budget analysis of public entities managing lands and
TRANSCRIPT

i
Budget Analysis of Public Entities Managing Lands
and Natural Resource Functions
Institute of Economic Affairs

i
This budget analysis was developed collaboratively by the Kenya Land Alliance (KLA) and the Institute of Economic Affairs (IEA) with the financial support of Trocaire.
Special acknowledgment goes to Mr. Kwame Owino, the team leader of IEA, and Ms. Jackline Kagume, who spearheaded the development of this publication.
We also acknowledge Ms. Faith Alubbe, the Chief Executive officer (CEO) of KLA, who provided able leadership and conceptualized this publication. Special mention also goes to Hillary Ogina, Community Land Rights Officer, for his technical input.
We equally thank the Land Sector Non-State Actors (LSNSA) and other partner organizations, who validated this document and gave valuable input. More specifically, We would like to acknowledge Namati, Haki Jamii, The Institute of Surveyors of Kenya (ISK), Kituo Cha Sheria, Indigenous Movement for Peace Advancement and Conflict Transformation (IMPACT), Pamoja Trust, Resource Conflict Institute (RECONCILE), Land Governance and Development Institute (LDGI), GROOTS Kenya, Hakijamii – Economic and Social Rights Center, Kenya Human Rights Commission (KHRC), Indigenous Women and Girls Initiative, Program for the Heritage of Ogiek and Mother Earth (PROHOME) , and Shule Yangu Alliance.
Acknowledgements
ii
Table of ContentsAcknowledgements i
Background 1
Ministry of Lands and Physical Planning 2 Overall Budget Analysis 5 Sector performance 10 Link to Community Lands 12
National Land Commission 12 Overall Budget Analysis 13 National Land Commission Sector Performance 15 Sources of Revenue 16
Wages 17
Ministry of Environment and Forestry 18
Overall Budget Analysis: Recurrent vs. Development Expenditure 20
Sector Performance 23
Appropriations in Aid 25
Wages 25
Community Livelihood Programme 26
Ministry of Petroleum and Mining 26 Overall Budget Analysis 27 Sector Performance 29 Appropriations in Aid (A-I-A) 32 Links to community Land 35
Conclusion 36
References 37
1
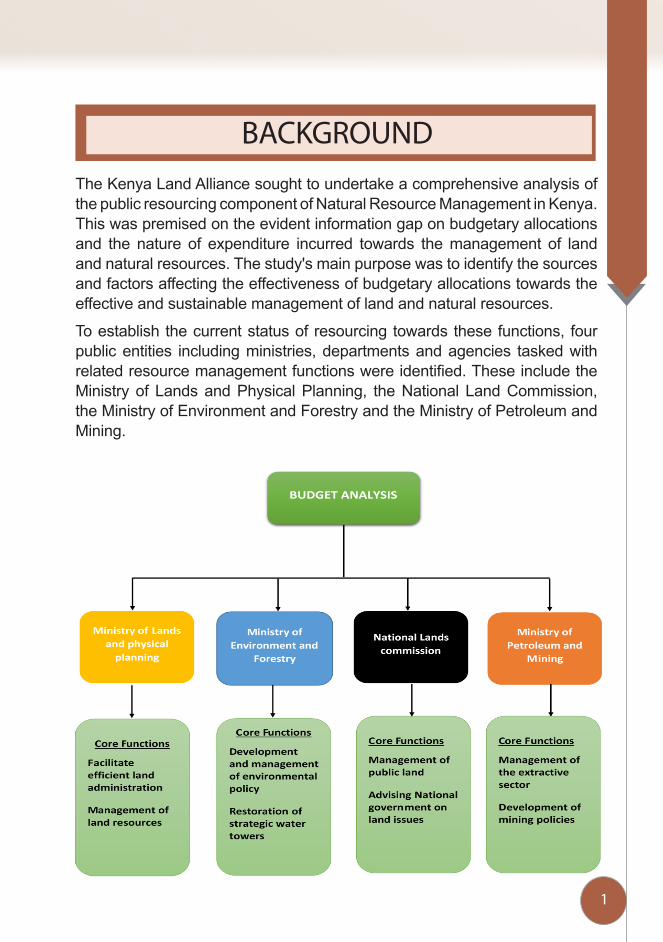
BACKGROUNDThe Kenya Land Alliance sought to undertake a comprehensive analysis of the public resourcing component of Natural Resource Management in Kenya. This was premised on the evident information gap on budgetary allocations and the nature of expenditure incurred towards the management of land and natural resources. The study's main purpose was to identify the sources and factors affecting the effectiveness of budgetary allocations towards the effective and sustainable management of land and natural resources.
To establish the current status of resourcing towards these functions, four public entities including ministries, departments and agencies tasked with related resource management functions were identified. These include the Ministry of Lands and Physical Planning, the National Land Commission, the Ministry of Environment and Forestry and the Ministry of Petroleum and Mining.
2
The core functions of the Ministry of Lands include facilitation of efficient land administration and management of land resources. The National Land Commission is tasked with the management of public land on behalf of the National and County Governments, as well as advising National Government on a comprehensive program for registration of title in land. The Ministry of Environment and Forestry functions include development and management of national environmental policy, forestry development policy, development of re-afforestation and agro-forestry and restoration of strategic water towers. Lastly, the Ministry of Petroleum and Mining was established to provide leadership in the management of the extractive sector in the country as guided by the Executive Order No. 1 of 2018. This includes the development of Petroleum and Mining policies, creating a favourable legal and regulatory environment for investments and building capacity for effective management of programs and projects.
The trends in budgetary performance for these entities were established and are highlighted in this report. These include the recurrent versus development allocation, priority programmes based on allocation, revenue performance in terms of appropriation-in-aid, budget absorption and utilisation rates and links to community land.
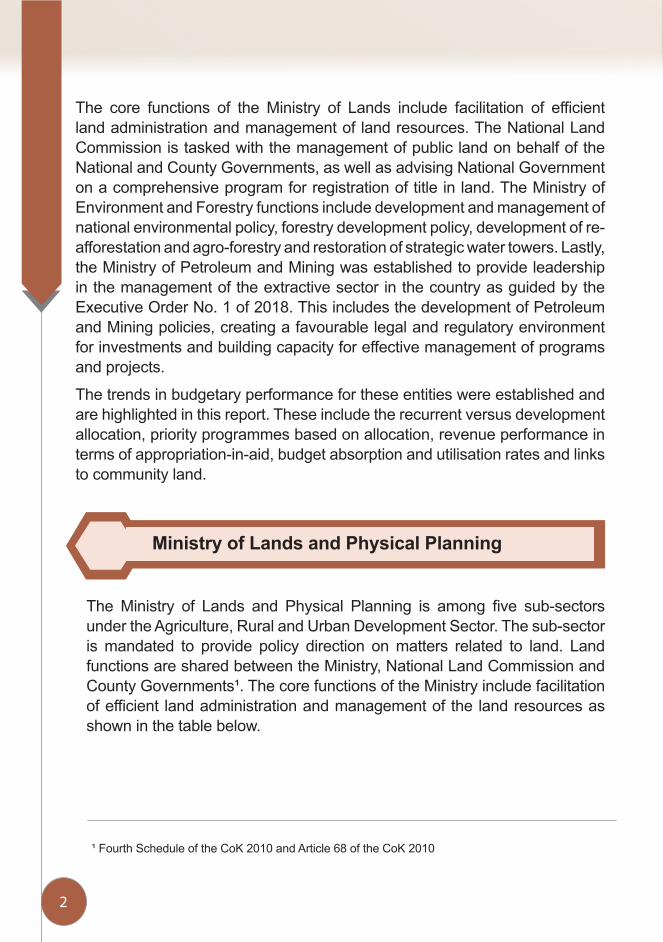
Ministry of Lands and Physical Planning
The Ministry of Lands and Physical Planning is among five sub-sectors under the Agriculture, Rural and Urban Development Sector. The sub-sector is mandated to provide policy direction on matters related to land. Land functions are shared between the Ministry, National Land Commission and County Governments¹. The core functions of the Ministry include facilitation of efficient land administration and management of the land resources as shown in the table below.
¹ Fourth Schedule of the CoK 2010 and Article 68 of the CoK 2010
3
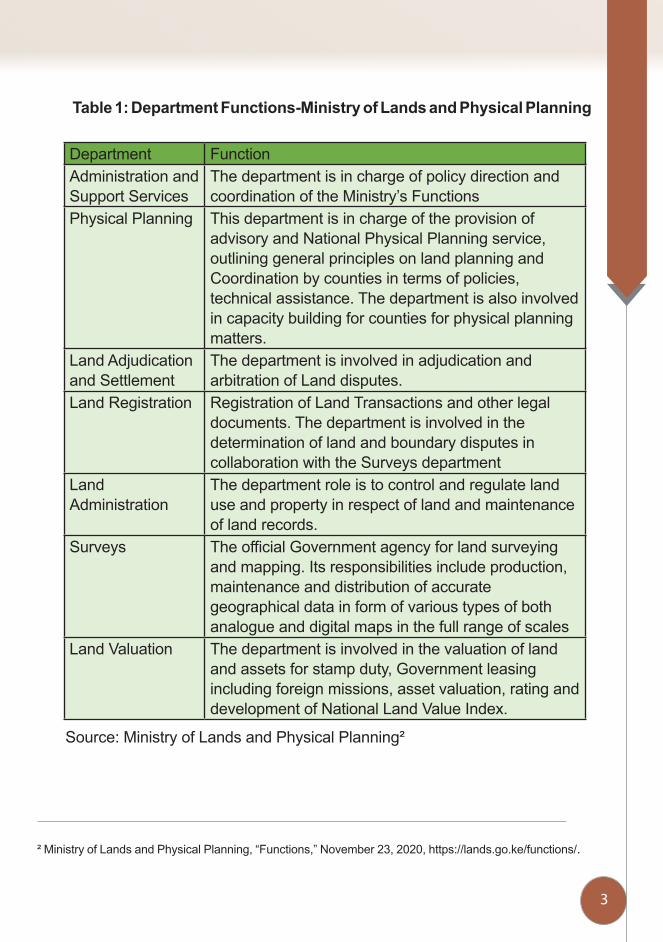
Department Function Administration and Support Services
The department is in charge of policy direction and coordination of the Ministry’s Functions
Physical Planning This department is in charge of the provision of advisory and National Physical Planning service, outlining general principles on land planning and Coordination by counties in terms of policies, technical assistance. The department is also involved in capacity building for counties for physical planning matters.
Land Adjudication and Settlement
The department is involved in adjudication and arbitration of Land disputes.
Land Registration Registration of Land Transactions and other legal documents. The department is involved in the determination of land and boundary disputes in collaboration with the Surveys department
Land Administration
The department role is to control and regulate land use and property in respect of land and maintenance of land records.
Surveys The official Government agency for land surveying and mapping. Its responsibilities include production, maintenance and distribution of accurate geographical data in form of various types of both analogue and digital maps in the full range of scales
Land Valuation The department is involved in the valuation of land and assets for stamp duty, Government leasing including foreign missions, asset valuation, rating and development of National Land Value Index.
Source: Ministry of Lands and Physical Planning²
² Ministry of Lands and Physical Planning, “Functions,” November 23, 2020, https://lands.go.ke/functions/.
Table 1: Department Functions-Ministry of Lands and Physical Planning
4
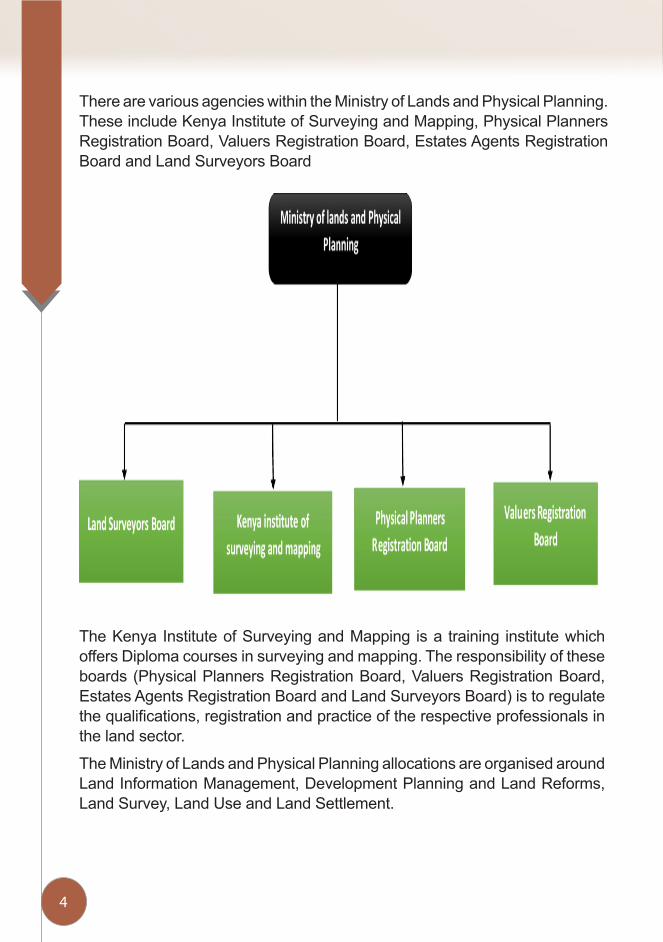
There are various agencies within the Ministry of Lands and Physical Planning. These include Kenya Institute of Surveying and Mapping, Physical Planners Registration Board, Valuers Registration Board, Estates Agents Registration Board and Land Surveyors Board
The Kenya Institute of Surveying and Mapping is a training institute which offers Diploma courses in surveying and mapping. The responsibility of these boards (Physical Planners Registration Board, Valuers Registration Board, Estates Agents Registration Board and Land Surveyors Board) is to regulate the qualifications, registration and practice of the respective professionals in the land sector.
The Ministry of Lands and Physical Planning allocations are organised around Land Information Management, Development Planning and Land Reforms, Land Survey, Land Use and Land Settlement.
5
Overall Budget Analysis
Source: National Treasury
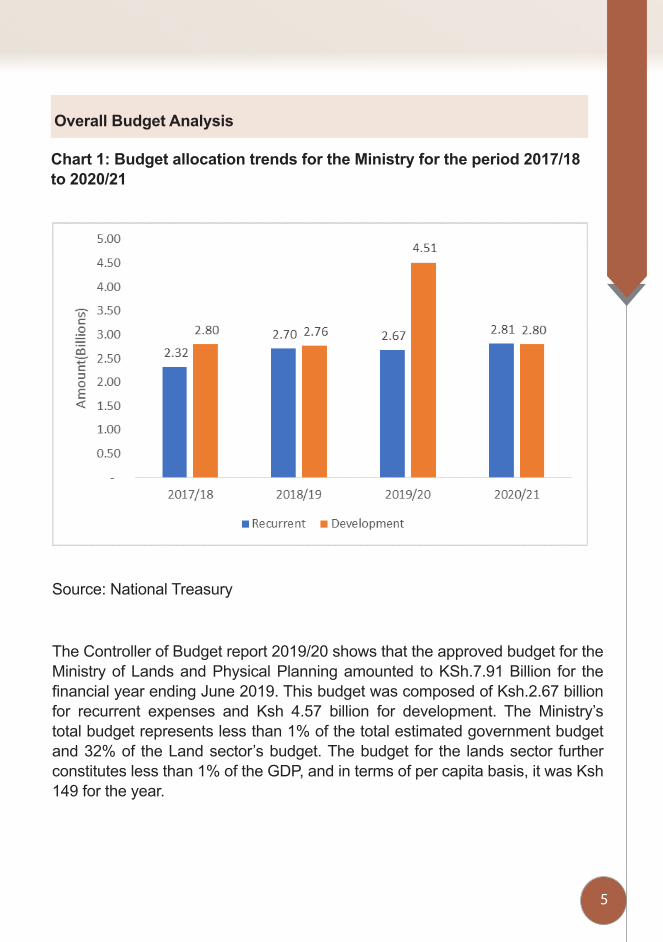
Chart 1: Budget allocation trends for the Ministry for the period 2017/18 to 2020/21
The Controller of Budget report 2019/20 shows that the approved budget for the Ministry of Lands and Physical Planning amounted to KSh.7.91 Billion for the financial year ending June 2019. This budget was composed of Ksh.2.67 billion for recurrent expenses and Ksh 4.57 billion for development. The Ministry’s total budget represents less than 1% of the total estimated government budget and 32% of the Land sector’s budget. The budget for the lands sector further constitutes less than 1% of the GDP, and in terms of per capita basis, it was Ksh 149 for the year.

6
Generally, it is noted that for the years under review (FY 2017/18 to FY 2019/20) there has been an increase of an average of Ksh 346 million between FY 2017/18 to 2018/19, but a major increase was noted in the FY 2019/20 at Ksh 1.72 Billion. This was attributed to an increase in the development expenditure budget. In the four years, the development and recurrent expenditure have been taking up equal amounts of the Ministry’s total budget. However, these changes in 2019/20 where the development expenditure takes up 63% of the total budget while the recurrent share was 37%.
The Ministry’s spending is expected to decrease by 22% (Ksh.1.58 Billion) in FY 2020/21 to Ksh.5.61 Billion. The figure is further divided into Ksh.2.81 Billion for recurrent and Ksh.2.80 Billion for development expenditure. This will take up about 0.2% of the total budget and 27% of the total share allocated to the land sector. There are prospective matters that are likely to direct the Ministry’s agenda in 2020/21. According to the Budget Policy Statement, the government envisioned to ensure both National and County governments avail appropriate land for the affordable housing project under the Big 4 agenda.
The move was in a bid to lower the costs of building as it is estimated that land takes up about 60% of the costs of housing development. In order to make this a reality, the government under the Ministry of Lands and Physical Planning will have to continue to administer policies and programs to guide this facilitation.
Analysis of the Development Vote
Over the last four years, the Ministry of Lands and Physical Planning under the development vote has been allocated a total of Ksh 12.87 billion or Ksh 3.22 billion annually. The Ministry was allocated Ksh 2.80 billion in 2017/18 which shrunk by 1.2% to Ksh 2.76 billion in 2018/19. It then increased by 63.4% in 2019/20 to Ksh 4.51 billion and dropped by 38% to Ksh 2.80 billion in 2021/21.

7
Chart 2: Ministry of Lands and Physical Planning Development Vote (2017/18-2020/21)
Source: National Treasury³
³ National Treasury, “Budget Books,” 2020, https://treasury.go.ke/budget.html.
The largest expenditure items out of the 12 in the development vote for the Ministry include Processing and Registration of Title deeds, Digitization of Land registries, and settlement of landless. In the financial year 2020/21, these three expenditure items take 81% of all development vote which is equivalent to Ksh 2.3 billion. The financial year 2019/20 was the year of fiscal consolidation in most government departments. In the financial year 2019/20, there was a 63% increase in the development vote. The increase confirms the policy priorities for the Ministry of Lands and Physical Planning in issuing more title deeds to Kenyans who had not previously accessed that right. There’s need to establish the baseline for how many more title deeds are needed under the programme, which would help in progressively determining the yearly costs for Processing and Registration of Title deeds.

8
• Cabinet secretary• Judiciary• Parliament• Politicians
In the financial year2019/20, the biggest development budget programmes were; the digitization of land registries which grew by 168% from Ksh 490 million to Ksh 1.3 billion; settlement of the landless which grew by 128% from Ksh 391 million to Ksh 891 million and construction of land registries which grew from Ksh 64 million to Ksh 160 million. The current regime campaigned on the policy platform to issue three million title deeds to Kenyans who did not have resources to access the title deeds. Government funding confirms the policy priority in expanding the access of Title deeds as shown in the table belowTable 2: Top priorities for the Ministry of Lands and Physical Planning Development Vote (2017/18-2020/21)
2017/18 2018/19 2019/20 2020/21Processing and Registration of Title deeds (Ksh Bn)
1.23 1.28 1.69 1.56
Digitization of Land registries (Ksh Bn) 0.75 0.49 1.31 0.52Digitization of Land registries (Ksh Bn) 28 64 160 190Settlement of the Landless (Ksh Mn’s) 425 391 891 180
Analysis of the Recurrent
In the four years under review, the Ministry of Lands was allocated a total of Ksh.10.5 billion or Ksh.2.63 billion annually under the recurrent vote. The recurrent vote was allocated Ksh.2.32 billion in 2017/18 which increased by 16.4% to Ksh.2.70 billion in 2018/19. It then reduced by 1% in 2019/20 to Ksh.2.67 billion and increased by 5.1% to Ksh.2.81 billion in 2021/21.
9
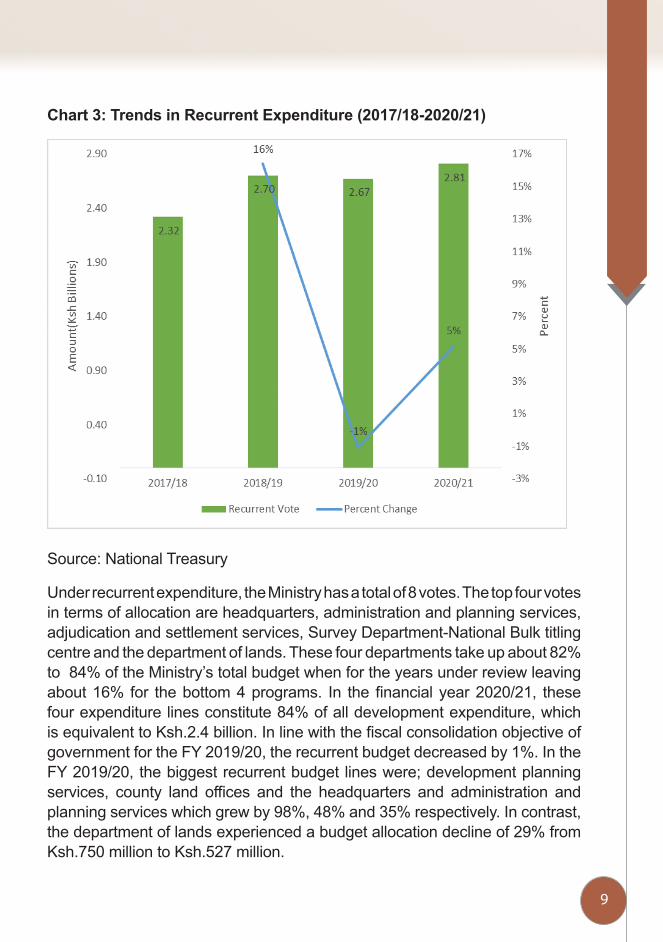
Chart 3: Trends in Recurrent Expenditure (2017/18-2020/21)
Source: National Treasury
Under recurrent expenditure, the Ministry has a total of 8 votes. The top four votes in terms of allocation are headquarters, administration and planning services, adjudication and settlement services, Survey Department-National Bulk titling centre and the department of lands. These four departments take up about 82% to 84% of the Ministry’s total budget when for the years under review leaving about 16% for the bottom 4 programs. In the financial year 2020/21, these four expenditure lines constitute 84% of all development expenditure, which is equivalent to Ksh.2.4 billion. In line with the fiscal consolidation objective of government for the FY 2019/20, the recurrent budget decreased by 1%. In the FY 2019/20, the biggest recurrent budget lines were; development planning services, county land offices and the headquarters and administration and planning services which grew by 98%, 48% and 35% respectively. In contrast, the department of lands experienced a budget allocation decline of 29% from Ksh.750 million to Ksh.527 million.
10
Appropriation in Aid
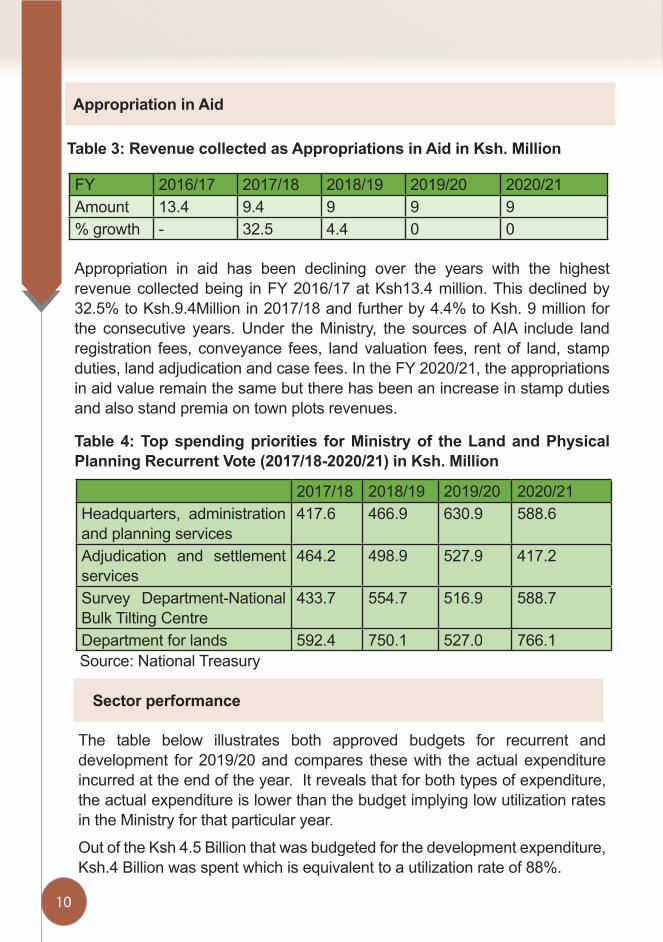
Table 3: Revenue collected as Appropriations in Aid in Ksh. Million
FY 2016/17 2017/18 2018/19 2019/20 2020/21Amount 13.4 9.4 9 9 9% growth - 32.5 4.4 0 0
Appropriation in aid has been declining over the years with the highest revenue collected being in FY 2016/17 at Ksh13.4 million. This declined by 32.5% to Ksh.9.4Million in 2017/18 and further by 4.4% to Ksh. 9 million for the consecutive years. Under the Ministry, the sources of AIA include land registration fees, conveyance fees, land valuation fees, rent of land, stamp duties, land adjudication and case fees. In the FY 2020/21, the appropriations in aid value remain the same but there has been an increase in stamp duties and also stand premia on town plots revenues.
Table 4: Top spending priorities for Ministry of the Land and Physical Planning Recurrent Vote (2017/18-2020/21) in Ksh. Million
2017/18 2018/19 2019/20 2020/21Headquarters, administration and planning services
417.6 466.9 630.9 588.6
Adjudication and settlement services
464.2 498.9 527.9 417.2
Survey Department-National Bulk Tilting Centre
433.7 554.7 516.9 588.7
Department for lands 592.4 750.1 527.0 766.1 Source: National Treasury
The table below illustrates both approved budgets for recurrent and development for 2019/20 and compares these with the actual expenditure incurred at the end of the year. It reveals that for both types of expenditure, the actual expenditure is lower than the budget implying low utilization rates in the Ministry for that particular year.
Out of the Ksh 4.5 Billion that was budgeted for the development expenditure, Ksh.4 Billion was spent which is equivalent to a utilization rate of 88%.
Sector performance

11
Table 5: Budget performance the for Ministry of Lands and Physical Planning, 2019/20 (Kshs Billion)
Gross Revised Estimates ExpenditureDevelopment 4.5 4Recurrent 2.7 2.2
On the other hand, out of the ksh.2.7 billion that was budgeted for the recurrent expenditure, Ksh.2.2 billion was expended implying an absorption rate of 82%. On average, the absorption rate for the total budget is 86%, which translates to approximately Ksh 9 for every Ksh 10, spend.
The utilization rate of the Ministry has been fluctuating over the years under review and this can be attributed to a decline in the absorption rates under the recurrent expenditure. However, concerning the sector’s average absorption rate, the Ministry has performed better given the absorption rates are at par with the average or above it.
Year Total Development Recurrent Sector’s average2019/20 86 88 82 862018/19 85 83 87 732017/18 88 84 95 80
Source: Controller of Budget Reports(Various issues)
Table 6: Ministry of Lands and Physical Planning Absorption Rates
The absorption rates show that the Ministry is slightly inefficient in terms of spending the budget allocated, given that every year, between 12% to 14% of its budget remains unabsorbed.
Development vote absorption rate
The absorption rates for the development vote for the Ministry of Lands and Physical Planning has reduced from 87.8% in 2017/18 financial year to 82.8% in 2018/19 financial year and then increased to 83.7% in 2019/20. In the three financial years 2017/18, 2018/19 and 2019/20, the absorption rates averaged 85%. In practical terms, this could mean that in 2019/20, 12% of the development projects that were planned for that financial year were not implemented. This is a slight improvement when compared to the previous year.
12
Link to Community Lands
Recurrent vote absorption rate
In contrast, in 2019/20, 18% of the recurrent budget was not utilized and this rate has been deteriorating from the previous years. In 2017/18 the Ministry did not absorb 5% of its recurrent budget and in 2018/19 it failed to absorb 13% of its budget. In the past, Treasury has attributed the low absorption rates to unrealistic demands during the budget-making. It should be noted that any time the Ministry fails to utilize resources, the public are not able to access services that had been anticipated that financial year. Because the ministry’s absorption rates are not divided into programs, it is a challenge to examine which departments have lower absorption rates and which perform better.
From the analysis and breakdown of the itemized budget lines, it is not clear what budgeted amounts are allocated to the land functions as outlined under Article 63 of the Constitution of Kenya. Even though one of the top expenditure items is Processing and Registration of Title deeds, it is not evident what specific amounts go to processing of title deeds for community lands.
The mandate of the Commission as per the Constitution, Article 67, and the National Land Commission Act No. 3 of 2012 is to implement key land governance mandates, implement National Land Policy and various land statutes⁴. Some of the functions include managing public land on behalf of the National and County Governments, advise the National Government on a comprehensive program for registration of title in the land throughout Kenya, conduct research related to land and the use of natural resources and make recommendations to appropriate authorities, initiate investigations on its initiative or a complaint into present or historical land injustices and recommend appropriate redress and encourage the application of alternative and traditional dispute resolution mechanisms in land conflicts⁵.
⁴The National Treasury, Program Based Budget, 2019.⁵ Agriculture Rural and Urban Development Sector Development, Medium Term Plan, 2018.
National Land Commission
13
Other functions include: assessing tax on land and premiums on immovable property in any area designated by law; monitor and have oversight responsibility for land use planning throughout the country, alienate public land, monitor the registration of all the rights and interests in land, ensure sustainable management of land for their intended purpose and future generations, develop and maintain an effective public land information management system at the National and County levels⁶.
For budget purposes, the National Land Commission has 4 programmes which include: Land administration and management, general administration, planning and support services, Land disputes and conflict resolutions and National Land Information Management System.
Overall Budget Analysis
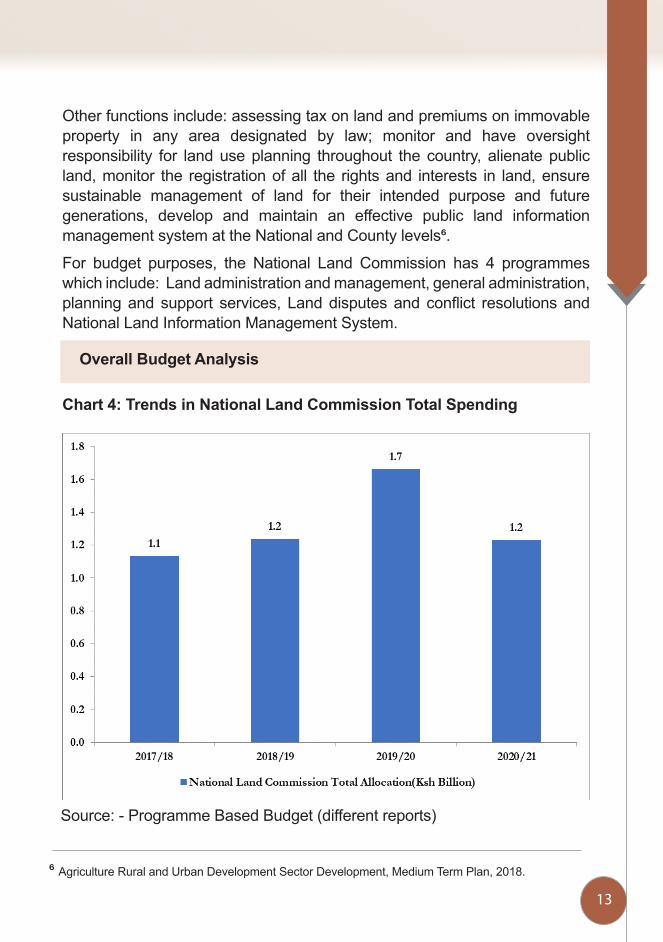
Chart 4: Trends in National Land Commission Total Spending
Source: - Programme Based Budget (different reports)
⁶ Agriculture Rural and Urban Development Sector Development, Medium Term Plan, 2018.
14
The National Land Commission did not have a development expenditure budget for the Financial years 2017/2018 to 2020/2021. The total budget for the Financial Year 2019/2020 was KES 1.66 Billion from KES 1.24 Billion in the Financial year 2018/2019 which later dropped in the Financial year 2020/2021 to KES 1.23 Billion. The increase in FY 2019/20 could partly be attributed to payments to the outgoing National Land Commission chairperson and other 23 National Land Officials who left office in 2019.
The National Land Commission’s expenditure significantly increased to KES 1.66billion in the financial year 2019/20 but decreased by 25% to KES 1.23 billion in 2020/21. This was after the compensation of National Security Scheme was made to the commissioners and officials of the Commission. The government in June 2020 gave priority to specific government ministries, departments and agencies that were more adversely affected by Covid-19, such as the Ministry of Health and Ministry of Education. In the financial year 2020/21, the Commission estimates to spend KES 1.37 billion, a 14% increase from the previous year.
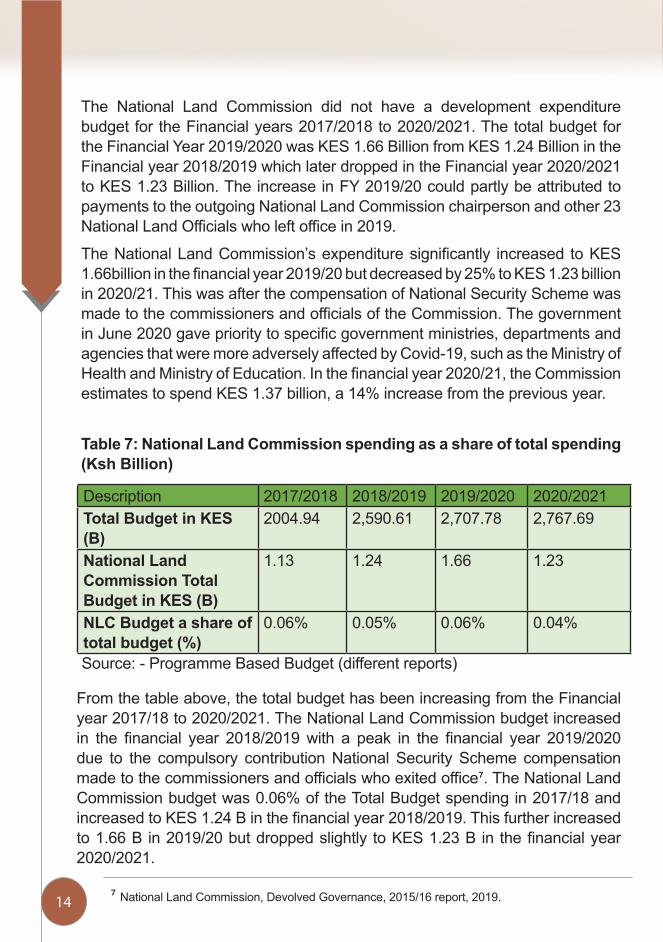
Table 7: National Land Commission spending as a share of total spending (Ksh Billion)
Description 2017/2018 2018/2019 2019/2020 2020/2021Total Budget in KES (B)
2004.94 2,590.61 2,707.78 2,767.69
National Land Commission Total Budget in KES (B)
1.13 1.24 1.66 1.23
NLC Budget a share of total budget (%)
0.06% 0.05% 0.06% 0.04%
Source: - Programme Based Budget (different reports)
⁷ National Land Commission, Devolved Governance, 2015/16 report, 2019.
From the table above, the total budget has been increasing from the Financial year 2017/18 to 2020/2021. The National Land Commission budget increased in the financial year 2018/2019 with a peak in the financial year 2019/2020 due to the compulsory contribution National Security Scheme compensation made to the commissioners and officials who exited office⁷. The National Land Commission budget was 0.06% of the Total Budget spending in 2017/18 and increased to KES 1.24 B in the financial year 2018/2019. This further increased to 1.66 B in 2019/20 but dropped slightly to KES 1.23 B in the financial year 2020/2021.
Votes Description 2017/2018 2018/2019 2019/2020 2020/2021National Land Commission
Recurrent in KES (B)
1.13 1.24 1.66 1.23
Development in KES (B)
- - - -
Total 1.13 1.24 1.66 1.23

15
Description 2017/2018 2018/2019 2019/2020 2020/2021Total Budget in KES (B)
2004.94 2,590.61 2,707.78 2,767.69
National Land Commission Total Budget in KES (B)
1.13 1.24 1.66 1.23
NLC Budget a share of total budget (%)
0.06% 0.05% 0.06% 0.04%
Source: - Programme Based Budget (different reports)
In the financial year 2017/18, the National Land Commission total budget was at 1.13 B with the largest allocation towards Headquarters, Insurance costs (KES 62.6 M) and the County Coordination offices basic salary (KES 238.3 M). In the financial year 2019/2020 the largest allocation was made towards insurance costs (KES 95.6M), Employer Compulsory Contribution to National Social Security Fund (KES 81.34M), Rentals of Produced Assets (KES 33.06M) and Government Pension and Retirement Benefits all under headquarters. (KES 524.74 M).
It is also noted that the recurrent budget for Purchase of Office furniture and general equipment across all departments in the commission has increased in each financial year which reflects inefficiency. There is also a recurrent budget allocation for hospitality under each department in the commission which is not only unnecessary but also signifies a structure problem.
Table 8: Recurrent Expenditure
Votes Description 2017/2018 2018/2019 2019/2020 2020/2021National Land Commission
Recurrent in KES (B)
1.13 1.24 1.66 1.23
Development in KES (B)
- - - -
Total 1.13 1.24 1.66 1.23
National Land Commission Sector performance
Chart 5: - National Land Commission performance
Source: - Programme Based Budget and Controller of Budget (Different reports)

16
The National Land Commission budget funds 4 programmes. The total expenditure in 2018/19 amounted to Ksh.1.2 Billion which represented 99.9% of the revised gross estimates. This is a 5% increase from 2017/18. The expenditure comprises of 0.0% and 96.6% absorption rates for development and recurrent expenditures respectively for the financial year 2019/2020.
From 2017/18 to 2020/21 the total expenditure has increased by 5%. This is a significant improvement though 100% absorption rate hasn’t been achieved. Inadequate funding and pending bills are some of the factors that have led to slow uptake of resources. However, in the financial year 2019/2020, the commission had a 99.9% total absorption rate. During this year, the commission prepared leases on public land including titling of public schools and reviewed more than 3,650 grants and dispositions to public land in various counties and for various Ministries Departments and Agencies⁸. It is also the same time that commissioners exited office and were compensated on compulsory retirement benefits⁹.
In the financial years 2019/2020, the Commission utilized the allocated funds in developing Public Land Information Management System and Information Communication Technology Infrastructure to support Public land management at the National and County governments, digitize public land records, school titling programmes for 4000 schools, prepare databases for public land, evaluate all parcels of public land, review of grants and disposition, research carried out on land use optimal land sizes, resolution of historical land injustices and land disputes and facilitating compulsory acquisition of land for government projects ¹⁰.
Sources of Revenue
There are no cited sources of revenue for the National Land Commission as Appropriation in Aid. The Commission does not raise revenue in its service delivery.
⁸ The National Treasury, Programme Based Budget, 2018/2019
⁹ The National Land Commission, Devolved Governance, 2015/16 report,2019
¹⁰ The National Treasury, Programme Based Budget,2019.
17
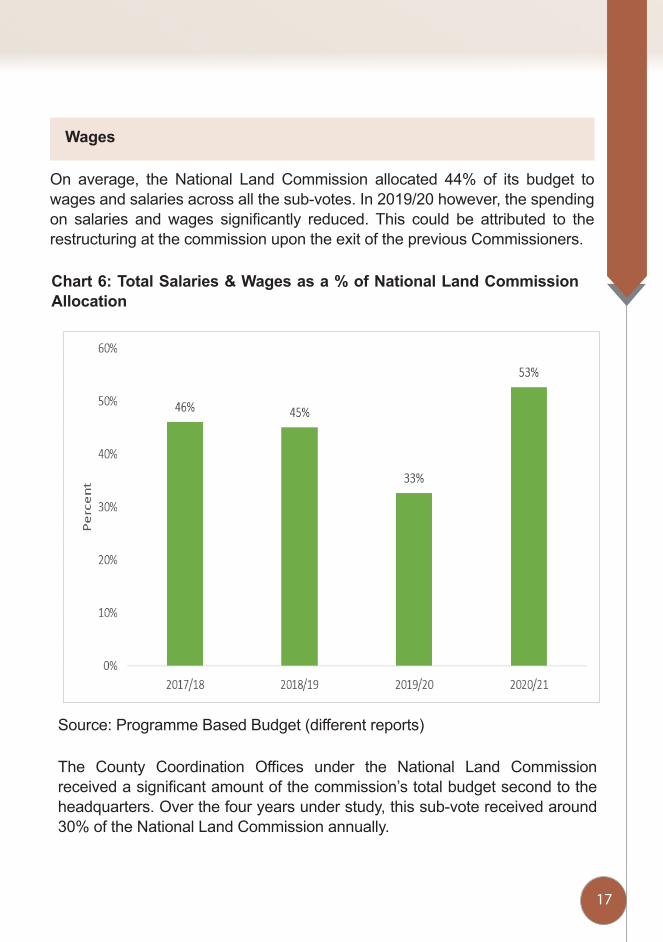
Wages
On average, the National Land Commission allocated 44% of its budget to wages and salaries across all the sub-votes. In 2019/20 however, the spending on salaries and wages significantly reduced. This could be attributed to the restructuring at the commission upon the exit of the previous Commissioners.
Chart 6: Total Salaries & Wages as a % of National Land Commission Allocation
Source: Programme Based Budget (different reports)
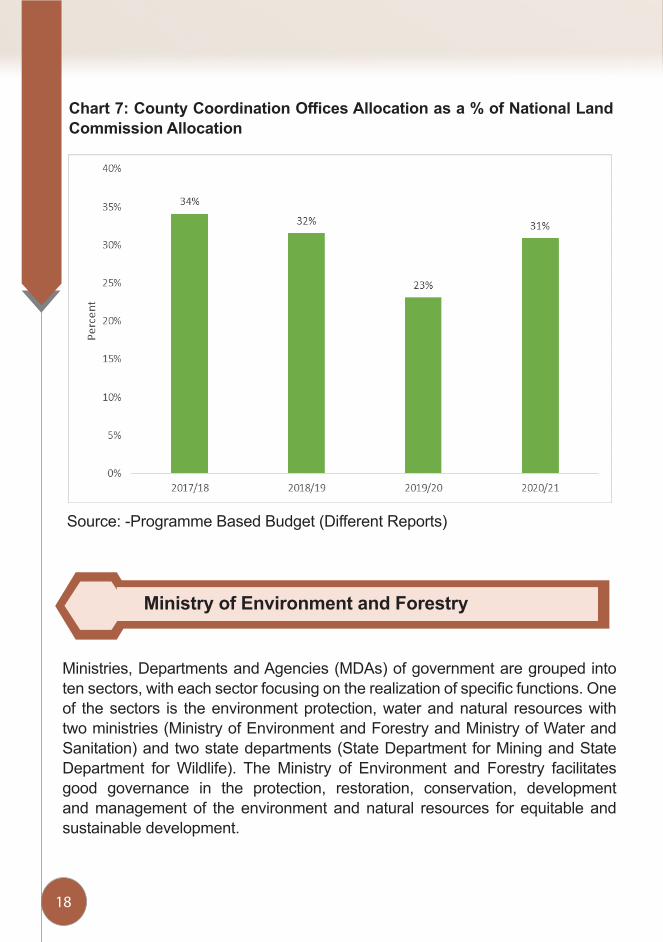
The County Coordination Offices under the National Land Commission received a significant amount of the commission’s total budget second to the headquarters. Over the four years under study, this sub-vote received around 30% of the National Land Commission annually.
18
Chart 7: County Coordination Offices Allocation as a % of National Land Commission Allocation
Source: -Programme Based Budget (Different Reports)
Ministry of Environment and Forestry
Ministries, Departments and Agencies (MDAs) of government are grouped into ten sectors, with each sector focusing on the realization of specific functions. One of the sectors is the environment protection, water and natural resources with two ministries (Ministry of Environment and Forestry and Ministry of Water and Sanitation) and two state departments (State Department for Mining and State Department for Wildlife). The Ministry of Environment and Forestry facilitates good governance in the protection, restoration, conservation, development and management of the environment and natural resources for equitable and sustainable development.
19
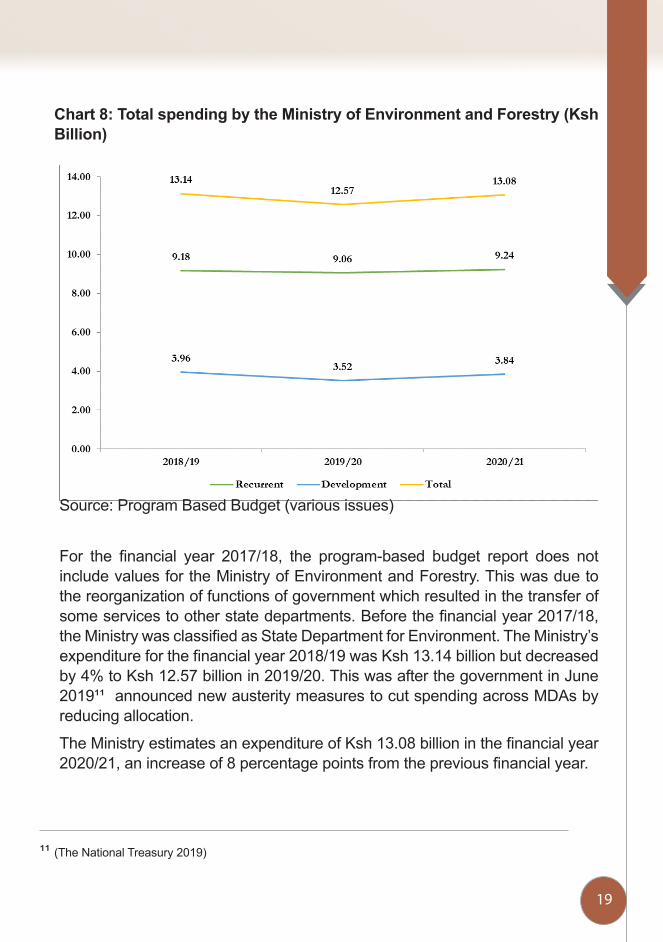
Chart 8: Total spending by the Ministry of Environment and Forestry (Ksh Billion)
Source: Program Based Budget (various issues)
For the financial year 2017/18, the program-based budget report does not include values for the Ministry of Environment and Forestry. This was due to the reorganization of functions of government which resulted in the transfer of some services to other state departments. Before the financial year 2017/18, the Ministry was classified as State Department for Environment. The Ministry’s expenditure for the financial year 2018/19 was Ksh 13.14 billion but decreased by 4% to Ksh 12.57 billion in 2019/20. This was after the government in June 2019¹¹ announced new austerity measures to cut spending across MDAs by reducing allocation.
The Ministry estimates an expenditure of Ksh 13.08 billion in the financial year 2020/21, an increase of 8 percentage points from the previous financial year.
¹¹ (The National Treasury 2019)
20
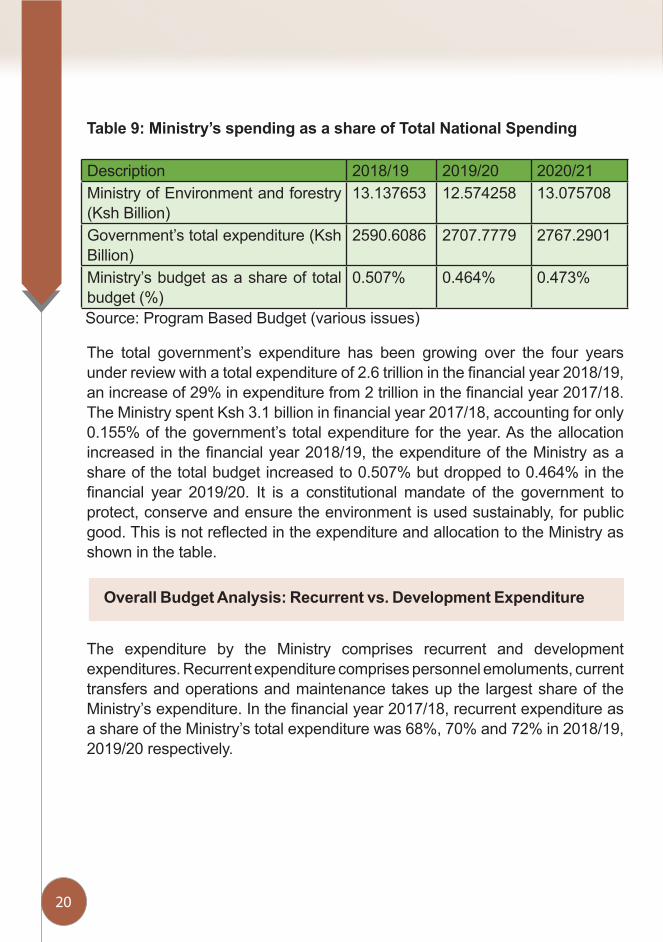
Table 9: Ministry’s spending as a share of Total National Spending
Description 2018/19 2019/20 2020/21Ministry of Environment and forestry (Ksh Billion)
13.137653 12.574258 13.075708
Government’s total expenditure (Ksh Billion)
2590.6086 2707.7779 2767.2901
Ministry’s budget as a share of total budget (%)
0.507% 0.464% 0.473%
Source: Program Based Budget (various issues)
The total government’s expenditure has been growing over the four years under review with a total expenditure of 2.6 trillion in the financial year 2018/19, an increase of 29% in expenditure from 2 trillion in the financial year 2017/18. The Ministry spent Ksh 3.1 billion in financial year 2017/18, accounting for only 0.155% of the government’s total expenditure for the year. As the allocation increased in the financial year 2018/19, the expenditure of the Ministry as a share of the total budget increased to 0.507% but dropped to 0.464% in the financial year 2019/20. It is a constitutional mandate of the government to protect, conserve and ensure the environment is used sustainably, for public good. This is not reflected in the expenditure and allocation to the Ministry as shown in the table.
Overall Budget Analysis: Recurrent vs. Development Expenditure
The expenditure by the Ministry comprises recurrent and development expenditures. Recurrent expenditure comprises personnel emoluments, current transfers and operations and maintenance takes up the largest share of the Ministry’s expenditure. In the financial year 2017/18, recurrent expenditure as a share of the Ministry’s total expenditure was 68%, 70% and 72% in 2018/19, 2019/20 respectively.
21
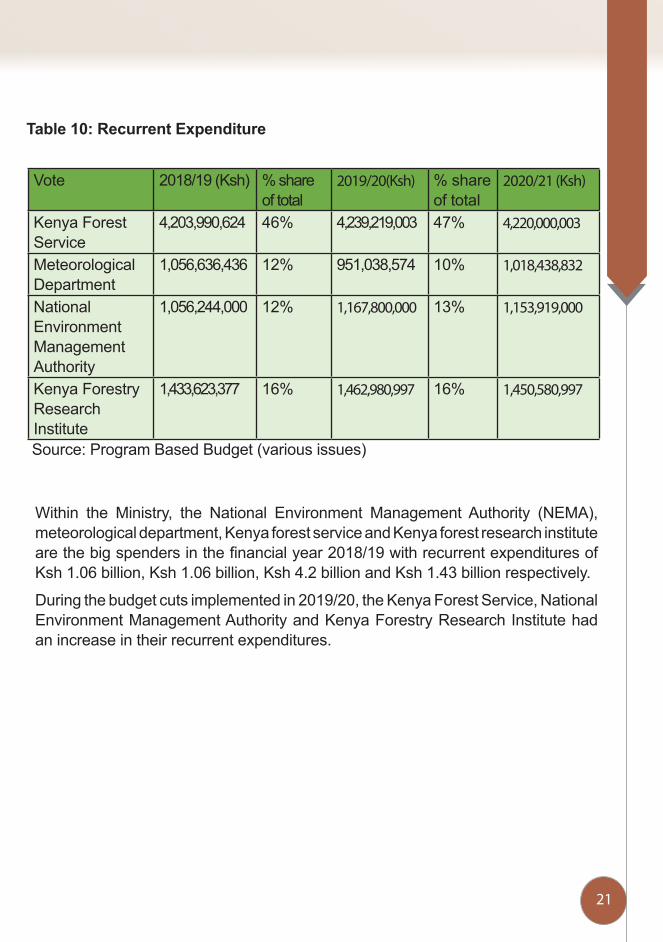
Table 10: Recurrent Expenditure
Vote 2018/19 (Ksh) % share of total
2019/20(Ksh) % share of total
2020/21 (Ksh)
Kenya Forest Service
4,203,990,624 46% 4,239,219,003 47% 4,220,000,003
Meteorological Department
1,056,636,436 12% 951,038,574 10% 1,018,438,832
National Environment Management Authority
1,056,244,000 12% 1,167,800,000 13% 1,153,919,000
Kenya Forestry Research Institute
1,433,623,377 16% 1,462,980,997 16% 1,450,580,997
Source: Program Based Budget (various issues)
Within the Ministry, the National Environment Management Authority (NEMA), meteorological department, Kenya forest service and Kenya forest research institute are the big spenders in the financial year 2018/19 with recurrent expenditures of Ksh 1.06 billion, Ksh 1.06 billion, Ksh 4.2 billion and Ksh 1.43 billion respectively.
During the budget cuts implemented in 2019/20, the Kenya Forest Service, National Environment Management Authority and Kenya Forestry Research Institute had an increase in their recurrent expenditures.
22
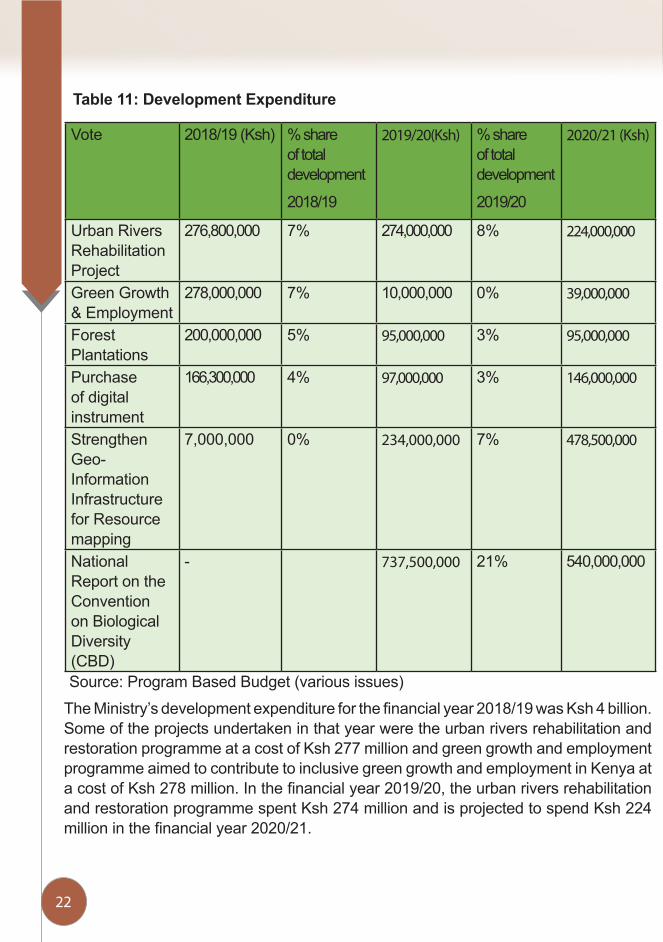
Table 11: Development Expenditure
Vote 2018/19 (Ksh) % share of total development
2018/19
2019/20(Ksh) % share of total development
2019/20
2020/21 (Ksh)
Urban Rivers Rehabilitation Project
276,800,000 7% 274,000,000 8% 224,000,000
Green Growth & Employment
278,000,000 7% 10,000,000 0% 39,000,000
Forest Plantations
200,000,000 5% 95,000,000 3% 95,000,000
Purchase of digital instrument
166,300,000 4% 97,000,000 3% 146,000,000
Strengthen Geo-Information Infrastructure for Resource mapping
7,000,000 0% 234,000,000 7% 478,500,000
National Report on the Convention on Biological Diversity (CBD)
- 737,500,000 21% 540,000,000
Source: Program Based Budget (various issues)The Ministry’s development expenditure for the financial year 2018/19 was Ksh 4 billion. Some of the projects undertaken in that year were the urban rivers rehabilitation and restoration programme at a cost of Ksh 277 million and green growth and employment programme aimed to contribute to inclusive green growth and employment in Kenya at a cost of Ksh 278 million. In the financial year 2019/20, the urban rivers rehabilitation and restoration programme spent Ksh 274 million and is projected to spend Ksh 224 million in the financial year 2020/21.
23
Kenya’s goal to achieve 10% national tree cover by 2022¹² is also implemented under the Ministry’s development expenditure where Ksh 200 million was spent on increasing forest cover in 2018/19. This expenditure decreases to Ksh 95 million in the next two financial years.
The Ministry of Environment and Forestry published the sixth national report to the convention on biological diversity in 2020¹³ on the progress and achievements made in implementing the Aichi Biodiversity Targets.
Aichi biodiversity targets include addressing the underlying causes of biodiversity loss, reducing the direct pressures on biodiversity, improving the status of biodiversity by safeguarding ecosystems and enhancing the benefits to all from ecosystem services. With the aim to implement the Aichi biodiversity targets, the Ministry spent Ksh 737.5 million in the financial year 2019/20 and is projected to spend Ksh 540 million in the financial year 2020/21.
The Ministry has many development projects running for any given financial year, with 57 items under the development expenditure in the years under review. This implies that the allocation towards development expenditure has to be spread over several projects. The Ministry should consider selecting the most crucial projects and prioritizing them, to ensure resources are channelled to critical projects.
Sector Performance
¹² (Ministry of Environment and Forestry 2020)
¹³ (Ministry of Environment and Forestry 2020)
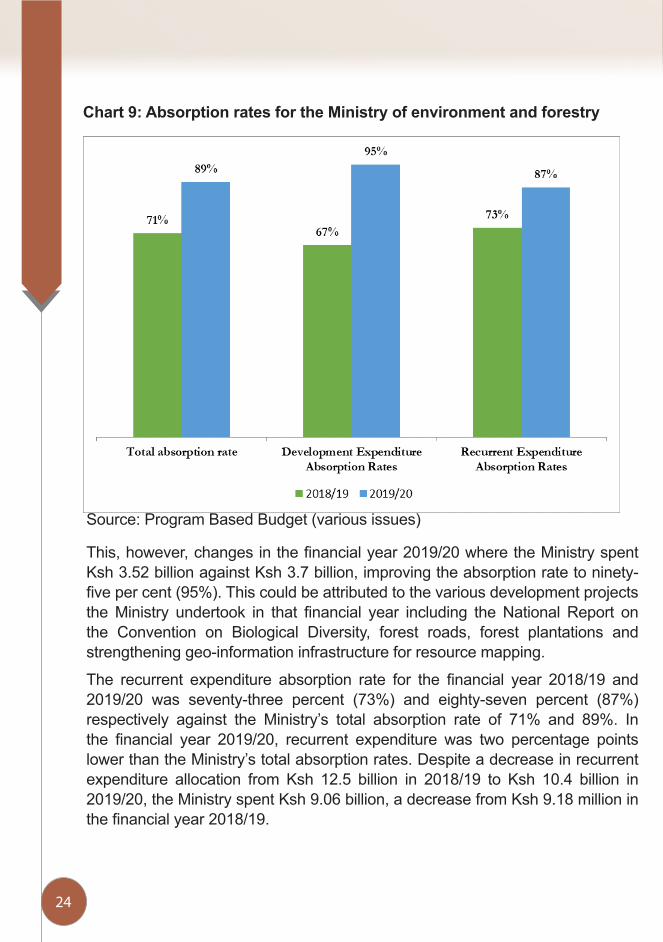
In the financial year 2018/19, the Ministry of Forestry was allocated Ksh 18.4 billion but spent Ksh 13.14 billion, recording an absorption rate of seventy-one percent (71%). Development expenditure absorption rate was lower at sixty-seven percent (67%) than the recurrent expenditure (73%) and the overall average absorption rate of seventy-one percent(71%). The amount allocated to development expenditure was Ksh 5.9 billion but the ministry spent Ksh 3.96 billion.
24
Chart 9: Absorption rates for the Ministry of environment and forestry
This, however, changes in the financial year 2019/20 where the Ministry spent Ksh 3.52 billion against Ksh 3.7 billion, improving the absorption rate to ninety-five per cent (95%). This could be attributed to the various development projects the Ministry undertook in that financial year including the National Report on the Convention on Biological Diversity, forest roads, forest plantations and strengthening geo-information infrastructure for resource mapping.
The recurrent expenditure absorption rate for the financial year 2018/19 and 2019/20 was seventy-three percent (73%) and eighty-seven percent (87%) respectively against the Ministry’s total absorption rate of 71% and 89%. In the financial year 2019/20, recurrent expenditure was two percentage points lower than the Ministry’s total absorption rates. Despite a decrease in recurrent expenditure allocation from Ksh 12.5 billion in 2018/19 to Ksh 10.4 billion in 2019/20, the Ministry spent Ksh 9.06 billion, a decrease from Ksh 9.18 million in the financial year 2018/19.
Source: Program Based Budget (various issues)

25
Appropriation of Aid
The Ministry of Environment and Forestry is among the high revenue-generating MDAs. The Appropriation in Aid comprises ‘Sale of Goods and Services’, ‘Receipts from Sale of Non-Financial Assets’ and ‘Receipts from Sale of Inventories, Stocks and Commodities’. The Ministry’s actual income receipts for the FY 2018/19 was Ksh. 1.1 billion, with the highest income earner being receipts from the sale of cultivated assets at Ksh. 660 million. This was followed by license fees, which contributed about Ksh. 352 million. The revised revenue estimates for FY 2019/20 were Ksh. 1.2 billion and the projections for FY 2020/21 to 2022/23 are set at Ksh. 1.01 billion. A similar revenue generation trend is noted, with receipts from the sale of cultivated assets and license fees being projected as the top revenue earners.
Wages
For the financial year 2019/20, wages and allowances accounted for twelve per cent of the recurrent spending in the Ministry of Environment and Forestry. This is projected to increase slightly, to fourteen per cent in the FY 2020/21. The bulk of the recurrent expenditure goes to grants to various government agencies and other levels of government, rentals, utilities and other operating expensesCategory Approved
Estimates 2019/20
Estimates 2020/21
Headquarters-Basic Salaries &Allowances
990,406,560 1,097,442,504
Central Planning & Project Monitoring Unit - HQ
15,123,620 16,082,544
Directorate Environment 47,063,620 43,658,991Climate Change Secretariat 27,740,480 29,022,898Multilateral Environmental Agreements 11,901,920 17,739,680Conservation Department 20,366,640 29,672,485Directorate of Resource Survey 79,788,880Total Salaries and Wages 1,112,602,840 1,313,407,982Total Recurrent Budget 9,059,066,877 9,236,116,643Salaries as a percentage of recurrent allocation
12.2% 14.2%
26
Community Livelihood Programme
The Community Livelihood Programme aims to improve the livelihoods of communities within the water towers ecosystem while increasing the Water Towers Ecosystem Health. The programme was allocated Ksh 260 million in the FY 2018/19 but this has reduced sharply to Ksh. 20 million in the FY 2020/21.
A review of the programme outputs and performance indicators listed under the programme-based budget reveals that while the budget allocations may have reduced over the three years, the targets listed (Number of nature-based enterprises established, area protected in Hectares, area of degraded landscapes rehabilitated in Hectares) have increased.
Notably, the priority areas listed by the Ministry for the current Medium Term Expenditure Framework (MTEF) period 2019/20–2021/22 include capacity building of communities on environmental management and awareness creation, restoration of degraded land, rivers and wetlands and domestication and implementation of Multilateral Environmental Agreements and programmes. The prioritization listed in the MTEF is however not matched with adequate resourcing.
Ministry of Petroleum and Mining
The Ministry currently comprises two state departments; the State Department of Petroleum and the State Department of Mining. The state department for petroleum was created in November 2015. This department owes its elevation to a government reorganization that saw it elevated from the directorate level to the state department level. The mandate of this state department is to lead petroleum operation programs, policy formulation, conducting reviews of the relevant fiscal, legal and regulatory framework, monitoring and supervision of oil and gas exploration and petroleum development and production activities.
27
Overall Budget Analysis
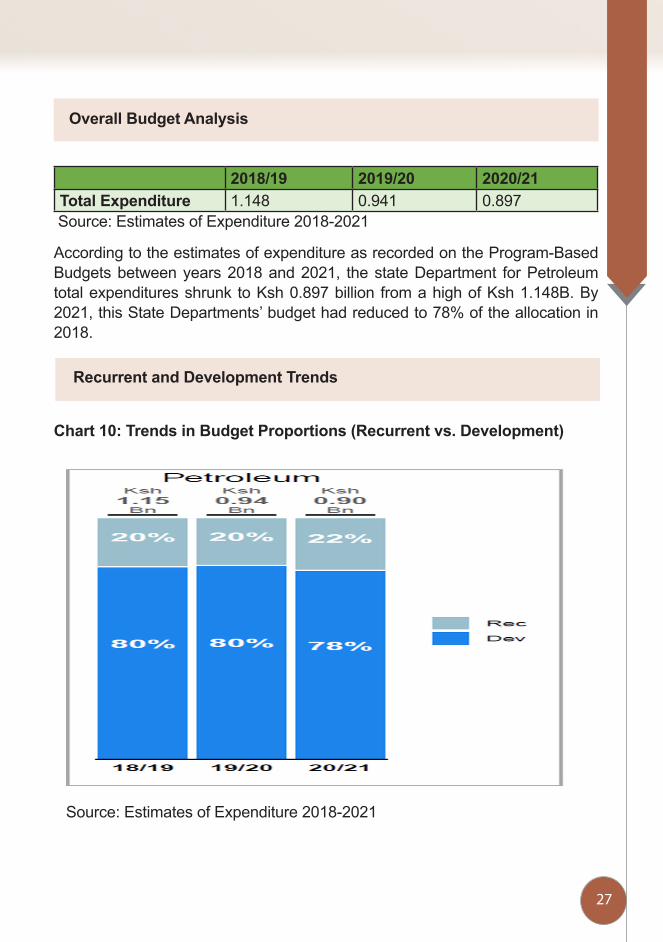
2018/19 2019/20 2020/21Total Expenditure 1.148 0.941 0.897
Source: Estimates of Expenditure 2018-2021
According to the estimates of expenditure as recorded on the Program-Based Budgets between years 2018 and 2021, the state Department for Petroleum total expenditures shrunk to Ksh 0.897 billion from a high of Ksh 1.148B. By 2021, this State Departments’ budget had reduced to 78% of the allocation in 2018.
Recurrent and Development Trends
Chart 10: Trends in Budget Proportions (Recurrent vs. Development)
Source: Estimates of Expenditure 2018-2021
28
By 2021, both the recurrent and development components of the state department for petroleum budget had shrunk to 84% and 87% of their size in the 2018/19 fiscal year. In 2019/20 the recurrent budget shrunk to 80%. The development budget shrunk to 83% of its then subsequently increased to 87%. Overall, both components of the petroleum budget shrunk in that period. While allocations for development have consistently reduced, allocations for recurrent expenditure decreased in 2019/20 but increased in 2020/21. In both cases, allocations remained below the 2018/19 baseline by the end of the period in question.
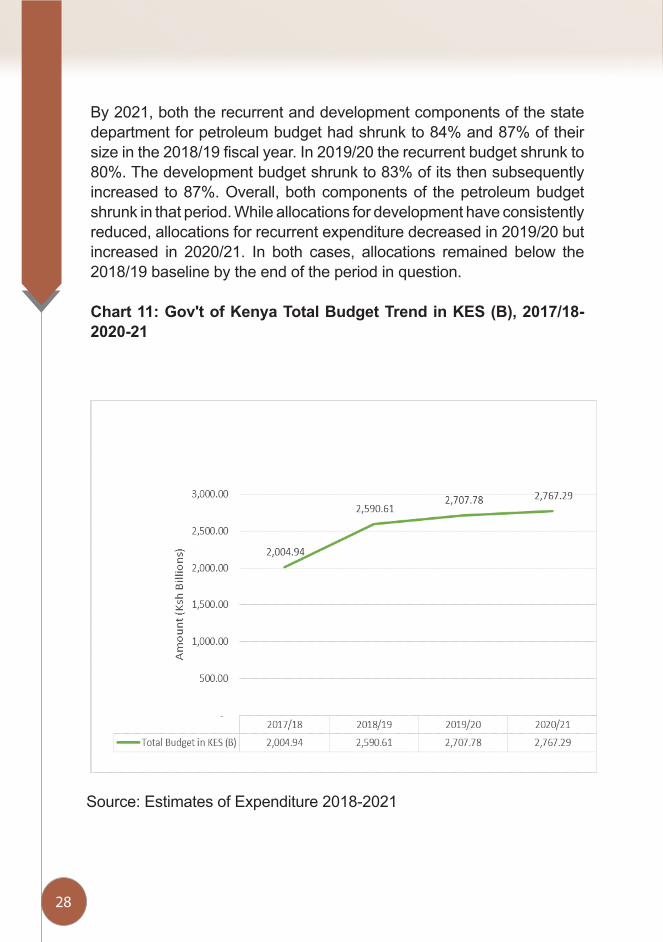
Chart 11: Gov't of Kenya Total Budget Trend in KES (B), 2017/18-2020-21
Source: Estimates of Expenditure 2018-2021
29
Between the financial years 2018/19 and 2020/21, the Kenyan government budget grew by 1.38%. In that same period, the State Department for Petroleum budget shrunk from Ksh1.15 billion to Ksh 0.89 billion. While the government budget has been growing in size, the State Department for petroleum budget shrunk to 78% in the 2017/18 financial year. Further, the State Department for petroleum share of total budget shrunk from 0.04% to 0.03%. Notably, the State Department for petroleum’s’ budget has been shrinking in both absolute and relative terms.
Sector Performance
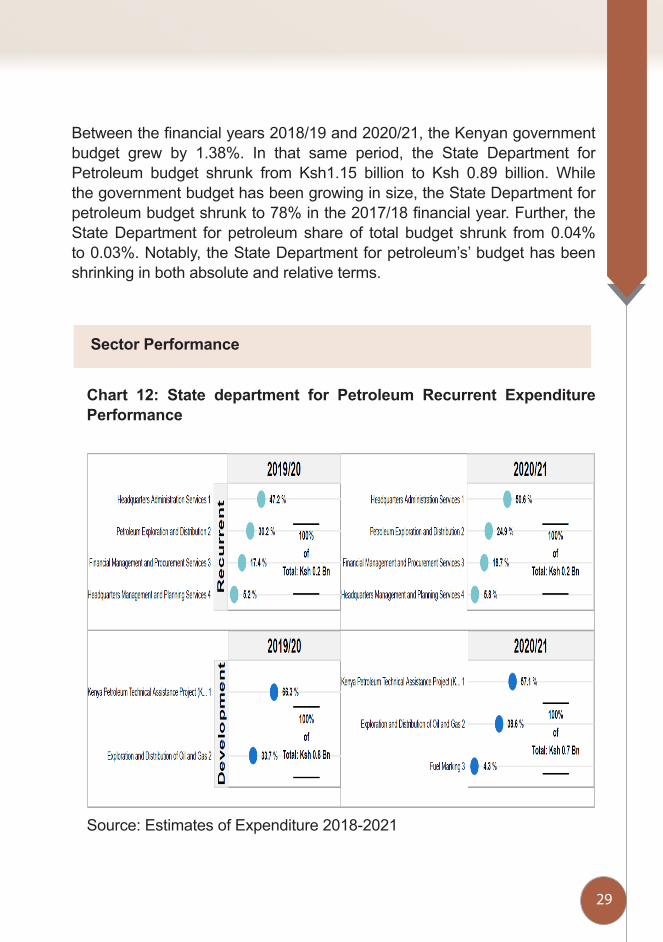
Chart 12: State department for Petroleum Recurrent Expenditure Performance
Source: Estimates of Expenditure 2018-2021
30
The chart above illustrates specific recurrent budget allocations for the state department of petroleum. In 2018, the headquarters administrative services took 46% share of the total state departments’ budget. This components share of the state departments’ recurrent budget increased to 47% in 2019/20 and further to 51% in 2020/21. Throughout the period 2018-2021, the Headquarters Administration Services took the largest share of this State Departments’ budget. The headquarters management and planning services component took the smallest share of recurrent expenditures. While all other components’ share of the recurrent budget grew from the 2018 baseline, only the petroleum exploration and distribution component shrunk.
Development Expenditure Performance
The table above illustrates specific development budget allocations for the State Department of Petroleum. In 2018, the exploration and distribution of oil and gas component took a 69% share of the total budget. This was the largest share by a single programme in that year. In the subsequent year, this component’s share of the total development budget reduced to 34% and then increased to 39%. This evolution was against a development budget that had a consistent fall during the period. The Kenya Petroleum Technical Assistance Project (KEPTAP) had its share of the total state department budget grow from 27% in 2018 to 57% in 2021. This particular project is funded by the World Bank.
It is reasonable to expect that the projects allocations will cease to exist once the money is used up and the objectives have been met. Petroleum Exploration in Block 14T component had zero allocations in this period. It is also important to note that Fuel Marking as a budget line had zero allocations in the FY 2019/20. Fuel marking is a method of mixing fuels with chemical markers as a safety standard that allows product differentiation and tracing for a number of reasons. It allows market stakeholders to distinguish between fuel marked for domestic consumption and fuel marked for export, for example. It is not clear why the allocation was not made in this particular year.
31
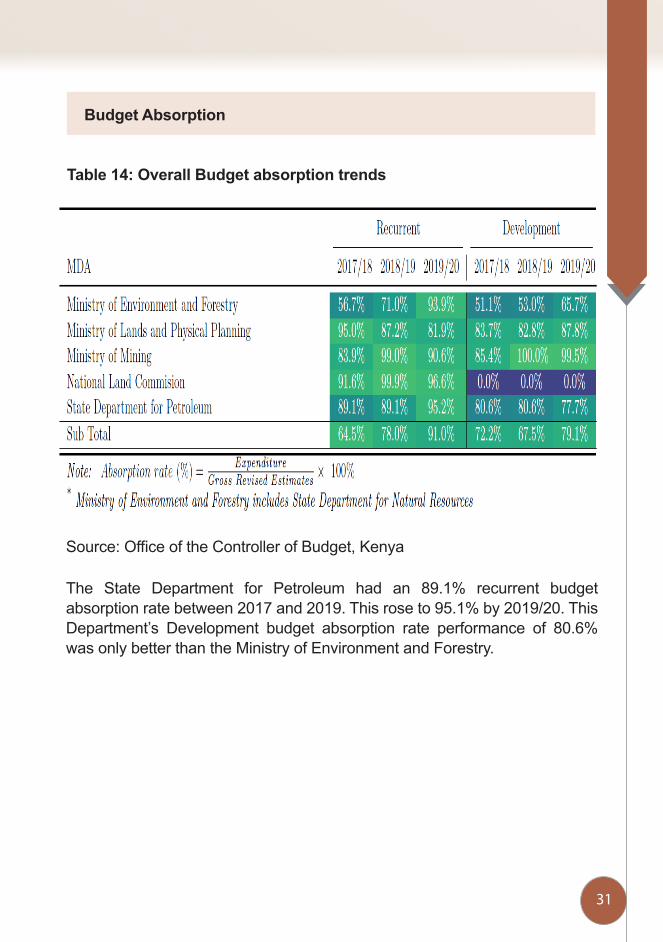
Budget Absorption
Table 14: Overall Budget absorption trends
Source: Office of the Controller of Budget, Kenya
The State Department for Petroleum had an 89.1% recurrent budget absorption rate between 2017 and 2019. This rose to 95.1% by 2019/20. This Department’s Development budget absorption rate performance of 80.6% was only better than the Ministry of Environment and Forestry.
32
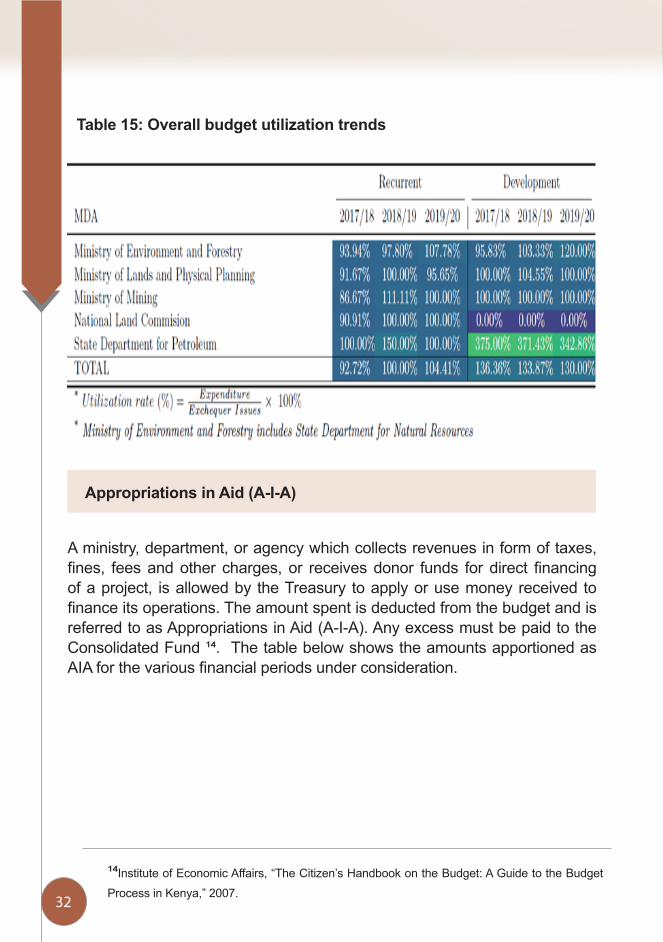
Table 15: Overall budget utilization trends
A ministry, department, or agency which collects revenues in form of taxes, fines, fees and other charges, or receives donor funds for direct financing of a project, is allowed by the Treasury to apply or use money received to finance its operations. The amount spent is deducted from the budget and is referred to as Appropriations in Aid (A-I-A). Any excess must be paid to the Consolidated Fund ¹⁴. The table below shows the amounts apportioned as AIA for the various financial periods under consideration.
Appropriations in Aid (A-I-A)
¹⁴Institute of Economic Affairs, “The Citizen’s Handbook on the Budget: A Guide to the Budget Process in Kenya,” 2007.
33
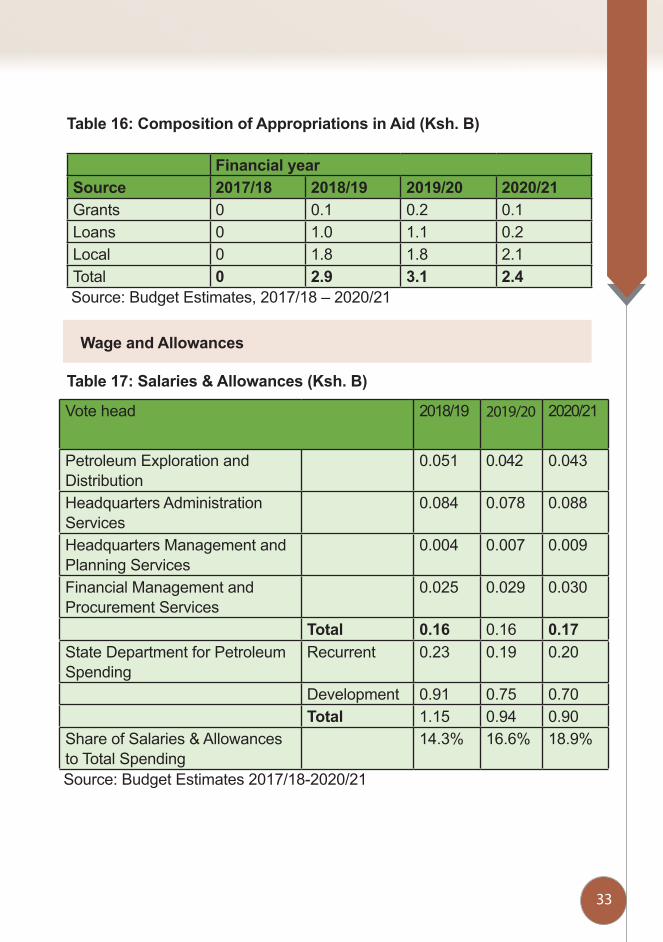
Table 16: Composition of Appropriations in Aid (Ksh. B)
Financial yearSource 2017/18 2018/19 2019/20 2020/21Grants 0 0.1 0.2 0.1Loans 0 1.0 1.1 0.2Local 0 1.8 1.8 2.1Total 0 2.9 3.1 2.4
Source: Budget Estimates, 2017/18 – 2020/21
Wage and Allowances
Table 17: Salaries & Allowances (Ksh. B)
Vote head 2018/19 2019/20 2020/21
Petroleum Exploration and Distribution
0.051 0.042 0.043
Headquarters Administration Services
0.084 0.078 0.088
Headquarters Management and Planning Services
0.004 0.007 0.009
Financial Management and Procurement Services
0.025 0.029 0.030
Total 0.16 0.16 0.17State Department for Petroleum Spending
Recurrent 0.23 0.19 0.20
Development 0.91 0.75 0.70Total 1.15 0.94 0.90
Share of Salaries & Allowances to Total Spending
14.3% 16.6% 18.9%
Source: Budget Estimates 2017/18-2020/21

34
The total for Basic Salaries (Permanent Employees), Personal Allowance (Paid as Part of Salary), and Wages over the financial period under review shows growth not only in nominal terms, but also as a percentage of the allocation to the State Department for Petroleum. The amount increased from Ksh. 0.16 Billion in the FY 2018/19 to Ksh. 0.17 Billion in FY 2020/21. As a percentage, there was an increase of 4.6 percentage points over the period.
The State Department for Petroleum had only 8 vote heads for both development and recurrent expenditure lines as outlined in the table below.
Table 18: Trends in Recurrent and Development
Recurrent Vote Heads Development Vote HeadsPetroleum Exploration and Distribution Kenya Petroleum Technical
Assistance Project (KEPTAP)Headquarters Administration Services Petroleum Exploration in Block
14THeadquarters Management and Planning Services
Fuel Marking
Financial Management and Procurement Services
Exploration and Distribution of Oil and Gas
Source: Budget Estimates, 2017/18 – 2020/21
Under the recurrent expenditure, the vote head on headquarters administration services has consistently received a higher allocation as a percentage of the total allocation. Under development, KEPTAP received a large allocation of Ksh. 0.5B in the FY 2019/20, which is twice the allocation from the previous FY, 2018/19.
However, this reduced to Ksh. 0.4B in the following year. Exploration and Distribution of Oil and Gas vote head shows a decline in allocation over the period, from Ksh. 0.63B in 2018/19 to Ksh. 0.27 B in the FY 2020/21 as shown in the chart below. This could be a result of the decline in exploration service and the subsequent shifting of resources to other functions. It is not clear that the government should expend its resources on oil exploration efforts.
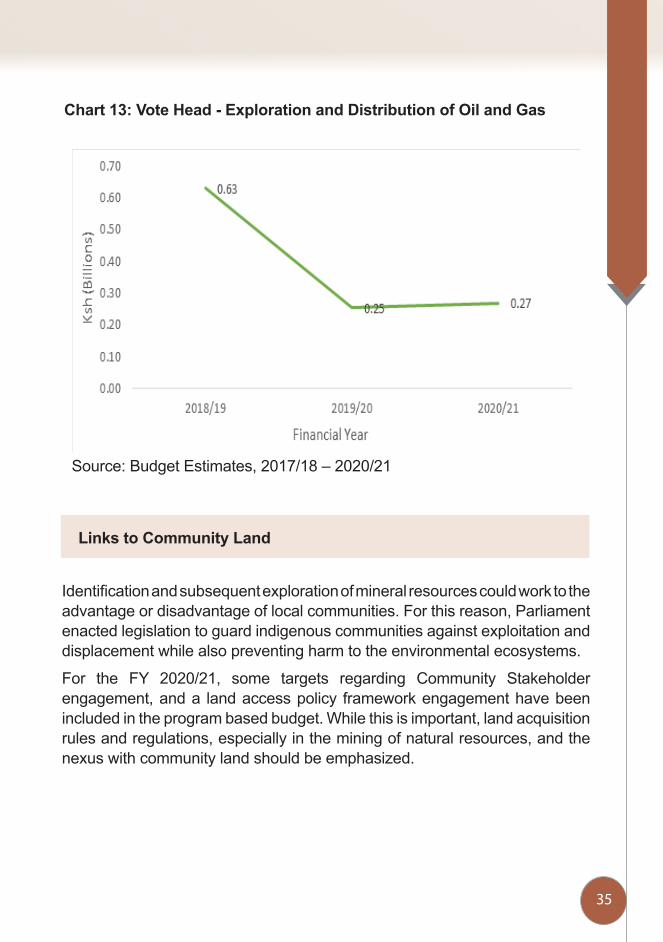
35
Chart 13: Vote Head - Exploration and Distribution of Oil and Gas
Source: Budget Estimates, 2017/18 – 2020/21
Links to Community Land
Identification and subsequent exploration of mineral resources could work to the advantage or disadvantage of local communities. For this reason, Parliament enacted legislation to guard indigenous communities against exploitation and displacement while also preventing harm to the environmental ecosystems.
For the FY 2020/21, some targets regarding Community Stakeholder engagement, and a land access policy framework engagement have been included in the program based budget. While this is important, land acquisition rules and regulations, especially in the mining of natural resources, and the nexus with community land should be emphasized.
36
Conclusion
The budget for the State Department for Petroleum has decreased over the FY 2018/19 to 2020/21. The decrease has been in absolute terms and also relative to the total national budget. Recurrent and development expenditures have reduced as oil exploration and development projects wind up. If new deposits of crude oil are not identified, this reduced budget trend may persist. This state department has had consistent absorption rates, with an average absorption of 81% of funds allocated.
Overall, the downward trend in the State Department budget can largely be attributed to a drop in the Petroleum Exploration and Distribution budget vote. While other votes received an increase in allocation, this vote head has recorded a decline. Basic salaries and personal allowances have increased both in nominal terms and relative to budget allocations to the State Department for Petroleum.

37
References
1 Agriculture Rural and Urban Development Sector report. 2018. Medium Term Expenditure Framework 2018/19-2020/21.
2 The National Treasury. 2019. Programme Based Budget.
3 Ministry of Environment and Forestry. 2020. Ministry of Environment and Forestry. Accessed November 22, 2020. https://www.cbd.int/doc/nr/nr-06/ke-nr-06-en.pdf.
4 The National Treasury. 2019. The National Treasury. June 19. Accessed November 22, 2020. https://www.treasury.go.ke/news-updates/300-treasury-puts-in-place-austerity-measures-to-contain-spending.
5 National Land Commission. 2019. Devolved Governance 2015/16 report.
6 Ministry of Petroleum and Mining. 2020. The State Department for Petroleum. November 23. http://www.petroleumandmining.go.ke.
7 Ministry of Environment and Forestry. (2020). Ministry of Environment and Forestry. Retrieved November 22, 2020, from Ministry of Environment and Forestry: https://www.cbd.int/doc/nr/nr-06/ke-nr-06-en.pdf
8 The National Treasury. (2019, June 19). The National Treasury. Retrieved November 22, 2020, from The National Treasury: https://www.treasury.go.ke/news-updates/300-treasury-puts-in-place-austerity-measures-to-contain-spending
9 The National Treasury. (2020, June). Estimates of Revenue, Grants and Loans. Retrieved November 23, 2020 from: https://www.treasury.go.ke/component/jdownloads/send/216-budget-books/1611-2020-2021-estimates-of-revenue-grants-and-loans.html
10 World Bank. 2020. Kenya Petroleum Technical Assistance Project (KEPTAP). November 24. http://www.projects.worldbank.org.
38
Published by Kenya Land Alliance
In partnership with
Institute of Economic Affairs