buct nitrogen inflation of tires for pdf.813.ppt · inflation of tires . 2 one example of reported...
TRANSCRIPT

Walter H. WaddellPolymers TechnologySeptember 19, 20132008.1603; 2007 PYBA 21
presented to
Beijing University of Chemical TechnologyBeijing, China
EVALUATION OF NITROGEN INFLATION OF TIRES

2
One example of reported claims for inflating tires with nitrogen gas:• Constant pressure: “Nitrogen molecules are four times larger than air and
as a result will not seep through the casing of the tyre like air, which would normally result in pressure loss. Nitrogen is also a more stable gas than air and as such will not give high fluctuations in temperature and therefore pressure within the tyre”.
• No oxidation: “As normal compressed air passes through the casing of the tyre, oxidation is caused within the tyre belts, reducing the life of the casing and increasing the risk of blow outs. As nitrogen is clean and dry, there is no moisture and the larger nitrogen molecules will not pass through the tyre casing like air”.
• Lower running temperature: “Fluctuation in pressure means increased temperature resulting in increased tyre wear. As the pressure in the tyre is more constant, you will not get the increase in temperature and pressure like you get with tyres inflated with normal compressed air”.
• 3 per cent saving on fuel costs: “As the tyre loses pressure, the tyre surface on the road increases. With a 10 per cent reduction in tyre pressure, research has shown that you will get a 3 per cent increase in fuel usage”.
Background: Reported Benefits of Nitrogen
Ref: Bowen Independent (Australia), March 7, 2007, Pg. 17
3
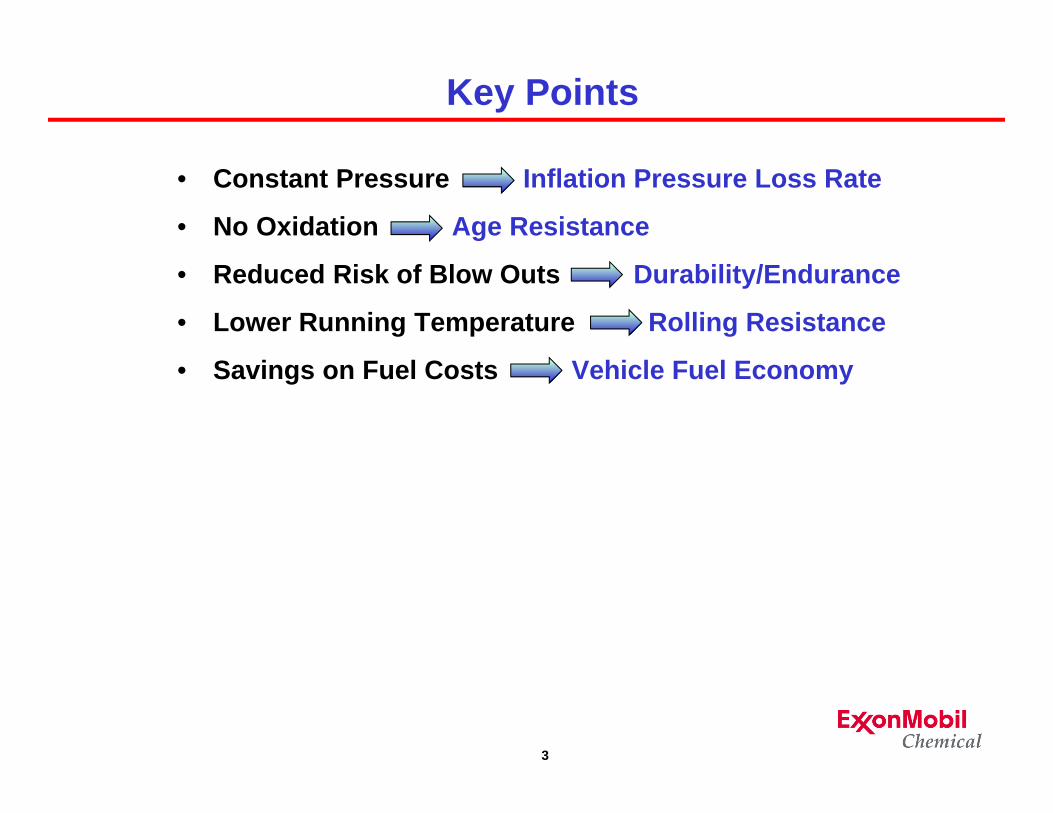
• Constant Pressure Inflation Pressure Loss Rate
• No Oxidation Age Resistance
• Reduced Risk of Blow Outs Durability/Endurance
• Lower Running Temperature Rolling Resistance
• Savings on Fuel Costs Vehicle Fuel Economy
Key Points
4
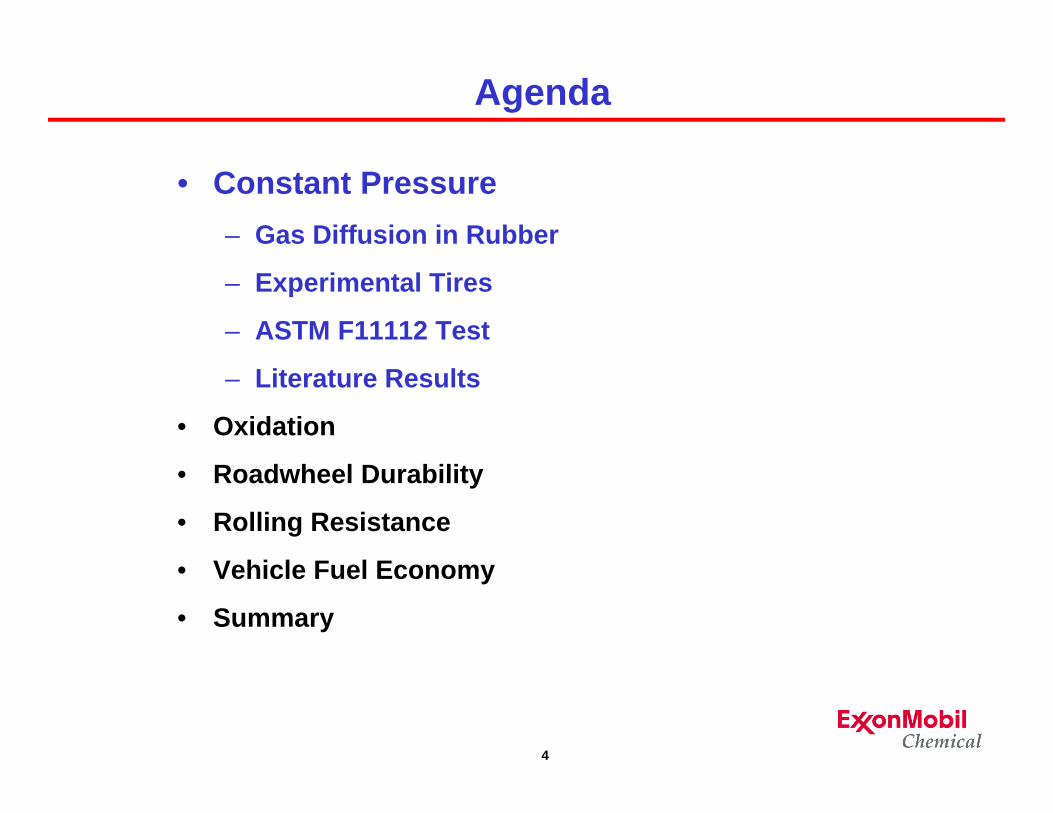
• Constant Pressure– Gas Diffusion in Rubber
– Experimental Tires
– ASTM F11112 Test
– Literature Results
• Oxidation
• Roadwheel Durability
• Rolling Resistance
• Vehicle Fuel Economy
• Summary
Agenda
5
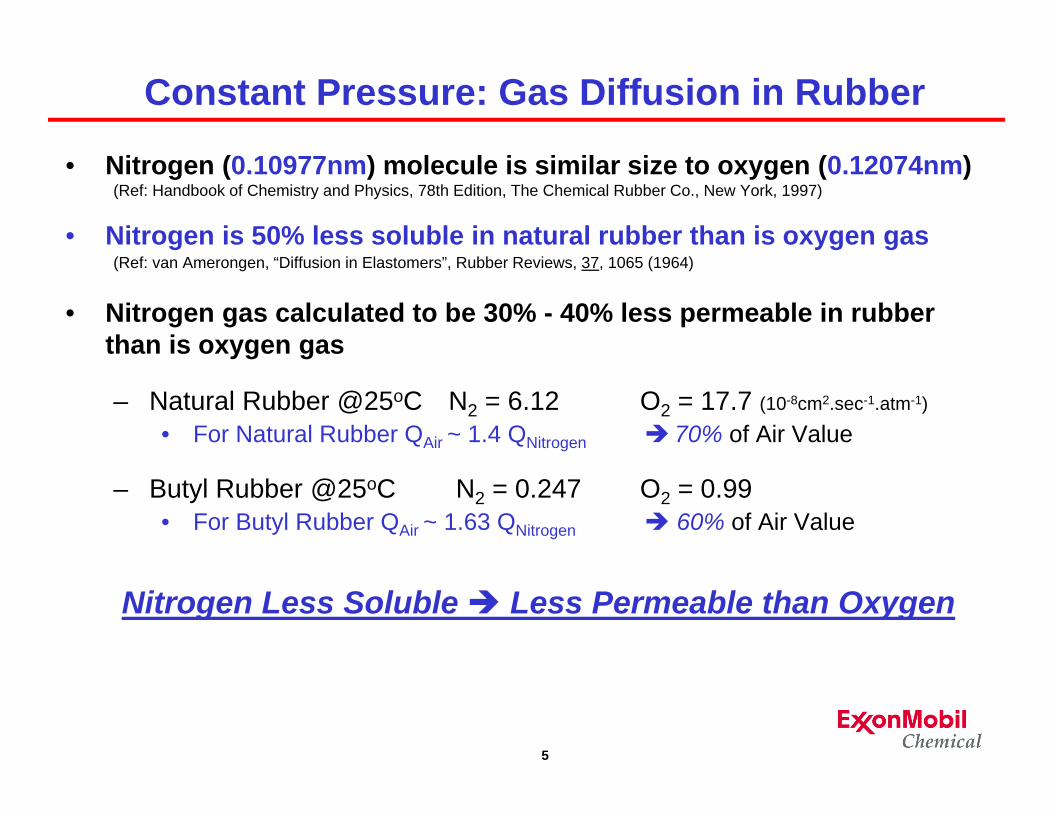
Constant Pressure: Gas Diffusion in Rubber
• Nitrogen (0.10977nm) molecule is similar size to oxygen (0.12074nm)(Ref: Handbook of Chemistry and Physics, 78th Edition, The Chemical Rubber Co., New York, 1997)
• Nitrogen is 50% less soluble in natural rubber than is oxygen gas(Ref: van Amerongen, “Diffusion in Elastomers”, Rubber Reviews, 37, 1065 (1964)
• Nitrogen gas calculated to be 30% - 40% less permeable in rubber than is oxygen gas
– Natural Rubber @25oC N2 = 6.12 O2 = 17.7 (10-8cm2.sec-1.atm-1)
• For Natural Rubber QAir ~ 1.4 QNitrogen 70% of Air Value
– Butyl Rubber @25oC N2 = 0.247 O2 = 0.99• For Butyl Rubber QAir ~ 1.63 QNitrogen 60% of Air Value
Nitrogen Less Soluble Less Permeable than Oxygen
6
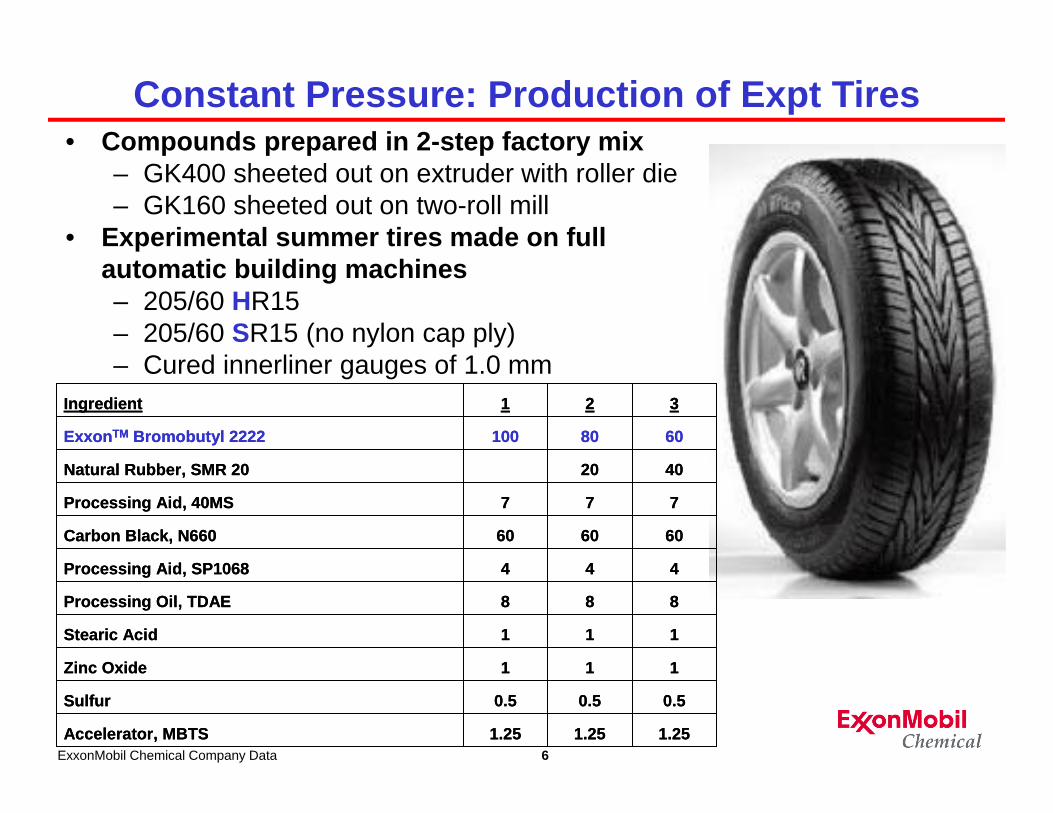
• Compounds prepared in 2-step factory mix– GK400 sheeted out on extruder with roller die– GK160 sheeted out on two-roll mill
• Experimental summer tires made on full automatic building machines– 205/60 HR15– 205/60 SR15 (no nylon cap ply)– Cured innerliner gauges of 1.0 mm
Constant Pressure: Production of Expt Tires
1.251.251.25Accelerator, MBTS
0.50.50.5Sulfur
111Zinc Oxide
111Stearic Acid
888Processing Oil, TDAE
444Processing Aid, SP1068
606060Carbon Black, N660
777Processing Aid, 40MS
4020Natural Rubber, SMR 20
6080100ExxonTM Bromobutyl 2222
321Ingredient
1.251.251.25Accelerator, MBTS
0.50.50.5Sulfur
111Zinc Oxide
111Stearic Acid
888Processing Oil, TDAE
444Processing Aid, SP1068
606060Carbon Black, N660
777Processing Aid, 40MS
4020Natural Rubber, SMR 20
6080100ExxonTM Bromobutyl 2222
321Ingredient
ExxonMobil Chemical Company Data
7
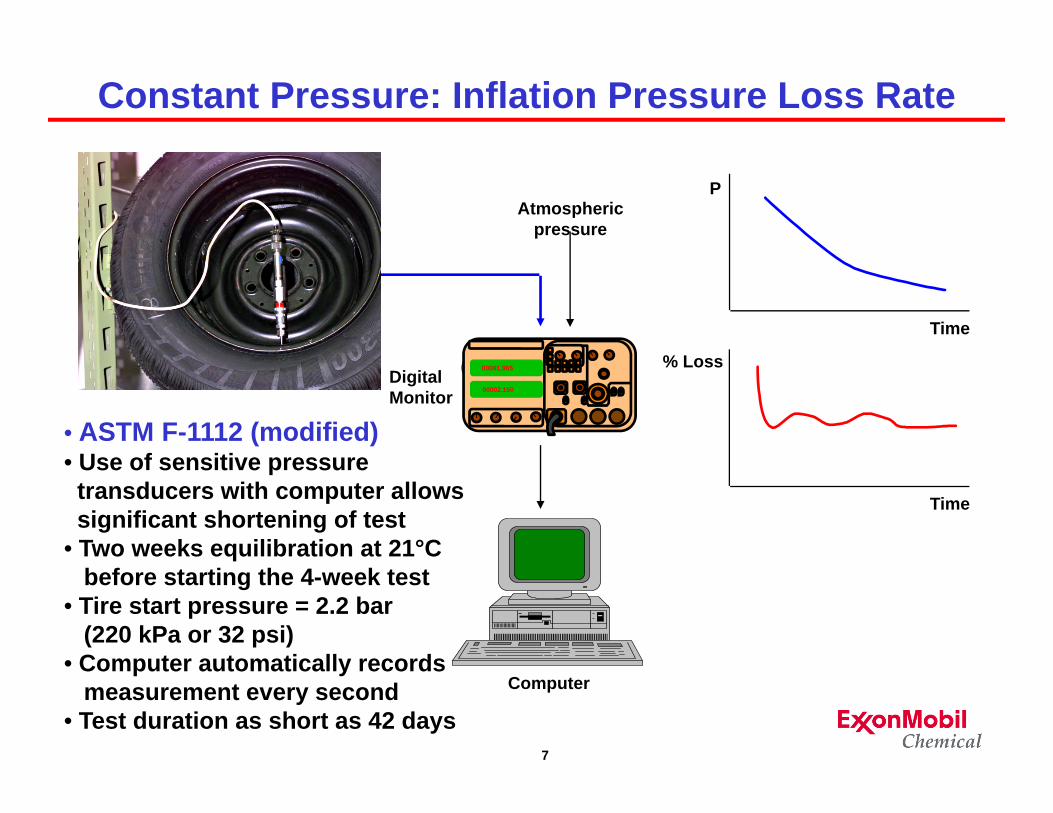
Constant Pressure: Inflation Pressure Loss Rate
00001.965
00002.150DigitalMonitor
Computer
Atmospheric pressure
• ASTM F-1112 (modified)• Use of sensitive pressure
transducers with computer allowssignificant shortening of test
• Two weeks equilibration at 21°C before starting the 4-week test
• Tire start pressure = 2.2 bar(220 kPa or 32 psi)
• Computer automatically recordsmeasurement every second
• Test duration as short as 42 days
P
Time
Time
% Loss

8
Constant Pressure: Fill Gas Effects on IPLR
Tire IPLR Reduced 40% Using
Dry, Pure Nitrogen Gas Inflation
Used ASTM F-1112 (modified) to study Inflation Pressure Loss Rates of 205/60 SR15 tires built with different innerliners• Tires purged 3X in order to obtain pure fill gas: dry 99.4% nitrogen
ExxonMobil Chemical Company Data
Inflation Pressure Loss Rate of 100-phr BIIR
1.45
0.79
0
0.5
1
1.5
2
Air Nitrogen
Filling Gas
%-L
oss/
Mon
th
Inflation Pressure Loss Rate of 80/20 CIIR/NR
1.84
1.01
0
0.5
1
1.5
2
Air Nitrogen
Filling Gas
%-L
oss/
Mon
th
9
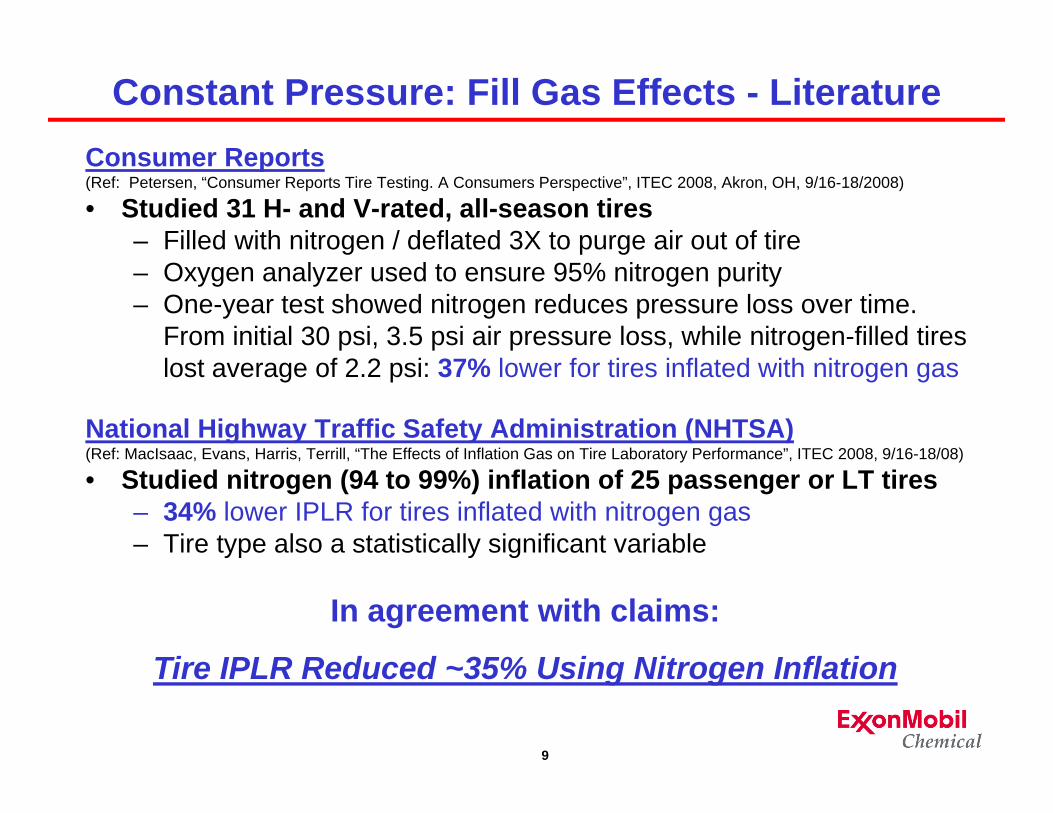
Constant Pressure: Fill Gas Effects - LiteratureConsumer Reports (Ref: Petersen, “Consumer Reports Tire Testing. A Consumers Perspective”, ITEC 2008, Akron, OH, 9/16-18/2008)
• Studied 31 H- and V-rated, all-season tires – Filled with nitrogen / deflated 3X to purge air out of tire– Oxygen analyzer used to ensure 95% nitrogen purity – One-year test showed nitrogen reduces pressure loss over time.
From initial 30 psi, 3.5 psi air pressure loss, while nitrogen-filled tires lost average of 2.2 psi: 37% lower for tires inflated with nitrogen gas
National Highway Traffic Safety Administration (NHTSA)(Ref: MacIsaac, Evans, Harris, Terrill, “The Effects of Inflation Gas on Tire Laboratory Performance”, ITEC 2008, 9/16-18/08)
• Studied nitrogen (94 to 99%) inflation of 25 passenger or LT tires – 34% lower IPLR for tires inflated with nitrogen gas– Tire type also a statistically significant variable
In agreement with claims:
Tire IPLR Reduced ~35% Using Nitrogen Inflation
10
• Constant Pressure
• Oxidation– Oven Aging od Tires
– Component Testing of Aged Tires• Roadwheel Durability
• Rolling Resistance
• Vehicle Fuel Economy
• Summary
Agenda
11
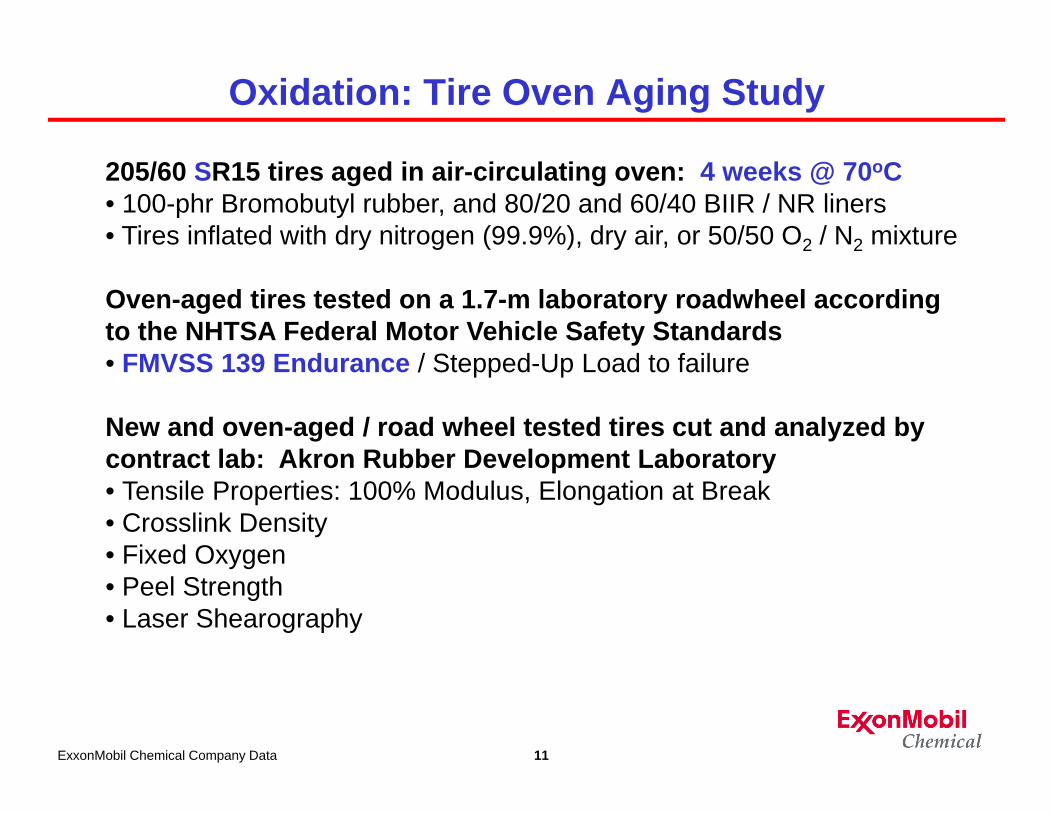
Oxidation: Tire Oven Aging Study
205/60 SR15 tires aged in air-circulating oven: 4 weeks @ 70oC• 100-phr Bromobutyl rubber, and 80/20 and 60/40 BIIR / NR liners• Tires inflated with dry nitrogen (99.9%), dry air, or 50/50 O2 / N2 mixture
Oven-aged tires tested on a 1.7-m laboratory roadwheel according to the NHTSA Federal Motor Vehicle Safety Standards• FMVSS 139 Endurance / Stepped-Up Load to failure
New and oven-aged / road wheel tested tires cut and analyzed by contract lab: Akron Rubber Development Laboratory• Tensile Properties: 100% Modulus, Elongation at Break• Crosslink Density• Fixed Oxygen• Peel Strength• Laser Shearography
ExxonMobil Chemical Company Data
12
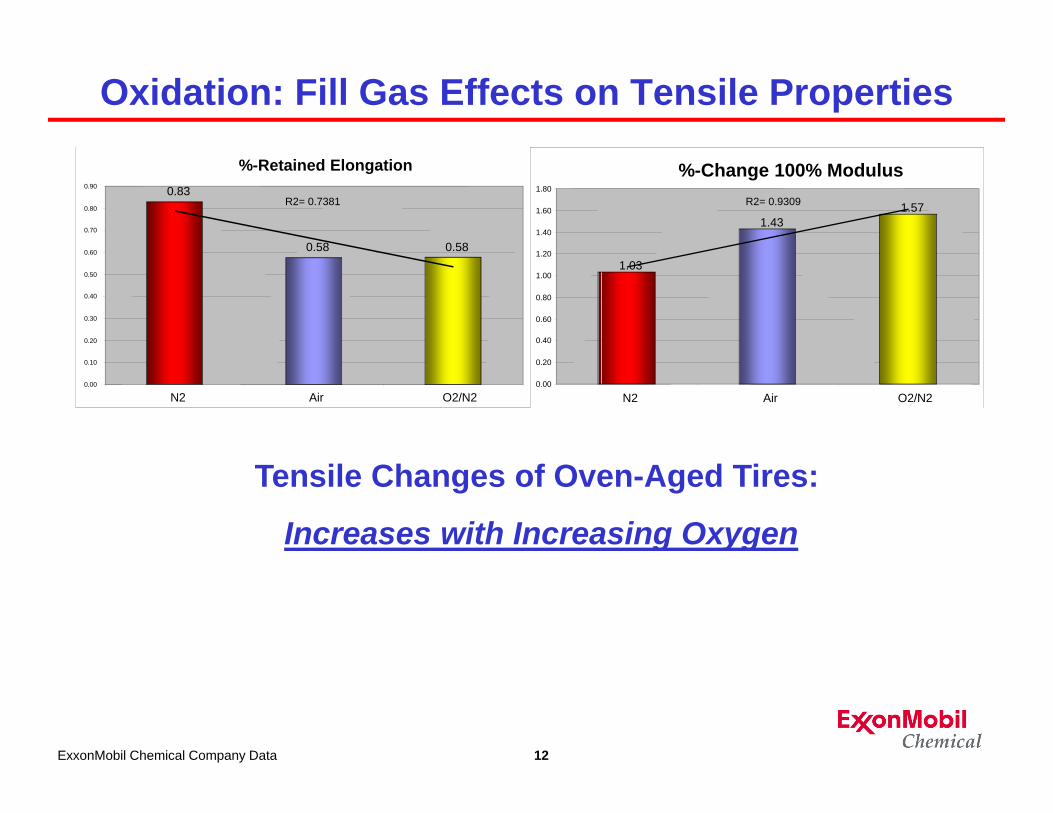
Oxidation: Fill Gas Effects on Tensile Properties
Tensile Changes of Oven-Aged Tires:
Increases with Increasing Oxygen
%-Retained Elongation0.83
0.58 0.58
R2= 0.7381
0.00
0.10
0.20
0.30
0.40
0.50
0.60
0.70
0.80
0.90
N2 Air O2/N2
%-Change 100% Modulus
1.03
1.431.57R2= 0.9309
0.00
0.20
0.40
0.60
0.80
1.00
1.20
1.40
1.60
1.80
N2 Air O2/N2
ExxonMobil Chemical Company Data
13
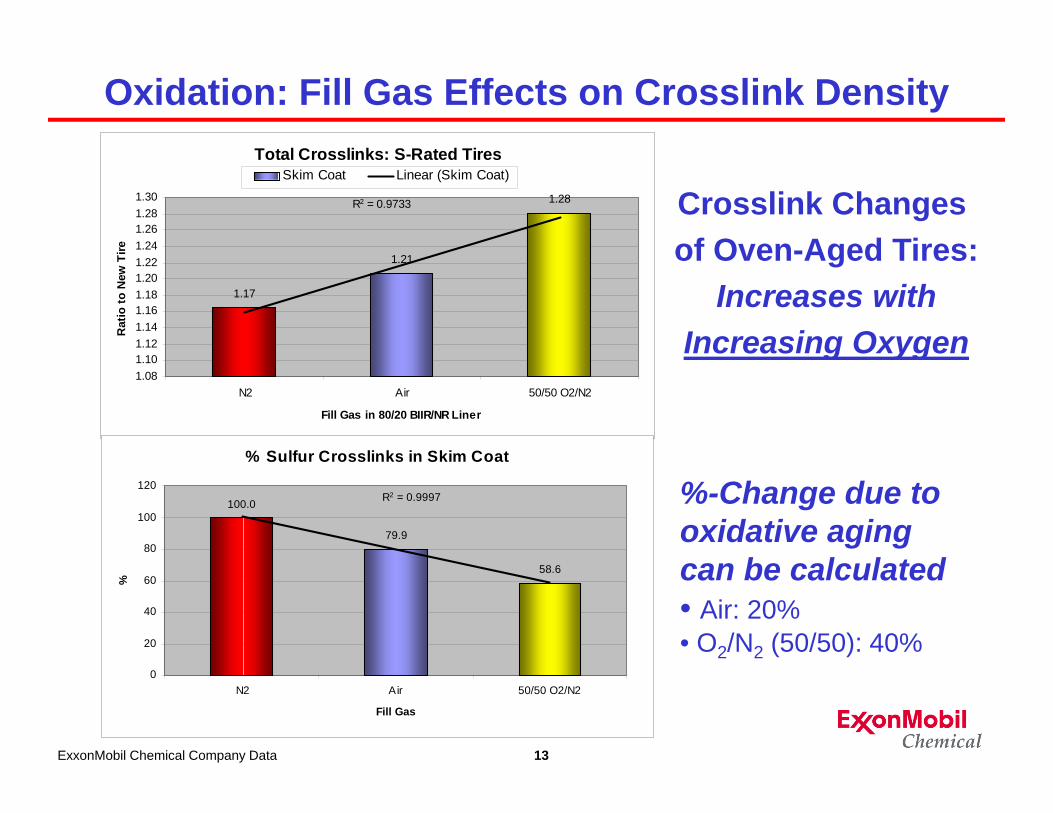
Oxidation: Fill Gas Effects on Crosslink Density
Crosslink Changesof Oven-Aged Tires:
Increases withIncreasing Oxygen
Total Crosslinks: S-Rated Tires
1.17
1.21
1.28R2 = 0.9733
1.081.101.121.141.161.181.201.221.241.261.281.30
N2 Air 50/50 O2/N2
Fill Gas in 80/20 BIIR/NR Liner
Rat
io to
New
Tire
Skim Coat Linear (Skim Coat)
% Sulfur Crosslinks in Skim Coat
100.0
79.9
58.6
R2 = 0.9997
0
20
40
60
80
100
120
N2 Air 50/50 O2/N2
Fill Gas
%
%-Change due to oxidative aging can be calculated• Air: 20%• O2/N2 (50/50): 40%
ExxonMobil Chemical Company Data
14
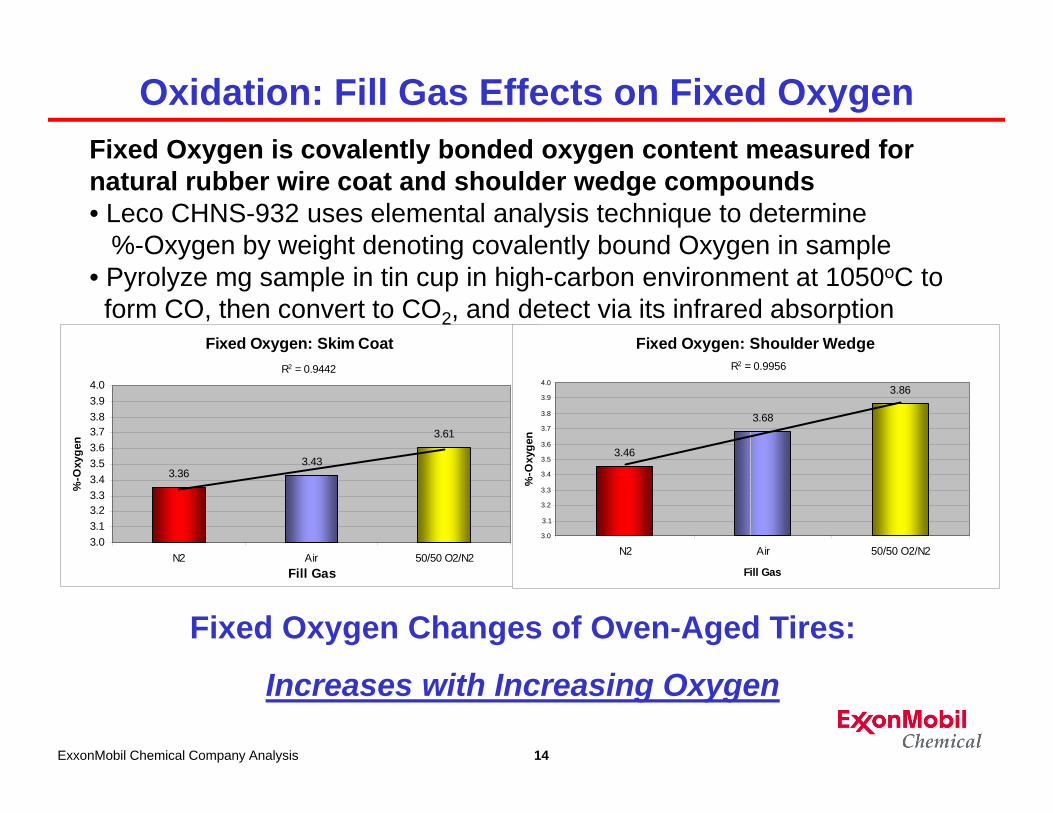
Oxidation: Fill Gas Effects on Fixed Oxygen
Fixed Oxygen Changes of Oven-Aged Tires:
Increases with Increasing Oxygen
Fixed Oxygen: Skim Coat
3.363.43
3.61
R2 = 0.9442
3.03.13.23.33.43.53.63.73.83.94.0
N2 Air 50/50 O2/N2Fill Gas
%-O
xyge
n
Fixed Oxygen: Shoulder Wedge
3.46
3.68
3.86
R2 = 0.9956
3.0
3.1
3.2
3.3
3.4
3.5
3.6
3.7
3.8
3.9
4.0
N2 Air 50/50 O2/N2
Fill Gas
%-O
xyge
n
ExxonMobil Chemical Company Analysis
Fixed Oxygen is covalently bonded oxygen content measured for natural rubber wire coat and shoulder wedge compounds• Leco CHNS-932 uses elemental analysis technique to determine
%-Oxygen by weight denoting covalently bound Oxygen in sample• Pyrolyze mg sample in tin cup in high-carbon environment at 1050oC toform CO, then convert to CO2, and detect via its infrared absorption
15
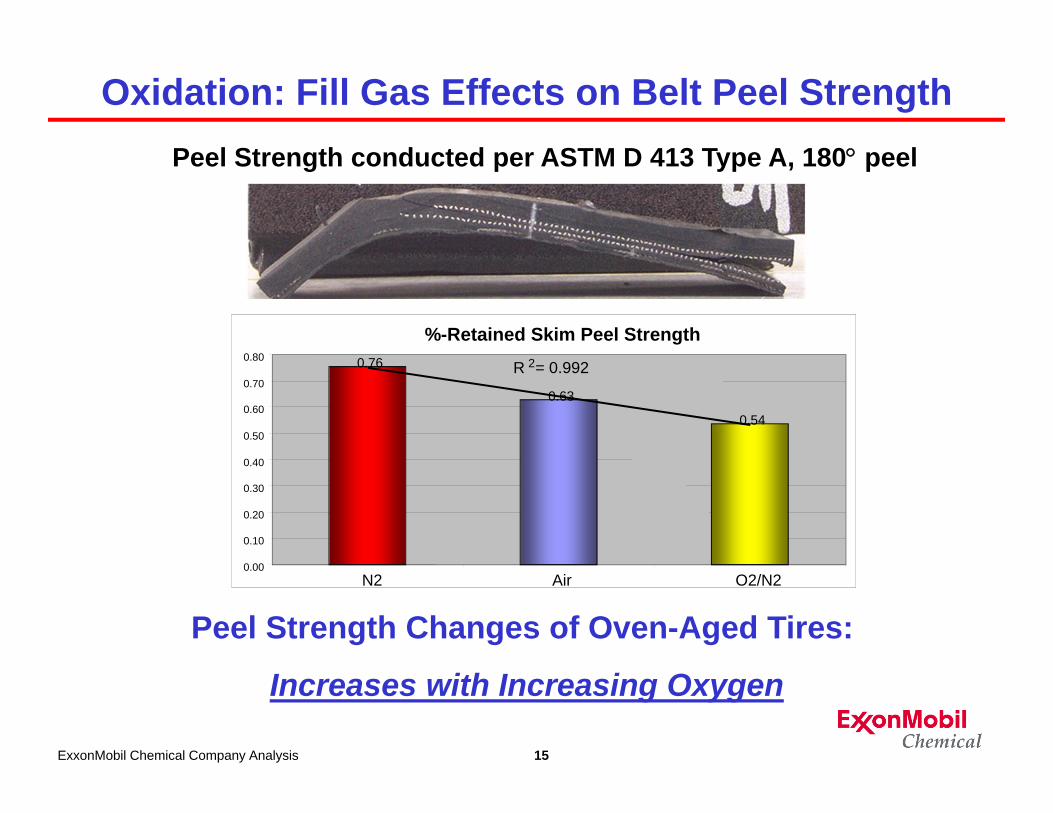
Oxidation: Fill Gas Effects on Belt Peel Strength
Peel Strength Changes of Oven-Aged Tires:
Increases with Increasing Oxygen
%-Retained Skim Peel Strength0.76
0.63
0.54
R 2= 0.992
0.00
0.10
0.20
0.30
0.40
0.50
0.60
0.70
0.80
N2 Air O2/N2
ExxonMobil Chemical Company Analysis
Peel Strength conducted per ASTM D 413 Type A, 180 peel

16
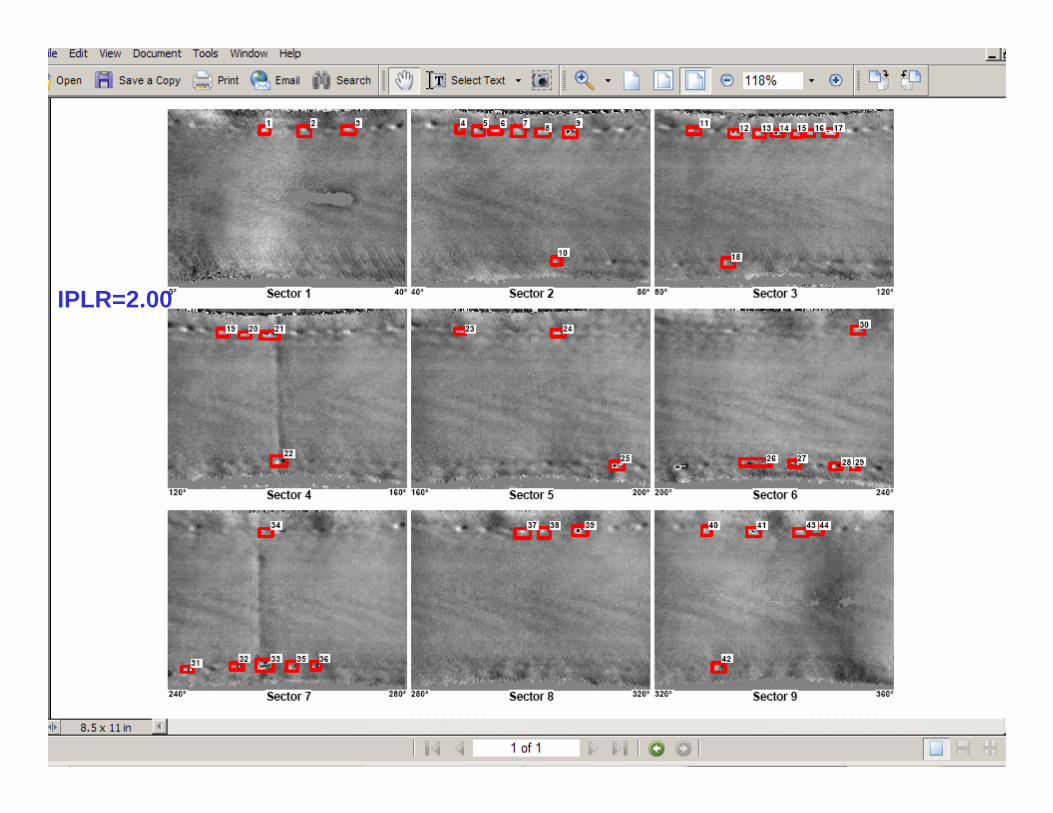
Relating Shearography to Tire Defects
Belt-1 edgeBelt-2 edge
Progression of belt edge defects along the two belt edges
Belt-1 edgeBelt-2 edge
Progression of belt edge defects along the two belt edges
17
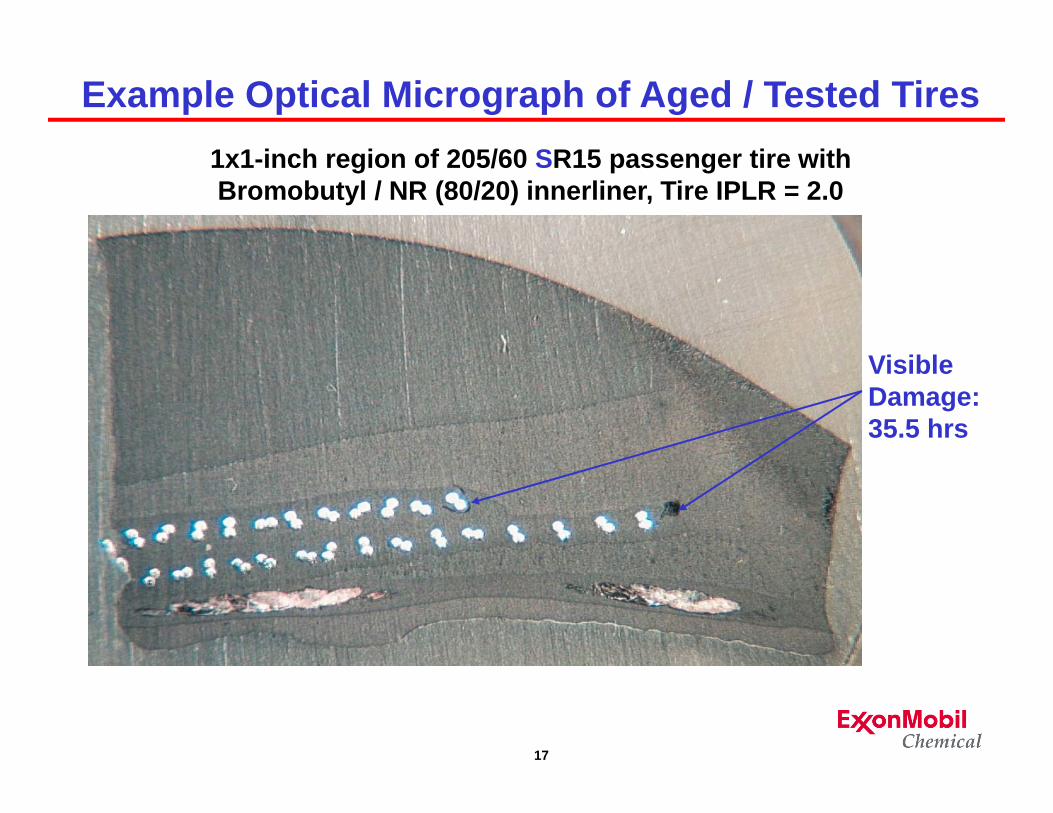
VisibleDamage: 35.5 hrs
1x1-inch region of 205/60 SR15 passenger tire withBromobutyl / NR (80/20) innerliner, Tire IPLR = 2.0
Example Optical Micrograph of Aged / Tested Tires
18
IPLR=2.00
19
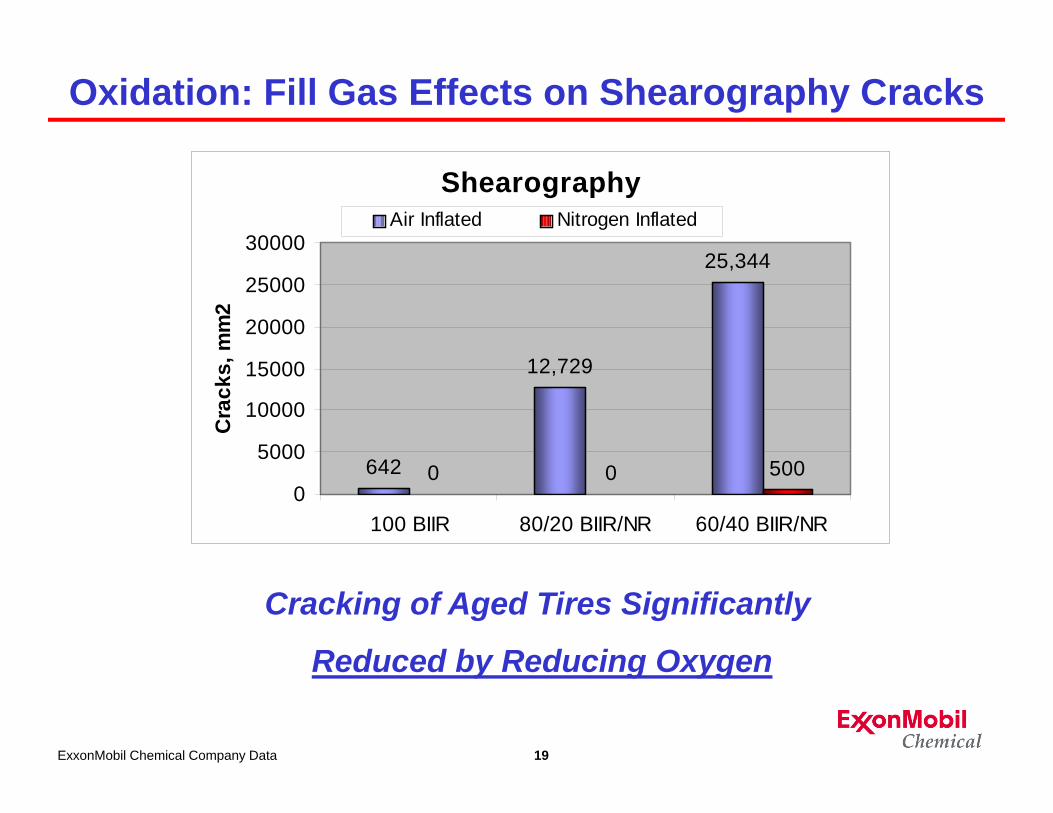
Oxidation: Fill Gas Effects on Shearography Cracks
Cracking of Aged Tires Significantly
Reduced by Reducing Oxygen
Shearography
642
12,729
25,344
0 0 5000
5000
10000
15000
20000
25000
30000
100 BIIR 80/20 BIIR/NR 60/40 BIIR/NR
Cra
cks,
mm
2Air Inflated Nitrogen Inflated
ExxonMobil Chemical Company Data
20
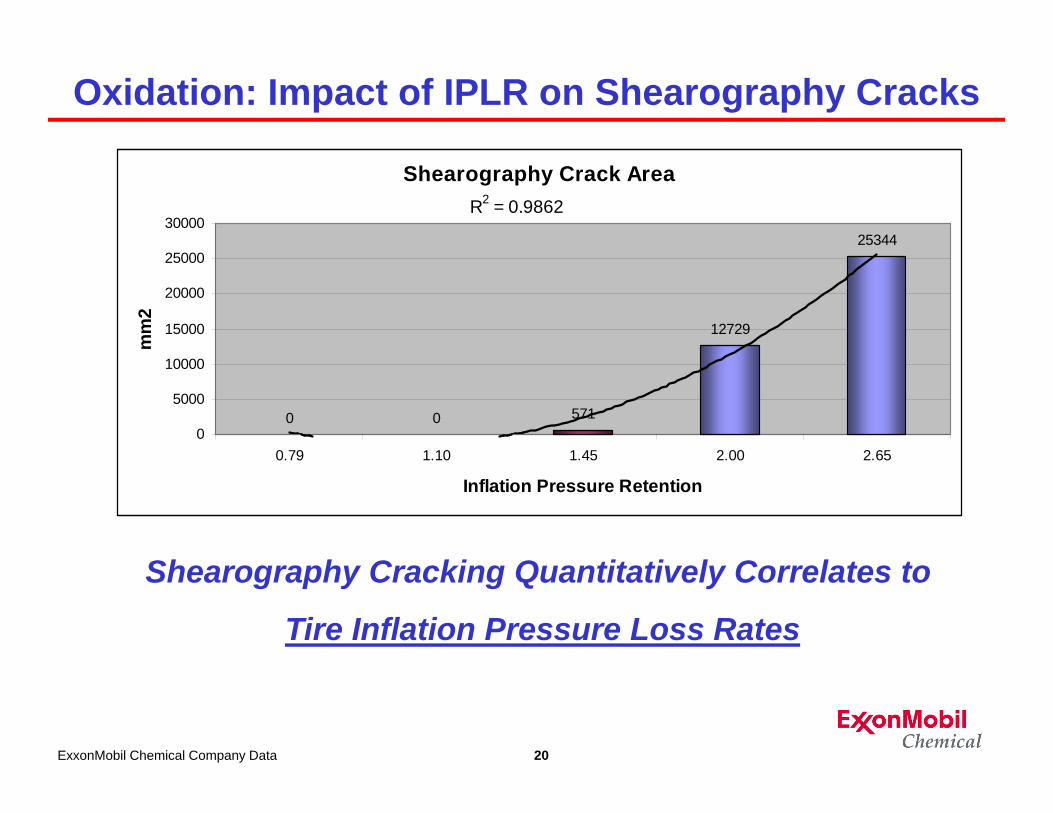
Oxidation: Impact of IPLR on Shearography Cracks
Shearography Cracking Quantitatively Correlates to
Tire Inflation Pressure Loss Rates
Shearography Crack Area
0 0 571
12729
25344
R2 = 0.9862
0
5000
10000
15000
20000
25000
30000
0.79 1.10 1.45 2.00 2.65
Inflation Pressure Retention
mm
2
ExxonMobil Chemical Company Data
21
• Constant Pressure
• Oxidation
• Roadwheel Durability– FMVSS 139 Endurance of New Tires
– FMVSS 139 Endurance / SUL of Aged Tires
• Rolling Resistance
• Vehicle Fuel Economy
• Summary
Agenda
22
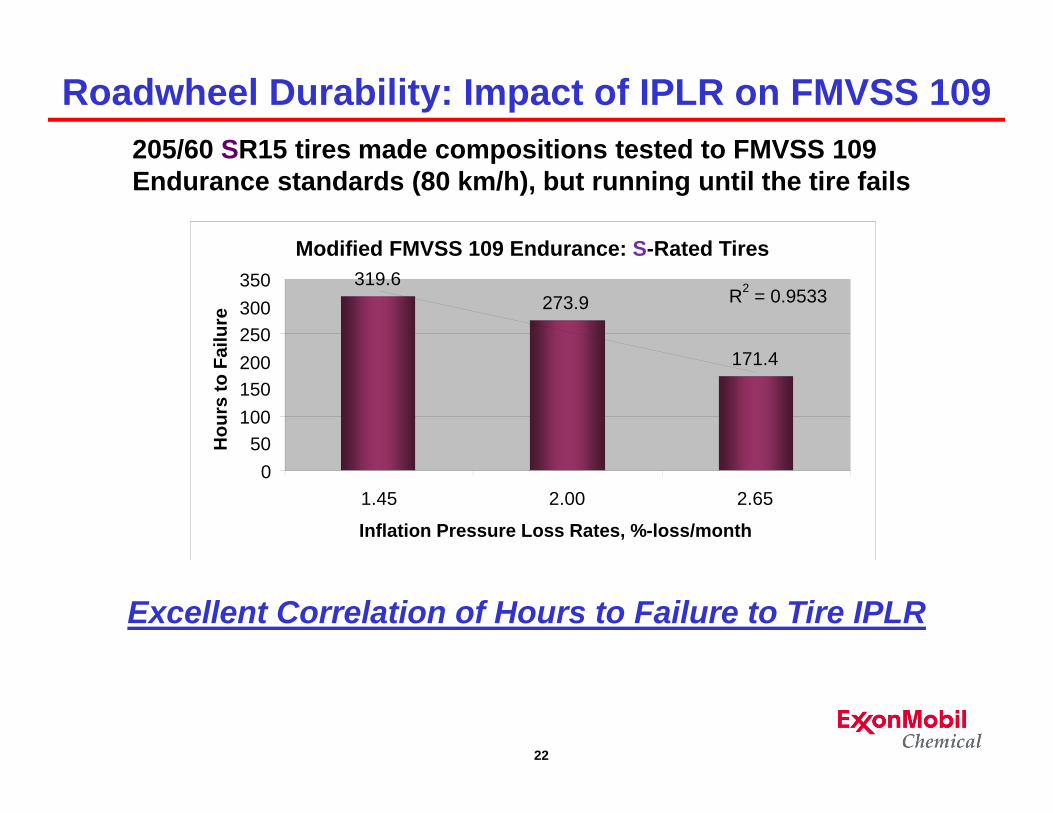
Roadwheel Durability: Impact of IPLR on FMVSS 109205/60 SR15 tires made compositions tested to FMVSS 109 Endurance standards (80 km/h), but running until the tire fails
Excellent Correlation of Hours to Failure to Tire IPLR
Modified FMVSS 109 Endurance: S-Rated Tires319.6
273.9
171.4
R2 = 0.9533
050
100150200250300350
1.45 2.00 2.65
Inflation Pressure Loss Rates, %-loss/month
Hou
rs to
Fai
lure
23
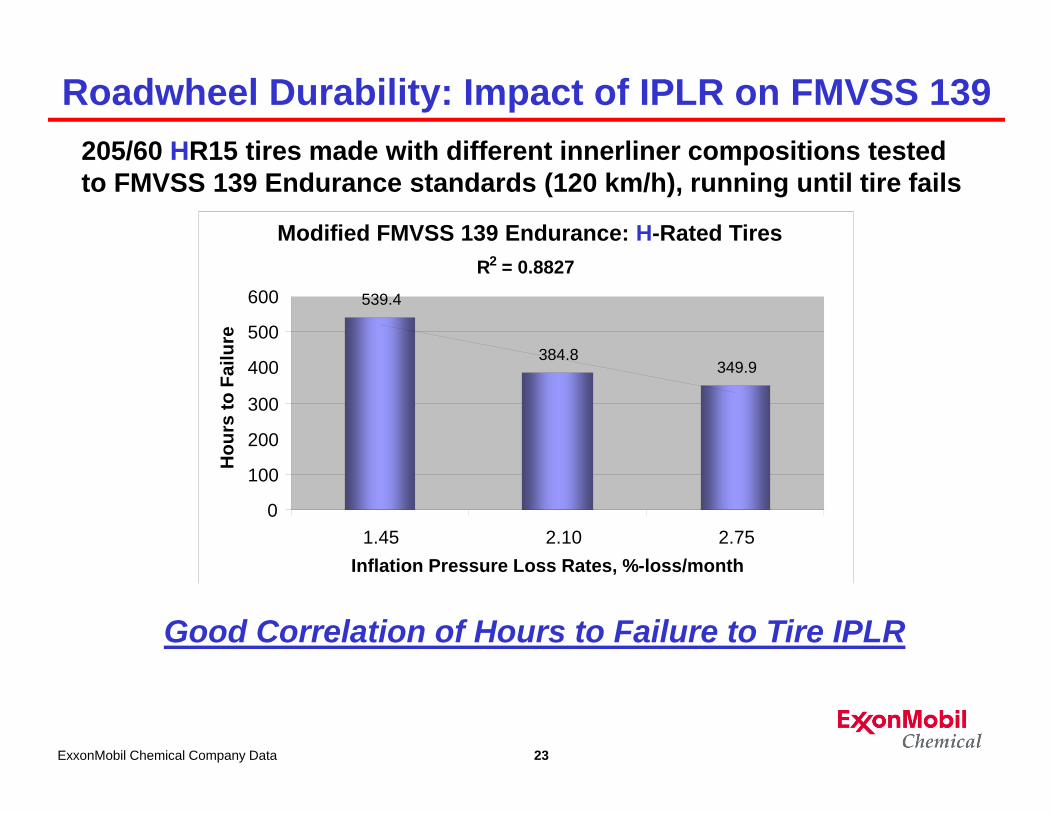
Roadwheel Durability: Impact of IPLR on FMVSS 139205/60 HR15 tires made with different innerliner compositions tested to FMVSS 139 Endurance standards (120 km/h), running until tire fails
Good Correlation of Hours to Failure to Tire IPLR
ExxonMobil Chemical Company Data
Modified FMVSS 139 Endurance: H-Rated Tires
539.4
384.8349.9
R2 = 0.8827
0
100
200
300
400
500
600
1.45 2.10 2.75Inflation Pressure Loss Rates, %-loss/month
Hou
rs to
Fai
lure
24
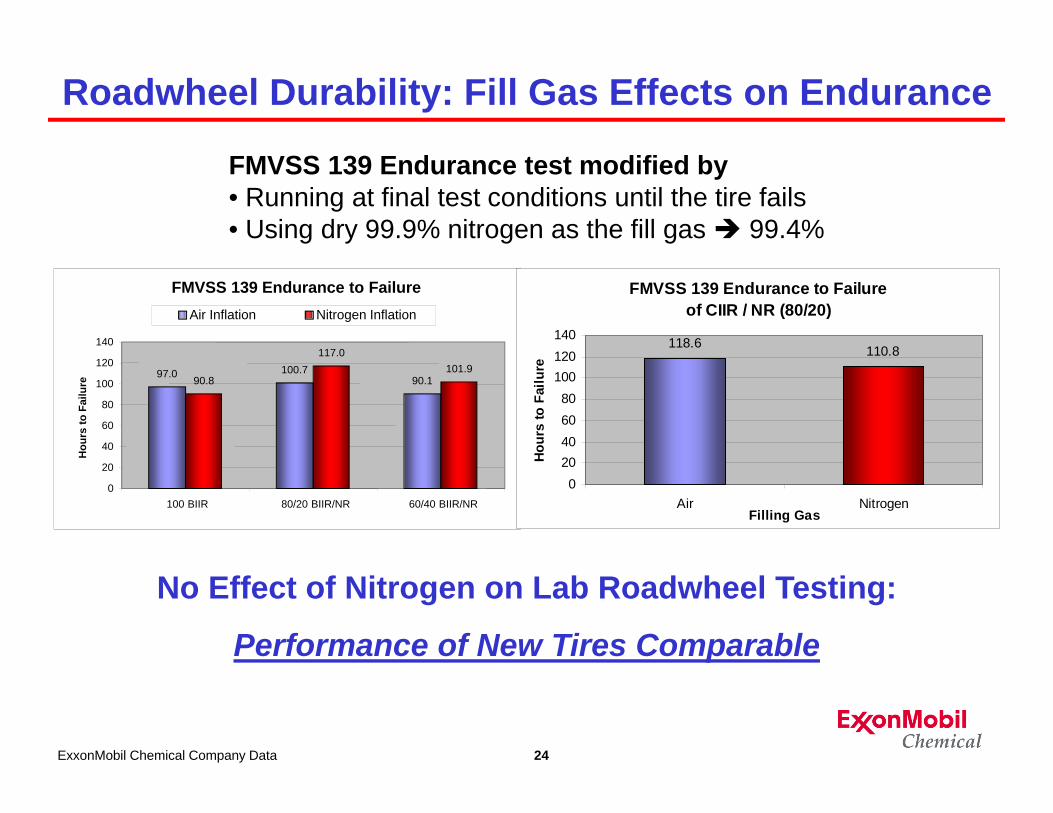
Roadwheel Durability: Fill Gas Effects on Endurance
FMVSS 139 Endurance to Failure
97.0 100.790.190.8
117.0101.9
0
20
40
60
80
100
120
140
100 BIIR 80/20 BIIR/NR 60/40 BIIR/NR
Hou
rs to
Fai
lure
Air Inflation Nitrogen Inflation
FMVSS 139 Endurance to Failureof CIIR / NR (80/20)
118.6 110.8
020406080
100120140
Air NitrogenFilling Gas
Hour
s to
Fai
lure
No Effect of Nitrogen on Lab Roadwheel Testing:
Performance of New Tires Comparable
FMVSS 139 Endurance test modified by • Running at final test conditions until the tire fails• Using dry 99.9% nitrogen as the fill gas 99.4%
ExxonMobil Chemical Company Data

25
Roadwheel Durability: Impact of IPLR on FMVSS 139FMVSS 139 Endurance test modified by following-up with a Stepped-Up Load test until failure
• Temperature: 38oC, Speed: 120 km/h, Pressure: 180 kPa dry air• Load: 4 hr @85% / 6 hr @90% / 24 hr @100% of rating• Stepped-Up Load: increase 10% @ 4-hr intervals until the tire fails
Roadwheel Performance of New Tires Comparable
ExxonMobil Chemical Company Data
FMVSS 139 Endurance, Step-Up Load
46.149.5 48.1
0
10
20
30
40
50
60
1.45 2.00 2.65
Inflation Pressure Loss Rates, %-loss/month
Hou
rs to
Fai
lure

26
Roadwheel Durability: Fill Gas Effects on Endurance
FMVSS 139 Endurance, Stepped-Up-Load
44.0 42.738.6
47.3 44.5 43.6R2 = 0.9422R2 = 0.9272
0
10
20
30
40
50
100/0 80/20 60/40
BIIR / NR
Hou
rs to
Fai
lure
Air Inflated, Oven Aged N2 Inflated, Oven Aged
ExxonMobil Chemical Company Data
Roadwheel Endurance of Aged Tires Improved
using Dry 99.4% Nitrogen Gas Inflation
27
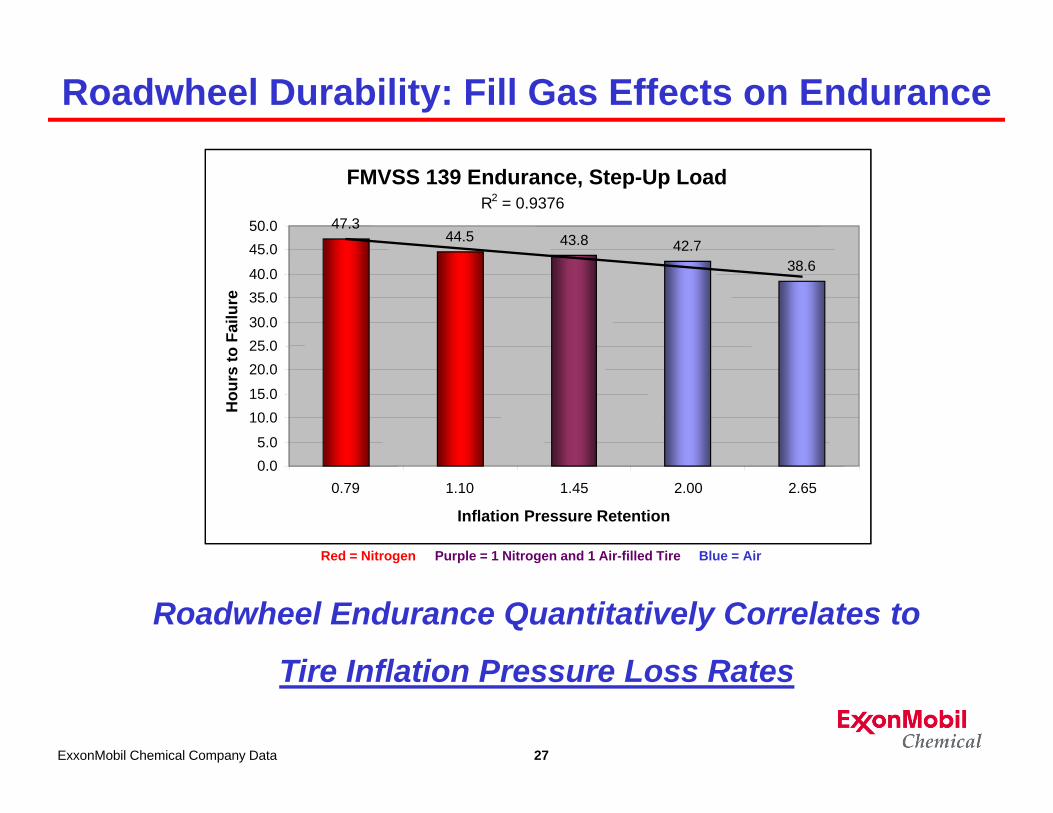
Roadwheel Durability: Fill Gas Effects on Endurance
Roadwheel Endurance Quantitatively Correlates to
Tire Inflation Pressure Loss Rates
FMVSS 139 Endurance, Step-Up Load
47.344.5 43.8 42.7
38.6
R2 = 0.9376
0.05.0
10.015.0
20.025.030.0
35.040.0
45.050.0
0.79 1.10 1.45 2.00 2.65
Inflation Pressure Retention
Hou
rs to
Fai
lure
Red = Nitrogen Purple = 1 Nitrogen and 1 Air-filled Tire Blue = Air
ExxonMobil Chemical Company Data
28
• Constant Pressure
• Oxidation
• Roadwheel Durability
• Rolling Resistance– SAE J1269, SAE 2452
– Temperature
– Coefficient
• Vehicle Fuel Economy
• Summary
Agenda
29
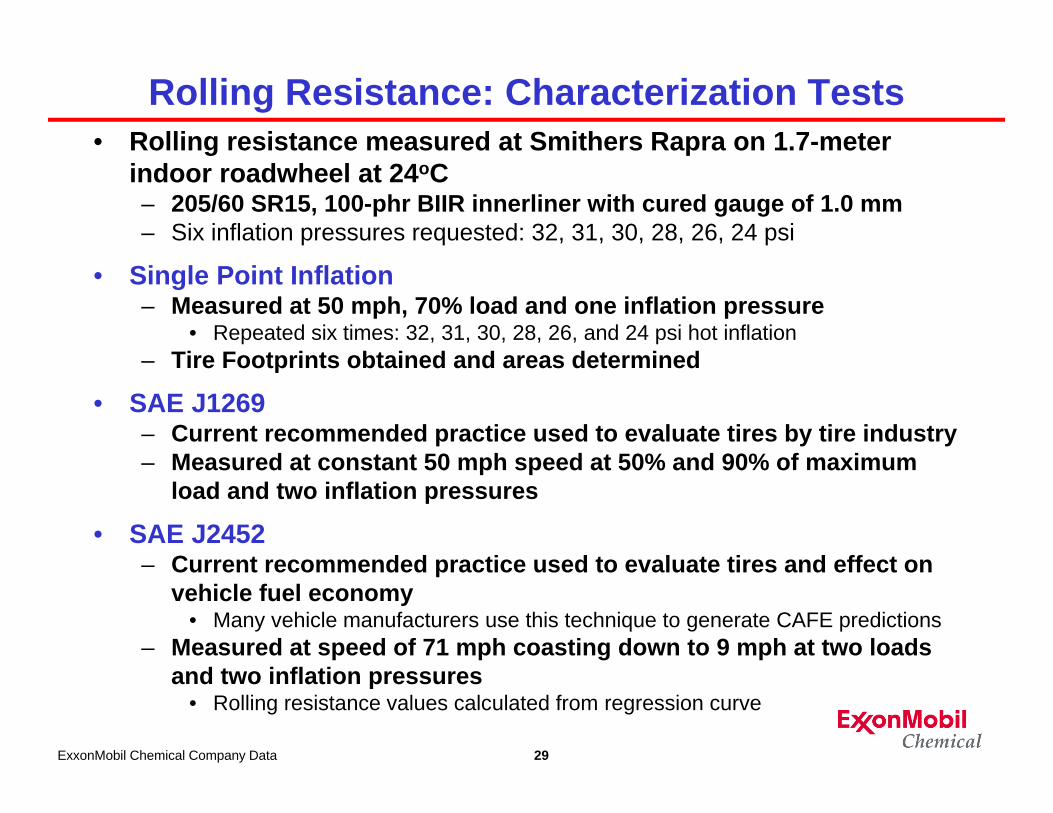
• Rolling resistance measured at Smithers Rapra on 1.7-meter indoor roadwheel at 24oC– 205/60 SR15, 100-phr BIIR innerliner with cured gauge of 1.0 mm– Six inflation pressures requested: 32, 31, 30, 28, 26, 24 psi
• Single Point Inflation– Measured at 50 mph, 70% load and one inflation pressure
• Repeated six times: 32, 31, 30, 28, 26, and 24 psi hot inflation – Tire Footprints obtained and areas determined
• SAE J1269 – Current recommended practice used to evaluate tires by tire industry– Measured at constant 50 mph speed at 50% and 90% of maximum
load and two inflation pressures
• SAE J2452– Current recommended practice used to evaluate tires and effect on
vehicle fuel economy• Many vehicle manufacturers use this technique to generate CAFE predictions
– Measured at speed of 71 mph coasting down to 9 mph at two loads and two inflation pressures
• Rolling resistance values calculated from regression curve
Rolling Resistance: Characterization Tests
ExxonMobil Chemical Company Data
30
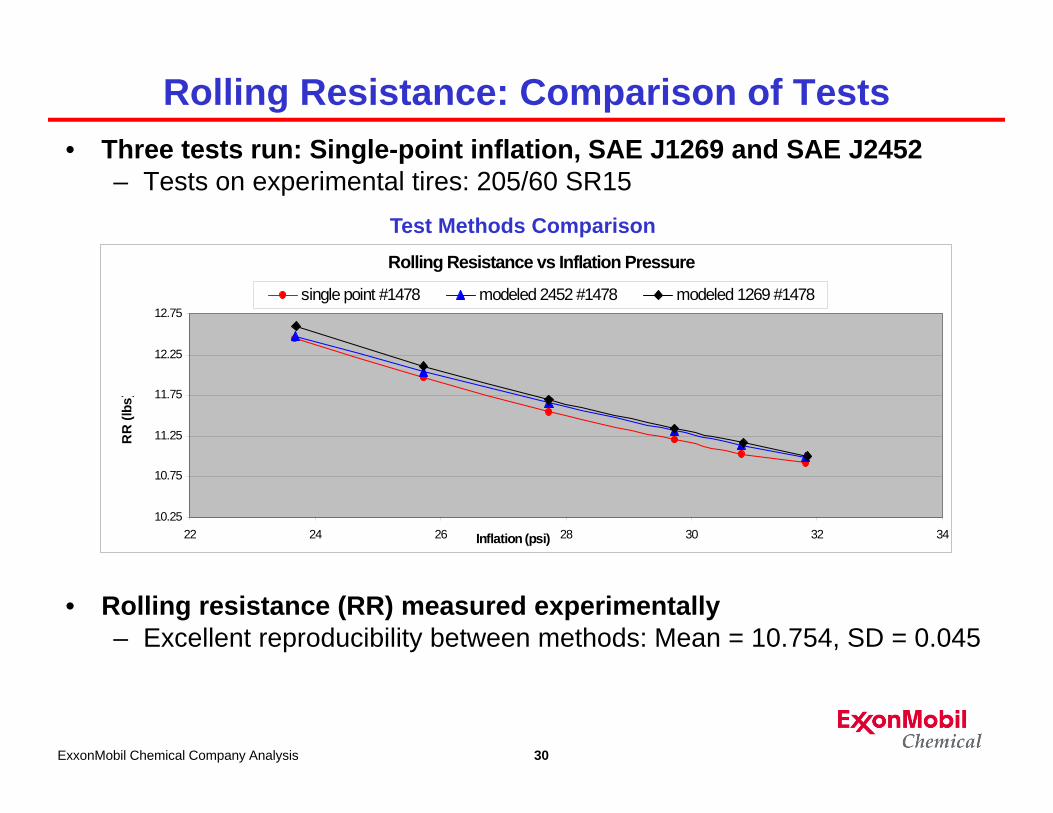
• Three tests run: Single-point inflation, SAE J1269 and SAE J2452– Tests on experimental tires: 205/60 SR15
• Rolling resistance (RR) measured experimentally– Excellent reproducibility between methods: Mean = 10.754, SD = 0.045
Rolling Resistance: Comparison of Tests
ExxonMobil Chemical Company Analysis
Rolling Resistance vs Inflation Pressure
10.25
10.75
11.25
11.75
12.25
12.75
22 24 26 28 30 32 34Inflation (psi)
RR
(lbs
)
single point #1478 modeled 2452 #1478 modeled 1269 #1478
Test Methods Comparison
31
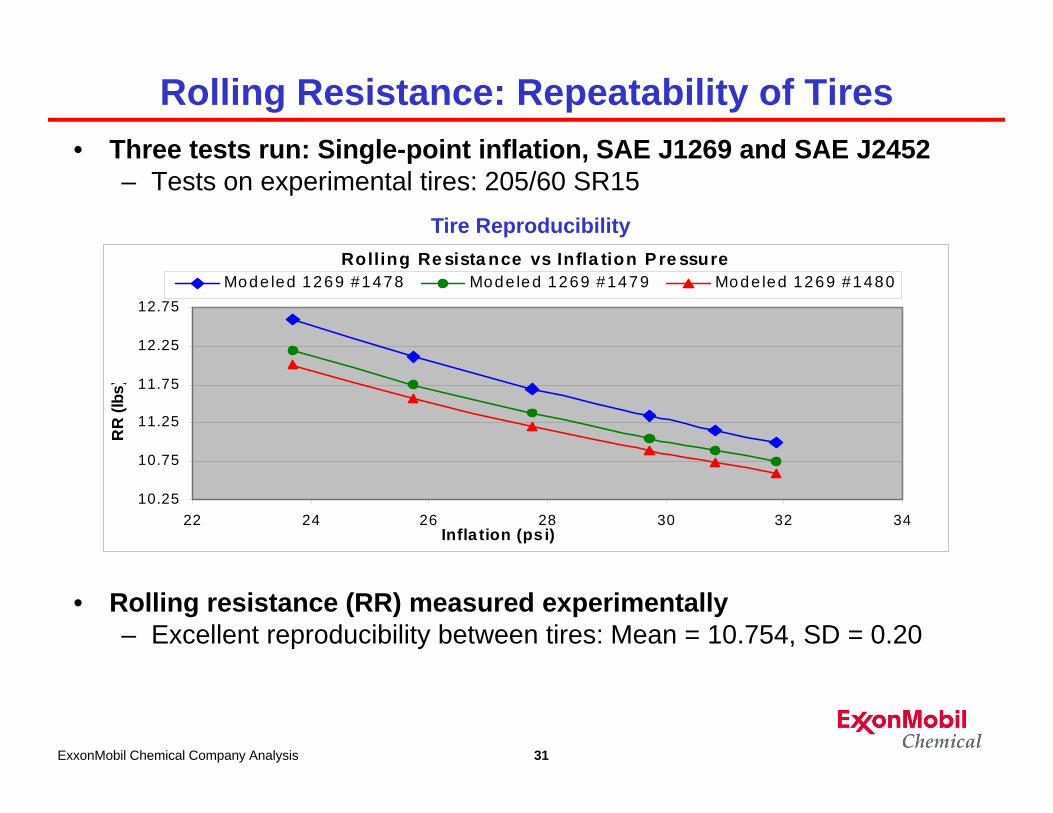
• Three tests run: Single-point inflation, SAE J1269 and SAE J2452– Tests on experimental tires: 205/60 SR15
• Rolling resistance (RR) measured experimentally– Excellent reproducibility between tires: Mean = 10.754, SD = 0.20
Rolling Resistance: Repeatability of Tires
ExxonMobil Chemical Company Analysis
Rolling Re sista nce vs Infla tion P re ssure
10.25
10.75
11.25
11.75
12.25
12.75
22 24 26 28 30 32 34Infla tion (ps i)
RR
(lbs
)
Mode led 1269 #1478 Mode led 1269 #1479 Mode led 1269 #1480
Tire Reproducibility
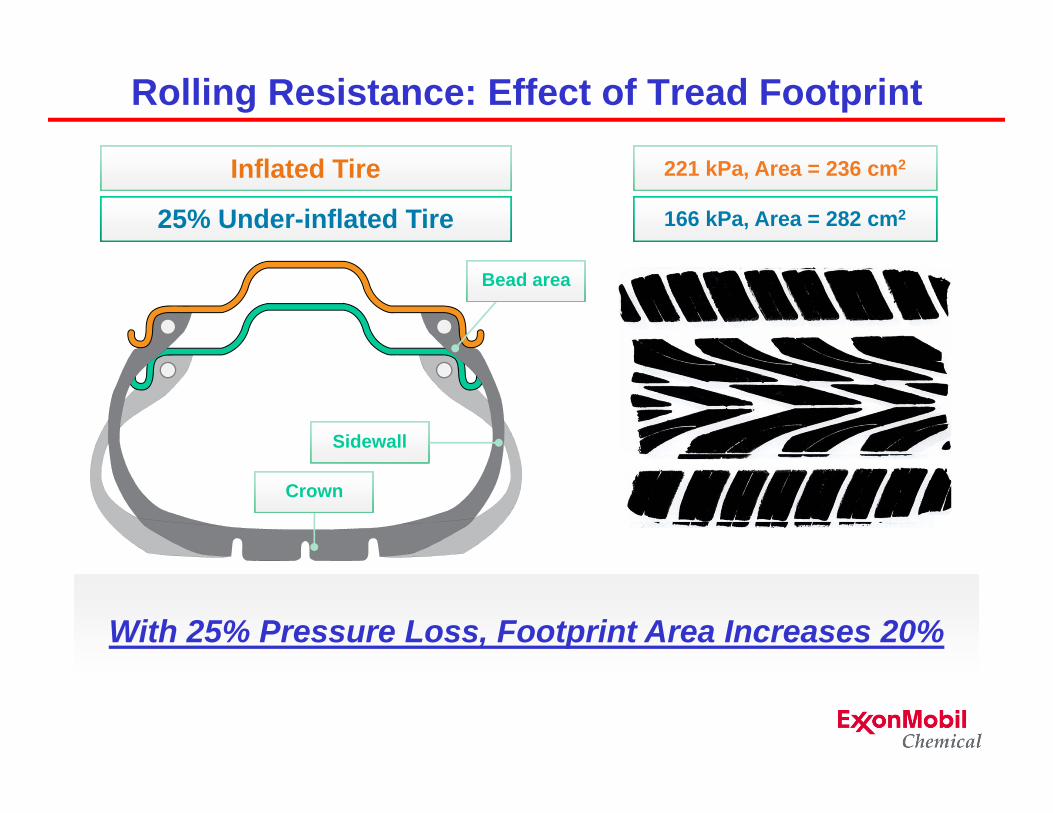
With 25% Pressure Loss, Footprint Area Increases 20%
Bead area
Sidewall
Crown
Inflated Tire
25% Under-inflated Tire
221 kPa, Area = 236 cm2
166 kPa, Area = 282 cm2
Rolling Resistance: Effect of Tread Footprint
33
Rolling Resistance: Fill Gas Effects on Temperature
ExxonMobil Chemical Company Analysis
Cavity Gas Temperature
R2 = 0.9708
3536373839404142
165 172 179 186 193 200 207 214 221 228 234 241 248 255 260
Inflation Pressure, kPa
Deg
rees
C
Air Linear (Air)
Cavity Air Temperature Dependent Upon Inflation Pressure
34
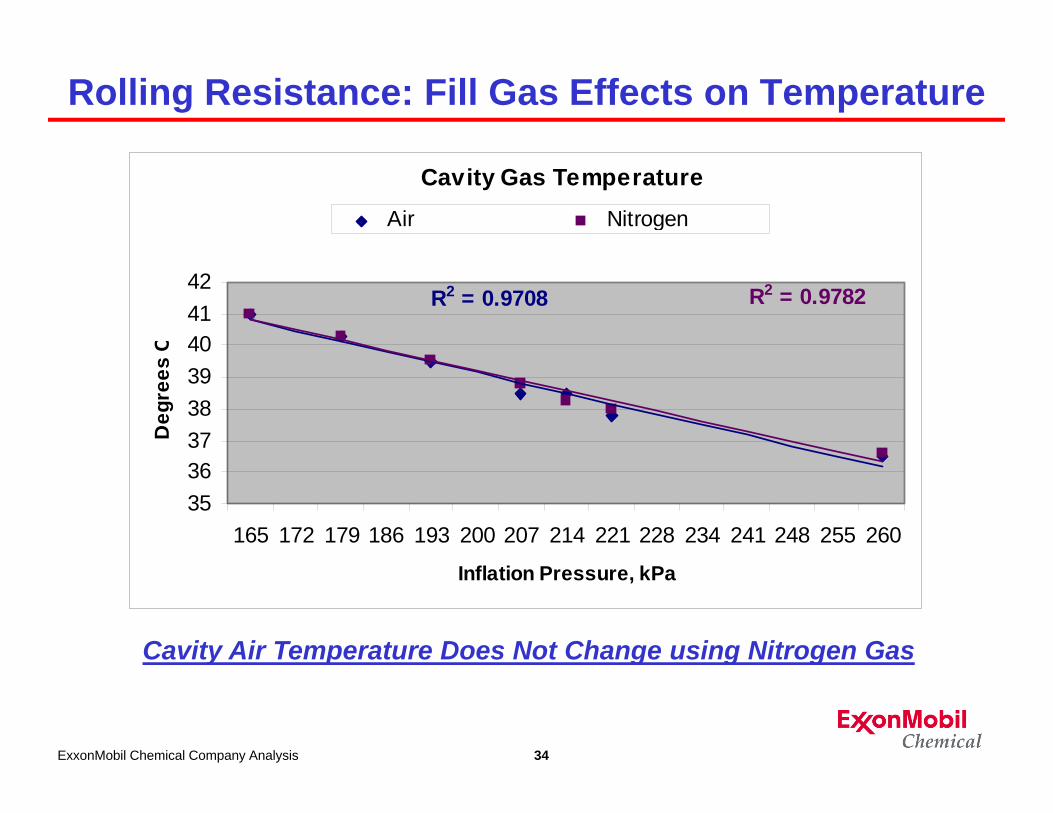
Rolling Resistance: Fill Gas Effects on Temperature
Cavity Air Temperature Does Not Change using Nitrogen Gas
ExxonMobil Chemical Company Analysis
Cavity Gas Temperature
R2 = 0.9708 R2 = 0.9782
3536373839404142
165 172 179 186 193 200 207 214 221 228 234 241 248 255 260
Inflation Pressure, kPa
Deg
rees
C
Air Nitrogen
35
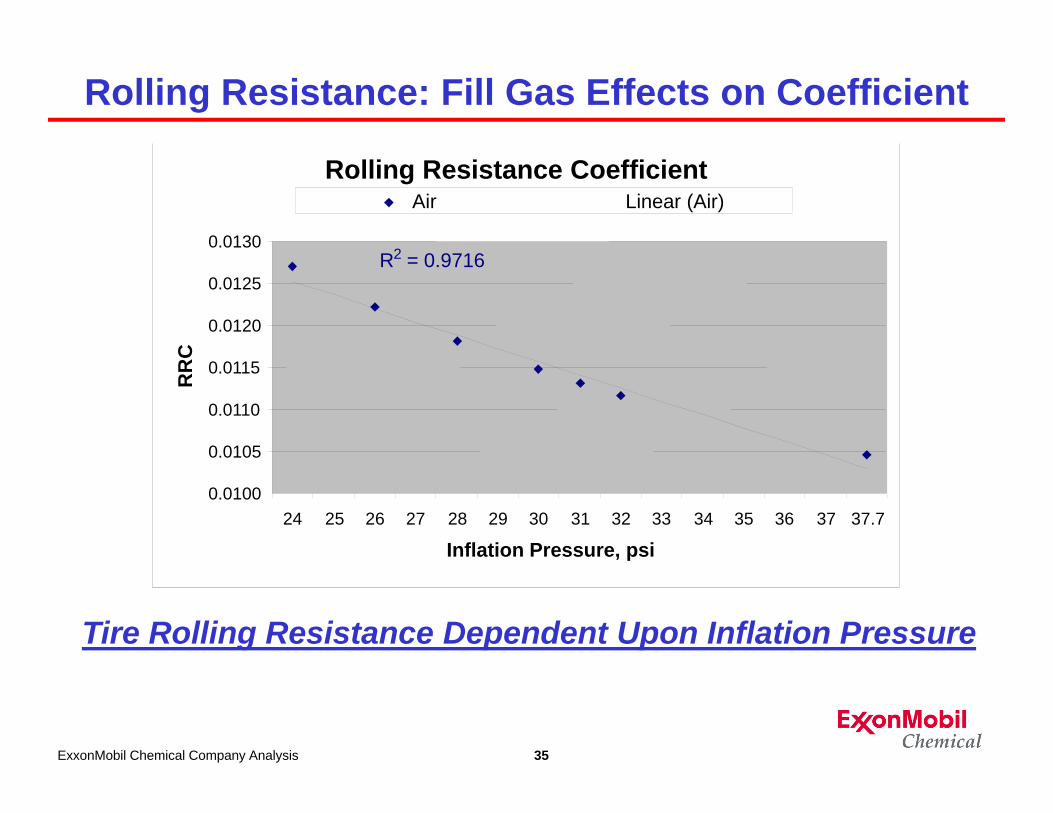
Rolling Resistance: Fill Gas Effects on Coefficient
Tire Rolling Resistance Dependent Upon Inflation Pressure
ExxonMobil Chemical Company Analysis
Rolling Resistance Coefficient
R2 = 0.9716
0.0100
0.0105
0.0110
0.0115
0.0120
0.0125
0.0130
24 25 26 27 28 29 30 31 32 33 34 35 36 37 37.7
Inflation Pressure, psi
RR
CAir Linear (Air)

36
Rolling Resistance: Fill Gas Effects on Coefficient
Tire Rolling Resistance Does Not Change Using Nitrogen
ExxonMobil Chemical Company Analysis
Rolling Resistance Coefficient
R2 = 0.9716 R2 = 0.9737
0.0100
0.0105
0.0110
0.0115
0.0120
0.0125
0.0130
24 25 26 27 28 29 30 31 32 33 34 35 36 37 37.7
Inflation Pressure, psi
RR
CAir Nitrogen
37
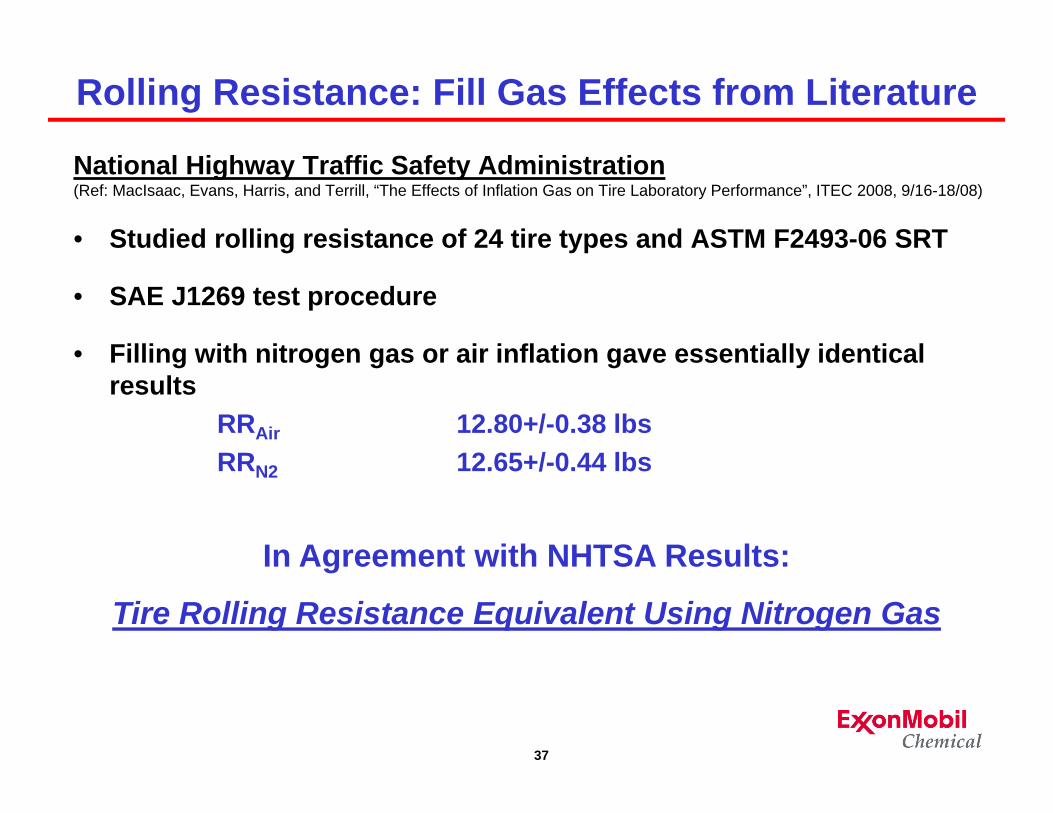
Rolling Resistance: Fill Gas Effects from Literature
In Agreement with NHTSA Results:
Tire Rolling Resistance Equivalent Using Nitrogen Gas
National Highway Traffic Safety Administration(Ref: MacIsaac, Evans, Harris, and Terrill, “The Effects of Inflation Gas on Tire Laboratory Performance”, ITEC 2008, 9/16-18/08)
• Studied rolling resistance of 24 tire types and ASTM F2493-06 SRT
• SAE J1269 test procedure
• Filling with nitrogen gas or air inflation gave essentially identical results
RRAir 12.80+/-0.38 lbs RRN2 12.65+/-0.44 lbs

38
• Constant Pressure
• Oxidation
• Roadwheel Durability
• Rolling Resistance
• Vehicle Fuel Economy• Summary
Agenda
39
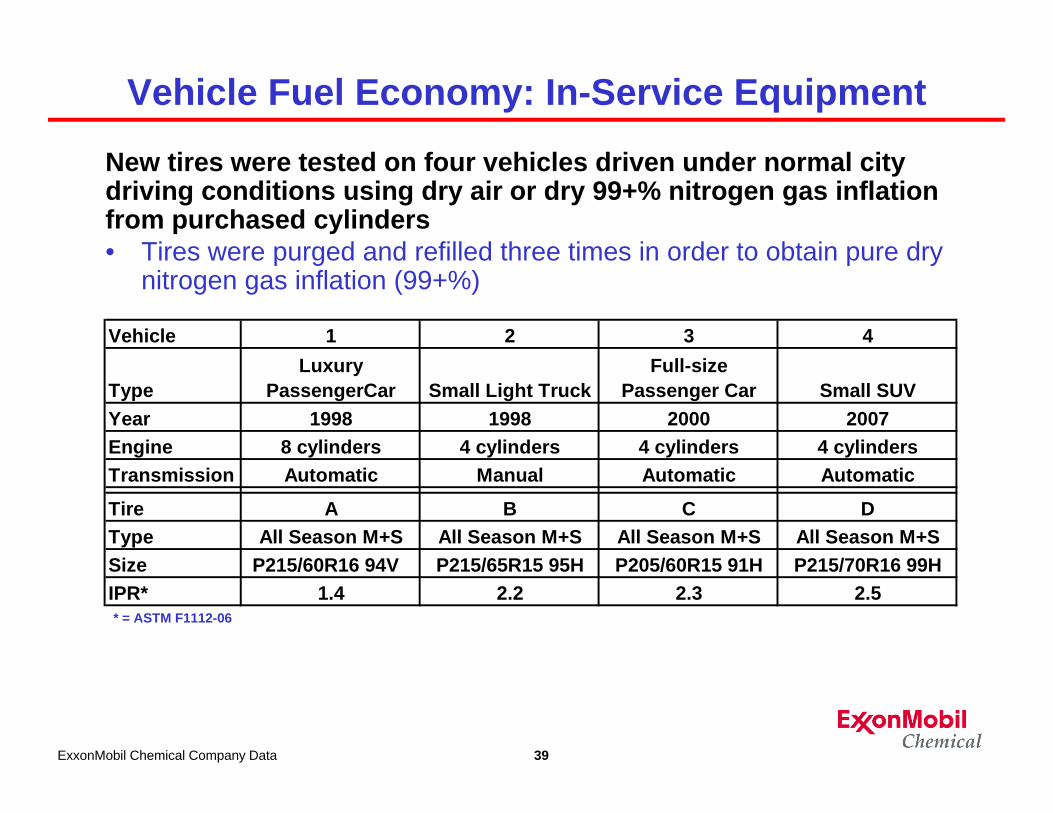
Vehicle Fuel Economy: In-Service Equipment
New tires were tested on four vehicles driven under normal city driving conditions using dry air or dry 99+% nitrogen gas inflation from purchased cylinders• Tires were purged and refilled three times in order to obtain pure dry
nitrogen gas inflation (99+%)
ExxonMobil Chemical Company Data
Vehicle 1 2 3 4
TypeLuxury
PassengerCar Small Light TruckFull-size
Passenger Car Small SUVYear 1998 1998 2000 2007Engine 8 cylinders 4 cylinders 4 cylinders 4 cylindersTransmission Automatic Manual Automatic Automatic
Tire A B C DType All Season M+S All Season M+S All Season M+S All Season M+SSize P215/60R16 94V P215/65R15 95H P205/60R15 91H P215/70R16 99HIPR* 1.4 2.2 2.3 2.5* = ASTM F1112-06
40
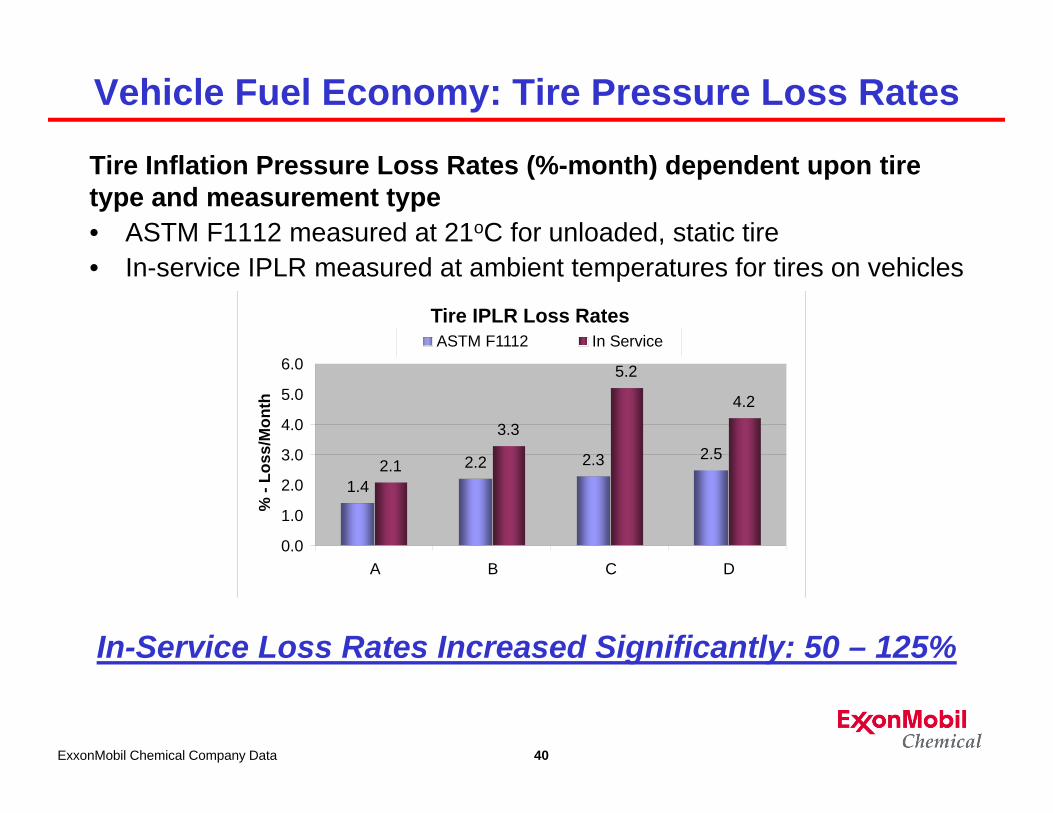
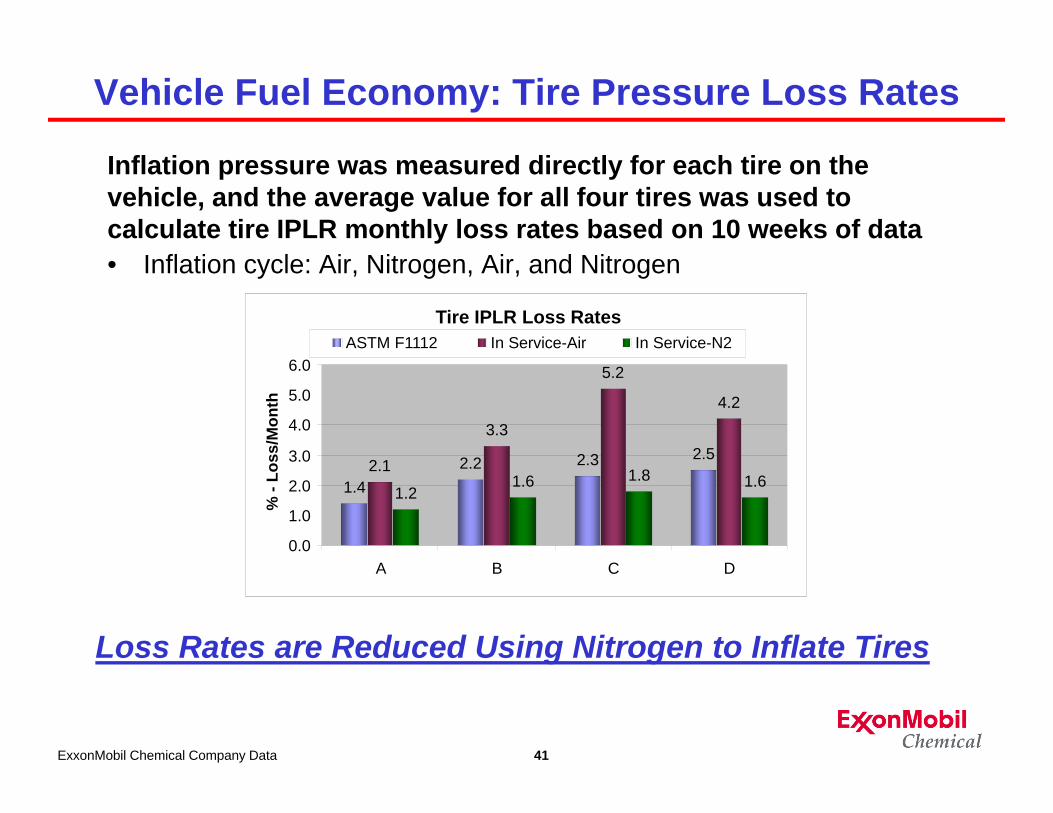
Vehicle Fuel Economy: Tire Pressure Loss Rates
Tire Inflation Pressure Loss Rates (%-month) dependent upon tire type and measurement type• ASTM F1112 measured at 21oC for unloaded, static tire• In-service IPLR measured at ambient temperatures for tires on vehicles
In-Service Loss Rates Increased Significantly: 50 – 125%
ExxonMobil Chemical Company Data
Tire IPLR Loss Rates
1.42.2 2.3 2.5
2.1
3.3
5.2
4.2
0.0
1.0
2.0
3.0
4.0
5.0
6.0
A B C D
% -
Loss
/Mon
th
ASTM F1112 In Service
41
Vehicle Fuel Economy: Tire Pressure Loss Rates
Inflation pressure was measured directly for each tire on the vehicle, and the average value for all four tires was used to calculate tire IPLR monthly loss rates based on 10 weeks of data• Inflation cycle: Air, Nitrogen, Air, and Nitrogen
Loss Rates are Reduced Using Nitrogen to Inflate Tires
ExxonMobil Chemical Company Data
Tire IPLR Loss Rates
1.42.2 2.3 2.5
2.1
3.3
5.2
4.2
1.21.6 1.8 1.6
0.0
1.0
2.0
3.0
4.0
5.0
6.0
A B C D
% -
Loss
/Mon
th
ASTM F1112 In Service-Air In Service-N2

42
Vehicle Fuel Economy: In-Service Miles Driven
Vehicle miles driven under normal city/highway conditions• Gallons of gas consumed recorded for each fill-up during the four
10-week time periods: 45,961 total miles driven
ExxonMobil Chemical Company Data
VehicleAir N2 Air-2 N2-2 Total
1 4030 4115 2720 3677 145432 2726 2537 3388 3381 120323 2328 2317 1984 2371 90004 3449 2860 4078 10387
Miles Driven
Vehicle Miles Driven
0
1000
2000
3000
4000
5000
Air N2 Air-2 N2-2
Mile
s
Vehicle 1 Vehicle 2 Vehicle 3 Vehicle 4
43
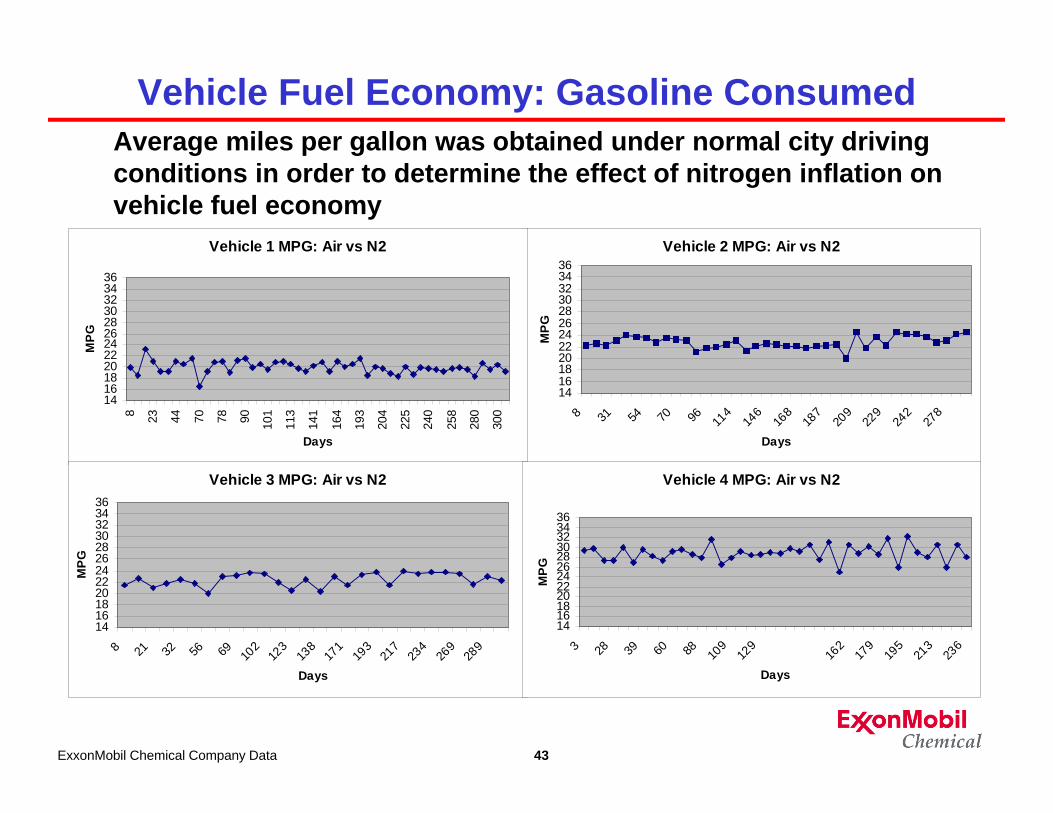
Vehicle Fuel Economy: Gasoline ConsumedAverage miles per gallon was obtained under normal city driving conditions in order to determine the effect of nitrogen inflation on vehicle fuel economy
ExxonMobil Chemical Company Data
Vehicle 2 MPG: Air vs N2
141618202224262830323436
8 31 54 70 96 114
146
168
187
209
229
242
278
Days
MPG
Vehicle 1 MPG: Air vs N2
141618202224262830323436
8 23 44 70 78 90 101
113
141
164
193
204
225
240
258
280
300
Days
MPG
Vehicle 3 MPG: Air vs N2
141618202224262830323436
8 21 32 56 69 102
123
138
171
193
217
234
269
289
Days
MPG
Vehicle 4 MPG: Air vs N2
141618202224262830323436
3 28 39 60 88 109
129
162
179
195
213
236
Days
MPG
44
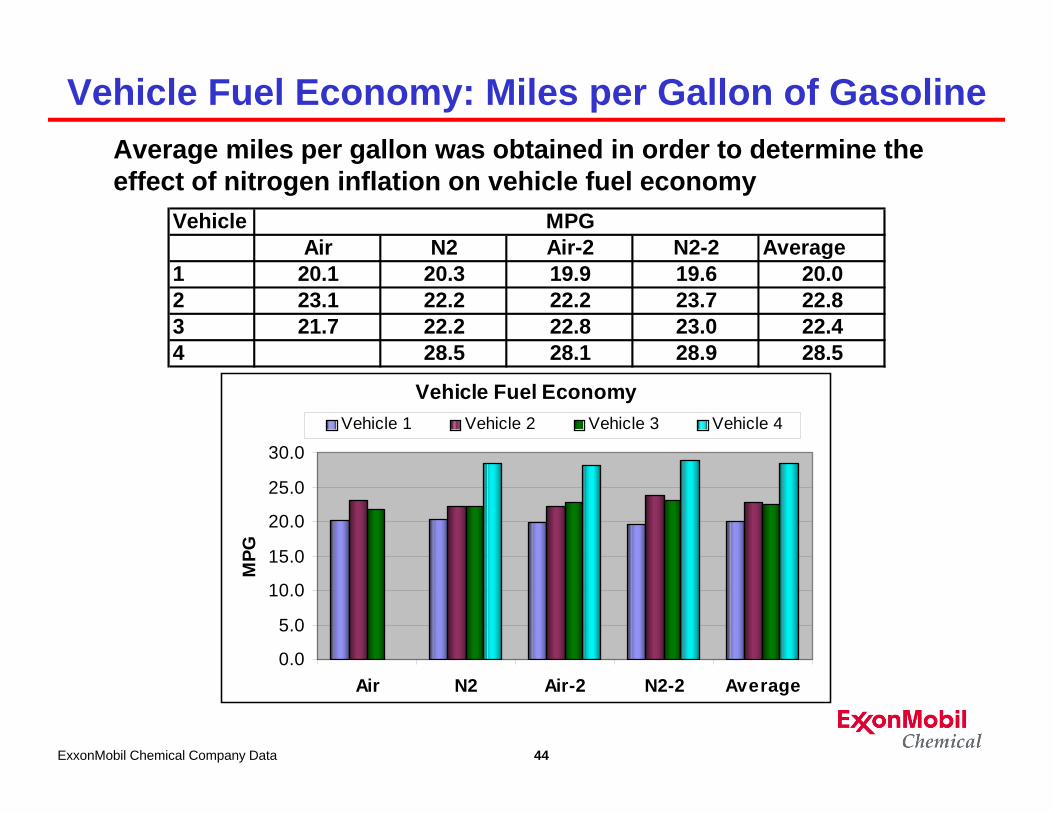
Vehicle Fuel Economy: Miles per Gallon of GasolineAverage miles per gallon was obtained in order to determine the effect of nitrogen inflation on vehicle fuel economy
ExxonMobil Chemical Company Data
VehicleAir N2 Air-2 N2-2 Average
1 20.1 20.3 19.9 19.6 20.02 23.1 22.2 22.2 23.7 22.83 21.7 22.2 22.8 23.0 22.44 28.5 28.1 28.9 28.5
MPG
Vehicle Fuel Economy
0.0
5.0
10.0
15.0
20.0
25.0
30.0
Air N2 Air-2 N2-2 Average
MPG
Vehicle 1 Vehicle 2 Vehicle 3 Vehicle 4
45
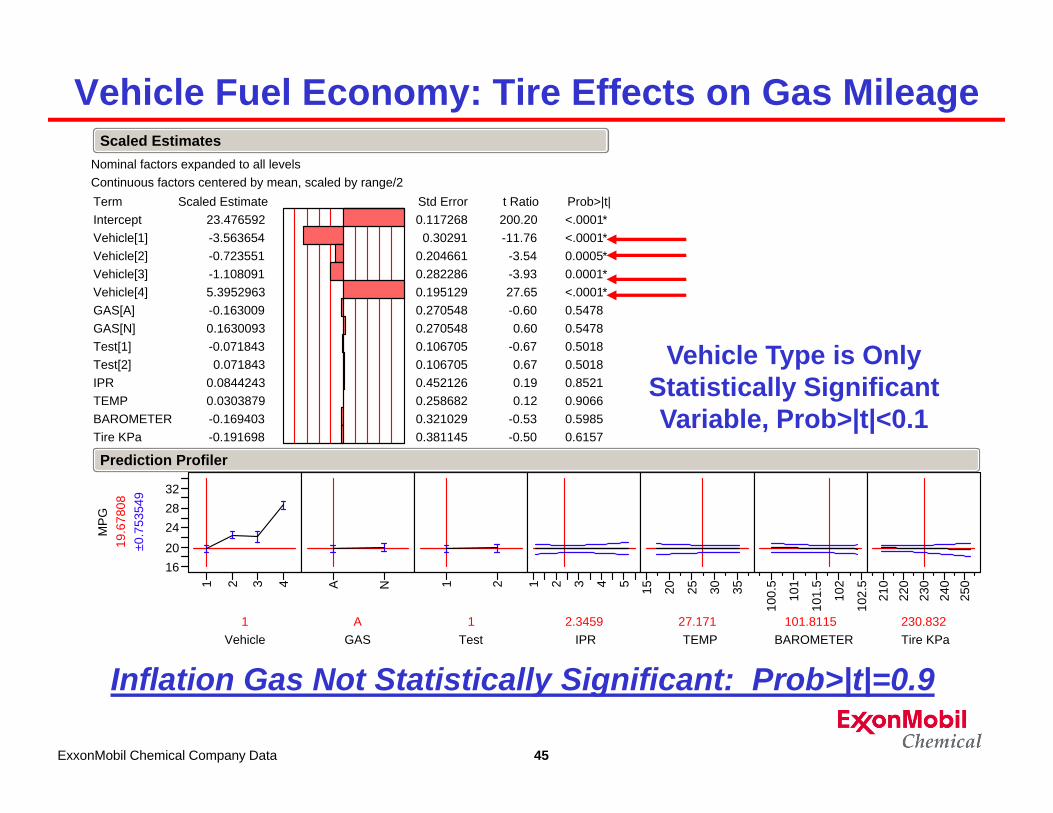
Vehicle Fuel Economy: Tire Effects on Gas Mileage
ExxonMobil Chemical Company Data
Inflation Gas Not Statistically Significant: Prob>|t|=0.9
Nominal factors expanded to all levelsContinuous factors centered by mean, scaled by range/2
InterceptVehicle[1]Vehicle[2]Vehicle[3]Vehicle[4]GAS[A]GAS[N]Test[1]Test[2]IPRTEMPBAROMETERTire KPa
Term23.476592-3.563654-0.723551-1.1080915.3952963-0.1630090.1630093-0.0718430.071843
0.08442430.0303879-0.169403-0.191698
Scaled Estimate0.1172680.30291
0.2046610.2822860.1951290.2705480.2705480.1067050.1067050.4521260.2586820.3210290.381145
Std Error200.20-11.76-3.54-3.9327.65-0.600.60
-0.670.670.190.12
-0.53-0.50
t Ratio<.0001*<.0001*0.0005*0.0001*<.0001*0.54780.54780.50180.50180.85210.90660.59850.6157
Prob>|t|
Scaled Estimates
1620242832
MP
G19
.678
08±0
.753
549
1 2 3 4
1Vehicle
A N
AGAS
1 2
1Test
1 2 3 4 52.3459
IPR15 20 25 30 35
27.171TEMP
100.
5
101
101.
5
102
102.
5
101.8115BAROMETER
210
220
230
240
250
230.832Tire KPa
Prediction Profiler
Vehicle Type is Only Statistically Significant Variable, Prob>|t|<0.1
46
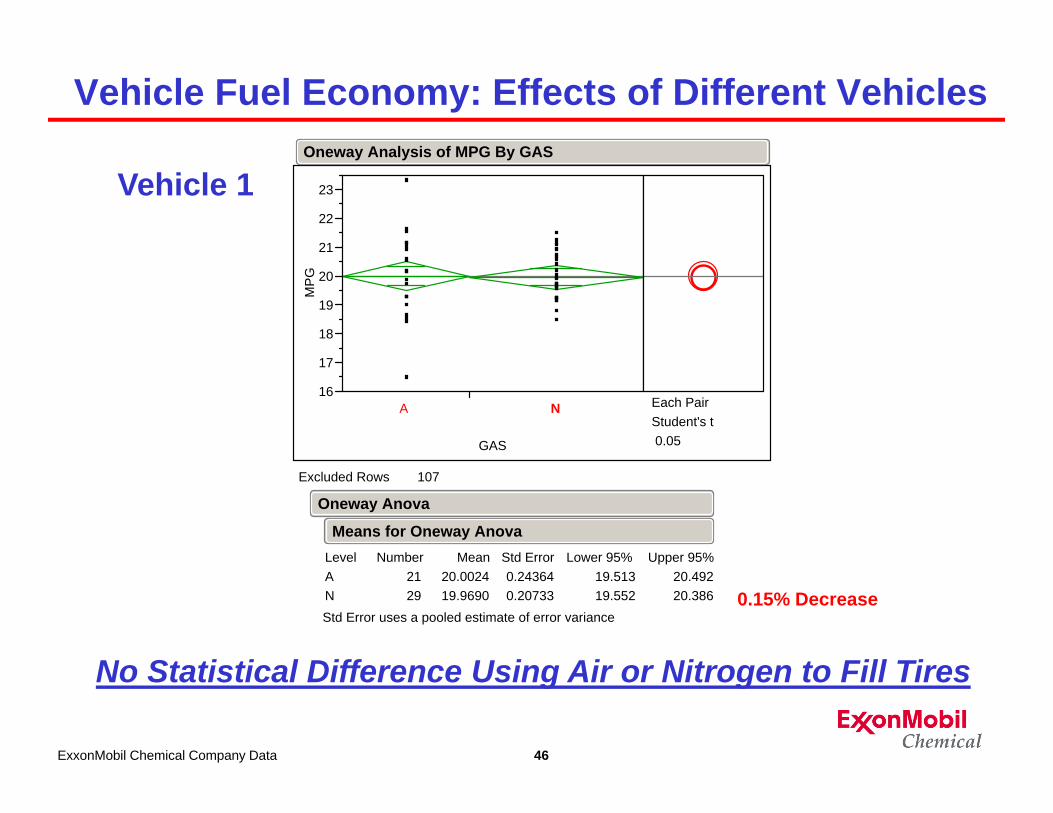
Vehicle Fuel Economy: Effects of Different Vehicles
ExxonMobil Chemical Company Data
No Statistical Difference Using Air or Nitrogen to Fill Tires
Vehicle 1
16
17
18
19
20
21
22
23
MP
G
A N
GAS
Each PairStudent's t0.05
Excluded Rows 107
AN
Level2129
Number20.002419.9690
Mean0.243640.20733
Std Error19.51319.552
Lower 95%20.49220.386
Upper 95%
Std Error uses a pooled estimate of error variance
Means for Oneway Anova
Oneway Anova
Oneway Analysis of MPG By GAS
0.15% Decrease
47ExxonMobil Chemical Company Data
No Statistical Difference Using Air or Nitrogen to Fill Tires
20
21
22
23
24
25
MP
G
A N
GAS
Each PairStudent's t0.05
Excluded Rows 118
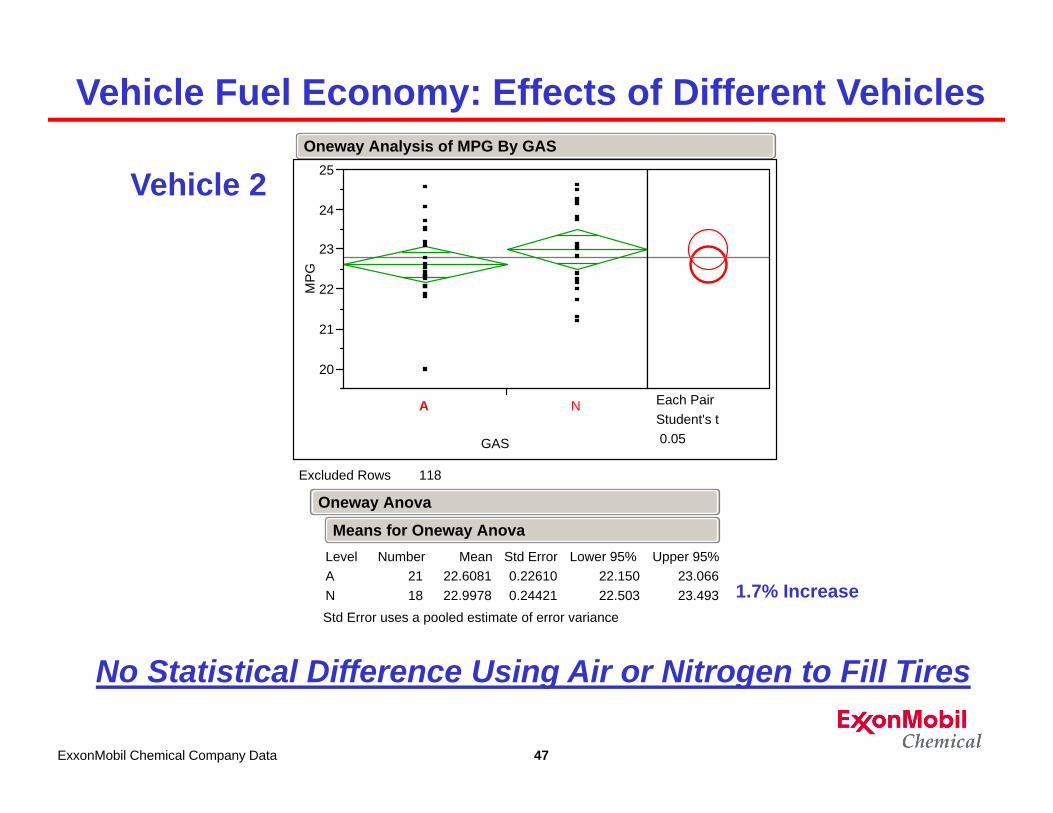
AN
Level2118
Number22.608122.9978
Mean0.226100.24421
Std Error22.15022.503
Lower 95%23.06623.493
Upper 95%
Std Error uses a pooled estimate of error variance
Means for Oneway Anova
Oneway Anova
Oneway Analysis of MPG By GAS
Vehicle 2
1.7% Increase
Vehicle Fuel Economy: Effects of Different Vehicles
48ExxonMobil Chemical Company Data
No Statistical Difference Using Air or Nitrogen to Fill Tires
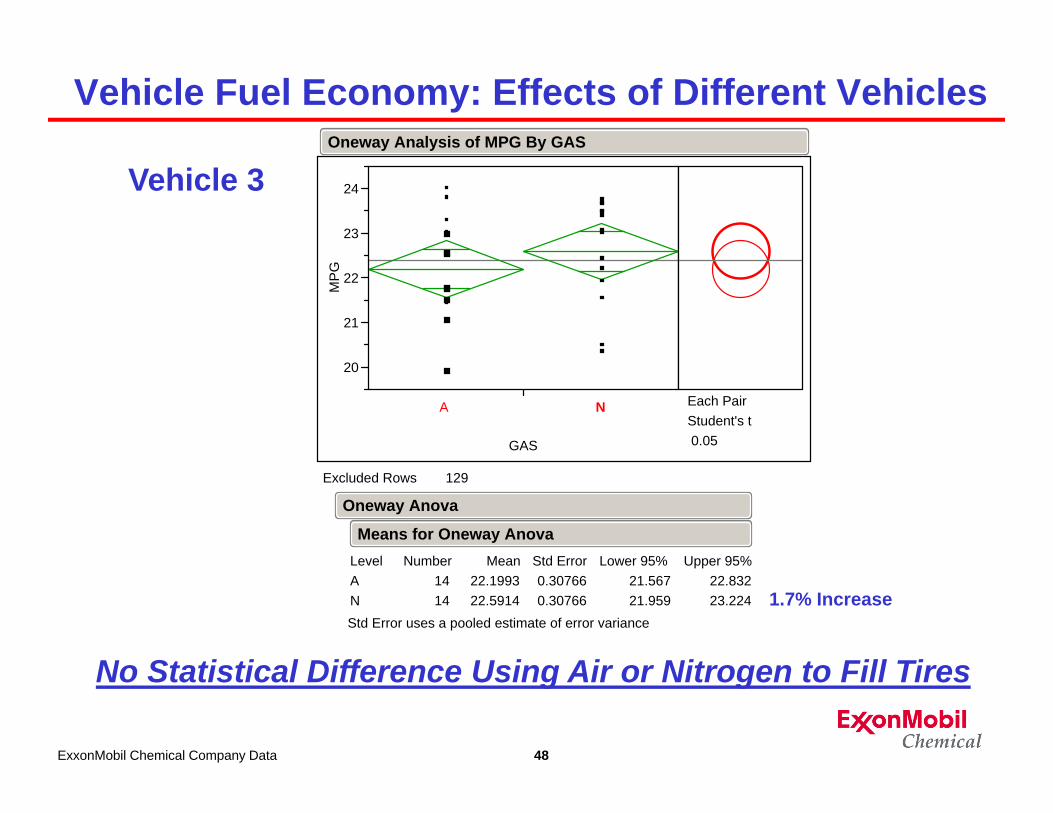
Vehicle 3
20
21
22
23
24
MPG
A N
GAS
Each PairStudent's t0.05
Excluded Rows 129
AN
Level1414
Number22.199322.5914
Mean0.307660.30766
Std Error21.56721.959
Lower 95%22.83223.224
Upper 95%
Std Error uses a pooled estimate of error variance
Means for Oneway Anova
Oneway Anova
Oneway Analysis of MPG By GAS
1.7% Increase
Vehicle Fuel Economy: Effects of Different Vehicles

49ExxonMobil Chemical Company Data
No Statistical Difference Using Air or Nitrogen to Fill Tires
24
25
26
27
28
29
30
31
32
33
MP
G
A N
GAS
Each PairStudent's t0.05
Excluded Rows 117
AN
Level1426
Number29.007128.7685
Mean0.442740.32489
Std Error28.11128.111
Lower 95%29.90329.426
Upper 95%
Std Error uses a pooled estimate of error variance
Means for Oneway Anova
Oneway Anova
Oneway Analysis of MPG By GAS
Vehicle 4
0.8% Decrease
Vehicle Fuel Economy: Effects of Different Vehicles

50
Vehicle Fuel Economy: Pressure Effects on Gas Mileage
ExxonMobil Chemical Company Data
Tire Inflation Pressure and Tire IPLR are Statistically Next Most Important Variables
( g )
Nominal factors expanded to all levelsContinuous factors centered by mean, scaled by range/2
InterceptGAS[A]GAS[N]Test[1]Test[2]IPRTEMPBAROMETERTire KPa
Term23.272876-0.7196820.71968210.2685351-0.2685352.3090921-0.7127660.90409062.8965046
Scaled Estimate0.2640820.5598370.5598370.2614990.2614990.7604930.5828970.7841050.733452
Std Error 88.13 -1.29 1.29 1.03 -1.03 3.04 -1.22 1.15 3.95
t Ratio <.0001 0.2006 0.2006 0.3061 0.3061 0.0028 0.2233 0.2507 0.0001
Prob>|t|
Scaled Estimates
MPG
32.29
16.47
22.82173
GAS
A N
Test
1 2
IPR
1.1
5.2
2.34586
TEMP17
.2
35.627.1707
BAROMETER
100.
5
102.
4
101.811
Tire KPa
209.
5
252.
75230.832
Prediction Profiler
51
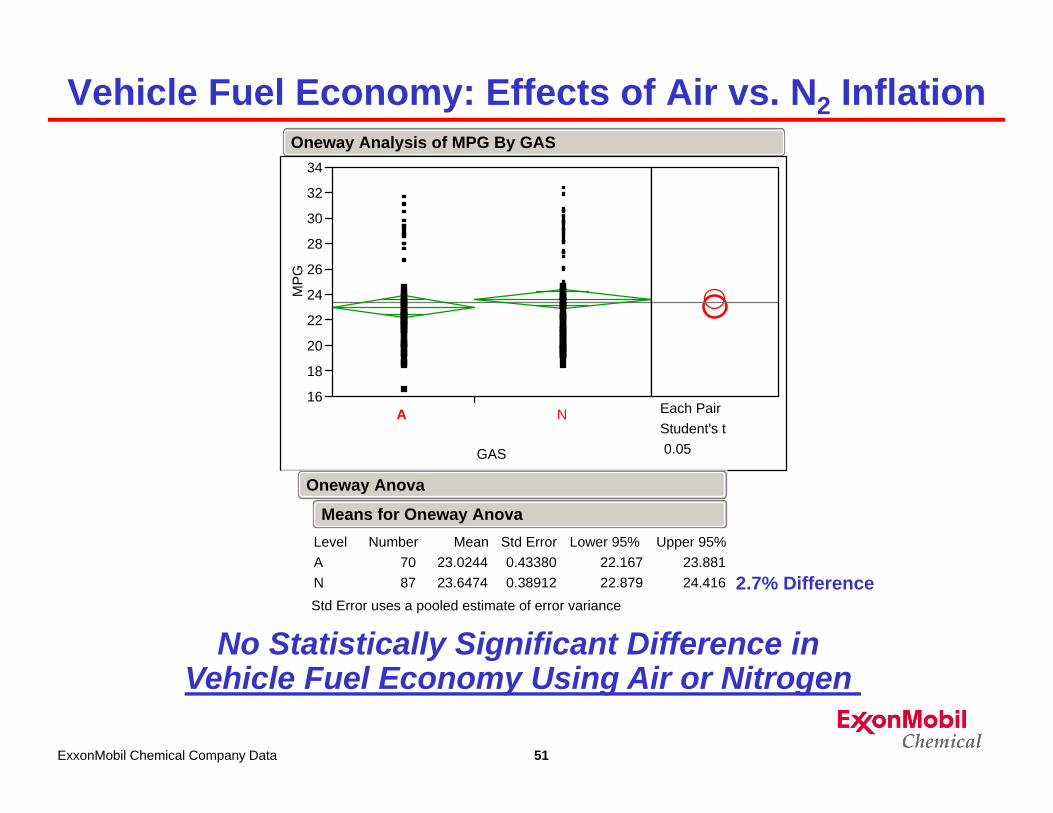
Vehicle Fuel Economy: Effects of Air vs. N2 Inflation
ExxonMobil Chemical Company Data
No Statistically Significant Difference in Vehicle Fuel Economy Using Air or Nitrogen
16
18
20
22
24
26
28
30
32
34
MP
G
A N
GAS
Each PairStudent's t0.05
AN
Level7087
Number23.024423.6474
Mean0.433800.38912
Std Error22.16722.879
Lower 95%23.88124.416
Upper 95%
Std Error uses a pooled estimate of error variance
Means for Oneway Anova
Oneway Anova
Oneway Analysis of MPG By GAS
2.7% Difference

52
Vehicle Fuel Economy: Effects of Air vs. N2 Inflation
ExxonMobil Chemical Company Data
No Statistically Significant Difference:Using Means gives +2.7%, Using Averages gives -2.3%
16
18
20
22
24
26
28
30
32
34
MP
G
A N
GAS
Each PairStudent's t0.05
AN
Level7087
Number23.024423.6474
Mean0.433800.38912
Std Error22.16722.879
Lower 95%23.88124.416
Upper 95%
Std Error uses a pooled estimate of error variance
Means for Oneway Anova
Oneway Anova
Oneway Analysis of MPG By GAS
Avg Air = 23.66Avg N2 = 23.13
- 2.3%
53
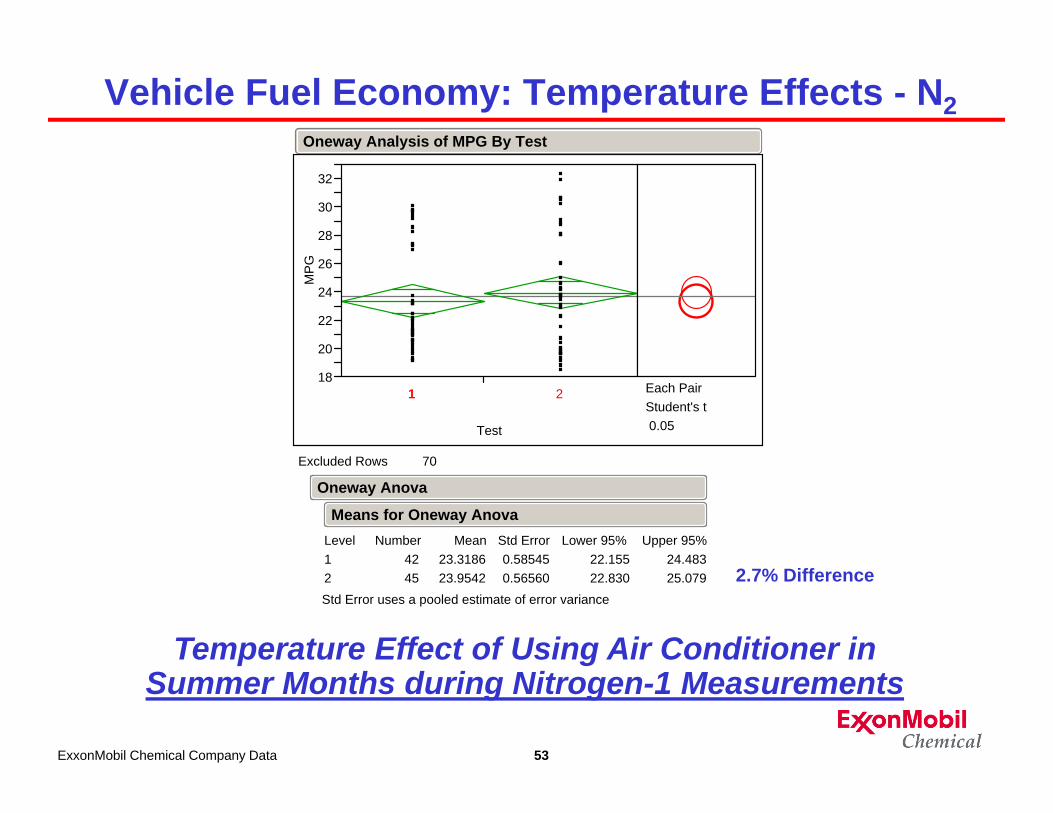
Vehicle Fuel Economy: Temperature Effects - N2
ExxonMobil Chemical Company Data
Temperature Effect of Using Air Conditioner inSummer Months during Nitrogen-1 Measurements
18
20
22
24
26
28
30
32
MP
G
1 2
Test
Each PairStudent's t0.05
Excluded Rows 70
12
Level4245
Number23.318623.9542
Mean0.585450.56560
Std Error22.15522.830
Lower 95%24.48325.079
Upper 95%
Std Error uses a pooled estimate of error variance
Means for Oneway Anova
Oneway Anova
Oneway Analysis of MPG By Test
2.7% Difference
54
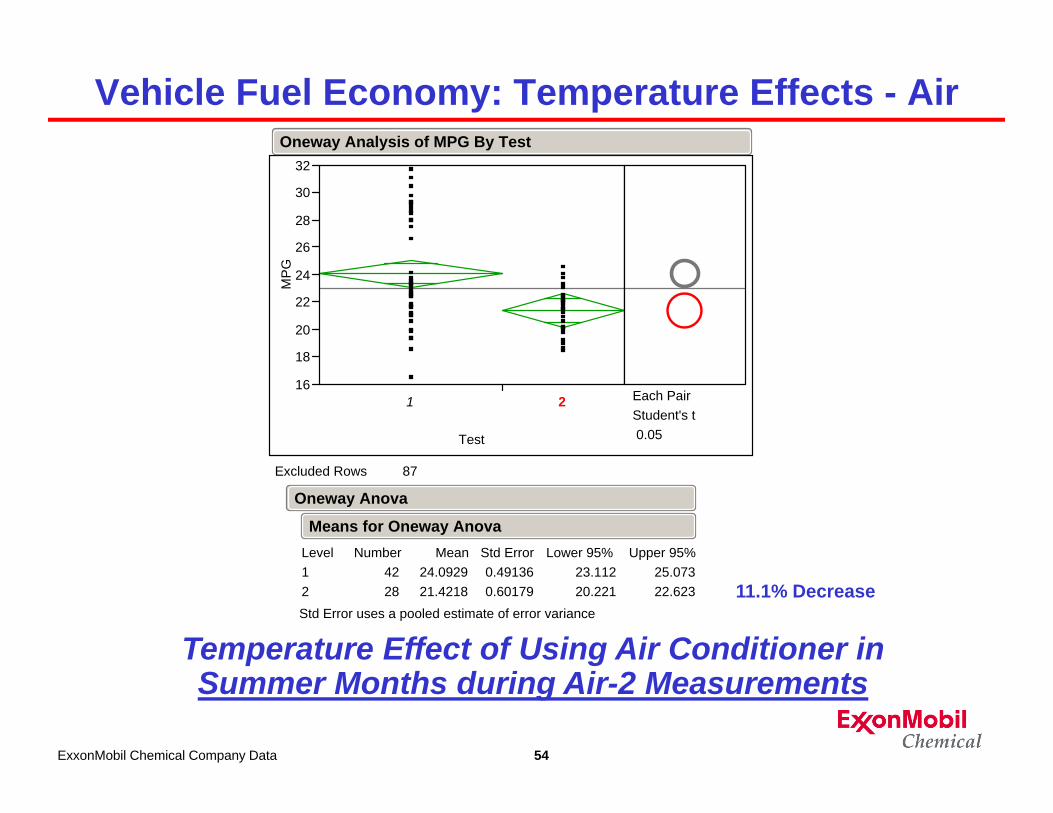
Vehicle Fuel Economy: Temperature Effects - Air
ExxonMobil Chemical Company Data
Temperature Effect of Using Air Conditioner inSummer Months during Air-2 Measurements
16
18
20
22
24
26
28
30
32
MP
G
1 2
Test
Each PairStudent's t0.05
Excluded Rows 87
12
Level4228
Number24.092921.4218
Mean0.491360.60179
Std Error23.11220.221
Lower 95%25.07322.623
Upper 95%
Std Error uses a pooled estimate of error variance
Means for Oneway Anova
Oneway Anova
Oneway Analysis of MPG By Test
11.1% Decrease

55
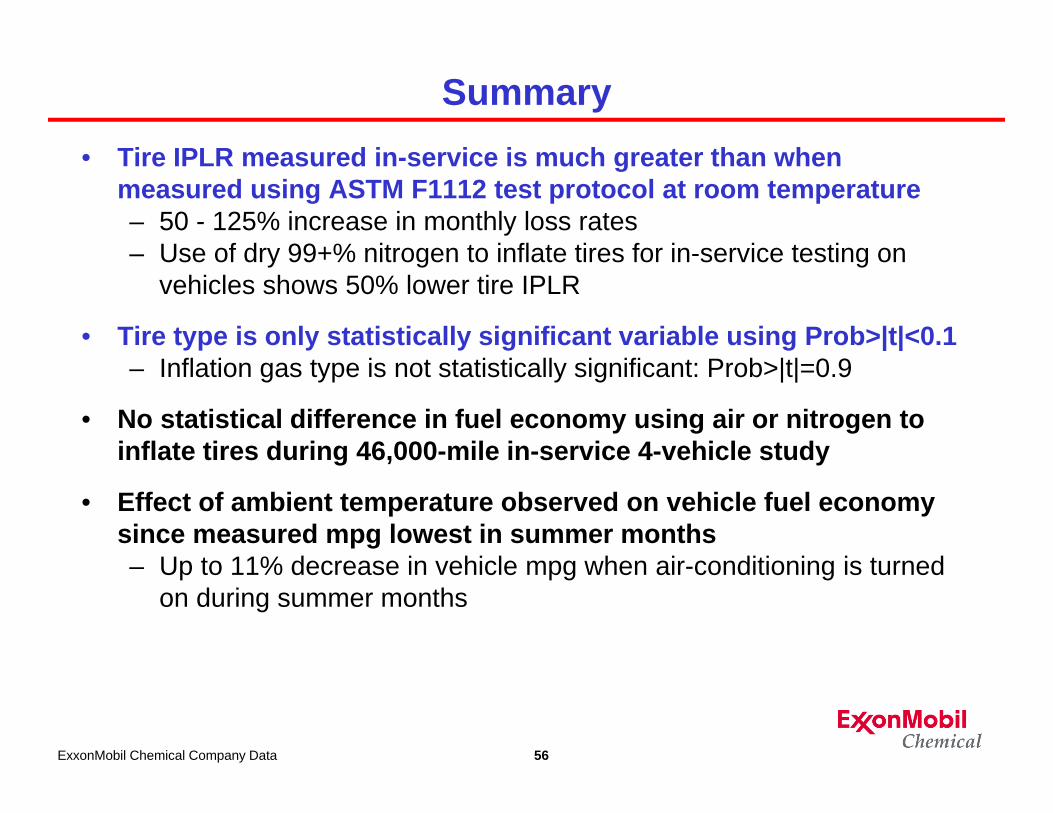
Summary
Use of dry 99.4% nitrogen as the fill gas
• Reduces oxidation of the natural rubber wire coat compound– Linear decrease in peel strength of skim with increasing
oxygen in the fill gas during laboratory oven aging
• Reduces tire IPLR by 40%
• Does not have primary affect on Cavity Gas Temperature– Cavity gas temperature dependent upon tire pressure: IPLR
• Does not have primary affect on Tire Rolling Resistance – Rolling resistance dependent upon tire inflation pressure: IPLR
ExxonMobil Chemical Company Data
Reducing Tire IPLR and Reducing Oxidation are the
Primary Effects of Using Nitrogen Gas Inflation
56
Summary• Tire IPLR measured in-service is much greater than when
measured using ASTM F1112 test protocol at room temperature– 50 - 125% increase in monthly loss rates– Use of dry 99+% nitrogen to inflate tires for in-service testing on
vehicles shows 50% lower tire IPLR
• Tire type is only statistically significant variable using Prob>|t|<0.1– Inflation gas type is not statistically significant: Prob>|t|=0.9
• No statistical difference in fuel economy using air or nitrogen to inflate tires during 46,000-mile in-service 4-vehicle study
• Effect of ambient temperature observed on vehicle fuel economy since measured mpg lowest in summer months– Up to 11% decrease in vehicle mpg when air-conditioning is turned
on during summer months
ExxonMobil Chemical Company Data
57
Disclaimer©2013 ExxonMobil Corporation. To the extent the user is entitled to disclose and distribute this document, the user may forward, distribute, and/or photocopy this copyrighted document only if unaltered and complete, including all of its headers,footers, disclaimers, and other information. You may not copy this document to a Web site. The information in this documentrelates only to the named product or materials when not in combination with any other product or materials. We based the information on data believed to be reliable on the date compiled, but we do not represent, warrant, or otherwise guarantee, expressly or impliedly, the merchantability, fitness for a particular purpose, suitability, accuracy, reliability, or completeness of this information or the products, materials, or processes described. The user is solely responsible for all determinations regarding any use of material or product and any process in its territories of interest. We expressly disclaim liability for any loss, damage, or injury directly or indirectly suffered or incurred as a result of or related to anyone using or relying on any of the information in this document. There is no endorsement of any product or process, and we expressly disclaim any contrary implication. The terms, “we”, “our”, "ExxonMobil Chemical", or "ExxonMobil" are used for convenience, and may include any one or more of ExxonMobil Chemical Company, Exxon Mobil Corporation, or any affiliates they directly or indirectly steward.
Evaluation of Nitrogen Inflation of Tires