the effects of inflation gas on tire laboratory test ... - what you need to know/independent... ·...
TRANSCRIPT

DOT HS 808 (TBD) September 2008
The Effects of Inflation Gas on Tire Laboratory Test Performance
DISCLAIMER
This publication is distributed by the U.S. Department of Transportation, National Highway Traffic Safety Administration, in the interest of information exchange. The opinions, findings, and conclusions expressed in this publication are those of the author(s) and not necessarily those of the Department of Transportation or the National Highway Traffic Safety Administration. The United States Government assumes no liability for its contents or use thereof. If trade names, manufacturers’ names, or specific products are mentioned, it is because they are considered essential to the object of the publication and should not be construed as an endorsement. The United States Government does not endorse products or manufacturers.
ii
iii
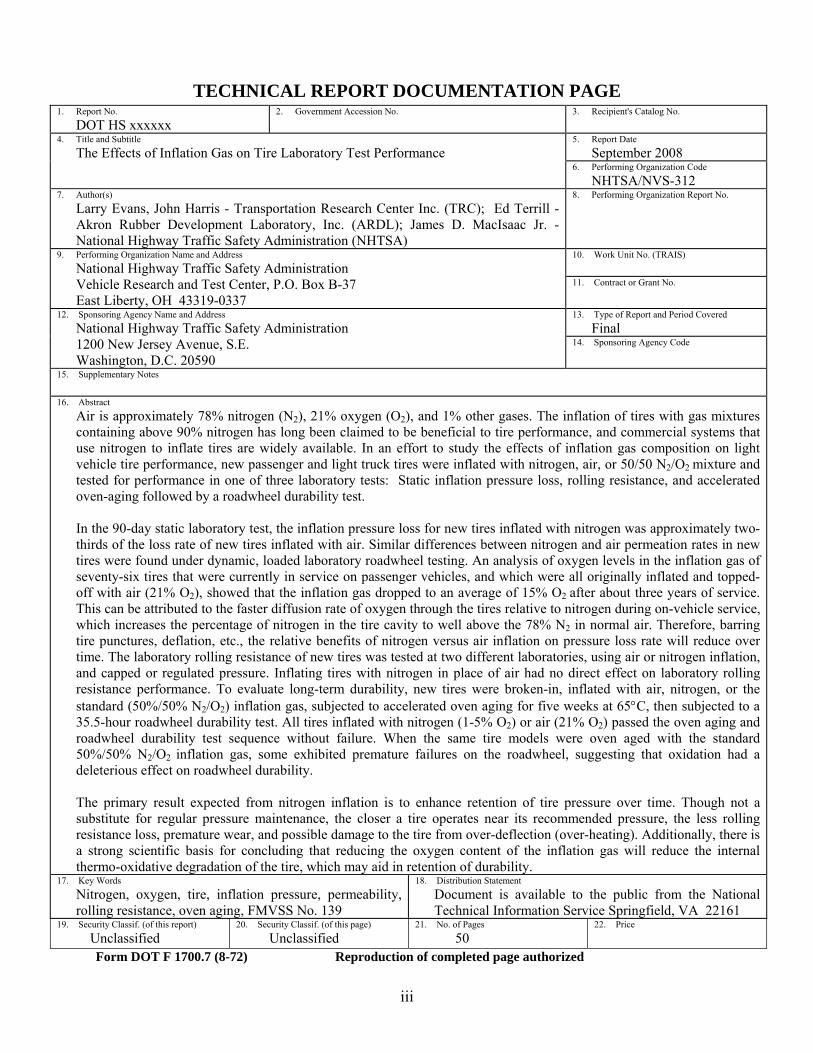
TECHNICAL REPORT DOCUMENTATION PAGE 1. Report No.
DOT HS xxxxxx 2. Government Accession No. 3. Recipient's Catalog No.
5. Report Date September 2008
4. Title and Subtitle The Effects of Inflation Gas on Tire Laboratory Test Performance
6. Performing Organization Code NHTSA/NVS-312
7. Author(s) Larry Evans, John Harris - Transportation Research Center Inc. (TRC); Ed Terrill - Akron Rubber Development Laboratory, Inc. (ARDL); James D. MacIsaac Jr. - National Highway Traffic Safety Administration (NHTSA)
8. Performing Organization Report No.
10. Work Unit No. (TRAIS) 9. Performing Organization Name and Address National Highway Traffic Safety Administration Vehicle Research and Test Center, P.O. Box B-37 East Liberty, OH 43319-0337
11. Contract or Grant No.
13. Type of Report and Period Covered Final
12. Sponsoring Agency Name and Address National Highway Traffic Safety Administration 1200 New Jersey Avenue, S.E. Washington, D.C. 20590
14. Sponsoring Agency Code
15. Supplementary Notes
16. Abstract Air is approximately 78% nitrogen (N2), 21% oxygen (O2), and 1% other gases. The inflation of tires with gas mixtures containing above 90% nitrogen has long been claimed to be beneficial to tire performance, and commercial systems that use nitrogen to inflate tires are widely available. In an effort to study the effects of inflation gas composition on light vehicle tire performance, new passenger and light truck tires were inflated with nitrogen, air, or 50/50 N2/O2 mixture and tested for performance in one of three laboratory tests: Static inflation pressure loss, rolling resistance, and accelerated oven-aging followed by a roadwheel durability test. In the 90-day static laboratory test, the inflation pressure loss for new tires inflated with nitrogen was approximately two-thirds of the loss rate of new tires inflated with air. Similar differences between nitrogen and air permeation rates in new tires were found under dynamic, loaded laboratory roadwheel testing. An analysis of oxygen levels in the inflation gas of seventy-six tires that were currently in service on passenger vehicles, and which were all originally inflated and topped-off with air (21% O2), showed that the inflation gas dropped to an average of 15% O2 after about three years of service. This can be attributed to the faster diffusion rate of oxygen through the tires relative to nitrogen during on-vehicle service, which increases the percentage of nitrogen in the tire cavity to well above the 78% N2 in normal air. Therefore, barring tire punctures, deflation, etc., the relative benefits of nitrogen versus air inflation on pressure loss rate will reduce over time. The laboratory rolling resistance of new tires was tested at two different laboratories, using air or nitrogen inflation, and capped or regulated pressure. Inflating tires with nitrogen in place of air had no direct effect on laboratory rolling resistance performance. To evaluate long-term durability, new tires were broken-in, inflated with air, nitrogen, or the standard (50%/50% N2/O2) inflation gas, subjected to accelerated oven aging for five weeks at 65°C, then subjected to a 35.5-hour roadwheel durability test. All tires inflated with nitrogen (1-5% O2) or air (21% O2) passed the oven aging and roadwheel durability test sequence without failure. When the same tire models were oven aged with the standard 50%/50% N2/O2 inflation gas, some exhibited premature failures on the roadwheel, suggesting that oxidation had a deleterious effect on roadwheel durability. The primary result expected from nitrogen inflation is to enhance retention of tire pressure over time. Though not a substitute for regular pressure maintenance, the closer a tire operates near its recommended pressure, the less rolling resistance loss, premature wear, and possible damage to the tire from over-deflection (over-heating). Additionally, there is a strong scientific basis for concluding that reducing the oxygen content of the inflation gas will reduce the internal thermo-oxidative degradation of the tire, which may aid in retention of durability.
17. Key Words Nitrogen, oxygen, tire, inflation pressure, permeability, rolling resistance, oven aging, FMVSS No. 139
18. Distribution Statement Document is available to the public from the National Technical Information Service Springfield, VA 22161
19. Security Classif. (of this report) Unclassified
20. Security Classif. (of this page) Unclassified
21. No. of Pages 50
22. Price
Form DOT F 1700.7 (8-72) Reproduction of completed page authorized
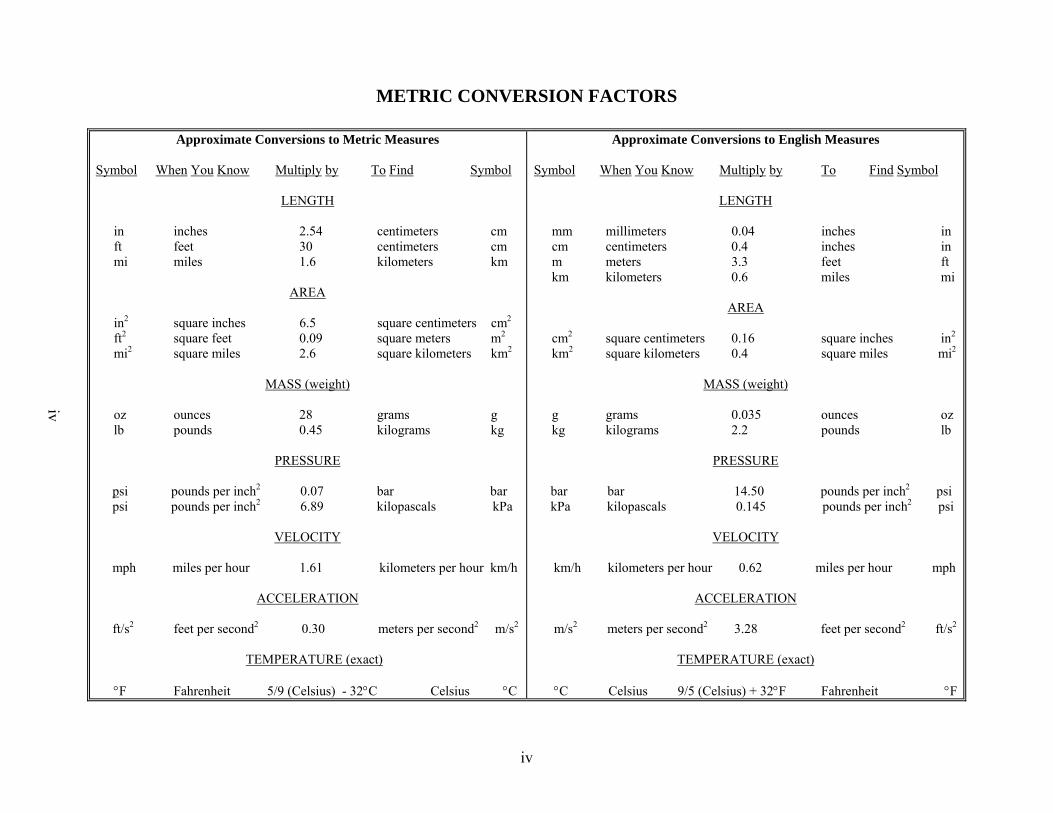
METRIC CONVERSION FACTORS
Approximate Conversions to Metric Measures Symbol When You Know Multiply by To Find Symbol
LENGTH
in inches 2.54 centimeters cm ft feet 30 centimeters cm mi miles 1.6 kilometers km
AREA
in2 square inches 6.5 square centimeters cm2 ft2 square feet 0.09 square meters m2 mi2 square miles 2.6 square kilometers km2
MASS (weight)
oz ounces 28 grams g
lb pounds 0.45 kilograms kg
PRESSURE
psi pounds per inch2 0.07 bar bar psi pounds per inch2 6.89 kilopascals kPa
VELOCITY
mph miles per hour 1.61 kilometers per hour km/h
ACCELERATION
ft/s2 feet per second2 0.30 meters per second2 m/s2
TEMPERATURE (exact)
°F Fahrenheit 5/9 (Celsius) - 32°C Celsius °C
Approximate Conversions to English Measures Symbol When You Know Multiply by To Find Symbol
LENGTH
mm millimeters 0.04 inches in cm centimeters 0.4 inches in m meters 3.3 feet ft km kilometers 0.6 miles mi
AREA
cm2 square centimeters 0.16 square inches in2 km2 square kilometers 0.4 square miles mi2
MASS (weight)
g grams 0.035 ounces oz kg kilograms 2.2 pounds lb
PRESSURE
bar bar 14.50 pounds per inch2 psi kPa kilopascals 0.145 pounds per inch2 psi
VELOCITY
km/h kilometers per hour 0.62 miles per hour mph
ACCELERATION
m/s2 meters per second2 3.28 feet per second2 ft/s2
TEMPERATURE (exact) °C Celsius 9/5 (Celsius) + 32°F Fahrenheit °F
iv
iv
NOTICE
REGARDING COMPLIANCE WITH
AMERICANS WITH DISABILITIES ACT SECTION 508
For the convenience of visually impaired readers of this report using text-to-speech software, additional descriptive text has been provided for graphical images contained in this report to satisfy Section 508 of the Americans with Disabilities Act (ADA)
v

Table of Contents SUBJECT:....................................................................................................................................... 1 PURPOSE:...................................................................................................................................... 1 EXECUTIVE SUMMARY: ........................................................................................................... 1 BACKGROUND: ........................................................................................................................... 3 DEFINITIONS:............................................................................................................................... 3 EXPERIMENTAL:......................................................................................................................... 4 RESULTS: ...................................................................................................................................... 5 SUMMARY:................................................................................................................................. 32 REFERENCES: ............................................................................................................................ 34 ACKNOWLEDGEMENTS:......................................................................................................... 35
General Test Parameters ....................................................................................................... 39 General Oven Aging Test Procedures................................................................................... 40
vi
List of Figures Figure 1: Distribution of IPL Normalized to Air Rate = 100 for Tire Type. Normalized Distribution of _____ Air _____ and ---- Nitrogen ----......................................................................... 8 Figure 2: Inflation Pressure Loss versus Weeks on Test for Different Inflation Gas.................. 10 Figure 3: Percent O2 Change during Ninety Day Test versus Initial O2 Concentration............. 11 Figure 4: Theoretical Distribution of IPL Normalized to Air Rate = 100 for Tire Type. Normalized Distribution of _____ Air with 20.9% O2 _____, __ - Air Depleted of O2 in Service __ -, and ---- Nitrogen ----..................................................................................................................... 13 Figure 5: FMVSS No. 139 Endurance and Low Pressure Tests - New Tires.............................. 19 Figure 6: Tires Broken-in and Oven Aged with Various Inflation Gases vs. Performance in FMVSS No. 139 Endurance and Low Pressure Test Sequence.................................................... 20 Figure 7: Partial Pressure of Oxygen in 50/50 Inflation Gas vs. Weeks in Oven for Capped Oven Aging at 60C & 70C ..................................................................................................................... 21 Figure 8: Partial Pressure of Oxygen for Each Week of 65C Oven Aging, Weekly Vent and Refill of Tires................................................................................................................................ 22 Figure 9: Changes in the Inflation Pressure during Capped-Inflation Roadwheel Testing ......... 24 Figure 10: Changes in the Percent Oxygen of Inflation Gas during Capped-Inflation Roadwheel Testing........................................................................................................................................... 25 Figure 11: Changes in the Partial Pressure of Oxygen during Capped-Inflation Roadwheel Testing........................................................................................................................................... 26 Figure 12: Changes in the Partial Pressure of Non-Oxygen Gas during Capped-Inflation Roadwheel Testing........................................................................................................................ 27 Figure 13: Changes in the Level of Fixed Oxygen in the Skim & Wedge Rubber Regions, New Tires, 5 Week Oven Aged Tires, Phoenix Tires ........................................................................... 28 Figure 14: Changes in the Average Tensile Properties in the Wedge Rubber Region, New Tires & Phoenix Tires. ........................................................................................................................... 29 Figure 15: Changes in the Average Tensile Properties in the Wedge Rubber Region, New Tires, Phoenix Tires, & 5 Week Oven Aged Tires ................................................................................. 30 Figure 16: Changes in the Inter-Belt Peel Strength in the Skim & Wedge Rubber Regions, New Tires, Phoenix Tires, & 5 Week Oven Aged Tires ....................................................................... 31
vii
viii
List of Tables Table 1: SAS GLM Analysis of Inflation Pressure Loss............................................................... 6 Table 2: Direct Comparisons of IPL for Nitrogen and Air Inflation ............................................. 7 Table 3: Inflation Pressure Loss Rates for 50/50 N2/O2 versus Air and Nitrogen......................... 9 Table 4: Inflation Pressure and Oxygen Percentage for Field Study Tires.................................. 12 Table 5: Estimated Composition of Tire Innerliner..................................................................... 14 Table 6: SAS GLM Analysis for Effects of Compound Composition Diffusion Rate (IPL) ...... 15 Table 7: SAE J 1269 Single-Point Rolling Resistance Testing ................................................... 16 Table 8: Direct Comparisons of Mean Values............................................................................. 17 Table 9: Analysis of Variance for Rolling Resistance (3 Tires of each Type, Inflated with Air, Run Using Regulated Method, in Each Lab) ................................................................................ 17 Table 10: Predicted Rolling Resistance for N2 and Air Inflated Tires after 90 Days Testing..... 18 Table 11: Figure 8 Linear Equations ........................................................................................... 22 Table 12: Modified LTDE Test Results....................................................................................... 23 Table 13: LTDE Test Parameters ................................................................................................ 38 Table 14: Oven Aging Test Parameters ....................................................................................... 39

Subject: Differences in the laboratory test performance of tires when inflated with gas containing different ratios of nitrogen to oxygen.
Purpose: The purpose of this report is to briefly detail results of NHTSA research that addresses the following basic questions that may affect the laboratory test performance of a tire when inflated with gases containing different ratios of nitrogen to oxygen:
1. Is there a systematic and quantifiable difference in the inflation pressure loss (IPL) of tires when inflated with gases of varying nitrogen to oxygen ratios?
2. Are any observed differences in IPL uniform among tires, or are they related to variables such as inflation pressure, or tire design and composition?
3. Are there direct effects of inflation gas composition on the rolling resistance of tires, or only indirect changes due to differing retention of inflation pressure over time?
4. Are there differences in tire durability performance after aging related to the nitrogen-to-oxygen ratio?
Executive Summary: Air is approximately 78% nitrogen (N2), 21% oxygen (O2), and 1% other gases. The inflation of tires with gas mixtures containing above 90% nitrogen has long been claimed to be beneficial to tire performance, and commercial systems that use nitrogen to inflate tires are widely available. NHTSA is currently conducting multiple tire research projects on the topics of tire inflation pressure loss rate, tire rolling resistance and tire aging. In order to study the effects of inflation gas composition on aspects of tire performance, extra tires from the studies (generally tires that had been designated as back-up tires in the event of a mis-test) were inflated with nitrogen, and tested versus tires inflated with air or other gases for performance in inflation pressure loss, rolling resistance, and oven-aging followed by a roadwheel durability test. In the 90-day static laboratory test, the inflation pressure loss for new tires inflated with nitrogen was approximately two-thirds of the loss rate of new tires inflated with air. The average 90-day pressure loss rate for tires inflated with air was 2.13%/month, and for the average for tires inflated with gas containing 95% to 99% nitrogen was 1.39%/month. Testing on a roadwheel indicated similar differences between nitrogen and air permeation rates under dynamic, loaded test conditions. A study of in-service tires on vehicles, originally inflated with air (21% O2), showed O2 levels averaging 15% for tires after about 3 years of service, which reduces the inflation pressure loss rate benefits for nitrogen inflation in service on a vehicle by approximately one-third. The decrease in permeability for nitrogen gas was observed to be independent of tire innerliner composition and thickness, thus applicable to all tire types studied. As an example, one set of light truck tires were inflated to 411.3 kPa (59.6 psi) with air which contained 21% O2 and 78% N2 At the end of 90 days the remaining pressure in the tire was 388.6 kPa (56.3 psi), an average inflation pressure loss rate of 1.72%/month (1.03 psi/month). When the light truck tires were inflated with 99% N2 gas, the pressure at the end of 90 days was 398.6 kPa (57.8 psi), an average inflation pressure loss rate of 1.24%/month (0.74 psi/month). Over the
1
90 day period the % N2 in the air-inflated tire increased to 80%, and the % N2 in the nitrogen-inflated tire decreased to 98%, due to the faster permeation of oxygen gas through the tire components in both directions, in and out, depending on the balance of partial pressures. If we continue to replenish the inflation gas with the original gas mixture (air or 99% pure N2) over a period of 3 years; the approximate predicted inflation pressure loss rates for the air-inflated tires, now containing 85% N2, would be 1.57%/month (0.94 psi/month), relative to a predicted inflation pressure loss rate for the nitrogen-inflated tires of approximately 1.31%/month (0.78 psi/month), and now containing 95% N2. Thus, for the light truck tire example provided above, the use of nitrogen-inflated tires decreased the amount of pressure lost by 28% over the first 90 days, while the predicted advantage of using nitrogen decreased to 17% over a 3 year period compared to an air-inflated tire. If we take the average of all tires we tested, the use of nitrogen-inflated tires decreased the amount of pressure lost by 35% over the first 90 days, while the advantage of using nitrogen is predicted to decrease to 24% over a 3 year period compared to an air-inflated tire. The study indicated that inflating with nitrogen in place of air had no immediate effect on laboratory tire rolling resistance. However, it is estimated that at the end of 90 days of on-vehicle service with no inflation pressure maintenance, the improved retention of inflation pressure using nitrogen versus air inflation will result in a 1.5% reduction in tire rolling resistance. Tires tested on a roadwheel after accelerated oven aging with nitrogen inflation showed no improvements in tire durability when compared to tires oven aged with air inflation. However, the oven aging test conditions may have been too short to differentiate between nitrogen and air inflation. Tires of same models oven aged with the traditional oxygen-rich inflation gas (50%/50% N2/O2) exhibited multiple failures, indicating the higher oxygen levels had a deleterious affect on post-oven roadwheel durability. These laboratory results are supported by results from tires retrieved from on-vehicle service in Phoenix, AZ that indicate that a portion of the oxygen permeating through the tire reacts with the internal tire rubber compounds, leading to degradation of their material properties. Thus lowering the percentage of oxygen in the inflation gas may be one way to lessen the availability of oxygen to react with and degrade the internal components of the tire over a long period of service. It should be noted that inflation with nitrogen merely slows the rate of diffusion of gas from the tire and is not a substitute for regularly maintaining tire pressure. The primary result expected from nitrogen inflation is to enhance retention of tire pressure over time, which will help maintain tire performance properties such as rolling resistance, handling, and durability. Since nitrogen and oxygen can diffuse both in and out of the tire over time, and the tire material properties may evolve and influence permeation rates, the authors caution that the results of laboratory testing on brand new tires may not predict benefits over a long period of real world service.
2
Background: Air is approximately 78% nitrogen (N2), 21% oxygen (O2) and 1% other gases and contains widely varying contents of water vapor. The inflation of tires with gas mixtures containing above 90% dry nitrogen has long been claimed to be beneficial to tire performance, and commercial systems that use nitrogen to inflate tires are widely available [1-10]. Lower rates of Inflation Pressure Loss (IPL) are explained by a combination of lower rate of diffusion of the N2 molecule through the rubber compound [3] and by the reduced partial pressure of O2 molecules inside the tire cavity [4]. Consumer Report’s magazine recently reported a comparison of the static inflation pressure loss of tires inflated with nitrogen versus those inflated with air [11]. They concluded that inflation with nitrogen did slow down the rate of pressure loss from tires that were stored for 1 year, but questioned whether the cost of approximately $5 / tire for nitrogen inflation was justified by this data. ExxonMobil Chemical has reported that tires maintained better durability and showed less separation at the belt edge when nitrogen was used as the inflation gas rather than air [12]. Their report concluded that this improvement was correlated to a lower rate of inflation pressure loss. The benefit of improved inflation pressure loss to improve tire rolling resistance has also been shown to be significant [13]. NHTSA is currently conducting multiple tire research projects on the topics of tire aging, inflation pressure loss rate and tire rolling resistance. In order to study the effects of inflation gas composition on aspects of tire performance, extra tires from the studies (generally tires that had been designated as back-up tires in the event of a mis-test) were inflated with nitrogen, and tested versus tires inflated with air for performance in inflation pressure loss, rolling resistance, and oven-aging followed by a roadwheel durability test. This study was not a designed experiment to test inflation gases, but a small subset of testing added to current projects. Various aging studies have shown that in order to simulate the results of aging in service, the oxygen content of the inflation gas needs to be increased beyond normal atmospheric levels of ~21% [14-16]. Therefore, a small subset of tires were also inflated with 50% N2 / 50% O2 gas and included in the study to further differentiate the effects of the oxygen content of the inflation gas on performance. It should be stressed that because this data uses extra tires added onto existing research, comparisons of properties is limited, and much of the analysis will be descriptive in nature. Additional research could be conducted with a larger sample of tires to make direct comparisons with more precision.
Definitions: Air (Also Shop Air)
Refers to normal atmospheric air compressed by mechanical means to inflate tires. Generally contains ~78% N2 / ~21% O2 and varying levels of water vapor.
Nitrogen N2 gas, either generated by separation from air on-site (approximately 95% - 99% N2), or received in pressurized cylinders (99+% N2), usually with very little or no humidity.
Inflation Pressure Loss rate, (IPL)
The rate of change of normalized inflation pressure, determined from the slope of the linear portion of the log pressure versus time curve as measured per ASTM F 1112.
Rolling Resistance (RR)
The force at the axle in the direction of travel required to make a loaded tire roll. Reported in pounds force. Corresponds to the energy lost by a tire
3

to internal forces, and not transmitted to vehicle movement. For the free-rolling tire, it is the scalar sum of all contact forces tangent to the test surface and parallel to the wheel plane of the tire.
Rolling Resistance Coefficient (RRC)
The ratio of rolling resistance force to the load on the tire. Reported as a dimensionless unit, generally ranging from 0.007 to 0.014 for light vehicle tires.
Light Vehicle NHTSA safety standards are applicable to vehicles with a Gross Vehicle Weight Rating of 4,356 kg or less (10,000 lbs. or less).
Field Tires Tires tested during on-vehicle service or after having been retrieved from on-vehicle service.
Tire Service Aging The changes in tire chemical and physical properties that take place as a tire is in service on a vehicle. Measured directly, or as a change in performance on a tire durability test.
Tire Laboratory Aging Test
A laboratory test designed to simulate the chemical and physical property changes, and tire durability test performance characteristics of a tire that has been in service on a vehicle.
Base Inflation Pressure
The inflation pressure corresponding to the maximum load listed in the tire load tables of the current T&RA yearbook or in corresponding tables published by similar organizations concerned with standardization.
Capped When a tire is inflated to measure pressure loss, the capped method requires the tire pressure to not be adjusted during the test. This is done by inflating the tire to the required pressure prior to testing, while the tire is at ambient temperature of the test area, and then sealing the air in the tire during testing with a valve, cap or some other seal.
Regulated During a test procedure, the inflation pressure is maintained at a specified value throughout the test.
T&RA Tire and Rim Association, Inc. 175 Montrose West Ave. Suite 150 Copley, Ohio 44321
Experimental: Tires were tested for inflation pressure loss using the ASTM F 1112 Standard Test Method for Static Testing of Tubeless Pneumatic Tires for Rate of Loss of Inflation Pressure. The ASTM F 1112 test method determines the rate of inflation pressure loss resulting from gas diffusion through the structures of tubeless tires under constant temperature conditions. The testing is done under static conditions, that is, non-rotating, non-loaded tires. Test tires are mounted on rims, fitted with calibrated precision pressure measuring devices, inflated to the desired pressure, and, after a period of stabilization, the inflation pressure is monitored as a function of time under static, constant temperature conditions. The test temperature was maintained at 21°C for all testing. Measured inflation pressures are then normalized to the nominal test temperature and one atmosphere barometric pressure (101.3 kPa) for calculation of pressure loss rates. The Inflation Pressure Loss rate (IPL) is calculated as percent loss per month using the slope of the linear portion of the log pressure versus time curve. The normal F 1112 test discards the first 30 days of data. During these tests the 90 day calculation follows this recommended practice.
4

However to generate the 3, 6, 9 and 11 week IPL values for this study, the first 30 days of data had to be included. The rolling resistance of tires was measured using the SAE J 1269 Rolling Resistance Measurement Procedure for Passenger Car, Light Truck, and Highway Truck and Bus Tires for the laboratory measurement of rolling resistance of pneumatic tires. SAE J 1269 contains three different methods of determining rolling resistance: Force, Torque and Power. For this study the Force method was used in the two laboratories. The Force method measures the reaction force at the tire spindle and converts it to rolling resistance. These measurements are made using a 1.707 m roadwheel with an instrumented axle for the tire. The surface is covered with a medium-coarse (80 grit) texture. Test data is normalized to 24°C. The test conditions used were the Standard Reference Condition (SRC) using 70% of maximum T&RA load and Base Inflation Pressure +20 kPa with a test speed of 80 km/h. During this part of the study both Capped and Regulated inflation methods were used. During the tests using the Capped method the tire would be inflated at room temperature with the designated filling gas and then run with a 30 minute warm-up to stabilize the temperature and allow the pressure to build up as if it were on the highway. The Regulated testing would be inflated using a rotary union to adjust the pressure and maintain the specified test pressure after the 30 minute warm-up, duplicating the standard SAE J 1269 test procedure. The various projects involving nitrogen tire inflation involved the testing of 261 tires of 30 different models. Details of the different tire models (“Tire Types”) are listed in Appendix A. In addition to testing of inflation pressure loss, tires were tested in accordance with a dynamic aging protocol supplied by Michelin Tire in which the tire is run for an extended period of time on a laboratory roadwheel. Tires were also tested by laboratory aging in hot air circulating ovens, followed by endurance testing on a laboratory roadwheel. The modified Michelin Long Term Durability Endurance (LTDE) test procedure is shown in Appendix B. Oven aging was carried out on tires mounted on rims and inflated with the specified gas at 65° C in a circulating air oven. The procedure is shown in Appendix C. Roadwheel testing of tires following oven aging was carried out using the FMVSS No. 139 endurance and low pressure tests, as specified in the Code of Federal Regulations (CFR) Part 571.139; New pneumatic radial tires for light vehicles, S6.3, Tire Endurance, and S6.4, Low Inflation Pressure Performance, shown in Appendix D. All data used in the compilation of this report are available in raw form in an accompanying Excel spreadsheet.
Results: 1. Is there a systematic and quantifiable difference in the inflation pressure loss (IPL) of tires
when inflated with gas of varying nitrogen to oxygen ratio?
5
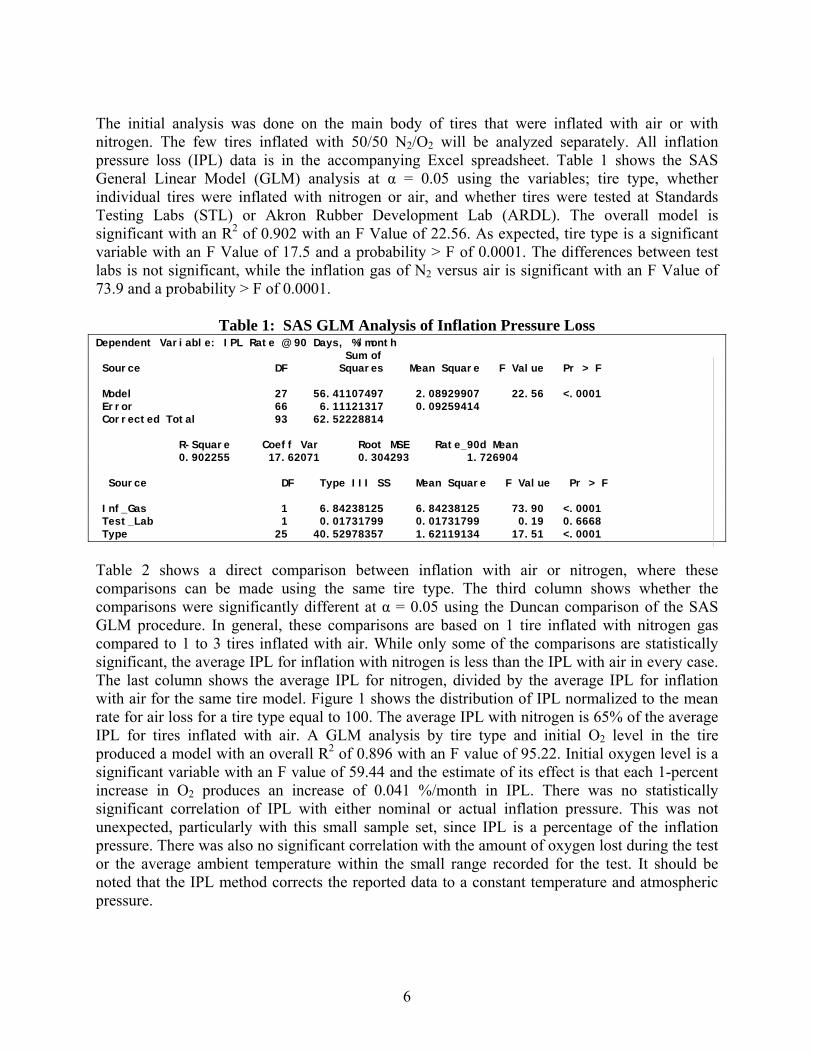
The initial analysis was done on the main body of tires that were inflated with air or with nitrogen. The few tires inflated with 50/50 N2/O2 will be analyzed separately. All inflation pressure loss (IPL) data is in the accompanying Excel spreadsheet. Table 1 shows the SAS General Linear Model (GLM) analysis at α = 0.05 using the variables; tire type, whether individual tires were inflated with nitrogen or air, and whether tires were tested at Standards Testing Labs (STL) or Akron Rubber Development Lab (ARDL). The overall model is significant with an R2 of 0.902 with an F Value of 22.56. As expected, tire type is a significant variable with an F Value of 17.5 and a probability > F of 0.0001. The differences between test labs is not significant, while the inflation gas of N2 versus air is significant with an F Value of 73.9 and a probability > F of 0.0001.
Table 1: SAS GLM Analysis of Inflation Pressure Loss Dependent Variable: IPL Rate @ 90 Days, %/month Sum of Source DF Squares Mean Square F Value Pr > F Model 27 56.41107497 2.08929907 22.56 <.0001 Error 66 6.11121317 0.09259414 Corrected Total 93 62.52228814 R-Square Coeff Var Root MSE Rate_90d Mean 0.902255 17.62071 0.304293 1.726904 Source DF Type III SS Mean Square F Value Pr > F Inf_Gas 1 6.84238125 6.84238125 73.90 <.0001 Test_Lab 1 0.01731799 0.01731799 0.19 0.6668 Type 25 40.52978357 1.62119134 17.51 <.0001
Table 2 shows a direct comparison between inflation with air or nitrogen, where these comparisons can be made using the same tire type. The third column shows whether the comparisons were significantly different at α = 0.05 using the Duncan comparison of the SAS GLM procedure. In general, these comparisons are based on 1 tire inflated with nitrogen gas compared to 1 to 3 tires inflated with air. While only some of the comparisons are statistically significant, the average IPL for inflation with nitrogen is less than the IPL with air in every case. The last column shows the average IPL for nitrogen, divided by the average IPL for inflation with air for the same tire model. Figure 1 shows the distribution of IPL normalized to the mean rate for air loss for a tire type equal to 100. The average IPL with nitrogen is 65% of the average IPL for tires inflated with air. A GLM analysis by tire type and initial O2 level in the tire produced a model with an overall R2 of 0.896 with an F value of 95.22. Initial oxygen level is a significant variable with an F value of 59.44 and the estimate of its effect is that each 1-percent increase in O2 produces an increase of 0.041 %/month in IPL. There was no statistically significant correlation of IPL with either nominal or actual inflation pressure. This was not unexpected, particularly with this small sample set, since IPL is a percentage of the inflation pressure. There was also no significant correlation with the amount of oxygen lost during the test or the average ambient temperature within the small range recorded for the test. It should be noted that the IPL method corrects the reported data to a constant temperature and atmospheric pressure.
6
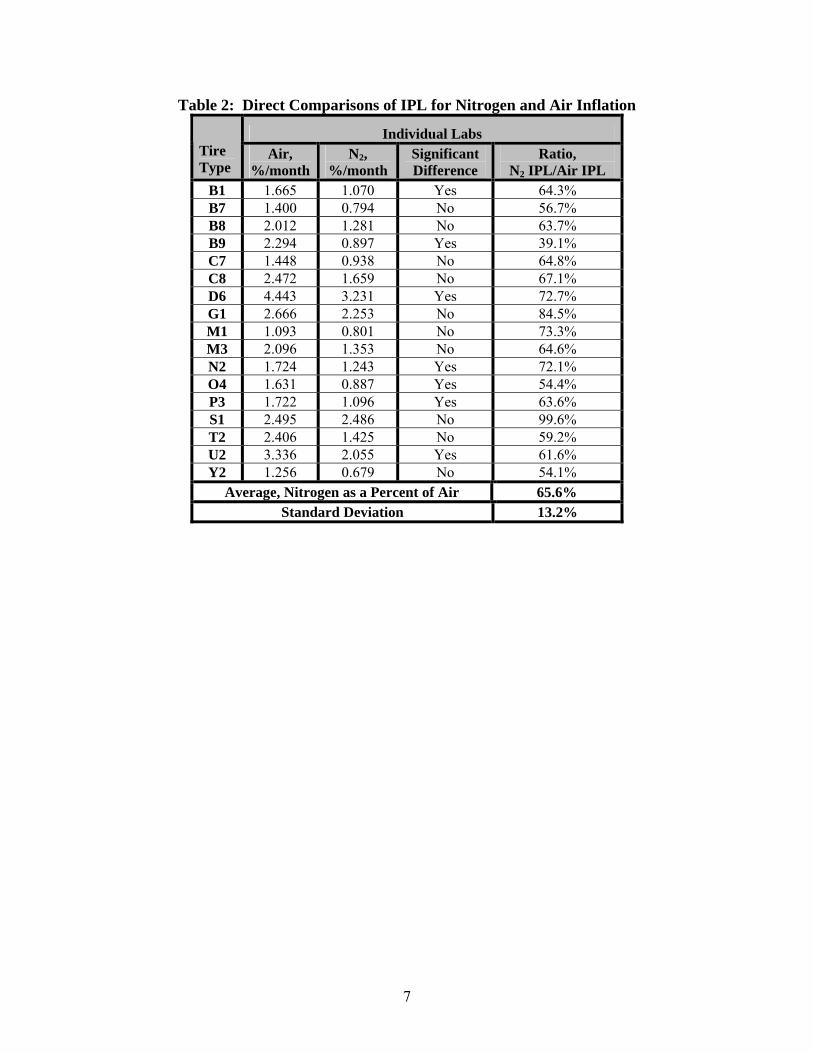
Table 2: Direct Comparisons of IPL for Nitrogen and Air Inflation
Individual Labs Tire Type
Air, %/month
N2, %/month
Significant Difference
Ratio, N2 IPL/Air IPL
B1 1.665 1.070 Yes 64.3% B7 1.400 0.794 No 56.7% B8 2.012 1.281 No 63.7% B9 2.294 0.897 Yes 39.1% C7 1.448 0.938 No 64.8% C8 2.472 1.659 No 67.1% D6 4.443 3.231 Yes 72.7% G1 2.666 2.253 No 84.5% M1 1.093 0.801 No 73.3% M3 2.096 1.353 No 64.6% N2 1.724 1.243 Yes 72.1% O4 1.631 0.887 Yes 54.4% P3 1.722 1.096 Yes 63.6% S1 2.495 2.486 No 99.6% T2 2.406 1.425 No 59.2% U2 3.336 2.055 Yes 61.6% Y2 1.256 0.679 No 54.1%
Average, Nitrogen as a Percent of Air 65.6% Standard Deviation 13.2%
7
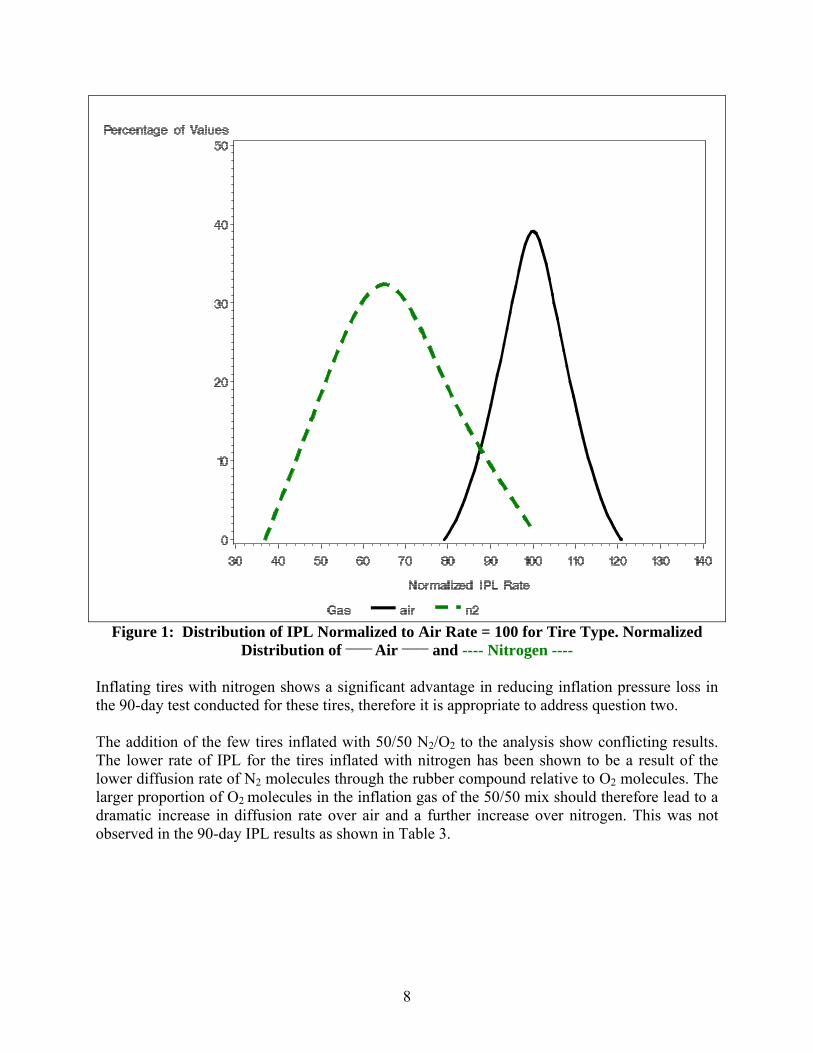
Figure 1: Distribution of IPL Normalized to Air Rate = 100 for Tire Type. Normalized Distribution of _____ Air _____ and ---- Nitrogen ----
Inflating tires with nitrogen shows a significant advantage in reducing inflation pressure loss in the 90-day test conducted for these tires, therefore it is appropriate to address question two. The addition of the few tires inflated with 50/50 N2/O2 to the analysis show conflicting results. The lower rate of IPL for the tires inflated with nitrogen has been shown to be a result of the lower diffusion rate of N2 molecules through the rubber compound relative to O2 molecules. The larger proportion of O2 molecules in the inflation gas of the 50/50 mix should therefore lead to a dramatic increase in diffusion rate over air and a further increase over nitrogen. This was not observed in the 90-day IPL results as shown in Table 3.
8
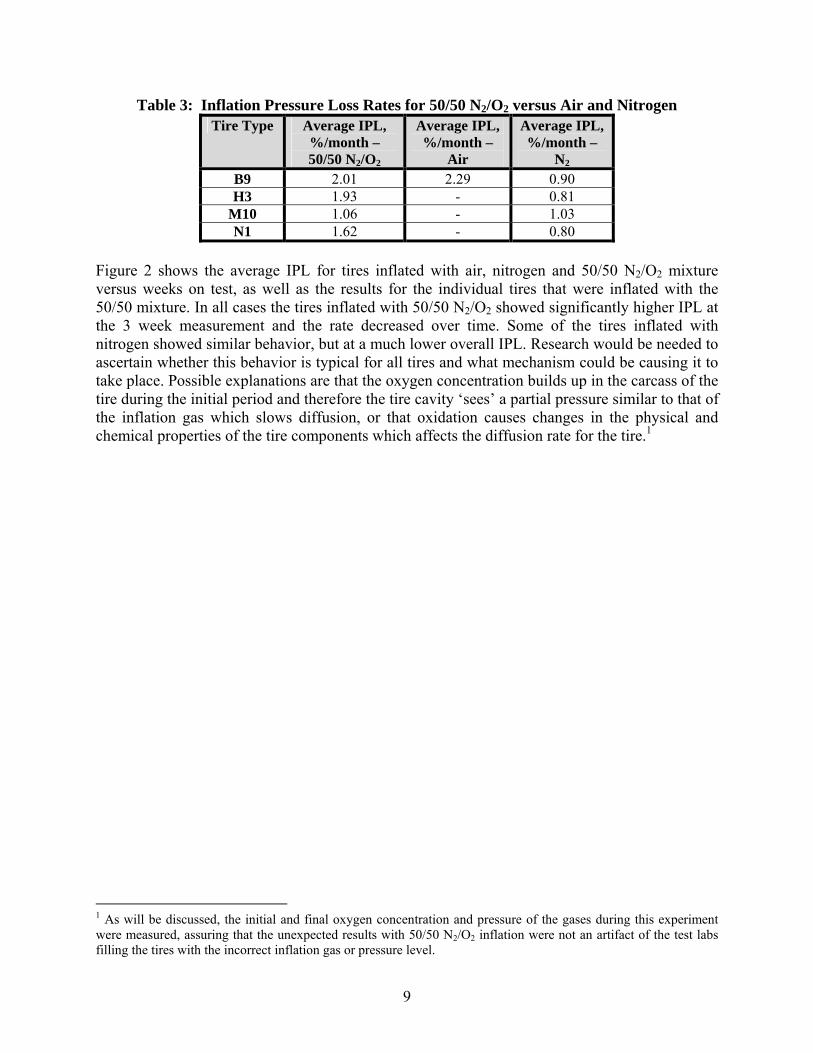
Table 3: Inflation Pressure Loss Rates for 50/50 N2/O2 versus Air and Nitrogen Tire Type Average IPL,
%/month – 50/50 N2/O2
Average IPL, %/month –
Air
Average IPL, %/month –
N2 B9 2.01 2.29 0.90 H3 1.93 - 0.81
M10 1.06 - 1.03 N1 1.62 - 0.80
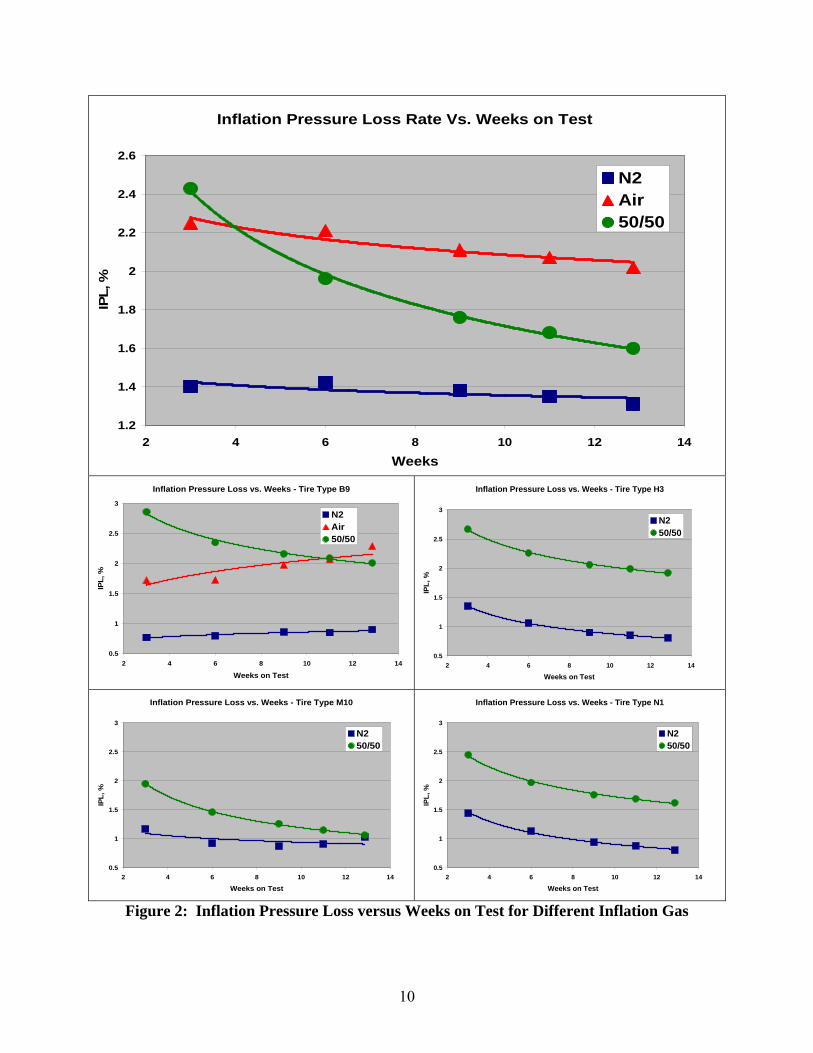
Figure 2 shows the average IPL for tires inflated with air, nitrogen and 50/50 N2/O2 mixture versus weeks on test, as well as the results for the individual tires that were inflated with the 50/50 mixture. In all cases the tires inflated with 50/50 N2/O2 showed significantly higher IPL at the 3 week measurement and the rate decreased over time. Some of the tires inflated with nitrogen showed similar behavior, but at a much lower overall IPL. Research would be needed to ascertain whether this behavior is typical for all tires and what mechanism could be causing it to take place. Possible explanations are that the oxygen concentration builds up in the carcass of the tire during the initial period and therefore the tire cavity ‘sees’ a partial pressure similar to that of the inflation gas which slows diffusion, or that oxidation causes changes in the physical and chemical properties of the tire components which affects the diffusion rate for the tire.1
1 As will be discussed, the initial and final oxygen concentration and pressure of the gases during this experiment were measured, assuring that the unexpected results with 50/50 N2/O2 inflation were not an artifact of the test labs filling the tires with the incorrect inflation gas or pressure level.
9
Inflation Pressure Loss Rate Vs. Weeks on Test
1.2
1.4
1.6
1.8
2
2.2
2.4
2.6
2 4 6 8 10 12 1Weeks
IPL,
%
4
N2Air50/50
Inflation Pressure Loss vs. Weeks - Tire Type B9
0.5
1
1.5
2
2.5
3
2 4 6 8 10 12 1
Weeks on Test
IPL,
%
4
N2Air50/50
Inflation Pressure Loss vs. Weeks - Tire Type H3
0.5
1
1.5
2
2.5
3
2 4 6 8 10 12 14
Weeks on Test
IPL,
%
N250/50
Inflation Pressure Loss vs. Weeks - Tire Type M10
0.5
1
1.5
2
2.5
3
2 4 6 8 10 12 14
Weeks on Test
IPL,
%
N250/50
Inflation Pressure Loss vs. Weeks - Tire Type N1
0.5
1
1.5
2
2.5
3
2 4 6 8 10 12 14
Weeks on Test
IPL,
%
N250/50
Figure 2: Inflation Pressure Loss versus Weeks on Test for Different Inflation Gas
10

The concentration of oxygen was measured at the beginning and end of the 90 day test period for each tire. Figure 3 shows the change in oxygen concentration during the 90-day test versus the initial oxygen concentration. As expected, the tires with 50% initial oxygen concentration lost significantly more oxygen than nitrogen during the test. The data shows that tires inflated with air lost, on average, 1.5% oxygen concentration during the test. This finding supports the lower diffusion rate of nitrogen. Tires inflated with nitrogen of greater than about 97% purity actually gained oxygen during the 90-day test. This strongly indicates that the change in oxygen in the tire cavity is primarily a result of diffusion and not reactive consumption of the oxygen.
Change in Percent Oxygen Concentration During IPL Test Versus Starting Oxygen Concentration
y = -0.0016x2 - 0.0519x + 0.2166R2 = 0.9156
-7
-6
-5
-4
-3
-2
-1
0
1
0 2 4 6 8 10 12 14 16 18 20 22 24 26 28 30 32 34 36 38 40 42 44 46 48 50 52
% Initial O2
%O
2 Lo
ss D
urin
g Te
st (9
0 da
ys)
Figure 3: Percent O2 Change during Ninety Day Test versus Initial O2 Concentration Seventy six tires from nineteen vehicles were measured for tire pressure and oxygen concentration. The tires were obtained on a volunteer basis from ARDL employees in Akron, Ohio. The tire pressures were measured with a pressure gauge (Pressure Inc. Pro Series digital pressure gauge 0 to 160 psi in 0.5 psi units). The tire oxygen concentration was measured with an oxygen sensor (Parker IR637409-QE04299020 digital readout in percent with 0.1 units). The oxygen sensor was calibrated to 20.9% oxygen regularly between tire readings. For the forty tires with the DOT date code recorded, the average age of the tires at the time of inspection was 2.8 years with tires ranging from 0.6 to 6.8 years old. The distribution of inflation pressure and oxygen percentage in the inflation gas is shown in Table 4. The average inflation pressure of the tires was 29.1 psi. Most tires (96%) were in a reasonable inflation range. However, three of the tires were severely under-inflated (less than or equal to 15 psi). The average percentage of oxygen measured in the inflation gas of field tires (on-vehicle tires) was 15.0%, and most values
11
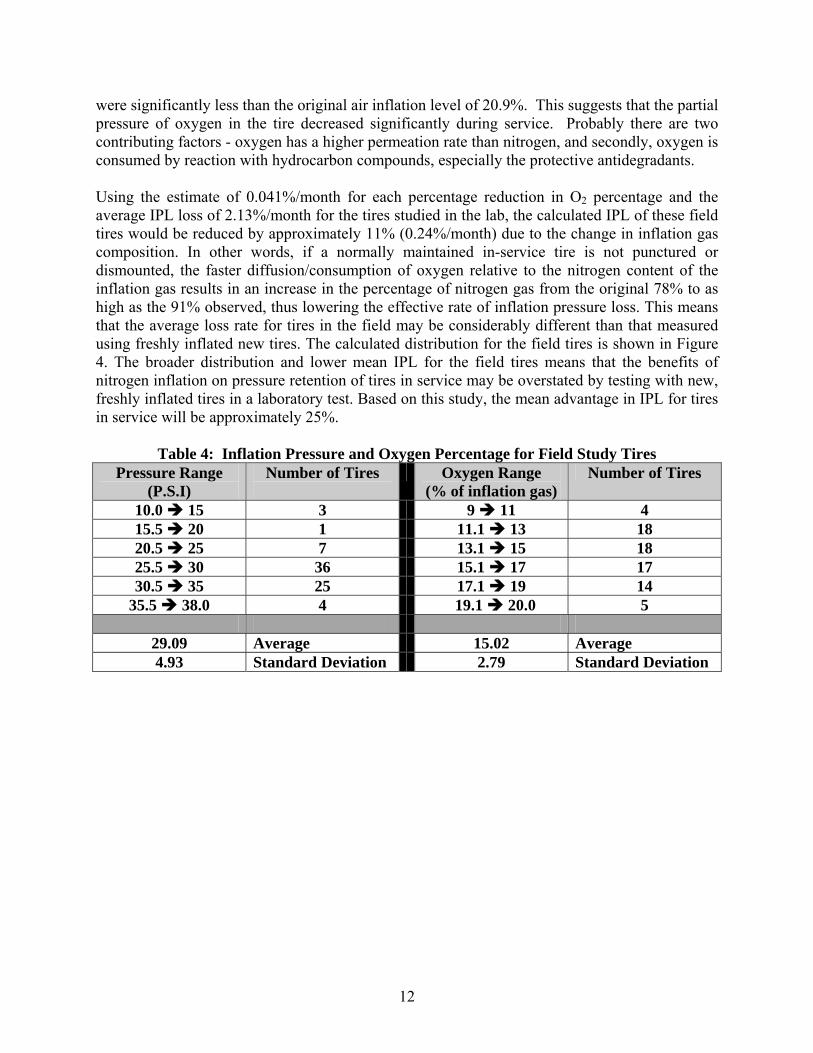
were significantly less than the original air inflation level of 20.9%. This suggests that the partial pressure of oxygen in the tire decreased significantly during service. Probably there are two contributing factors - oxygen has a higher permeation rate than nitrogen, and secondly, oxygen is consumed by reaction with hydrocarbon compounds, especially the protective antidegradants. Using the estimate of 0.041%/month for each percentage reduction in O2 percentage and the average IPL loss of 2.13%/month for the tires studied in the lab, the calculated IPL of these field tires would be reduced by approximately 11% (0.24%/month) due to the change in inflation gas composition. In other words, if a normally maintained in-service tire is not punctured or dismounted, the faster diffusion/consumption of oxygen relative to the nitrogen content of the inflation gas results in an increase in the percentage of nitrogen gas from the original 78% to as high as the 91% observed, thus lowering the effective rate of inflation pressure loss. This means that the average loss rate for tires in the field may be considerably different than that measured using freshly inflated new tires. The calculated distribution for the field tires is shown in Figure 4. The broader distribution and lower mean IPL for the field tires means that the benefits of nitrogen inflation on pressure retention of tires in service may be overstated by testing with new, freshly inflated tires in a laboratory test. Based on this study, the mean advantage in IPL for tires in service will be approximately 25%.
Table 4: Inflation Pressure and Oxygen Percentage for Field Study Tires Pressure Range
(P.S.I) Number of Tires
Oxygen Range
(% of inflation gas) Number of Tires
10.0 15 3 9 11 4 15.5 20 1 11.1 13 18 20.5 25 7 13.1 15 18 25.5 30 36 15.1 17 17 30.5 35 25 17.1 19 14
35.5 38.0 4 19.1 20.0 5
29.09 Average 15.02 Average 4.93 Standard Deviation 2.79 Standard Deviation
12
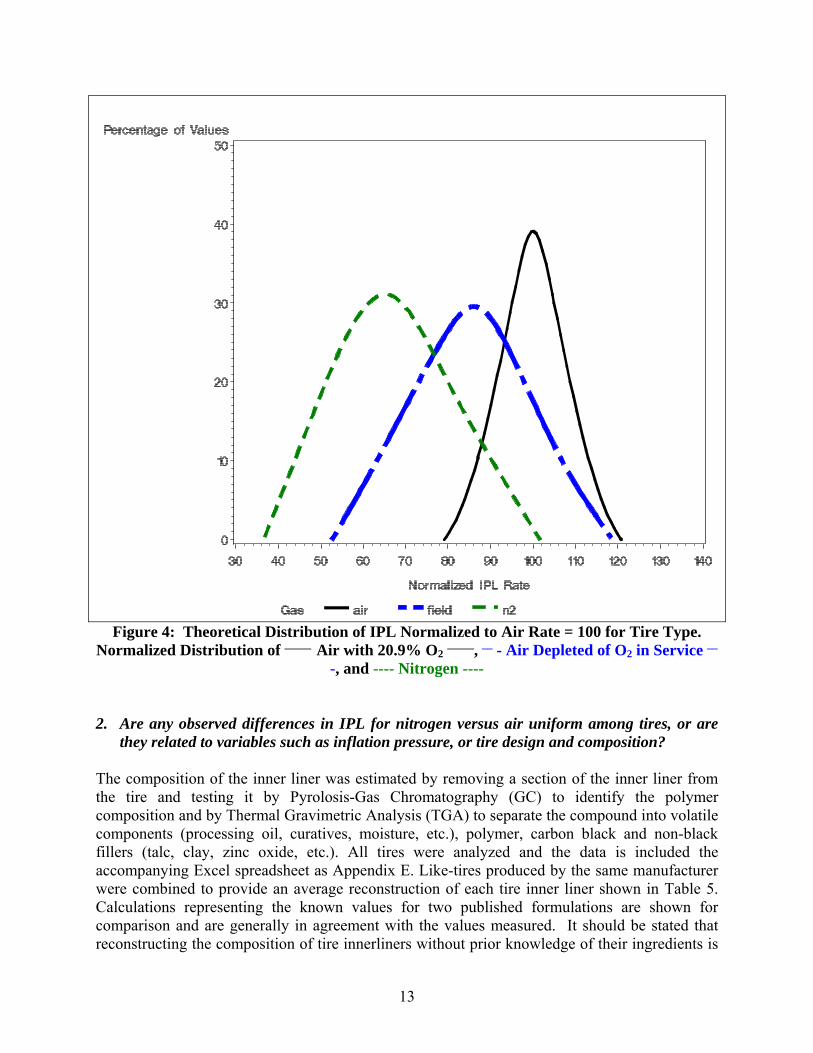
Figure 4: Theoretical Distribution of IPL Normalized to Air Rate = 100 for Tire Type. Normalized Distribution of _____ Air with 20.9% O2 _____, __ - Air Depleted of O2 in Service __
-, and ---- Nitrogen ----
2. Are any observed differences in IPL for nitrogen versus air uniform among tires, or are
they related to variables such as inflation pressure, or tire design and composition? The composition of the inner liner was estimated by removing a section of the inner liner from the tire and testing it by Pyrolosis-Gas Chromatography (GC) to identify the polymer composition and by Thermal Gravimetric Analysis (TGA) to separate the compound into volatile components (processing oil, curatives, moisture, etc.), polymer, carbon black and non-black fillers (talc, clay, zinc oxide, etc.). All tires were analyzed and the data is included the accompanying Excel spreadsheet as Appendix E. Like-tires produced by the same manufacturer were combined to provide an average reconstruction of each tire inner liner shown in Table 5. Calculations representing the known values for two published formulations are shown for comparison and are generally in agreement with the values measured. It should be stated that reconstructing the composition of tire innerliners without prior knowledge of their ingredients is
13
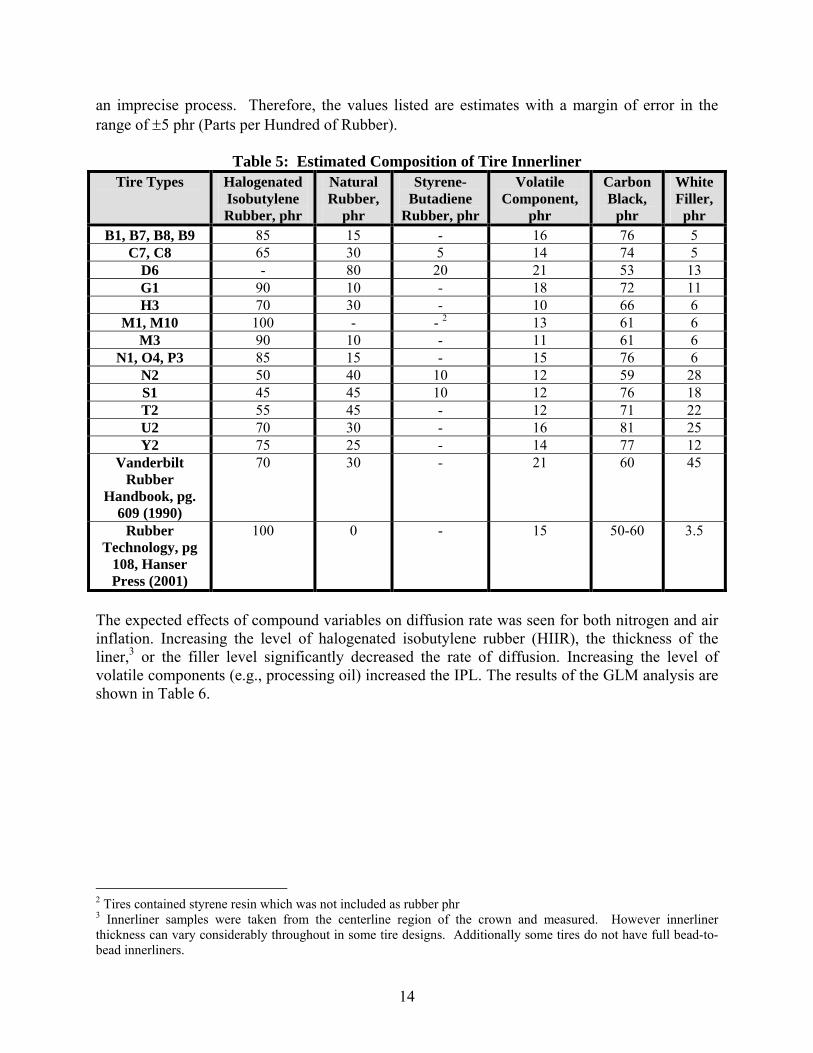
an imprecise process. Therefore, the values listed are estimates with a margin of error in the range of ±5 phr (Parts per Hundred of Rubber).
Table 5: Estimated Composition of Tire Innerliner Tire Types Halogenated
Isobutylene Rubber, phr
Natural Rubber,
phr
Styrene-Butadiene
Rubber, phr
Volatile Component,
phr
Carbon Black,
phr
White Filler,
phr B1, B7, B8, B9 85 15 - 16 76 5
C7, C8 65 30 5 14 74 5 D6 - 80 20 21 53 13 G1 90 10 - 18 72 11 H3 70 30 - 10 66 6
M1, M10 100 - - 2 13 61 6 M3 90 10 - 11 61 6
N1, O4, P3 85 15 - 15 76 6 N2 50 40 10 12 59 28 S1 45 45 10 12 76 18 T2 55 45 - 12 71 22 U2 70 30 - 16 81 25 Y2 75 25 - 14 77 12
Vanderbilt Rubber
Handbook, pg. 609 (1990)
70 30 - 21 60 45
Rubber Technology, pg
108, Hanser Press (2001)
100 0 - 15 50-60 3.5
The expected effects of compound variables on diffusion rate was seen for both nitrogen and air inflation. Increasing the level of halogenated isobutylene rubber (HIIR), the thickness of the liner,3 or the filler level significantly decreased the rate of diffusion. Increasing the level of volatile components (e.g., processing oil) increased the IPL. The results of the GLM analysis are shown in Table 6.
2 Tires contained styrene resin which was not included as rubber phr 3 Innerliner samples were taken from the centerline region of the crown and measured. However innerliner thickness can vary considerably throughout in some tire designs. Additionally some tires do not have full bead-to-bead innerliners.
14
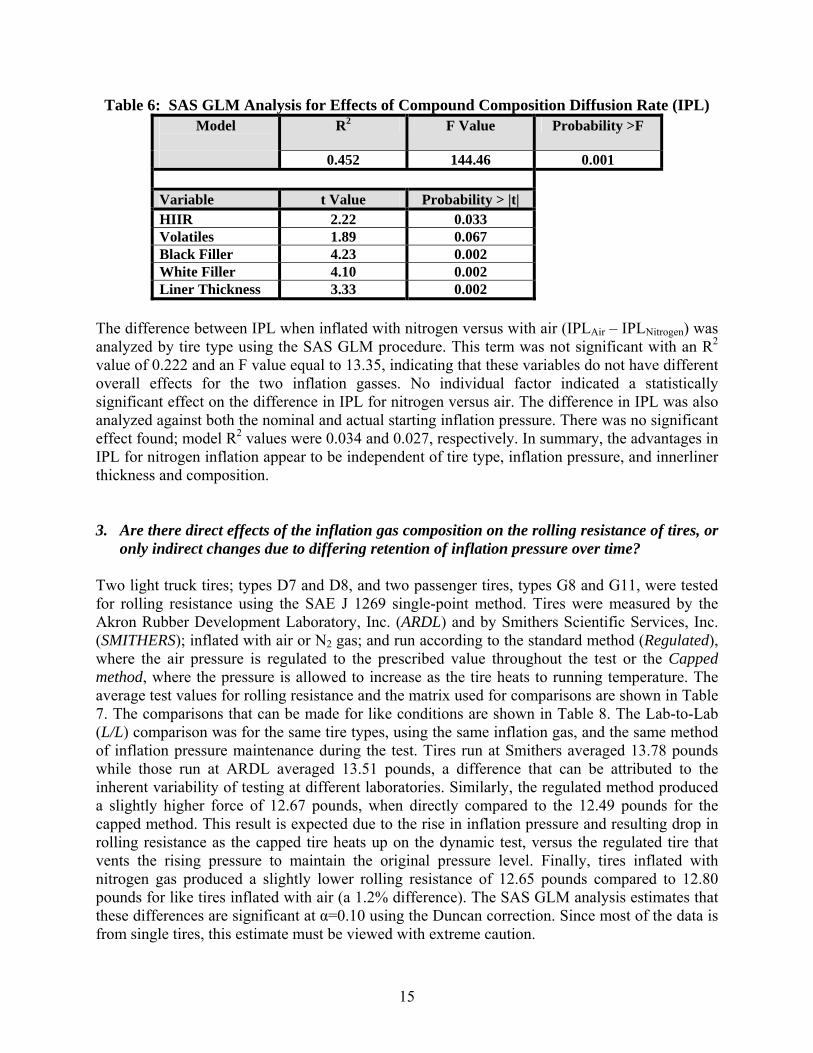
Table 6: SAS GLM Analysis for Effects of Compound Composition Diffusion Rate (IPL) Model
R2 F Value Probability >F
0.452 144.46 0.001 Variable t Value Probability > |t| HIIR 2.22 0.033 Volatiles 1.89 0.067 Black Filler 4.23 0.002 White Filler 4.10 0.002 Liner Thickness 3.33 0.002
The difference between IPL when inflated with nitrogen versus with air (IPLAir – IPLNitrogen) was analyzed by tire type using the SAS GLM procedure. This term was not significant with an R2 value of 0.222 and an F value equal to 13.35, indicating that these variables do not have different overall effects for the two inflation gasses. No individual factor indicated a statistically significant effect on the difference in IPL for nitrogen versus air. The difference in IPL was also analyzed against both the nominal and actual starting inflation pressure. There was no significant effect found; model R2 values were 0.034 and 0.027, respectively. In summary, the advantages in IPL for nitrogen inflation appear to be independent of tire type, inflation pressure, and innerliner thickness and composition. 3. Are there direct effects of the inflation gas composition on the rolling resistance of tires, or
only indirect changes due to differing retention of inflation pressure over time? Two light truck tires; types D7 and D8, and two passenger tires, types G8 and G11, were tested for rolling resistance using the SAE J 1269 single-point method. Tires were measured by the Akron Rubber Development Laboratory, Inc. (ARDL) and by Smithers Scientific Services, Inc. (SMITHERS); inflated with air or N2 gas; and run according to the standard method (Regulated), where the air pressure is regulated to the prescribed value throughout the test or the Capped method, where the pressure is allowed to increase as the tire heats to running temperature. The average test values for rolling resistance and the matrix used for comparisons are shown in Table 7. The comparisons that can be made for like conditions are shown in Table 8. The Lab-to-Lab (L/L) comparison was for the same tire types, using the same inflation gas, and the same method of inflation pressure maintenance during the test. Tires run at Smithers averaged 13.78 pounds while those run at ARDL averaged 13.51 pounds, a difference that can be attributed to the inherent variability of testing at different laboratories. Similarly, the regulated method produced a slightly higher force of 12.67 pounds, when directly compared to the 12.49 pounds for the capped method. This result is expected due to the rise in inflation pressure and resulting drop in rolling resistance as the capped tire heats up on the dynamic test, versus the regulated tire that vents the rising pressure to maintain the original pressure level. Finally, tires inflated with nitrogen gas produced a slightly lower rolling resistance of 12.65 pounds compared to 12.80 pounds for like tires inflated with air (a 1.2% difference). The SAS GLM analysis estimates that these differences are significant at α=0.10 using the Duncan correction. Since most of the data is from single tires, this estimate must be viewed with extreme caution.
15
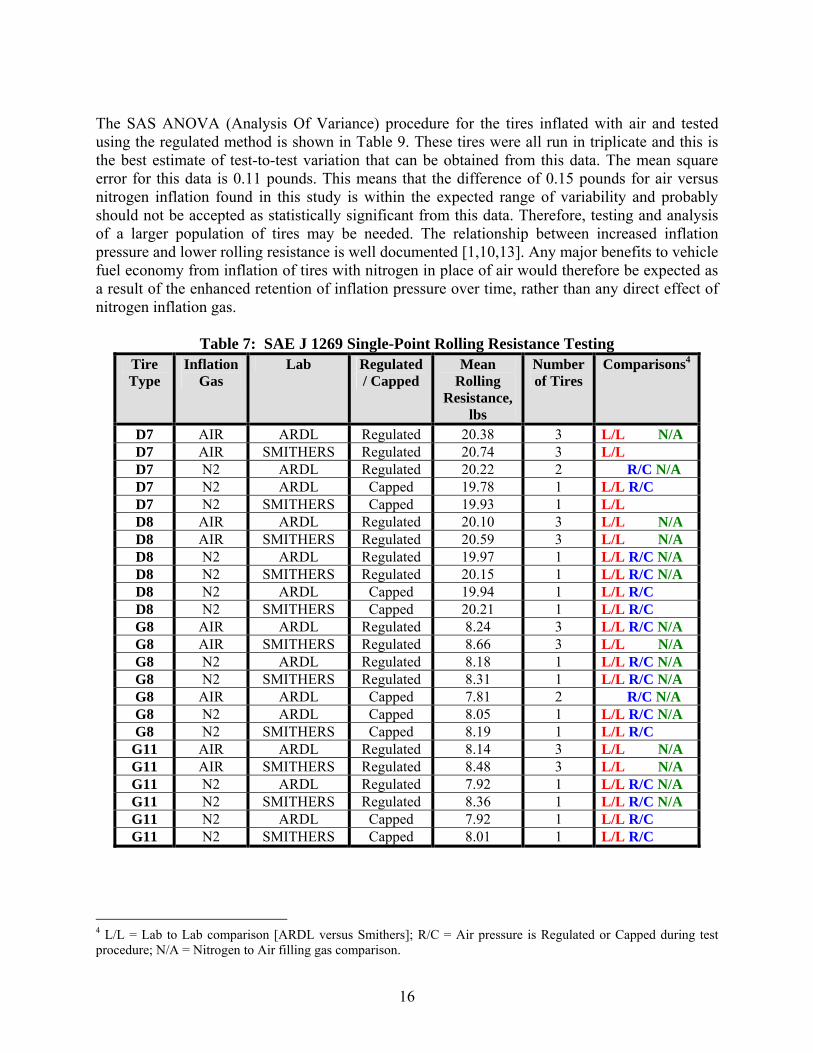
The SAS ANOVA (Analysis Of Variance) procedure for the tires inflated with air and tested using the regulated method is shown in Table 9. These tires were all run in triplicate and this is the best estimate of test-to-test variation that can be obtained from this data. The mean square error for this data is 0.11 pounds. This means that the difference of 0.15 pounds for air versus nitrogen inflation found in this study is within the expected range of variability and probably should not be accepted as statistically significant from this data. Therefore, testing and analysis of a larger population of tires may be needed. The relationship between increased inflation pressure and lower rolling resistance is well documented [1,10,13]. Any major benefits to vehicle fuel economy from inflation of tires with nitrogen in place of air would therefore be expected as a result of the enhanced retention of inflation pressure over time, rather than any direct effect of nitrogen inflation gas.
Table 7: SAE J 1269 Single-Point Rolling Resistance Testing Tire Type
Inflation Gas
Lab Regulated / Capped
Mean Rolling
Resistance, lbs
Number of Tires
Comparisons4
D7 AIR ARDL Regulated 20.38 3 L/L N/A D7 AIR SMITHERS Regulated 20.74 3 L/L D7 N2 ARDL Regulated 20.22 2 R/C N/A D7 N2 ARDL Capped 19.78 1 L/L R/C D7 N2 SMITHERS Capped 19.93 1 L/L D8 AIR ARDL Regulated 20.10 3 L/L N/A D8 AIR SMITHERS Regulated 20.59 3 L/L N/A D8 N2 ARDL Regulated 19.97 1 L/L R/C N/A D8 N2 SMITHERS Regulated 20.15 1 L/L R/C N/A D8 N2 ARDL Capped 19.94 1 L/L R/C D8 N2 SMITHERS Capped 20.21 1 L/L R/C G8 AIR ARDL Regulated 8.24 3 L/L R/C N/A G8 AIR SMITHERS Regulated 8.66 3 L/L N/A G8 N2 ARDL Regulated 8.18 1 L/L R/C N/A G8 N2 SMITHERS Regulated 8.31 1 L/L R/C N/A G8 AIR ARDL Capped 7.81 2 R/C N/A G8 N2 ARDL Capped 8.05 1 L/L R/C N/A G8 N2 SMITHERS Capped 8.19 1 L/L R/C
G11 AIR ARDL Regulated 8.14 3 L/L N/A G11 AIR SMITHERS Regulated 8.48 3 L/L N/A G11 N2 ARDL Regulated 7.92 1 L/L R/C N/A G11 N2 SMITHERS Regulated 8.36 1 L/L R/C N/A G11 N2 ARDL Capped 7.92 1 L/L R/C G11 N2 SMITHERS Capped 8.01 1 L/L R/C
4 L/L = Lab to Lab comparison [ARDL versus Smithers]; R/C = Air pressure is Regulated or Capped during test procedure; N/A = Nitrogen to Air filling gas comparison.
16
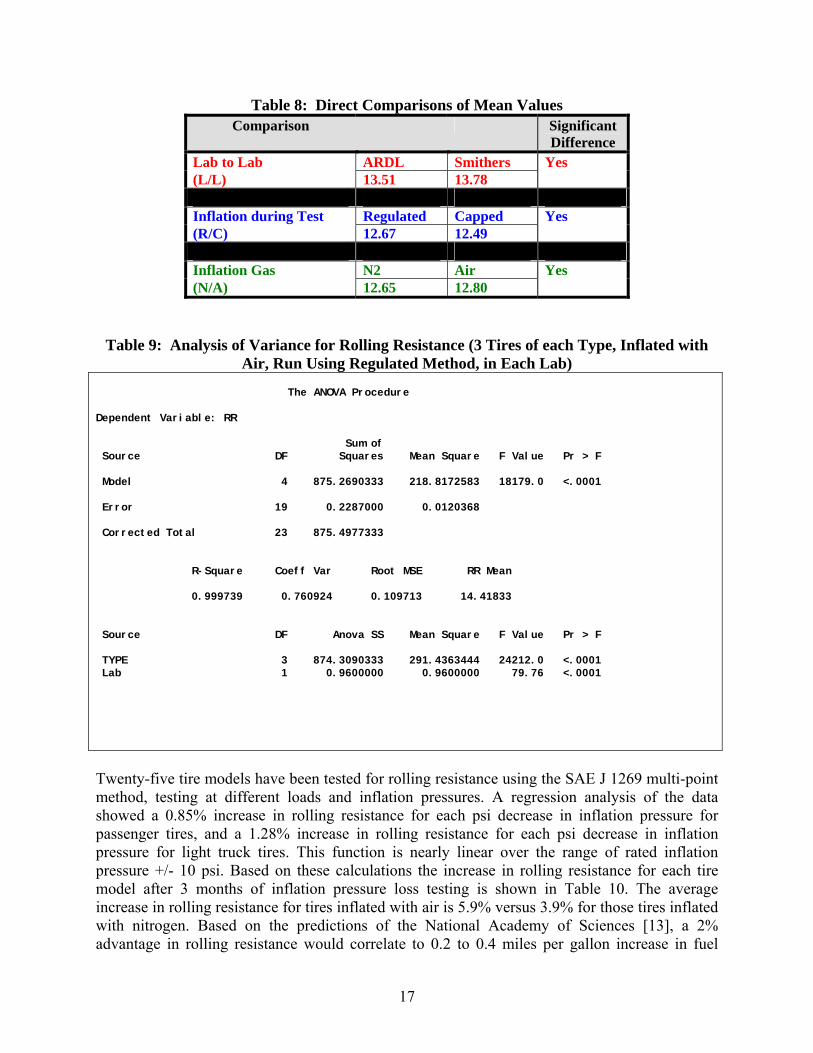
Table 8: Direct Comparisons of Mean Values Comparison Significant
Difference Lab to Lab ARDL Smithers Yes (L/L) 13.51 13.78 Inflation during Test Regulated Capped Yes (R/C) 12.67 12.49 Inflation Gas N2 Air Yes (N/A) 12.65 12.80
Table 9: Analysis of Variance for Rolling Resistance (3 Tires of each Type, Inflated with Air, Run Using Regulated Method, in Each Lab)
The ANOVA Procedure Dependent Variable: RR Sum of Source DF Squares Mean Square F Value Pr > F Model 4 875.2690333 218.8172583 18179.0 <.0001 Error 19 0.2287000 0.0120368 Corrected Total 23 875.4977333 R-Square Coeff Var Root MSE RR Mean 0.999739 0.760924 0.109713 14.41833 Source DF Anova SS Mean Square F Value Pr > F TYPE 3 874.3090333 291.4363444 24212.0 <.0001 Lab 1 0.9600000 0.9600000 79.76 <.0001
Twenty-five tire models have been tested for rolling resistance using the SAE J 1269 multi-point method, testing at different loads and inflation pressures. A regression analysis of the data showed a 0.85% increase in rolling resistance for each psi decrease in inflation pressure for passenger tires, and a 1.28% increase in rolling resistance for each psi decrease in inflation pressure for light truck tires. This function is nearly linear over the range of rated inflation pressure +/- 10 psi. Based on these calculations the increase in rolling resistance for each tire model after 3 months of inflation pressure loss testing is shown in Table 10. The average increase in rolling resistance for tires inflated with air is 5.9% versus 3.9% for those tires inflated with nitrogen. Based on the predictions of the National Academy of Sciences [13], a 2% advantage in rolling resistance would correlate to 0.2 to 0.4 miles per gallon increase in fuel
17

economy. It should be noted that regular maintenance of inflation pressure is necessary for tires whether inflated with air or with nitrogen. Table 10: Predicted Rolling Resistance for N2 and Air Inflated Tires after 90 Days Testing
Rolling Resistance after 90 Days, % of Original TIRE TYPE Air Inflation N2 Inflation
B1 104.2 102.7 B7 103.6 102.0 B8 105.1 103.3 B9 108.8 103.4 C7 103.7 102.4 C8 106.3 104.2 D6 111.3 108.2 G1 106.8 105.7 M1 102.8 102.0 M3 105.3 103.5 N2 106.6 104.8 O4 106.3 103.4 P3 104.4 102.8 S1 106.4 106.3 T2 106. 103.6 U2 108.5 105.2 Y2 104.8 102.6
AVERAGE 105.9 103.9 4. Are there changes in tire durability performance after aging related to the nitrogen to
oxygen ratio? The accepted chemical mechanisms that produce material property changes in tires during service are thermo-oxidative [14, 16-19]. Numerous articles have been published that show benefits to slowing the rate of change in rubber properties by inflating tires with nitrogen in place of air [2-11]. Conversely, there have been several studies that use increased oxygen in the filling gas to accelerate these changes in properties to age the belt coat stocks of tires in a laboratory environment [14, 16-20]. Tires inflated with nitrogen were added to the NHTSA tire aging study in addition to the tires inflated with air or 50% N2 / 50% O2 (50/50). Two new tires from 11 different tire models were subjected to the FMVSS No. 139 Endurance and Low Pressure roadwheel tests. All 22 new tires successfully completed the 35.5 hour test sequence with no visible findings (“NVD”), and no appreciable pressure loss. These results are detailed in Figure 5, which identifies tires as passenger or light truck, by manufacturer, by tire type (Appendix A), and by unique four-digit barcode.
18

Figure 5: FMVSS No. 139 Endurance and Low Pressure Tests - New Tires Two new tires of each of 11 different tire models were subjected to a two hour roadwheel break-in at 80km/h (50 mph), followed by a five week oven aging procedure (details in Appendix C) using a 50/50 N2/O2 inflation mixture, which yields an effective oxygen content of around 42%, or about twice the level of normal air. Based on an agency analysis of the changes in tire material properties and roadwheel performance in tires retrieved from service, these oven aging conditions replicate approximately 2.5 years and 47,000 kilometers (29k miles) of service in the high ambient temperatures of the Southwestern United States, or as much as double that amount of service in the northernmost States. One additional tire of each model was subjected to the same test procedure with shop air inflation (21% oxygen) and another tire with nitrogen inflation (3% oxygen) from a nitrogen generator unit. After aging tires inflated with the accelerated aging mixture of 50/50 N2/O2 inflation gas, 6 of 22 tires (27%) failed before the end of the 35.5 hour roadwheel test sequence due to thermo-oxidative degradation of the tire rubber compounds and their inter-laminar interfaces. However, all 22 new tires with air or nitrogen inflation successfully completed the 35.5 hour test sequence with no visual findings (NVD) following oven aging. Therefore, no difference in performance in the post-aging roadwheel test was observed between oven aging with normal shop air and nitrogen for these test conditions.
19
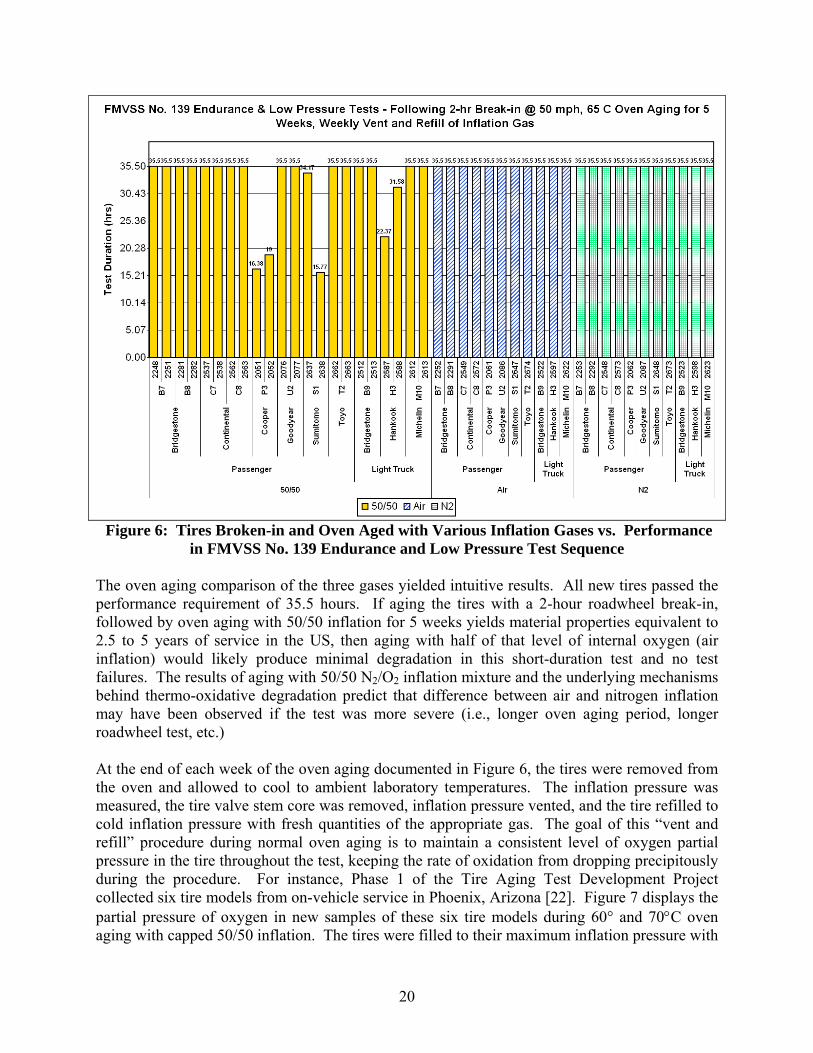
Figure 6: Tires Broken-in and Oven Aged with Various Inflation Gases vs. Performance in FMVSS No. 139 Endurance and Low Pressure Test Sequence
The oven aging comparison of the three gases yielded intuitive results. All new tires passed the performance requirement of 35.5 hours. If aging the tires with a 2-hour roadwheel break-in, followed by oven aging with 50/50 inflation for 5 weeks yields material properties equivalent to 2.5 to 5 years of service in the US, then aging with half of that level of internal oxygen (air inflation) would likely produce minimal degradation in this short-duration test and no test failures. The results of aging with 50/50 N2/O2 inflation mixture and the underlying mechanisms behind thermo-oxidative degradation predict that difference between air and nitrogen inflation may have been observed if the test was more severe (i.e., longer oven aging period, longer roadwheel test, etc.) At the end of each week of the oven aging documented in Figure 6, the tires were removed from the oven and allowed to cool to ambient laboratory temperatures. The inflation pressure was measured, the tire valve stem core was removed, inflation pressure vented, and the tire refilled to cold inflation pressure with fresh quantities of the appropriate gas. The goal of this “vent and refill” procedure during normal oven aging is to maintain a consistent level of oxygen partial pressure in the tire throughout the test, keeping the rate of oxidation from dropping precipitously during the procedure. For instance, Phase 1 of the Tire Aging Test Development Project collected six tire models from on-vehicle service in Phoenix, Arizona [22]. Figure 7 displays the partial pressure of oxygen in new samples of these six tire models during 60° and 70°C oven aging with capped 50/50 inflation. The tires were filled to their maximum inflation pressure with
20

50/50, the valve stem capped, and the tires oven aged without interruption. One set of tires was removed after 3 weeks and the pressure and percentage of oxygen in the inflation gas was measured. Another set of tires repeated the procedure at 6 weeks. As is evident in Figure 7, the portion of the pressurized inflation gas that is oxygen (“partial pressure of oxygen”) is permeating and reacting so quickly that at six weeks, a normal passenger tire with a 35 psi max inflation pressure has lost 1/3 to 1/2 of the pressurized oxygen during the test, depending on the temperature. As oven aging test development progressed, it became evident that the pressure level and oxygen content level in the gas was going to have to be maintained in order to retain a sufficient oxygen for the oxidative reaction.
Figure 7: Partial Pressure of Oxygen in 50/50 Inflation Gas vs. Weeks in Oven for Capped Oven Aging at 60C & 70C
For tires inflated with 50/50 N2/O2 or N2 in the Figure 6 inflation gas comparison, an extra step was taken to measure the percent oxygen in the inflation gas before venting the tire. With the weekly vent and refill of the 50/50 N2/O2 inflation gas, the partial pressure of oxygen remained essentially constant throughout the test. When nitrogen inflation was used, the partial pressure of oxygen initially dropped until nearly zero oxygen remained at week five. Since many lines are close together on the graph, equations for the linear regressions are contained in Table 11.
21
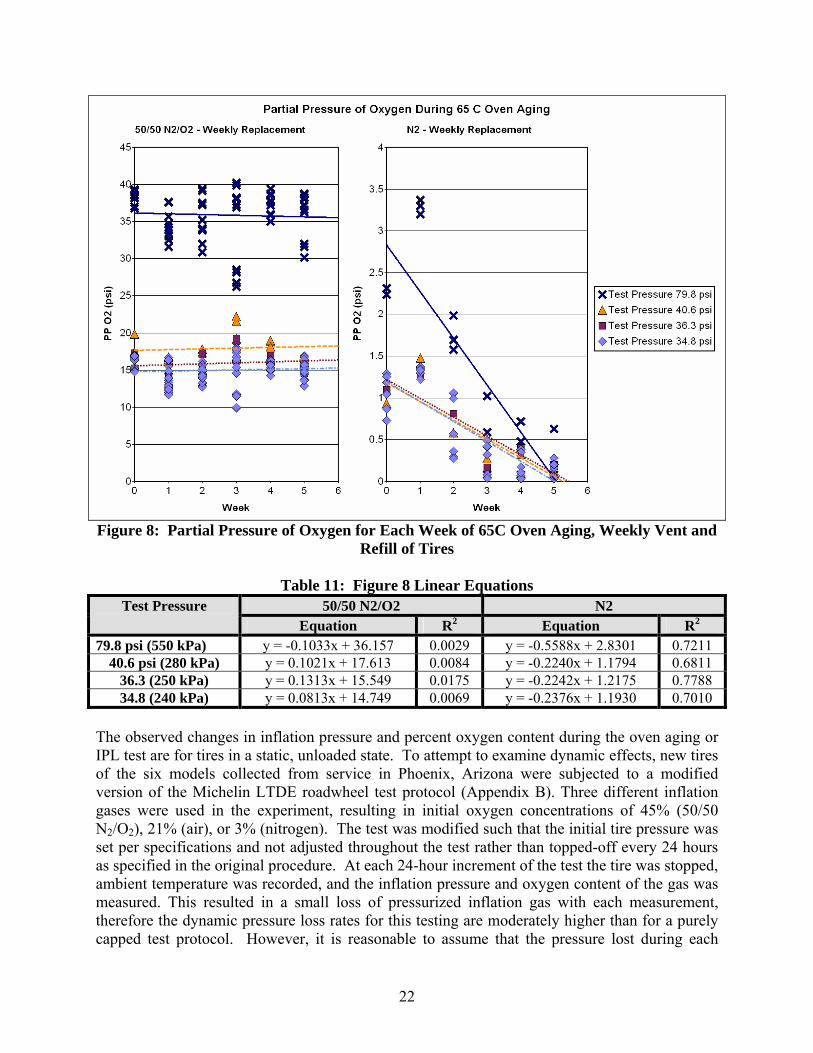
Figure 8: Partial Pressure of Oxygen for Each Week of 65C Oven Aging, Weekly Vent and Refill of Tires
Table 11: Figure 8 Linear Equations
50/50 N2/O2 N2 Test Pressure Equation R2 Equation R2
79.8 psi (550 kPa) y = -0.1033x + 36.157 0.0029 y = -0.5588x + 2.8301 0.7211 40.6 psi (280 kPa) y = 0.1021x + 17.613 0.0084 y = -0.2240x + 1.1794 0.6811
36.3 (250 kPa) y = 0.1313x + 15.549 0.0175 y = -0.2242x + 1.2175 0.7788 34.8 (240 kPa) y = 0.0813x + 14.749 0.0069 y = -0.2376x + 1.1930 0.7010
The observed changes in inflation pressure and percent oxygen content during the oven aging or IPL test are for tires in a static, unloaded state. To attempt to examine dynamic effects, new tires of the six models collected from service in Phoenix, Arizona were subjected to a modified version of the Michelin LTDE roadwheel test protocol (Appendix B). Three different inflation gases were used in the experiment, resulting in initial oxygen concentrations of 45% (50/50 N2/O2), 21% (air), or 3% (nitrogen). The test was modified such that the initial tire pressure was set per specifications and not adjusted throughout the test rather than topped-off every 24 hours as specified in the original procedure. At each 24-hour increment of the test the tire was stopped, ambient temperature was recorded, and the inflation pressure and oxygen content of the gas was measured. This resulted in a small loss of pressurized inflation gas with each measurement, therefore the dynamic pressure loss rates for this testing are moderately higher than for a purely capped test protocol. However, it is reasonable to assume that the pressure lost during each
22

measurement at the 24-hour mark was roughly the same regardless of the inflation gas, and therefore will be reasonably predictive of loss rates for the different gas mixtures experiencing similar dynamic, loaded tire conditions. The durability results of the LTDE test are shown in Table 12. Once again, the small sample sizes and short duration of the test (relative to years of intended vehicle service) produced no useful trends in differentiating the effects of the various inflation gases on tire durability.
Table 12: Modified LTDE Test Results Tire Type
Barcode Inflation Gas
Time to Failure, hours
Notes on Tire Failure Type
B 1014 50-50 . Test interrupted @ 213 hours - Holiday shut-down B 1009 50-50 622.5 Tread Shoulder Separation OSS, Belt Edge Exposed
OSS, Bead Damage OSS. B 1010 AIR . Test interrupted @ 213 hours - Holiday shut-down B 1011 AIR 431.9 Tread Shoulder Chunking with Belts Exposed OSS,
Belt Edge Separation OSS, Innerliner Split. B 1012 N2 . Test interrupted @ 213 hours - Holiday shut-down B 1013 N2 349.5 Tread Shoulder Cracking OSS. C 1511 50-50 . Test interrupted @ 332 hours - Holiday shut-down C 1510 50-50 536 Innerliner Separation, Sidewall Rupture SS, Total Air
Loss. C 1509 50-50 204.3 Sidewall Cracking SS and OSS. C 1512 AIR 629.8 Sidewall Rupture SS, Total Air Loss. C 1514 N2 526.5 Bead Turn-up Cracking SS, Bead Damage SS. D 1109 50-50 354.9 Bead Turn-up Cracking OSS. E 1350 50-50 494.2 Sidewall Cracking, Bead Damage SS. E 1309 50-50 473.4 Bead Turn-up Cracking SS, Tread Shoulder Pocket
Cracking SS and OSS. E 1370 AIR 574.8 Tread Shoulder Chunking with Belts Exposed, Belt
Edge Loosened, Bead Turn-up Cracking, Tread Shoulder Pocket Cracking
E 1313 N2 507.9 Tread Shoulder Chunking with Belts Exposed SS, Tread Shoulder Pocket Cracking SS and OSS, Bead Damage SS and OSS
H 1209 50-50 97.5 Sidewall Rupture with Delamination SS, Innerliner Separation, Total Air Loss.
H 1210 50-50 55.8 Sidewall Rupture with Delamination SS x 2. H 1214 AIR 731.2 Sidewall Rupture with Delamination SS. H 1212 AIR 515.2 Bead Turn-up Cracking OSS, Bead Damage OSS. L 1409 50-50 667.8 Sidewall Cracking OSS, Innerliner Separation. L 1411 AIR 717.5 Bead Turn-up Cracking SS, Total Air Loss. L 1413 N2 647.1 Sidewall Cracking OSS.
Displayed in Figure 9 is the inflation pressure, corrected for temperature, for tire types “B”, “C”, “E”, or “L” that were subjected up to 700 hours of roadwheel testing with all three gases
23

(includes pressure losses for pressure and percent oxygen readings taken every 24-hours). The initial cold pressure data point for each tire at 0 hrs is not used, only the hot pressures from the 4 hour reading and onward. For comparison, it is estimated that the average tire in the US experiences approximately 394 hours of use per year.5 The average time to removal for the 18 tires of the four tire models test was 464 hours, the equivalent of a little over one year of rolling service. Tires in the modified LTDE test results were observed to have slightly less pressure loss for nitrogen versus air inflation, and slightly less pressure loss for air versus 50/50 inflation. Based on the slopes of the linear regression lines, which have essentially the same y-intercepts, the nitrogen inflated tires lost inflation pressure at only 63% the rate of air inflated tires during the dynamic roadwheel testing. Additionally, the 50/50 inflated tires lost inflation pressure at 125% percent the rate of the air inflated tires. Therefore it is expected that the lower the percentage of oxygen in the tire inflation gas, the slower the rate of pressure loss during dynamic on-vehicle use.
Figure 9: Changes in the Inflation Pressure during Capped-Inflation Roadwheel Testing
5 USDOT Bureau of Transportation Statistics, “Highlights of the 2001 National Household Travel Survey”: 29.1 miles per day per person / 55.1 minutes per day of travel per person = average speed of 31.7 mph. 12,497 miles per year vehicle use / 31.7 mph = 394 hours per year of vehicle use. http://www.bts.gov/publications/highlights_of_the_2001_national_household_travel_survey/html/section_02.html, and Highway Statistics 2004, FHWA, Table VM-1, http://www.fhwa.dot.gov/policy/ohim/hs04/htm/vm1.htm
24
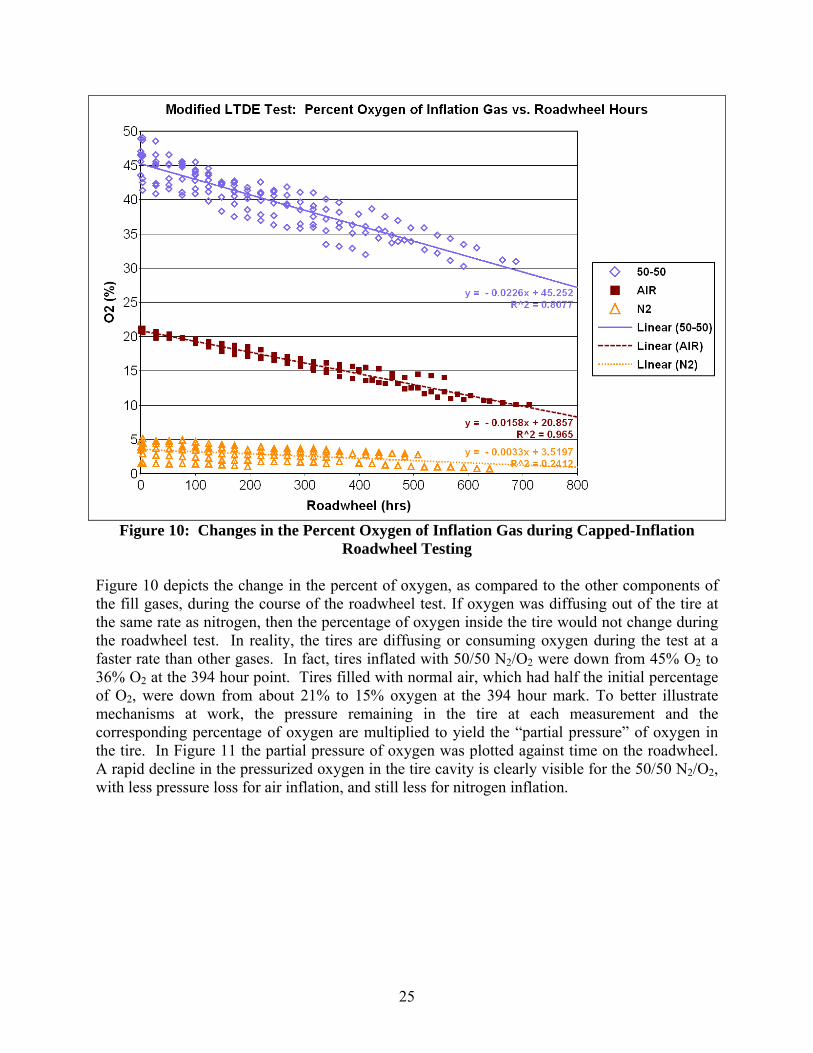
Figure 10: Changes in the Percent Oxygen of Inflation Gas during Capped-Inflation Roadwheel Testing
Figure 10 depicts the change in the percent of oxygen, as compared to the other components of the fill gases, during the course of the roadwheel test. If oxygen was diffusing out of the tire at the same rate as nitrogen, then the percentage of oxygen inside the tire would not change during the roadwheel test. In reality, the tires are diffusing or consuming oxygen during the test at a faster rate than other gases. In fact, tires inflated with 50/50 N2/O2 were down from 45% O2 to 36% O2 at the 394 hour point. Tires filled with normal air, which had half the initial percentage of O2, were down from about 21% to 15% oxygen at the 394 hour mark. To better illustrate mechanisms at work, the pressure remaining in the tire at each measurement and the corresponding percentage of oxygen are multiplied to yield the “partial pressure” of oxygen in the tire. In Figure 11 the partial pressure of oxygen was plotted against time on the roadwheel. A rapid decline in the pressurized oxygen in the tire cavity is clearly visible for the 50/50 N2/O2, with less pressure loss for air inflation, and still less for nitrogen inflation.
25
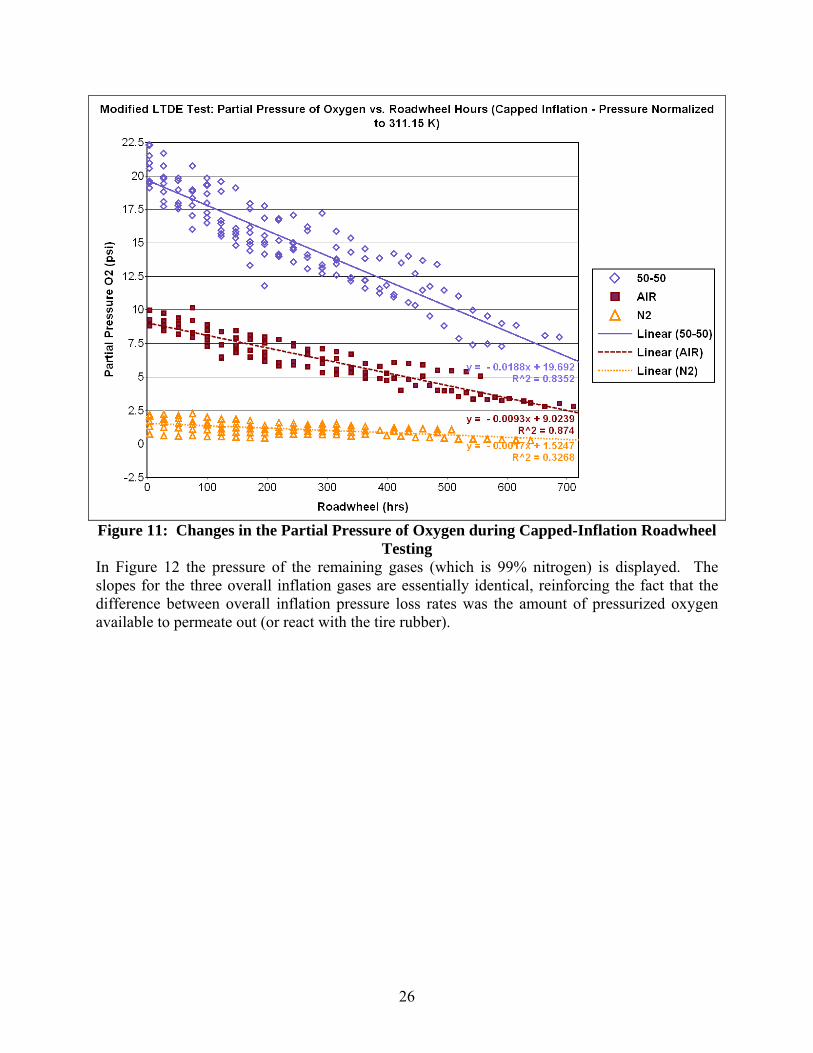
Figure 11: Changes in the Partial Pressure of Oxygen during Capped-Inflation Roadwheel Testing
In Figure 12 the pressure of the remaining gases (which is 99% nitrogen) is displayed. The slopes for the three overall inflation gases are essentially identical, reinforcing the fact that the difference between overall inflation pressure loss rates was the amount of pressurized oxygen available to permeate out (or react with the tire rubber).
26

Figure 12: Changes in the Partial Pressure of Non-Oxygen Gas during Capped-Inflation Roadwheel Testing
The oxygen permeating through the tire is soluble in most of the tire rubber compounds and can react with internal tire components causing degradation even in small amounts. For instance, Hamed states that “A concentration of 1 to 2% of reacted oxygen is normally sufficient to cause severe deterioration in an elastomer”[21]. In Phase 1 of the Tire Aging Test Development Project, tires of six different models were retrieved from on-road service in Phoenix, Arizona USA and sent for an analysis of material properties [24]. Among the various material tests conducted was a measurement of the level of fixed oxygen in the skim rubber (at centerline of the rubber between the belts) and wedge rubber (rubber between the belt edges). These two components are in the belt-package region, which is the critical region for light vehicle radial tire durability. In Figure 13, the average levels of fixed oxygen in the skim and wedge rubber of tires collected in Phoenix after an average of 4 years of service (“Phase 1 - Phoenix”) are compared to the averages of new tires of the same models (“Phase 1 - New”). 6 Additionally, in Figure 13 new tires of 10 of the tire models oven aged in Figure 6 of this report were subjected to the same oven aging procedures and sent for materials analysis (“Phase 4 - Oven…”) and compared to new versions of the same models (“Phase 4 - New”). As can be seen in the figure, the level of fixed oxygen absorbed by the internal belt-package rubber after an average of 4 years of service
6 Fixed oxygen results for “Phase 1 - Phoenix” tires are based on a total of 21 tires, representing six different tire models, with ages of 2.51 to 6.1 years old at the time of collection. “Phase 1 - New” tire results are based on 30 tires, representing the same six tire models, all purchased new.
27
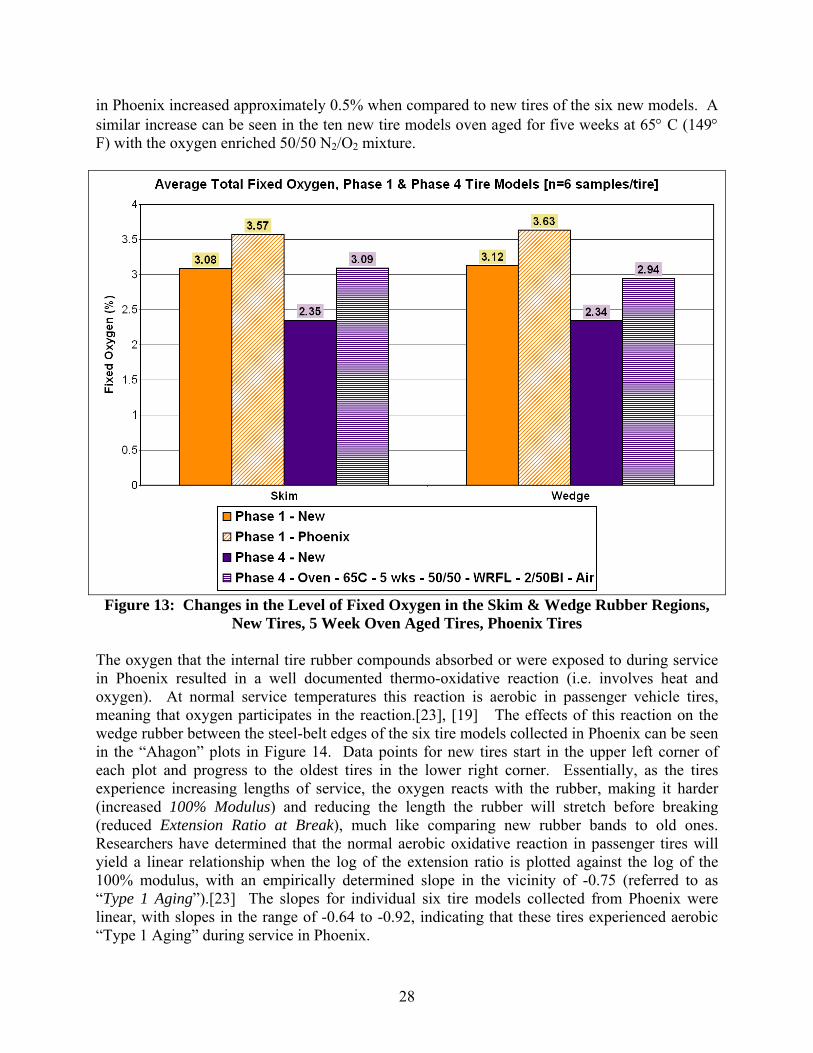
in Phoenix increased approximately 0.5% when compared to new tires of the six new models. A similar increase can be seen in the ten new tire models oven aged for five weeks at 65° C (149° F) with the oxygen enriched 50/50 N2/O2 mixture.
Figure 13: Changes in the Level of Fixed Oxygen in the Skim & Wedge Rubber Regions, New Tires, 5 Week Oven Aged Tires, Phoenix Tires
The oxygen that the internal tire rubber compounds absorbed or were exposed to during service in Phoenix resulted in a well documented thermo-oxidative reaction (i.e. involves heat and oxygen). At normal service temperatures this reaction is aerobic in passenger vehicle tires, meaning that oxygen participates in the reaction.[23], [19] The effects of this reaction on the wedge rubber between the steel-belt edges of the six tire models collected in Phoenix can be seen in the “Ahagon” plots in Figure 14. Data points for new tires start in the upper left corner of each plot and progress to the oldest tires in the lower right corner. Essentially, as the tires experience increasing lengths of service, the oxygen reacts with the rubber, making it harder (increased 100% Modulus) and reducing the length the rubber will stretch before breaking (reduced Extension Ratio at Break), much like comparing new rubber bands to old ones. Researchers have determined that the normal aerobic oxidative reaction in passenger tires will yield a linear relationship when the log of the extension ratio is plotted against the log of the 100% modulus, with an empirically determined slope in the vicinity of -0.75 (referred to as “Type 1 Aging”).[23] The slopes for individual six tire models collected from Phoenix were linear, with slopes in the range of -0.64 to -0.92, indicating that these tires experienced aerobic “Type 1 Aging” during service in Phoenix.
28
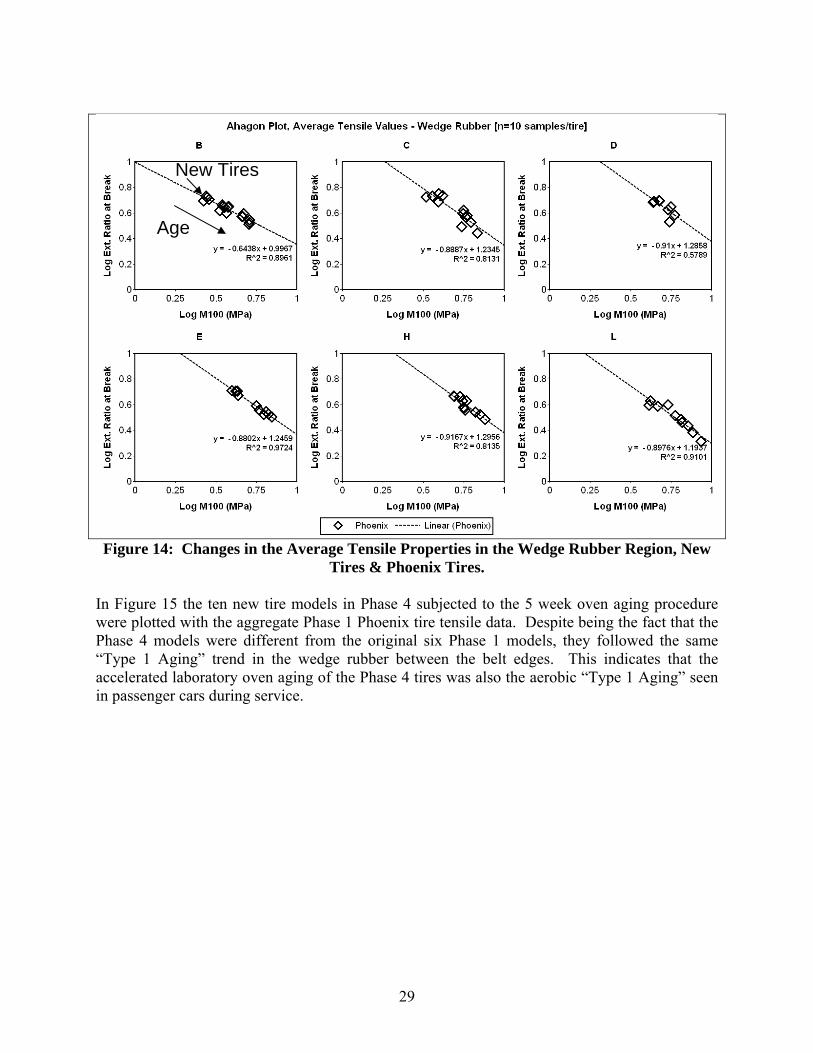
Figure 14: Changes in the Average Tensile Properties in the Wedge Rubber Region, New Tires & Phoenix Tires.
Age
New Tires
In Figure 15 the ten new tire models in Phase 4 subjected to the 5 week oven aging procedure were plotted with the aggregate Phase 1 Phoenix tire tensile data. Despite being the fact that the Phase 4 models were different from the original six Phase 1 models, they followed the same “Type 1 Aging” trend in the wedge rubber between the belt edges. This indicates that the accelerated laboratory oven aging of the Phase 4 tires was also the aerobic “Type 1 Aging” seen in passenger cars during service.
29

Figure 15: Changes in the Average Tensile Properties in the Wedge Rubber Region, New Tires, Phoenix Tires, & 5 Week Oven Aged Tires
The effects of aerobic thermo-oxidative reaction on average inter-belt peel strength in the skim and wedge regions of the belt package can be seen in Figure 16. The average inter-belt peel strength in the skim and wedge rubber regions decreased approximately 21 to 28 lbf/in after an average of 4 years of service or following the 5 week oven aging process. This reduction in peel adhesion between the two steel belts can also be replicated by the laboratory oven aging procedure through acceleration of the oxidative process. It must be noted that this is a description of the average effects for property changes. The properties of individual tire components change at different rates depending on service and different tire types and constructions age at different rates [25].
30
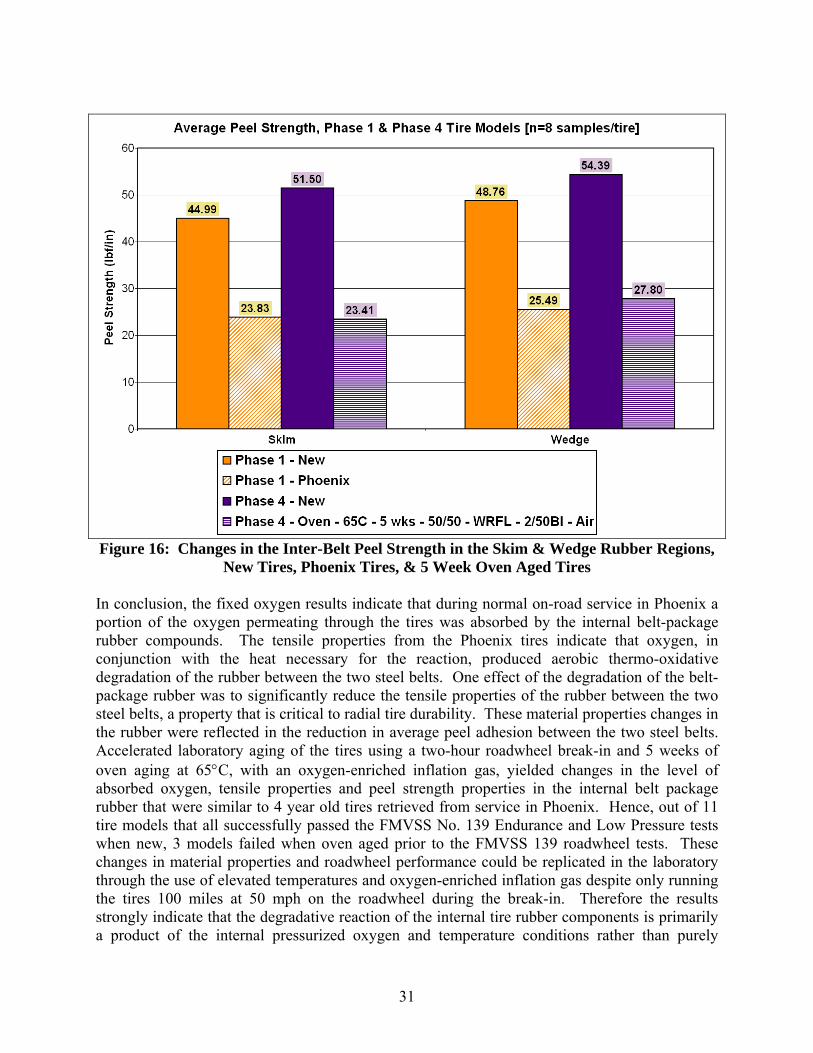
Figure 16: Changes in the Inter-Belt Peel Strength in the Skim & Wedge Rubber Regions, New Tires, Phoenix Tires, & 5 Week Oven Aged Tires
In conclusion, the fixed oxygen results indicate that during normal on-road service in Phoenix a portion of the oxygen permeating through the tires was absorbed by the internal belt-package rubber compounds. The tensile properties from the Phoenix tires indicate that oxygen, in conjunction with the heat necessary for the reaction, produced aerobic thermo-oxidative degradation of the rubber between the two steel belts. One effect of the degradation of the belt-package rubber was to significantly reduce the tensile properties of the rubber between the two steel belts, a property that is critical to radial tire durability. These material properties changes in the rubber were reflected in the reduction in average peel adhesion between the two steel belts. Accelerated laboratory aging of the tires using a two-hour roadwheel break-in and 5 weeks of oven aging at 65°C, with an oxygen-enriched inflation gas, yielded changes in the level of absorbed oxygen, tensile properties and peel strength properties in the internal belt package rubber that were similar to 4 year old tires retrieved from service in Phoenix. Hence, out of 11 tire models that all successfully passed the FMVSS No. 139 Endurance and Low Pressure tests when new, 3 models failed when oven aged prior to the FMVSS 139 roadwheel tests. These changes in material properties and roadwheel performance could be replicated in the laboratory through the use of elevated temperatures and oxygen-enriched inflation gas despite only running the tires 100 miles at 50 mph on the roadwheel during the break-in. Therefore the results strongly indicate that the degradative reaction of the internal tire rubber components is primarily a product of the internal pressurized oxygen and temperature conditions rather than purely
31
mechanical fatigue of the tire structure. Thus, inflating tires with nitrogen gas, thereby lowering the percentage of oxygen in the inflation gas, is one way to lessen the availability of oxygen to react with and degrade the internal components of the tire.
Summary: Though the study was not specifically designed around evaluating the effects of nitrogen inflation, a sufficient number of tires with different inflation gases were tested in the various test programs to yield a number of statistically significant results. NHTSA testing of tires has confirmed that using nitrogen as an inflation gas in place of air slows the static IPL of the tire significantly. In the 90-day static room temperature test, the inflation pressure loss rate for tires inflated with nitrogen was approximately two-thirds of the loss rate of tires inflated with air. Dynamic testing on a roadwheel test shows the differences between the diffusion rate of air vs. nitrogen vs. 50/50 N2/O2 are maintained at higher temperatures and dynamic conditions (i.e., simulating rolling operation on a vehicle). The decrease in permeability for nitrogen gas was observed to be independent of tire innerliner composition and thickness, thus applicable to all tire types studied. Inflating with nitrogen in place of air had little or no direct effect on tire rolling resistance performance. It should be noted that inflation with nitrogen merely slows the rate of diffusion of gas from the tire and is not a substitute for regularly maintaining tire pressure. Limited static inflation pressure loss rate testing with a 50%/50% blend of nitrogen/oxygen inflation gas produced mixed results. The IPL for all tires began significantly higher, but dropped by the end of the 90-day test period to approximately the loss rate of air, which contains only 21% oxygen. Analysis of the gas content at the end of the test period confirmed that the rate of oxygen loss from the tire was approximately 4 times the rate of nitrogen loss averaged over the 90-day period. The reasons for the drop in IPL over time for the high oxygen content tires are unknown. Seventy-six tires from nineteen vehicles were measured for tire pressure and oxygen concentration. For the forty tires with the DOT code recorded, the average age of the tires at the time of inspection was 2.8 years with tires ranging for 0.6 to 6.8 years old. The average inflation pressure of the tires was 29.1 psi. The average percentage of oxygen measured in the inflation gas of field tires (on-vehicle tires) was 15.0%, and most values were significantly less than the original air inflation level of 20.9%. This suggests that the partial pressure of oxygen in the tire decreased significantly during service. Probably there are two contributing factors: first, oxygen has a higher permeation rate than nitrogen, and second, oxygen is consumed. Using the estimate of 0.041%/month for each percentage reduction in O2 percentage and the average IPL loss of 2.13%/month for the tires studied in the lab, the calculated IPL of these field tires would be reduced by approximately 11% (0.24%/month) due to the change in inflation gas composition. In other words, if a normally maintained in-service tire is not punctured or deflated, the faster diffusion/consumption of oxygen relative to the nitrogen content of the inflation gas results in an increase in the percentage of nitrogen gas from the original 78% to as high as the 91% observed, thus lowering the effective rate of inflation pressure loss. This means that the average loss rate for tires in the field may be considerably different than that measured using freshly inflated new tires. The benefits of nitrogen inflation on pressure retention of tires in
32
service may be overstated by testing with new, freshly inflated tires in a laboratory test. Based on this study, the mean advantage in IPL for tires in service will be approximately 25%. The results for 23 tires subjected to hundreds of hours of laboratory roadwheel aging with air, 50/50 N2/O2, or nitrogen inflation were inconclusive. Results did not indicate a correlation between the inflation gas used and the time to failure in this particular roadwheel durability test. The results for 44 tires subjected to oven aging for 5 weeks at 65°C, followed by the 35.5 hour FMVSS No. 139 Endurance and Low Pressure test sequence, showed the oven and roadwheel test conditions to be sufficiently severe to differentiate between 50/50 N2/O2 inflation and the other two inflation gases, air and nitrogen. However, the oven and roadwheel test conditions were not severe enough to differentiate between air and nitrogen inflation. The oxygen concentration measurement data from both the accelerated dynamic roadwheel aging and static oven aging also showed a much more rapid diffusion/reaction of the oxygen portion of the inflation gas when compared to the nitrogen gas. An analysis of common inter-belt rubber material properties from tires retrieved after an average of 4 years of on-vehicle service in Phoenix, Arizona demonstrated that a portion of the oxygen permeating through the tire is absorbed and reacts with the internal tire rubber compounds, which eventually leads to degradation of inter-belt adhesion. Accelerated laboratory aging of the tires using a two-hour roadwheel break-in and 5 weeks of oven aging at 65° C with an oxygen-enriched inflation gas yielded changes in the level of absorbed oxygen, tensile properties and peel strength properties in the internal belt package rubber that were similar to 4 year old tires retrieved from service. Hence, out of 11 tire models that successfully passed the FMVSS No. 139 Endurance and Low Pressure tests when new, 3 models failed when oven aged prior to the roadwheel test. These changes in material properties and roadwheel performance could be replicated in the laboratory through the use of elevated temperatures and oxygen-enriched inflation gas despite only running the tires 100 miles at 50 mph on the roadwheel during the break-in. Therefore the results strongly indicate that the degradative reaction of the internal tire rubber components is a product of the internal pressurized oxygen and temperature conditions rather than from purely mechanical fatigue of the tire structure. Thus lowering the percentage of oxygen in the inflation gas may be one way to lessen the availability of oxygen to react with and degrade the internal components of the tire. A primary positive result expected from nitrogen inflation may to produce more uniformly maintained tire pressure over time, which would help maintain tire performance properties such as handling, rolling resistance and durability. As seen from the effect of liner composition on IPL, this may be more important for some tire models. Also, there is a strong scientific basis for concluding that reducing the oxygen content of the inflation gas will reduce the internal thermo-oxidative degradation of the tire, which may aid in retention of durability.
33

References: [1] http://www-nrd.nhtsa.dot.gov/pdf/nrd-01/NRDmtgs/2001/0701TirePressure.pdf “Tire Pressure Special Study” (July, 26, 2001) [2] RMA Tire Information Service Bulletin TISB Vol. 44, No. 1 “Using Nitrogen to Inflate Passenger and Light Truck Tires in Normal Service Applications (2006) [3] http://www.nitrogendirect.com/N2Info.htm (2005) [4] L. Sabino, G. Naldi and P. Pelloni “Tyres Inflation with De-Oxigenated (sic) Air”, University of Bologna (2000). [5] L. R. Sperberg, “Tire Durability with Nitrogen Inflation”, Rubber Age 99 (11), 83 (1967) [6] Lawrence R. Sperberg, Million Mile Truck Tires – Available Today, Stronger Longer Tires of El Paso, Inc. El Paso, TX 1985 [7] Tokita, N. et al., Uniroyal, Inc; Long Term Durability of Tires, International Rubber Conference, Kyoto, Japan, October 1985 [8] Walenga, Guy, Bridgestone/Firestone, Nitrogen Inflation for Truck Tires, Clemson Tire Conference, Clemson University, 11 Mar. 2004. [9] Fisher, Peggy, A New Gas for the New Millenium? , Tire Business, 7/2000 [10] Should You Stop Putting Air in Your Tires? Real Questions, Real Answers, Bridgestone/Firestone North America, LLC, Vol. 8, Issue 3, 2003 [11] http://blogs.consumerreports.org/cars/2007/10/tires-nitrogen-.html [12] ExxonMobil Chemical - Nitrogen Inflation of Tires, 08/28/2006, Docket Document ID: NHTSA-2005-21276-23, U.S. Federal Docket Management System (FDMS) at http://www.regulations.gov [13] TRB Special Report 286, “Tires and Passenger Vehicle Fuel Economy”, National Research Council, (2006) http://www.nap.edu/catalog.php?record_id=11620 [14] “Research Report to Congress on Tire Aging”, DOT HS 810 799, August 2007, Docket Document ID: NHTSA-2005-21276-42, U.S. Federal Docket Management System (FDMS) at http://www.regulations.gov [15] Baldwin, J.M., Bauer, David R., and Ellwood, Kevin R., Ford Motor Company, “Effects of Nitrogen Inflation on Tire Aging and Performance”, Rubber & Plastics News, Vol. 34, No. 4, pp 14-19, 2004. [16] ASTM F09.30, Aged Tire Durability Task Group, Status Update, NHTSA Briefing July 24, 2007, Docket Document ID: NHTSA-2005-21276-41, U.S. Federal Docket Management System (FDMS) at http://www.regulations.gov [17] A. Ahagon, M. Kida, H. Kaidou, Rubb. Chem. Technol., 63, 683 (1990) [18] M. Cohen, "How Tires Age and How to Characterize Aging in Tires" to International Tire Exhibition and Conference (2004) [19] D. R. Bauer, J. M. Baldwin, K. R. Ellwood, Ford Motor Company, Docket Document ID: NHTSA-2005-21276-11, U.S. Federal Docket Management System (FDMS) at http://www.regulations.gov “Correlation of Rubber Properties between Field Aged Tires and Laboratory Aged Tires”, Rubb. Chem. Technol., 78, [20] L. Evans, S. Feve and J. MacIsaac “Evaluation of New and Aged Tires by Accelerated Service Life Tests: Comparison Using a Stepped-Up-Load and a Stepped-Up-Speed Roadwheel Test”, to The Tire Society Conference, September, 2007.
34

35
[21] Engineering with Rubber, 2nd Edition, Hanser 2001, Chapter 2, Materials and Compounds, page 26, Gary R. Hamed. [22] Docket: NHTSA-2005-21276, U.S. Federal Docket Management System (FDMS) at http://www.regulations.gov [23] H. Kaidou, A. Ahagon, Rubb. Chem. Technol., 63, 698 (1990) [24] L. Evans, S. Feve and J. MacIsaac “NHTSA Tire Aging Test Development Project Phase 1 – Phoenix, Arizona Tire Study, Report 2: Peel Adhesion of Light Vehicle Tires as Purchased New and After Retrieval for Service in Phoenix Arizona USA. [25] J. R. Shelton, Rubb. Chem. Technol., 30, 1251 (1957).
Acknowledgements: The authors wish to thank James A. Popio, Ph.D. of Smithers Scientific Services, Inc. for valuable technical contributions. Testing was performed by:
Smithers Scientific Services, Inc. 1150 North Freedom Street Ravenna, Ohio 44266
Akron Rubber Development Laboratory, Inc. 2887 Gilchrist Rd. Akron, Ohio 44305 Standard Testing Laboratories 1845 Harsh Avenue S.E. Massillon, Ohio 44648

Appendix A: Tire Types Tire Type
Manufacturer Brand Name Tire Model Tread Design
Size Load Range
Speed Rating
Tread Wear Grade
Traction Grade
Temp. Grade
Avg. Weight
(lbs) B Michelin BFGoodrich Touring T/A SR4 All
Season P195/65R15 089 S 540 A B
B1 Bridgestone Bridgestone Blizzak DM-Z3 Winter 235/75R16 105 Q - - - 31.37 B7 Bridgestone Firestone Wilderness AT I All
Season P265/75R16 114 S 440 B B 40.76
B8 Bridgestone Bridgestone B450 All Season
P205/65R15 092 S 360 B B 19.95
B9 Bridgestone Bridgestone Duravis M773 II All Season
LT265/75R16 123 (E) - - - - 48
C Goodyear Goodyear Eagle GA All Season
P205/65R15 092 V 300 A A
C7 Continental Continental Contitrac TR All Season
P265/70R17 113 S 520 A B 40.93
C8 Continental General Ameri G4S All Season
P205/65R15 092 T 520 A B 20.31
D Michelin Michelin LTX M/S All Season
P235/75R15XL 108 S 440 A B
D6 Goodyear Mohave [Discount Tire]
RS All Season
P205/65R15 092 R 360 A B 19.11
D7 Cooper Cooper Discoverer ST-C All Season
LT235/85R16 120 (E) N - - - 44.42
D8 Cooper Cooper Discoverer ST-C All Season
LT245/75R16 120 (E) N - - - 44.85
E Bridgestone Firestone Wilderness AT I All Season
P265/75R16 114 S 440 B B
G1 Goodyear Goodyear Ultra Grip Winter P235/75R15XL 108 S - - - 32.62 G11 Goodyear Goodyear Integrity All
Season P225/60R17 098 S 460 A B 24.46
G8 Goodyear Goodyear Integrity All Season
225/60R16 098 S 460 A B 22.9
H Goodyear Pathfinder [Discount Tire]
ATR A/S All Season
LT245/75R16 120 (E) Q - - -
H3 Hankook Hankook DynaPro AS All Season
LT245/75R16 120 (E) - - - - 42.91
L Continental General Grabber ST All Season
255/65R16 109 H 360 B A 31.9
M1 Michelin Michelin Cross Terrain SUV
All Season
P265/75R16 114 S 700 A B 39.13
36
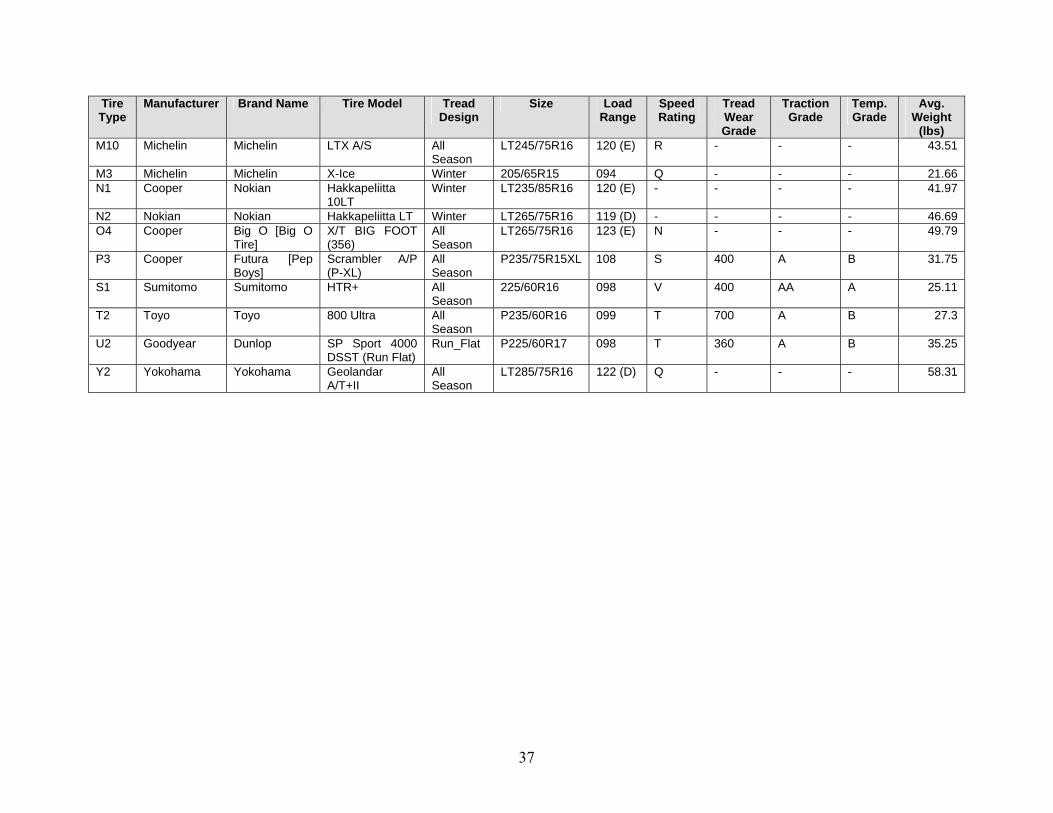
37
Tire Type
Manufacturer Brand Name Tire Model Tread Design
Size Load Range
Speed Rating
Tread Wear Grade
Traction Grade
Temp. Grade
Avg. Weight
(lbs) M10 Michelin Michelin LTX A/S All
Season LT245/75R16 120 (E) R - - - 43.51
M3 Michelin Michelin X-Ice Winter 205/65R15 094 Q - - - 21.66 N1 Cooper Nokian Hakkapeliitta
10LT Winter LT235/85R16 120 (E) - - - - 41.97
N2 Nokian Nokian Hakkapeliitta LT Winter LT265/75R16 119 (D) - - - - 46.69 O4 Cooper Big O [Big O
Tire] X/T BIG FOOT (356)
All Season
LT265/75R16 123 (E) N - - - 49.79
P3 Cooper Futura [Pep Boys]
Scrambler A/P (P-XL)
All Season
P235/75R15XL 108 S 400 A B 31.75
S1 Sumitomo Sumitomo HTR+ All Season
225/60R16 098 V 400 AA A 25.11
T2 Toyo Toyo 800 Ultra All Season
P235/60R16 099 T 700 A B 27.3
U2 Goodyear Dunlop SP Sport 4000 DSST (Run Flat)
Run_Flat P225/60R17 098 T 360 A B 35.25
Y2 Yokohama Yokohama Geolandar A/T+II
All Season
LT285/75R16 122 (D) Q - - - 58.31
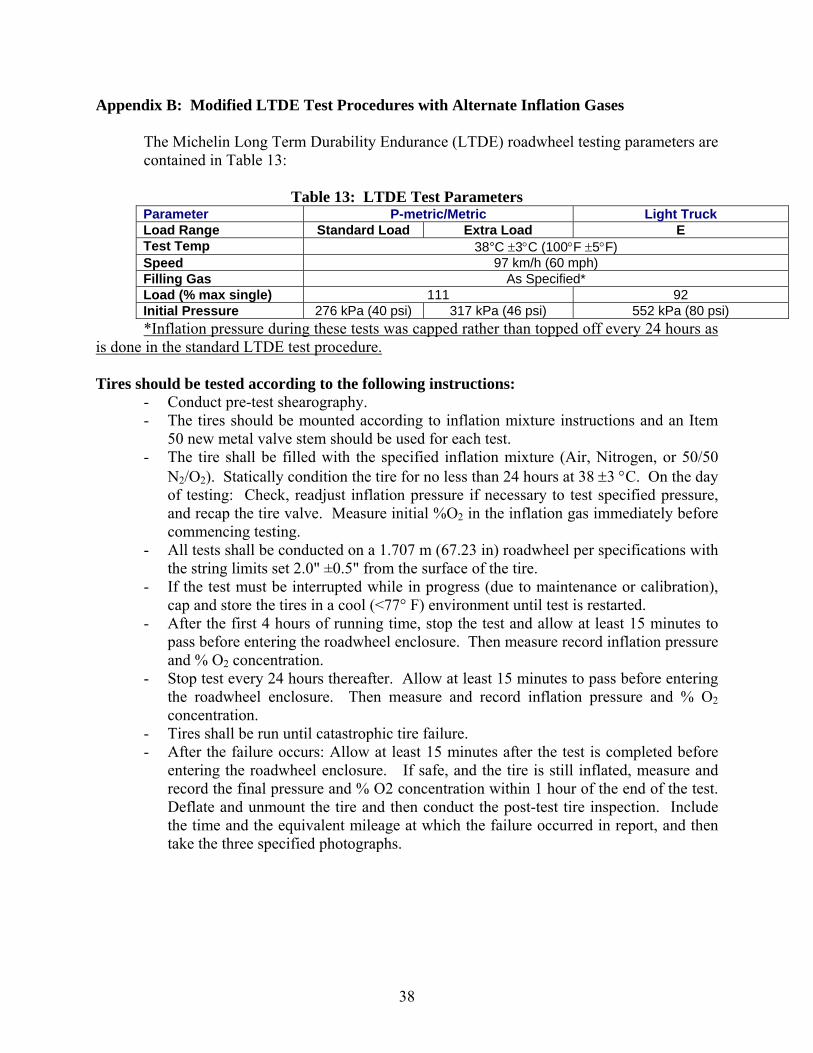
Appendix B: Modified LTDE Test Procedures with Alternate Inflation Gases
The Michelin Long Term Durability Endurance (LTDE) roadwheel testing parameters are contained in Table 13:
Table 13: LTDE Test Parameters Parameter P-metric/Metric Light Truck Load Range Standard Load Extra Load E Test Temp 38°C ±3°C (100°F ±5°F) Speed 97 km/h (60 mph) Filling Gas As Specified* Load (% max single) 111 92 Initial Pressure 276 kPa (40 psi) 317 kPa (46 psi) 552 kPa (80 psi)
*Inflation pressure during these tests was capped rather than topped off every 24 hours as is done in the standard LTDE test procedure. Tires should be tested according to the following instructions:
- Conduct pre-test shearography. - The tires should be mounted according to inflation mixture instructions and an Item
50 new metal valve stem should be used for each test. - The tire shall be filled with the specified inflation mixture (Air, Nitrogen, or 50/50
N2/O2). Statically condition the tire for no less than 24 hours at 38 ±3 °C. On the day of testing: Check, readjust inflation pressure if necessary to test specified pressure, and recap the tire valve. Measure initial %O2 in the inflation gas immediately before commencing testing.
- All tests shall be conducted on a 1.707 m (67.23 in) roadwheel per specifications with the string limits set 2.0" ±0.5" from the surface of the tire.
- If the test must be interrupted while in progress (due to maintenance or calibration), cap and store the tires in a cool (<77° F) environment until test is restarted.
- After the first 4 hours of running time, stop the test and allow at least 15 minutes to pass before entering the roadwheel enclosure. Then measure record inflation pressure and % O2 concentration.
- Stop test every 24 hours thereafter. Allow at least 15 minutes to pass before entering the roadwheel enclosure. Then measure and record inflation pressure and % O2 concentration.
- Tires shall be run until catastrophic tire failure. - After the failure occurs: Allow at least 15 minutes after the test is completed before
entering the roadwheel enclosure. If safe, and the tire is still inflated, measure and record the final pressure and % O2 concentration within 1 hour of the end of the test. Deflate and unmount the tire and then conduct the post-test tire inspection. Include the time and the equivalent mileage at which the failure occurred in report, and then take the three specified photographs.
38
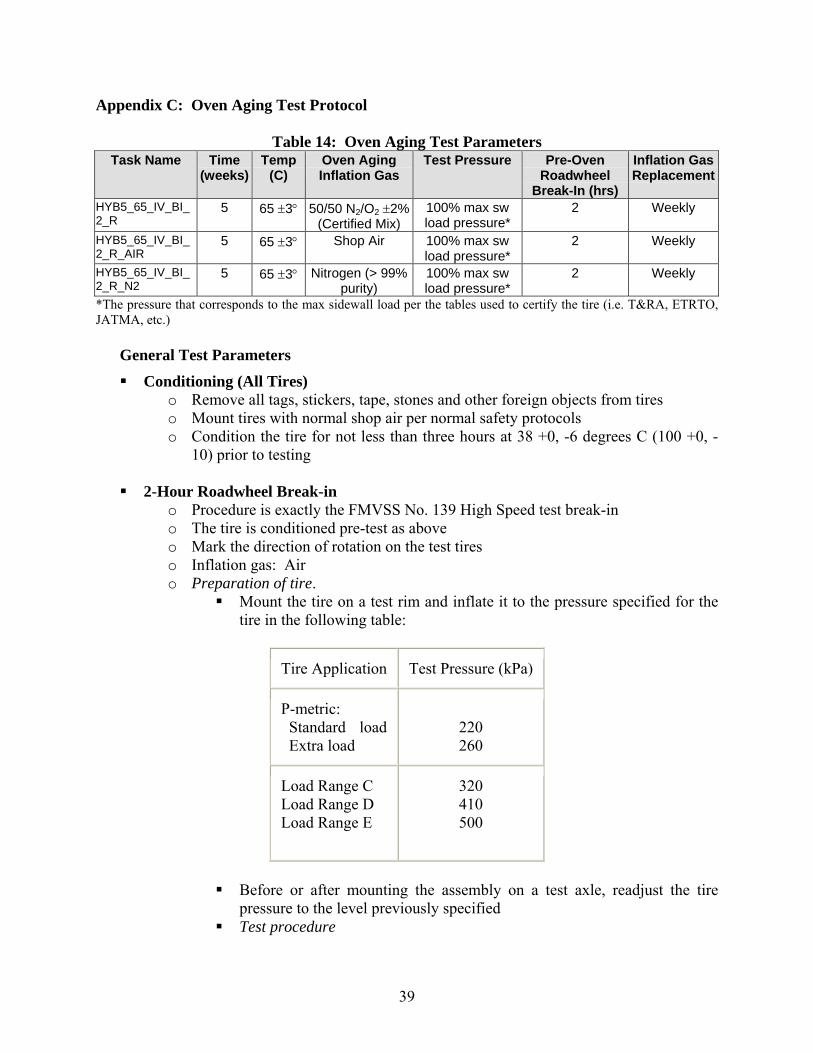
Appendix C: Oven Aging Test Protocol
Table 14: Oven Aging Test Parameters Task Name Time
(weeks) Temp
(C) Oven Aging Inflation Gas
Test Pressure Pre-Oven Roadwheel
Break-In (hrs)
Inflation Gas Replacement
HYB5_65_IV_BI_2_R
5 65 ±3° 50/50 N2/O2 ±2%(Certified Mix)
100% max sw load pressure*
2 Weekly
HYB5_65_IV_BI_2_R_AIR
5 65 ±3° Shop Air 100% max sw load pressure*
2 Weekly
HYB5_65_IV_BI_2_R_N2
5 65 ±3° Nitrogen (> 99% purity)
100% max sw load pressure*
2 Weekly
*The pressure that corresponds to the max sidewall load per the tables used to certify the tire (i.e. T&RA, ETRTO, JATMA, etc.)
General Test Parameters
Conditioning (All Tires) o Remove all tags, stickers, tape, stones and other foreign objects from tires o Mount tires with normal shop air per normal safety protocols o Condition the tire for not less than three hours at 38 +0, -6 degrees C (100 +0, -
10) prior to testing
2-Hour Roadwheel Break-in o Procedure is exactly the FMVSS No. 139 High Speed test break-in o The tire is conditioned pre-test as above o Mark the direction of rotation on the test tires o Inflation gas: Air o Preparation of tire.
Mount the tire on a test rim and inflate it to the pressure specified for the tire in the following table:
Tire Application Test Pressure (kPa)
P-metric: Standard load Extra load
220 260
Load Range C Load Range D Load Range E
320 410 500
Before or after mounting the assembly on a test axle, readjust the tire pressure to the level previously specified
Test procedure
39

• Press the assembly against the outer face of a test drum with a diameter of 1.70 m.
• Apply to the test axle a load equal to 85% of the tire's maximum load carrying capacity.
• Break-in the tire by running it for 2 hours at 80 km/h.
General Oven Aging Test Procedures Mount each test tire per instructions and use a new metal valve stem. When using
the 50/50 mix, observe all specified safety precautions, especially: "The tire is seated with normal air instead of the 50/50 mixture, and then vented to 0 psig before inflation with the 50/50 mixture."
Condition the tire for at least three hours at 38 +0, -6 degrees C (100 +0, -10)
prior to testing.
Age tire in an air-circulating oven per specified oven-aging parameters with either spacers between each wheel, on racks, or suspended so as no tire is subject to the additional weight of more than one tire above it. Allow sufficient room for adequate air flow around each tire.
- Inflation Gas Replacement
o Conducted weekly o Remove tire from oven and allow to cool at 38 +0, -6 degrees C (100 +0, -10)
for at least one hour o Measure and record the pressure and % O2 concentration in the inflation gas
(unit must be accurate to ±0.1%) o Inspect general condition of tire, paying special attention to valve stem and
bead areas o If tire condition is acceptable, remove valve stem core and allow to deflate to
atmospheric pressure o Re-install valve stem core and inflate to test pressure with fresh inflation
mixture o Return tire to the oven for aging as soon as it is practicable; document time
tire entered oven
Once the oven aging period is complete, remove the tire from the oven and allow to cool at 38 +0, -6 degrees C (100 +0, -10) for at least one hour before measuring and recording the pressure and % O2 concentration in the inflation gas.
If the tire passes inspection, send it on to the designated post oven aging testing.
40

Appendix D: FMVSS Title 49: Transportation Part 571.139 Standard No.139 (10-01-04); New pneumatic radial tire for light vehicles. See the standard for details. Test procedures used for testing to requirements of FMVSS No 139, Section S6.3 Endurance and S6.4 Low
Inflation Pressure Performance specifies test conditions used for this study. The test conditions for Section 6.3 (endurance) are:
Passenger Car Tires Standard Load 180 kPa
Extra Load 220 kPa Light Truck (LT)
LR C 260 kPa LR D 340 kPa LR E 410 kPa
Temperature 38°C Speed 120 km/h
85% for 4 hours 90% for 6 hours
Load
100% for 24 hours
o Remove all tags, stickers, tape, stones and other foreign objects from tires o Mount the tire on a test rim and inflate it to the pressure specified for the
tire in the above table o Condition the tire for not less than three hours at 38 +0, -6 degrees C (100
+0, -10) prior to testing o Before or after mounting the assembly on a test axle, readjust the tire
pressure to the level previously specified
Test procedure
• Press the assembly against the outer face of a roadwheel with a diameter of 1.70 m at above speed.
• Apply to the test axle a load per equal to specified % of tire's maximum load carrying capacity
• Continue for the required period of time and adjust load per schedule
• After allowing to cool, inspect tire, take and record posttest pressure, and proceed to Section 6.4 Low Pressure (LP).
The test conditions for Section 6.4 Low Pressure (LP) are:
Passenger Car Tires Pressures Standard Load 140 kPa
Extra Load 160 kPa
41

42
Light Truck (LT) LR C 200 kPa LR D 260 kPa LR E 320 kPa
Temperature 38°C Speed 120 km/h
Load 100% for 1.5 hours
o After completion of the endurance test, deflate the tire to the pressure
specified for that tire in the above table. o Condition the tire for not less than three hours at 38 +0, -6 degrees C (100
+0, -10) prior to testing o Before or after mounting the assembly on a test axle, readjust the tire
pressure to the level previously specified
Test procedure
• Press the assembly against the outer face of a roadwheel with a diameter of 1.70 m at above speed.
• Apply to the test axle a load per equal to 100 % of tire's maximum load carrying capacity
• Continue for the required period of time
Appendix E: Nitrogen Report Data_Final.xls