b.s., chemistry, northern arizona university, 2008
TRANSCRIPT
The Development of Capillary and Microchip Electrophoresis Methods for the Analysis of
Pharmaceuticals in Developing Countries
By
Jessica S. Creamer
B.S., Chemistry, Northern Arizona University, 2008
M.S., Pharmaceutical Chemistry, University of Kansas, 2010
Submitted to the graduate degree program in Pharmaceutical Chemistry and the Graduate
Faculty of the University of Kansas in partial fulfillment of the requirements for the degree of
Doctor of Philosophy.
________________________________
Chairperson – Dr. Susan M. Lunte
________________________________
Dr. Karen J. Nordheden
________________________________
Dr. Teruna J. Siahaan
________________________________
Dr. John F. Stobaugh
________________________________
Dr. Michael Zhuo Wang
Date Defended: May 30th
, 2014

ii
The Dissertation Committee for Jessica S. Creamer
certifies that this is the approved version of the following dissertation:
Capillary and Microchip Electrophoresis Methods for the Analysis of
Pharmaceuticals used in Developing Countries
________________________________
Chairperson Dr. Susan M. Lunte
Date approved:______________________

iii

iv
This dissertation is dedicated to my parents, Will and Cathy Creamer,
for their unwavering love and support.

v

vi
Abstract
Maintaining a consistent supply of pharmaceuticals to developing countries could save millions
of lives per year. One of the major roadblocks in this effort is an abundance of substandard and
counterfeit drugs in the supply chain. To prevent these products from being distributed, improved
methodology and instrumentation for drug screening is needed. In these low-resource areas the
availability of proper funding and laboratory space is limited. To replace the expensive liquid
chromatography and mass spectrometry instrumentation traditionally used for quality control, capillary
electrophoresis (CE) can be used. CE has a low startup cost and, because of the small sample and reagent
volume requirements, the cost per test is kept to a minimum. Additionally, any methodology developed
for CE can be transferred to the miniaturized platform of microchip electrophoresis (ME). ME further
reduces the cost-per-test and provides the potential for a fully portable analytical device that can be used
for on-site analysis. This method is particularly useful for screening pharmaceuticals throughout the many
distribution lines, store houses, and clinics across a large country.
In this dissertation, CE was used to develop methodology for the analysis of the peptide drug
oxytocin (OT). OT is needed in developing countries to prevent death from post-partum hemorrhage. A
major concern regarding the supply chain of peptide-based drugs is the degradation of these products
when then are shipped and stored incorrectly. Several degradation products are produced when OT is
subjected to heat-stress conditions. Deamidation, in particular, produces small molecular changes that
have significant effects on the biological activity of the peptide. Initially, methodology for the separation
and detection of desamino degradation products of OT was developed for CE-UV. OT contains three
potential sites of deamidation, which leads to seven distinct desamino products. The separation was
achieved following an optimization of the background electrolyte to include a pseudostationary phase and
an organic modifier to increase selectivity and resolve the eight structurally similar peptides.
vii
To improve the functionality of the CE assay for OT integrity screening, the next step of was to
further optimize the method for a separation of all of the known degradation products formed under heat-
stressed OT formulations. However, current literature on the degradation of OT does not yet addressed
the degradation of Pitocin pharmaceutical formulations that are prepared in water containing a small
amount of acetic acid, to adjust the pH between 3-5, and 0.5% chlorobutanol as a preservative. To
investigate the effect that CB and CB-like products have on the degradation of OT, LC-UV-MS was used
to monitor the formation of degradation products as a function of time. The preliminary data shows that
CB, and the structurally similar trichloroethanol (TCE), significantly stabilize OT from the heat-stress
degradation. The addition of either of these trichloro species substantially reduces the rate of degradation
observed over a 48 h period at 70 °C. Further work is needed on this project to determine the cause of this
protective effect by performing structural studies of OT in the presence of CB or TCE.
Finally, initial steps were taken towards the development of a low-cost portable ME device. A
significant percentage of small molecule counterfeit drugs are formulated with the wrong amount of
active ingredient. Current portable analytical methods available to monitor the pharmaceutical supply
chain are limited in their quantitative abilities. By coupling ME to conductivity detection, it is possible to
perform quantitative analysis of multiple species simultaneously. Initial experiments to evaluate system
performance were performed using two first-line anti-tuberculosis drugs, ethambutol and isoniazid.

viii
Acknowledgements
Much effort has gone into the work published here and I could not have done it alone.
First and foremost I’d like to acknowledge my advisor, Dr. Susan Lunte, for the six years’
worth of mentoring and guidance. From the very start she has worked with me to create unique
projects which have led to exciting and unexpected research. Despite her busy schedule she never
failed to make time to talk about research or make a much needed cup of Jet Fuel. Through her
tireless efforts I have come into my own as scientist and writer. I cannot thank her enough for always
pushing me to be my best, especially towards the end, when I needed it most.
The KU Pharmaceutical Chemistry Department is an excellent place to learn and this is due
entirely to the efforts of the stellar faculty. In particular I’d like to thank the many teachers I have had
over the years for helping fill my head with a tremendous amount of knowledge and for the solid
foundation on which to build my future.
Nothing would run smoothly without the efforts of the staff. Thank you to Nancy Helm for
all of your help and kindness throughout my time here. Thanks to Gary Weber for all of the work that
you do for our group and for putting up with all of us constantly asking you where Sue was any given
week; I hope that you enjoy your well-earned retirement!
Many thanks to my committee members, Dr. Siahaan, Dr. Stobaugh, Dr. Volkin, and Dr.
Nordheden, who have taken time out of their busy schedules to give spot-on guidance during our
many meetings, and to Dr. Wang for agreeing to be a part of my defense process in Dr. Volkin’s
stead. I am particularly grateful to my readers Dr. Siahaan and Dr. Stobaugh for their thoughtful
feedback during the writing process.

ix
I owe so much to all of the Lunte Lab members, past and present, for their constant support
and camaraderie. You helped me work through so many research problems.
To the people that were in the lab when I joined, Dr. Pradyot Nandi, Dr. Dave Fisher, Dr.
Matt Hulvey, Dr. Courtney Sloan, Dr. Phil Livanec, Dr. Anne Regel and Dr. Tom Linz, thank you for
teaching me what it meant to be a part of the lab. Your hard work and worldly knowledge of BBQ,
bacon, and beer helped me go from vegetarian to meat-lover in just one short year. In particular, I
want to say thanks to Anne and Courtney for being excellent friends, in lab and out. Sharing a cube
in grad school is like being roommates. Thanks for always telling me it was going to be okay, and for
suggesting that we go out to eat when it was clear we needed a break from MRB.
A huge thank you to the rest of my Lunte Lab family, my fellow graduate students Dr. Dulan
Gunasekara, Dr. David Scott, Joe Siegel, Shamal Durayalage, Manjula Wijesinghe, Abdullah Al-
Hossaini, Rachel Saylor, and Nathan Oborny; the numerous, wonderful undergrads Erin Reid, Erin
Evans, Emilie Mainz, Pann Pichetsurnthorn, Derek Jensen, and wine expert Jeff Bauman; and the
host of talented visiting scientists Bruno Lucca, Diogenes Meneses, Richard Piffer, Giuseppe Caruso,
and Dr. Fracassi da Silva that have lent their brains, humor, and insight into the research that we do.
Having you all around has made the countless group meeting and odd hours in lab much more
bearable.
I am especially thankful for the individuals with whom I have worked closely on projects.
Thanks to Nathan Oborny for always stepping up to help me out even when your plate was already
full. Thanks to Fracassi for leaping over the language barrier to teach me how to think outside the
fabrication box. Thanks to Shannon Krauss, the goofball of an REU that I was fortunate enough to
mentor, who helped to initiate the oxytocin project. And of course, thanks to Ryan Grigsby; none of

x
us would be able to function without your constant hard work. How you manage to keep everything
running smoothly when we are trying so hard to break it will always be a mystery.
Thank you to the graduate students at KU for their willingness to share their knowledge and
experience, especially to the friends I made in the classes before me, who seemed way smarter than I
thought I would ever be, particularly Dr. Loren Schieber, Dr. Diana Sperger Davey, Dr. Taryn
Bagby, Talia Martin, Dr. Maria Feeney, Dr. Sarah Pyszczynski, and Dr. Elodie Dempah.
I was tremendously lucky to enter graduate school with my fellow Deuces, Josh Woods, Dr.
Randy Logan, and Dr. Justin Thomas. Together we survived late nights studying and the even later
nights of Rock Band. There is nothing quite like the support you get from the only people that know
exactly what you are going through. Our friendship means the world to me and I could not imagine
doing this without you guys.
Outside of the lab my sanity was kept intact with the help from my many non-science friends
and teammates. From dog park dates, to dance parties, to Ultimate tournaments, and community
dinners, you have bolstered my spirit and given me a reason to get my experiments done early.
I would not be where I am today without my wonderful family. If it’s a balance of nature and
nurture then I lucked out on both. My mom and dad are positive, bright, and caring people that have
always encouraged me to follow whatever path was in front of me. They raised me to be the curious
and dedicated person that I am, and I thank them for all of the advantages they have given me. That
includes my two baby brothers, Nick and Matt, who have been my ridiculous partners in crime for
the last quarter of a century.
And at last, thank you Nicolas Frisby, for loving me through it all. After many nebulous
years in graduate school, we are both finished! Now that the future is wide open, I cannot think of a
better person to have by my side as I figure out what’s next.

xi

xii
Table of Contents
1 Chapter One: Thesis Objective and Chapter Summaries – pg 1
1.1 Introduction – pg 2
1.2 Chapter Summaries – pg 2
1.2.1 Chapter Two – pg 2
1.2.2 Chapter Three – pg 3
1.2.3 Chapter Four – pg 4
1.2.4 Chapter Five – pg 4
1.2.5 Chapter Six – pg 5
2 Chapter Two: Recent Advances in the Analysis of Therapeutic Proteins by Capillary and
Microchip Electrophoresis – pg 7
2.1 Introduction – pg 8
2.2 Techniques – pg 9
2.2.1 Capillary Zone Electrophoresis– pg 9
2.2.1.1 Dynamic coatings – pg 10
2.2.1.2 Static coatings – pg 13
2.2.1.3 Evaluation of capillary coating performance – pg 14
2.2.2 Capillary gel electrophoresis – pg 17
2.2.3 Capillary isoelectric focusing – pg 21
2.2.4 Capillary electrochromatography – pg 26
2.3 Detection methods – pg 31
2.3.1 Spectroscopic detection– pg 31
2.3.2 Mass Spectrometry– pg 32
2.4 Applications – pg 37

xiii
2.4.1 Glycosylation – pg 37
2.4.2 Biosimilars – pg 42
2.5 Microchip electrophoresis – pg 45
2.5.1 Microchip gel electrophoresis – pg 45
2.5.2 Microchip isoelectric focusing – pg 46
2.5.3 Microchip electrophoresis-mass spectrometry – pg 48
2.6 Conclusions and future perspectives – pg 50
2.7 References – pg 51
3 Chapter Three: Capillary Electrophoresis Separation of the Desamino Degradation Products of
Oxytocin– pg 61
3.1 Introduction – pg 62
3.2 Materials and methods – pg 65
3.2.1 Chemicals and reagents – pg 65
3.2.2 Preparation of buffers – pg 65
3.2.2.1 Buffer composition optimization – pg 65
3.2.2.2 Buffer additive optimization – pg 66
3.2.3 Standard preparation – pg 66
3.2.4 Equipment conditions – pg 66
3.2.5 Acid-catalyzed deamidation of oxytocin – pg 67
3.3 Results and discussion – pg 67
3.3.1 Separation optimization– pg 67
3.3.1.1 BGE selection – pg 67
3.3.1.2 CD additives – pg 68
3.3.1.3 Organic modifiers– pg 69
3.3.1.4 Separation voltage – pg 71
xiv
3.3.2 Separation parameters – pg 71
3.3.3 Tracking degradation in heat-stressed oxytocin samples – pg 73
3.4 Concluding remarks – pg 76
3.5 References – pg 78
4 Chapter Four: Investigation into the Effect of Chlorobutanol on the
Stability of Oxytocin– pg 81
4.1 Introduction – pg 82
4.2 Materials and methods – pg 86
4.2.1 Chemicals and reagents – pg 86
4.2.2 Preparation of oxytocin formulations – pg 86
4.2.3 Accelerated degradation studies – pg 88
4.2.4 LC-UV-MS equipment condition – pg 88
4.3 Results and discussion– pg 89
4.3.1 Q1 scan range optimization– pg 89
4.3.2 Effect of formulation buffering capacity on OT degradation– pg 92
4.3.3 Effect of chlorobutanol on OT degradation– pg 95
4.3.4 Effect of chlorobutanol-like species on OT degradation – pg 98
4.3.4.1 Antimicrobial effect– pg 98
4.3.4.2 Alcohol substitution– pg 98
4.3.4.3 Trichloro group– pg 100
4.3.5 Potential rational for increased OT stability in the presence of CB and TCE– pg 103
4.4 Concluding remarks – pg 104
4.5 References – pg 105

xv
5 Chapter Five: Development of Methods for On-site Separation Based Analysis of Small
Molecule Pharmaceuticals for use in Developing Countries – pg 107
5.1 Introduction– pg 108
5.2 Material and methods– pg 114
5.2.1 Chemicals and reagents– pg 114
5.2.2 Background electrolyte preparation– pg 116
5.2.3 Sample preparation– pg 116
5.2.4 Microchip design– pg 117
5.2.4.1 PDMS microchannel fabrication– pg 117
5.2.4.2 Electrode fabrication – pg 117
5.2.4.3 Microchip construction– pg 120
5.2.5 Microchip operation– pg 120
5.2.6 Instrumentation for C4D– pg 120
5.3 Results and discussion – pg 122
5.3.1 Rational for BGE composition– pg 122
5.3.2 ME separation performance for EMB from standards
vs pharmaceutical formulation– pg 128
5.3.3 Analysis of a lab-made counterfeit – pg 130
5.3.4 Identification of an internal standard– pg 130
5.4 Conclusions– pg 135
5.5 References – pg 136
6 Chapter Six: Conclusions and future directions – pg 139
6.1 Conclusions– pg 140
6.1.1 Oxytocin project– pg 140
6.1.2 ME-C4D portable analysis project– pg 142

xvi
6.2 Future Directions– pg 143
6.2.1 CE separation of all oxytocin degradation products– pg 143
6.2.2 Continuing development for on-site ME analysis – pg 143
6.2.2.1 ME-C4D for small molecule analysis – pg 143
6.2.2.2 ME-LIF for protein and peptide drug analysis – pg 145
6.3 References– pg 148

1
Chapter One:
Thesis Objective and Chapter Summaries

2
1.1 Introduction
Both small molecule drugs and biopharmaceuticals are needed around the world to prevent and cure
illness. However, there are significant barriers to the effective global distribution of these products. In
particular, biopharmaceuticals have limited geographical distribution due to the risk of both chemical and
physical degradation when these products are transported in the absence of a cold-chain shipping and
storage. To help support regulatory efforts within developing countries, innovative methodologies for
protein integrity screening that use preexisting inexpensive instrumentation are needed. For small
molecule drugs, the supply chain is threatened by an overabundance of counterfeit products. Counterfeits
are present throughout distribution lines in warehouses, pharmacies, and clinics. Analysis of these
products needs to be able to be performed on-site to detect them prior to administration. To combat this,
the development of new instrumentation and methodologies for portable and high-throughput assessment
of drug quality is necessary.
This dissertation explores the use of capillary electrophoresis (CE) and microchip electrophoresis
(ME) as low-cost analysis techniques for quantitative testing of the integrity of both small molecule drugs
and biopharmaceuticals. The focus of the research described in this dissertation has been the development
of novel methodologies and instrumentation for on-site analysis that can be used in the various
environmental conditions faced in low-resource areas.
1.2 Chapter Summaries
1.2.1 Chapter Two
This chapter is a thorough review of the recent developments and applications of CE-based
separation methods for the characterization of protein and peptide therapeutics. The development of
biopharmaceuticals is an expensive and time-intensive process. Biologics, which have become a multi-
billion dollar industry, are chemically complex products that require constant observation during each
stage of development and production. Post-translational modifications, along with chemical and physical

3
degradation from oxidation, deamidation, and aggregation, can lead to high levels of heterogeneity that
affect drug quality and efficacy.
In particular, this chapter focuses on summarizing research as described in papers accepted for
publication over the in the two-year period between January 2012 and December 2013. The separation
principles and recent technological advances of CE, capillary gel electrophoresis, capillary isoelectric
focusing, capillary electrochromatography and CE-mass spectrometry are discussed, along with exciting
new applications of these techniques that are relevant to pharmaceutical analysis. Also included is a short
summary of recent ME methods to indicate the direction this field is moving with regards to the
development of inexpensive and portable analysis systems for on-site, high-throughput analysis.
1.2.2 Chapter Three
CE-UV can be used for fast qualitative analysis of proteins, and operated in developing countries at
a fraction of the cost of liquid chromatographic methods. In this chapter the development of a rapid CE
method for the separation of oxytocin (OT) from its desamino degradation products is presented. OT is a
critical drug for the treatment of post-partum hemorrhage, the leading cause of maternal death in
developing countries. Under heat-stress conditions OT undergoes deamidation which leads to reduced
therapeutic efficiency. OT has three specific sites of deamidation that leads to the formation of seven
structurally similar peptides.
To achieve a separation of the seven desamino OT peptides, the background electrolyte composition
was optimized to include sulfobutyl ether β-cyclodextrin (SBE) with MeOH as an organic modifier. The
SBE acts as a pseudostationary phase, enhancing the resolution based on affinity between the peptide and
the cyclodextrin. A rapid separation was accomplished using CE-UV (214 nm) on a 50 cm capillary (40
cm to window) that could resolve all eight peptides in less than 13 min. The method was then applied to
monitor the heat-stress degradation products of OT at 70 °C, where all seven desamino species were
observed over a 96 h period.

4
1.2.3 Chapter Four
Chapter four provides the results of a preliminary study investigating the possible protective effects
of chlorobutanol (CB) on OT during heat-stress degradation. CB is added to injectable oxytocin
formulations as an antimicrobial preservative (AP) at 0.5% w/v. Previous studies investigating the
degradation of OT have been performed in the absence of CB. Yet, it has been shown numerous times by
other groups that APs can have a significant effect on protein formulation stability. Prior to the
development of a CE-based method that can separate and detect all of the known degradation products of
OT we first wanted to make sure that the presence of CB did not alter the degradation mechanisms to
produce additional products.
To monitor both the degradation products formed as well as the kinetics, LC-UV-MS was used to
investigate the degradation of OT in presence of CB and CB-like species. The various CB-like species
included structurally similar compounds tert-butol alcohol (TBA), trichloroacetic acid (TCA), and
trichloroethanol (TCE); as well as, benzyl alcohol (BA), which has similar antimicrobial properties to CB.
This preliminary study showed that OT formulations without additives (as well as those containing TBA,
TCA, and BA) degraded quickly and, after 48 h at 70 °C, less than 30% of the parent OT remained in
solution. On the other hand, the OT formulations containing the CB or TCE were much more stable and
more than 70% of the OT was still present after the 48 h at 70 °C. It has been shown that halogenated
alcohols such as TCE can alter the structure of the peptide, which could lead to an increased stability.
However, more work is needed on this project to determine the mechanism for how CB and TCE inhibit
OT degradation.
1.2.4 Chapter Five
This chapter presents a brief review on portable methods for pharmaceutical analysis to transition
the focus of the dissertation towards the work that has been done in our lab to develop a ME device for
small molecule integrity screening. ME is a fast-growing technology that places the separation

5
mechanism of capillary electrophoresis on to a miniaturized platform, significantly decreasing the cost
and size of the supporting instrumentation. Inexpensive and portable technologies are particularly
important for regulation of drugs in developing countries that are working to protect the pharmaceutical
supply chain from counterfeit drugs.
Currently, counterfeit drug detection is performed by a variety of available analysis techniques that
can provide accurate and specific qualitative analysis to confirm active ingredient identity; however, the
quantitative capabilities of these assays is limited. By coupling the ME separation with a simple and
universal detection method, capacitively coupled contactless conductivity detection (C4D), this system is
able to perform quantitative analysis of multiple species simultaneously. This approach is particularly
useful for the analysis of formulations that contain multiple active ingredients, or for the detection of
counterfeit products with large amounts of impurities and contaminants.
This chapter demonstrates the utility of the ME-C4D system for on-site pharmaceutical analysis
using two first-line anti-tuberculosis drugs, ethambutol (EMB) and isoniazid (INH). Both EMB and INH
were separated on-chip using a low-conductivity buffer of 60 mM HEPES, 0.1 mM lactic acid pH 4.0.
The linearity of the method was determined for both drugs over a range of 0.25-5.0 M with R2 values of
greater than 0.997. Further metrics of analytical performance including precision and separation
efficiency for EMB in both samples made from both the standard and tablet formulation are presented.
1.2.5 Chapter Six
Chapter six summarizes the research presented in this dissertation and discusses potential future
directions of both the oxytocin and ME-C4D projects.

6
7
Chapter Two:
Recent advances in the analysis of therapeutic proteins by capillary and microchip
electrophoresis
Published as:
J.S. Creamer, N.J. Oborny, S.M. Lunte, ‘Recent advances in the analysis of therapeutic proteins
by capillary and microchip electrophoresis’, Analytical Methods, 2014, 6 (15), 5427-5449
8
2.1 Introduction
The characterization of protein therapeutics presents a unique analytical challenge due to the inherent
heterogeneity of recombinant protein expression. Even small changes in the manufacturing process can
lead to vastly different active pharmaceutical ingredients. Additionally, numerous physical and chemical
degradation pathways can occur during manufacturing and storage that compromise protein integrity,
leading to a potentially harmful, unstable product [1]. Thorough characterization of protein therapeutics is
necessary at every step of the research and development process, from drug discovery to lot release.
Due to the potential complexity of product degradation during preformulation and formulation
studies, additional separation techniques are needed to complement the more widely used column liquid
chromatography (LC) methods. To address this issue, capillary electrophoresis (CE) has become a
popular choice for the separation and analysis of therapeutic proteins and peptides.
CE provides several distinct advantages over LC. First, due to the faster separation times and the use
of multi-capillary arrays, hundreds of samples can be processed by CE per day. Second, CE is capable of
achieving very high efficiency separations due to the low diffusion coefficients of biomolecules. Lastly,
the small dimensions of the capillary and the low sample volume requirements keep reagent and analyte
use to a minimum, reducing the cost-per-test. The benefits of CE for the analysis of therapeutic peptides
and proteins have been addressed in several excellent reviews to date [2-5].
This chapter is aimed at highlighting the advances made in the field of CE therapeutic protein
analysis during 2012 and 2013 by expanding on a paper that was recently published by Zhao et al. [5].
Following brief descriptions of the working principles of the different CE separation and detection
methods, recent technological improvements and novel applications are discussed. Two additional
sections have been included to further explore the use of CE for the determination of protein
glycosylation and the comparison of biosimilars. Finally, a brief introduction into microfluidic
approaches to protein analysis is given. Microchip electrophoresis (ME) has the additional advantages of
9
increased speed, high-throughput capabilities, and portability for on-site analyses. Tables are presented in
each section to highlight the relevant CE and ME application-based citations.
2.2 Techniques
Historically, capillary zone electrophoresis (CZE) has been the most commonly employed form of
CE. Yet, the principles of electrophoretic separations and the benefits of capillary-based techniques are
applicable to other CE separation modes as well. Protein analysis based on size can be accomplished by
capillary gel electrophoresis (CGE), capillary isoelectric focusing (CIEF) can be used to determine
isoelectric points and charge heterogeneity, and capillary electrochromatography (CEC), which combines
the high efficiency electrophoretic separation with chromatographic retention, can be used for more
selective separations and analysis of neutral species. Depending on the properties of the analyte and
requirements of the assay, each of these separation modes can be coupled to a number of detection
methods such as UV-Vis absorbance, laser-induced fluorescence (LIF), and mass spectrometry (MS).
2.2.1 Capillary zone electrophoresis
Of the electrophoresis-based separation techniques, CZE is most frequently used for the analysis of
small molecules, carbohydrates, and peptides. It is simple, easy-to-use, and requires minimal amounts of
reagents compared to chromatographic methods. Additionally, in CZE, the separation of analytes is based
on their size-to-charge ratio, making it well suited for separations of proteins with post-translational
modifications (PTMs) or degradations that affect the charge of the molecule [6, 7] including deamidation,
glycosylation, and phosphorylation.
One example of the use of CZE for the investigation of deamidation concerns the stability of
oxytocin. Deamidation of Asn and Gln residues is the most common chemical degradation pathway for
peptides and proteins [1]. This process leads to the production of an ionizable carboxylic acid from the
neutral amide (R-CONH2 → R-COOH), facilitating a separation by CZE. However, if peptides, such as
oxytocin, contain several labile Asn and Gln sites, multiple degradation products of the same size-to-

10
charge ratio are produced and a straightforward separation becomes impossible. To distinguish between
the seven desamino degradation products of heat-stressed oxytocin, Creamer et al. utilized sulfobutyl
ether β-cyclodextrin (SBE β-CD) as a pseudo-stationary phase [8]. The negatively charged SBE β-CD
forms an inclusion complex with the hydrophobic Tyr2 residue of oxytocin, affecting the electrophoretic
mobility of the peptides. A baseline separation of all eight peptides and a migration time RSD of less than
1.2% was achieved.
Unfortunately, reproducible separations of larger biomolecules using bare fused-silica capillaries are
rare due to protein adsorption. Many proteins have large localized regions of positive charge that are
electrostatically attracted to the negatively charged silanol groups at the capillary surface. Additional
adsorption can be caused by hydrophobic and hydrogen-bonding interactions. This adsorption process
prevents CZE from obtaining the 106 theoretical plates that should be possible due to the very low
diffusion coefficients of large proteins. [9, 10].
One strategy for minimizing protein adsorption is to alter either the charge density of the protein or
the capillary wall by changing the pH or ionic strength of the background electrolyte (BGE). Another
approach is to simply add a modifier to the BGE to reduce protein-wall interactions. The addition of
surfactants, small amines, or anionic salts, such as phytic acid, to the BGE is common [11, 12]. In cases
where modification of the run buffer does not obviate protein adsorption, dynamic and static capillary
coatings have been used to create a barrier between the ionized silanol groups and the protein of interest.
2.2.1.1 Dynamic coatings
Dynamic coatings are buffer additives that adsorb to the surface of the capillary, shielding the silanol
groups from analyte adsorption [13]. These noncovalent coatings are popular due to their simplicity,
versatility, and ease-of-use. However, because of their impermanent nature, the coatings need to be
continuously regenerated. This can be accomplished by refreshing the physically adsorbed layer at the
capillary with rinses between runs, or adding a small amount to the BGE to prevent coating degradation

11
during electrophoresis. A variety of such coatings have been used for protein separations, ranging from
small molecules such as ionic liquids (ILs) to larger molecules such as surfactants and polymers [14].
ILs have been previously explored as dynamic coatings for CZE protein separations [15-17]. ILs are
salts made up of organic cations and inorganic or organic anions that are liquid at, or around, room
temperature. Recently, a new IL, N-methyl-2-pyrrolidonium methyl sulfonate ([NMP]+CH3SO3
–), was
used to prevent basic protein (pI 9.0-10.7) adsorption to capillary walls during CE separation [18]. The
[NMP]+
moiety electrostatically adsorbs to the capillary surface, where it is able to form a hydrogen bond
for additional stability (Fig. 1). Using this coating, the authors were able to achieve a baseline separation
of four basic proteins (Table 1) with an interday migration time RSD of less than 1.5%. The improvement
in the separation after addition of only 0.02% w/v IL, compared to that obtained with phosphate buffer
alone, is easily seen in Fig. 1D.
Polysaccharides are also attractive candidates for dynamic coatings for protein separations because
they are non-toxic, readily abundant, and biocompatible [19-21]. Two novel dynamic coatings based on
the chemical substitutions of cellulose have recently been reported [22, 23]. The first, a positively charged
quaternarnized cellulose (QC), was synthesized through a reaction of cellulose with 3-chloro-2-
hydroxypropyltrimethylammonium chloride. The positive charge of the QC leads to the electrostatic
adsorption of the compound to the capillary surface, reversing the electroosmotic flow (EOF). Addition of
5 µg/mL QC to the BGE prevented adsorption of model basic proteins leading to higher separation
efficiencies [22]. To increase the reverse EOF by 10%, and further improve separation efficiency,
additional substitution of the QC was made using hydrophobic hexadecyl groups [23]. Both QCs were
evaluated with a separation of five basic proteins (Table 1). In both cases, the modified capillaries
produced a migration time reproducibility with RSD of less than 2.7%.
Despite their simplicity, buffer additives and dynamic coatings are not always the best approach to
eliminate protein adsorption. If the modifier is highly charged, band broadening can occur due to high
separation currents and Joule heating. Additionally, some buffer modifiers can interfere with protein

12
Fig. 1. A) The structure of the IL [NMP]+CH3SO3−, B) the interaction between [NMP]
+ and the silica
capillary inner wall , and C) the mechanism of separation of proteins using [NMP]+ as dynamic coating
material, D) Electropherograms of four basic proteins in bare silica capillary (bottom trace) and in the
presence of 0.02% w/v IL (top trace). Run buffer: 40 mM pH 4.0 sodium phosphate; voltage: 18 kV;
detection: 214 nm; peaks: (1) cytochrome c, (2) lysozyme, (3) ribonuclease A, (4) α-chymotrypsinogen A.
Reprinted with permission from ref. 18
D
A)
B)
C)
13
binding assays [24], disrupt protein stability [25], or be incompatible with downstream detection methods
such as MS. In cases where greater stability and reproducibility are needed, static coatings have been used
[13].
2.2.1.2 Static coatings
Static coatings are chemically linked to the capillary wall and do not need to be added to the run
buffer to acheive reproducible separations. Therefore, they have the potential for large-scale production
and can be made commercially available. Several companies, including GL Sciences (FunCap®), Target
Discovery (UltraTrol™), MicroSOLV (CElixer™), and Beckman Coulter (eCAP™), are already selling
coated capillaries for protein separations.
Gassner et al. performed a thorough comparison of both commercially available and lab-generated
static coatings in 2013 [26]. Eight coatings were selected—four positive: FunCap®-type A, UltraTrol™
HR, Hexadimethrin bromide (polybrene) (PB)-dextran sulfate-PB, and polyethylenimine; and four
neutral: FunCap®-type D, UltraTrol™ LN, hydroxypropylcellulose, and polyvinyl alcohol (PVA). The
coatings were evaluated for the protein recovery, isoform resolution, and migration time reproducibility
of two monoclonal antibodies (mAbs).
For the positively charged coatings, the separation was run in negative polarity. With these capillaries
it was determined that the slower the EOF, the better the resolution. Yet, while UltraTrol™ HR had the
slowest EOF, it had poor reproducibility (8.9% RSD) and was discarded from the study. For the neutral
coatings run in normal polarity, the largest factor for protein adsorption was the presence of residual
silanol groups. This was apparent by the fact that some EOF was still generated in the capillary. Of the
four neutral coatings in this study, both commercial options, FunCap®-type D and UltraTrol™ LN,
generated a small amount of EOF at pH 7.0, indicating that the coating was not uniform and there were
still potential sites for protein adsorption. However, it is important to note that the separation performance
of each coating was highly dependent on the pH and composition of the BGE. Consequently, care should
be taken during method development to fully optimize the BGE for the selected coating.

14
Due to the varied performance of the commercially available products, new coatings for the
separation of basic and hydrophobic proteins are still under development. One particularly attractive
choice for static coatings is phospholipid bilayers (PLB) because of the protein resistant nature of the
phosphoylcholine polar headgroup. However, the limiting factor for these coatings are their poor long-
term chemical and physical stability. This can be remedied by cross-linking the PLB with bis-SorbPC
which produces a stabilized phospholipid bilayer (SPB) at the capillary surface [27]. In a recent report, it
was shown that the SPB produced a stable coating over a pH range from 4.0–9.3 [28]. Over the course of
45-days dry storage the migration time reproducibility for both model proteins (Table 1) was marginally
affected and the overall RSD for the EOF was only changed by 1.1%.
To reduce the preparation time of static coated capillaries, self-assembled bilayers and photoinitiated
polymerization can be used. An example of such a process was described by Yu et al. using a
photosensitive diazoresin (DR) in combination with either PVA [29] or polyethylene glycol (PEG) [30].
After exposure to 365 nm light, both the DR/PVA and DR/PEG coatings were able to prevent protein
adsorption and achieve an efficient separation of several model basic proteins (Table 1) with a migration
time precision less than 4% RSD.
2.2.1.3 Evaluation of capillary coating performance
Prior to assay development, the determination of capillary coating performance is extremely
important. A previous analytical approach to determine protein adsorption in capillaries involves flushing
the capillary with the protein of interest to allow adsorption and then measuring desorption on a
subsequent rinse [31-33]. However, with this method, only irreversibly bound proteins are measured. As
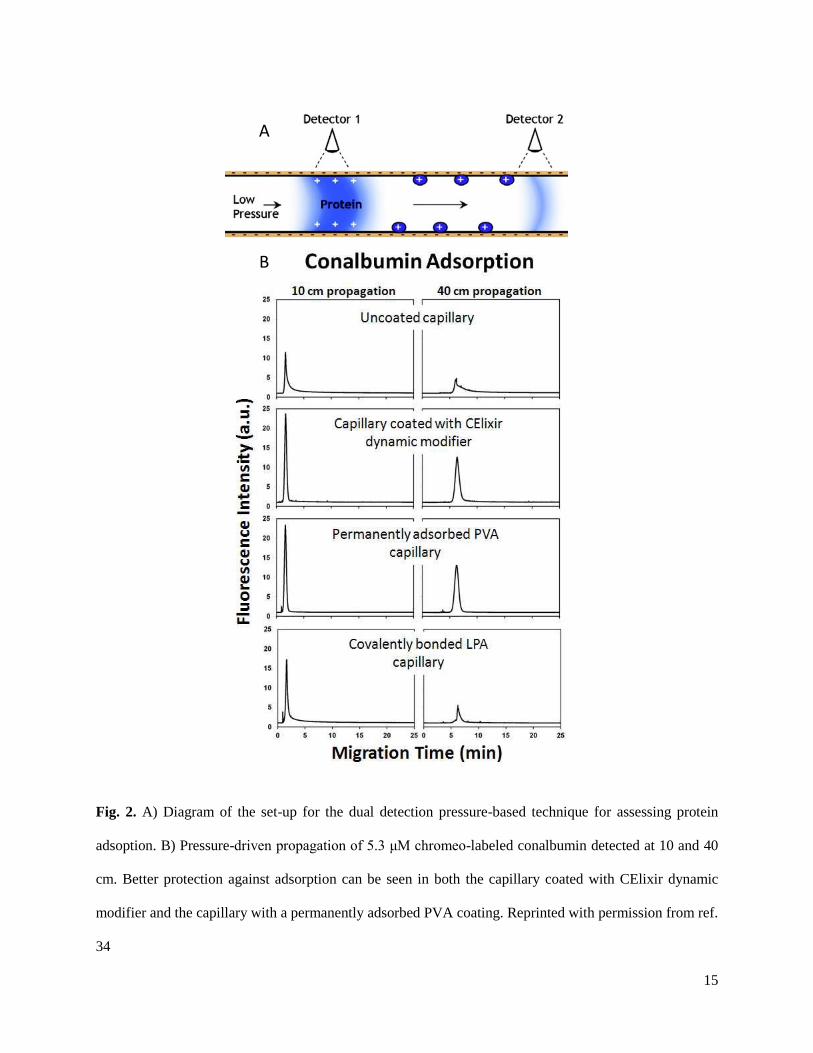
an alternative, de Jong et al. recently developed a more direct method using pressure-driven flow [34].
Briefly, a plug of sample is pressure injected into a capillary at a low flow rate (0.5 psi) and the Taylor
dispersion of the plug is measured at two different detection points along the capillary. Based on these
measurements, the magnitude of the protein adsorption can be estimated (Fig. 2).
15
Fig. 2. A) Diagram of the set-up for the dual detection pressure-based technique for assessing protein
adsoption. B) Pressure-driven propagation of 5.3 μM chromeo-labeled conalbumin detected at 10 and 40
cm. Better protection against adsorption can be seen in both the capillary coated with CElixir dynamic
modifier and the capillary with a permanently adsorbed PVA coating. Reprinted with permission from ref.
34
A)
B)
16

17
2.2.2 Capillary gel electrophoresis
The most commonly used analytical method for size determination, purity assessment, and quality
control of therapeutic recombinant proteins is sodium dodecyl sulfate polyacrylamide gel electrophoresis
(SDS-PAGE). SDS is used to coat the proteins, resulting in a uniform negative charge proportional to
their size. Under an electric field the proteins are then separated through a sieving gel matrix, allowing
estimation of protein molecular weight (MW). However, conventional SDS-PAGE can be time-
consuming and tedious and yield irreproducible results with limited quantitative abilities [35].
To improve on this important technique, the CGE equivalent, SDS-CGE, has been developed and
utilized for the determination of size heterogeneity of therapeutic proteins [36-38] (Table 2). Here the
sieving gel is placed inside the capillary through which the negatively charged SDS-coated proteins are
separated. SDS-CGE has many advantages over SDS-PAGE, including high efficiency separations, more
accurate MW and concentration determination, and the ability to automate the process for high-
throughput analysis.
Shi et al. demonstrated these advantages of SDS-CGE over SDS-PAGE, along with the improved
precision of migration time and peak area, for the analysis of the light chain, nonglycosylated heavy
chain, and heavy chain fragments of a mAb [39]. Using the capillary format, the authors were able to
achieve RSDs of less than 0.5% for migration time and less than 5% for corrected peak area. However,
for quality control of biopharmaceuticals, the precision for a quantitative assay needs to be lower than 2%
RSD. By switching to hydrodynamic rather than electrokinetic injection, along with increased sample
concentration, the precision of a standard SDS-CGE assay was improved to 0.2% RSD for migration time
and between 1 and 2% RSD for peak area ratio [40].
Another method to improve assay precision for the SDS-CGE assay is through automation of the
sample preparation process. A large number of samples are generated during the development of high-
quality biologics. These samples originate from every step of the development process and are presented
for analysis in a variety of matrices. The use of an automatic robotic platform for sample preparation can
18
help mitigate user error introduced in the multi-step sample preparation process. The PhyNexus Micro-
Extractor Automated Instrument uses a ProA resin column to bind mAb samples prior to separation. Once
bound, the instrument performs sample concentration normalization, removal of contaminates, desalting,
and mixing with appropriate SDS-CGE buffers. With this method, protein recovery of Fc-fusion proteins,
and IgG1 and IgG2 mAbs was increased to 90% [41].
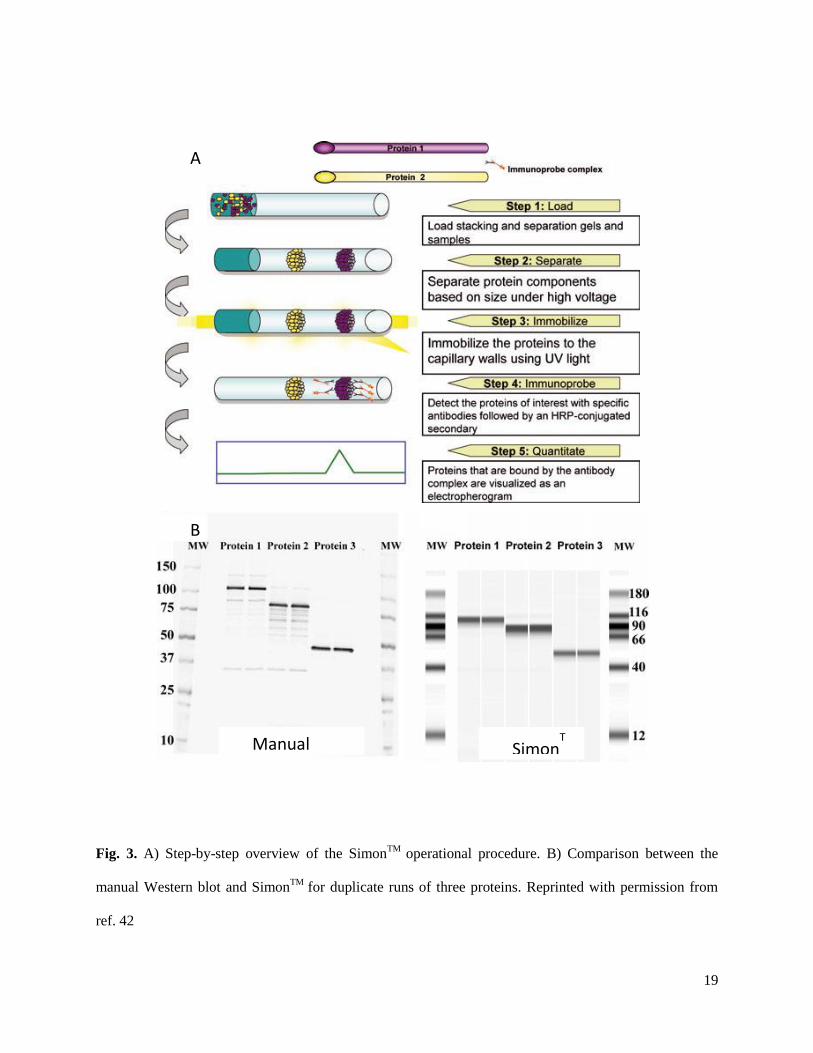
UV absorbance and LIF spectroscopy are the dominant detection methods for SDS-CGE. However,
for detection of specific mAbs, Western blot immunoassay detection has also been utilized. The
ProteinSimple Simple Western™ (or Simon™) automates the immunoassay detection procedure by
performing all separation steps and washes in-capillary. Following a SDS-CGE separation, the proteins
are photochemically cross-linked to the capillary wall, where they are exposed to a horseradish
peroxidase-conjugated secondary antibody for whole-capillary chemiluminescence imaging (Fig. 3).
Simon™ also makes quantitative Western blots possible. Using this instrument, a standard curve was
generated for a vaccine candidate protein with linearity from 0.45–7 µg/mL and R2 values of 0.990 or
greater for five experiments [42].
Spectroscopic detection using immunoassay methods for CGE are useful because coupling CGE with
MS by electrospray ionization (ESI) is difficult due to the presence of nonvolatile BGE. However, SDS-
CGE has been coupled successfully to matrix-assisted laser desorption ionization (MALDI) MS by
moving a poly(tetrafluoroethylene) membrane past the end of the capillary to collect the peaks as they
leave the capillary [43]. CGE-MALDI-MS has been utilized for the direct mass measurement of
recombinant proteins [44, 45] and neoglycoproteins [46].
19
Fig. 3. A) Step-by-step overview of the SimonTM
operational procedure. B) Comparison between the
manual Western blot and SimonTM
for duplicate runs of three proteins. Reprinted with permission from
ref. 42
A)
B)
Manual Western
SimonT
M

20
21
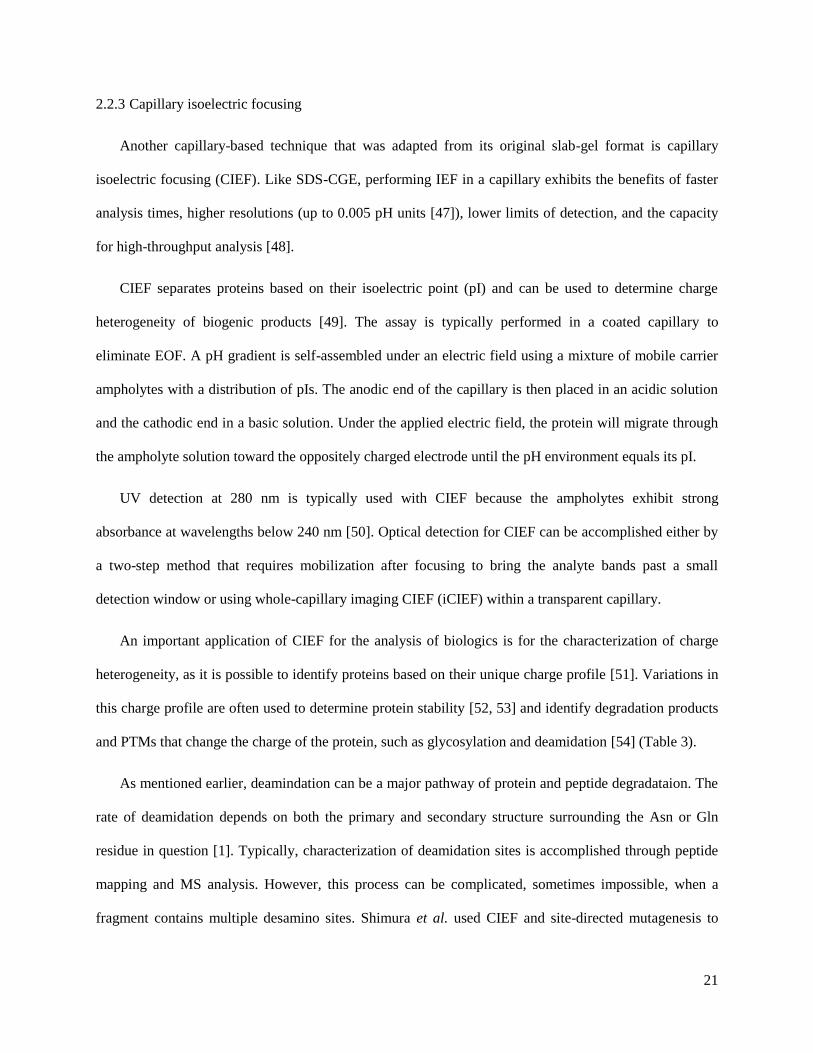
2.2.3 Capillary isoelectric focusing
Another capillary-based technique that was adapted from its original slab-gel format is capillary
isoelectric focusing (CIEF). Like SDS-CGE, performing IEF in a capillary exhibits the benefits of faster
analysis times, higher resolutions (up to 0.005 pH units [47]), lower limits of detection, and the capacity
for high-throughput analysis [48].
CIEF separates proteins based on their isoelectric point (pI) and can be used to determine charge
heterogeneity of biogenic products [49]. The assay is typically performed in a coated capillary to
eliminate EOF. A pH gradient is self-assembled under an electric field using a mixture of mobile carrier
ampholytes with a distribution of pIs. The anodic end of the capillary is then placed in an acidic solution
and the cathodic end in a basic solution. Under the applied electric field, the protein will migrate through
the ampholyte solution toward the oppositely charged electrode until the pH environment equals its pI.
UV detection at 280 nm is typically used with CIEF because the ampholytes exhibit strong
absorbance at wavelengths below 240 nm [50]. Optical detection for CIEF can be accomplished either by
a two-step method that requires mobilization after focusing to bring the analyte bands past a small
detection window or using whole-capillary imaging CIEF (iCIEF) within a transparent capillary.
An important application of CIEF for the analysis of biologics is for the characterization of charge
heterogeneity, as it is possible to identify proteins based on their unique charge profile [51]. Variations in
this charge profile are often used to determine protein stability [52, 53] and identify degradation products
and PTMs that change the charge of the protein, such as glycosylation and deamidation [54] (Table 3).
As mentioned earlier, deamindation can be a major pathway of protein and peptide degradataion. The
rate of deamidation depends on both the primary and secondary structure surrounding the Asn or Gln
residue in question [1]. Typically, characterization of deamidation sites is accomplished through peptide
mapping and MS analysis. However, this process can be complicated, sometimes impossible, when a
fragment contains multiple desamino sites. Shimura et al. used CIEF and site-directed mutagenesis to

22
determine the rates of deamidation in Fab fragments of mouse IgG1-κ [54]. The rate of disappearance of
the parent peak of each mutant was compared to that of the wild type to obtain the single-residue
deamidation rates. By monitoring the CIEF charge profile of the six Fab mutants for the additional acidic
peaks, a third, previously unknown, deamidation hotspot for the mouse IgG1-κ was identified.
CIEF can be even more powerful when run in combination with an orthogonal separation technique
such as SDS-CGE [55] or reversed-phase LC, or in tandem with MS. CIEF has been coupled to MS
through both ESI [56, 57] and MALDI interfaces [58, 59]. Due to the presence of the non-volatile
ampholytes in the separation buffer, coupling CIEF with ESI can be complicated by ion-suppression and
source contamination. To cut down on the intensive sample preparation needed to desalt protein samples
from gels, a segmented capillary has been described. In this design, seven segments of PEEK capillary
were connected by Nafion joints, each with its own buffer reservoir (Fig. 4) [60]. This allowed analytes in
the capillary segments to be selectively mobilized after focusing, creating an online fractionator prior to
additional analysis by LC, CE, or MS.
Additional technological advances in CIEF-MS interface development have been reported by Zhong
et al. [61] and Wang et al. [62]. Their work is discussed further in the MS detection section of this
chapter. Along with the development of new interfaces, several straightforward BGE buffer modifications
have been described in the literature to solve the problems of high backgrounds and ion suppression [63,
64].
As with SDS-CGE, detection of proteins by immunoassay following separation by CIEF can be used
to improve detection limits and specificity without the need for MS. For example, Michels et al. have
described the first multiplexed iCIEF immunoassay for investigation of the charge heterogeneity of mAbs
[65]. Once the mAbs were focused, they were then photochemically immobilized to the capillary wall
where they were then exposed to a secondary antibody, conjugated with horseradish peroxidase, and
detected by chemiluminescence (Fig. 5). The resulting LOD of this assay was 6 ng/mL, which was a
1000-fold increase over UV detection.

23
Fig. 4. Schematic layout of the on-line multiple junction CIEF setup; the six-port injector is shown in the
sample-loop loading position. Reprinted with permission from ref. 60

24
Fig. 5. Schematic of the Nanopro three-step process . 1) Separation by CIEF, 2) immobilization of the
antibody to the capillary wall, 3) detection with secondary antibody by chemiluminescence. Reprinted
with permission from ref. 65

25
26
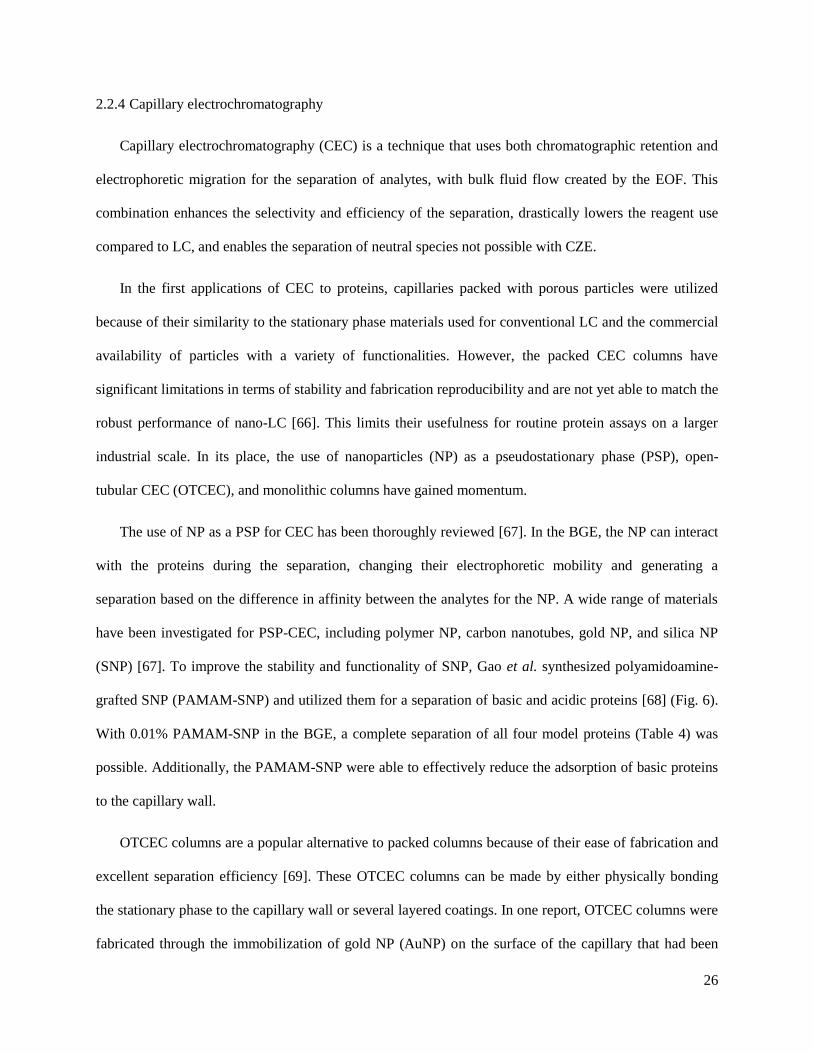
2.2.4 Capillary electrochromatography
Capillary electrochromatography (CEC) is a technique that uses both chromatographic retention and
electrophoretic migration for the separation of analytes, with bulk fluid flow created by the EOF. This
combination enhances the selectivity and efficiency of the separation, drastically lowers the reagent use
compared to LC, and enables the separation of neutral species not possible with CZE.
In the first applications of CEC to proteins, capillaries packed with porous particles were utilized
because of their similarity to the stationary phase materials used for conventional LC and the commercial
availability of particles with a variety of functionalities. However, the packed CEC columns have
significant limitations in terms of stability and fabrication reproducibility and are not yet able to match the
robust performance of nano-LC [66]. This limits their usefulness for routine protein assays on a larger
industrial scale. In its place, the use of nanoparticles (NP) as a pseudostationary phase (PSP), open-
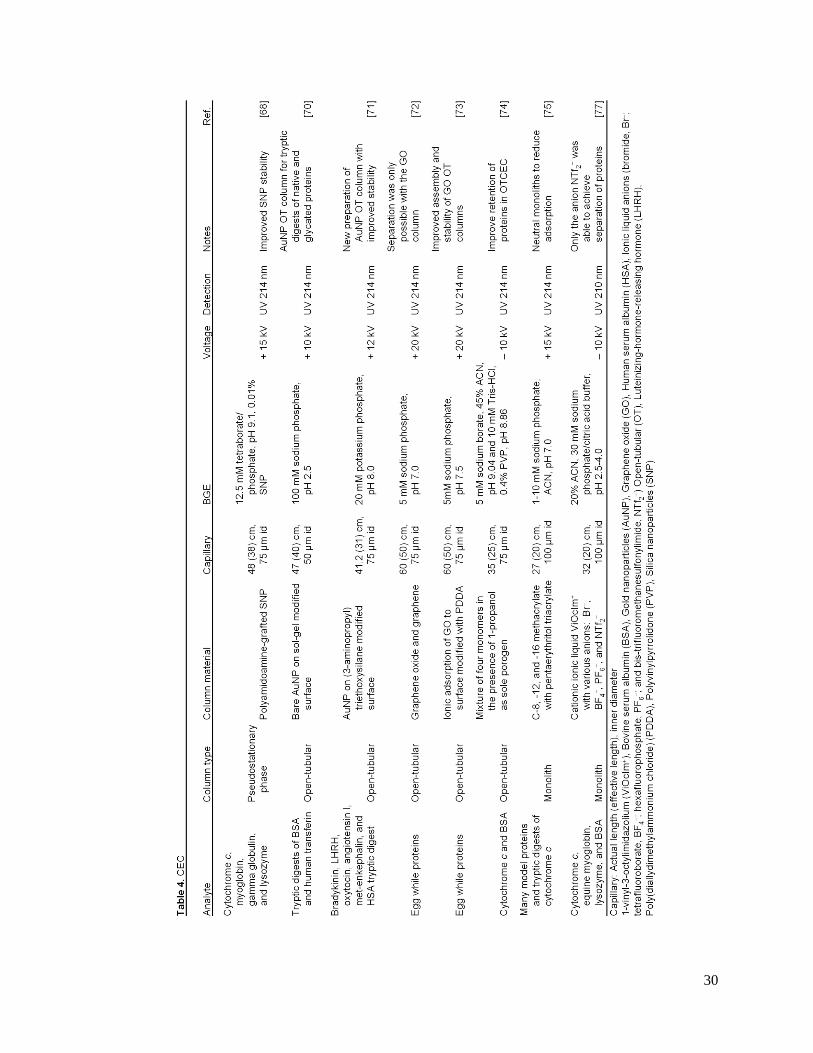
tubular CEC (OTCEC), and monolithic columns have gained momentum.
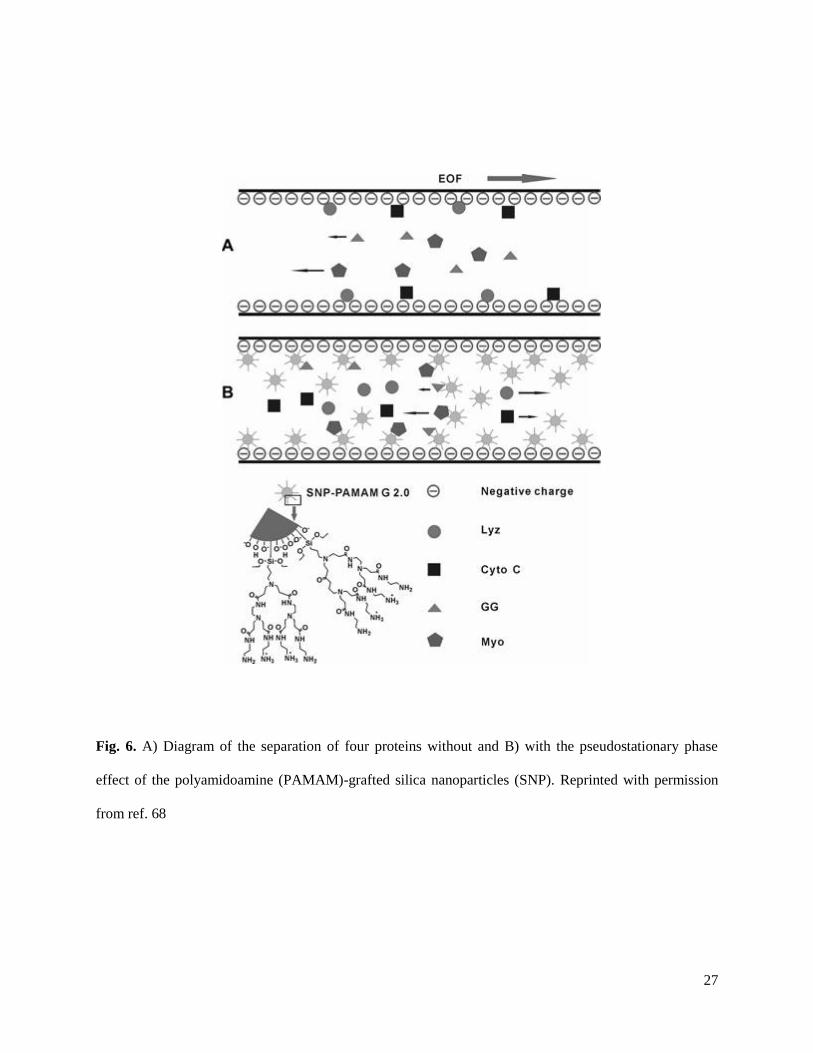
The use of NP as a PSP for CEC has been thoroughly reviewed [67]. In the BGE, the NP can interact
with the proteins during the separation, changing their electrophoretic mobility and generating a
separation based on the difference in affinity between the analytes for the NP. A wide range of materials
have been investigated for PSP-CEC, including polymer NP, carbon nanotubes, gold NP, and silica NP
(SNP) [67]. To improve the stability and functionality of SNP, Gao et al. synthesized polyamidoamine-
grafted SNP (PAMAM-SNP) and utilized them for a separation of basic and acidic proteins [68] (Fig. 6).
With 0.01% PAMAM-SNP in the BGE, a complete separation of all four model proteins (Table 4) was
possible. Additionally, the PAMAM-SNP were able to effectively reduce the adsorption of basic proteins
to the capillary wall.
OTCEC columns are a popular alternative to packed columns because of their ease of fabrication and
excellent separation efficiency [69]. These OTCEC columns can be made by either physically bonding
the stationary phase to the capillary wall or several layered coatings. In one report, OTCEC columns were
fabricated through the immobilization of gold NP (AuNP) on the surface of the capillary that had been
27
Fig. 6. A) Diagram of the separation of four proteins without and B) with the pseudostationary phase
effect of the polyamidoamine (PAMAM)-grafted silica nanoparticles (SNP). Reprinted with permission
from ref. 68

28
pretreated with a sol-gel. The gold immobilized in the sol-gel participates in noncovalent interactions with
thiol and amino groups of proteins, increasing their capacity factor. Using this technique, Miksik et al.
were able to separate the peptides generated by the tryptic digestion of native and glycosylated bovine
serum albumin (BSA) and human transferrin [70]. Unfortunately, preparation of the AuNP-modified
columns required several days and many reaction steps, which limited its utility. To alleviate this
problem, a new method for AuNP immobilization to the capillary wall through covalent binding using (3-
aminopropyl)triethoxysilane has been described [71]. This procedure creates a stable coating that could be
reused over 900 times with migration time RSDs less than 1.7% for model proteins (Table 4).
Another novel OTCEC column was described by Qu et al. and was produced by immobilizing
graphene (G) and graphene oxide (GO) sheets to the capillary wall to act as the stationary phase. It was
found that between the two coatings, only the GO exhibited a reproducible EOF over the pH range of
3–9 and separated a mixture of egg white proteins [72]. The separation was achieved due to the reverse-
phase-like interaction between the GO coated surface and the proteins. To improve the stacking of GO at
the capillary wall, a layer-by-layer technique to produce the GO-modified OTCEC column was reported.
In this case, GO nanosheets were adsorbed on a poly(diallydimethylammonium chloride)-treated capillary
by electrostatic interaction. This created a stable coating for over 200 runs [73]. Both methods for column
fabrication produced excellent run-to-run, day-to-day, and column-to-column reproducibility with less
than 3% RSD for the EOF.
Often, OTCEC separations suffer from low capacity factors because of the small active surface area
and fewer available functional sites. This also can lead to poor separation efficiency and co-eluting peaks.
In an attempt to improve peak capacity, a new porous layer for OTCEC has been described that uses the
in situ polymerization of a mixture of monomers in the presence of porogen for higher separation
efficiencies [74]. A column generated from the porogen, 1-propanol, was able to generate a high
abundance of micropores and mesopores, resulting in a large specific surface area. This generated an
efficient separation of the two model proteins, BSA and cytochrome-c.
29
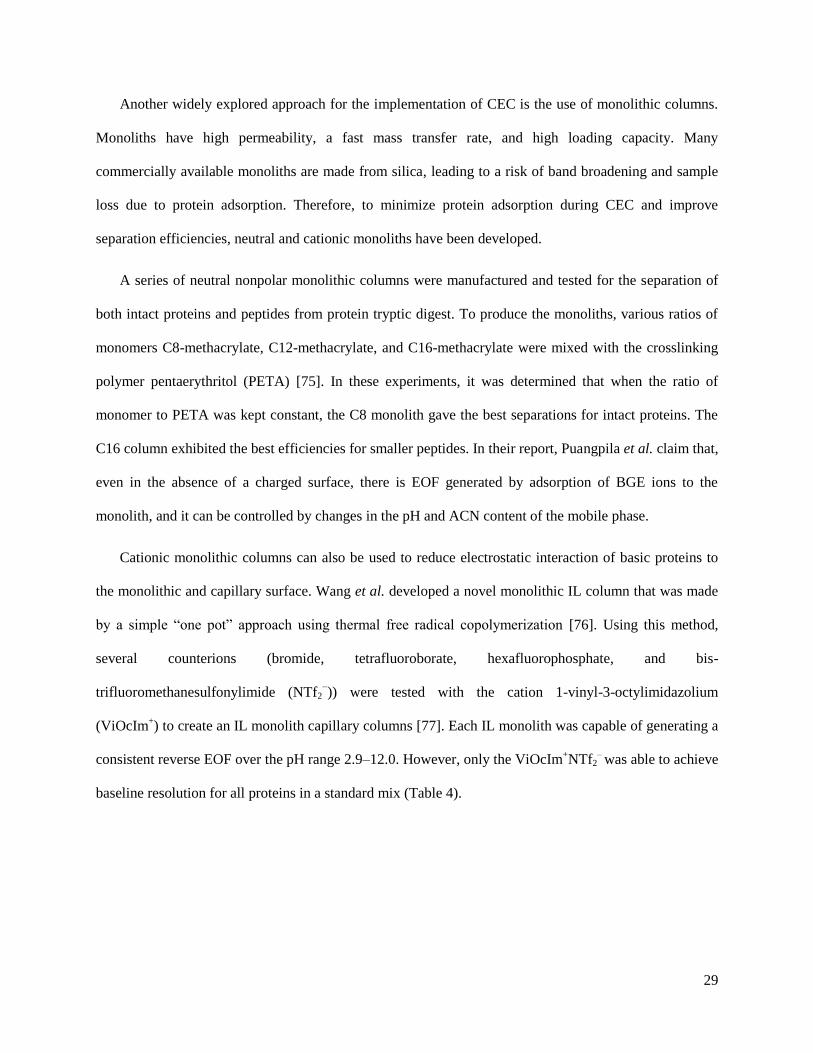
Another widely explored approach for the implementation of CEC is the use of monolithic columns.
Monoliths have high permeability, a fast mass transfer rate, and high loading capacity. Many
commercially available monoliths are made from silica, leading to a risk of band broadening and sample
loss due to protein adsorption. Therefore, to minimize protein adsorption during CEC and improve
separation efficiencies, neutral and cationic monoliths have been developed.
A series of neutral nonpolar monolithic columns were manufactured and tested for the separation of
both intact proteins and peptides from protein tryptic digest. To produce the monoliths, various ratios of
monomers C8-methacrylate, C12-methacrylate, and C16-methacrylate were mixed with the crosslinking
polymer pentaerythritol (PETA) [75]. In these experiments, it was determined that when the ratio of
monomer to PETA was kept constant, the C8 monolith gave the best separations for intact proteins. The
C16 column exhibited the best efficiencies for smaller peptides. In their report, Puangpila et al. claim that,
even in the absence of a charged surface, there is EOF generated by adsorption of BGE ions to the
monolith, and it can be controlled by changes in the pH and ACN content of the mobile phase.
Cationic monolithic columns can also be used to reduce electrostatic interaction of basic proteins to
the monolithic and capillary surface. Wang et al. developed a novel monolithic IL column that was made
by a simple “one pot” approach using thermal free radical copolymerization [76]. Using this method,
several counterions (bromide, tetrafluoroborate, hexafluorophosphate, and bis-
trifluoromethanesulfonylimide (NTf2−)) were tested with the cation 1-vinyl-3-octylimidazolium
(ViOcIm+) to create an IL monolith capillary columns [77]. Each IL monolith was capable of generating a
consistent reverse EOF over the pH range 2.9–12.0. However, only the ViOcIm+NTf2
– was able to achieve
baseline resolution for all proteins in a standard mix (Table 4).
30

31
2.3 Detection methods
2.3.1 Spectroscopic detection
Spectroscopy is the most common detection method for proteins and peptides separated by CE. UV
absorbance tends to be favored over fluorescence spectroscopy due to a natural absorbance of the amide
bonds and aromatic residues in the near UV (214 and 280 nm). However, this approach suffers from poor
limits of detection due to the micrometer pathlengths characteristic of CE and high background from the
UV source. Additionally, BGE composition, pH, and ionic strength can have a significant effect on
background. Approaches such as increasing the pathlength through modification of the detection window
using Z-shaped capillaries and bubble-cells have been successful in decreasing the LOD by an order of
magnitude or greater [78, 79].
Fluorescence detection of proteins can be accomplished based on the native fluorescence of
tryptophan, phenylalanine, and tyrosine residues in proteins using a deep UV light source [80-82].
However, with native fluorescence based detection, the signal is dependent on the number of excitable
residues as well as their accessibility within the tertiary structure of the protein. Therefore, the
applicability of this technique varies from protein to protein. To improve the LODs for native
fluorescence detection of erythropoietin (EPO), Wang et al. utilized a magnetic bead-based extraction
system for pre-concentration. Using this procedure, it was possible to obtain an LOD of 10 nM, two
orders of magnitude lower than what was possible with UV absorbance at 214 nm [83].
Low limits of detection achievable by LIF can also be obtained through derivatization of the protein
or peptide of interest with a fluorophore [84]. The most common derivatization sites for proteins are the
primary amines and cysteine residues. These can be tagged with a variety of agents including Alexa
Fluor-based dyes, naphthalene-2,3-dicarboxaldehyde, fluoresceinisothiocyanate, and many others. A
major disadvantage of pre-separation derivatization for proteins is the complexity of the derivatization
process. This approach requires not only that the tag is specific for the functional group on the analyte of
interest but also that it does not interfere with the separation by introducing additional fluorescent by-
32
products. Proteins typically have several reactive sites that can be labeled, which leads to multiple peaks
for one analyte, complicating data analysis [85].
2.3.2 Mass spectrometry
CE-MS is a powerful combination of high efficiency separation with selective and sensitive detection.
This technique can provide important information on identity, glycoforms, degradation, and impurities of
protein therapeutics [86, 87]. It is possible to couple CE to MS using different ionization techniques, as
has been described in several excellent reviews [88, 89]. For this chapter, only the recent advances
regarding the development and application of the ESI interfaces will be highlighted. CE was first
interfaced with MS by ESI in 1987 [90] and it remains the most popular ionization method due to its
broad applicability and commercialization.
ESI is a robust soft-ionization technique that produces multiply charged ions for proteins in the gas
phase. However, there are many considerations that must be taken into account when coupling it with CE.
Primarily, the use of run buffers containing non-volatile salts and additives can lead to their deposition
within the instrument, and subsequent contamination of the source. While formic acid and acetate buffers
have been used as BGEs for the separation of proteins by CE, they are not always ideal because of
inadequate resolution and possible protein instability at low pH. Additionally, the voltages typically
applied to the capillary for separation are 2–3 orders of magnitude higher than what is used for ESI.
Toward this end, researchers have developed three general approaches for coupling CE to MS with ESI:
sheath-liquid, sheathless, or junction-at-the-tip interfaces.
The most widely used and commercially available option is the sheath-liquid interface. This is
accomplished by placing the outlet of the CE capillary coaxially within a tube. The tube delivers a MS-
compatible sheath liquid (Fig. 7A) that provides easy electrical connections and a flow rate to the ESI of
µL/min. This is beneficial because the EOF of the CE is generally much slower (nL/min) than what is
compatible for a stable spray.

33
The compatibility of separation and detection parameters for CE-ESI-MS with a sheath-liquid
interface was evaluated for eight model proteins and several EPO isoforms [91]. It was found that the
BGE composition and capillary coating play the largest role in the quality of the separation. For all
analytes the best signal was obtained with a sheath flow rate between 2-5 µL/min and a sheath flow liquid
composed of 1% acetic acid in 1:1 organic:water; in this study, 2-propanol was chosen over MeOH or
ACN. The optimal gas pressure was determined to be 0.2 bar, since anything lower lead to a loss of
analyte intensity and anything higher was shown to affect the resolution of the separation. As an added
benefit, the nebulizer gas pressure can create suction at the capillary outlet, increasing the CE flow rate
for separations performed in neutral capillaries (Table 5).
An obvious disadvantage of the sheath-liquid interface is the loss in detector sensitivity from dilution
of the eluting peaks. To improve detection limits, a sheathless interface was developed. The largest
downside of this approach is the difficulty in properly completing the electrical circuits for the CE and the
ESI. While many attempts have been made, these interfaces were limited by stability and ease of
application [89, 92].
Recently, Moini and Whitt developed a sheathless interface based on a porous junction [93, 94]. In
this interface, the end of the capillary was made porous to small ions by drilling a well into the polyamide
coating and etching the remaining material with hydrofluoric acid. The capillary was then placed within
an existing ESI needle filled with BGE, allowing electrical connection to both the CE and ESI (Fig. 7B).
The tip of the capillary could then be used for electrospray when voltage is applied. The only drawback to
this technique was the difficulty in reproducibly etching the capillary end. To improve the applicability
and availability of the Moini and Whitt sheathless interface, Beckman Coulter developed a prototype that
has been successfully applied to the analysis of intact proteins [95], protein glycoforms [96], and protein
tryptic digests [97, 98] (Table 5).
In a recent report, both CE- and LC-MS were compared for the analysis of a particular therapeutic
mAb [98]. With LC-MS, 11 small peptides eluted in the void volume and could not be detected, including
34
two fragments that were critical for the identification of the binding domain of the mAb. The same digest
was analyzed by CE-MS employing both a traditional sheath-liquid interface and the Beckman Coulter
sheathless interface using a BGE consisting of 10% acetic acid at pH 2.3. Sixty of 61 peptides were
detected with the sheath-liquid interface, while all 61 peptides were detected with the sheathless system
with higher separation efficiencies and better sensitivity.
Another alternative to the sheath-liquid interface is the junction-at-the-tip design developed by
Chen’s group. In this interface, the capillary end is placed within a hollow needle that forms a “flow-
through microvial” [99] (Fig. 7C). The hollow needle is filled with a chemical modifier that provides the
necessary electrical contacts for the separation and ESI voltages. Similar to a sheath-liquid interface, this
modifier increases the CE BGE compatibility with the ESI. However, because the flow rates are much
lower (< 1 µL/min), the dilution factor is not significant. Chen’s group has extensively characterized the
performance of this interface in several publications [100-102].
Perhaps the most exciting new use of these interfaces is in coupling MS to more complex CE modes,
such as CIEF and capillary isotachophoresis (CITP) which require high concentrations of non-volatile
components to achieve a separation. In 2011, Zhong et al. described a CIEF-MS approach for the analysis
of several model peptides and proteins using the junction-at-the-tip interface with coated and uncoated
capillaries [61]. Unfortunately, the ampholytes used for the separation were still able to reach the detector,
leading to high backgrounds and ion suppression. To prevent this from occurring, a new sheathless
interface was developed by Wang et al. that uses a large bore separation capillary for sample loading and
a sheathless interface with a porous emitter for its application with CITP [62] (Fig. 7D). This system was
then utilized for the analysis of test peptides spiked into tryptic digests of BSA (Table 5). They were able
to obtain a linear range over 4.5 orders of magnitude and a five-fold sensitivity improvement compared to
the sheath-liquid interface for two test peptides, kemptide and angiotensin II.

35
Fig. 7. Diagrams of four CE-ESI-MS interfaces. A) Sheath-flow, B) Moini and Whitt sheathless flow, C)
Chen junction-at-the-tip, D) sheathless interface for CITP/CZE-nanoESI-MS. Reprinted/adapted with
permission from ref. 89, 94, 102, 62, respectively
A)
B)
C)
D)

36

37
2.4 Applications
In addition to assessing protein pharmaceutical products based on their size and charge heterogeneity
and the presence of impurities, the analysis of biologics poses two additional analytical challenges: 1)
how to characterize and better understand the complicated cellular process of glycosylation, and 2)
preparing for the onset of biosimilar drugs to the market and how to best prove their similarity to the
innovator product.
2.4.1 Glycosylation
Glycosylation is one of the most prevalent PTMs of therapeutic proteins. In vivo, glycosylation plays
several important roles, including protection against degradation and non-specific interactions as well as
orientation for the binding domain. The two major types of glycosylation that occur involve N-linked and
O-linked carbohydrates. N-linked glycans are attached to the protein backbone at the amine side of Asn
and are found in the well-defined amino acid sequence of Asn-X-Ser/Thr, where X is any amino acid but
proline. O-linked glycans are not sequence-specific and are found attached to the protein backbone at the
OH group of Ser or Thr.
Monoclonal antibody-based therapeutics of the IgG1 sub-type make up a 100 billion dollar annual
market [103]. These mAbs consist of 2–3% carbohydrate by mass. Most of the glycosylation occurs as N-
linked glycans located on the Asp297
in the CH2 domain of the Fc region of each heavy chain. A number of
factors can affect the composition, structure, and frequency of these glycans, posing an interesting
challenge for the manufacturing of a homogeneous product. To ensure a homogeneous product and avoid
potentially immunogenic glycans, each step of biotherapeutic production from clone selection to lot
release needs to be well characterized. This characterization requires fast, high-throughput analytical
methods to accurately screen the numerous samples generated per day.
The size and charge characterization of glycoproteins can be accomplished by the various
electrophoretic separation techniques mentioned in the previous sections of this chapter. Several methods

38
and protocols for CZE, SDS-CGE, and CIEF separations of glycoproteins have been compiled by
Rustandi et al. [104]. A typical downside to CE-based methods is the characteristic migration time
irreproducibility. To address this, freely available software, glyXalign, was developed based on a set of
rapid algorithms that enables automatic correction of distortions in CGE-LIF data to improve peak
identification [105].
For further understanding of the nature, location, and composition of the glycans, methods for the
removal and analysis of the sugars themselves are also needed. The majority of these carbohydrate
analyses are performed by LC. In particular, hydrophilic interaction chromatography (HILIC) coupled to
LIF and MS detection has been useful for the sensitive analysis of glycans [106].
CE-LIF is an excellent orthogonal technique to HILIC-LIF for separation of glycans, and in a
comparative study it was shown that they were able to detect an equal number of glycans removed from
an IgG [107]. An advantage of CE-LIF for glycan analysis is that it can be used to distinguish both
lineage and positional isomers [108, 109]. Using CZE-LIF, carbohydrate sequencing can be performed by
both top-down digestion and bottom-up identification using a series of sugar-specific exoglycosidases.
Typically, glycans are enzymatically removed, fluorescently labeled, and separated by size or charge.
There are several charged fluorescent reagents commercially available for tagging glycans. The most
common reagent used in conjunction with CE-LIF is 8-aminopyrene-1,3,6-trisulfonic acid (APTS).
However, recently, Kuo et al. published a rapid method for labeling aldoses with 2,3-naphthalenediamine
to produce highly fluorescent naphthimidazole derivatives [110]. Using this reagent, it was possible to
perform composition analysis and enantioseparation of the glycans using CE with cyclodextrin in the
BGE.
An important advantage of CE-LIF over HILIC-LIF is the ability to multiplex 48- and 96-capillary
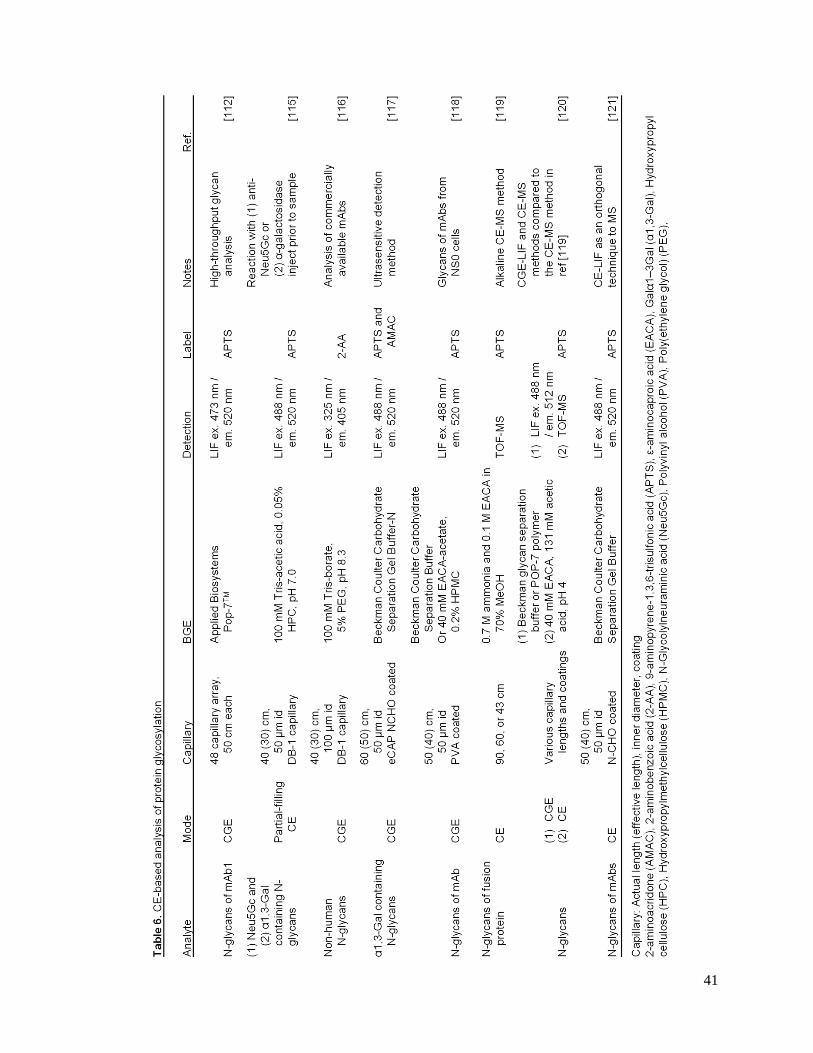
arrays for high-throughput analysis. Callewaert et al. were the first to perform glycan analysis using a
commercially available multiplexed CE-based DNA analyzer [111]. Later, this same technique was used
along with a 48-capillary array to perform high-throughput analysis of glycans from IgG. In this

39
application, glycans were removed by digestion and labeled with APTS in 96-well plates and then
subjected to simultaneous analysis by capillary array. This approach made it possible to run 3000 samples
in a single day [112] (Table 6).
In the research and development of mAbs, a particular area of interest is the study of immunogenic
non-human glycans. The frequency and type of non-human glycans attached to the therapeutic protein
during production differ from cell line to cell line [113]. It is well known that the non-human
oligosaccharides galactose-α-1,3-galactose (α1,3-Gal) and N-glycolylneuraminic acid (Neu5Gc) can illicit
an immune response. In fact, in response to enteric bacteria, approximately 1% of all human antibodies
are against the α1,3-Gal epitope [114].
Detection of both α1,3-Gal and Neu5Gc non-human glycans was performed by partial filling affinity
CE. In this method, a plug of either anti-Neu5Gc antibody or α-galactosidase (dissolved in BGE) was
injected on capillary prior to injection of the APTS-labeled glycans (removed from the target antibody)
[115]. Once the electric field was applied, the higher mobility sugars in the sample pass through the
antibody or enzyme plug, causing a reaction. This reaction produced additional product peaks upon LIF
detection, allowing specific detection and quantification of the two immunogenic sugars.
In another study, six commercially available mAb pharmaceuticals produced in nonhuman
mammalian cell lines were analyzed by CZE-LIF, in parallel with LC-ESI-TOF-MS, to determine the
presence of nonhuman N-glycans [116]. By CZE, forty-six fluorescently labeled N-glycans were
separated using a tris-borate BGE containing 5% PEG to slow the EOF. Of the six mAb pharmaceuticals,
three were found to contain nonhuman N-glycan residues. To obtain additional information regarding the
attachment of nonhuman N-glycans to therapeutic proteins, CZE-LIF with exoglycosidase digestion and
fluorescent tagging was used to achieve LODs of 1 μg allowing characterization of the low-abundance
α1,3-Gal epitope [117].
CE-MS can also be used in conjunction with CGE-LIF [118] to obtain additional structural
information and identify unknown glycans [2]. For example, Bunz et al. described both alkaline and

40
acidic BGE systems that could be used for the determination of APTS-labeled mAb glycans by CE-TOF-
MS [119, 120] (Table 6). The CE-MS methods were then compared against to two CGE-LIF methods
commonly used for routine glycan analysis. While both CE-MS and CGE-LIF were able to resolve and
detect the glycans, because of the difference in the separation mechanisms they had different migration
orders, making it difficult to directly compare the two electropherograms obtained for a complex sample.
The downside of glycan analysis by MS is the likelihood of unwanted fragmentation of sugars during
the ionization process. This can lead to large amounts of difficult-to-interpret data and misidentification
[121]. For this reason, it is important not only to insure careful optimization during MS method
development but to provide orthogonal analyses such as CZE-LIF or CGE-LIF to validate the findings.
41
42
2.4.2 Biosimilars
Follow-on biologics, also known as biosimilars or biobetters, is the term for the “generic”
biopharmaceuticals that have recently entered the market. The European Medicines Agency published
regulatory guidelines for biosimilars in 2005, and by 2012 there were 14 products approved for sale in
Europe [122]. In 2013 the first mAb biosimilar, Hospira’s Inflectra, hit the European market, and more
than a half-dozen prospective biosimilars are in the pipeline. In 2015, as the majority of the leading
biologics go off patent, there will be ample opportunity for established and start-up companies to begin
producing biosimilars.
While production of biosimilars is an inherently less risky venture, due to the established market and
tested safety of the innovator product, proving comparability to regulatory agencies still poses a
significant challenge. Unlike chemical synthesis of small molecule generics, the composition of biologics
is highly dependent on the manufacturing process. Small changes in production can have significant
implications on the quality. In particular, the addition of impurities, aggregation products, and/or PTMs
such as glycans can cause the protein to be immunogenic. Without detailed knowledge of how the
innovator was produced, it can be very difficult to create an identical product.
Fortunately, dozens of analytical techniques exist to verify the physicochemical and functional
comparability of the biosimilar to the innovator [123]. As discussed in the previous sections of this
chapter, electrophoretic techniques are widely used for characterization of size and charge heterogeneity,
product degradation, and PTMs. The appropriate method is generally chosen based on protein complexity,
which varies from small non-glycosylated proteins like insulin and HGH to large, heterogeneous
glycoproteins and mAbs [124].
EPO is a glycoprotein with approved biosimilars making up 12% of its market [122]. EPO has three
complex N-glycosylation sites and one O-glycosylation site, which introduce a high level of heterogeneity
into the protein. To be able to differentiate between the various formulations of EPO, or prove similarity
between innovator and biosimilar, Taichrib et al. evaluated two multivariate statistical approaches for the
43
analysis of CE-MS data [125] (Table 7). The data were generated using a CE-ESI-TOF-MS method
developed previously that exhibited high separation efficiencies and high selectivity for 14 commercially
available preparations of EPO [91]. Both statistical approaches proved useful for analyzing the similarity
or difference between large sets of glycosylated biologics that were generated under different production
conditions, cell lines, and various batch numbers.
With the upcoming mAb biologic patent cliff, much of the biosimilar research has focused on the
comparability of antibodies from various sources. Towards this end, CZE [126] and SDS-CGE [127]
techniques can be used to determine charge heterogeneity of mAbs. Using CZE, rituximab (Kikuzubam®
and Reditux®) and trastuzumab biosimilars were analyzed with respect to existing commercial products,
Mabthera® and Herceptin®, respectively [126] (Table 7). The CZE methods were then compared to
existing CIEF and chromatographic methods (HILIC and cation exchange chromatography). They found
that, not surprisingly, a single method was not sufficient to resolve and characterize a protein, putting the
emphasis on orthogonal techniques. However, they did report that CZE and CIEF gave better resolution
of the mAbs than either HILIC and cation exchange chromatography, especially when using coated
capillaries, since protein adsorption tends to lead to band broadening.
With the multitude of assays that exist, reproducibility and ruggedness is essential for widespread
biosimilar production and regulation. The innovator, the biosimilar manufacturer, and the regulatory
agency need to be certain that, despite the various laboratory conditions, the experimental results are
comparable. To help facilitate this, Salas-Solano et al. evaluated an iCIEF method in 12 different
laboratories across the world using several analysts, a variety of ampholytes, and multiple instruments
[128]. The combined precision for the 12 labs was 0.8% RSD for the pI determination and 11% RSD for
the percent peak area values for the charge variants of a therapeutic mAb. This study compared these
values to those obtained using conventional CIEF, where the RSDs for pI and peak area were of 0.8% and
5.5%, respectively [129].
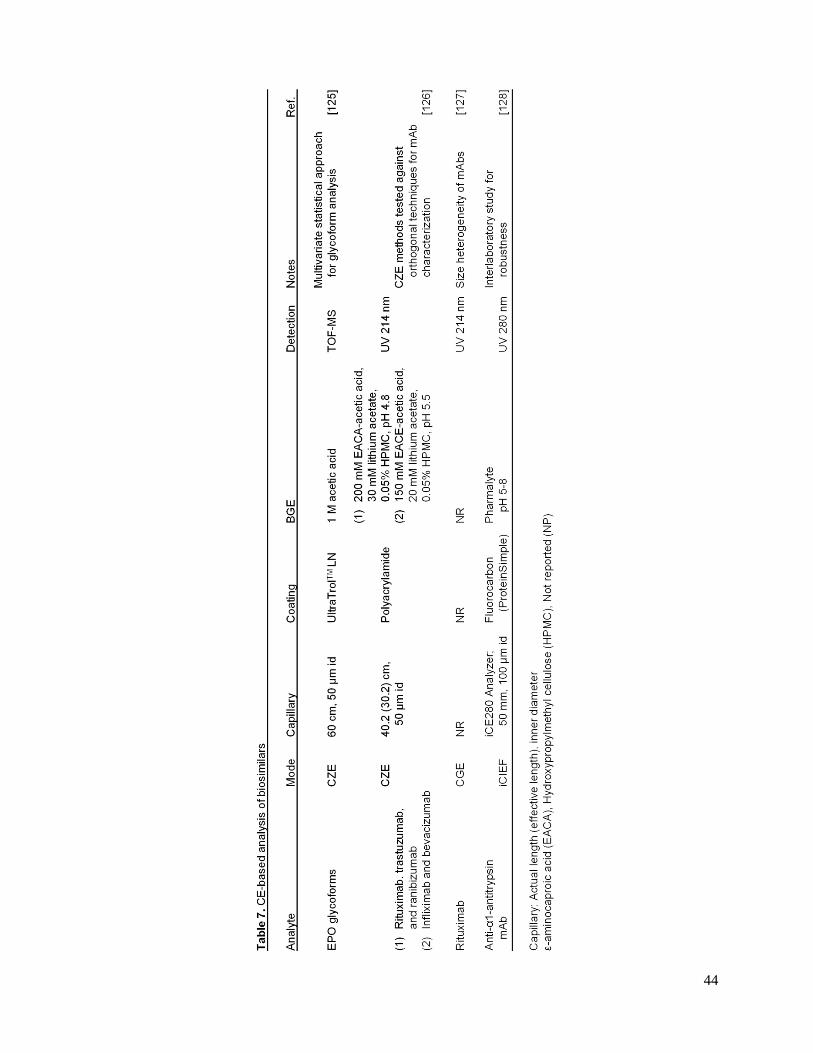
44

45
2.5 Microchip electrophoresis
Many aspects of CE, such as low sample volume requirements, speed, efficiency, and the ability to
use physiologically appropriate BGEs, make it an attractive method for the analysis of
biopharmaceuticals. The advantages CE offers over chromatography are a function of the small inner
diameter of the capillary. Consequently there has been an effort to further miniaturize bench-top CE
instrumentation to a microfluidic format. This has decreased samples sizes needed for analysis from mL
to µL, reduced analysis times from minutes to seconds, increased separation efficiencies, decreased costs,
and added the ability for portable point-of-care analysis. Additionally, multiplex ME systems can be
designed to handle high-throughput analysis on a greater scale than CE systems, making them an
attractive technology for drug discovery and analysis [130, 131].
While most CE separation modes can be transferred to ME, the majority of the current published
assays have dealt with analysis of biomarkers and small molecule drugs. Recent advances in N-glycan
profiling by ME have also been made for clinical chemistry applications [132-134]. However, as the field
of protein analysis on-chip grows, so does the possibility that the use of these devices will soon be
accepted by the FDA as a validated method, allowing them to be incorporated into industry protocols.
2.5.1 Microchip gel electrophoresis
The LabChip® GXII, a commercially available microchip gel electrophoresis (MGE) system from
PerkinElmer, is used frequently in the pharmaceutical industry [135, 136]. The commercial procedure,
which uses indirect fluorescence and a HT Protein Express gel matrix [137], was compared against two
new SDS-MGE methods, one for “high-sensitivity” and the other for “high-resolution” [138]. In the
“high-sensitivity” method, direct LIF detection of fluorescently labeled proteins was investigated. Two
labeling schemes were compared, and it was reported that performing the labeling step prior to protein
denaturation improved the signal up to 50-fold for a loading concentration LOD of 1 ng/mL. In the “high-
resolution” method, the sieving effect of the commercial gel was increased by the addition of a 6%
poly(N,N-dimethylacrylamide) (PDMA) solution. With an optimal ratio of 2:1, gel:PDMA, the assay

46
achieved resolution between Fab heterodimers without increasing the separation time. Additional high-
throughput analysis is available to process 96 samples in less than an hour.
SDS-MGE has also been integrated with Western blot immunoassay detection [139]. The separation
of a series of test proteins with a MW range of 11–155 kDa (Table 2) was performed on-chip by Jin et al.
[140]. Following the separation, the sample was eluted from the chip onto the Western blot membrane. In
order to maintain the discrete zones accomplished during the separation, the chip was held in place
vertically while the membrane moved below the outlet on an X-Y stage for spotting (Fig. 8). By carefully
controlling the membrane spotting rate and the flow from the SDS-MGE chip, separation efficiencies of
40,000 theoretical plates were possible. With this set-up, the throughput capabilities were improved with
a total analysis time of less than 32 min for the separation and immunoassay. This is a dramatic
improvement over the traditional Western assay that takes several hours to complete.
2.5.2 Microchip isoelectric focusing
ME-based systems have also been used to verify the charge heterogeneity of mAbs with microchip
isoelectric focusing (MIEF). Using a commercially available MCE-2010 system with whole-channel
imaging from Shimadzu, Kinoshita et al. were able to analyze the charge variants of several mAbs [141].
The microchip consisted of two sample wells, one containing an anolyte and the second containing a
catholyte, separated by a 2.7 cm channel. Following the separation, the whole channel was imaged with
UV detection. To reduce the EOF, 0.2% hydroxyproplymethylcellulose was added to the BGE allowing
greater focusing while preventing the non-specific adsorption of protein to the capillary wall. Using the
optimized conditions, the authors were able to separate charge variants of three commercially available
mAbs (bevacizumab, trastuzumab, and cetuximab) within 200–300 s. These separations were very
reproducible (< 0.5% RSD) and were roughly 10 times faster than the corresponding CIEF assay
(Table 3).
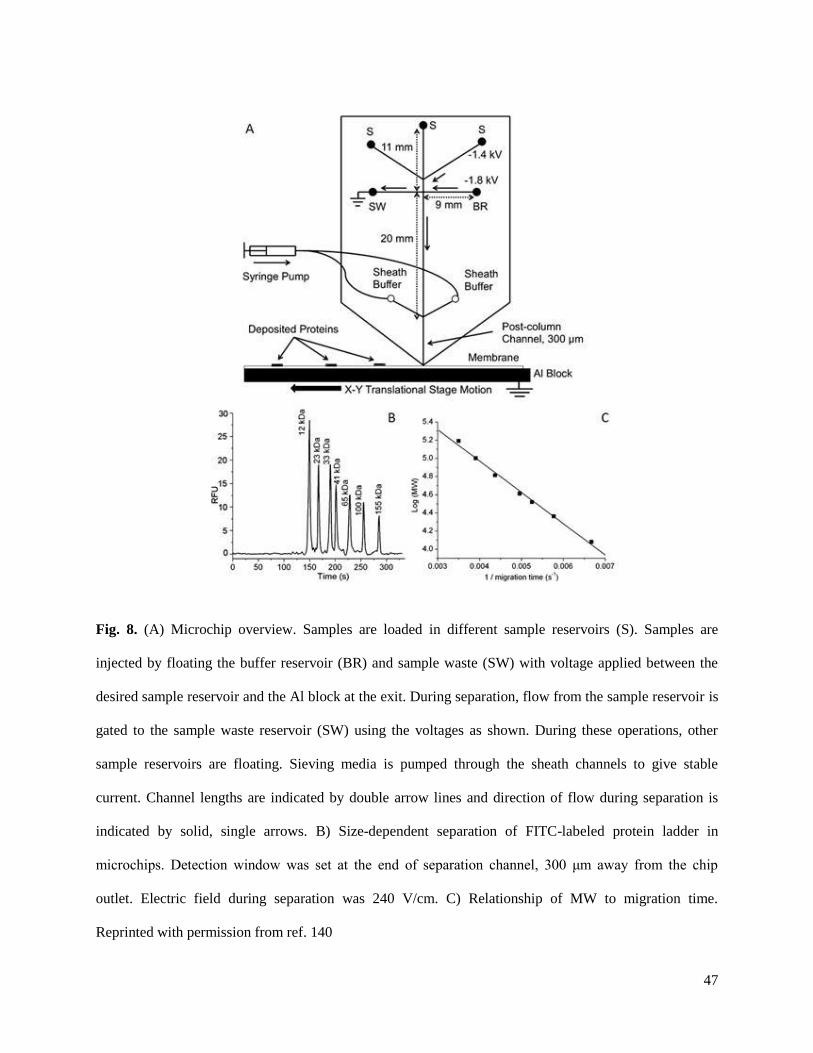
47
Fig. 8. (A) Microchip overview. Samples are loaded in different sample reservoirs (S). Samples are
injected by floating the buffer reservoir (BR) and sample waste (SW) with voltage applied between the
desired sample reservoir and the Al block at the exit. During separation, flow from the sample reservoir is
gated to the sample waste reservoir (SW) using the voltages as shown. During these operations, other
sample reservoirs are floating. Sieving media is pumped through the sheath channels to give stable
current. Channel lengths are indicated by double arrow lines and direction of flow during separation is
indicated by solid, single arrows. B) Size-dependent separation of FITC-labeled protein ladder in
microchips. Detection window was set at the end of separation channel, 300 μm away from the chip
outlet. Electric field during separation was 240 V/cm. C) Relationship of MW to migration time.
Reprinted with permission from ref. 140

48
To further improve the utility and throughput of MIEF assay a single-channel microchip device where
separation, immobilization, and subsequent immunoblot rinse steps could all be performed has been
reported [142]. Once the proteins were separated within the pH gradient they were exposed to UV light
and covalently cross-linked to a light-activated volume-accessible gel present in the microchip. This
technique gave similar capture efficiencies (≈ 0.01%) to previous reports where proteins were
immobilized on the inner surface of the capillary [42, 143]. Wash steps were performed by
electrophoretic transport on the immobilized protein without concern of sample loss. Using this technique
it was possible to complete an isoform assay in less than 120 min, up to 15x faster than the conventional
slab-gel followed by Western blot (Table 5). Such rapid purity assays illustrate the significant advantage
ME has over CE and other techniques.
2.5.3 Microchip electrophoresis-mass spectrometry
As with CE, even more specific and selective detection of analytes is possible by coupling ME to MS.
The most common ionization interface for ME with MS is ESI, but MALDI is also possible [144]. The
major benefit of ME-ESI-MS is that the flow rate on-chip is compatible with ESI and can therefore be
seamlessly interfaced without disrupting the electrophoretic separation. When constructing an ME-MS
interface, the geometry of the outlet and flow rate through the capillary must be taken into account given
their monolithic construction and integration.
An advantage of ME over CE is that sample preparation and multiple separation methods can be
integrated onto a single device prior to the ESI interface. Therefore, the excess dead volumes that are
characteristic of conventional systems are eliminated, reducing the band broadening and sample dilution.
The Ramsey group reported a fully integrated LC/CE microchip that terminated in an ESI source off the
corner of the device in 2011 [145]. The potential combination of LC and ME for a more selective and
specific separation is very powerful. In addition, the microchip flow rates are compatible with the ESI.
However, a major disadvantage of fully integrated microchips is that the increased complexity of the
device makes them difficult to fabricate.

49
Fig. 9. Schematic of the hybrid capillary LC microchip CE-ESI experimental setup. The orange line
represents a transfer capillary connecting the LC column to the microfluidic device. The dashed green
lines represent electrical connections between the high voltage power supply and the microfluidic
reservoirs. Reprinted with permission from ref. 146

50
As noted in a subsequent Ramsey paper, the fully integrated chip described above could not handle
pressures over 200 bar. Therefore, to improve on the earlier design, a glass microchip that could be
integrated with an off-chip UPLC was designed (Fig. 9). This allowed higher pressures to be reached than
were possible with the LC on-chip [145]. The new device produced significant improvements in
reproducibility and peak capacity when evaluated for the analysis of digested N-glycosylated proteins
(Table 5). Additionally, the authors point out the utility of the new design in its ability to integrate to
existing LC equipment that is already ubiquitous in industry.
2.6 Conclusions and future perspectives
The development of protein and peptide therapeutics is a complex and high-risk venture, as products
produced by recombinant expression are inherently heterogeneous. However, with advances in analytical
techniques, thorough protein characterization is possible. In particular, CE-based separation techniques
such as CZE, CGE, CIEF, and CEC provide versatile, efficient, and fast analyses of proteins.
Additionally, CE-based techniques have the potential for high-throughput analysis using capillary arrays.
The wide range of capillary-based separations can assess many aspects of protein stability, process
impurities, and PTMs such as glycolysis, each of which is essential in providing a safe, effective, and
quality product.
Microchip-based formats have the potential for increased speed, higher throughput, and portability of
CE. While the development of ME devices is still primarily an academic research area, there is
considerable promise for this miniaturized technique in the future of on-site pharmaceutical analysis.
Pharmaceutical applications of ME and CE to therapeutic protein analysis will be further expanded
through the development and commercialization of specialty capillaries, BGEs, and detection techniques.
This is especially true for CE-MS and ME-MS interfaces. With numerous reviews already existing on this
topic alone, coupling of MS with these techniques show great promise in the future for therapeutic protein
analysis.

51
2.7 References
[1] Manning, M. C., Chou, D. K., Murphy, B. M., Payne, R. W., Katayama, D. S., Pharm Res 2010,
27, 544-575.
[2] Fekete, S., Gassner, A.-L., Rudaz, S., Schappler, J., Guillarme, D., TrAC, Trends Anal. Chem.
2013, 42, 74-83.
[3] Little, M. J., Paquette, D. M., Roos, P. K., Electrophoresis 2006, 27, 2477-2485.
[4] Staub, A., Guillarme, D., Schappler, J., Veuthey, J.-L., Rudaz, S., J. Pharm. Biomed. Anal. 2011,
55, 810-822.
[5] Zhao, S. S., Chen, D. D. Y., Electrophoresis 2014, 35, 96-108.
[6] Marie, A.-L., Przybylski, C., Gonnet, F., Daniel, R., Urbain, R., Chevreux, G., Jorieux, S.,
Taverna, M., Anal. Chim. Acta 2013, 800, 103-110.
[7] Shi, Y., Li, Z., Qiao, Y., Lin, J., J. Chromatogr. B: Anal. Technol. Biomed. Life Sci. 2012, 906,
63-68.
[8] Creamer, S. T. Krauss, and S. M. Lunte, Electrophoresis, 2014, 35, 563-569
[9] Jorgenson, J. W., Lukacs, K. D., Science 1983, 222, 266-272.
[10] Lukacs, K. D., Jorgenson, J. W., HRC CC, J. High Resolut. Chromatogr. Chromatogr. Commun.
1985, 8, 407-411.
[11] Corradini, D., J. Chromatogr. B: Biomed. Sci. Appl. 1997, 699, 221-256.
[12] Watzig, H., Degenhardt, M., Kunkel, A., Electrophoresis 1998, 19, 2695-2752.
[13] Stutz, H., Electrophoresis 2009, 30, 2032-2061.
[14] Lucy, C. A., MacDonald, A. M., Gulcev, M. D., J. Chromatogr. A 2008, 1184, 81-105.
[15] Corradini, D., Nicoletti, I., Bonn, G. K., Electrophoresis 2009, 30, 1869-1876.
52
[16] Li, J., Han, H., Wang, Q., Liu, X., Jiang, S., Anal. Chim. Acta 2010, 674, 243-248.
[17] Wu, X., Wei, W., Su, Q., Xu, L., Chen, G., Electrophoresis 2008, 29, 2356-2362.
[18] Guo, X.-F., Chen, H.-Y., Zhou, X.-H., Wang, H., Zhang, H.-S., Electrophoresis 2013, 34, 3287-
3292.
[19] Cao, F., Luo, Z., Zhou, D., Zeng, R., Wang, Y., Electrophoresis 2011, 32, 1148-1155.
[20] Fu, X., Huang, L., Gao, F., Li, W., Pang, N., Zhai, M., Liu, H., Wu, M., Electrophoresis 2007,
28, 1958-1963.
[21] Kato, M., Imamura, E., Sakai-Kato, K., Nakajima, T., Toyo'oka, T., Electrophoresis 2006, 27,
1895-1899.
[22] Zhao, L., Zhou, J., Xie, H., Huang, D., Zhou, P., Electrophoresis 2012, 33, 1703-1708.
[23] Zhao, L., Zhou, J., Zhou, H., Yang, Q., Zhou, P., Electrophoresis 2013, 34, 1593-1599.
[24] de Jong, S., Epelbaum, N., Liyanage, R., Krylov, S. N., Electrophoresis 2012, 33, 2584-2590.
[25] Cooper, B. T., Sanzgiri, R. D., Maxey, S. B., Analyst (Cambridge, U. K.) 2012, 137, 5777-5784.
[26] Gassner, A.-L., Rudaz, S., Schappler, J., Electrophoresis 2013, 34, 2718-2724.
[27] Mansfield, E., Ross, E. E., Aspinwall, C. A., Anal. Chem. 2007, 79, 3135-3141.
[28] Adem, S. M., Mansfield, E., Keogh, J. P., Hall, H. K., Aspinwall, C. A., Anal. Chim. Acta 2013,
772, 93-98.
[29] Yu, B., Liu, P., Cong, H., Tang, J., Zhang, L., Electrophoresis 2012, 33, 3066-3072.
[30] Yu, B., Cui, W., Cong, H., Jiao, M., Liu, P., Yang, S., RSC Adv. 2013, 3, 20010-20015.
[31] Castelletti, L., Verzola, B., Gelfi, C., Stoyanov, A., Righetti, P. G., J. Chromatogr. A 2000, 894,
281-289.
[32] Verzola, B., Gelfi, C., Righetti, P. G., J. Chromatogr. A 2000, 874, 293-303.

53
[33] Verzola, B., Gelfi, C., Righetti, P. G., J. Chromatogr. A 2000, 868, 85-99.
[34] de Jong, S., Krylov, S. N., Anal. Chem. 2012, 84, 453-458.
[35] Zhu, Z., Lu, J. J., Liu, S., Anal. Chim. Acta 2012, 709, 21-31.
[36] Hutterer, K. M., Hong, R. W., Lull, J., Zhao, X., Wang, T., Pei, R., Le, M. E., Borisov, O., Piper,
R., Liu, Y. D., Petty, K., Apostol, I., Flynn, G. C., MAbs 2013, 5, 608-613.
[37] Lu, C., Liu, D., Liu, H., Motchnik, P., MAbs 2013, 5, 102-113.
[38] Michels, D. A., Parker, M., Salas-Solano, O., Electrophoresis 2012, 33, 815-826.
[39] Shi, Y., Li, Z., Lin, J., Anal. Methods 2012, 4, 1637-1642.
[40] Cianciulli, C., Hahne, T., Waetzig, H., Electrophoresis 2012, 33, 3276-3280.
[41] Le, M. E., Vizel, A., Hutterer, K. M., Electrophoresis 2013, 34, 1369-1374.
[42] Rustandi, R. R., Loughney, J. W., Hamm, M., Hamm, C., Lancaster, C., Mach, A., Ha, S.,
Electrophoresis 2012, 33, 2790-2797.
[43] Lu, J. J., Zhu, Z., Wang, W., Liu, S., Anal. Chem. 2011, 83, 1784-1790.
[44] Na, D. H., Park, E. J., Kim, M. S., Cho, C. K., Woo, B. H., Lee, H. S., Lee, K. C., Bull. Korean
Chem. Soc. 2011, 32, 4253-4257.
[45] Na, D. H., Park, E. J., Kim, M. S., Lee, H. S., Lee, K. C., Chromatographia 2012, 75, 679-683.
[46] Kerekgyarto, M., Fekete, A., Szurmai, Z., Kerekgyarto, J., Takacs, L., Kurucz, I., Guttman, A.,
Electrophoresis 2013, 34, 2379-2386.
[47] Shen, Y., Xiang, F., Veenstra, T. D., Fung, E. N., Smith, R. D., Anal. Chem. 1999, 71, 5348-
5353.
[48] Koshel, B. M., Wirth, M. J., Proteomics 2012, 12, 2918-2926.
[49] Righetti, P. G., Sebastiano, R., Citterio, A., Proteomics 2013, 13, 325-340.

54
[50] Wehr, T., Rodriguez-Diaz, R., Zhu, M., Capillary Electrophoresis of Proteins, Marcel Dekker,
New York 1998.
[51] Anderson, C. L., Wang, Y., Rustandi, R. R., Electrophoresis 2012, 33, 1538-1544.
[52] Rustandi, R. R., Wang, F., Hamm, C., Cuciniello, J. J., and Marley, M. L., Electrophoresis,
2014, 35, 1072-1078
[53] Rustandi, R. R., Peklansky, B., and Anderson, C. L., Electrophoresis, 2014, 35, 1065-1071
[54] Shimura, K., Hoshino, M., Kamiya, K., Enomoto, M., Hisada, S., Matsumoto, H., Novotny, M.,
Kasai, K.-i., Anal. Chem. 2013, 85, 1705-1710.
[55] Lu, J. J., Wang, S., Li, G., Wang, W., Pu, Q., Liu, S., Anal. Chem. 2012, 84, 7001-7007.
[56] Tang, Q., Harrata, A. K., Lee, C. S., Anal. Chem. 1995, 67, 3515-3519.
[57] Tang, Q., Harrata, A. K., Lee, C. S., J. Mass Spectrom. 1996, 31, 1284-1290.
[58] Foret, F., Mueller, O., Thorne, J., Goetzinger, W., Karger, B. L., J. Chromatogr. A 1995, 716,
157-166.
[59] Zhang, Z., Wang, J., Hui, L., Li, L., Electrophoresis 2012, 33, 661-665.
[60] Chingin, K., Astorga-Wells, J., Pirmoradian, N. M., Lavold, T., Zubarev, R. A., Anal. Chem.
2012, 84, 6856-6862.
[61] Zhong, X., Maxwell, E. J., Ratnayake, C., Mack, S., Chen, D. D. Y., Anal. Chem. 2011, 83,
8748-8755.
[62] Wang, C., Lee, C. S., Smith, R. D., Tang, K., Anal. Chem. 2013, 85, 7308-7315.
[63] Kuroda, Y., Yukinaga, H., Kitano, M., Noguchi, T., Nemati, M., Shibukawa, A., Nakagawa, T.,
Matsuzaki, K., J. Pharm. Biomed. Anal. 2005, 37, 423-428.
[64] Zhu, G., Sun, L., Yang, P., Dovichi, N. J., Anal. Chim. Acta 2012, 750, 207-211.

55
[65] Michels, D. A., Tu, A. W., McElroy, W., Voehringer, D., Salas-Solano, O., Anal. Chem. 2012,
84, 5380-5386.
[66] Fanali, C., D'Orazio, G., Fanali, S., Electrophoresis 2012, 33, 2553-2560.
[67] Nilsson, C., Birnbaum, S., Nilsson, S., Electrophoresis 2011, 32, 1141-1147.
[68] Gao, J., Latep, N., Ge, Y., Tian, J., Wu, J., Qin, W., J. Sep. Sci. 2013, 36, 1575-1581.
[69] Cheong, W. J., Ali, F., Kim, Y. S., Lee, J. W., J. Chromatogr. A 2013, 1308, 1-24.
[70] Miksik, I., Lacinova, K., Zmatlikova, Z., Sedlakova, P., Kral, V., Sykora, D., Rezanka, P.,
Kasicka, V., J. Sep. Sci. 2012, 35, 994-1002
[71] Hamer, M., Yone, A., Rezzano, I., Electrophoresis 2012, 33, 334-339.
[72] Qu, Q., Gu, C., Hu, X., Anal. Chem. 2012, 84, 8880-8890.
[73] Qu, Q., Gu, C., Gu, Z., Shen, Y., Wang, C., Hu, X., J. Chromatogr. A 2013, 1282, 95-101.
[74] Liu, H., Li, X., Huang, L., Zhang, L., Zhang, W., Anal. Biochem. 2013, 442, 186-188.
[75] Puangpila, C., Nhujak, T., El, R. Z., Electrophoresis 2012, 33, 1431-1442.
[76] Wang, Y., Deng, Q.-L., Fang, G.-Z., Pan, M.-F., Yu, Y., Wang, S., Anal. Chim. Acta 2012, 712,
1-8.
[77] Liu, C.-C., Deng, Q.-L., Fang, G.-Z., Liu, H.-L., Wu, J.-H., Pan, M.-F., Wang, S., Anal. Chim.
Acta 2013, 804, 313-320.
[78] Hempel, G., Electrophoresis 2000, 21, 691-698.
[79] Swinney, K., Bornhop, D. J., Electrophoresis 2000, 21, 1239-1250.
[80] de Kort, B. J., de Jong, G. J., Somsen, G. W., Electrophoresis 2012, 33, 2996-3001.
[81] Sarazin, C., Delaunay, N., Costanza, C., Eudes, V., Mallet, J.-M., Gareil, P., Anal. Chem. 2011,
83, 7381-7387.

56
[82] de Kort, B. J., de Jong, G. J., Somsen, G. W., Anal. Chim. Acta 2013, 766, 13-33.
[83] Wang, H., Dou, P., Lue, C., Liu, Z., J. Chromatogr. A 2012, 1246, 48-54.
[84] Walt, D. R., Anal. Chem. 2013, 85, 1258-1263.
[85] Ramsay, L. M., Dickerson, J. A., Dovichi, N. J., Electrophoresis 2009, 30, 297-302.
[86] Haselberg, R., de Jong, G. J., Somsen, G. W., LC GC Asia Pac. 2012, 15, 13-18.
[87] Pioch, M., Bunz, S.-C., Neusuess, C., Electrophoresis 2012, 33, 1517-1530.
[88] Haselberg, R., de Jong, G. J., Somsen, G. W., Electrophoresis 2013, 34, 99-112.
[89] Hommerson, P., Khan, A. M., de Jong, G. J., Somsen, G. W., Mass Spectrom. Rev. 2011, 30,
1096-1120.
[90] Olivares, J. A., Nguyen, N. T., Yonker, C. R., Smith, R. D., Anal. Chem. 1987, 59, 1230-1232.
[91] Taichrib, A., Pioch, M., Neusuess, C., Electrophoresis 2012, 33, 1356-1366.
[92] Bonvin, G., Schappler, J., Rudaz, S., J. Chromatogr. A 2012, 1267, 17-31.
[93] Moini, M., Anal. Chem. 2007, 79, 4241-4246.
[94] Whitt, J. T., Moini, M., Anal. Chem. 2003, 75, 2188-2191.
[95] Haselberg, R., Ratnayake, C. K., de Jong, G. J., Somsen, G. W., J. Chromatogr. A 2010, 1217,
7605-7611.
[96] Haselberg, R., de Jong, G. J., Somsen, G. W., Anal. Chem. 2013, 85, 2289-2296.
[97] Gahoual, R., Burr, A., Busnel, J.-M., Kuhn, L., Hammann, P., Beck, A., Francois, Y.-N., Leize-
Wagner, E., MAbs 2013, 5, 479-490.
[98] Whitmore, C. D., Gennaro, L. A., Electrophoresis 2012, 33, 1550-1556.
[99] Maxwell, E. J., Zhong, X., Zhang, H., van, Z. N., Chen, D. D. Y., Electrophoresis 2010, 31,
1130-1137.

57
[100] Maxwell, E. J., Zhong, X., Chen, D. D. Y., Anal. Chem. 2010, 82, 8377-8381.
[101] Zhao, S. S., Zhong, X., Chen, D. D. Y., Electrophoresis 2012, 33, 1322-1330.
[102] Zhong, X., Maxwell, E. J., Chen, D. D. Y., Anal. Chem. 2011, 83, 4916-4923.
[103] Researchmoz.us, http://www.researchmoz.us/global-and-china-monoclonal-antibody-industry-
report-2013-2017-report.html 2013.
[104] Rustandi, R. R., Anderson, C. L., Hamm, M., Glycosylation Engineering of
Biopharmaceuticals, Springer New York 2013.
[105] Behne, A., Muth, T., Borowiak, M., Reichl, U., Rapp, E., Electrophoresis 2013, 34, 2311-2315.
[106] Wuhrer, M., de, B. A. R., Deelder, A. M., Mass Spectrom. Rev. 2009, 28, 192-206.
[107] Mittermayr, S., Bones, J., Doherty, M., Guttman, A., Rudd, P. M., J. Proteome Res. 2011, 10,
3820-3829.
[108] Guttman, A., TrAC, Trends Anal. Chem. 2013, 48, 132-143.
[109] Mittermayr, S., Bones, J., Guttman, A., Anal. Chem. 2013, 85, 4228-4238.
[110] Kuo, C.-Y., Wang, S.-H., Lin, C., Liao, S. K.-S., Hung, W.-T., Fang, J.-M., Yang, W.-B.,
Molecules 2012, 17, 7387-7400.
[111] Callewaert, N., Geysens, S., Molemans, F., Contreras, R., Glycobiology 2001, 11, 275-281.
[112] Reusch, D., Haberger, M., Kailich, T., Heidenreich, A.-K., Kampe, M., Bulau, P., Wuhrer, M.,
MAbs 2013, 6, 185-196.
[113] Croset, A., Delafosse, L., Gaudry, J.-P., Arod, C., Glez, L., Losberger, C., Begue, D.,
Krstanovic, A., Robert, F., Vilbois, F., Chevalet, L., Antonsson, B., J. Biotechnol. 2012, 161, 336-
348.
[114] Galili, U., Rachmilewitz, E. A., Peleg, A., Flechner, I., J. Exp. Med. 1984, 160, 1519-1531.

58
[115] Yagi, Y., Kakehi, K., Hayakawa, T., Ohyama, Y., Suzuki, S., Anal. Biochem. 2012, 431, 120-
126.
[116] Maeda, E., Kita, S., Kinoshita, M., Urakami, K., Hayakawa, T., Kakehi, K., Anal. Chem.
2012, 84, 2373-2379.
[117] Szabo, Z., Guttman, A., Bones, J., Shand, R. L., Meh, D., Karger, B. L., Mol. Pharmaceutics
2012, 9, 1612-1619.
[118] Hamm, M., Wang, Y., Rustandi, R. R., Pharmaceuticals 2013, 6, 393-406.
[119] Bunz, S.-C., Cutillo, F., Neusuess, C., Anal. Bioanal. Chem. 2013, 405, 8277-8284.
[120] Bunz, S.-C., Rapp, E., Neusuess, C., Anal. Chem. 2013, 85, 10218-10224.
[121] Wang, Y., Santos, M., Guttman, A., J. Sep. Sci. 2013, 36, 2862-2867.
[122] Initiative, G. a. B., http://www.gabionline.net/Reports/Biosimilars-marketed-in-Europe 2012.
[123] Falconer, R. J., Jackson-Matthews, D., Mahler, S. M., J. Chem. Technol. Biotechnol. 2011, 86,
915-922.
[124] Beck, A., Diemer, H., Ayoub, D., Debaene, F., Wagner-Rousset, E., Carapito, C., Van, D. A.,
Sanglier-Cianferani, S., TrAC, Trends Anal. Chem. 2013, 48, 81-95.
[125] Taichrib, A., Pioch, M., Neusuess, C., Anal. Bioanal. Chem. 2012, 403, 797-805.
[126] Espinosa-de, l. G. C. E., Perdomo-Abundez, F. C., Padilla-Calderon, J., Uribe-Wiechers, J. M.,
Perez, N. O., Flores-Ortiz, L. F., Medina-Rivero, E., Electrophoresis 2013, 34, 1133-1140.
[127] Visser, J., Feuerstein, I., Stangler, T., Schmiederer, T., Fritsch, C., Schiestl, M., BioDrugs 2013,
27, 495-507.
[128] Salas-Solano, O., Kennel, B., Park, S. S., Roby, K., Sosic, Z., Boumajny, B., Free, S., Reed-
Bogan, A., Michels, D., McElroy, W., Bonasia, P., Hong, M., He, X., Ruesch, M., Moffatt, F.,
Kiessig, S., Nunnally, B., J. Sep. Sci. 2012, 35, 3124-3129.

59
[129] Salas-Solano, O., Babu, K., Park, S. S., Zhang, X., Zhang, L., Sosic, Z., Boumajny, B., Zeng,
M., Cheng, K.-C., Reed-Bogan, A., Cummins-Bitz, S., Michels, D. A., Parker, M., Bonasia, P., Hong,
M., Cook, S., Ruesch, M., Lamb, D., Bolyan, D., Kiessig, S., Allender, D., Nunnally, B.,
Chromatographia 2011, 73, 1137-1144.
[130] Culbertson, C. T., Mickleburgh, T. G., Stewart-James, S. A., Sellens, K. A., Pressnall, M.,
Anal. Chem. 2014, 86, 95-118.
[131] Neuzi, P., Giselbrecht, S., Laenge, K., Huang, T. J., Manz, A., Nat. Rev. Drug Discovery 2012,
11, 620-632.
[132] Mitra, I., Snyder, C. M., Alley, W. R., Novotny, M. V., Jacobson, S. C., American Chemical
Society 2013, pp. ANYL-279.
[133] Mitra, I., Alley, W. R., Goetz, J. A., Vasseur, J. A., Novotny, M. V., Jacobson, S. C., J.
Proteome Res. 2013, 12, 4490-4496.
[134] Zhuang, Z., Starkey, J. A., Mechref, Y., Novotny, M. V., Jacobson, S. C., Anal. Chem. 2007,
79, 7170-7175.
[135] Han, H., Livingston, E., Chen, X., Anal. Chem. 2011, 83, 8184-8191.
[136] Primack, J., Flynn, G. C., Pan, H., Electrophoresis 2011, 32, 1129-1132.
[137] Chen, X., Tang, K., Lee, M., Flynn, G. C., Electrophoresis 2008, 29, 4993-5002.
[138] Han, H., Chen, X., Electrophoresis 2012, 33, 765-772.
[139] Pan, W., Chen, W., Jiang, X., Anal. Chem. 2010, 82, 3974-3976.
[140] Jin, S., Anderson, G. J., Kennedy, R. T., Anal. Chem. 2013, 85, 6073-6079.
[141] Kinoshita, M., Nakatsuji, Y., Suzuki, S., Hayakawa, T., Kakehi, K., J. Chromatogr. A 2013,
1309, 76-83.
[142] Hughes, A. J., Herr, A. E., Proc. Natl. Acad. Sci. U. S. A. 2012, 109, 21450-21455

60
[143] O'Neill, R. A., Bhamidipati, A., Bi, X., Deb-Basu, D., Cahill, L., Ferrante, J., Gentalen, E.,
Glazer, M., Gossett, J., Hacker, K., Kirby, C., Knittle, J., Loder, R., Mastroieni, C., MacLaren, M.,
Mills, T., Nguyen, U., Parker, N., Rice, A., Roach, D., Suich, D., Voehringer, D., Voss, K., Yang, J.,
Yang, T., Vander Horn, P. B., Proc. Natl. Acad. Sci. U. S. A. 2006, 103, 16153-16158.
[144] He, X., Chen, Q., Zhang, Y., Lin, J.-M., TrAC, Trends Anal. Chem. 2014, 53, 84-97.
[145] Chambers, A. G., Mellors, J. S., Henley, W. H., Ramsey, J. M., Anal. Chem. 2011, 83, 842-
849.
[146] Mellors, J. S., Black, W. A., Chambers, A. G., Starkey, J. A., Lacher, N. A., Ramsey, J. M.,
Anal. Chem. 2013, 85, 4100-4106.
61
Chapter Three:
Capillary electrophoresis separation of the desamino degradation products of oxytocin
Published as:
J.S. Creamer, S.T. Krauss, S.M. Lunte, ‘Capillary electrophoresis separation of the desamino
degradation products of oxytocin’, Electrophoresis, 2014, 35, 563-569
62
3.1 Introduction
Oxytocin (OT) is a cyclic nonapeptide hormone secreted from the pituitary gland of the
hypothalamus. Traditionally, OT is used therapeutically in maternal health to induce and augment labor as
well as prevent death from postpartum hemorrhage. However, low concentrations of endogenous OT have
also been implicated in behavioral disorders such as depression, anxiety, and autism [1]. As research
progresses in this field, new therapeutic uses for OT and its analogs will be discovered. To ensure safety
and efficacy, inexpensive and fast analytical methods are needed to determine the integrity and stability of
OT.
As a biopharmaceutical drug, OT is susceptible to both chemical and physical degradation during
purification, shipping, storage, and delivery. Yet, prior to 2009, there were few reports on the specific
degradation pathways of OT. In 1981, Nachtmann et al. compiled the then current knowledge of the
physical, chemical, and pharmaceutical characteristics of OT, noting the importance of formulation pH on
the rate of degradation [2]. In the following years, several methods were published in which LC-UV was
used to determine OT quality in pharmaceutical dosage forms [3-6], including the US and EU
Pharmacopoeias [7, 8]. In these stability-indicating methods, OT was resolved from its pH-, heat-, light-,
and oxidative-stress degradation products. However, none of these reports identified the degradation
products formed. Hawe et al. were the first to publish a systematic discussion of the formation of specific
degradation products and the degradation kinetics of OT using LC-MS [9].
Deamidation is the most common chemical degradation pathway for proteins and peptides [10]. It is
not surprising then that OT undergoes deamidation under both acidic and basic conditions and that the
rate of deamidation increases with exposure to heat [9]. Proper functionality of OT at the uterine receptor
requires that both the receptor binding region (Ile3, Gln
4, Pro
7, and Leu
8) and the active site (Asn
5 and
Tyr2) be intact [11]. Both of these sites rely on amino acids with amide functional groups (Gln
4 and Asn
5).
Different combinations of deamidation at those sites, and at the amidated C-terminus, lead to a total of

63
seven possible desamino-OT species (Figure 1). It has also been shown that deamidation at each site
significantly diminishes the peptide’s biological activity [12-14].
To evaluate the extent of OT deamidation, we employed a CE-based method for analysis. CE has
several benefits over LC for peptide analysis. CE requires very little reagent use for the preparation of the
run buffer (mL), allowing the use of expensive and exotic additives without significantly increasing the
cost-per-test or waste generated by this technique. Additionally, CE is known for high efficiency
separations of both proteins and peptides. The size-to-charge based separation is particularly useful for
the identification of deamidation products [15, 16]. This is because deamidation yields an ionizable side
group from a neutral amide (R-CONH2 → R-COOH), which alters the electrophoretic mobility of the
peptide depending on the pH of the background electrolyte.
To the best of our knowledge, there is only one report that uses CE to address OT degradation. In
that report, the separation of the degradation products was performed with an acidic background
electrolyte inside positively charged, noncovalently coated capillaries [17]. At this low pH the desamino
side chains are protonated and are, therefore, neutral, producing a +1 charge for all species due to the
protonated N-terminus. Because of this, only partial resolution of OT from the desamino species was
possible. For identification of the products, the authors relied on MS to collect extracted-ion
electropherograms to identify the degradents. Additionally, the authors did not identify which specific
site(s) of the peptide had undergone deamidation, instead distinguishing only between mono- and bis-
deamidated OT.
In this chapter, a CE method is described that utilizes a modified charged β-cyclodextrin as a
pseudo-stationary phase and the organic modifier MeOH in a phosphate buffer (pH 6.0) to achieve a
separation of the seven desamino degradation products from OT. All seven of these desamino species are
detected after a 96 h heat-stressed degradation study of OT. This fast and cost-effective analysis method
makes it possible to determine the extent of OT deamidation in 12 minutes without requiring the use of
expensive, high-resolution MS.
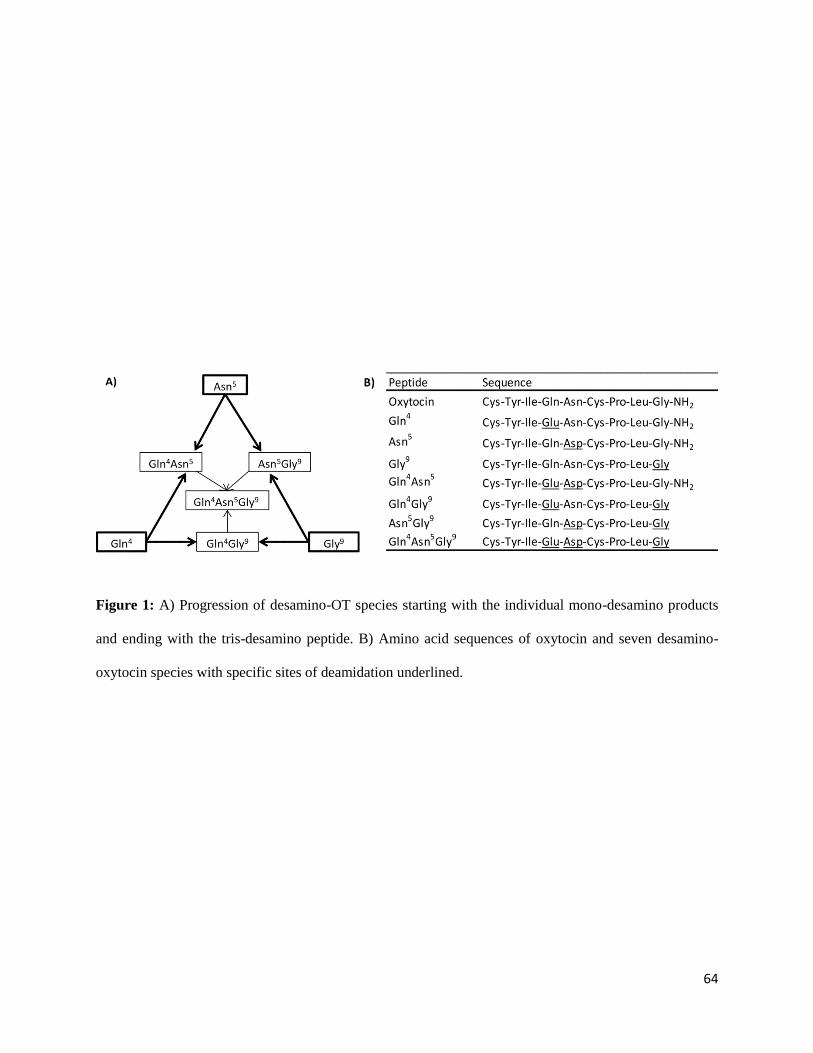
64
Figure 1: A) Progression of desamino-OT species starting with the individual mono-desamino products
and ending with the tris-desamino peptide. B) Amino acid sequences of oxytocin and seven desamino-
oxytocin species with specific sites of deamidation underlined.

65
3.2 Materials and methods
3.2.1 Chemicals and reagents
OT acetate salt was obtained from Bachem (Torrance, CA, USA). OT desamino standards of mono-
desamino at Gln4
(Gln4), mono-desamino at Asn
5 (Asn
5), mono-desamino at Gly
9-NH2
(Gly
9), bis-
desamino at Gln4 and
Asn
5 (Gln
4Asn
5),
bis-desamino at Gln
4 and Gly
9-NH2
(Gln
4Gly
9), bis-desamino at
Asn5 and
Gly
9-NH2
(Asn
5Gly
9), and tris-desamio at Gln
4, Asn
5, and Gly
9-NH2 (Gln
4Asn
5Gly
9) were
synthesized by Shanghai Mocell Biotech Co. (Shanghai, China). β-cyclodextrin, o-phosphoric acid,
monobasic sodium phosphate, dibasic sodium phosphate, HEPES, mesityl oxide (MO), acetonitrile,
methanol, dimethyl sulfoxide, concentrated HCl, and NaOH were obtained as analytical grade reagents
from Sigma Aldrich (St. Louis, MO, USA). Sulfobutyl ether β-cyclodextrin (SBE) was donated by Cydex
Pharmaceuticals (Lenexa, KS, USA).
3.2.2 Preparation of buffers
3.2.2.1. Buffer composition optimization
Several background electrolytes were investigated over a pH range of 4.0-9.0; each was prepared at
a concentration of 50 mM. The phosphate buffers (pH 4.0, 5.0, 6.0, 7.0, 8.0, and 9.0) were prepared by
mixing the appropriate amounts of acid and conjugate base as calculated by the Henderson-Hasselbalch
equation, and the pH was adjusted as needed with either 1 M NaOH or 1 M o-phosphoric acid. The
HEPES buffer (pH 7.0) was prepared by simply adding the correct amount of HEPES to water and
adjusting the pH as needed with 1 M NaOH or 1 M HCl. All buffers were prepared with 18 MΩ deionized
water (Millipore, Billerica, MA, USA) and filtered through 0.2 µm pore nylon filters before use (GE
Water and Process Technologies, Trevose, PA, USA).

66
3.2.2.2. Buffer additive optimization
Phosphate buffer stock (pH 6.0) was prepared at 100 mM and diluted daily to 50 mM with selected
buffer additives with DI water to prepare the background electrolyte (BGE). β-cyclodextrin stock was
prepared at 10 mM in 50 mM pH 6.0 phosphate buffer and diluted with buffer to 1, 5, and 10 mM. SBE
stock was prepared at 100 mM in water and was added to BGE at 1-12 mM (in increments of 1 mM).
The organic solvents ACN and MeOH were added to the BGE at concentrations 1-20 % v/v (in
increments of 5 %), while DMSO was evaluated at 1 and 5 % v/v. Any pH change due to the addition of
organic solvents was not corrected for (ie. 10% MeOH can increase the pH up to 0.2 units). All
measurements of the EOF were done with a 0.3% v/v solution of MO into BGE.
3.2.3 Standard preparation
For all BGE optimization and spiking studies, standard solutions of OT and the desamino peptides
were made daily by dissolving a measured amount of the lyophilized peptide into 50 mM phosphate
buffer, pH 2.0. The 50 mM phosphate buffer was prepared at pH 2.0 by combining the appropriate
amounts of o-phosphoric acid (15 M) and monobasic sodium phosphate.
3.2.4 Equipment conditions
Separations were performed on a Beckman Coulter P/ACE MDQ (Brea, CA, USA) with UV
detection (214 nm). The system was controlled using 32-Karat software. Subsequent data analysis was
performed using this software and Origin 8.6 (Northamption, MA, USA). A 50 cm fused silica capillary
(50 mm id × 360 mm od) from Polymicro Technologies (Phoenix, AZ, USA) was used for the separation,
and a small window was burned into the polyimide coating 10 cm from the capillary end for detection.
Each day, prior to use, the capillary was conditioned by rinsing for 5 min with 0.1 M HCl, water,
methanol, water, 0.1 N NaOH, water, and for 10 min with BGE. To expedite equilibration of the buffer
within the capillary, a 20 kV potential was applied across the capillary for 25 min following the
conditioning. To maintain separation efficiency, the capillary was rinsed for 3 min with 0.1 M HCl, water,
67
0.1 N NaOH, water, and BGE between every run. Pressure injections were performed at 1 psi for 5.0 s. A
separation voltage of 20–30 kV was applied.
3.2.5 Acid-catalyzed deamidation of oxytocin
Lyophilized OT acetate was dissolved at 0.1 mg/mL in 50 mM phosphate buffer (pH 2.0) and sealed
in borosilicate glass vials with TFE-lined caps (Fisher Scientific, Fairlawn, NJ, USA). To track the
degradation, the sealed vials were placed in a water bath at 70 °C, and aliquots were removed at regular
intervals. The extent of degradation was monitored by measuring the OT peak height using CE-UV. The
pH of the blank (50 mM phosphate buffer, pH 2.0) was monitored at the start and end of every
experiment and was found to fluctuate within ± 0.2 pH units.
3.3 Results and discussion
3.3.1 Separation optimization
3.3.1.1. BGE selection
Initially, phosphate buffer was investigated over a pH range of 4-9 as a potential background
electrolyte (BGE) for the analysis of OT and its desamino degradation products. To evaluate the
usefulness of phosphate as a BGE, migration time reproducibility, separation current, and separation
efficiency were determined for triplicate runs of the OT standard. At the low pH (4-5) the EOF was
significantly reduced, causing increased migration times and poor separation efficiency. The
reproducibility increased with the pH from 6-7 with minimal improvements past pH 7, while the
efficiency of the separation improved continually from pH 6-9. However, the separation current also
increased significantly over this pH range.
To avoid high currents which can lead to band broadening, HEPES, a low conductivity buffer, was
also tested. However, this BGE resulted in large system peaks, possibly due to difference in conductivity
between the BGE and the sample. For this reason HEPES was excluded from further buffer studies. It was
68
concluded that 50 mM phosphate buffer at pH 6.0 provided the best separation efficiency while
maintaining a relatively low current, and it was implemented for further optimization.
With 50 mM phosphate buffer at pH 6.0 as the BGE, the initial separation of OT and the seven
desamino-OT standards gave four distinct peaks. From spiking studies, the peaks were identified as OT,
the three mono-desamino OT species, the three bis-desamino OT species, and finally the tris-desamino
OT species. Given the similar size of the analytes, it is not surprising that species migrated based on their
overall charge (+1, 0, –1, and –2, respectively). Additional optimization of buffer additives was
performed to increase the resolution of these species.
3.3.1.2. CD additives
Under the free zone electrophoresis conditions mentioned above, it was not possible to resolve the
multiple mono- and bis-desamino species from one another due to their identical size-to-charge ratios. In
order to improve the separation, cyclodextrins were investigated due to their ability to act as a pseudo-
stationary phase. The cyclodextrins form inclusion complexes with hydrophobic peptide residues, such as
the Tyr2 residue of OT, thereby increasing the apparent size of the peptide and changing its mobility.
However, the addition of neutral β-cyclodextrin to the BGE yielded no noticeable improvement in
resolution because, based on hydrophobicity alone, the selectivity for peptide inclusion would be identical
for each species.
To introduce more selectivity for the separation, sulfobutyl ether-modified β-cyclodextrin (SBE) was
evaluated. When the peptide associates with the SBE, both its size and overall negative charge increase,
significantly reducing the electrophoretic mobility. Positively charged OT has the highest affinity for the
SBE and, as the concentration of SBE in the BGE was increased, the migration time of OT increased.
This is illustrated in the plot of the migration time of the analytes, relative to the EOF maker MO, versus
SBE concentration shown in Figure 2a.

69
The mono-desamino species have a weaker interaction with the SBE than OT does. The additional
negative charge from the deamidated side group creates an electrostatic repulsion with the negatively
charged cyclodextrin, lowering the binding constant. However, a significant improvement in selectivity
was introduced by the addition of the SBE. Fig. 2 shows that by increasing the concentration of SBE from
0 to 11 mM it was possible to completely separate all three mono-desamino species (peaks 1, 2, and 6).
This is extremely useful since they are neutral species at this pH and, without the negatively charged
SBE, they would be impossible to separate with only free-zone electrophoresis. The enhanced selectivity
most likely comes from the relative position of the mono-desamino site to the Tyr2 residue.
As OT deamidation progresses, increasing the peptide’s overall negative charge, a less dramatic shift
in relative migration time was observed with the bis-desamino species due to decreased interaction with
the SBE. At 11 mM SBE, Gln4Asn
5 (peak 3) is resolved from Asn
5Gly
9 and Gln
4Gly
9 which remain co-
migrated (peak 4/5). However, when all the standards were run together, Gln4Asn
5 was found to co-
migrate with the mono-desamino Gln4 (peak 2/3) as shown in Figure 2b.
At all concentrations of SBE, Gln4Asn
5Gly
9 migrates last (peak 8), showing a small difference in
migration time with respect to the EOF. This indicates a minimal interaction with the SBE due to
electrostatic repulsion from the three deamidated sites.
3.3.1.3. Organic modifiers
To further resolve the co-migrating species (Gln4/Gln
4Asn
5 and Asn
5Gly
9/Gln
4Gly
9), the organic
solvents DMSO, ACN, and MeOH were evaluated as modifiers to the BGE. The organic solvent in the
BGE alters the hydrophobic affinity of the cyclodextrin for the peptide, changing the binding constant and
therefore affecting the relative electrophoretic mobilities. Neither DMSO nor ACN exhibited an
appreciable benefit to the separation at any concentration. ACN increased the EOF, which in turn
increased the separation efficiency; however, the resolution of all species was lost as a result. DMSO at 1
% v/v did not change the separation in any way; yet increasing the concentration to 5 % v/v resulted in an
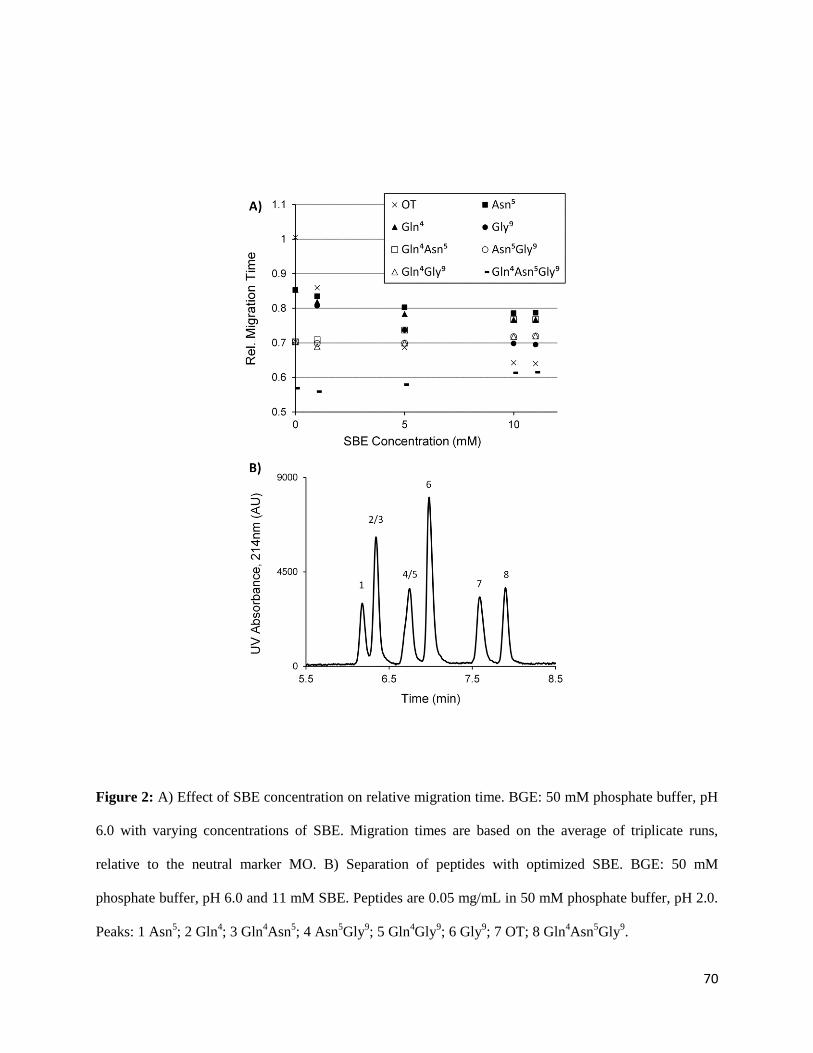
70
Figure 2: A) Effect of SBE concentration on relative migration time. BGE: 50 mM phosphate buffer, pH
6.0 with varying concentrations of SBE. Migration times are based on the average of triplicate runs,
relative to the neutral marker MO. B) Separation of peptides with optimized SBE. BGE: 50 mM
phosphate buffer, pH 6.0 and 11 mM SBE. Peptides are 0.05 mg/mL in 50 mM phosphate buffer, pH 2.0.
Peaks: 1 Asn5; 2 Gln
4; 3 Gln
4Asn
5; 4 Asn
5Gly
9; 5 Gln
4Gly
9; 6 Gly
9; 7 OT; 8 Gln
4Asn
5Gly
9.

71
electropherogram with zero peaks, probably due to a significant decrease in the EOF. MeOH not only
changed the polarity of the BGE, it also slightly decreased the EOF, increasing the resolution. With 10 %
v/v MeOH, it was possible to achieve a complete separation of all seven desamino species from OT.
Figure 3a demonstrates the change in migration time (relative to the EOF) versus the concentration of
MeOH.
3.3.1.4. Separation voltage
The effect of voltage on the separation efficiency was investigated by increasing the separation
voltage from 20–30 kV, in increments of 2 kV, and calculating the theoretical plates and resolution of the
peptides in the resulting electropherograms. Based on these experiments, 22 kV was chosen for the
greatest separation efficiency without loss of resolution due to Joule heating. An electropherogram
demonstrating the fully optimized separation of all eight species is shown in Figure 3b.
3.3.2 Separation parameters
The linear range of this assay is 2.5-100 µM for all analytes, except Gln4, which exhibited a linear
range of 5-100 µM. For all peptide calibration curves the R2 value was greater than 0.9995 (n = 3 for five
concentrations). The LOD (S/N = 3) and LOQ (S/N = 10) are provided in Table 1. It should be noted that
a common concentration for OT in maternal health therapeutics is 10 IU/mL (approximately 20 µM).
While this concentration falls well within the linear range of the assay, the LOQ for OT on the current
system is not ideal for research or quality control settings. However, it would be possible to improve the
low sensitivity with improved CE-UV technology such as a bubble cell or Z-shaped capillaries [18].
Migration time can be a helpful tool for peak identification. However, CE is notorious for irreproducible
migration times due to changes in the EOF over time and slight differences in BGE additive
concentration. To improve the %RSD for the migration times of all species, the desamino peak

72
Figure 3: A) Effect of MeOH concentration on relative migration time. BGE: 50 mM phosphate buffer,
pH 6.0, 11 mM SBE with varying concentrations of MeOH. Migration times are based on the average of
triplicate runs, relative to the neutral marker MO. B) Optimized separation of peptides. BGE: 50 mM
phosphate buffer, pH 6.0,11 mM SBE, 10 % v/v MeOH. Peptides are 0.05 mg/mL in 50 mM phosphate
buffer, pH 2.0. Peaks: 1 Asn5; 2 Gln
4; 3 Gln
4Asn
5; 4 Gly
9; 5 Asn
5Gly
9; 6 Gln
4Gly
9; 7 OT; 8
Gln4Asn
5Gly
9.

73
migration times were taken relative to the OT peak. Table 1 provides the %RSD values for the migration
time and relative migration times of the desamino peaks.
3.3.3 Tracking degradation in heat-stressed oxytocin samples
The heat-stressed degradation of OT was monitored using the optimized separation described above.
OT was prepared at 0.1 mg/mL in acidic conditions (pH 2.0) to ensure that the primary degradation
pathway was acid-catalyzed deamidation. Three samples were degraded concurrently at 70 °C over the
course of 5 days, sampling every 12 hours.
The degradation of OT was determined by monitoring the peak heights of all species as a function of
time. Using the method described in this paper, it was possible to monitor the appearance and
disappearance of OT and all seven desamino species over the 5 day period. In Figure 4a,
electropherograms from five different time points (time points 10, 34, and 58 h excluded for clarity) are
stacked to illustrate the extent of degradation over time. t = 0 h shows one peak in the electropherogram
corresponding to OT. All subsequent peaks of the degradation products were identified by migration time
relative to OT and by spiking studies.
At t = 24 h, the OT peak height was diminished slightly, giving rise to the three mono-desamino
species. The concentration of both Gln4 and Gly
9 (peaks 2 and 4) increased over time, cresting at the 72 h
time point, seen more clearly in Figure 4b. However, the height of the Asn5 peak (peak 1) stayed at a
fairly constant low concentration from 10-72 h. This could be indicative of the relative reactivity between
the deamidation sites due to the secondary structure of the peptide. Structural studies of OT have shown
hydrogen bond formation between the hydroxyl group of the Tyr2 and the carboxamide of Asn
5, which
would decrease the likelihood of deamidation at this site [19].
As the sample continued to degrade at 70 °C, the mono-desamino species gave rise to the bis-desamino
species. Due to the low reactivity of Asn5, both Gln
4Asn
5 and Asn
5Gly
9 (peaks 3 and 5) were
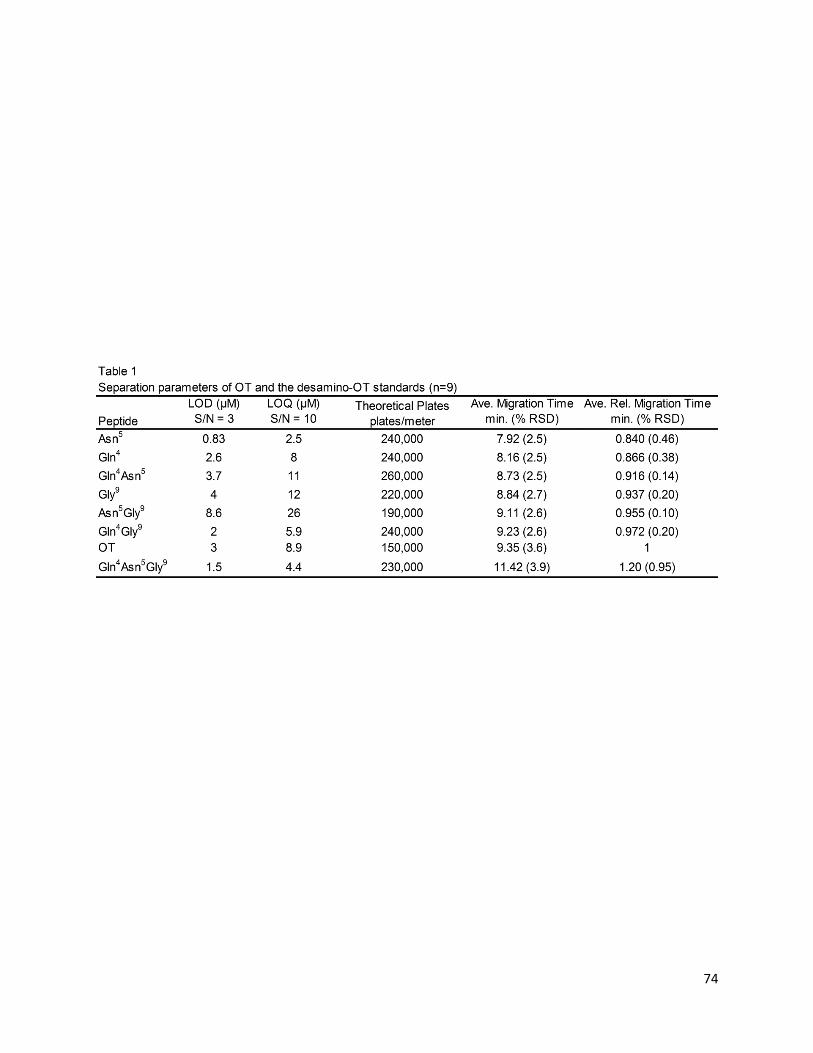
74

75
Figure 4: A) Degradation time points of heat-stressed oxytocin. BGE: 50 mM phosphate buffer, pH 6.0,
11 mM SBE, 10 % v/v MeOH. Peaks: 1 Asn5
(■); 2 Gln4
(▲); 3 Gln4Asn
5 (□); 4 Gly
9 (●); 5 Asn
5Gly
9
(○); 6 Gln4Gly
9 (Δ); 7 OT; 8 Gln
4Asn
5Gly
9 (x). B) Formation of desamino-OT products over time at 70
°C. Initial OT concentration was 0.1 mg/mL in 50 mM phosphate buffer, pH 2.0.

76
first seen at 34 h and remained in low concentrations over the course of the study. The more reactive sites
of Gln4 and Gly
9 led to a steady increase in the presence of Gln
4Gly
9 (peak 6) from 24-96 h.
The Gln4Asn
5Gly
9 species was first observed as a small peak in the t = 48 h time point, and its peak
height steadily increased until the end of the study. Notably, using the LC-MS method, the appearance of
Gln4Asn
5Gly
9, Asn
5, and Gln
4Asn
5 was either not observed or not at high enough concentrations to be
detected by the method [9].
From this degradation study, the kinetics for the disappearance of OT (n = 3) were calculated to be
pseudo-first order with a kobs of 0.465 days-1
(3.4% RSD) and a t1/2 of 1.5 days (3.9% RSD). This half-life
is similar to that reported by Hawe et al., 1.1 days with a less than 5% RSD [9]. At each time point, all of
the peaks were accounted for by mass balance (104% ± 5), by adding up the peak heights and comparing
them to the initial OT peak. This indicates no sample loss by adsorption on the capillary wall or by
precipitation in the sample vial during degradation.
3.4 Concluding remarks
A CE-UV method to separate the desamino degradation products of OT has been described.
Deamidation creates seven desamino-OT species with structures very similar in size and charge, making
resolution with free zone electrophoresis a challenge. To resolve the many desamino degradation species
with identical size-to-charge ratios, it was necessary to include the pseudo-stationary phase SBE as well
as the organic modifier MeOH in the BGE. Using this approach, the heat-stressed degradation of OT in
acidic buffer was monitored over time. All seven desamino degradation products were detected over a 96
h heat-stress period at 70 °C in acidic conditions.
For this study, formulation in a pH 2.0 buffer was chosen to force deamidation to be the major
degradation pathway of OT. However, as reported by both Hawe et al. and Hasselberg et al., OT
degradation is pH dependent and deamidation is not the major pathway at higher pHs [9, 17]. At the

77
pharmaceutically relevant pH 4.5, both papers report minimal deamidation, with the formation of both
dimers and tri- and tetrasulfide as the primary degradation species.
Preliminary results from analysis of heat-stressed OT at pH 4.5 with the assay described in this
paper, corroborate the previous reports showing little deamidation after 96 h under 70 °C heat-stress
conditions. Additional work is ongoing to modify the current assay and create a comprehensive CE-UV
method for the determination of all degradation species of OT.
Having a low-cost and fast CE-UV method for OT analysis will enhance the field of study by
allowing more labs to participate in research without having to invest in expensive LC-MS
instrumentation. Additionally, CE has the potential for miniaturization through method transfer to
microchip electrophoresis (ME), reducing the cost-per-test and analysis time even further. ME allows
portability, which increases the range of the assay to places like developing countries, where traditional
laboratory equipment is not readily available.
78
3.5 References
[1] Miller, G., Science. 2013, 339, 267-269.
[2] Nachtmann, F., Krummen, K., Maxl, F., Riemer, E., Analytical Profiles of Drug Substances 1981, 10,
563-600.
[3] Ohta, M., Fukuda, H., Kimura, T., Tanaka, A., J. Chromatogr. 1987, 402, 392-395.
[4] Dudkiewicz-Wilczynska, J., Snycerski, A., Tautt, J., Acta Pol. Pharm. 2000, 57, 403-406.
[5] Wang, G., Miller, R. B., Melendez, L., Jacobus, R., J. Liq. Chromatogr. Relat. Technol. 1997, 20,
567-581.
[6] Chaibva, F. A., Walker, R. B., J. Pharm. Biomed. Anal. 2007, 43, 179-185.
[7] European Pharmacopoeia 5th Edition 2005, 2174-2175.
[8] Callahan, L. N., Pharmacopeial Forum 2007, 29, 1946.
[9] Hawe, A., Poole, R., Romeijn, S., Kasper, P., van, d. H. R., Jiskoot, W., Pharm. Res. 2009, 26, 1679-
1688.
[10] Cornell, M. M., Chou, D. K., Murphy, B. M., Payne, R. W., Katayama, D. S., Pharm. Res. 2010, 27,
544-575.
[11] Walter, R., Schwartz, I. L., Darnell, J. H., Urry, D. W., Proc. Nat. Acad. Sci. U. S. 1971, 68, 1355-
1359.
[12] Photaki, I., du, V. V., J. Am. Chem. Soc. 1965, 87, 908-913.
[13] Branda, L. A., Du, V. V., J Biol Chem 1966, 241, 4051-4054.
[14] Ferrier, B. M., Vigneaud, V. d., J. Med. Chem. 1966, 9, 55-57.
[15] Lai, M., Skanchy, D., Stobaugh, J., Topp, E., J. Pharm. Biomed. Anal. 1998, 18, 421-427.
[16] Mandrup, G., J. Chromatogr. 1992, 604, 267-281.

79
[17] Haselberg, R., Brinks, V., Hawe, A., de, J. G. J., Somsen, G. W., Anal. Bioanal. Chem. 2011, 400,
295-303.
[18] Hempel, G., Electrophoresis 2000, 21, 691-698.
[19] Urry, D. W., Walter, R., Proc. Nat. Acad. Sci. U. S. 1971, 68, 956-958.

80

81
Chapter Four:
Investigation into the Effect of Chlorobutanol on the Stability of Oxytocin

82
4.1 Introduction
Capillary electrophoresis (CE) provides a distinct cost advantage over high performance liquid
chromatography (HPLC) as a separation method for quantitative analysis in developing countries. Most
background electrolytes (BGEs) used for CE are composed of inexpensive aqueous buffers and, when
more expensive additives are necessary, the low volume requirements and minimal reagent use keep the
cost-per-test low. Additionally, the instrumentation cost for CE is significantly lower than HPLC. CE-UV
instrumentation for use in developing countries is available for $10,000 [1] and has been used for
counterfeit pharmaceutical detection of small molecule drugs using previously published methods [2].
However, inexpensive CE based methods for the analysis of biopharmaceuticals are still needed. The
overall aim of this project is to develop a CE-based method for the separation and detection of oxytocin
(OT) and all of its degradation products formed in pharmaceutical preparations under heat-stress
conditions. Building on the work described in chapter three of this dissertation, where the desamino
degradation products of OT are separated by CE [3], chapter four investigates the other degradation
products formed in OT pharmaceutical formulations.
OT is an important biopharmaceutical used to induce labor and treat post-partum hemorrhage
(PPH). In developing countries PPH is the leading cause of maternal death, killing approximately 250,000
women per year. These deaths can largely be attributed to the lack of effective obstetric care and
treatment, including access to OT. The challenge to achieving widespread distribution of OT is due in part
to the inconsistent availability of cold-chain shipping and storage in low-resource areas. Peptide drugs are
known to undergo a variety of chemical and physical degradation pathways at elevated temperatures [4],
and World Health Organization (WHO) studies have shown that both solid dose and injectable OT rapidly
degrade in “tropical climates” [5]. Currently, these complex degradation pathways lead to a variety of
compounds that are not easily distinguishable from OT itself without the use of expensive HPLC
instrumentation to separate the different products.

83
Historically, HPLC with UV detection has been the primary tool for analysis of OT. Many LC-
based methods have been reported to measure the quantity of OT in pharmaceutical preparations [6-8].
LC-based stability indicating methods also exist that make it possible to resolve OT from degradation
products generated during oxidation, acid, base, and thermal stress [9, 10]. However, it was not until 2009
that the identification of the specific degradation products formed during heat-stress (Table 1) was
accomplished by Hawe et al. using LC-MS [11]. Additional studies regarding the mechanism of
degradation of OT were published last year by Wisniewski et al. (Figure 1) [12].
In the degradation studies performed by Hawe and Wisniewski, OT was formulated in phosphate
buffers over a range of pH 2.0, 4.5, 7.0 and 9.0. This was done to control the pH, which plays a
significant role in OT degradation kinetics and product formation. However, the injectable form of OT is
not formulated in phosphate buffer. According to the package insert, Pitocin, a synthetic injectable OT, is
formulated in water that has been pH adjusted to a value between pH 3 and 5 with acetic acid, and
contains 0.5% w/v chlorobutanol (CB) as a preservative (Watson Labs, Teva Pharmaceuticals). In this pH
range, acetic acid can act as a buffer; however, at low concentrations its buffer capacity is poor.
Therefore, it is possible that a different set of degradation products will be formed.
In this chapter, OT degradation is investigated in a solution similar that of the pharmaceutical
preparation. This study was carried out using LC-UV-MS to monitor the degradation kinetics of OT as
well as the appearance of known degradation products of OT, in the presence and absence of several CB
and CB-like additives. The effect of CB on the degradation was of specific interest because the presence
of antimicrobial preservatives (APs) has been shown by others to influence the stability of a wide range of
biopharmaceuticals [13]. Previous reports have shown that the stability of insulin is profoundly improved
by the addition of phenol or m-cresol through formation of additional helical segment of the N-terminus
of the B-chain [14]. In contrast, the addition of both alkyl and aromatic alcohol APs lead to increased
aggregation of cytochrome c by promoting partial protein unfolding [15]. To the best of our knowledge
there are no reports that specifically address the effects of CB on the stability of OT.

84

85
Figure 1: Proposed mechanism of degradation for oxytocin in solution. The solid arrows follow the major
pathway of degradation. For simplicity the parts of the molecules that do not participate in the outlined
mechanism are represented by a dashed line. Reprinted with permission from Wisniewski et al.

86
4.2 Materials and methods
4.2.1 Chemicals and reagents
OT acetate powder was obtained from Bachem (Torrance, CA). Analytical grade reagents 2,2,2-
trichloroethanol (TCE), ammonium acetate, benzyl alcohol (BA), CB (trichloro-2-methyl-2-propanol),
dibasic sodium phosphate, ethanol, glacial acetic acid, isopropyl alcohol, monobasic sodium phosphate,
o-phosphoric acid, sodium hydroxide, tert-butanol (TBA), and trichloroacetic acid (TCA) were received
from Sigma Aldrich (St. Louis, MO). Optima LC/MS grade ACN was purchased from Fisher Scientific
(Fair Lawn, NJ).
4.2.2 Preparation of oxytocin formulations
The stock solution of 50 mM pH 4.5 phosphate buffer was prepared by mixing the necessary
amount of mono- and dibasic sodium phosphate with any further pH adjustment performed as needed by
the addition of 1 M NaOH or 1 M o-phosphoric acid. The unbuffered water solution was prepared by
adjusting the pH of nanopure water to 4.0 with 99.9% glacial acetic acid (≈ 0.9 mM). The APs were then
added to appropriate solution at 0.5% w/v as shown in Table 2. For formulation H, after the addition of
TCA to unbuffered water/acetic acid, the solution pH dropped below 2.0 and required further pH
adjustment with the addition ammonium acetate (final concentration 40 mM ammonium acetate with
4.8% w/v TCA) to reach pH 4.0. All solutions were prepared with 18 MΩ nanopure water (Millipore,
Billerica, MA) and filtered through 0.45 µm pore nylon filters before use (FisherBrand, Fisher Scientific).
The solutions were stored at 4 °C for no more than one week prior to use. Due to the low solubility of CB,
all solutions were brought to room temperature and sonicated for 15 min prior to the addition of OT.

87
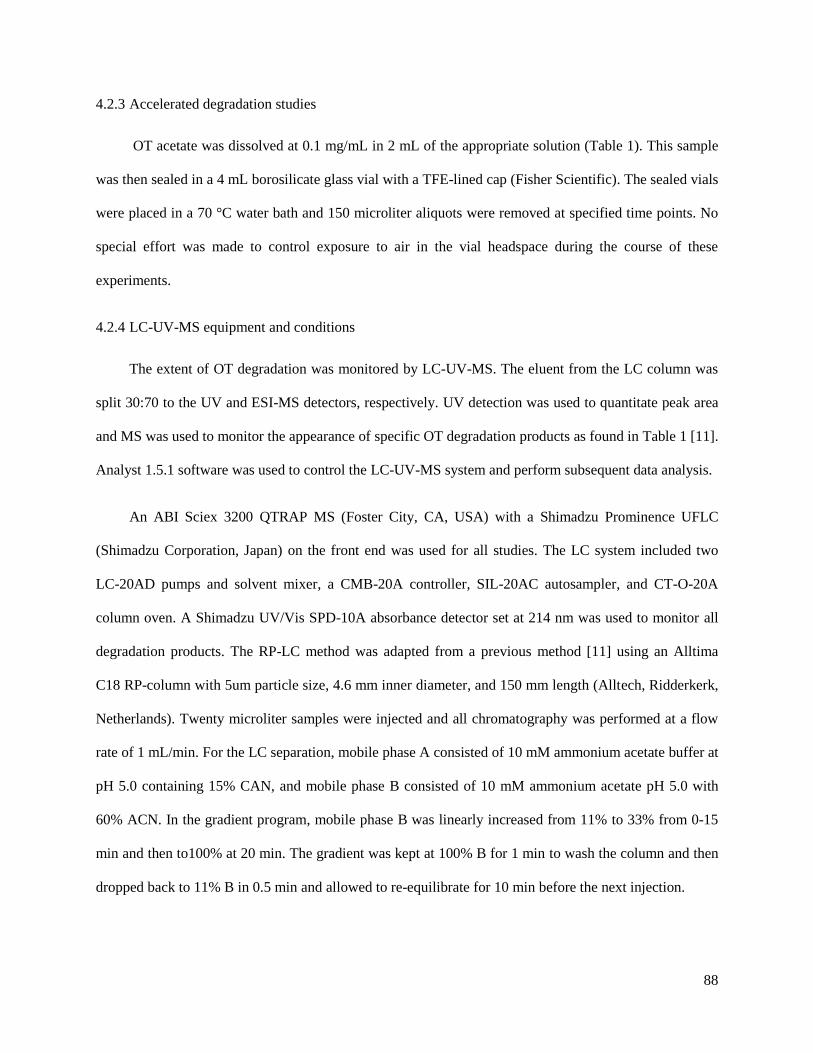
88
4.2.3 Accelerated degradation studies
OT acetate was dissolved at 0.1 mg/mL in 2 mL of the appropriate solution (Table 1). This sample
was then sealed in a 4 mL borosilicate glass vial with a TFE-lined cap (Fisher Scientific). The sealed vials
were placed in a 70 °C water bath and 150 microliter aliquots were removed at specified time points. No
special effort was made to control exposure to air in the vial headspace during the course of these
experiments.
4.2.4 LC-UV-MS equipment and conditions
The extent of OT degradation was monitored by LC-UV-MS. The eluent from the LC column was
split 30:70 to the UV and ESI-MS detectors, respectively. UV detection was used to quantitate peak area
and MS was used to monitor the appearance of specific OT degradation products as found in Table 1 [11].
Analyst 1.5.1 software was used to control the LC-UV-MS system and perform subsequent data analysis.
An ABI Sciex 3200 QTRAP MS (Foster City, CA, USA) with a Shimadzu Prominence UFLC
(Shimadzu Corporation, Japan) on the front end was used for all studies. The LC system included two
LC-20AD pumps and solvent mixer, a CMB-20A controller, SIL-20AC autosampler, and CT-O-20A
column oven. A Shimadzu UV/Vis SPD-10A absorbance detector set at 214 nm was used to monitor all
degradation products. The RP-LC method was adapted from a previous method [11] using an Alltima
C18 RP-column with 5um particle size, 4.6 mm inner diameter, and 150 mm length (Alltech, Ridderkerk,
Netherlands). Twenty microliter samples were injected and all chromatography was performed at a flow
rate of 1 mL/min. For the LC separation, mobile phase A consisted of 10 mM ammonium acetate buffer at
pH 5.0 containing 15% CAN, and mobile phase B consisted of 10 mM ammonium acetate pH 5.0 with
60% ACN. In the gradient program, mobile phase B was linearly increased from 11% to 33% from 0-15
min and then to100% at 20 min. The gradient was kept at 100% B for 1 min to wash the column and then
dropped back to 11% B in 0.5 min and allowed to re-equilibrate for 10 min before the next injection.
89
All 3200 QTRAP MS experiments were conducted using ESI in the positive ion mode. All
parameters were optimized using the automated tune function in the Analyst software. This program
checked for a response from the compound of interest in a standard solution of 0.1 mg/mL OT in 50:50
ACN:H2O. Optimization for the most intense Q1 signal was then performed by increasing and decreasing
the voltages that control the path of the ion through the MS. Optimization of the compound-specific
parameters was accomplished by direct infusion, while the optimization of curtain gas, ion source gas 1,
and ion source gas 2, as well as the source temperature, was performed with flow injection analysis to
account for the composition of the mobile phase and LC flow rate.
4.3 Results and discussion
This chapter describes the results of a pilot study done with the goal to explore the effect of CB and
CB-like additives on the degradation of OT under heat-stress conditions. Each formulation was tested
with an n=1 so no statistically significant conclusions can be drawn. However, the results described below
provide a starting point and indicate the potential directions for further research should this project be
continued in the future.
4.3.1 Q1 scan range optimization
The 3200 QTRAP can function as either a triple quadrupole MS or as a sensitive ion trap MS for
qualitative analysis. Triple quadrupole mass analyzers are best suited for compound identification based
on detection of the product ions formed from the unique fragmentation pattern of the molecule of interest.
A quadrupole analyzer (Q) is made up of four parallel metal rods used to create an oscillating electric
field through which the ions from the ESI pass (Figure 2i). Based on the voltages applied to the rods, only
ions with specific mass-to-charge ratios will reach the detector plate. A triple quadrupole has three of
these Q analyzers in series. The samples enter the instrument and pass through the Q1 where specific
masses are focused and sent to Q2, also referred to as the collision cell. In this second quadrupole, the
precursor ions are bombarded by a neutral collision gas, typically nitrogen or argon. Selected product ions
are then isolated and focused in Q3 before being sent to the detector plate (Figure 2ii). This ion selection

90
Figure 2: Cartoon schematics of the i) ESI source and quadrupole analyzer and ii) arrangement of
quadrupole analyzers in a triple quadrupole mass spectrometer.
i
ii
i

91
process is referred to as multiple reaction monitoring (MRM). The best sensitivity is gained in MRM
where the MS selects for the specified ions, lowering the baseline by effectively filtering out unwanted
signal from the sample [16].
For the purposes of this exploratory study, the 3200 QTRAP was used qualitatively to scan for
peptides of specific masses in an attempt to monitor the formation of known degradation products. These
results were then compared to the previously published study [11] to identify similarities or differences in
the degradation mechanism of OT in the presence of the formulation additives. Ideally, the Q1 scan would
have been performed over a wide enough mass range to monitor all degradation products formed under
heat-stress conditions. However, due to the sensitivity limitations of the MS while scanning a large mass
range, the background noise was such that it was impossible to obtain a signal from low-abundance
degradation products. Initial experiments to optimize the S/N were performed using a degraded sample of
0.1 mg/mL OT that was formulated in phosphate buffer pH 4.5 and was heat-stressed at 50 °C for 99
hours.
For a Q1 scan over the mass range of 400-1200 Da, a high background signal was observed (1.0E7
cps), with a noise of 150 cps. With these settings the limits of detection were so high that it was
impossible to quantitate OT or any of its degradation products. By decreasing the mass scan range to 900-
1100 Da, it was possible to generate much cleaner spectra with a fifty-fold decrease in the background
(2.0E5 cps). Following this trend, the background could be decreased further by scanning over several
short mass ranges. The final optimized method involved scanning the mass ranges 974-976 m/z for
doubly charged dimer products, 1006-1011 m/z for OT and the desamino degradation products, 1030-
1032 m/z for OT trisulfide, and 1070-1072 m/z for OT tetrasulfide. With this method, the background
was lowered another order of magnitude (1.0E4 cps). With these settings a S/N of 5000 for 5 µM OT was
possible.

92
The LC-UV-MS method was used to monitor the relative abundance of the expected degradation
products in the various formulations during heat stress (Table 2). Unfortunately, using this approach,
information was lost regarding the molecular weight of new degradation products. However, this was
necessary to improve the LODs for this study. In the future it should be possible to rerun these samples
using MRM to investigate the identity of any new species.
4.3.2 Effect of formulation buffering capacity on OT degradation
As previously mentioned, injectable OT is not formulated in a buffered solution. However, the
previous literature reports of OT degradation have been performed in phosphate buffer to control the pH
near that of the pharmaceutical preparation [11, 17]. Therefore, a comparison of the stability of OT
formulated in a phosphate buffer solution pH 4.5 (formulation A), to a formulation prepared with
unbuffered water, pH adjusted to 4 with acetic acid (formulation C), was performed first (Table 2). Using
the data obtained via LC-UV, the kinetics of the disappearance of OT in the pH 4.5 buffered formulation
appeared to be pseudo first order with a calculated half-life of 1.5 days. This value is similar to what was
reported by Hawe et al (1.9 days, 15% RSD). The unbuffered formulation also followed pseudo first order
kinetics but the half-life was 0.71 days, indicating much more rapid degradation (Figure 3i). The
difference in the rate of disappearance of oxytocin as a function of time can also be seen in the plot in
Figure 3ii that shows the % of OT remaining after 48 h of heat-stress degradation at 70° C for both
formulations.
All of the predicted degradation products were produced in both the buffered and unbuffered
formulations as determined by LC-MS. However, due to poor ionization in the electrospray source, the
dimer products gave a disproportionately low signal compared to the other degradation products (Figure
4). This was not the case for the LC-UV analysis at 214 nm, as each peptide has approximately the same
molar absorptivity at 214 nm due to the unchanged peptide backbone and presence of the tyrosine residue
[18]. Therefore, the response obtained using LC-UV was used for both quantitative analysis by peak area,
and as comparative tool for qualitative analysis between samples.

93
Figure 3: Comparison of the i) pseudo first order degradation kinetics of OT and ii) amount of oxytocin
remaining after 48 h 70 °C heat-stress in unbuffered water at pH 4 and phosphate buffer pH 4.5.
i
i
ii
i
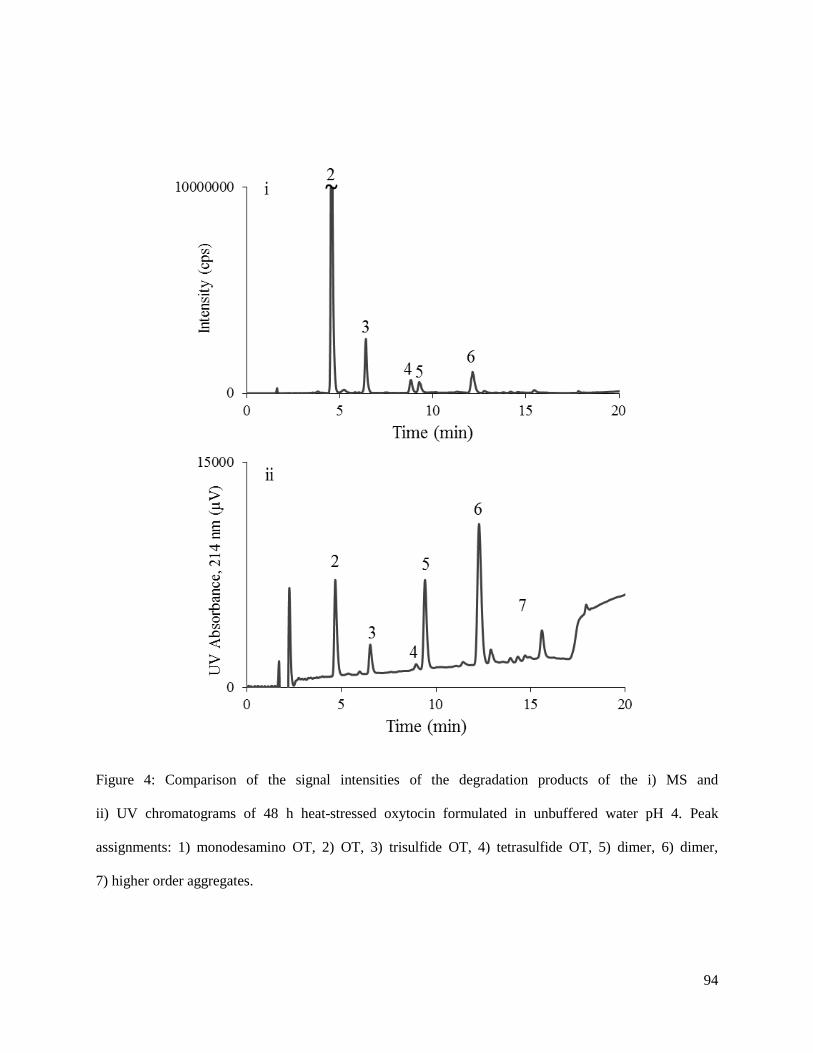
94
Figure 4: Comparison of the signal intensities of the degradation products of the i) MS and
ii) UV chromatograms of 48 h heat-stressed oxytocin formulated in unbuffered water pH 4. Peak
assignments: 1) monodesamino OT, 2) OT, 3) trisulfide OT, 4) tetrasulfide OT, 5) dimer, 6) dimer,
7) higher order aggregates.

95
4.3.3 Effect of chlorobutanol on OT degradation
To create a solution that was similar in composition to the pharmaceutical formulation, 0.5% w/v
CB was added to the pH 4 unbuffered water solution (formulation D). In order to compare these results to
section 4.3.2 of this chapter, CB was also added to pH 4.5 phosphate buffer (formulation B) (Table 2).
The LC-UV and LC-MS results indicated that the stability of OT was significantly improved in both
formulations with the addition of CB. However, the presence of CB in the unbuffered formulation showed
the greatest protective effect, with 81% OT remaining in solution after 48 h at 70 °C (Figure 5ii).
In both the buffered and unbuffered samples, the kinetics of OT degradation was noticeably
changed with the addition of CB as compared to the results in section 4.3.2 (Figure 5i). When the data
was plotted according to first order kinetics, instead of exhibiting a linear decay during 0-48 h of
degradation, both curves appear to level off. After the first 4 h there is no notable OT degradation in the
unbuffered solution with CB. This indicates that perhaps equilibrium is reached within the solution.
Further investigations are needed to provide a mechanistic rational for these results.
A comparison of the two LC-UV chromatograms makes it possible to see the differences in the
degradation profiles of formulations with CB compared to those without. As shown in Figure 6ii, it is
possible to see the formation cyclic polysulfide products in the unbuffered formulation with CB, yet, there
are no dimer products formed. In both formulations containing CB, a new unidentified peak was present
that elutes between the tri- and tetra sulfide compounds. Identification of this peak by LC-MS MRM
could provide useful information as to what reactions are occurring in the sample.
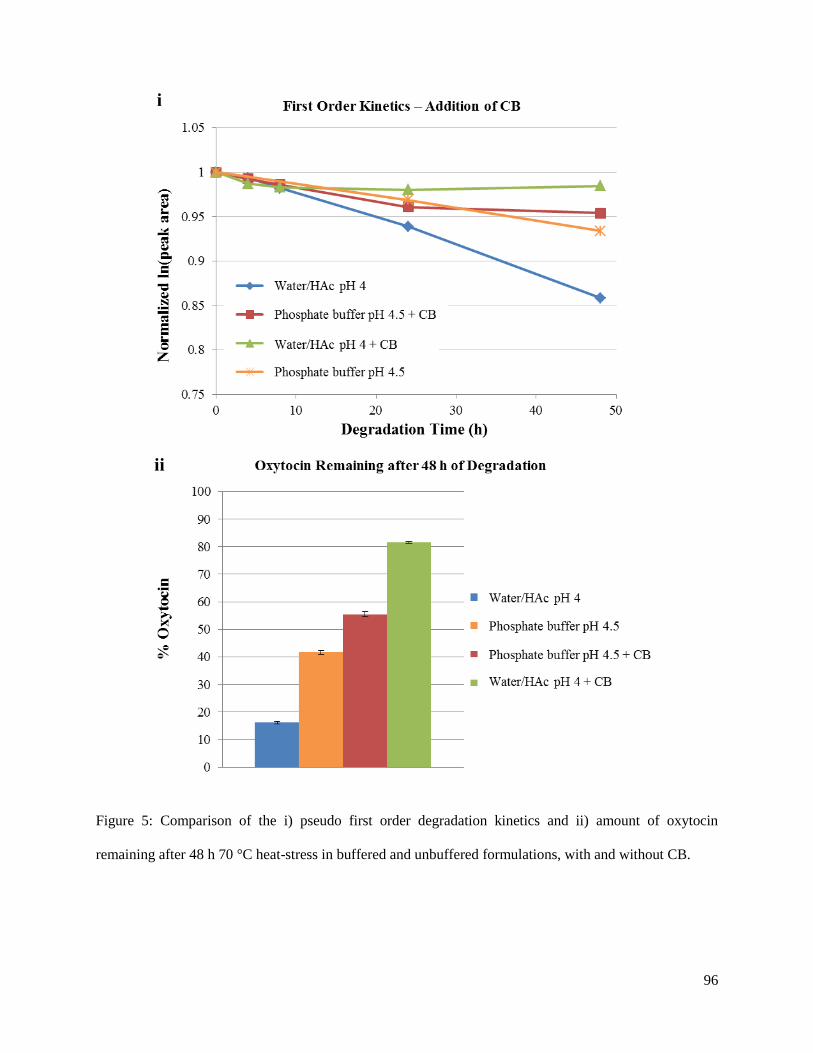
96
Figure 5: Comparison of the i) pseudo first order degradation kinetics and ii) amount of oxytocin
remaining after 48 h 70 °C heat-stress in buffered and unbuffered formulations, with and without CB.
i
i
ii
i

97
Figure 6: Comparison of the degradation products formed after 48 h at 70 °C oxytocin formulated in
i) water pH 4 and ii) water pH 4 with 0.5% w/v chlorobutanol. Peak assignments: 1) monodesamino OT,
2) OT, 3) trisulfide OT, 4) tetrasulfide OT, 5) dimer, 6) dimer, 7) higher order aggregates, *unidentified
species.

98
4.3.4 Effect of chlorobutanol-like species on OT degradation
As described above, CB has a significant effect on the stability of OT under heat-stressed
conditions. To investigate the mechanism of this enhanced stability, several species with antimicrobial or
structural similarity to CB were tested with OT in accelerated degradation studies.
4.3.4.1. Antimicrobial effect
To ensure that the prolonged stability of OT in the presence of CB was not simply due to an
antimicrobial effect, a formulation with the common antimicrobial agent, benzyl alcohol (BA), was tested
(formulation K, Table 2). No protective effect was seen by the addition of BA. A plot of the pseudo first
order kinetics was once again linear with a calculated half-life of 0.53 days. Additionally, in the LC-UV
chromatogram, all of the previously reported degradation products were present (Figure 7iii), indicating a
similar degradation mechanism to the unbuffered formulation with no additives. If anything, the rate of
the degradation of oxytocin appeared to increase rather that decrease in the presence of BA. One possible
explanation could be that BA has been known to result in increased formation of aggregation products in
protein formulations [19, 20].
4.3.4.2. Alcohol substitution
The CB molecule has two distinct functional groups that could interact with peptides. These are the
trichloro group and the tertiary alcohol. To investigate the effect of the alcohol moiety on the stability of
OT, ethanol (primary), isopropyl alcohol (secondary), and TBA (tertiary) were all tested (formulations F-
H, Table 2). None of these formulations appeared to change OT degradation as compared to the
unbuffered formulation with no additives. For example, the degradation for the formulation containing
TBA was plotted according to pseudo first order kinetics and was linear between 0-48 hours with a
calculated half-life of 0.68 days (similar to the 0.71 day half-life of unbuffered OT with no additives). The
LC-UV chromatogram for the 48 h degradation sample containing TBA shows all of the expected
degradation products with no additional peaks (Figure 7ii).

99
Figure 7: Comparison of the degradation products formed after 48 h at 70 °C oxytocin formulated in
i) water pH 4, ii) water pH 4 with 0.5% w/v tert-butanol, and iii) water pH 4 with 0.5% w/v benzyl
alcohol. Peak assignments: 1) monodesamino OT, 2) OT, 3) trisulfide OT, 4) tetrasulfide OT, 5) dimer, 6)
dimer, 7) higher order aggregates.

100
4.3.4.3. Trichloro group
To investigate the effect CB’s trichloro group on the stability of the oxytocin, solutions containing
either trichloroacetic acid (TCA, formulation H) or trichloroethanol (TCE, formulation I) were tested
(Table 2). The presence of TCA showed a slight increase the % OT remaining after 48 h heat-stress,
compared to the unbuffered formulation without additives (Figure 8ii). However, the plot of the
degradation kinetics was linear with a calculated half-life of 1.2 days (Figure 8i), which is less than the
buffered formulation with no additives (1.5 days). This added stability compared to the formulation in
water could simply be due to the increased buffering capacity of the ammonium acetate that was
necessary to increase the pH to 4 after the addition of the TCA. The LC-UV-MS data shows the formation
of primarily cyclic polysulfides with dimers present at low concentration (Figure 9iii).
TCE on the other hand, elicits very similar behavior to CB in OT formulations. After 48 h at 70° C
there is still 70% OT remaining in the formulation (Figure 8ii). Again, the data diverges from the
expected pseudo first order kinetics, with the OT disappearance leveling off after 8 h (Figure 8i). Like
CB, the LC-UV chromatogram shows that OT in the presence of TCE does not form dimers (Figure 9ii).
Additionally, with TCE, an unidentified peak is produced. This peak has a different retention time to the
unidentified peak seen in the CB formulation, indicating that it is a different product. If the CB and TCE
are increasing the stability of OT through a new reaction mechanism, this peak could be a byproduct.
Further studies are needed to identify this peak.
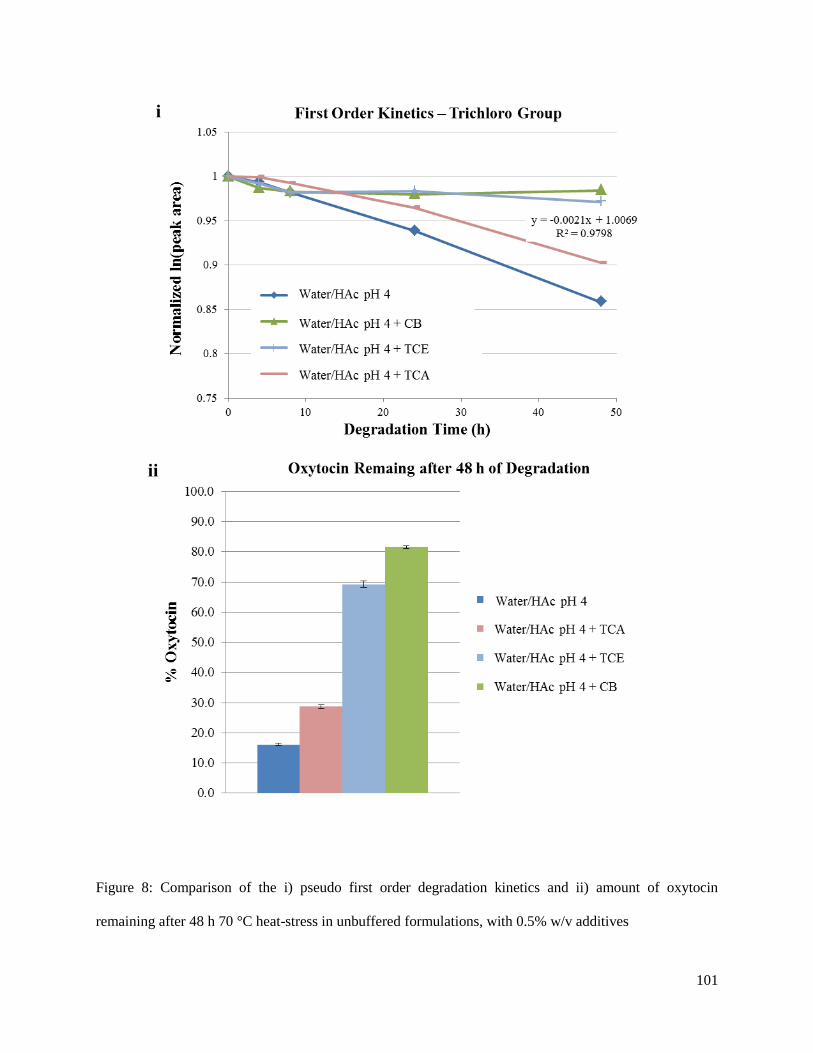
101
Figure 8: Comparison of the i) pseudo first order degradation kinetics and ii) amount of oxytocin
remaining after 48 h 70 °C heat-stress in unbuffered formulations, with 0.5% w/v additives
i
ii
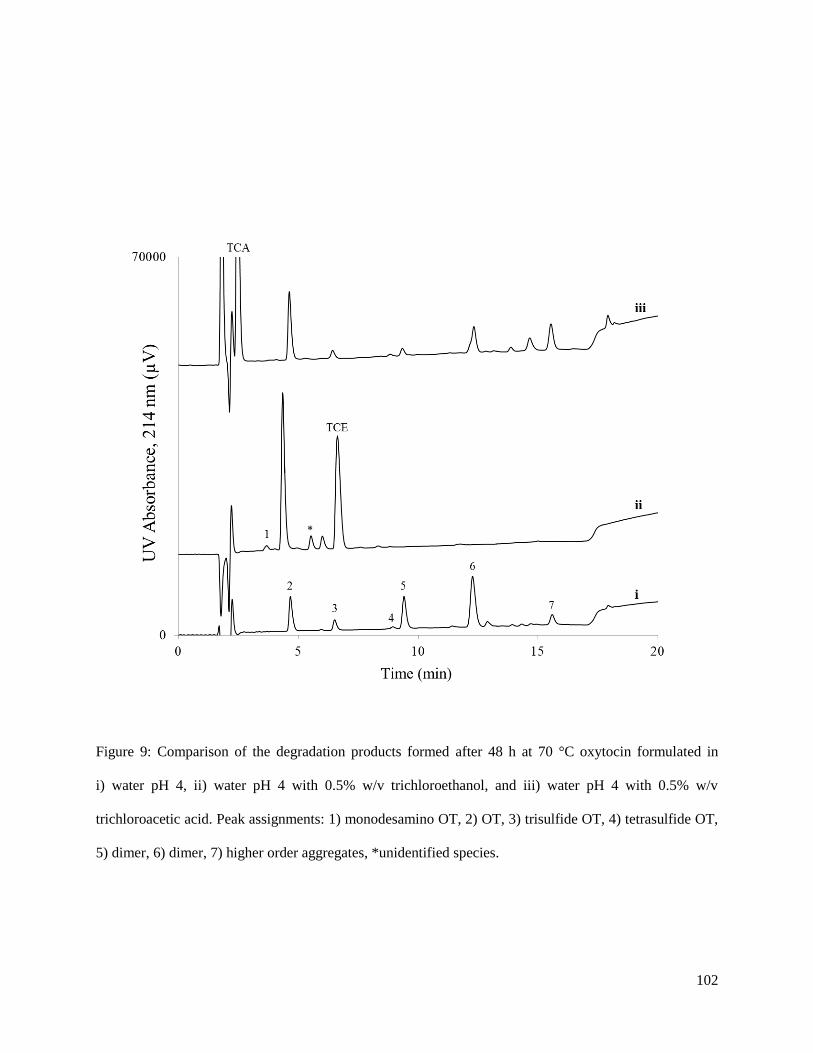
102
Figure 9: Comparison of the degradation products formed after 48 h at 70 °C oxytocin formulated in
i) water pH 4, ii) water pH 4 with 0.5% w/v trichloroethanol, and iii) water pH 4 with 0.5% w/v
trichloroacetic acid. Peak assignments: 1) monodesamino OT, 2) OT, 3) trisulfide OT, 4) tetrasulfide OT,
5) dimer, 6) dimer, 7) higher order aggregates, *unidentified species.

103
4.3.5 Potential rational for increased OT stability in the presence of CB and TCE
OT in the presence of CB and TCE does not appear to form dimers. A few reports in the literature
have suggested that the presence of CB reduces the likelihood of aggregation of proteins in blood
samples; however, the mechanism for this stabilization was not provided [21, 22]. For OT specifically,
the mechanism of degradation postulated by Wisniewski et al. indicates that the dimer products are
formed from linear OT peptides after they undergo the loss of a sulfur following β-elimination of the
disulfide bond (Figure 1) [12]. It is possible that both CB and TCE are associating with the peptide in a
way that is preventing further reactions.
The conformation of OT in solution consists of two β-turns stabilized by the disulfide bond and
considerable hydrogen bonding between multiple residues [23]. As heated cyclic OT denatures, or
becomes linear following β-elimination of the disulfide bond, the secondary structure is removed,
allowing the hydrophobic amino acid residues Tyr2, Leu
8, and Ile
3 to interact with the solution.
Tryptophan fluorescence quenching studies have shown that TCE (logP octanol-water, 1.42) associates
with hydrophobic regions of proteins [24, 25], inducing stable alpha-helical secondary structure. This
effect has also been seen with peptides using other halogenated alcohols, such as trifluoroethanol [26-29].
CB is even more hydrophobic, with a logP (octanol-water) value of 2.03. Therefore, it is possible that CB
has an even stronger association with the hydrophobic regions of the peptide. With such a small peptide,
any association of CB to the hydrophobic residues of OT could prevent nearby thiols and N-termini from
interactions that lead to the formation of dimers. To investigate the effect of CB on the peptide structure,
further studies by nuclear magnetic resonance and circular dichroism should be done on the peptide-
preservative mixtures.
In addition to the mechanism for the degradation products previously discussed, it is possible for
OT to undergo disulfide scrambling through radical-based reactions in the presence of light and heat.
Mozziconacci has reported the formation several products [30] that had not been described in the previous
published reports [11, 12, 17]. Through personal discussions with Mozziconacci, it was postulated that

104
under high temperature conditions, the generation of sulfur centered radicals could lead to the formation
of both the cyclic polysulfides and dimers. In this case, it is possible that CB and TCE could be acting as
electron scavengers and preventing degradation before it can occur.
Regardless of the mechanism, structural identification of the additional peak seen in the
chromatograms for both the TCE and CB formulation is necessary to gain more information on how it
could be formed. MRM analysis should be performed on the new peak before and after reduction and
alkylation. These studies will provide further structural information and allow for product identification
and direction of additional experiments.
4.4 Concluding remarks
Despite the widespread use of OT for clinical purposes in maternal health, not much is known
regarding the mechanism of degradation of this peptide in its commercial pharmaceutical formulation. In
this chapter, a preliminary look at the degradation products when OT is formulated in solution similar to
its pharmaceutical preparation was accomplished. Oddly, in the presence of the antimicrobial preservative
CB, the stability of oxytocin is increased. In an attempt to determine the reason for this increased stability,
a variety of compounds of structural similarity to CB were tested in accelerated degradation studies. Of
all of the compounds tested, only 0.5% w/v TCE was capable of inducing a similar stabilizing effect in
the OT formulation. TCE also showed similarities to CB in the lack of dimer products formed during
degradation. Additionally, in both the CB and TCE samples, an unidentified peak was seen in the LC-UV
chromatogram. Further studies to determine identity of this peak are necessary.
In addition to investigating the mechanism by which CB improves OT stability, future directions of
this project will be to further optimize the CE separation discussed in chapter 3 to include the dimer and
cyclic polysulfide products. This will accomplish the goal of creating a low-cost assay to determine the
stability of OT in the supply chains of developing countries.
105
4.5 References
[1] Rohrbasser, C., Rheme, D., Decastel, S., Roth, S., Aja Montes, M. d. L., Veuthey, J.-L., Rudaz, S.,
Chimia 2009, 63, 890-891.
[2] Marini, R. D., Rozet, E., Montes, M. L. A., Rohrbasser, C., Roht, S., Rheme, D., Bonnabry, P.,
Schappler, J., Veuthey, J. L., Hubert, P., Rudaz, S., J. Pharm. Biomed. Anal. 2010, 53, 1278-1287.
[3] Creamer, J. S., Krauss, S. T., Lunte, S. M., Electrophoresis 2014, 35, 563-569.
[4] Cornell Manning, M., Chou, D. K., Murphy, B. M., Payne, R. W., Katayama, D. S., Pharm. Res.
2010, 27, 544-575.
[5] Hogerzeil, H. V., Walker, G. J. A., de Goeje, M. J., Action Programme on Essential Drugs, World
Health Organization. 1993, 1-50.
[6] Dudkiewicz-Wilczynska, J., Snycerski, A., Tautt, J., Acta Pol. Pharm. 2000, 57, 403-406.
[7] Krummen, K., Frei, R. W., J. Chromatogr. 1977, 132, 429-436.
[8] Ohta, M., Fukuda, H., Kimura, T., Tanaka, A., J Chromatogr 1987, 402, 392-395.
[9] Chaibva, F. A., Walker, R. B., J. Pharm. Biomed. Anal. 2007, 43, 179-185.
[10] Wang, G., Miller, R. B., Melendez, L., Jacobus, R., J. Liq. Chromatogr. Relat. Technol. 1997, 20,
567-581.
[11] Hawe, A., Poole, R., Romeijn, S., Kasper, P., van der Heijden, R., Jiskoot, W., Pharm. Res. 2009,
26, 1679-1688.
[12] Wiśniewski, K., Finnman, J., Flipo, M., Galyean, R., Schteingart, C. D., Peptide Science 2013, 100,
408-421.
[13] Meyer, B. K., Ni, A., Hu, B., Shi, L., J. Pharm. Sci. 2007, 96, 3155-3167.
[14] Brange, J., Langkjaer, L., Acta Pharm. Nord. 1992, 4, 149-158.
[15] Hutchings, R. L., M. Singh, S., Cabello-Villegas, J., Mallela, K. M. G., J. Pharm. Sci. 2013, 102,
365-376.
[16] de Hoffmann, E., Stroobant, V., Mass Spectrometry, Principles and Applications, John Wiley and
Sons LTD 2007.

106
[17] Haselberg, R., Brinks, V., Hawe, A., de Jong, G. J., Somsen, G. W., Anal. Bioanal. Chem. 2011, 400,
295-303.
[18] Kuipers, B. J. H., Gruppen, H., J. Agric. Food Chem. 2007, 55, 5445-5451.
[19] Roy, S., Katayama, D., Dong, A., Kerwin, B. A., Randolph, T. W., Carpenter, J. F., Biochemistry
2006, 45, 3898-3911.
[20] Tobler, S. A., Holmes, B. W., Cromwell, M. E. M., Fernandez, E. J., J. Pharm. Sci. 2004, 93, 1605-
1617.
[21] Chen, S. L., Yang, W. C., Huang, T. P., Wann, S., Teng, C. M., Thromb. Haemostasis 1990, 64, 473-
477.
[22] Stewart, M. W., Gordon, P. A., Thromb. Res. 1991, 64, 757-762.
[23] Urry, D. W., Walter, R., Proc. Nat. Acad. Sci. U. S. 1971, 68, 956-958.
[24] Eftink, M. R., Zajicek, J. L., Ghiron, C. A., Biochim. Biophys. Acta, Protein Struct. 1977, 491, 473-
481.
[25] Solt, K., Johansson, J. S., Pharmacology 2002, 64, 152-159.
[26] Jackson, M., Mantsch, H. H., Biochim. Biophys. Acta, Protein Struct. Mol. Enzymol. 1992, 1118,
139-143.
[27] Lee, C.-S., Lin, C.-H., Hsieh, W.-L., Chiao, S.-M., Tung, W.-C., J. Nanosci. Nanotechnol. 2014, 14,
5568-5573.
[28] Lee, C.-S., Tung, W.-C., Luo, W.-C., Protein J. 2012, 31, 222-228.
[29] Lehrman, S. R., Tuls, J. L., Lund, M., Biochemistry 1990, 29, 5590-5596.
[30] Mozziconacci, O., Schoeneich, C., J. Pharm. Sci. 2012, 101, 3331-3346.
107
Chapter Five:
Development of Methods for On-site Separation Based Analysis of Small Molecule
Pharmaceuticals for use in Developing Countries

108
5.1 Introduction
Counterfeit drugs are reported to make up to 20% of the global market, and this number can be as
high as 50-60% in developing countries [1, 2]. The term “counterfeit” covers a variety of products that are
“deliberately and fraudulently mislabeled with respect to identify or source” [3]. In a survey published by
the World Health Organization (WHO), all counterfeit drugs seized over a two-year period were
classified into several categories. Of the 46 reports, only 17.8% of the products were the correct drug at
the correct amount that was being distributed in falsified packaging. The remaining 82.2% were
substandard medicines: 32.1% contained no active ingredient, 20.2% had an incorrect amount of active
ingredient, 21.4% contained of the wrong active ingredient, and 8.5% had high levels of impurities and
contaminants [4].
The presence of these substandard medicines in developing countries has a huge negative impact on
public health. Medications that contain little-to-no active ingredient can prolong sickness and increase the
likelihood of death, while taking a drug containing the wrong active ingredient can lead to serious side
effects. Additionally, any inconsistency in the source of the drugs that leads to switching from authentic
drug to counterfeit and back again, can lead to the emergence of drug-resistant bacteria, which pose a
global health threat. Due to the increasing prevalence of counterfeit drugs in developing countries, quality
control of pharmaceuticals must now be performed at multiple checkpoints throughout the distribution
system, in addition to the screening that occurs when products enter the country. The ability of a
government to maintain an effective regulatory authority directly impacts the likelihood of counterfeits
getting to market. Of the 191 WHO member states, only 20% can maintain a functioning regulatory
presence, while 30% have no regulation at all [4].
A major roadblock to a reliable regulatory effort in developing countries is the lack of appropriate
instrumentation to screen the supply chain for counterfeit drugs. Quality control of pharmaceuticals is
normally accomplished in a permanent laboratory that contains state of the art instrumentation (i.e. HPLC
and MS), and most USP and EUP methods have been developed with this environment in mind.

109
Unfortunately, these types of laboratories do not exist in developing countries for many reasons, including
the lack of funding, access to trained personnel, and improper infrastructure (electricity and running
water) needed to support HPLC or MS. Therefore, portable, user-friendly, and inexpensive alternatives
are needed to perform high-throughput screening of pharmaceuticals in the absence of a traditional
laboratory setting.
Due to the large number of samples that need to be screened each day, non-destructive methods,
that do not require extensive sample preparation, are popular. One strategy has been to develop innovative
tracking codes and anti-counterfeit packaging to maintain a more secure distribution of pharmaceuticals
across the world by providing a simple visual-based inspection to verify identity [5, 6]. Recently, the
FDA developed a multiple wavelength emitter (CD-3) that can be used to visually screen tablet coatings
and packaging in comparison to the authentic product [7-9]. The latest version of this device is handheld
and battery operated, allowing it to be transported to wherever it is needed. While the CD-3 is a very
useful and groundbreaking technique for first-pass screening of products, it gives no chemical information
about the drug.
For products that fail the first-pass inspection, a secondary analysis is needed to get more
information regarding chemical composition. Handheld devices for X-ray fluorescence [10], Raman [11,
12] or infrared [13, 14] spectroscopy are commercially available and well suited for this task. However,
the cost of these devices is far beyond what is reasonable for developing countries. For example, a single
handheld Raman spectrometer can cost anywhere from 20,000 to 50,000 USD. With this high start-up
cost, it is unlikely enough devices could be purchased to cover the multiple distribution lines, store
houses, and clinics located throughout a large country. Additionally, while these spectrometers are able to
provide qualitative information regarding the chemical composition of the tablet based on spectra
matching of the compounds to a library, they have limited quantitative ability [15, 16], making them
unable to detect counterfeits containing the wrong amount of active ingredients.

110
Thin-layer chromatography (TLC) kits by Minilab™ that use colorimetric detection have been
widely used as an inexpensive, portable method for monitoring pharmaceutical quality [17]. While TLC is
capable of providing semi-quantitative results for a wide variety of drugs commonly used in developing
countries [18, 19], the downside of this technique is that it is both time and resource intensive. Each test
requires several sample preparation steps to get the tablet into solution, and then mL amounts of organic
solvents are needed to perform the separation and detection. This whole process can take upwards of 30
min per plate to accomplish. Additionally, to obtain reproducible and accurate results, the test is best
performed by trained personnel.
Paper-based lateral-flow assays, on the other hand, are more environmentally friendly and easy to
use. These tests have been thoroughly investigated for low-cost diagnostics for developing countries [20-
23]. More recently, this approach has also been explored for on-site pharmaceutical quality control. For
example, Weaver et al. described simple, yet specific paper-based tests for beta-lactam antibiotics and
anti-tuberculosis (TB) drugs [24]. In this assay, the tablet is scraped across a test card, eliminating the
crushing and dissolving sample preparation steps. The test card contains several lanes of dried reagents
that react with the formulation to produce colored products. Using water in the place of organic solvents,
the small amount of powdered tablet, deposited on the paper, is dissolved and brought into the reagent
zones via capillary action. These reagents are designed to react with specific functional groups known to
be present in the active ingredient and excipients that make up the formulation. While these tests are only
qualitative, they give much more information regarding the structure of the drug compared to TLC.
Microchip electrophoresis (ME) is a versatile separation technique that can be used to supplement
the information gained from the qualitative analysis methods that are currently available in developing
countries. A separation-based assay allows for simultaneous identification of degradation productions and
active ingredient that is not possible with the lateral-flow tests. Further coupling of ME to a universal
detection system can also be used for quantitative analysis, giving a more accurate assessment of active
ingredient concentration than is possible with the handheld spectrometers. Due to the small dimensions of
111
the separation channel, ME requires only a few microliters of sample and reagent, keeping the cost-per-
test low and leading to a short total analysis time. Additionally, because fluid movement is accomplished
through the application of voltage, there is no need for expensive small-volume pumps.
In the laboratory, ME can be coupled to a variety of detectors depending on the needs of the assay.
However, the ability to incorporate electrodes directly into the design of the microchip and miniaturize
the associated electronics, makes electrochemical detection a more attractive method for on-site analysis
compared to spectroscopic methods such as UV or LIF [25, 26]. With the micrometer pathlengths and
picoliter sample plugs characteristic of ME, the limits of detection (LOD) achievable with UV
spectroscopic detection are extremely high. LIF detection exhibits lower the LODs; however,
derivatization chemistry for molecules that do not contain a fluorophore is required, increasing the
complexity of the assay. For a more useful and universal detection of charged species, capacitively
coupled contactless conductivity detection (C4D) can be used. ME was first coupled with C
4D in 2001
[27] and it has since been used for the analysis of biological, environmental, and pharmaceutical samples
as described in an several excellent reviews [28].
Conductivity detection works by placing two electrodes (working and detection) opposite each other
within the separation channel. In direct conductivity detection the electrodes are placed inside the
separation channel (Figure 1a). A low frequency alternating signal is applied to the working electrode to
compensate for the formation of the electric double layer at the electrode surface. The signal received at
the second electrode is inversely proportional to the resistance of the fluid in the channel between the two
electrodes G = 1/R = 1/V, where G is conductance, R is resistance, and V is voltage. If the analyte zone is
charged and therefore less resistive than the BGE, it will be more conductive and will yield a positive
peak in the electropherogram. On the other hand, if the zone is more resistive than the background
electrolyte, a negative peak will be observed.

112
In C4D, the electrodes are isolated from the fluid in the separation channel by an insulating layer. In
this system the electrode, insulating layer, and solution behave similarly to a parallel plate capacitor
(conductor/dielectric/conductor) (Figure 1b). To overcome the high impedance of the signal transmission
across the insulating layer, a high frequency signal must be used. The generation of a high frequency
alternating current at the working electrode creates the polarization of the dielectric. As the signal travels
through the solution to the second electrode, the resulting current that is measured depends on the
capacitive reactance of the dielectric (Cw), the resistance of the solution, and the reactance of the stray
capacitance (C0) (the direct capacitive coupling between the electrodes) as shown in the simple circuit
diagram in Figure 1c. By keeping Cw low and C0 high, the current varies linearly with the conductivity of
the solution [28]. C4D has less background noise than contact conductivity due to the isolation of the
electrodes, and it also prevents electrode fouling and bubble formation that can occur when the electrodes
are placed in the solution.
For implementation in developing countries, single-use disposable components coupled with
reusable instrumentation are an excellent way to achieve high-performance, low-cost analysis of samples
[23]. Since the electrodes in C4D are placed outside of the channel and isolated from the fluid, it is
possible to build a device that reuses the electrode board. The electrodes are the most expensive part of
the microchip, and reusing them will help keep the cost-per-test low. The part of the microfluidic that
houses the channels for ME can be fabricated from a variety of low-cost materials. While glass has been
traditionally employed for the fabrication of these devices due to its well characterized surface properties,
glass microchips are expensive and time consuming to produce. More robust and inexpensive microchips
can be manufactured from polymers and plastics [29-32] using large scale manufacturing processes.
These plastic chips can be easily aligned within the electrode board, used once, and disposed of, allowing
for a much cheaper portable test than the handheld spectrometer, with greater analytical capability than
TLC or paper-based devices.

113
Figure 1: Comparison between the a) contact and b) contactless conductivity detection. C) A simplified
electrical circuit diagram of the electrodes relationship to the solution. The grey blocks represent the top
and bottom microchannel walls with the solution between them. The top wall has the capacitively coupled
electrodes on it. Cw, wall capacitance; C0, stray capacitance; Rs, solution resistance. Reprinted with
permission from Coltro et al (ref 28).
a b
c

114
In this chapter, a ME-C4D method is developed for the determination of two first-line anti-TB
drugs, ethambutol (EMB) and isoniazid (INH) (Figure 2). Tuberculosis is a deadly communicable disease
that, despite being treatable, is responsible for 1.5 million deaths per year worldwide. One of the major
factors directly impacting access to life-saving medication is the distribution of counterfeit drugs within
developing countries via unregulated supply chains. Both CE-UV and CE-C4D have been evaluated as
fast and inexpensive methods for the analysis of first-line anti-TB drugs [33, 34]. To improve the
portability and, therefore, feasibility of on-site analysis, ME-C4D was used to separate EMB and IHN,
and partially separated EMB from its major degradation product 2-aminobutanol (2-AMB).
5.2 Materials and methods
5.2.1 Chemicals and reagents
HEPES, lactic acid, MES, histidine, diethylamine (DEA), ethylendiamine (EDA), EMB, INH, and
2-AMB were obtained as analytical grade reagents from Sigma Aldrich (St. Louis, MO). The acetone was
received from Fisher Scientific (Fair Lawn, NJ). For the studies involving the commercial formulated
drug, EMB hydrochloride (EMB HCl) produced by Teva pharmaceuticals (Petah Tikva, Israel) was used.
All BGE and sample solutions were prepared with 18 MΩ ultrapure water (Millipore, Billerica, MA) and
filtered through a 0.2 µm pore nylon filters prior to use (GE Water and Process Technologies, Trevose,
PA, USA).
The following supplies were used as received: 100 mm Si wafers (Silicon Inc, Boise, ID); AZ 1518
photoresist and AZ 300 MIF developer (Mays Chemical, Indianapolis, IN); SU-8 10 negative photoresist
and SU-8 developer (MicroChem, Newton, MA); Slygard 184 Silicone Elastomer Kit: PDMS (Ellsworth
Adhesives, Germantown, WI, USA); Borosilicate float glass, 4” x 1.1 mm (Precision Glass and Optics,
Santa Ana, CA); Pt (99.99% purity) and Ti (99.97% purity) targets (2 in. diameter × 0.125 in. thick;
Kurt J. Lesker Co., Clairton, PA); gloss laminating sheets – acid free (U.S. Stamp & Sign, Cookeville,
TN); and Ag colloidal paste (Ted Pella, Redding, CA, USA).

115
Figure 2: Structures of first line anti-TB drugs ethambutol and isoniazide. Structure for 2-aminobutanol,
the major degradation product of ethambutol.
Isoniazid Ethambutol 2-aminobutanol

116
5.2.2 Background electrolyte preparation
For ME-C4D experiments, two BGEs were used. A BGE composed of 30 mM MES and 50 mM
histidine was prepared by combining the correct amount of both components to nanopure water to achieve
the desired concentration. At this ratio of MES to histidine the pH of the solution is 6.0 ± 0.1 and no
additional pH adjustment is needed. To prepare the 60 mM HEPES, pH 4.0 BGE, a stock solution of 200
mM HEPES was made weekly and diluted daily. A 5 M lactic acid solution was used to adjust the pH of
the 60 mM HEPES BGE to pH 4.0 (final concentration of lactic acid was approximately 0.1 mM).
5.2.3 Sample preparation
Stock solutions of EMB, INH, EDA, and DEA were prepared at a concentration of 20 mM in
ultrapure water. These solutions were stored at 4 °C and diluted to the desired concentration with BGE
prior to use. The stock solution of 2-AMB was prepared day of the experiment at a concentration of 5 mM
in BGE.
For the analysis of the pharmaceutical formulations, three EMB tablets were weighed and
pulverized with a mortar and pestle. Based on the reported drug concentration of 400 mg per tablet, and
the average weight of the three pills, the appropriate amount of powder was weighted out to produce a 5
mL solution of 5 mM EMB in BGE. This solution was sonicated for 30 min and filtered through a 0.2 µm
pore nylon filters prior to use.
The lab-made counterfeits were created by mixing the correct amount of powered EMB tablet and
sucrose to create formulations of 0, 25, 50, and 100% ETB. These formulations were dissolved in 10 mL
(final concentration was10 mM for the 100% solution), sonicated for 30 min, and filtered through a 0.2
µm pore nylon filters. Finally they were diluted by a factor of 10 in BGE (1 mM for the 100% solution)
prior to use.
117
5.2.4 Microchip design
5.2.4.1 PDMS microchannel fabrication
The channels of the ME device were molded into PDMS using a previously described procedure
[35, 36]. Briefly, a 100 mm silicon wafer was coated with SU-8 10 negative photoresist using a spin
coater. The photoresist was cross-linked in the pattern of the channels by exposure to UV light for 16 s
through a negative mask with the transparent microchip features on a black field (Infinite Graphics,
Minneapolis, NM). After exposure, the unreacted photoresist was removed with SU-8 developer, leaving
raised microchannel features on the wafer (40 µm wide and 15 µm tall). A 10:1 mixture of PDMS to
curing agent was poured over the wafer and placed in an oven to cure at 70 °C for 2 h. The PDMS layer
was then peeled off, leaving an imprint of the microchannels in the polymer. Access to these channels
was provided through reservoirs made by a 4 mm biopsy punch at the end of each channel (Harris Uni-
Core, Ted Pella, Redding, CA). All experiments were performed with a 5 cm separation channel and 0.75
cm side arms in the design of the simple-t microchip (Figure 3a).
5.2.4.2 Electrode fabrication
A lift-off process was used to fabricate the platinum electrodes that were used for conductivity
detection. The process has been previously described by Vazquez et al [37]. Borosilicate float glass was
coated with positive photoresist (AZ 1518) and exposed to a UV light through a negative mask
(transparent electrode features on a black field) for 10 s. After exposure, the plate was placed in 300 MIF
developer to remove unreacted photoresist, leaving exposed glass in the shape of the electrodes
surrounded by photoresist. The plate was subjected to a plasma de-scum to etch the exposed glass,
remove impurities, and prepare the surface for better metal adhesion. It was then immediately placed in
the thin layer deposition chamber where a 200 Å Ti adhesion layer was deposited followed by a 4000 Å
Pt layer. To complete the process, the photoresist (covered by excess Ti and Pt) was removed by placing
the plate in an acetone bath for 5 min, leaving behind the Pt electrodes (Figure 4) of 650 µm wide with a

118
Figure 3: Cartoon schematic of the A) simple-t microchip dimensions and B) gated injection

119
Figure 4: Step-by-step cartoon schematic of the lift-off electrode fabrication. A) borosilicate glass plate,
B) spin-coated photoresist, C) UV exposure through negative mask, D) remove exposed photoresist, E) Ti
and Pt sputtered over photoresist and glass, F) “lift off” remaining photoresist with acetone.

120
200 µm gap between them. Pt wires were connected to the electrodes with colloidal silver paste and
secured to the plate with quick-set epoxy.
5.2.4.3 Microchip construction
The face of the glass plate containing the C4D electrodes was covered by a thin layer of an adhesive
polyester laminating sheet to isolate the metal electrode from the separation channel. The cured PDMS
layer, containing the microchannels, was then aligned and reversibly sealed over the polyester layer
(Figure 5). The electrodes were placed perpendicularly to the separation channel 1 cm from the buffer
waste reservoir (Figure 3a).
5.2.5 Microchip operation
A gated injection scheme was used to introduce sample into the separation channel of the simple-t
microchip for analysis. The voltages were applied to the appropriate reservoirs using a programmable
Jenway Microfluidic Power Supply (Dunlow, Essex, UK) controlled by an in-house Labview program
(National Instruments, Austin, TX). To establish the gate, one high-voltage lead was place in the sample
reservoir and one in the buffer reservoir, with an earth ground in the sample waster and buffer waste
reservoirs. To inject, the high-voltage at the buffer reservoir was floated, allowing the sample to fill the
channel intersection. After a defined period of time, the voltage was reapplied and the gating was
reestablished, leaving a discreet plug of sample in the separation channel to undergo electrophoresis
(Figure 3b).
5.2.6 Instrumentation for C4D
A BK Precision function generator (Yorba Linda, CA) was used to apply a signal of 400-500 kHz
(optimized daily) with an amplitude of 10 Vpp at the working electrode. The detection circuitry was
fabricated in-house by members of the Instituto de Química de São Carlos at the University of São Paulo,
Brazil [38, 39]. The voltage output was collected and converted from analog to digital through an

121
Figure 5: Construction of the ME with C4D chip. A) PDMS layer with embedded microchannels,
B) polyester insulating layer, and C) glass plate with electrodes.
122
in-house Labview program. To reduce the background interference, the whole microchip was placed
inside a Faraday cage (Figure 6).
5.3 Results and discussion
5.3.1 Rational for BGE composition
To decrease the background current in C4D, low-conductivity BGEs are typically used. The
zwitterionic collection of Good’s buffers and amino acids are particularly attractive for this purpose. A
previous report for the CE-C4D separation and detection of EMB and 2-AMB used a BGE composed of
30 mM MES and 50 mM histidine at pH 6.0 [34].
The initial investigation of EMB on-chip was performed using the same MES/histidine BGE. A
standard solution of 5 mM EMB was analyzed on the 5 cm simple-t microchip discussed in section
5.2.4.3 (Figure 7a). With this BGE it was possible to resolve EMB and 2-AMB (Figure 7b). However,
detection of INH is not possible at this pH because it has no charge. Figure 8 shows a plot prepared by
Faria et al that shows the effect of the BGE pH on the electrophoretic mobilities of EMB and INH [33].
At pH values above 5.5, INH is neutral and will give no response in C4D. As can be seen from the graph,
there is a small window between pH 3.5 and 4.5 where both EMB and INH are charged and can be
separated based on difference in mobilities.
To achieve a BGE at pH 4.0, where both EMB and INH are positively charged, a BGE consisting of
60 mM HEPES, 0.1 mM lactic acid at pH 4.0 was chosen. In our studies, with the 5 cm long channel,
EMB and INH were fully resolved (Figure 9c). Unfortunately, EMB and 2-AMB were only partially
resolved using with this system (Figure 10b). It is possible that the resolution could be improved by using
a chip with a longer separation channel, or by further optimization of the BGE;
however, other chip designs and BGEs were not investigated at this time.
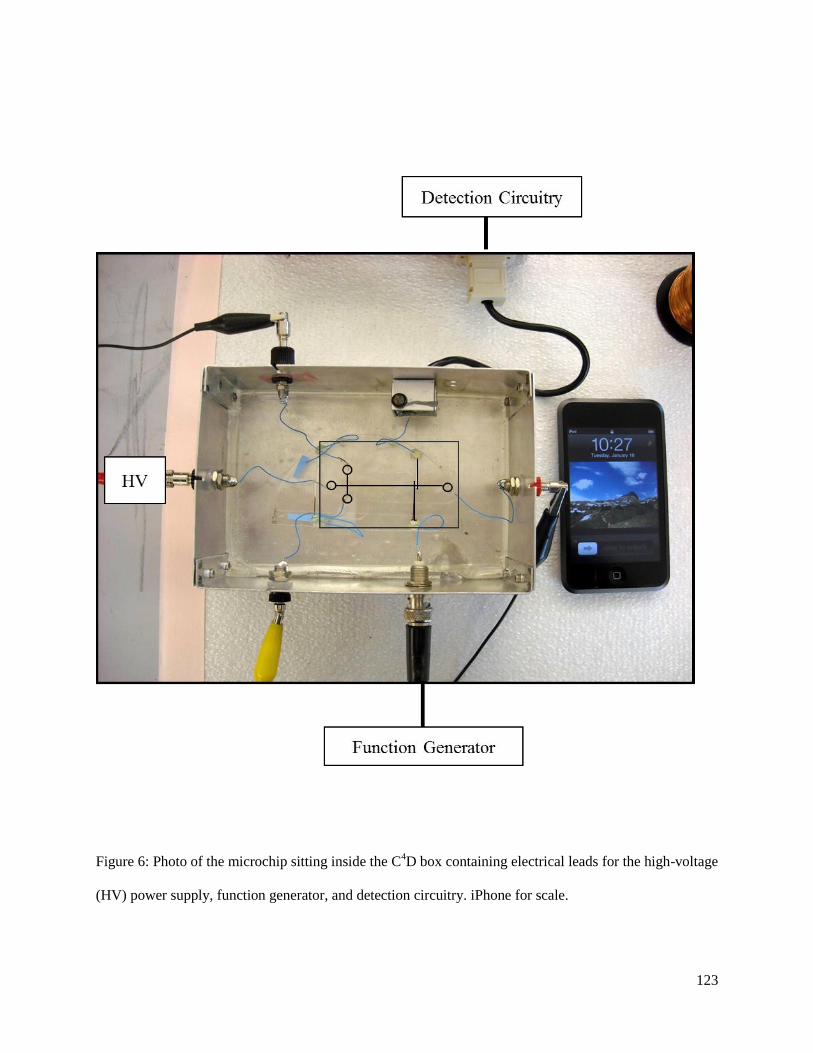
123
Figure 6: Photo of the microchip sitting inside the C4D box containing electrical leads for the high-voltage
(HV) power supply, function generator, and detection circuitry. iPhone for scale.
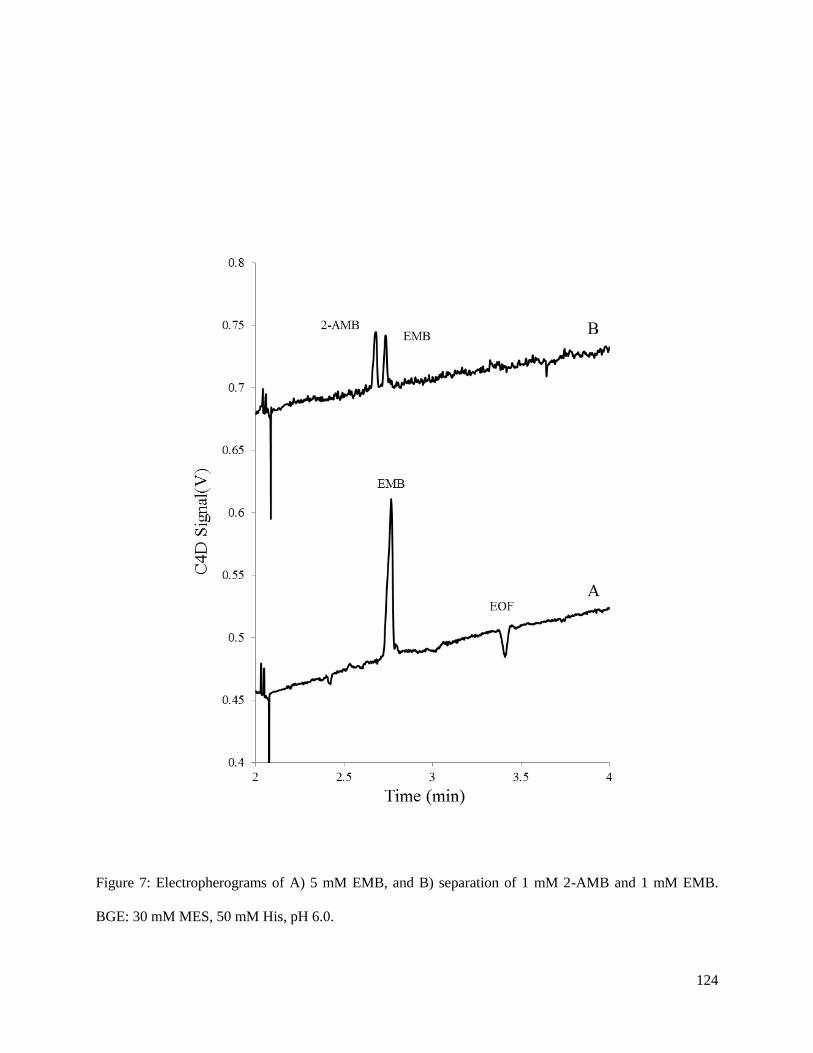
124
Figure 7: Electropherograms of A) 5 mM EMB, and B) separation of 1 mM 2-AMB and 1 mM EMB.
BGE: 30 mM MES, 50 mM His, pH 6.0.

125
Figure 8: The effective mobility curve of EMB and INH. Data provided by Professor Marcone de Oliveira
from the Departamento de Química, Instituto de Ciências Exatas, Universidade Federal de Juiz de Foravia
via personal communication.

126
Figure 9: Electropherograms of A) 1 mM EMB, B) 5 mM INH, and C) separation of 1 mM EMB and 5
mM INH. BGE: 60 mM HEPES, 0.1 mM lactic acid, pH 4.0

127
Figure 10: Electropherograms of A) 1 mM EMB and B) separation of 1 mM 2-AMB and 0.25 mM EMB.
BGE: 60 mM HEPES, 0.1 mM lactic acid, pH 4.0

128
To determine the utility of ME-C4D for quantitation of both drugs, calibration curves were prepared for
EMB and INH. Since the concentration of the sample is determined during sample preparation when a
specified amount of the crushed tablet is dissolved into the BGE, the test can easily be run at a
concentration that falls within the linearity of the method. Calibration curves for EMB and INH were
linear over a range of 0.25-5.0 mM with R2
values of 0.9973 and 0.9991, respectively. The LODs,
estimated at a S/N =3, were 18 µM for EMB and 180 µM for INH. Luckily, sensitivity is not a main
concern for the analysis of these compounds since the solid dose formulations contain a large amount of
active ingredient, 400 mg per EMB HCl tablet and 300 mg per INH tablet.
5.3.2 ME separation performance for EMB standards vs pharmaceutical formulation
To assess the analytical performance of the separation, the % RSD for migration time, peak height,
and peak area, along with theoretical plates/meter were calculated for the EMB standard dissolved in
BGE and are shown in Table 1. The commercial EMB HCl tablet is formulated with several excipients
including gelatin, hydroxypropyl methylcellulose, sodium lauryl sulfate, sorbitol, steric acid, sucrose, and
titanium dioxide. To insure that the presence of excipients did not affect the separation, or the ability to
quantitate the drug, a crushed tablet was dissolved into BGE and analyzed. Surprisingly, the migration
time reproducibility improved significantly with the addition of the excipients, as did the calculated
number of theoretical plates (Table 1). This could possibly be explained by the presence of the lauryl
sulfate surfactant in the formulation. With the initially high concentrations of the drug and surfactant
found in the injection plug, it is possible that the negatively charged surfactants present in the formulation
associate with EMB, through a combination of hydrophobic or electrostatic interactions. This association
would decrease the electrophoretic mobility of the EMB, and induce a stacking effect. Then, as the
sample plug diffuses, becoming diluted by BGE in the separation channel, these interactions would
diminish, causing the free drug to separate based on its own electrophoretic mobility. A similar
phenomena of sample pre-concentration by surfactant micelle collapse has been described by Quirino et
al [40].
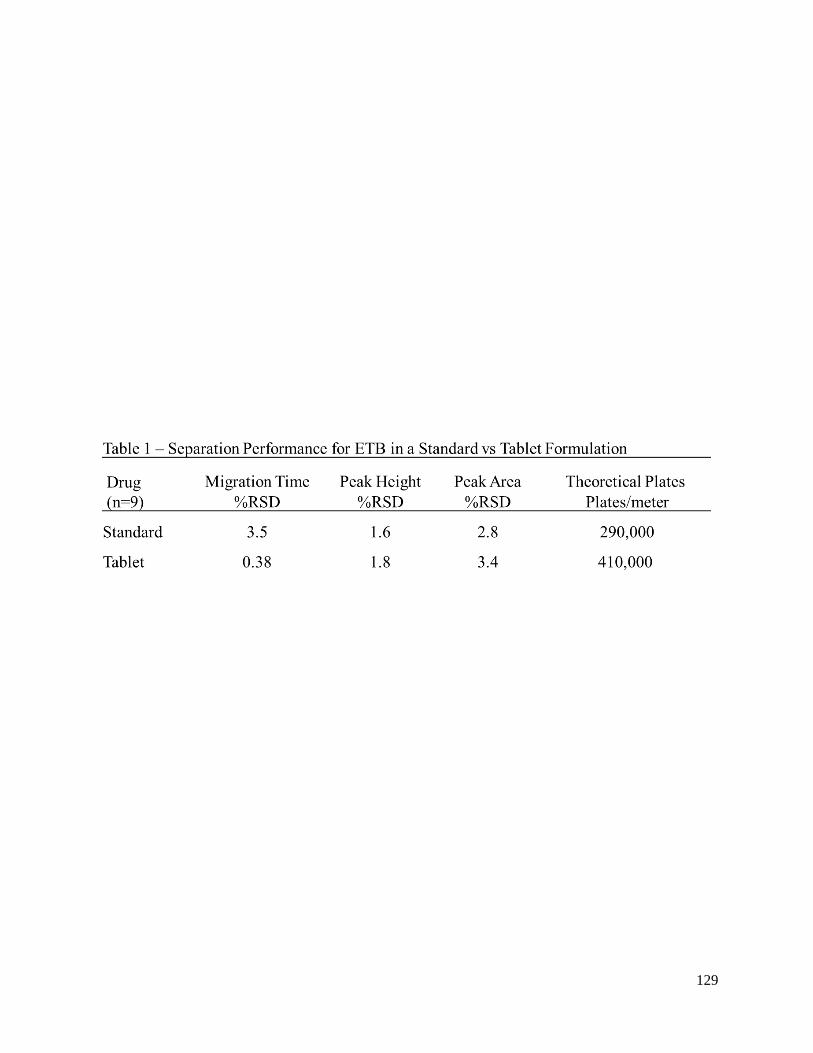
129

130
5.3.3 Analysis of a lab-made counterfeit
As previously stated, approximately one fifth of counterfeit drugs contain the wrong amount of
active ingredient [4]. The available paper-based devices and handheld spectrometers are currently unable
to perform quantitative analysis. According to the European Pharmacopoeia monograph for EMB HCl,
the tablet must contain between 90-110% of the amount listed on the label [41]. To assess the capability
of the ME-C4D system to measure the amount of active ingredient in adulterated products, lab-made
counterfeits were formulated by cutting EMB tablets with sucrose. Then, using the peak area of the
counterfeit formulations divided by the peak area of a 100% EMB standard, the percentage of EMB in the
counterfeit was determined. The actual percentage fell within a 95% confidence interval for all counterfeit
formulations except for the 25% ETB counterfeit, where the ME-C4D results gave a confidence interval
of 25.9-28.1 for an n=9 injections (Figure 11). However, 25% is far outside of the acceptable
concentration range for EBT HCl and even with a confidence of 90% this product would be rejected.
While further studies will need to investigate counterfeits covering a %EMB closer to the acceptable
range of 90-110%, this study suggests that a peak area comparison of the sample to a standardized
solution of EMB could be used accurately assess the amount of active ingredient in the product.
5.3.4 Identification of an internal standard
For the application of in-field analysis in developing countries, the assay will need to be robust
and reproducible under a wide range of external conditions. Temperature, in particular, can greatly affect
the migration time of analytes due to the change in BGE viscosity. To help account for environmental
error, as well as any chip-to-chip variation, an internal standard should be used. Additionally, having the
internal standard will provide a more accurate way to identify drugs based on their relative migration
time.
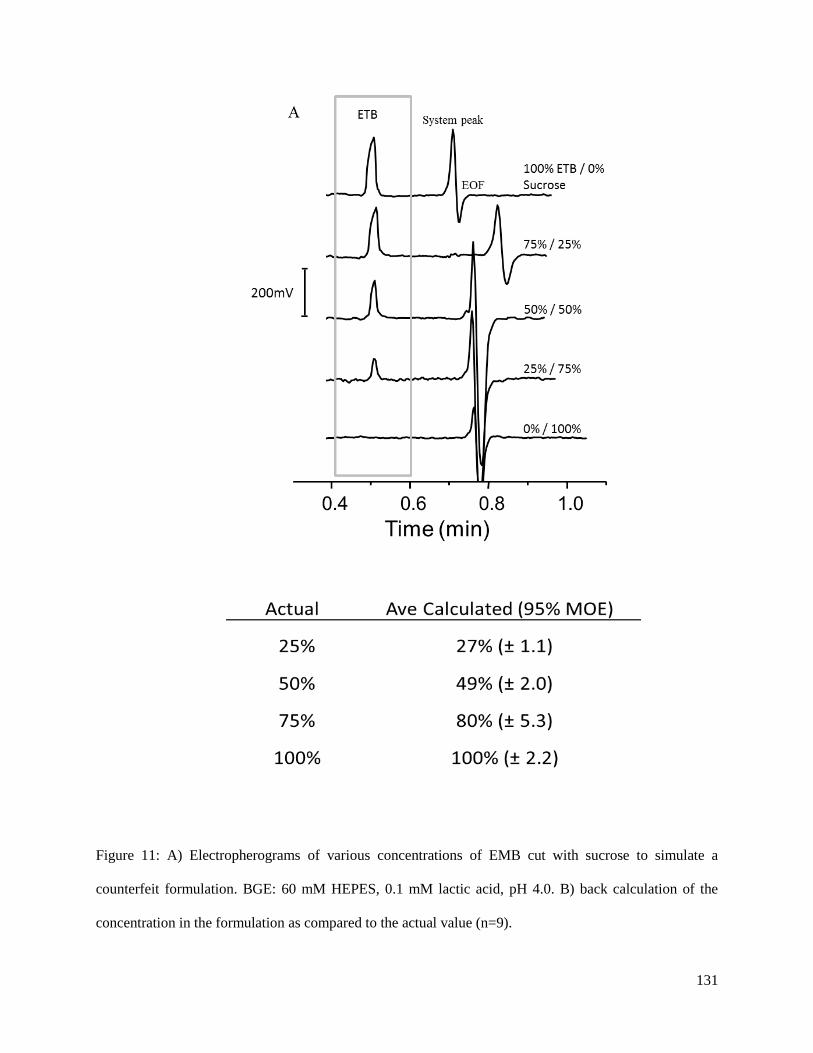
131
Figure 11: A) Electropherograms of various concentrations of EMB cut with sucrose to simulate a
counterfeit formulation. BGE: 60 mM HEPES, 0.1 mM lactic acid, pH 4.0. B) back calculation of the
concentration in the formulation as compared to the actual value (n=9).

132
Several amine-containing compounds were assessed as internal standards using the simulation
software Peakmaster. Peakmaster is a program developed by Jaroš et al in 2001 that uses equations
derived from electrophoresis theory to predict analyte migration times. Based on user imputed BGE,
sample, and instrumentation conditions a theoretical electropherogram is generated. The 60 mM HEPES,
0.1 mM lactic acid BGE conditions were entered into the program from a predetermined database of
possible constituents. Mobilities of EMB and INH were used as calculated by Faria et al., while the
mobilities of the potential internal standards (ethylenediamine (EDA), diethylamine (DEA), and benzyl
amine (BA)) were taken from the Peakmaster database of potential analytes. Using the specified
parameters of all components in a 10 cm fused silica capillary was accomplished (Figure 12).
In Figure 13 it is possible to see that INH is fully resolved from all species, however, EMB
completely co-migrated with BA but was separated from EDA and DEA. Based on this information, both
EDA and DEA were tested on-chip. Using the ME-C4D, it was found that EMB and DEA co-migrated
under the separation conditions (Figure 13a), while EDA was fully resolved from both IHN and EMB and
will be used in the future as an internal standard (Figure 13b).

133
Figure 12: Peakmaster perdition of migration times of three potential internal standards based on the
mobility from the database of compounds. Mobilities of EMB and INH were given to us by Marcone de
Oliverira. Peakmaster run parameters: 40 cm capillary/10 cm to window, positive polarity, 10.8 kV
driving voltage, EOF at 3 min. BGE constituents: 60 mM HEPES, 0.1 mM lactic acid. Signal:
conductivity.
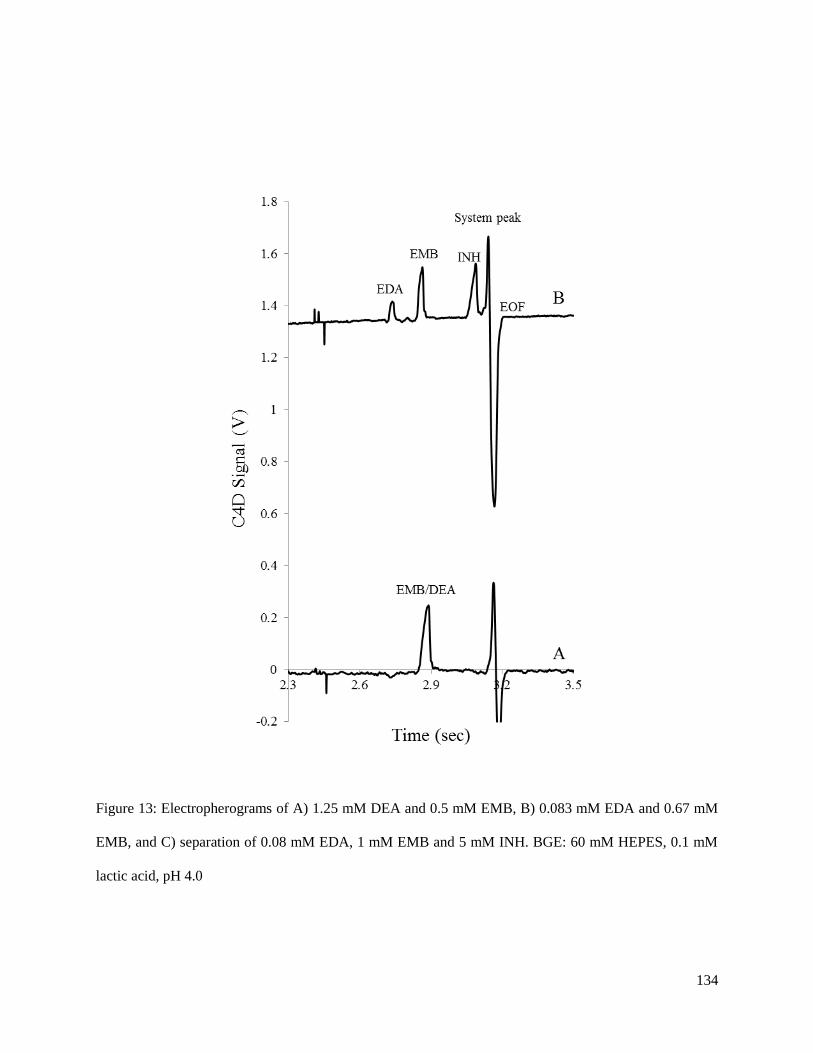
134
Figure 13: Electropherograms of A) 1.25 mM DEA and 0.5 mM EMB, B) 0.083 mM EDA and 0.67 mM
EMB, and C) separation of 0.08 mM EDA, 1 mM EMB and 5 mM INH. BGE: 60 mM HEPES, 0.1 mM
lactic acid, pH 4.0
135
5.4 Conclusions
This chapter describes the first steps towards the development of a portable ME-C4D assay for on-
site pharmaceuticals testing. ME-C4D can provide separation-based analysis and necessary quantitative
information for counterfeit drug screening in developing countries. Using a PDMS microchannel
substrate with a 5 cm separation channel, a separation of two first-line anti-TB drugs (EMB and INH) was
accomplished. TB medications are often prescribed in fixed dose combination formulations; making the
simultaneous analysis of multiple active ingredients extremely useful. Using ME-C4D it is also possible to
partially resolve EMB and its major degradation product, 2-AMB. The resolution of the separation could
be improved though further optimization of the BGE or separation channel length.
To demonstrate the ability of this assay to provide quantitative results, a lab-made counterfeit of
EMB was analyzed. The concentration of EMB in the adulterated product, EMB HCl tablet cut with
sucrose, was determined by comparison of the peak area to a standard solution of EMB. Additionally, an
internal standard was identified to help reduce chip-to-chip variability and assay error for future studies.
While much work is needed before this device can be subjected to testing in the field, there is obvious
potential in the utility of ME-C4D to provide low-cost portable and quantitative analysis of
pharmaceuticals.

136
5.5 References
[1] Storme-Paris, I., Rebiere, H., Matoga, M., Civade, C., Bonnet, P. A., Tissier, M. H., Chaminade, P.,
Anal. Chim. Acta 2010, 658, 163-174.
[2] Zucker, H., Akunyili, D. N., Lee, R., in: IMPACT (Ed.), World Health Organization.
[3] Kimura, K., Nishizawa, M., Sodogandji, T., ten Ham, M., Wondemangegnehu, E., Department of
Essential Drugs and Other Medicines, World Health Organization, Geneva, Switxerland 1999.
[4] http://www.who.int/medicines/services/counterfeit/overview/en/, World Health Organization;
Medicines 2014.
[5] Power, G., in: IMPACT (Ed.), http://www.who.int/impact/events/IMPACT-ACTechnologiesv3LIS.pdf,
World Health Organization.
[6] Shah, R. Y., Prajapati, P. N., Agrawal, Y. K., J Adv Pharm Technol Res 2010, 1, 368-373.
[7] Fischer, A., U.S. Food and Drug Administration 2013.
[8] http://www.fda.gov/downloads/ForConsumers/ConsumerUpdates/UCM349206.pdf, Food and Drug
Administration, Consumer Health Information.
[9] http://www.fda.gov/downloads/NewsEvents/Newsroom/FactSheets/UCM349286.pdf, in: Services, D.
o. H. a. H. (Ed.), U.S. Food and Drug Administration 2013.
[10] Ida, H., Kawai, J., Forensic Sci. Int. 2005, 151, 267-272.
[11] Ricci, C., Nyadong, L., Yang, F., Fernandez, F. M., Brown, C. D., Newton, P. N., Kazarian, S. G.,
Anal. Chim. Acta 2008, 623, 178-186.
[12] Yang, D., Thomas, R., Am. Pharm. Rev. 2012, 15, 1-10.
[13] Hargreaves, M. D., Green, R. L., Jalenak, W., Brown, C. D., Gardner, C., John Wiley & Sons Ltd.
2012, pp. 275-287.
[14] Moffat, A. C., Assi, S., Watt, R. A., J. Near Infrared Spectrosc. 2010, 18, 1-15.
[15] Assi, S., Watt, R., Moffat, T., Spectroscopy 2011, 36, 38-44, 46-47.
[16] Hajjou, M., Qin, Y., Bradby, S., Bempong, D., Lukulay, P., J. Pharm. Biomed. Anal. 2013, 74, 47-
55.

137
[17] Sherma, J., Acta Chromatogr. 2007, 19, 5-20.
[18] Flinn, P. E., Kenyon, A. S., Layloff, T. P., J. Liq. Chromatogr. 1992, 15, 1639-1653.
[19] Kaale, E., Risha, P., Layloff, T., Sherma, J., Chromatogr. Sci. Ser. 2014, 106, 247-263.
[20] Martinez, A. W., Phillips, S. T., Whitesides, G. M., Carrilho, E., Anal. Chem. (Washington, DC, U.
S.) 2010, 82, 3-10.
[21] Fu, E., Liang, T., Spicar-Mihalic, P., Houghtaling, J., Ramachandran, S., Yager, P., Anal. Chem
2012, 84, 4574-4579.
[22] Lutz, B., Liang, T., Fu, E., Ramachandran, S., Kauffman, P., Yager, P., Lab Chip 2013, 13, 2840-
2847.
[23] Yager, P., Edwards, T., Fu, E., Helton, K., Nelson, K., Tam, M. R., Weigl, B. H., Nature (London,
U. K.) 2006, 442, 412-418.
[24] Weaver, A. A., Reiser, H., Barstis, T., Benvenuti, M., Ghosh, D., Hunckler, M., Joy, B., Koenig, L.,
Raddell, K., Lieberman, M., Anal. Chem. 2013, 85, 6453-6460.
[25] Lacher, N. A., Garrison, K. E., Martin, R. S., Lunte, S. M., Electrophoresis 2001, 22, 2526-2536.
[26] Wang, J., Talanta 2002, 56, 223-231.
[27] Guijt, R. M., Baltussen, E., Van der Steen, G., Frank, H., Billiet, H., Schalkhammer, T., Laugere, F.,
Vellekoop, M., Berthold, A., Sarro, L., Van Dedem, G. W. K., Electrophoresis 2001, 22, 2537-2541.
[28] Coltro, W. K. T., Lima, R. S., Segato, T. P., Carrilho, E., Pereira de Jesus, D., Lucio do Lago, C.,
Fracassi da Silva, J. A., Anal. Methods 2012, 4, 25-33.
[29] Becker, H., Gaertner, C., Anal. Bioanal. Chem. 2008, 390, 89-111.
[30] Becker, H., Locascio, L. E., Talanta 2002, 56, 267-287.
[31] Fiorini, G. S., Chiu, D. T., BioTechniques 2005, 38, 429-446.
[32] Tsao, C.-W., DeVoe, D. L., Microfluid. Nanofluid. 2009, 6, 1-16.
[33] Faria, A. F., de Souza, M. V. N., Bruns, R. E., de Oliveira, M. A. L., Talanta 2010, 82, 333-339.
[34] Fracassi da Silva, J. A., Vitorazzi de Castro, N., Pereira de Jesus, D., Faria, A. F., De Souza, M. V.
N., Leal de Oliveira, M. A., Electrophoresis 2010, 31, 570-574.
138
[35] Duffy, D. C., McDonald, J. C., Schueller, O. J. A., Whitesides, G. M., Anal. Chem. 1998, 70, 4974-
4984.
[36] McDonald, J. C., Duffy, D. C., Anderson, J. R., Chiu, D. T., Wu, H., Schueller, O. J. A., Whitesides,
G. M., Electrophoresis 2000, 21, 27-40.
[37] Vazquez, M., Frankenfeld, C., Coltro, W. K. T., Carrilho, E., Diamond, D., Lunte, S. M., Analyst
2010, 135, 96-103.
[38] Fracassi da Silva, J. A., do Lago, C. L., Analytical Chemistry 1998, 70, 4339-4343.
[39] Fracassi da Silva, J. A., Guzman, N., do Lago, C. L., Journal of Chromatography A 2002, 942, 249-
258.
[40] Quirino, J. P., Haddad, P. R., Anal. Chem. 2008, 80, 6824-6829.
[41] Pharmacopia, Ethambutol Hydrochloride, Council of Europe, Strasbourg 2005.

139
Chapter Six m
Conclusions and Future Directions

140
6.1 Conclusions
6.1.1 Oxytocin project
The ultimate goal of the project described in the first half of this thesis was to develop a capillary
electrophoresis (CE) method for the separation and detection of the degradation products formed by
oxytocin (OT) under thermal stress. Having a reliable, low-cost assay for OT integrity could help
maintain a more secure supply chain in developing countries. Currently the biggest threat to the supply of
OT is the absence of proper shipping and storage of these heat-sensitive products [1] as OT is known to
generate several degradation products under heat-stress conditions [2].
Initially, studies were focused on the CE-based separation of the desamino degradation products
of OT, as discussed in chapter 3 [3]. OT has three possible sites where deamidation can occur, leading to
seven different desamino degradation products. Chapter 3 described the systematic optimization of the
background electrolyte (BGE) for the CE separation to provide greater selectivity between species with
similar electrophoretic mobilities. The final BGE composition included sulfobutyl ether β-cyclodextrin as
a pseudo stationary phase and MeOH as an organic modifier. Under these conditions it was possible to
achieve baseline resolution of all seven desamino species from OT. Using this method, the heat-stress
degradation of OT at pH 2.0 was monitored over a period of 96 h at 70 °C. This CE method offers faster
analysis times and lower costs-per-test than the current HPLC method.
However, deamidation is not the only degradation pathway for heat-stressed OT samples.
Previous studies have shown that the major products formed at pH > 3 are dimers and cyclic polysulfides.
The cyclic polysulfides are formed by the addition of one to two sulfurs to the disulfide bridge of OT
between Cys1 and Cys
6. The mechanism by which both the dimers and the cyclic polysulfides are formed
was postulated by Wisniewski et al [4]. These previous studies to determine the degradation products of
OT were performed in phosphate buffered solutions to control pH. While this was necessary for
controlled OT degradation, it does not account for the fact that injectable OT is formulated in unbuffered

141
water, adjusted between pH 3-5 with the addition of acetic acid, and 0.5% w/v chlorobutanol (CB) as a
preservative. Before continuing the optimization of our CE method to include the dimer and cyclic
polysulfide compounds, confirmation that the degradation products formed in the pharmaceutical
preparation are identical to those reported in the buffered formulation was needed.
Chapter 4 presents a preliminary study of the OT degradation products formed under heat-stress
conditions in a variety of liquid formulations, including an unbuffered water solution with CB that is
similar to the pharmaceutical preparation. Over the course of two days, multiple samples were analyzed at
regular time intervals while the samples were heated at 70° C. The analysis of the samples was
accomplished with LC-UV-MS. MS was used for mass identification of the peaks present in the LC-UV
chromatogram, while the LC-UV data at 214 nm was used for quantitative analysis to determine
degradation kinetics.
In these studies, it was determined that the presence of CB in the unbuffered and buffered
formulations increased the thermal stability of OT. This effect was much more pronounced in the
unbuffered formulations where the percentage of OT remaining after 48 h at 70 °C was improved by a
factor of five. In the formulations that did not contain CB, all of the expected degradation products of OT
(dimers and cyclic polysulfides) were observed. However, with the addition of CB, the dimer products
were no longer formed, indicating a change in the degradation mechanism of OT. Additionally, a new
peak was observed in the LC-UV chromatogram that eluted after the trisufide product (4.9% of t=0
oxytocin peak area).
Several compounds of structural similarity to CB were tested in the unbuffered OT formulation in
an attempt to determine mechanism by which CB decreases the degradation rate. Of all of the compounds
tested, only 0.5% w/v 2,2,2-trichloroethanol (TCE) produced a similar stabilizing effect in the OT
formulation, as well was preventing the formation of dimer products. Additionally, an unidentified peak
was seen in the LC-UV chromatogram of the TCE sample (5.8% of t=0 oxytocin peak area). If CB and

142
TCE are reacting with the OT in a way that prevents the formation of dimers, this new peak could be a
useful tool in determining the mechanism. Future studies will focus on confirming its identity.
6.1.2 ME-C4D portable analysis project
The overall goal of this project was to take the initial steps towards developing a portable analysis
system for on-site drug quality control screening. Resource-low countries are plagued by the counterfeit
drug products that make up to 50% of the market in some areas. Without proper regulatory control by
governmental agencies, these substandard products can pass unchecked into the country and be
distributed causing prolonged sickness, potential side effects, and death. Currently, the analytical methods
available for screening pharmaceutical supply chains range from high-tech handheld spectrometers, to
low-tech TLC and lateral-flow assays. These methods cover a variety of innovative ways to qualitatively
assess drug quality; however, their quantitative abilities are limited. This prevents the identification of the
subset of counterfeits that contains the wrong amount of active ingredient.
To supplement the qualitative methods mentioned above, while keeping the cost-per-test low,
microchip electrophoresis (ME) is an attractive separations-based analysis method. ME can be coupled
with a universal detector, such as C4D, that allows for quantitative analysis of multiple products
simultaneously. The work in chapter 5 discusses the uses of ME coupled with capacitively coupled
contactless conductivity detection (C4D) for the analysis of anti-tuberculosis (TB) drugs. Using this
methods, two first-line anti-TB drugs, ethambutol (EMB) and isoniazid (INH), separated and detected
using a BGE consisting of 60 mM HEPES with 0.1 mM lactic acid at pH 4.0. Additionally, this system
was used to analyze lab-made counterfeits of various concentrations of EMB. The assay was useful for
determining the concentration of formulations containing 50, 75, and 100% drug within a 95% confidence
interval.
143
6.2 Future Directions
6.2.1 CE separation of all oxytocin degradation products
In addition to further investigations into the mechanism of the stability enhancement of oxytocin in
the presence of CB as discussed at the end of chapter 4, we would like to continue working towards a CE-
based separation for OT integrity screening. As mentioned previously, OT and the cyclic polysulfides
have roughly the same size-to-charge ratio at all pH values, making them impossible to separate by CZE.
Additionally, the cyclodextrin used in chapter 3 does not provide any selectivity between these three
peptides. However, metals such as copper (II) have been used previously to form complexes with
peptides, imparting an additional negative charge and thereby changing their mobility [5].
We have hypothesized that the addition of copper (II) or another divalent metal ion to the BGE
could lead to varying degrees complexation for the three cyclic peptides based on the length of the
disulfide bridge. Due to the presence of the disulfide bond, OT does have some inherent secondary
structure. Structural studies have shown that hydrogen bonding occurs between the hydroxyl group of the
Tyr2 and the carboxamide of Asn5 due to their proximity in the cyclic form of the peptide. With the
addition of each new sulfur molecule to the disulfide bridge, this structure could change, possibly
allowing access to more of the peptide backbone for metal complexation, introducing selectivity between
the di-, tri-, and tetrasulfide OTs. The trouble with testing this hypothesis has been the lack of
commercially available standards for the cyclic polysulfides that could be used to optimize the separation.
However, both Ferring Pharmaceuticals and the Schoenich lab at KU have offered their support in the
donation or preparation of said species.
6.2.2 Continuing development for on-site ME analysis
6.2.2.1. ME-C4D for small molecule analysis
It going forward, the next goal of this project is to further develop the ME-C4D system so it can be
used for the analysis of counterfeit drugs in developing countries. This includes further miniaturization of
144
the associated electronics needed to run the device. Through work in our laboratory by Ryan Grigsby, and
through collaboration with Pinnacle Technologies, development of a miniaturized high voltage power
supply (HVPS) and associated software needed to operate the voltage for fluid flow on-chip has been
accomplished. This instrumentation was developed as part of our “lab-on-a-sheep” project; however, the
technology is transferable to on-site microchip based analytical systems. The C4D circuitry is already
quite small and can be housed in a 2”x4” box. To be fully autonomous, all the components including
HVPS and C4D, must run on a laptop battery. Again, this has been demonstrated with the “lab-on-a-
sheep” project and just needs to be modified for the ME-C4D system.
To further improve this assay for use in developing countries, another area of future research that
needs to be addressed is investigating alternative microchip substrates to PDMS that are still inexpensive
and easy to fabricate. While PDMS is an excellent choice for prototyping, it will not be useful for the
final product because PDMS loses its elasticity overtime, making long-term storage impractical. Many
plastic options exist [9-11] for just this application and further work will be done to test the separation
performance in a few of these materials.
In addition, before ME-C4D can be implemented in developing countries in areas that do not have
functioning laboratories, sample preparation methods that can be performed on-site without the need of a
mortar and pestle and sonicator to grind the tablet need to be developed. The sample preparation protocols
used in conjunction with the Minilab™ TLC tests have been very successful in this regard [12, 13]. In this
method, the tablet in a small bag and dissolved in a predetermined volume of solvent to achieve the
correct concentration. We will adapt their methods to develop a working protocol. Additionally, the effect
of ambient temperature variability on the ME separation must also be investigated since in elevated
temperatures can lead to changes in the migration time of the analytes. More work, using the internal
standard discussed in chapter 5, is needed to show that separation performance is acceptable under
various external temperatures.

145
And then finally, once the generic ME-C4D system has been fully developed, assays for other drugs
used frequently in developing countries should be developed using the same basic platform. Once these
goals have been realized, it will be possible to portable field ready analysis system that could provide
much needed quantitative analysis of pharmaceuticals on-site and at a low-cost.
6.2.2.2. ME-LIF for protein and peptide drug analysis
The downside of the ME-C4D system for protein and peptide drug analysis is the poor limits of
detection. Peptide and protein drugs are generally formulated at low concentrations; oxytocin for example
is prepared as 10 IU/mL or roughly 20 uM. In CE, the small pathlength leads to poor limits of detection
(LOD) with UV-Vis spectroscopic detection. While the UV is useful for conventional CE for universal
detection of biologics, it does not make an attractive option for microchip. As an alternative to UV, LIF
provides very specific and sensitive detection. Work towards a fully portable LIF detection system has
been underway in our laboratory for the past two years. The current system has a total cost of less than
$500 and can easily fit in an 8x8 inch box (Figure 2). Preliminary separations of fluorescently derivatized
amino acids have been achieved and LODs in the low µM are possible. While these initial studies show
significant promise, much work is needed to get this system to a place where it can be implemented in the
field.
Additionally, microchip electrochromatography (MEC) is being investigated as a separation
mechanism for the peptide products. MEC combines chromatographic retention and electrophoretic
migration, with bulk fluid flow created by the EOF. This combination enhances the selectivity and
efficiency of the separation and enables the separation of neutral species not possible with CZE. Gold
nanoparticles affixed to the surface of the capillary as an open tubular column (OTCEC) have been used
for the separation of peptides [6]. As compared to packed-bed columns, OTCECs have the benefit of easy
and reproducible preparation, while maintain the high peak efficiency of CE [7]. This approach could
allow for a portable and inexpensive peptide assay without the use of BGE additive to achieve a

146
separation of the degraded products. Optimization of peptide separations on both conventional CE and a
microchip design from the Garcia lab [8] is being currently under way.

147
Figure 1: Current image of the portable LIF detector as developed by Nathan J. Oborny in the Susan
Lunte Lab. A) Box housing the electronics, battery to power the system, and 420nm LED with focusing
lenses. B) Objective, filter, and custom photodiode amplifier for detection. C) 3D printed prototype optics
mount to hold objective 45 degrees to LED source.
C
B
A
148
6.3 References
[1] Hogerzeil, H. V., Walker, G. J. A., de Goeje, M. J., Action Programme on Essential Drugs, World
Health Organization. 1993, 1-50.
[2] Hawe, A., Poole, R., Romeijn, S., Kasper, P., van der Heijden, R., Jiskoot, W., Pharm. Res. 2009, 26,
1679-1688.
[3] Creamer, J. S., Krauss, S. T., Lunte, S. M., Electrophoresis 2014, 35, 563-569.
[4] Wiśniewski, K., Finnman, J., Flipo, M., Galyean, R., Schteingart, C. D., Peptide Science 2013, 100,
408-421.
[5] Kuhnline, C. D., Lunte, S. M., J. Sep. Sci. 2010, 33, 2506-2514.
[6] Hamer, M., Yone, A., Rezzano, I., Electrophoresis 2012, 33, 334-339.
[7] Cheong, W. J., Ali, F., Kim, Y. S., Lee, J. W., J. Chromatogr. A 2013, 1308, 1-24.
[8] Segato, T. P., Bhakta, S. A., Gordon, M. T., Carrilho, E., Willis, P. A., Jiao, H., Garcia, C. D., Anal.
Methods 2013, 5, 1652-1657.
[9] Becker, H., Locascio, L. E., Talanta 2002, 56, 267-287.
[10] Fiorini, G. S., Chiu, D. T., BioTechniques 2005, 38, 429-446.
[11] Tsao, C.-W., DeVoe, D. L., Microfluid. Nanofluid. 2009, 6, 1-16.
[12] Kaale, E., Risha, P., Layloff, T., Sherma, J., Chromatogr. Sci. Ser. 2014, 106, 247-263.
[13] Flinn, P. E., Kenyon, A. S., Layloff, T. P., J. Liq. Chromatogr. 1992, 15, 1639-1653.