broughton, john d. (2008) element behaviour in inundated ... · dent, d. (1980) acid sulphate...
TRANSCRIPT

This file is part of the following reference:
Broughton, John D. (2008) Element behaviour in inundated actual acid sulfate soils, East Trinity, Cairns.
PhD thesis, James Cook University.
Access to this file is available from:
http://eprints.jcu.edu.au/2126

276
9. REFERENCES
Afonso, M. D. S. & Stumm, W. (1992) Reductive dissolution of iron(III) (hydr)oxides by hydrogen sulfide. Langmuir, 8, 1671-1675.
Ahern, C. R., Ahern, M. R. & Powell, B. (1998) Guidelines for Sampling and Analysis of Lowland Acid Sulfate Soils (ASS) in Queensland., Indooroopilly., QASSIT, Department of Natural Resources, Resource Sciences Centre.
Aoyama, I., Urakami, Y. & Kawara, O. (1982) Local redistribution and partial extraction of heavy metals in bottom sediments of an estuary. Environmental Pollution (series B), 4, 27-43.
Åström, M. (1998) Partitioning of transition metals in oxidised and reduced zones of sulphide-bearing fine-grained sediments. Applied Geochemistry, 13, 607-617.
Åström, M. (2001a) The effect of acid soil leaching on trace element abundance in a medium-sized stream, W. Finland. Applied Geochemistry, 16, 387-396.
Åström, M. (2001b) Effect of widespread severely acidic soils on spatial features and abundance of trace elements in streams. Journal of Geochemical Exploration, 73, 181-191.
Åström, M. & Åström, J. (1997) Geochemistry of stream water in a catchment in Finland affected by sulphidic fine sediments. Applied Geochemistry, 12, 593-605.
Åström, M. & Björklund, A. (1995) Impact of acid sulfate soils on stream water geochemistry in western Finland. Journal of Environmental Monitoring, 55, 163-170.
Åström, M. & Björklund, A. (1997) Geochemistry and acidity of sulphide-bearing postglacial sediments of western Finland. Environmental Geochemistry & Health, 19, 155-164.
Åström, M. & Corin, N. (2000) Abundance, sources and speciation of trace elements in humus-rich streams affected by acid sulphate soils. Aquatic Geochemistry, 12, 367-383.
Australian and New Zealand Environment and Conservation Council (1992) Australian Water Quality Guidelines for Fresh and Marine Waters., Canberra, ANZECC Secretariat.
Australian and New Zealand Environment and Conservation Council & Agriculture and Resource Management Council of Australia and New Zealand (2000) Australian and New Zealand Guidelines for Fresh and Marine Water Quality 2000. Artarmon, NSW, Australia, Australian Water Association.
Australian Government Bureau of Meteorology (2007) Monthly Climate Statistics - Summary Cairns Airport. Australian Government Bureau of Meteorology,.
Australian National Herbarium Centre for Plant Biodiversity Research (2007) PTERIDACEAE. Canberra, Australia, Australian National Herbarium Centre for Plant Biodiversity Research.
Azizian, M. F. & Nelson, P. O. (1998) Lead sorption, chemically enhanced desorption, and equilibrium modelling in an iron-oxide-coated sand and synthetic groundwater system. IN JENNE, E. (Ed.) Adsorption of Metals by Geomedia: Variables, Mechanisms, and Model Applications. San Diego, USA, Academic Press.
Baker, A. J. M. (1981) Accumulators and excluders - strategies in the response of plants to heavy metals. Journal of Plant Nutrition, 3, 643-654.
Barry, E. V., Ahern, C. R., Martens, M. A., Hopgood, G. L. & Smith, C. D. (2003) Surface Water Monitoring and Treatment. IN SMITH, C. D., MARTENS, M., AHERN, C. R., ELDERSHAW, V. J., POWELL, B., BARRY, E. V. & HOPGOOD, G. L. (Eds.) Demonstration of Management and Rehabilitation of Acid Sulfate Soils at East Trinity: Technical Report. Indooroopilly, Queensland, Queensland Government Department of Natural Resources and Mines.
Bennett, B. & Dudas, M. J. (2003) Release of arsenic and molybdenum by reductive dissolution of iron oxides in a soil with enriched levels of native arsenic. Journal of Environmental Engineering and Science, 2, 265 - 272.
Berner, R. A. (1964) Iron sulfides formed from aqueous solution at low temperatures and atmospheric pressure. Journal of Geology, 72, 293-306.
Berner, R. A. (1970) Sedimentary pyrite formation. American Journal of Science, 268, 1 - 23. Berner, R. A. (1984) Sedimentary pyrite formation: an update. Geochimica Cosmochimica Acta, 48, 605
- 615. Bethke, C. M. (2006) Act2. 6.05 ed. Urbana, Illinois, Rockware Inc. Bigham, J. M., Schwertmann, U. & Pfab, G. (1996a) Influence of pH on mineral speciation in a
bioreactor simulating acid mine drainage. Applied Geochemistry, 11, 845-849.

277
Bigham, J. M., Schwertmann, U., Traina, S. J., Winland, R. L. & Wolf, M. (1996b) Schwertmannite and the chemical modelling of iron in acid sulfate waters. Geochimica et Cosmochimica Acta, 60, 2111-2121.
Bird, E. C. F. (1970) Coastal evolution in the Cairns district. The Australian Geographer, 11, 327-335. Blake, L., Johnston, A. E. & Goulding, K. W. T. (1994) Mobilization of aluminium in soil by acid
deposition and its uptake by grass cut for hay - a chemical time bomb. Soil Use and Management, 10, 51-55.
Bloomfield, C., Coulter, J. K. & Kanaris-Sotiriou, R. (1968) Oil palms on acid sulphate soil in Malaya. Tropical Agriculture, 45, 289-300.
Blunden, B. & Indraratna, B. (2000) Evaluation of surface and groundwater management strategies for drained sulfidic soil using numerical simulation models. Australian Journal of Soil Research, 38, 569-590.
Blunden, B. & Indraratna, B. (2001) Pyrite oxidation model for assessing ground-water management strategies in acid sulfate soils. Journal of Geotechnical and Geoenvironmental Engineering, 127, 146-157.
Bodle, M. J. & Van, T. K. (1999) Biology of Melaleuca. IN LAROCHE, F. B. (Ed.) Melaleuca Management Plan. Florida Exotic Pest Plant Council.
Borggaard, O. K. (1976) The use of EDTA in soil analysis. Acta Agriculturae Scandinavica, 26, 144-150.
Bowman, G., Hicks, W., Fitzpatrick, R. & Davies, P. (1999) Remediation options for the acid sulfate soil ‘hotspot’ at East Trinity Inlet, Cairns, North Queensland. IN SLAVICH, P. (Ed.) Workshop on Remediation & Assessment of Broadacre acid sulfate soils. Southern Cross University, Lismore, Acid Sulfate Soil Management Advisory Committee (ASSMAC), Australia.
Boyle, R. W. & Jonasson, I. R. (1973) The geochemistry of arsenic and its use as an indicator element in geochemical prospecting. Journal of Geochemical Exploration, 2, 251-296.
Brimhall, G. H., Alpers, C. N. & Cunningham, A. B. (1985) Analysis of supergene ore-forming processes and ground-water solute transport using mass balance principles. Economic Geology, 80, 1227-1256.
Brimhall, G. H. & Dietrich, W. E. (1987) Constitutive mass balance relations between chemical composition, volume, density, porosity, and strain in metasomatic hydrochemical systems: results on weathering and pedogenesis. Geochimica et Cosmochimica Acta, 51, 567-587.
Brimhall, G. H., Lewis, C. J., Ague, J. J., Dietrich, W. E., Hampel, J., Teague, T. & Rix, P. (1988) Metal enrichment in bauxites by deposition of chemically mature aeolian dust. Nature, 333, 819-824.
Brimhall, G. H., Lewis, C. J., Ford, C., Bratt, J., Taylor, G. & Warin, O. (1991) Quantitative geochemical approach to pedogenesis: importance of parent material reduction, volumetric expansion, and eolian influx in lateritization. Geoderma, 51, 51-91.
Brinkman, R., Bao Ve, N., Kim, T. T., Phuoc Hau, D. & Van Mensvoort, M. E. F. (1993) Sulfidic materials in the Western Mekong Delta, Vietnam. Catena, 20, 317-331.
Brinkman, W. J. & Xuan, V.-T. (1991) Melaleuca Leucadendron, a useful and versatile tree for acid sulfate soils and some other poor environments. The International Tree Crops Journal, 6, 261-274.
Brookins, D. G. (1988) Eh-pH Diagrams for Geochemistry, Berlin, Springer-Verlag. Bunzl, K., Albers, B. P., Schimmack, W., Belli, M., Ciuffo, L. & Menegon, S. (2000) Examination of
a relationship between 137Cs concentrations in soils and plants from alpine pastures. Journal of Environmental Radioactivity, 48, 145-158.
Burgess, J. (1978) Metals ions in solution, Ellis Horwood, Chichester, England. Bush, R. T., Fyfe, D. & Sullivan, L. A. (2004) Occurrence and abundance of monosulfidic black
ooze in coastal acid sulfate soil landscapes. Australian Journal of Soil Research, 42, 609-616. Bush, R. T., Fyfe, D. M. & Sullivan, L. A. (2002a) Distribution and occurrence of monosulfidic
black ooze (MBO) in coastal acid sulfate soil landscapes. 5th International Acid Sulfate Soils Conference - Sustainable Management of Acid Sulfate Soils. Gold Coast.
Bush, R. T. & Sullivan, L. A. (1997) Morphology and behaviour of greigite from a Holocene sediment in Eastern Australia. Australian Journal of Soil Research, 35, 853 - 861.
278
Bush, R. T., Sullivan, L. A. & Fyfe, D. M. (2002b) Mobility of monosulfidic black oozes (MBO's) in a coastal acid sulfate soil landscape. 5th International Acid Sulfate Soils Conference - Sustainable Management of Acid Sulfate Soils. Gold Coast.
Calmano, W., Förstner, U. & Hong, J. (1994) Chapter 20 Mobilization and scavenging of heavy metals following resuspension of anoxic sediments from the Elbe River. IN ALPERS, C. N. & BLOWES, D. W. (Eds.) Environmental Geochemistry of Sulfide Oxidation. American Chemical Society Symposium Series 550. Washington DC, American Chemical Society.
Calmano, W., Hong, J. & Förstner, U. (1992) Influence of pH value and redox potential on binding and mobilization of heavy metals in contaminated sediments. Vom Wasser, 78, 245-257.
Casas, A. M. & Crecelius, E. A. (1994) Relationship between acid volatile sulfide and the toxicity of zinc, lead and copper in marine sediments. Environmental Toxicology & Chemistry, 13, 529-536.
Cavicchiolo, M. (2001) An investigation into the bioaccumulation of arsenic and zinc in biota downstream of an area affected by acid sulfate soils. Engineering. University of New England, Diploma of Engineering Thesis, Unpublished.
Chao, T. T. (1984) Use of partial dissolution techniques in geochemical exploration. Journal of Geochemical Exploration, 20, 101-135.
Chao, T. T. & Sanzolone, R. F. (1977) Chemical dissolution of sulfide minerals. Journal of Research US Geological Survey, 5, 409-412.
Chappell, J. (1982) Sea levels and sediments: some features of the context of coastal archaeological sites in the tropics. Archaeology in Oceania, 17, 69-78.
Chappell, J. & Thom, B. G. (1986) Coastal morphodynamics in North Australia: review and prospect. Australian Geographic Studies, 24, 110-127.
Chojnacka, K., Chojnacki, A., Górecka, H. & Górecki, H. (2005) Bioavailability of heavy metals from polluted soils to plants. Science of the Total Environment, 337, 175-182.
Chu, C., Lin, C., Wu, Y., Lu, W. & Long, J. (2006) Organic matter increases jarosite dissolution in acid sulfate soils under inundation conditions. Australian Journal of Soil Research, 44, 11-16.
Condie, K. C., Dengate, J. & Cullers, R. L. (1995) Behaviour of rare earth elements in a paleoweathering profile on granodiorite in the Front Range, Colorado, USA. Geochimica et Cosmochimica Acta, 59, 279-294.
Cook, F. J., Hicks, W., Gardener, E. A., Carlin, G. D. & Froggatt, D. W. (2000) Export of acidity in drainage water from acid sulphate soils. Marine Pollution Bulletin, 41, 319-326.
Craw, D. & Chappell, D. A. (1989) Evolution and sulphide mineral occurrences of an incipient nonmarine sedimentary basin, New Zealand. Sedimentary Geology, 129, 37 - 50.
Crockford, R. H. & Willett, I. R. (1995) Dry and oxidation effects on the magnetic properties of sulfidic material during oxidation. Australian Journal of Soil Research, 33, 19-29.
Cronan, D. S. (1974) Authigenic minerals in deep-sea sediments. IN GOLDBERG, E. D. (Ed.) The Sea - Ideas and observations on progress in the study of the seas, Volume 5, Marine Chemistry. Chichester., Wiley-Interscience.
Danh, N. T. & Tuong, T. P. (1993) Kinetics of soil solution chemistry in different leaching treatments of undisturbed columns of acid sulphates soils from the Plain of Reeds, Vietnam. IN DENT, D. L. & VAN MENSVOORT, M. E. F. (Eds.) Selected Papers of the Ho Chi Minh city Symposium on Acid Sulphate Soils. . Ho Chi Minh City, Vietnam, ILRI Publication 53, Wageningen, The Netherlands.
Davidson, C. M., Hursthouse, A. S., Tognarelli, D. M., Ure, A. M. & Urquhart, G. J. (2004) Should acid ammonium oxalate replace hydroxylammonium chloride in step 2 of the revised BCR sequential extraction protocol for soil and sediment? Analytica Chimica Acta, 508, 193-199.
Dear, S. E., Moore, N. G., Dobos, S. K., Watling, K. M. & Ahern, C. R. (2002) Soil Management Guidelines. Queensland Acid Sulfate Soil Technical Manual. Brisbane, Queensland State Government Department of Natural Resources and Mines.
Deer, W. A., Howie, R. A. & Zussman, J. (1992) An introduction to the rock-forming minerals, Edinburgh Gate, Harlow, Essex, Addison Wesley Longman Limited.
Dennison, W. C., O’neil, J. M., Duffy, E., Oliver, P. & Shaw, G. (1997) Blooms of the alga Lyngbya Majascula in coastal waters of Queensland. IN CHARPY, L. & LARKUM, A. W. D. (Eds.) International Symposium on Marine Cyanobacterium. Monaco, Bulletin de L’Institut Oceanographique.

279
Dent, D. (1980) Acid Sulphate soils: morphology and prediction. Journal of Soil Science, 31, 87-99. Dent, D. (1986) Acid sulphate soils: a baseline for research and development, Wageningen, The Netherlands,
International Institute for Land Reclamation and Improvement, Publication 39. Dent, D. & Pons, L. J. (1993) Acid and muddy thoughts. IN BUSH, R. T. (Ed.) National Conference
on Acid Sulfate Soils. Coolangatta, CSIRO. Dent, D. L. & Raiswell, R. W. (1982) Quantitative models to predict the rate and severity of acid
sulphate development: a case study in The Gambia. IN DOST, H. & VAN BREEMEN, N. (Eds.) Second international symposium on Acid Sulphate Soils. Bangkok, Thailand, 18-24 January, 1981.
Di Stefano, J. & Fisher, R. F. (1983) Invasion potential of Melaleuca Quinquenervia in southern Florida, USA. Forest Ecology and Management, 7, 133-141.
Dyrssen, D. & Kremling, K. (1990) Increasing hydrogen sulfide concentration and trace metal behaviour in the anoxic Baltic waters. Marine Chemistry, 30, 193-204.
Easton, C. (1989) The trouble with the Tweed. Fishing World, March 1989, 58-59. Erdemoğlu, M. & Sarikaya, M. (2006) Effects of heavy metals and oxalate on the zeta potential of
magnetite. Journal of Colloid and Interface Science, 300, 795-804. Evangelou, V. P. (1998) Environmental Soil and Water Chemistry: Principles and Applications, New York,
John Wiley & Sons. Fanning, D. S. (2002) Acid Sulfate Soils. IN LAL, R. (Ed.) Encyclopedia of Soil Science. New York,
Marcel Dekker, Inc. Faure, G. (1998) Principles and applications of geochemistry. A comprehensive textbook for geology students.,
Prentice Hall, Upper Saddle River, New jersey. Ferguson, A. J. P. & Eyre, B. (1999) Behaviour of aluminium and iron in acid runoff from acid
sulfate soils in the lower Richmond River catchment. AGSO Journal of Australian Geology and Geophysics, 17, 193-201.
Ferriter, A. P. (1999) Extent of Melaleuca infestation in Florida. IN LAROCHE, F. B. (Ed.) Melaleuca Management Plan. 3rd ed., Florida exotic pest plant council.
Finlayson, C. M., Storrs, M. J. & Lindner, G. (1997) Degradation and rehabilitation of wetlands in the Alligator Rivers Region of northern Australia. Wetlands Ecology and Management, 5, 19-36.
Finzgar, N., Kos, B. & Lestan, D. (2005) Heap leaching of lead contaminated soil using biodegradable chelator [S,S]-ethylenediaminedisuccinate. Environmental Technology, 26, 553-560.
Fitzpatrick, R., Davies, P. J., Thomas, B. P., Merry, R. H., Fotheringham, W., Hicks, S. & Barnett, E. L. (2002) Properties, distribution and environmental hazards of South Australian coastal acid sulfate soils. 5th International Acid Sulfate Soils Conference - Sustainable Management of Acid Sulfate Soils. Gold Coast, Queensland, Australia.
Fyfe, D. M., Sullivan, L. A. & Bush, R. T. (2002) Non-ferrous metal content in monosulfidic black oozes (MBO's) in the Richmond River catchment. 5th International Acid Sulfate Soils Conference - Sustainable Management of Acid Sulfate Soils. Gold Coast.
Garrels, R. M. & Perry, E. A. (1974) Cycling of carbon, sulfur, and oxygen through geologic time. IN GOLDBERG, E. D. (Ed.) The Sea - Ideas and observations on progress in the study of the seas, Volume 5, Marine Chemistry., Wiley-Interscience.
Goldhaber, M. B. & Kaplan, I. R. (1974) The sulfur cycle. IN GOLDBERG, E. D. (Ed.) The Sea - Ideas and observations on progress in the study of the seas, Volume 5, Marine Chemistry. Chichester, Wiley-Interscience.
Goldhaber, M. B. & Kaplan, I. R. (1975) Controls and consequences of sulfate reduction rates in recent marine sediments. Soil Science, 119, 42-55.
Graham, T. L. & Larsen, R. M. (2000) Coastal geomorphology: Progressing the understanding of acid sulfate soil distribution. IN AHERN, C. R., HEY, K. M., WATLING, K. M. & ELDERSHAW, V. J. (Eds.) Acid Sulfate Soils: Environmental Issues, Assessment & Management, Technical Papers Brisbane, June 2000. Brisbane, Department of Natural Resources, Indooroopilly, Queensland, Australia.
Grant, J. A. (1986) The Isocon Diagram-A Simple Solution to Gresens' Equation for Metasomatic Alteration. Economic Geology, 81, 1976-1982.
Green, D. (1993) Rivers of death. Fishing World, April 1993. Gresens, R. (1967) Composition-volume relationships of metasomatism. Chemical Geology, 2, 47-65.

280
Griscom, S. B., Fisher, N. S. & Luoma, S. N. (2000) Geochemical influences on assimilation of sediment-bound metals in clams and mussels. Environmental Science and Technology, 34, 91-99.
Grogan, K. L. (2002) Mineralogy and geochemistry of iron in acid sulfate soils, Cairns, Far North Queensland. School of Earth Sciences. Cairns, James Cook University.
Grogan, K. L., Gilkes, R. J. & Lottermoser, B. G. (2003) Maghemite formation in burnt plant litter at East Trinity, North Queensland, Australia. Clays and Clay Minerals, 51, 390-396.
Guilherme, L. R. & Anderson, S. J. (1998) Copper sorption kinetics and sorption hysteresis in two oxide-rich soils (oxisols). IN JENNE, E. (Ed.) Adsorption of Metals by Geomedia: Variables, Mechanisms, and Model Applications. San Diego, USA, Academic Press.
Hall, G. E. M. (1998) Analytical perspective on trace element species of interest in exploration. Journal of Geochemical Exploration, 61, 1-19.
Hall, G. E. M., Gauthier, G., Pelchat, J.-C., Pelchat, P. & Vaive, J. E. (1996a) Application of a sequential extraction scheme to ten geological certified reference materials for the determination of 20 elements. Journal of Analytical Atomic Spectrometry, 11, 787-796.
Hall, G. E. M., Vaive, J. E., Beer, R. & Hoashi, M. (1996b) Selective leaches revisited, with emphasis on the amorphous Fe oxyhydroxide phase extraction. Journal of Geochemical Exploration, 56, 59-78.
Hall, T. (2002) Mineralogy, geochemistry, and behaviour of suspended particles in acid waters at East Trinity, Cairns. Earth Sciences. Cairns, James Cook University, honours thesis, unpublished.
Hall, T. L. (2003) Geochemistry of Suspended Particles in Discharge Waters. IN SMITH, C. D., MARTENS, M. A., AHERN, C. R., ELDERSHAW, V. J., POWELL, B., BARRY, E. V. & HOPGOOD, G. L. (Eds.) Demonstration of Management and Rehabilitation of Acid Sulfate Soils at East Trinity: Technical Report. Indooroopilly, Queensland, Australia., Department of Natural Resources and Mines.
Harmsen, K. & Van Breemen, N. (1975) Translocation of iron in acid sulfate soils: production and diffusion of dissolved ferrous iron. Soil Science Society of America Journal, 39, 1148-1153.
Hauser, L., Tandy, S., Schulin, R. & Nowack, B. (2005) Column extraction of heavy metals from soils using the biodegradable chelating agent EDDS. Environmental Science and Technology, 39, 6819-6824.
Heath, L. C., White, I., Hutchinson, M. F. & Stein, J. (2002) Climate factors that lead to fish kills in acid sulfate soils catchments. The 5th International Annual Acid Sulfate Soils Conference.
Hem, J. D. (1985) Study and interpretation of the chemical characteristics of natural waters. 3rd Edition. IN 2254., U. G. S. W.-S. P. (Ed.).
Hey, K. M., Ahern, C. R. & Watling, K. M. (2000) Using chemical field tests to identify acid sulfate soils likelihood. IN AHERN, C. R., HEY, K. M., WATLING, K. M. & ELDERSHAW, V. J. (Eds.) Acid Sulfate Soils: Environmental Issues, Assessment and Management, Technical Papers. Brisbane, Department of Natural Resources, Indooroopilly, Queensland, Australia.
Hicks, W., Fitzpatrick, R. & Bowman, G. (2003) Managing coastal acid sulfate soils: the East Trinity example. IN ROACH, I. C. (Ed.) Advances in Regolith. Canberra, CRC LEME, CSIRO Land and Water.
Hicks, W. S., Bowman, G. M. & Fitzpatrick, R. W. (1999) East Trinity Acid Sulfate Soils. Part 1: Environmental Hazards. CSIRO Land and Water Technical Report 14/99. CSIRO.
Hicks, W. S. & Fitzpatrick, R. W. (2003) Effects of tidal exchange on soil and sediment. IN SMITH, C. D., MARTENS, M. A., AHERN, C. R., ELDERSHAW, V. J., POWELL, B., BARRY, E. V. & HOPGOOD, G. L. (Eds.) Demonstration of Management and Rehabilitation of Acid Sulfate Soils at East Trinity: Technical Report. Indooroopilly, Queensland, Australia, Department of Natural Resources and Mines.
Hooda, P. S., Mcnulty, D., Alloway, B. J. & Aitken, M. N. (1997) Plant availability of heavy metals in soils previously amended with heavy applications of sewage sludge. Journal of the Science of Food and Agriculture, 73, 446-454.
Hossner, L. R. (1996) Chapter 3 Dissolution for total element analysis. IN SPARKS, D. L., PAGE, A. L., HELMKE, P. A., LOEPPERT, R. H., SOLTANPOUR, P. N. T., M A, JOHNSTON, C. T. & SUMNER, M. E. (Eds.) Methods of Soil Analysis Part 3 - Chemical Methods. Madison, Soil Science Society of America, Inc.
281
Howarth, R. W. (1979) Pyrite: its rapid formation in a salt marsh and its importance in ecosystem metabolism. Science, 203, 49-51.
Howarth, R. W. & Giblin, A. (1983) Sulfate reduction in the salt marshes at Sapelo Island, Georgia. Limnology and Oceanography, 28, 70-82.
Hudson-Edwards, K. A. (2003) Sources, mineralogy, chemistry and fate of heavy metal-bearing particles in mining-affected river systems. Mineralogical Magazine, 67, 205-217.
Hudson-Edwards, K. A., Jamieson, H. E., Charnock, J. M. & Macklin, M. G. (2005) Arsenic speciation in waters and sediments of ephemeral floodplain pools, Rios Agrio-Guadiamar, Aznalcollar, Spain. Chemical Geology, 219, 175-192.
Huggins, F. E., Huffman, G. P., Kosmack, D. A. & Lowenhaupt, D. E. (1980) Mössbauer detection of goethite (α-FeOOH) in coal and its potential as an indicator of coal oxidation. International Journal of Coal Geology, 1, 75-81.
Hund-Rinke, K. & Kordel, W. (2003) Underlying issues in bioaccessibility and bioavailability: experimental methods. Ecotoxicology and Environmental Safety, 56, 52-62.
Hussein, A. H. & Rabenhorst, M. C. (1999) Modeling sulfur sequestration in coastal marsh soils. Soil Science Society of America Journal, 63, 1954-1963.
Indraratna, B., Glamore, W. C. & Tularam, G. A. (2002) The effects of tidal buffering on acid sulphate soil environments in coastal areas of New South Wales. Geotechnical and Geological Engineering, 20, 181-199.
Indraratna, B., Golab, A., Glamore, W. & Blunden, B. (2005) Acid sulphate soil remediation techniques on the Shoalhaven River floodplain, Australia. Quarterly Journal of Engineering Geology and Hydrogeology, 38, 129-142.
Intawongse, M. & Dean, J. R. (2006) Uptake of heavy metals by vegetable plants grown on contaminated soil and their bioavailability in the human gastrointestinal tract. Food Additives and Contaminants, 23, 36-48.
Johnston, S. G., Slavich, P. G. & Hirst, P. (2002) Deep flooding of sulfidic backswamps and artificial drainage: links to estuarine deoxygenation and scald formation. 5th International Acid Sulfate Soils Conference - Sustainable Management of Acid Sulfate Soils. Gold Coast, Australia.
Johnston, S. G., Slavich, P. G. & Hirst, P. (2003) Alteration of groundwater and sediment geochemistry in a sulfidic backswamp due to Melaleuca quinquenervia encroachment. Australian Journal of Soil Research, 41, 1343-1367.
Jones, M. (1985) Quaternary Geology and Coastline Evolution of Trinity Bay, North Queensland., Brisbane, Queensland, Geological Survey of Queensland Publication No 386.
Joukainen, S. & Yli-Halla, M. (2003) Environmental impacts and acid loads from deep sulfidic layers of two well-drained acid sulfate soils in western Finland. Agriculture, Ecosystems & Environment, 95, 297-309.
Kashem, M. A. & Singh, B. R. (2001a) Metal availability in contaminated soils: I Effects of flooding and organic matter on changes in Eh, pH and solubility of Cd, Ni and Zn. Nutrient Cycling in Agroecosystems, 61, 247-255.
Kashem, M. A. & Singh, B. R. (2001b) Metal availability in contaminated soils: II Uptake of Cd, Ni and Zn in rice plants grown under flooded culture with organic matter addition. Nutrient Cycling in Agroecosystems, 61, 257-266.
Kelly, D. P. & Wood, A. P. (2000) Reclassification of some species of Thiobacillus to the newly designated genera Acidithiobacillus gen. nov., Halothiobacillus gen. nov. and Thermithiobacillus gen. nov. International Journal of Systematic and Evolutionary Microbiology, 50, 489-500.
Kersten, M. & Förstner, U. (1987) Effect of sample pretreatment on the reliability of solid speciation data of heavy metals - implications for the study of early diagenetic processes. Marine Chemistry, 22.
Kheboian, C. & Bauer, C. F. (1987) Accuracy of selective extraction procedures for metal speciation in model aquatic sediments. Analytical Chemistry, 59, 1417-1423.
Kos, B. & Lestan, D. (2003) Influence of a biodegradable ([S,S]-EDDS) and nondegradable (EDTA) chelate and hydrogel modified soil water sorption capacity on Pb phytoextraction and leaching. Plant and Soil, 253, 403-411.
Kroon, F. J. (2005) Behavioural avoidance of acidified water by juveniles of four commercial fish and prawn species with migratory life stages. Marine Ecology Progress Series, 285, 193-204.

282
La Force, M. J. & Fendorf, S. (2000) Solid-phase iron characterization during common selective sequential extractions. Soil Science Society of America Journal, 64, 1608-1615.
Lambeck, K., Esat, T. & Potter, E.-K. (2002) Links between climate and sea levels for the past three million years. Nature, 419, 199-206.
Langmuir, D. (1997) Aqueous Environmental Geochemistry, Upper Saddle River, New Jersey, Prentice Hall Inc.
Laperche, V. & Traina, S. (1998) Immobilization of Pb by hydroxylapatite. IN JENNE, E. (Ed.) Adsorption of Metals by Geomedia: Variables, Mechanisms, and Model Applications. San Diego, USA, Academic Press.
Lee, G., Bigham, J. M. & Faure, G. (2002) Removal of trace metals by co precipitation with Fe, Al and Mn from natural waters contaminated with acid mine drainage in the Ducktown Mining District, Tennessee. Applied Geochemistry, 17, 569-581.
Lin, C., Mcconchie, D., Bush, R. T., Sullivan, L. A. & Rosicky, M. (2001) Characteristics of some heavy metals in acid sulfate topsoils, Eastern Australia. Pedosphere, 11, 31-37.
Lin, C. & Melville, M. D. (1993) Control of soil acidification by fluvial sedimentation in an estuarine floodplain, eastern Australia. Sedimentary Geology, 85, 271-284.
Lin, C., Melville, M. D., White, I., Islam, M., Wilson, B. P., Yang, X. & Van Oploo, P. (1998) Chemical controls on acid discharge from acid sulphate soils under sugarcane cropping in an Eastern Australian estuarine Floodplain. Environmental Pollution, 103.
Lin, C., Wood, M., Haskins, P., Ryffel, T. & Lin, J. (2004) Controls on water acidification and de-oxygenation in an estuarine waterway, eastern Australia. Estuarine Coastal and Shelf Science, 61, 55-63.
Lin, S. & Morse, J. W. (1991) Sulfate reduction and iron sulfide mineral formation in Gulf of Mexico anoxic sediments. American Journal of Science, 291, 55 - 89.
Lockhart, C. S., Austin, D. F. & Aumen, N. G. (1999) Water level effects on growth of melaleuca seedlings from Lake Okeechobee (Florida, USA) littoral zone. Environmental Management, 23, 507-518.
Loring, D. H. & Rantala, R. T. T. (1992) Manual for the geochemical analyses of marine sediments and suspended particulate matter. Earth-Science Reviews, 32, 235-283.
Lowson, R. (1982) Aqueous oxidation of pyrite by molecular oxygen. Chemical Reviews, 82, 451-497. Luther Iii, G. W., Meyerson, A. L., Krajewski, J. J. & Hires, R. (1980) Metal sulfides in estuarine
sediments. Journal of Sedimentary Petrology, 50, 1117-1120. Luther Iii, G. W., Meyerson, A. L., Rogers, K. & Hall, F. (1982) Tidal and seasonal variations of
sulfate ion in a Jersey marsh system. Estuaries, 5, 189-196. Ma, L. Q., Komar, K. M., Tu, C., Zhang, W., Cai, Y. & Kennelley, E. D. (2001) A fern that
hyperaccumulates arsenic. Nature, 409, 579. Manceau, A., Lanson, B., Schlegel, M. L., Hargé, J. C., Musso, M., Eybert-Bérard, L., Hazemann, J.
L., Chateigner, D. & Lamble, G. M. (2000a) Quantitative Zn speciation in smelter-contaminated soils by EXAFS spectroscopy. American Journal of Science, 300, 289-343.
Manceau, A., Schlegel, M. L., Musso, M., Sole, V. A., Gauthier, C., Petit, P. E. & Trolard, F. (2000b) Crystal chemistry of trace elements in natural and synthetic goethite. Geochimica et Cosmochimica Acta, 64, 3643-3661.
Martin, J. M., Nirel, P. & Thomas, A. J. (1987) Sequential extraction techniques: promises and problems. Marine Chemistry, 22, 313-341.
Matúš, P., Kubová, J., Bujdoš, M. & Medved', J. (2006) Free aluminium extraction from various reference materials and acid soils with relation to plant availability. Talanta, 70, 996-1005.
Mclaren, R. G., Swift, R. S. & Williams, J. G. (1981) The adsorption of copper by soil materials at low equilibrium solution concentrations. Journal of Soil Science, 32, 247-256.
Meharg, A. A. & Hartley-Whitaker, J. (2002) Arsenic uptake and metabolism in arsenic resistant and nonresistant plant species. New Phytologist, 154, 29 - 43.
Melville, M. D. & White, I. (2002) Acid sulfate soils, management. IN LAL, R. (Ed.) Encyclopedia of Soil Science. Madison Avenue, New York, Marcel Dekker, Inc.
Miller, L. P. (1950) Formation of metal sulfides through the activities of sulfate-reducing bacteria. Boyce Thompson Institute of Plant Research, 16, 85-89.
Miller, W. P., Martens, D. C. & Zelazny, L. W. (1986) Effects of sequence in extraction of trace metals from soils. Soil Science Society of America Journal, 50, 598-601.
283
Morse, J. W. (1994a) Chapter 20 Release of toxic metals via oxidation of authigenic pyrite in resuspended sediments. IN ALPERS, C. N. & BLOWES, D. W. (Eds.) Environmental Geochemistry of Sulfide Oxidation. American Chemical Society Symposium Series 550. Washington DC, American Chemical Society.
Morse, J. W. (1994b) Interactions of trace metals with authigenic sulfide minerals: implications for their bioavailability. Marine Chemistry, 46.
Morse, J. W., Millero, F. J., Cornwell, J. C. & Richard, D. (1987) The Chemistry of the hydrogen sulfide and iron sulfide systems in natural waters. Earth-Science Reviews, 24, 1-42.
Müller, R. & Büttner, P. (2003) An introduction to practical biostatistics in medicine and public health. James Cook University.
Munsell Color (2000) Munsell Soil Color Charts, New Windsor, New York State, GretagMacbeth. Murtha, G. G., Cannon, M. G. & Smith, C. D. (1996) 1:50 000 Soils Map of Babinda-Cairns Area,
North Queensland, CSIRO Division of Soils and the Queensland Government Department of Primary Industries.
Nahon, D. & Merino, E. (1996) Pseudomorphic replacement versus dilation in laterites: petrographic evidence, mechanisms, and consequences for modelling. Journal of Geochemical Exploration, 57, 217-225.
National Environmental Protection Council (1999) Schedule B (1) Guideline on the investigation levels for soil and groundwater. National Environmental Protection Council.
National Research Council (1980) Mineral Tolerance of Domestic Animals, Washington D.C., USA, The National Academy of Sciences, USA.
Natural Resources and Mines (2004) Aerial photograph Cairns Q6118/47 (20/6/2004) Datum GDA94/Projection UTM ZONE 55. Coorparoo, Natural Resources and Mines,.
Nhung, M. M. & Ponnamperuma, F. N. (1966) Effects of calcium carbonate, manganese dioxide, ferric hydroxide, and prolonged flooding on chemical and electrochemical changes and the growth of rice in flooded acid sulfate soil. Soil Science, 102.
Nishizono, H., Suzuki, S. & Ishii, F. (1987) Accumulation of heavy metals in the metal-tolerant fern, Athyrium yokoscense, growing on various environments. Plant and Soil, 102, 65-70.
Nordstrom, D. K. (1991) Chemical modelling of acid mine water in the western United Stages. US Geological Survey Water Res. Invest. Report Number 91-4034. US Geological Survey.
Nordstrom, D. K. & Alpers, C. N. (1999) Geochemistry of acid mine waters. IN PLUMLEE, G. S. & LOGSDON, M. J. (Eds.) The environmental geochemistry of mineral deposits. Part A: processes, techniques and health issues. Reviews in Economic Geology, 6A, 133-160.
Nriagu, J. O. (1978) Dissolved silica in pore waters of Lake Ontario, Erie and Superior sediments. Limnology and Oceanography, 23, 53-67.
Patrick, W. H. J. & Delaune, R. D. (1972) Characterization of the oxidized and reduced zones in flooded soil. Soil Science Society of America Proceedings, 36, 573-576.
Peachey, D. & Allen, B. P. (1977) An investigation into the selective dissolution of sulphide phases from stream sediments and soils. Journal of Geochemical Exploration, 8, 571-577.
Pfeiffer, W. C., Fiszman, M., Drude De Lacerda, L., Van Weerelt, M. & Carbonell, N. (1982) Chromium in water, suspended particles, sediments and biota in the Iraja River estuary. Environmental Pollution (Series B), 4, 193-205.
Pons, L. J., Van Breemen, N. & Driessen, P. M. (1982) Physiography of coastal sediments and development of potential soil acidity. IN KITTRICK, J. A., FANNING, D. S. & HOSSNER, L. R. (Eds.) Acid Sulphate Weathering. SSSA Special Publication No. 10. Madison, Soil Science Society of America.
Portnoy, J. W. & Giblin, A. E. (1997a) Biogeochemical effects of seawater restoration to diked salt marshes. Ecological Applications, 7, 1054-1063.
Portnoy, J. W. & Giblin, E. A. (1997b) Effects of historic tidal restrictions on salt marsh sediment chemistry. Biogeochemistry, 36, 275–303.
Powell, B. (1998) Introduction to Acid Sulfate Soils. Understanding and Managing Acid Sulfate Soils in Canelands, Canegrowers Sugar Environment Forum, Workshop 6. Mackay.
Powell, B. & Ahern, C. R. (1999) QASSMAC Acid sulfate soils management strategy for Queensland. Indooroopilly, Queensland, QASSMAC and Queensland Government Department of Natural Resources.

284
Powell, B. & Martens, M. A. (2005) A review of acid sulfate soil impacts, actions and policies that impact on water quality in Great Barrier Reef catchments, including a case study on remediation at East Trinity. Marine Pollution Bulletin, 51, 149–164.
Queensland Acid Sulfate Soils Investigation Team (Qassit) (2000) East Trinity property acid sulfate soils remediation action plan: for public consultation. Brisbane, Queensland Government Department of Natural Resources.
Queensland Government (2003) East Trinity Property Land Management and Remediation Newsletter - Number 3, November 2003. Brisbane, Queensland Government.
Queensland Herbarium (2007a) Identification of grass collected from East Trinity. Brisbane. Queensland Herbarium (2007b) Identification of mangrove fern and grass collected from East
Trinity. Brisbane. Rabenhorst, M. C. & Fanning, D. S. (2002) Acid sulfate soils, problems. IN LAL, R. (Ed.)
Encyclopedia of Soil Science. New York, Marcel Dekker, Inc. Rabenhorst, M. C., Fanning, D. S. & Burch, S. N. (2002) Acid sulfate soils, formation. IN LAL, R.
(Ed.) Encyclopedia of Soil Science. New York, Marcel Dekker, Inc. Rauret, G., Lopez-Sanchez, J., Luck, D., Yli-Halla, M., Muntau, H. & Quevauviller, P. (2001) The
certification of the extractable contents (mass fractions) of Cd, Cr, Cu, Ni, Pb and Zn in freshwater sediment following a sequential extraction procedure BCR-701. BCR Information. Brussels, European Commission Standards, Measurements, and Testing Program.
Rauret, G., Lopez-Sanchez, J. F., Sahuquillo, A., Barahona, E., Lachica, M., Ure, A. M., Davidson, C. M., Gomez, A., Luck, D., Bacon, J. R., Yli-Halla, M., Muntau, H. & Quevauviller, P. (2000) Application of a modified BCR sequential extraction (three-step) procedure for the determination of extractable trace metal contents in a sewage sludge amended soil reference material (CRM 483), complemented by a three-year stability study of acetic acid and EDTA extractable metal content. Journal of Environmental Monitoring, 2, 228-233.
Rauret, G., Lopez-Sanchez, J. F., Sahuquillo, A., Rubio, R., Davidson, C., Ure, A. & Quevauviller, P. (1999) Improvement of the BCR three step sequential extraction procedure prior to the certification of new sediment and soil reference materials. Journal of Environmental Monitoring, 1, 57-61.
Rayment, G. E. & Higginson, F. R. (1992) Australian Laboratory Handbook of Soil and Water Chemical Methods, North Ryde, Reed International Books Australia Pty Limited trading as Inkata Press, a division of Butterworth-Heinemann.
Reichman, S. M. (2002) The responses of plants to metal toxicity: a review focusing on copper, manganese and zinc, Melbourne, Australia, Australian Minerals & Energy Environment Foundation.
Richards, F. A. (1965) Anoxic basins and fjords. IN RILEY, J. P. & SKIRROW, G. (Eds.) Chemical Oceanography Vol. 1. New York., Academic Press, New York.
Robertson, A. P. & Leckie, J. O. (1998) Acid/base, copper binding, and Cu2+/H+ exchange properties of goethite, an experimental and modeling study. Environmental Science and Technology, 32, 2519-2530.
Rout, G. R., Samantaray, S. & Das, P. (2001) Aluminium toxicity in plants: a review. Agronomie, 21, 3-21.
Royal Australian Survey Corps (1987) Cairns 1:50,000 Topographic Map. Royal Australian Survey Corps.
Russell, D. J. & Helmke, S. A. (2002) Impacts of acid leachate on water quality and fisheries resources of a coastal creek in northern Australia. Marine and Freshwater Research, 53, 19-33.
Sahuquillo, A. & Rauret, G. (2003) Chapter 39 Sequential extraction. IN MESTER & STURGEON (Eds.) Comprehensive Analytical Chemistry XLI.
Sahuquillo, A., Rigol, A. & Rauret, G. (2002) Comparison of leaching tests for the study of trace metals remobilisation in soils and sediments. Journal of Environmental Monitoring, 4, 1003-1009.
Sammut, J., Melville, M. D., Callinan, R. D. & Fraser, G. C. (1995) Estuarine acidification: impacts on aquatic biota of draining acid sulphate soils. Australian Geographical Studies, 33, 89-100.
Sammut, J., White, I. & Melville, M. D. (1994) Stratification in acidified coastal floodplain drains. Wetlands (Australia), 13, 49-64.
Santillan-Medrano, J. & Jurinak, J. J. (1975) The chemistry of lead and cadmium in soil solid phase formation. Soil Science Society of America Journal, 39, 851-856.

285
Shahandeh, H. & Hossner, L. R. (2000) Plant screening for chromium phytoremediation. International Journal of Phytoremediation, 2, 31-51.
Sharp, D. & Simon, D. K. (2002) AusGrass: Grasses of Australia. 1 ed., Australian Biological Resources Study, Canberra, and the Environmental Protection Agency, Queensland.
Sheppard, S. C. & Evenden, W. G. (1988) The assumption of linearity in soil and plant concentrations ratios: an experimental evaluation. Journal of Environmental Radioactivity, 7, 221-247.
Shin, D. & Lee, I. (2002) Carbonate-hosted talc deposits in the contact aureole of an igneous intrusion (Hwanggangri mineralized zone, South Korea): geochemistry, phase relationships, and stable isotope studies. Ore Geology Reviews, 22, 17-39.
Siegel, F. R. (2002) Environmental Geochemistry of Potentially Toxic Metals, Berlin Heidelberg, Springer-Verlag.
Simpson, S. L., Apte, S. C. & Batley, G. E. (1998) Effect of short-term resuspension events on trace metal speciation in polluted anoxic sediments. Environmental Science and Technology, 32, 620-625.
Singer, P. C. & Stumm, W. (1970) Acid mine drainage: the rate determining step. Science, 167, 1121-1123.
Skinner, B. J., Erd, R. C. & Grimaldi, F. S. (1964) Greigite, the thio-spinel of iron: a new mineral. American Mineralogist, 49, 543 - 555.
Smith, C., Eldershaw, V., Barry, E. & Martens, M. (2003a) Background to the Project. IN SMITH, C., MARTENS, M., AHERN, C., ELDERSHAW, V., POWELL, B., BARRY, E. & HOPGOOD, G. (Eds.) Demonstration of Management and Rehabilitation of Acid Sulfate Soils at East Trinity: Technical Report. Indooroopilly, Queensland, Australia, Department of Natural Resources and Mines.
Smith, C. D., Graham, T. L., Barry, E. V., Adams, J. J. & Ahern, C. R. (2003b) Acid Sulfate Soil and Stratigraphic Assessment. IN SMITH, C. D., MARTENS, M. A., AHERN, C. R., ELDERSHAW, V. J., POWELL, B., BARRY, E. V. & HOPGOOD, G. L. (Eds.) Demonstration of Management and Rehabilitation of Acid Sulfate Soils at East Trinity: Technical Report. Indooroopilly, Queensland, Australia, Department of Natural Resources and Mines.
Smith, C. D., Martens, M. A., Ahern, C. R. & Eldershaw, V. J. (2003c) Overview of the East Trinity Project Findings. IN SMITH, C. D., MARTENS, M. A., AHERN, C. R., ELDERSHAW, V. J., POWELL, B., BARRY, E. V. & HOPGOOD, G. L. (Eds.) Demonstration of Management and Rehabilitation of Acid Sulfate Soils at East Trinity: Technical Report. Indooroopilly, Queensland, Australia., Queensland Government Department of Natural Resources and Mines, .
Smith, C. D., Martens, M. A., Ahern, C. R., Eldershaw, V. J., Powell, B., Barry, E. V. & Hopgood, G. L. (2003d) Demonstration of Management and Rehabilitation of Acid Sulfate Soils at East Trinity: Technical Report. Indooroopilly, Queensland, Australia., Department of Natural Resources and Mines, Indooroopilly, Queensland, Australia.
Smith, J. (2004) Chemical changes during oxidation of iron monosulfide-rich sediments. Australian Journal of Soil Research, 42, 659-666.
Smith, J. & Melville, M. D. (2004) Iron monosulfides formation and oxidation in drain-bottom sediments of an acid sulfate soil environment. Applied Geochemistry, 19, 1837-1853.
Smith, J. V. S., Jankowskia, J. & Sammut, J. (2003e) Vertical distribution of As(III) and As(V) in a coastal sandy aquifer: factors controlling the concentration and speciation of arsenic in the Stuarts Point groundwater system, northern New South Wales, Australia. Applied Geochemistry, 18, 1479-1496.
Smith, K. (1999) Metal sorption on mineral surfaces: an overview with examples relating to mineral deposits. IN PLUMLEE, G. S. & LOGSDON, M. J. (Eds.) The environmental geochemistry of mineral deposits. Part A: Processes, techniques, and health issues. Reviews in economic geology, 6A, 161-182.
Smith, K. S. & Huyck, H. L. O. (1999) An overview of the abundance, relative mobility, bioavailability, and human toxicity of metals. IN PLUMLEE, G. S. & LOGSDON, M. J. (Eds.) The environmental geochemistry of mineral deposits. Part A: Processes, techniques, and health issues. Reviews in economic geology, 6A, 29-64.
286
Soil Survey Staff (1999) Soil Taxonomy, A Basic System of Soil Classification for Making and Interpreting Soil Surveys (Second Edition). Agriculture Handbook (No. 436). United States Department of Agriculture, Natural Resources Conservation Service. Downloaded from: http://soils.usda.gov/technical/classification/taxonomy/ on 16 July 2004.
Standards Australia (1997) AS 4482.1-1997 Guide to the sampling and investigation of potentially contaminated soil Part 1: Non-volatile and semi-volatile compounds, Standards Australia (Standards Association of Australia), Homebush, NSW 2140.
Stanton, P. (2003) Appendix 1 Vegetation of the East Trinity Property. IN SMITH, C., MARTENS, M., AHERN, C., ELDERSHAW, V., POWELL, B., BARRY, E. & HOPGOOD, G. (Eds.) Demonstration of Management and Rehabilitation of Acid Sulfate Soils at East Trinity: Technical Report. Indooroopilly, Queensland, Australia., Department of Natural Resources and Mines.
Sterk, G. (1993) Leaching of acid from the topsoil of raised beds on acid sulphate soils in the Mekong delta, Vietnam. IN DENT, D. L. & VAN MENSVOORT, M. E. F. (Eds.) Selected Papers of the Ho Chi Minh city Symposium on Acid Sulphate Soils (ILRI Publication 53). Ho Chi Minh City Symposium on Acid Sulphate Soils, held March 1992, International Institute for Land Reclamation and Improvement (ILRI), Wageningen, The Netherlands.
Steyrer, H. P. & Sturm, R. (2002) Stability of zircon in a low-grade ultramylonite and its utility for chemical mass balancing: the shear zone at Mie´ville, Switzerland. Chemical Geology, 187, 1-19.
Stoltz, E. & Greger, M. (2002) Accumulation properties of As, Cd, Cu, Pb and Zn by four wetland plant species growing on submerged mine tailings. Environmental and Experimental Botany, 47, 271-280.
Stumm, W. & Morgan, J. J. (1996) Aquatic Chemistry: Chemical Equilibria and Rates in Natural Waters, Wiley-Interscience.
Sullivan, L. A. & Bush, R. T. (2002) Chemical behaviour of monosulfidic black oozes (MBOs) in water: pH and dissolved oxygen. 5th International Acid Sulfate Soils Conference - Sustainable Management of Acid Sulfate Soils. Gold Coast.
Sundström, R., Åström, M. & Österholm, P. (2002) Comparison of the metal content in acid sulfate soil runoff and industrial effluents in Finland. Environmental Science and Technology, 36, 4269-4272.
Sutherland, R. A. & Tack, F. M. G. (2003) Fractionation of Cu, Pb and Zn in certified reference soils SRM 2710 and SRM 2711 using the optimized BCR sequential extraction procedure. Advances in Environmental Research, 8, 37-50.
Syrovetnik, K., Puura, E. & Neretnieks, I. (2004) Accumulation of heavy metals in Oostriku peat bog, Estonia: site description, conceptual modelling and geochemical modelling of the source of the metals. Environmental Geology, 45, 731-740.
Tanaka, A. & Navasero, S. A. (1967) Carbon dioxide and organic acids in relation to the growth of rice. Soil Science and Plant Nutrition (Tokyo), 13, 25-30.
Tandy, S., Bossart, K., Meuller, R., Ritschel, J., Hauser, L., Schulin, R. & Nowack, B. (2004) Extraction of heavy metals from soils using biodegradable chelating agents. Environmental Science and Technology, 38, 937-944.
Tandy, S., Schulin, R. & Nowack, B. (2006a) The influence of EDDS on the uptake of heavy metals in hydroponically grown sunflowers. Chemosphere, 62, 1454-1463.
Tandy, S., Schulin, R. & Nowack, B. (2006b) Uptake of metals during chelant-assisted phytoextraction with EDDS related to the solubilized metal concentration. Environmental Science and Technology, 40, 2753-2758.
Tessier, A., Campbell, P. G. C. & Bisson, M. (1979) Sequential extraction procedure for the speciation of particulate trace metals. Analytical Chemistry, 51, 844-851.
Thom, B. G. & Chappell, J. (1975) Holocene sea levels relative to Australia. Search, 6, 90-93. Thom, B. G. & Roy, P. S. (1985) Relative sea levels and coastal sedimentation in southeast Australia
in the Holocene. Journal of Sedimentary Petrology, 55, 257-264. Thomson, E. A., Louma, S. N., Cain, D. J. & Johanson, C. (1980) The effect of sample storage on
the extraction of Cu, Zn, Fe, Mn and organic material from oxidized estuarine sediments. Water, Air, and Soil Pollution, 14, 215-233.

287
Tin, N. T. & Wilander, A. (1995) Chemical conditions in acidic waters in the plain of reeds, Viet Nam. Water Research, 20, 1401-1408.
Van Breemen, N. (1973) Soil forming processes in acid sulphate soils. IN DOST, H. (Ed.) Proceedings of the international conference on Acid Sulphate Soils; 1972. Wageningen, The Netherlands, International Institute for Land Reclamation and Improvement: Wageningen, The Netherlands; ILRI No.18/1.
Van Breemen, N. (1976) Genesis and solution chemistry of acid sulphate soils in Thailand., Wageningen, Pudoc.
Van Breemen, N. (1988) Redox processes of iron and sulfur involved in the formation of acid sulfate soils. IN STUCKI, J. W., GOODMAN, B. A. & SCHWERTMANN, U. (Eds.) Iron in Soils and Clay Minerals.
Van Breemen, N. (1993) Environmental aspects of acid sulphate soils. IN DENT, D. L. & VAN MENSVOORT, M. E. F. (Eds.) Ho Chi Minh City Symposium on Acid Sulphate Soils. Ho Chi Minh City, Vietnam, International Institute for Land Reclamation and Improvement (ILRI).
Van Der Moezel, P. G., Pearce-Pinto, G. V. N. & Bell, D. T. (1991) Screening for salt and waterlogging tolerance in Eucalyptus and Melaleuca species. Forest Ecology and Management, 40, 27-37.
Vandecasteele, B., De Vos, B. & Tack, F. M. G. (2002) Cadmium and Zinc uptake by volunteer willow species and elder rooting in polluted dredge sediment disposal sites. Science of the Total Environment, 299, 191-205.
Vandecasteele, B., Quataert, P. & Tack, F. M. G. (2005) The effect of hydrological regime on the metal bioavailability for the wetland plant species Salix cinerea. Environmental Pollution, 135.
Vandecasteele, B., Quataert, P. & Tack, F. M. G. (2007) Uptake of Cd, Zn and Mn by willow increases during terrestrialisation of initially ponded polluted sediments. Science of the Total Environment, 380, 133-143.
Vandevivere, P., Hammes, F., Verstraete, W., Feijtel, T. & Schowanek, D. (2001) Metal decontamination of soil, sediment, and sewage sludge by means of transition metal chelant [S,S]-EDDS. Journal of Environmental Engineering, 802-811.
Virgona, J. L. (1992) Environmental factors influencing the prevalence of a cutaneous ulcerative disease (red spot) in the sea mullet, Mugil cephalus L., in the Clarence River, New South Wales, Australia. Journal of Fish Diseases, 15, 363-378.
Ward, N. J., Sullivan, L. A., Fyfe, D. M., Bush, R. T. & Ferguson, A. J. P. (2004) The process of sulfide oxidation in some acid sulfate soil materials. Australian Journal of Soil Research, 42, 449-458.
Watkinson, A. J., Dennison, W. C., O’neil, J. M. & Hewson, I. (2000) Blooms of the Marine Cyanobacterium Lyngbya majuscula in Deception Bay: Potential Implications of Hydric Soil Disturbance. IN AHERN, C. R., HEY, K. M., WATLING, K. M. & ELDERSHAW, V. J. (Eds.) Acid Sulfate Soils: Environmental Issues, Assessment and Management, Technical Papers. Brisbane, 20–22 June, 2000., Department of Natural Resources, Indooroopilly, Queensland, Australia.
Wendelaar Bonga, S. E. & Van Dederen, L. W. (1986) Effects of acidified water on fish. Endeavour (New Series), 10, 198-202.
Whitbread, M. A. & Moore, C. L. (2004) Two lithogeochemical approaches to the identification of alteration patterns at the Elura Zn-Pb-Ag deposit, Cobar, New South Wales, Australia: use of Pearce Element Ratio analysis and Isocon analysis. Geochemistry: Exploration, Environment, Analysis, 4, 129-141.
White, I., Melville, M. D., Wilson, B. P. & Sammut, J. (1997) Reducing acidic discharges from coastal wetlands in eastern Australia. Wetlands Ecology and Management, 5, 55-72.
White, I., Wilson, P. B., Melville, M. D., Sammut, J. & Lin, C. (1996) Hydrology and drainage of acid sulfate soils. IN SMITH, R. J. & SMITH, H. J. (Eds.) Proceedings of the 2nd National Conference on Acid Sulfate Soils. 2nd National Conference of Acid Sulfate Soils. Coffs Harbour, held 5 - 6 September 1996, Robert J Smith and Associates and Acid Sulfate Soils Management Advisory Committee (ASSMAC).
Wieder, R. K., Yavitt, J. B. & Lang, G. E. (1990) Methane production and sulfate reduction in two Appalachian peatlands. Biogeochemistry, 10, 81-104.

288
Willett, I. R., Crockford, R. H. & Milnes, A. R. (1992) Transformation of iron, manganese and aluminium during oxidation of a sulphidic material from an acid sulphate soil. IN SKINNER, H. C. W. & FITZPATRICK, R. W. (Eds.) Biomineralization Processes of Iron and Manganese-Modern and Ancient Environments. Cremlingen-Destedt, Germany, Catena Verlag.
Williams, T. P., Bubb, J. M. & Lester, J. N. (1994) Metal accumulation within salt marsh environments: a review. Marine Pollution Bulletin, 28, 277-290.
Willmott, W. F. & Stephenson, P. J. (1989) Rocks and landscapes of the Cairns district. Queensland Department of Mines, Brisbane, Brisbane, Queensland Department of Mines.
Wilson, B. P., White, I. & Melville, M. D. (1999) Floodplain hydrology, acid discharge and change in water quality associated with a drained acid sulfate soil. Marine and Freshwater Research, 50, 149-157.
Yaman, M. & Akdeniz, I. (2006) Fractionation of aluminium in soil and relation to its concentration in fruits. Environmental Monitoring and Assessment, 115, 279-289.
Yigit, O. & Hofstra, A. H. (2003) Lithogeochemistry of Carlin-type gold mineralization in the Gold Bar district, Battle Mountain-Eureka Trend, Nevada. Ore Geology Reviews, 22, 201-224.

289
APPENDIX A. PROJECT SAMPLE CATALOGUE
Table A.1. Acid Sulfate Soil sample locations (AGD84 zone 55) and notes.
Location Significant Inundation
Easting Northing Notes
Dry ASS Profile (DP)
No 372510 8126650 Surface dry, core mostly dry/slightly moist.
Live Melaleuca leucadendra.
Wet ASS Profile (WP)
Yes 372450 8126600 Surface approximately 0.4 m lower than DP.
Surrounded by dead Melaleuca leucadendra. Surface wet, core saturated.
Table A.2. Acid Sulfate Soil samples and notes.
Sample ID Profile Core Collected Depth m bgl Notes/Analyses DP0-1 Dry 0 November 2004 0.0 - 0.3 XRD DP0-2 Dry 0 November 2004 0.3 - 0.5 XRD DP0-3 Dry 0 November 2004 0.5 - 0.7 XRD DP0-4 Dry 0 November 2004 0.7 - 0.9 XRD DP0-5 Dry 0 November 2004 0.9 - 1.1 XRD
DP1-01 Dry 1 June 2005 0.0 - 0.1 XRF, Isocon Analysis DP1-02 Dry 1 June 2005 0.1 - 0.2 XRF, Isocon Analysis DP1-03 Dry 1 June 2005 0.2 - 0.3 XRF, Isocon Analysis DP1-04 Dry 1 June 2005 0.3 - 0.4 XRF, Isocon Analysis DP1-05 Dry 1 June 2005 0.4 - 0.5 XRF, Isocon Analysis DP1-06 Dry 1 June 2005 0.5 - 0.6 XRF, Isocon Analysis DP1-07 Dry 1 June 2005 0.6 - 0.7 XRF, Isocon Analysis DP1-08 Dry 1 June 2005 0.8 - 0.9 XRF, Isocon Analysis DP1-09 Dry 1 June 2005 1.0 - 1.1 XRF, Isocon Analysis DP1-10 Dry 1 June 2005 1.2 - 1.3 XRF
DP2-01 Dry 2 June 2005 0.0 - 0.1 GSC-SEP, MBCR-SEP, DTPA, EDTA, EDDS
grain-size analysis, soil pH, oxidised soil pH
DP2-02 Dry 2 June 2005 0.1 - 0.2 GSC-SEP, MBCR-SEP, DTPA, EDTA, EDDS,
soil pH, oxidised soil pH
DP2-03 Dry 2 June 2005 0.2 - 0.3 GSC-SEP, MBCR-SEP, DTPA, EDTA, EDDS
grain-size analysis, soil pH, oxidised soil pH
DP2-04 Dry 2 June 2005 0.3 - 0.4 GSC-SEP, MBCR-SEP, DTPA, EDTA, EDDS
grain-size analysis, soil pH, oxidised soil pH
DP2-05 Dry 2 June 2005 0.4 - 0.5 GSC-SEP, MBCR-SEP, DTPA, EDTA, EDDS
grain-size analysis, soil pH, oxidised soil pH
DP2-06 Dry 2 June 2005 0.5 - 0.6 GSC-SEP, MBCR-SEP, DTPA, EDTA, EDDS
grain-size analysis, soil pH, oxidised soil pH
DP2-07 Dry 2 June 2005 0.6 - 0.7 GSC-SEP, MBCR-SEP, DTPA, EDTA, EDDS
grain-size analysis, soil pH, oxidised soil pH
DP2-08 Dry 2 June 2005 0.7 - 0.8 GSC-SEP, MBCR-SEP, grain-size analysis, soil
pH, oxidised soil pH
DP2-09 Dry 2 June 2005 0.8 - 0.9 GSC-SEP, MBCR-SEP, grain-size analysis, soil
pH, oxidised soil pH
DP2-10 Dry 2 June 2005 0.9 - 1.0 GSC-SEP, MBCR-SEP, grain-size analysis, soil
pH, oxidised soil pH
DP2-11 Dry 2 June 2005 1.0 - 1.1 Grain-size analysis, soil pH, oxidised soil pH
DP2-12 Dry 2 June 2005 1.1 - 1.2 Grain-size analysis, soil pH, oxidised soil pH
- Table Continued Next Page -

290
Table A.2. (Continued) Acid Sulfate Soil samples and notes.
Sample ID Profile Core Collected Depth m bgl Notes/Analyses
DP2-13 Dry 2 June 2005 1.2 - 1.3 Grain-size analysis, soil pH, oxidised soil pH
DP2-14 Dry 2 June 2005 1.3 - 1.4 Grain-size analysis, soil pH, oxidised soil pH
WP1-01 Wet 1 June 2005 0.0 - 0.15 XRD, XRF, Isocon Analysis WP1-02 Wet 1 June 2005 0.15 - 0.3 XRD, XRF, Isocon Analysis WP1-03 Wet 1 June 2005 0.3 - 0.4 XRD, XRF, Isocon Analysis WP1-04 Wet 1 June 2005 0.4 - 0.5 XRF, Isocon Analysis WP1-05 Wet 1 June 2005 0.5 - 0.6 XRD, XRF, Isocon Analysis WP1-06 Wet 1 June 2005 0.6 - 0.7 XRF, Isocon Analysis WP1-07 Wet 1 June 2005 0.7 - 0.8 XRD, XRF, Isocon Analysis WP1-08 Wet 1 June 2005 0.8 - 0.9 XRD, XRF, Isocon Analysis WP1-09 Wet 1 June 2005 0.9 - 1.0 XRD, XRF, Isocon Analysis WP1-10 Wet 1 June 2005 1.0 - 1.1 XRF WP1-11 Wet 1 June 2005 1.1 - 1.2 XRD, XRF
WP2-01 Wet 2 June 2005 0 - 0.1 GSC-SEP, MBCR-SEP, DTPA, EDTA, EDDS
grain-size analysis, soil pH, oxidised soil pH
WP2-02 Wet 2 June 2005 0.1 - 0.2 GSC-SEP, MBCR-SEP, DTPA, EDTA, EDDS
WP2-03 Wet 2 June 2005 0.2 - 0.3 GSC-SEP, MBCR-SEP, DTPA, EDTA, EDDS
grain-size analysis, soil pH, oxidised soil pH
WP2-04 Wet 2 June 2005 0.3 - 0.4 GSC-SEP, MBCR-SEP, DTPA, EDTA, EDDS
grain-size analysis, soil pH, oxidised soil pH
WP2-05 Wet 2 June 2005 0.4 - 0.5 GSC-SEP, MBCR-SEP, DTPA, EDTA, EDDS
grain-size analysis, soil pH, oxidised soil pH
WP2-06 Wet 2 June 2005 0.5 - 0.6 GSC-SEP, MBCR-SEP, DTPA, EDTA, EDDS
grain-size analysis, soil pH, oxidised soil pH
WP2-07 Wet 2 June 2005 0.6 - 0.7 GSC-SEP, MBCR-SEP, DTPA, EDTA, EDDS
grain-size analysis, soil pH, oxidised soil pH
WP2-08 Wet 2 June 2005 0.7 - 0.8 GSC-SEP, MBCR-SEP, grain-size analysis, soil
pH, oxidised soil pH
WP2-09 Wet 2 June 2005 0.8 - 0.9 GSC-SEP, MBCR-SEP, grain-size analysis, soil
pH, oxidised soil pH
WP2-10 Wet 2 June 2005 0.9 - 1.0 GSC-SEP, MBCR-SEP, grain-size analysis, soil
pH, oxidised soil pH
WP2-11 Wet 2 June 2005 1.0 - 1.1 Grain-size analysis, soil pH, oxidised soil pH
WP2-12 Wet 2 June 2005 1.1 - 1.2 Grain-size analysis, soil pH, oxidised soil pH
WP2-13 Wet 2 June 2005 1.2 - 1.3 Grain-size analysis, soil pH, oxidised soil pH
WP2-14 Wet 2 June 2005 1.3 - 1.4 Grain-size analysis, soil pH, oxidised soil pH

291
Table A.3. Firewood Creek drain sediment sample locations (AGD84 zone 55) and notes.
Twelve Orange Flocculant (OF) and five Black Ooze (BO) samples were collected.
Sample ID Type Easting Northing Notes
FDS01 OF 0372480 8126500 Upstream from DP ASS location (OF)
XRD, XRF
FDS02 OF 0372480 8126500 Upstream from DP ASS location (OF)
XRD, XRF
FDS03 OF 0372480 8126450 At DP ASS location (OF)
XRF
FDS04 OF 0372480 8126450 At DP ASS location (OF)
XRF
FDS05 OF 0372480 8126400 Downstream from DP ASS location (OF)
XRD, XRF
FDS06 OF 0372480 8126400 Downstream from DP ASS location (OF)
XRD, XRF
FDS07A OF 0372454 8126462 At DP ASS location flood plate (OF)
XRF
FDS07B BO 0372454 8126462 At DP ASS location flood plate (BO)
XRF
FDS08A OF 0372302 8126377 Drain confluence (OF)
XRF, MBCR-SEP
FDS08B BO 0372302 8126377 Drain confluence (BO)
XRF, MBCR-SEP
FDS9A OF 0372372 8126324 Eastern drain (OF)
XRF
FDS9B BO 0372372 8126324 Eastern drain (BO)
XRF
FDS10A OF 0372329 8126388 At WP ASS location (OF)
XRF, MBCR-SEP
FDS10B BO 0372329 8126388 At WP ASS location (BO)
XRF, MBCR-SEP
FDS11A OF 0371432 8126033 Inside bundwall (OF)
XRF, MBCR-SEP
FDS11B BO 0371432 8126033 Inside bundwall (BO)
XRF, MBCR-SEP
FDS12 OF 0372404 8126482 Opposite DP ASS location (OF)
XRF

292
Table A.4. Collection locations (AGD84 zone 55) and notes for mouth sediments from
Firewood and Falls Creeks.
Grid Reference Sample ID Creek Easting Northing Notes
FCT01 Firewood 0371064 8126180 Marine Mud, wet, organic matter. FCT02 Firewood 0370954 8126081 Marine Mud, moist, clayey. FTC03 Firewood 0370930 8126066 Marine Mud, moist, clayey. FCT04 Firewood 0370911 8126114 Marine Mud, gritty - shell fragments. FCT05 Firewood 0370921 8126169 Marine Mud, minor grit. FCT06 Firewood 0370947 8126168 Marine Mud, clayey, no grit. FCT07 Firewood 0370956 8125972 Marine Mud - clay. FCT08 Firewood 0371024 8126199 Marine Mud, wet.
FCT09 Firewood 0371052 8126206 Marine Mud, considerable sand and shell
grit. FCT10 Firewood 0371032 8126126 Marine Mud, wet. FCT11 Firewood 0370924 8125913 Marine Mud FCT12 Firewood 0370924 8125913 Marine Mud, wet, organic matter (leaves). FCT13 Firewood 0370812 8126109 Marine Mud.
B01 Falls 0371490 8123131 See Hall (2002). B02 Falls 0371439 8123044 “ ” B03 Falls 0371566 8123044 “ ” B04 Falls 0371647 8123105 “ ” B05 Falls 0371730 8123053 “ ” B06 Falls 0371772 8123112 “ ” B07 Falls 0371848 8123235 “ ” B08 Falls 0371776 8123350 “ ” B09 Falls 0371844 8123405 “ ” B10 Falls 0371993 8123417 “ ” B11 Falls 0371976 8123305 “ ” B12 Falls 0372174 8123199 “ ” B13 Falls 0372342 8123163 “ ” B14 Falls 0372355 8123209 “ ”

293
Table A.5. Plant and associated soil sample details. Two types of plants were collected: the
grass Paspalum vaginatum; and the mangrove fern Acrostichum speciosum. Each plant
sample was processed to provide a stem (above ground tissue) and root (below
ground tissue) sample. Soil from the roots of each plant sample was also collected.
Hence, each plant sample has a corresponding soil sample.
Location* ID Species East North Date Notes
37+ 812+
MF1 Acrostichum speciosum 2319 5586 Apr 2007 Collected from inside bundwall. Plant soil extracted with EDTA.
MF2 Acrostichum speciosum 2107 5608 Apr 2007 Collected from inside bundwall. Plant soil extracted with EDTA.
MF3 Acrostichum speciosum 1844 5770 Apr 2007 Collected from inside bundwall. Plant soil.
MF4 Acrostichum speciosum 0745 6711 Apr 2007 Collected from outside bundwall. Background sample. Plant soil extracted with EDTA.
MF5 Acrostichum speciosum 1630 6764 Apr 2007 Mangrove Fern, Magazine Creek flocculant pan. Plant soil extracted with EDTA.
MF6 Acrostichum speciosum 2419 6487 Apr 2007 Collected from dry ASS profile location. Plant soil extracted with EDTA.
MF7 Acrostichum speciosum 2394 6406 Apr 2007 Collected from wet ASS profile location. Plant soil extracted with EDTA.
MF8 Acrostichum speciosum 0890 6325 Dec 2007 Collected from outside bundwall. Background sample.
MF9 Acrostichum speciosum 2679 9578 Dec 2007 Collected from outside bundwall. Background sample.
MF10 Acrostichum speciosum 0990 8161 Dec 2007 Collected from outside bundwall. Background sample.
MF11 Acrostichum speciosum 2025 9067 Dec 2007 Collected from outside bundwall. Background sample.
MF12 Acrostichum speciosum 2025 9067 Dec 2007 Collected from outside bundwall. Background sample.
MF13 Acrostichum speciosum 2212 9266 Dec 2007 Collected from outside bundwall. Background sample.
MF14 Acrostichum speciosum 2212 9266 Dec 2007 Collected from outside bundwall. Background sample.
MF15 Acrostichum speciosum 1577 6684 Dec 2007 Collected from IAASS. Soil wet when sampled.
MF16 Acrostichum speciosum 1791 5738 Dec 2007 Collected from IAASS. Soil wet when sampled.
PV1 Paspalum vaginatum 2394 6406 Mar 2007 Collected from wet ASS profile location. Covered by ~3 cm of salt water when sampled. Plant soil extracted with EDTA.
PV2 Paspalum vaginatum 2412 6483 Mar 2007 Collected from dry ASS profile location. Covered by ~20 cm of salt water when sampled. Plant soil extracted with EDTA.
PV3 Paspalum vaginatum 2594 5898 Mar 2007 Collected from the top of Firewood Creek (TFW) Background sample. Plant soil extracted with EDTA.
- Table Continued Next Page -

294
Table A.5. (Continued) Plant and associated soil sample details. Two types of plants were
collected: the grass Paspalum vaginatum; and the mangrove fern Acrostichum speciosum.
Each plant sample was processed to provide a stem (above ground tissue) and root
(below ground tissue) sample. Soil from the roots of each plant sample was also
collected. Hence, each plant sample has a corresponding soil sample.
Location* ID Species East North Date Notes
37+ 812+
PV4 Paspalum vaginatum 2102 5624 Apr 2007 Collected from inside bundwall. Plant soil extracted with EDTA.
PV5 Paspalum vaginatum 1636 26760 Apr 2007 Collected from inside bundwall. Plant soil extracted with EDTA.
PV6 Paspalum vaginatum 2420 6489 Apr 2007 Collected from dry ASS profile location. Covered by ~3 cm of salt water when sampled. Plant soil extracted with EDTA.
PV7 Paspalum vaginatum 2394 6406 Apr 2007 Collected from wet ASS profile location. Covered by ~20 cm of salt water when sampled. Plant soil extracted with EDTA.
PV8 Paspalum vaginatum 0773 7266 Dec 2007 Collected from outside bundwall. Background sample.
PV9 Paspalum vaginatum 0779 7313 Dec 2007 Collected from outside bundwall. Background sample.
PV10 Paspalum vaginatum 0779 7313 Dec 2007 Collected from outside bundwall. Background sample.
PV11 Paspalum vaginatum 0872 7687 Dec 2007 Collected from outside bundwall. Background sample.
PV12 Paspalum vaginatum 0872 7687 Dec 2007 Collected from outside bundwall. Background sample.
PV13 Paspalum vaginatum 0885 7743 Dec 2007 Collected from outside bundwall. Background sample.
PV14 Paspalum vaginatum 0885 7743 Dec 2007 Collected from outside bundwall. Background sample.
PV15 Paspalum vaginatum 2102 5615 Dec 2007 Collected from IAASS. Soil wet when sampled.
PV16 Paspalum vaginatum 1573 6687 Dec 2007 Collected from IAASS. Soil wet when sampled.
* Co-ordinates are for AMG 55K CB.
295
APPENDIX B. QUALITY ASSURANCE OF ANALYTICAL DATA
B.1 Data Quality of ASS and Drain Sediment XRF Element Determination
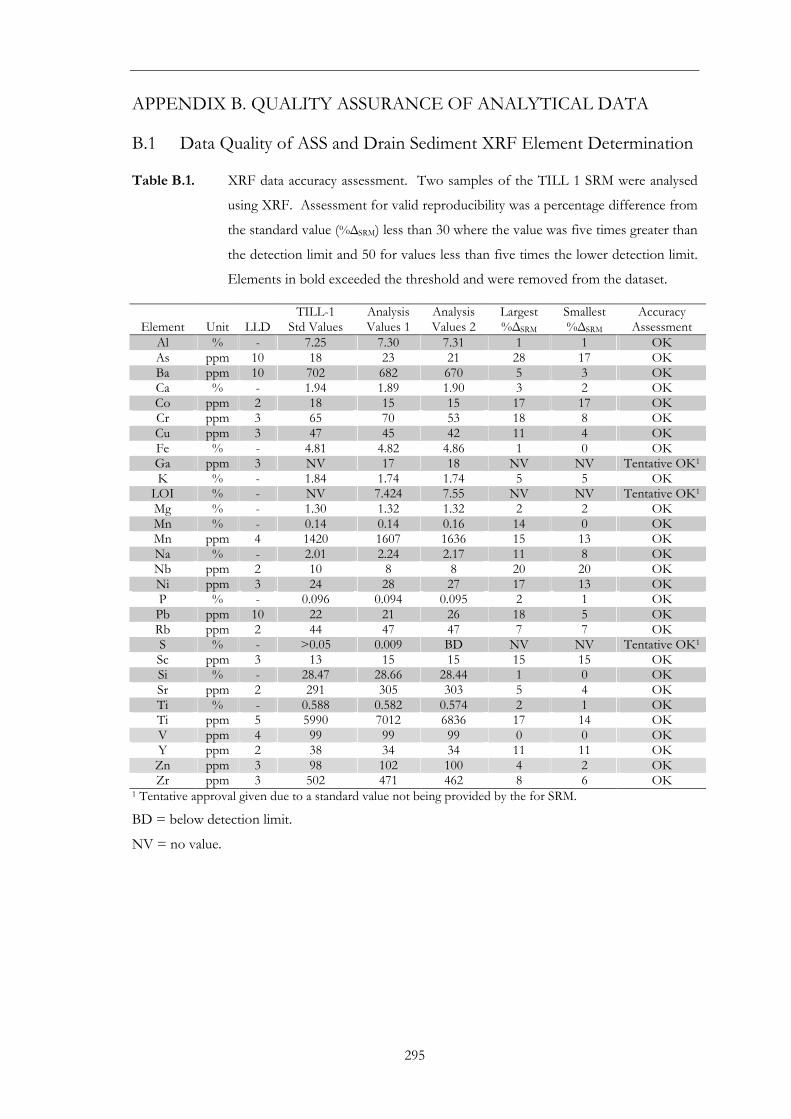
Table B.1. XRF data accuracy assessment. Two samples of the TILL 1 SRM were analysed
using XRF. Assessment for valid reproducibility was a percentage difference from
the standard value (%∆SRM) less than 30 where the value was five times greater than
the detection limit and 50 for values less than five times the lower detection limit.
Elements in bold exceeded the threshold and were removed from the dataset.
TILL-1 Analysis Analysis Largest Smallest Accuracy Element Unit LLD Std Values Values 1 Values 2 %∆SRM %∆SRM Assessment
Al % - 7.25 7.30 7.31 1 1 OK As ppm 10 18 23 21 28 17 OK Ba ppm 10 702 682 670 5 3 OK Ca % - 1.94 1.89 1.90 3 2 OK Co ppm 2 18 15 15 17 17 OK Cr ppm 3 65 70 53 18 8 OK Cu ppm 3 47 45 42 11 4 OK Fe % - 4.81 4.82 4.86 1 0 OK Ga ppm 3 NV 17 18 NV NV Tentative OK1 K % - 1.84 1.74 1.74 5 5 OK
LOI % - NV 7.424 7.55 NV NV Tentative OK1 Mg % - 1.30 1.32 1.32 2 2 OK Mn % - 0.14 0.14 0.16 14 0 OK Mn ppm 4 1420 1607 1636 15 13 OK Na % - 2.01 2.24 2.17 11 8 OK Nb ppm 2 10 8 8 20 20 OK Ni ppm 3 24 28 27 17 13 OK P % - 0.096 0.094 0.095 2 1 OK
Pb ppm 10 22 21 26 18 5 OK Rb ppm 2 44 47 47 7 7 OK S % - >0.05 0.009 BD NV NV Tentative OK1 Sc ppm 3 13 15 15 15 15 OK Si % - 28.47 28.66 28.44 1 0 OK Sr ppm 2 291 305 303 5 4 OK Ti % - 0.588 0.582 0.574 2 1 OK Ti ppm 5 5990 7012 6836 17 14 OK V ppm 4 99 99 99 0 0 OK Y ppm 2 38 34 34 11 11 OK
Zn ppm 3 98 102 100 4 2 OK Zr ppm 3 502 471 462 8 6 OK
1 Tentative approval given due to a standard value not being provided by the for SRM.
BD = below detection limit.
NV = no value.

296
Table B.2. XRF data reproducibility assessment. Three sets of replicate samples were
analysed. Assessment for valid reproducibility was a R%D less than 30 where the
value was five times greater than the detection limit and 50 for values less than five
times the lower detection limit. Elements in bold (i.e. S) exceeded the threshold
and were removed from the dataset. Replicate 1 was ETA82S-1, Replicate 2 was
ETA143-3 and Replicate 3 was ETA143-3.
Replicate 1 Replicate 2 Replicate 3 Element Unit LDL 1st 2nd R%D 1st 2nd R%D 1st 2nd R%D Assessment
Al % - 8.09 8.03 1 8.55 8.58 0 8.59 8.46 2 OK As ppm 10 56 57 2 28 29 4 24 24 0 OK Ba ppm 10 210 188 11 265 269 1 257 255 1 OK Ca % - 0.33 0.33 0 0.26 0.26 0 0.25 0.24 3 OK Co ppm 2 2 2 0 3 2 40 5 7 33 OK Cr ppm 3 94 73 25 106 107 1 83 88 6 OK Cu ppm 3 15 15 0 11 11 0 7 8 13 OK Fe % - 4.13 4.11 0 3.92 3.95 1 3.91 3.83 2 OK Ga ppm 3 20 21 5 22 22 0 19 20 5 OK K % - 2.08 2.07 0 1.91 1.97 3 2.02 1.98 2 OK
LOI % - 21.2 21.1 0 17.7 17.5 1 18.8 18.8 0 OK Mg % - 0.50 0.49 2 0.36 0.35 1 0.31 0.31 0 OK Mn % - BD BD NV BD BD NV 0.015 0.015 0 OK Mn ppm 4 127 107 17 156 151 3 135 136 1 OK Na % - 1.64 1.55 6 0.97 0.93 4 0.96 0.96 1 OK Nb ppm 2 12 11 9 17 18 6 23 24 4 OK Ni ppm 3 15 15 0 17 15 13 21 22 5 OK P % - 0.061 0.060 1 0.025 0.026 3 0.026 0.026 0 OK
Pb ppm 10 28 28 0 24 24 0 21 25 17 OK Rb ppm 2 170 168 1 153 152 1 137 141 3 OK S % - 0.046 0.046 1 0.005 0.014 98 0.008 0.008 0 Tentative OK1
Sc ppm 3 15 11 31 16 16 0 12 11 9 OK Si % - 24.08 24.09 0 25.88 25.97 0 25.57 25.23 1 OK Sr ppm 2 85 85 0 75 76 1 70 73 4 OK Ti % - 0.403 0.405 0 0.515 0.520 1 0.534 0.540 1 OK Ti ppm 5 4819 5290 9 5641 5613 0 5502 5491 0 OK V ppm 4 91 90 1 70 65 7 72 73 1 OK Y ppm 2 27 27 0 24 25 4 22 24 9 OK
Zn ppm 3 50 50 0 49 49 0 42 44 5 OK Zr ppm 3 202 209 3 203 203 0 185 192 4 OK
1 Tentative approval given due acceptable accuracy in two other replicates and very low concentrations in
failed samples.
BD = below detection limit.
NV = no value.

297
B.3 Data Quality of SEP Bulk and Residual Sample Element Determination
Table B.3. Accuracy data for SEP solid samples analysed using the HClO4+HCl+HF+HNO3
digest and ICP-MS analysis (ALS). The SRM used was TILL-1. Assessment for
valid reproducibility was a percentage difference from the standard value (%∆SRM)
less than 30 where the value was five times greater than the detection limit and 50
for values less than five times the lower detection limit. Elements in bold (i.e. Cr
and Zr) exceeded the threshold and were removed from the datasets.
Element Units LDL TILL1 Std
Values Analysis Values %∆SRM
Accuracy Assessment
Al % 0.01 7.25 7.01 3 OK As ppm 0.2 18 21.4 19 OK Ba ppm 10 702 620 12 OK Co ppm 0.1 18 15.3 15 OK
Cr ppm 1 65 107 65 Fail
Cu ppm 0.2 47 40 15 OK Fe % 0.01 4.81 5.82 21 OK Ga ppm NV NV NV Tentative OK1
Mn ppm 5 1420 1230 13 OK Na % 0.01 2.01 1.94 4 OK Nb ppm 0.1 10 8.8 12 OK Ni ppm 0.2 24 25.8 8 OK
Pb ppm 0.5 22 20.3 8 OK Sc ppm 0.1 13 13 0 OK Ti % 0.005 0.60 0.47 22 OK V ppm 1 99 95 4 OK
Zn ppm 2 98 89 9 OK Zr ppm 0.5 502 172.5 66 Fail
1 Approval given due to a standard value not being provided for the SRM.
BD = below detection limit.
NV = no value.
298
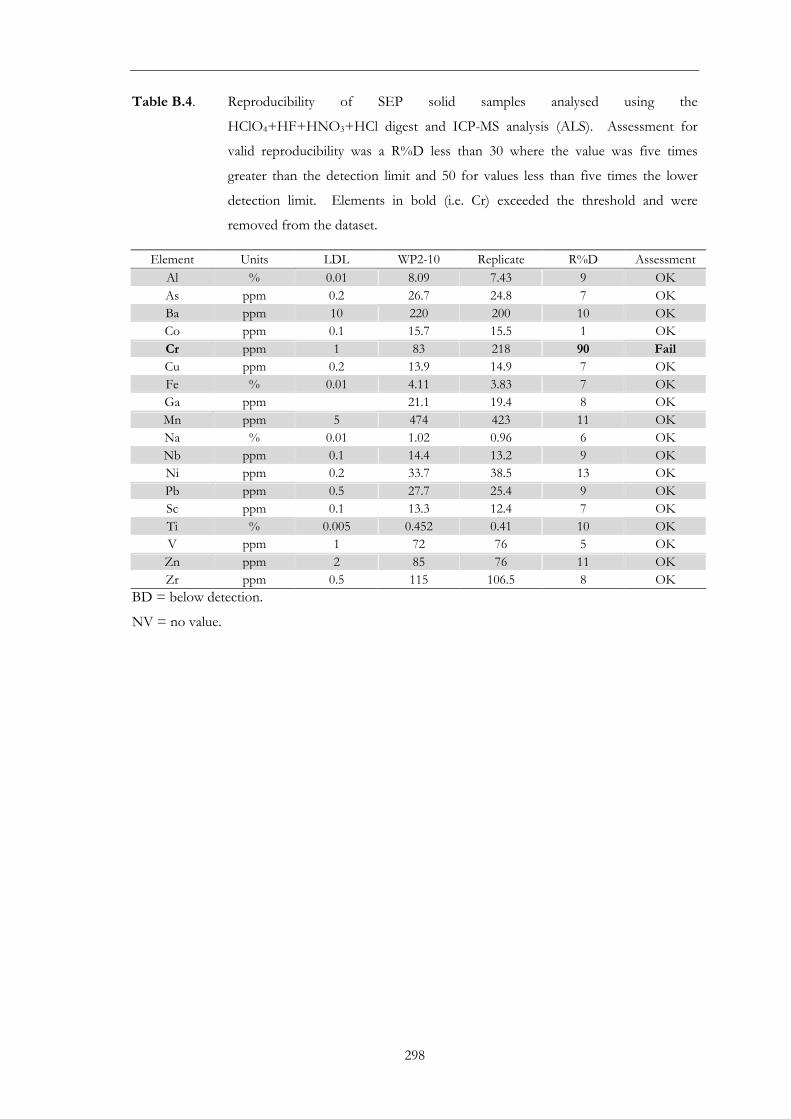
Table B.4. Reproducibility of SEP solid samples analysed using the
HClO4+HF+HNO3+HCl digest and ICP-MS analysis (ALS). Assessment for
valid reproducibility was a R%D less than 30 where the value was five times
greater than the detection limit and 50 for values less than five times the lower
detection limit. Elements in bold (i.e. Cr) exceeded the threshold and were
removed from the dataset.
Element Units LDL WP2-10 Replicate R%D Assessment
Al % 0.01 8.09 7.43 9 OK
As ppm 0.2 26.7 24.8 7 OK Ba ppm 10 220 200 10 OK Co ppm 0.1 15.7 15.5 1 OK
Cr ppm 1 83 218 90 Fail
Cu ppm 0.2 13.9 14.9 7 OK Fe % 0.01 4.11 3.83 7 OK Ga ppm 21.1 19.4 8 OK
Mn ppm 5 474 423 11 OK Na % 0.01 1.02 0.96 6 OK Nb ppm 0.1 14.4 13.2 9 OK Ni ppm 0.2 33.7 38.5 13 OK
Pb ppm 0.5 27.7 25.4 9 OK Sc ppm 0.1 13.3 12.4 7 OK Ti % 0.005 0.452 0.41 10 OK V ppm 1 72 76 5 OK
Zn ppm 2 85 76 11 OK Zr ppm 0.5 115 106.5 8 OK
BD = below detection.
NV = no value.
299
B.4 Data Quality of the SEP, DTPA, EDDS and EDTA Solution Analysis
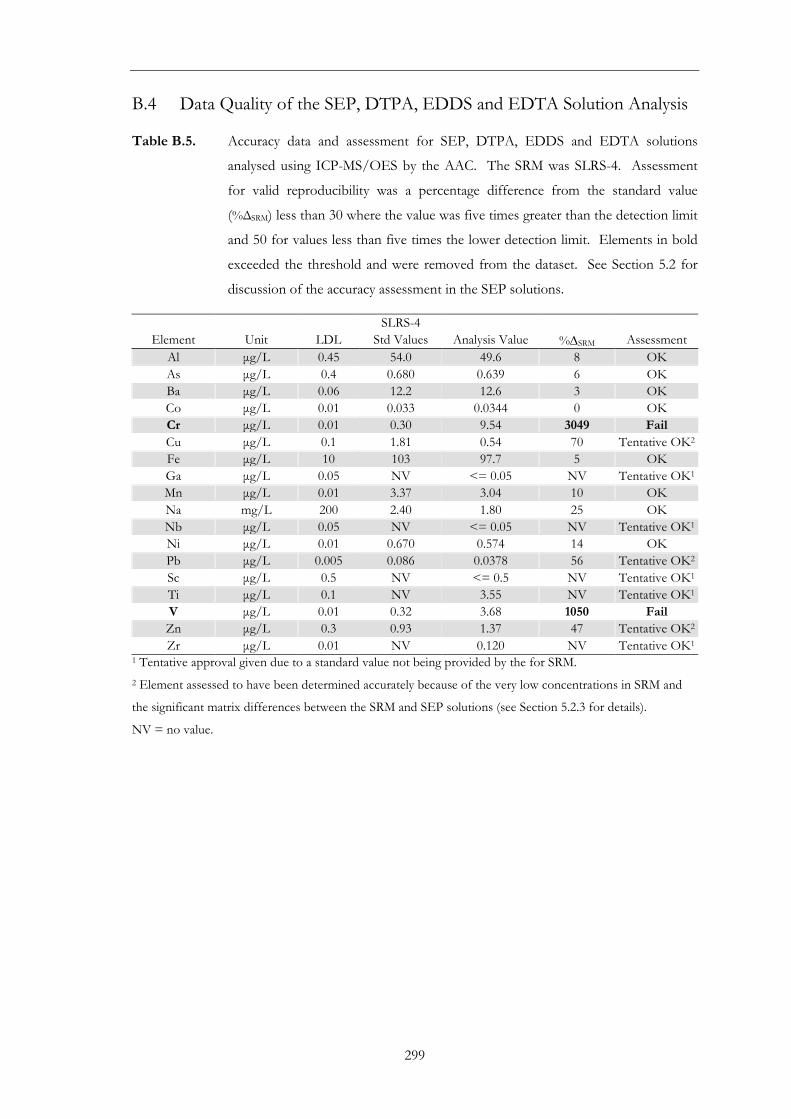
Table B.5. Accuracy data and assessment for SEP, DTPA, EDDS and EDTA solutions
analysed using ICP-MS/OES by the AAC. The SRM was SLRS-4. Assessment
for valid reproducibility was a percentage difference from the standard value
(%∆SRM) less than 30 where the value was five times greater than the detection limit
and 50 for values less than five times the lower detection limit. Elements in bold
exceeded the threshold and were removed from the dataset. See Section 5.2 for
discussion of the accuracy assessment in the SEP solutions.
SLRS-4 Element Unit LDL Std Values Analysis Value %∆SRM Assessment
Al µg/L 0.45 54.0 49.6 8 OK As µg/L 0.4 0.680 0.639 6 OK Ba µg/L 0.06 12.2 12.6 3 OK Co µg/L 0.01 0.033 0.0344 0 OK Cr µg/L 0.01 0.30 9.54 3049 Fail
Cu µg/L 0.1 1.81 0.54 70 Tentative OK2 Fe µg/L 10 103 97.7 5 OK Ga µg/L 0.05 NV <= 0.05 NV Tentative OK1
Mn µg/L 0.01 3.37 3.04 10 OK Na mg/L 200 2.40 1.80 25 OK Nb µg/L 0.05 NV <= 0.05 NV Tentative OK1 Ni µg/L 0.01 0.670 0.574 14 OK Pb µg/L 0.005 0.086 0.0378 56 Tentative OK2 Sc µg/L 0.5 NV <= 0.5 NV Tentative OK1 Ti µg/L 0.1 NV 3.55 NV Tentative OK1 V µg/L 0.01 0.32 3.68 1050 Fail
Zn µg/L 0.3 0.93 1.37 47 Tentative OK2 Zr µg/L 0.01 NV 0.120 NV Tentative OK1
1 Tentative approval given due to a standard value not being provided by the for SRM.
2 Element assessed to have been determined accurately because of the very low concentrations in SRM and
the significant matrix differences between the SRM and SEP solutions (see Section 5.2.3 for details).
NV = no value.
300
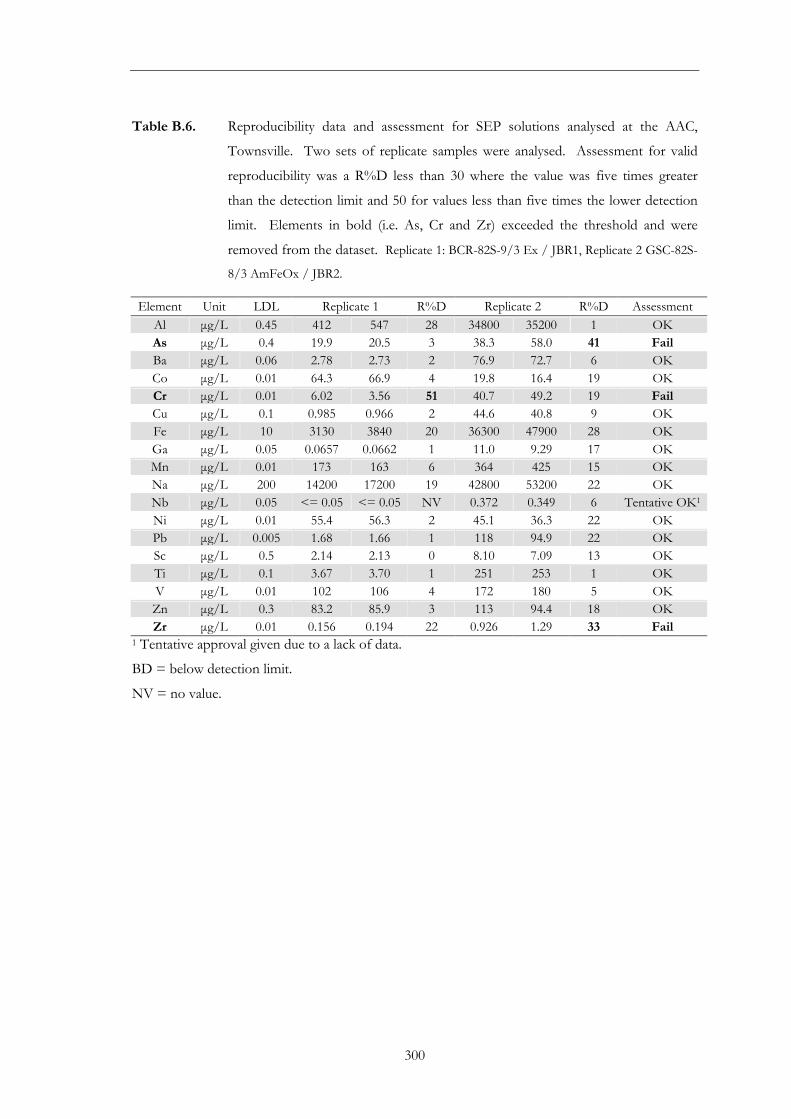
Table B.6. Reproducibility data and assessment for SEP solutions analysed at the AAC,
Townsville. Two sets of replicate samples were analysed. Assessment for valid
reproducibility was a R%D less than 30 where the value was five times greater
than the detection limit and 50 for values less than five times the lower detection
limit. Elements in bold (i.e. As, Cr and Zr) exceeded the threshold and were
removed from the dataset. Replicate 1: BCR-82S-9/3 Ex / JBR1, Replicate 2 GSC-82S-
8/3 AmFeOx / JBR2.
Element Unit LDL Replicate 1 R%D Replicate 2 R%D Assessment
Al µg/L 0.45 412 547 28 34800 35200 1 OK As µg/L 0.4 19.9 20.5 3 38.3 58.0 41 Fail
Ba µg/L 0.06 2.78 2.73 2 76.9 72.7 6 OK
Co µg/L 0.01 64.3 66.9 4 19.8 16.4 19 OK Cr µg/L 0.01 6.02 3.56 51 40.7 49.2 19 Fail
Cu µg/L 0.1 0.985 0.966 2 44.6 40.8 9 OK Fe µg/L 10 3130 3840 20 36300 47900 28 OK
Ga µg/L 0.05 0.0657 0.0662 1 11.0 9.29 17 OK Mn µg/L 0.01 173 163 6 364 425 15 OK Na µg/L 200 14200 17200 19 42800 53200 22 OK Nb µg/L 0.05 <= 0.05 <= 0.05 NV 0.372 0.349 6 Tentative OK1
Ni µg/L 0.01 55.4 56.3 2 45.1 36.3 22 OK Pb µg/L 0.005 1.68 1.66 1 118 94.9 22 OK Sc µg/L 0.5 2.14 2.13 0 8.10 7.09 13 OK Ti µg/L 0.1 3.67 3.70 1 251 253 1 OK
V µg/L 0.01 102 106 4 172 180 5 OK Zn µg/L 0.3 83.2 85.9 3 113 94.4 18 OK Zr µg/L 0.01 0.156 0.194 22 0.926 1.29 33 Fail
1 Tentative approval given due to a lack of data.
BD = below detection limit.
NV = no value.

301
B.2 Data Quality of Mouth Sediment Element Determination
The analytical quality data for the HClO4+HF+HNO3+HCl digest with ICP-MS analysis
conducted by ALS and presented in Tables B.7 and B.8 applies to the mouth sediment elemental
composition data (Chapter 6).
Table B.7. Accuracy data for the mouth sediment element determination using
HClO4+HF+HNO3+HCl digest and ICP-MS analysis conducted be ALS. The
SRM used was GXR-3. Assessment for valid reproducibility was a percentage
difference from the standard value (%∆SRM) less than 30 where the value was five
times greater than the detection limit and 50 for values less than five times the
lower detection limit. Elements in bold (i.e. Al, Cu and Sc) exceeded the threshold
and were removed from the dataset.
Element Unit LDL Certified Value
Mean1 Analysis Values %∆SRM
Accuracy Assessment
Al % 0.01 6.40 4.25 34 Fail
As ppm 0.2 3970 4610 16 OK
Ba ppm 10 5000 5200 4 OK
Ca % 0.01 13.59 13 4 OK
Co ppm 0.1 45 37.3 16 OK
Cu ppm 0.2 15 9.1 39 Fail
Fe % 0.01 19.31 18.2 6 OK
K % 0.01 0.73 0.81 11 OK
Li ppm 0.2 114 85.3 25 OK
Mg % 0.01 0.81 0.82 1 OK
Mn ppm 5 22300 >10000 NV Tentative OK2
Na % 0.01 0.84 0.82 2 OK
Nb ppm 0.1 NV NV NV Tentative OK2
Ni ppm 0.2 60 44.7 26 OK
P % 10 0.11 0.114 4 OK
Pb ppm 0.5 15 13.7 9 OK
S ppm 2320 2800 21 OK
Sc ppm 0.1 16.80 41.5 147 Fail
Ti % 0.005 0.10 0.091 11 OK
V ppm 1 42 38 10 OK
Y ppm 0.1 15 12 20 OK
Zn ppm 2 207 213 3 OK
Zr ppm 0.5 63 57.4 9 OK 1 Mean of the “certified” values reported by Potts et al. (1992) and Govindaraju (1989) for the GXR-3 SRM.
2 Tentative approval given due to a certified value not being provided for SRM.

302
Table B.8. Reproducibility data for HClO4+HF+HNO3+HCl digest and ICP-MS analysis
conducted by ALS. Two replicate samples were analysed. Assessment for valid
reproducibility was a R%D less than 30 where the value was five times greater
than the detection limit and 50 for values less than five times the lower detection
limit. Elements in bold exceeded the threshold and were removed from the
dataset.
FCT7 HCT12 Element Unit R1 R2 R3 R%D R1 R2 R%D Assessment
Al % 8.08 7.74 7.98 4 8.26 8.33 1 OK As ppm 32.8 33.2 32.3 3 25.1 25.8 3 OK Ba ppm 230 220 230 4 250 260 4 OK Ca % 1.22 1.2 0.9 29 2.85 2.92 2 OK Co ppm 13.8 14.1 15 8 13.7 13.6 1 OK Cr ppm 73 69 72 6 74 75 1 OK Cu ppm 24.8 24.8 25.1 1 20.7 20.1 3 OK Fe % 4.98 4.88 4.97 2 4.3 4.4 2 OK Ga ppm 16.95 16.1 16.65 5 19.3 18.95 2 OK K % 1.67 1.61 1.67 4 1.67 1.7 2 OK Li ppm 59.4 59.5 65.3 10 58.9 58 2 OK Mg % 0.83 0.81 0.85 5 1.06 1.07 1 OK Mn ppm 388 383 378 3 655 704 7 OK Na % 1.46 1.39 1.62 15 1.34 1.37 2 OK Nb ppm 15.3 14.4 15.1 6 17.2 17 1 OK Ni ppm 30.9 31 32.7 6 33.4 32.8 2 OK P ppm 710 660 640 10 590 590 0 OK
Pb ppm 29.1 27.1 28.4 7 29 26.4 9 OK Rb ppm 122.5 116.5 118.5 5 108.5 94.3 14 OK S % 1.44 1.38 1.42 4 0.51 0.52 2 OK Ti % 0.448 0.437 0.455 4 0.507 0.512 1 OK V ppm 78 75 80 6 83 85 2 OK Y ppm 30 28.4 30.5 7 23.8 22.5 6 OK
Zn ppm 95 93 95 2 89 89 0 OK Zr ppm 100 95 101.5 7 111.5 110.5 1 OK
BD = below detection limit.
NV = no value.

303
B.6 Data Quality of the Plant Analyses
Table B.9 provides reproducibility data for the digest and analysis of the plant samples. The
elemental concentration of the plant samples is reported in Chapter 7. There is no accuracy data
for the plant samples because a suitable SRM was not available.
Table B.9. Reproducibility data for the plant digest (HNO3+H2O2) and analysis (ICP-MS)
conducted by the AAC on plant samples MF1 - MF7 and PV1 - PV7. Assessment
for valid reproducibility was a R%D less than 30 where the value was five times
greater than the detection limit and 50 for values less than five times the lower
detection limit. Elements in bold (i.e. Ni) exceeded the threshold and were
removed from the related dataset.
Stem Replicate Root Replicate Element Units 8766-007 8766-015 R%D Assessment 8766-014 8766-016 R%D Assessment
Al ppm 1140 1220 7 OK 426 502 16 OK As ppm 1.48 1.60 8 OK 9.51 11.1 15 OK Co ppm 0.632 0.691 9 OK 0.773 0.835 8 OK Cr ppm 0.980 0.969 1 OK 1.86 2.21 17 OK Cu ppm 1.81 1.74 4 OK 1.74 1.89 8 OK Ni ppm 1.28 0.789 47 Fail 1.34 1.21 10 OK Pb ppm 0.353 0.371 5 OK 0.631 0.674 7 OK Zn ppm 16.5 15.1 9 OK 11.2 11.7 4 OK
BD = below detection; NV = no value.
Table B.10. Reproducibility data for the plant digest (HNO3+H2O2) and analysis (ICP-MS)
conducted by the AAC on plant samples MF8 - MF16 and PV8 - PV16.
Assessment for valid reproducibility was a R%D less than 30 where the value was
five times greater than the detection limit and 50 for values less than five times the
lower detection limit. Elements in bold exceeded the threshold and were removed
from the related dataset.
Element Units Method 9047-037 9047-038 R%D Assessment Al ppm ICP-AES 1260 1330 -5 OK As ppm ICP-MS 5.81 6.48 -11 OK Co ppm ICP-MS 3.72 4.09 -9 OK Cr ppm ICP-MS 19.5 21.8 -11 OK Cu ppm ICP-MS 43.7 48.5 -10 OK Ni ppm ICP-MS 35.9 39.1 -9 OK Pb ppm ICP-MS 56.1 61.4 -9 OK Zn ppm ICP-MS 279 304 -9 OK

304
B.5 Data Quality of Plant Soil EDTA Extractions
Table B.10. Accuracy data for the bioavailability extractions. Assessment for valid accuracy
was a percentage difference from the standard value (%∆SRM) less than 30 where
the value was five times greater than the detection limit and 50 for values less than
five times the lower detection limit. Elements in bold exceeded the threshold and
were removed from the dataset.
SLRS-4 Accuracy Element Unit Certified Analysis Values %∆SRM Assessment
Al µg/L 54 58.3 -7 OK As µg/L 0.68 0.6912 -2 OK Co µg/L 0.033 0.0433 -24 OK Cr µg/L 0.33 0.515 -36 Fail
Cu µg/L 1.81 2.03 -11 OK Ni µg/L 0.67 0.752 -11 OK Pb µg/L 0.086 0.063 37 Fail
Zn µg/L 0.93 0.9665 -4 OK
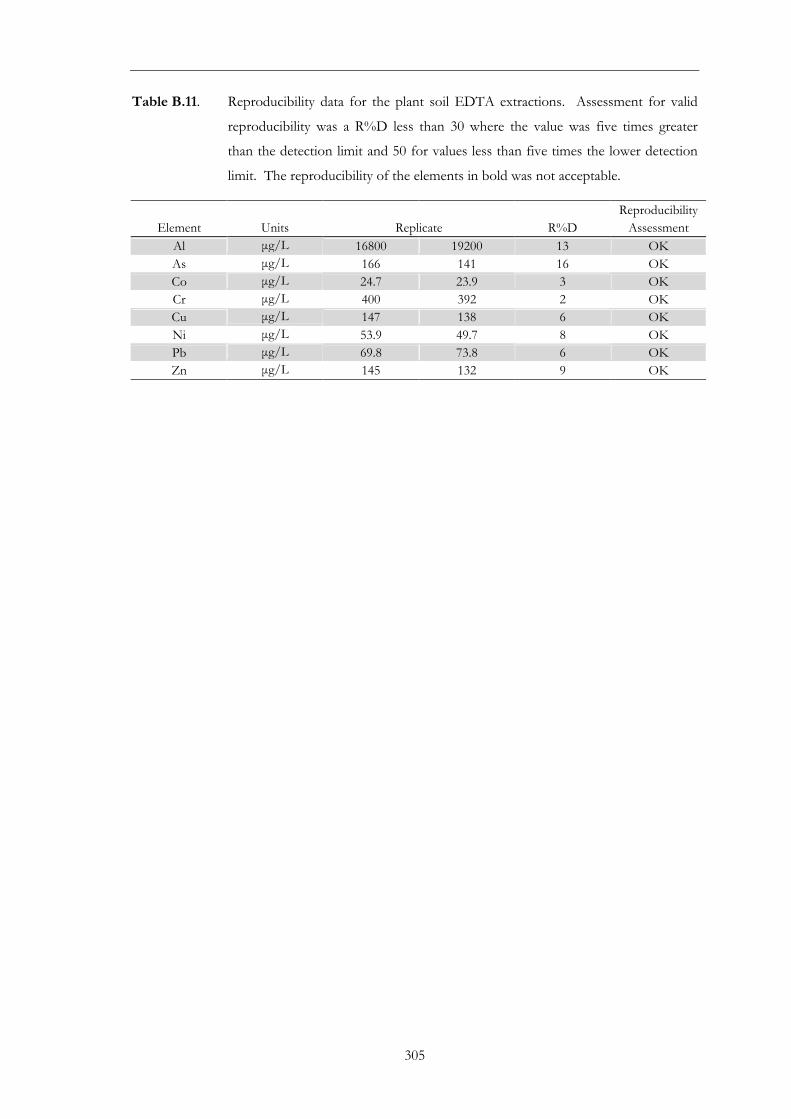
305
Table B.11. Reproducibility data for the plant soil EDTA extractions. Assessment for valid
reproducibility was a R%D less than 30 where the value was five times greater
than the detection limit and 50 for values less than five times the lower detection
limit. The reproducibility of the elements in bold was not acceptable.
Reproducibility Element Units Replicate R%D Assessment
Al µg/L 16800 19200 13 OK
As µg/L 166 141 16 OK Co µg/L 24.7 23.9 3 OK Cr µg/L 400 392 2 OK Cu µg/L 147 138 6 OK
Ni µg/L 53.9 49.7 8 OK Pb µg/L 69.8 73.8 6 OK Zn µg/L 145 132 9 OK

306
APPENDIX C. ASS SAMPLE DATA
Table C.1. Grain-size data for samples from the dry and wet ASS profiles. Values are percentage of
sample volume passing the size class. The grain-size data are graphed in Figures C.1 and
C.2 for the dry and wet ASS profiles, respectively.
Passing Size % Clay 3.6 µm
% Silt 63 µm
Very Fine Sand 126 µm
Fine Sand 252 µm
Medium Sand 502 µm
Coarse Sand
1002 µm
Very Coarse Sand
2000 µm DP2-01 11 55 61 71 86 98 100 DP2-02 18 55 57 68 89 99 100 DP2-03 13 48 52 66 90 100 100 DP2-04 12 48 54 69 90 99 100 DP2-05 12 58 67 81 93 99 100 DP2-06 14 72 81 91 98 100 100 DP2-07 11 60 69 84 96 100 100 DP2-08 12 61 70 87 97 100 100 DP2-09 8 35 44 76 99 100 100 DP2-10 9 43 53 79 96 100 100 DP2-11 11 58 68 85 95 99 100 DP2-12 10 47 61 79 92 98 100 DP2-13 11 57 68 81 92 100 100 DP2-14 11 60 69 81 92 99 100 WP2-01 15 75 83 90 96 99 100 WP2-03 16 80 86 92 97 99 100 WP2-04 18 81 87 93 98 100 100 WP2-05 15 75 83 90 94 98 100 WP2-06 14 69 80 88 93 98 100 WP2-07 13 69 79 88 95 99 100 WP2-08 16 72 81 91 97 99 100 WP2-09 13 66 78 93 99 100 100 WP2-10 14 65 77 88 94 98 100 WP2-11 15 71 82 91 97 100 100 WP2-12 15 75 85 91 95 99 100 WP2-13 15 73 83 91 95 99 100 WP2-14 18 79 87 93 97 100 100

307
Figure C.1. Grainsize distribution for samples from the dry ASS profile.

308
Figure C.2. Grainsize distribution for samples from the wet ASS profile.
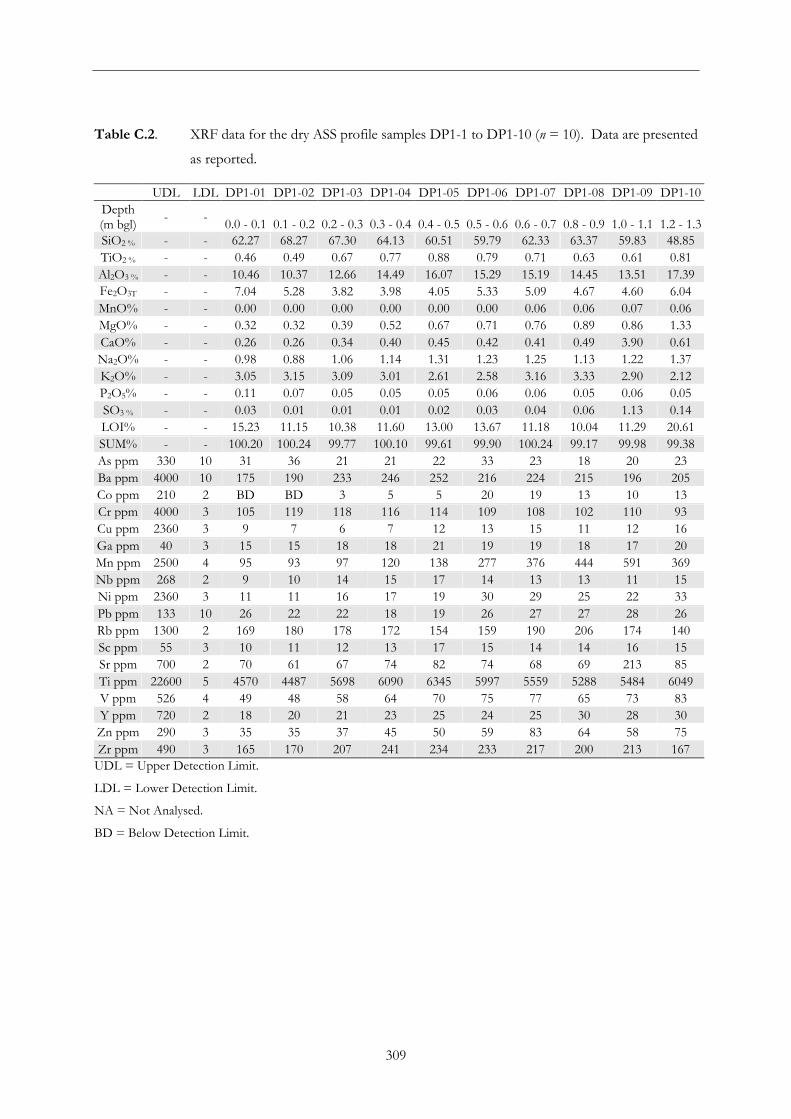
309
Table C.2. XRF data for the dry ASS profile samples DP1-1 to DP1-10 (n = 10). Data are presented
as reported.
UDL LDL DP1-01 DP1-02 DP1-03 DP1-04 DP1-05 DP1-06 DP1-07 DP1-08 DP1-09 DP1-10 Depth (m bgl)
- - 0.0 - 0.1 0.1 - 0.2 0.2 - 0.3 0.3 - 0.4 0.4 - 0.5 0.5 - 0.6 0.6 - 0.7 0.8 - 0.9 1.0 - 1.1 1.2 - 1.3
SiO2 % - - 62.27 68.27 67.30 64.13 60.51 59.79 62.33 63.37 59.83 48.85 TiO2 % - - 0.46 0.49 0.67 0.77 0.88 0.79 0.71 0.63 0.61 0.81 Al2O3 % - - 10.46 10.37 12.66 14.49 16.07 15.29 15.19 14.45 13.51 17.39 Fe2O3T
% - - 7.04 5.28 3.82 3.98 4.05 5.33 5.09 4.67 4.60 6.04
MnO% - - 0.00 0.00 0.00 0.00 0.00 0.00 0.06 0.06 0.07 0.06 MgO% - - 0.32 0.32 0.39 0.52 0.67 0.71 0.76 0.89 0.86 1.33 CaO% - - 0.26 0.26 0.34 0.40 0.45 0.42 0.41 0.49 3.90 0.61 Na2O% - - 0.98 0.88 1.06 1.14 1.31 1.23 1.25 1.13 1.22 1.37 K2O% - - 3.05 3.15 3.09 3.01 2.61 2.58 3.16 3.33 2.90 2.12 P2O5% - - 0.11 0.07 0.05 0.05 0.05 0.06 0.06 0.05 0.06 0.05 SO3 % - - 0.03 0.01 0.01 0.01 0.02 0.03 0.04 0.06 1.13 0.14 LOI% - - 15.23 11.15 10.38 11.60 13.00 13.67 11.18 10.04 11.29 20.61 SUM% - - 100.20 100.24 99.77 100.10 99.61 99.90 100.24 99.17 99.98 99.38 As ppm 330 10 31 36 21 21 22 33 23 18 20 23 Ba ppm 4000 10 175 190 233 246 252 216 224 215 196 205 Co ppm 210 2 BD BD 3 5 5 20 19 13 10 13 Cr ppm 4000 3 105 119 118 116 114 109 108 102 110 93 Cu ppm 2360 3 9 7 6 7 12 13 15 11 12 16 Ga ppm 40 3 15 15 18 18 21 19 19 18 17 20 Mn ppm 2500 4 95 93 97 120 138 277 376 444 591 369 Nb ppm 268 2 9 10 14 15 17 14 13 13 11 15 Ni ppm 2360 3 11 11 16 17 19 30 29 25 22 33 Pb ppm 133 10 26 22 22 18 19 26 27 27 28 26 Rb ppm 1300 2 169 180 178 172 154 159 190 206 174 140 Sc ppm 55 3 10 11 12 13 17 15 14 14 16 15 Sr ppm 700 2 70 61 67 74 82 74 68 69 213 85 Ti ppm 22600 5 4570 4487 5698 6090 6345 5997 5559 5288 5484 6049 V ppm 526 4 49 48 58 64 70 75 77 65 73 83 Y ppm 720 2 18 20 21 23 25 24 25 30 28 30
Zn ppm 290 3 35 35 37 45 50 59 83 64 58 75 Zr ppm 490 3 165 170 207 241 234 233 217 200 213 167
UDL = Upper Detection Limit.
LDL = Lower Detection Limit.
NA = Not Analysed.
BD = Below Detection Limit.
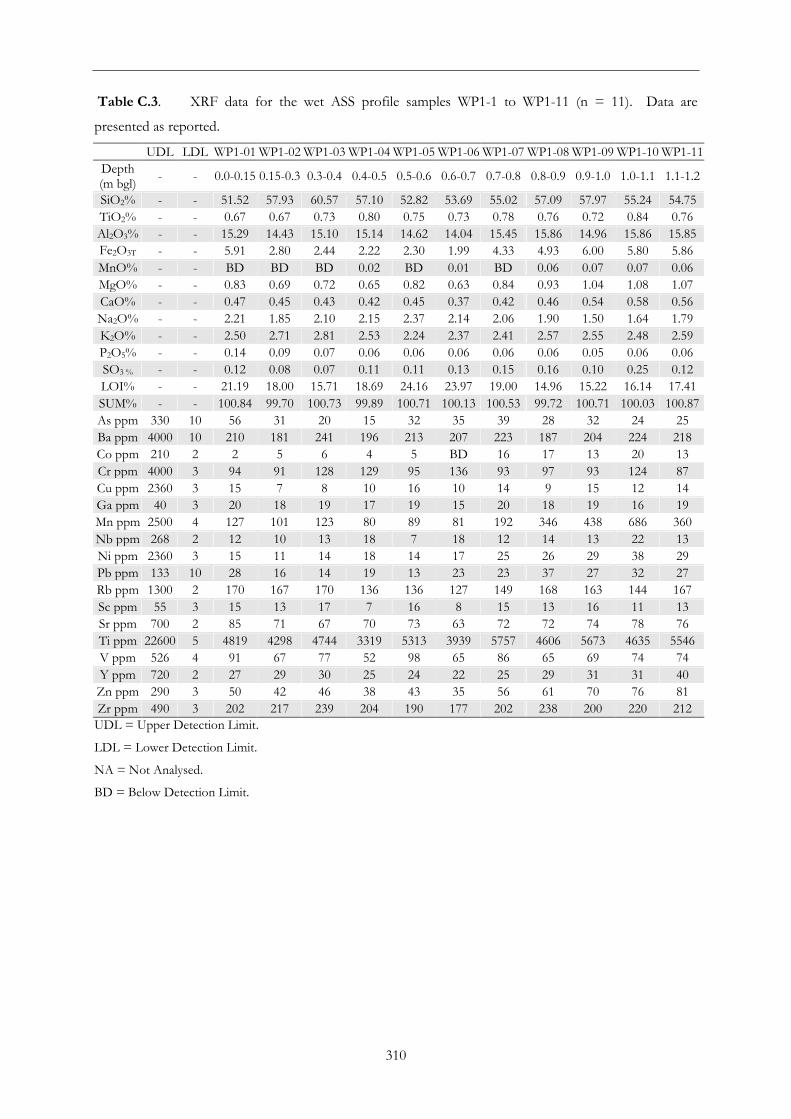
310
Table C.3. XRF data for the wet ASS profile samples WP1-1 to WP1-11 (n = 11). Data are
presented as reported.
UDL LDL WP1-01 WP1-02 WP1-03 WP1-04 WP1-05 WP1-06 WP1-07 WP1-08 WP1-09 WP1-10 WP1-11 Depth (m bgl)
- - 0.0-0.15 0.15-0.3 0.3-0.4 0.4-0.5 0.5-0.6 0.6-0.7 0.7-0.8 0.8-0.9 0.9-1.0 1.0-1.1 1.1-1.2
SiO2% - - 51.52 57.93 60.57 57.10 52.82 53.69 55.02 57.09 57.97 55.24 54.75 TiO2% - - 0.67 0.67 0.73 0.80 0.75 0.73 0.78 0.76 0.72 0.84 0.76 Al2O3% - - 15.29 14.43 15.10 15.14 14.62 14.04 15.45 15.86 14.96 15.86 15.85 Fe2O3T
% - - 5.91 2.80 2.44 2.22 2.30 1.99 4.33 4.93 6.00 5.80 5.86
MnO% - - BD BD BD 0.02 BD 0.01 BD 0.06 0.07 0.07 0.06 MgO% - - 0.83 0.69 0.72 0.65 0.82 0.63 0.84 0.93 1.04 1.08 1.07 CaO% - - 0.47 0.45 0.43 0.42 0.45 0.37 0.42 0.46 0.54 0.58 0.56 Na2O% - - 2.21 1.85 2.10 2.15 2.37 2.14 2.06 1.90 1.50 1.64 1.79 K2O% - - 2.50 2.71 2.81 2.53 2.24 2.37 2.41 2.57 2.55 2.48 2.59 P2O5% - - 0.14 0.09 0.07 0.06 0.06 0.06 0.06 0.06 0.05 0.06 0.06 SO3 % - - 0.12 0.08 0.07 0.11 0.11 0.13 0.15 0.16 0.10 0.25 0.12 LOI% - - 21.19 18.00 15.71 18.69 24.16 23.97 19.00 14.96 15.22 16.14 17.41 SUM% - - 100.84 99.70 100.73 99.89 100.71 100.13 100.53 99.72 100.71 100.03 100.87 As ppm 330 10 56 31 20 15 32 35 39 28 32 24 25 Ba ppm 4000 10 210 181 241 196 213 207 223 187 204 224 218 Co ppm 210 2 2 5 6 4 5 BD 16 17 13 20 13 Cr ppm 4000 3 94 91 128 129 95 136 93 97 93 124 87 Cu ppm 2360 3 15 7 8 10 16 10 14 9 15 12 14 Ga ppm 40 3 20 18 19 17 19 15 20 18 19 16 19 Mn ppm 2500 4 127 101 123 80 89 81 192 346 438 686 360 Nb ppm 268 2 12 10 13 18 7 18 12 14 13 22 13 Ni ppm 2360 3 15 11 14 18 14 17 25 26 29 38 29 Pb ppm 133 10 28 16 14 19 13 23 23 37 27 32 27 Rb ppm 1300 2 170 167 170 136 136 127 149 168 163 144 167 Sc ppm 55 3 15 13 17 7 16 8 15 13 16 11 13 Sr ppm 700 2 85 71 67 70 73 63 72 72 74 78 76 Ti ppm 22600 5 4819 4298 4744 3319 5313 3939 5757 4606 5673 4635 5546 V ppm 526 4 91 67 77 52 98 65 86 65 69 74 74 Y ppm 720 2 27 29 30 25 24 22 25 29 31 31 40
Zn ppm 290 3 50 42 46 38 43 35 56 61 70 76 81 Zr ppm 490 3 202 217 239 204 190 177 202 238 200 220 212
UDL = Upper Detection Limit.
LDL = Lower Detection Limit.
NA = Not Analysed.
BD = Below Detection Limit.
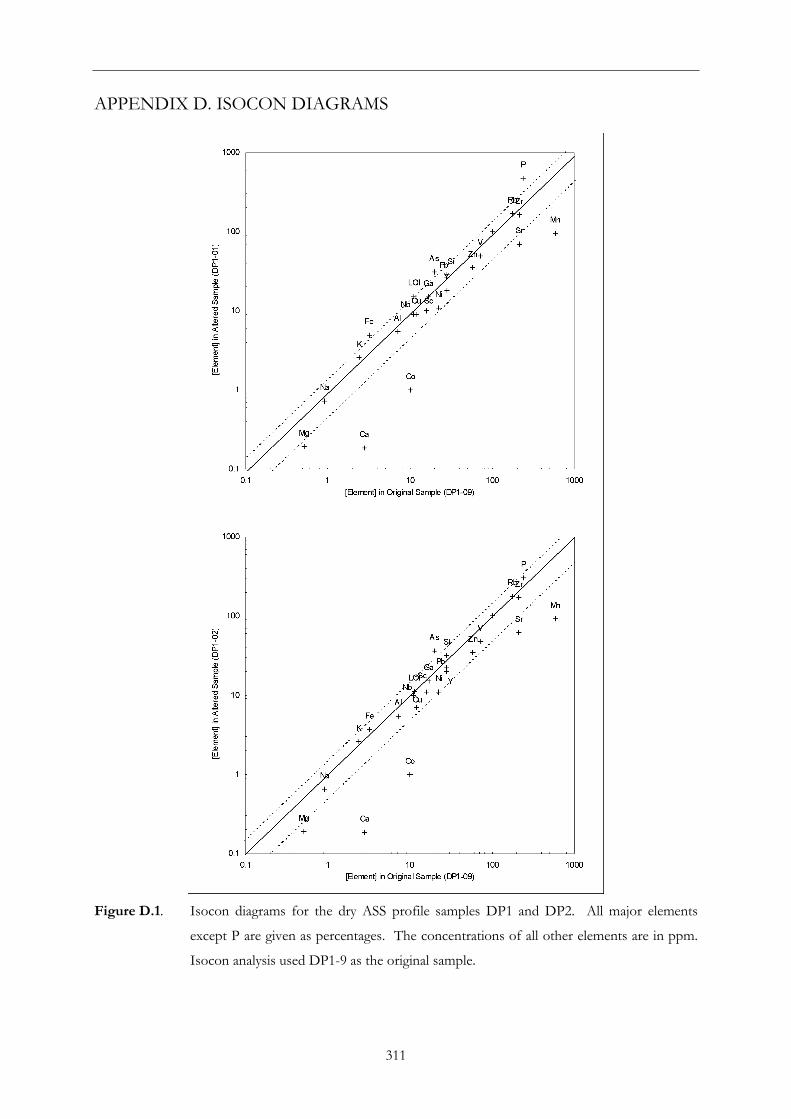
311
APPENDIX D. ISOCON DIAGRAMS
Figure D.1. Isocon diagrams for the dry ASS profile samples DP1 and DP2. All major elements
except P are given as percentages. The concentrations of all other elements are in ppm.
Isocon analysis used DP1-9 as the original sample.

312
Figure D.2. Isocon diagrams for the dry ASS profile samples DP1-3 and DP1-4. All major elements
except P are given as percentages. The concentrations of all other elements are in ppm.
Isocon analysis used DP1-9 as the original sample.

313
Figure D.3. Isocon diagrams for the dry ASS profile samples DP1-5 and DP1-6. All major elements
except P are given as percentages. The concentrations of all other elements are in ppm.
Isocon analysis used DP1-9 as the original sample.
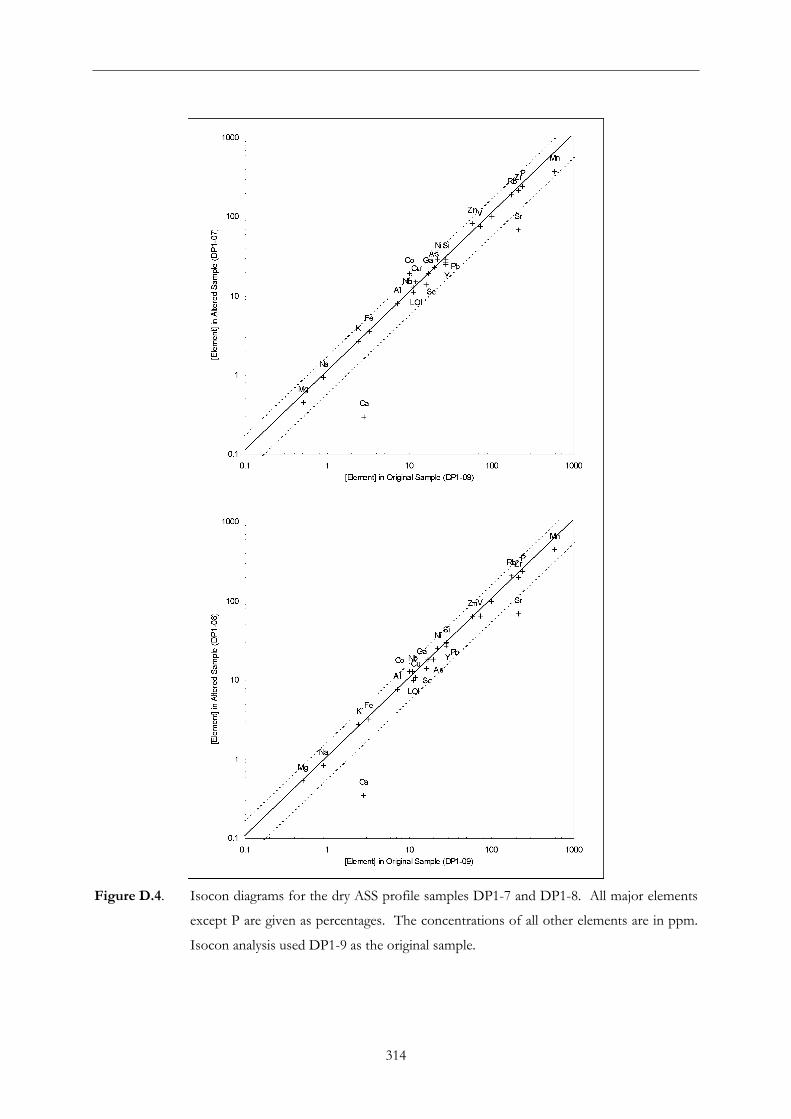
314
Figure D.4. Isocon diagrams for the dry ASS profile samples DP1-7 and DP1-8. All major elements
except P are given as percentages. The concentrations of all other elements are in ppm.
Isocon analysis used DP1-9 as the original sample.
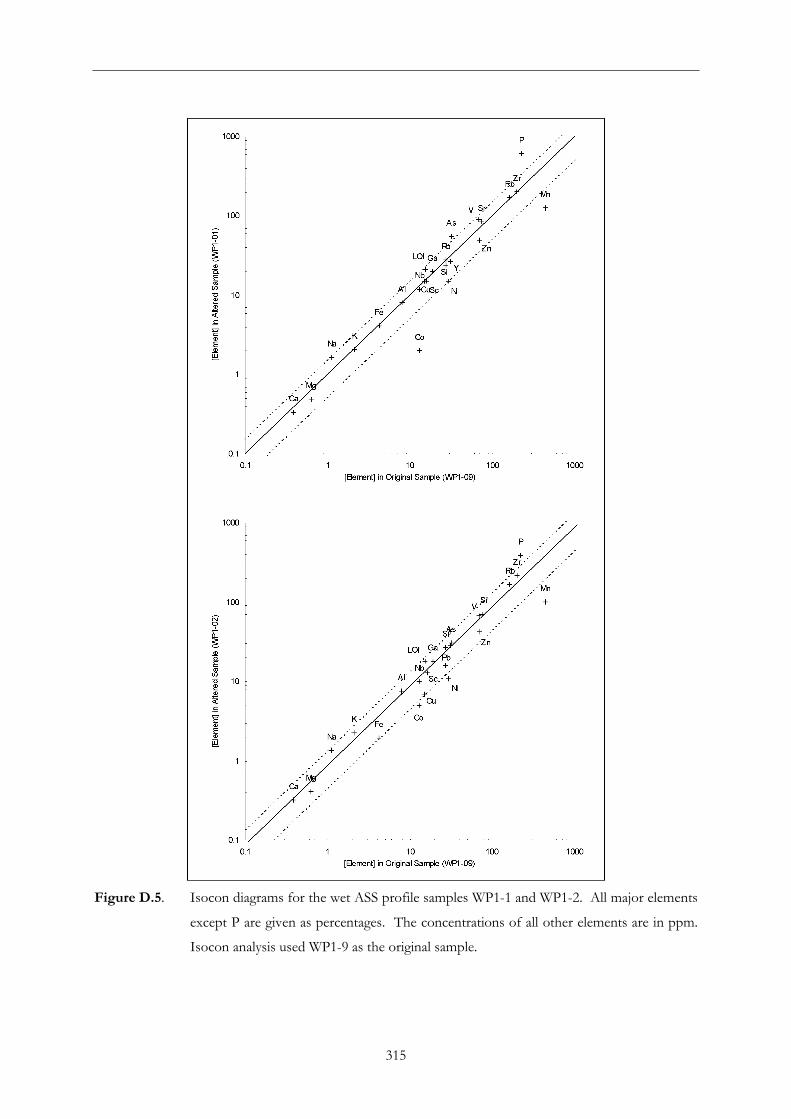
315
Figure D.5. Isocon diagrams for the wet ASS profile samples WP1-1 and WP1-2. All major elements
except P are given as percentages. The concentrations of all other elements are in ppm.
Isocon analysis used WP1-9 as the original sample.

316
Figure D.6. Isocon diagrams for the wet ASS profile samples WP1-3 and WP1-4. All major elements
except P are given as percentages. The concentrations of all other elements are in ppm.
Isocon analysis used WP1-9 as the original sample.
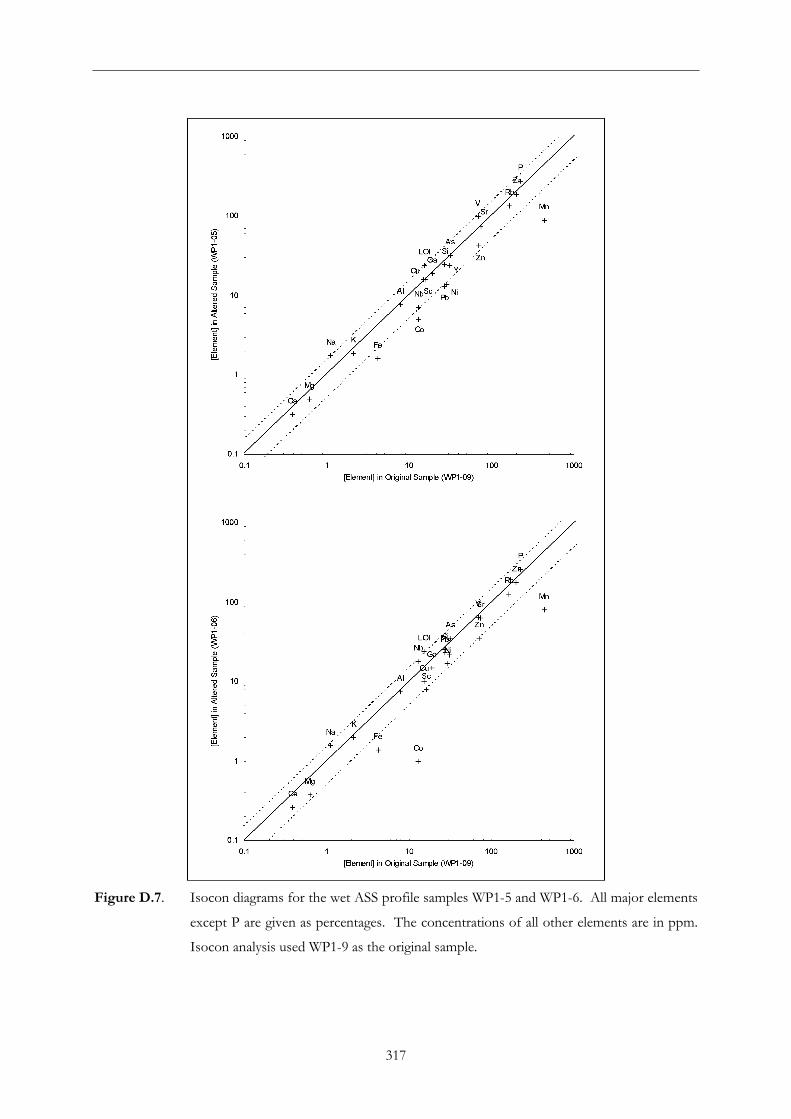
317
Figure D.7. Isocon diagrams for the wet ASS profile samples WP1-5 and WP1-6. All major elements
except P are given as percentages. The concentrations of all other elements are in ppm.
Isocon analysis used WP1-9 as the original sample.

318
Figure D.8. Isocon diagrams for the wet ASS profile samples WP1-7 and WP1-8. All major elements
except P are given as percentages. The concentrations of all other elements are in ppm.
Isocon analysis used WP1-9 as the original sample.
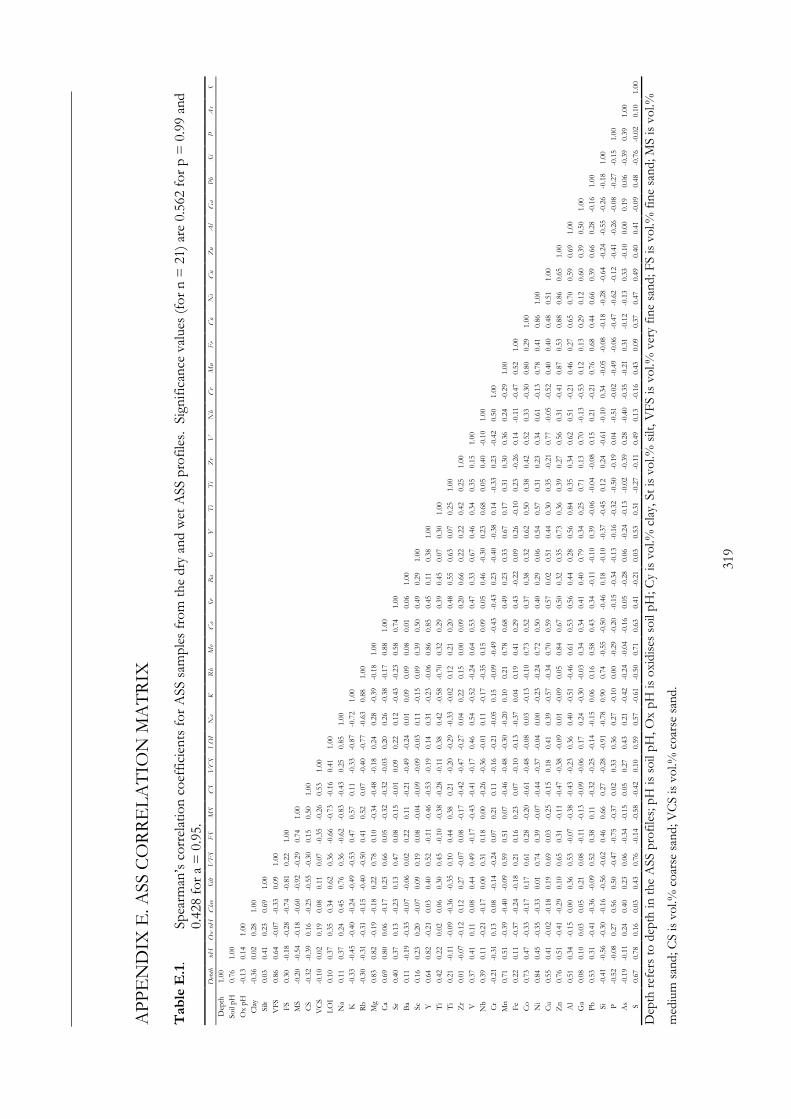
319
AP
PE
ND
IX E
. ASS
CO
RR
EL
AT
ION
MA
TR
IX
Table E
.1.
Spea
rman
’s c
orre
latio
n co
effi
cien
ts f
or A
SS s
ampl
es f
rom
the
dry
and
wet
ASS
pro
file
s. S
igni
fica
nce
valu
es (
for
n =
21)
are
0.5
62 f
or p
= 0
.99
and
0.42
8 fo
r a
= 0
.95.
Dep
th
pH
Ox p
H
Cla
y Silt
V
FS
FS
MS
CS
VC
S
LO
I N
a K
R
b M
g C
a Sr
Ba
Sc
Y
Ti
Ti
Zr
V
Nb
Cr
Mn
Fe
Co
Ni
Cu
Zn
Al
Ga
Pb
Si
P
As
S
Dep
th
1.00
Soil
pH
0.76
1.
00
Ox
pH
-0.1
3 0.
14
1.00
Cla
y -0
.36
0.02
0.
28
1.00
Silt
0.03
0.
41
0.23
0.
69
1.00
VF
S 0.
86
0.64
-0
.07
-0.3
3 0.
09
1.00
FS
0.30
-0
.18
-0.2
8 -0
.74
-0.8
1 0.
22
1.00
MS
-0.2
0 -0
.54
-0.1
8 -0
.60
-0.9
2 -0
.29
0.74
1.
00
CS
-0.3
2 -0
.39
0.16
-0
.25
-0.5
5 -0
.30
0.15
0.
50
1.00
VC
S -0
.10
0.02
0.
19
0.08
0.
11
0.07
-0
.35
-0.2
6 0.
53
1.00
LO
I 0.
10
0.37
0.
35
0.34
0.
62
0.36
-0
.66
-0.7
3 -0
.16
0.41
1.
00
Na
0.11
0.
37
0.24
0.
45
0.76
0.
36
-0.6
2 -0
.83
-0.4
3 0.
25
0.85
1.
00
K
-0.3
3 -0
.45
-0.4
0 -0
.24
-0.4
9 -0
.53
0.47
0.
57
0.11
-0
.33
-0.8
7 -0
.72
1.00
Rb
-0.3
0 -0
.31
-0.3
1 -0
.15
-0.4
0 -0
.50
0.41
0.
52
0.07
-0
.40
-0.7
7 -0
.63
0.88
1.
00
Mg
0.83
0.
82
-0.1
9 -0
.18
0.22
0.
78
0.10
-0
.34
-0.4
8 -0
.18
0.24
0.
28
-0.3
9 -0
.18
1.00
Ca
0.69
0.
80
0.06
-0
.17
0.23
0.
66
0.05
-0
.32
-0.3
2 -0
.03
0.20
0.
26
-0.3
8 -0
.17
0.88
1.
00
Sr
0.40
0.
37
0.13
-0
.23
0.13
0.
47
0.08
-0
.15
-0.0
1 0.
09
0.22
0.
12
-0.4
3 -0
.23
0.58
0.
74
1.00
Ba
0.11
-0
.19
-0.3
3 -0
.07
-0.0
6 0.
02
0.22
0.
11
-0.2
1 -0
.49
-0.2
4 0.
01
0.09
0.
09
0.08
0.
01
0.06
1.
00
Sc
0.16
0.
23
0.20
-0
.07
0.09
0.
19
0.08
-0
.04
-0.0
9 -0
.09
-0.0
3 0.
11
-0.1
5 0.
09
0.39
0.
50
0.49
0.
29
1.00
Y
0.64
0.
82
-0.2
1 0.
03
0.40
0.
52
-0.1
1 -0
.46
-0.5
3 -0
.19
0.14
0.
31
-0.2
3 -0
.06
0.86
0.
85
0.45
0.
11
0.38
1.
00
Ti
0.42
0.
22
0.02
0.
06
0.30
0.
45
-0.1
0 -0
.38
-0.2
8 -0
.11
0.38
0.
42
-0.5
8 -0
.70
0.32
0.
29
0.39
0.
45
0.07
0.
30
1.00
Ti
0.21
-0
.11
-0.0
9 -0
.36
-0.3
5 0.
10
0.44
0.
38
0.21
-0
.20
-0.2
9 -0
.33
-0.0
2 0.
12
0.21
0.
20
0.48
0.
55
0.63
0.
07
0.25
1.
00
Zr
0.01
-0
.07
-0.1
2 0.
12
0.27
-0
.07
0.08
-0
.17
-0.4
2 -0
.47
-0.2
7 0.
04
0.22
0.
15
0.00
0.
09
0.20
0.
66
0.22
0.
22
0.42
0.
25
1.00
V
0.37
0.
41
0.11
0.
08
0.44
0.
49
-0.1
7 -0
.43
-0.4
1 -0
.17
0.46
0.
54
-0.5
2 -0
.24
0.64
0.
53
0.47
0.
33
0.67
0.
46
0.34
0.
35
0.15
1.
00
Nb
0.39
0.
11
-0.2
1 -0
.17
0.00
0.
31
0.18
0.
00
-0.2
6 -0
.36
-0.0
1 0.
11
-0.1
7 -0
.35
0.15
0.
09
0.05
0.
46
-0.3
0 0.
23
0.68
0.
05
0.40
-0
.10
1.00
Cr
-0.2
1 -0
.31
0.13
0.
08
-0.1
4 -0
.24
0.07
0.
21
0.11
-0
.16
-0.2
1 -0
.05
0.15
-0
.09
-0.4
9 -0
.43
-0.4
3 0.
23
-0.4
0 -0
.38
0.14
-0
.33
0.23
-0
.42
0.50
1.
00
Mn
0.71
0.
51
-0.3
9 -0
.40
-0.0
9 0.
59
0.51
0.
07
-0.4
6 -0
.48
-0.3
0 -0
.20
0.10
0.
21
0.78
0.
68
0.49
0.
23
0.33
0.
67
0.17
0.
31
0.30
0.
36
0.24
-0
.29
1.00
Fe
0.22
0.
11
-0.3
7 -0
.24
-0.1
8 0.
21
0.16
0.
23
0.07
-0
.10
-0.1
3 -0
.37
0.04
0.
19
0.41
0.
29
0.43
-0
.22
0.09
0.
26
-0.1
0 0.
23
-0.2
6 0.
14
-0.1
1 -0
.47
0.52
1.
00
Co
0.73
0.
47
-0.3
3 -0
.17
0.17
0.
61
0.28
-0
.20
-0.6
1 -0
.48
-0.0
8 0.
03
-0.1
3 -0
.10
0.73
0.
52
0.37
0.
38
0.32
0.
62
0.50
0.
38
0.42
0.
52
0.33
-0
.30
0.80
0.
29
1.00
Ni
0.84
0.
45
-0.3
5 -0
.33
0.01
0.
74
0.39
-0
.07
-0.4
4 -0
.37
-0.0
4 0.
00
-0.2
3 -0
.24
0.72
0.
50
0.40
0.
29
0.06
0.
54
0.57
0.
31
0.23
0.
34
0.61
-0
.13
0.78
0.
41
0.86
1.
00
Cu
0.55
0.
41
-0.0
2 -0
.18
0.19
0.
69
0.03
-0
.25
-0.1
5 0.
18
0.41
0.
39
-0.5
7 -0
.34
0.70
0.
59
0.57
0.
02
0.51
0.
44
0.30
0.
35
-0.2
1 0.
77
-0.0
5 -0
.52
0.40
0.
40
0.48
0.
51
1.00
Zn
0.76
0.
51
-0.4
1 -0
.29
0.10
0.
65
0.31
-0
.11
-0.4
7 -0
.38
-0.0
9 0.
01
-0.0
9 0.
05
0.84
0.
67
0.50
0.
32
0.35
0.
73
0.36
0.
39
0.27
0.
56
0.31
-0
.41
0.87
0.
53
0.88
0.
86
0.65
1.
00
Al
0.51
0.
34
-0.1
5 0.
00
0.36
0.
53
-0.0
7 -0
.38
-0.4
3 -0
.23
0.36
0.
40
-0.5
1 -0
.46
0.61
0.
53
0.56
0.
44
0.28
0.
56
0.84
0.
35
0.34
0.
62
0.51
-0
.21
0.46
0.
27
0.65
0.
70
0.59
0.
69
1.00
Ga
0.08
0.
10
0.03
0.
05
0.21
0.
08
-0.1
1 -0
.13
-0.0
9 -0
.06
0.17
0.
24
-0.3
0 -0
.03
0.34
0.
34
0.41
0.
40
0.79
0.
34
0.25
0.
71
0.13
0.
70
-0.1
3 -0
.53
0.12
0.
13
0.29
0.
12
0.60
0.
39
0.50
1.
00
Pb
0.53
0.
31
-0.4
1 -0
.36
-0.0
9 0.
52
0.38
0.
11
-0.3
2 -0
.25
-0.1
4 -0
.15
0.06
0.
16
0.58
0.
43
0.34
-0
.11
-0.1
0 0.
39
-0.0
6 -0
.04
-0.0
8 0.
15
0.21
-0
.21
0.76
0.
68
0.44
0.
66
0.39
0.
66
0.28
-0
.16
1.00
Si
-0.4
1 -0
.56
-0.3
0 -0
.16
-0.5
6 -0
.62
0.46
0.
66
0.27
-0
.28
-0.9
1 -0
.78
0.90
0.
74
-0.5
5 -0
.50
-0.4
6 0.
18
-0.1
0 -0
.37
-0.4
5 0.
12
0.24
-0
.61
-0.1
0 0.
34
-0.0
5 -0
.08
-0.1
8 -0
.28
-0.6
4 -0
.24
-0.5
5 -0
.26
-0.1
8 1.
00
P
-0.5
2 -0
.08
0.27
0.
56
0.50
-0
.47
-0.7
5 -0
.37
0.02
0.
33
0.36
0.
27
-0.1
0 0.
00
-0.2
9 -0
.20
-0.1
5 -0
.34
-0.1
3 -0
.16
-0.3
2 -0
.50
-0.1
9 0.
04
-0.5
1 -0
.02
-0.4
9 -0
.06
-0.4
7 -0
.62
-0.1
2 -0
.41
-0.2
6 -0
.08
-0.2
7 -0
.15
1.00
As
-0.1
9 -0
.11
0.24
0.
40
0.23
0.
06
-0.3
4 -0
.15
0.05
0.
27
0.43
0.
21
-0.4
2 -0
.24
-0.0
4 -0
.16
0.05
-0
.28
0.06
-0
.24
-0.1
3 -0
.02
-0.3
9 0.
28
-0.4
0 -0
.35
-0.2
1 0.
31
-0.1
2 -0
.13
0.33
-0
.10
0.00
0.
19
0.06
-0
.39
0.39
1.
00
S 0.
67
0.78
0.
16
0.03
0.
43
0.76
-0
.14
-0.5
8 -0
.42
0.10
0.
59
0.57
-0
.61
-0.5
0 0.
71
0.63
0.
41
-0.2
1 0.
03
0.53
0.
31
-0.2
7 -0
.11
0.49
0.
13
-0.1
6 0.
43
0.09
0.
37
0.47
0.
49
0.40
0.
41
-0.0
9 0.
48
-0.7
6 -0
.02
0.10
1.
00
Dep
th r
efer
s to
dep
th in
the
ASS
pro
file
s; p
H is
soi
l pH
, Ox
pH is
oxi
dise
s so
il pH
; Cy
is v
ol.%
cla
y, S
t is
vol
.% s
ilt, V
FS
is v
ol.%
ver
y fi
ne s
and;
FS
is v
ol.%
fin
e sa
nd; M
S is
vol
.%
med
ium
san
d; C
S is
vol
.% c
oars
e sa
nd; V
CS
is v
ol.%
coa
rse
sand
.

320
APPENDIX F. SEQUENTIAL EXTRACTION DATA FOR ASS SAMPLES
Table F.1. Free water loss (weight percent) from sequential extraction soil samples. Free water is
defined as the water lost from the soil samples after two centrifuge runs of 20 min at
3000 g each.
Sample wt.% water loss after
centrifuging Sample
wt.% water loss after centrifuging
DP2-01 0 WP2-01 13 DP2-02 3 WP2-02 8 DP2-03 6 WP2-03 11 DP2-04 7 WP2-04 10 DP2-05 6 WP2-05 13 DP2-06 7 WP2-06 15 DP2-07 9 WP2-07 12 DP2-08 6 WP2-08 5 DP2-09 9 WP2-09 4 DP2-10 11 WP2-10 6
Table F.2. Total moisture content of soil materials used in sequential extraction procedures.
Sample wt.% total water loss (after
drying) Sample
wt.% water loss (after drying)
DP2-01 22 WP2-01 32 DP2-02 23 WP2-02 31 DP2-03 28 WP2-03 31 DP2-04 27 WP2-04 33 DP2-05 31 WP2-05 36 DP2-06 34 WP2-06 36 DP2-07 30 WP2-07 38 DP2-08 - WP2-08 - DP2-09 - WP2-09 - DP2-10 - WP2-10 -

321
Table F.3
. G
SC-S
EP
ele
men
t da
ta f
or A
SS s
ampl
es. T
he v
olum
es o
f th
e fr
actio
n ex
trac
tions
wer
e: A
dsor
bed,
Exc
hang
eabl
e, C
arbo
nate
bou
nd (
AE
C)
= 4
0
mL
(x2
), am
orph
ous
Fe
oxid
e (A
mF
eOx)
= 4
0 m
L (
x2),
crys
talli
ne F
e ox
ide
(Cry
FeO
x) =
60
mL
(x2
), an
d ox
idis
able
(O
x) =
45
mL
. T
he r
esid
ual
frac
tion
(Res
) of
eac
h sa
mpl
e is
mar
ked
“Res
” if
the
res
idua
l fra
ctio
n w
as d
eter
min
ed d
irec
tly, o
r “B
ulk”
if d
eter
min
ed in
dire
ctly
. A
ll re
sidu
al C
o
valu
es w
ere
dete
rmin
ed in
dire
ctly
.
D
P2-
01
DP
2-02
D
P2-
03
DP
2-04
D
P2-
05
DP
2-06
D
P2-
07
DP
2-08
D
P2-
09
DP
2-10
W
P2-
01
WP
2-02
W
P2-
03
WP
2-04
W
P2-
05
WP
2-06
W
P2-
07
WP
2-08
W
P2-
09
WP
2-10
B
lank
D
ry M
ass
0.84
99
0.83
95
0.78
55
0.80
08
0.75
54
0.72
8 0.
7637
0.
79
0.79
0.
79
0.74
72
0.76
0.
7603
0.
7386
0.
7051
0.
6994
0.
6793
0.
73
0.73
0.
73
- AEC
A
l ppm
8.
74
6.45
5.
59
5.4
1.92
2.
01
2.61
6.
54
2.29
2.
32
5.89
2.
78
3.38
11
.5
14.7
12
.2
15.6
50
.3
2.12
4.
15
<=
0.5
A
s pp
b 2.
99
18.5
9.
87
3.36
<
= 2
<
= 2
<
= 2
25
.9
12.3
12
.5
12.3
21
.2
18
40.8
44
.7
71.9
79
.3
215
28.8
24
.1
<=
2
Ba
ppb
1.83
5.
98
5.18
4.
07
4.56
4.
75
4.75
8.
18
12.1
13
.6
23.3
40
.7
21.1
14
.8
11.5
10
.2
11.5
28
.1
7.57
10
.5
2.1
Co
ppb
4.8
3.56
3.
5 3.
52
2.85
2.
66
32.9
11
3 29
.1
18.4
7.
08
3.18
3.
58
5.47
7.
85
6.9
8.1
48.3
10
7 82
.1
0.68
7 C
r pp
b 33
.3
55.8
58
.8
59.6
42
41
.1
38.8
18
.6
14
13.6
43
.2
51.3
45
.9
65.8
57
.3
52.4
57
67
.8
12.2
13
.5
14
Cu
ppb
13.5
29
.3
36.3
34
.2
36.9
36
.2
28.3
20
.9
64.4
76
.2
28.4
39
.2
28.3
37
.4
44.2
36
.6
38.4
11
0 12
7 11
8 26
.9
Fe
ppm
6.
54
10.1
11
.7
14.5
3.
78
4.79
7.
33
10.8
5.
3 3.
25
11.5
24
.1
12.5
4.
51
4.51
3.
66
4.79
36
6
9.27
0.
144
Ga
ppb
0.76
2 5.
1 5.
41
7.23
2.
76
1.21
1.
15
0.92
3 1.
13
1.07
5.
07
4.42
4.
38
10.9
10
.8
9.74
10
.2
19.7
0.
643
1.22
0.
722
Mn
ppb
202
117
153
93
83.4
88
.1
167
1520
54
7 87
6 10
2 10
2 95
.7
109
107
89.3
95
.2
244
346
363
3.78
N
a pp
m
1040
0 11
500
1100
0 11
700
1140
0 12
200
1110
0 47
20
4700
47
00
1080
0 10
200
9880
96
80
1140
0 92
70
1140
0 47
10
4680
47
10
1010
0 N
b pp
b 0.
142
0.22
3 1.
95
6.17
10
.7
11.4
4.
99
0.13
6 0.
152
0.12
6 2.
45
1.8
1.12
1.
36
1.35
1.
05
0.82
3 0.
158
0.05
54
0.09
9 0.
563
Ni p
pb
11.5
9.
54
14.6
11
.5
9.49
9.
75
23
152
67.6
56
.3
12.4
11
.1
12.3
12
.4
14.9
14
.4
15.4
11
5 16
9 19
2 10
.6
Pb
ppb
2.81
1.
41
2.25
1.
64
4.38
8.
22
14.9
18
.9
7.72
11
.6
36.2
37
.5
29.4
51
.3
39.2
43
.1
48.1
85
.2
31.2
25
.1
0.58
9 Sc
ppb
13
.9
26.1
21
.4
14.3
13
.1
12.7
11
.1
24.1
16
.3
21.9
8.
41
11.1
10
13
.7
13.5
14
.4
15.6
85
.5
31.6
31
.6
9.97
T
i ppb
27
.5
235
232
260
210
55.2
47
.5
120
115
98.2
17
3 17
5 17
4 24
6 21
4 22
9 20
9 22
0 71
.3
122
10.7
V
ppb
1.
3 18
16
.8
23
12.1
13
.2
15.5
12
.2
15.9
19
.8
49.4
44
.3
44.5
11
8 14
1 14
9 17
3 13
9 40
.8
31.6
<
= 0
.5
Zn
ppb
43.7
36
.3
49.6
42
.2
32.4
35
.2
38.9
22
3 56
.7
39.6
48
.6
40.2
40
.3
53.2
49
.2
47.8
52
.7
108
85.3
17
0 28
.4
Zr
ppb
4.91
4.
32
3.89
4.
71
3 1.
41
1.19
2.
1 1.
59
1.83
4.
88
5.25
5.
51
5.31
5.
02
5.33
5.
4 4.
27
1.54
2.
18
0.19
4 AmFeO
x
A
l ppm
11
0 17
.6
27.5
23
37
.1
36
34.5
89
.1
70.4
44
.8
51.8
40
.9
34.8
32
.3
39.6
53
.2
52.6
34
.8
64.3
84
.7
0.15
4 A
s pp
b 16
4 28
3 20
5 17
3 12
1 85
.7
94.3
26
.7
7.96
7.
63
114
248
111
37.9
43
.2
64.9
72
.2
38.3
42
.4
18.2
<
= 0
.5
Ba
ppb
122
95.8
91
.2
93.4
11
3 88
.3
107
63.9
84
.4
85.5
89
.1
155
92.4
26
.9
25.2
26
.2
42.6
76
.9
108
89.8
0.
589
Co
ppb
8.05
2.
34
2.09
2.
63
3.7
4.64
9.
83
81.2
40
.7
38.2
7 7.
92
4.93
5.
02
3.71
4.
58
5.22
6.
74
19.8
36
.8
46.2
<
= 0
.05
Cr
ppb
94.5
73
.9
61.4
54
.6
55.9
52
.8
57.1
77
.2
91.8
93
.7
51.8
71
.3
51
37
31.1
35
.9
39
40.7
72
92
.7
2.44
C
u pp
b 63
.6
43.8
38
.6
33.1
69
.1
74.5
56
50
.5
26.1
27
35
.8
36.3
33
.3
16.9
14
.7
19.1
22
.2
44.6
19
.8
18.5
6.
51
Fe
ppm
36
1 32
3 25
4 19
8.5
289
171
118
170
111
109
167
228
123
23.8
22
.9
26.2
36
36
.3
77.8
12
0 0.
0807
G
a pp
b 12
10
.4
9.6
9.07
9.
95
9.09
8.
82
16
18.9
18
12
.5
14.8
11
.1
6.32
6.
56
6.68
8.
03
11
13.6
16
.2
<=
0.0
5 M
n pp
b 19
8 75
.2
69
86
102
120
275
3150
11
30
1270
13
5 12
2 12
1 51
.8
62.3
71
12
4 36
4 71
6 11
70
0.27
3 N
a pp
m
96.5
73
.8
83.6
76
.9
118
95.7
66
.9
81.7
83
.1
81.2
75
.3
51.5
71
.5
76.9
70
.6
91.9
10
3 42
.8
75.1
83
.6
3.71
- T
able
Con
tinue
d N
ext P
age
-
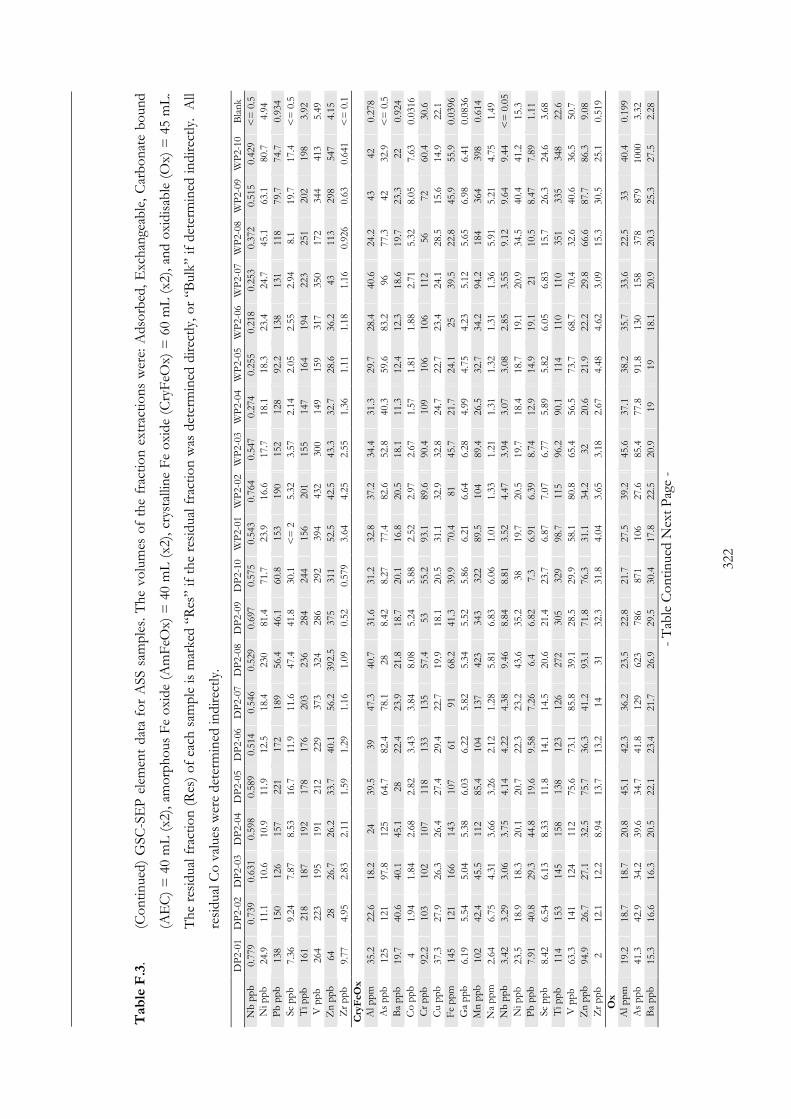
322
Table F.3
. (C
ontin
ued)
GSC
-SE
P e
lem
ent
data
for
ASS
sam
ples
. The
vol
umes
of
the
frac
tion
extr
actio
ns w
ere:
Ads
orbe
d, E
xcha
ngea
ble,
Car
bona
te b
ound
(AE
C)
= 4
0 m
L (
x2),
amor
phou
s F
e ox
ide
(Am
FeO
x) =
40
mL
(x2
), cr
ysta
lline
Fe
oxid
e (C
ryF
eOx)
= 6
0 m
L (
x2),
and
oxid
isab
le (
Ox)
= 4
5 m
L.
The
res
idua
l fra
ctio
n (R
es)
of e
ach
sam
ple
is m
arke
d “R
es”
if t
he r
esid
ual f
ract
ion
was
det
erm
ined
dir
ectly
, or
“Bul
k” if
det
erm
ined
indi
rect
ly.
All
resi
dual
Co
valu
es w
ere
dete
rmin
ed in
dire
ctly
.
D
P2-
01
DP
2-02
D
P2-
03
DP
2-04
D
P2-
05
DP
2-06
D
P2-
07
DP
2-08
D
P2-
09
DP
2-10
W
P2-
01
WP
2-02
W
P2-
03
WP
2-04
W
P2-
05
WP
2-06
W
P2-
07
WP
2-08
W
P2-
09
WP
2-10
B
lank
N
b pp
b 0.
779
0.73
9 0.
631
0.59
8 0.
589
0.51
4 0.
546
0.52
9 0.
697
0.57
5 0.
543
0.76
4 0.
547
0.27
4 0.
255
0.21
8 0.
253
0.37
2 0.
515
0.42
9 <
= 0
.5
Ni p
pb
24.9
11
.1
10.6
10
.9
11.9
12
.5
18.4
23
0 81
.4
71.7
23
.9
16.6
17
.7
18.1
18
.3
23.4
24
.7
45.1
63
.1
80.7
4.
94
Pb
ppb
138
150
126
157
221
172
189
56.4
46
.1
60.8
15
3 19
0 15
2 12
8 92
.2
138
131
118
79.7
74
.7
0.93
4 Sc
ppb
7.
36
9.24
7.
87
8.53
16
.7
11.9
11
.6
47.4
41
.8
30.1
<
= 2
5.
32
3.57
2.
14
2.05
2.
55
2.94
8.
1 19
.7
17.4
<
= 0
.5
Ti p
pb
161
218
187
192
178
176
203
236
284
244
156
201
155
147
164
194
223
251
202
198
3.92
V
ppb
26
4 22
3 19
5 19
1 21
2 22
9 37
3 32
4 28
6 29
2 39
4 43
2 30
0 14
9 15
9 31
7 35
0 17
2 34
4 41
3 5.
49
Zn
ppb
64
28
26.7
26
.2
33.7
40
.1
56.2
39
2.5
375
311
52.5
42
.5
43.3
32
.7
28.6
36
.2
43
113
298
547
4.15
Z
r pp
b 9.
77
4.95
2.
83
2.11
1.
59
1.29
1.
16
1.09
0.
52
0.57
9 3.
64
4.25
2.
55
1.36
1.
11
1.18
1.
16
0.92
6 0.
63
0.64
1 <
= 0
.1
CryFeO
x
A
l ppm
35
.2
22.6
18
.2
24
39.5
39
47
.3
40.7
31
.6
31.2
32
.8
37.2
34
.4
31.3
29
.7
28.4
40
.6
24.2
43
42
0.
278
As
ppb
125
121
97.8
12
5 64
.7
82.4
78
.1
28
8.42
8.
27
77.4
82
.6
52.8
40
.3
59.6
83
.2
96
77.3
42
32
.9
<=
0.5
B
a pp
b 19
.7
40.6
40
.1
45.1
28
22
.4
23.9
21
.8
18.7
20
.1
16.8
20
.5
18.1
11
.3
12.4
12
.3
18.6
19
.7
23.3
22
0.
924
Co
ppb
4 1.
94
1.84
2.
68
2.82
3.
43
3.84
8.
08
5.24
5.
88
2.52
2.
97
2.67
1.
57
1.81
1.
88
2.71
5.
32
8.05
7.
63
0.03
16
Cr
ppb
92.2
10
3 10
2 10
7 11
8 13
3 13
5 57
.4
53
55.2
93
.1
89.6
90
.4
109
106
106
112
56
72
60.4
30
.6
Cu
ppb
37.3
27
.9
26.3
26
.4
27.4
29
.4
22.7
19
.9
18.1
20
.5
31.1
32
.9
32.8
24
.7
22.7
23
.4
24.1
28
.5
15.6
14
.9
22.1
F
e pp
m
145
121
166
143
107
61
91
68.2
41
.3
39.9
70
.4
81
45.7
21
.7
24.1
25
39
.5
22.8
45
.9
55.9
0.
0396
G
a pp
b 6.
19
5.54
5.
04
5.38
6.
03
6.22
5.
82
5.34
5.
52
5.86
6.
21
6.64
6.
28
4.99
4.
75
4.23
5.
12
5.65
6.
98
6.41
0.
0836
M
n pp
b 10
2 42
.4
45.5
11
2 85
.4
104
137
423
343
322
89.5
10
4 89
.4
26.5
32
.7
34.2
94
.2
184
364
398
0.61
4 N
a pp
m
2.64
6.
75
4.31
3.
66
3.26
2.
12
1.28
5.
81
6.83
6.
06
1.01
1.
33
1.21
1.
31
1.32
1.
31
1.36
5.
91
5.21
4.
75
1.49
N
b pp
b 3.
42
3.29
3.
06
3.75
4.
14
4.22
4.
38
9.46
8.
84
8.81
3.
52
4.47
3.
94
3.07
3.
08
2.85
3.
55
9.12
9.
64
9.44
<
= 0
.05
Ni p
pb
23.5
18
.9
18.3
20
.1
20.7
22
.3
23.2
43
.6
35.2
38
19
.7
20.5
19
.7
18.4
18
.7
19.1
20
.9
34.5
40
.4
41.2
15
.3
Pb
ppb
7.91
40
.8
29.3
44
.8
19.6
9.
58
7.26
6.
4 6.
82
7.3
6.91
6.
39
8.74
12
.9
14.9
19
.1
21
10.5
8.
47
7.89
1.
11
Sc p
pb
8.42
6.
54
6.13
8.
33
11.8
14
.1
14.5
20
.6
21.4
23
.7
6.87
7.
07
6.77
5.
89
5.82
6.
05
6.83
15
.7
26.3
24
.6
3.68
T
i ppb
11
4 15
3 14
5 15
8 13
8 12
3 12
6 27
2 30
5 32
9 98
.7
115
96.2
90
.1
114
110
110
351
335
348
22.6
V
ppb
63
.3
141
124
112
75.6
73
.1
85.8
39
.1
28.5
29
.9
58.1
80
.8
65.4
56
.5
73.7
68
.7
70.4
32
.6
40.6
36
.5
50.7
Z
n pp
b 94
.9
26.7
27
.1
32.5
75
.7
36.3
41
.2
93.1
71
.8
76.3
31
.1
34.2
32
20
.6
21.9
22
.2
29.8
66
.6
87.7
86
.3
9.08
Z
r pp
b 2
12.1
12
.2
8.94
13
.7
13.2
14
31
32
.3
31.8
4.
04
3.65
3.
18
2.67
4.
48
4.62
3.
09
15.3
30
.5
25.1
0.
519
Ox
A
l ppm
19
.2
18.7
18
.7
20.8
45
.1
42.3
36
.2
23.5
22
.8
21.7
27
.5
39.2
45
.6
37.1
38
.2
35.7
33
.6
22.5
33
40
.4
0.19
9 A
s pp
b 41
.3
42.9
34
.2
39.6
34
.7
41.8
12
9 62
3 78
6 87
1 10
6 27
.6
85.4
77
.8
91.8
13
0 15
8 37
8 87
9 10
00
3.32
B
a pp
b 15
.3
16.6
16
.3
20.5
22
.1
23.4
21
.7
26.9
29
.5
30.4
17
.8
22.5
20
.9
19
19
18.1
20
.9
20.3
25
.3
27.5
2.
28
- T
able
Con
tinue
d N
ext P
age
-
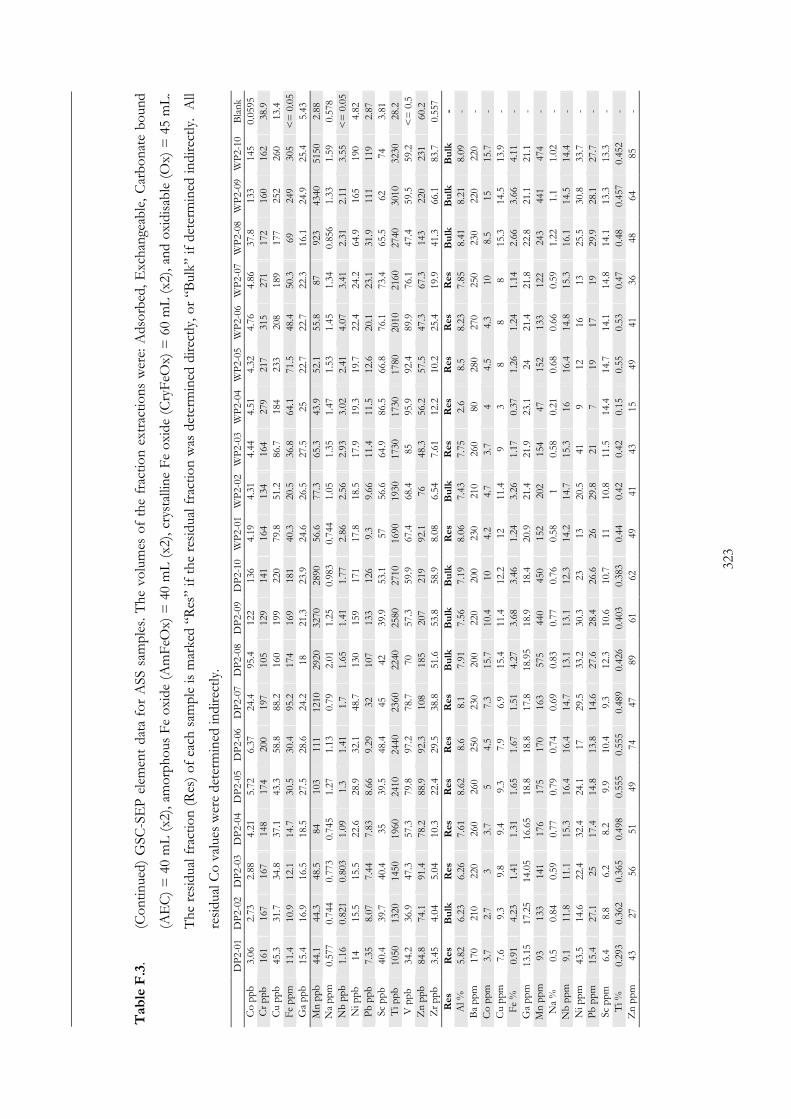
323
Table F.3
. (C
ontin
ued)
GSC
-SE
P e
lem
ent
data
for
ASS
sam
ples
. The
vol
umes
of
the
frac
tion
extr
actio
ns w
ere:
Ads
orbe
d, E
xcha
ngea
ble,
Car
bona
te b
ound
(AE
C)
= 4
0 m
L (
x2),
amor
phou
s F
e ox
ide
(Am
FeO
x) =
40
mL
(x2
), cr
ysta
lline
Fe
oxid
e (C
ryF
eOx)
= 6
0 m
L (
x2),
and
oxid
isab
le (
Ox)
= 4
5 m
L.
The
res
idua
l fra
ctio
n (R
es)
of e
ach
sam
ple
is m
arke
d “R
es”
if t
he r
esid
ual f
ract
ion
was
det
erm
ined
dir
ectly
, or
“Bul
k” if
det
erm
ined
indi
rect
ly.
All
resi
dual
Co
valu
es w
ere
dete
rmin
ed in
dire
ctly
.
D
P2-
01
DP
2-02
D
P2-
03
DP
2-04
D
P2-
05
DP
2-06
D
P2-
07
DP
2-08
D
P2-
09
DP
2-10
W
P2-
01
WP
2-02
W
P2-
03
WP
2-04
W
P2-
05
WP
2-06
W
P2-
07
WP
2-08
W
P2-
09
WP
2-10
B
lank
C
o pp
b 3.
06
2.73
2.
88
4.21
5.
72
6.37
24
.4
95.4
12
2 13
6 4.
19
4.31
4.
44
4.51
4.
32
4.76
4.
86
37.8
13
3 14
5 0.
0595
C
r pp
b 16
1 16
7 16
7 14
8 17
4 20
0 19
7 10
5 12
9 14
1 16
4 13
4 16
4 27
9 21
7 31
5 27
1 17
2 16
0 16
2 38
.9
Cu
ppb
45.3
31
.7
34.8
37
.1
43.3
58
.8
88.2
16
0 19
9 22
0 79
.8
51.2
86
.7
184
233
208
189
177
252
260
13.4
F
e pp
m
11.4
10
.9
12.1
14
.7
30.5
30
.4
95.2
17
4 16
9 18
1 40
.3
20.5
36
.8
64.1
71
.5
48.4
50
.3
69
249
305
<=
0.0
5 G
a pp
b 15
.4
16.9
16
.5
18.5
27
.5
28.6
24
.2
18
21.3
23
.9
24.6
26
.5
27.5
25
22
.7
22.7
22
.3
16.1
24
.9
25.4
5.
43
Mn
ppb
44.1
44
.3
48.5
84
10
3 11
1 12
10
2920
32
70
2890
56
.6
77.3
65
.3
43.9
52
.1
55.8
87
92
3 43
40
5150
2.
88
Na
ppm
0.
577
0.74
4 0.
773
0.74
5 1.
27
1.13
0.
79
2.01
1.
25
0.98
3 0.
744
1.05
1.
35
1.47
1.
53
1.45
1.
34
0.85
6 1.
33
1.59
0.
578
Nb
ppb
1.16
0.
821
0.80
3 1.
09
1.3
1.41
1.
7 1.
65
1.41
1.
77
2.86
2.
56
2.93
3.
02
2.41
4.
07
3.41
2.
31
2.11
3.
55
<=
0.0
5 N
i ppb
14
15
.5
15.5
22
.6
28.9
32
.1
48.7
13
0 15
9 17
1 17
.8
18.5
17
.9
19.3
19
.7
22.4
24
.2
64.9
16
5 19
0 4.
82
Pb
ppb
7.35
8.
07
7.44
7.
83
8.66
9.
29
32
107
133
126
9.3
9.66
11
.4
11.5
12
.6
20.1
23
.1
31.9
11
1 11
9 2.
87
Sc p
pb
40.4
39
.7
40.4
35
39
.5
48.4
45
42
39
.9
53.1
57
56
.6
64.9
86
.5
66.8
76
.1
73.4
65
.5
62
74
3.81
T
i ppb
10
50
1320
14
50
1960
24
10
2440
23
60
2240
25
80
2710
16
90
1930
17
30
1730
17
80
2010
21
60
2740
30
10
3230
28
.2
V p
pb
34.2
36
.9
47.3
57
.3
79.8
97
.2
78.7
70
57
.3
59.9
67
.4
68.4
85
95
.9
92.4
89
.9
76.1
47
.4
59.5
59
.2
<=
0.5
Z
n pp
b 84
.8
74.1
91
.4
78.2
88
.9
92.3
10
8 18
5 20
7 21
9 92
.1
76
48.3
56
.2
57.5
47
.3
67.3
14
3 22
0 23
1 60
.2
Zr
ppb
3.45
4.
04
5.04
10
.3
22.4
29
.5
38.8
51
.6
53.8
58
.9
8.08
6.
54
7.61
12
.2
10.2
25
.4
19.9
41
.3
66.1
83
.7
0.55
7 Res
Res
Bulk
Res
Res
Res
Res
Res
Bulk
Bulk
Bulk
Res
Bulk
Res
Res
Res
Res
Res
Bulk
Bulk
Bulk
- A
l %
5.82
6.
23
6.26
7.
61
8.62
8.
6 8.
1 7.
91
7.56
7.
19
8.06
7.
43
7.75
2.
6 8.
5 8.
23
7.85
8.
41
8.21
8.
09
- B
a pp
m
170
210
220
260
260
250
230
200
220
200
230
210
260
80
280
270
250
230
220
220
- C
o pp
m
3.7
2.7
3 3.
7 5
4.5
7.3
15.7
10
.4
10
4.2
4.7
3.7
4 4.
5 4.
3 10
8.
5 15
15
.7
- C
u pp
m
7.6
9.3
9.8
9.4
9.3
7.9
6.9
15.4
11
.4
12.2
12
11
.4
9 3
8 8
8 15
.3
14.5
13
.9
- F
e %
0.
91
4.23
1.
41
1.31
1.
65
1.67
1.
51
4.27
3.
68
3.46
1.
24
3.26
1.
17
0.37
1.
26
1.24
1.
14
2.66
3.
66
4.11
-
Ga
ppm
13
.15
17.2
5 14
.05
16.6
5 18
.8
18.8
17
.8
18.9
5 18
.9
18.4
20
.9
21.4
21
.9
23.1
24
21
.4
21.8
22
.8
21.1
21
.1
- M
n pp
m
93
133
141
176
175
170
163
575
440
450
152
202
154
47
152
133
122
243
441
474
- N
a %
0.
5 0.
84
0.59
0.
77
0.79
0.
74
0.69
0.
83
0.77
0.
76
0.58
1
0.58
0.
21
0.68
0.
66
0.59
1.
22
1.1
1.02
-
Nb
ppm
9.
1 11
.8
11.1
15
.3
16.4
16
.4
14.7
13
.1
13.1
12
.3
14.2
14
.7
15.3
16
16
.4
14.8
15
.3
16.1
14
.5
14.4
-
Ni p
pm
43.5
14
.6
22.4
32
.4
24.1
17
29
.5
33.2
30
.3
23
13
20.5
41
9
12
16
13
25.5
30
.8
33.7
-
Pb
ppm
15
.4
27.1
25
17
.4
14.8
13
.8
14.6
27
.6
28.4
26
.6
26
29.8
21
7
19
17
19
29.9
28
.1
27.7
-
Sc p
pm
6.4
8.8
6.2
8.2
9.9
10.4
9.
3 12
.3
10.6
10
.7
11
10.8
11
.5
14.4
14
.7
14.1
14
.8
14.1
13
.3
13.3
-
Ti %
0.
293
0.36
2 0.
365
0.49
8 0.
555
0.55
5 0.
489
0.42
6 0.
403
0.38
3 0.
44
0.42
0.
42
0.15
0.
55
0.53
0.
47
0.48
0.
457
0.45
2 -
Zn
ppm
43
27
56
51
49
74
47
89
61
62
49
41
43
15
49
41
36
48
64
85
-

324
Table F.4
. A
ugm
ente
d M
BC
R-S
EP
ele
men
t da
ta f
or A
SS s
ampl
es.
The
vol
umes
of
the
frac
tion
extr
actio
ns w
ere:
wat
er-s
olub
le (
WS)
= 4
0 m
L,
Aci
d
Ext
ract
able
(A
E)
= 4
0 m
L,
redu
cibl
e (R
ed)
= 4
0 m
L,
and
oxid
isab
le (
Ox)
=
50
mL
. A
ll M
BC
R-S
EP
res
idua
l fr
actio
ns (
Res
) w
ere
dete
rmin
ed
dire
ctly
. D
ry m
ass
is in
gra
ms.
D
P2-
01
DP
2-02
D
P2-
03
DP
2-04
D
P2-
05
DP
2-06
D
P2-
07
DP
2-08
D
P2-
09
DP
2-10
W
P2-
01
WP
2-02
W
P2-
03
WP
2-04
W
P2-
05
WP
2-06
W
P2-
07
WP
2-08
W
P2-
09
WP
2-10
B
lank
Dry M
ass
0.84
99
0.83
95
0.78
55
0.80
08
0.75
54
0.72
8 0.
7637
0.
79
0.79
0.
79
0.74
72
0.76
0.
7603
0.
7386
0.
7051
0.
6994
0.
6793
0.
73
0.73
0.
73
WS
Al p
pm
2.64
1.
66
2.04
1.
23
3.69
2.
98
0.29
2 2.
07
10.4
1.
98
12
8.6
10.5
23
.8
25.6
22
.6
28.4
31
.5
9.49
3.
93
0.11
3 A
s pp
b <
= 0
.5
3.32
2.
58
1.84
2.
7 2.
93
4.55
1.
3 0.
89
0.85
5 10
.4
15.5
19
.5
31.6
34
.6
50.6
52
.5
50.1
11
.4
3.65
0.
863
Ba
ppb
0.24
6 1.
08
1.15
0.
832
1.28
1.
2 0.
439
1.29
5.
61
1.32
11
.2
18.6
19
.8
6.98
5.
35
4.55
7.
64
29.1
7.
63
2.03
0.
493
Co
ppb
4.08
0.
913
0.82
4 0.
272
0.50
5 0.
327
4.87
51
.8
5.62
0.
653
1.03
0.
515
2.52
1.
7 2.
3 1.
95
2.63
13
.8
9.29
4.
56
0.00
66
Cr
ppb
5.96
6.
73
5.78
0.
636
2.76
<
= 0
.5
<=
0.5
1.
22
29.5
5.
8 5.
98
9.37
29
.3
9.87
9.
46
8.67
10
.4
60.3
31
.9
8.44
<
= 0
.5
Cu
ppb
2.45
3.
44
3.22
1.
47
4.43
2.
4 0.
896
1.55
2.
82
1.41
3.
08
4.25
5.
55
2.16
2.
3 2.
86
3.74
10
.3
2.59
1.
57
5.01
F
e pp
m
0.11
8 2.
86
2.6
1.93
3.
57
2.51
0.
937
0.36
3 9.
7 1.
47
14.5
29
13
.4
10.1
10
.1
9.53
12
.4
18.1
7.
05
2.95
<
= 0
.05
Ga
ppb
0.96
1 1.
14
1.05
0.
163
0.42
9 0.
213
<=
0.0
5 0.
0813
1.
95
0.68
4 0.
996
0.90
2 4.
47
0.96
7 0.
927
0.77
8 <
= 0
.05
2.08
1.
45
0.8
<=
0.0
5 M
n pp
b 27
4 68
.2
61.3
17
16
.6
14.1
28
.7
1500
14
7 38
.2
13.4
13
.1
33.4
21
.1
20.6
17
.7
27.9
10
4 48
.9
30.5
<
= 0
.5
Na
ppm
22
3 91
10
5 12
5 13
2 13
9 12
0 61
.8
50.7
55
.2
253
211
114
215
242
245
238
120
109
97.9
1.
35
Nb
ppb
<=
0.0
5 0.
0251
0.
0329
<
= 0
.05
<=
0.0
5 <
= 0
.05
<=
0.0
5 0.
104
<=
0.0
5 <
= 0
.05
<=
0.0
5 <
= 0
.05
0.14
7 0.
118
0.12
0.
119
0.09
09
<=
0.0
5 <
= 0
.05
<=
0.0
5 <
= 0
.05
Ni p
pb
7.57
1.
44
1.69
0.
67
0.82
1 0.
582
2.06
66
.2
9.19
1.
36
1.95
1.
33
7.14
3.
36
3.79
3.
49
4.28
20
8.
5 4.
65
<=
0.5
P
b pp
b 0.
371
0.46
0.
313
0.23
2 0.
931
1.12
0.
146
0.22
4 1.
83
0.64
8.
39
13.5
13
.3
11.9
8.
24
7.85
9.
91
21.3
2.
6 0.
748
0.24
Sc
ppb
1.
39
1.52
1.
68
0.21
9 1.
38
0.64
<
= 0
.5
1.47
11
.4
2.77
1.
1 2.
06
9.31
1.
96
1.98
2.
02
2.47
18
.7
8.22
3.
59
<=
0.5
T
i ppb
<
= 0
.1
3.98
15
.2
2.35
8
4.38
1.
12
4.49
7.
25
9.25
4.
4 5.
63
166
7.07
19
.8
7.72
7.
75
8.51
4.
75
5.7
<=
0.1
V
ppb
4.
29
7.67
5.
79
<=
0.5
10
.2
<=
0.5
<
= 0
.5
0.46
5 30
11
.3
17.5
18
.5
59
65.3
84
.9
170
195
196
54.5
17
.9
<=
0.5
Z
n pp
b 31
9.
91
9.34
5.
37
5.43
6.
25
5.01
27
22
.5
3.33
7.
51
6.73
21
.4
12.9
14
.4
11.1
14
61
.8
19.4
8.
61
5.68
Z
r pp
b 0.
297
0.13
1 0.
164
0.14
2 0.
375
0.24
5 <
= 0
.1
0.12
2 <
= 0
.1
0.22
3 0.
862
1.13
5.
85
1.36
1.
38
1.49
1.
2 0.
403
<=
0.1
1.
11
<=
0.1
AE
0.
04
Al p
pm
14.6
0.
853
0.82
6 0.
981
1.24
0.
392
0.55
2 4.
07
0.94
6 1.
18
3.15
2.
06
1.73
1.
8 1.
96
2.08
1.
58
1.31
0.
412
2.02
0.
108
As
ppb
1.32
1.
26
1.23
1.
28
1.72
3.
47
5.52
2.
96
3.77
3.
53
35.2
37
.6
39.2
31
33
.8
49.3
44
.5
54.6
19
.9
14.9
<
= 0
.5
Ba
ppb
0.26
9 0.
371
0.50
8 0.
525
0.77
1 1.
1 1.
32
1.88
4.
4 5.
46
9.49
21
.6
7.44
4.
32
3.24
3.
07
2.9
4.87
2.
78
3.05
0.
535
Co
ppb
1.15
0.
649
0.52
0.
266
0.27
1 0.
303
12.5
66
.7
16
15.9
5.
05
0.85
9 1.
05
1.87
3.
27
3.92
2.
39
23.3
64
.3
95.8
<
= 0
.1
Cr
ppb
<=
0.5
<
= 0
.5
<=
0.5
<
= 0
.5
<=
0.5
<
= 0
.1
<=
0.1
6.
58
5.81
5.
45
<=
0.5
<
= 0
.5
<=
0.5
<
= 0
.5
<=
0.5
<
= 0
.5
<=
0.5
8.
48
6.02
7.
26
<=
0.5
C
u pp
b 4.
62
4.32
4.
04
3.16
5.
11
6.83
5.
56
1.1
1.22
1
1.57
2.
98
1.56
1.
05
0.97
3 0.
918
0.98
1 2.
66
0.98
5 1.
12
5.3
Fe
ppm
0.
392
0.67
7 0.
875
1.19
1.
5 2.
09
9.28
27
.1
7.27
4.
87
9.68
22
19
.2
0.65
3 1.
47
2.25
1.
6 2.
21
3.13
6.
4 <
= 0
.05
Ga
ppb
<=
0.0
5 <
= 0
.05
<=
0.0
5 <
= 0
.05
<=
0.0
5 <
= 0
.5
<=
0.5
0.
295
0.16
0.
0887
<
= 0
.05
<=
0.0
5 <
= 0
.05
<=
0.0
5 <
= 0
.05
<=
0.0
5 <
= 0
.05
0.31
7 0.
0657
0.
206
<=
0.0
5 M
n pp
b 35
.9
35.8
30
.3
18.8
19
.1
28.1
63
24
00
371
971
65.6
67
.9
56.1
45
34
.3
41.4
32
.1
62.4
17
3 23
9 <
= 0
.1
- T
able
Con
tinue
d N
ext P
age
-

325
Table F.4
. (C
ontin
ued)
Aug
men
ted
MB
CR
-SE
P e
lem
ent
data
for
ASS
sam
ples
. T
he v
olum
es o
f th
e fr
actio
n ex
trac
tions
wer
e: w
ater
-sol
uble
(W
S) =
40
mL
,
Aci
d E
xtra
ctab
le (
AE
) =
40
mL
, red
ucib
le (R
ed)
= 4
0 m
L, a
nd o
xidi
sabl
e (O
x) =
50
mL
. A
ll M
BC
R-S
EP
res
idua
l fra
ctio
ns (R
es)
wer
e de
term
ined
dire
ctly
. D
ry m
ass
is in
gra
ms.
D
P2-
01
DP
2-02
D
P2-
03
DP
2-04
D
P2-
05
DP
2-06
D
P2-
07
DP
2-08
D
P2-
09
DP
2-10
W
P2-
01
WP
2-02
W
P2-
03
WP
2-04
W
P2-
05
WP
2-06
W
P2-
07
WP
2-08
W
P2-
09
WP
2-10
B
lank
N
a pp
m
11.2
6.
62
7.92
12
.7
17.3
18
.3
12.6
2.
99
5 4.
79
34.5
33
33
.3
37.1
39
.1
51.2
42
.9
15.4
14
.2
12.2
0.
169
Nb
ppb
<=
0.0
5 <
= 0
.05
<=
0.0
5 <
= 0
.05
<=
0.0
5 <
= 0
.5
<=
0.5
<
= 0
.05
<=
0.0
5 <
= 0
.05
<=
0.0
5 <
= 0
.05
<=
0.0
5 <
= 0
.05
<=
0.0
5 <
= 0
.05
<=
0.0
5 <
= 0
.05
<=
0.0
5 <
= 0
.05
<=
0.0
5 N
i ppb
4.
03
1.32
1.
32
0.78
3 0.
62
0.87
3 6.
81
70.8
26
.9
13.6
6.
38
3.39
3.
83
2.32
3.
25
3.75
2.
75
16.8
55
.4
120
<=
0.1
P
b pp
b <
= 0
.05
<=
0.0
5 0.
207
0.11
9 0.
328
0.50
4 1.
26
2.48
1.
24
1.18
2.
64
3.34
2.
02
3.84
2.
72
2.88
2.
98
6.27
1.
68
2.39
0.
152
Sc p
pb
<=
0.5
<
= 0
.5
<=
0.5
<
= 0
.5
<=
0.5
<
= 0
.5
<=
0.5
2.
32
2.12
2.
38
<=
0.5
<
= 0
.5
0.16
9 0.
103
<=
0.5
<
= 0
.5
<=
0.5
2.
4 2.
14
2.49
<
= 0
.5
Ti p
pb
1.81
3.
06
9.34
2.
1 39
.8
<=
0.5
<
= 0
.5
1.64
9.
36
2.99
3.
08
2.05
2.
11
3.37
4.
27
3.93
3.
66
12.9
3.
67
7.5
<=
0.5
V
ppb
<
= 0
.5
<=
0.5
<
= 0
.5
<=
0.5
<
= 0
.5
<=
0.5
25
.2
30.1
65
.8
35.3
<
= 0
.5
<=
0.5
<
= 0
.5
<=
0.5
<
= 0
.5
<=
0.5
<
= 0
.5
39.8
10
2 12
7 <
= 0
.5
Zn
ppb
13.5
7.
56
7.47
6.
27
5.05
32
.8
38.3
38
3 67
.1
50.5
21
.9
15.1
14
.8
14.3
14
.4
16.1
12
.6
30
83.2
31
3 5.
43
Zr
ppb
0.61
8 <
= 0
.1
<=
0.1
<
= 0
1 <
= 0
.1
<=
0.5
<
= 0
.5
<=
0.1
<
= 0
.1
<=
0.1
0.
377
0.35
9 0.
306
0.60
9 0.
604
1.14
1.
09
0.59
5 0.
156
<=
0.1
<
= 0
.1
Red
0.
04
Al p
pm
63.7
22
.6
10.8
7.
09
14.9
17
.7
20.6
55
.1
12
14.1
25
.3
18
13.8
22
.4
16.8
31
.4
27.9
15
.6
12.1
32
.8
0.12
7 A
s pp
b 10
.5
20
15.4
10
.3
10.7
12
.4
23.4
11
.9
4.98
10
65
.3
121
84.2
16
.4
20
27.8
24
44
64
.8
39
1.5
Ba
ppb
22.7
12
.7
10.4
8
17.6
25
.6
30.6
12
.8
17.3
20
37
.1
86.3
44
.4
13.1
8.
74
9.55
9.
82
17.8
34
.8
16.1
0.
767
Co
ppb
1.18
0.
624
0.58
8 0.
55
0.60
6 0.
551
11.2
35
.6
18.6
13
.4
2.68
0.
515
1.35
1.
62
2.49
3.
94
2.26
19
.3
62.8
52
.9
<=
0.1
C
r pp
b 27
.1
23.3
20
.3
17.8
14
.6
14.9
14
.9
47.1
40
.3
39.4
18
.1
35.1
39
.3
10.6
9.
73
11.3
10
.6
22.3
27
.1
36.5
3.
44
Cu
ppb
18.9
19
.8
18.4
16
34
.8
34.3
22
.8
9.26
4.
43
6.02
7.
36
7.01
10
.3
2.67
1.
98
2.16
2.
12
8.56
2.
2 1.
43
4.55
F
e pp
m
142
81.9
70
.3
62.3
25
.7
24.2
29
.9
50.5
29
.3
33.5
12
7 17
4 12
1 16
.4
7.03
12
.4
11.3
10
21
19
.1
<=
0.0
5 G
a pp
b 3.
04
2.7
2.78
2.
62
2 1.
74
1.75
3.
08
5.04
5.
51
3.27
4.
49
4.22
1.
3 1.
26
1.52
1.
4 2.
03
3.35
5.
91
<=
0.5
M
n pp
b 19
.7
20.8
23
.8
31.7
34
.8
36.5
55
.8
524
366
486
21.2
20
.2
35.5
16
.7
13.9
18
16
.5
38.2
18
7 21
6 <
= 0
.1
Na
ppm
1.
93
0.62
2 0.
409
0.54
8 0.
585
0.32
9 0.
218
0.39
3 0.
253
0.32
3 0.
414
0.16
7 0.
33
0.50
3 0.
393
0.39
7 0.
566
0.20
7 0.
377
0.39
<
= 0
.5
Nb
ppb
0.18
3 0.
26
0.22
8 0.
234
0.20
3 0.
156
0.17
2 0.
265
0.41
1 0.
339
0.20
1 0.
388
0.42
3 0.
0912
0.
0792
0.
0739
0.
0581
0.
124
0.21
0.
258
<=
0.0
5 N
i ppb
16
.2
12.9
12
.6
12.6
12
.2
12.1
18
60
49
.9
33
17.8
12
.6
25
15.2
16
.6
20.5
17
.3
43.5
83
.7
97.6
10
.4
Pb
ppb
42.7
21
.7
16.1
17
.8
66.8
89
.5
126
68.5
37
.3
55.2
16
0 19
8 13
9 14
9 11
3 15
9 15
6 17
1 86
.2
85.3
0.
932
Sc p
pb
1.28
0.
909
0.67
2 0.
567
1.3
0.78
3 0.
655
7.42
4.
89
4.27
1.
18
2.33
3.
22
<=
0.5
<
= 0
.5
<=
0.5
<
= 0
.5
1.5
2.7
3.97
<
= 0
.5
Ti p
pb
62.1
14
0 11
3 11
8 14
5 10
6 98
.6
78.4
14
6 15
2 85
.5
156
101
88.9
90
.6
102
99
76.3
10
4 12
2 <
= 0
.5
V p
pb
67.5
32
.2
28.6
23
.6
57.5
91
16
8 33
4 25
7 35
7 39
0 42
0 27
9 88
10
6 24
6 20
8 24
4 36
6 60
0 4.
22
Zn
ppb
17.7
14
.5
15.4
16
.2
16.8
19
.5
20.9
38
7 18
7 14
2 21
.3
14.4
31
.7
18.9
19
.5
23.8
19
.3
45.1
20
1 54
4 6.
14
Zr
ppb
3.58
3.
18
1.65
1.
11
0.37
0.
257
0.15
1 0.
418
0.23
0.
251
2.49
3.
65
2.73
0.
185
<=
0.1
0.
145
<=
0.1
0.
314
0.27
5 0.
375
<=
0.1
Ox
Al p
pm
46
24.5
22
.5
34.7
38
.5
39.8
63
.6
131
70.7
83
.8
41
28.9
29
.6
37.2
29
.3
38.2
45
.9
48.3
75
.9
95.4
0.
238
As
ppb
2.19
3.
3 1.
66
2.07
5.
14
2.99
7.
21
0.80
3 1.
37
1.93
11
.9
7.68
32
.5
46.7
23
.9
86.3
73
.7
38.6
58
.4
50.6
<
= 0
.5
- T
able
Con
tinue
d N
ext P
age
-

326
Table F.4
. (C
ontin
ued)
Aug
men
ted
MB
CR
-SE
P e
lem
ent
data
for
ASS
sam
ples
. T
he v
olum
es o
f th
e fr
actio
n ex
trac
tions
wer
e: w
ater
-sol
uble
(W
S) =
40
mL
,
Aci
d E
xtra
ctab
le (
AE
) =
40
mL
, red
ucib
le (R
ed)
= 4
0 m
L, a
nd o
xidi
sabl
e (O
x) =
50
mL
. A
ll M
BC
R-S
EP
res
idua
l fra
ctio
ns (R
es)
wer
e de
term
ined
dire
ctly
. D
ry m
ass
is in
gra
ms.
D
P2-
01
DP
2-02
D
P2-
03
DP
2-04
D
P2-
05
DP
2-06
D
P2-
07
DP
2-08
D
P2-
09
DP
2-10
W
P2-
01
WP
2-02
W
P2-
03
WP
2-04
W
P2-
05
WP
2-06
W
P2-
07
WP
2-08
W
P2-
09
WP
2-10
B
lank
B
a pp
b 1.
23
1.7
1.55
2.
25
2.44
1.
86
4.88
5.
3 7.
89
5.83
26
.7
1.31
4.
11
13.2
10
.4
15.2
19
.1
17.9
7.
95
5.18
0.
824
Co
ppb
1.64
1.
16
1.21
1.
54
1.9
2.48
11
10
1 88
.7
85
2.42
1.
44
3.06
3.
12
3.53
8.
92
5.02
31
.1
102
104
<=
0.1
C
r pp
b 16
9 16
6 15
9 20
7 27
5 29
2 31
2 12
9 10
4 10
3 23
1 17
8 25
4 26
3 24
0 34
2 26
7 14
7 14
0 14
3 3.
3 C
u pp
b 20
.9
22.4
21
.7
18.6
28
.7
29.8
34
.3
82.8
79
78
45
.6
29.4
56
10
1 15
4 16
4 11
3 14
0 97
.1
91.9
8.
72
Fe
ppm
78
.3
28.6
20
.7
31.6
25
.6
14.6
65
.4
202
191
204
65.4
43
32
.8
41.1
29
31
.4
36.3
95
.9
208
250
0.27
G
a pp
b 0.
733
0.84
6 0.
14
0.15
0.
791
0.12
0.
822
1.53
2.
3 2.
17
1.88
1.
05
2.84
3.
55
2.06
5.
86
3.68
3.
23
3.87
3.
83
<=
0.0
5 M
n pp
b 20
.5
11.7
12
.8
17.9
25
.6
39
914
8870
68
80
8180
46
.2
20.4
40
22
.2
27.7
63
87
.1
1720
47
80
5390
1.
47
Na
ppm
7.
74
5.52
5.
37
5.87
5.
67
4.98
3.
3 3.
57
3.23
3.
43
1.95
1.
95
1.53
1.
77
1.71
1.
37
1.71
2.
41
2.32
1.
97
<=
0.5
N
b pp
b 0.
112
0.01
64
<=
0.0
5 <
= 0
.05
<=
0.5
<
= 0
.5
<=
0.0
5 0.
0596
0.
0586
<
= 0
.05
<=
0.0
5 <
= 0
.05
<=
0.0
5 <
= 0
.05
<=
0.0
5 <
= 0
.05
<=
0.0
5 <
= 0
.05
<=
0.0
5 0.
0529
<
= 0
.05
Ni p
pb
5.14
4.
54
4.51
6.
37
8.5
9.78
20
.5
171
120
114
6.62
4.
13
7.34
10
.4
12.1
22
.3
19.4
46
.4
133
148
1.46
P
b pp
b 0.
949
1.3
1.17
1.
68
2.56
1.
62
5.22
6.
8 5.
53
4.37
3.
56
1.53
3.
76
27.1
25
66
.7
67.6
32
.2
7.41
4.
47
0.69
9 Sc
ppb
24
.5
21.2
23
.4
17.7
30
30
.8
32.8
41
.8
34.1
36
.4
33
25
41.5
70
.2
57.6
65
56
.5
42.8
45
.2
44.6
1.
2 T
i ppb
10
4 84
.9
68.7
55
.1
38.7
31
.6
40.3
32
.7
38.7
34
.3
220
63
78.5
10
3 93
.9
151
112
76
60.2
64
.6
4.53
V
ppb
<
= 0
.5
<=
0.5
<
= 0
.5
<=
0.5
<
= 0
.5
<=
0.5
<
= 0
.5
2.86
4.
83
4.34
9.
4 <
= 0
.5
47.4
60
.6
27.9
14
9 95
42
.4
36
38.7
<
= 0
.5
Zn
ppb
19.5
19
.2
18.8
24
.3
22.6
22
.8
35.5
21
9 16
9 16
0 30
.5
22
43.4
47
.8
40.9
47
.3
55.7
11
0 21
6 23
4 16
.9
Zr
ppb
1.15
<
= 0
.5
<=
0.1
<
= 0
.1
<=
0.1
<
= 0
.1
<=
0.1
1.
03
0.69
4 0.
493
<=
0.1
<
= 0
.1
0.59
0.
604
0.58
2 1.
99
1.41
0.
283
0.36
6 0.
484
0.12
2 Res
Res
Res
Res
Res
Res
Res
Res
Res
Res
Res
Res
Res
Res
Res
Res
Res
Res
Res
Res
Res
Res
A
l %
4.87
5.
42
4.94
6.
28
7.42
7.
01
7.44
7.
69
6.68
6.
8 7.
39
7.01
6.
7 7.
86
7.82
7.
46
7.05
6.
58
7.76
7.
15
- A
s pp
m
19.3
27
.3
23.2
29
.1
18.9
19
.3
13.8
18
.5
16
18.4
19
.4
21.2
9.
9 9.
6 15
.7
17.8
18
.9
18
20
21.8
-
Ba
ppm
16
0 21
0 19
0 22
0 25
0 23
0 25
0 23
0 23
0 21
0 23
0 22
0 20
0 26
0 27
0 25
0 25
0 24
0 24
0 22
0 -
Co
ppm
2.
1 1.
8 1.
8 2.
7 3.
3 3.
1 3.
6 5.
2 3.
2 3.
6 2.
9 2.
7 2.
6 2.
7 3
2.9
3 3.
4 4.
3 4.
4 -
Cr
ppm
24
29
35
36
41
41
41
47
31
33
30
30
29
32
34
32
33
34
38
39
-
Cu
ppm
8.
8 7.
2 6.
6 8.
6 9.
9 10
.5
9.8
11.6
8.
6 9
9.1
10.1
24
10
.7
11.5
12
11
.5
11.8
11
.2
10.5
-
Fe
%
3.5
4.01
3.
38
3.79
2.
86
2.44
2.
42
3.72
2.
29
2.4
1.86
1.
83
1.35
1.
36
1.52
1.
42
1.43
1.
5 2.
41
2.54
-
Ga
ppm
12
.15
13.9
5 12
.65
16.5
19
.6
18.1
5 19
.05
19.6
5 16
.15
17.2
20
.7
19.4
5 18
.35
22.2
21
.6
20.2
18
.85
17.7
2 20
19
-
Mn
ppm
98
10
8 92
13
7 15
1 14
7 16
3 18
5 15
0 15
1 15
1 14
2 12
9 14
4 14
2 13
2 13
5 15
4 17
2 15
8 -
Mo
ppm
8.
48
11.8
9.
72
7.63
7.
29
7.14
10
3.
68
3.46
4.
05
19.5
18
.5
19
32.7
43
41
.6
27.2
13
.56
10.1
12
.1
- N
a %
0.
42
0.56
0.
48
0.61
0.
66
0.59
0.
59
0.53
0.
51
0.51
0.
51
0.5
0.49
0.
59
0.57
0.
55
0.53
0.
54
0.55
0.
49
- N
b pp
m
8.3
9.7
8.6
12.2
15
.2
13.5
13
.8
13.6
10
.8
11.8
15
.5
14.2
13
.4
18.1
17
.5
16.7
16
.4
14.6
14
.7
14.1
-
Ni p
pm
7.9
8.4
11.3
11
.4
13.4
14
.9
14.5
18
.2
12.4
13
.3
11.1
11
.1
11.3
12
.8
13
12.5
13
.2
14.4
15
.5
16.1
-
Pb
ppm
16
.7
22.7
19
.2
25
20.7
16
.8
18.4
19
.6
22.9
21
.7
18.2
17
.6
29.9
17
.1
16.2
14
.2
13.6
15
.6
21.8
19
.9
- Sc
ppm
5.
3 5.
9 5.
5 8.
3 10
.5
9.9
9.9
11.2
7.
3 8.
3 8.
2 7.
9 7.
4 9.
3 9.
7 9.
4 9.
1 8.
8 10
.3
10
-
- T
able
Con
tinue
d N
ext P
age
-
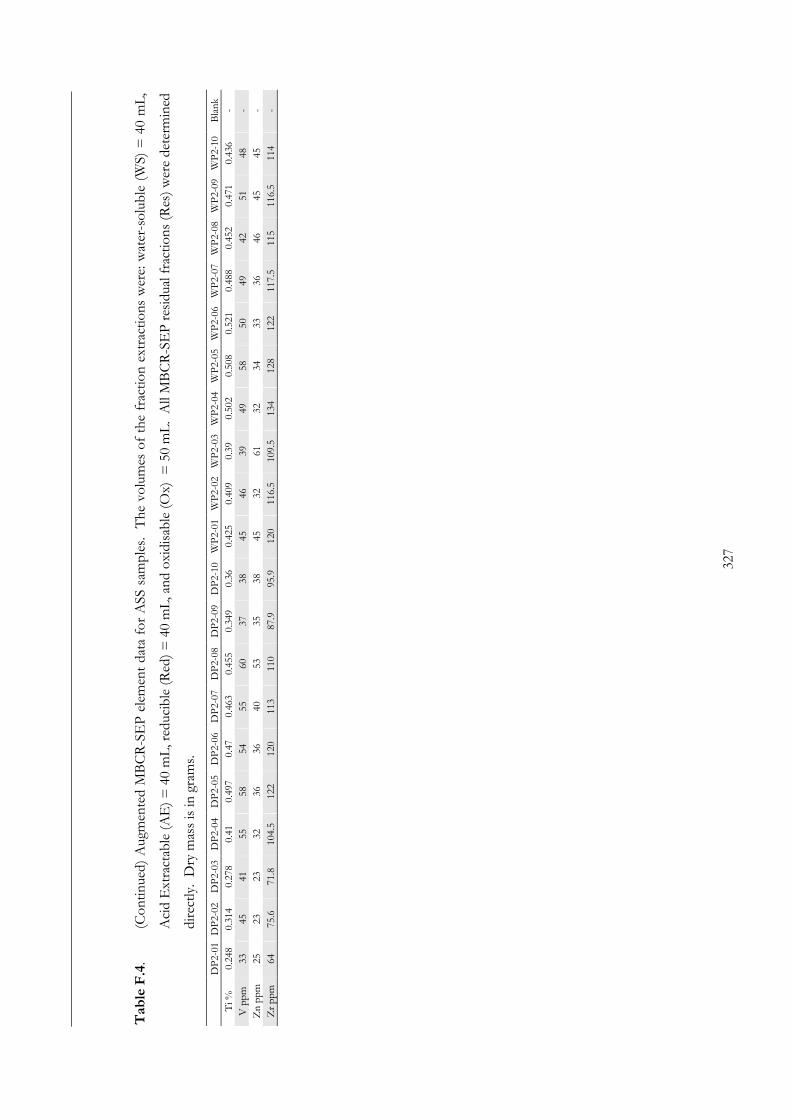
327
Table F.4
. (C
ontin
ued)
Aug
men
ted
MB
CR
-SE
P e
lem
ent
data
for
ASS
sam
ples
. T
he v
olum
es o
f th
e fr
actio
n ex
trac
tions
wer
e: w
ater
-sol
uble
(W
S) =
40
mL
,
Aci
d E
xtra
ctab
le (
AE
) =
40
mL
, red
ucib
le (R
ed)
= 4
0 m
L, a
nd o
xidi
sabl
e (O
x) =
50
mL
. A
ll M
BC
R-S
EP
res
idua
l fra
ctio
ns (R
es)
wer
e de
term
ined
dire
ctly
. D
ry m
ass
is in
gra
ms.
D
P2-
01
DP
2-02
D
P2-
03
DP
2-04
D
P2-
05
DP
2-06
D
P2-
07
DP
2-08
D
P2-
09
DP
2-10
W
P2-
01
WP
2-02
W
P2-
03
WP
2-04
W
P2-
05
WP
2-06
W
P2-
07
WP
2-08
W
P2-
09
WP
2-10
B
lank
T
i %
0.24
8 0.
314
0.27
8 0.
41
0.49
7 0.
47
0.46
3 0.
455
0.34
9 0.
36
0.42
5 0.
409
0.39
0.
502
0.50
8 0.
521
0.48
8 0.
452
0.47
1 0.
436
- V
ppm
33
45
41
55
58
54
55
60
37
38
45
46
39
49
58
50
49
42
51
48
-
Zn
ppm
25
23
23
32
36
36
40
53
35
38
45
32
61
32
34
33
36
46
45
45
-
Zr
ppm
64
75
.6
71.8
10
4.5
122
120
113
110
87.9
95
.9
120
116.
5 10
9.5
134
128
122
117.
5 11
5 11
6.5
114
-

328
AP
PE
ND
IX G
. XR
F A
ND
SE
QU
EN
TIA
L E
XT
RA
CT
ION
DA
TA
FO
R D
RA
IN S
ED
IME
NT
S
Table G
.1.
All
XR
F r
esul
ts f
rom
dra
in s
edim
ent
sam
ples
. D
ata
are
pres
ente
d as
rep
orte
d.
U
DL
L
DL
F
DS0
1 F
DS0
2 F
DS0
3 F
DS0
4 F
DS0
5 F
DS0
6 F
DS0
7A
FD
S07B
FD
S08A
FD
S08B
FD
S9A
F
DS9
B F
DS1
0A F
DS1
0B F
DS1
1A F
DS1
1B
FD
S12
SiO
2%
- -
23.8
0 14
.64
47.3
9 27
.61
63.7
1 15
.68
22.8
5 73
.03
20.3
5 17
.34
25.5
9 39
.36
16.0
1 14
.45
19.6
7 39
.75
54.2
8 T
iO2%
-
- 0.
18
0.15
0.
25
0.34
0.
10
0.16
0.
10
0.25
0.
30
0.25
0.
34
0.52
0.
20
0.21
0.
23
0.56
0.
86
Al 2O
3%
- -
7.29
5.
52
7.88
8.
75
4.86
4.
44
3.48
8.
64
15.5
4 13
.09
16.8
9 18
.05
10.2
3 11
.20
4.72
10
.21
16.0
6 F
e 2O
3T%
-
- 25
.76
38.2
1 15
.83
22.8
6 13
.93
44.3
2 28
.32
4.38
21
.01
27.5
4 17
.68
7.19
26
.48
24.0
2 26
.39
14.6
7 5.
53
MnO
%
- -
BD
B
D
BD
B
D
BD
B
D
BD
0.
01
0.01
0.
01
0.02
0.
01
0.01
B
D
0.05
0.
01
0.02
M
gO%
-
- 0.
29
0.33
0.
37
0.46
0.
25
0.25
1.
05
0.30
0.
85
0.76
0.
70
0.77
1.
15
0.76
1.
81
1.12
0.
53
CaO
%
- -
0.49
0.
45
0.38
0.
51
0.30
0.
38
0.59
0.
19
0.40
0.
41
0.35
0.
39
0.62
0.
41
0.83
0.
68
0.35
N
a 2O
%
- -
0.60
0.
69
1.12
1.
16
0.85
0.
62
3.57
1.
24
3.24
2.
90
2.21
2.
23
4.65
2.
51
4.91
3.
90
1.34
K
2O%
-
- 1.
40
0.88
2.
07
1.31
1.
30
0.73
1.
21
3.54
1.
02
0.76
1.
08
1.87
0.
90
0.73
1.
00
1.64
2.
39
P2O
5%
- -
0.15
0.
17
0.12
0.
17
0.06
0.
07
0.09
0.
06
0.22
0.
22
0.27
0.
38
0.15
0.
22
0.09
0.
14
0.06
L
OI%
-
- 40
.38
38.3
7 24
.27
37.1
1 14
.79
32.9
7 38
.24
8.41
36
.54
36.2
3 34
.88
29.3
6 38
.52
45.3
3 39
.33
26.8
4 18
.18
SO3%
0.
07
0.12
0.
09
0.24
0.
05
0.09
0.
58
0.10
0.
70
0.72
0.
18
0.16
1.
15
0.56
1.
32
0.64
0.
05
SUM
%
- -
100.
41
99.5
3 99
.77
100.
51
100.
19
99.6
9 10
0.09
10
0.15
10
0.17
10
0.22
10
0.18
10
0.29
10
0.06
10
0.40
10
0.33
10
0.17
99
.64
As
ppm
33
0 10
40
33
41
15
31
3
74
15
34
42
38
42
49
35
40
30
31
Ba
ppm
40
00
10
82
95
108
125
69
43
119
127
115
115
97
133
141
112
188
172
268
Co
ppm
21
0 2
9 B
D
BD
14
B
D
BD
B
D
23
18
1 14
15
B
D
2 B
D
14
8 C
r pp
m
4000
3
61
56
84
56
72
36
12
54
47
25
44
44
13
18
14
53
76
Cu
ppm
23
60
3 B
D
BD
14
B
D
10
BD
B
D
3 12
9
11
11
4 12
3
12
75
Ga
ppm
40
3
BD
B
D
11
BD
8
BD
N
A
7 17
N
A
18
18
NA
N
A
NA
12
20
M
n pp
m
2500
4
249
259
65
148
51
203
BD
55
74
B
D
135
71
BD
B
D
164
91
139
Nb
ppm
26
8 2
3 4
4 6
2 2
6 13
12
8
14
19
7 5
7 16
25
N
i ppm
23
60
3 14
16
14
9
11
8 53
6
23
24
18
16
26
43
13
14
10
Pb
ppm
13
3 10
7
12
33
6 25
12
9
24
35
6 37
36
10
1
10
33
29
Rb
ppm
13
00
2 88
61
12
3 77
83
44
69
19
9 67
38
85
12
2 43
8
48
92
144
Sc p
pm
55
3 B
D
BD
7
BD
4
BD
N
A
1 12
N
A
12
8 N
A
NA
N
A
10
12
Sr p
pm
700
2 57
48
98
12
5 45
33
82
37
56
31
51
60
86
7
150
107
75
Ti p
pm
2260
0 5
1704
15
86
3284
26
56
1928
89
8 43
4 11
27
1665
12
63
2046
25
36
953
1107
94
4 29
35
5404
V
ppm
52
6 4
84
69
26
61
15
36
21
25
42
46
46
52
28
40
23
52
71
Y p
pm
720
2 39
21
19
20
20
13
16
21
49
22
36
37
33
7
12
16
25
Zn
ppm
29
0 3
48
35
37
28
37
26
4 9
79
50
81
58
55
5 27
37
58

329
Zr
ppm
49
0 3
73
53
73
76
43
58
27
97
43
16
57
114
14
1 57
14
7 19
5 U
DL
= U
pper
Det
ectio
n L
imit;
LD
L =
Low
er D
etec
tion
Lim
it; N
A =
Not
Ana
lyse
d; B
D =
Bel
ow D
etec
tion
Lim
it.
Table G
.2.
XR
F d
ata
stat
istic
s fo
r dr
ain
sedi
men
ts.
Dra
in s
edim
ents
are
des
crib
ed i
n th
ree
grou
ps: a
ll dr
ain
sedi
men
ts,
the
oran
ge f
locc
ulan
ts (
OF
) an
d th
e
blac
k oo
zes
(BO
).
A
ll D
rain
Sed
imen
ts (
n =
17)
O
rang
e F
locc
ulan
ts (
n =
12)
B
lack
Ooz
es (
n =
5)
Sm
all
25th
%til
e M
edia
n 75
th %
tile
Lar
ge
Smal
l 25
th
Med
ian
75th
L
arge
Sm
all
25th
%til
e M
edia
n 75
th %
tile
Lar
ge
Al %
1.
84
2.92
4.
63
6.93
9.
55
1.84
2.
55
4.01
6.
12
8.94
4.
57
5.40
5.
93
6.93
9.
55
As
ppm
3
31
35
41
74
3 31
36
40
.25
74
15
30
35
42
42
Ba
ppm
43
97
11
5 13
3 26
8 43
91
.75
111.
5 12
9 26
8 11
2 11
5 12
7 13
3 17
2 C
a %
0.
14
0.27
0.
29
0.37
0.
59
0.21
0.
26
0.30
0.
38
0.59
0.
14
0.28
0.
29
0.29
0.
49
Co
ppm
1
1 2
14
23
1 1
1 10
.25
18
1 2
14
15
23
Cu
ppm
1.
5 1.
5 9
12
75
1.5
1.5
3.5
11.2
5 75
3
9 11
12
12
F
e %
3.
06
10.2
6 15
.99
18.5
2 31
.00
3.87
12
.04
17.0
0 18
.84
31.0
0 3.
06
5.03
10
.26
16.8
0 19
.26
Ga
ppm
1.
5 1.
5 9.
5 17
.25
20
1.5
1.5
8 17
20
7
9.5
12
15
18
K %
0.
61
0.75
1.
00
1.36
2.
94
0.61
0.
81
0.95
1.
10
1.98
0.
61
0.63
1.
36
1.55
2.
94
LO
I %
8.
41
26.8
4 36
.23
38.3
7 45
.33
14.7
9 30
.80
36.8
2 38
.41
40.3
8 8.
41
26.8
4 29
.36
36.2
3 45
.33
Mg
%
0.15
0.
20
0.42
0.
51
1.09
0.
15
0.19
0.
30
0.54
1.
09
0.18
0.
46
0.46
0.
46
0.68
M
n pp
m
2 51
74
14
8 25
9 2
61.5
13
7 17
3.75
25
9 2
2 55
71
91
N
a %
0.
45
0.83
1.
64
2.40
3.
64
0.45
0.
60
0.93
2.
46
3.64
0.
92
1.65
1.
86
2.15
2.
89
Nb
ppm
2
4 7
13
25
2 3.
75
6 8.
25
25
5 8
13
16
19
Ni p
pm
6 11
14
23
53
8
10.7
5 14
19
.25
53
6 14
16
24
43
P
%
0.02
0.
04
0.07
0.
10
0.17
0.
02
0.04
0.
06
0.08
0.
12
0.03
0.
06
0.10
0.
10
0.17
P
b pp
m
1 9
12
33
37
6 9.
75
12
30
37
1 6
24
33
36
Rb
ppm
8
48
77
92
199
43
57.7
5 73
85
.75
144
8 38
92
12
2 19
9 S
%
0.05
0.
09
0.18
0.
64
1.32
0.
05
0.08
0.
15
0.61
1.
32
0.10
0.
16
0.56
0.
64
0.72
Sc
ppm
1
1.5
5.5
10.5
12
1.
5 1.
5 4
12
12
1 4.
5 8
9 10
Si
%
6.75
8.
11
11.1
3 18
.58
34.1
4 6.
84
8.77
10
.90
15.2
2 29
.78
6.75
8.
11
18.4
0 18
.58
34.1
4 Sr
ppm
7
45
57
86
150
33
50.2
5 66
89
15
0 7
31
37
60
107
Ti %
0.
06
0.11
0.
15
0.20
0.
52
0.06
0.
09
0.13
0.
19
0.52
0.
13
0.15
0.
15
0.31
0.
34
V p
pm
15
26
42
52
84
15
25.2
5 39
63
84
25
40
46
52
52
Y
ppm
7
16
21
33
49
12
18.2
5 20
.5
33.7
5 49
7
16
21
22
37
Zn
ppm
4
27
37
55
81
4 27
.75
37
55.7
5 81
5
9 37
50
58
Z
r pp
m
1 43
57
76
19
5 14
43
57
73
19
5 1
16
97
114
147

330
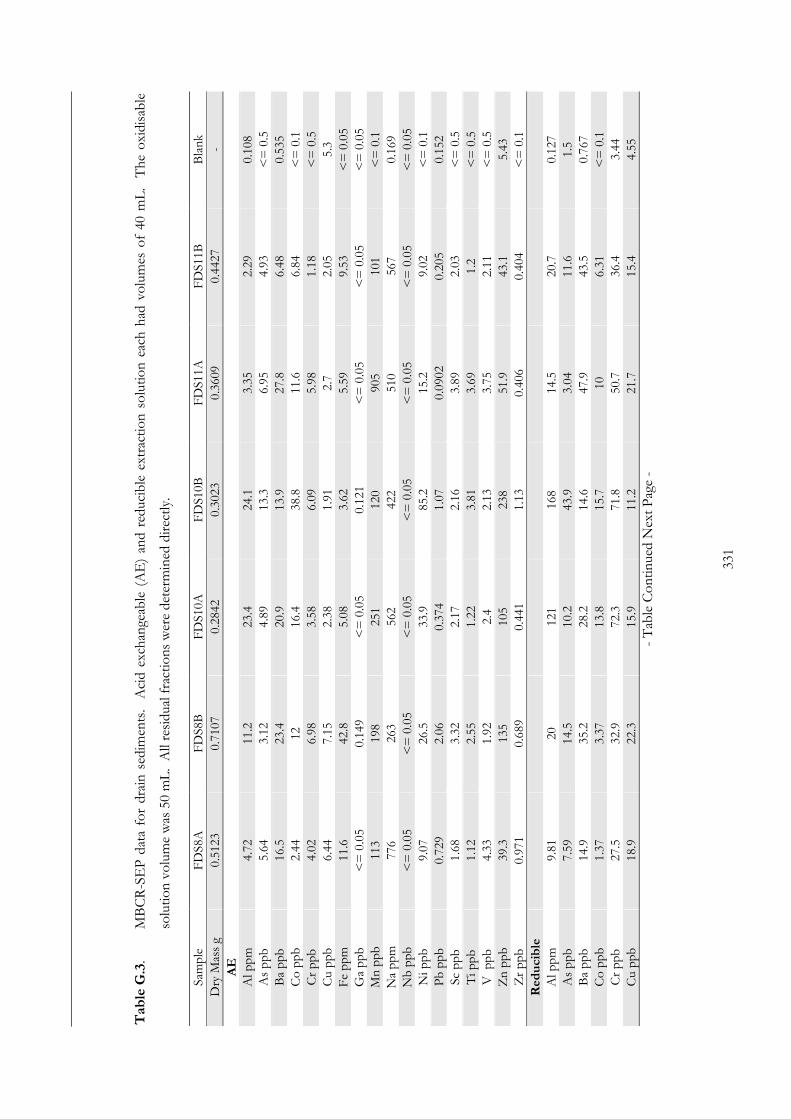
331
Table G
.3.
MB
CR
-SE
P d
ata
for
drai
n se
dim
ents
. A
cid
exch
ange
able
(A
E)
and
redu
cibl
e ex
trac
tion
solu
tion
each
had
vol
umes
of
40 m
L.
The
oxi
disa
ble
solu
tion
volu
me
was
50
mL
. A
ll re
sidu
al f
ract
ions
wer
e de
term
ined
dir
ectly
.
Sam
ple
FD
S8A
F
DS8
B
FD
S10A
F
DS1
0B
FD
S11A
F
DS1
1B
Bla
nk
Dry
Mas
s g
0.51
23
0.71
07
0.28
42
0.30
23
0.36
09
0.44
27
- AE
Al p
pm
4.72
11
.2
23.4
24
.1
3.35
2.
29
0.10
8 A
s pp
b 5.
64
3.12
4.
89
13.3
6.
95
4.93
<
= 0
.5
Ba
ppb
16.5
23
.4
20.9
13
.9
27.8
6.
48
0.53
5 C
o pp
b 2.
44
12
16.4
38
.8
11.6
6.
84
<=
0.1
C
r pp
b 4.
02
6.98
3.
58
6.09
5.
98
1.18
<
= 0
.5
Cu
ppb
6.44
7.
15
2.38
1.
91
2.7
2.05
5.
3 F
e pp
m
11.6
42
.8
5.08
3.
62
5.59
9.
53
<=
0.0
5 G
a pp
b <
= 0
.05
0.14
9 <
= 0
.05
0.12
1 <
= 0
.05
<=
0.0
5 <
= 0
.05
Mn
ppb
113
198
251
120
905
101
<=
0.1
N
a pp
m
776
263
562
422
510
567
0.16
9 N
b pp
b <
= 0
.05
<=
0.0
5 <
= 0
.05
<=
0.0
5 <
= 0
.05
<=
0.0
5 <
= 0
.05
Ni p
pb
9.07
26
.5
33.9
85
.2
15.2
9.
02
<=
0.1
P
b pp
b 0.
729
2.06
0.
374
1.07
0.
0902
0.
205
0.15
2 Sc
ppb
1.
68
3.32
2.
17
2.16
3.
89
2.03
<
= 0
.5
Ti p
pb
1.12
2.
55
1.22
3.
81
3.69
1.
2 <
= 0
.5
V p
pb
4.33
1.
92
2.4
2.13
3.
75
2.11
<
= 0
.5
Zn
ppb
39.3
13
5 10
5 23
8 51
.9
43.1
5.
43
Zr
ppb
0.97
1 0.
689
0.44
1 1.
13
0.40
6 0.
404
<=
0.1
Red
ucible
Al p
pm
9.81
20
12
1 16
8 14
.5
20.7
0.
127
As
ppb
7.59
14
.5
10.2
43
.9
3.04
11
.6
1.5
Ba
ppb
14.9
35
.2
28.2
14
.6
47.9
43
.5
0.76
7 C
o pp
b 1.
37
3.37
13
.8
15.7
10
6.
31
<=
0.1
C
r pp
b 27
.5
32.9
72
.3
71.8
50
.7
36.4
3.
44
Cu
ppb
18.9
22
.3
15.9
11
.2
21.7
15
.4
4.55
-
Tab
le C
ontin
ued
Nex
t Pag
e -

332
Table G
.3.
(Con
tinue
d) M
BC
R-S
EP
dat
a fo
r dr
ain
sedi
men
ts.
Aci
d ex
chan
geab
le (
AE
) an
d re
duci
ble
extr
actio
n so
lutio
n ea
ch h
ad v
olum
es o
f 40
mL
. T
he
oxid
isab
le s
olut
ion
volu
me
was
50
mL
. A
ll re
sidu
al f
ract
ions
wer
e de
term
ined
dir
ectly
.
Sam
ple
FD
S8A
F
DS8
B
FD
S10A
F
DS1
0B
FD
S11A
F
DS1
1B
Bla
nk
Fe
ppm
44
5 18
8 13
60
307
808
541
<=
0.0
5 G
a pp
b 3.
4 6.
78
3.87
4.
75
2.32
4.
71
<=
0.5
M
n pp
b 14
.8
47.2
67
.3
18.3
73
2 69
<
= 0
.1
Na
ppm
2.
11
0.53
1 3.
54
2.34
6.
57
4.27
<
= 0
.5
Nb
ppb
0.10
8 0.
137
<=
0.0
5 0.
0534
0.
0774
0.
0956
<
= 0
.05
Ni p
pb
21.7
27
66
.2
63.3
40
.3
40.3
10
.4
Pb
ppb
61.2
11
0 40
.7
98.7
23
.8
108
0.93
2 Sc
ppb
3.
38
4.31
8.
76
6.11
6.
15
4.34
<
= 0
.5
Ti p
pb
20.3
53
.5
9.14
5.
06
14.5
32
.6
<=
0.5
V
ppb
28
2 37
9 11
0 19
6 65
.4
133
4.22
Z
n pp
b 22
.3
117
182
194
79.3
61
.8
6.14
Z
r pp
b 4.
52
3.3
3.62
1.
43
2.06
2.
17
<=
0.1
Oxidisable
Al p
pm
2.8
8.85
17
.7
35.8
3.
92
7.21
0.
238
As
ppb
<=
0.5
<
= 0
.5
7.18
2.
52
2.05
1.
75
<=
0.5
B
a pp
b 6.
72
14.1
5.
82
7.97
9.
18
2.77
0.
824
Co
ppb
1.07
3.
2 3.
75
26.5
4.
74
4.3
<=
0.1
C
r pp
b 21
.2
60.3
64
.7
149
51.2
17
9 3.
3 C
u pp
b 11
.6
22.8
17
.4
36.4
18
40
.8
8.72
F
e pp
m
38
8.22
55
.2
29.1
50
.7
28.6
0.
27
Ga
ppb
0.51
7 1.
46
1.27
2.
12
0.59
4 1.
87
<=
0.0
5 M
n pp
b 15
.3
46.1
27
.5
44.1
14
5 57
.2
1.47
N
a pp
m
5.05
4.
78
3.5
4.62
5.
48
7.16
<
= 0
.5
Nb
ppb
<=
0.0
5 0.
0585
0.
0686
0.
0668
<
= 0
.05
0.07
9 <
= 0
.05
Ni p
pb
130
195
149
216
162
210
1.46
P
b pp
b 7.
2 3.
28
15.9
17
.8
8.81
1.
49
0.69
9 Sc
ppb
21
.5
29.4
17
.6
36.4
15
.2
35
1.2
Ti p
pb
21.7
17
32
.6
38.6
21
.1
98.6
4.
53
- T
able
Con
tinue
d N
ext P
age
-
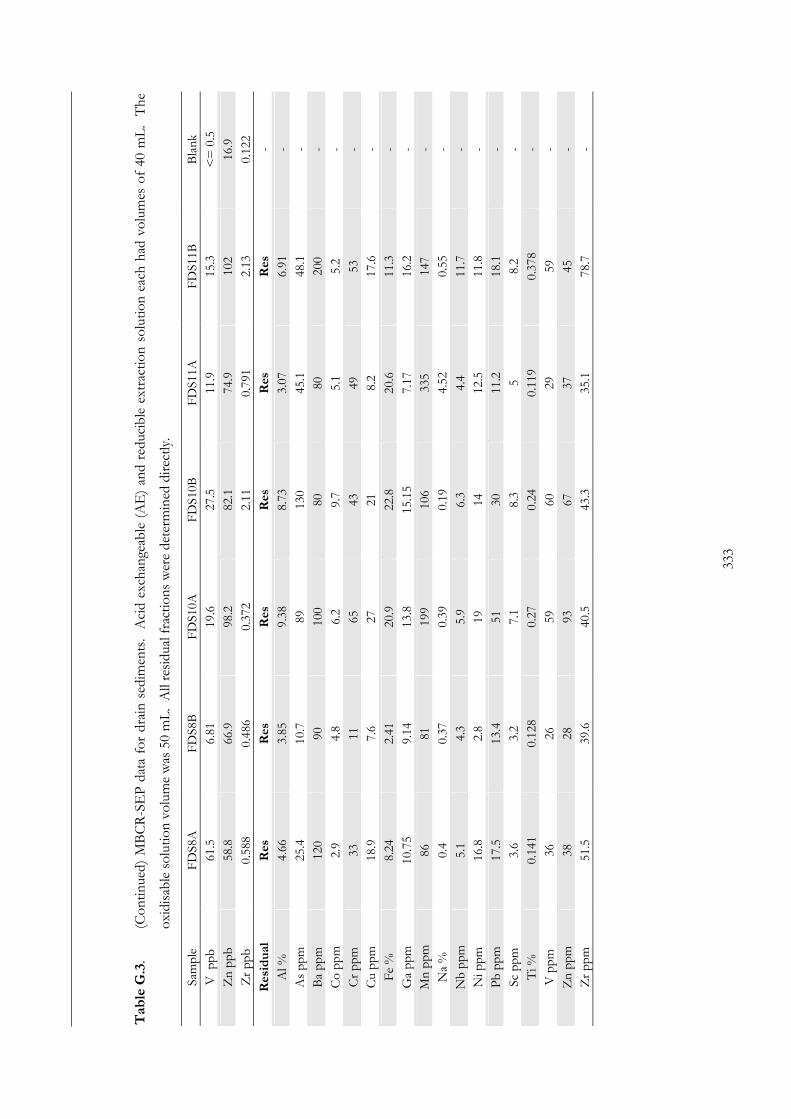
333
Table G
.3.
(Con
tinue
d) M
BC
R-S
EP
dat
a fo
r dr
ain
sedi
men
ts.
Aci
d ex
chan
geab
le (
AE
) an
d re
duci
ble
extr
actio
n so
lutio
n ea
ch h
ad v
olum
es o
f 40
mL
. T
he
oxid
isab
le s
olut
ion
volu
me
was
50
mL
. A
ll re
sidu
al f
ract
ions
wer
e de
term
ined
dir
ectly
.
Sam
ple
FD
S8A
F
DS8
B
FD
S10A
F
DS1
0B
FD
S11A
F
DS1
1B
Bla
nk
V p
pb
61.5
6.
81
19.6
27
.5
11.9
15
.3
<=
0.5
Zn
ppb
58.8
66
.9
98.2
82
.1
74.9
10
2 16
.9
Zr
ppb
0.58
8 0.
486
0.37
2 2.
11
0.79
1 2.
13
0.12
2
Residual
Res
Res
Res
Res
Res
Res
-
Al %
4.
66
3.85
9.
38
8.73
3.
07
6.91
-
As
ppm
25
.4
10.7
89
13
0 45
.1
48.1
-
Ba
ppm
12
0 90
10
0 80
80
20
0 -
Co
ppm
2.
9 4.
8 6.
2 9.
7 5.
1 5.
2 -
Cr
ppm
33
11
65
43
49
53
-
Cu
ppm
18
.9
7.6
27
21
8.2
17.6
-
Fe
%
8.24
2.
41
20.9
22
.8
20.6
11
.3
-
Ga
ppm
10
.75
9.14
13
.8
15.1
5 7.
17
16.2
-
Mn
ppm
86
81
19
9 10
6 33
5 14
7 -
Na
%
0.4
0.37
0.
39
0.19
4.
52
0.55
-
Nb
ppm
5.
1 4.
3 5.
9 6.
3 4.
4 11
.7
- N
i ppm
16
.8
2.8
19
14
12.5
11
.8
-
Pb
ppm
17
.5
13.4
51
30
11
.2
18.1
-
Sc p
pm
3.6
3.2
7.1
8.3
5 8.
2 -
Ti %
0.
141
0.12
8 0.
27
0.24
0.
119
0.37
8 -
V p
pm
36
26
59
60
29
59
-
Zn
ppm
38
28
93
67
37
45
-
Zr
ppm
51
.5
39.6
40
.5
43.3
35
.1
78.7
-

334
AP
PE
ND
IX H
. FIR
EW
OO
D C
RE
EK
MO
UT
H S
ED
IME
NT
DA
TA
Table H
.1.
Ele
men
tal
com
posi
tion
of F
irew
ood
Cre
ek m
outh
sed
imen
ts c
olle
cted
Apr
il 20
04.
Ele
men
t co
ncen
trat
ions
wer
e de
term
ined
usi
ng I
CP
-MS-
AE
S
afte
r H
F+
HN
O3+
HC
lO4+
HC
l dig
est.
F
CT
01
FC
T02
F
CT
03
FC
T04
F
CT
05
FC
T06
F
CT
07
FC
T08
F
CT
09
FC
T10
F
CT
11
FC
T12
F
CT
13
Med
ian
As
ppm
33
.7
29.5
30
.1
20.4
28
28
.9
32.8
31
.6
6.3
23.4
26
.9
26.2
24
.6
28
Ba
ppm
21
0 23
0 25
0 23
0 20
0 24
0 23
0 22
0 13
0 24
0 24
0 22
0 25
0 23
0 C
a %
1.
05
0.59
1.
31
6.06
0.
81
1.06
1.
22
1.33
2.
03
1.16
0.
8 1.
22
0.64
1.
16
Co
ppm
13
.5
18.3
14
.5
11
10.1
14
.4
13.8
11
.8
2.4
11.1
14
.6
13.6
13
.4
13.5
F
e %
5.
21
4.44
4.
5 4.
02
3.54
4.
68
4.98
4.
25
0.68
3.
53
4.36
4.
65
4.48
4.
44
Ga
ppm
16
.7
18.6
18
.8
14.4
5 11
.65
18.6
16
.95
14.5
5 5.
5 13
.9
16.4
5 16
.7
18.1
5 16
.7
K %
1.
64
1.69
1.
77
1.58
1.
7 1.
7 1.
67
1.8
2.26
1.
68
1.61
1.
56
1.69
1.
69
Li p
pm
58.6
11
6.5
63
46.4
37
.8
62.6
59
.4
53.8
14
.3
44.9
64
.1
70.4
62
.1
59.4
M
g %
0.
84
0.81
0.
89
0.69
0.
52
0.91
0.
83
0.67
0.
13
0.64
0.
87
0.85
0.
9 0.
83
Mn
ppm
49
5 26
7 56
0 30
9 27
1 39
0 38
8 43
9 12
9 38
5 32
7 28
3 33
3 33
3 N
a %
1.
58
1.29
1.
57
1.38
1.
37
1.43
1.
46
1.41
0.
42
1.42
1.
76
1.54
1.
52
1.43
Nb
ppm
14
.8
15.1
16
.2
13
10.9
16
.4
15.3
14
2.
8 13
.1
15.4
14
.6
16.1
14
.8
Ni p
pm
32.2
37
.5
33.4
26
.2
20.6
32
.5
30.9
23
.7
4.8
23.3
32
31
.3
31.7
31
.3
P p
pm
580
490
350
620
380
610
710
460
180
450
670
640
590
580
Pb
ppm
30
.2
25.6
25
.8
20.4
22
.4
27.1
29
.1
26.1
18
.3
22.6
26
26
.7
27.9
26
Rb
ppm
12
1 12
1 12
3.5
101
109.
5 12
6 12
2.5
127.
5 14
5.5
113
113
113
122.
5 12
1 S
%
1.29
0.
96
2.24
0.
68
1.3
0.94
1.
44
1.49
0.
14
0.6
1.57
1.
34
0.92
1.
29
Sr p
pm
142.
5 90
.3
168
392
113
131
143
152
101.
5 13
4.5
129
133
105.
5 13
3 T
i %
0.41
7 0.
422
0.51
0.
41
0.33
0.
478
0.44
8 0.
394
0.07
2 0.
403
0.47
2 0.
439
0.48
0.
422
V p
pm
76
78
82
63
53
82
78
61
11
59
78
78
84
78
Y p
pm
29.2
35
24
.2
24.8
20
.8
28.6
30
24
.8
4.9
22.3
28
.4
31.9
28
.3
28.3
Z
n pp
m
93
99
78
75
58
97
95
74
18
70
91
99
99
91
Zr
ppm
95
.5
93.1
10
9 92
.2
82.5
10
6.5
100
105.
5 23
.8
93.3
10
4.5
93.6
10
5 95
.5

335
Table H
.2.
Ele
men
tal
com
posi
tion
of F
irew
ood
Cre
ek m
outh
sed
imen
ts c
olle
cted
Sep
tem
ber
2002
. E
lem
ent
conc
entr
atio
ns w
ere
dete
rmin
ed u
sing
IC
P-
MS/
AE
S af
ter
HF
+H
NO
3+H
ClO
4+H
Cl d
iges
t. D
ata
are
from
Hal
l (20
02).
Sam
ple
FC
T01
F
CT
02
FC
T03
F
CT
04
FC
T05
F
CT
06
FC
T07
F
CT
08
FC
T09
F
CT
10
FC
T11
F
CT
12
FC
T13
M
edia
n
Al p
pm
7290
0 45
000
7780
0 68
600
8290
0 91
900
9110
0 77
800
1105
00
9040
0 63
700
2720
0 85
100
7780
0 A
s pp
m
26.2
17
.3
24.7
22
.8
25.2
25
.7
27.9
24
.9
25.3
27
.2
24.5
3.
2 23
.7
24.9
C
u pp
m
21.2
10
.8
21.9
19
21
.1
22.1
22
.1
19.5
21
.3
21.5
19
2.
6 22
.8
21.2
F
e pp
m
3880
0 22
300
3790
0 32
800
3870
0 40
400
4080
0 38
400
3850
0 40
900
3410
0 35
00
3700
0 38
400
Li p
pm
68.2
36
.6
69.7
57
.9
74
79
70
67.1
70
.2
68.2
51
8.
3 61
.4
68.2
M
n pp
m
459
331
625
610
472
520
559
765
644
595
647
72
672
595
Ni p
pm
26.7
15
.4
28.7
25
.9
27.7
28
.4
29
28.4
29
.1
28.3
24
.5
3.4
29.5
28
.3
Pb
ppm
21
.7
16.4
23
20
.8
22.9
22
.3
23.8
21
.9
22.7
23
.1
20.3
14
22
.4
22.3
Zn
ppm
91
47
94
80
95
10
4 96
92
96
93
82
14
94
93
Table H
.3.
Ele
men
tal c
ompo
sitio
n of
Fir
ewoo
d C
reek
mou
th s
edim
ents
col
lect
ed J
uly
2002
. The
Jul
y 20
02 s
edim
ents
fro
m F
irew
ood
Cre
ek a
re a
lso
refe
rred
to a
s th
e ‘b
asel
ine’
sed
imen
ts i
n th
e te
xt.
Ele
men
t co
ncen
trat
ions
wer
e de
term
ined
usi
ng I
CP
-MS/
AE
S af
ter
HF
+H
NO
3+H
ClO
4+H
Cl
dige
st.
Dat
a ar
e fr
om H
all (
2002
).
Sam
ple
FC
T01
F
CT
02
FC
T03
F
CT
04
FC
T05
F
CT
06
FC
T07
F
CT
08
FC
T09
F
CT
10
FC
T11
F
CT
12
FC
T13
M
edia
n
Al p
pm
6730
0 42
100
7830
0 64
300
6510
0 75
700
7100
0 74
600
7490
0 69
700
7830
0 21
200
7370
0 71
000
As
ppm
33
.5
20
24.8
23
21
.9
25.7
26
24
27
.7
24
27.2
3.
4 22
.3
24
Cu
ppm
21
.3
10.8
23
18
.7
17.4
21
.7
22
18.8
22
.8
21.6
22
.3
5.1
21.3
21
.3
Fe
ppm
42
000
2410
0 38
800
3180
0 33
000
4140
0 39
400
3840
0 42
000
3700
0 43
600
4500
35
700
3840
0 L
i ppm
56
29
.9
62.5
46
.2
52
77.2
62
.1
64.4
71
.9
62.4
81
.2
8.8
56.9
62
.1
Mn
ppm
51
3 23
0 43
5 36
2 27
5 32
1 35
4 45
1 37
3 32
5 41
4 55
35
4 35
4 N
i ppm
27
15
29
23
23
30
28
27
30
27
30
3
28
27
Pb
ppm
22
.3
15
22.7
20
.5
19.2
21
.6
22.2
21
.2
23.1
21
.9
22.9
11
.4
20.5
21
.6
Zn
ppm
95
49
98
80
80
10
8 97
90
10
4 93
10
5 8
92
93

336
Table H
.4.
Ele
men
tal c
ompo
sitio
n of
Fal
ls C
reek
mou
th s
edim
ents
col
lect
ed 2
004.
The
Fal
ls C
reek
sed
imen
ts a
re a
lso
refe
rred
as
the
‘bac
kgro
und’
sed
imen
ts
in t
he t
ext.
Ele
men
t con
cent
ratio
ns w
ere
dete
rmin
ed u
sing
IC
P-M
S/A
ES
afte
r H
F+
HN
O3+
HC
lO4+
HC
l dig
est.
Dat
a ar
e fr
om H
all (
2002
).
Sam
ple
B01
B
02
B03
B
04
B05
B
06
B07
B
08
B09
B
10
B11
B
12
B13
B
14
Med
ian
Al p
pm
2350
0 70
100
5170
0 69
900
6320
0 72
700
6590
0 69
800
7070
0 70
100
7610
0 75
900
6790
0 69
100
6985
0 A
s pp
m
0.07
0.
09
0.1
0.09
0.
1 0.
1 0.
09
0.09
0.
1 0.
08
0.09
0.
09
0.11
0.
09
0.09
C
u pp
m
13.6
25
.5
21.9
25
.3
21.4
28
19
.2
20.7
22
.7
22.1
23
.7
23.5
21
.1
22.4
22
.25
Fe
ppm
33
200
3530
0 37
200
3500
0 33
300
3850
0 27
000
3450
0 36
400
3110
0 34
400
3440
0 33
400
3460
0 34
450
Li p
pm
18.1
56
.8
49
50.8
48
.8
54.8
46
49
.9
52.1
52
.3
57.3
55
.3
51.6
54
51
.85
Mn
ppm
18
3 31
6 26
8 36
5 27
2 29
4 20
3 29
1 27
4 22
2 27
4 23
7 24
0 29
5 27
3 N
i ppm
16
29
25
26
25
27
23
25
25
25
26
25
24
25
25
P
b pp
m
12.9
22
.2
21.2
21
.2
20.9
23
.1
18.7
19
.6
21.2
19
.5
21.9
21
.5
20.1
21
.7
21.2
Zn
ppm
61
0.
92
0.94
0.
88
0.88
87
0.
84
0.92
0.
9 0.
88
0.96
0.
95
0.84
0.
91
0.91
5

337
Table H
.5.
Fir
ewoo
d C
reek
mou
th s
edim
ent
tem
pora
l co
mpa
riso
n.
Lith
ium
nor
mal
ised
ele
men
t co
mpa
riso
n of
Fir
ewoo
d C
reek
mou
th s
edim
ents
col
lect
ed
Apr
il 20
04, S
epte
mbe
r 20
02 a
nd J
uly
2002
are
com
pare
d. E
lem
ent
conc
entr
atio
ns w
ere
dete
rmin
ed u
sing
IC
P-M
S af
ter
HF
+H
NO
3+H
ClO
4+H
Cl
acid
dig
est.
Sam
ple
FC
T01
F
CT
02
FC
T03
F
CT
04
FC
T05
F
CT
06
FC
T07
F
CT
08
FC
T09
F
CT
10
FC
T11
F
CT
12
FC
T13
A
s A
pril
2004
0.
575
0.25
3 0.
478
0.44
0 0.
741
0.46
2 0.
552
0.58
7 0.
441
0.52
1 0.
420
0.37
2 0.
396
As
Sept
200
2 0.
384
0.47
3 0.
354
0.39
4 0.
341
0.32
5 0.
399
0.37
1 0.
360
0.39
9 0.
480
0.38
6 0.
386
As
July
200
2 0.
598
0.66
9 0.
397
0.49
8 0.
421
0.33
3 0.
419
0.37
3 0.
385
0.38
5 0.
335
0.38
6 0.
392
Fe
Apr
il 20
04
889
381
714
866
937
748
838
790
476
786
680
661
721
Fe
Sept
200
2 56
9 60
9 54
4 56
6 52
3 51
1 58
3 57
2 54
8 60
0 66
9 42
2 60
3 F
e Ju
ly 2
002
750
806
621
688
635
536
634
596
584
593
537
511
627
Li A
pril
2004
1.
000
1.00
0 1.
000
1.00
0 1.
000
1.00
0 1.
000
1.00
0 1.
000
1.00
0 1.
000
1.00
0 1.
000
Li S
ept
2002
1.
000
1.00
0 1.
000
1.00
0 1.
000
1.00
0 1.
000
1.00
0 1.
000
1.00
0 1.
000
1.00
0 1.
000
Li J
uly
2002
1.
000
1.00
0 1.
000
1.00
0 1.
000
1.00
0 1.
000
1.00
0 1.
000
1.00
0 1.
000
1.00
0 1.
000
Mn
Apr
il 20
04
8.45
2.
29
8.89
6.
66
7.17
6.
23
6.53
8.
16
9.02
8.
57
5.10
4.
02
5.36
M
n Se
pt 2
002
6.73
9.
04
8.97
10
.54
6.38
6.
58
7.99
11
.40
9.17
8.
72
12.6
9 8.
67
10.9
4 M
n Ju
ly 2
002
9.16
7.
69
6.96
7.
84
5.29
4.
16
5.70
7.
00
5.19
5.
21
5.10
6.
25
6.22
N
i Apr
il 20
04
0.54
9 0.
322
0.53
0 0.
565
0.54
5 0.
519
0.52
0 0.
441
0.33
6 0.
519
0.49
9 0.
445
0.51
0 N
i Sep
t 20
02
0.39
1 0.
421
0.41
2 0.
447
0.37
4 0.
359
0.41
4 0.
423
0.41
5 0.
415
0.48
0 0.
410
0.48
0 N
i Jul
y 20
02
0.48
2 0.
502
0.46
4 0.
498
0.44
2 0.
389
0.45
1 0.
419
0.41
7 0.
433
0.36
9 0.
341
0.49
2 P
b A
pril
2004
0.
515
0.22
0 0.
410
0.44
0 0.
593
0.43
3 0.
490
0.48
5 1.
280
0.50
3 0.
406
0.37
9 0.
449
Pb
Sept
200
2 0.
318
0.44
8 0.
330
0.35
9 0.
309
0.28
2 0.
340
0.32
6 0.
323
0.33
9 0.
398
1.68
7 0.
365
Pb
July
200
2 0.
398
0.50
2 0.
363
0.44
4 0.
369
0.28
0 0.
357
0.32
9 0.
321
0.35
1 0.
282
1.29
5 0.
360
Zn
Apr
il 20
04
1.58
7 0.
850
1.23
8 1.
616
1.53
4 1.
550
1.59
9 1.
375
1.25
9 1.
559
1.42
0 1.
406
1.59
4 Z
n Se
pt 2
002
1.33
4 1.
284
1.34
9 1.
382
1.28
4 1.
316
1.37
1 1.
371
1.36
8 1.
364
1.60
8 1.
687
1.53
1 Z
n Ju
ly 2
002
1.69
6 1.
639
1.56
8 1.
732
1.53
8 1.
399
1.56
2 1.
398
1.44
6 1.
490
1.29
3 0.
909
1.61
7

338
APPENDIX I. PLANT AND SOIL BIOAVAILABILITY DATA
Table I.1. Concentration statistics for Al, As, Co, Cr, Pb, Zn in above ground parts (stems) and below ground parts (roots) of Acrostichum speciosum samples collected from East Trinity.
Acrostichum speciosum Smallest 25th%tile Median 75th%tile Largest IAASS Stems (n = 8)
Al ug/g 9 54 98 374 442 As ug/g 0.5 0.5 0.5 0.5 0.5 Co ug/g 0.05 0.05 0.28 0.37 0.83 Cr ug/g 0.42 0.72 0.81 0.97 1.52 Cu ug/g 2.03 5.08 5.63 7.32 11.40 Pb ug/g 0.02 0.02 0.08 0.12 0.23 Zn ug/g 5.2 10.1 12.0 12.7 15.6
Background Stems (n = 8) Al ug/g 74 86 103 170 432 As ug/g 0.5 0.5 0.5 0.5 0.5 Co ug/g 0.05 0.05 0.05 0.12 0.16 Cr ug/g 0.05 0.05 0.15 0.37 1.65 Cu ug/g 3.25 4.64 5.61 6.625 7.97 Pb ug/g 0.05 0.13 0.17 0.18 0.45 Zn ug/g 7.4 7.5 8.5 9.6 10.1
IAASS Roots (n = 8) (n = 8) Al ug/g 4 351 858 2840 4930 As ug/g 0.5 1.0 1.7 6.8 95.4 Co ug/g 0.09 0.31 0.49 0.97 1.50 Cr ug/g 0.84 1.22 1.47 2.33 4.23 Cu ug/g 3.68 5.13 6.53 8.53 16.70 Pb ug/g 0.06 0.26 0.76 2.72 8.74 Zn ug/g 2.5 7.9 9.5 11.3 18.6
Background Roots (n = 8) Al ug/g 1170 1987 2240 2957 3890 As ug/g 0.5 0.92 1.27 5.97 8.56 Co ug/g 0.20 0.31 0.44 0.73 1.63 Cr ug/g 0.05 0.05 0.485 0.90925 1.24 Cu ug/g 5.79 5.8675 6.15 8.1275 8.81 Pb ug/g 0.98 1.41 1.64 1.99 2.53 Zn ug/g 7.2 8.6 9.8 12.5 17.3

339
Table I.2. Concentration statistics for Al, As, Co, Cr, Pb, Zn in above ground tissue (stems) and
below ground tissue (roots) of the Paspalum vaginatum samples collected from East Trinity.
Paspalum vaginatum Smallest 25th%tile Median 75th%tile Largest IAASS Stems (n = 8)
Al µg/g 1 370 540 866 1140 As µg/g 0.5 0.5 0.5 1.1 1.5
Co µg/g 0.05 0.141 0.23 0.56 1.24
Cr µg/g 0.36 0.72 0.89 0.94 3.48
Cu µg/g 1.81 4.79 6.73 9.4475 14.1 Pb µg/g 0.13 0.25 0.35 0.40 0.43
Zn µg/g 13.7 16.4 16.7 22.5 58.2 Background Stems (n = 8)
Al µg/g 4 1651 2980 4142 6260
As µg/g 0.5 1.0 1.3 1.4 2.8
Co µg/g 0.36 0.59 0.75 0.85 1.19 Cr µg/g 1.38 1.91 3.07 3.38 4.40
Cu µg/g 4.31 4.38 5.24 5.56 10.90
Pb µg/g 1.08 1.35 1.45 1.71 2.22
Zn µg/g 9.4 12.0 12.9 17.7 27.2 IAASS Roots (n = 8)
Al µg/g 418 550 871 1460 2210
As µg/g 1.5 2.6 3.2 9.0 38.8 Co µg/g 0.28 0.65 0.92 1.27 2.74
Cr µg/g 0.05 0.81 1.00 1.54 1.86
Cu µg/g 1.74 6.00 12.20 16.20 28.40 Pb µg/g 0.34 0.63 1.00 1.73 2.15
Zn µg/g 7.7 12.1 47.8 82.2 166.0 Background Roots (n = 8)
Al µg/g 613 1018.25 2630 13475 22800
As µg/g 1.3 4.2 5.1 10.7 21.3
Co µg/g 0.31 0.54 1.00 2.82 3.88
Cr µg/g 0.05 0.05 1.15 7.91 15 Cu µg/g 7.57 9.57 9.94 11.77 17.80
Pb µg/g 0.26 1.42 2.01 7.14 8.88
Zn µg/g 14.5 30.7 37.5 45.1 60.3

340
Table I.3
. C
once
ntra
tions
of
Al,
As,
Co,
Cr,
Pb,
Zn
in a
bove
gro
und
part
s (s
tem
s) a
nd b
elow
gro
und
part
s (r
oots
) of
Acr
ostich
um s
pecios
um (
Man
grov
e F
ern,
sam
ple
ID =
MF
) sam
ples
col
lect
ed f
rom
Eas
t Tri
nity
.
Sam
ple
MF
-1
MF
-2
MF
-3
MF
-5
MF
-6
MF
-7
MF
-15
MF
-16
MF
-4
MF
-8
MF
-9
MF
-10
MF
-11
MF
-12
MF
-13
MF
-14
Typ
e IA
ASS
IA
ASS
IA
ASS
IA
ASS
IA
ASS
IA
ASS
IA
ASS
IA
ASS
B
G
BG
B
G
BG
B
G
BG
B
G
BG
St
ems
Al µ
g/g
9.11
36
7 66
.1
188
396
442
20.9
98
.1
174
432
103
79.5
16
9 74
.1
88.1
10
6
As
µg/g
0.
50
0.50
0.
50
0.50
0.
50
0.50
0.
50
0.50
0.
50
0.50
0.
50
0.50
0.
50
0.50
0.
50
0.50
Co
µg/g
0.
05
0.35
0.
05
0.83
0.
28
0.42
0.
05
0.05
0.
16
0.14
0.
05
0.05
0.
11
0.05
0.
05
0.05
Cr
µg/g
0.
42
0.74
0.
73
1.00
0.
71
0.82
0.
97
1.52
0.
76
0.05
0.
05
0.24
0.
05
1.65
0.
11
0.15
Cu
µg/g
8.
2 5.
5 4.
0 5.
6 5.
6 2.
0 11
.4
7.0
5.8
6.5
8.0
5.6
4.8
7.1
4.3
3.3
Pb
µg/g
0.
03
0.08
0.
03
0.03
0.
08
0.03
0.
22
0.23
0.
05
0.45
0.
19
0.14
0.
13
0.18
0.
13
0.17
Zn
µg/g
6.
1 12
.4
5.3
15.6
12
.0
12.7
12
.9
11.4
10
.1
9.6
7.5
9.8
7.6
8.9
7.4
8.5
Roo
ts
Al µ
g/g
858
3080
87
1 34
4 4.
3 35
3 49
30
2760
11
70
3460
38
90
1500
27
90
2150
22
40
2540
As
µg/g
0.
50
3.00
1.
11
0.50
1.
69
1.98
18
.10
95.4
0 0.
50
1.27
6.
02
5.95
1.
06
0.50
1.
67
8.56
Co
µg/g
0.
27
1.06
0.
09
0.94
0.
37
0.32
1.
50
0.49
0.
32
0.27
1.
13
0.60
0.
37
0.20
0.
44
1.63
Cr
µg/g
1.
28
2.09
1.
55
1.06
3.
06
0.84
1.
47
4.23
1.
24
0.05
0.
90
0.05
0.
49
0.05
0.
47
0.93
Cu
µg/g
16
.7
7.1
5.5
12.9
6.
5 3.
7 6.
5 4.
1 8.
3 8.
8 5.
8 6.
2 8.
1 6.
6 5.
9 5.
8
Pb
µg/g
0.
52
1.68
0.
31
0.10
0.
76
0.06
8.
74
5.83
0.
98
2.53
2.
31
1.88
1.
84
1.46
1.
26
1.64
Zn
µg/g
9.
5 11
.2
5.5
11.8
2.
5 8.
7 10
.3
18.6
11
.4
8.7
7.2
17.4
10
.8
8.4
9.8
16.0

341
Table I.4
. C
once
ntra
tions
of
Al,
As,
Co,
Cr,
Pb,
Zn
in a
bove
gro
und
part
s (s
tem
s) a
nd b
elow
gro
und
part
s (r
oots
) of
the
Pas
palu
m v
agin
atum
(G
rass
, sam
ple
ID =
PV
) sa
mpl
es c
olle
cted
fro
m E
ast T
rini
ty.
Sam
ple
PV
-1
PV
-2
PV
-4
PV
-5
PV
-6
PV
-7
PV
-15
PV
-16
PV
-3
PV
-8
PV
-9
PV
-10
PV
-11
PV
-12
PV
-13
PV
-14
Typ
e IA
ASS
IA
ASS
IA
ASS
IA
ASS
IA
ASS
IA
ASS
IA
ASS
IA
ASS
B
G
BG
B
G
BG
B
G
BG
B
G
BG
St
ems
Al µ
g/g
849
916
540
656
1.33
11
40
138
448
2200
5.
98
5170
30
80
6260
3.
89
3800
29
80
As
µg/g
0.
50
0.50
0.
50
0.46
1.
09
1.48
0.
50
1.08
1.
38
2.77
1.
22
0.50
1.
44
0.50
1.
50
1.28
Co
µg/g
0.
17
0.53
0.
21
1.24
0.
23
0.63
0.
05
0.05
0.
83
1.19
0.
62
0.36
0.
91
0.63
0.
75
0.51
Cr
µg/g
0.
79
0.60
0.
76
0.89
0.
93
0.98
3.
48
0.36
1.
38
4.40
3.
07
2.06
4.
05
3.15
3.
14
1.47
Cu
µg/g
14
.1
9.1
10.4
5.
0 4.
1 1.
8 7.
1 6.
7 10
.9
5.6
4.4
4.3
5.6
5.5
5.2
4.4
Pb
µg/g
0.
26
0.27
0.
43
0.13
0.
39
0.35
0.
23
0.40
1.
39
2.22
1.
63
1.08
1.
95
1.45
1.
57
1.21
Zn
µg/g
16
.3
13.7
34
.3
18.6
16
.7
16.5
18
.5
58.2
27
.2
18.2
12
.8
9.6
17.6
14
.5
9.4
12.9
R
oots
Al µ
g/g
1350
41
8 22
10
591
986
426
871
1790
61
3 26
30
713
1120
58
80
1970
0 22
800
1140
0
As
µg/g
3.
22
2.69
1.
52
4.57
7.
44
9.51
2.
39
38.8
0 1.
27
5.06
2.
95
5.14
4.
63
10.6
0 10
.90
21.3
0
Co
µg/g
1.
17
0.28
0.
91
1.57
2.
74
0.77
0.
92
0.28
0.
31
0.46
0.
57
0.78
1.
63
3.88
3.
32
2.65
Cr
µg/g
0.
95
0.81
1.
58
1.06
1.
53
1.86
0.
05
0.79
1.
15
0.05
0.
05
0.05
3.
65
12.0
0 15
.00
6.55
Cu
µg/g
28
.4
12.2
18
.0
6.5
4.6
1.7
15.6
13
.7
17.8
7.
6 9.
9 8.
9 10
.9
12.6
9.
8 11
.5
Pb
µg/g
2.
01
0.34
2.
15
0.63
1.
08
0.63
0.
91
1.64
0.
26
2.01
1.
04
1.55
2.
63
6.59
8.
88
8.78
Zn
µg/g
87
.2
7.7
80.6
47
.8
12.4
11
.2
55.3
16
6.0
14.5
42
.2
33.6
22
.2
60.3
37
.5
42.2
53
.8
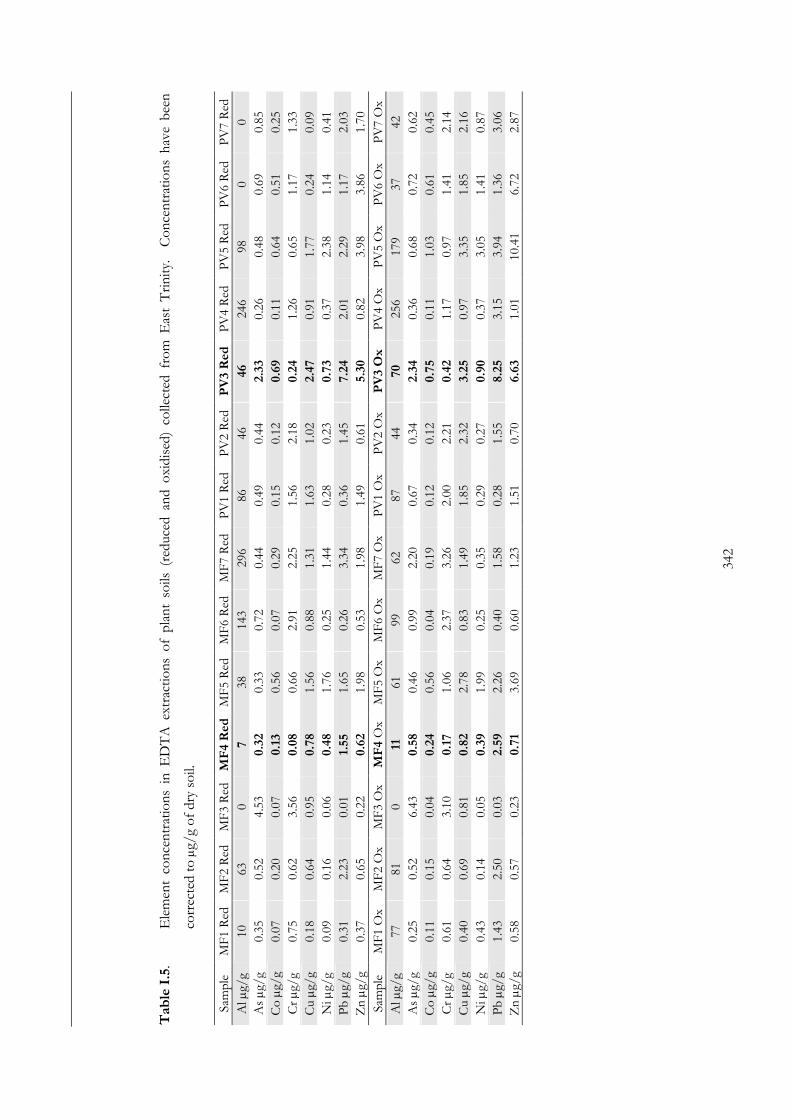
342
Table I.5
. E
lem
ent
conc
entr
atio
ns i
n E
DT
A e
xtra
ctio
ns o
f pl
ant
soils
(re
duce
d an
d ox
idis
ed)
colle
cted
fro
m E
ast
Tri
nity
. C
once
ntra
tions
hav
e be
en
corr
ecte
d to
µg/
g of
dry
soi
l.
Sam
ple
MF
1 R
ed
MF
2 R
ed
MF
3 R
ed MF4 Red
M
F5
Red
M
F6
Red
M
F7
Red
P
V1
Red
P
V2
Red
PV3 Red
P
V4
Red
P
V5
Red
P
V6
Red
P
V7
Red
A
l µg/
g 10
63
0
7 38
14
3 29
6 86
46
46
24
6 98
0
0 A
s µg
/g
0.35
0.
52
4.53
0.32
0.
33
0.72
0.
44
0.49
0.
44
2.33
0.
26
0.48
0.
69
0.85
C
o µg
/g
0.07
0.
20
0.07
0.13
0.56
0.
07
0.29
0.
15
0.12
0.69
0.
11
0.64
0.
51
0.25
C
r µg
/g
0.75
0.
62
3.56
0.08
0.
66
2.91
2.
25
1.56
2.
18
0.24
1.
26
0.65
1.
17
1.33
C
u µg
/g
0.18
0.
64
0.95
0.78
1.
56
0.88
1.
31
1.63
1.
02
2.47
0.
91
1.77
0.
24
0.09
N
i µg/
g 0.
09
0.16
0.
06
0.48
1.
76
0.25
1.
44
0.28
0.
23
0.73
0.
37
2.38
1.
14
0.41
P
b µ
g/g
0.31
2.
23
0.01
1.55
1.
65
0.26
3.
34
0.36
1.
45
7.24
2.
01
2.29
1.
17
2.03
Z
n µ
g/g
0.37
0.
65
0.22
0.62
1.
98
0.53
1.
98
1.49
0.
61
5.30
0.
82
3.98
3.
86
1.70
Sa
mpl
e M
F1
Ox
MF
2 O
x M
F3
Ox
MF4
Ox
MF
5 O
x M
F6
Ox
MF
7 O
x P
V1
Ox
PV
2 O
x PV3 Ox
PV
4 O
x P
V5
Ox
PV
6 O
x P
V7
Ox
Al µ
g/g
77
81
0 11
61
99
62
87
44
70
256
179
37
42
As
µg/g
0.
25
0.52
6.
43
0.58
0.
46
0.99
2.
20
0.67
0.
34
2.34
0.
36
0.68
0.
72
0.62
C
o µg
/g
0.11
0.
15
0.04
0.24
0.
56
0.04
0.
19
0.12
0.
12
0.75
0.
11
1.03
0.
61
0.45
C
r µg
/g
0.61
0.
64
3.10
0.17
1.06
2.
37
3.26
2.
00
2.21
0.42
1.
17
0.97
1.
41
2.14
C
u µg
/g
0.40
0.
69
0.81
0.82
2.
78
0.83
1.
49
1.85
2.
32
3.25
0.
97
3.35
1.
85
2.16
N
i µg/
g 0.
43
0.14
0.
05
0.39
1.
99
0.25
0.
35
0.29
0.
27
0.90
0.
37
3.05
1.
41
0.87
P
b µ
g/g
1.43
2.
50
0.03
2.59
2.
26
0.40
1.
58
0.28
1.
55
8.25
3.
15
3.94
1.
36
3.06
Z
n µ
g/g
0.58
0.
57
0.23
0.71
3.69
0.
60
1.23
1.
51
0.70
6.63
1.
01
10.4
1 6.
72
2.87

343
AP
PE
ND
IX J
. D
AT
A F
OR
ED
DS,
ED
TA
AN
D D
TP
A E
XT
RA
CT
ION
S O
F A
SS S
AM
PL
ES
Table J.1
. E
DT
A,
DT
PA
and
ED
DS
leac
h el
emen
t da
ta f
rom
ASS
sam
ples
. E
lem
ents
wer
e de
term
ined
usi
ng I
CP
-MS/
OE
S te
chni
ques
. D
ry m
ass
is i
n
gram
s.
Sam
ple
DP
2-01
D
P2-
02
DP
2-03
D
P2-
04
DP
2-05
D
P2-
06
DP
2-07
W
P2-
01
WP
2-02
W
P2-
03
WP
2-04
W
P2-
05
WP
2-06
W
P2-
07
Bla
nk
Dry
Mas
s
0.84
99
0.83
95
0.78
55
0.80
08
0.75
54
0.72
8 0.
7637
0.
7472
0.
76
0.76
03
0.73
86
0.70
51
0.69
94
0.67
93
- EDTA
Al p
pb
1080
0 62
20
2180
20
1 25
8 38
7 14
60
2440
13
20
2800
47
40
4310
36
20
4000
<
= 0
.5
As
ppb
42.9
94
57
.1
53
60.7
74
.6
131
78.3
82
.2
115
246
283
441
463
0.59
5 C
o pp
b 19
.7
8.28
5.
22
4.86
4.
55
4.07
94
.9
21.8
4.
17
5.7
17.8
25
.5
26.4
24
.5
<=
0.0
5 C
r pp
b 15
3 31
8 19
8 16
6 16
6 13
1 81
.6
69.2
12
7 15
7 17
1 14
2 12
8 13
2 5.
1 C
u pp
b 23
5 17
9 12
3 11
7 29
0 29
7 19
5 82
.4
115
65.6
55
.4
38.5
32
37
.6
6.65
F
e pp
b 10
7000
10
1000
73
500
9780
0 51
700
6020
0 78
000
8860
0 16
5000
14
6000
42
300
2870
0 25
100
2550
0 40
.8
Mn
ppb
1320
60
4 33
2 40
6 39
1 51
1 90
7 29
8 43
1 47
6 49
3 29
9 35
2 31
0 0.
146
Ni p
pb
59.6
19
12
.2
14.6
12
.1
15.3
64
40
.8
25.4
30
.2
40.3
44
.4
48.3
49
.9
0.57
2 P
b pp
b 38
.4
14.9
6.
33
6.1
54
110
209
227
404
257
331
252
387
405
1.61
Z
n pp
b 11
1 64
.8
44.5
60
.1
57.3
75
.1
87.1
72
.9
61.9
59
.9
112
86.9
10
1 10
0 22
.4
DTPA
Al p
pb
3400
29
40
3780
16
10
959
722
267
1310
10
30
1390
11
800
6420
76
00
1100
0 <
= 0
.5
As
ppb
3.3
10.2
9.
81
5.34
3.
39
4.51
4.
04
11.8
12
.2
14.8
54
.4
49.9
75
.8
76.3
<
= 0
.5
Co
ppb
7.39
5.
9 5.
23
3.08
3.
54
2.99
71
.4
17.8
2.
78
3.46
14
.4
19.7
46
.3
20
<=
0.0
5 C
r pp
b 24
.9
34.8
36
.9
33.9
31
.8
30.3
27
.6
34.3
36
.1
36.9
50
.1
41.8
39
.2
42.2
24
.5
Cu
ppb
26.6
62
.1
58.1
24
.2
147
133
36.4
19
.5
22.7
7.
29
23.1
18
.5
31.4
26
.7
6.63
F
e pp
b 19
700
3660
0 39
400
3840
0 34
600
3780
0 33
800
4670
0 50
100
4840
0 35
000
2370
0 23
000
2560
0 25
7 M
n pp
b 31
6 38
6 29
7 10
2 28
1 27
3 18
1 99
.8
103
87.1
34
9 24
1 27
7 26
5 <
= 0
.05
Ni p
pb
21.8
11
.5
10.9
11
.2
7.83
7.
92
32.1
20
.4
8.83
11
.1
22.3
24
.8
41.9
29
.8
0.37
P
b pp
b 1.
53
2.05
0.
922
0.46
7 23
.1
37.1
15
.2
22.9
18
.6
17.1
23
7 17
8 26
0 28
0 <
= 0
.01
Zn
ppb
47.4
64
.3
81.7
39
.8
104
52.8
42
.8
41.9
27
.8
27.2
96
.7
56.3
68
.7
68
14.8
EDDS
Al p
pb
2220
0 37
00
2640
27
3 26
1 13
20
3520
67
10
2470
44
00
7290
89
90
8000
90
20
<=
0.5
A
s pp
b 50
.8
70.6
63
.2
46.2
47
.8
58.2
98
.4
116
85.8
11
2 23
6 27
5 41
8 43
7 7.
54
Co
ppb
19.7
7.
94
7.08
4.
83
4.55
4.
52
113
30.2
4.
17
5.69
20
.2
30.5
31
.4
26.2
<
= 0
.05
Cr
ppb
245
462
473
372
376
358
269
115
140
158
245
256
235
246
7.52
- T
able
Con
tinue
d N
ext P
age
-

344
Table J.1
. (C
ontin
ued)
ED
TA
, DT
PA
and
ED
DS
leac
h el
emen
t da
ta f
rom
ASS
sam
ples
. E
lem
ents
wer
e de
term
ined
usi
ng I
CP
-MS/
OE
S te
chni
ques
. D
ry
mas
s is
in g
ram
s.
Sam
ple
DP
2-01
D
P2-
02
DP
2-03
D
P2-
04
DP
2-05
D
P2-
06
DP
2-07
W
P2-
01
WP
2-02
W
P2-
03
WP
2-04
W
P2-
05
WP
2-06
W
P2-
07
Bla
nk
Cu
ppb
261
180
178
126
293
313
230
194
169
135
94.1
74
.8
81.6
90
19
.8
Fe
ppb
8990
0 59
600
6920
0 70
600
2840
0 42
100
6720
0 13
5000
19
1000
15
6000
35
300
2530
0 22
200
2210
0 16
1 M
n pp
b 13
50
639
579
390
399
520
945
434
393
406
503
325
319
313
4.41
N
i ppb
67
.2
20.4
20
.1
14.9
13
.3
15.2
73
.4
67.4
28
34
.3
46.8
56
.2
66.3
58
.8
1.61
P
b pp
b 20
.7
9.06
7.
74
6.49
39
.3
79.2
14
4 21
1 18
8 15
3 30
8 21
9 26
0 26
4 3.
95
Zn
ppb
116
69.8
65
.7
58.4
55
.4
77.4
85
.7
99.1
72
.5
61.9
12
4 91
.9
111
106
28.8