british hospitality: trends &...
TRANSCRIPT
BRitish hospitality:tRends & developments2012 REPORT
In association with

I N A SS O C I AT I O N W I T H
The association’s report – Creating Jobs in Britain: A Hospitality Economy Proposition – called on the government to work as a positive partner with the hospitality industry to realise the following objectives:
• To create 236,000 additional jobs throughout the hospitality industry by 2015.
• To make Britain a world-class destination for hospitality, tourism and business.
• To work in partnership with industry to propel hospitality’s contribution to economic recovery, rebalancing growth and the regeneration of local communities.
• To harness the knowledge and capabilities of members of the BHA to help transform the efficiency and commercialism of the public sector, without additional burdens of cost on government or industry.
BHA’s Aims And OBjEcTivEs
Compiled for the British Hospitality Association by Wordsmith and Company
Editors: Miles Quest and Diane Needham
Designed by: Creative Heads Ltd
British Hospitality Association Queens House 55-56 Lincoln’s Inn Fields London WC2A 3BH Tel: 020 7404 7744 Fax: 020 7404 7799 Email: [email protected] www.bha.org.uk
The British Hospitality Association, incorporating the Restaurant Association, the national trade association for the hotel, food service and leisure industry, celebrated its centenary in 2007. It has in membership almost every publicly quoted hotel group, many independent hotels, restaurants and clubs, major food and service management companies, motorway service operators and many local hotel associations. In total, it represents over 45,000 establishments, including 350,000 hotel rooms.
The association promotes the interests of the entire industry to government ministers, Members of Parliament and officials in Westminster, Edinburgh, Cardiff and Brussels, to other relevant organisations, the City and the media. In this capacity, it focuses on the potential impact of proposed UK and European legislation and seeks to ensure that the industry’s concerns are fully taken into account in the consultative process.
The association also aims to lead the industry towards better business practices, thus improving quality and, more specifically, to support members in order to make their businesses more efficient and more profitable.
Although every effort has been made to check the accuracy of the information in this publication, the association does not accept responsibility for any errors or omissions.
Trends & Developments 1Trends & Developments 1
3 Shaping informed operations, investment and strategic decisions UfiIbrahim,chiefexecutive,BritishHospitalityAssociation
5 Harnessing the power of the online world MarkRoper,AmericanExpress
6 TOURism
12 UK HOTEL indUsTRY
13 Economic outlook: a long and winding road back to the recovery DavidFenton,SeniorEconomist,RBSGroup
15 Total UK hotel construction exceeds £20bn in past decade MelvinGold,Consultant
18 2012 – A year of activity AndrewTaylor,HeadofLeisureforCommercialBankingatNatWestandRBS
28 Is the UK hotel industry stuck in the middle of a ‘lost decade’? JeremyHill,director,Christie+Co
31 Branding is key to hotel growth MelvinGold,consultant
36 UK cATERnG indUsTRY
37 Bright spots after a disappointing four years PeterBackman,managingdirector,Horizons
44 Eating-out continues – but few property transactions SimonChaplin,director,Christie+Co
47 PUBs
48 An undervalued sector stimulates investor attention NeilMorgan,director,Christie+Co
52 cOnFEREncEs And mEETinGs
54 EmPLOYmEnT And QUALiFicATiOns
60 TimEsHARE
61 UK market strong for shared-holiday ownership product AndyMiln,regionaldirector,RCI
65 dATA TABLEs
66 Tourism: Tables1-17
71 UK hotel industry: Tables18-62
102 UK catering industry: Tables63-73
105 Employment and qualifications: Tables74-83
108 BiBLiOGRAPHY And AddREssEs
cOnTEnTs

2 Trends & Developments2 Trends & Developments
I N T RO DU C T I O N
I N T RO DU C T I O N
Trends & Developments 3Trends & Developments 3
Ufi Ibrahim, Chief Executive, British Hospitality Association
sHAPinG inFORmEd OPERATiOns, invEsTmEnT And sTRATEGic dEcisiOns
Appreciation of short, medium and long-term trends in the business environment is critical to shaping informed operations, investment and strategic decisions. Trends & Developments is the British Hospitality industry’s unique reference tool, amalgamating year-on-year data, tracking change across the restaurant, food service, accommodation, timeshare, and meetings sectors of the United Kingdom.
At the outset, I would like to express my sincere thanks to all the industry experts who contributed data, research and insights. I’d also like to underline our appreciation for the support of the sponsors of this publication – American Express, Christie & Co, Natwest and RBS. With their backing and input, this issue of Trends&Developments offers the user a comprehensive appreciation of a broader range of changes that are shaping British Hospitality.
Looking back to 2012 - an extraordinary year for the UK and for the Hospitality industry - exceptional events including the Queen’s Diamond Jubilee, and the Olympic & Paralympic Games, affected business performance at varying degrees. While not all Hospitality & Tourism related sectors saw a short term gain, there is an opportunity to reap rewards in the medium term.
By showcasing British Hospitality at its best on a global platform, coupled with the heightened visibility enjoyed by the UK during the Games and thereafter through the GREAT campaign, the UK aims to maximize the Hospitality & Tourism returns of the Olympics investment.
Fourteen million meals were served by Hospitality businesses during the Games, 70,000 Games-makers were recruited and trained, thousands of athletes and members of the Olympic family were accommodated and catered for. Some 4 billion global viewers tuned into some part of the Games, including the Olympics Closing Ceremony during which the President of the International Olympic Committee praised British Hospitality for our outstanding welcome and service.
There is no doubt that British Hospitality is world leading in many regards, and increasingly the world’s attention turns not only to what, but also how our industry responds to major events, evolving consumer behavior, the digital revolution, branding, as well as the development of talent and skills. As our industry context becomes more complex, so too will the challenge of staying ahead of the curve. The role of information, and the effective application of this intelligence will become even more critical in advancing competitive growth.
2012 also recorded a breakthrough in the number of international arrivals worldwide which reached 1 billion for the first time in history. The UNWTO forecasts continued growth, averaging some 43 million additional international trips per year. Much of this growth emanates from the rising incomes per capita in emerging economies. The more wealth people have, the more they want travel and enjoy the hospitality offered by international destinations. This trend bodes well for our industry in the UK. There is a real opportunity for export-led growth, which in turn can create new jobs and economic growth across the entire UK.
However, growth cannot be taken for granted. Just as businesses must become more responsive and effective in tackling change in a competitive and complex global market, so too must government. Public policy can make or break the ambition of our industry to generate employment and prosperity across the UK.
Over the past year, the British Hospitality industry rose above several challenges, not least the sluggish economy and continued squeeze on real household disposable incomes. Public expenditure cuts affected government spend on meetings and conferences, while uncertainty impacted on some B-to-B markets.
In his recent budget statement (5 December 2012), the UK Chancellor of the Exchequer warned that the ‘period of austerity’ was expected to continue to 2015. The Treasury appears to be unwavering on efforts to tackle the budget deficit and to reduce the size of the state. Sound policy decisions are dependent on evidence, intelligence and understanding of the consequences on UK plc.
The BHA is the authority on British Hospitality, and we are committed to delivering much needed research, and ensuring that businesses, investors and policy-makers, may be equipped with the facts necessary to make informed decisions to unlock Hospitality’s potential to create 475,000 jobs by 2020.

4 Trends & Developments4 Trends & Developments
I N T RO DU C T I O N

I N T RO DU C T I O N
Trends & Developments 5Trends & Developments 5
by Mark Roper, Vice President & General Manager, UK Merchant Services at American Express
HARnEssinG THE POwER OF THE OnLinE wORLd
The past few years have been notable for the speed at which technology has shaped and changed our industry, and 2012 has been no exception. Social media, online marketing and digital partnerships continue to take precedence as merchants look to communicate with their customers on a much larger scale, in newer and more innovative ways.
Whilst the advent of these new forms of communication might initially seem overwhelming we need to recognise that they’re here to stay – and we need to work out how we’re going to make the most of the possibilities that they offer. Some parts of the industry have already embraced the opportunity: exciting partnerships between businesses in the sector are thriving, and the prospect of a much larger online audience is proving difficult to ignore.
Over the past few years, social media has become an increasingly important part of our lives, especially for Generation Y who look to their social networks to remain connected at all times. Bloggers have become a widely-read and well-respected source of information for everything from holiday destinations to the latest restaurant openings; Twitter provides a channel for people to share their recommendations and experiences with one another instantly.
These new forms of communication have the power to revolutionise the way we all do business.
As a result, those in the hospitality industry have a new medium through which to attract and service customers, by being able to receive and manage bookings online, facilitating global bookings with an unprecedented level of simplicity for the customer. Online channels provide a golden opportunity to small merchants, who might not have resources for expensive marketing campaigns, to get their message across to a wider audience than traditional marketing mediums; and big and small companies alike are able to engage more efficiently and effectively with their customers.
American Express is continuing to focus on partnerships and has embraced innovative digital ventures delivering value to merchants though Cardmember spend in 2012.
One example is our partnership with FourSquare. This innovative new collaboration in the UK offers our Cardmembers exclusive location-based deals with a variety of businesses
across the country, including some of the best-known restaurant chains.
Realise the Potential London, an online magazine and iPhone & iPad app, was launched in Q2 2012 to help local and visiting Cardmembers make the most of their time in London. With compelling information and merchant offers, the campaign enabled businesses to be promoted to local Londoners, incoming tourists and business travellers.
For our partners in the restaurant sector, we’ve continued our support of Top Treats in partnership with Toptable, as well as the London Restaurant Festival to drive awareness and footfall to some of the capital’s most exciting restaurants. Rewarding Cardmembers for restaurant spend has encouraged them to dine out and dine out more frequently, visiting personal favorites and trying something new.
Social media enables American Express to bring our support of the industry, and the partnerships, to a much wider audience. Through online channels, we’re able to communicate these opportunities to both our merchants and our Cardmembers.
As we head into 2013 and beyond, and the influence of digital and social media increases even further, ways of working together to harness the power of the online world will become increasingly significant. Social media has made its presence felt in the hospitality industry, and it’s undoubtedly here to stay. With the enormous potential that the digital sphere has to revolutionise the way we all do business, embracing these times of change and making use of strong partnerships and innovations will help us all make the most of the opportunities at our fingertips.
We’re very pleased, once again, to sponsor BritishHospitality:TrendsandDevelopments. The BHA provides important support and insight throughout the year to those of us working in the hospitality industry, and this report continues to be vital reading as we plan for the year ahead.

6 Trends & Developments
TO U RISM
touRism

Trends & Developments 7
TO U RISM
Recovery has come at different speeds – stronger in emerging economies (up eight per cent) than in developed economies (up five per cent). This recovery is continuing into 2012 with international tourist arrivals growing by five per cent in the first half of 2012 to 467m and on track to reach one billion tourists by the end of the year.
The majority of destinations that had not exceeded pre-crisis levels in 2010 did so in 2011. Contrary to the long-term trend, advanced economies (+4.9 per cent) posted higher growth than emerging economies (+4.3 per cent) due largely to strong growth in Europe and the setbacks in the Middle East and North Africa.
The annual average growth rate of over four per cent in the number of travellers between 1970 and 2000 is forecast to moderate in the period 2010-2030, with the number of international tourist arrivals worldwide rising by an average 3.3 per cent per year. As a result, an average of 43m additional international tourists will join the tourism marketplace every year.
International tourism receipts continued their recovery in 2011, reflecting the increase in arrivals during the year, reaching a record US$1 trillion for the first time. Growth is estimated at 3.9 per cent in 2011, measured in real terms. By region, the Americas (+5.7 per cent) recorded the largest increase followed by Europe (+5.2 per cent), Asia and the Pacific (+4.4 per cent) and Africa (+2.2 per cent). The Middle East was the only region posting negative growth (-14 per cent).
In 2011, Europe attracted 51.3 per cent of tourism arrivals but 45 per cent of tourism expenditure in 2011 – up 6.2 per cent on 2010.
The rise of China as a tourist destination is noticeable. Having overtaken both the UK and Italy in recent years in terms of arrivals, it has now overtaken Spain to third place, while it is fourth in terms of receipts. If Hong Kong and Macao were included, China would be second only to the USA in terms of receipts, and third (after USA and France) in terms of arrivals.
(Tables1-4,page66)
In 2011, world tourism continued to rebound from the setbacks of 2008/2009. In 2009 the number of international arrivals fell back to just above 2006 levels, dropping by 4.2 per cent with receipts falling by 9.5 per cent. A strong rebound in 2010 – up 6.6 per cent on 2009 figures – saw arrivals reach a record 940m, which again increased in 2011 by 4.6 per cent to reach a further record of 983m with receipts more than US$1 trillion in 2011.
wORLd TOURism GROws APAcE
43m additional international tourists will join the tourism marketplace every year.
1990
451 million
983 million
2011
118% increase
International tourist arrivals
Growth rate in 2011
4.6%
$1 trillionInternational arrival receipts in 2011
TO U RISM
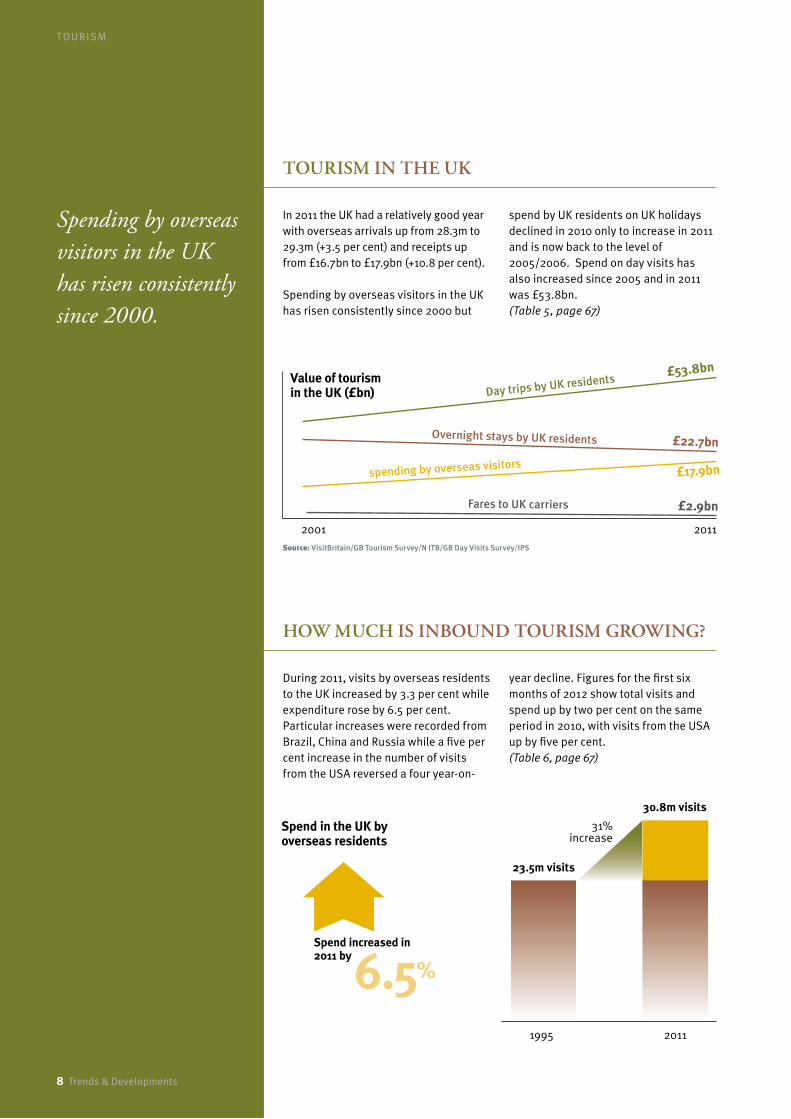
Spending by overseas visitors in the UK has risen consistently since 2000.
TOURism in THE UK
In 2011 the UK had a relatively good year with overseas arrivals up from 28.3m to 29.3m (+3.5 per cent) and receipts up from £16.7bn to £17.9bn (+10.8 per cent). Spending by overseas visitors in the UK has risen consistently since 2000 but
spend by UK residents on UK holidays declined in 2010 only to increase in 2011 and is now back to the level of 2005/2006. Spend on day visits has also increased since 2005 and in 2011 was £53.8bn.(Table5,page67)
1995
23.5m visits
2011
30.8m visits
6.5%Spend increased in 2011 by
HOw mUcH is inBOUnd TOURism GROwinG?
During 2011, visits by overseas residents to the UK increased by 3.3 per cent while expenditure rose by 6.5 per cent. Particular increases were recorded from Brazil, China and Russia while a five per cent increase in the number of visits from the USA reversed a four year-on-
year decline. Figures for the first six months of 2012 show total visits and spend up by two per cent on the same period in 2010, with visits from the USA up by five per cent. (Table6,page67)
2001
spending by overseas visitors
Overnight stays by UK residents
Fares to UK carriers
2011
£17.9bn
£22.7bn
£2.9bn
Day trips by UK residents£53.8bn
Value of tourism in the UK (£bn)
31% increase
Spend in the UK by overseas residents
8 Trends & Developments
Source: VisitBritain/GB Tourism Survey/N ITB/GB Day Visits Survey/IPS
Trends & Developments 9
TO U RISM
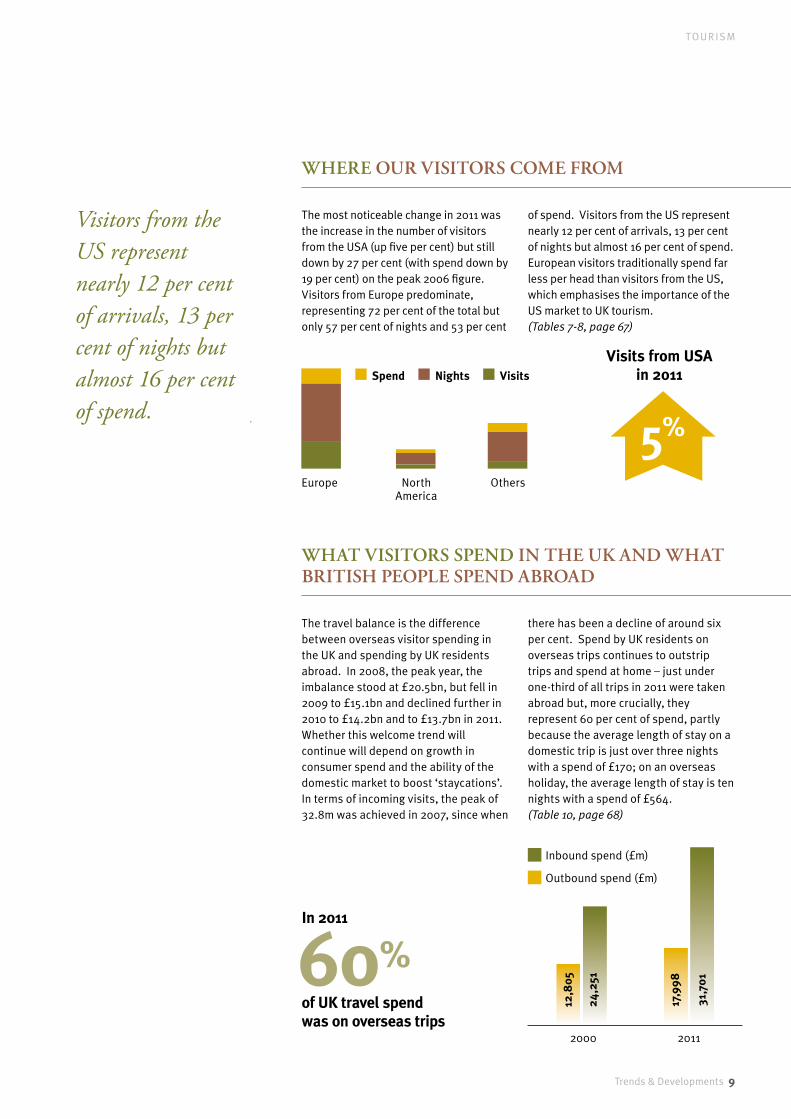
Visitors from the US represent nearly 12 per cent of arrivals, 13 per cent of nights but almost 16 per cent of spend.
wHERE OUR visiTORs cOmE FROm
The most noticeable change in 2011 was the increase in the number of visitors from the USA (up five per cent) but still down by 27 per cent (with spend down by 19 per cent) on the peak 2006 figure. Visitors from Europe predominate, representing 72 per cent of the total but only 57 per cent of nights and 53 per cent
of spend. Visitors from the US represent nearly 12 per cent of arrivals, 13 per cent of nights but almost 16 per cent of spend. European visitors traditionally spend far less per head than visitors from the US, which emphasises the importance of the US market to UK tourism.(Tables7-8,page67)
wHAT visiTORs sPEnd in THE UK And wHAT BRiTisH PEOPLE sPEnd ABROAd
The travel balance is the difference between overseas visitor spending in the UK and spending by UK residents abroad. In 2008, the peak year, the imbalance stood at £20.5bn, but fell in 2009 to £15.1bn and declined further in 2010 to £14.2bn and to £13.7bn in 2011. Whether this welcome trend will continue will depend on growth in consumer spend and the ability of the domestic market to boost ‘staycations’. In terms of incoming visits, the peak of 32.8m was achieved in 2007, since when
there has been a decline of around six per cent. Spend by UK residents on overseas trips continues to outstrip trips and spend at home – just under one-third of all trips in 2011 were taken abroad but, more crucially, they represent 60 per cent of spend, partly because the average length of stay on a domestic trip is just over three nights with a spend of £170; on an overseas holiday, the average length of stay is ten nights with a spend of £564.(Table10,page68)
Visits from USA in 2011
2000
Europe North America
Others
Spend Nights Visits
2011
12,8
05
24,2
51
17,9
98
31,7
0160%of UK travel spend was on overseas trips
In 2011
5%
Inbound spend (£m)
Outbound spend (£m)
10 Trends & Developments
TO U RISM
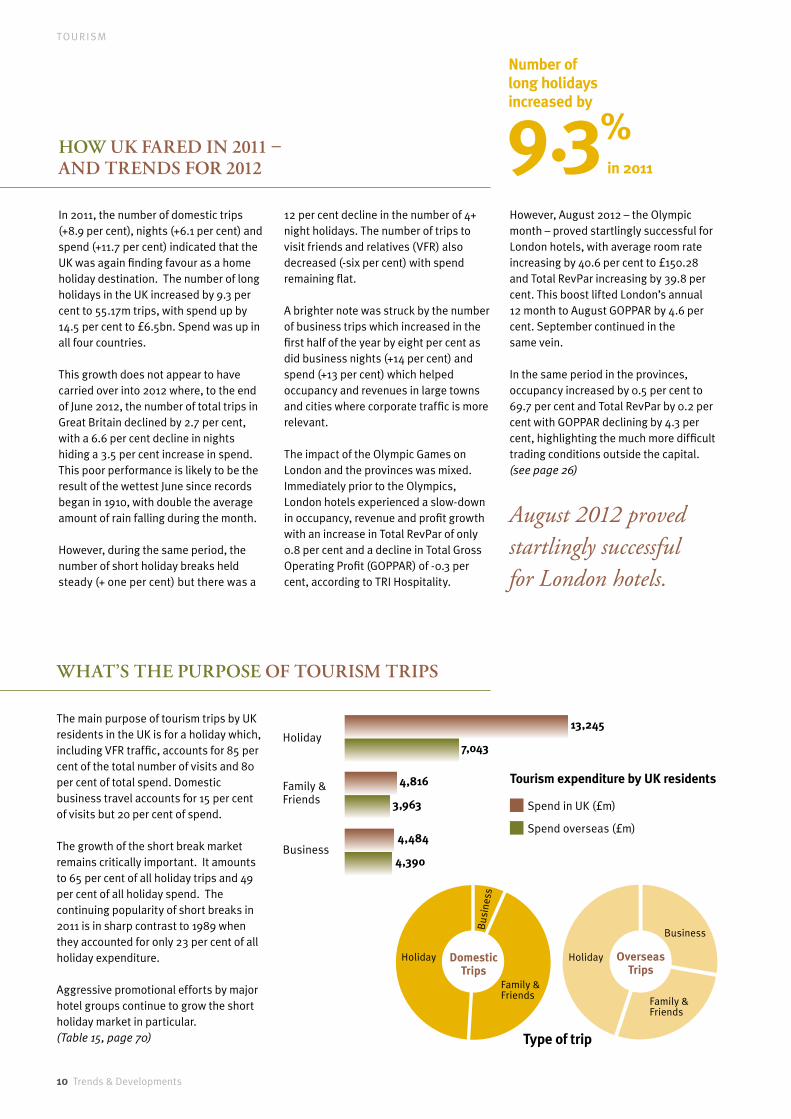
The main purpose of tourism trips by UK residents in the UK is for a holiday which, including VFR traffic, accounts for 85 per cent of the total number of visits and 80 per cent of total spend. Domestic business travel accounts for 15 per cent of visits but 20 per cent of spend.
The growth of the short break market remains critically important. It amounts to 65 per cent of all holiday trips and 49 per cent of all holiday spend. The continuing popularity of short breaks in 2011 is in sharp contrast to 1989 when they accounted for only 23 per cent of all holiday expenditure.
Aggressive promotional efforts by major hotel groups continue to grow the short holiday market in particular. (Table15,page70)
HOw UK FAREd in 2011 – And TREnds FOR 2012
In 2011, the number of domestic trips (+8.9 per cent), nights (+6.1 per cent) and spend (+11.7 per cent) indicated that the UK was again finding favour as a home holiday destination. The number of long holidays in the UK increased by 9.3 per cent to 55.17m trips, with spend up by 14.5 per cent to £6.5bn. Spend was up in all four countries.
This growth does not appear to have carried over into 2012 where, to the end of June 2012, the number of total trips in Great Britain declined by 2.7 per cent, with a 6.6 per cent decline in nights hiding a 3.5 per cent increase in spend. This poor performance is likely to be the result of the wettest June since records began in 1910, with double the average amount of rain falling during the month.
However, during the same period, the number of short holiday breaks held steady (+ one per cent) but there was a
12 per cent decline in the number of 4+ night holidays. The number of trips to visit friends and relatives (VFR) also decreased (-six per cent) with spend remaining flat.
A brighter note was struck by the number of business trips which increased in the first half of the year by eight per cent as did business nights (+14 per cent) and spend (+13 per cent) which helped occupancy and revenues in large towns and cities where corporate traffic is more relevant.
The impact of the Olympic Games on London and the provinces was mixed. Immediately prior to the Olympics, London hotels experienced a slow-down in occupancy, revenue and profit growth with an increase in Total RevPar of only 0.8 per cent and a decline in Total Gross Operating Profit (GOPPAR) of -0.3 per cent, according to TRI Hospitality.
However, August 2012 – the Olympic month – proved startlingly successful for London hotels, with average room rate increasing by 40.6 per cent to £150.28 and Total RevPar increasing by 39.8 per cent. This boost lifted London’s annual 12 month to August GOPPAR by 4.6 per cent. September continued in the same vein.
In the same period in the provinces, occupancy increased by 0.5 per cent to 69.7 per cent and Total RevPar by 0.2 per cent with GOPPAR declining by 4.3 per cent, highlighting the much more difficult trading conditions outside the capital.(seepage26)
wHAT’s THE PURPOsE OF TOURism TRiPs
Holiday
Family & Friends
Business
13,245
7,043
4,816
3,963
4,484
4,390
Spend in UK (£m)
Spend overseas (£m)
OverseasTrips
Holiday
Family & Friends
Business
Holiday
Family & Friends
Bus
ines
s
DomesticTrips
9.3%in 2011
Number of long holidays increased by
Type of trip
Tourism expenditure by UK residents
August 2012 proved startlingly successful for London hotels.
I N T RO DU C T I O NTO U RISM
Trends & Developments 11
UK REsidEnTs And visiTORs: wHERE THEY sTAY, HOw mUcH THEY sPEnd
TOTAL vALUE OF UK TOURism And LEisURE indUsTRY
vAT – And HOw THE UK is UncOmPETiTivE
In 2011, the south west, south east and north west remained the most popular regions of the country for domestic visitors in terms of trips, nights and spend, although London still earns £2.4bn from domestic visitors. The distribution of overseas visitors to Britain is markedly
different. London is by far the favourite destination and accounted for 53 per cent of all their expenditure (£9.4bn), followed, distantly, by the south east of England and Scotland.
(Table13,page69)
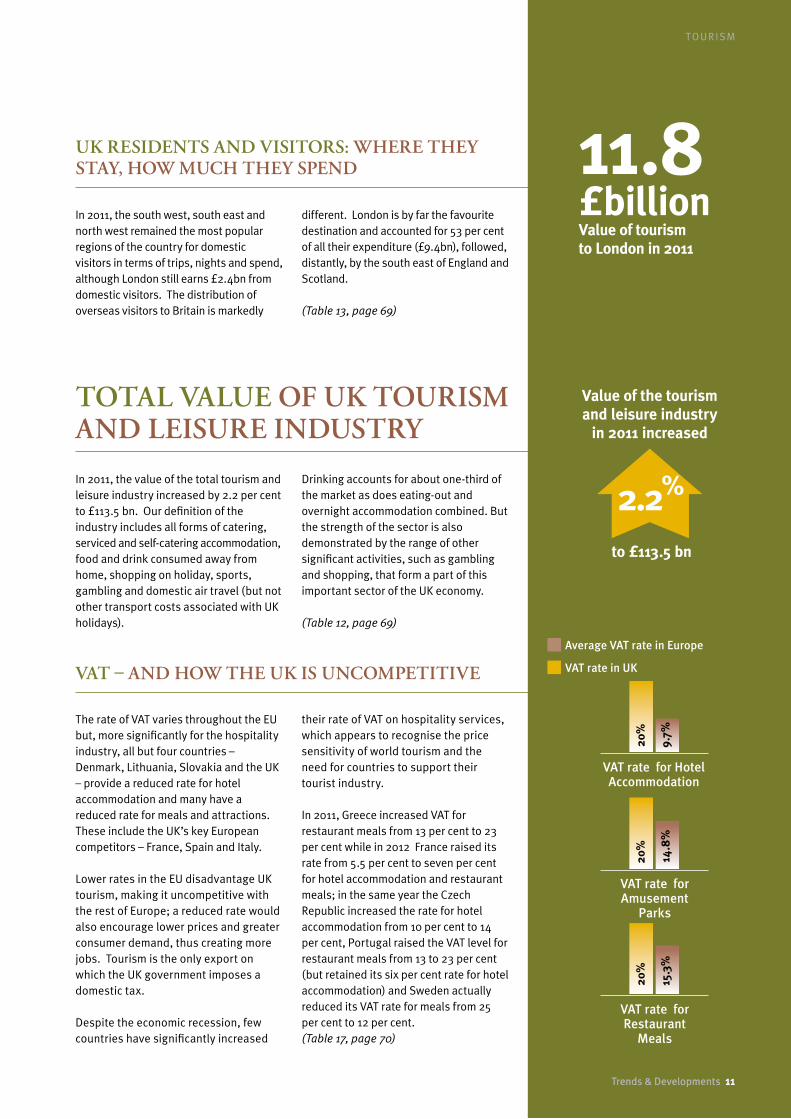
In 2011, the value of the total tourism and leisure industry increased by 2.2 per cent to £113.5 bn. Our definition of the industry includes all forms of catering, serviced and self-catering accommodation, food and drink consumed away from home, shopping on holiday, sports, gambling and domestic air travel (but not other transport costs associated with UK holidays).
Drinking accounts for about one-third of the market as does eating-out and overnight accommodation combined. But the strength of the sector is also demonstrated by the range of other significant activities, such as gambling and shopping, that form a part of this important sector of the UK economy.
(Table12,page69)
The rate of VAT varies throughout the EU but, more significantly for the hospitality industry, all but four countries – Denmark, Lithuania, Slovakia and the UK – provide a reduced rate for hotel accommodation and many have a reduced rate for meals and attractions. These include the UK’s key European competitors – France, Spain and Italy.
Lower rates in the EU disadvantage UK tourism, making it uncompetitive with the rest of Europe; a reduced rate would also encourage lower prices and greater consumer demand, thus creating more jobs. Tourism is the only export on which the UK government imposes a domestic tax.
Despite the economic recession, few countries have significantly increased
their rate of VAT on hospitality services, which appears to recognise the price sensitivity of world tourism and the need for countries to support their tourist industry.
In 2011, Greece increased VAT for restaurant meals from 13 per cent to 23 per cent while in 2012 France raised its rate from 5.5 per cent to seven per cent for hotel accommodation and restaurant meals; in the same year the Czech Republic increased the rate for hotel accommodation from 10 per cent to 14 per cent, Portugal raised the VAT level for restaurant meals from 13 to 23 per cent (but retained its six per cent rate for hotel accommodation) and Sweden actually reduced its VAT rate for meals from 25 per cent to 12 per cent.(Table17,page70)
VAT rate for Hotel Accommodation
20%
9.7%
VAT rate for Amusement
Parks
20%
14.8
%
VAT rate for Restaurant
Meals
20%
15.3
%
Average VAT rate in Europe
VAT rate in UK
11.8 £billionValue of tourism to London in 2011
Value of the tourism and leisure industry
in 2011 increased
to £113.5 bn
2.2%
Trends & Developments 11
12 Trends & Developments
H OT E L I N DUS T RY
hotel industRy

Trends & Developments 13
H OT E L I N DUS T RY
Is 2012 a turning point? David Fenton, Senior Economist, RBS Group, says that there is still a long and winding road ahead.
Let’s start with the good news:
the UK came out of its double-dip recession in Q3 2012, with the strongest growth since 2007 (+1.0 per cent q/q). As well as some truly unforgettable moments, the Olympics and Paralympics also delivered a boost to economic activity, across many sectors – including hospitality. Hotels showed greater
activity in Q3, according to National Statistics, albeit mainly in London. This continues an encouraging trend, which has seen the hospitality sector comfortably outperform the wider economy over the last couple of years.
Even so, let’s not get carried away. Economic growth was still flat in year-on-year terms in Q3, and another contraction in Q4 cannot be ruled out. The bottom line is that even if the UK economy has moved out of intensive care, it is to the high-dependency unit, and only an incurable optimist would expect a speedy recovery in 2013.
EcOnOmic OUTLOOK: A LOnG And windinG ROAd BAcK TO THE REcOvERY
by David Fenton, Senior Economist, RBS Group
KEY UncERTAinTiEs in THE GLOBAL EcOnOmY...
Looking forward, the outlook depends crucially on what happens in the global economy. That’s not because conditions at home don’t matter; far from it. Consumer spending accounts for almost half of final demand, and will be vital to the prospects for the hotel sector. But the fact is that a sustainable recovery in the UK requires a rebalancing of growth towards exports and investment. That seems almost impossible in the current environment.
There are two key uncertainties in the global economy: the US “fiscal cliff” and European debt crisis.
Of the two, the fiscal cliff is the more pressing. So pressing, in fact, that we will know the outcome by the time you read this. The fiscal cliff refers to a set of tax hikes and spending cuts, scheduled to come into effect on 1 January 2013, that would be big enough to tip the US economy back into recession. The UK
wouldn’t escape either: the global after-shock would probably be big enough to shave up to one per cent point off UK growth, according to the IMF. For an economy that’s currently flat in year-on-year terms, that could be enough to trigger a “treble dip” in 2013.
Our hope and expectation is that, by the time you read this, Congress will have done a deal. But even if the US steps back from the brink, the fiscal position will remain precarious and a source of uncertainty unless a credible plan to balance the books in the medium term has also been agreed.
If the fiscal cliff is the most pressing risk, the European debt crisis is the most worrying. Collectively, the euro area countries are the UK’s biggest trading partner and provide around half of overseas visitors, according to the International Passenger Survey.
Recent steps by the European Central Bank (ECB) have provided some welcome respite for countries like Spain and Italy. But the ECB cannot fix the crisis by itself. A sustainable solution could take many forms, including euro bonds and a banking union, which will ultimately see members acting more like a single country than a bunch of countries that happen to sit on the same continent.
Forging a stronger union won’t be easy. Germans are worried about the costs of bailing out governments in other countries, which is likely to be a key issue in the 2013 election. Meanwhile, opposition to austerity is growing in “peripheral” countries, as evidenced by strikes and violent protests in Spain and Portugal. Whatever happens, I think we can confidently predict that the European debt crisis will remain a key uncertainty for the UK in 2013.

14 Trends & Developments
H OT E L I N DUS T RY
...And cLOsER TO HOmE
PUTTinG iT ALL TOGETHER
As if that’s not enough, the UK also has plenty of home-grown uncertainties to contend with. For example, fiscal austerity has still got a long way to run. Of spending cuts, 88 per cent had yet to come into effect as of April 2012, according to the Institute for Fiscal Studies. And the debate about the effect of these cuts on the wider economy remains unsettled.
Recent research by the IMF suggested that so-called “fiscal multipliers” might be much higher than previous estimates (fiscal multipliers measure the effect of a tax or spending change on the wider economy). If so, austerity would be more costly. The key take-away from all of this
is that the public finances will continue to cast a shadow over the economic outlook.
Finally, it’s worth mentioning the rate of inflation. Consumer price inflation fell back in 2012, but was still higher than expected, higher than the two per cent target and – crucially – higher than growth in average earnings. This leaves consumers facing the toughest squeeze on real take-home pay for 30 years. ‘Short breaks’ has been one of the main areas where consumers are making cutbacks, according to the Deloitte Consumer Tracker, though the pressure has eased over the past year.
So where does all of this leave us?
Most economists – including us – expect 2013 to be a better year than 2012: +1.3 per cent from -0.1 per cent, according to Consensus Forecasts in November. Given that the hospitality sector is closely correlated with UK GDP, that should lead to an improvement in key metrics like RevPar.
Nevertheless, that would represent another sub-par performance for the UK economy, with expectations for 2014 also subdued. When it comes to the UK economy’s direction of travel, it would appear that the best we can hope for is a long and winding road back to recovery.
Most economists expect 2013 to be a better year than 2012: +1.3 per cent from -0.1 per cent.
88% of spending cuts have yet to come into effect as of April 2012
Public finances will continue to cast a shadow over the economic outlook.

Trends & Developments 15
H OT E L I N DUS T RY
TOTAL UK HOTEL cOnsTRUcTiOn ExcEEds £20bn in PAsT dEcAdE
Over 100,000 new hotel rooms have been built in the UK in the last decade, plus extensive refurbishment in leading properties and rebrandings. With total investment at well over £20bn, the industry is a key player in the UK economy.
How much has been spent building all these new hotel rooms in the UK over the past decade? Using the listing that, for well over a decade this publication has annually published, and collaborating with Gleeds, I have sought to answer that question. Although there are almost certainly some omissions in this publication’s database, it is the most comprehensive available.
From that excellent start we incorporated into the database the ability to analyse the database by brand, by region and by city as well as by the number of bedrooms.
Gleeds then took the database and incorporated construction costs on a consistent basis, taking due account of location, brand and size of hotel. They also adjusted for timing so that the end value reflects what it would have been had all construction taken place in Quarter 4 of 2012. Of course the resulting estimate is broad, so there is a risk of incompleteness or inaccuracy, but it does provide a sound basis to estimate the construction worth of the UK hotel sector over the period.
As the table on page 16 shows, the database tracks 103,612 rooms (in 983 hotels) that opened between 2003 and 2012, 26,340 (219 hotels) that have switched brands and a further 9,453 (96 hotels) that have undergone significant refurbishment. In the case of rebranding a level of capital expenditure is assumed to be spent to bring a hotel to the new brand standards when it changes brand.
This does not always amount to a full refurbishment but is usually more than simply changing the signage and costs have been estimated on a suitable basis.
It also depicts the development cycle: the highest level of new openings will be this year (2012), largely due to the Olympics. 43.3 per cent of newly opened rooms were in London. Prior to that, the peak year was in 2008, followed by 2004, 2007 and 2011.
It is a reminder that so frequently the hotel development cycle is mis-aligned with the economic cycle: the development and build period is long, and much happens in the economy from conception to opening. In recent years and, indeed, currently, it has been hard to find bank funding for new developments. Thus, in the coming years, the pace of hotel openings will most likely slow (but not stop entirely) yet the cycle will resume again and chances are that the peak number of new openings will once again align with the top of the cycle.
Using Gleeds analysis of the database we are also able to express this in financial terms which is illustrated in the following table and shows an overall estimated construction cost of £12.4bn, predominantly in new build hotels (including conversion to hotel use of existing buildings). In seven of the ten years, the construction value of completed projects in the sector exceeded £1bn, the peak in this case being in 2008 when value exceeded £1.7bn. The Olympic Year fell only slightly short of that level.
This estimate of cost takes account only of construction cost, including fit-out. It excludes the professional fees which might be up to 10 per cent of total project cost for budget and midscale properties, or 15 per cent for full service or upscale properties with a larger interior design element. The value of the land on which the hotel stands can also vary significantly and might range from 20-100 per cent of construction cost.
Thus the overall economic impact of hotel development in the UK is well beyond the £12.4bn of construction value that we estimate here; it probably stretches beyond £20bn over the past decade although it is not possible to quantify accurately.
by Melvin Gold, Hotel Industry Consultant (in collaboration with Steve Lacey, Director, Gleeds)
20 £billiontotal investment in the last decade
2003 2012
Refurbishment (Total 9,543)– 478
Rebranding (Total 26,340)
8332,729
New openings (Total 103,612)15,868
4,492
Number of bedrooms built Average number of bedrooms
built per annum 2003-2012
8,634

H OT E L I N DUS T RY
Almost certainly these figures are understated, especially for refurbishments. They include only the most significant of these, and even then only the construction elements omitting professional fees etc. Also under the radar is the regular refurbishment capital set aside by hotels to upkeep their facilities. In the management agreements of the larger brands, for example, there is a requirement to set aside 4-5 per cent of annual revenue to upkeep the property. That is not included. So the refurbishment element only includes projects that have significantly
repositioned a property, rather than maintained its standards.
In the table below Gleeds have presented some summary data of ‘rule of thumb’ per room costs that are applicable for UK hotels. However for this analysis they have applied their more detailed industry expertise and knowledge of hotel construction costs, taking account of factors such as brand, location and project size to make a (still broad) estimate for each of the projects in the database, rather than relying solely on these ‘rule of thumb’ figures.
The predominant force has been the budget hotel sector as shown in the table left, which shows that 58,612 rooms, 56.6 per cent of total new openings, have been in the budget sector with the two largest players, Premier Inn (19,311 rooms) and Travelodge (18,433) being the driving force; the next largest, Holiday Inn Express, opened 5,588 rooms (referencing this publication’s database).
The database further reveals that only 12,619 unbranded hotel rooms have opened in the UK in the past decade (including some in small chains), which further supports the article on branding and franchising on page 31 of this publication. The emergence of niche sectors such as boutique hotels and Aparthotels is also revealed. Some of the unbranded hotels fall into these sectors as well as country house and the pub sectors, so not all are the traditional independent hotel by any means.
Analysis also shows that there were only two brands in the UK that drove construction values of more than £1bn – the budget giants Premier Inn (£1.3bn) and Travelodge (£1.05bn) exceeded that mark and unsurprisingly are now the largest hotel brands in the UK. These brands are also the only ones that tend to reach those parts of the country that others cannot reach – their development strategies featuring a wider variety of locations than any other brands in the UK market today.
More surprisingly, among the multi-brand global players it is Carlson (Radisson, Park Plaza, Park Inn) that has had the greatest impact on UK construction with a cost of almost £1.4bn although this was especially driven by some large Park Plaza developments in London including the city’s largest recent opening, the 1,021 room Park Plaza Westminster Bridge.
Sector Budget bedroom Midscale bedroom Upscale bedroom
Size of room Up to 22m² 24-30m² 28-50m² +
Construction Costs 34,000-50,000 50,000-130,000 135,000-325,000
Fees 4,000-6,000 7,000-20,000 20,000-40,000 +
Furniture, fittings & equipment 4,000-6,000 8,000-20,000 25,000-35,000 +
TOTAL 42,000-62,000 65,000-170,000 180,000-400,000 Source: Gleeds (Q4 2012)NB. Figures exclude utility connections, land cost, pre-opening costs and finance during construction
Hotels RoomsEstimated.
Construction Cost (£m)
Budget 580 58,612 3,366.8
Mid Market 97 16,880 1,664.7
Full Service 67 14,609 2,503.9
Independent 139 5,868 915.8
Boutique 47 3,593 592.3
Aparthotel 23 1,407 96.4
Upscale 9 1,356 463.4
Hostel 5 435 13.4
Resort Lodges/Apts 3 383 61.6
Country House 7 297 63.5
Pub 5 151 5.2
Beach Hut resort 1 21 2.2
TOTAL 983 103,612 9,749.2
Source: Melvin Gold Consulting/Gleeds/BHA Trends & Developments database
Estimated construction costs (£)
New openings (2003-2012)
12.4 £billionestimated construction cost of UK hotels 2003-2012
78% of construction costs are for new builds
57% of new openings have been in the budget sector
16 Trends & Developments

Trends & Developments 17
H OT E L I N DUS T RY
InterContinental Hotels, with six different brands under development, was the only other company to generate development of over £1bn. Accor is estimated to have generated £760m of construction and Hilton is estimated at £610m.
Regional and city analysis shows that London has had the greatest number of new hotels as well as rebrandings and refurbishments, proving once again that it is one of the most dynamic hotel markets in the world.
As the chart (right) shows, the North West had the next highest level of new openings but, when taking account of rebrandings and refurbishments, as well as new build, the South East had the second highest number of overall rooms. Scotland and the West Midlands were next in the rankings.
In construction cost terms, the differences were also stark. London drew £4.5bn of construction value, whereas only two English regions – the South East and the North West – exceeded the £1bn mark, as well as Scotland. This is also partly driven by the type of hotel and also by varying regional costs of construction.
In London, having a lower proportion of budget hotels and more upscale and full service, cost per room (taking account of new, rebranding and refurbishment) averaged £109,951 per room whereas the average cost in the South East was £85,460 per room and in the North West and Scotland it was £83,374 and £87,350 respectively.
In terms of cities, London had 25,681 new build rooms, with a further 3,370 at Heathrow, 1,125 at Stansted, and 386 near Gatwick. This is substantially more than the total supply in any other UK city. Nonetheless growth of 5,303 rooms in Manchester, 3,698 in Birmingham, 3,244 in Liverpool and 3,238 in Edinburgh were substantial increases. In fact there were 14 UK cities which had more than 1,000 rooms added during
the decade (as well as Heathrow and Stansted).
Rebrandings were especially prevalent in Scotland with Glasgow and Edinburgh having 1,159 and 744 rooms changing brand, respectively. These were in third and fourth place, only surpassed by London and Gatwick. Apart from London, significant levels of refurbishments were reported in Bournemouth and in Cardiff.
Putting the UK hotel industry’s impact on the construction sector in context, the £12.4bn of construction in a 10-year period indicates that this is 6.1 per cent of total UK Private Commercial Construction across the period. In overall terms, the Office of National Statistics estimates that new orders for Private Commercial Construction placed from mid-2002 until mid-2012 (most recent 10 years) was £204.1bn at current values.
It is remarkable that in 1969 the then government introduced the Hotel
Development Incentives Scheme (HDIS) which gave developers a grant of up to £1,000 per bedroom (£1,250 in London) – a significant contribution in those days. Such was the stimulus then required by the sector which sparked construction of 54,772 rooms (including extensions) between 1969 to April 1973, when the scheme ended.
Now, without incentives, and largely unloved by government, the hotel sector has developed 103,612 rooms in 983 new hotels in a decade that has included the worst recession in the country’s history. It has driven a construction value of £12.4bn, excluding professional fees and the value of the land, and has played a major part in stimulating regeneration.
Further proof that the hotel sector, and UK tourism in general, is a vibrant industry and is a significant contributor to the UK economy, creating both direct and indirect jobs, is hardly needed.
MelvinGold,FIH,isaleadingindependenthotelindustryconsultant.Moredetailsofhisservices,andhiscontactdetailscanbefoundatwww.melvingoldconsulting.com.
Gleedsisaworldclassmanagementandconstructionconsultancywithover125years’experienceinthebuildingandconstructionindustry.Ithasaparticularspecialisminthehotelsector.Contact:SteveLacey,Director([email protected])
Furthersupportingtablesforthedatapresentedinthisarticlewillbeincludedatwww.melvingoldconsulting.com/UK%20Hotel%20Supply.html
Total construction costs (£m)(forfulldetails,seeTable22,page72)
Lond
on
Sout
h W
est
Nor
th E
ast
4,5
42.2
777.
0
353.
7
Sout
h Ea
st
York
shire
/Hum
bers
ide
Nor
ther
n Ire
land
1,38
0.6
625.
5
227.
5
Nor
th W
est
East
of E
ngla
nd
Vario
us
1,25
2.2
606.
5
28.6
Scot
land
East
Mid
land
s
Chan
nel I
slan
ds
1,05
5.8
406.
0
50.6
Wes
t Mid
land
s
Wal
es
Isle
of M
an
711.
9
382.
0
25.3

18 Trends & Developments
H OT E L I N DUS T RY
by Andrew Taylor, Head of Leisure, RBS/NatWest Commercial Banking2012 – A YEAR OF AcTiviTY
This year saw significant events impacting the UK’s hospitality industry – from the success of the Queen’s Jubilee and Olympic and Paralympic games to Travelodge’s entry into CVA. But what is the true impact, both in and outside London? And how does the future look as results point towards economic recovery? Andrew Taylor, Head of Leisure for Commercial Banking at NatWest and RBS, takes a closer look.
After an encouraging start, the Jubilee was the first of the year’s historic events, bringing with it an extra bank holiday and a predicted influx of visitors to the capital, both foreign and domestic. But while the festivities created the illusion of a packed London in June, hotel occupancy struggled as the city was primarily filled with day visitors.
Ironically, hotels in London recorded the worst financial performance of 2012 in June for many years. Revenue per room (RevPAR) across the central London hotels declined by 10.8 per cent in the month to £117.30, while total revenue per room (TrevPAR) fell by 8.1 per cent to £148.00, on the back of a 6.6 per cent decline in room occupancy to 82.9 per cent. The extended holiday for the Queen’s Diamond Jubilee, combined with warnings of transport disruption and fears over accommodation, led to a detrimental decline in business. Nevertheless, despite this slow-down prior to the Olympic and Paralympics, the Games delivered a boost to hotel performance in London, although arguably less than predicted.
The Office for National Statistics recorded a drop of five per cent in visitor numbers in August although this was outweighed by an estimated nine per cent increase in spend per visitor compared to last year with the average hotel room costing £210 – an increase of 26 per cent compared to the same period in 2011.
Substitution seemed to be the leading factor, with business travellers and regular visitors avoiding the city amid fears of rocketing prices and travel and congestion chaos. This also had a knock-on effect on central London restaurants with takings in some restaurants not near Games venues down 40 per cent or more, although clearly this issue was short-lived.
London hoteliers also managed to buck the traditional post-Olympic slump as occupancy levels rose by 3.1 per cent to 89.5 per cent in September according to TRI Hospitality Consulting’s latest figures (Page26). These figures can be attributed to one of the most successful Paralympics in history and an increase of late visitors.
But while London and other host cities rode the crest of the Olympic wave, provincial cities suffered a decline in both occupancy and room revenue throughout August with year-to-date gross operating profit per available room down by three per cent while London’s GOPPAR rose by 6.6. per cent over the same period. This is not, however, a new struggle for the provinces. Those inside the London bubble have seen occupancies creeping up since early 2000 while occupancy in the provinces stays more or less static. Now, with the expected increase in food prices due to adverse weather conditions hitting UK harvests and the above-inflation energy increases, there seems to be no respite for provincial hoteliers.
Over the same period the UK restaurant and pub sector saw sales growth of 5.8 per cent in the year to September 2012 with sales inside the M25 increasing by 6.7 per cent. Competition remains strong both within the industry and against the supermarket “dine in” style offers. Consumer discretionary spend remains under pressure and customers are still looking for value alongside an enjoyable dining experience.
Although the proportion of budget hotels in the UK is still lower than in Europe and the US, over 17,000 new hotel rooms opened in the UK in the past year – 70 per cent of which were in the budget market. Interestingly, the London market grew by circa 8,000 rooms of which around 58 per cent were budget, whilst in the provinces nearly 86 per cent of new room stock came from the budget sector with the largest new room concentration being in Edinburgh. This will continue to put pressure on independent operators. With 15,000 new rooms projected for 2013 – highly driven by the branded and budget space – the future looks bright.
However, Travelodge’s entry into company voluntary agreement (CVA) with creditors threw a different light on the otherwise optimistic outlook. The chain, the second largest in the budget hotel sector behind Premier Inn and the third biggest hotel chain in the UK by number of bedrooms, is shedding one in ten of its hotels under a major overhaul which means that £709m of debt will be written off and new equity of £75m provided by the lenders.
Room rates for regional hotels predicted to
rise in 2013 by
Occupancy for regional hotels predicted to
fall in 2013 by
-0.3%
2.4%
Hotel recovery from the recession has been faster than the rest of the economy.
Trends & Developments 19
H OT E L I N DUS T RY
But what does the future hold for independent hotels as the major brands set their sights on expansion in the UK? While global super-brands have the back-up of online booking engines and a global taskforce of marketers and revenue managers, the independents are reliant on their own small, often family-run operations. One glimmer of hope may be the growth of the boutique trend as more travellers opt for the chic and unique.
PricewaterhouseCooper’s 2013 forecast predicts that regional hotels may at last see relief with some growth in the New Year as room rates rise by 2.4 per cent; although occupancy is forecast to fall by 0.3 per cent RevPAR is set to rise by two per cent.
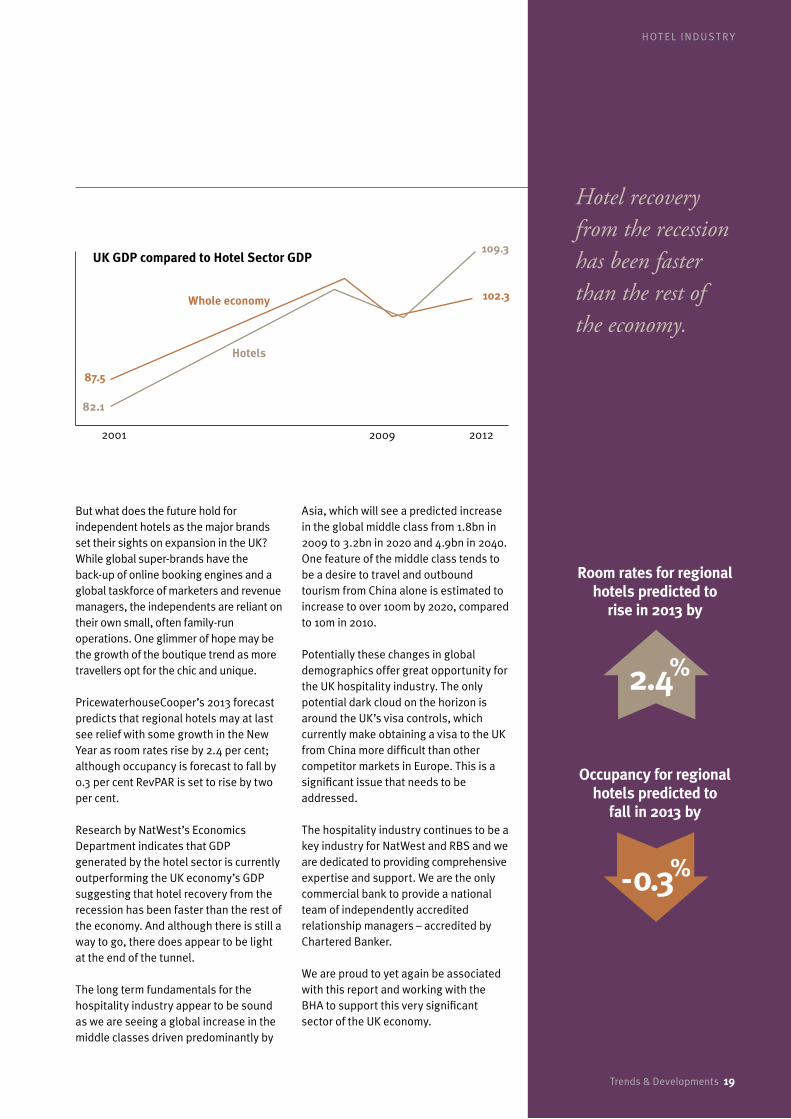
Research by NatWest’s Economics Department indicates that GDP generated by the hotel sector is currently outperforming the UK economy’s GDP suggesting that hotel recovery from the recession has been faster than the rest of the economy. And although there is still a way to go, there does appear to be light at the end of the tunnel.
The long term fundamentals for the hospitality industry appear to be sound as we are seeing a global increase in the middle classes driven predominantly by
Asia, which will see a predicted increase in the global middle class from 1.8bn in 2009 to 3.2bn in 2020 and 4.9bn in 2040. One feature of the middle class tends to be a desire to travel and outbound tourism from China alone is estimated to increase to over 100m by 2020, compared to 10m in 2010.
Potentially these changes in global demographics offer great opportunity for the UK hospitality industry. The only potential dark cloud on the horizon is around the UK’s visa controls, which currently make obtaining a visa to the UK from China more difficult than other competitor markets in Europe. This is a significant issue that needs to be addressed.
The hospitality industry continues to be a key industry for NatWest and RBS and we are dedicated to providing comprehensive expertise and support. We are the only commercial bank to provide a national team of independently accredited relationship managers – accredited by Chartered Banker.
We are proud to yet again be associated with this report and working with the BHA to support this very significant sector of the UK economy.
2001 2012
Hotels
109.3
82.1
Whole economy 102.3
87.5
UK GDP compared to Hotel Sector GDP
2009

H OT E L I N DUS T RY
Whitbread, with its Premier Inn budget brand, continues to remain the largest hotel operator in the UK, with InterContinental’s various brands second and Travelodge third. In spite of the impact of the recession, all three companies maintained their growth during 2012, with Premier Inn adding 30 hotels (3,900 rooms) InterContinental adding 13 hotels (1,800 rooms) and Travelodge adding 39 hotels (4,000 rooms).
During the year, however, Travelodge entered a Company Voluntary Arrangement (CVA) with its creditors as it sought to reduce the level of rent it pays on 109 hotels, and announced plans to shed 49 hotels which it now considers unviable. It is raising £75m of new money to inject into the business and plans to invest £55m in a major refurbishment programme; bank debt of £235m, is being written off and £71m repaid reducing bank debt from £635m to £329m, with repayment extended to 2017. Accor and Hilton both added to their portfolios with more openings planned for 2013.
Of the ten largest companies, only Whitbread and InterContinental continue to remain in British hands; however, InterContinental is a truly international company with strong links to the US and Travelodge, though now owned by US investors, operates almost exclusively in UK and Ireland. Hilton, Marriott, Carlson and Wyndham are US-based and so is Best Western, though the UK franchise is a collection of quintessential three/four star British hotels. Guoman in based in Singapore with the majority of hotels in the UK.
Apart from Premier Inn and Travelodge, neither of which franchise in the UK, the majority of new developments continue to be franchise-led with Holiday Inn, Holiday Inn Express, Doubletree by Hilton, Hampton by Hilton, Ramada and Accor leading the way. All but Accor are US-based franchises so, to this extent, the UK hotel industry continues to be strongly influenced by US styles and standards, only slightly amended for the
UK market. The introduction of franchising and their brands, as well as the eagerness of hotel companies to change from ownership to hotel operations, remain the most significant trends in the UK hotel industry.
Independent ownership will continue – and the best will thrive – but branded hotel groups are increasingly influencing the industry’s development. Almost all the new-build properties are branded (Table29,page82), of which Premier Inn and Travelodge continue to be the most noticeable examples.
With the branded sector growing, the private sector has to hold its own in a difficult market though one company, Britannia Hotels, has moved from 13th to 11th on the back of a number of acquisitions (Table28,page79). Consortia such as Best Western, Classic British Hotels, Small Luxury Hotels of the World, and Pride of Britain maintain their position but are having to compete against the growth of major franchisees such as Chardon Management with 2,800 rooms added (now operating the 21 former Barcelo hotels for Puma) and BDL (plus 900 rooms).
Uk’s ten largest hotel companies and number of rooms(for full list, see Table 26, page 74)
1 Whitbread Hotel Company, London 48,383
2 InterContinental Hotels Group, Buckinghamshire 40,100
3 Travelodge, Oxfordshire 36,898
4 Accor, London 26,500+
5 Hilton Worldwide, London 23,500
6 Best Western, York 15,900
7 Carlson Rezidor Hotel Group, Brussels, Belgium 12,812
8 Marriott Hotels, London 11,943
9 Wyndham Worldwide, USA 10,010
10 Guoman Hotels Group, London 8,214
as at November 2012
With the branded sector growing, the private sector has to hold its own in a difficult market.
2012: GROwTH cOnTinUEs dEsPiTE REcEssiOn
New hotels in 2012
13 30 39
InterContinental
Premier Inn
Travelodge
20 Trends & Developments

Trends & Developments 21
H OT E L I N DUS T RY
Property transactions during 2012, apart from the continuing disposal of the von Essen portfolio (Table 28, page 79) did not feature any major insolvency, though Travelodge’s CVA represented a setback for one of the UK’s most aggressive hotel companies.
One prominent name to disappear from the UK hotel scene was that of the Spanish-based Barcelo hotel group which had signed a 45-year lease to run 21 hotels, including the Lygon Arms in Broadway, Imperial in Torquay and Majestic in Harrogate owned by Puma Hotels. Barcelo paid a £20m penalty to terminate its leases after asking for a reduction in the rent it paid for the properties, in view of a fall in business during the recession.
Prior to the grant of the leases in 2007, Puma Hotels itself operated the hotels through its head office in Hinckley and now resumes direct management. The company, in which the AIM-listed Hotel Corporation has a 49.9 per cent stake, revived the old Paramount Hotels brand and has appointed Chardon Management to assist in the management of the hotels. Subsequently, doubts have been expressed about Puma’s £300m debt to Allied Irish Banks which is now in the hands of the Irish Bank Resolution Corporation.
In a £200m deal, Principal Hayley, bought back six hotels for £200m from property fund AAIM. The group then immediately sold the freehold of the properties to Pramerica, the real-estate arm of America’s Prudential, but will continue to operate them on a 175-year lease. Principal Hayley originally sold the properties – which include Hotel Russell in London, Selsdon Park in Surrey, Leeds Metropole, Royal York, Palace Manchester and George in Edinburgh – to AAIM in 2006, at the height of the property market, for circa £275m.
Another hotel name likely to disappear is the Cavendish in London. Originally built by Trust Houses in 1964 for £2m, the
252-room hotel, owned by the Barclay Brothers (owners of the Ritz) was sold to Ascott, the serviced accommodation company, for £168m, who will convert much of the hotel into serviced apartments.
One notable property to change hands during the year was the Belfry in the West Midlands, with its championship golf course, which had been owned and operated since 2007 by the Irish-based Quinn Group after it bought the hotel from De Vere for £165m. The hotel was sold to KSL Capital Partners, a leading US private equity firm, in 2012 for £70m, who installed De Vere as operators.
The Britannia Hotel group continues its expansion with the acquisition of the Royal Bath in Bournemouth – one of the most traditional of all resort hotels – the Village, Daresbury Park from De Vere and two hotels in Scarborough – The Royal and Clifton which were part of the English Rose collection which was in administration. During the year, Britannia also acquired the Ramada in Leeds.
Other well known hotels to change hands include The Hoxton at a guide price of £67.5m purchased by US based Ennismore Capital, which was established in 2010. The aim is to develop the Hoxton brand by opening further hotels in London, US and Europe in the next five years.
A major new development in London’s Leicester Square will see the Odeon Cinema site turned into a hotel, residential complex and restaurants by Jasminder Singh, whose Radisson Edwardian group also acquired the freehold of two of the group’s hotels – in Birmingham and Canary Wharf. This move is contrary to
the trend for hotel companies to dispose of their freehold interests.
Meanwhile, the sale of the freehold of individual hotel properties, with the current operators retaining the management contract, continues apace.
200 £millionPrincipal Hayley bought back six hotels
wHO sOLd wHAT in 2012?
Barcelo paid a £20m penalty to terminate its leases after asking for a reduction in the rent it paid for the properties.
22 Trends & Developments
H OT E L I N DUS T RY
Hotel Rooms Price (est) Purchaser
AAIM Principal Hayley Hotels x 6: Hotel Russell, London; Palace, Manchester; George, Edinburgh; Royal York, York; Selsdon Park, Surrey; Metropole, Leeds
1,384 £200m Re-acquired by Principal Hayley & Conference Venues
Principal Hayley x 6 freehold 1,384
Principal Hayley retains management contract for 175 year lease
Pramerica Real Estate investments
The Belfry, West Midlands (Quinn Group affiliate) 324 (550 acre resort)
£70m asking price – management contract to DeVere
KSL Capital Partners
Barcelo 20 hotels
Pulls out of 45 year lease with £20.25m penalty fee – management contract to Chardon Management
Puma Hotels resume ownership
Cavendish Hotel , London (Barclay Brothers) 230 £158.8m Ascott serviced apartments
The Scotsman Edinburgh; The Calls, Leeds; Hotel de la Tremoille, Paris(Scotsman Hotel Group – in administration)
203 £40m Sheikh Mohamed Bin Issa al-Jaber through JJW Group
Royal Hotel, South Bay; Clifton Hotel, North Bay – English Rose Hotels, Scarborough (in administration)
118/70 £7.5m guide price; £2m guide price Britannia Hotels
Hoxton Hotel, Shoreditch, London 208 £65m+ Ennismore Capital (to develop brand in New York and across Europe)
InterContinental Westminster (Splendid Hotels/IHG) 256 Shiraz Boghani (former part-owner of Splendid
Hotels with Bashir Nathoo)
Radisson Edwardian, New Providence Wharf, London (The Ballymore Group) 169 £37.5m Jasminder Singh (Edwardian Group)
Odeon, Leicester Square 245
£100m for new hotel development with residential, restaurants and cinema
Radisson Edwardian Hotels
Von Essen Hotels – (company in administration) 28
Ramada Hotel Leeds North, Seacroft (Millgreen View Securities – in administration) – to be renamed Britannia Leeds Hotel
103 Britannia Hotels
De Vere Royal Bath, Bournemouth; Village, Daresbury Park, Warrington 140, 125 £20m Britannia Hotels
Peveril of the Peak, Peak District 45 HF Holidays
Great Victoria, Bradford (Tomahawk Hotels – in administration) 70 Gainford Group
Manor House, Studland, Dorset (Andrew Purkis) 23 Home Grown Hotels(Robin Hutson)
Queens Hotel, Blackpool 107 Leisureplex Hotels
Bailbrook House Hotel, Bath 78 £6.95m guide price Hand Picked Hotels
Hyatt Regency Birmingham (in administration) 319 £27m (est) Hyatt affiliate
Source: Wordsmith and Company
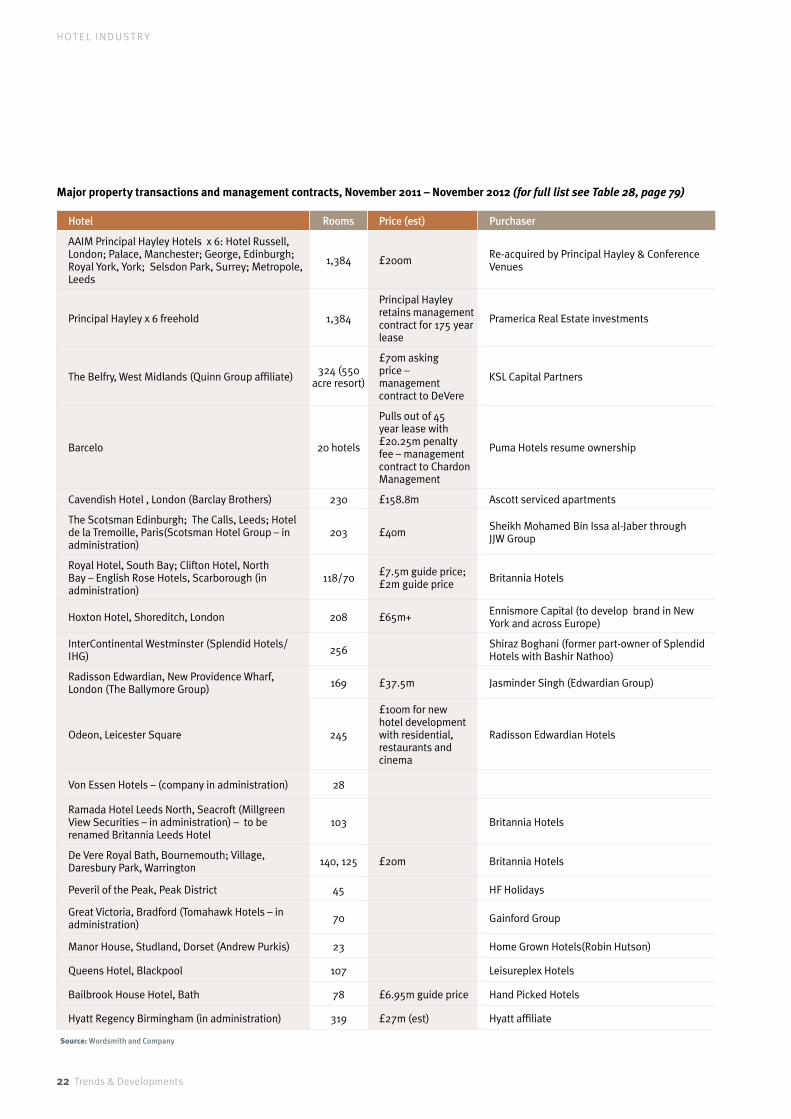
Major property transactions and management contracts, November 2011 – November 2012 (for full list see Table 28, page 79)
I N T RO DU C T I O N
Trends & Developments 23
H OT E L I N DUS T RY
Hotel construction – 2002-2012/15
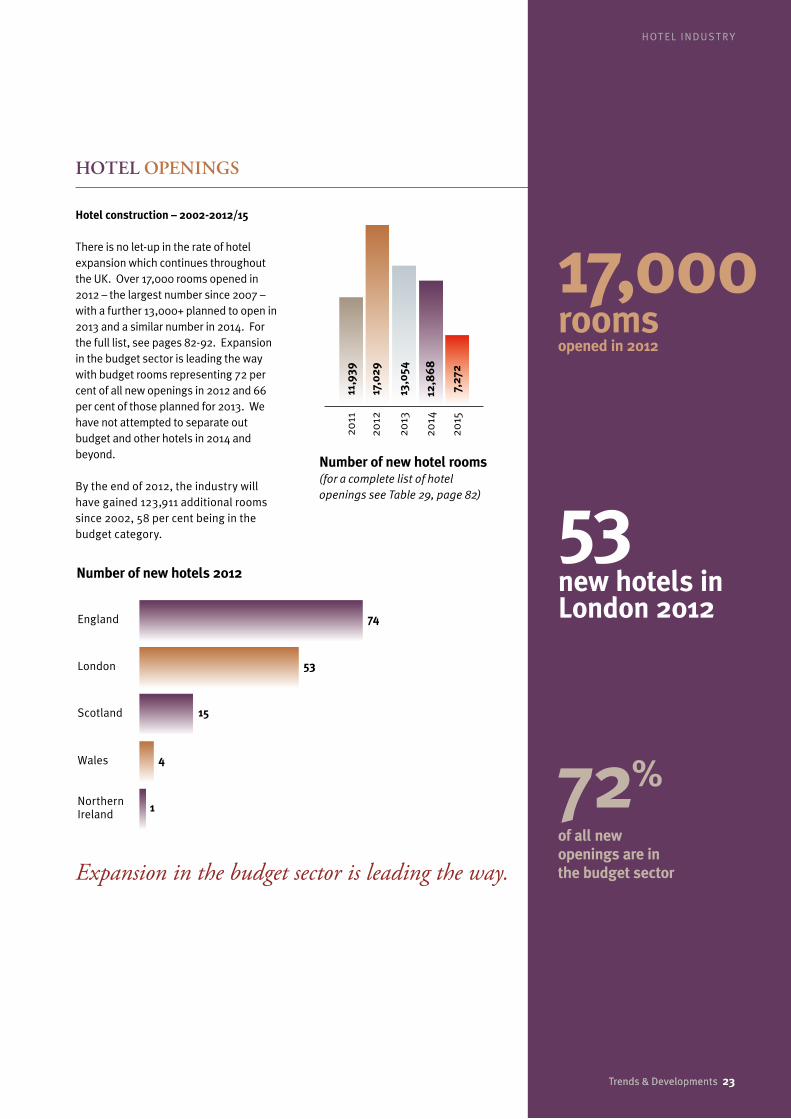
There is no let-up in the rate of hotel expansion which continues throughout the UK. Over 17,000 rooms opened in 2012 – the largest number since 2007 – with a further 13,000+ planned to open in 2013 and a similar number in 2014. For the full list, see pages 82-92. Expansion in the budget sector is leading the way with budget rooms representing 72 per cent of all new openings in 2012 and 66 per cent of those planned for 2013. We have not attempted to separate out budget and other hotels in 2014 and beyond.
By the end of 2012, the industry will have gained 123,911 additional rooms since 2002, 58 per cent being in the budget category.
HOTEL OPEninGs
17,000 rooms opened in 2012
53 new hotels in London 2012
Expansion in the budget sector is leading the way.
Number of new hotels 2012
England 74
Scotland
London
15
53
Wales 4
Northern Ireland 1 72%
of all new openings are in the budget sector
Number of new hotel rooms(foracompletelistofhotelopeningsseeTable29,page82)
2011
11,9
39
2012
17,0
29
2013
13,0
54
2014
12,8
68
2015
7,27
2
Trends & Developments 23
24 Trends & Developments
H OT E L I N DUS T RY
HOTEL OPENINGS – 2012
InterContinental continued its strong expansion with a new InterContinental Hotel in St James (254 rooms), three new Holiday Inns, a new Holiday Inn Express and a new Staybridge Suites in London, together with a further three Holiday Inns in England – Southend (129 rooms), Walsall (156 rooms) and London Gatwick (118 rooms) and five new Holiday Inn Express properties – all operated by franchisees. Two new Hotel Indigos also opened in Newcastle (148 rooms) and Edinburgh (60 rooms), which was a re-launch of the former Osbourne Hotel, with one opening in Kensington, London (51 rooms) in January 2013.
Hilton also increased its portfolio with a new Hilton at Wembley (361 rooms) and at the new FA complex at St George’s Park, Burton on Trent (146 rooms), which also has a new Hampton by Hilton (86 rooms). Three other Hampton by Hiltons also opened – at Birmingham (284 rooms), Luton (250 rooms) and York (120 rooms).
Three Doubletree by Hilton have opened this year – all rebrands – including the seventh in London. Premier Inn and Travelodge continued their strong expansion both in London and in the provinces with Premier Inn adding 3,939 rooms and Travelodge 4,000 rooms.
Meanwhile some new names have appeared on the London hotel scene. London has its first Pullman Hotel (Accor’s re-launch of the Novotel in Euston Road). The Bulgari in Knightsbridge opened on the site of the old Normandie Hotel and the nearby 36-room Wellesley in Knightsbridge, in a 1920s building which was the site of a
former Pizza Express restaurant, opened in December. Also opening in December is one of London’s most famous banqueting houses – the former Café Royal in Regent Street has been turned into a 159-room hotel. The first US-based Thompson hotel – Belgraves (a re-working of the former Sheraton Belgravia) – has opened and Melia’s 173-room ME hotel opened in the Aldwych after a long building delay. South Place Hotel in Moorgate (80 rooms) is the first hotel in a proposed chain of boutique properties by the restaurant group, D&D. In the budget sector, the Malaysian-owned Tune Hotel group continued its rapid expansion in London with three new properties (Liverpool Street (183 rooms), Paddington (137 rooms) and Kings Cross (217 rooms); Apex and Accor both added to their London portfolios.Plans for The Edge Hotel School, based at Wivenhoe House on the University of Essex campus at Colchester at last materialised. The Edge, the first hotel school based entirely in a fully operational hotel, is the result of the partnership between the independent education foundation Edge, the University of Essex and its academic partner Kaplan Open Learning.
On the south coast, plans have been revived for the Bournemouth Hotel School. With similar aims to the Edge, the project, based on the construction of a 200-room Holiday Inn, has the support of InterContinental Hotels group, Holiday Inn and Bournemouth University, with an opening date scheduled for 2013.
Another hotel school – Hotel Future – based in Oldham is planned for 2015.
InterContinental, Hilton, Accor, Premier Inn and Travelodge continued their strong expansion in 2012.
24 Trends & Developments
Trends & Developments 25
H OT E L I N DUS T RY
BUDGET HOTELS
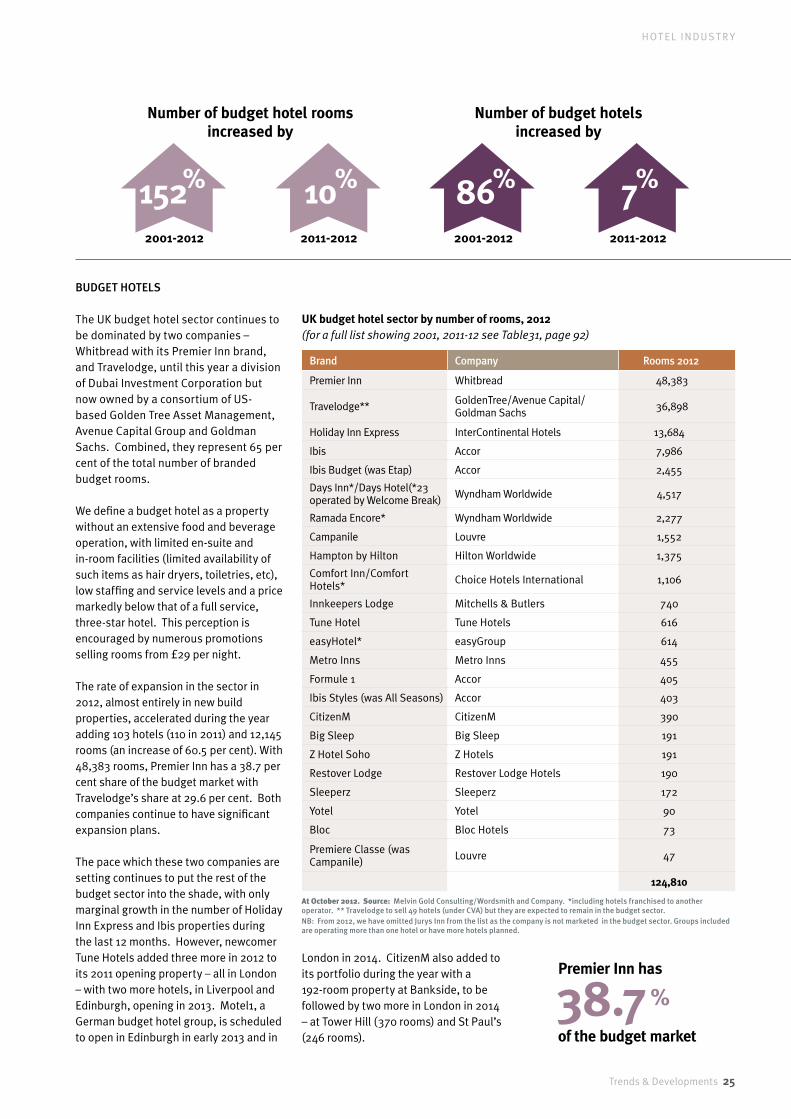
The UK budget hotel sector continues to be dominated by two companies – Whitbread with its Premier Inn brand, and Travelodge, until this year a division of Dubai Investment Corporation but now owned by a consortium of US-based Golden Tree Asset Management, Avenue Capital Group and Goldman Sachs. Combined, they represent 65 per cent of the total number of branded budget rooms.
We define a budget hotel as a property without an extensive food and beverage operation, with limited en-suite and in-room facilities (limited availability of such items as hair dryers, toiletries, etc), low staffing and service levels and a price markedly below that of a full service, three-star hotel. This perception is encouraged by numerous promotions selling rooms from £29 per night.
The rate of expansion in the sector in 2012, almost entirely in new build properties, accelerated during the year adding 103 hotels (110 in 2011) and 12,145 rooms (an increase of 60.5 per cent). With 48,383 rooms, Premier Inn has a 38.7 per cent share of the budget market with Travelodge’s share at 29.6 per cent. Both companies continue to have significant expansion plans.
The pace which these two companies are setting continues to put the rest of the budget sector into the shade, with only marginal growth in the number of Holiday Inn Express and Ibis properties during the last 12 months. However, newcomer Tune Hotels added three more in 2012 to its 2011 opening property – all in London – with two more hotels, in Liverpool and Edinburgh, opening in 2013. Motel1, a German budget hotel group, is scheduled to open in Edinburgh in early 2013 and in
Number of budget hotel rooms increased by
Number of budget hotels increased by
2011-2012 2011-20122001-2012 2001-2012
38.7 %Premier Inn has
of the budget market
152% 86%10% 7%
UK budget hotel sector by number of rooms, 2012(forafulllistshowing2001,2011-12seeTable31,page92)
Brand Company Rooms 2012
Premier Inn Whitbread 48,383
Travelodge** GoldenTree/Avenue Capital/Goldman Sachs 36,898
Holiday Inn Express InterContinental Hotels 13,684
Ibis Accor 7,986
Ibis Budget (was Etap) Accor 2,455
Days Inn*/Days Hotel(*23 operated by Welcome Break) Wyndham Worldwide 4,517
Ramada Encore* Wyndham Worldwide 2,277
Campanile Louvre 1,552
Hampton by Hilton Hilton Worldwide 1,375
Comfort Inn/Comfort Hotels* Choice Hotels International 1,106
Innkeepers Lodge Mitchells & Butlers 740
Tune Hotel Tune Hotels 616
easyHotel* easyGroup 614
Metro Inns Metro Inns 455
Formule 1 Accor 405
Ibis Styles (was All Seasons) Accor 403
CitizenM CitizenM 390
Big Sleep Big Sleep 191
Z Hotel Soho Z Hotels 191
Restover Lodge Restover Lodge Hotels 190
Sleeperz Sleeperz 172
Yotel Yotel 90
Bloc Bloc Hotels 73
Premiere Classe (was Campanile) Louvre 47
124,810
At October 2012. Source: Melvin Gold Consulting/Wordsmith and Company. *including hotels franchised to another operator. ** Travelodge to sell 49 hotels (under CVA) but they are expected to remain in the budget sector.NB: From 2012, we have omitted Jurys Inn from the list as the company is not marketed in the budget sector. Groups included are operating more than one hotel or have more hotels planned.
London in 2014. CitizenM also added to its portfolio during the year with a 192-room property at Bankside, to be followed by two more in London in 2014 – at Tower Hill (370 rooms) and St Paul’s (246 rooms).
26 Trends & Developments
H OT E L I N DUS T RY
HOw mAnY HOsPiTALiTY BUsinEssEs wEnT insOLvEnT?
HOTEL REsULTs 2012
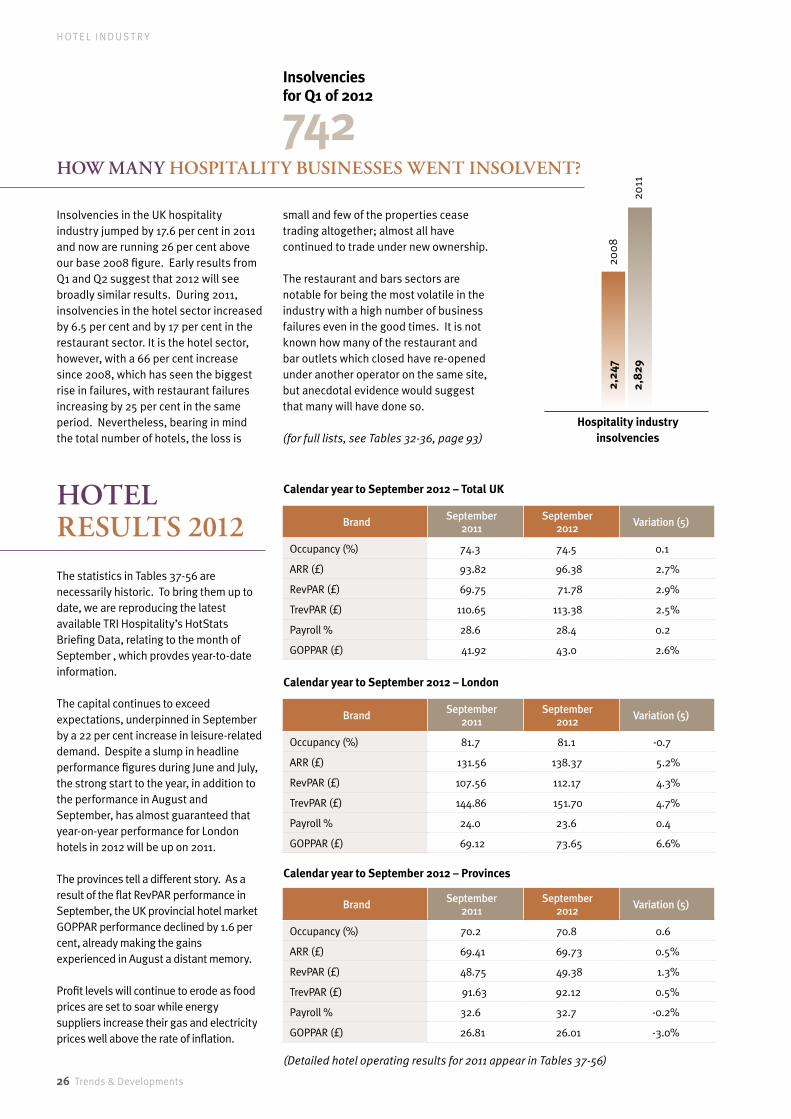
Insolvencies in the UK hospitality industry jumped by 17.6 per cent in 2011 and now are running 26 per cent above our base 2008 figure. Early results from Q1 and Q2 suggest that 2012 will see broadly similar results. During 2011, insolvencies in the hotel sector increased by 6.5 per cent and by 17 per cent in the restaurant sector. It is the hotel sector, however, with a 66 per cent increase since 2008, which has seen the biggest rise in failures, with restaurant failures increasing by 25 per cent in the same period. Nevertheless, bearing in mind the total number of hotels, the loss is
small and few of the properties cease trading altogether; almost all have continued to trade under new ownership.
The restaurant and bars sectors are notable for being the most volatile in the industry with a high number of business failures even in the good times. It is not known how many of the restaurant and bar outlets which closed have re-opened under another operator on the same site, but anecdotal evidence would suggest that many will have done so.
(forfulllists,seeTables32-36,page93)
The statistics in Tables 37-56 are necessarily historic. To bring them up to date, we are reproducing the latest available TRI Hospitality’s HotStats Briefing Data, relating to the month of September , which provdes year-to-date information. The capital continues to exceed expectations, underpinned in September by a 22 per cent increase in leisure-related demand. Despite a slump in headline performance figures during June and July, the strong start to the year, in addition to the performance in August and September, has almost guaranteed that year-on-year performance for London hotels in 2012 will be up on 2011.
The provinces tell a different story. As a result of the flat RevPAR performance in September, the UK provincial hotel market GOPPAR performance declined by 1.6 per cent, already making the gains experienced in August a distant memory.
Profit levels will continue to erode as food prices are set to soar while energy suppliers increase their gas and electricity prices well above the rate of inflation.
Hospitality industryinsolvencies
2008
2011
2,24
7
2,8
29
742Insolvencies for Q1 of 2012
Brand September 2011
September 2012 Variation (5)
Occupancy (%) 74.3 74.5 0.1
ARR (£) 93.82 96.38 2.7%
RevPAR (£) 69.75 71.78 2.9%
TrevPAR (£) 110.65 113.38 2.5%
Payroll % 28.6 28.4 0.2
GOPPAR (£) 41.92 43.0 2.6%
Brand September 2011
September 2012 Variation (5)
Occupancy (%) 81.7 81.1 -0.7
ARR (£) 131.56 138.37 5.2%
RevPAR (£) 107.56 112.17 4.3%
TrevPAR (£) 144.86 151.70 4.7%
Payroll % 24.0 23.6 0.4
GOPPAR (£) 69.12 73.65 6.6%
Brand September 2011
September 2012 Variation (5)
Occupancy (%) 70.2 70.8 0.6
ARR (£) 69.41 69.73 0.5%
RevPAR (£) 48.75 49.38 1.3%
TrevPAR (£) 91.63 92.12 0.5%
Payroll % 32.6 32.7 -0.2%
GOPPAR (£) 26.81 26.01 -3.0%
Calendar year to September 2012 – Total UK
Calendar year to September 2012 – London
Calendar year to September 2012 – Provinces
(Detailedhoteloperatingresultsfor2011appearinTables37-56)

I N T RO DU C T I O N
Trends & Developments 27
H OT E L I N DUS T RY
HOTEL vALUEs
According to consultancy HVS, hotel values are climbing back to their 2006 peak, increasing in London in 2011 by 12.0 per cent, in Edinburgh by 1.7 per cent, in Manchester by 0.2 per cent but falling in Birmingham by 6.7 per cent. These changes, which brought the capital back to its peak values of 2006/2007, reflected London’s continuing emergence from the recession as it benefits from stronger corporate and leisure demand as well as its position as a global financial centre. Edinburgh, which is the UK’s second most popular business destination, also made progress. Manchester, however, saw little growth while Birmingham, with over 600 rooms added in 2011 – and with more planned – saw hoteliers chasing occupancy rather than rates, and hotel values fell by 6.7 per cent. London remains one of the
leaders of recovery in Europe, with room values second only to Paris (€630,928) and considerably above third placed Zurich (€518,496). HVS Index monitors changes in the values of mainly four- and five-star hotels in key European cities. We give only UK cities here. The methodology employed is based on operating data from a representative sample of hotels, which is then aggregated. In arriving at each valuation, HVS takes into account its own valuation experience, as well as current trends in the market place. (Tables60-62,page101)
Hotel ownership has now become an international investment, which is clearly demonstrated by the continuing purchase of trophy assets across Paris and London by private individuals and funds. Growth becomes more prominent from 2013 onwards for most cities with London and Paris again leading the way, followed by Zurich and Geneva. These cities already have high occupancies but further rate increases are expected to push up values.
Lond
on
Edin
burg
h
Man
ches
ter
Bir
min
gham
11%
23%
20%
27%
Lond
on
Edin
burg
h
Man
ches
ter
Bir
min
gham
4%
-1%
-22%
-38
%
Hotel valuation per room since 2000
Forecast increase hotel valuation 2012-2016
Increase/decrease in hotel valuation since 2000
Edinburgh
-1%
Manchester
-2%
Birmingham
-38%
London
4%
Trends & Developments 27

28 Trends & Developments
H OT E L I N DUS T RY
The term “lost decade” was first applied to the Japanese economy during the 1990s and, following a five-year period of inactivity which is in danger of continuing, it might also provide a fitting description for the UK.
In order for hotel values to grow over the next five years, trading performances must recover and, before that happens, market conditions need to improve. Although the trading outlook is marginally positive, hotel trading performances are not yet demonstrating sufficient improvements to generate excitement in the sector. When market conditions eventually improve and the hotel market recovers, are we likely to look back on this period as a lost decade of relative inactivity and missed opportunity?
However, the transactional arena wasn’t completely devoid of participants in 2012 and we witnessed the conclusion of some interesting deals. As the market continues to move forward at a sluggish pace, most hotel owners are exercising nothing more
than their patience – holding onto their assets and waiting for conditions to improve. The majority of vendors are in some way distressed or are choosing to dispose of assets that are unlikely to survive unless conditions change.
Buyers are opportunistic and continue to respond to good quality opportunities in key locations that offer value for money. From a lending perspective, we are slowly seeing some banks waking up to the fact that values are low and buyers’ leverage requirements are sensible. Although the banks still have large amounts of hotel debt, the appetite of some is gradually returning and they are lending selectively.
There can be no doubt that London’s profile has benefited from the various other events hosted in 2012 and whilst the Queen’s Diamond Jubilee celebrations may have done little to help London hotel occupancy over the extended bank holiday weekend, they undoubtedly created a feel-good factor
and helped to boost the Royal Family’s global profile, which can’t be bad news for the UK’s inbound tourist market. It will be interesting to see whether this increase in global attention will translate into rising visitor numbers and trading performance improvements over the coming months.
is THE UK HOTEL indUsTRY sTUcK in THE middLE OF A ‘LOsT dEcAdE’?
BUT ARE wE in THE middLE OF A LOsT dEcAdE?
Taking to the global stage, the UK put on some outstanding performances in 2012, delivering what were arguably the best ever Olympic and Paralympic Games. Although it is still a little early to assess their full impact, initial analysis tells us that hotels in London, and in other key UK cities, benefited from increases in profitability during the four weeks when the Games were underway.
By Jeremy Hill, Director & Head of Hotels, Christie + Co
In order for hotel values to grow over the next five years, trading performances must recover
London, and other key UK cities, benefited from increases in profitability during the four weeks of the Olympic Games.
28 Trends & Developments
Trends & Developments 29
H OT E L I N DUS T RY
Private equity is also making a comeback, as confirmed by our consultancy team. “We are being approached by private equity firms on a weekly basis,” confirms Andreas Scriven, Christie + Co’s Head of Consultancy.
“Some of the banks’ hotel property portfolios are being wrapped up in big
packages and sold at a bulk discount. These large debt package sell-offs are tempting new players into the market because they recognise an opportunity to acquire them at a good price, break them up, and retain the most viable assets. Those who are sufficiently bold have an opportunity to generate attractive returns.”
The sale of the 28-strong von Essen Hotels portfolio dominated hotel industry headlines in 2011. Having sold 19 von Essen assets in 2011, Christie + Co was able to conclude the final few deals in 2012 – see page 81. The sale of the von Essen assets originally met with some scepticism from market commentators but we were able to prove that the market for country house hotels is still functioning.
As the London market continues to outperform other parts of the UK, hotels in and around the capital generate significant demand. Acting for the Dublin-based Lioncourt Capital, we sold two Ramada Hotels in Bayswater Road, Hyde Park and Hangar Lane, Ealing to the Westmont Hospitality Group for a combined sum in the region of £75m. The properties will be franchised under Hilton’s DoubleTree brand.
The sale of the Leinster Inn Hotel in Bayswater proved sufficiently tempting to attract a consortium of investors from across the GCC. The hotel, which had ceased trading, occupied six adjoining Grade II-Listed town houses in the Bayswater Conservation Area. Making its UK market debut in response to the growing global demand for prime residential property in London, Qatar First Investment Bank led the consortium of GCC investors who acquired the property for development purposes.
Christie + Co also sold some significant regional assets in 2012. Deals included the sale of the Crowne Plaza in Cambridge to London & Regional and the sale of two non-core assets for De Vere Hotels. The Royal Bath in Bournemouth and the Daresbury Park Hotel near Warrington were both sold to Britannia Hotels, the UK’s largest privately owned
hotel group. These sales, together with the recent sale of De Vere’s Barony Castle in Peebles, will enable the group to focus on the planned expansion of its De Vere Village Urban Resorts business, which will see 15-18 new hotels open in prime UK locations over the next two years.
Another asset formerly owned by the De Vere Group recently changed hands for a reported £70m. The Belfry Resort in the West Midlands, renowned for its world-famous Brabazon golf course, was acquired by KSL Capital Partners and will be managed by a subsidiary of the De Vere Group under a 10-year management contract.
In June 2011, Royal Bank of Scotland took control of a portfolio of 42 hotels in the UK, which were owned by a consortium of investors including
Quinlan Private and operating under a management agreement with Marriott. RBS appointed Ernst & Young as receivers and rumours of a sale have
been rife ever since last summer but the deal, reportedly worth up to £700m, is yet to conclude.
cROssinG THE FinisH LinE in 2012
mAjOR PORTFOLiO dEAL sTiLL RUmOUREd
“We are being approached by private equity firms on a weekly basis.”
70 £million
The Belfry Resort sold for
30 Trends & Developments
H OT E L I N DUS T RY
Although vendors’ expectations have become more closely aligned with those of buyers, accurate price setting continues to be a vital factor in the transactional process. Vendors can be tempted into the market by the promise of a high price, but if it proves unrealistic and unachievable it is not only damaging to the sales process and disappointing to the vendor, it is also harmful to the wider market.
The only way successfully to engage buyers is to price an asset realistically from the start and then drive the price higher using a competitive process. Sales processes fail if the guide price is set too high and these failures are particularly worrying because they deter other vendors and stall the market.
The difficulties faced by budget operator Travelodge not only tell us that budget hotels haven’t necessarily benefited from consumer cost saving over the last few years, they also pose an interesting question about the sustainability of index-linked rent reviews.
Travelodge announced a Company Voluntary Arrangement (CVA) in August, for which its “unsustainable debt burden” was blamed. Unlike market-based rents, those that are index-linked can continue to rise while trading performance is in decline. For companies like Travelodge, which follow a leasehold
business model, rents that are subject to index-linked reviews can quickly become unsustainable if the commencing rent is too high. Travelodge’s creditors voted overwhelmingly in favour of the CVA, which will enable the business to restructure its property portfolio.
The trading outlook for 2013 is marginally positive and although we will continue to see some distress, the majority of hotels will be able to trade successfully until the market recovers – providing they are able to maintain standards. Hotel businesses are understandably cutting costs dramatically in order to survive the trading conditions, but the severity of these cuts could ultimately lead to their demise. If too much cost is driven out of a business, service quality, employment levels and the general condition of the hotel could all be compromised. As the tough trading conditions continue and assets deteriorate, CAPEX is an issue that owners can no longer afford to ignore.
Many of the hotels that come to the market in 2013 will have a distressed background, but the sales completed in 2012 prove that there continues to be a market for these assets, regardless of their condition. The focus, when pricing hotels, should always be on current value not on values achieved in the past, or likely to be achievable in the future. If owners take a more sensible approach to asset pricing, we will see some sense of normality returning to the market – where the marketing of assets generates viewings and offers. Ultimately a deal can only take place if investors and lenders recognise that a price is sensible. From an investment perspective, the UK is
currently considered to be one of the most attractive markets in Europe and, whilst London continues to outperform other UK cities, there is still plenty of demand for assets in other key locations.
We have already seen some new investors emerging in 2012 and we can expect opportunities to attract buyers from even farther afield next year. As 2013 approaches, we should perhaps capitalise on the feel-good factor created by the Olympic and Paralympic Games and hope that their success will, in some way, be reflected in the UK hotel industry.
THE dAnGER OF OvERPRicinG
HAvE wE sEEn THE LAsT OF indEx-LinKEd REnT REviEws?
LOOKinG FORwARd TO 2013
As the tough trading conditions continue and assets deteriorate, CAPEX is an issue that owners can no longer afford to ignore.
I N T RO DU C T I O N
Trends & Developments 31
H OT E L I N DUS T RY
BRAndinG is KEY TO HOTEL GROwTH
Brand names hang over the door of an increasingly significant proportion of UK hotels. Their number will grow.
By Melvin Gold, Hotel Industry Consultant
In my 2011 report on UK hotel industry supply (using end-2010 data) I estimated that 39.7 per cent of UK hotels were part of corporate chains and a further 6.6 per cent were part of consortia. Taking the long-term view, by 2030 two-thirds of hotel rooms are likely to be branded as part of a corporate chain or consortia.
Despite this trend, we should not fear the total loss of the independent hotel. If 66 per cent of the 2030 UK hotel industry is branded, almost 300,000 hotel (and bed and breakfast) rooms will remain unbranded – probably smaller properties with entrepreneurial owners with the focus on quality, service and building a loyal clientele.
However, the opportunity for entrepreneurial spirit is not solely confined to the independent sector as the brands claim that they also provide an opportunity for it to thrive by providing the standards, systems and tools of the trade, as well as the customers through their reservations systems and loyalty schemes. At the same time, although the recent recession has shown that there can be pitfalls along the way, owners and franchisees provide financial capital alongside energy and endeavour. Of course, franchising is not new to the UK hotel market though it has undergone recent rapid growth and its structure is changing. It wasn’t that long ago that Whitbread held the master franchise for the Marriott brand in the UK, the Real Hotel Company (formerly Choice Hotels Europe) held the master franchise for
Choice Hotels International’s brands and Jarvis Hotels held the UK master franchise for the Ramada brand. Those days are gone and most of the major companies that are franchising their hotel brands in the UK are now doing so directly from the parent or through a UK subsidiary.
In global terms five of the top six of the world’s largest hotel companies – InterContinental Hotels Group (IHG), Wyndham, Hilton Hotels, Accor and Choice Hotels International – are active in the UK market through franchising. The exception is Marriott International. Indeed, at present Wyndham and Choice are only active through franchising whereas the others are also active through other business models including management agreements, leases and (in limited cases) through development and ownership. Wyndham has stated that it will consider management agreements in the future but it seems this will be mainly for opportunities for the full service Wyndham Grand, such as the 154-room Wyndham Grand Chelsea Harbour which it already manages, rather than in mid-market and budget hotels.
The UK’s two largest budget hotel chains, Premier Inn and Travelodge, have shied away from the franchising model despite having products which would apparently lend themselves to it. Travelodge has two properties in mainland UK that are operating under franchise, both being a legacy from previous ownership, and currently has 11 properties in Ireland, which it previously owned, under a master franchise. Premier Inn does not operate through franchising.
By 2030 two-thirds of hotel rooms are likely to be branded as part of a corporate chain or consortia.
39.7 %In 2011
of UK hotels were part of corporate chains
Trends & Developments 31
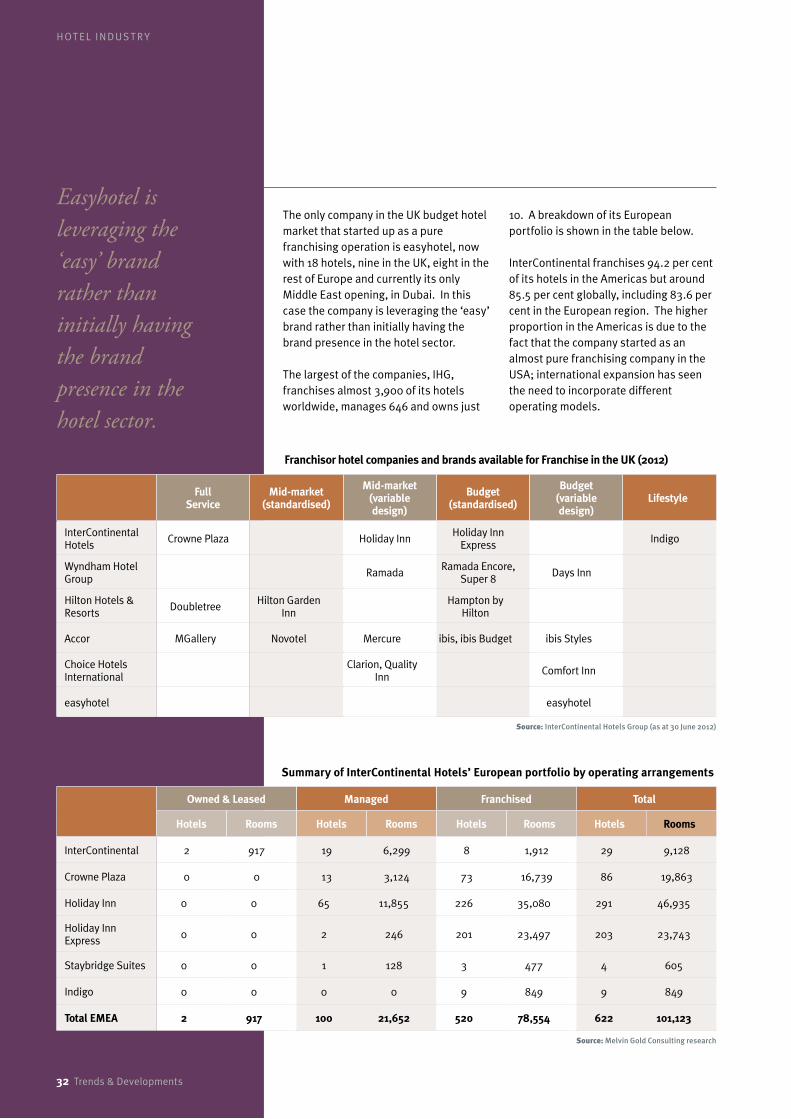
H OT E L I N DUS T RY
The only company in the UK budget hotel market that started up as a pure franchising operation is easyhotel, now with 18 hotels, nine in the UK, eight in the rest of Europe and currently its only Middle East opening, in Dubai. In this case the company is leveraging the ‘easy’ brand rather than initially having the brand presence in the hotel sector.
The largest of the companies, IHG, franchises almost 3,900 of its hotels worldwide, manages 646 and owns just
10. A breakdown of its European portfolio is shown in the table below.
InterContinental franchises 94.2 per cent of its hotels in the Americas but around 85.5 per cent globally, including 83.6 per cent in the European region. The higher proportion in the Americas is due to the fact that the company started as an almost pure franchising company in the USA; international expansion has seen the need to incorporate different operating models.
Easyhotel is leveraging the ‘easy’ brand rather than initially having the brand presence in the hotel sector.
Franchisor hotel companies and brands available for Franchise in the UK (2012)
Summary of InterContinental Hotels’ European portfolio by operating arrangements
Owned & Leased Managed Franchised Total
Hotels Rooms Hotels Rooms Hotels Rooms Hotels Rooms
InterContinental 2 917 19 6,299 8 1,912 29 9,128
Crowne Plaza 0 0 13 3,124 73 16,739 86 19,863
Holiday Inn 0 0 65 11,855 226 35,080 291 46,935
Holiday Inn Express 0 0 2 246 201 23,497 203 23,743
Staybridge Suites 0 0 1 128 3 477 4 605
Indigo 0 0 0 0 9 849 9 849
Total EMEA 2 917 100 21,652 520 78,554 622 101,123
Source: Melvin Gold Consulting research
FullService
Mid-market (standardised)
Mid-market (variable design)
Budget (standardised)
Budget (variable design)
Lifestyle
InterContinental Hotels Crowne Plaza Holiday Inn Holiday Inn
Express Indigo
Wyndham Hotel Group Ramada Ramada Encore,
Super 8 Days Inn
Hilton Hotels & Resorts Doubletree Hilton Garden
InnHampton by
Hilton
Accor MGallery Novotel Mercure ibis, ibis Budget ibis Styles
Choice Hotels International
Clarion, Quality Inn Comfort Inn
easyhotel easyhotel
Source: InterContinental Hotels Group (as at 30 June 2012)
32 Trends & Developments

Trends & Developments 33
H OT E L I N DUS T RY
Accor, like many of the hotel brands and consortia, has recognised that the future for UK hotels will be in branding.
Holiday Inn Express, the newest mass roll-out brand, was launched in Europe as almost entirely a franchise model. Although there were a few teething issues it did not take long for the brand to attract franchisee interest, especially in the UK, and even today 117 of the group’s European portfolio of 203 properties are in the UK.
Indigo, IHG’s new lifestyle brand, and Staybridge Suites, an extended stay brand, were launched almost exclusively as franchised properties although one of the Staybridge Suites properties is managed by IHG at present.
Currently Wyndham and Choice are only operating in the UK under franchise models. Wyndham has over 3,000 rooms under the Ramada brand (including Ramada Plaza), 4,500 Days Inn/Hotels branded rooms, and 2,277 Ramada Encore rooms. Choice’s UK portfolio comprises 39 hotels (3,000 rooms), mainly under the Quality and Comfort brands.
Hilton UK portfolio predominantly consists of managed hotels but with an ever growing number of its estate operating under franchise agreements – now 22 out of a 109- strong portfolio, half of which is the full service DoubleTree by Hilton brand. This presents a strong opportunity for developers to pursue conversions of existing hotels, through both management and franchising agreements, whilst retaining a distinct sense of individuality for their property.
The more standardised brands, Hampton by Hilton and Hilton Garden Inn, are growing their presence in the UK as well as across Europe with many properties opening under franchise agreements. Both brands offer quality service to value-wise guests and have European pipelines of over 40 hotels each through a combination of management and franchising agreements.
Accor, Europe’s largest hotel company and a franchisor of choice in France, has successfully deployed the franchise model in the UK in the last three years; the sector (together with managed hotels) now represents over 30 per cent of the company’s UK portfolio which suggests that Accor, like many of the hotel brands and the consortia, has recognised that the future for UK hotels will be in branding.
In 2011, Accor signed franchise agreements with Focus Hotels (10 properties now operating under the Mercure brand) and Jupiter Hotels (26 Mercure properties, purchased by Patron Capital and West Register). The ambition is to grow the total portfolio to 300 hotels by the end of 2016, when around 60 per cent of the UK & Ireland portfolio will be operating under franchise and management contract structures. The flexible Mercure and ibis Styles brands are expected to be the driving force behind this growth.
Euro
pe
Glo
bally
Am
eric
as
83.
6%
85.
5%
94.2
%
InterContinental franchise hotels
H OT E L I N DUS T RY
So why is franchising so important to brand holders when the business model offers them relatively little control of customer-facing activities – this, in an industry where customer-facing skills are so important? Careful vetting of franchisees and monitoring of their performance is therefore critical.
The big companies are attracted by the limited capital investment required, most having embraced the asset-light model. Reduced capital and the ability to work through a broad-based franchisee network enables more rapid network growth and better local knowledge (many franchisees are ‘local’ to a particular operating area).
Return on capital for the franchisor is typically strong, not least because capital expenditure is low, and a steady stream of fee income from an expanding network is an attractive proposition. This, however, depends on size and growth; for the franchisee, who now has a choice of brands to choose from, brand strength is key. The brand has to produce business. That depends on brand strength and marketing and a strong reservations system and online presence.
Major brands bring marketing muscle to hotel owners, including powerful global reservations systems, sales organisations, and customer databases. Often these are supported by loyalty schemes and consumer advertising. Normally these factors are on a scale that is simply beyond the reach of the independent hotelier.
One of the key factors in franchising is for the customer experience to be consistently achieved. A franchisee operating a poor standard franchise damages the whole brand. In the hotel world the model lends itself most easily to the mid- and budget markets. Not that the upper tier of the market lacks in delivery to the customer but it is more individualistic in style and that makes for a more difficult definition of standards and consistency of delivery.
However, franchising depends on the availability of finance and that has remained difficult to obtain in recent years. Higher equity requirements have further hampered progress. Most franchisees are small or medium sized companies and, given the economic environment, may have financial stress in their existing businesses and have difficulty in raising further capital from the banks. A number of franchise operators have fallen by the wayside this year.
60%
By the end of 2016 around
of Accor’s UK & Ireland portfolio will be operating under franchise
One of the key factors in franchising is for the customer experience to be consistently achieved.
Majorbrandsbring marketing muscle to hotel owners, including powerful global reservations systems.
34 Trends & Developments
Trends & Developments 35
H OT E L I N DUS T RY
As a result, the claimed development pipelines of the big brands increasingly depend on the ability of third parties to be able to fund new development or to persuade independent properties to attach a brand to their premises. Even this requires capital – the properties have to be brought to compliance with brand standards.
As well as financing requirements, hotel owners and developers have to consider the cost of the fees payable to the franchisor and the cost of ensuring continued compliance with brand standards. For independent owners this is a huge issue because currently they are their own boss in this regard, able to control capital expenditure to their own timescale and pocket. That luxury departs with a franchise although undoubtedly compliance with brand standards will be better for customers in ensuring more consistent standards.
Fees are many and various and their quantum varies between the brands. There is normally an initial fee based on the number of bedrooms, a franchise fee based on a percentage of rooms revenue, system and reservation fees per reservation, and marketing fees. Normally there are no additional fees in respect of food and beverage and other revenue. For an existing property owner these costs have to be considered against the incremental revenue and profit that will be generated by a well known brand.
Franchising will no doubt continue its growth in the UK hotel industry in the years to come as the big companies seek to get bigger. Banks, already showing a preference for a brand name over the door rather than an independent operation, have gravitated even more towards this. With the influence of the internet and third party agents, hoteliers increasingly need to find a viable route to market through these important customer and revenue generating sources.
These factors combine to ensure that growth in the proportion of UK hotels that are branded or part of consortia will continue to grow in the coming years. Equally entrepreneurial spirit seems certain to ensure that franchising will become an increasingly prevalent business model in the UK hotel industry.
Melvin Gold, FIH, is a leading independent hotel industry consultant. More details of his services, and his contact details can be found at www.melvingoldconsulting.com.
This article is updated from an earlier version which was first published in the 2011 edition of the UK Hospitality Black Book.
Banks are already showing a preference for a brand name over the door.
The claimed development pipelines of the big brands increasingly depend on the ability of third parties to be able to fund new development.
Franchising will no doubt continue its growth in the UK hotel industry

36 Trends & Developments36 Trends & Developments
I N T RO DU C T I O N
uK CateRinG industRy

I N T RO DU C T I O N
Trends & Developments 37
BRiGHT sPOTs AFTER A disAPPOinTinG FOUR YEARs
After a disappointing performance in 2011 which turned out to show no nominal growth at all in the eating-out sector, the Jubilee and then the Olympics would, it appeared, offer opportunities for operators and suppliers. However, the outcome of 2012 will be broadly flat with wet weather throughout much of the summer dampening consumer enthusiasm for eating-out. But within the disappointing overall performance there were plenty of bright spots.
London continued to be a place apart from the rest of the country, its sales increased by almost two per cent – and expansion in central areas exceeded even this figure – compared with nil growth in the rest of the country. This comparative success was driven by a local economy that benefitted from an increase in overseas visitors, especially high spending Russian and Chinese, and consumers who were seeing their real
incomes increase on the back of an increase in jobs, and continuing low interest payments on mortgages and other loans.
The growth in London spawned the development of many new concepts – of which more below – which in turn created a buzz in the market and encouraged consumers to eat out. This virtuous circle unfortunately was not repeated in the rest of the country.
Another feature of the eating-out market in 2011 and the first three quarters of 2012 has been dynamism amongst emerging brands and concepts. In the summer of 2010, there were 527 outlets in small, fast growing brands – i.e. brands with 5-25 outlets, growing at by at least 20 per cent over three years. Two years later, by the summer of 2012, they had increased by over 42 per cent to 753 outlets.
In the midst of a recession in the eating-out market, which has now been going on for over four years, 2012 appeared to offer some promise. This was certainly true in part but by no means for everyone and for all sectors.
By Peter Backman, Managing Director, Horizons FS Limited.
The growth in London spawned the development of many new concepts
Rise in two years
42%
Eating-out market, emerging brands
2010 2012
527 outlets
753 outlets
Trends & Developments 37
U K C AT E RI N G I N DUS T RY

38 Trends & Developments
U K C AT E RI N G I N DUS T RY
Operators have been developing a host of other strategies from pop-up outlets, street food, world cuisine buffets and many more.
They were led by the likes of Byron, Wildwood, Frae, Chimichanga and Ed’s Easy Diner. Encouragingly for the future, although some of these brands are being developed by established groups, such as Gondola and Prezzo, the vast majority have been set up by new entrants. The large brands of tomorrow will include some of these newly emerging ones and they are being followed by a host of even smaller start-ups which will be the seed corn for the market in years ahead.
These newer brands are entering a market where established names have been consolidating their position over the last year. Brands such as Nando’s and Costa have seen significant expansion driven by increasing their footprint in terms of store numbers, or footfall per unit, and in some cases (such as Domino’s) new stores, more customers per store and increased spend per customer. The expansion into underexploited parts of the UK continues, too, with the likes of Wagamama, Giraffe, Yo! Sushi opening growing numbers of sites outside the capital.
All the while, well established brands, including the pizza operators such Pizza Express, Strada and Prezzo, continue to increase their sales.
A recent feature has been the emergence of new cuisine concepts; the lead being Mexican food epitomised by Wahaca, Barburrito, and Chipotle alongside established names such as Chiquitos. Other South American concepts, including Rodizio Preto and Tropeiro, are also making headway.
The healthy eating trend continues with long-time leader, Leon, being joined by Chop’d, Tossed, Pod and a number of others that cater to the growing desire for nutritious food, from selected consumer segments. This is just one example of the eating-out sector embracing changing consumer requirements. And growth is also seen in an allied segment, local and wholesome food, epitomised by Bill’s Produce and smaller look-alikes.
Alongside these growth sectors operators have been developing a host of other strategies from pop-up outlets, street food, world cuisine buffets and many more. The growing food-to-go market has been highlighted by new offers – porridge from Pret A Manger for example – that encourage customers into eating in new parts of the day.
That the market is encouraging such diverse entrepreneurial activity bodes well for the future of the eating-out market.
The tenanted pub sector has continued to struggle in the face of falling demand for beer and the high cost that tenants pay for beer in order to secure low rents. Publicans have attempted to boost sales by serving more food but the consumer demands ever increasing quality and competition has forced prices down or at least not allowed price rises even though food costs have risen.
The growth of group operators in a broadly static market has meant that independent operators have suffered in the face of rising costs and increased competition.
38 Trends & Developments
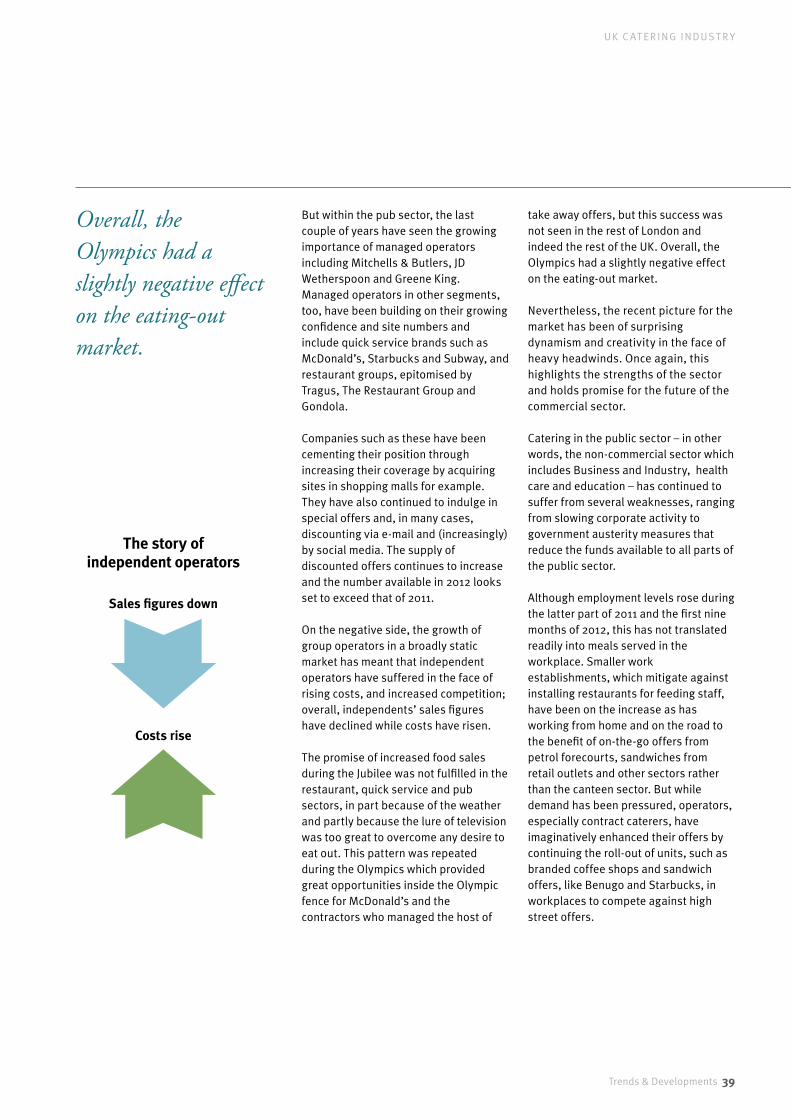
Trends & Developments 39
U K C AT E RI N G I N DUS T RY
Overall, the Olympics had a slightly negative effect on the eating-out market.
But within the pub sector, the last couple of years have seen the growing importance of managed operators including Mitchells & Butlers, JD Wetherspoon and Greene King. Managed operators in other segments, too, have been building on their growing confidence and site numbers and include quick service brands such as McDonald’s, Starbucks and Subway, and restaurant groups, epitomised by Tragus, The Restaurant Group and Gondola.
Companies such as these have been cementing their position through increasing their coverage by acquiring sites in shopping malls for example. They have also continued to indulge in special offers and, in many cases, discounting via e-mail and (increasingly) by social media. The supply of discounted offers continues to increase and the number available in 2012 looks set to exceed that of 2011.
On the negative side, the growth of group operators in a broadly static market has meant that independent operators have suffered in the face of rising costs, and increased competition; overall, independents’ sales figures have declined while costs have risen.
The promise of increased food sales during the Jubilee was not fulfilled in the restaurant, quick service and pub sectors, in part because of the weather and partly because the lure of television was too great to overcome any desire to eat out. This pattern was repeated during the Olympics which provided great opportunities inside the Olympic fence for McDonald’s and the contractors who managed the host of
take away offers, but this success was not seen in the rest of London and indeed the rest of the UK. Overall, the Olympics had a slightly negative effect on the eating-out market.
Nevertheless, the recent picture for the market has been of surprising dynamism and creativity in the face of heavy headwinds. Once again, this highlights the strengths of the sector and holds promise for the future of the commercial sector.
Catering in the public sector – in other words, the non-commercial sector which includes Business and Industry, health care and education – has continued to suffer from several weaknesses, ranging from slowing corporate activity to government austerity measures that reduce the funds available to all parts of the public sector.
Although employment levels rose during the latter part of 2011 and the first nine months of 2012, this has not translated readily into meals served in the workplace. Smaller work establishments, which mitigate against installing restaurants for feeding staff, have been on the increase as has working from home and on the road to the benefit of on-the-go offers from petrol forecourts, sandwiches from retail outlets and other sectors rather than the canteen sector. But while demand has been pressured, operators, especially contract caterers, have imaginatively enhanced their offers by continuing the roll-out of units, such as branded coffee shops and sandwich offers, like Benugo and Starbucks, in workplaces to compete against high street offers.
The story of independent operators
Sales figures down
Costs rise
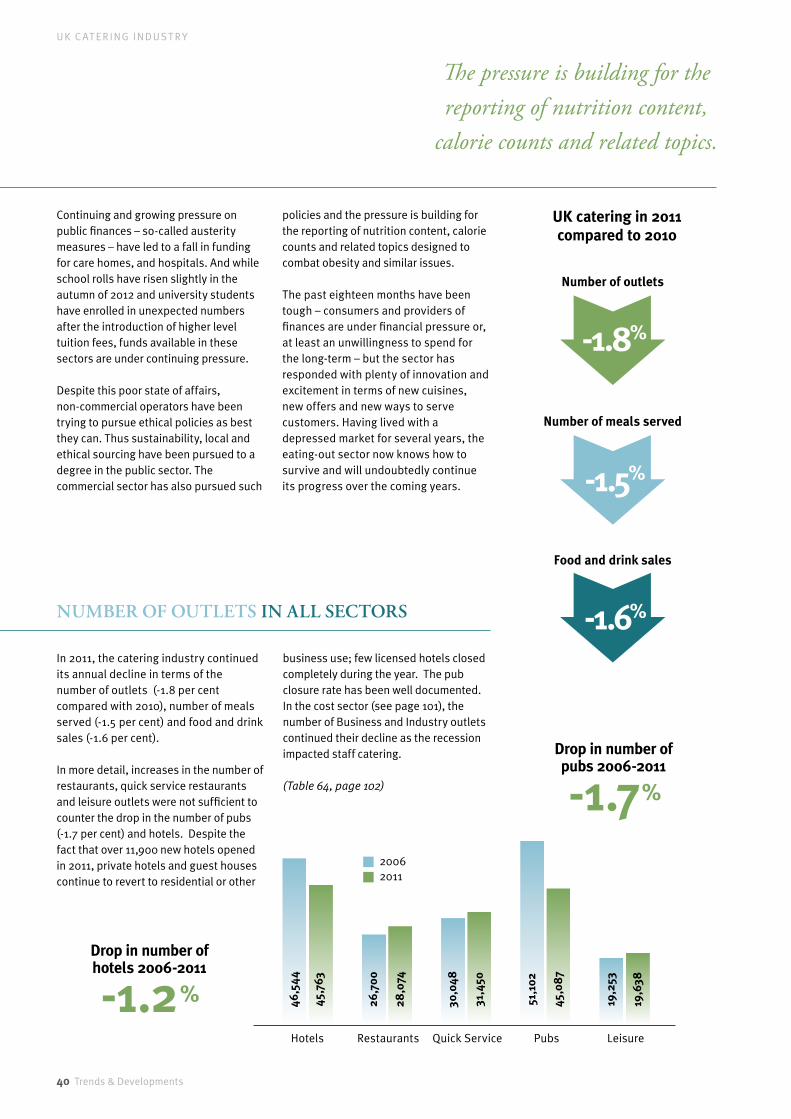
40 Trends & Developments
U K C AT E RI N G I N DUS T RY
Continuing and growing pressure on public finances – so-called austerity measures – have led to a fall in funding for care homes, and hospitals. And while school rolls have risen slightly in the autumn of 2012 and university students have enrolled in unexpected numbers after the introduction of higher level tuition fees, funds available in these sectors are under continuing pressure.
Despite this poor state of affairs, non-commercial operators have been trying to pursue ethical policies as best they can. Thus sustainability, local and ethical sourcing have been pursued to a degree in the public sector. The commercial sector has also pursued such
policies and the pressure is building for the reporting of nutrition content, calorie counts and related topics designed to combat obesity and similar issues.
The past eighteen months have been tough – consumers and providers of finances are under financial pressure or, at least an unwillingness to spend for the long-term – but the sector has responded with plenty of innovation and excitement in terms of new cuisines, new offers and new ways to serve customers. Having lived with a depressed market for several years, the eating-out sector now knows how to survive and will undoubtedly continue its progress over the coming years.
The pressure is building for the reporting of nutrition content,
calorie counts and related topics.
Number of outlets
Number of meals served
Food and drink sales
UK catering in 2011 compared to 2010
-1.8%
-1.5%
-1.6%nUmBER OF OUTLETs in ALL sEcTORs
In 2011, the catering industry continued its annual decline in terms of the number of outlets (-1.8 per cent compared with 2010), number of meals served (-1.5 per cent) and food and drink sales (-1.6 per cent).
In more detail, increases in the number of restaurants, quick service restaurants and leisure outlets were not sufficient to counter the drop in the number of pubs (-1.7 per cent) and hotels. Despite the fact that over 11,900 new hotels opened in 2011, private hotels and guest houses continue to revert to residential or other
business use; few licensed hotels closed completely during the year. The pub closure rate has been well documented. In the cost sector (see page 101), the number of Business and Industry outlets continued their decline as the recession impacted staff catering.
(Table64,page102)
46,5
44
45,7
63
26,7
00
30,0
48
51,1
02
19,2
53
28,0
74
31,4
50
45,0
87
19,6
38
-1.7 %
-1.2 %
Drop in number of pubs 2006-2011
Drop in number of hotels 2006-2011
3,510
5,130
8.641
3,738
20,356
26,227
Hotels Restaurants Quick Service Pubs Leisure
20062011

I N T RO DU C T I O N
Trends & Developments 41
Combined food and drink sales for pubs in 2011
-0.7%
The negative impact of the economic recession was emphasised in 2011 when the number of meals in the profit sector fell by 0.5 per cent, principally because of a fall in the number of meals served in pubs (-8.7 per cent) though all profit
sectors showed a decline. The cost sector, too, followed this downward trend (-1.7 per cent), with the biggest drop in the number of B&I meals.
(Table65,page102)
nUmBER OF mEALs
HOw mUcH did THEY sPEnd?
Food sales reflected the downward trend in the number of meals served, with a 0.5 per cent drop in the profit sector and a similar decline in the cost sector. Hotels, restaurants and leisure outlets bucked this trend with a modest increase but this did not counter the 0.8 per cent decline in food sales in pubs.
Combining food and drink sales, pubs again suffered in 2011 (-0.7 per cent). Although other profit sectors turned in a more buoyant performance during the year, food and drink sales declined by 1.6 per cent.
(Tables66-67,page103)
Food sales reflected the downward trend in the number of meals served.
-8.7 %Meals served in pubs
2006 2011
Cost Sector (£m)3,510
3,322
Profit Sector (£m)5,130
4,686
Total (£m)8.008
8.641
Number of meals served in all sectors
2004 2011
Cost Sector (£m)3,738 4,196
Profit Sector (£m)
20,356
27,587Total (£m)31,783
26,227
Food sales in all sectors
Trends & Developments 41
U K C AT E RI N G I N DUS T RY
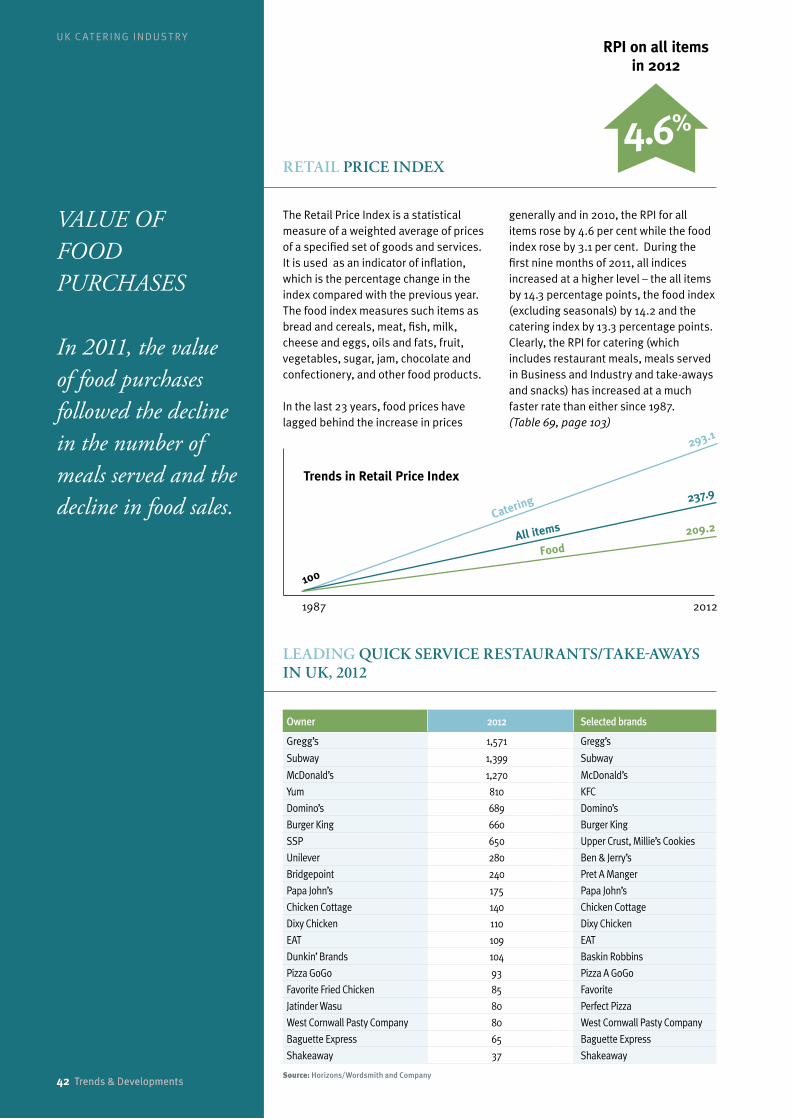
42 Trends & Developments
U K C AT E RI N G I N DUS T RY
VALUE OF FOOD PURCHASES
In 2011, the value of food purchases followed the decline in the number of meals served and the decline in food sales.
Owner 2012 Selected brands
Gregg’s 1,571 Gregg’s
Subway 1,399 Subway
McDonald’s 1,270 McDonald’s
Yum 810 KFC
Domino’s 689 Domino’s
Burger King 660 Burger King
SSP 650 Upper Crust, Millie’s Cookies
Unilever 280 Ben & Jerry’s
Bridgepoint 240 Pret A Manger
Papa John’s 175 Papa John’s
Chicken Cottage 140 Chicken Cottage
Dixy Chicken 110 Dixy Chicken
EAT 109 EAT
Dunkin’ Brands 104 Baskin Robbins
Pizza GoGo 93 Pizza A GoGo
Favorite Fried Chicken 85 Favorite
Jatinder Wasu 80 Perfect Pizza
West Cornwall Pasty Company 80 West Cornwall Pasty Company
Baguette Express 65 Baguette Express
Shakeaway 37 Shakeaway
Source: Horizons/Wordsmith and Company
RETAiL PRicE indEx
LEAdinG QUicK sERvicE REsTAURAnTs/TAKE-AwAYs in UK, 2012
The Retail Price Index is a statistical measure of a weighted average of prices of a specified set of goods and services. It is used as an indicator of inflation, which is the percentage change in the index compared with the previous year. The food index measures such items as bread and cereals, meat, fish, milk, cheese and eggs, oils and fats, fruit, vegetables, sugar, jam, chocolate and confectionery, and other food products.
In the last 23 years, food prices have lagged behind the increase in prices
generally and in 2010, the RPI for all items rose by 4.6 per cent while the food index rose by 3.1 per cent. During the first nine months of 2011, all indices increased at a higher level – the all items by 14.3 percentage points, the food index (excluding seasonals) by 14.2 and the catering index by 13.3 percentage points. Clearly, the RPI for catering (which includes restaurant meals, meals served in Business and Industry and take-aways and snacks) has increased at a much faster rate than either since 1987. (Table69,page103)
RPI on all itemsin 2012
4.6%
Trends in Retail Price Index
293.1
1987 2012
Catering
All items
Food
237.9
209.2
100
42 Trends & Developments
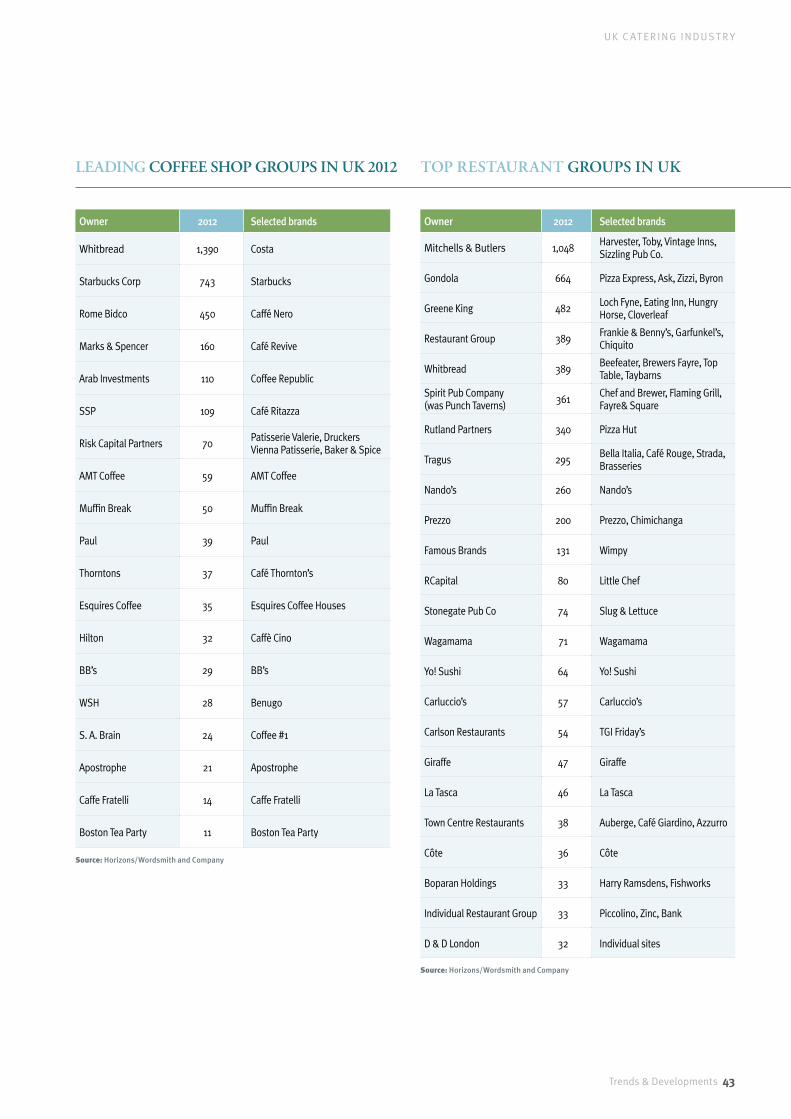
Trends & Developments 43
U K C AT E RI N G I N DUS T RY
293.1
Owner 2012 Selected brands
Whitbread 1,390 Costa
Starbucks Corp 743 Starbucks
Rome Bidco 450 Caffé Nero
Marks & Spencer 160 Café Revive
Arab Investments 110 Coffee Republic
SSP 109 Café Ritazza
Risk Capital Partners 70 Patisserie Valerie, Druckers Vienna Patisserie, Baker & Spice
AMT Coffee 59 AMT Coffee
Muffin Break 50 Muffin Break
Paul 39 Paul
Thorntons 37 Café Thornton’s
Esquires Coffee 35 Esquires Coffee Houses
Hilton 32 Caffè Cino
BB’s 29 BB’s
WSH 28 Benugo
S. A. Brain 24 Coffee #1
Apostrophe 21 Apostrophe
Caffe Fratelli 14 Caffe Fratelli
Boston Tea Party 11 Boston Tea Party
Source: Horizons/Wordsmith and Company
LEAdinG cOFFEE sHOP GROUPs in UK 2012 TOP REsTAURAnT GROUPs in UK
Owner 2012 Selected brands
Mitchells & Butlers 1,048 Harvester, Toby, Vintage Inns, Sizzling Pub Co.
Gondola 664 Pizza Express, Ask, Zizzi, Byron
Greene King 482 Loch Fyne, Eating Inn, Hungry Horse, Cloverleaf
Restaurant Group 389 Frankie & Benny’s, Garfunkel’s, Chiquito
Whitbread 389 Beefeater, Brewers Fayre, Top Table, Taybarns
Spirit Pub Company (was Punch Taverns) 361 Chef and Brewer, Flaming Grill,
Fayre& Square
Rutland Partners 340 Pizza Hut
Tragus 295 Bella Italia, Café Rouge, Strada, Brasseries
Nando’s 260 Nando’s
Prezzo 200 Prezzo, Chimichanga
Famous Brands 131 Wimpy
RCapital 80 Little Chef
Stonegate Pub Co 74 Slug & Lettuce
Wagamama 71 Wagamama
Yo! Sushi 64 Yo! Sushi
Carluccio’s 57 Carluccio’s
Carlson Restaurants 54 TGI Friday’s
Giraffe 47 Giraffe
La Tasca 46 La Tasca
Town Centre Restaurants 38 Auberge, Café Giardino, Azzurro
Côte 36 Côte
Boparan Holdings 33 Harry Ramsdens, Fishworks
Individual Restaurant Group 33 Piccolino, Zinc, Bank
D & D London 32 Individual sites
Source: Horizons/Wordsmith and Company

44 Trends & Developments
U K C AT E RI N G I N DUS T RY
Living in a convenience-focused society, UK consumers are now much more likely to pop to a coffee shop, buy pre-prepared food from the supermarket, collect a meal from the local takeaway, or eat out. It’s clear that canny operators are keeping a very close eye on consumer behaviour and quickly adapt their offerings to take advantage of the latest trends.
Costa Coffee, Starbucks and Caffé Nero are just three of the coffee shop brands competing to attract and retain customers with new products, concepts and promotional partnerships. SA Brain, the Welsh brewer and leisure operator acquired the Coffee#1 chain of 15 outlets in 2011 and has since opened a further 10 sites with a target of operating a
50-strong estate by the end of 2013.With the advent of mobile technology, coffee shops are recognised as suitable venues for meetings or to catch up with friends, so the free Wi-Fi provided by operators has become one of their most important offerings.
Starbucks already operates 10 Drive Thru sites in the UK and when the company announced plans to add 300 stores to its UK estate, it also indicated that 200 of these outlets would be drive through sites, many of which would be operated under licence by petrol forecourt retailer Euro Garages. Costa Coffee also opened its first Drive Thru store in Nottingham in 2011 and plans to have six drive-through outlets open by the end of 2012.
A number of different research reports published in 2012 confirm that British consumers’ enthusiasm for eating out is set to continue. A Horizons survey, published in July 2012, reported that on average, British consumers had eaten out 2.77 times in the preceding two weeks – an increase from 2.02 times in the previous year’s survey. But although consumers are choosing to eat out more frequently, the average spend per head, including drinks, has declined, falling to £12.30, compared with £12.69 the previous year.
EATinG-OUT cOnTinUEs – BUT FEw PROPERTY TRAnsAcTiOns
Free Wi-Fi provided by operators has become one of their most important offerings.
Average spend per head declined
in 2012 to
£12.30
cAn i UsE mY vOUcHER?
Operators started offering vouchers at the beginning of the recession and consumers have become increasingly reliant upon them. In fact, they commonly check online before visiting casual dining restaurants to ensure that they benefit from the latest offers and best deals.
Research in January 2012 found that six out of ten diners use vouchers when eating out, although just one in four people said they go out more often as a result of the vouchers. Use of vouchers is highest in the casual dining (61 per cent)
and quick service (62 per cent) markets. Just under half (48 per cent) of people use vouchers in a bar or pub, while 50 per cent do so in a fine dining venue.
Operators would clearly like to reduce consumers’ reliance on these sales incentives and research indicates that only one in five respondents would stop visiting an outlet if vouchers were no longer provided. Vouchers are unlikely to disappear altogether, but they are likely to be much less widely available in the future.
60%of diners use vouchers
when eating out.
By Simon Chaplin, Director & Head of Restaurants, Christie + Co

I N T RO DU C T I O N
Trends & Developments 45
TOP PERFORmERs And RisinG sTARs
Full-service restaurants experienced an optimistic growth year in 2011, with an increase of 7.1 percent in turnover. Rising stars in this category include Busaba Eathai, Jamie’s Italian and Côte. Andy Bassadone and Chris Benians launched Côte, the French brasserie concept, shortly after they sold Strada to Tragus Holdings. Since then Côte has gone from strength to strength, developing an estate of around 35 sites making it one of the top performing privately owned bars and restaurants in the UK.
Having opened its first restaurant in Charing Cross Road, London in May 2010, the US-based, Mexican-style Chipotle chain finally progressed its UK rollout during 2012. TGI Friday’s has also experienced something of a resurgence in popularity and plans to open up to seven new sites before the end of 2012.
There has also been plenty of investor interest in the sector, with private equity firms keen to support the expansion of successful brands.
In April, Graphite Capital announced that it had provided £21m in expansion funding to Rex Restaurant Associates Limited, the company established by Chris Corbin and Jeremy King, owners of The Wolseley restaurant on Piccadilly.
During the same month, Piper Private Equity acquired a significant minority stake in Loungers, the fast-growing cafe/bar restaurant group, investing £16m in the business.
Later in the year, Isis Equity Partners acquired a minority stake in Pho, the Vietnamese fast-casual concept, investing £5.2m to aid its expansion.
The Olympic and Paralympic games contributed to the transactional lull, as operators waited to see what effect the games would have on their operations.
7.1%
Busaba Eathai
Jamie’s Italian
Côte
Full service restaurant turnover in 2011
TRAnsAcTiOnAL LULL
Transactional activity was very limited in 2012, with some operators choosing to focus on improving the efficiency of their existing operations, whilst others sought suitable sites to meet their expansion plans.
London and other key cities continue to be the most desirable locations for restaurant operators, but prime sites are few and far between. The sale of former Paramount Restaurant sites dominated the transaction lists at the beginning of the year, as La Tasca, Camino and Byron acquired sites formerly operated under the Bertorelli, Livebait and Brasserie Gérard brands. As the leading operators focus on acquiring prime sites in London, regional operators like Living Ventures are able to take advantage of local opportunities.
New retail developments are scarce, but we have seen a few of the leading
brands, such as Byron, Carluccio’s, Wagamama and Miller & Carter acquire shopping centre sites this year. This lack of new development opportunities is prompting acquisitive operators to widen the net and consider a variety of alternative locations. Loungers, the café, bar, restaurant operator recently acquired new premises in Bournemouth, which had previously been occupied by a newsagent.
The Olympic and Paralympic games contributed to the transactional lull, as operators waited to see what effect the games would have on their operations. Whilst initial reports suggest that the performance of restaurants increased marginally in August, particularly in London, the Olympics didn’t prompt the bonanza that everyone was hoping for. Now that the games are over, we have witnessed an increase in activity as potential buyers seek new opportunities.
Trends & Developments 45
U K C AT E RI N G I N DUS T RY

U K C AT E RI N G I N DUS T RY
TALEs OF TROUBLE
Little Chef, the iconic roadside operator which is backed by R Capital, underwent a restructuring exercise in 2012, selling off 67 sites earlier in the year and closing its Sheffield headquarters.
La Tasca, the tapas restaurant chain, completed a Company Voluntary Agreement that saw 16 sites closed and left it with an estate of 46 restaurants in the UK. The CVA, which cleared a £2m loss from the business, also led to rent reductions on 19 sites and a monthly instalment plan for rents on the remainder. La Tasca certainly isn’t alone in embarking upon lease renegotiations. Christie + Co is frequently asked to assist operators in negotiations with landlords and we have witnessed a few CVAs in the hospitality sector during 2012. It is unclear how they will affect investors.
67 Little Chefsites sold off in 2012
LOOKinG FORwARd TO 2013
From a transactional point of view, we can expect more consolidation in 2013. Gondola and Tragus have not been particularly acquisitive in 2012 so it will be interesting to see what their next moves will be. Living Ventures will also be one to watch in the coming months.
There are predictions that the UK’s branded restaurant market will grow by
22 per cent to £13.6 billion in the next three years, as eating-out becomes increasingly ingrained in consumer behaviour. The opportunities are there. The challenge for operators will be responding to consumer needs, coping with rising costs and securing suitable sites to enable the growth of their businesses.
22%
predicted growth in branded restaurants by 2015
There are predictions that the UK’s branded restaurant market will grow by 22 per cent to £13.6bn in the next three years.
46 Trends & Developments

Trends & Developments 47
U K C AT E RI N G I N DUS T RY
puBs
P U BS
Headline dominating topics in 2012 included the beer duty escalator and minimum pricing. Although the British Beer & Pub Association (BBPA) reported that the decline in on-trade beer volumes slowed in 2011, with sales falling 3.4 per cent – the lowest rate of decline since 2004 – the association reported a six per cent slide in the first quarter of 2012 and a 5.3 per cent slide in the second quarter. Increasing taxes are blamed for declining sales and a campaign to scrap the beer duty escalator has reached its target of 100,000 signatures, giving hope to campaigners who want the issue to be debated in parliament. The escalator puts up the tax on a pint by two per cent above inflation every year and has resulted in a 42 per cent tax increase since its introduction in 2008.
Whilst the minimum pricing legislation in Scotland is currently being challenged, the idea is quite widely supported in the on-trade in the hope that it will negatively affect the off-trade. A recent survey of members of the British Institute of Innkeeping revealed that 77 per cent of licensees questioned agreed with the concept of a national minimum price. Although many licensees hold supermarkets responsible for the decline in the on-trade, we don’t believe that the introduction of minimum pricing will have
much of an impact on the balance between on- and off-sales in the future.
There have been conflicting reports about the number of pub closures taking place in 2012. A report published by Begbies Traynor in April suggested that pubs were closing at a rate of 50 per week; whilst a report published by the Campaign for Real Ale (CAMRA) just a few days later suggested that the weekly figure was 12. Regardless of the closure rate, we continue to believe that the pub market is oversupplied in certain areas and up to 3,000 unsustainable units still need to close.
The pub sector has been taking criticism and attracting negative headlines for so long, some investors are finally starting to recognise the benefits of entering the sector.
“Trading conditions have been difficult for a long time but the pub companies have proved their resilience,” says Andreas Scriven, Christie + Co’s Head of Consultancy.
“Some new investors, including private equity firms, are adopting a contrarian investment strategy. Rather than being deterred by all the negativity surrounding the sector, they recognise that it has driven values down and created an
An UndERvALUEd sEcTOR sTimULATEs invEsTOR ATTEnTiOn
Negativity has surrounded the pub sector for more than five years – since the licensing laws changed in 2005 and the smoking bans were implemented in 2006 and 2007. Since then the headlines have featured an endless stream of challenging issues that have adversely impacted pub businesses – from below-cost supermarket pricing, to binge drinking. Apply all these additional issues to those faced by every other UK business – an economic downturn, rising costs and declining consumer confidence – it’s hardly surprising that we have witnessed so many pub closures.
‘We believe that up to 3,000 unsustainable units need to close.’
Pub values have continually declined since 2008 – there has never been a
better time to buy.
By Neil Morgan, Director & Head of Pubs, Christie + Co
48 Trends & Developments

Trends & Developments 49
P U BS
opportunity for them to dive in and pick up portfolios that they can clean up. Judging by the number of enquiries we have received from investors seeking industry insight and advice, we can expect them to be much more active in the coming months.”
Having reported declining pub values since 2008, we believed that they had reached their lowest point in 2011. Unfortunately, the economic malaise has been even worse than we first thought and, having witnessed a further decline in prices, we finally believe that we have reached the bottom of the curve. Although the decline is clearly bad news for anyone who wants to exit the sector, there has never been a better time to buy. Whilst banks are looking for an exit, experienced operators – including those who have retired – can’t resist the urge to jump back in. Anyone with suitable knowledge and experience has the opportunity to pick up sites at a very affordable level, provided they are able to secure the funding to do so.
Stonegate Pub Company’s acquisition of 333 wet-led pubs from Mitchells & Butlers in August 2010, in a deal backed by TDR Capital, was one of the first indications that private equity was returning to the pub market. Since then we have seen a number of private equity firms stepping in to acquire stakes in pub and restaurant companies and fund expansion plans. Private equity players have been very active in the managed house sector in 2012. So far, the most noteworthy deal of the year has been the acquisition of Novus Leisure by LGV Capital and Hutton Collins. Novus Leisure, which operates a chain of 52 bars and nightclubs, was acquired for £100m in a deal that marked the exit of the banks – Barclays Ventures and RBS Strategic Investment Group. A sale of Inventive Leisure, the Revolution vodka bar operator, has also been rumoured since it was placed on the market earlier this year, with bidders
reported to include Silverfleet Capital and Equistone Partners Europe.
The Barracuda Group found itself in need of a strategic review in 2012. The Group, which operates late-night managed houses under a range of brands including Smith & Jones, Varsity and Cape, secured the backing of Värde Partners to enable a restructuring exercise that separated the property company from the operating company. As a result of the restructuring, the renamed Bramwell Pub Company will operate 190 pubs across the UK and plans to invest in service and training as well as refurbishment.
Managed houses continue to be incredibly popular at an individual level too, with buyers fishing from an increasingly small pond – particularly in London where Fuller’s and Young’s actively compete for the best sites. Development and new build schemes provide managed house operators with a rare opportunity to create value-led food operations on the edge of towns and they are always in high demand. Country house pub developments have also become more of a possibility now that pub numbers have declined and the “too many pubs” argument can no longer be used during the planning process.
Despite a decline in the total number of wet-led outlets, some companies continue to target wet-led sites, restoring many of those that have failed and returning them to licensed use. Blackpool-based Amber Taverns, which operates around 80 pubs in the north of England, is apparently succeeding in its mission to prove that wet-led community pubs are both “relevant and viable”. The company, which is backed by LGV Capital, is rapidly growing its estate of wet-led community pubs and looks set to expand beyond 100 sites over the coming months.
Bravo Inns – another North West-based, wet-led community pub operator, which is backed by Albion Ventures – has also grown its estate during 2012.
So far, the most noteworthy deal of the year has been the acquisition of Novus Leisure by LGV Capital and Hutton Collins.
Amber Taverns is apparently succeeding in its mission to prove that wet-led community pubs are both “relevant and viable”.
Bravo Inns has grown its estate during 2012
50 Trends & Developments
P U BS
Although trading conditions are still tough, pub businesses continue to demonstrate their resilience by positioning themselves as community service providers and exploring new ways of attracting customers from an even wider audience.
Pubs are already taking advantage of consumer demand for convenient, affordable meals and we can expect to see even more innovative pub dining and takeaway options in the future. With relatively low set-up and operating costs, the addition of letting bedrooms is another good way for pubs to increase revenue and boost food and drink spend.
Depending on their location, pubs can provide accommodation for backpackers, compete with budget hotels, secure wedding and function business, or tap into the domestic tourism market. During 2013 we are likely to see pubs develop even more inventive ways of revenue building.
The pubcos are also much more willing to offer support and guidance to tenants and lessees, in an attempt to put an end to revolving door tenancies. We are generally seeing more openness and transparency, with some pubcos even providing shadow P&L accounts for benchmarking purposes, so that licensees are aware of performance expectations.
Franchising and franchise-type models are becoming increasingly popular, as pub
companies assume some of the responsibility for the property, in an effort to make pub operation more appealing for the licensee. Unlike the restaurant sector, where franchise agreements are based on the appeal of the brand, pub franchises are based on the buying power and support of the pub company.
We can expect further advances in the relationship between landlords and licensees as the pub companies compete to secure the best operators. We are also likely to see new business-building initiatives, such as free Wi-Fi, to target increasingly mobile consumers, for whom connectivity is essential.
As pub companies continue to improve their performance and boost investor confidence, the transactional market is likely to become a little more dynamic in 2013. The big pub companies will continue churning their estates and disposing of assets, generating opportunities for the smaller, up-and-coming operators to expand, although availability of debt continues to be an issue. But whilst the majority of deals in 2012 have been individual and small portfolio sales, we expect to see some bigger transactions as confidence grows.
LOOKinG FORwARd TO A mORE POsiTivE 2013
During 2013 we are likely to see pubs develop even more inventive ways of revenue building.
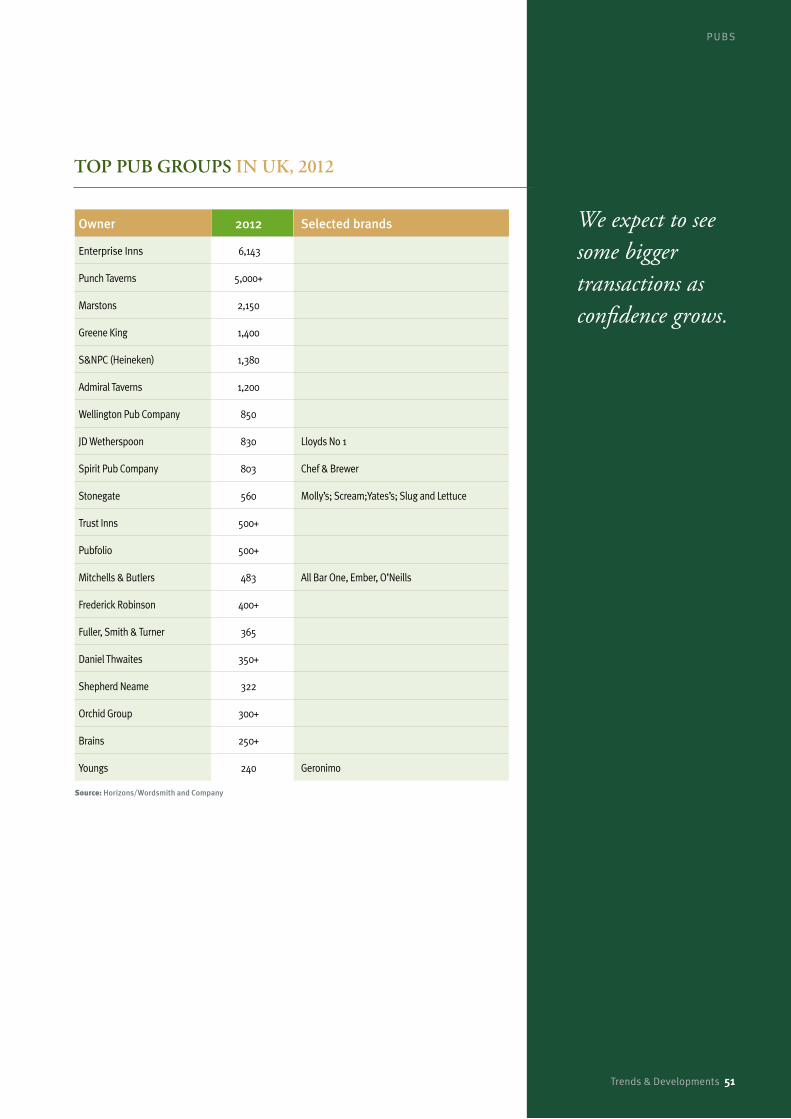
P U BS
TOP PUB GROUPs in UK, 2012
Owner 2012 Selected brands
Enterprise Inns 6,143
Punch Taverns 5,000+
Marstons 2,150
Greene King 1,400
S&NPC (Heineken) 1,380
Admiral Taverns 1,200
Wellington Pub Company 850
JD Wetherspoon 830 Lloyds No 1
Spirit Pub Company 803 Chef & Brewer
Stonegate 560 Molly’s; Scream;Yates’s; Slug and Lettuce
Trust Inns 500+
Pubfolio 500+
Mitchells & Butlers 483 All Bar One, Ember, O’Neills
Frederick Robinson 400+
Fuller, Smith & Turner 365
Daniel Thwaites 350+
Shepherd Neame 322
Orchid Group 300+
Brains 250+
Youngs 240 Geronimo
Source: Horizons/Wordsmith and Company
We expect to see some bigger transactions as confidence grows.
Trends & Developments 51
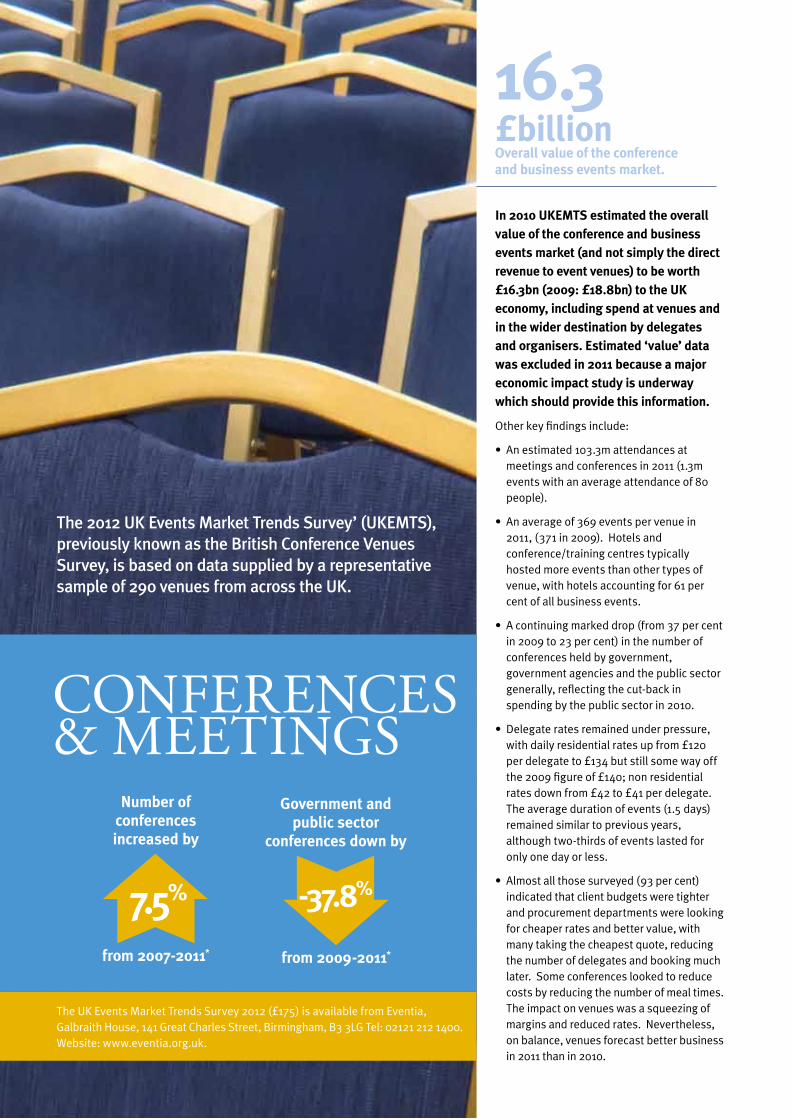
52 Trends & Developments
P U BS
ConFeRenCes & meetinGs
In 2010 UKEMTS estimated the overall value of the conference and business events market (and not simply the direct revenue to event venues) to be worth £16.3bn (2009: £18.8bn) to the UK economy, including spend at venues and in the wider destination by delegates and organisers. Estimated ‘value’ data was excluded in 2011 because a major economic impact study is underway which should provide this information.
Other key findings include:
• An estimated 103.3m attendances at meetings and conferences in 2011 (1.3m events with an average attendance of 80 people).
• An average of 369 events per venue in 2011, (371 in 2009). Hotels and conference/training centres typically hosted more events than other types of venue, with hotels accounting for 61 per cent of all business events.
• A continuing marked drop (from 37 per cent in 2009 to 23 per cent) in the number of conferences held by government, government agencies and the public sector generally, reflecting the cut-back in spending by the public sector in 2010.
• Delegate rates remained under pressure, with daily residential rates up from £120 per delegate to £134 but still some way off the 2009 figure of £140; non residential rates down from £42 to £41 per delegate. The average duration of events (1.5 days) remained similar to previous years, although two-thirds of events lasted for only one day or less.
• Almost all those surveyed (93 per cent) indicated that client budgets were tighter and procurement departments were looking for cheaper rates and better value, with many taking the cheapest quote, reducing the number of delegates and booking much later. Some conferences looked to reduce costs by reducing the number of meal times. The impact on venues was a squeezing of margins and reduced rates. Nevertheless, on balance, venues forecast better business in 2011 than in 2010.
The 2012 UK Events Market Trends Survey’ (UKEMTS), previously known as the British Conference Venues Survey, is based on data supplied by a representative sample of 290 venues from across the UK.
7.5%
Number of conferences increased by
from 2007-2011*
16.3 £billionOverall value of the conference and business events market.
from 2009-2011*
Government and public sector
conferences down by
-37.8%
The UK Events Market Trends Survey 2012 (£175) is available from Eventia, Galbraith House, 141 Great Charles Street, Birmingham, B3 3LG Tel: 02121 212 1400. Website: www.eventia.org.uk.

Trends & Developments 53
CO N F E RE N C E S
Venues felt that price/value for money was easily the key consideration in the mind of the buyer followed by location
and access. Being a recognised brand and green sustainability credentials were seen as much less important, though
being a brand was more important for hotel venues (18 per cent indicated it was an important criterion for buyers).
wHY dO BUYERs cHOOsE?
93% Tighter client budgets (cheaper rates/more value for money)
76% Shorter lead times
69% Increased competition from cheaper venues/in-house facilities
56% Less catering spend (room only/avoiding meal times)
49% Smaller events
42% Increase in day/fewer residential/shorter events
36% clients reluctant to commit to contracts
21% Organisers demanding greater levels of technology and equipment
18% More intervention from client procurement departments
13% Organisers demanding more specific dietary requirements
12% Organisers demanding ‘green’ credentials
61% Hotels
12% Conference/training centre
19% Unusual venue
7% University
Market share by conference venue (%), 2011*
1% Purpose-built centre
*Source: UKEMT Survey, 2012
Type of conference*
Residential2.0 Days
Non-residential1.5 Days
Average delegate attendance, 2011*
No. of Delegates No. of Delegate days2010 20102011 2011
67.6m 91.372.3m 104.9
10.5m
14.2
10.3m
15.0
10.5m
14.2
20.7m
41.3
Total 98.7m
Total 146.2m
Total 103.3m
Total 166.2m
Value of conferences 2010-2011*
Number of conferences 2010-2011*
Non-StayingTotal spend – 2010: £5.5bn 2011: n/a
Staying – DestinationTotal spend – 2010: £2.9bn 2011: n/a
Staying – ResidentialTotal spend – 2010: £2.9bn 2011: n/a
Average annual conference per venue2007 2008 2009 2010 2011
343 391 379 371 369
Total 1.20m
Total 1.37m
Total 1.32m
Total 1.30m
Total 1.29m
British conference market: number of events, 2007-2011*
2009 2010 201137% 28% 23%
47% 51% 57%
16% 21%21%
Corporate
Association and not-for-profit
Government/public sector
Average daily delegate rates (£) including VAT, 2007-2011*
Type of conference 2007 2008 2009 2010 2011
Residential 133 138 140 120 134
Non-residential 40 46 46 42 41

54 Trends & Developments54 Trends & Developments54 Trends & Developments
E M P LOY M E N T & QU A L I F I C AT I O N S
54 Trends & Developments
employment & qualiFiCations

E M P LOY M E N T & QU A L I F I C AT I O N S
Trends & Developments 55Trends & Developments 55
The figures used in Table 74, page 105, are derived from a study of the hospitality industry for the BHA by Oxford Economics, but estimates by Deloitte for VisitBritain suggest a total visitor economy workforce of 2.63m, rising to 2.89m by 2020; these figures, however, include sectors such as the creative arts which are not normally included in employment statistics for the hospitality and tourism industry.
According to Table 73, in the last 12 years, employment in the hotel sector has risen by one per cent to 403,000 and by four per cent to 558,000 in restaurants and cafes while employment in pubs has declined by the same percentage to 476,000. The restaurant sector is by far the largest in terms of employment with 1.263m.
Oxford Economics calculates that the hospitality industry creates a further 1.2m jobs through indirect and induced employment. Indirect employment
comprises jobs sustained in the supply sector of the industry, for example, food and beverage manufacture, business services such as advertising and market research, agriculture and communications. Induced employment represents those jobs sustained by the spending of direct and indirect persons employed, such as jobs in retail outlets, companies producing consumer goods and a range of service industries.
Care should be taken in comparing figures from Table 74 with other tables in this section, which are based on ONS Labour Force Surveys.
A characteristic of the industry is that it is dominated by small businesses – over 80 per cent employ fewer than 50 people although they account for only 42 per cent of the workforce. Indeed, taking the entire number of hotels and guest houses (Table64,page102) the average number of employees per hotel is just over six (12 in restaurants).
The hospitality industry creates a further 1.2m jobs through indirect and induced employment.
Employment in PUB sector
Employment in RESTAURANT & CATERING
sector
Employment in HOTEL sector
1998-2010
1998-2010
1998-2010
-4%
4%
1%
nUmBER OF EmPLOYEEs in UK HOsPiTALiTY indUsTRY
17% Hotels and related
1% Event management
31% Catering
52% Restaurant and related
UK direct hospitality employment, 2010
The hospitality industry, in which we include hotels, restaurants, catering, pubs and bars and event management, directly employs 2.4m people but determining the exact number is complicated by the problems of defining the industry and of accurate data collection. Any comparison between different data sources should be treated with caution.
Trends & Developments 55
E M P LOY M E N T & QU A L I F I C AT I O N S

56 Trends & Developments56 Trends & Developments56 Trends & Developments
E M P LOY M E N T & QU A L I F I C AT I O N S
Many employers have had to face the problem of redundancy rather than recruitment.
A further characteristic is that the industry is notable for its high level of labour turnover. It is estimated that this currently stands at 30 per cent but many employers report a much higher figure. Some of this turnover is natural as many seasonal jobs are taken up by full-time students who are attracted to vacation work; they provide a flexible workforce which suits both employer and employee. Nevertheless, turnover generally is
higher in hospitality than in many other industries and, in some cases, staff shortages in the industry are caused more by problems of retention than recruitment. This problem has eased somewhat in the recession as many employers have had to face the problem of redundancy rather than recruitment, but it is likely to re-appear when the industry moves back into growth.
Female workers represent 58 per cent of the total workforce – a figure which has been declining in recent years. In 1995, the percentage was 70 per cent.
nUmBER OF wORKERs BY GEndER
30%
level of labour turnover
60,0
00
Sel
f cat
erin
g40
%60
%
262,
00
0H
otel
s43
.5%
56.5
%
386,
00
0H
ospi
talit
y se
rvic
es26
.8%
73.2
%
172,
00
0Fo
od S
ervi
ce a
nd
Man
agem
ent
33.8
%66
.2%
Pubs
, bar
s an
d ni
ght c
lubs
45.7
%54
.3%
342,
200
709,
700
Rest
aura
nts
50.8
%49
.2%
Male
Female
Total201157.6%
Female
42.3%Male
Numbers employed in the tourism and hospitality industry in UK by gender, 2011
54.3
%
56 Trends & Developments

E M P LOY M E N T & QU A L I F I C AT I O N S
Trends & Developments 57Trends & Developments 57Trends & Developments 57
Chefs and kitchen staff account for almost one-third of all hospitality employment with waiters and restaurant managers making up a further 19 per cent. Food and food service remains the industry’s principal activity. (Table76,page105)
Hospitality is mainly a young person’s industry, with 45 per cent of workers aged under 30 years – 14.5 per cent under 20 years – and 18.7 per cent aged over 50 years. (Table78,page106)
nUmBER OF wORKERs in cORE OccUPATiOns
nUmBER OF wORKERs BY AGE
16-19
20-29
30-49
50-64
0ver 65
16.7%
14.5%
34.8%
32.0%
2.0%Total employment in UK by age, 2011
45%
of workers are aged under 30 years
Total employment in core occupations 2011
427,300
43,200
Publicans & managers of licenced premeses 45,100
Bar staff 200,300
Waiters, waitresses 254,200
Restaurant, catering & bar managers 176,100
Kitchen & catering staff
Housekeepers and related occupations
45,700Conference & exhibition managers
Chefs, cooks
Hotel and accommodation managers
267,500
43,100
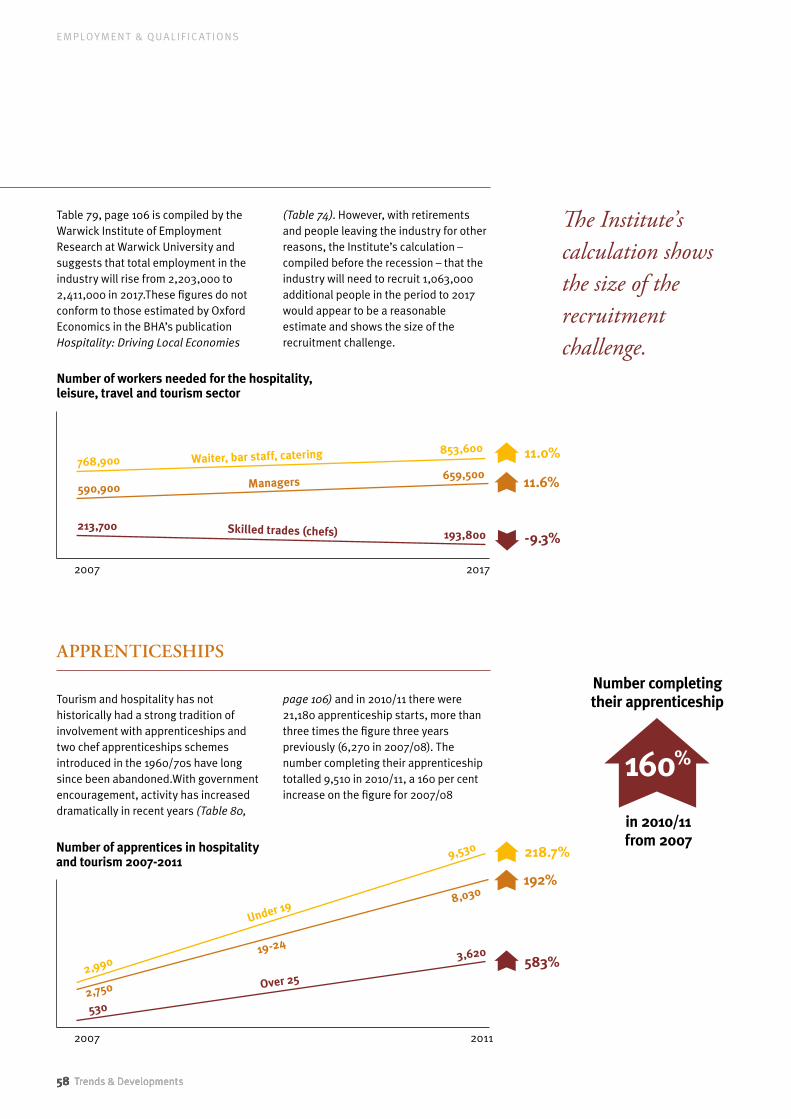
58 Trends & Developments58 Trends & Developments58 Trends & Developments
E M P LOY M E N T & QU A L I F I C AT I O N S
58 Trends & Developments
The Institute’s calculation shows the size of the recruitment challenge.
APPREnTicEsHiPs
Tourism and hospitality has not historically had a strong tradition of involvement with apprenticeships and two chef apprenticeships schemes introduced in the 1960/70s have long since been abandoned.With government encouragement, activity has increased dramatically in recent years (Table80,
page106) and in 2010/11 there were 21,180 apprenticeship starts, more than three times the figure three years previously (6,270 in 2007/08). The number completing their apprenticeship totalled 9,510 in 2010/11, a 160 per cent increase on the figure for 2007/08
Number of workers needed for the hospitality, leisure, travel and tourism sector
Number of apprentices in hospitality and tourism 2007-2011
Table 79, page 106 is compiled by the Warwick Institute of Employment Research at Warwick University and suggests that total employment in the industry will rise from 2,203,000 to 2,411,000 in 2017.These figures do not conform to those estimated by Oxford Economics in the BHA’s publication Hospitality:DrivingLocalEconomies
(Table74). However, with retirements and people leaving the industry for other reasons, the Institute’s calculation – compiled before the recession – that the industry will need to recruit 1,063,000 additional people in the period to 2017 would appear to be a reasonable estimate and shows the size of the recruitment challenge.
2007 2017
Waiter, bar staff, catering
Managers
Skilled trades (chefs)
853,600768,900
590,900
213,700193,800
659,500
11.0%
218.7%
-9.3%
583%
11.6%
192%
2007 2011
Under 19
19-24
Over 25
9,530
2,990
2,750
530
3,620
8,030
Number completing their apprenticeship
in 2010/11 from 2007
160%
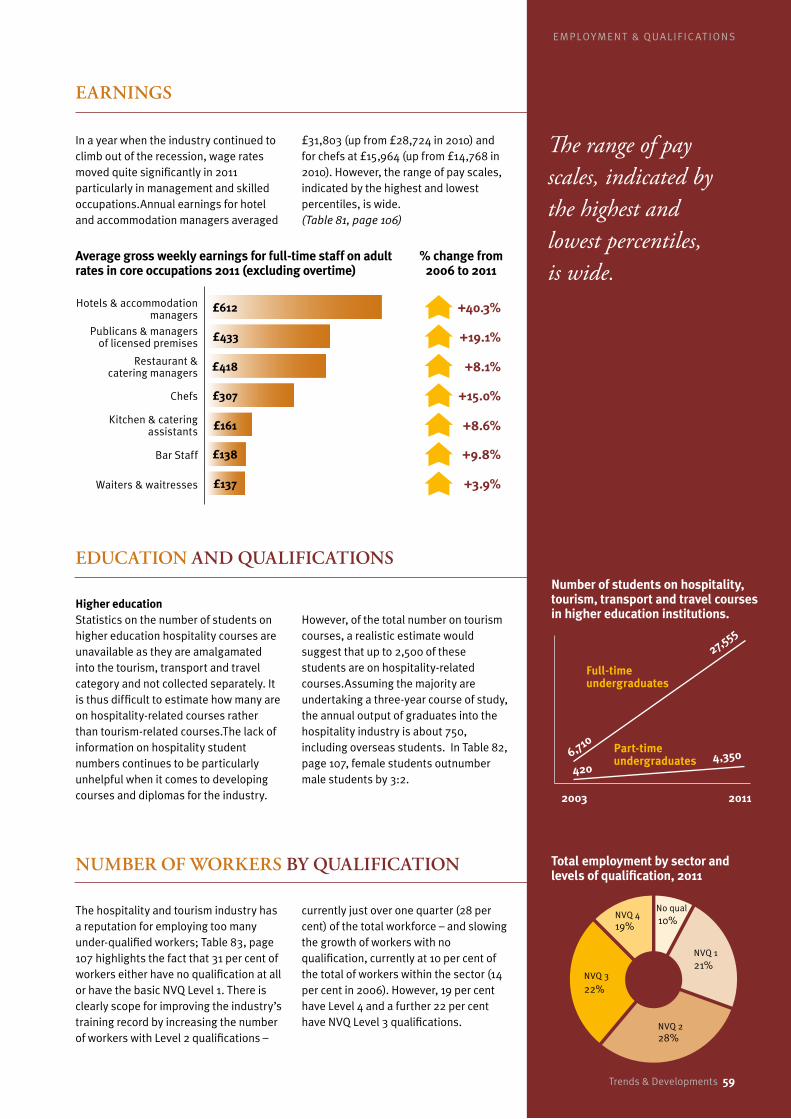
E M P LOY M E N T & QU A L I F I C AT I O N S
Trends & Developments 59Trends & Developments 59
The range of pay scales, indicated by the highest and lowest percentiles, is wide.
EARninGs
EdUcATiOn And QUALiFicATiOns
nUmBER OF wORKERs BY QUALiFicATiOn
In a year when the industry continued to climb out of the recession, wage rates moved quite significantly in 2011 particularly in management and skilled occupations.Annual earnings for hotel and accommodation managers averaged
£31,803 (up from £28,724 in 2010) and for chefs at £15,964 (up from £14,768 in 2010). However, the range of pay scales, indicated by the highest and lowest percentiles, is wide. (Table81,page106)
Higher educationStatistics on the number of students on higher education hospitality courses are unavailable as they are amalgamated into the tourism, transport and travel category and not collected separately. It is thus difficult to estimate how many are on hospitality-related courses rather than tourism-related courses.The lack of information on hospitality student numbers continues to be particularly unhelpful when it comes to developing courses and diplomas for the industry.
However, of the total number on tourism courses, a realistic estimate would suggest that up to 2,500 of these students are on hospitality-related courses.Assuming the majority are undertaking a three-year course of study, the annual output of graduates into the hospitality industry is about 750, including overseas students. In Table 82, page 107, female students outnumber male students by 3:2.
The hospitality and tourism industry has a reputation for employing too many under-qualified workers; Table 83, page 107 highlights the fact that 31 per cent of workers either have no qualification at all or have the basic NVQ Level 1. There is clearly scope for improving the industry’s training record by increasing the number of workers with Level 2 qualifications –
currently just over one quarter (28 per cent) of the total workforce – and slowing the growth of workers with no qualification, currently at 10 per cent of the total of workers within the sector (14 per cent in 2006). However, 19 per cent have Level 4 and a further 22 per cent have NVQ Level 3 qualifications.
Average gross weekly earnings for full-time staff on adult rates in core occupations 2011 (excluding overtime)
% change from 2006 to 2011
£612 +40.3%
Waiters & waitresses £137 +3.9%
Chefs £307 +15.0%
Restaurant & catering managers £418 +8.1%
Kitchen & catering assistants £161 +8.6%
Hotels & accommodation managers
£138 +9.8%Bar Staff
Publicans & managers of licensed premises £433 +19.1%
Number of students on hospitality, tourism, transport and travel courses in higher education institutions.
2003 2011
6,710
420
27,555
Full-time undergraduates
Part-time undergraduates 4,350
Total employment by sector and levels of qualification, 2011
10%No qual
NVQ 4
NVQ 2
19%
NVQ 3
22%
28%
21%NVQ 1
Trends & Developments 59
E M P LOY M E N T & QU A L I F I C AT I O N S

60 Trends & Developments
LO C A L ECO N O M Y
timeshaRe
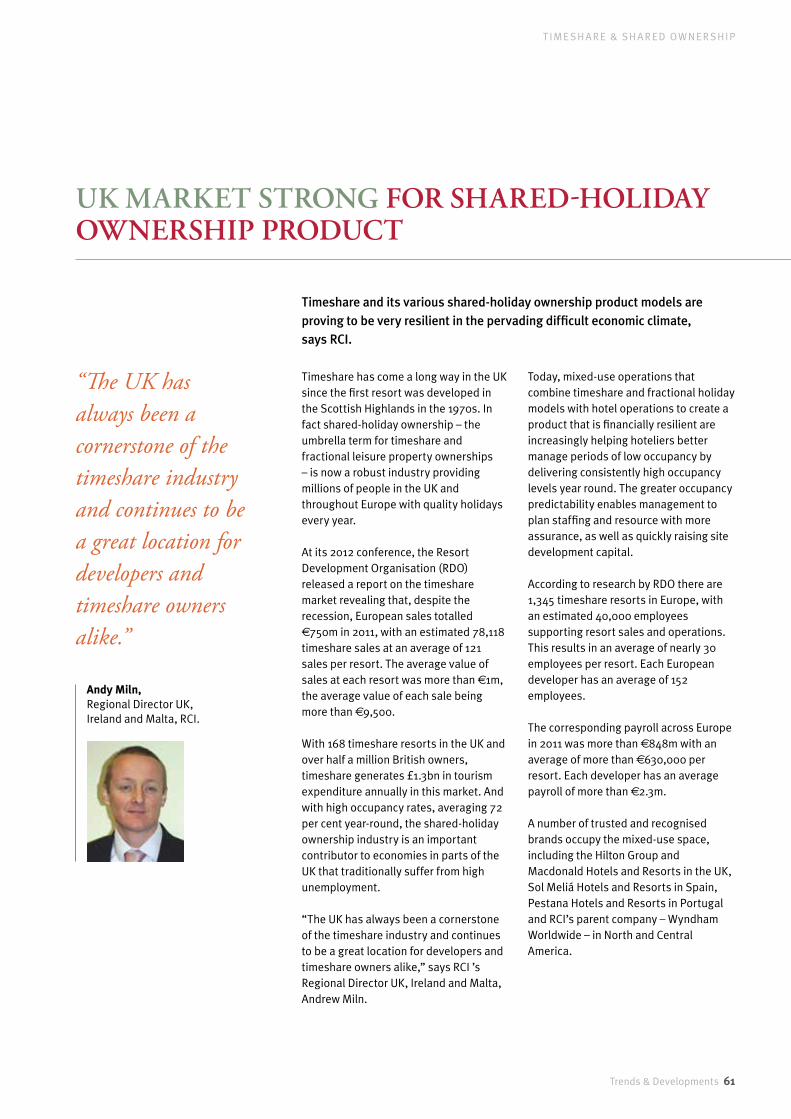
Trends & Developments 61
T I M E SH A RE & SH A RE D OW N E R SH I P
Andy Miln, Regional Director UK, Ireland and Malta, RCI.
UK mARKET sTROnG FOR sHAREd-HOLidAY OwnERsHiP PROdUcT
Timeshare and its various shared-holiday ownership product models are proving to be very resilient in the pervading difficult economic climate, says RCI.
Timeshare has come a long way in the UK since the first resort was developed in the Scottish Highlands in the 1970s. In fact shared-holiday ownership – the umbrella term for timeshare and fractional leisure property ownerships – is now a robust industry providing millions of people in the UK and throughout Europe with quality holidays every year.
At its 2012 conference, the Resort Development Organisation (RDO) released a report on the timeshare market revealing that, despite the recession, European sales totalled €750m in 2011, with an estimated 78,118 timeshare sales at an average of 121 sales per resort. The average value of sales at each resort was more than €1m, the average value of each sale being more than €9,500.
With 168 timeshare resorts in the UK and over half a million British owners, timeshare generates £1.3bn in tourism expenditure annually in this market. And with high occupancy rates, averaging 72 per cent year-round, the shared-holiday ownership industry is an important contributor to economies in parts of the UK that traditionally suffer from high unemployment.
“The UK has always been a cornerstone of the timeshare industry and continues to be a great location for developers and timeshare owners alike,” says RCI ’s Regional Director UK, Ireland and Malta, Andrew Miln.
Today, mixed-use operations that combine timeshare and fractional holiday models with hotel operations to create a product that is financially resilient are increasingly helping hoteliers better manage periods of low occupancy by delivering consistently high occupancy levels year round. The greater occupancy predictability enables management to plan staffing and resource with more assurance, as well as quickly raising site development capital.
According to research by RDO there are 1,345 timeshare resorts in Europe, with an estimated 40,000 employees supporting resort sales and operations. This results in an average of nearly 30 employees per resort. Each European developer has an average of 152 employees.
The corresponding payroll across Europe in 2011 was more than €848m with an average of more than €630,000 per resort. Each developer has an average payroll of more than €2.3m.
A number of trusted and recognised brands occupy the mixed-use space, including the Hilton Group and Macdonald Hotels and Resorts in the UK, Sol Meliá Hotels and Resorts in Spain, Pestana Hotels and Resorts in Portugal and RCI’s parent company – Wyndham Worldwide – in North and Central America.
“The UK has always been a cornerstone of the timeshare industry and continues to be a great location for developers and timeshare owners alike.”

62 Trends & Developments
T I M E SH A RE & SH A RE D OW N E R SH I P
These developments, which are marketed to high net worth individuals, frequently include services such as 24-hour concierge service, airport lounge access and a personalised travel service.
“There has also been a rise in the development of fractional properties for those whose pockets are not so deep and this is proving to be a successful concept for RDO resort developer members,” he says.
“It is no surprise that today’s buyers, in the midst of a deep recession, have less of an appetite for the long-term
ownership that appealed to their parents’ generation. So the industry is responding to this need by developing short-term ownerships, typically of five to ten years.
“Buyers then have access to luxurious accommodation around the world that they could only have dreamt of, and may go on to buy a longer-term timeshare or even fractional ownership.”
Andy Miln agrees and says that despite today’s economic challenges and difficult trading conditions, the current UK landscape is one of excitement and opportunity driven through new resort
openings and expansion programmes, alongside property conversions and acquisitions, with continued investment from major hospitality brands within the industry.
“Coupled with new product innovation to meet the ever-changing needs of both today’s owners and tomorrow’s purchasers, the outlook for the UK industry is extremely positive.
“All this within a highly popular region demonstrating a successful supply and demand model resulting in the highest occupancy rates in Europe.”
FRAcTiOnAL FOcUs
Five most popular models of shared holiday ownership
RDO Chief Executive, Paul Gardiner-Bougaard says that as the needs and aspirations of buyers have evolved over the years, so too has the industry. Shared-holiday ownership now includes high-end concepts such as fractional ownership, private residence clubs, condo-hotels and destination clubs.
Holiday Ownership Timeshare Fractional Private Residence Club Destination Clubs Condo Hotel
Interval size
One week to multiple weeks can be purchased
1/20 to 1/4 interest 1/20 interest or greater 10 to 60 days usage Whole
ownership
Description Hotel rooms or apartments
Mid to Upscale apartments or villas
Exclusive luxury apartments or villas
Membership offering access to global portfolio of luxury residences
Hotel rooms/suites
Consumer Benefit
Holiday solution allowing client to return to home resort or travel worldwide via exchange
Benefits of second home ownership at a fraction of the cost without maintenance responsibilities
Benefits of second home ownership at a fraction of the cost without maintenance responsibilities
Benefits of owning portfolio of signature properties around the world without complexity of whole ownership
Personal use as second home plus rental and exchange options
Ownership structure
Deeded equity-based, or right to use
Deeded equity-based, or right to use
Deeded equity-based, or right to use Right to use membership Deeded or right
to use
Service Levels
Standard resort level service, mid-week clean and à la carte services
Standard resort level service, mid-week clean and à la carte services
Five-star service sometimes with dedicated staff. Full amenities
Ultra-luxury services often with butler, concierge, personal chef
Varies by property
Annual maintenance
Varies – one-bed average: £200-£350
1.5-2 per cent of purchase price
1.5-2 per cent of purchase price £190-£650/a day Varies
“...today’s buyers, in the midst of a deep recession, have less of an appetite for the long-term ownership...”
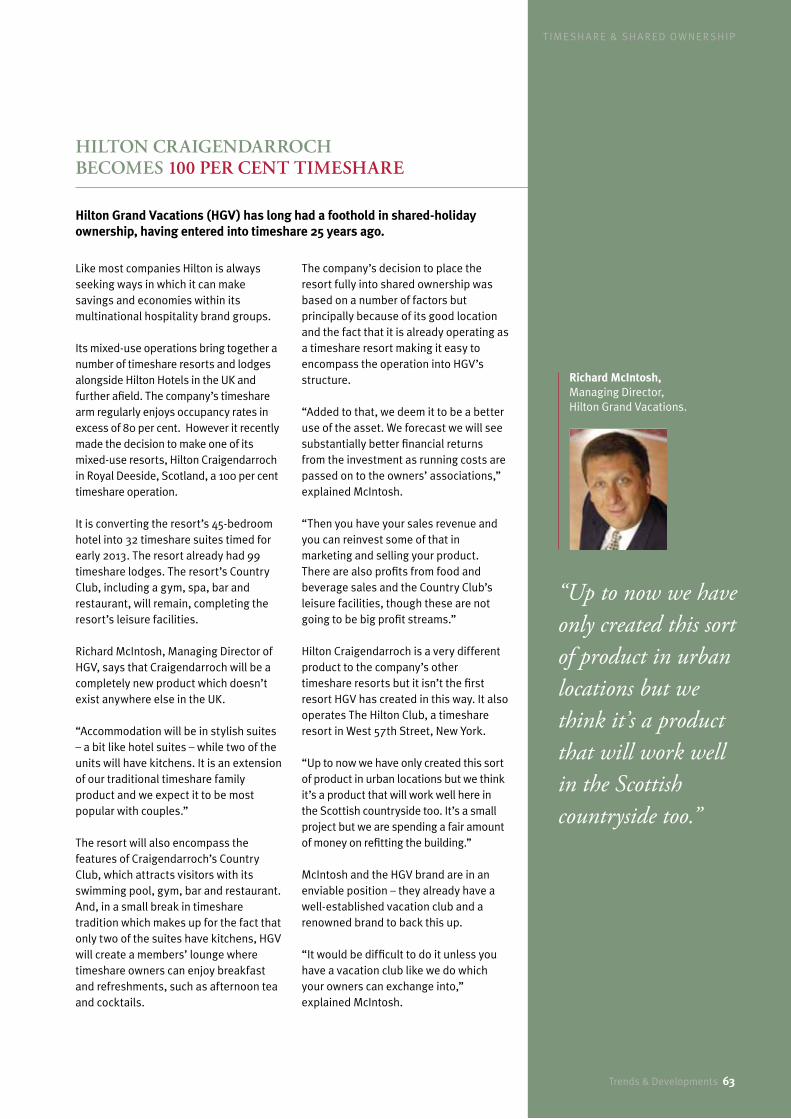
T I M E SH A RE & SH A RE D OW N E R SH I P
Hilton Grand Vacations (HGV) has long had a foothold in shared-holiday ownership, having entered into timeshare 25 years ago.
Like most companies Hilton is always seeking ways in which it can make savings and economies within its multinational hospitality brand groups.
Its mixed-use operations bring together a number of timeshare resorts and lodges alongside Hilton Hotels in the UK and further afield. The company’s timeshare arm regularly enjoys occupancy rates in excess of 80 per cent. However it recently made the decision to make one of its mixed-use resorts, Hilton Craigendarroch in Royal Deeside, Scotland, a 100 per cent timeshare operation.
It is converting the resort’s 45-bedroom hotel into 32 timeshare suites timed for early 2013. The resort already had 99 timeshare lodges. The resort’s Country Club, including a gym, spa, bar and restaurant, will remain, completing the resort’s leisure facilities.
Richard McIntosh, Managing Director of HGV, says that Craigendarroch will be a completely new product which doesn’t exist anywhere else in the UK.
“Accommodation will be in stylish suites – a bit like hotel suites – while two of the units will have kitchens. It is an extension of our traditional timeshare family product and we expect it to be most popular with couples.”
The resort will also encompass the features of Craigendarroch’s Country Club, which attracts visitors with its swimming pool, gym, bar and restaurant. And, in a small break in timeshare tradition which makes up for the fact that only two of the suites have kitchens, HGV will create a members’ lounge where timeshare owners can enjoy breakfast and refreshments, such as afternoon tea and cocktails.
The company’s decision to place the resort fully into shared ownership was based on a number of factors but principally because of its good location and the fact that it is already operating as a timeshare resort making it easy to encompass the operation into HGV’s structure.
“Added to that, we deem it to be a better use of the asset. We forecast we will see substantially better financial returns from the investment as running costs are passed on to the owners’ associations,” explained McIntosh.
“Then you have your sales revenue and you can reinvest some of that in marketing and selling your product. There are also profits from food and beverage sales and the Country Club’s leisure facilities, though these are not going to be big profit streams.”
Hilton Craigendarroch is a very different product to the company’s other timeshare resorts but it isn’t the first resort HGV has created in this way. It also operates The Hilton Club, a timeshare resort in West 57th Street, New York.
“Up to now we have only created this sort of product in urban locations but we think it’s a product that will work well here in the Scottish countryside too. It’s a small project but we are spending a fair amount of money on refitting the building.”
McIntosh and the HGV brand are in an enviable position – they already have a well-established vacation club and a renowned brand to back this up.
“It would be difficult to do it unless you have a vacation club like we do which your owners can exchange into,” explained McIntosh.
HiLTOn cRAiGEndARROcH BEcOmEs 100 PER cEnT TimEsHARE
Richard McIntosh, Managing Director, Hilton Grand Vacations.
“Up to now we have only created this sort of product in urban locations but we think it’s a product that will work well in the Scottish countryside too.”
Trends & Developments 63
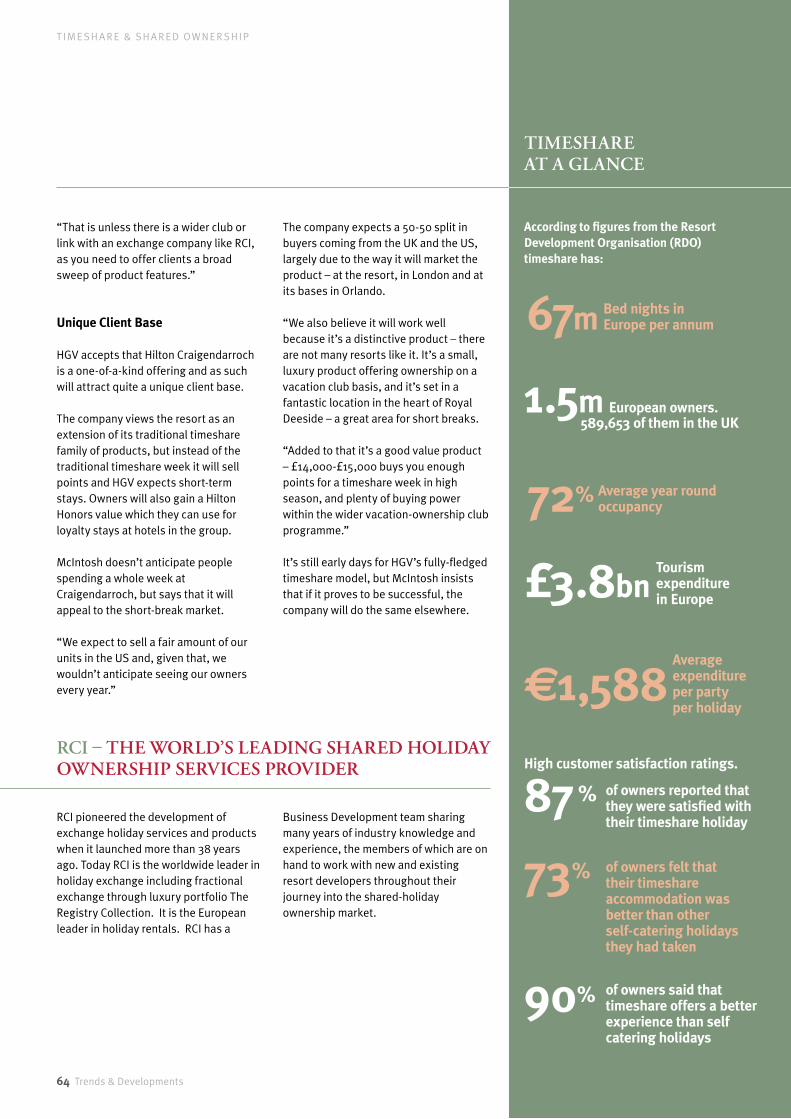
64 Trends & Developments
T I M E SH A RE & SH A RE D OW N E R SH I P
“That is unless there is a wider club or link with an exchange company like RCI, as you need to offer clients a broad sweep of product features.”
Unique Client Base
HGV accepts that Hilton Craigendarroch is a one-of-a-kind offering and as such will attract quite a unique client base.
The company views the resort as an extension of its traditional timeshare family of products, but instead of the traditional timeshare week it will sell points and HGV expects short-term stays. Owners will also gain a Hilton Honors value which they can use for loyalty stays at hotels in the group.
McIntosh doesn’t anticipate people spending a whole week at Craigendarroch, but says that it will appeal to the short-break market.
“We expect to sell a fair amount of our units in the US and, given that, we wouldn’t anticipate seeing our owners every year.”
The company expects a 50-50 split in buyers coming from the UK and the US, largely due to the way it will market the product – at the resort, in London and at its bases in Orlando.
“We also believe it will work well because it’s a distinctive product – there are not many resorts like it. It’s a small, luxury product offering ownership on a vacation club basis, and it’s set in a fantastic location in the heart of Royal Deeside – a great area for short breaks.
“Added to that it’s a good value product – £14,000-£15,000 buys you enough points for a timeshare week in high season, and plenty of buying power within the wider vacation-ownership club programme.”
It’s still early days for HGV’s fully-fledged timeshare model, but McIntosh insists that if it proves to be successful, the company will do the same elsewhere.
RCI pioneered the development of exchange holiday services and products when it launched more than 38 years ago. Today RCI is the worldwide leader in holiday exchange including fractional exchange through luxury portfolio The Registry Collection. It is the European leader in holiday rentals. RCI has a
Business Development team sharing many years of industry knowledge and experience, the members of which are on hand to work with new and existing resort developers throughout their journey into the shared-holiday ownership market.
According to figures from the Resort Development Organisation (RDO) timeshare has:
Rci – THE wORLd’s LEAdinG sHAREd HOLidAY OwnERsHiP sERvicEs PROvidER
TimEsHARE AT A GLAncE
Bed nights in Europe per annum
Average expenditure per party per holiday
European owners.589,653 of them in the UK
67m
£3.8bn
€1,588
1.5m
72 %
87 %
90 %
73 %
Average year round occupancy
of owners reported that they were satisfied with their timeshare holiday
of owners said that timeshare offers a better experience than self‐catering holidays
of owners felt that their timeshare accommodation was better than other self-catering holidays they had taken
High customer satisfaction ratings.
Tourism expenditure in Europe

Trends & Developments 65
T I M E SH A RE & SH A RE D OW N E R SH I P
data taBles

66 Trends & Developments
DATA TA B L E S
1990 2003 2004 2005 2006 2007 2008 2009 2010 2011
Total 451,000 692,000 763,000 798,000 850,000 904,000 917,000 882,000 940,000 983,000
Source: World Tourism OrganisationP Provisional
Table 1: International tourist arrivals (‘000s), 1990, 2003-2011p
1990 2003 2004 2005 2006 2007 2008 2009 2010 2011
Receipts (US$m) 264,000 533,000 634,000 679,000 744,000 8587,000 930,000 851,000 919,000 1,030,000
Source: World Tourism OrganisationP Provisional
Table 2: International tourism payments (US$bn) 1990, 2003-2011p
Table 4: International tourism by receipts: leading ten countries, 2009-2011p
Rank
2009 2010 2011p
Country Receipts US$bn Country Receipts US$bn Country Receipts US$bn
1 USA 94,200 USA 103,500 USA 116.300
2 Spain 53,200 Spain 52,500 Spain 59,900
3 France 48,700 France 46,300 France 53.800
4 Italy 40,200 Italy 45,800 China 48,500
5 China* 39,700 China 38.800 Italy 43,000
6 Germany 34,700 Germany 34,600 Germany 38,800
7 UK 30,100 UK 30,100 UK 35,900
8 Australia 25,600 Australia 25,400 Australia 31,400
9 Turkey 21,300 Turkey 16,600 Hong Kong (China) –
10 Austria 19,400 Austria 21,300 Turkey 27,700
*excluding Hong Kong and Macao p Provisional Source: World Tourism Organisation
Table 3: International tourism by arrival: leading ten countries, 2009-2011p
Rank
2009 2010 2011p
Country Arrivals Country Arrivals Country Arrivals
1 France 74,200 France 77,100 France 79,500
2 USA 54,900 USA 59,800 USA 62,300
3 Spain 52,200 China* 55,700 China* 57,600
4 China 50,900 Spain 52,500 Spain 56,700
5 Italy 43,200 Italy 43,600 Italy 46,100
6 UK 28,000 UK 28,300 Turkey 29,300
7 Turkey 25,500 Turkey 27,000 UK 29,200
8 Germany 24,200 Germany 26,900 Germany 28,400
9 Malaysia 23,646 Malaysia 24,600 Malaysia 24,700
10 Mexico 22,346 Mexico 23,300 Mexico 23,400
*excluding Hong Kong and Macao p Provisional Source: World Tourism Organisation
touRism
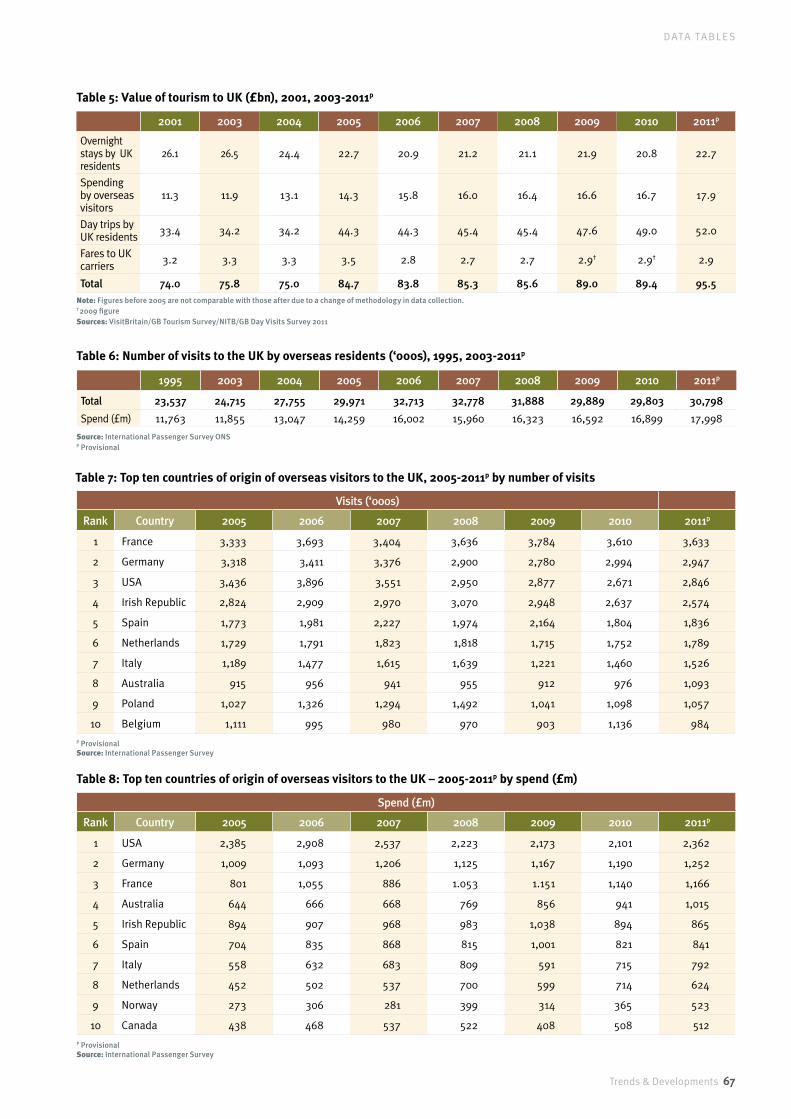
Trends & Developments 67
DATA TA B L E S
2001 2003 2004 2005 2006 2007 2008 2009 2010 2011p
Overnight stays by UK residents
26.1 26.5 24.4 22.7 20.9 21.2 21.1 21.9 20.8 22.7
Spending by overseas visitors
11.3 11.9 13.1 14.3 15.8 16.0 16.4 16.6 16.7 17.9
Day trips by UK residents 33.4 34.2 34.2 44.3 44.3 45.4 45.4 47.6 49.0 52.0
Fares to UK carriers 3.2 3.3 3.3 3.5 2.8 2.7 2.7 2.9† 2.9† 2.9
Total 74.0 75.8 75.0 84.7 83.8 85.3 85.6 89.0 89.4 95.5Note: Figures before 2005 are not comparable with those after due to a change of methodology in data collection. † 2009 figure Sources: VisitBritain/GB Tourism Survey/NITB/GB Day Visits Survey 2011
Table 5: Value of tourism to UK (£bn), 2001, 2003-2011p
Table 6: Number of visits to the UK by overseas residents (‘000s), 1995, 2003-2011p
1995 2003 2004 2005 2006 2007 2008 2009 2010 2011p
Total 23,537 24,715 27,755 29,971 32,713 32,778 31,888 29,889 29,803 30,798
Spend (£m) 11,763 11,855 13,047 14,259 16,002 15,960 16,323 16,592 16,899 17,998
Source: International Passenger Survey ONSP Provisional
Table 7: Top ten countries of origin of overseas visitors to the UK, 2005-2011p by number of visits
Visits (‘000s)
Rank Country 2005 2006 2007 2008 2009 2010 2011p
1 France 3,333 3,693 3,404 3,636 3,784 3,610 3,633
2 Germany 3,318 3,411 3,376 2,900 2,780 2,994 2,947
3 USA 3,436 3,896 3,551 2,950 2,877 2,671 2,846
4 Irish Republic 2,824 2,909 2,970 3,070 2,948 2,637 2,574
5 Spain 1,773 1,981 2,227 1,974 2,164 1,804 1,836
6 Netherlands 1,729 1,791 1,823 1,818 1,715 1,752 1,789
7 Italy 1,189 1,477 1,615 1,639 1,221 1,460 1,526
8 Australia 915 956 941 955 912 976 1,093
9 Poland 1,027 1,326 1,294 1,492 1,041 1,098 1,057
10 Belgium 1,111 995 980 970 903 1,136 984
P ProvisionalSource: International Passenger Survey
Table 8: Top ten countries of origin of overseas visitors to the UK – 2005-2011p by spend (£m)
Spend (£m)
Rank Country 2005 2006 2007 2008 2009 2010 2011p
1 USA 2,385 2,908 2,537 2,223 2,173 2,101 2,362
2 Germany 1,009 1,093 1,206 1,125 1,167 1,190 1,252
3 France 801 1,055 886 1.053 1.151 1,140 1,166
4 Australia 644 666 668 769 856 941 1,015
5 Irish Republic 894 907 968 983 1,038 894 865
6 Spain 704 835 868 815 1,001 821 841
7 Italy 558 632 683 809 591 715 792
8 Netherlands 452 502 537 700 599 714 624
9 Norway 273 306 281 399 314 365 523
10 Canada 438 468 537 522 408 508 512
P ProvisionalSource: International Passenger Survey
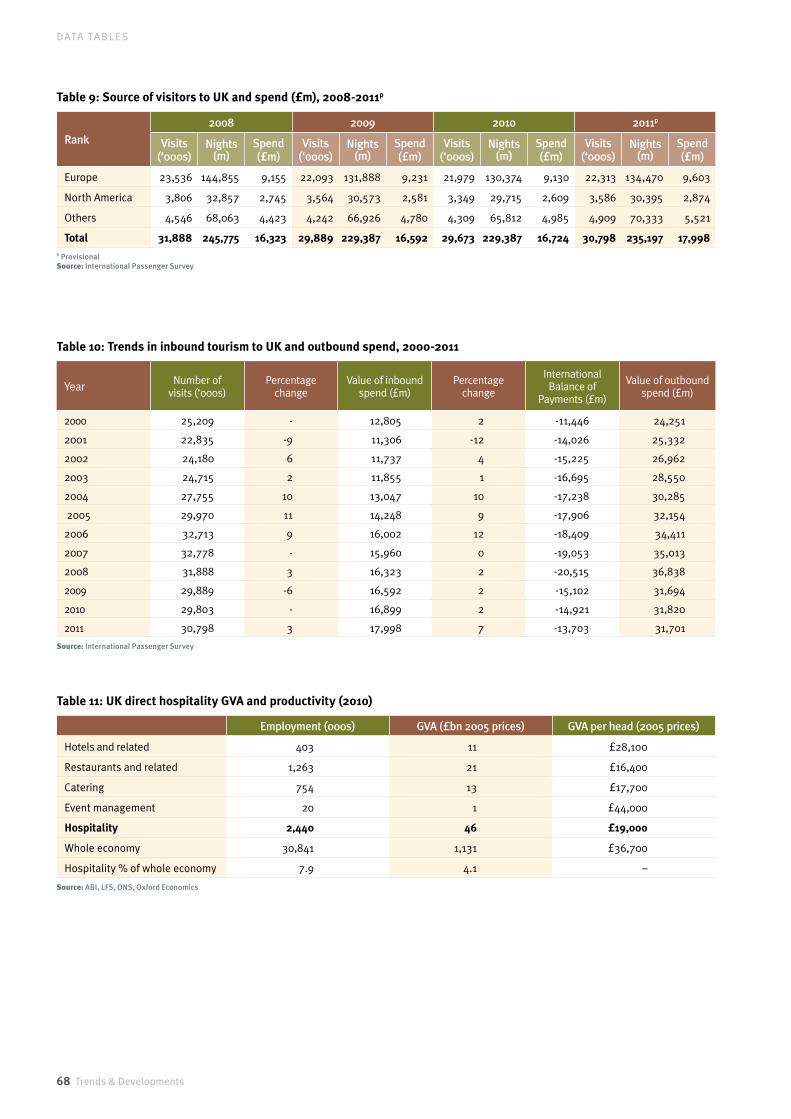
68 Trends & Developments
DATA TA B L E S
Year Number of visits (‘000s)
Percentage change
Value of inbound spend (£m)
Percentage change
International Balance of
Payments (£m)
Value of outbound spend (£m)
2000 25,209 - 12,805 2 -11,446 24,251
2001 22,835 -9 11,306 -12 -14,026 25,332
2002 24,180 6 11,737 4 -15,225 26,962
2003 24,715 2 11,855 1 -16,695 28,550
2004 27,755 10 13,047 10 -17,238 30,285
2005 29,970 11 14,248 9 -17,906 32,154
2006 32,713 9 16,002 12 -18,409 34,411
2007 32,778 - 15,960 0 -19,053 35,013
2008 31,888 3 16,323 2 -20,515 36,838
2009 29,889 -6 16,592 2 -15,102 31,694
2010 29,803 - 16,899 2 -14,921 31,820
2011 30,798 3 17,998 7 -13,703 31,701
Source: International Passenger Survey
Table 10: Trends in inbound tourism to UK and outbound spend, 2000-2011
Table 9: Source of visitors to UK and spend (£m), 2008-2011p
Rank2008 2009 2010 2011p
Visits(‘000s)
Nights (m)
Spend (£m)
Visits(‘000s)
Nights (m)
Spend (£m)
Visits(‘000s)
Nights (m)
Spend (£m)
Visits(‘000s)
Nights (m)
Spend (£m)
Europe 23,536 144,855 9,155 22,093 131,888 9,231 21,979 130,374 9,130 22,313 134,470 9,603
North America 3,806 32,857 2,745 3,564 30,573 2,581 3,349 29,715 2,609 3,586 30,395 2,874
Others 4,546 68,063 4,423 4,242 66,926 4,780 4,309 65,812 4,985 4,909 70,333 5,521
Total 31,888 245,775 16,323 29,889 229,387 16,592 29,673 229,387 16,724 30,798 235,197 17,998P ProvisionalSource: International Passenger Survey
Table 11: UK direct hospitality GVA and productivity (2010)
Employment (000s) GVA (£bn 2005 prices) GVA per head (2005 prices)
Hotels and related 403 11 £28,100
Restaurants and related 1,263 21 £16,400
Catering 754 13 £17,700
Event management 20 1 £44,000
Hospitality 2,440 46 £19,000
Whole economy 30,841 1,131 £36,700
Hospitality % of whole economy 7.9 4.1 –
Source: ABI, LFS, ONS, Oxford Economics

Trends & Developments 69
DATA TA B L E S
Table 12: Value of UK tourism and leisure industry (£bn), 2006-2011
2006 2007 2008 2009 2010 2011 2011
Total Total Total Total Total TotalTourism – inbound tourists
Domestic holidays
– UK residents
Leisure – UK
residents
Overnight accommodation 11.0 11.7 11.5 12.7 12.5 13.7 2.9 10.8 –
Eating out-of-home 20.7 21.6 22.5 23.1 23.4 23.6 1.3 4.6 17.6
Drinking out-of-home 35.6 36.3 36.1 33.9 33.6 33.3 0.4 5.9 26.9
Air travel within UK and from start points outside UK to destinations within UK 2.8 2.9 2.7 2.9 2.9 3.1 1.6 1.5 –
Rail, car, coach, taxi, cab travel for leisure and tourism 4.8 4.8 4.7 4.7 4.7 5.0 1.5 2.2 1.3
Cinemas, theatres, museums, zoos, historic properties, theme parks, gardens 3.2 3.2 3.7 3.8 3.9 3.5 1.0 0.0 2.6
Social clubs, leisure classes, bingo, dances, discos, social events 6.0 6.6 5.6 5.9 5.6 6.5 – – 6.5
Sports – spectating 1.0 0.9 1.0 0.9 1.0 1.0 0.3 – 0.7
Sports – participating 2.3 2.5 2.0 1.6 1.3 1.8 – – 1.8
Shopping on holiday, shopping by overseas visitors 3.6 3.7 3.9 4.2 4.2 4.5 4.5 –
Gambling 4.7 4.5 3.8 4.3 5.0 3.7 0.0 – 3.7
Business-related expenditure 11.3 11.8 12.2 12.4 13.0 13.8 5.0 – 8.8
TOTAL 106.9 110.6 109.7 110.5 111.1 113.5 18.5 25.1 70.0
Source: Horizons Note: Domestic holidays are leisure activities that involve at least one night spent away from home (excluding business activities). This is the same as holiday tourism as defined by UKTS.Leisure activities do not involve a night spent away from home. Drinking out-of-home includes alcoholic and soft drink consumption in pubs and restaurants, whether or not food is consumed at the same time.Gambling by UK residents also includes gambling by overseas visitors.Air travel only includes payment to UK carriers.– means excluded from scope but effectively is zero in most cases.
Table 13: Distribution of domestic visitors by region and nation, 2010-2011p
DestinationTrips (m) Nights (m) Expenditure (£m)
2010 2011p 2010 2011p 2010 2011p
ENGLAND
London 11.58 11.09 24.85 27.06 2,515 2,398
West Midlands 7.88 8.21 20.90 19.44 1,078 1,111
East of England 8.88 10.32 27.94 31.17 1,306 1,475
East Midlands 7.69 9.0 21.57 24.78 1,029 1,317
North West 12.52 13.99 34.47 37.07 2,260 2,549
North East 3.59 4.30 10.86 12.73 627 717
South East 16.37 19.94 46.07 47.40 2,232 2,57
South West 19.22 20.22 73.79 75.01 3,606 4,029
Yorkshire & Humberside 10.04 11.51 26.25 30.20 1,478 1,663
ENGLAND 96.38 104.28 288.11 307.33 16,210 17,914
SCOTLAND 12.37 13.36 44.56 45.58 2,628 3,018
WALES 8.67 9.70 32.77 34.94 1,438 1,734
NORTHERN IRELAND - 1.87 - 4.31 - 145
TOTAL 116.88 129.21 365.54 391.6 20,288 22,811
Source: VisitEngland/UKTS. Note: Sums may not add up to totals due to rounding up. All expenditure at historic prices.
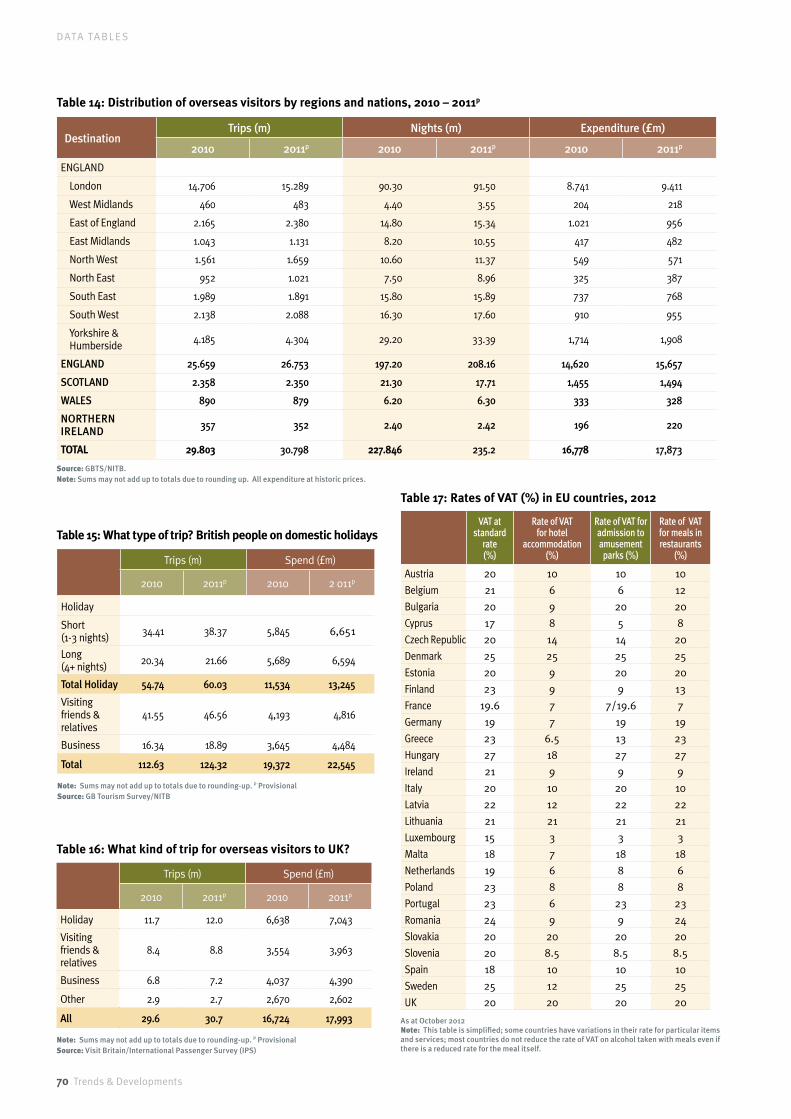
70 Trends & Developments
DATA TA B L E S
Table 14: Distribution of overseas visitors by regions and nations, 2010 – 2011p
DestinationTrips (m) Nights (m) Expenditure (£m)
2010 2011p 2010 2011p 2010 2011p
ENGLAND
London 14.706 15.289 90.30 91.50 8.741 9.411
West Midlands 460 483 4.40 3.55 204 218
East of England 2.165 2.380 14.80 15.34 1.021 956
East Midlands 1.043 1.131 8.20 10.55 417 482
North West 1.561 1.659 10.60 11.37 549 571
North East 952 1.021 7.50 8.96 325 387
South East 1.989 1.891 15.80 15.89 737 768
South West 2.138 2.088 16.30 17.60 910 955
Yorkshire & Humberside 4.185 4.304 29.20 33.39 1,714 1,908
ENGLAND 25.659 26.753 197.20 208.16 14,620 15,657
SCOTLAND 2.358 2.350 21.30 17.71 1,455 1,494
WALES 890 879 6.20 6.30 333 328
NORTHERN IRELAND 357 352 2.40 2.42 196 220
TOTAL 29.803 30.798 227.846 235.2 16,778 17,873
Source: GBTS/NITB. Note: Sums may not add up to totals due to rounding up. All expenditure at historic prices.
Trips (m) Spend (£m)
2010 2011p 2010 2 011p
Holiday
Short (1-3 nights) 34.41 38.37 5,845 6,651
Long (4+ nights) 20.34 21.66 5,689 6,594
Total Holiday 54.74 60.03 11,534 13,245
Visiting friends & relatives
41.55 46.56 4,193 4,816
Business 16.34 18.89 3,645 4,484
Total 112.63 124.32 19,372 22,545
Note: Sums may not add up to totals due to rounding-up. P ProvisionalSource: GB Tourism Survey/NITB
Table 15: What type of trip? British people on domestic holidays
Trips (m) Spend (£m)
2010 2011p 2010 2011p
Holiday 11.7 12.0 6,638 7,043
Visiting friends & relatives
8.4 8.8 3,554 3,963
Business 6.8 7.2 4,037 4,390
Other 2.9 2.7 2,670 2,602
All 29.6 30.7 16,724 17,993
Note: Sums may not add up to totals due to rounding-up. P ProvisionalSource: Visit Britain/International Passenger Survey (IPS)
Table 16: What kind of trip for overseas visitors to UK?
Table 17: Rates of VAT (%) in EU countries, 2012
VAT at standard
rate (%)
Rate of VAT for hotel
accommodation(%)
Rate of VAT for admission to amusement parks (%)
Rate of VAT for meals in restaurants
(%)
Austria 20 10 10 10
Belgium 21 6 6 12
Bulgaria 20 9 20 20
Cyprus 17 8 5 8
Czech Republic 20 14 14 20
Denmark 25 25 25 25
Estonia 20 9 20 20
Finland 23 9 9 13
France 19.6 7 7/19.6 7
Germany 19 7 19 19
Greece 23 6.5 13 23
Hungary 27 18 27 27
Ireland 21 9 9 9
Italy 20 10 20 10
Latvia 22 12 22 22
Lithuania 21 21 21 21
Luxembourg 15 3 3 3
Malta 18 7 18 18
Netherlands 19 6 8 6
Poland 23 8 8 8
Portugal 23 6 23 23
Romania 24 9 9 24
Slovakia 20 20 20 20
Slovenia 20 8.5 8.5 8.5
Spain 18 10 10 10
Sweden 25 12 25 25
UK 20 20 20 20
As at October 2012Note: This table is simplified; some countries have variations in their rate for particular items and services; most countries do not reduce the rate of VAT on alcohol taken with meals even if there is a reduced rate for the meal itself.
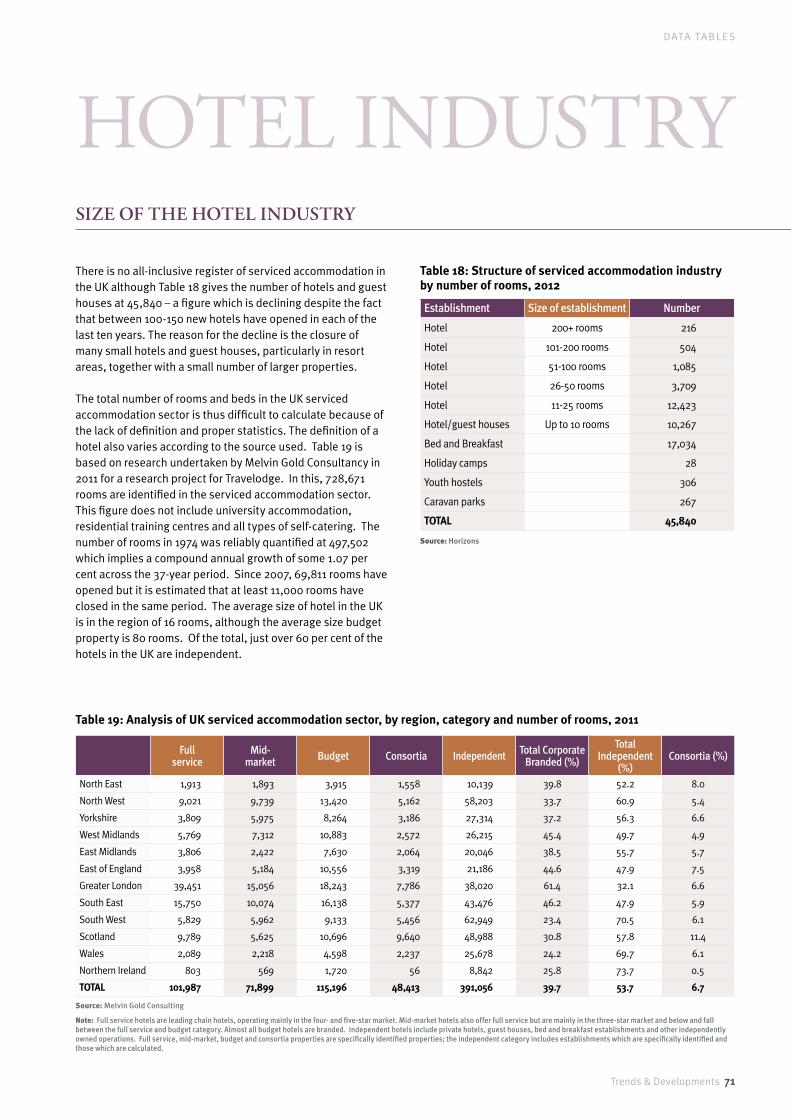
Trends & Developments 71
DATA TA B L E S
hotel industRysiZE OF THE HOTEL indUsTRY
There is no all-inclusive register of serviced accommodation in the UK although Table 18 gives the number of hotels and guest houses at 45,840 – a figure which is declining despite the fact that between 100-150 new hotels have opened in each of the last ten years. The reason for the decline is the closure of many small hotels and guest houses, particularly in resort areas, together with a small number of larger properties.
The total number of rooms and beds in the UK serviced accommodation sector is thus difficult to calculate because of the lack of definition and proper statistics. The definition of a hotel also varies according to the source used. Table 19 is based on research undertaken by Melvin Gold Consultancy in 2011 for a research project for Travelodge. In this, 728,671 rooms are identified in the serviced accommodation sector. This figure does not include university accommodation, residential training centres and all types of self-catering. The number of rooms in 1974 was reliably quantified at 497,502 which implies a compound annual growth of some 1.07 per cent across the 37-year period. Since 2007, 69,811 rooms have opened but it is estimated that at least 11,000 rooms have closed in the same period. The average size of hotel in the UK is in the region of 16 rooms, although the average size budget property is 80 rooms. Of the total, just over 60 per cent of the hotels in the UK are independent.
Table 18: Structure of serviced accommodation industry by number of rooms, 2012
Establishment Size of establishment Number
Hotel 200+ rooms 216
Hotel 101-200 rooms 504
Hotel 51-100 rooms 1,085
Hotel 26-50 rooms 3,709
Hotel 11-25 rooms 12,423
Hotel/guest houses Up to 10 rooms 10,267
Bed and Breakfast 17,034
Holiday camps 28
Youth hostels 306
Caravan parks 267
TOTAL 45,840
Source: Horizons
Full service
Mid-market Budget Consortia Independent Total Corporate
Branded (%)
TotalIndependent
(%)Consortia (%)
North East 1,913 1,893 3,915 1,558 10,139 39.8 52.2 8.0
North West 9,021 9,739 13,420 5,162 58,203 33.7 60.9 5.4
Yorkshire 3,809 5,975 8,264 3,186 27,314 37.2 56.3 6.6
West Midlands 5,769 7,312 10,883 2,572 26,215 45.4 49.7 4.9
East Midlands 3,806 2,422 7,630 2,064 20,046 38.5 55.7 5.7
East of England 3,958 5,184 10,556 3,319 21,186 44.6 47.9 7.5
Greater London 39,451 15,056 18,243 7,786 38,020 61.4 32.1 6.6
South East 15,750 10,074 16,138 5,377 43,476 46.2 47.9 5.9
South West 5,829 5,962 9,133 5,456 62,949 23.4 70.5 6.1
Scotland 9,789 5,625 10,696 9,640 48,988 30.8 57.8 11.4
Wales 2,089 2,218 4,598 2,237 25,678 24.2 69.7 6.1
Northern Ireland 803 569 1,720 56 8,842 25.8 73.7 0.5
TOTAL 101,987 71,899 115,196 48,413 391,056 39.7 53.7 6.7
Source: Melvin Gold Consulting
Note: Full service hotels are leading chain hotels, operating mainly in the four- and five-star market. Mid-market hotels also offer full service but are mainly in the three-star market and below and fall between the full service and budget category. Almost all budget hotels are branded. Independent hotels include private hotels, guest houses, bed and breakfast establishments and other independently owned operations. Full service, mid-market, budget and consortia properties are specifically identified properties; the independent category includes establishments which are specifically identified and those which are calculated.
Table 19: Analysis of UK serviced accommodation sector, by region, category and number of rooms, 2011
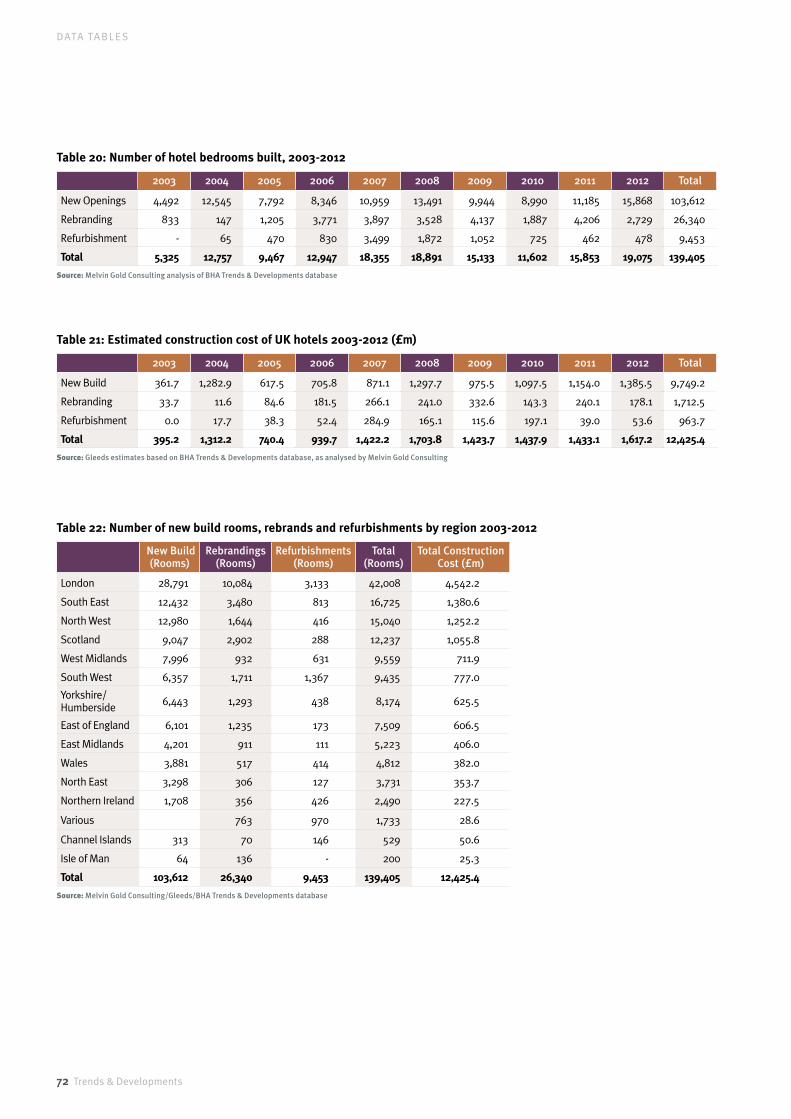
72 Trends & Developments
DATA TA B L E S
Table 20: Number of hotel bedrooms built, 2003-2012
2003 2004 2005 2006 2007 2008 2009 2010 2011 2012 Total
New Openings 4,492 12,545 7,792 8,346 10,959 13,491 9,944 8,990 11,185 15,868 103,612
Rebranding 833 147 1,205 3,771 3,897 3,528 4,137 1,887 4,206 2,729 26,340
Refurbishment - 65 470 830 3,499 1,872 1,052 725 462 478 9,453
Total 5,325 12,757 9,467 12,947 18,355 18,891 15,133 11,602 15,853 19,075 139,405
Source: Melvin Gold Consulting analysis of BHA Trends & Developments database
Table 21: Estimated construction cost of UK hotels 2003-2012 (£m)
2003 2004 2005 2006 2007 2008 2009 2010 2011 2012 Total
New Build 361.7 1,282.9 617.5 705.8 871.1 1,297.7 975.5 1,097.5 1,154.0 1,385.5 9,749.2
Rebranding 33.7 11.6 84.6 181.5 266.1 241.0 332.6 143.3 240.1 178.1 1,712.5
Refurbishment 0.0 17.7 38.3 52.4 284.9 165.1 115.6 197.1 39.0 53.6 963.7
Total 395.2 1,312.2 740.4 939.7 1,422.2 1,703.8 1,423.7 1,437.9 1,433.1 1,617.2 12,425.4
Source: Gleeds estimates based on BHA Trends & Developments database, as analysed by Melvin Gold Consulting
Table 22: Number of new build rooms, rebrands and refurbishments by region 2003-2012
New Build (Rooms)
Rebrandings (Rooms)
Refurbishments (Rooms)
Total (Rooms)
Total Construction Cost (£m)
London 28,791 10,084 3,133 42,008 4,542.2
South East 12,432 3,480 813 16,725 1,380.6
North West 12,980 1,644 416 15,040 1,252.2
Scotland 9,047 2,902 288 12,237 1,055.8
West Midlands 7,996 932 631 9,559 711.9
South West 6,357 1,711 1,367 9,435 777.0
Yorkshire/Humberside 6,443 1,293 438 8,174 625.5
East of England 6,101 1,235 173 7,509 606.5
East Midlands 4,201 911 111 5,223 406.0
Wales 3,881 517 414 4,812 382.0
North East 3,298 306 127 3,731 353.7
Northern Ireland 1,708 356 426 2,490 227.5
Various 763 970 1,733 28.6
Channel Islands 313 70 146 529 50.6
Isle of Man 64 136 - 200 25.3
Total 103,612 26,340 9,453 139,405 12,425.4
Source: Melvin Gold Consulting/Gleeds/BHA Trends & Developments database

Trends & Developments 73
DATA TA B L E S
Table 23: Number of AA inspected hotels, 2012 Table 24: Number of AA inspected guest houses, 2012
Table 25: Whitbread plc, 2009-2012
Table 26: InterContinental Hotels Group (IHG), 2008-2011
nUmBER OF GRAdEd HOTELs BY AA
UK’s TEn LARGEsT HOTEL GROUPs
One star
Two star
Three star
Four star
Five star Associate† Budget
hotels*
UK 6 250 1,405 850 99 30 831
Source: Automobile Association* Budget hotels are primarily branded properties; they are listed but not graded.† Associate hotels are rated by VisitBritain, VisitEngland, VisitScotland or VisitWales and marketed by the AA.
One star
Two star
Three star
Four star
Five star Associate†
UK 7 60 756 1,670 370 150
Source: Automobile Association* Budget hotels are primarily branded properties; they are listed but not graded.† Associate hotels are rated by VisitBritain, VisitEngland, VisitScotland or VisitWales and marketed by the AA.
WHITBREADWhitbread is the UK’s largest hotel and restaurant group, operating in the budget hotel, branded restaurant and coffee shop sectors. It has more than 630 Premier Inns with over 50,000 rooms in the UK, Ireland, Abu Dhabi, Dubai and India. Its restaurant brands, which include Beefeater Grill, Brewers Fayre, Table Table and Taybarns total 387 with six more due to open in 2012/13. The company plans to open 4,200 hotel rooms during 2012/13 and remains on track to achieve its milestone of 65,000 rooms by 2015/16. Costa is the UK’s leading coffee shop brand with over 2,200 stores in 25 countries worldwide with a growth target of 3,500 stores by 2015/16. In the UK it has over 1,420 stores and has introduced five Drive Thru locations and now has over 1,190 Costa Express machines.
INTERCONTINENTAL HOTELS GROUPInterContinental Hotels Group is a global hotel company operating, mainly through franchisees, in nearly 100 countries with more guest rooms than any other hotel company totalling 666,000 in over 4,500 hotels. It operates nine hotel brands of which six are in the UK – InterContinental, Crowne Plaza, Hotel Indigo, Holiday Inn, Holiday Inn Express and Staybridge Suites. In 2011/12 it increased the number of its hotels in the UK to 282 with 27 hotels in its UK development pipeline including an InterContinental in Westminster, six Hotel Indigos and eleven Holiday Inn Express. Holiday Inn was the official hotel provider for the London 2012 Olympics and Paralympic Games. Worldwide the company has more than 1,000 hotels in its pipeline and expects to recruit some 90,000 people over the next few years.
TRAVELODGETravelodge , one of the UK’s leading budget hotel companies, announced in 2012 that it had agreed a financial restructuring which would secure the long-term future of the business. Its key investors are now GoldenTree Asset Management, Avenue Capital Group and Goldman Sachs. The company which at present operates 505 hotels is to dispose of 49 which are no longer viable and has initiated a Company Voluntary Arrangement covering 109 properties. Starting in 2013, £55m will be invested in a major refurbishment programme covering 175 hotels.
ACCORAccor has more than 4,400 hotels and 530,000 rooms in 92 countries. It employs over 180,000 employees worldwide. It now has twelve brands of which nine operate in the UK including the first Pullman which opened in 2012, together with a second MGallery. It has also introduced its new ibis brands – ibis Styles and ibis budget. The company plans to increase its hotels to 300 and create 3,500 jobs by 2015. Accor United Kingdom inaugurated a training and career development centre in London in 2012.
1 March 2012
3 March2011
4 March2010
26 February2009
Turnover (£m) 1,778.0 1,599.6 1,435.0 1,334.6
Profit before tax (£m) 305.8 271.2 239.1 224.4
No of employees 40,000 40,000 34,000 33,000
31 December2011
31 December2010
31 December2009
31 December2008**
Turnover ($m) 1,768 1,628 1,538 1,897
Profit before tax ($m) 559 444 363 549
No of employees
7,956* (345,000)
7,858* (335,000)
7,556*(335,000)
8,334*(333,000)
*directly employed staff worldwide**reporting currency changed room sterling to US dollars with 2008 half year

74 Trends & Developments
DATA TA B L E S
Table 27: Hotel groups with over 200 rooms (with location of head office or regional UK office), 2012
HILTON WORLDWIDEHilton Worldwide operates 3,900 hotels with 640,000 rooms in 91 countries. It has five brands operating in the UK: Waldorf Astoria, Hilton Hotels & Resorts, Doubletree by Hilton, Hampton by Hilton and Hilton Garden Inn. In 2012 it grew its UK portfolio by 11 hotels including its first dual-brand property at St George’s Park, Burton-upon-Trent, three Doubletrees and the conversion of The Caledonian, Edinburgh to a Waldorf Astoria. More openings are planned for 2013 and beyond.
BEST WESTERNBest Western UK has over 280 independently-owned hotels in the UK operating over 15,900 rooms. It is part of Best Western International which has over 4,000 hotels (310,000 rooms) in 100 countries. It is now growing its Best Western Plus and Best Western Premier brands in the UK.
CARLSON REZIDORCarlson Rezidor is a partnership of Carlson and The Rezidor Hotel Group formed in early 2012. It has a portfolio of 1,300 hotels in 81 countries employing 80,000 people. In the UK it operates 61 hotels under the Radisson Blu, Park Inn by Radisson, Park Plaza and Missoni brands. Carlson also operates TGI Friday’s in this country.
MARRIOTTMarriott is a global hotel company with 3,700 hotels in 73 countries employing 300,000 people with 14 hotel and extended stay suite brands as well as vacation ownership. In the UK it operates JW Marriott, Renaissance, Marriott, Courtyard, Grand Residences and Residence Inn. In 2012 the Marriott operated Bulgari London opened and the UK is one of the first countries selected for the company’s new lifestyle brand, EDITION, due to open in 2013.
WYNDHAMWith more than 55 brands Wyndham Worldwide is one of the world’s largest hospitality companies. Its Wyndham Hotels division operates more than 7,200 hotels worldwide with four brands established in the UK: Wyndham Grand, Ramada, Ramada encore, Days Inn and Hotels. A second Wyndham Grand is due to open in Scotland in 2015.
GUOMANGuoman Hotels Group is the principal investment of Guocoleisure Ltd, an investment holding company with its primary listing on the Singapore Stock Exchange and secondary lists in London and New Zealand. It owns, leases or manages 37 hotels in the United Kingdom under two brands – Guoman, a five star brand and Thistle, a well established four-star brand. The company also has hotels in Malaysia and Shanghai.
Groups No of hotels
No of rooms Brand No of hotels worldwide inc UK
(rooms in brackets)
1 Whitbread Hotel Company, London 630+ 48,383 Premier Inn 637+ (50,000+) UK, Dubai,
India and Ireland
2 InterContinental Hotels Group, Buckinghamshire
286(as at
30.6.2012) 40,100
InterContinental (2), *Crowne Plaza (23), *Holiday Inn (131), *Holiday Inn Express (120), Staybridge Suites (3), *Hotel Indigo (7)
4,500+ (666,000+) in 100 countries
3
Travelodge, Oxfordshire (Golden Tree/Avenue Capital/Goldman Sachs) (NB: 49 hotels to be sold from 17.8.2012)
505+ (as at
17.8.12) 36,898 Travelodge 519 +(37,500) in UK, Ireland
and Spain
4 Accor, London 196 26,500+
*Sofitel (3), *Novotel (31),*Mercure (75), Ibis (57), Ibis Styles (4), Ibis Budget (18), MGallery (2), Pullman (1), Formule 1 (5)
4,426+ (531,714+) in 92 countries
5 Hilton Worldwide, London 108 23,500
*Doubletree (17), *Garden Inn (5), *Hilton Hotels & Resorts (72), *Hampton by Hilton (8), *Waldorf Astoria (2), Unbranded (4)
3,800+ (630.000+) in 91 countries
6 **Best Western, York 280+ 15,900 Best Western Plus (24), Best Western Premier (9)
4,030+ (311,156) in 100 countries
7 Carlson Rezidor Hotel Group, Brussels, Belgium 61 12,812
Radisson Blu (13), Radisson Blu Edwardian (14), Park Inn by Radisson (23), Park Plaza (10), Missoni (1)
1,319 (209,000) in 81 countries.
8 Marriott Hotels, London 58 11,943
JW Marriott (1), Renaissance (3), Marriott (50), Courtyard by Marriott (1), Residence Inn (1), Grand Residences (1), Executive Apartments (1)
3,700+ hotels (300,000+) inc time share in 73 countries
9 Wyndham Worldwide, USA 110 10,010 Wyndham Grand (1), *Ramada (33), *Ramada Encore (18), *Days Hotel (14), *Days Inn (44)
7,200 hotels (608,300) in 66 countries
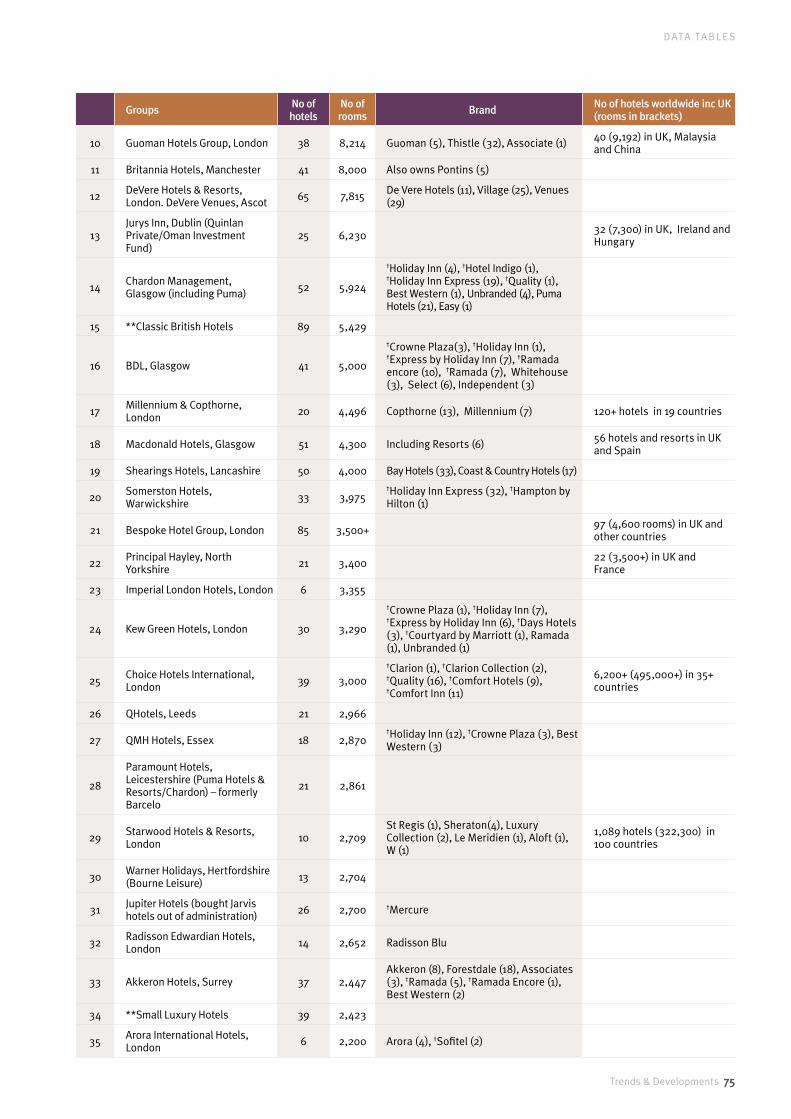
Trends & Developments 75
DATA TA B L E S
Groups No of hotels
No of rooms Brand No of hotels worldwide inc UK
(rooms in brackets)
10 Guoman Hotels Group, London 38 8,214 Guoman (5), Thistle (32), Associate (1) 40 (9,192) in UK, Malaysia and China
11 Britannia Hotels, Manchester 41 8,000 Also owns Pontins (5)
12 DeVere Hotels & Resorts, London. DeVere Venues, Ascot 65 7,815 De Vere Hotels (11), Village (25), Venues
(29)
13Jurys Inn, Dublin (Quinlan Private/Oman Investment Fund)
25 6,230 32 (7,300) in UK, Ireland and Hungary
14 Chardon Management, Glasgow (including Puma) 52 5,924
†Holiday Inn (4), †Hotel Indigo (1), †Holiday Inn Express (19), †Quality (1), Best Western (1), Unbranded (4), Puma Hotels (21), Easy (1)
15 **Classic British Hotels 89 5,429
16 BDL, Glasgow 41 5,000
†Crowne Plaza(3), †Holiday Inn (1), †Express by Holiday Inn (7), †Ramada encore (10), †Ramada (7), Whitehouse (3), Select (6), Independent (3)
17 Millennium & Copthorne, London 20 4,496 Copthorne (13), Millennium (7) 120+ hotels in 19 countries
18 Macdonald Hotels, Glasgow 51 4,300 Including Resorts (6) 56 hotels and resorts in UK and Spain
19 Shearings Hotels, Lancashire 50 4,000 Bay Hotels (33), Coast & Country Hotels (17)
20 Somerston Hotels, Warwickshire 33 3,975
†Holiday Inn Express (32), †Hampton by Hilton (1)
21 Bespoke Hotel Group, London 85 3,500+ 97 (4,600 rooms) in UK and other countries
22 Principal Hayley, North Yorkshire 21 3,400 22 (3,500+) in UK and
France
23 Imperial London Hotels, London 6 3,355
24 Kew Green Hotels, London 30 3,290
†Crowne Plaza (1), †Holiday Inn (7), †Express by Holiday Inn (6), †Days Hotels (3), †Courtyard by Marriott (1), Ramada (1), Unbranded (1)
25 Choice Hotels International, London 39 3,000
†Clarion (1), †Clarion Collection (2), †Quality (16), †Comfort Hotels (9), †Comfort Inn (11)
6,200+ (495,000+) in 35+ countries
26 QHotels, Leeds 21 2,966
27 QMH Hotels, Essex 18 2,870†Holiday Inn (12), †Crowne Plaza (3), Best Western (3)
28
Paramount Hotels, Leicestershire (Puma Hotels & Resorts/Chardon) – formerly Barcelo
21 2,861
29 Starwood Hotels & Resorts, London 10 2,709
St Regis (1), Sheraton(4), Luxury Collection (2), Le Meridien (1), Aloft (1), W (1)
1,089 hotels (322,300) in 100 countries
30 Warner Holidays, Hertfordshire (Bourne Leisure) 13 2,704
31 Jupiter Hotels (bought Jarvis hotels out of administration) 26 2,700 †Mercure
32 Radisson Edwardian Hotels, London 14 2,652 Radisson Blu
33 Akkeron Hotels, Surrey 37 2,447 Akkeron (8), Forestdale (18), Associates (3), †Ramada (5), †Ramada Encore (1), Best Western (2)
34 **Small Luxury Hotels 39 2,423
35 Arora International Hotels, London 6 2,200 Arora (4), †Sofitel (2)
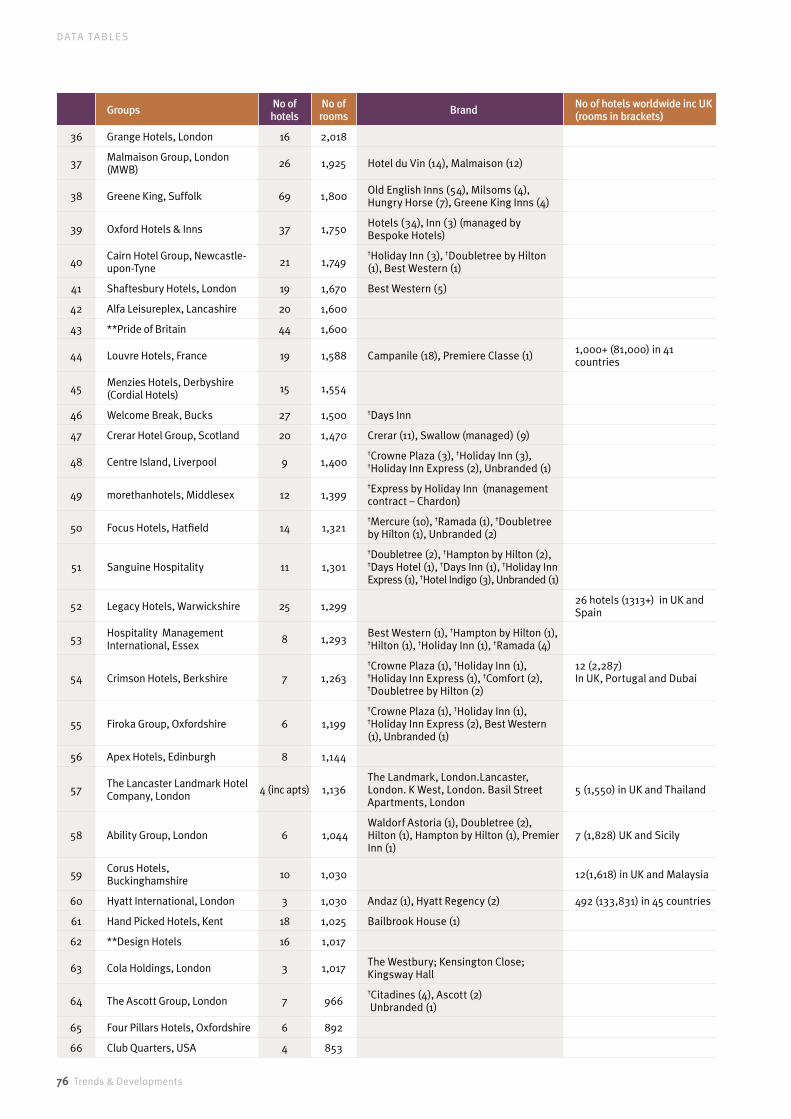
76 Trends & Developments
DATA TA B L E S
Groups No of hotels
No of rooms Brand No of hotels worldwide inc UK
(rooms in brackets)
36 Grange Hotels, London 16 2,018
37 Malmaison Group, London (MWB) 26 1,925 Hotel du Vin (14), Malmaison (12)
38 Greene King, Suffolk 69 1,800 Old English Inns (54), Milsoms (4), Hungry Horse (7), Greene King Inns (4)
39 Oxford Hotels & Inns 37 1,750 Hotels (34), Inn (3) (managed by Bespoke Hotels)
40 Cairn Hotel Group, Newcastle-upon-Tyne 21 1,749
†Holiday Inn (3), †Doubletree by Hilton (1), Best Western (1)
41 Shaftesbury Hotels, London 19 1,670 Best Western (5)
42 Alfa Leisureplex, Lancashire 20 1,600
43 **Pride of Britain 44 1,600
44 Louvre Hotels, France 19 1,588 Campanile (18), Premiere Classe (1) 1,000+ (81,000) in 41 countries
45 Menzies Hotels, Derbyshire (Cordial Hotels) 15 1,554
46 Welcome Break, Bucks 27 1,500 †Days Inn
47 Crerar Hotel Group, Scotland 20 1,470 Crerar (11), Swallow (managed) (9)
48 Centre Island, Liverpool 9 1,400†Crowne Plaza (3), †Holiday Inn (3), †Holiday Inn Express (2), Unbranded (1)
49 morethanhotels, Middlesex 12 1,399†Express by Holiday Inn (management contract – Chardon)
50 Focus Hotels, Hatfield 14 1,321†Mercure (10), †Ramada (1), †Doubletree by Hilton (1), Unbranded (2)
51 Sanguine Hospitality 11 1,301
†Doubletree (2), †Hampton by Hilton (2), †Days Hotel (1), †Days Inn (1), †Holiday Inn Express (1), †Hotel Indigo (3), Unbranded (1)
52 Legacy Hotels, Warwickshire 25 1,299 26 hotels (1313+) in UK and Spain
53 Hospitality Management International, Essex 8 1,293 Best Western (1), †Hampton by Hilton (1),
†Hilton (1), †Holiday Inn (1), †Ramada (4)
54 Crimson Hotels, Berkshire 7 1,263
†Crowne Plaza (1), †Holiday Inn (1), †Holiday Inn Express (1), †Comfort (2), †Doubletree by Hilton (2)
12 (2,287)In UK, Portugal and Dubai
55 Firoka Group, Oxfordshire 6 1,199
†Crowne Plaza (1), †Holiday Inn (1), †Holiday Inn Express (2), Best Western (1), Unbranded (1)
56 Apex Hotels, Edinburgh 8 1,144
57 The Lancaster Landmark Hotel Company, London 4 (inc apts) 1,136
The Landmark, London.Lancaster, London. K West, London. Basil Street Apartments, London
5 (1,550) in UK and Thailand
58 Ability Group, London 6 1,044Waldorf Astoria (1), Doubletree (2), Hilton (1), Hampton by Hilton (1), Premier Inn (1)
7 (1,828) UK and Sicily
59 Corus Hotels, Buckinghamshire 10 1,030 12(1,618) in UK and Malaysia
60 Hyatt International, London 3 1,030 Andaz (1), Hyatt Regency (2) 492 (133,831) in 45 countries
61 Hand Picked Hotels, Kent 18 1,025 Bailbrook House (1)
62 **Design Hotels 16 1,017
63 Cola Holdings, London 3 1,017 The Westbury; Kensington Close; Kingsway Hall
64 The Ascott Group, London 7 966†Citadines (4), Ascott (2) Unbranded (1)
65 Four Pillars Hotels, Oxfordshire 6 892
66 Club Quarters, USA 4 853
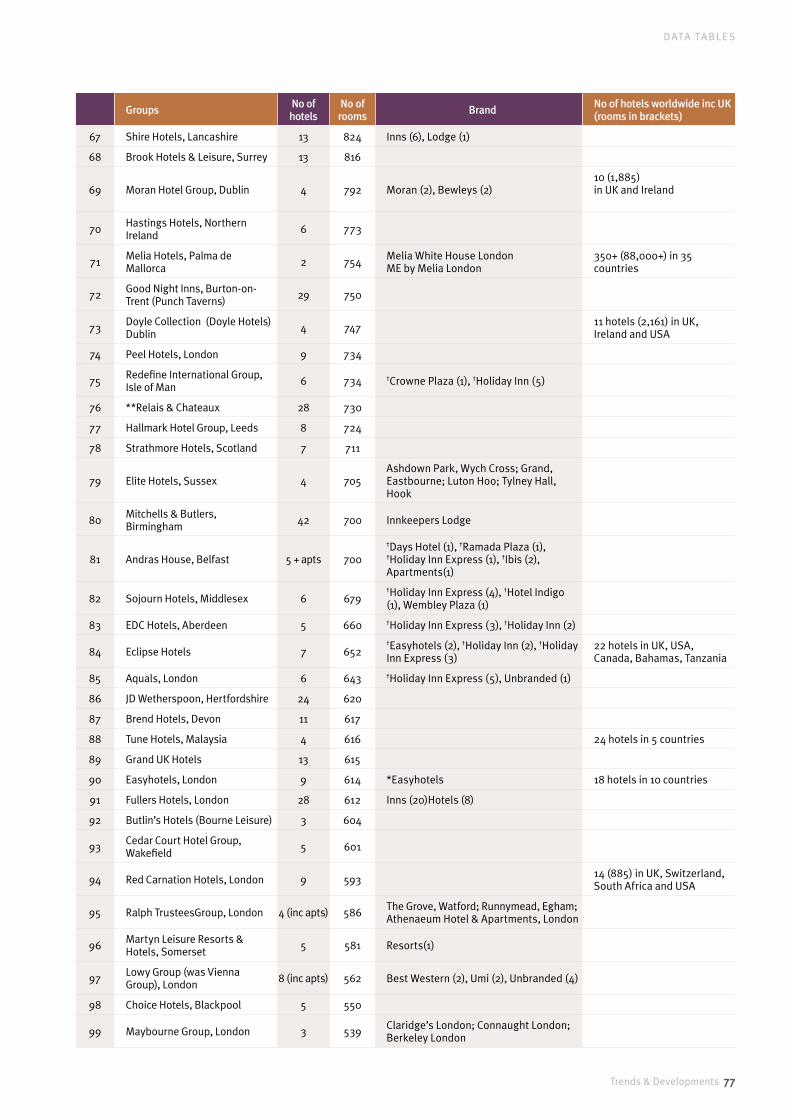
Trends & Developments 77
DATA TA B L E S
Groups No of hotels
No of rooms Brand No of hotels worldwide inc UK
(rooms in brackets)
67 Shire Hotels, Lancashire 13 824 Inns (6), Lodge (1)
68 Brook Hotels & Leisure, Surrey 13 816
69 Moran Hotel Group, Dublin 4 792 Moran (2), Bewleys (2)10 (1,885)in UK and Ireland
70 Hastings Hotels, Northern Ireland 6 773
71 Melia Hotels, Palma de Mallorca 2 754 Melia White House London
ME by Melia London350+ (88,000+) in 35 countries
72 Good Night Inns, Burton-on-Trent (Punch Taverns) 29 750
73 Doyle Collection (Doyle Hotels) Dublin 4 747 11 hotels (2,161) in UK,
Ireland and USA
74 Peel Hotels, London 9 734
75 Redefine International Group, Isle of Man 6 734 †Crowne Plaza (1), †Holiday Inn (5)
76 **Relais & Chateaux 28 730
77 Hallmark Hotel Group, Leeds 8 724
78 Strathmore Hotels, Scotland 7 711
79 Elite Hotels, Sussex 4 705Ashdown Park, Wych Cross; Grand, Eastbourne; Luton Hoo; Tylney Hall, Hook
80 Mitchells & Butlers, Birmingham 42 700 Innkeepers Lodge
81 Andras House, Belfast 5 + apts 700
†Days Hotel (1), †Ramada Plaza (1), †Holiday Inn Express (1), †Ibis (2), Apartments(1)
82 Sojourn Hotels, Middlesex 6 679†Holiday Inn Express (4), †Hotel Indigo (1), Wembley Plaza (1)
83 EDC Hotels, Aberdeen 5 660 †Holiday Inn Express (3), †Holiday Inn (2)
84 Eclipse Hotels 7 652†Easyhotels (2), †Holiday Inn (2), †Holiday Inn Express (3)
22 hotels in UK, USA, Canada, Bahamas, Tanzania
85 Aquals, London 6 643 †Holiday Inn Express (5), Unbranded (1)
86 JD Wetherspoon, Hertfordshire 24 620
87 Brend Hotels, Devon 11 617
88 Tune Hotels, Malaysia 4 616 24 hotels in 5 countries
89 Grand UK Hotels 13 615
90 Easyhotels, London 9 614 *Easyhotels 18 hotels in 10 countries
91 Fullers Hotels, London 28 612 Inns (20)Hotels (8)
92 Butlin’s Hotels (Bourne Leisure) 3 604
93 Cedar Court Hotel Group, Wakefield 5 601
94 Red Carnation Hotels, London 9 593 14 (885) in UK, Switzerland, South Africa and USA
95 Ralph TrusteesGroup, London 4 (inc apts) 586 The Grove, Watford; Runnymead, Egham; Athenaeum Hotel & Apartments, London
96 Martyn Leisure Resorts & Hotels, Somerset 5 581 Resorts(1)
97 Lowy Group (was Vienna Group), London 8 (inc apts) 562 Best Western (2), Umi (2), Unbranded (4)
98 Choice Hotels, Blackpool 5 550
99 Maybourne Group, London 3 539 Claridge’s London; Connaught London; Berkeley London

78 Trends & Developments
DATA TA B L E S
Groups No of hotels
No of rooms Brand No of hotels worldwide inc UK
(rooms in brackets)
100 Portland Hotels, Edinburgh 5 536 Best Western (1)
101 Prem Group, Dublin 9 (inc 6 apts) 526
34+ hotels and apartments (2,900+ in UK, Ireland, Belgium, France and Poland
102 Feathers Hotel & Catering Group, Liverpool 8 507 Best Western (8)
103 Seymour Hotels, Jersey 3 504
104 Marston’s Inns & Taverns 41+ 500
105 Future Inns, Bristol 3 495 5 (898) in UK and Canada
106 Fairmont Hotels & Resorts, London 2 477 Savoy, London; St Andrew's Hotel,
Scotland 60+ hotels in 18 countries
107 Rocco Forte Collection, London 3 470 Brown’s Hotel, London; The Lowry, Manchester; The Balmoral, Edinburgh 13 (1,865) in 7 countries
108 TLH Leisure Resort, Devon 4 (inc apts) 469
109 Four Seasons, London 3 468Four Seasons, Canary Wharf; Four Seasons Park Lane; Four Seasons, Hampshire
88 hotels in 35 countries
110 Exclusive Hotels, Surrey 6 460 EH Venues (2) 7 hotels (866) in UK and Italy
111 Metro Inns, London 8 455
112 Meridien Leisure Hotels, Berkshire 3 450 †Holiday Inn Express, (2) †Holiday Inn (1) 4 (580) in UK and Bulgaria
113 Jumeirah International, London 3 440Jumeirah Carlton Tower; Jumeirah Lowndes; London Grosvenor House Apartments
19 hotels in 9 countries
114 Morvan Hotels, Jersey 6 423 Best Western (1)
115 QN Hotels Group, Essex 5 393†Holiday Inn (2), †Ramada Plaza (1), †Holiday Inn Garden Court (2)
116 Citizen M, Holland 2 390
117 Young's Hotels, London 17 380
118 Lavender Hotels 6 378 Best Western (6)
119 Prima Hotel Group, Cheshire 6 378
120 Sonoma Hotels 6 376
121 Firmdale Hotels, London 7 374 8 (460) in UK and USA
122 Danubius Hotels, London 1 366 Danubius Regents Park 44 (8,700+) in 5 countries
123 Dorchester Collection, London 3 365 The Dorchester, London; Cowarth Park; 45 Park Lane 9 hotels in 5 countries
124 English Lakes Hotels, Cumbria 6 359
125 Morgans Hotel Group, London 2 354 12 (3,946) in UK and USA
126 McMillan Hotels, Stranrear 7 351
127 Surejogi Hotels, London 3 351
†Doubletree by Hilton (1), †The Bentley, a Hilton hotel (1), Washington – Mayfair
128 Abode Hotels,Somerset 6 348
129 Aristel Hotels, Surrey 5 341 Best Western (4), Unbranded (1)
130 Richardson Hotels, Devon 5 323
131 NH Hoteles, London 2 321 400 (59,109) in 26 countries
132 Castle Hotel Group, Dublin 3 318 7 hotels in UK and Ireland
133 Cosmopolitan Hotels, Scotland 2 318
134 FJB Hotels, Dorset 4 312
135 Modern Hotels, Jersey 2 308

Trends & Developments 79
DATA TA B L E S
Groups No of hotels
No of rooms Brand No of hotels worldwide inc UK
(rooms in brackets)
136 Lester Hotels, Watford 5 281†Comfort (1), Best Western (1), Unbranded (3)
137 Sleepwell Hotels, Isle of Man 4 279
138 Huggler Hotels, Jersey 3 256
139 Prince Hotels, Coventry 3 256 7 hotels in UK and Germany
140 Nike Group, Berkshire 2 250
141 Holdsworth Hotels, Isle of Wight 3 243
142 Mooney Hotel Group, Northern Ireland 3 240
143 Lake District Hotels, Cumbria 6 239
144 Starcrown Hotels, London 2 238
145 Kings Hotels, Weymouth 4 233
146 Longrose Buccleuch, Derbyshire 3 229
†Doubletree by Hilton (1), Best Western Plus (1), Mercure (1)
147 Nettleton Group, Cornwall 3 229
148 Hollybourne Hotels, Hampshire 5 227
149 Eton Collection (Westmont Hospitality) 4 226
150 Dakota Hotels, Scotland 2 224
151 Harbour Hotels, Bournemouth 5 223
152 Antoinette Hotel Group, Surrey 4 209
Source: Wordsmith and Company. As at November 30 2012. ** consortium of independently owned hotels. * some or all franchised to another operator and may be included in other company listings.† franchised hotels (also included in franchisor listings) Room numbers are approximate.
Table 28: Major property transactions and management contracts, November 2011 – November 2012
Hotel Rooms Price (est) Purchaser
AAIM Principal Hayley Hotels x 6: Hotel Russell, London; Palace, Manchester; George, Edinburgh; Royal York, York; Selsdon Park, Surrey; Metropole, Leeds
1,384 £200m Re-acquired by Principal Hayley & Conference Venues
Abbey Hill, Milton Keynes (to become Mercure) 88 Clubhouse Group (Nazim Manji)
Aston Hall, nr Sheffield (Tomahawk – in administration) 52 £3.2m asking price Aston Hall Hotel Ltd
Bailbrook House Hotel, Bath (Delancey) 78 £6.95m asking price Hand Picked Hotels
Barony Castle Hotel, Peebles (De Vere) – to become Mercure 78 £2m est Barony Castle LLP
Barcelo 20 hotels
Pulls out of 45 year lease with £20.25m penalty fee – management contract to Chardon Management
Puma Hotels resume ownership
The Belfry, West Midlands (Quinn Group affiliate) 324 (550 acre resort)
£70m asking price – management contract to DeVere KSL Capital Partners
Best Western Abbey Hotel, Bath (Compass Hotels) 60 3 year modernisation programme Ian and Christa Taylor
Best Western Crown, Lyndhurst (Evergreen Hotels) 38 Antoinette Hotel Group
Best Western Moore Place Hotel, Milton Keynes 61 Management contract BDL
Cavendish Hotel , London (Barclay Brothers) 230 £158.8m Ascott (to become serviced apartments)
Cotswold House, Chipping Campden (Concorde Hotel Management) 28 Long term lease and
management contract Bespoke Hotels
Cromwell Hotel, London (The Lords group) 85 £20m Private
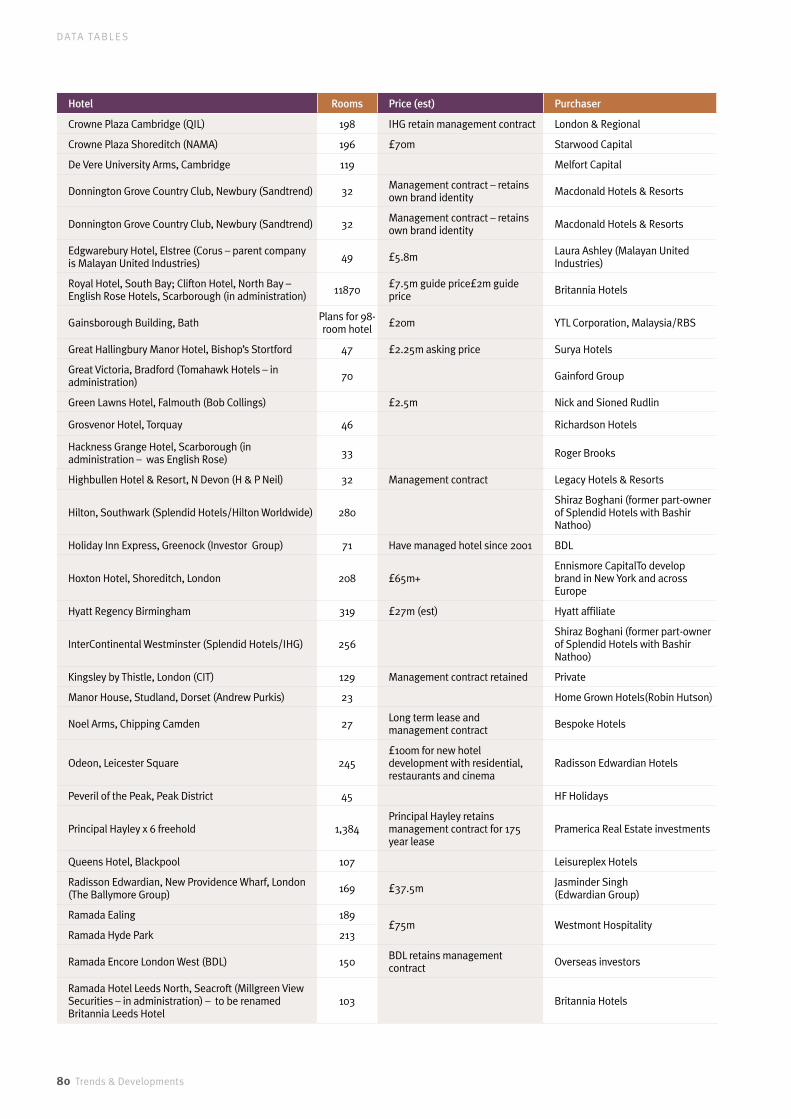
80 Trends & Developments
DATA TA B L E S
Hotel Rooms Price (est) Purchaser
Crowne Plaza Cambridge (QIL) 198 IHG retain management contract London & Regional
Crowne Plaza Shoreditch (NAMA) 196 £70m Starwood Capital
De Vere University Arms, Cambridge 119 Melfort Capital
Donnington Grove Country Club, Newbury (Sandtrend) 32 Management contract – retains own brand identity Macdonald Hotels & Resorts
Donnington Grove Country Club, Newbury (Sandtrend) 32 Management contract – retains own brand identity Macdonald Hotels & Resorts
Edgwarebury Hotel, Elstree (Corus – parent company is Malayan United Industries) 49 £5.8m Laura Ashley (Malayan United
Industries)
Royal Hotel, South Bay; Clifton Hotel, North Bay –English Rose Hotels, Scarborough (in administration) 11870 £7.5m guide price£2m guide
price Britannia Hotels
Gainsborough Building, Bath Plans for 98-room hotel £20m YTL Corporation, Malaysia/RBS
Great Hallingbury Manor Hotel, Bishop’s Stortford 47 £2.25m asking price Surya Hotels
Great Victoria, Bradford (Tomahawk Hotels – in administration) 70 Gainford Group
Green Lawns Hotel, Falmouth (Bob Collings) £2.5m Nick and Sioned Rudlin
Grosvenor Hotel, Torquay 46 Richardson Hotels
Hackness Grange Hotel, Scarborough (in administration – was English Rose) 33 Roger Brooks
Highbullen Hotel & Resort, N Devon (H & P Neil) 32 Management contract Legacy Hotels & Resorts
Hilton, Southwark (Splendid Hotels/Hilton Worldwide) 280Shiraz Boghani (former part-owner of Splendid Hotels with Bashir Nathoo)
Holiday Inn Express, Greenock (Investor Group) 71 Have managed hotel since 2001 BDL
Hoxton Hotel, Shoreditch, London 208 £65m+Ennismore CapitalTo develop brand in New York and across Europe
Hyatt Regency Birmingham 319 £27m (est) Hyatt affiliate
InterContinental Westminster (Splendid Hotels/IHG) 256Shiraz Boghani (former part-owner of Splendid Hotels with Bashir Nathoo)
Kingsley by Thistle, London (CIT) 129 Management contract retained Private
Manor House, Studland, Dorset (Andrew Purkis) 23 Home Grown Hotels(Robin Hutson)
Noel Arms, Chipping Camden 27 Long term lease and management contract Bespoke Hotels
Odeon, Leicester Square 245£100m for new hotel development with residential, restaurants and cinema
Radisson Edwardian Hotels
Peveril of the Peak, Peak District 45 HF Holidays
Principal Hayley x 6 freehold 1,384Principal Hayley retains management contract for 175 year lease
Pramerica Real Estate investments
Queens Hotel, Blackpool 107 Leisureplex Hotels
Radisson Edwardian, New Providence Wharf, London (The Ballymore Group) 169 £37.5m Jasminder Singh
(Edwardian Group)
Ramada Ealing 189£75m Westmont Hospitality
Ramada Hyde Park 213
Ramada Encore London West (BDL) 150 BDL retains management contract Overseas investors
Ramada Hotel Leeds North, Seacroft (Millgreen View Securities – in administration) – to be renamed Britannia Leeds Hotel
103 Britannia Hotels

Trends & Developments 81
DATA TA B L E S
Hotel Rooms Price (est) Purchaser
Renaissance London Heathrow (Hotel Property Owners) 649 Marriott International retains
management contract Arora Hotels
Rose and Crown, Romaldkirk 12 £1.3m asking price Robinson family
Royal Park, London 48 Management contract Bird Hospitality (new company – first contract on owned hotel)
Royal Wells Hotel, Tunbridge Wells 23 Shepherd Neame
The Scotsman Edinburgh; The Calls, Leeds; Hotel de la Tremoille, Paris(Scotsman Hotel Group – in administration)
203 £40m Sheikh Mohamed Bin Issa al-Jaberthrough JJW Group
The Swan at Streatley, Berkshire 45 £6m asking price Rare Bird Hotels (Hugh Osmonde)
Travelodge London Marylebone (Aviva Investors) 92 Travelodge retains management contract
M & G Secured Property Income Fund
Von Essen Hotels – (company in administration)
Bishopstrow House, Wilts 31 £6m (guide price) Longleat Enterprises
Callow Hall, Mappleton, Derbyshire 16 £2.25m (guide price) Private buyer
Cliveden House, Taplow, Bucks 41£30m est (guide price £35m) – management contract to Chewton Glen
Ian & Richard Livingstone
Congham Hall, Norfolk 26 £2.5m (guide price) Nicholas Dickinson
Dalhousie Castle, Edinburgh 29 £5m (guide price) Robert and Gina Parker
Greenway Hotel, Cheltenham, Glos 17 £3.5m Eden Hotel Collection
Homewood Park Hotel & Spa, Bath 21 £3.5m (guide price) Longleat Enterprises
Hotel Verta Battersea (to be rebranded Hotel Verta by Rhombus) 70
£20m (asking price – est £17.5m). Management contract to US- based Rhombus International
Woodlon (Nicholas Cowell)
Lewtrenchard Manor, Devon 14 £750,000 (guide price) Sue and James Murray (former owners)
Llangoed Hall, Brecon 23 Roger Hancox
Mount Somerset 19 £3m (guide price) Eden Hotel Collection
Royal Crescent, Bath 29£18m (£22.5m guide price) – management contract – Vision Asset Management
Topland Group
Seaham Hall, Co Durham 20 £5m (£12,5 original guide price) Seasons Holidays
Sharrow Bay, Lake District 24 £1.5m Hamilton Bradshaw(James Caan)
Ston Easton Park, nr Bath, Somerset 21 £3m Hamilton Bradshaw(James Caan)
Fowey Hall, Fowey; Ickworth Hotel, Suffolk; Moonfleet Manor, Dorset; Woolley Grange, Wilts; Elms, Abberley, Worcs; Thornbury Castle, Glos; New Park Manor, New Forest
211 £30m est Halcyon Hotels and Resorts/Patron Capital Partners
Ynyshir Hall, Powys 9 £1.5m (guide price) Joan and Rob Reen (original owners)
Wild Pheasant Llangollen (Global Investment Company – in administration) 46 Asif Siddiqui
Woodlands, Leeds (Tomahawk – in administration) 23 £2m est Elle R Leisure
Source: Wordsmith and Company
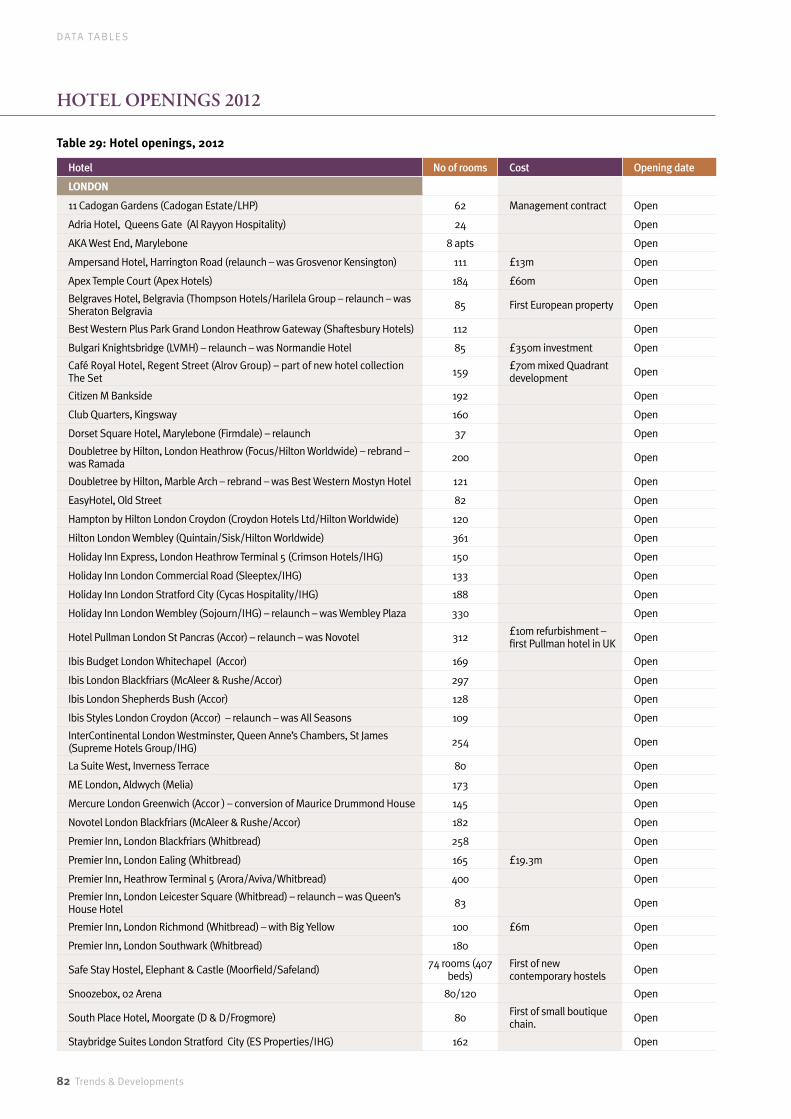
82 Trends & Developments
DATA TA B L E S
Table 29: Hotel openings, 2012
Hotel No of rooms Cost Opening date
LONDON
11 Cadogan Gardens (Cadogan Estate/LHP) 62 Management contract Open
Adria Hotel, Queens Gate (Al Rayyon Hospitality) 24 Open
AKA West End, Marylebone 8 apts Open
Ampersand Hotel, Harrington Road (relaunch – was Grosvenor Kensington) 111 £13m Open
Apex Temple Court (Apex Hotels) 184 £60m Open
Belgraves Hotel, Belgravia (Thompson Hotels/Harilela Group – relaunch – was Sheraton Belgravia 85 First European property Open
Best Western Plus Park Grand London Heathrow Gateway (Shaftesbury Hotels) 112 Open
Bulgari Knightsbridge (LVMH) – relaunch – was Normandie Hotel 85 £350m investment Open
Café Royal Hotel, Regent Street (Alrov Group) – part of new hotel collection The Set 159 £70m mixed Quadrant
development Open
Citizen M Bankside 192 Open
Club Quarters, Kingsway 160 Open
Dorset Square Hotel, Marylebone (Firmdale) – relaunch 37 Open
Doubletree by Hilton, London Heathrow (Focus/Hilton Worldwide) – rebrand – was Ramada 200 Open
Doubletree by Hilton, Marble Arch – rebrand – was Best Western Mostyn Hotel 121 Open
EasyHotel, Old Street 82 Open
Hampton by Hilton London Croydon (Croydon Hotels Ltd/Hilton Worldwide) 120 Open
Hilton London Wembley (Quintain/Sisk/Hilton Worldwide) 361 Open
Holiday Inn Express, London Heathrow Terminal 5 (Crimson Hotels/IHG) 150 Open
Holiday Inn London Commercial Road (Sleeptex/IHG) 133 Open
Holiday Inn London Stratford City (Cycas Hospitality/IHG) 188 Open
Holiday Inn London Wembley (Sojourn/IHG) – relaunch – was Wembley Plaza 330 Open
Hotel Pullman London St Pancras (Accor) – relaunch – was Novotel 312 £10m refurbishment – first Pullman hotel in UK Open
Ibis Budget London Whitechapel (Accor) 169 Open
Ibis London Blackfriars (McAleer & Rushe/Accor) 297 Open
Ibis London Shepherds Bush (Accor) 128 Open
Ibis Styles London Croydon (Accor) – relaunch – was All Seasons 109 Open
InterContinental London Westminster, Queen Anne’s Chambers, St James (Supreme Hotels Group/IHG) 254 Open
La Suite West, Inverness Terrace 80 Open
ME London, Aldwych (Melia) 173 Open
Mercure London Greenwich (Accor ) – conversion of Maurice Drummond House 145 Open
Novotel London Blackfriars (McAleer & Rushe/Accor) 182 Open
Premier Inn, London Blackfriars (Whitbread) 258 Open
Premier Inn, London Ealing (Whitbread) 165 £19.3m Open
Premier Inn, Heathrow Terminal 5 (Arora/Aviva/Whitbread) 400 Open
Premier Inn, London Leicester Square (Whitbread) – relaunch – was Queen’s House Hotel 83 Open
Premier Inn, London Richmond (Whitbread) – with Big Yellow 100 £6m Open
Premier Inn, London Southwark (Whitbread) 180 Open
Safe Stay Hostel, Elephant & Castle (Moorfield/Safeland) 74 rooms (407 beds)
First of new contemporary hostels Open
Snoozebox, 02 Arena 80/120 Open
South Place Hotel, Moorgate (D & D/Frogmore) 80 First of small boutique chain. Open
Staybridge Suites London Stratford City (ES Properties/IHG) 162 Open
HOTEL OPEninGs 2012

Trends & Developments 83
DATA TA B L E S
Hotel No of rooms Cost Opening date
The Townhouse, Mayfair (Veladail Hotels) 7 Open
Travelodge, London Bromley 92 Open
Travelodge, London Balham 90 Open
Travelodge, London Clapham 84 Open
Travelodge, London Crystal Palace 89 Open
Travelodge, London Enfield (Frontier Estates) 132 Open
Travelodge, London Excel Centre 131 £7.4m Open
Travelodge, London Greenwich West 97 £5.5m Open
Travelodge, London Sidcup (with Waitrose) 84 Open
Travelodge, London Stratford 188 £15.5m Open
Travelodge, London Sidcup (with Waitrose) 84 Open
Travelodge, London Stratford 188 £15.5m Open
Travelodge, London Woolwich 120 Open
Travelodge, London Teddington 113 Open
Travelodge, London Twickenham 111 Open
Tune Hotel, Liverpool Street 183 Open
Tune Hotel, Kings Cross 217 Open
Tune Hotel, Paddington 137 Open
The Wellesley, Knightsbridge (City & Country Hotels) 36 Open
Z Hotel, Victoria (Bev King) 106 Open
ENGLAND
Britannia Leeds Hotel (Britannia Hotels) – relaunch – was Ramada Leeds North 103 Open
The Bocardo, Oxford 10 Open
The Daffodil Hotel by the Lake, Grasmere (Harwood/Brady) – relaunch – was The Waterside 79 Open
Dartington Hall, Devon (Dartington Hall Trust) 50 Open
Earl of Doncaster Hotel, Doncaster – relaunch 89 £5m refurbishment Open
Edge Hotel School and Country House Hotel, Wivenhoe House, Colchester (University of Essex/Kaplan) 40 £10m Open
The Edgwarebury , Elstree (MUI) – relaunch – as Laura Ashley boutique hotel 49 Open
The Foley, Claygate, Surrey (Young’s) 17 £3m Open
Francis Hotel, Bath (Accor) – relaunch as MGallery 98 £6m Open
Gulliver’s Theme Parks, Warrington 56 £4m Open
Hampton by Hilton, Broad Street, Birmingham (Sanguine/Hilton Worldwide) 284 Open
Hampton by Hilton, Luton Airport (Ability Group/Hilton Worldwide) 250 Open
Hampton by Hilton, York (Avantis/Hilton Worldwide) 120 £10m Open
Hampton by Hilton, St George’s Park Burton-on-Trent (Football Association/Hilton Worldwide) 86 Open
Hilton, St George’s Park, Burton-on-Trent (Football Association/Hilton Worldwide) 146 £105m Open
Holiday Inn Express, Crewe (Chardon/IHG) – relaunch – was Ramada 70 Open
Holiday Inn Express, Dunstable (Gateway Hotel/IHG) 120 £6.5m Open
Holiday Inn Express, Crown Gate, Harlow (Aquals/IHG) 122 Open
Holiday Inn Express, Liverpool-Hoylake (Sanguine/IHG) – relaunch – was Kings Gap Court 56 Open
Holiday Inn Express, Windsor (Chardon/IHG) 57 Open
Holiday Inn, London Gatwick, Worth (IHG) 118 Open
Holiday Inn, London Southend Airport (Stobart/Chardon/IHG) 129 £10m Open
Holiday Inn, Walsall – (Kew Green/Hotel Operations/IHG – relaunch 156 Open
Hotel la Tour, Eastside City Park Gate, Birmingham (Hotel de la Tour Group) 174 £24m Open
Hotel Indigo, Newcastle (Sanguine/IHG) 148 £20m Open
Legoland Windsor (Merlin) 150 Part of £30m development Open
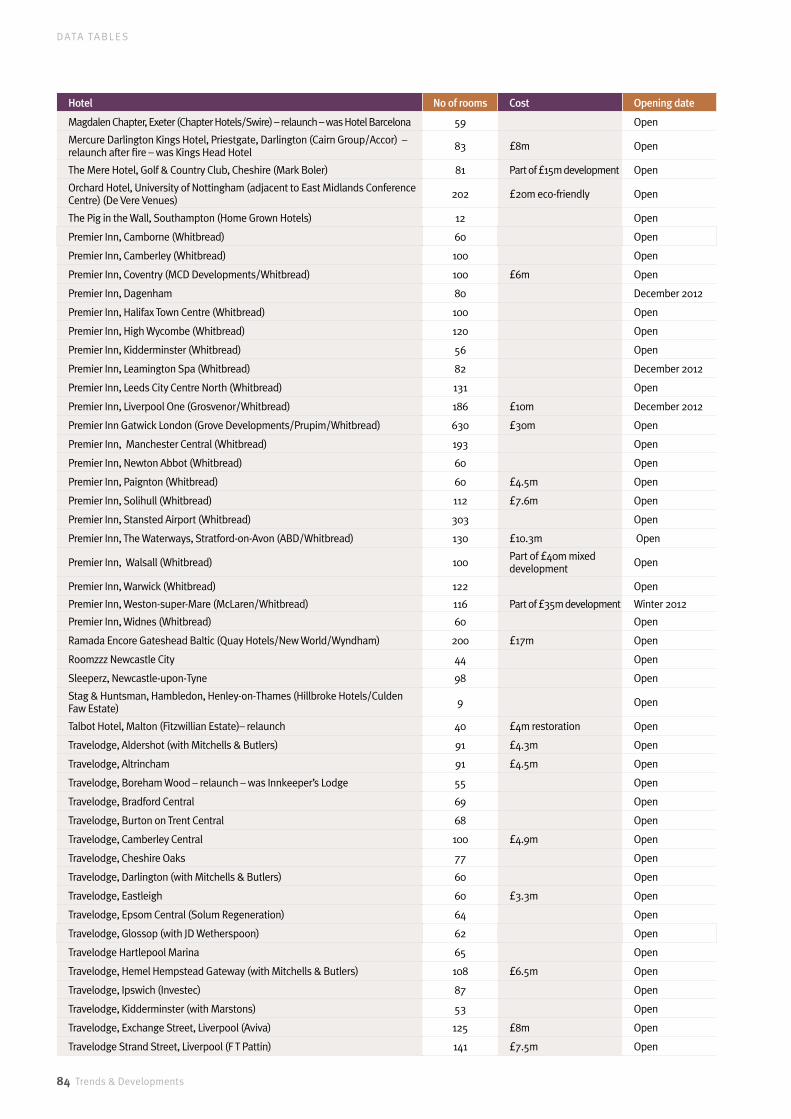
84 Trends & Developments
DATA TA B L E S
Hotel No of rooms Cost Opening date
Magdalen Chapter, Exeter (Chapter Hotels/Swire) – relaunch – was Hotel Barcelona 59 Open
Mercure Darlington Kings Hotel, Priestgate, Darlington (Cairn Group/Accor) – relaunch after fire – was Kings Head Hotel 83 £8m Open
The Mere Hotel, Golf & Country Club, Cheshire (Mark Boler) 81 Part of £15m development Open
Orchard Hotel, University of Nottingham (adjacent to East Midlands Conference Centre) (De Vere Venues) 202 £20m eco-friendly Open
The Pig in the Wall, Southampton (Home Grown Hotels) 12 Open
Premier Inn, Camborne (Whitbread) 60 Open
Premier Inn, Camberley (Whitbread) 100 Open
Premier Inn, Coventry (MCD Developments/Whitbread) 100 £6m Open
Premier Inn, Dagenham 80 December 2012
Premier Inn, Halifax Town Centre (Whitbread) 100 Open
Premier Inn, High Wycombe (Whitbread) 120 Open
Premier Inn, Kidderminster (Whitbread) 56 Open
Premier Inn, Leamington Spa (Whitbread) 82 December 2012
Premier Inn, Leeds City Centre North (Whitbread) 131 Open
Premier Inn, Liverpool One (Grosvenor/Whitbread) 186 £10m December 2012
Premier Inn Gatwick London (Grove Developments/Prupim/Whitbread) 630 £30m Open
Premier Inn, Manchester Central (Whitbread) 193 Open
Premier Inn, Newton Abbot (Whitbread) 60 Open
Premier Inn, Paignton (Whitbread) 60 £4.5m Open
Premier Inn, Solihull (Whitbread) 112 £7.6m Open
Premier Inn, Stansted Airport (Whitbread) 303 Open
Premier Inn, The Waterways, Stratford-on-Avon (ABD/Whitbread) 130 £10.3m Open
Premier Inn, Walsall (Whitbread) 100 Part of £40m mixed development Open
Premier Inn, Warwick (Whitbread) 122 Open
Premier Inn, Weston-super-Mare (McLaren/Whitbread) 116 Part of £35m development Winter 2012
Premier Inn, Widnes (Whitbread) 60 Open
Ramada Encore Gateshead Baltic (Quay Hotels/New World/Wyndham) 200 £17m Open
Roomzzz Newcastle City 44 Open
Sleeperz, Newcastle-upon-Tyne 98 Open
Stag & Huntsman, Hambledon, Henley-on-Thames (Hillbroke Hotels/Culden Faw Estate) 9 Open
Talbot Hotel, Malton (Fitzwillian Estate)– relaunch 40 £4m restoration Open
Travelodge, Aldershot (with Mitchells & Butlers) 91 £4.3m Open
Travelodge, Altrincham 91 £4.5m Open
Travelodge, Boreham Wood – relaunch – was Innkeeper’s Lodge 55 Open
Travelodge, Bradford Central 69 Open
Travelodge, Burton on Trent Central 68 Open
Travelodge, Camberley Central 100 £4.9m Open
Travelodge, Cheshire Oaks 77 Open
Travelodge, Darlington (with Mitchells & Butlers) 60 Open
Travelodge, Eastleigh 60 £3.3m Open
Travelodge, Epsom Central (Solum Regeneration) 64 Open
Travelodge, Glossop (with JD Wetherspoon) 62 Open
Travelodge Hartlepool Marina 65 Open
Travelodge, Hemel Hempstead Gateway (with Mitchells & Butlers) 108 £6.5m Open
Travelodge, Ipswich (Investec) 87 Open
Travelodge, Kidderminster (with Marstons) 53 Open
Travelodge, Exchange Street, Liverpool (Aviva) 125 £8m Open
Travelodge Strand Street, Liverpool (F T Pattin) 141 £7.5m Open

Trends & Developments 85
DATA TA B L E S
Hotel No of rooms Cost Opening date
Travelodge London Gatwick Central – relaunch – was Mercure 400 Open
Travelodge, Loughborough Central 87 Open
Travelodge, Lytham St Annes 61 Open
Travelodge, Malvern 52 £3m End 2012
Travelodge, Sunderland (Calmont/Kier) 82 £6m Open
Travelodge, Tamworth (with Lidl) 66 £2.3m Open
Travelodge, Wincanton 57 Open
Travelodge, Woking White Rose 110 Open
Vanbrugh House Hotel (Sojourn Hotels), St Michael’s Street, Oxford 22 Open
The Wave Hotel, Bognor Regis (Butlins) (McAlpine/ Bourne Leisure) 215 + 29 apts £25m Open
The Wellington, Bristol (Bath Ales) 8 First Bath Ales pub to offer rooms Open
The White Swan, Stratford-upon-Avon – relaunch (Fullers) 41 £3m Open
Wood Norton Hall, Evesham (Bespoke Hotels) – relaunch 50 £4m restoration Open
SCOTLAND
Ackergill Tower, Wick (Clarenco) – relaunch as hotel 28 £6m Open
The Atholl, Edinburgh (ICMI) 4 Open
Cairn Lodge, Auchterarder (Arora Hotel Collection) – relaunch 14 Open
The Caledonian – A Waldorf Astoria Hotel (Hilton Worldwide) – rebrand – was Caledonian Hilton, Edinburgh 254 £24m Open
Easyhotel Glasgow (Chardon/Easyhotels) 125 Open
Grasshoppers Glasgow (Barrie Munn) 30` Open
Hotel Indigo Edinburgh (Sojourn/IHG) – relaunch – was Osbourne Hotel 60 Open
Loch Lomond Arms Hotel, Luss (Sir Michael Colquhoun) 14 £2.7m Open
Mercure Eddleston Barony Castle Hotel & Spa (Accor) – relaunch 78 Open
Premier Inn, Edinburgh Park, Edinburgh (Whitbread) 120 £2m Open
Premier Inn, Princes Street, Edinburgh (Delamore Properties/Whitbread) 97 Part of £35m hotel/retail development Open
Premier Inn, Glasgow Newton Mearns 60 Open
Premier Inn, Buchanan Galleries, Glasgow (Whitbread) 210 Part of £30m development Open
Premier Inn, Inverness Centre (Ardmuir/Whitbread) 100 £17m Open
Premier Inn, Inverness South (Caledonian Canal) (Whitbread) 80 Open
Premier Inn, Inverness West 76 Open
Travelodge above Topshop, Princes Street, Edinburgh 96 £10m Open
Travelodge, Edinburgh Queen Street 85 £8.5m Open
Travelodge, Fort William (with JD Wetherspoon) 60 Open
Ugadale Hotel, Mull of Kintyre (Southworth Development) 22 Open
WALES
Brown’s Hotel, Laugharne (Nigel Short) – relaunch 15 Open
Nanteos, Aberyswyth (Saxoncourt) – relaunch 14+4 bed mews house £4.5m Open
Premier Inn, Innovation Quarter, Barry (Whitbread) 80 Open
Premier Inn, Llanelli Central West (Whitbread) 28 Open
Travelodge, Llanelli Central 53 Part of £20m mixed development Open
NORTHERN IRELAND
Premier Inn, Crescent Link, Londonderry (Whitbread) 60 £6m Open
CHANNEL ISLANDS
Duke of Richmond, Guernsey (Red Carnation) – relaunch 70 £1.5m Open
Marina Metro Hotel, Jersey – relaunch – was Marina Hotel 36 Open
ISLE OF MAN
Ramsey Park Hotel, Ramsey 30 Open
Source: Wordsmith and Company T

86 Trends & Developments
DATA TA B L E S
Hotel No of rooms Cost Opening Date
LONDON
Chiltern Fire Station (Andre Balazs) – conversion 26 2013
Edition London by Marriott 193 First Edition in UK Spring 2013
Great Northern Hotel, Kings Cross (Oxford Hotels/Paramerica) 94 Early 2013
Ham Yard, Regent Street (Firmdale) 100 £60m mixed development 2013
Hampton by Hilton London Waterloo (Rising Star/Shiva/HMI/Hilton Worldwide) 294 2013
Hilton London Southbank(Boghani/Hilton Worldwide) 281 Autumn 2013
Holiday Inn, Wandsworth (Eclipse/IHG) 122 £14m
Holiday Inn, London Barking (Key Homes/IHG) 210 Summer 2013
Holiday Inn Docklands, London West India Dock (Key Homes Group/West India Dock Road Ltd/IHG) 252 Summer 2013
Holiday Inn Express London-Excel (IHG) 204 Summer 2013
Holiday Inn Express Royal Arsenal Riverside, Woolwich (Key Homes Group) 130 2013
Hotel Indigo, Cannon Street(City Site Estates/IHG) 38 2013
Hotel Indigo Kensington (IHG) 51 January 2013
Hotel Indigo, Philpot Lane (IHG) 64 2013
Hoxton, Holborn 175 £15m 2013
Park Inn by Radisson Wembley (Key Homes Group/Rezidor) 235 Early 2013
Premier Inn, York Road, Lambeth (Whitbread) 234 2013
Premier Inn City of London, St Mary-at-Hill (Beltane Asset Management/Whitbread) 183
Premier Inn, Hyde House, Hendon (Whitbread) 99 2013
Premier Inn, London Sutton (Whitbread) 120 Sutton Superbowl site 2013
Premier Inn, Wandsworth (The Harvest Partnership/Whitbread) 120 December 2013
Premier Inn, Waterloo (Whitbread) 247 2013
London Ealing Hotel (was Ramada to become Doubletree by Hilton) 189 May 2013
London Hyde Park (was Ramada to become Doubletree by Hilton) 213 May 2013
Seraphine, Knightsbridge 20 January 2013
Sanger Hotel, Heston (McAleer & Rushe) 317 £19.5m August 2013
Shangri-La at the Shard (LBQ) 195
Hotel on levels 34-52 – 310 metre building – £2bn mixed development
May 2013
Travelodge, London Bethnal Green (Dam Estates) 131 2013
Travelodge, London Bexleyheath 110 £5.4m 2013
Travelodge, London Charlton 120 2013
Travelodge, London Clapham Junction (Sequoia Hotels) 84 2013
Travelodge, London Edgware 119 £6.2m 2013
Travelodge Royal Docks, Newham (Citygrove) 131 10.6m 2013
Travelodge, London Finchley 110 2013
Travelodge, London Finsbury Park 96 £10.1m 2013
Travelodge, Sutton 100 2013
Travelodge, Vauxhall (with Waitrose) (Salmon Harvester) 154 £17.4m mixed development 2013
Travelodge, Walthamstow (Solum Regeneration) 107
ENGLAND
Adagio Aparthotel, Lewis’s Building, Liverpool (Accor/Merepark) 129 £20m 2013
Albert Square Inn, Manchester (Roger Ward) – was Memorial Hall 8 £3.5m 2013
Askham Hall, Cumbria (Charles Lowther) 26 £2.5m conversion 2013/4
Table 30: Hotel openings planned for 2013

Trends & Developments 87
DATA TA B L E S
Hotel No of rooms Cost Opening Date
Bloc Hotel, London Gatwick South Terminal 245 Autumn 2013
Crowne Plaza, Stephenson Quarter, Newcastle-upon-Tyne (Silverlink/IHG) 250Part of £200m mixed use project – funding delays start
2013
Doubletree by Hilton, Edgbaston Mill, Birmingham (Calthorpe/Edgbaston Holdings/Zinnia Hotels/Hilton Worldwide) 200 Summer 2013
Doubletree by Hilton, Municipal Annex, Liverpool (Sanguine/Hilton Worldwide) 87 Summer 2013
Hampton by Hilton, Exeter International Airport (Sanguine/Hilton Worldwide) 160 £30m January 2013
Hampton by Hilton, Gatwick North (Shiva/HMI/Hilton Worldwide) 192 Summer 2013
Hampton by Hilton, Sheffield (West Bar/Sanguine/Hilton Worldwide) 142 £9.5m 2013
Harbour Hotel, Southampton Ocean Village (MDL) 70 2013/4
Heckfield Place, Hook, Hampshire (Morningside) 60 March 2013
Hilton Garden Inn, Hull (Hilton Worldwide) 132 £15m 2013/4
Holiday Inn Express Snow Hill, Birmingham (Sanguine/IHG) 224 Spring 2013
Hotel Indigo, Birmingham Waterloo Street (Rustic Pine Developments/IHG) 60
Hotel Indigo, York (Sojourn/IHG) 101 2013
Ibis Brighton (McAleer & Rushe/Accor) 140 June 2013
Ibis Liverpool, Dale Street (Accor) 122 £10m 2013
Mercure Milton Keynes Abbey Hill, Bucks – relaunch – was Abbey Hill 88 2013
Moran Hotel, Kingston-on-Thames (NHP Leisure/Moran Hotels) 150 2013/4
The Pig on the Beach, Studland Bay (Home Grown Hotels) – relaunch – was the Manor House Hotel. 23 National Trust Property June 2013
Poet’s House, Ely (House Collection) 21 Spring 2013
Premier Inn, Bath (Whitbread) 108 2013
Premier Inn, Bicester (Whitbread) 80 February 2013
Premier Inn, Bristol Lewins Mead (Whitbread) 175 £10m 2013
Premier Inn, Flemingate, Beverley (Whitbread) 79 2013
Premier Inn, Cambridge (Whitbread) 121 2013
Premier Inn, Canterbury (Whitbread) 120 2013
Premier Inn, Catterick Garrison (Whitbread) 60 2013
Premier Inn, Dorchester (Whitbread) 76 Jan 2013
Premier Inn, Eastbourne (Whitbread) 65 Was Co-op building 2013
Premier Inn, Exeter (Whitbread) 120 2013
Premier Inn, Farnborough (Whitbread) 80 2013
Premier Inn, Harrogate International Centre (Puma Hotels/Whitbread) 107 January 2013
Premier Inn, Ipswich (Whitbread) 80 2013
Premier Inn, Longbridge (Whitbread) 75 2013
Premier Inn, Abbey Retail Park, Redditch (Whitbread) 62 2013
Premier Inn, Sunbury-on-Thames (Whitbread) 104 2013
Premier Inn, Trowbridge (Whitbread) 80 2013
Premier Inn, Weymouth (Whitbread) 60 February 2013
Premier Inn, Woking (Whitbread) 100 2013
Ramada, Martlesham (New World/Wyndham) 120 2013
Ramada, Rugby (New World/Wyndham) 111 2013
Ramada Encore, Jewellery Quarter, Birmingham (New World/Wyndham) 151 2013/4
Sandford Springs, Hampshire (Leaderboard Golf Group) 40 2013
Sleeperz, Manchester 80 £4.5m 2013
Travelodge, Chantry Street, Andover 78 £3.2m 2013
Travelodge Aylesbury (with Waitrose) 81 2013
Travelodge, Bedford 130 2013
Travelodge NEC, Birmingham 200 2013

88 Trends & Developments
DATA TA B L E S
Hotel No of rooms Cost Opening Date
Travelodge, Newmarket Road, Cambridge 219 2013
Travelodge, Chertsey (SI Pension Fund) 73 2013
Travelodge, Felixstowe 54 £2.7m 2013
Travelodge, Exchange Street, Liverpool 125 2013
Travelodge, Kings Lynn (with Greene King) 68 2013 2013
Travelodge, Newton Abbot 61 2013
Travelodge, St Helens 64 £3.2m 2013
Travelodge, Sittingbourne 56 2013
Travelodge, Stevenage (with Mitchells & Butlers) 71 2013
Travelodge, York (Tiger/Kier) 124 2013
Tune, Liverpool 127 2013
Z Hotel, Liverpool (Bev King) 92 2013
SCOTLAND
BDL, Brae, Shetland 100 £6.5m Winter 2013
Courtyard by Marriott, AberdeenInternational Airport 194 Debut new design across Europe Spring 2013
Doubletree by Hilton, Dundee (BDL Hilton Worldwide) – conversion – was Landmark Hotel 95 2013
Ibis, SoCo, Edinburgh (Accor) 259 June 2013
Malmaison Dundee – relaunch – was Tay Hotel (MEC Services/MWB) 91 £15m May 2013
Motel One, Princes Street, Edinburgh (Aberdeen Asset Management) 140 Part of £13m development project 2013
Motel One, Edinburgh (Chris Stewart Group) 208
First UK hotel German budget hotel group- £25m – part of £45m mixed development
Early 2013
Park Inn by Radisson Glasgow City Centre (Carlson Rezidor) 91 Spring 2013
Staybridge Suites, Edinburgh (BDL/IHG) 121 2013
Tune Edinburgh 175 2013
WALES
Travelodge, Cardiff 72 Was Co-op building 2013
NORTHERN IRELAND
Premier Inn, Crescent Link, Londonderry (Orana Group/Whitbread) 60 £6m – part of £56m development 2013
Strand Road Hotel, Londonderry (Doddy Group) 116 2013
Andras Hotel, Londonderry 139 2013
2014
LONDON
Art’otel, Hoxton (Park Plaza Hotels/Aldersgate Investments/Squire and Partners) 350 2014
The Beaumont, Balderton Street, Mayfair (Grosvenor/RexRA) 75Including the habitable structure The Crouching Man by Antony Gormley
Early 2014
Citizen M Tower Hill 370 2014
Citizen M St Pauls 246 2014
City Road Hotel, Hackney (Soneva/Squire and Partners) 275
Dorsett Regency, Shepherd’s Bush Green (Kosmopolito) 332 First hotel in UK 2014
Edwardian, Leicester Square (Edwardian Group – Jasminder Singh) 245 Hotel, residential and restaurant development 2014/5
Holiday Inn Express Wembley – office conversion (Summit Hotels/IHG) 262 2014
LaLiT, Tooley Street, Southwark (Bharat Hotels) 70 First hotel in UK 2014/5
Mondrian, Sea Containers House Hotel, South Bank (Archlane/Morgans Hotel Group) 356 2014
Motel One, Tower of London 258 First property in London 2014
Park Inn by Radisson London Excel (Rezidor) 223 2014
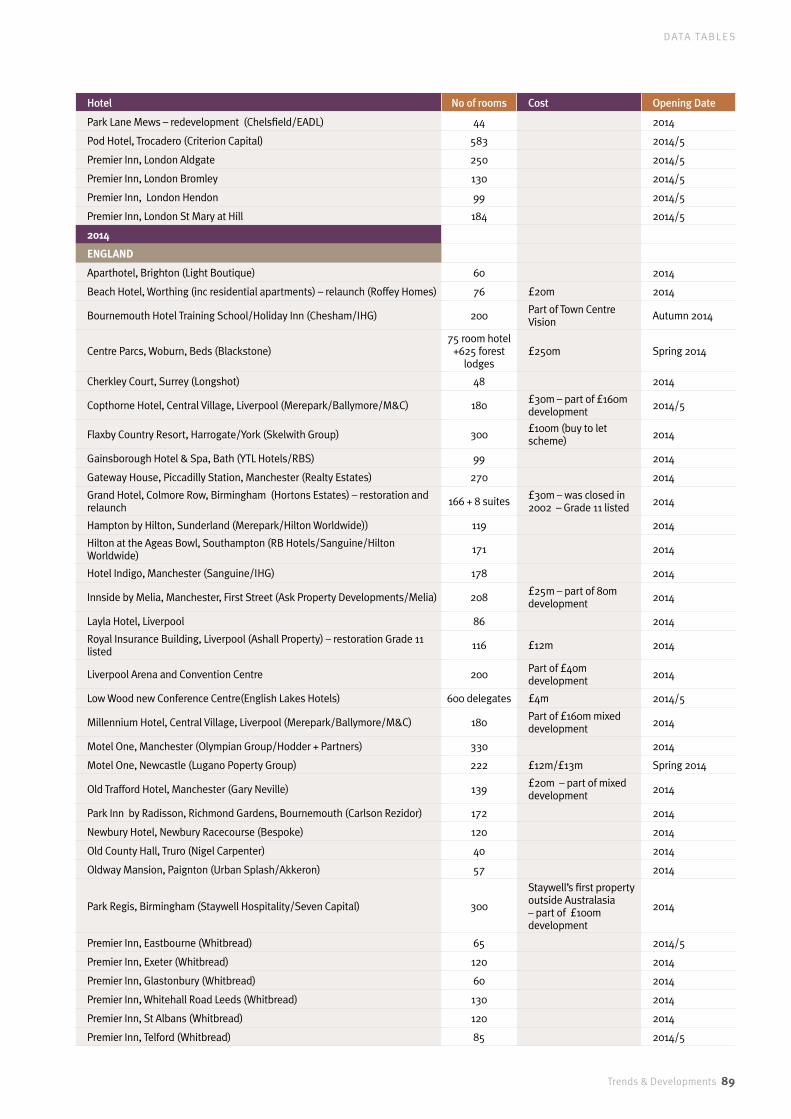
Trends & Developments 89
DATA TA B L E S
Hotel No of rooms Cost Opening Date
Park Lane Mews – redevelopment (Chelsfield/EADL) 44 2014
Pod Hotel, Trocadero (Criterion Capital) 583 2014/5
Premier Inn, London Aldgate 250 2014/5
Premier Inn, London Bromley 130 2014/5
Premier Inn, London Hendon 99 2014/5
Premier Inn, London St Mary at Hill 184 2014/5
2014
ENGLAND
Aparthotel, Brighton (Light Boutique) 60 2014
Beach Hotel, Worthing (inc residential apartments) – relaunch (Roffey Homes) 76 £20m 2014
Bournemouth Hotel Training School/Holiday Inn (Chesham/IHG) 200 Part of Town Centre Vision Autumn 2014
Centre Parcs, Woburn, Beds (Blackstone)75 room hotel
+625 forest lodges
£250m Spring 2014
Cherkley Court, Surrey (Longshot) 48 2014
Copthorne Hotel, Central Village, Liverpool (Merepark/Ballymore/M&C) 180 £30m – part of £160m development 2014/5
Flaxby Country Resort, Harrogate/York (Skelwith Group) 300 £100m (buy to let scheme) 2014
Gainsborough Hotel & Spa, Bath (YTL Hotels/RBS) 99 2014
Gateway House, Piccadilly Station, Manchester (Realty Estates) 270 2014
Grand Hotel, Colmore Row, Birmingham (Hortons Estates) – restoration and relaunch 166 + 8 suites £30m – was closed in
2002 – Grade 11 listed 2014
Hampton by Hilton, Sunderland (Merepark/Hilton Worldwide)) 119 2014
Hilton at the Ageas Bowl, Southampton (RB Hotels/Sanguine/Hilton Worldwide) 171 2014
Hotel Indigo, Manchester (Sanguine/IHG) 178 2014
Innside by Melia, Manchester, First Street (Ask Property Developments/Melia) 208 £25m – part of 80m development 2014
Layla Hotel, Liverpool 86 2014
Royal Insurance Building, Liverpool (Ashall Property) – restoration Grade 11 listed 116 £12m 2014
Liverpool Arena and Convention Centre 200 Part of £40m development 2014
Low Wood new Conference Centre(English Lakes Hotels) 600 delegates £4m 2014/5
Millennium Hotel, Central Village, Liverpool (Merepark/Ballymore/M&C) 180 Part of £160m mixed development 2014
Motel One, Manchester (Olympian Group/Hodder + Partners) 330 2014
Motel One, Newcastle (Lugano Poperty Group) 222 £12m/£13m Spring 2014
Old Trafford Hotel, Manchester (Gary Neville) 139 £20m – part of mixed development 2014
Park Inn by Radisson, Richmond Gardens, Bournemouth (Carlson Rezidor) 172 2014
Newbury Hotel, Newbury Racecourse (Bespoke) 120 2014
Old County Hall, Truro (Nigel Carpenter) 40 2014
Oldway Mansion, Paignton (Urban Splash/Akkeron) 57 2014
Park Regis, Birmingham (Staywell Hospitality/Seven Capital) 300
Staywell’s first property outside Australasia – part of £100m development
2014
Premier Inn, Eastbourne (Whitbread) 65 2014/5
Premier Inn, Exeter (Whitbread) 120 2014
Premier Inn, Glastonbury (Whitbread) 60 2014
Premier Inn, Whitehall Road Leeds (Whitbread) 130 2014
Premier Inn, St Albans (Whitbread) 120 2014
Premier Inn, Telford (Whitbread) 85 2014/5
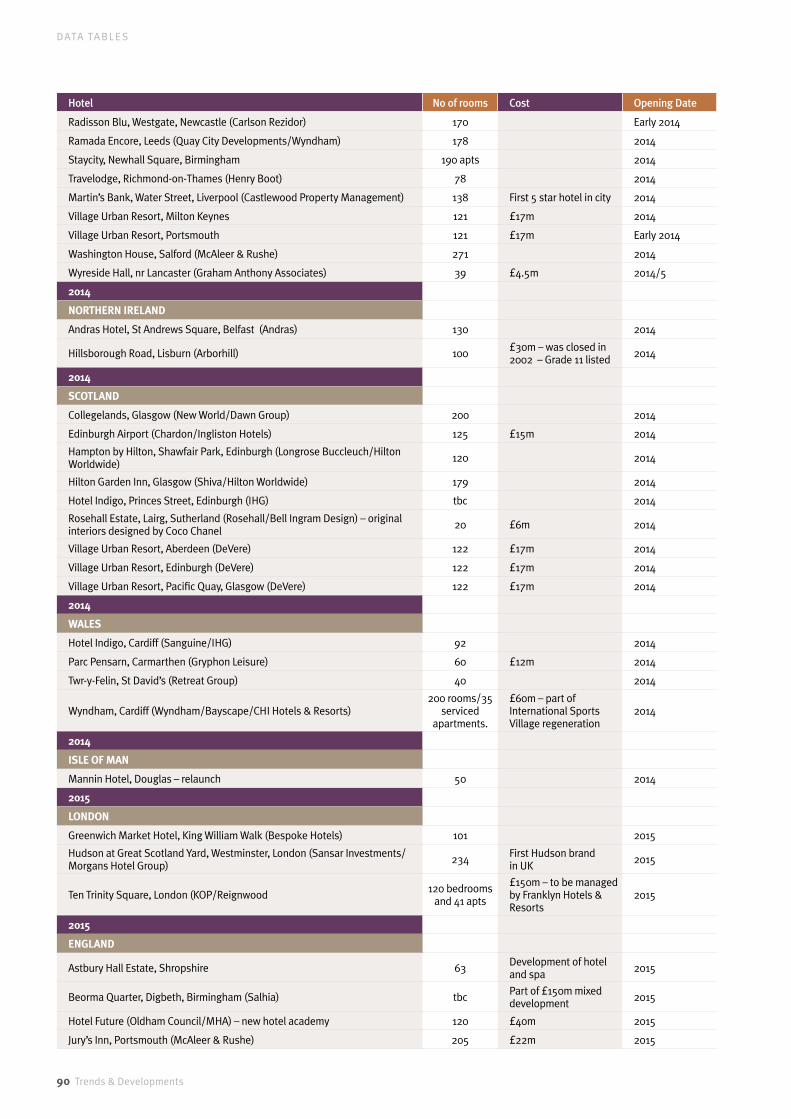
90 Trends & Developments
DATA TA B L E S
Hotel No of rooms Cost Opening Date
Radisson Blu, Westgate, Newcastle (Carlson Rezidor) 170 Early 2014
Ramada Encore, Leeds (Quay City Developments/Wyndham) 178 2014
Staycity, Newhall Square, Birmingham 190 apts 2014
Travelodge, Richmond-on-Thames (Henry Boot) 78 2014
Martin’s Bank, Water Street, Liverpool (Castlewood Property Management) 138 First 5 star hotel in city 2014
Village Urban Resort, Milton Keynes 121 £17m 2014
Village Urban Resort, Portsmouth 121 £17m Early 2014
Washington House, Salford (McAleer & Rushe) 271 2014
Wyreside Hall, nr Lancaster (Graham Anthony Associates) 39 £4.5m 2014/5
2014
NORTHERN IRELAND
Andras Hotel, St Andrews Square, Belfast (Andras) 130 2014
Hillsborough Road, Lisburn (Arborhill) 100 £30m – was closed in 2002 – Grade 11 listed 2014
2014
SCOTLAND
Collegelands, Glasgow (New World/Dawn Group) 200 2014
Edinburgh Airport (Chardon/Ingliston Hotels) 125 £15m 2014
Hampton by Hilton, Shawfair Park, Edinburgh (Longrose Buccleuch/Hilton Worldwide) 120 2014
Hilton Garden Inn, Glasgow (Shiva/Hilton Worldwide) 179 2014
Hotel Indigo, Princes Street, Edinburgh (IHG) tbc 2014
Rosehall Estate, Lairg, Sutherland (Rosehall/Bell Ingram Design) – original interiors designed by Coco Chanel 20 £6m 2014
Village Urban Resort, Aberdeen (DeVere) 122 £17m 2014
Village Urban Resort, Edinburgh (DeVere) 122 £17m 2014
Village Urban Resort, Pacific Quay, Glasgow (DeVere) 122 £17m 2014
2014
WALES
Hotel Indigo, Cardiff (Sanguine/IHG) 92 2014
Parc Pensarn, Carmarthen (Gryphon Leisure) 60 £12m 2014
Twr-y-Felin, St David’s (Retreat Group) 40 2014
Wyndham, Cardiff (Wyndham/Bayscape/CHI Hotels & Resorts)200 rooms/35
serviced apartments.
£60m – part of International Sports Village regeneration
2014
2014
ISLE OF MAN
Mannin Hotel, Douglas – relaunch 50 2014
2015
LONDON
Greenwich Market Hotel, King William Walk (Bespoke Hotels) 101 2015
Hudson at Great Scotland Yard, Westminster, London (Sansar Investments/Morgans Hotel Group) 234 First Hudson brand
in UK 2015
Ten Trinity Square, London (KOP/Reignwood 120 bedrooms and 41 apts
£150m – to be managed by Franklyn Hotels & Resorts
2015
2015
ENGLAND
Astbury Hall Estate, Shropshire 63 Development of hotel and spa 2015
Beorma Quarter, Digbeth, Birmingham (Salhia) tbc Part of £150m mixed development 2015
Hotel Future (Oldham Council/MHA) – new hotel academy 120 £40m 2015
Jury’s Inn, Portsmouth (McAleer & Rushe) 205 £22m 2015

Trends & Developments 91
DATA TA B L E S
Hotel No of rooms Cost Opening Date
Park Regis, Auchinlech House, Birmingham (Seven Capital) 300 Part of £100m development 2015
Resorts World, Birmingham (part of £125m development) 176 Part of £125m development 2015
Royal Ascot Hotel, Ascot (Arora) 200 2015
2015
NORTHERN IRELAND
McGinnis Group, Waterside, Londonderry 100 £11m 2015
2015
SCOTLAND
Edinburgh Airport, Almond Avenue (NLP/Theakston Estates)) 150/200 2015
Wyndham Grand, The Angus, Dundee (next to Forbes of Kingennie resort) (MAP/Wyndham) 187 Second Wyndham
brand property in UK 2015
FUTURE PROJECTS
LONDON
Admiralty Arch, The Mall (Prime Investors Capital) 150
Armani Hotel, Knightsbridge (Emaar Properties) 200
Chelsea Barracks/Harrods Hotel (Qatar Holdings)
Courtyard by Marriott Strand East, Stratford (Landprop Holding) 350
Cucumber, Paddington Basin (Reuben Brothers) 90
First Central Park Royal (LDM/L & R Properties)park royal 150
Four Seasons Hotel & Residence, Heron Plaza, Bishopsgate (Heron International)
190 plus120 residences
Second phase of £500m development
Park Plaza, Western Avenue 160 £15m
The Garden at New Covent Garden(CGMA/Vinci St Modwin) 200 Part of mixed development
Tobacco Dock Hotel, Wapping (Al Mubaraken) 242 +63 apts
ENGLAND
Bristol International Airport 251 £20m
Broxbournebury Manor Golf Hotel (GVA Humberts Leisure) 95
The Buxton Crescent, Buxton (Heritage Lottery/Trevor Osborne/Buxton Crescent Hotel & Thermal Spa Company) 79 £32m
Chapter Hotels, Bristol (Swire) – relaunch of- Avon Gorge Hotel 76
Chesterfield – Northern Gateway (Wilson Bowden) 80 £50m mixed development
Far Gosford Street, Coventry 120 Part of £12m redevelopment
Green Park House, Bath (New Liberty Diamond) 190Hilton GA, Wildwood Golf & Country Club, Surrey (Translloyd Developments/Hilton Worldwide) 100
Holiday Inn Express, Arena Central, Birmingham (Centre Island) 210
Ng2, Nottingham (Miller Birch) 184 £25m development
Pleasington Lakes Holiday Village, Blackburn (Castleland) 94 lodges
Portland Crescent Hotel, Leeds (Oxford GB) 246 £31 development
Savernake Club, Wiltshire (was Tottenham House) (Buena Vista Hospitality) 293
Seacroft Holiday Village, Norfolk (Richardson Group) 260 Part of £20m development
Silverstone Race Circuit, Northamptonshire 3 hotels Planning permission agreed
Sleeperz, Birmingham 90
Sleeperz, Liverpool 90
Worsley New Hall, Manchester (Peel/Allies and Morrison)
SCOTLAND
Scottish Life Building Edinburgh (Royal London) 103
Scottish Provident Building, St Andrews Square (Peveril Securities) tbc £120m
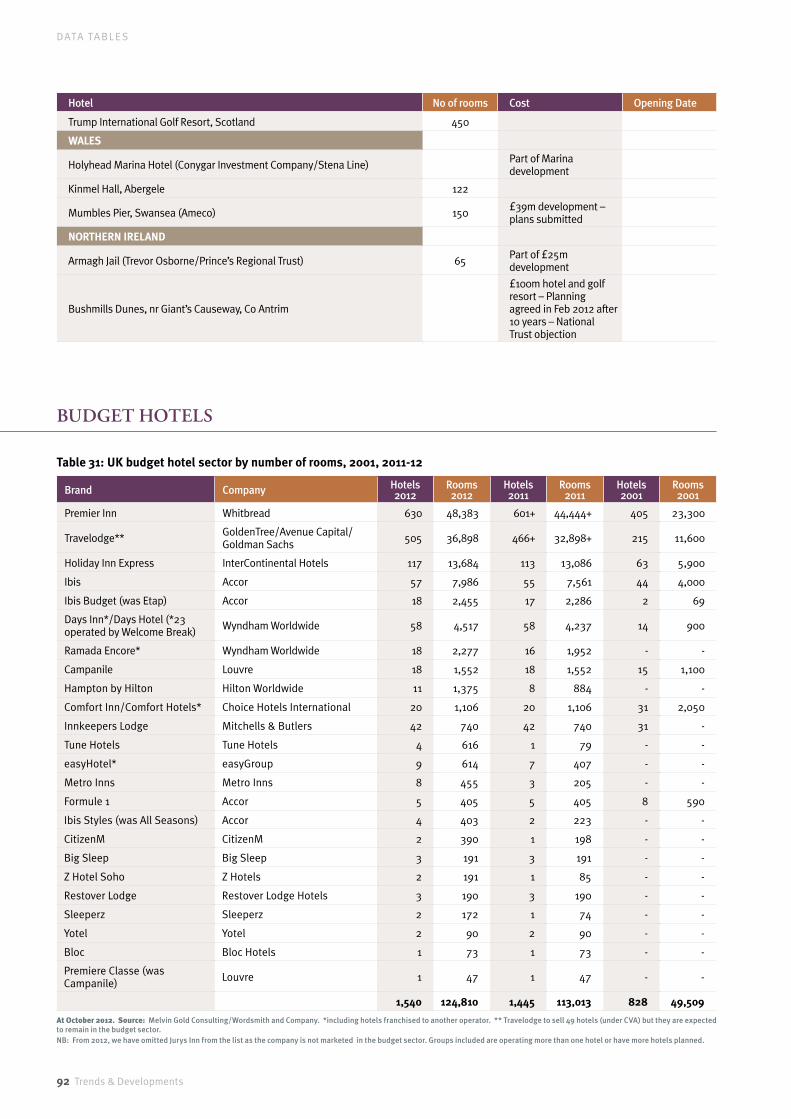
92 Trends & Developments
DATA TA B L E S
Hotel No of rooms Cost Opening Date
Trump International Golf Resort, Scotland 450
WALES
Holyhead Marina Hotel (Conygar Investment Company/Stena Line) Part of Marina development
Kinmel Hall, Abergele 122
Mumbles Pier, Swansea (Ameco) 150 £39m development – plans submitted
NORTHERN IRELAND
Armagh Jail (Trevor Osborne/Prince’s Regional Trust) 65 Part of £25m development
Bushmills Dunes, nr Giant’s Causeway, Co Antrim
£100m hotel and golf resort – Planning agreed in Feb 2012 after 10 years – National Trust objection
Table 31: UK budget hotel sector by number of rooms, 2001, 2011-12
Brand Company Hotels2012
Rooms 2012
Hotels 2011
Rooms 2011
Hotels 2001
Rooms 2001
Premier Inn Whitbread 630 48,383 601+ 44,444+ 405 23,300
Travelodge** GoldenTree/Avenue Capital/Goldman Sachs 505 36,898 466+ 32,898+ 215 11,600
Holiday Inn Express InterContinental Hotels 117 13,684 113 13,086 63 5,900
Ibis Accor 57 7,986 55 7,561 44 4,000
Ibis Budget (was Etap) Accor 18 2,455 17 2,286 2 69
Days Inn*/Days Hotel (*23 operated by Welcome Break) Wyndham Worldwide 58 4,517 58 4,237 14 900
Ramada Encore* Wyndham Worldwide 18 2,277 16 1,952 - -
Campanile Louvre 18 1,552 18 1,552 15 1,100
Hampton by Hilton Hilton Worldwide 11 1,375 8 884 - -
Comfort Inn/Comfort Hotels* Choice Hotels International 20 1,106 20 1,106 31 2,050
Innkeepers Lodge Mitchells & Butlers 42 740 42 740 31 -
Tune Hotels Tune Hotels 4 616 1 79 - -
easyHotel* easyGroup 9 614 7 407 - -
Metro Inns Metro Inns 8 455 3 205 - -
Formule 1 Accor 5 405 5 405 8 590
Ibis Styles (was All Seasons) Accor 4 403 2 223 - -
CitizenM CitizenM 2 390 1 198 - -
Big Sleep Big Sleep 3 191 3 191 - -
Z Hotel Soho Z Hotels 2 191 1 85 - -
Restover Lodge Restover Lodge Hotels 3 190 3 190 - -
Sleeperz Sleeperz 2 172 1 74 - -
Yotel Yotel 2 90 2 90 - -
Bloc Bloc Hotels 1 73 1 73 - -
Premiere Classe (was Campanile) Louvre 1 47 1 47 - -
1,540 124,810 1,445 113,013 828 49,509
At October 2012. Source: Melvin Gold Consulting/Wordsmith and Company. *including hotels franchised to another operator. ** Travelodge to sell 49 hotels (under CVA) but they are expected to remain in the budget sector.NB: From 2012, we have omitted Jurys Inn from the list as the company is not marketed in the budget sector. Groups included are operating more than one hotel or have more hotels planned.
BUdGET HOTELs

Trends & Developments 93
DATA TA B L E S
Table 33: Insolvencies in UK hotel industry, 2008-2012
Table 35: Insolvencies in UK bars, 2008-2012 Table 36: Insolvencies in other UK hospitality companies, 2008-2012
insOLvEnciEs
2008 TOTAL
2009 TOTAL
2010 TOTAL
2011 TOTAL
2012 Q1
2012 Q2
Compulsory liquidation 40 32 24 27 5 4
Creditors’ voluntary liquidations 46 66 60 78 19 34
Trading related bankruptcies 49 55 82 71 17 17
Receivership 5 18 21 8 0 3
Administration 26 68 61 80 21 9
Company voluntary arrangements 5 12 13 6 5 3
Compulsory liquidation – Scotland
4 8 9 18 3 3
Creditors’ voluntary liquidation – Scotland
0 0 3 3 2 1
TOTAL 175 259 273 291 72 74
Source: The Insolvency Service
2008 TOTAL
2009 TOTAL
2010 TOTAL
2011 TOTAL
2012 Q1
2012 Q2
Compulsory liquidation 159 147 120 108 27 21
Creditors’ voluntary liquidations 163 214 252 258 74 79
Trading related bankruptcies 657 543 587 792 185- 176
Receivership 7 11 19 7 6 1
Administration 44 48 42 49 9 7
Company voluntary arrangements 23 16 20 21 4 5
Compulsory liquidation – Scotland
10 7 26 35 9 16
Creditors’ voluntary liquidation – Scotland
1 1 10 4 2 1
TOTAL 1.064 987 1,076 1,274 416 306
Source: The Insolvency Service
2008 TOTAL
2009 TOTAL
2010 TOTAL
2011 TOTAL
2012 Q1
2012 Q2
Compulsory liquidation 130 124 88 99 24 17
Creditors’ voluntary liquidations 329 414 407 497 146 129
Trading related bankruptcies 174 233 206 237 66 56
Receivership 5 13 4 7 6 1
Administration 108 110 56 56 9 12
Company voluntary arrangements 18 20 27 22 3 4
Compulsory liquidation – Scotland
13 15 39 47 25 21
Creditors’ voluntary liquidation – Scotland
0 3 8 12 8 1
TOTAL 777 932 835 977 287 241
Source: The Insolvency Service
2008 TOTAL
2009 TOTAL
2010 TOTAL
2011 TOTAL
2012 Q1
2012 Q2
Compulsory liquidation 21 29 21 15 7 9
Creditors’ voluntary liquidations 73 89 91 107 28 26
Trading related bankruptcies 110 105 107 130 35 40
Receivership 3 5 2 5 1 0
Administration 14 14 17 13 3 3
Company voluntary arrangements 4 5 1 2 0 6
Compulsory liquidation – Scotland
5 4 10 12 1 7
Creditors’ voluntary liquidation – Scotland
0 0 7 2 3 1
TOTAL 230 251 256 286 88 92
Source: The Insolvency Service
Table 34: Insolvencies in UK restaurant industry, 2008-2012
Table 32: Total insolvencies in UK hospitality industry, 2008-2012
2008 TOTAL 2009 TOTAL 2010 TOTAL 2011 TOTAL 2012 Q1 2012 Q2
Compulsory liquidation 350 332 253 249 63 51
Creditors’ voluntary liquidations 611 783 810 940 267 268
Trading related bankruptcies 990 936 982 1,230 292 289
Receivership 20 47 46 27 13 5
Administration 192 240 176 198 42 31
Company voluntary arrangements 50 53 61 51 12 18
Compulsory liquidation – Scotland 32 34 84 112 38 47
Creditors’ voluntary liquidation – Scotland 1 4 28 22 15 4
TOTAL 2,246 2,429 2,440 2,820 742 713Source: The Insolvency Service
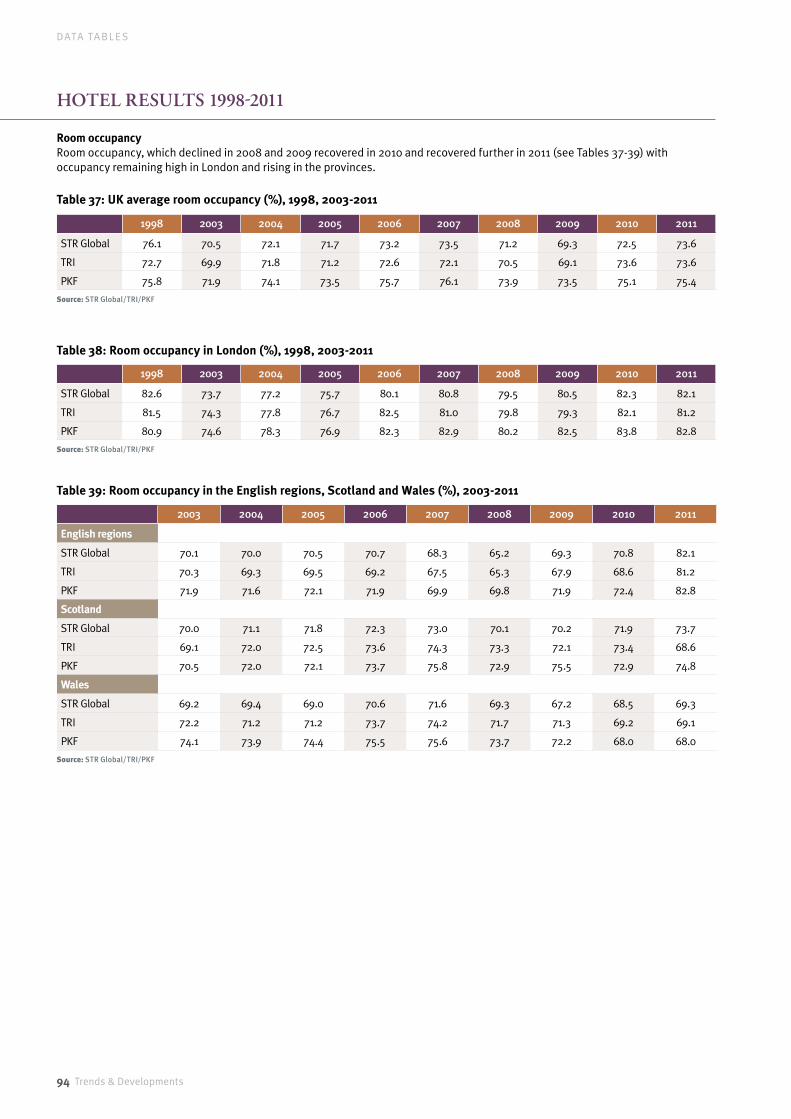
94 Trends & Developments
DATA TA B L E S
Table 37: UK average room occupancy (%), 1998, 2003-2011
1998 2003 2004 2005 2006 2007 2008 2009 2010 2011
STR Global 76.1 70.5 72.1 71.7 73.2 73.5 71.2 69.3 72.5 73.6
TRI 72.7 69.9 71.8 71.2 72.6 72.1 70.5 69.1 73.6 73.6
PKF 75.8 71.9 74.1 73.5 75.7 76.1 73.9 73.5 75.1 75.4
Source: STR Global/TRI/PKF
HOTEL REsULTs 1998-2011
Room occupancyRoom occupancy, which declined in 2008 and 2009 recovered in 2010 and recovered further in 2011 (see Tables 37-39) with occupancy remaining high in London and rising in the provinces.
Table 38: Room occupancy in London (%), 1998, 2003-2011
Table 39: Room occupancy in the English regions, Scotland and Wales (%), 2003-2011
1998 2003 2004 2005 2006 2007 2008 2009 2010 2011
STR Global 82.6 73.7 77.2 75.7 80.1 80.8 79.5 80.5 82.3 82.1
TRI 81.5 74.3 77.8 76.7 82.5 81.0 79.8 79.3 82.1 81.2
PKF 80.9 74.6 78.3 76.9 82.3 82.9 80.2 82.5 83.8 82.8
Source: STR Global/TRI/PKF
2003 2004 2005 2006 2007 2008 2009 2010 2011
English regions
STR Global 70.1 70.0 70.5 70.7 68.3 65.2 69.3 70.8 82.1
TRI 70.3 69.3 69.5 69.2 67.5 65.3 67.9 68.6 81.2
PKF 71.9 71.6 72.1 71.9 69.9 69.8 71.9 72.4 82.8
Scotland
STR Global 70.0 71.1 71.8 72.3 73.0 70.1 70.2 71.9 73.7
TRI 69.1 72.0 72.5 73.6 74.3 73.3 72.1 73.4 68.6
PKF 70.5 72.0 72.1 73.7 75.8 72.9 75.5 72.9 74.8
Wales
STR Global 69.2 69.4 69.0 70.6 71.6 69.3 67.2 68.5 69.3
TRI 72.2 71.2 71.2 73.7 74.2 71.7 71.3 69.2 69.1
PKF 74.1 73.9 74.4 75.5 75.6 73.7 72.2 68.0 68.0
Source: STR Global/TRI/PKF
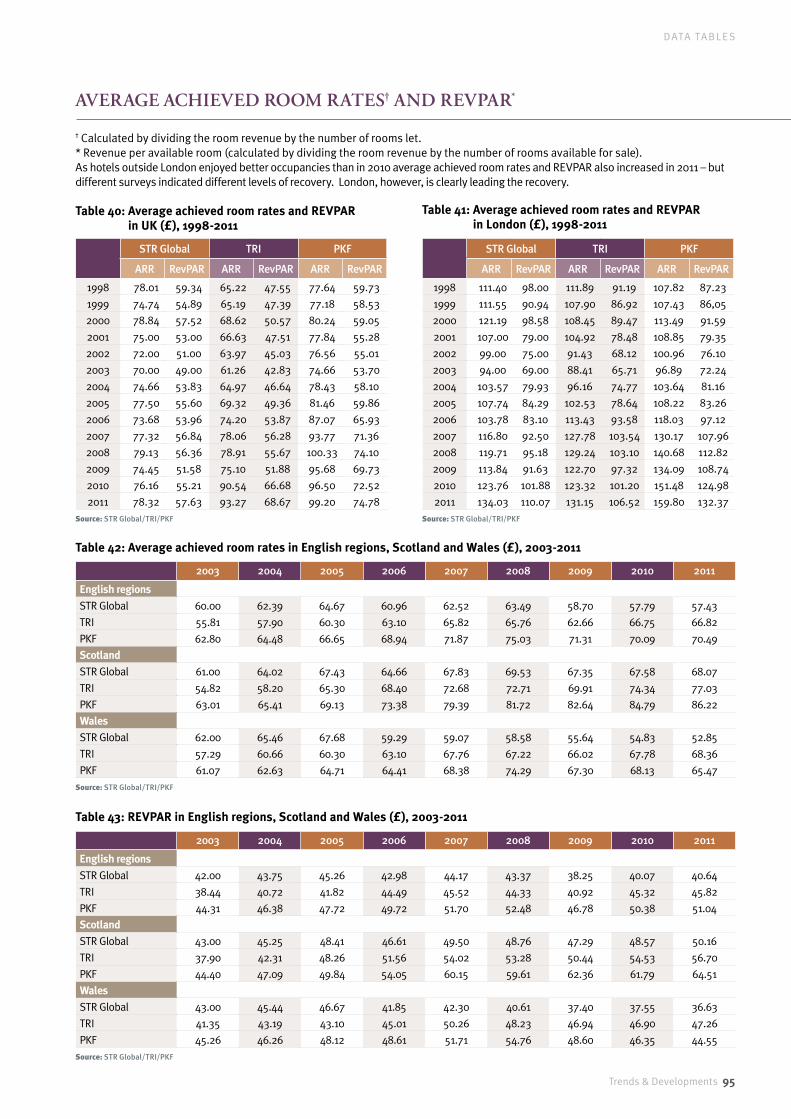
Trends & Developments 95
DATA TA B L E S
Table 40: Average achieved room rates and REVPAR in UK (£), 1998-2011
AvERAGE AcHiEvEd ROOm RATEs† And REvPAR*
† Calculated by dividing the room revenue by the number of rooms let.* Revenue per available room (calculated by dividing the room revenue by the number of rooms available for sale).As hotels outside London enjoyed better occupancies than in 2010 average achieved room rates and REVPAR also increased in 2011 – but different surveys indicated different levels of recovery. London, however, is clearly leading the recovery.
STR Global TRI PKF
ARR RevPAR ARR RevPAR ARR RevPAR
1998 78.01 59.34 65.22 47.55 77.64 59.73
1999 74.74 54.89 65.19 47.39 77.18 58.53
2000 78.84 57.52 68.62 50.57 80.24 59.05
2001 75.00 53.00 66.63 47.51 77.84 55.28
2002 72.00 51.00 63.97 45.03 76.56 55.01
2003 70.00 49.00 61.26 42.83 74.66 53.70
2004 74.66 53.83 64.97 46.64 78.43 58.10
2005 77.50 55.60 69.32 49.36 81.46 59.86
2006 73.68 53.96 74.20 53.87 87.07 65.93
2007 77.32 56.84 78.06 56.28 93.77 71.36
2008 79.13 56.36 78.91 55.67 100.33 74.10
2009 74.45 51.58 75.10 51.88 95.68 69.73
2010 76.16 55.21 90.54 66.68 96.50 72.52
2011 78.32 57.63 93.27 68.67 99.20 74.78Source: STR Global/TRI/PKF
Table 41: Average achieved room rates and REVPAR in London (£), 1998-2011
STR Global TRI PKF
ARR RevPAR ARR RevPAR ARR RevPAR
1998 111.40 98.00 111.89 91.19 107.82 87.23
1999 111.55 90.94 107.90 86.92 107.43 86,05
2000 121.19 98.58 108.45 89.47 113.49 91.59
2001 107.00 79.00 104.92 78.48 108.85 79.35
2002 99.00 75.00 91.43 68.12 100.96 76.10
2003 94.00 69.00 88.41 65.71 96.89 72.24
2004 103.57 79.93 96.16 74.77 103.64 81.16
2005 107.74 84.29 102.53 78.64 108.22 83.26
2006 103.78 83.10 113.43 93.58 118.03 97.12
2007 116.80 92.50 127.78 103.54 130.17 107.96
2008 119.71 95.18 129.24 103.10 140.68 112.82
2009 113.84 91.63 122.70 97.32 134.09 108.74
2010 123.76 101.88 123.32 101.20 151.48 124.98
2011 134.03 110.07 131.15 106.52 159.80 132.37Source: STR Global/TRI/PKF
Table 42: Average achieved room rates in English regions, Scotland and Wales (£), 2003-2011
Table 43: REVPAR in English regions, Scotland and Wales (£), 2003-2011
2003 2004 2005 2006 2007 2008 2009 2010 2011
English regions
STR Global 60.00 62.39 64.67 60.96 62.52 63.49 58.70 57.79 57.43
TRI 55.81 57.90 60.30 63.10 65.82 65.76 62.66 66.75 66.82
PKF 62.80 64.48 66.65 68.94 71.87 75.03 71.31 70.09 70.49
Scotland
STR Global 61.00 64.02 67.43 64.66 67.83 69.53 67.35 67.58 68.07
TRI 54.82 58.20 65.30 68.40 72.68 72.71 69.91 74.34 77.03
PKF 63.01 65.41 69.13 73.38 79.39 81.72 82.64 84.79 86.22
Wales
STR Global 62.00 65.46 67.68 59.29 59.07 58.58 55.64 54.83 52.85
TRI 57.29 60.66 60.30 63.10 67.76 67.22 66.02 67.78 68.36
PKF 61.07 62.63 64.71 64.41 68.38 74.29 67.30 68.13 65.47Source: STR Global/TRI/PKF
2003 2004 2005 2006 2007 2008 2009 2010 2011
English regions
STR Global 42.00 43.75 45.26 42.98 44.17 43.37 38.25 40.07 40.64
TRI 38.44 40.72 41.82 44.49 45.52 44.33 40.92 45.32 45.82
PKF 44.31 46.38 47.72 49.72 51.70 52.48 46.78 50.38 51.04
Scotland
STR Global 43.00 45.25 48.41 46.61 49.50 48.76 47.29 48.57 50.16
TRI 37.90 42.31 48.26 51.56 54.02 53.28 50.44 54.53 56.70
PKF 44.40 47.09 49.84 54.05 60.15 59.61 62.36 61.79 64.51
Wales
STR Global 43.00 45.44 46.67 41.85 42.30 40.61 37.40 37.55 36.63
TRI 41.35 43.19 43.10 45.01 50.26 48.23 46.94 46.90 47.26
PKF 45.26 46.26 48.12 48.61 51.71 54.76 48.60 46.35 44.55Source: STR Global/TRI/PKF

96 Trends & Developments
DATA TA B L E S
Table 44: Total revenue per available room UK (£), 2003-2011
TOTAL REvEnUE PER AvAiLABLE ROOm
Since 2003, total revenue per available room has climbed consistently in London except for 2009 – after which revenues returned to pre-recession levels. Regional England, however, has shown little growth over the same period and traded down in 2011 compared with 2010; it is still trading at 2004/5 levels. Trading in Wales fell back in 2011 but revenues in Scotland have shown longer-term growth.
2003 2004 2005 2006 2007 2008 2009 2010 2011
TRI
UK 27,950 30,000 30,770 34,457 34,125 33,788 31,112 32,587 32,425
London 28,190 32,920 33,310 42,318 44,023 44,082 41,135 45,048 47,655
Regional England 27,830 29,320 29,790 32,957 32,477 31,390 28,807 30,163 29.898
Scotland 27,640 30,520 32,950 35,738 36,304 34,855 32,434 34,045 34.049
Wales 29,970 30,300 30,600 39,898 37,364 35,209 30,580 31,879 29,579
PKF
UK 33,710 36,705 37,755 38,621 44,397 46,130 42,368 43,263 43,601
London 38,370 44,286 45,597 49,756 60,343 63,970 59,598 63,363 66.395
Regional England 31,520 32,822 33,451 32,496 37,492 38,492 35.365 34,269 33,676
Scotland 31,850 36,557 38,579 39,656 43,466 42,680 42,219 42,520 43,422
Wales 32,700 30,835 31,817 33.489 38,226 39,461 37,731 31,580 30,153
Source: STR Global/TRI/PKF
2003 2004 2005 2006 2007 2008 2009 2010 2011
STR Global 49.1 51.4 52.0 54.3 59.2 61.0 61.4 63.5 64.5
TRI 53.8 55.3 56.6 57.3 54.1 58.1 59.7 61.3 62.;1
PKF 55.5 56.9 57.5 58.0 57.6 58.6 58.8 61.2 62.6
Source: STR Global/TRI/PKF
Table 45: Room revenue as a percentage of total revenue UK (%), 2003-2011
ROOm REvEnUE As A PERcEnTAGE OF TOTAL REvEnUE
As a percentage of total revenue, room revenue in the UK increased in London and in all three countries in 2011.
2003 2004 2005 2006 2007 2008 2009 2010 2011
STR Global 64.8 63.7 63.7 65.6 65.2 67.3 68.5 71.9 72.4
TRI 68.5 70.8 72.9 73.3 73.8 72.5 69.3 71.7 73.3
PKF 65.0 65.2 65.3 66.0 67.3 68.1 69.7 72.0 72.8
Source: STR Global/TRI/PKF
Table 47: Room revenue as a percentage of total revenue – English regions, Scotland and Wales (%), 2003-2011
Table 46: Room revenue as a percentage of total revenue London (%), 2003-2011
2003 2004 2005 2006 2007 2008 2009 2010 2011
English regions
STR Global 49.5 52.0 52.7 54.9 54.4 57.1 56.7 58.2 59.1
TRI 51.0 52.3 53.1 53.6 53.8 54.9 51.7 51.2 51.8
PKF 51.0 52.6 53.6 53.0 52.0 52.5 51.4 53.7 55.3
Scotland
STR Global 48.3 48.9 49.6 53.3 54.9 52.9 54.1 57.2 58.6
TRI 52.1 54.2 54.3 56.1 55.5 56.1 55.2 56.9 57.3
PKF 49.5 50.1 50.6 51.4 52.5 53.5 53.9 53.0 54.2
Wales
STR Global 45.7 46.4 46.3 47.0 46.6 n/a* n/a* 55.7 55.3
TRI 50.6 48.3 50.5 50.8 50.2 50.3 47.4 47.7 40.7
PKF 45.5 48.1 48.8 49.2 46.4 47.7 47.0 53.6 53.9Source: STR Global/TRI/PKF

Trends & Developments 97
DATA TA B L E S
Table 48: Food revenue as a percentage of total revenue UK and London (%), 2003-2011
FOOd REvEnUE
Hotels in London are much less dependent on food revenue (Table48) and beverage revenue (Table50) than hotels in other parts of the UK where food and beverage as a percentage of total revenue continues to represent over 30 per cent of total revenue and remains an important income stream (though one with high costs).
2003 2004 2005 2006 2007 2008 2009 2010 2011
UKSTR Global 23.0 22.3 22.3 19.3 17.7 18.2 19.4 18.3 17.4TRI 23.6 22.8 21.7 21.2 21.8 20.9 18.7 18.1 17.8PKF 25.5 24.5 23.9 24.3 24.5 24.5 23.0 22.8 22.2
LONDONSTR Global 15.8 16.6 16.2 15.1 15.4 14.5 13.9 13.1 12.9TRI 16.1 14.4 13.9 13.6 12.8 13.5 14.4 13.5 12.7PKF 20.7 20.6 19.7 20.4 20.0 19.7 19.0 17.7 17.1
Source: STR Global/TRI/PKF
Table 49: Food revenue as a percentage of total revenue English regions, Scotland and Wales (%), 2003-2011
BEvERAGE REvEnUE
2003 2004 2005 2006 2007 2008 2009 2010 2011
English regionsSTR Global 22.7 22.1 22.0 19.1 19.9 20.7 21.6 21.8 20.6TRI 24.7 24.0 23.3 22.7 22.2 22.1 22.3 22.4 22.3PKF 28.0 26.5 26.3 27.0 27.4 27.7 27.5 26.6 26.5ScotlandSTR Global 24.4 23.8 23.5 20.4 19.9 21.7 21.8 21.9 20.6TRI 24.8 23.1 22.8 22.3 21.9 21.8 21.5 20.8 20.2PKF 27.8 27.6 27.3 26.3 25.9 26.5 25.9 25.1 24.1WalesSTR Global 23.9 23.1 23.5 20.3 21.6 n/a* n/a* 21.6 21.5TRI 24.4 24.8 24.3 23.8 23.8 23.3 22.8 22.8 24.2PKF 28.0 27.6 27.2 27.5 28.1 28.9 27.9 25.5 25.7
Source: STR Global/TRI/PKF
Table 50: Beverage revenue as a percentage of total revenue UK and London (%), 2003-2011
2003 2004 2005 2006 2007 2008 2009 2010 2011
UKSTR Global 11.6 11.0 10.6 9.3 8.5 8.3 8.2 7.9 8.1TRI 10.7 10.4 9.7 9.4 10.1 6.6 8.7 8.5 8.4PKF 10.0 9.6 9.2 9.5 9.5 8.8 8.7 8.3 8.3
LONDONSTR Global 8.0 8.3 8.2 7.8 7.9 7.4 7.5 7.1 7.1TRI 5.8 5.7 5.1 5.0 4.9 5.0 6.8 6.3 5.9PKF 7.8 7.7 7.4 7.3 7.9 7.4 6.8 6.1 6.2
Source: STR Global/TRI/PKF
Table 51: Beverage revenue as a percentage of total revenue English regions, Scotland and Wales (%), 2003-2011
2003 2004 2005 2006 2007 2008 2009 2010 2011
English regionsSTR Global 11.2 10.6 10.3 9.0 9.5 8.3 8.6 7.9 8.3TRI 11.5 11.0 10.5 10.4 10.0 9.1 10.1 10.4 10.6PKF 10.9 10.4 9.9 10.2 10.1 9.5 10.1 9.5 9.7ScotlandSTR Global 12.9 12.6 12.1 10.4 10.3 10.9 10.8 9.9 9.9TRI 12.5 12.1 11.2 10.4 10.2 10.2 10.6 10.3 9.9PKF 12.0 11.7 11.2 11.4 11.1 10.6 11.0 11.1 10.7WalesSTR Global 12.7 12.5 12.4 10.3 10.6 n/a* n/a* 9.7 9.9TRI 12.5 11.9 11.6 11.5 11.0 10.7 11.5 11.5 12.3PKF 12.8 12.0 12.3 11.6 11.7 10.5 10.6 9.9 10.4
Source: STR Global/TRI/PKF
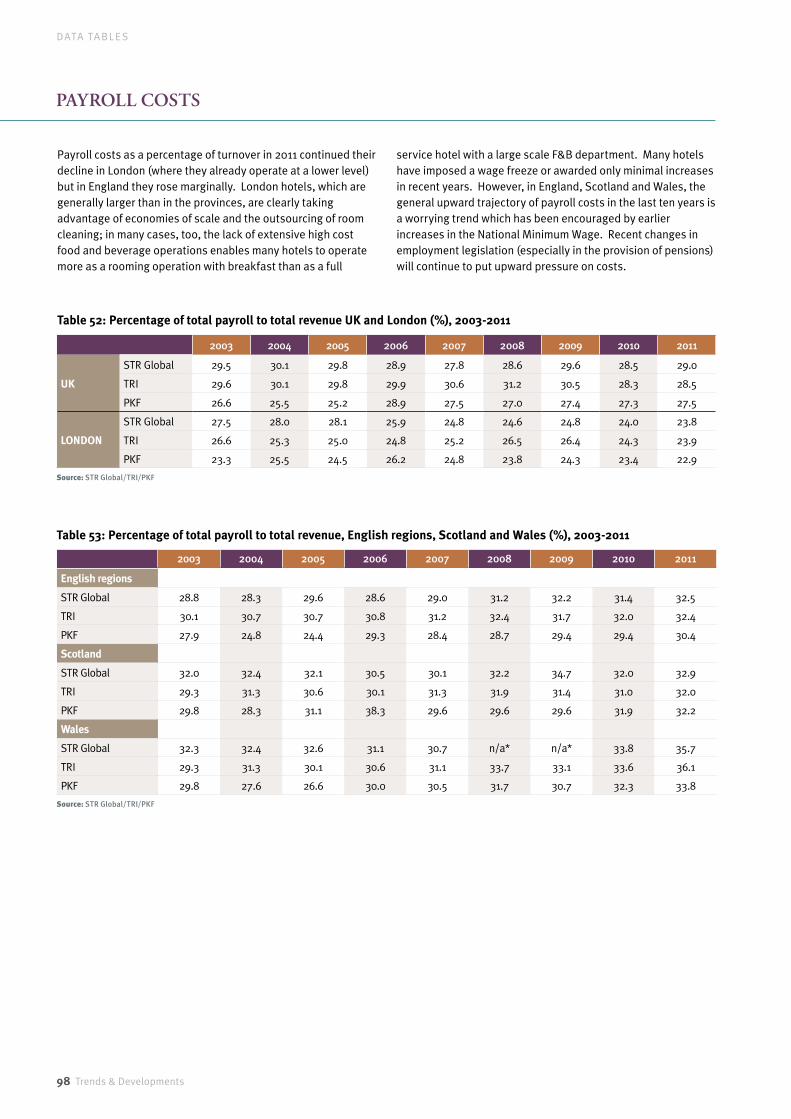
98 Trends & Developments
DATA TA B L E S
PAYROLL cOsTs
Payroll costs as a percentage of turnover in 2011 continued their decline in London (where they already operate at a lower level) but in England they rose marginally. London hotels, which are generally larger than in the provinces, are clearly taking advantage of economies of scale and the outsourcing of room cleaning; in many cases, too, the lack of extensive high cost food and beverage operations enables many hotels to operate more as a rooming operation with breakfast than as a full
service hotel with a large scale F&B department. Many hotels have imposed a wage freeze or awarded only minimal increases in recent years. However, in England, Scotland and Wales, the general upward trajectory of payroll costs in the last ten years is a worrying trend which has been encouraged by earlier increases in the National Minimum Wage. Recent changes in employment legislation (especially in the provision of pensions) will continue to put upward pressure on costs.
Table 52: Percentage of total payroll to total revenue UK and London (%), 2003-2011
Table 53: Percentage of total payroll to total revenue, English regions, Scotland and Wales (%), 2003-2011
2003 2004 2005 2006 2007 2008 2009 2010 2011
English regions
STR Global 28.8 28.3 29.6 28.6 29.0 31.2 32.2 31.4 32.5
TRI 30.1 30.7 30.7 30.8 31.2 32.4 31.7 32.0 32.4
PKF 27.9 24.8 24.4 29.3 28.4 28.7 29.4 29.4 30.4
Scotland
STR Global 32.0 32.4 32.1 30.5 30.1 32.2 34.7 32.0 32.9
TRI 29.3 31.3 30.6 30.1 31.3 31.9 31.4 31.0 32.0
PKF 29.8 28.3 31.1 38.3 29.6 29.6 29.6 31.9 32.2
Wales
STR Global 32.3 32.4 32.6 31.1 30.7 n/a* n/a* 33.8 35.7
TRI 29.3 31.3 30.1 30.6 31.1 33.7 33.1 33.6 36.1
PKF 29.8 27.6 26.6 30.0 30.5 31.7 30.7 32.3 33.8
Source: STR Global/TRI/PKF
2003 2004 2005 2006 2007 2008 2009 2010 2011
UK
STR Global 29.5 30.1 29.8 28.9 27.8 28.6 29.6 28.5 29.0
TRI 29.6 30.1 29.8 29.9 30.6 31.2 30.5 28.3 28.5
PKF 26.6 25.5 25.2 28.9 27.5 27.0 27.4 27.3 27.5
LONDON
STR Global 27.5 28.0 28.1 25.9 24.8 24.6 24.8 24.0 23.8
TRI 26.6 25.3 25.0 24.8 25.2 26.5 26.4 24.3 23.9
PKF 23.3 25.5 24.5 26.2 24.8 23.8 24.3 23.4 22.9
Source: STR Global/TRI/PKF

Trends & Developments 99
DATA TA B L E S
Table 54: Gross operating profit per available room UK (£), 2003-2011
Table 55: Percentage of gross operating profit to total revenue UK (%), 2003-2011
GROss OPERATinG PROFiT
Although London powered ahead in 2011 with increases in GOP, higher costs and lower occupancies reduced GOP in England,
Scotland and Wales both in real terms and as a percentage of total revenue.
2003 2004 2005 2006 2007 2008 2009 2010 2011
STR GLOBAL
UK 12,900 12,500 12,510 12,490 18,070 18,133 13,870 15,239 15,579
London 19,010 21,180 21,850 26,910 30,485 34,419 29,825 33,603 35,422
Regional England 12,100 12,090 12,640 12,400 14,780 11,958 9,525 9,464 9,216
Scotland 11,390 12,100 12,660 13,330 15,760 13,943 11,340 11,772 11,362
Wales 12,740 13,130 13,170 11,650 14,630 n/a* n/a* 7,860 6,886
TRI
UK 10,100 10,960 10,953 11,714 11,518 10,982 9,641 10,134 9,764
London 13,160 15,850 15,700 19,360 20,343 19,815 19,553 23,244 24,936
Regional England 9,750 10,180 10,217 10,674 10,514 9,359 8,619 8,554 8,150
Scotland 9,520 10,830 10,862 11,595 12,345 12,720 11,314 10,886 10,379
Wales 11,240 9,890 9,906 13,608 11,787 9,868 9,095 9,021 8,493
PKF
UK 14,560 15,228 15,202 15,642 17,336 17,834 15,452 16,119 15,920
London 18,680 19,683 19,736 22,682 27,627 29,510 26,504 30,105 31,473
Regional England 12,980 13,269 13,399 12,388 13,384 13,206 15,841 10,800 9,824
Scotland 11,710 12,369 12,256 12,975 14,309 14,085 13,889 11,779 11,794
Wales 12,470 11,388 11,189 11,990 11,797 11,247 10,836 8,095 6,411
Source: STR Global/TRI/PKF
2003 2004 2005 2006 2007 2008 2009 2010 2011
STR GLOBAL
UK 37.2 38.2 37.8 37.3 43.6 39.9 37.1 38.3 37.4
London 43.4 44.1 43.8 46.4 46.7 48.9 47.6 48.8 48.5
Regional England 35.2 39.2 38.7 38.0 41.9 34.0 30.8 31.7 29.8
Scotland 33.5 33.1 33.2 34.7 38.4 32.7 29.4 31.4 30.0
Wales 34.3 35.2 33.8 31.7 37.1 n/a* n/a 25.7 23.4
TRI
UK 36.8 37.4 36.5 35.2 33.4 34.0 33.8 38.8 38.3
London 44.2 47.3 45.9 46.2 46.3 44.7 43.1 47.8 48.3
Regional England 36.2 36.0 34.4 33.0 33.7 31.6 31.1 30.5 29.4
Scotland 33.8 35.4 33.8 27.0 34.5 32.0 32.1 32.8 31.1
Wales 35.8 34.1 33.8 31.9 31.5 27.1 27.3 27.0 23.6
PKF
UK 43.2 41.3 40.3 40.5 39.0 38.7 36.5 37.2 36.5
London 48.7 44.4 43.3 45.6 45.8 46.1 44.5 46.8 47.4
Regional England 41.2 40.9 40.1 38.1 35.7 34.3 31.0 31.5 29.2
Scotland 36.8 33.8 31.8 32.7 32.9 33.0 32.9 27.2 27.2
Wales 38.1 37.4 35.2 35.8 30.9 28.5 28.7 25.6 21.3
Source: STR Global/TRI/PKF
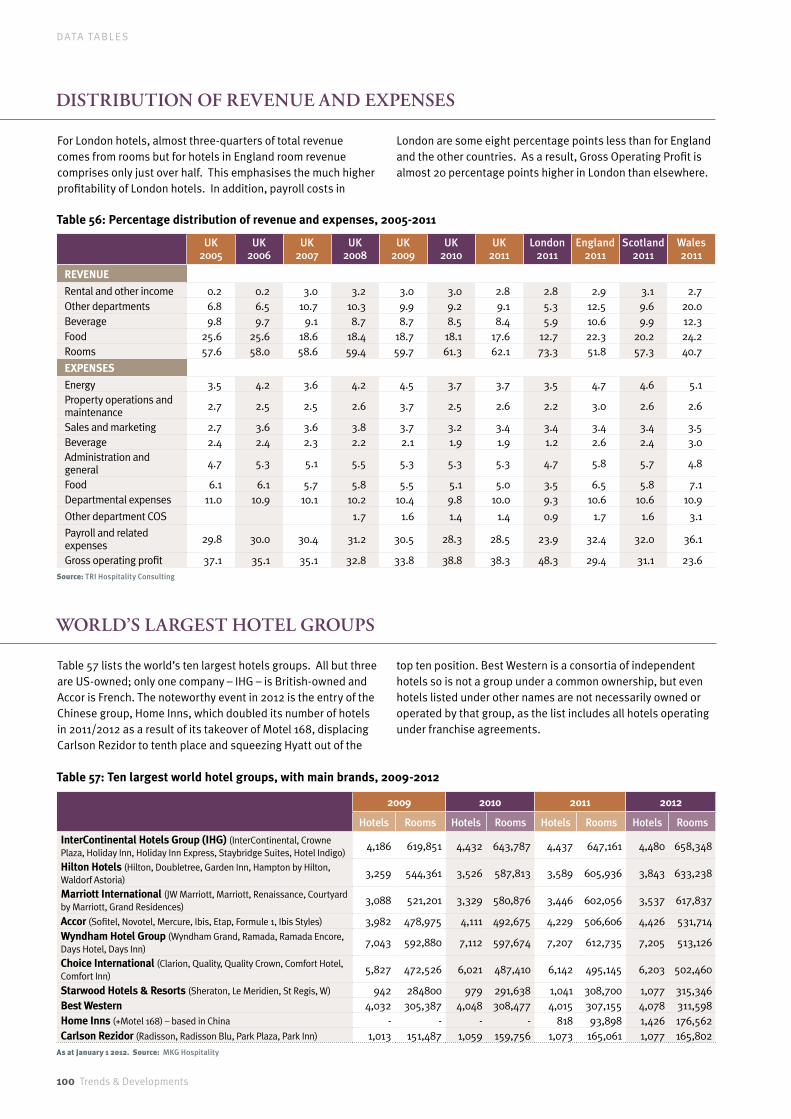
100 Trends & Developments
DATA TA B L E S
Table 56: Percentage distribution of revenue and expenses, 2005-2011
disTRiBUTiOn OF REvEnUE And ExPEnsEs
For London hotels, almost three-quarters of total revenue comes from rooms but for hotels in England room revenue comprises only just over half. This emphasises the much higher profitability of London hotels. In addition, payroll costs in
London are some eight percentage points less than for England and the other countries. As a result, Gross Operating Profit is almost 20 percentage points higher in London than elsewhere.
UK2005
UK2006
UK2007
UK2008
UK2009
UK2010
UK2011
London 2011
England 2011
Scotland 2011
Wales2011
REVENUE
Rental and other income 0.2 0.2 3.0 3.2 3.0 3.0 2.8 2.8 2.9 3.1 2.7Other departments 6.8 6.5 10.7 10.3 9.9 9.2 9.1 5.3 12.5 9.6 20.0Beverage 9.8 9.7 9.1 8.7 8.7 8.5 8.4 5.9 10.6 9.9 12.3Food 25.6 25.6 18.6 18.4 18.7 18.1 17.6 12.7 22.3 20.2 24.2Rooms 57.6 58.0 58.6 59.4 59.7 61.3 62.1 73.3 51.8 57.3 40.7
EXPENSES
Energy 3.5 4.2 3.6 4.2 4.5 3.7 3.7 3.5 4.7 4.6 5.1Property operations and maintenance 2.7 2.5 2.5 2.6 3.7 2.5 2.6 2.2 3.0 2.6 2.6
Sales and marketing 2.7 3.6 3.6 3.8 3.7 3.2 3.4 3.4 3.4 3.4 3.5Beverage 2.4 2.4 2.3 2.2 2.1 1.9 1.9 1.2 2.6 2.4 3.0Administration and general 4.7 5.3 5.1 5.5 5.3 5.3 5.3 4.7 5.8 5.7 4.8
Food 6.1 6.1 5.7 5.8 5.5 5.1 5.0 3.5 6.5 5.8 7.1Departmental expenses 11.0 10.9 10.1 10.2 10.4 9.8 10.0 9.3 10.6 10.6 10.9
Other department COS 1.7 1.6 1.4 1.4 0.9 1.7 1.6 3.1
Payroll and related expenses 29.8 30.0 30.4 31.2 30.5 28.3 28.5 23.9 32.4 32.0 36.1
Gross operating profit 37.1 35.1 35.1 32.8 33.8 38.8 38.3 48.3 29.4 31.1 23.6Source: TRI Hospitality Consulting
Table 57: Ten largest world hotel groups, with main brands, 2009-2012
wORLd’s LARGEsT HOTEL GROUPs
Table 57 lists the world’s ten largest hotels groups. All but three are US-owned; only one company – IHG – is British-owned and Accor is French. The noteworthy event in 2012 is the entry of the Chinese group, Home Inns, which doubled its number of hotels in 2011/2012 as a result of its takeover of Motel 168, displacing Carlson Rezidor to tenth place and squeezing Hyatt out of the
top ten position. Best Western is a consortia of independent hotels so is not a group under a common ownership, but even hotels listed under other names are not necessarily owned or operated by that group, as the list includes all hotels operating under franchise agreements.
2009 2010 2011 2012
Hotels Rooms Hotels Rooms Hotels Rooms Hotels Rooms
InterContinental Hotels Group (IHG) (InterContinental, Crowne Plaza, Holiday Inn, Holiday Inn Express, Staybridge Suites, Hotel Indigo)
4,186 619,851 4,432 643,787 4,437 647,161 4,480 658,348
Hilton Hotels (Hilton, Doubletree, Garden Inn, Hampton by Hilton, Waldorf Astoria)
3,259 544,361 3,526 587,813 3,589 605,936 3,843 633,238
Marriott International (JW Marriott, Marriott, Renaissance, Courtyard by Marriott, Grand Residences)
3,088 521,201 3,329 580,876 3,446 602,056 3,537 617,837
Accor (Sofitel, Novotel, Mercure, Ibis, Etap, Formule 1, Ibis Styles) 3,982 478,975 4,111 492,675 4,229 506,606 4,426 531,714Wyndham Hotel Group (Wyndham Grand, Ramada, Ramada Encore, Days Hotel, Days Inn)
7,043 592,880 7,112 597,674 7,207 612,735 7,205 513,126
Choice International (Clarion, Quality, Quality Crown, Comfort Hotel, Comfort Inn)
5,827 472,526 6,021 487,410 6,142 495,145 6,203 502,460
Starwood Hotels & Resorts (Sheraton, Le Meridien, St Regis, W) 942 284800 979 291,638 1,041 308,700 1,077 315,346Best Western 4,032 305,387 4,048 308,477 4,015 307,155 4,078 311,598Home Inns (+Motel 168) – based in China - - - - 818 93,898 1,426 176,562Carlson Rezidor (Radisson, Radisson Blu, Park Plaza, Park Inn) 1,013 151,487 1,059 159,756 1,073 165,061 1,077 165,802
As at January 1 2012. Source: MKG Hospitality
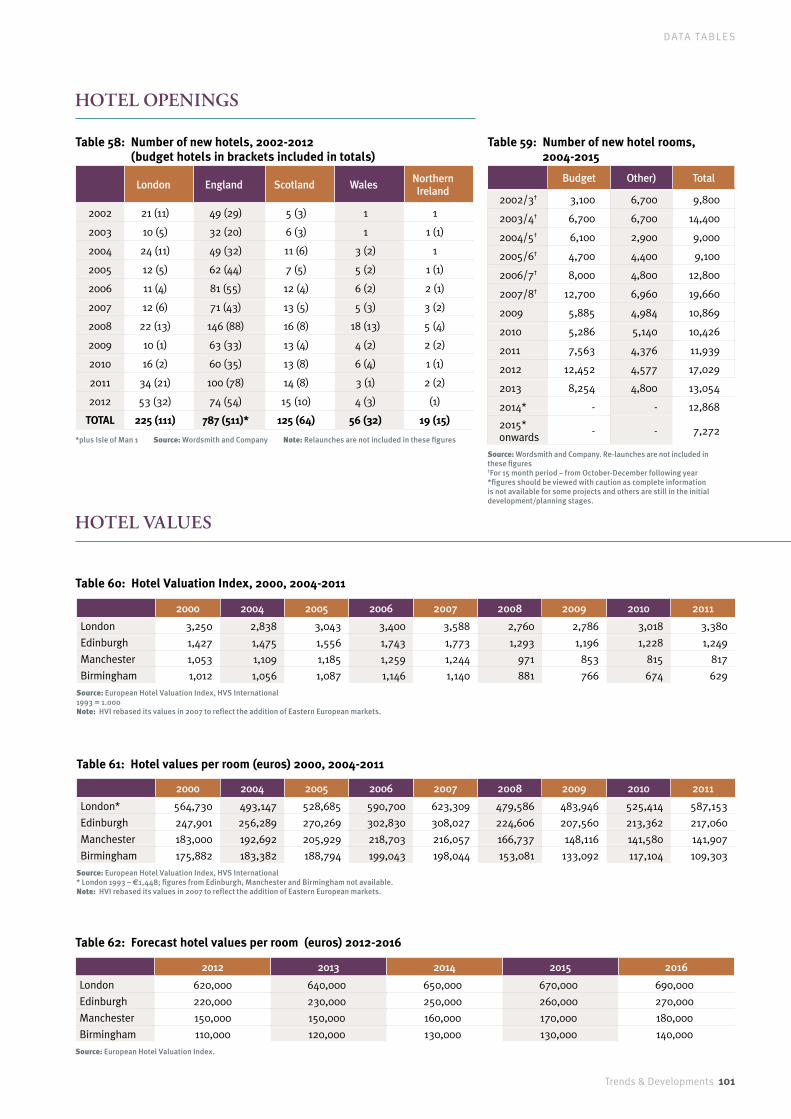
Trends & Developments 101
DATA TA B L E S
HOTEL OPEninGs
Table 58: Number of new hotels, 2002-2012 (budget hotels in brackets included in totals)
Table 59: Number of new hotel rooms, 2004-2015
London England Scotland Wales Northern Ireland
2002 21 (11) 49 (29) 5 (3) 1 1
2003 10 (5) 32 (20) 6 (3) 1 1 (1)
2004 24 (11) 49 (32) 11 (6) 3 (2) 1
2005 12 (5) 62 (44) 7 (5) 5 (2) 1 (1)
2006 11 (4) 81 (55) 12 (4) 6 (2) 2 (1)
2007 12 (6) 71 (43) 13 (5) 5 (3) 3 (2)
2008 22 (13) 146 (88) 16 (8) 18 (13) 5 (4)
2009 10 (1) 63 (33) 13 (4) 4 (2) 2 (2)
2010 16 (2) 60 (35) 13 (8) 6 (4) 1 (1)
2011 34 (21) 100 (78) 14 (8) 3 (1) 2 (2)
2012 53 (32) 74 (54) 15 (10) 4 (3) (1)
TOTAL 225 (111) 787 (511)* 125 (64) 56 (32) 19 (15)
*plus Isle of Man 1 Source: Wordsmith and Company Note: Relaunches are not included in these figures
Budget Other) Total
2002/3† 3,100 6,700 9,800
2003/4† 6,700 6,700 14,400
2004/5† 6,100 2,900 9,000
2005/6† 4,700 4,400 9,100
2006/7† 8,000 4,800 12,800
2007/8† 12,700 6,960 19,660
2009 5,885 4,984 10,869
2010 5,286 5,140 10,426
2011 7,563 4,376 11,939
2012 12,452 4,577 17,029
2013 8,254 4,800 13,054
2014* - - 12,868
2015* onwards - - 7,272
Source: Wordsmith and Company. Re-launches are not included in these figures †For 15 month period – from October-December following year *figures should be viewed with caution as complete information is not available for some projects and others are still in the initial development/planning stages.
Table 60: Hotel Valuation Index, 2000, 2004-2011
2000 2004 2005 2006 2007 2008 2009 2010 2011
London 3,250 2,838 3,043 3,400 3,588 2,760 2,786 3,018 3,380
Edinburgh 1,427 1,475 1,556 1,743 1,773 1,293 1,196 1,228 1,249
Manchester 1,053 1,109 1,185 1,259 1,244 971 853 815 817
Birmingham 1,012 1,056 1,087 1,146 1,140 881 766 674 629
Source: European Hotel Valuation Index, HVS International1993 = 1.000Note: HVI rebased its values in 2007 to reflect the addition of Eastern European markets.
Table 61: Hotel values per room (euros) 2000, 2004-2011
Table 62: Forecast hotel values per room (euros) 2012-2016
2000 2004 2005 2006 2007 2008 2009 2010 2011
London* 564,730 493,147 528,685 590,700 623,309 479,586 483,946 525,414 587,153
Edinburgh 247,901 256,289 270,269 302,830 308,027 224,606 207,560 213,362 217,060
Manchester 183,000 192,692 205,929 218,703 216,057 166,737 148,116 141,580 141,907
Birmingham 175,882 183,382 188,794 199,043 198,044 153,081 133,092 117,104 109,303
Source: European Hotel Valuation Index, HVS International* London 1993 – €1,448; figures from Edinburgh, Manchester and Birmingham not available.Note: HVI rebased its values in 2007 to reflect the addition of Eastern European markets.
2012 2013 2014 2015 2016
London 620,000 640,000 650,000 670,000 690,000
Edinburgh 220,000 230,000 250,000 260,000 270,000
Manchester 150,000 150,000 160,000 170,000 180,000
Birmingham 110,000 120,000 130,000 130,000 140,000
Source: European Hotel Valuation Index.
HOTEL vALUEs
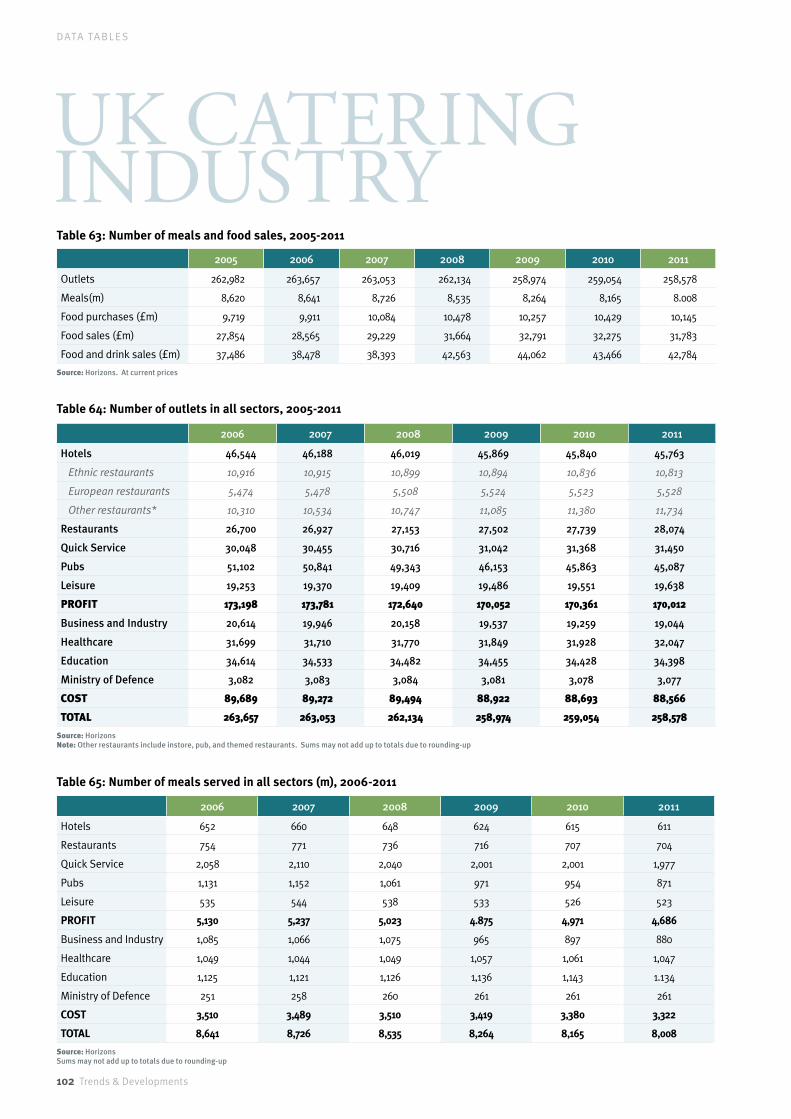
102 Trends & Developments
DATA TA B L E S
uK CateRinG industRy
2005 2006 2007 2008 2009 2010 2011
Outlets 262,982 263,657 263,053 262,134 258,974 259,054 258,578
Meals(m) 8,620 8,641 8,726 8,535 8,264 8,165 8.008
Food purchases (£m) 9,719 9,911 10,084 10,478 10,257 10,429 10,145
Food sales (£m) 27,854 28,565 29,229 31,664 32,791 32,275 31,783
Food and drink sales (£m) 37,486 38,478 38,393 42,563 44,062 43,466 42,784
Source: Horizons. At current prices
Table 63: Number of meals and food sales, 2005-2011
Table 64: Number of outlets in all sectors, 2005-2011
2006 2007 2008 2009 2010 2011
Hotels 46,544 46,188 46,019 45,869 45,840 45,763
Ethnicrestaurants 10,916 10,915 10,899 10,894 10,836 10,813
Europeanrestaurants 5,474 5,478 5,508 5,524 5,523 5,528
Otherrestaurants* 10,310 10,534 10,747 11,085 11,380 11,734
Restaurants 26,700 26,927 27,153 27,502 27,739 28,074
Quick Service 30,048 30,455 30,716 31,042 31,368 31,450
Pubs 51,102 50,841 49,343 46,153 45,863 45,087
Leisure 19,253 19,370 19,409 19,486 19,551 19,638
PROFIT 173,198 173,781 172,640 170,052 170,361 170,012
Business and Industry 20,614 19,946 20,158 19,537 19,259 19,044
Healthcare 31,699 31,710 31,770 31,849 31,928 32,047
Education 34,614 34,533 34,482 34,455 34,428 34,398
Ministry of Defence 3,082 3,083 3,084 3,081 3,078 3,077
COST 89,689 89,272 89,494 88,922 88,693 88,566
TOTAL 263,657 263,053 262,134 258,974 259,054 258,578
Source: Horizons Note: Other restaurants include instore, pub, and themed restaurants. Sums may not add up to totals due to rounding-up
Table 65: Number of meals served in all sectors (m), 2006-2011
2006 2007 2008 2009 2010 2011
Hotels 652 660 648 624 615 611
Restaurants 754 771 736 716 707 704
Quick Service 2,058 2,110 2,040 2,001 2,001 1,977
Pubs 1,131 1,152 1,061 971 954 871
Leisure 535 544 538 533 526 523
PROFIT 5,130 5,237 5,023 4.875 4,971 4,686
Business and Industry 1,085 1,066 1,075 965 897 880
Healthcare 1,049 1,044 1,049 1,057 1,061 1,047
Education 1,125 1,121 1,126 1,136 1,143 1.134
Ministry of Defence 251 258 260 261 261 261
COST 3,510 3,489 3,510 3,419 3,380 3,322
TOTAL 8,641 8,726 8,535 8,264 8,165 8,008
Source: Horizons Sums may not add up to totals due to rounding-up
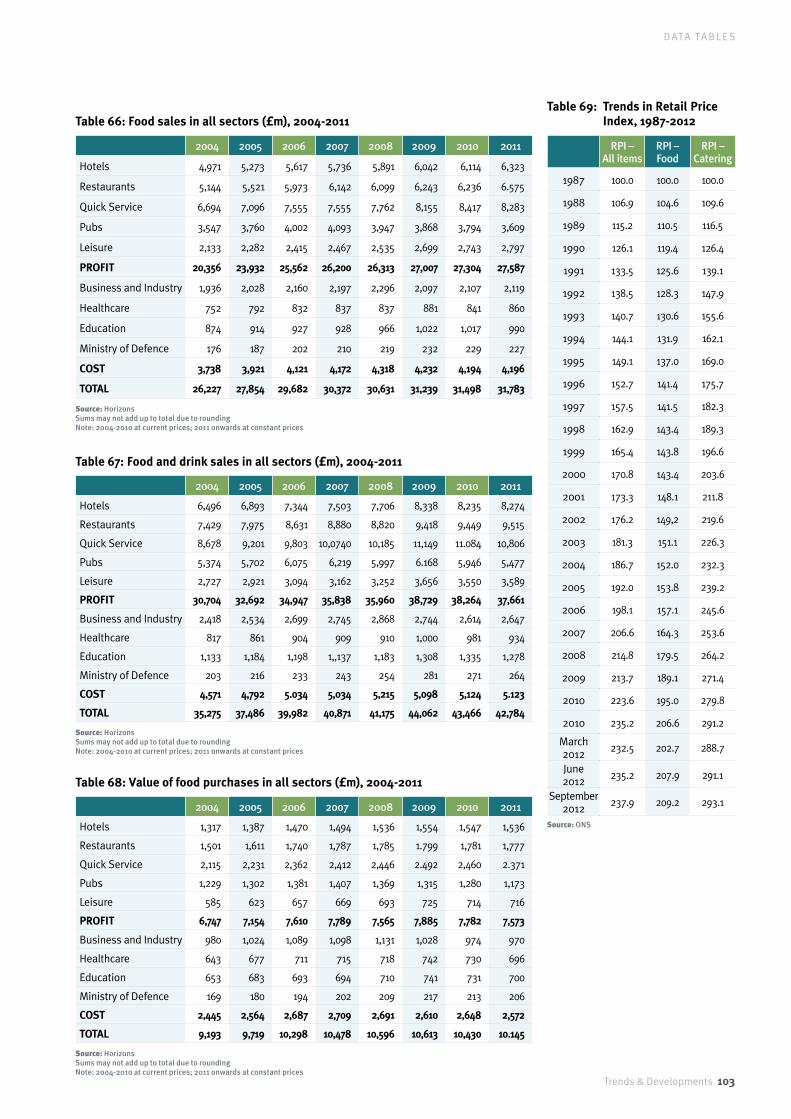
Trends & Developments 103
DATA TA B L E S
Table 66: Food sales in all sectors (£m), 2004-2011
2004 2005 2006 2007 2008 2009 2010 2011
Hotels 4,971 5,273 5,617 5,736 5,891 6,042 6,114 6,323
Restaurants 5,144 5,521 5,973 6,142 6,099 6,243 6,236 6.575
Quick Service 6,694 7,096 7,555 7,555 7,762 8,155 8,417 8,283
Pubs 3,547 3,760 4,002 4,093 3,947 3,868 3,794 3,609
Leisure 2,133 2,282 2,415 2,467 2,535 2,699 2,743 2,797
PROFIT 20,356 23,932 25,562 26,200 26,313 27,007 27,304 27,587
Business and Industry 1,936 2,028 2,160 2,197 2,296 2,097 2,107 2,119
Healthcare 752 792 832 837 837 881 841 860
Education 874 914 927 928 966 1,022 1,017 990
Ministry of Defence 176 187 202 210 219 232 229 227
COST 3,738 3,921 4,121 4,172 4,318 4,232 4,194 4,196
TOTAL 26,227 27,854 29,682 30,372 30,631 31,239 31,498 31,783
Source: Horizons Sums may not add up to total due to roundingNote: 2004-2010 at current prices; 2011 onwards at constant prices
Table 67: Food and drink sales in all sectors (£m), 2004-2011
Table 68: Value of food purchases in all sectors (£m), 2004-2011
2004 2005 2006 2007 2008 2009 2010 2011
Hotels 6,496 6,893 7,344 7,503 7,706 8,338 8,235 8,274
Restaurants 7,429 7,975 8,631 8,880 8,820 9,418 9,449 9,515
Quick Service 8,678 9,201 9,803 10,0740 10,185 11,149 11.084 10,806
Pubs 5,374 5,702 6,075 6,219 5,997 6.168 5,946 5,477
Leisure 2,727 2,921 3,094 3,162 3,252 3,656 3,550 3,589
PROFIT 30,704 32,692 34,947 35,838 35,960 38,729 38,264 37,661
Business and Industry 2,418 2,534 2,699 2,745 2,868 2,744 2,614 2,647
Healthcare 817 861 904 909 910 1,000 981 934
Education 1,133 1,184 1,198 1,,137 1,183 1,308 1,335 1,278
Ministry of Defence 203 216 233 243 254 281 271 264
COST 4,571 4,792 5.034 5,034 5,215 5,098 5,124 5.123
TOTAL 35,275 37,486 39,982 40,871 41,175 44,062 43,466 42,784
Source: Horizons Sums may not add up to total due to roundingNote: 2004-2010 at current prices; 2011 onwards at constant prices
2004 2005 2006 2007 2008 2009 2010 2011
Hotels 1,317 1,387 1,470 1,494 1,536 1,554 1,547 1,536
Restaurants 1,501 1,611 1,740 1,787 1,785 1.799 1,781 1,777
Quick Service 2,115 2,231 2,362 2,412 2,446 2.492 2,460 2.371
Pubs 1,229 1,302 1,381 1,407 1,369 1,315 1,280 1,173
Leisure 585 623 657 669 693 725 714 716
PROFIT 6,747 7,154 7,610 7,789 7,565 7,885 7,782 7,573
Business and Industry 980 1,024 1,089 1,098 1,131 1,028 974 970
Healthcare 643 677 711 715 718 742 730 696
Education 653 683 693 694 710 741 731 700
Ministry of Defence 169 180 194 202 209 217 213 206
COST 2,445 2,564 2,687 2,709 2,691 2,610 2,648 2,572
TOTAL 9,193 9,719 10,298 10,478 10,596 10,613 10,430 10.145
Source: Horizons Sums may not add up to total due to roundingNote: 2004-2010 at current prices; 2011 onwards at constant prices
Table 69: Trends in Retail Price Index, 1987-2012
RPI – All items
RPI – Food
RPI – Catering
1987 100.0 100.0 100.0
1988 106.9 104.6 109.6
1989 115.2 110.5 116.5
1990 126.1 119.4 126.4
1991 133.5 125.6 139.1
1992 138.5 128.3 147.9
1993 140.7 130.6 155.6
1994 144.1 131.9 162.1
1995 149.1 137.0 169.0
1996 152.7 141.4 175.7
1997 157.5 141.5 182.3
1998 162.9 143.4 189.3
1999 165.4 143.8 196.6
2000 170.8 143.4 203.6
2001 173.3 148.1 211.8
2002 176.2 149,2 219.6
2003 181.3 151.1 226.3
2004 186.7 152.0 232.3
2005 192.0 153.8 239.2
2006 198.1 157.1 245.6
2007 206.6 164.3 253.6
2008 214.8 179.5 264.2
2009 213.7 189.1 271.4
2010 223.6 195.0 279.8
2010 235.2 206.6 291.2
March2012 232.5 202.7 288.7
June 2012 235.2 207.9 291.1
September 2012 237.9 209.2 293.1
Source: ONS

104 Trends & Developments
DATA TA B L E S
FOOd And sERvicE mAnAGEmEnT
TURnOvER
nUmBER OF OUTLETs
nUmBER OF mEALs
mOTORwAY sERvicE AREAs
Food and service management, traditionally called contract catering or cost sector catering, covers the provision of far more than catering services. It now includes a wide range of support services, ranging from housekeeping and cleaning to reception and land management, waste management to laundry. The BHA
2012 Food and Service Management Survey lists over 4,200 outlets in which support services are provided. In scope, the sector covers catering for business and industry, education, healthcare, Ministry of Defence and catering for members of the public in leisure outlets.
Table 70: Turnover of UK food and service management market (£bn), 1993, 2003-2011
Table 71: Structure of the food and service management market by number of outlets, 1993 and 2003-2011
1993 2003 2004 2005* 2006 2007 2008 2009 2010 2011
TURNOVER 2,006 3,783 3,895 3,673 3,768 3,977 4,133 4,165 3,870 4,029
Change on 1993 (%) - 89 94 83 88 98 105 107.6 93.0 101.0
* Figures adjusted Source: British Hospitality Association Food and Service Management Survey, 2012
1993 2003 2004 2005* 2006 2007 2008 2009 2010 2011
Business and Industry 7,132 8,939 8,975 8,973 9,103 8,436 8,719 8,183 6,406 6,414
Healthcare 406 882 859 839 799 636 653 810 617 700
State Education 2,383 5,027 4,676 4,506 4,898 5,836 5,136 4,781 3,832 3,892
Independent Schools 587 819 841 754 781 736 637 643 711 595
Local Authorities 261 477 368 291 257 242 282 200 177 242
Ministry of Defence 265 522 520 490 421 352 421 566 344 331
Oil rigs† 302 235 223 202 193 229 163 264 172 184
Catering for the public 619 1,385 1,566 914 921 1,136 972 1,137 1,431 1,443
TOTAL 11,964 18,386 18,028 16,969 17,373 17,603 16,983 16,583 13,690 13,801
* Figures adjusted † Includes construction sites and training centresSource: British Hospitality Association Food and Service Management Survey, 2012
1993 2003 2004 2005* 2006 2007 2008 2009 2010 2011
Business and Industry 408 613 617 645 680 666 717 582 456 468
Healthcare 65 232 208 204 203 210 197 250 165 145
State Education 94 281 287 265 272 289 266 263 234 258
Independent Schools 100 135 120 100 105 100 88 90 106 95
Local Authorities 38 37 28 22 20 19 23 24 18 21
Ministry of Defence 92 108 119 105 105 145 170 215 172 166
Oil rigs† 41 17 17 16 16 20 18 30 21 25
Catering for the Public 120 185 214 139 139 150 140 153 200 201
TOTAL 940 1,608 1,601 1,496 1,540 1,599 1,619 1,607 1,372 1,379
* Figures adjusted † Includes construction sites and training centresSource: British Hospitality Association Food and Service Management Survey, 2012
Table 72: Size of food and service management market by number of meals served (m), 1993 and 2003-2011
Table 73: Motorway Service Operators by number of outlets, 2012
Operators Outlets
Moto Hospitality 42
Welcome Break 26
Roadchef 20
Extra 8
Westmorland Motorway Services 2
Cairn Lodge Services 1
Stop 24 1
As at November 2012Source: Wordsmith and Company
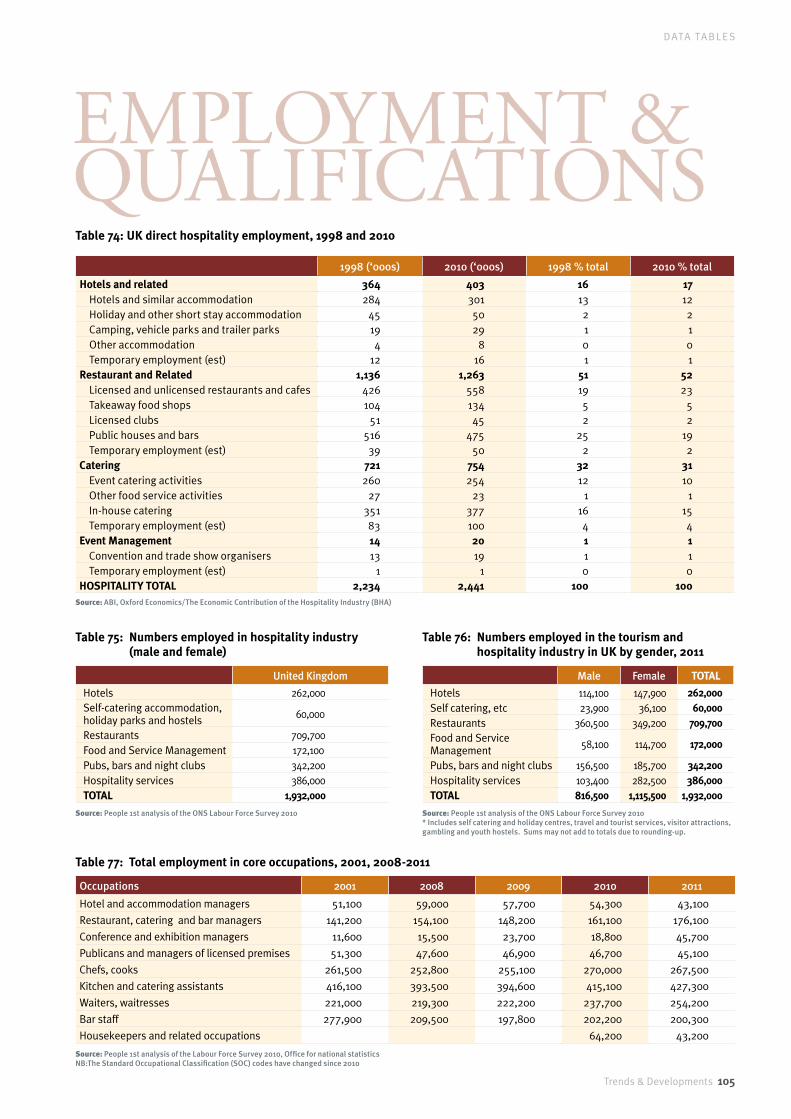
Trends & Developments 105
DATA TA B L E S
employment & qualiFiCations
1998 (‘000s) 2010 (‘000s) 1998 % total 2010 % total
Hotels and related 364 403 16 17 Hotels and similar accommodation 284 301 13 12 Holiday and other short stay accommodation 45 50 2 2 Camping, vehicle parks and trailer parks 19 29 1 1 Other accommodation 4 8 0 0 Temporary employment (est) 12 16 1 1Restaurant and Related 1,136 1,263 51 52 Licensed and unlicensed restaurants and cafes 426 558 19 23 Takeaway food shops 104 134 5 5 Licensed clubs 51 45 2 2 Public houses and bars 516 475 25 19 Temporary employment (est) 39 50 2 2Catering 721 754 32 31 Event catering activities 260 254 12 10 Other food service activities 27 23 1 1 In-house catering 351 377 16 15 Temporary employment (est) 83 100 4 4Event Management 14 20 1 1 Convention and trade show organisers 13 19 1 1 Temporary employment (est) 1 1 0 0HOSPITALITY TOTAL 2,234 2,441 100 100
Source: ABI, Oxford Economics/The Economic Contribution of the Hospitality Industry (BHA)
United Kingdom
Hotels 262,000 Self-catering accommodation, holiday parks and hostels 60,000
Restaurants 709,700 Food and Service Management 172,100 Pubs, bars and night clubs 342,200 Hospitality services 386,000 TOTAL 1,932,000
Source: People 1st analysis of the ONS Labour Force Survey 2010
Table 75: Numbers employed in hospitality industry (male and female)
Table 76: Numbers employed in the tourism and hospitality industry in UK by gender, 2011
Male Female TOTAL
Hotels 114,100 147,900 262,000Self catering, etc 23,900 36,100 60,000Restaurants 360,500 349,200 709,700Food and Service Management 58,100 114,700 172,000
Pubs, bars and night clubs 156,500 185,700 342,200Hospitality services 103,400 282,500 386,000TOTAL 816,500 1,115,500 1,932,000
Source: People 1st analysis of the ONS Labour Force Survey 2010* Includes self catering and holiday centres, travel and tourist services, visitor attractions, gambling and youth hostels. Sums may not add to totals due to rounding-up.
Table 74: UK direct hospitality employment, 1998 and 2010
Table 77: Total employment in core occupations, 2001, 2008-2011
Occupations 2001 2008 2009 2010 2011
Hotel and accommodation managers 51,100 59,000 57,700 54,300 43,100
Restaurant, catering and bar managers 141,200 154,100 148,200 161,100 176,100
Conference and exhibition managers 11,600 15,500 23,700 18,800 45,700
Publicans and managers of licensed premises 51,300 47,600 46,900 46,700 45,100
Chefs, cooks 261,500 252,800 255,100 270,000 267,500
Kitchen and catering assistants 416,100 393,500 394,600 415,100 427,300
Waiters, waitresses 221,000 219,300 222,200 237,700 254,200
Bar staff 277,900 209,500 197,800 202,200 200,300
Housekeepers and related occupations 64,200 43,200
Source: People 1st analysis of the Labour Force Survey 2010, Office for national statisticsNB:The Standard Occupational Classification (SOC) codes have changed since 2010
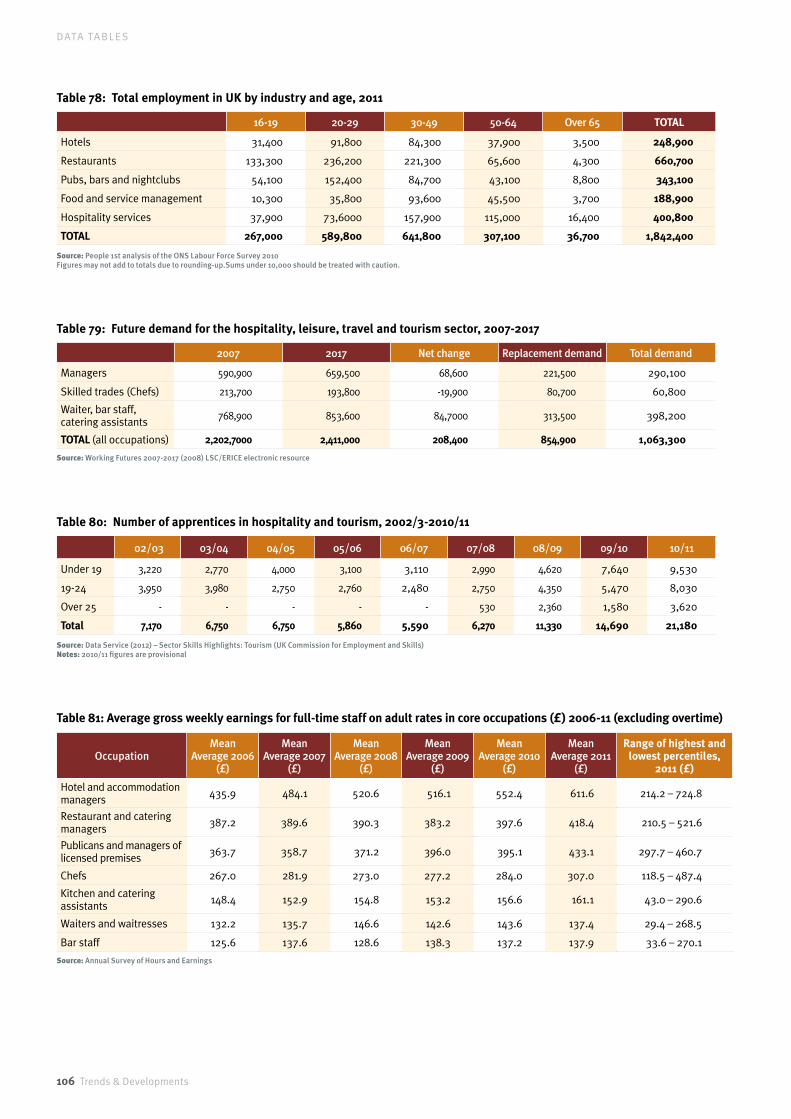
106 Trends & Developments
DATA TA B L E S
Table 78: Total employment in UK by industry and age, 2011
Table 79: Future demand for the hospitality, leisure, travel and tourism sector, 2007-2017
Table 80: Number of apprentices in hospitality and tourism, 2002/3-2010/11
16-19 20-29 30-49 50-64 Over 65 TOTAL
Hotels 31,400 91,800 84,300 37,900 3,500 248,900
Restaurants 133,300 236,200 221,300 65,600 4,300 660,700
Pubs, bars and nightclubs 54,100 152,400 84,700 43,100 8,800 343,100
Food and service management 10,300 35,800 93,600 45,500 3,700 188,900
Hospitality services 37,900 73,6000 157,900 115,000 16,400 400,800
TOTAL 267,000 589,800 641,800 307,100 36,700 1,842,400
Source: People 1st analysis of the ONS Labour Force Survey 2010Figures may not add to totals due to rounding-up.Sums under 10,000 should be treated with caution.
2007 2017 Net change Replacement demand Total demand
Managers 590,900 659,500 68,600 221,500 290,100
Skilled trades (Chefs) 213,700 193,800 -19,900 80,700 60,800
Waiter, bar staff, catering assistants 768,900 853,600 84,7000 313,500 398,200
TOTAL (all occupations) 2,202,7000 2,411,000 208,400 854,900 1,063,300
Source: Working Futures 2007-2017 (2008) LSC/ERICE electronic resource
02/03 03/04 04/05 05/06 06/07 07/08 08/09 09/10 10/11
Under 19 3,220 2,770 4,000 3,100 3,110 2,990 4,620 7,640 9,530
19-24 3,950 3,980 2,750 2,760 2,480 2,750 4,350 5,470 8,030
Over 25 - - - - - 530 2,360 1,580 3,620
Total 7,170 6,750 6,750 5,860 5,590 6,270 11,330 14,690 21,180
Source: Data Service (2012) – Sector Skills Highlights: Tourism (UK Commission for Employment and Skills)Notes: 2010/11 figures are provisional
Table 81: Average gross weekly earnings for full-time staff on adult rates in core occupations (£) 2006-11 (excluding overtime)
OccupationMean
Average 2006 (£)
Mean Average 2007
(£)
Mean Average 2008
(£)
Mean Average 2009
(£)
Mean Average 2010
(£)
Mean Average 2011
(£)
Range of highest and lowest percentiles,
2011 (£)
Hotel and accommodation managers 435.9 484.1 520.6 516.1 552.4 611.6 214.2 – 724.8
Restaurant and catering managers 387.2 389.6 390.3 383.2 397.6 418.4 210.5 – 521.6
Publicans and managers of licensed premises 363.7 358.7 371.2 396.0 395.1 433.1 297.7 – 460.7
Chefs 267.0 281.9 273.0 277.2 284.0 307.0 118.5 – 487.4
Kitchen and catering assistants 148.4 152.9 154.8 153.2 156.6 161.1 43.0 – 290.6
Waiters and waitresses 132.2 135.7 146.6 142.6 143.6 137.4 29.4 – 268.5
Bar staff 125.6 137.6 128.6 138.3 137.2 137.9 33.6 – 270.1
Source: Annual Survey of Hours and Earnings

Trends & Developments 107
DATA TA B L E S
Table 83: Total employment by sector and levels of qualification, 2011
No Qualification NVQ level 1 and entry level NVQ level 2 NVQ level 3 NVQ level 4
and above
Hotels 24,200 57,700 64,800 54,900 59,000
Self-catering etc 4,400 9,700 14,800 11,300 19,900
Restaurants 87,200 151,300 188,00 142,600 138,800
Pubs, bars and clubs 33,700 61,300 87,000 93,800 64,300
Food and service management 10,200 38,000 55,000 33,400 34,800
Travel services 2,200 9,300 13,300 20,200 29,300
Tourist services 1,000 1,500 5.500 5,700 10,900
Visitor attractions 1,000 1,900 5,800 2,500 8,100
Events 1,000 2,600 4,500 3,700 17,800
Gambling 9,800 19,100 21,800 18,500 1,700
Hospitality services 41,300 97,400 131,200 75,000 39,600
TOTAL 216,000 449,800 591,700 461,600 394,200
% 2011 10 21 28 22 19
% 2010 10 22 27.5 22 18
% 2009 11.5 22 27.5 22 17
% 2008 12 24 28 21 15
% 2007 13 23 28 22 14
% 2006 14 24 28 22 12
Source: People 1st/Labour Force Survey 2011Note: Includes all those working in core hospitality, leisure, travel and tourism occupations either as their main job or second job. Figures may not add to totals due to rounding.
Table 82: Number of students on hospitality, tourism, transport and travel courses in higher education institutions, 2003-2011
2003 2004 2005 2006 2007 2008 2009 2010 2011
Full-time under-graduates 6,710 8,790 8,315 9,820 10,230 19,590 21,090 25,705 27,555
Part-time under-graduates 420 600 645 800 1,075 2,110 3,185 4,095 4,350
Source: Higher Education Statistics Agency, 2009Note: Included in 2011 figures are 2,979 full–time postgraduate and 990 part-time post graduate students.

108 Trends & Developments
DATA TA B L E S
Automobile AssociationHotel/Guest House/B&B registrations
British Hospitality AssociationFood and Service Management Survey, 2012
DeloitteSTR Global Hotel Benchmark Survey
EventiaUK Events Market Trends Survey HorizonsUK Tourism and Leisure IndustryUK Catering Industry
HVS ConsultingHotel Valuation Index
Insolvency ServiceInsolvency statistics
InterContinental Hotels GroupAnnual Report, 2011/12
Melvin Gold ConsultingNumber of hotel rooms in UKInvestment of UK hotel industryBranding and Franchising in UK hotel industry
MKG Hospitality ConsultingTen largest world hotel groups
Office for National StatisticsOfficial statistics
ONS Labour Force SurveyEmployment statistics
Oxford EconomicsEconomic contribution of UK hospitality industry People 1st – Sector Skills CouncilEmployment statistics
PKFUK Trends 1997-2011
Qualifications and Curriculum AuthorityStudent statistics
STR Global Hotel Benchmark SurveyUK Trends, 1997-2011 TRI Hospitality ConsultingUK Hotel Industry statistics, 1997-2011
VisitBritainTourism statistics
WhitbreadAnnual Report, 2011/12
World Tourism OrganisationTourism statistics
Wordsmith and CompanyHotel GroupsProperty transactionsHotel openings
Automobile AssociationFanum HouseBasingstokeHampshire RG21 4EAwww.theaa.com
EventiaGalbraith House141 Great Charles StreetBirmingham B3 3LGwww.eventia.org.uk
British Hospitality AssociationQueens House55/56 Lincoln Inn FieldsLondon WC2A 3BHwww.bha.org.uk
Deloitte2 New Street SquareLondon EC4A 3BZwww.deloitte.co.uk
Horizons FS313 Regents Park RoadLondon N3 1DPwww.horizonsforsuccess.com
The Insolvency Servicewww.insolvency.gov.uk
Northern Ireland Tourist Board59 North StreetBelfast BT1 1NBwww.nitb.com
Office for National StatisticsCardiff RoadNewport,South Wales NP10 8XCwww.statistics.gov.uk
Oxford EconomicsAbbey House121 St Aldates Oxford OX1 1HBwww.oef.com
People 1st – Sector Skills CouncilSecond FloorArmstrong House38 Market SquareUxbridge UB8 1LHwww.people1st.co.uk
PKFFarringdon Place20 Farringdon RoadLondon EC1M 3Apwww.pkf.co.uk
Qualifications and Curriculum Development Agency53-55 Butts RoadEarlsdon Park,Coventry CV1 3BHwww.qcda.org.uk
TRI Hospitality Consulting88 Baker StreetLondon W1U 6TQwww.trihospitality.com
VisitBritain1 Palace StreetLondon SW1E 5HEwww.visitbritain.org/ukindustry
VisitScotlandOcean Point One94 Ocean DriveEdinburgh EH6 6JHwww.visitscotland.org
Visit WalesWelsh Assembly GovernmentBrunel House2 Fitzalan RoadCardiff CF24 0UYwww.wales.gov.uk/topics/tourism
World Tourism OrganisationCalle Capital Haya 4228020 Madrid,Spainwww.unwto.org
Wordsmith and CompanyPO Box 2513Farnham RoyalSlough, SL2 [email protected]
BiBLiOGRAPHY
AddREssEs


Queens House, 55/56 Lincoln’s Inn Fields, London WC2A 3BHTel: 020 7404 7744 Fax: 020 7404 7799 Email: [email protected] www.bha.org.uk