brighton & hove child poverty needs assessment, 2010...
TRANSCRIPT
Brighton & Hove Child Poverty Needs Assessment, 2010-2011, Draft V.1.0
Brighton & Hove Child Poverty Needs Assessment, 2010-2011
DRAFT 1.0 Produced for: Children & Young People’s Trust Board Date: 21 March 2011 Contents Page 1. Introduction and background 2 2. Key issues and gaps 5 3. Recommendations for consideration 7 4. Who’s at risk and why? 9 5. The level of need in the population 12 6. Services in relation to need 15 7. Funding 18 8. Projected service use 20 9. Views of public 22 10. Views of professionals 25 11. Expert opinion and evidence base 28 12. Recommendations for further evidence gathering 33 13. Timeframe and key contacts 34 14. Appendices 35
Please note that where references are made in this needs assessment to further information held within the Child Poverty Profile, available through the Brighton & Hove Local Information Service (BHLIS) website, this is not yet available. It is anticipated that this online resource will be made available by June 2011.
9
Brighton & Hove Child Poverty Needs Assessment, 2010-2011, Draft V.1.0
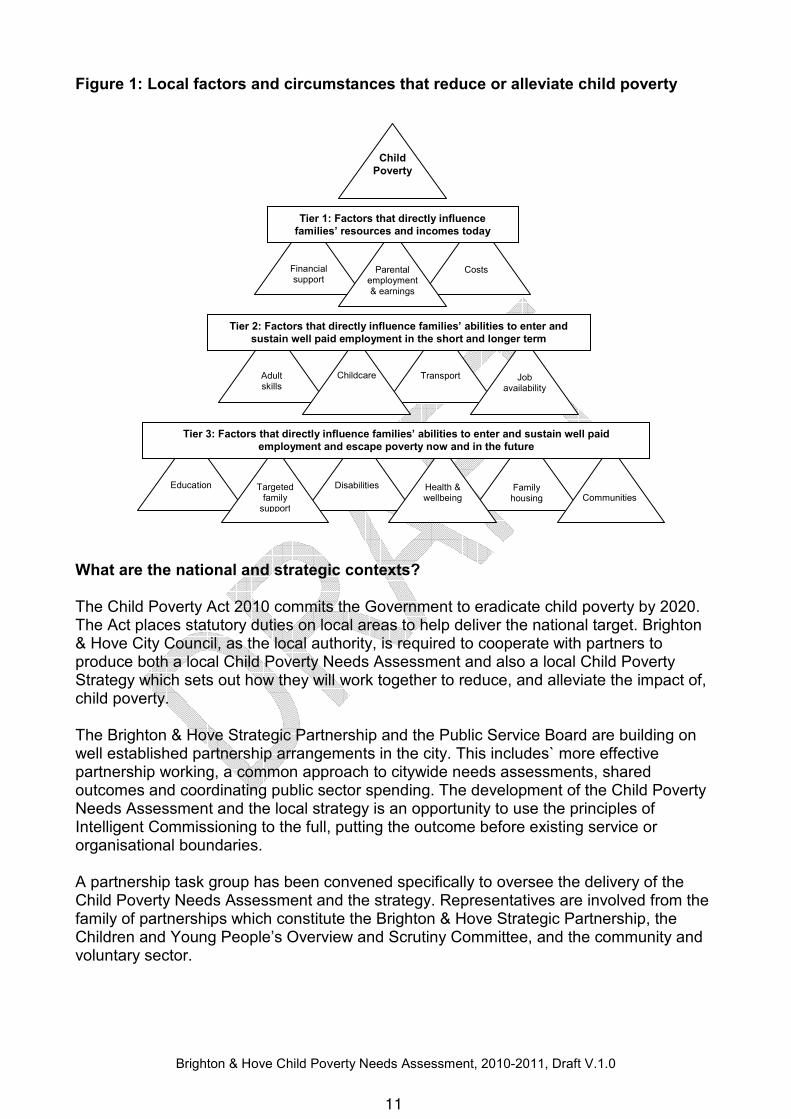
1. Introduction and background What is the subject of the Needs Assessment, what are the issues and why are they important? Approximately 2.8 million children and young people in England live in poverty, roughly one in every five. A family of 2 adults with 2 children are considered to live in poverty if their weekly income is £344 or less, before housing costs. For a lone parent with 2 children this is £263 or less. In 2008 the Joseph Rowntree Foundation estimated the total cost of child poverty to the UK to be £25 billion per year, in terms of costs to public services, benefits to supplement income and also lost productivity to the country as a whole. A study by UNICEF in 2010 placed the UK nineteenth lowest out of the top twenty-four richest countries for material wellbeing among children. Outcomes for children raised in poverty are significantly worse than for those who are not. Educational achievement and health and wellbeing are likely to suffer. Lifetime earnings for children raised in poverty are significantly lower, as are their prospects for employment. Therefore children brought up in poverty are more likely to raise their own children in poverty. Services to reduce child poverty must focus on the circumstances that prevent parents from working, which in some cases are deep rooted or beyond a family’s ability to control. It is not, however, only about family circumstances and parental behaviour, but also aspirations within neighbourhoods and the economic context of the city as a whole. Evidence points firmly to a prevention approach which is therefore the focus of this needs assessment and its conclusions. The picture of services in relation to child poverty must also include protection as well as prevention, where circumstances are compounded to the extent that there are child wellbeing or protection issues. The pyramid in Figure 1, based on a model by the Child Poverty Unit, is a useful way to visualise how support for families is both complex and inter-connected. There are three tiers to the pyramid: 1. Short-term support that provides immediate solutions to day to day issues around
financial matters in relation to earnings and costs of living. 2. Medium-term support that meets the needs of parents and carers around skills and
training, job availability and childcare. 3. Long-term support that gives children and young people the best chance to prosper as
adults, such as education, health, targeted family support and support to communities. Two case studies demonstrate the range of support required by families on order to move out of poverty and to improve life chances, in relation to the range of factors and circumstances shown in the pyramid.
Appendix 1: Case Studies
10
Brighton & Hove Child Poverty Needs Assessment, 2010-2011, Draft V.1.0
Figure 1: Local factors and circumstances that reduce or alleviate child poverty
What are the national and strategic contexts? The Child Poverty Act 2010 commits the Government to eradicate child poverty by 2020. The Act places statutory duties on local areas to help deliver the national target. Brighton & Hove City Council, as the local authority, is required to cooperate with partners to produce both a local Child Poverty Needs Assessment and also a local Child Poverty Strategy which sets out how they will work together to reduce, and alleviate the impact of, child poverty. The Brighton & Hove Strategic Partnership and the Public Service Board are building on well established partnership arrangements in the city. This includes` more effective partnership working, a common approach to citywide needs assessments, shared outcomes and coordinating public sector spending. The development of the Child Poverty Needs Assessment and the local strategy is an opportunity to use the principles of Intelligent Commissioning to the full, putting the outcome before existing service or organisational boundaries. A partnership task group has been convened specifically to oversee the delivery of the Child Poverty Needs Assessment and the strategy. Representatives are involved from the family of partnerships which constitute the Brighton & Hove Strategic Partnership, the Children and Young People’s Overview and Scrutiny Committee, and the community and voluntary sector.
Targeted family
support
Education Disabilities Health & wellbeing
Family housing
Tier 3: Factors that directly influence families’ abilities to enter and sustain well paid
employment and escape poverty now and in the future
Tier 1: Factors that directly influence
families’ resources and incomes today
Tier 2: Factors that directly influence families’ abilities to enter and
sustain well paid employment in the short and longer term
Child
Poverty
Financial support
Parental employment & earnings
Costs
Adult skills
Transport Job availability
Childcare
Communities
11
Brighton & Hove Child Poverty Needs Assessment, 2010-2011, Draft V.1.0
What is the scope? This needs assessment is based on the official Government measure of child poverty. This is defined as the number of children in families in receipt of either out of work benefits, or in receipt of working tax credits where their reported income is less than 60% of the average national income. Specific aims of the Child Poverty Needs Assessment are to determine the following: Data: to map in detail child poverty data and related service indicators for the city and to draw comparison with other relevant towns and cities. Risk: to describe family circumstances within the city that may increase the likelihood of child poverty. Need: to understand levels of child poverty within the city and associated issues and services. What works: to evidence which types of services are proven to alleviate the effects of poverty and how they might have the greatest impact. Recommendations: to draw conclusions from the evidence to inform the development of an effective strategy to reduce child poverty. This needs assessment has also been undertaken as a trial of the new Brighton & Hove template for citywide needs analyses. Due to the breadth of the subject and the strategic nature of this needs assessment certain more detailed elements of the template have not been undertaken, specifically a review of individual service provision, workforce and costs. Sources An extensive range of national and local evidence was compiled, arranged by four key themes – Financial Support, Employment and Skills, Life Chances, and Place. These are commonly referred to as the child poverty ‘building blocks’. The Child Poverty Profile on the Brighton & Hove Local Information Service (BHLIS) website holds a comprehensive list of all the evidence which was reviewed for the Child Poverty Needs Assessment. A summary of key evidence is provided for purposes of reporting.
Appendix 2: Key Evidence
12
Brighton & Hove Child Poverty Needs Assessment, 2010-2011, Draft V.1.0
2. Key issues and gaps Child Poverty Data and Evidence The latest child poverty data relates to benefit claimant information for 2008. Despite the time delay the data does provide the most complete picture available of child poverty within the city and will be particularly useful as a test of the direction of travel over the long term. The data also allows us to make comparisons both within different areas of the city, based on the detail it gives us at neighbourhood level, and also in relation to other local authority areas. Family characteristics Current 2001 census data is extremely out of date. Therefore there is not an accurate up to date picture of the local population, particularly with regard to groups such as Black and Minority Ethnic (BME) families. However the Office for National Statistics estimated that the total BME population for Brighton & Hove had risen from 12 percent at the time of the 2001 census to 16 percent in 2007. Child poverty data does not reflect the ethnicity of families. In Brighton & Hove there are higher than average incidences of mental health problems, drug and alcohol misuse. Levels of domestic violence are also high, which disproportionately impacts on women and children. These are not reflected in national risk factors for child poverty or the official data but should be considered as part of the local child poverty picture. Working and out of work poverty National data shows a trend whereby the numbers of children and young people living in poverty in working families is rising while the number living in families on out of work benefits has fallen. The degree to which this may be true for Brighton & Hove is difficult to measure due to the limitations of child poverty data and the length of time that it has been available. Families who are entitled to benefits but do not claim are unaccounted for in child poverty data. This is likely to be more true of working families who generally are in receipt of fewer benefits. Exactly how many families this represents in the city will be unknown until the next census data is available in approximately two years time. We can measure, to a degree, the attainment of children and young people living in families dependent on out of work benefits, based on Free School Meals eligibility. However, currently we do not measure the attainment of children and young people from families living in working poverty. Long term and persistent poverty Whilst living in poverty for any period of time may impact upon the outcomes for children and young people and their families as a whole, there is an important distinction between short term income loss, for instance temporary loss of employment, and long term or inter-generational poverty.
13
Brighton & Hove Child Poverty Needs Assessment, 2010-2011, Draft V.1.0
Research shows that the longer and more persistent the experience of poverty for families, the more damaging it is in terms of the negative impact on long term life chances for children and young people. There is a correlation between higher concentrations of child poverty and traditionally more disadvantaged communities, where evidence suggests that child poverty is an intergenerational issue. However, child poverty data does not indicate the length of time or the extent to which families are actually below the 60% income threshold. Service Data and Evidence There is good local service level data related to child poverty. However, the main challenge for the needs assessment has been the extent to which data and evidence is available for sharing between services, both within the local authority and also across public and community and voluntary sector organisations. The aim of the local authority and partners is to move towards a focus on shared outcomes rather than individual services. This Child Poverty Needs Assessment demonstrates that to tackle child poverty there must be a more holistic and outcome focussed approach to gathering and sharing data within local services. Views of professionals and public There is excellent understanding at the front line and within services of the issues for families in relation to child poverty, which is summarised in Section 10. The views of children and young people and parents and carers are formally gathered through related service consultations or more generic ones (e.g. the former Place Survey), which have been brought together to inform Section 11. There is, however, little overall consultation historically on the direct experience of living in poverty for families in the city. This needs assessment originally intended to undertake some new consultation with children and young people and parents and carers, however due to capacity this has not been possible. There is significant national research of common issues related to poverty which has been used to supplement local consultation. Given the general falling off in attainment of children in the city from primary through into secondary education, consultation would most usefully capture and trace aspirations of local children and young people, with a focus on the most disadvantaged neighbourhoods.
14

Brighton & Hove Child Poverty Needs Assessment, 2010-2011, Draft V.1.0
3. Recommendations for consideration Partnership commitment and capacity 1. The local Child Poverty Strategy should embed the aim to reduce child poverty as a
strategic priority for partnerships within the city. 2. Partners adopt a common strategic approach to commission services which support
families as a whole to change their circumstances for the better. 3. A reducing child poverty 'check' is applied against relevant future commissioning to
ensure effectiveness and value for money. 4. The Child Poverty Strategy should provide a framework to coordinate the activities of
key services and sub-outcomes that are known to reduce child poverty. Coordination of Services Tier 1: Financial support for families 5. Accessible, quality advice services for parents and carers. 6. Good quality financial advice for parents and carers in targeted family support. 7. Consistent monitoring of take-up of advice services by parents and carers to determine
with accuracy the correlation to child poverty. Tier 2: Sustained employment for parents 8. Creation of new jobs for the city, delivered through the refreshed City Employment and
Skills Plan. 9. Focus on adult skills, particularly for targeted families, and with a focus on family
learning. 10. Raise skill levels for parents before and during their children’s primary school
education, with a focus on lone parents and support around child care. Tier 3: Improved life chances for children and young people, their families and communities 11. Early intervention for children and young people in educational attainment and personal
development, at three core age groups from 0-18 years (as per the Graham Allen review).
12. Raise the overall quality of teaching and effectiveness on attainment in all secondary schools within the city.
13. Focus specific attention on monitoring and raising attainment of children and young people from the most deprived neighbourhoods.
14. Ensure that intervention in school is supported by family intervention to raise parental aspiration and improve the quality of the home environment.
15. Focus on parents through mental health and drug and alcohol services as a preventative tool, before safeguarding becomes an issue.
16. Focus on providing protection and support for children affected by domestic violence and their non-abusive parent, and on early intervention and prevention.
17. Focus on increasing family housing through delivery of the Brighton & Hove Housing Strategy and the Core Strategy to alleviate pressures in the city.
18. Develop a scheme(s) to increase social and cultural engagement and aspiration for targeted children and young people.
15
Brighton & Hove Child Poverty Needs Assessment, 2010-2011, Draft V.1.0
Monitoring Improvement 19. Key service indicators and associated outcomes for reducing child poverty are
identified and monitored within the new City Performance and Risk Management Framework.
20. Family data should be shared more effectively between sectors, partners and services to coordinate evidence of need in relation to child poverty.
21. The national child poverty measure should be used as an overarching 'test' of evidence of success for the city in improving circumstances for families.
Further Evidence Gathering Recommendations for further evidence gathering are included in Section 12.
16

Brighton & Hove Child Poverty Needs Assessment, 2010-2011, Draft V.1.0
4. Who’s at risk and why? The national Households Below Average Income (HBAI) survey provides estimates of the percentage of families living in poverty in the UK according to their characteristics. This is based on a selected sample of families known to be below the 60 percent income threshold. It provides a more detailed picture of risk factors than actual child poverty data, but only at the national level. Of all groups, children and young people with an unemployed parent or parents face the greatest risk of experiencing poverty of all family groups. The influence of other family characteristics in terms of risk therefore largely relates to the extent to which these are likely to inhibit parents’ ability to work or maintain a sufficient income to meet their living costs. The Brighton & Hove Health Profile, 2010 shows that in Brighton & Hove there are higher than average incidence of mental health problems, drug and alcohol misuse. There are also high levels of domestic and sexual violence, according to British Crime Survey data. These risk factors are not included in child poverty data but, given their impact on ability to work and also the family environment, they must be considered to be a part of the local child poverty picture. Risk factors by family characteristics The following list brings together known groups of families who are at increased risk of being in poverty. This is based on a combination of national and local data and therefore it is not possible to produce a clear hierarchy of risk for families in the city. Families will commonly fall into a number of these categories and therefore they should be seen as interrelated. Percentages quoted are based on HBAI national statistics. Children in out of work families Children in families without a parent in employment have an 81 percent risk of living in poverty. This is either the cause or a symptom of poverty in most of the specific family risk factors listed below. Children of a lone parent After housing costs 50 percent of children in lone parent families nationally live in poverty. The causes centre on a single wage in relation to living costs and the affordability of childcare. Children with a disability or with parents with a disability Families with a disabled child or adult have a 42 percent risk of living in poverty. It costs three times as much to bring up a disabled child and parents often take on the role of primary carer which makes employment difficult. Children leaving care
17
Brighton & Hove Child Poverty Needs Assessment, 2010-2011, Draft V.1.0
Young care leavers face significant risks to their life chances with significantly lower academic achievement than their peers. They are more likely to be unemployed, to become homeless and to spend time in prison. Children of teenage parents Children of teenage parents have a 63 percent increased risk of being born into poverty in comparison to babies born to mothers in their twenties. Children of teenage mothers are at increased risk of low educational attainment, unemployment, poverty in adulthood, and poor health. Children of Black and minority ethnic families Nationally 66 percent of Bangladeshi and Pakistani children and 50 percent of Black and Black British children live in poverty. The degree to which families in Brighton & Hove reflect this is not clear from existing data. Children from Gypsy and Traveller families have a higher risk of living in poverty with a resultant risk to educational attainment and wellbeing. Children of asylum seekers are also at risk of living in poverty and associated risks to wellbeing. National and local data however provides little information in terms of income or poverty for these marginalised families. Children with parents and carers with mental health problems Mental health problems in parents and carers may lead to unemployment and social exclusion for the whole family. Children from households with the lowest 20 percent of incomes have a threefold increased risk of mental health problems themselves. Children with parents and carers who misuse drugs and/or alcohol Children with parents and carers who abuse alcohol and or drugs are at an increased risk of poverty and reduced life chances, due to the effects on parenting and difficulty in gaining and sustaining employment. Children in families experiencing domestic violence Children growing up in poverty have an increased risk of experiencing domestic violence within their family. Children in families experiencing domestic violence are at risk of reduced life chances, most importantly around wellbeing. Families with four or more children Children in larger families have a 40 percent risk of living in poverty, predominantly due to higher associated costs of living and challenges to sustaining employment. Figure 2 illustrates the various risks and causes that could result in families entering into poverty. This is written from the perspective of family circumstance and therefore does not include wider economic fluctuations, such as the recession, inflation and housing markets, which are also a contributing factor. Those issues in bold are considered to be of particular local importance.
18

Brighton & Hove Child Poverty Needs Assessment, 2010-2011, Draft V.1.0
Figure 2: Causal chain why families may enter poverty 1. What causes parents to be unemployed?
• National down turn in employment and subsequent loss of jobs and lack of new job creation
• Transition from benefits to work may mean parent cannot pay essential bills and costs in the short to medium term
• Low wages where costs of living outstrip income may mean cannot pay essential bills and costs with loss of in kind benefits (e.g. free school meals)
• Parent/carer duties make working unaffordable and/or impossible to coordinate with available carer support
• Cultural traditions that discourage female working outside the home
• Intergenerational poverty – low aspirations / lack of confidence
• Language barriers where fluent English is required
• Parents with larger families where childcare costs outstrip work income
• Lone parents where one wage does not cover essential costs
• Families experiencing domestic violence
• Chaotic parental circumstances o Drug and alcohol abuse o Long term mental and physical health problems
• Low skills and few or no qualifications o Exacerbated where the average qualifications levels are high
• Poor educational achievement
2. What are the causes of poor educational achievement?
v Low familial aspirations
Ø Intergenerational poverty – low aspirations / lack of confidence v Chaotic or difficult family circumstances
Ø Children taken into Care Ø Parents/families who neglect or abuse children Ø Parents with drug and/or alcohol misuse Ø Families experiencing domestic violence Ø Parents with significant mental health problems Ø Parents with significant long term health problems Ø Young parents without strong supporting structures
v Environment or culture around a child that exacerbate low aspirations Ø Poor communities with no culture of aspiration/educational
aspiration Ø Overcrowded and chaotic home space Ø Highly mobile families or those excluded from services and society such
as gypsy and traveller families and asylum seeker families v Specific conditions that hamper a child’s ability to learn (a wide spectrum of
additional needs) Ø Where the educational/family support available is not sufficient to
narrow the gap in educational attainment Ø Where a child’s condition is so severe as to preclude standard
attainment
3. What causes a broader range of families in work to be living in poverty?
• Low wage jobs o Low wage economies and part time casual work in some employment sectors
such as catering and hospitality o Parents with low skills and few or no qualifications can only gain low paid low skilled jobs
v Challenges for those parents receiving benefits to access and attend essential training
Ø Cost and flexibility of childcare prohibitive Ø Eligibility to training for those on benefits
19
Brighton & Hove Child Poverty Needs Assessment, 2010-2011, Draft V.1.0
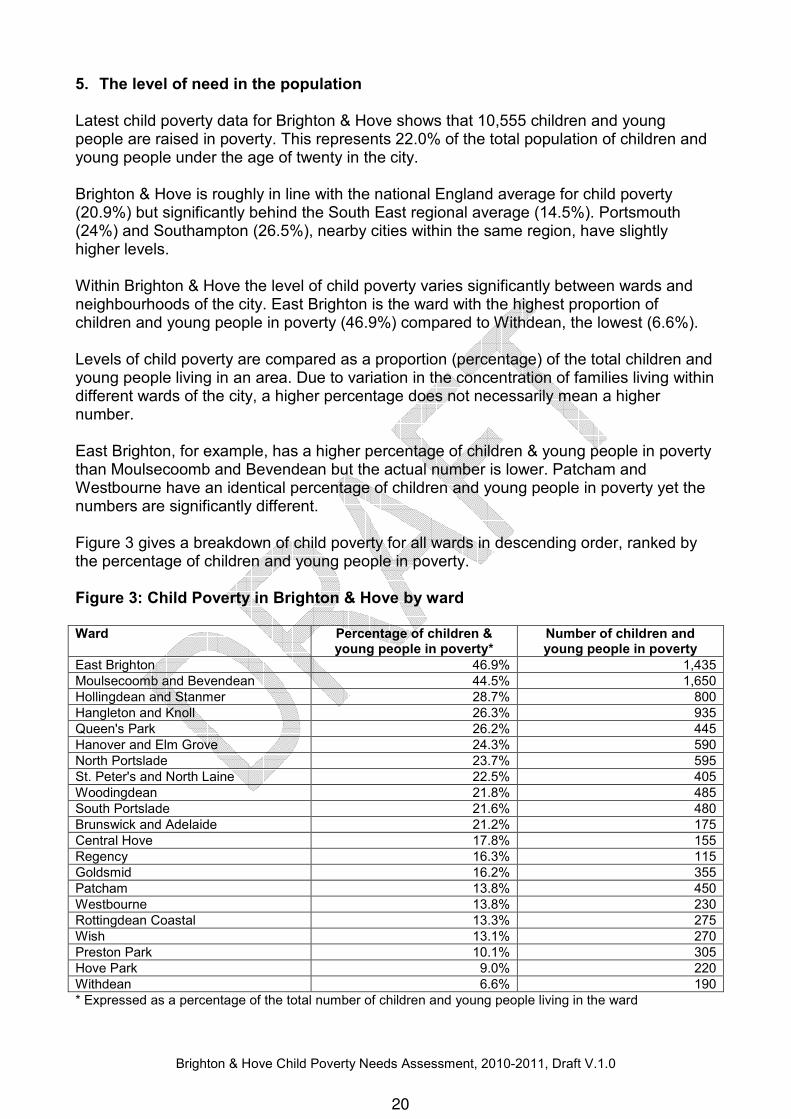
5. The level of need in the population Latest child poverty data for Brighton & Hove shows that 10,555 children and young people are raised in poverty. This represents 22.0% of the total population of children and young people under the age of twenty in the city. Brighton & Hove is roughly in line with the national England average for child poverty (20.9%) but significantly behind the South East regional average (14.5%). Portsmouth (24%) and Southampton (26.5%), nearby cities within the same region, have slightly higher levels. Within Brighton & Hove the level of child poverty varies significantly between wards and neighbourhoods of the city. East Brighton is the ward with the highest proportion of children and young people in poverty (46.9%) compared to Withdean, the lowest (6.6%). Levels of child poverty are compared as a proportion (percentage) of the total children and young people living in an area. Due to variation in the concentration of families living within different wards of the city, a higher percentage does not necessarily mean a higher number. East Brighton, for example, has a higher percentage of children & young people in poverty than Moulsecoomb and Bevendean but the actual number is lower. Patcham and Westbourne have an identical percentage of children and young people in poverty yet the numbers are significantly different. Figure 3 gives a breakdown of child poverty for all wards in descending order, ranked by the percentage of children and young people in poverty. Figure 3: Child Poverty in Brighton & Hove by ward Ward Percentage of children &
young people in poverty* Number of children and young people in poverty
East Brighton 46.9% 1,435
Moulsecoomb and Bevendean 44.5% 1,650
Hollingdean and Stanmer 28.7% 800
Hangleton and Knoll 26.3% 935
Queen's Park 26.2% 445
Hanover and Elm Grove 24.3% 590
North Portslade 23.7% 595
St. Peter's and North Laine 22.5% 405
Woodingdean 21.8% 485
South Portslade 21.6% 480
Brunswick and Adelaide 21.2% 175
Central Hove 17.8% 155
Regency 16.3% 115
Goldsmid 16.2% 355
Patcham 13.8% 450
Westbourne 13.8% 230
Rottingdean Coastal 13.3% 275
Wish 13.1% 270
Preston Park 10.1% 305
Hove Park 9.0% 220
Withdean 6.6% 190
* Expressed as a percentage of the total number of children and young people living in the ward
20
Brighton & Hove Child Poverty Needs Assessment, 2010-2011, Draft V.1.0
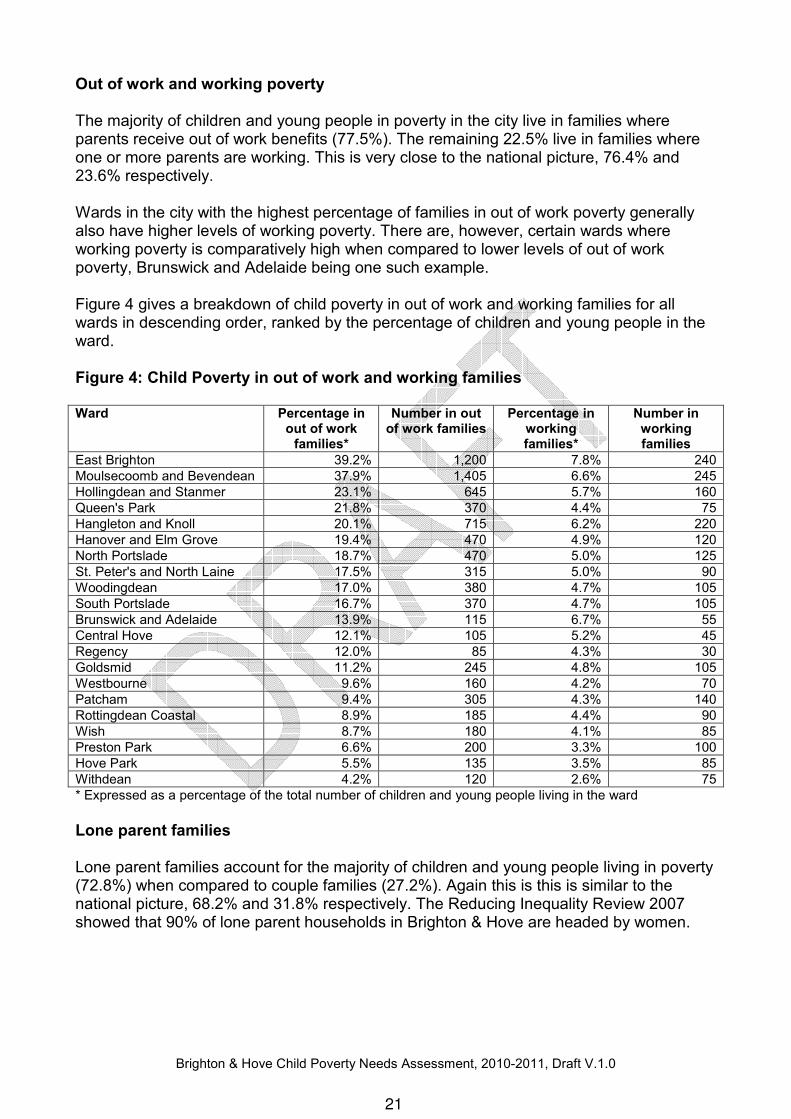
Out of work and working poverty The majority of children and young people in poverty in the city live in families where parents receive out of work benefits (77.5%). The remaining 22.5% live in families where one or more parents are working. This is very close to the national picture, 76.4% and 23.6% respectively. Wards in the city with the highest percentage of families in out of work poverty generally also have higher levels of working poverty. There are, however, certain wards where working poverty is comparatively high when compared to lower levels of out of work poverty, Brunswick and Adelaide being one such example. Figure 4 gives a breakdown of child poverty in out of work and working families for all wards in descending order, ranked by the percentage of children and young people in the ward. Figure 4: Child Poverty in out of work and working families Ward Percentage in
out of work families*
Number in out of work families
Percentage in working families*
Number in working families
East Brighton 39.2% 1,200 7.8% 240
Moulsecoomb and Bevendean 37.9% 1,405 6.6% 245
Hollingdean and Stanmer 23.1% 645 5.7% 160
Queen's Park 21.8% 370 4.4% 75
Hangleton and Knoll 20.1% 715 6.2% 220
Hanover and Elm Grove 19.4% 470 4.9% 120
North Portslade 18.7% 470 5.0% 125
St. Peter's and North Laine 17.5% 315 5.0% 90
Woodingdean 17.0% 380 4.7% 105
South Portslade 16.7% 370 4.7% 105
Brunswick and Adelaide 13.9% 115 6.7% 55
Central Hove 12.1% 105 5.2% 45
Regency 12.0% 85 4.3% 30
Goldsmid 11.2% 245 4.8% 105
Westbourne 9.6% 160 4.2% 70
Patcham 9.4% 305 4.3% 140
Rottingdean Coastal 8.9% 185 4.4% 90
Wish 8.7% 180 4.1% 85
Preston Park 6.6% 200 3.3% 100
Hove Park 5.5% 135 3.5% 85
Withdean 4.2% 120 2.6% 75
* Expressed as a percentage of the total number of children and young people living in the ward
Lone parent families Lone parent families account for the majority of children and young people living in poverty (72.8%) when compared to couple families (27.2%). Again this is this is similar to the national picture, 68.2% and 31.8% respectively. The Reducing Inequality Review 2007 showed that 90% of lone parent households in Brighton & Hove are headed by women.
21

Brighton & Hove Child Poverty Needs Assessment, 2010-2011, Draft V.1.0
Overall picture
• The majority (60.7%) of children and young people in poverty live in lone parent families who are out of work.
• 16.7% of children and young people in poverty live in couple families who are out of work.
• 12.1% of children and young people in poverty live in lone parent, working families.
• 10.5% of children and young people in poverty live in couple, working families. Further information The Child Poverty Profile on BHLIS allows users to map all available child poverty data for Brighton & Hove down to Lower Super Output Areas (LSOA). This shows a more detailed and even more varied picture than comparing child poverty by ward level alone. Key maps at LSOA level are provided for purposes of reporting.
Appendix 3: Key Maps
22
Brighton & Hove Child Poverty Needs Assessment, 2010-2011, Draft V.1.0
6. Services in relation to need This section brings together a summary of key evidence of need in Brighton & Hove in relation to services that support families living in poverty. Further data and evidence can be found in the Child Poverty Profile on BHLIS, as well as reference to a range of strategies which contain actions to address these issues. Tier 1: Financial support for families Financial support
• Advice services have experienced a significant increase in enquiries over the past two years since the start of the economic downturn.
• Social Welfare Law advice services received an estimated 17,000 enquiries in 2009/10. The majority of these were related to money matters.
• Calls to the Amaze helpline increased by 40% over the 6 months prior to January 2011 and 50% of calls are primarily related to financial concerns.
Parental earnings and costs of living
• In 2010 average weekly earnings were below the national average for men but above the national average for women.
• In May 2010 the percentage of residents claiming out of work benefits was 13.1%, compared to the England average of 12.4%.
• In June 2010 the percentage of economically inactive people who wanted a job was 7.4%, compared to national average of 5.7%.
• In 2010 the average price of a 3 bedroom home was £314,762, requiring an income of £72,637 to secure a mortgage.
• In 2010 house prices rose by 12.9% compared to 5.2% nationally, making them 33% higher than the national average.
• In 2010 the average monthly rental price for a 3 bedroom home was £1,251. The cost of renting in the city is now the highest in the country after London.
• Of local concern are proposals to reduce the maximum Local Housing Allowance that will leave some families at risk of a shortfall in payments.
• Homelessness applications and acceptances to the Council’s Housing Options team have risen over the last two years.
Tier 2: Sustained employment for parents Adult skills and job availability
• There are high numbers of residents with Level 3 qualifications and a minority of residents, one in twelve, with few or no qualifications.
• Anecdotal evidence suggests significant numbers within this minority have literacy and numeracy problems.
• The percentage of residents with a Level 4 qualification or above in 2009 was 42.6%, compared to the national average of 29.9%
• In recent years overall population growth has outpaced job growth in the city.
• There has been a recent decrease in growth in part-time jobs, which are important for mothers returning to work.
23

Brighton & Hove Child Poverty Needs Assessment, 2010-2011, Draft V.1.0
• The number of job applicants outweighed available jobs by four to one in November 2010.
Childcare
• The parent survey of the 2010 Childcare Sufficiency Assessment suggests high levels of satisfaction with the quality and availability childcare.
• Costs of childcare are higher than the national average.
• There is little flexible childcare on offer outside the standard working weekday which is problematic for parents with unsociable work hours.
Tier 3: Improved life chances for children and young people, their families and communities Education
• Overall attainment at nursery and primary school is the same as, or above, the national average. There is a significant decline by the time that pupil attainment is measured at GCSE.
• GCSE attainment (5 A*-C grades, including English and Mathematics) within schools in 2010 was 49%, compared to the national average of 55.2%.
• In 2010 unauthorised absences from school were 2.1%, compared to the national average of 1.4%. Persistent absences were 6.1%, compared to 4.6% nationally.
• Children and young people not in education, employment or training (NEET) have reduced, from 8.79% in 2010 to 7.46% in 2011, but are still above the national average.
• A steady growth is predicted in pupil numbers over the next 5 years. Disabilities
• In February 2010 48% of working age people on benefits in the city claimed incapacity benefit compared to the England average of 43% and the south east average of 42%.
• In 2009/10, of 1186 families registered with Amaze, 9% have more than one child with special needs and 1.5% have more than two.
• 29% of the children with disabilities registered with Amaze have a parent or carer who is disabled.
• Of the 246 claims made through the Amaze Disability Living Allowance (DLA) project, 49% of parents and parent carers live on benefits, 45% are lone parents and 23% have mental health problems.
Targeted Family Support
• A minority of families with complex needs require a disproportionate level of service support.
• The city has higher than average numbers of Looked After Children with high associated costs.
Health and Wellbeing
• There are high levels of adult mental health problems compared to the national average.
24
Brighton & Hove Child Poverty Needs Assessment, 2010-2011, Draft V.1.0
• Incapacity benefits for mental health problems have remained significantly higher than the England average for the last three years.
• Children from families with the lowest 20% of incomes are almost three times as likely to have a common mental health problem.
• In 2009/10, 3,359 domestic violence crimes and incidents were reported to the police. Eight out of ten of these were against women.
• Domestic violence is identified as the primary reason for a third of child protection plans.
• There are higher than average levels of adult drug and alcohol misuse compared to the national average.
• Hospital stays for alcohol related harm and drug misuse have been significantly worse than the England average for the last three years.
• The percentage of school children regularly misusing drugs or alcohol was higher than both the regional and national averages in 2008, according the Tell Us survey.
Family housing
• In 2010 waiting times for family sized social housing were significantly longer. One and a half years for a 3 bedroom property compared to 9 months for a 1 bedroom property.
• 31% of families on the housing waiting list require a home with 3 or more bedrooms.
• The 2010 Housing Needs Survey highlighted that 31% of housing demand that could not be met through the existing housing stock was for homes with 3 or more bedrooms.
Communities
• Disadvantaged communities and larger areas of family housing are predominantly situated further from the city centre, facilities and employment.
• Evidence from the Place Survey 2008 suggests that residents from the most disadvantaged neighbourhoods participate less in the social and cultural life of the city.
• Research from the Tarner neighbourhood indicates the importance of participating in the local community for health and well being.
• The Place Survey 2008 showed that 40% of residents in the 10% most deprived areas reported that they felt safe in their community after dark compared to 62% of residents citywide.
• 35% of residents perceived there to be a high level of anti-social behaviour in more deprived areas compared to 19% citywide.
Further information Details of all of the evidence collated for this Child Poverty Needs Assessment along with service data and trends in relation to child poverty can be accessed through the Child Poverty Profile on BHLIS.
25
Brighton & Hove Child Poverty Needs Assessment, 2010-2011, Draft V.1.0
7. Funding Cost of poverty National information on the cost of child poverty is limited, in part due to the newness of the Child Poverty Act but also the complexity and the range of services and family circumstances involved. Locally no analysis has been undertaken of the cost of alleviating child poverty or preventing it. The main source of national evidence is a study by the Joseph Rowntree Foundation (JRF) in October 2008. They estimated that the cost of child poverty to public services nationally was at least £11.6 billion per annum and as much as £20.7 billion. JRF also found that being raised in poverty as a child would reduce earnings for an individual by between 15 and 28 per cent on average over their lifetime, and also reduce the probability of them being in employment at the age of 34 by between 4 and 7 percent. In 2010 the Institute for Fiscal Studies (IFS) estimated that the target to eradicate child poverty could be met through tax and benefit measures alone at a cost of around £19 billion a year at current prices. The rationale, therefore, is to eradicate child poverty by moving families out of poverty in a sustained way through a full range of preventative intervention along with financial support in the form of benefits that provide incentives for families to work. In October 2001 16 areas across the UK were announced as pilots for ‘Community Budgets’, whereby money from Government departments would be pooled and passed down to local agencies in order to rationalise support for families with the most complex needs. It is intended that the programme will be extended nationally by 2013-14. Value for money case for prevention The Graham Allen review on early intervention, published in January 2011, emphasises the importance of commissioning services based on proven effectiveness. With the ending of ring fenced Area Base Grant and reduction in pilot funding streams there is an added incentive to move to proven intervention models based not only on their potential to bring about long term improvement in family circumstances but crucially at a reduced cost Examples are given below for each of the three tiers of the pyramid. Tier 1: Financial support for families ‘Every Pound Counts’ was a three year campaign in Lambeth to increase take up of benefits by vulnerable groups. A central referral hub allows benefit advisers to access relevant council databases, with the client’s permission, and share the information with partner advice agencies. This helps to identify those who are missing out on benefits and improves the service offered to vulnerable users. The project costs over three years were £672,000 which released £3,750,000 in benefits to 2000 recipients.
26

Brighton & Hove Child Poverty Needs Assessment, 2010-2011, Draft V.1.0
Tier 2: Sustained employment for parents The Tyne Gateway Project trains parents who are living in poverty to become community entrepreneurs. Individuals are targeted and encouraged to attend an awareness raising course to prepare for full time employment as a community Entrepreneur. Support is provided through Jobcentre Plus, local FE colleges and the Family Information Service. Successful graduates of the course go on to develop projects that focus on tackling child poverty at a local level, using their own knowledge and experience of living below the poverty line. In addition to increased income participants report a shift in their attitudes towards benefits with increased aspirations both for themselves and for their children. Tier 3: Improved life chances for children and young people, their families and communities The Family Recovery Programme in Westminster, a Think Family pilot, has an average cost of £19,500 per family with an average cost avoidance of £40,000 in the same year that they are engaged in the programme. For families with complex problems prior to the engagement the estimated savings in services are £136,000 per family. The Building Bridges project, in various London boroughs, intervenes early to reduce the escalation of a parent’s mental health problems. Based on an average cost of £4,000 for early intervention per family it can ultimately prevent a child entering foster care at a potential cost of £25,500 per year. The Supporting People Programme in Brighton & Hove has a budget of £11.3 million and released Net savings of £36.6 million. For every £1 spent in the city on Supporting People services there is an estimated saving of £3.24 across other budgets. This takes into account reductions in costs for housing and homelessness services, tenancy failure costs, other social costs related to anti-social behaviour and crime, and DWP and NHS costs.
27
Brighton & Hove Child Poverty Needs Assessment, 2010-2011, Draft V.1.0
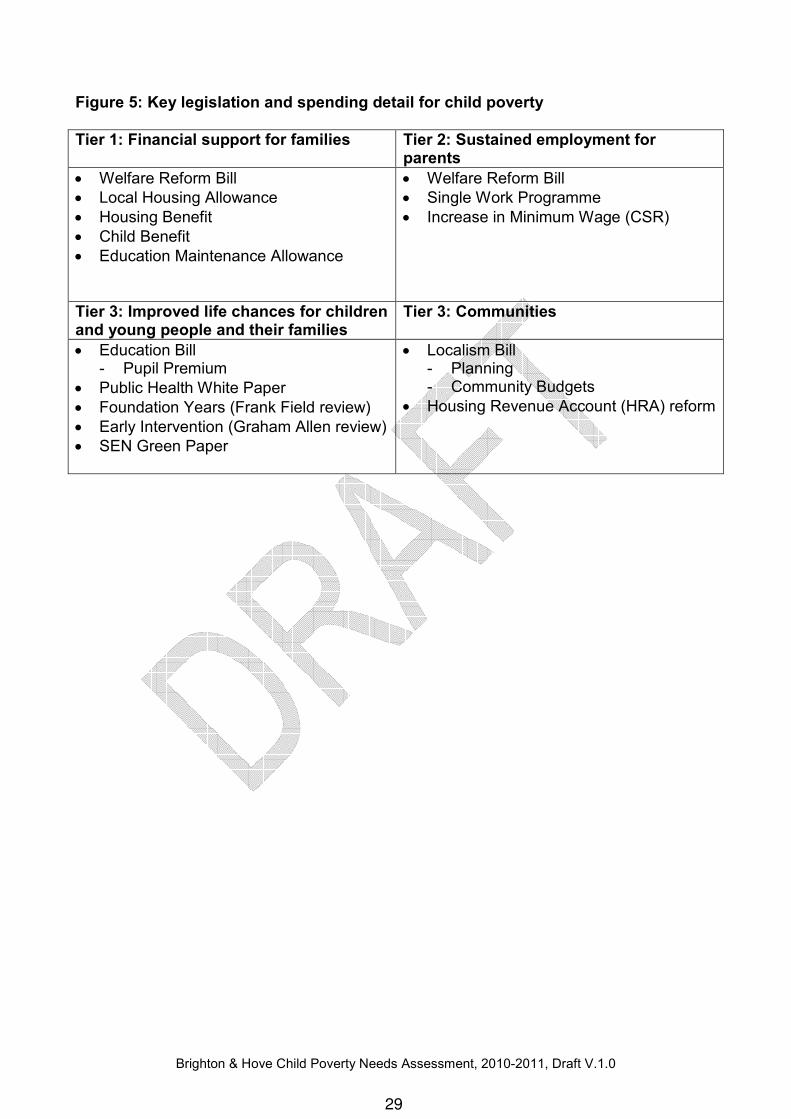
8. Projected service use Population projection The current population of children and young people within the Brighton & Hove is lower than the national average. The adult population is younger than the national average with a higher proportion of people aged 20 to 44 years. The resident population of Brighton & Hove rose by 3.2% between 2002 and 2009, from 248,400 to 256,300 people. This is predicted to increase by 5.0% over the next eight years, from 256,300 in 2009 to 269,000 in 2019. There is a predicted increase in the number of young children. The 2001 Census showed that Black and Minority Ethnic groups made up 12% of the total population in Brighton & Hove. The Office of National Statistics mid-year estimates in 2007 showed this as having risen to 16%. 2012 Census data will provide a more accurate, up to date picture of the current resident population. Economic projection In Brighton & Hove over half of the working age population is employed in business & financial services and the public sector. The other two sectors are hospitality & retail, accounting for 21 percent of the workforce, and creative industries accounting for about 11 percent. The developing City Employment and Skills Plan for 2011-14 shows that growth in the working age population in Brighton & Hove means that 2,700 more residents need to be in work by 2014 and 6,300 more by 2020 to maintain the current employment rate. An additional 6,000 residents would need to be in work by 2014 to return to the 2004 employment rate and an extra 9,600 by 2020. Legislative reform and the Comprehensive Spending Review National policy reform and the Comprehensive Spending Review have implications for child poverty, both in terms of funding for organisations delivering services and also family income. The Government is also preparing a National Child Poverty Strategy, to be published in Spring 2011, which will set the national policy agenda for child poverty following the independent review of Poverty and Life Chances by Frank Field MP. The grid in Figure 5 below brings together key reforms arranged by the three tiers of the child poverty pyramid.
28
Brighton & Hove Child Poverty Needs Assessment, 2010-2011, Draft V.1.0
Figure 5: Key legislation and spending detail for child poverty
Tier 1: Financial support for families Tier 2: Sustained employment for parents
• Welfare Reform Bill
• Local Housing Allowance
• Housing Benefit
• Child Benefit
• Education Maintenance Allowance
• Welfare Reform Bill
• Single Work Programme
• Increase in Minimum Wage (CSR)
Tier 3: Improved life chances for children and young people and their families
Tier 3: Communities
• Education Bill - Pupil Premium
• Public Health White Paper
• Foundation Years (Frank Field review)
• Early Intervention (Graham Allen review)
• SEN Green Paper
• Localism Bill - Planning - Community Budgets
• Housing Revenue Account (HRA) reform
29
Brighton & Hove Child Poverty Needs Assessment, 2010-2011, Draft V.1.0
9. Views of public A wide range of existing national and local consultation and research with parents and carers and children and young people on the experience of living in poverty has been reviewed for the needs assessment. The Child Poverty Profile on BHLIS includes a comprehensive catalogue which provides details of the sources. Tier 1: Financial support for families Financial support For parents on out of work benefits one of the most common concerns is the degree to which family income drops off at the point at which they move into low paid or part time work. When all out of work subsidies are taken into account some families consider that their income will be higher if they remain on benefits. On entering work many parents find the combination of childcare responsibilities and inflexible or unsociable hours of work unmanageable. Parental earnings and costs of living For families living on a minimum income, small fluctuations in the cost of living such as unexpected items of expenditure and changes in circumstances, for example the change from benefits to work or back, are stressful and often mean further hardship. Families can be forced to choose between essentials such as food and fuel, or take on debt. Many families in poverty are financially excluded and choose legitimate or illegal money lending that entails significantly higher levels of interest and therefore more expense in the long run. Whilst parents and carers often bear the stress of these decisions there is evidence that for children and young people the comparison between their family circumstances and that of other children can often be a source of worry, fear and in some cases shame. Children and young people in low income families may well go without a range of experiences that many other families would consider a normal part of growing up. Having friends over to play, going on school trips and excursions and celebrating significant occasions such as birthdays and religious holidays. Tier 2: Sustained employment for parents Adult skills and job availability For many parents, particularly lone parents, a lack of skills and learning prevent them from entering work or higher paid work. They report real difficulty in getting appropriate subsidised childcare in order to undertake training and qualifications. They also report a conflict between the class times of courses in colleges and universities and the availability of childcare, most often in nurseries which split payment into fixed half-day sessions. Childcare There are parents who struggle to use childcare services even when they are affordable and available. Young parents report feeling unsure about leaving their babies with
30

Brighton & Hove Child Poverty Needs Assessment, 2010-2011, Draft V.1.0
strangers and this may also be more widely true for parents whose family have never used professional childcare. Safeguarding fears are voiced, in particular when talking about home based, unsupervised childcare. In part these fears are no doubt fuelled by media reporting and, in certain cases of more vulnerable parents, by their own childhood experiences. Some young parents report feeling they will be judged by childcare professionals and fear that their baby will form a stronger attachment to the child carer. Tier 3: Improved life chances for children and young people, their families and communities Education National research following cohorts of children from primary school through to secondary school has tracked the trajectory of children’s aspirations. In general there is reduction in the scope and ambition of the aspirations of children from poorer families from the end of primary school and then more noticeably through the first part of secondary school. Children from poorer families report feelings of exclusion from extended school life, mainly as a result of financial costs but sometimes because of social exclusion or because there is no value placed on school activities by family. Other children report a sense of being categorised as under achievers because they are seen as disadvantaged by teachers and professionals. Disabilities For families with specific needs the costs of living are greater, for example heating requirements and the costs of specialist equipment and therapeutic support. Children with disabilities are more likely to live in lone parent families in disadvantaged communities and their parents are more likely to be unemployed and to have a disability themselves. Parents in these circumstances often find dealing with a multiplicity of services and agencies is a challenge in itself. The experience of many parents with children with disabilities is that they are viewed by their employers as difficult employees whose family duties are in competition with their productivity. Health and Wellbeing For some parents health conditions and mental health issues in particular present significant challenges to accessing training and work. In some instances parents report insufficient support to enable them to be more independent. Other parents contrast this with the complexity of managing numerous different appointments. As children grow and become more aware of their circumstances often they develop great empathy for the hardships which their parents endure. They voice feelings of guilt and worry for their parents’ health and wellbeing along with frustration and anger at not being able to have the consumer items and experiences enjoyed by others. For families growing up in communities that are generally more affluent this sense of alienation can be acute.
31
Brighton & Hove Child Poverty Needs Assessment, 2010-2011, Draft V.1.0
Family housing For families living in poor quality accommodation, whether it is social housing or private rented accommodation, the impact of their physical environment is often something they articulate when talking about the everyday things that can lead to depression and stress. Parents voice grave concerns in some cases about the effects of damp and infestations on their children’s health, alongside the constant difficulties in winter of keeping fuel inefficient homes sufficiently warm. Children and young people talk about the shame associated for them with poor quality homes, and these feelings can be so profound that they simply never invite friends home after school or at the weekends. Members of families living in overcrowded conditions express their frustration at having little or no privacy, no quiet time for work or study. In the worst cases of temporary accommodation, in hostels and bed and breakfast, overcrowded families may in turn share bathroom and cooking spaces with strangers. Communities Exclusion from the social and cultural life of their peers is a common issue for many children and young people living in poverty. Often this is financial exclusion but children also talk about their exclusion from places and experiences because of fear and prejudice. Children with disabilities in Brighton & Hove have said where they like to go in their leisure time and other places which they avoid because of their perceived reception. Families often struggle with the stigma attached to poverty. Whilst the local neighbourhood can have a strong influence on the degree to which they feel poor in comparison to others, for children and young people the place that they spend most time associating with peers is in school. Children and young people report being subject to teasing and bullying because of their clothes, access to Free School Meals and their absence from events or trips that require payment. Parents on the lowest incomes report school as a source of financial stress, in particular the cost of uniforms and contributions to trips. Some young people in disadvantaged communities express concerns about socialising outdoors, for example in unsupervised parks and playgrounds, for fear of being a victim of crime. Young people who may have no other option than to socialise outdoors may in turn be viewed as perpetrators of crime by other members of the community.
32
Brighton & Hove Child Poverty Needs Assessment, 2010-2011, Draft V.1.0
10. Views of professionals A wide range of consultation with professionals from public sector organisations and the community and voluntary sector took place to inform the needs assessment. This included themed child poverty workshops as well as discussions at a range of forums and events. Further Information on these discussions and full notes from the child poverty workshops are available through the Child Poverty Profile on BHLIS. Tier 1: Financial support for families Financial Support Professionals feel that the benefits system does not encourage claimants to return to work due to additional costs associated with working and a gap between benefits ending and a new wage coming in. There is felt to be a need for increased tapering of benefits and an acknowledgement that low paid jobs often require subsidy in order for families to survive without increased debt. Tax credits are seen to support families in work but are not always taken up due to concern about inaccurate payments destabilising family finances. There is concern about the proposed changes to the Local Housing Allowance and the expectation that these changes will have a disproportionate impact in Brighton & Hove with its large private rental sector and higher than average rental costs. For larger, family properties the greater the likely impact between current rental costs and the new level of allowance. Parental earnings and costs of living Locally, jobs that pay enough to cover the high costs of housing and living in the city are highlighted as essential to providing the conditions for families to stay in the city. There is a sense that the relationship between income and costs is intensely felt in Brighton & Hove by a wide range of families, including families living in working poverty. The importance of good quality independent and trusted advice is seen as vital in enabling families to reduce and manage debt and to become financially included with basic bank accounts. The poverty premium is seen to apply most acutely to access to credit. Many of the poorest families are buying their goods at very high interest rates either through high street stores with legitimate repayment arrangements or by turning to illegal loan sharks. Tier 2: Sustained employment for parents Adult skills Professionals are concerned about the numbers of local residents who have literacy and or numeracy problems, as well as basic skills more broadly. There is a clear understanding on the part of many professionals that the families they support are doubly disadvantaged living in a city with such a high proportion of students and graduates and also patterns of migration into the city for seasonal work.
33
Brighton & Hove Child Poverty Needs Assessment, 2010-2011, Draft V.1.0
Childcare Professionals echo families in their concerns about the costs of living for families bringing up children. In particular the relationship between the costs of childcare and low wage work is a key concern, despite the recognised impact of the childcare element of the working tax credit. The transition between benefits and training or work is also seen as particularly problematic for parents and carers. Childcare deposits, which can total hundreds of pounds, can make returning to work unfeasible for some families. Tier 3: Improved life chances for children and young people, their families and communities Educational attainment Locally there is recognition from education professionals about the importance of the Early Years Foundation Stage in preparing children in childcare for their reception year in school, and there are high hopes that it will be reflected in the attainment of those children over the years to come and into secondary school. However there is also recognition locally from a range of professionals that some children do not have a strong enough culture of aspiration and suffer poorer attainment as a result. Concern has also been voiced about the general under performance at GCSE level of young people in Brighton & Hove. Targeted family support It is acknowledged that certain families require a significantly higher amount of support and intervention due to multiple or complex needs. These families therefore require a coordinated range of support between services if they are to change their circumstances, as demonstrated for instance through the Family Intervention Project. Disabilities Children and families with disabilities are seen as having less opportunity to access the cultural and social life of the city. In part as a result of financial concerns but also in terms of expertise in including children and young people with special needs. Costs for housing adaptations, heating and specialist equipment are seen as a significant additional expense for families with children with disabilities. In addition, for some parents, there is neither the funding nor the expertise available for someone else to care for their child while they train, work or take a break. Health and wellbeing Nationally there is evidence that the impact of ongoing health conditions, and in particular mental health problems, on a parent’s ability to work, train or raise their children is widespread amongst some of the poorest families.
34
Brighton & Hove Child Poverty Needs Assessment, 2010-2011, Draft V.1.0
Locally the following conditions and behaviours are seen by professionals to be priorities:
• Mental health problems
• Chronic health conditions
• Families experiencing drug and/or alcohol misuse
• Domestic violence Family housing A key concern for professionals is the difficulty of finding decent quality accommodation that is appropriate for families in the city. Overcrowding is seen as a common problem in both social housing and the private rented sector, and also to some degree in the home owner market too. The reduction in the numbers of family homes as a direct result of the growth in multiple occupancy housing has also been raised as an issue in some areas of the city. Communities There is a perception among professionals that within some communities there is a poverty of aspiration, and that the experience of belonging to such a community can also affect aspirations within families. Low level skills and unemployment within families is also seen as contributing to low aspirations. Professionals also talked about the sense that there are two aspects to the city, the cultural and social centre and clusters of deprived communities on the outskirts. This isolation is seen as being both due to material considerations and the degree to which some residents feel uncomfortable outside their immediate community. This links closely to a broader perception that families from the poorer neighbourhoods participate less in the general cultural and social life of the city. In this context the work of schools and community organisations around events such as the Children’s Parade and the Children’s Festival are considered of high importance in enabling marginalised children and young people to have a greater sense of belonging.
35
Brighton & Hove Child Poverty Needs Assessment, 2010-2011, Draft V.1.0
11. Expert opinion and evidence base There is a growing body of evidence of initiatives that are proven to change and improve circumstances for families. This section provides the basis for a menu of good practice to inform development of the local Child Poverty Strategy and also future Intelligent Commissioning activity. The following are a selection of projects which are either locally evaluated, are validated as examples of best practice through the Centre for Excellence in Outcomes for Children (C4EO) or are used as evidence in the Graham Allen review. The Child Poverty Profile on BHLIS provides access to further evidence of good practice. Tier 1: Financial support for families Financial Support Children’s Centre Moneywise Project, Kirklees Citizen’s Advice Bureau advisors staff work alongside children’s centre staff focusing on uptake of unclaimed benefits and managing debt payments. For an annual cost of £100,000 in 2008 this project secured £602,000 in incomes gain and debt management for 556 families. Parental earnings and costs of living Housing Options Brighton & Hove Staff had refresher training on debt, benefit advice and preventing homelessness due to mortgage arrears. As a result homelessness prevention for mortgage arrears cases increased by 140% and the number of households having to make homeless applications due to mortgage repossessions has decreased by 27% Tier 2: Sustained employment for parents Adult Skills Family Learning Programme, Brighton & Hove Parents are supported to improve their children’s learning and are also supported into adult training and skills. It is particularly effective in engaging parents with basic skills training. This externally evaluated programme supports a number of key outcomes for reducing child poverty and also importantly impacts on ‘Tier 3’ educational achievement. Early Years Excellence Centre working with Job Centre Plus, Blackburn with Darwen Joint working between Jobcentre Plus (JCP) and Early Years Excellence services delivered through children’s centres. A simple referral form enables initial contact between the JCP and the Children’s Centre Network. It has been adopted Borough wide and resulted in high numbers of referrals between Jobcentre Plus and the Children’s Centre Network. It has increased uptake of children’s centre services and engaged adults with back to work initiatives and tax credit take up.
36
Brighton & Hove Child Poverty Needs Assessment, 2010-2011, Draft V.1.0
Childcare The focus is on the impact of good quality childcare to improve training and employment prospects for parents and carers. Making childcare affordable via subsidies for targeted families, such as the Care2Learn national programme of subsidies for young parents in training, has been evaluated as successfully enabling parents to gain skills and qualifications. Less targeted subsidy via the childcare element of the working tax credit makes childcare more affordable for families working on low incomes. Whilst these programmes and benefits can be evaluated in terms of their immediate impact on work or training, there is little evaluation of the medium to long term impact on outcomes for family income and child poverty. Tier 3: Improved life chances for children and young people, their families and communities Education Educational achievement is seen as the most vital component in enabling children and young people out of poverty. The importance of emotional resilience and aspirations to improve attainment is highlighted throughout the C4EO validated programme of practice. Families and Schools Together (FAST) pilot, National and Brighton & Hove This is one of the few programmes that shows an impact on a wide range of outcomes both in terms of engaging parents with their children’s education and raising attainment and improving behaviour in school. Targeted families are supported to engage more confidently with school and their children’s learning and to create an informal support network between parents. My Future, My Choice, Bristol Imaginative shows and workshops are used to extend and increase young peoples’ ambitions for themselves and their careers. It is shown to raises aspirations and improve knowledge and awareness of future life opportunities in order to inform the choices that they make for study at the end of Key Stage 3. Targeted Family Support Family Recovery Programme, Westminster (Think Family pilot) The Family Recovery Programme (FRP) consists of a multi-agency team around the family who work with and support families who are most at risk of losing their homes, having their children taken into Care, or face prison. The Team Around the Family (TAF) devises a single care plan that takes into account the varying needs and problems of each family member. Typically, the TAF works with families for 6 to 12 months and support and services are phased to avoid overloading the family. The care plan uses intensive outreach work to create a possibility of change. The family is involved with the process throughout.
37
Brighton & Hove Child Poverty Needs Assessment, 2010-2011, Draft V.1.0
The FRP is groundbreaking because agencies who usually only work with adults are part of the core team around the family working alongside agencies who usually focus on children. There are two lead workers for each family: one for the adults and one for the children to co-ordinate services involved. Think Family pilot, Brighton & Hove Think Family aims to improve outcomes for families experiencing risk factors such as parental mental health issues, parental substance misuse, domestic violence, long term intergenerational unemployment, and poor housing. In November 2010, 130 families in Brighton & Hove were registered with the project. The project has provided training for over 250 members of staff from both adult’s and children’s services, in both the statutory and voluntary sector, in using the think family approach. It has widened the scope of the Common assessment Common Assessment Framework (CAF) which has enabled staff to better assess whole family support (now called Family CAF). Family Nurse Partnerships (FNP) Pilots, National This programme is proven to improve antenatal health, child health and development and economic self sufficiency of the family. The FNP is a voluntary programme offered to young mothers having their first baby. The programme consists of frequent structured home visits until the child is 2 years old Functional Family Therapy (FFT), Brighton & Hove An assertive outreach model that works with difficult to engage families, where there are high levels of conflict/distress and a young person is likely to be involved in offending or at risk of becoming looked after. Providing FFT to 100 children and young people as a successful alternative to foster care costs £200,000 annually against an estimated saving of £3.5 million in looked after costs. Triple P Programme, Brighton & Hove Triple P is a system of easy to implement, proven parenting solutions that helps solve current parenting problems and prevents future problems before they arise. It has been delivered extensively in Brighton with well evidenced results. Disabilities Amaze Disability Living Allowance (DLA) project, Brighton & Hove The Amaze DLA project provides volunteers to support the City’s most vulnerable families complete the difficult Disability Living Allowance claim form. The project costs £59,000 and In 2009/10 generated £2m of DLA benefit and £1m of other passported benefits, so for every £1 spent generates £51 for households with disabled children.
38

Brighton & Hove Child Poverty Needs Assessment, 2010-2011, Draft V.1.0
Health and Wellbeing The UK Resilience Programme, Hertfordshire An 18 lesson programme that is aimed at 11-13 year olds which enables them to develop skills in emotion control and emotional awareness, problem solving, assertiveness, peer relationships, and decision making. ‘Building Bridges’, Family Action, London Boroughs The service meets the needs of families where parents have severe and enduring mental health problems. It aims to intervene early so as to reduce the escalation of an adult’s mental health problems, reduce the need for acute hospitalisation of adults and care orders for children, and improve the safeguarding and development outcomes for children ‘Changing Trax’, Newcastle A crisis intervention model working with families where there are serious child protection concerns related to parental substance misuse. The crisis intervention programme provides intensive time-limited work with families where there are problems with substance misuse that may lead to the child becoming looked after or becoming subject to a child protection plan. Youth Alcohol Partnership Intervention, ‘Operation Park’, Brighton and Hove Operation Park uses multi-agency identification and tiered intervention for young people. This project aims to identify and intervene more effectively to lead children and young people away from problem alcohol use and support families. Family Housing Turning the Tide, Brighton & Hove The Turning the Tide pilot reshaped housing management services to use resources more effectively. Through early identification and building staff capacity they are able to address the needs and behaviours of individuals and families whilst retaining a focus on housing and tenancy management. Evaluation of the pilot shows increased levels of resident satisfaction in relation to anti-social behaviour, increased referrals to service and increased time in the community for housing officers. Under-Occupations Officer, Brighton & Hove This role has increased the number of family sized homes available in the city by supporting and incentivising tenants to move from a property that is larger than their needs. In 2008/9 this work released more than 80 family sized homes.
39

Brighton & Hove Child Poverty Needs Assessment, 2010-2011, Draft V.1.0
Communities ‘Coo-l’ prepaid card, Tower Hamlets Tower Hamlets funds 300 prepaid cards with £25 a month that can be used at a variety of venues in the area and in London. The cards are given to young people aged between 9 and 11 who are referred by youth workers. Amaze ‘Compass Card’, Brighton & Hove The Compass Card provides over 30 offers of free and discounted access to local leisure and cultural opportunities and sports facilities and activities. It is available to children and young people registered on the Amaze disabled children’s database and is highly valued by 1,400 families using it. This is due in part to the significant financial savings it provides and also because they know that the organisations which accept the card will provide a safe and inclusive welcome to their children.
40

Brighton & Hove Child Poverty Needs Assessment, 2010-2011, Draft V.1.0
12. Recommendations for further evidence gathering i. Identify parents and carers registering for adult services in the following areas:
• Advice services
• Mental health services
• Drug and alcohol services
• Domestic violence ii. Determine with the Department for Work and Pensions (DWP) access to local data
on persistent poverty in out of work families, which is defined as children and young people in families who are living in poverty for 3 out of 4 years.
iii. Identify families in out of work and working poverty as part of the current work being
developed by children’s services to track educational attainment for the most deprived families in the city.
iv. Research with lone parents to identify the particular barriers and challenges to
moving out of poverty, as the largest family group in the city.
41

Brighton & Hove Child Poverty Needs Assessment, 2010-2011, Draft V.1.0
13. Timeframe and key contacts The Brighton & Hove Child Poverty Needs Assessment reported to the following boards:
• The Brighton & Hove Children & Young People’s Trust Board, 21 March 2011
• The Brighton & Hove City Council Children & Young People’s Overview & Scrutiny Committee, 23 March 2011
• The Brighton & Hove Public Service Board, 10 May 2011
• The Brighton & Hove Strategic Partnership, 24 May 2011 The Child Poverty Needs Assessment and accompanying Child Poverty Profile is published on the Brighton & Hove Local Information Service (BHLIS) An annual refresh of the data profile is intended subject to comparable data being made available. For more information about the Brighton & Hove Child Poverty Needs Assessment please contact: Sarah Colombo, Early Years and Childcare Strategy Manager, Brighton & Hove City Council, [email protected], 01273 294218 Matthew Wragg, Acting Central Policy Development Team Manager, Brighton & Hove City Council, [email protected], 01273 293944
42

Brighton & Hove Child Poverty Needs Assessment, 2010-2011, Draft V.1.0
Appendix 1 Case Study, Child Protection Risks This case study is taken from Redesigning Provision for Families with Multiple Problems, Department for Education, 2010. Shaded triangles within the pyramid below highlight the services that would be involved to support the family in the case study.
This family consisted of a mother, the mother’s partner of 10 years, and three boys aged 15, 13, and 11. There was a history of family difficulties: conflict within the family, financial and housing difficulties, early participation in antisocial behaviour, attachment issues and aggressive behaviour. The family was very hard to engage and had been known to services over a number of years. The case went to a Child Protection Strategy Meeting because of the physical violence between the two younger boys. Family focused support involved: Parenting support The mother accepted there was a problem with boundary setting and agreed to undertake a Triple P parenting course. The partner did not take any role in parenting the boys due to being refused admission to a family meeting 10 years ago. The family received support from the lead practitioner, as well as an NSPCC anti-bullying project. The mother and partner signed a contract outlining that they would spend quality time with the children: the partner would take them fishing; and the mother agreed to attend an art and crafts course with the 13 year old to help develop attachment.
Targeted family
support
Education Disabilities Health & wellbeing
Family housing
Tier 3: Factors that directly influence families’ abilities to enter and sustain well paid
employment and escape poverty now and in the future
Tier 1: Factors that directly influence
families’ resources and incomes today
Tier 2: Factors that directly influence families’ abilities to enter and
sustain well paid employment in the short and longer term
Child
Poverty
Financial support
Parental employment & earnings
Costs
Adult skills
Transport Job availability
Childcare
Communities
43

Brighton & Hove Child Poverty Needs Assessment, 2010-2011, Draft V.1.0
Peer relationships The 13 year old physically bullied the 11 year old. The practitioner referred the 11 year old to a NSPCC anti-bullying project to help raise his self-esteem. He is now much more positive about his relationship with his brother and is attending a young carers’ project to access additional support and positive activities. The junk room downstairs has been turned into a bedroom for the oldest son, meaning each boy has their own bedroom, which has reduced fighting and bullying. A contract has been drawn up between the two younger boys and if they adhere to it they will be rewarded with a meal of their choice. The 13 year old has completed workbooks on bullying and anger management with support from a teaching assistant at school. The practitioner also liaised with the local community police officer for the oldest son to be engaged in a restorative justice programme to address his behaviour when the NSPCC work finished. Debt issues A benefit check consent form was completed and Pathfinder staff worked with the family on budgeting. School attendance The 11 year old was truanting from school. The mother now takes him to and from school. Communication between parents and the school has improved dramatically. Mental health The practitioner accompanied the mother to a GP appointment to address her depression and support from a therapist was accessed. Education/training The mother wanted to complete a computer course and had an interview but could not afford the £350 course fees. She successfully applied to become a volunteer at the learning centre (and consequently will get the course free of charge); and is awaiting CRB checks. Engagement in positive activities The practitioner provided information on football courses and karate sessions for the boys for the summer holidays. The practitioner also supported them to complete an application form to the Family Holiday Association to provide them with a break away and enable them to engage in positive activities as a family. Outcomes identified include
• Child Protection: the six weekly review meeting brought a unanimous decision to reduce the level of concern on the family. Consequently, the case was not referred up to the Child Protection team.
• Improved attendance at school. The Education Welfare Officer is no longer involved with the family.
44

Brighton & Hove Child Poverty Needs Assessment, 2010-2011, Draft V.1.0
• Reduction in bullying and fighting by the 13-year old.
• Improved self-esteem for the 11-year old.
• Mother’s partner is now taking an active role in parenting the boys.
• The boys have clear boundaries around behaviour at home and within the family.
• A reduction in anti-social behaviour which made the tenancy more secure and prevented legal action being taken by the housing provider.
• The family are learning to manage their finances.
• The mother is working as a volunteer and is going to complete a computer course.
• The boys are engaging in positive activities.
• There has been an improvement in attachment between the mother and her 13-year old son.
45

Brighton & Hove Child Poverty Needs Assessment, 2010-2011, Draft V.1.0
Appendix 1 Case Study, Domestic Violence This case study is provided by Rise, a local charity which supports women, children and young people affected by domestic abuse in Brighton & Hove and across West Sussex. Shaded triangles within the pyramid below highlight the services that would be involved to support the family in the case study.
Family Jane – Mother John – Father Jim – Son (aged 7) Jen – Daughter (aged 3) Issues at time of initial assessment at Rise Jane was referred to Rise in July 2008 and reported since discovering that her partner John (also the children’s father) had been convicted of rape against a 14 year old girl about 15 years previous, he had become physically and emotionally abusive towards her. John was arrested for an incident where he physically assaulted Jane and was given bail conditions not to contact Jane or the children however proceeded to breach the bail conditions. A restraining order was issued however John continued to breach the order on numerous occasions. Jane and the children were very frightened of John and did not want any further contact from him. John was persistent in his attempts to contact Jane and the children despite a court order that issued no contact along with a Child Protection Plan in
Targeted family
support
Education Disabilities Health & wellbeing
Family housing
Tier 3: Factors that directly influence families’ abilities to enter and sustain well paid
employment and escape poverty now and in the future
Tier 1: Factors that directly influence
families’ resources and incomes today
Tier 2: Factors that directly influence families’ abilities to enter and
sustain well paid employment in the short and longer term
Child
Poverty
Financial support
Parental employment & earnings
Costs
Adult skills
Transport Job availability
Childcare
Communities
46

Brighton & Hove Child Poverty Needs Assessment, 2010-2011, Draft V.1.0
place that prevented John from having any contact with the children as a result of the risk to children (Schedule One Offender) and because of the domestic violence he perpetrated against Jane and the children. Throughout the past two years, John has made several applications to the Family Court for supervised visits and continues to breach the restraining order against him. Both criminal and family proceedings court cases are ongoing with the family. Rise Intervention Jane received one to one support from an Independent Domestic Violence Advocate and from an Outreach Caseworker and was advised on available housing options, welfare benefits, criminal and civil remedies, safety planning and risk management. Rise advocated with other professional agencies such as the police, solicitors, probation, courts, social services and Housing Options in an attempt to ensure that Jane and her children’s safety needs were prioritised by the agencies supporting the family. Economic Impact on the family Jane and the children were made homeless as Jane could no longer keep herself and the children safe if they continued to live in the family home as a result of John’s continued harassment and abuse. One of Jane’s options was to move in to refuge accommodation, which is a safe house where Jane and her children could remain temporarily until they find somewhere more permanent. Jane would have had to quit her job so that the risk of John tracking her down at the refuge was significantly reduced. Jane decided to keep her job and instead gave up her current tenancy and moved to a new accommodation in the private sector, which she described as being in poor condition and felt the area was unsafe to raise her children but was her only option as the rent was significantly cheaper and affordable. Jane and the children’s standard of living had decreased significantly as a result of the move. In order for Jane to afford the rent, she took a two bedroom flat and the children had to share a room. Jane had to pay half the deposit to secure the property and was supported by the council to pay the remaining half. The loss of John’s income meant that Jane had to apply for welfare benefits to top up her income. They could no longer afford to keep the family pet and had to give their dog to a family friend to look after. In addition to having already lost their father, Jane described this as another traumatic loss for the children. Jane could no longer afford to keep the children in after school sports and needed instead to pay for a child minder to look after the children after school while she was at work. Jane expressed frustration that there was no financial support to help parents on low incomes pay for child care. The children could no longer access extracurricular activities which Jane felt denied the children the opportunity to develop confidence, learn social skills and build healthy relationships during a time when they needed this most. Jane felt that the children blamed her for the loss of their father and dog and also for taking away the activities they previously enjoyed and her relationship with the children was affected negatively. Jane’s mental health suffered as a result of her experiences. She identified feeling depressed and stated that the financial difficulties they faced living as a single parent household further exasperated the issues she was already dealing with as a result of the domestic violence.
47

Brighton & Hove Child Poverty Needs Assessment, 2010-2011, Draft V.1.0
Despite the fact that she had fled from her partner, she continued to be harassed by John and was living in an area where she did not feel it was safe to bring up the children. She had to work more hours in order to bring in enough income to support the family but still couldn’t provide the standard of living that they had when John was a part of the household. Since leaving, John has not contributed any financial support to the family for the children.
48

Brighton & Hove Child Poverty Needs Assessment, 2010-2011, Draft V.1.0
Appendix 2 Key Evidence The following is a selection of key national and local evidence used to complete the Child Poverty Needs Assessment. National • HM Revenue & Customs (for official child poverty data), http://www.hmrc.gov.uk/index.htm
• Child Poverty Unit, http://www.education.gov.uk/childrenandyoungpeople/families/childpoverty
• Centre for Excellence and Outcomes in Children and Young People's Services, http://www.c4eo.org.uk/themes/poverty/default.aspx?themeid=7&accesstypeid=1
• Child Poverty Action Group, http://www.cpag.org.uk/publications/
• Joseph Rowntree Foundation, http://www.jrf.org.uk
• Office for National Statistics, http://www.statistics.gov.uk/default.asp
• The Foundation Years: preventing poor children becoming poor adults, Frank Field MP, HM Government, 2010
• Early Intervention: The Next Steps, Graham Allen MP, HM Government, 2010 Local
• Brighton & Hove Sustainable Community Strategy; ‘Creating the City of Opportunities’
• Brighton & Hove Children & Young People’s Plan, 2009-2012
• Annual Report of the Director of Public Health, NHS Brighton and Hove, 2009
• City Employment & Skills Plan, City Employment & Skills Steering Group, 2011-2014 (to be published, 2011)
• Brighton & Hove 14-19 Strategy Update, Brighton & Hove Learning Partnership, 2010-2015
• Brighton & Hove Adult Learning Strategy, Brighton and Hove Learning, 2007-2009
• Brighton & Hove Housing Strategy, Healthy Homes, Healthy City, Healthy Lives, 2009-2014
• Brighton & Hove Community Safety, Crime Reduction and Drugs Strategy, 2008-2011 (revised 2010)
• Brighton & Hove Joint Strategic Needs Assessment (JSNA) Summary, 2011
• Developing Appropriate Strategies for Reducing Inequality in Brighton and Hove (Reducing Inequality Review), OCSI/Educe Ltd, 2007
• Brighton & Hove Child Poverty Profile, Brighton & Hove Local Information Service (to be published, 2011)
49

Brighton & Hove Child Poverty Needs Assessment, 2010-2011, Draft V.1.0
Appendix 3 Map: The percentage of children & young people living poverty in Brighton & Hove by Lower Super Output Area (LSOA)
50

Brighton & Hove Child Poverty Needs Assessment, 2010-2011, Draft V.1.0
Appendix 3 Map: The percentage of children and young people living in poverty in out of work families by Lower Super Output Area (LSOA)
51

Brighton & Hove Child Poverty Needs Assessment, 2010-2011, Draft V.1.0
Appendix 3 Map: The percentage of children and young people living in poverty in working families by Lower Super Output Area (LSOA)
52

Brighton & Hove Child Poverty Needs Assessment, 2010-2011, Draft V.1.0
Appendix 3 Map: The percentage of children and young people living in poverty in lone parent families by Lower Super Output Area (LSOA)
53

54