annual standards report - brighton & hove city council...
TRANSCRIPT

1
Annual Standards Report
2013/14 December Version: unvalidated data
For further information please contact: Hilary Ferries, Head of Standards and Achievement, Education & Inclusion, [email protected]
139
2
Introduction The local policy context in Brighton & Hove is one in which there is a strong emphasis on partnership working with and between schools, paired with robust data analysis and challenge. The Children’s Services department is working closely with schools developing the concept of what ‘schools supporting schools’ means in the city. This approach is captured in the School Improvement Strategy and will be explored further this year. This report is an analysis of standards and achievement in the city, based on the provisional 2013/ 2014 results at the end of each Key Stage. Not all the results are validated yet so some of what we have is provisional at this stage. This report will be updated in March when the Key Stage 4 and Key Stage 5 data will be validated and secondary RAISEonline published. The report also identifies the key priorities of the Education and Inclusion Team. There are national changes planned to the way that schools measure progress and assess pupils for 2016. We are working with headteachers and assessment leads to prepare for this. School Effectiveness The percentage of schools judged to be good or outstanding in the city fell from 80% in summer 2013 to 78%% in summer 2014. Her Majesty’s Chief Inspector (HMCI) published his annual report on 10 December. Across primary nationally there has been a rise of three percentage points in the number of primary schools judged to be good and outstanding (from 79% to 82%) the picture in the secondary phase nationally has remained the same as last year (71%) and we were below this at 67%. We know there is still much more to be done to ensure that all pupils in the city attend a school that is judged good or outstanding. Structure of the report The document is in two sections: an analysis by Key Stage and a summary of ‘Closing the Gaps in Educational Achievement’.
Section One. Key Stage Analysis 1. Early Years and Foundation Stage (age 5) Main points:
• The % of children achieving a Good Level of Development has risen by 16% to 60%. This is in line with national %.
• 60% of children have achieved the expected level in all the early learning goals which is a 17% rise this year and in line with national.
• The lowest scoring area of learning is literacy- early reading and writing.
• The gaps in % of children who achieved a Good Level of Development is reducing for pupils with FSM by 2% to 22%
• The gap in % of children who achieved a Good Level of Development has significantly reduced for children with EAL to 2% from 14%
1.1 The Early Years Foundation Stage Profile data this year has returned to be in line with national
figures following a significant dip last year as a result of a new national assessment profile
introduced across the country. As with all new national assessments it takes three years to settle
and become a robust set of data.
140

3
In order to improve our moderation process the Brighton & Hove early years team worked in
partnership with seven other Local Authorities across the South East to ensure a shared and
agreed understanding of the “expected level” for each area of learning. Professional development
moderation events were held across the city throughout the year to support all reception teachers
to make accurate and robust judgments. Additional support was given to all newly qualified
teachers, new to Reception and schools in a category of need. We continue to offer a termly
meeting for all EYFS coordinators to share good practice and national priorities.
Writing and reading are the lowest scoring areas of learning and we will continue to offer targeted
support and challenge to those schools with low results and newly qualified teachers. Ongoing
courses on early literacy and maths are offered to all schools alongside a targeted group of
additional projects aimed at the high category schools.
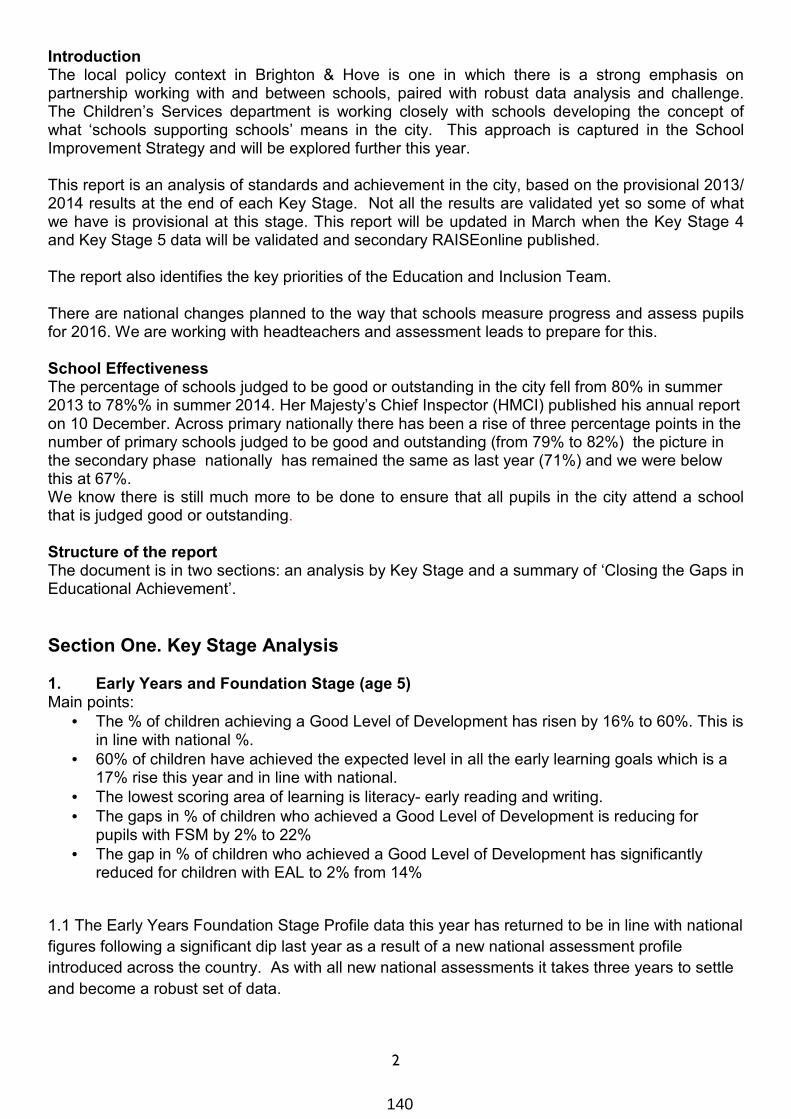
1.2 The table below shows the percentage of pupils working at the ‘expected’ and ‘exceeding’ in
each area of learning compared to national figures
Early Learning Goals B&H 2013
National 2013
B&H 2014
National 2014
PRIME LEARNING GOALS
Listening and attention 79.2 81.0 86.4 84
Understanding 81.9 81.0 88.5 84
Speaking 78.2 78.0 86.3 82
Moving and handling 87.1 87 90.4 89
Health and self-care 90.8 88 94.6 90
Self-confidence and self-awareness 84.8 85 90.4 87
Managing feelings and behaviour 83.0 83 89.1 86
Making relationships 84.5 84 90.8 87
SPECIFIC LEARNING GOALS
Reading 64.3 71 75.0 74
Writing 56.1 62 70.2 67
Numbers 66.3 69 81.6 74
Shape, space and measures 78.3 75 87.2 79
People and communities 84.7 80 91.7 84
The world 85.9 80 92.7 83
Technology 90.7 88 95.2 90
141
4
Exploring media and materials 86.6 82 93.4 86
Being imaginative 85.9 81 93.6 85
AREAS OF LEARNING
B&H 2013
National 2013
B&H 2014
National 2014
Communication and Language 71.0 72 80.4 77
Physical Development 83.8 83 88.9 86
Personal, Social and Emotional Development
74.8 76 84.0 81
Literacy 54.4 61 68.1 66
Mathematics 64.0 66 79.8 72
Understanding the world 79.4 75 88.8 80
Expressive arts and design 82.2 78 91.5 83
Overall B&H 2013
National 2013
B&H 2014
National 2014
Prime Learning Goals 61.4 Not published
73.2 Not published
Specific Learning Goals 47.4 Not published
64.2 Not published
All Learning Goals 42.9 Not published
59.0 Not published
Average points 32.8 32.8 34.4 33.8
Good Level of Development 43.3 52 60.1 69
Next steps • Target support to NQTs, new to Reception and high support schools
• Continue to work in close partnership with other local authorities in the south east
• Continue to offer training to all teachers working in the EYFS
• Work in partnership with targeted schools on a project on early writing.
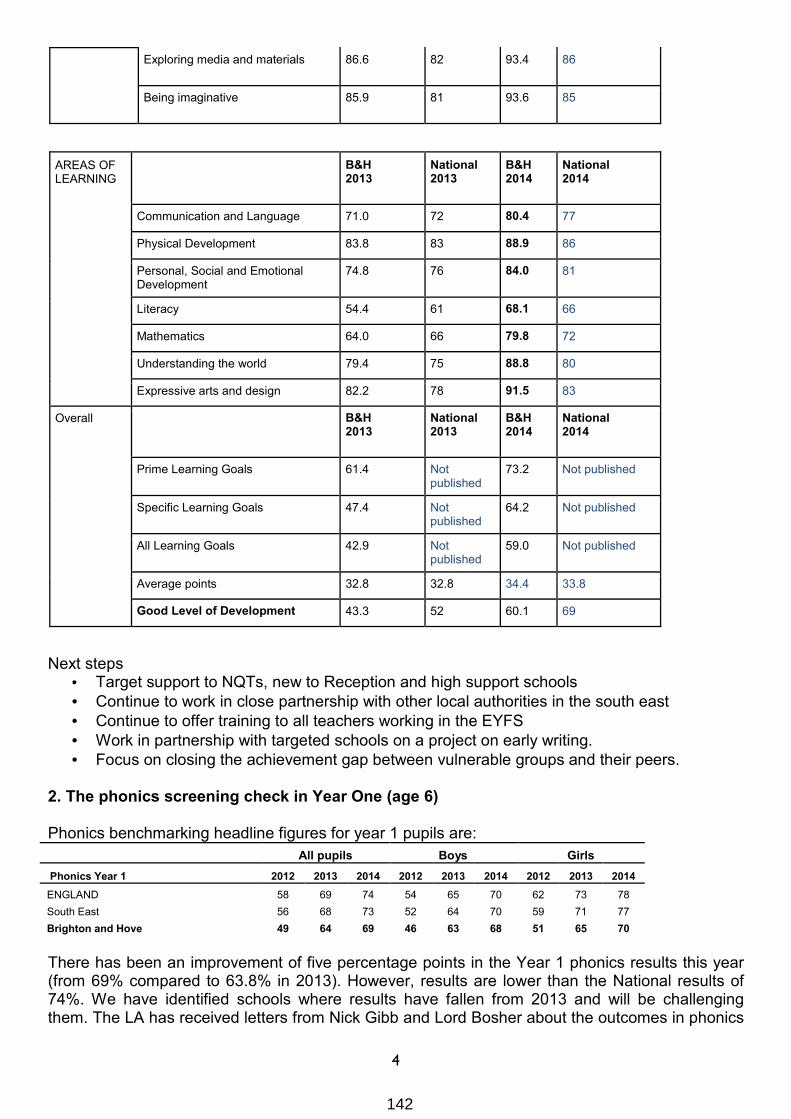
• Focus on closing the achievement gap between vulnerable groups and their peers. 2. The phonics screening check in Year One (age 6) Phonics benchmarking headline figures for year 1 pupils are:
All pupils Boys Girls
Phonics Year 1 2012 2013 2014 2012 2013 2014 2012 2013 2014
ENGLAND 58 69 74 54 65 70 62 73 78
South East 56 68 73 52 64 70 59 71 77
Brighton and Hove 49 64 69 46 63 68 51 65 70
There has been an improvement of five percentage points in the Year 1 phonics results this year (from 69% compared to 63.8% in 2013). However, results are lower than the National results of 74%. We have identified schools where results have fallen from 2013 and will be challenging them. The LA has received letters from Nick Gibb and Lord Bosher about the outcomes in phonics
142

5
and we have sent them our response and detailed action plan to address the issues they raised. 3. Key Stage 1 Assessments (tests at age 7) This is a positive picture. The 2014 Key Stage 1 teacher assessments show that the percentage of pupils achieving the expected level has continued to rise in all subjects which reflects the national results. There has been particularly good improvement in the attainment at the higher Level 3. The children have improved by 4.9% in reading, 2.8% in writing and by 2.4% in maths. Reading
All schools 2012 - 2013 2013-2014 difference National
L2+ 90.1 90.9 +0.8 89.5
L3 31.4 36.3 +4.9 23.9
APS 16.6
Writing
All schools 2012 - 2013 2013-2014 difference National
L2+ 85.8 87.4 +1.2 86.2
L3 13.3 16.1 +2.8 16.1
APS 14.9
Maths
All schools 2012 - 2013 2013-2014 difference National
L2+ 93.4 94.4 +1 92.2
L3 25.1 27.5 +2.4 24.3
APS 16.5
Next Steps A focus on phonics to ensure all schools are aware of best practice Citywide maths project - the second year Writing Project with Pie Corbett and other writing initiatives Prepare for ‘life without levels’ 4. Key Stage 2 (tests at age 11) The results for the Key Stage 2 national curriculum tests taken at the end of year 6 indicate a rise in attainment in all subjects. Reading, writing and maths combined for Brighton & Hove was above national average both at level 4+ and level 5. The percentage of pupils with a ‘good level 4’ (ie 4b or above) was 70% this year which is three percentage points above the national average.
KS2 RWML4+ 2011 2012 2013 2014
B&H All 64% 74% 79% 79%
Stat neighbours 72% 74% 77%
England 75% 76% 78%
Overall attainment at level 4+ in Reading, Writing and Maths combined at
the end of key stage 2.
The city’s “expected progress” of two levels in reading, writing and maths also rose and was above the national average. This is a positive picture for KS2
143

6
Floor standard The ‘floor standard’ for 2014 for Key Stage 2 is: Above 65% for Level 4 in reading writing and maths More than the national median for two levels progress in reading More than the national median for two levels progress in writing More than the national median for two levels progress in maths There are two schools that are below the floor standard’ St Nicolas CE Primary School and Carden Primary School. The diagram below shows how the schools provisionally sit against the floor standard (using 2014 national medians) Next steps
• Focus on schools where the data indicates they are below any of the floor standards
• Focus on schools that may be vulnerable to dropping an Ofsted grade
• Continue with the City wide maths project to address lower achievement in maths
• Continue the Primary Writing Project and explore other ways of improving writing
• Continue to support the introduction of the New Primary Curriculum
• Prepare for ‘life without levels’
144

7
*St Mark’s Aldrington Westdene Woodingdean Rudyard Kipling St Andrew’s St Margaret’s
Downs Junior St John the Baptist Benfield Fairlight *Moulsecoomb
Queens Park *West Blatchington St Bernadette’s
St Joseph’s Middle Street Mile Oak
*City Academy Whitehawk Somerhill Stanford Junior Bevendean
Coldean Cottesmore Goldstone Hertford Junior Our Lady of Lourdes Saltdean St Mary’s St Luke’s
94% pupils made at least two levels progress in Reading (National median 2014) Balfour
Carlton Hill *Coombe Road St Paul’s Hangleton Junior St Martin’s St Bartholomew’s
93% pupils made at least two levels progress in Maths (National median 2014)
96% of pupils make two levels progress in writing (National median 2014)
Below the Progress floor standards Elm Grove Peter Gladwin *Carden Hove Juniors Patcham Junior *St Nicolas St Mary Magdalen
145

8
6. Key Stage 4 (GCSE at age 16) Introduction 6.1 Due to a range of reforms taking effect on this year’s results it is not possible to draw strong
comparisons between 2014 and preceding years.
6.2 National Changes
6.2.1 There were four major changes to the GCSE exams in 2013/2014.
6.2.2. It is important to note that the Department for Education (DfE) did not know what the impact
of the changes would be, either individually or collectively. Ofqual separately wrote an open letter
to schools in July 2014 warning of unusual variability being found in school outcomes and specific
mention of the consequences of early entry, the switch to linear course and the changes to English
all having impact.
6.2.3 On the 23 October the Department for Education released provisional LA and national statistics on the main GCSE attainment indicators: the percentage of pupils achieving 5+ A*-C including English and maths, the percentage of pupil entered and achieving the English Baccalaureate, percentage expected (3+ levels) progress in English, and percentage expected (3+ levels) progress in mathematics. The national statistics for all state-funded schools 2013/14 have been reported using the 2013 methodology (best entry with no Wolf rules applied), a comparison figure (with Wolf rules and best entry result), and as the new 2014 methodology (both Wolf and early entry rules applied). 6.3 Brighton & Hove
6.3.1 The English and maths % A*-C result for B&H is below the national figure by three
percentage points, 55% and 58% respectively. From last year there was a national and B&H drop of three and nine percentage points respectively. This suggested national % 5+ A*-C qualifications including English and maths has been affected to a greater extent by 3+ A*-C results in subjects other than English and maths, whilst B&H results more affected by English and maths A*-C results than 3+ A*-C in other subjects.
146

9
6.3.2 In English expected progress (3+ levels) from the end of primary school B&H is in line with the national figure of 71%. There has been a drop of three percentage points for B&H but national is the same as in 2013.
6.3.3 In Mathematics expected progress (3+ levels) B&H is four percentage points below
national, 61% to 65% respectively, which is the same as last year. There has been both a national and a B&H drop of six percentage points.
6.3.4 The rank from top out of 152 local authorities in England fell in 5+ A*-C including English and maths and % expected progress in English from 59th to 110th, and 44th to 86th respectively. The rank stayed the same in % expected progress in maths at 116th.
6.3.5 The drop in % 5+A*-C including English and maths was 9 percentage points. This was
greater than the national state-funded drop of 6 percentage points and this degree of change happened in only 14 of the 152 local authorities in England.
6.3.6 The Brighton & Hove entry rate and percentage achieving the English Baccalaureate were below the state-funded national and south east region. In each English, maths and science components of the English Baccalaureate the percentage of pupils achieving was below state-funded national and south east region, but the entry rates were similar. In the history component the percentage of pupil achieving was similar to state-funded national and the south east region, but the entry rates were lower. In the language component the percentage of pupils achieving was above the national state-funded and south east region, but the entry rates were below.
6.4 Individual Schools
In order to better understand the reasons for the 2014 drop in performance the sequence of
conversation with schools has been undertaken. This has enabled us to determine what elements
of the reforms may have had the greatest impact in each individual school and ‘tell the story’ of
achievement in the city.
Some schools continued with qualifications which were discounted from 2014 as a result of the Wolf review. It is important that senior colleagues appreciate that whilst these qualifications are not counted against the schools performance they are of course valid for individual pupils. The fact that the maths foundation paper (which has C as the highest grade) was more ‘wordy’ than the paper which would have given A-C could have contributed to the higher number of D grades. The
changes to English assessment and early entry have been more significant for other schools.
147

10
6.4.1 Pupils achieving 5+ A*- C GCSEs or equivalent qualifications including English & Maths
7.1.2 Floor standard The ‘floor standard’ for 2014 for Key Stage 4 is:
• Fewer than 40% of pupils achieve five or more GCSEs at grade A*-C or equivalent, including GCSEs (or iGCSEs) in both English and mathematics
• The school has a below median score for the percentage of pupils making expected progress between Key Stage 2 and Key Stage 4 in English
• The school has a below median score for the percentage of pupils making expected progress between Key Stage 2 and Key Stage 4 in mathematics
The median school score for pupils making expected progress in English and in mathematics is 73 per cent for each in 2013 and this report uses those figures as at the time of writing, 2014 medians have not been published. The recommendations of the Wolf Review will be implemented for performance measures based on 2014 results. This means that, for example, no vocational qualification can count for more than 1 GCSE and a maximum of two vocational qualifications per pupil can count in performance tables measures. These changes will make the floor standard more demanding. There are no schools that are below the floor standard. The diagram below shows where the
secondary schools sit against the floor standard (using 2013 medians) .Only one school, Dorothy
Stringer, meets all aspects of the Floor Standard. This is based on 2013 data, so may change
when results are validated.
FIRST ENTRY Percentage of
pupils achieving 5+
A*-C or equivalents
including A*-C in both English
and mathematics
GCSEs – 2014 from
EPAS
BEST ENTRY
Percentage of pupils
achieving 5+ A*-C or
equivalents including A*-
C in both English and mathematics
GCSEs – 2014 from
EPAS
FIRST ENTRY
Percentage of pupils at the end of
Key Stage 4 achieving expected level of
progress between
Key Stage 2 and GCSE
English From Tables
Checking
FIRST ENTRY
Percentage of pupils at the end of
Key Stage 4 achieving expected level of
progress between
Key Stage 2 and GCSE
mathematics from EPAS
BEST ENTRY
Percentage of pupils at the end
of Key Stage 4
achieving expected level of
progress between
Key Stage 2 and GCSE
mathematics from EPAS
FIRST ENTRY
Percentage of Key Stage
4 pupils achieving
grades A*-C in both
English and mathematics
GCSEs From Tables
Checking
Blatchington Mill School and Sixth Form College
59% 59% 72% 72% 72% 60%
Brighton Aldridge Community Academy 28% 49% 95% 21% 57% 30%
Cardinal Newman Catholic School 60% 60% 71% 69% 69% 61%
Dorothy Stringer School 64% 64% 80% 77% 77% 68%
Hove Park School and Sixth Form Centre
59% 59% 77% 67% 67% 63%
Longhill High School 49% 49% 58% 53% 53% 49%
Patcham High School 46% 48% 73% 51% 51% 47%
Portslade Aldridge Community Academy
52% 54% 85% 64% 64% 62%
Varndean School 47% 48% 56% 59% 59% 49%
Brighton & Hove 52.6% 54.2% 70.4% 61% 63% 55.0%
National NCER from EPAS 55.3% 58.2% 70% 65% 68% 57.6%
148

11
40% of pupils achieve five or more GCSEs at grade A*-C or equivalent, including GCSEs (or iGCSEs) in both English and mathematics
73% of pupils making expected progress between Key Stage 2 and Key Stage 4 in English
73% of pupils making expected progress between Key Stage 2 and Key Stage 4 in maths
Dorothy
Stringer
BACA,
PACA,
Hove Park,
Patcham
Varndean, Longhill
Cardinal Newman
Blatchington Mill
8. Next Steps
• We will follow up on the Adviser’s visits to every school by providing ongoing monitoring
and support, challenge visits for schools, depending on their priority level.
• Predictions have been for some time an issue across secondary schools and this year were
a significant issue. We will introduce a more robust approach to quality assuring the
predictions provided by each school.
• The Children’s Services Performance Board will monitor and scrutinise these predictions on
a termly basis. Our focus on predictions will be on the Y11 and Y10 cohorts and the
predictions from each school will directly influence intervention.
• In line with our School Improvement Strategy, school improvement boards will be set up to
challenge, support and monitor the progress of high priority schools. As part of this process
we will identify schools where we may need to commission deep dive/HMI reviews scoped
together between school and LA.
• Individual more specific challenge sessions involving the Assistant Director and/or Head of
Standards and Achievement will take place with Head, and chair of governors in specific
schools where issues are wider than those linked to national changes in this particular year,
or where results and predictions stand out to be a major concern.
• We will meet with the chair of Secondary School Partnership to discuss her perception of
standards across the schools this year and agree the action SSP will take going forward.
• We will closely monitor the approach that six schools have embarked on as part of the
‘Challenge Partner’ programme together looking at the impact this is having throughout the
year.
• The LA will look closely with the SSP at how the current funding the LA is providing to the
partnership for school improvement is being used and how this directly links to the areas of
149

12
need. The progress linked to the resource provided will be monitored closely throughout the
year.
• We will continue to look closely at the use of the role of Teaching and Learning Consultant
and improve links with school lead teacher roles, the School Improvement Partner role, and
work of wider Standards and Achievement Team.
• Regular dialogue will take place between LA leads, all secondary heads and the wider
partnership at the Secondary and Continuing Education Partnership meetings where we will
have an opportunity to have a collaborative dialogue on secondary school improvement and
the strategy going forward.
• Regular dialogue will take place between LA leads and Secondary Chairs of Governors
(including academies) to have an opportunity to have a collaborative dialogue on secondary
school improvement, enhanced levels of accountability, increased focus on leadership role
of chair of governors and the strategy going forward. LA Representative will attend the
Secondary Chairs’ Group on a termly basis and report back to Assistant Director & Head of
Standards & Achievement.
• Further training and support will be provided to chairs and their governing bodies to support
them in their challenge role as governors. The deployment of National Leaders in
Governance (NLG) will be carefully considered based on the identified needs of governing
bodies linked to standards across the city.
• Specific work with the data team to review its role and relationship with other groups, for
example with the strategic data group, curriculum group and subject networks. Also how to
use the groups to the fullest to provide and share appropriate data and analysis throughout
the year to inform decisions regarding intervention.
• The LA will look at any capacity issues in the secondary school improvement system and
make proposals to address by commissioning new provision or intervention as needed.
• Regular communication with secondary heads and chairs of governors regarding school
improvement will take place throughout the year to ensure an ongoing open, collaborative
dialogue.
• We will review our approach to involving young people in school improvement. As part of
our strategy going forward we will create a focus group of young people across the schools
who can contribute to the development of our strategy going forward and provide challenge
and support alongside that of the Standards and Achievement team.
• We will review our City Wide Maths strategy and allocation of resources with secondary
heads to respond to this year’s results and adapt accordingly. The new Sussex Maths Hub,
led by St Paul’s Catholic College and St Richard’s College is offering a wide range of maths
opportunities which we will promote across the schools.
• We will look carefully at the different approaches to science across the city and share best
practice. We look to see if we need a citywide approach similar to that developed in relation
to maths.
8. Key Stage 5 (age 18) 8.1 Provisional results suggests that there has been good improvement in the A level results in Brighton & Hove schools and colleges as overall, students achieved above national averages in pass rates and the proportion of top A* - B grades.
150
13
8.2 National Changes The national picture is that A-level grades are slightly down this year and for the third year in a row there has been a small reduction in the proportion of A levels awarded top grades. The pass rate is down slightly for the first time in over 30 years, by 0.1% points to 98.0%. Just over a quarter of exam entries - 26.0% - were given A or A* grades, a slight fall on 2013's figure of 26.3%. There were also marginal falls in the proportion of entries in the A* to B grades. But the very highest A* grade has risen from 7.6% to 8.2%. 8.3 Brighton & Hove 8.3.1 Around 80% of A level students in the city study at the two sixth form colleges, around 50% at BHASVIC and around 30% at Varndean College. Around 20% of A level students study in the school sixth forms at Cardinal Newman, Blatchington Mill, Hove Park, BACA and PACA, with around half of these attending Cardinal Newman.
8.3.2 For 2013/ 14 there is an improving trend across the city, with most of the seven schools and colleges offering A and AS levels showing improvements in pass rates, ‘points per entry’* and the proportion of entries awarded top grades. The proportion of entries awarded A* - B grades improved to 54%, well above the provisional national average figure of 52%. The proportion of entries achieving a pass grade improved to 98.4%, again above the provisional national average of 98.0%
9. Not in Employment, Education, or Training (NEET) Throughout the year, the authority has worked with schools, colleges and training providers, and with the Youth Employability Service and other agencies, on a range of initiatives to maximise participation, including developing new provision, improving transition processes and providing personalised guidance to young people. 10. Attendance and Exclusions 10.1 Attendance and Persistent Absence: Both overall and persistent absence at Primary level in Brighton & Hove continues to be in line with the national average. At secondary level there are higher levels of absence for both overall and persistent absence compared to the national average. However, overall absence rates have reduced over the last two years in secondary schools. Provisional data for the academic year 2013/14 shows overall absence in primary school at 4% and secondary at 6%. PA data for primary shows 3.4% with secondary at 8.8% This data will be confirmed and published by the DfE in March 2015 when a comparison with national and south east will be available. 10.2 Fixed Term and Permanent Exclusion: In Brighton and Hove primary schools there has been a fall in the average number of days lost per exclusion since last year. Collectively Brighton & Hove primary schools are now below the national, south east and average of similar local authorities. The average number of exclusions per excluded pupil has also fallen to the average of similar local authorities, but is still above national and South East rates. There was one permanent exclusion in the 2013/2014 year. Across Brighton & Hove secondary schools the average number of days lost per excluded pupil has fallen since last year but is still above England, South East and all similar local authority rates. The average number of exclusions per excluded pupil remains the same as last year and is still above rates for England, the South East and all similar local authorities. There was one permanent exclusion in the 2013/2014 year.
151

14
Hove Juniors: Poetry from Year 4 Curriculum theme World War One
152

15
Section Two. Closing the Gaps in Educational Achievement 11.1. Early Years Foundation Stage Profile. This table shows the breakdown of pupils in the Early Years. It is apparent that there has been a significant rise in the children in care, and children with English as an additional language over the last year.
2012-2013 2013-2014
Boys 1486 1467
Girls 1345 1410
Summer born 1345 1410
Spring born 910 905
Autumn born 955 933
SEN 415 375
School Action 192 168
School Action Plus 177 176
Statement 46 31
CiC 9 15
FSM 495 466
EAL 356 432
Ethnicity – other than white British
857 670
Living in 30% most deprived postcode
930 968
11.2 Closing the Gap in the Educational Achievement of Learners known to be eligible for free school meals (FSM) 11.2.1 Early Years Foundation Stage FSM
% FSM GLD 41.8
% Not FSM GLD 63.5
EYFSP FSM gap 21.7
This has closed 2 percentage points from last year. 11.2.2 Key Stage 1 FSM The performance of pupils in Brighton & Hove with FSM fell in writing, remained the same in reading and rose 1.7% points in maths. This means the gaps have widened in reading and writing and are above the national (by one percentage point and 3.5 % points respectively) but narrowed in maths, where the gap is smaller than national by 0.6% point.
KS1 Reading 2008 2009 2010 2011 2012 2013 2014
B&H FSM Gap 19.0% 21.0% 21.0% 19.9% 20.5% 12.0% 13.0%
SN FSM Gap 18.1% 16.7% 14.6% 14.4% 14.4% 12.8% 12.0%
England FSM Gap 17.7% 16.6% 16.2% 15.0% 14.0% 12.0% 12.0%
153

16
KS1 Writing 2008 2009 2010 2011 2012 2013 2014
B&H FSM Gap 23.0% 24.0% 22.0% 20.3% 26.3% 15.5% 17.5%
SN FSM Gap 20.9% 19.7% 16.9% 17.4% 16.5% 16.6% 15.0%
England FSM Gap 20.0% 18.8% 18.1% 18.0% 16.0% 15.0% 14.0%
KS1 Maths 2008 2009 2010 2011 2012 2013 2014
B&H FSM Gap 12.0% 13.0% 11.0% 10.8% 14.9% 10.0% 8.4%
SN FSM Gap 13.4% 11.2% 10.7% 9.9% 11.4% 10.3% 10.0%
England FSM Gap 12.4% 12.1% 12.0% 11.0% 11.0% 9.0% 9.0%
11.2.3 Key Stage 2 FSM The Reading, writing and maths at level 4+ has increased by 2% points because the attainment of the free school meals children stayed at 58% whilst the non-free school meal total went up by 2% points
KS2 RWML4+ 2012 2013 2014
B&H FSM 53% 58% 58%
B&H Non FSM 79% 83% 85%
B&H Gap 26% 25% 27%
11.2.4 If each subject is looked at individually, in reading the gap has decreased by 2% points with improvement in performance of both the non FSM and FSM groups. In writing the gap remained the same, with both groups improving two % points, but in maths it slightly increased as the attainment of the pupils entitled to FSM remained the same whilst attainment of their peers increased by one % point. 11.2.5 Key Stage 4 FSM Introduction The National Consortium for Examination Results release early GCSEs data into the Educational Analysis Performance System in October. This contains the earliest indication of national performance for the main progress measures in English and maths that will go on to be released by the DfE at a later date. Summary The percentage of learners eligible for FSM who attained 5+A*-C grades in GCSE including English and Maths shows that the gap has narrowed by one percentage point from 37 to 36.
Results 2010 2011 2012 2013 2014
B&H FSM 22% 26% 27% 31% 22%
B&H non FSM 53% 57% 62% 68% 58%
The percentage of pupil premium pupils achieving 5+ A*-C including English and maths was below national in five schools. Only in three schools had a narrower than national attainment gap due to above attainment in both the pupil premium and non-pupil premium pupil groups. One school had
154

17
above national attainment in both groups but higher relative attainment in the non-pupil premium group that resulted in a wider than national gap. In 2013/14 the percentage of Brighton & Hove pupil premium pupils achieving 3+ and 4+ levels of progress in English and maths was below national by two percentage points in both progress measures in English, and nine and five percentage points in 3+ and 4+ levels of progress in maths. In maths progress in almost all prior attainment groups was below national. Progress in the non-pupil premium groups was in line for 3+ levels of progress in English but one percentage point below national for English 4+ levels of progress and 3+ and 4+ levels of progress in maths, so was below national to a lesser extent than the pupil premium group. 11.3. Closing the Gap in Educational Achievement of Learners with Special Educational Needs (SEN) 11.3.1 Early Years SEN
% SEN GLD 21.9
% Not SEN GLD 65.8
EYFSP SEN gap 43.8
This gap has widened 6 percentage points from last year. 11.3.2 Key Stage 1 SEN The 2013 Special Educational Needs versus non SEN gap narrowed in reading by 2.2% points and maths by 2.5% points. However it increased by 0.9% points in writing. While the gap remains too wide, the Local Authority will continue with its focus on interventions such as ECAR to improve the outcomes for young people with SEN and is confident that the new focussed Closing the Gap Strategy will result in rises in attainment and further narrowing of the gaps between children with SEN their peers. 11.3.3 Key Stage 2 SEN The gap in SEN combined reading, writing and maths combined scores has reduced by one % point but shows an improvement of two % points from last year.
KS2 RWML4+ 2012 2013 2014
B&H SEN 33% 40% 42%
B&H Non SEN 90% 93% 94%
B&H Gap 57% 53% 52%
11.3.4 Key Stage 4 SEN
Results 2010 2011 2012 2013 2014 2012 2013
B&H SEN 13% 22% 19% 26% 21% SEN (FFT D) 33% 38%
B&H non SEN 62% 66% 69% 75% 65% Non SEN (FFT D) 75% 77%
B&H SEN cohort 649 690 585 608 SEN (FFT B) 29% 34%
B&H Non SEN cohort 1718 1632 1628 1686
Non SEN (FFT B) 71% 72%
155

18
The percentage of special educational needs pupils achieving 5+ A*-C including English and maths was above national in six schools. Only two schools have a narrower than national attainment gap due to above national attainment in both the special educational needs and non-special educational needs groups. Two schools had above attainment in both groups but higher relative attainment in the non-special educational needs that created a wider than national gap. 11.4. Closing the Gap in Educational Achievement of Learners with English as an Additional Language: Ethnic Minority Achievement Service (EMAS) 11.4.1 Early Years EAL
% EAL GLD 59.9
% Not EALGLD 61.5
EYFSP EAL gap 1.6
This gap has closed significantly from 14.4% last year. 11.4.2 Key Stage 1 The reading gap has continued to reduce and is below the statistical neighbour average for the first time. At 87% the EAL attainment is the same as National, however our non-EAL pupils perform better than National and 2% points better than statistical neighbours.
KS1 Reading 2012 2013 2014
B&H EAL 77.0% 84.0% 87.0%
B&H Non EAL 88.0% 91.0% 91.8%
B&H EAL Gap 11.0% 7.0% 4.8%
Our National and Statistical Neighbour EAL writing at level 2+ is 87% whereas Brighton & Hove is one percentage point above at 88%.
KS1 Writing 2012 2013 2014
B&H EAL 71.0% 77.0% 79.0%
B&H Non EAL 83.0% 87.0% 88.0%
B&H EAL Gap 12.0% 10.0% 9.0%
At Brighton & Hove EAL pupils perform better in Maths than statistical neighbours (88%) and National (90%) however our non-EAL pupils also performance better than Statistical Neighbours and National (93%) The Statistical First Release (SFR) rounds up or down figures, so will show our gap as 3%. This is the smallest gap for six years and attainment in both groups is increasing.
KS1 Maths 2012 2013 2014
B&H EAL 88.0% 88.0% 90.6%
B&H Non EAL 92.0% 94.0% 94.3%
B&H EAL Gap 4.0% 6.0% 3.7%
156

19
11.4.3 Key Stage 2 EAL The ongoing improvement in reducing the gap for key stage 2 EAL pupils continues. This year we see a further 3% drop for reading, writing and maths combined scores. This follows the 3% drop in 2013 and reflects the effective work that has been undertaken by EMAS with the schools.
KS2 RWML4+ 2012 2013 2014
B&H EAL 64% 70% 75%
B&H Non-EAL 75% 80% 81%
B&H EAL Gap 12% 9% 6%
In reading the gap remains at 6% and in writing the gap has reduced by 1% point. The greatest success is in maths where the gap has reduced by 5% to only 1%. 11.4.4 Key Stage 4 11.4.5 Both pupils with English as an Additional Language (EAL) and pupils with English as a First Language (non-EAL) were below national for the percentage achieving 5+ A*-C including English and maths, and 3+ levels of progress in English and 3+ levels of progress in maths. 11.4.6 In the percentage achieving 5+ A*-C including English and maths EAL pupils were further below national than non-EAL pupils. In the percentage achieving 3+ levels of progress in English, EAL pupils were further below national than non-EAL pupils, but in the percentage achieving 3+ levels progress in maths non-EAL pupils were further below national than EAL pupils. 11.5 Children in Care 11.5.1 Foundation Stage Profile (FSP) Children in Care
Percentage achieving a ‘Good Level of Development’ 2014
Children in Care – Published Cohort (12) 50%
Children in Care – Local Cohort (18) 50%
All Brighton and Hove pupils 60.1%
Published Cohort: Children who have been in care continuously for 12 months as at the 31st March 2014 (known as 903 cohort). Local Cohort: Children who were in care as at 31st July 2014 There is no national data for Children in Care** The cohort for whom the Foundation Stage data will be published is the 903 cohort and only has a small number of children in it, however on all measures attainment is below all Brighton & Hove Children. There is no national data for children in care. 11.5.2 Key Stage One Children in Care Local Cohort (Pupils in Year 2 who form the 903 cohort in addition to the pupils who were in care at end of July each year)
2011 2012 2013 2014
Cohort 11 21 18 15
No data 0 0 0 0
Reading L2+ 6 (55%) 9 (43%) 12 (66%) 9 (60%)
Writing L2+ 6 (55%) 7 (33%) 11 (61%) 8 (53%)
Maths L2+ 6 (55%) 13(62%) 11 (61%) 8 (53%)
157

20
Published Cohort (Pupils at the end of Year 2 who have been in care continuously for 12 months as at 31st March 2013)
2011 2012 2013 2014 All LA 14
All Nat 14
CiC 2013 Nat
Cohort 4 14 15 10 - - -
No data 0 0 0 0 - - -
Reading L2+ 3 (75%)
7 (50%)
11 (73.3%)
5 (50%)
90.9%
89%
69%
Writing L2+ 3 (75%)
5 (36%)
11 (73.3%)
5 (50%)
86.9%
85%
61%
Maths L2+ 3 (75%)
9 (64%)
10 (66.7%)
5 (50%)
93.8%
91%
71%
• The cohort is small this year which makes statistical analysis extremely difficult.
• Results for Y2 are below those for Children in Care nationally and below those of all children locally and nationally.
• There has been a significant decrease in reading, writing and maths which has widened the gap between Children in Care and all children.
• Out of the cohort of 10; 2 had a statement (one had severe learning difficulties); 4 were educated out of authority. The data still needs significant further investigation.
158

21
11.5.3 Key Stage Two Children in Care
Percentage achieving Level 4+ in Reading, Writing and Maths
2013 2014
Children in Care – Published Cohort 40.0% 61.5%
Children in Care – Local Cohort 37.5% 60.0%
All Brighton & Hove pupils 78% 80.3%
Brighton +Hove
Children in care Published
Percentage achieving 2 levels progress in Reading 91.1 84.6%
Percentage achieving 2 levels progress in Writing 92.7 84.6%
Percentage achieving 2 levels progress in Maths 92.4 76.9%
Brighton & Hove Children in Care 2013/14 (Published cohort)
Brighton & Hove Children in Care 2012/13 (Published cohort)
Brighton & Hove All Children 2013/14
National average for all Children in Care 2012/13
Attainment gap between Children in Care and All Children 2013/14
Key Stage 2 Maths level 4+
69.2% 52% 88.1% 59% 18.9%
Key Stage 2 Reading level 4+
76.9% 68% 91.2% 63% 14.3%
Key Stage 2 Writing level 4+
61.5% 48% 85.6% 55% 24.1%
Grammar Punctuation and Spelling (GPS)
38.5% 52%
76.9% 45% 38.4%
Key Stage 2 Reading, Writing and Maths 4+
61.5% 40% 80.3% Not available
18.8%
159

22
• Attainment in all
• l subjects is better in 2013/14 or significantly better than in 2012/13. The only exception to
this is Grammar, Punctuation and Spelling where children did less well this year.
• The attainment gap between Children in Care and all children has narrowed in 2013/14.
However Brighton & Hove’s Children in Care do not perform as well as other children in
Brighton & Hove or nationally.
• Brighton & Hove’s Children in Care achieved well above Children in Care nationally.
• Four children achieved level 5 in Maths and two achieved level 5 in reading.
• Out of the 4 who did not achieve age related expectation 2 had statements of SLD or MLD which would mean they were highly unlikely to reach this level.
• The level of expected progress of Brighton & Hove’s Children in Care is only slightly below that of all children. This is encouraging.
• 30.8 % made more than expected progress in reading and writing; 38.5% made more than expected progress in Maths.
11.5.4 Key Stage Four Children in Care LA Defined Cohort (Pupils in Year 11 who form the 903 cohort in addition to the pupils who were in care at the end of July 2014.) 2011 2012 2013 2014
Cohort 42 42 41 47
No data 0 0 0 0
5+A*-G 19 (45.2%) 18 (42.9%) 26 (63.4%) 21 (44.7%)
5+A*-C 10 (23.8%) 10 (23.8%) 11 (26.8%) 11 (23.4%)
5+A*-C incl Eng and Maths 8 (19%) 3 (7.1%) 5 (12.2%) 9 (19.1%)
903 Defined Cohort (Pupils at the end of Year 11 who have been in care continuously for 12 months from 1st April 2013) 2011 2012 2013 2014 All LA
14 All Nat
non CiC13
CiC Nat 13
Cohort 31 34 35 37 - - -
No data 0 0 0 0 - - -
5+A*-G 15 (48.4%)
18 (52.9%)
23 (65.7%)
19 (51.4%)
- - -
5+A*-C 7 (22.6%)
9 (26.5%)
10 (28.6%)
11 (30%)
64.5% 80.3% 36.6%
5+A*-C incl. Eng and Maths
6 (19.4%)
2 (5.9%)
5 (14.3%)
9 (24.3%)
54% 58.0% 16.1%
Percentage expected progress English
- - 11 (31.4%)
13 (35.1%)
* 68.5% 32.6%
Percentage expected progress Maths
- - 12 (34.3%)
12 (32.5%)
* 69.1% 29.2%
160

23
• In 2013/14 24.3% of Brighton & Hove Children in Care (children looked after continuously for 12 months from 1 April 2013) achieved 5 A*-C including English and Maths. This is a significant increase compared to 2012/13 (14.6%) and above how Children in Care achieve nationally (16.1 % in 2012/13). Although the gap between Children in Care and all Children is still significant this gap is narrowing in Brighton & Hove. Had this result been published in national tables in 2013 it would have been comfortably in the top quartile of LA results.
• There have been some significant achievements, for example 3 young people achieved 5 or more A grades. This includes a young person who has achieved exceptionally high grades in Science and Maths and is on track to study medicine at University.
• In another case a young person who had completely disengaged from education whilst undergoing particularly challenging circumstances attended alternative provision set up by the Virtual School. He achieved Ds in Maths and English above what was expected and is now able to go onto his course of choice post 16.
• All of those who achieved 5A*-C including English and Maths received 1:1 tuition from the Virtual School. We expect the overwhelming majority to progress into post 16 learning and all young people will be closely supported by the Virtual Schools 16+ worker. Any young people who have not achieved their expected grades will have intensive support so they can still take their course of choice or a suitable alternative found.
• Out of the cohort of 37; 15 had a statement; 18 were educated out of authority. The data still needs significant further analysis and there are some results that have not yet been received.
11.6 Next Steps
Initial priorities for the new Headteacher of the Virtual School include:
• Completing a SWOT analysis so we are all clear of the starting point for the school in
conjunction with social workers, carers and schools;
• Development of the Personal Education Plan and process for Children in Care so it is
simpler and more effective;
• Ensuring the Pupil Premium is used effectively to benefit Children in Care;
• Establishing strong relationships with social workers, carers and schools;
• Supporting cohesive working across Children’s Services and with all agencies involved;
• Collating accurate data on Children in Care so their educational progress can be tracked
and monitored. This data will be used to inform early and effective interventions where
appropriate and will be put in place in partnership with the school;
• Developing the service to support the education of children who have previously been in
care and have been adopted.
12. Next steps - summary
1. We have allocated a prioritisation level to all primary, secondary and special schools and are brokering support for those schools thought to be at risk
2. We are strengthening and developing partnership working to build capacity in schools to carry out this support, both in and out of the LA
3. We have reintroduced a data and target setting visit for all primary schools as part of our statutory service which will enable us to track and ‘tweak’ support
4. We will collect predictions at different points of the year 5. We will meet half termly with the SSP 6. We are meeting with the chairs of governors from secondary to develop their role in school
improvement
161

24
7. We have a focus on the teaching of phonics and writing 8. We will continue with the Citywide maths strategy 9. Our Closing the Gap focus has been strengthened with a conference in July and follow up
activities for all schools. The secondary schools have devised a pupil premium review,
supported by a National Leader of Education (NLE) from a school in another LA. Every
school will have a review and the process will develop understanding and practice in City
schools and help close the gap.
10. We will also circulate the report that was written by a deputy head seconded last term who visited every school to discuss the achievement of BME pupils. Achievement of Black Minority Ethnic pupils has been highlighted and a three year action plan drawn up
162