brevard county, florida...long term portfolio $2,301,522 short term portfolio 0.55% merrill lynch...
TRANSCRIPT

Brevard County, Florida
300 S. Orange Avenue, Suite 1170
Orlando, FL 32801
(407) 648-2208
(407) 648-1323 fax
PFM Asset Management LLC
One Keystone Plaza, Suite 300
North Front & Market Streets
Harrisburg, PA 17101-2044
717-232-2723 • 717-233-6073 fax
Annual Investment Performance Review
Fiscal Year Ended September 30, 2016
Investment Advisors
Steven Alexander, CTP, CGFO, CPPT, Managing DirectorRobert Cheddar, CFA, Chief Credit Officer, Managing DirectorD. Scott Stitcher, CFA, DirectorRichard Pengelly, CFA, CTP, DirectorRebecca Geyer, CTP, Senior Analyst
© 2016 PFM Asset Management LLC Page 1 of 32

TABLE OF CONTENTS For the Fiscal Year Ended September 30, 2016
Tab I
Annual Review
Tab II
Executive Summary
Long Term Fund Portfolio
Tab III
Short Term and Bond Portfolio
Asset Allocation Chart
Important Disclosures
© 2016 PFM Asset Management LLC Page 2 of 32
Tab I
© 2016 PFM Asset Management LLC Page 3 of 32

For the Fiscal Year Ended September 30, 2016
Brevard County, Florida Balances and Interest Earnings
Total Portfolio Balances and Interest Earnings
Balances Book Value Book Value Percent Change
Fund Name as of September 30, 2016 as of September 30, 2015 From FY 2016 - 2015
General Fund $27,109,014 $25,155,094 7.77%
Special Revenue 157,357,018 147,184,211 6.91%
Debt Service 5,246,603 4,807,084 9.14%
Capital Projects 10,411,651 17,391,406 -40.13%
Enterprise 116,291,227 129,107,243 -9.93%
Internal Service 56,892,913 47,366,057 20.11%
Total $373,308,426 $371,011,095 0.62%
Interest Earnings Interest Earned Interest Earned Percent Change
Fund Name Fiscal Year 2016 Fiscal Year 2015 From FY 2016 - 2015
General Fund $330,334 $251,329 31.43%
Special Revenue 1,353,632 805,230 68.11%
Debt Service 80,038 64,384 24.31%
Capital Projects 95,329 99,037 -3.74%
Enterprise 1,026,405 688,686 49.04%
Internal Service 372,256 172,044 116.37%
Total $3,257,994 $2,080,710 56.58%
Book Value Market Value
County Total Portfolio as of September 30, 2016 as of September 30, 2016
Short Term and Bond Portfolio $184,614,029 $184,647,896
Long Term Portfolio 191,272,112 191,793,513
Total $375,886,141 $376,441,409
© 2016 PFM Asset Management LLC
Page 4 of 32

For the Fiscal Year Ended September 30, 2016
Brevard County, Florida Annual Review
Short Term and Long Term Portfolios Annual Review Fact Sheet
Ending Balance as of September 30, 2016 Long Term Portfolio Performance Last 12 Months
Short Term Portfolio Market Value¹ $184,647,896 Total Return
Long Term Portfolio Market Value 191,793,513 Long Term Portfolio 1.20%
Total All Assets $376,441,409 Merrill Lynch 1-3 Year U.S. Treasury Index 0.88%
Performance over the Benchmark 0.32%
Interest Earnings Last 12 Months Effective Duration3Fiscal Year End
Total Portfolio Interest Earnings for Fiscal Year 2016 $3,257,994 Long Term Portfolio 1.81 Years
Merrill Lynch 1-3 Year U.S. Treasury Index 1.83 Years
Additional Annual Returns in Dollars2Last 12 Months Short Term Portfolio Performance Last 12 Months
Total Return Yield at Cost
Long Term Portfolio $2,301,522 Short Term Portfolio 0.55%
Merrill Lynch 1-3 Year U.S. Treasury Index 1,687,783 S&P Rated GIP Index Government 30 Day Gross Yield 0.44%
Additional Returns over Benchmark $613,739 Performance over the Benchmark 0.11%
Weighted Average Maturity As of September 30, 2016
Short Term Portfolio 53 Days
S&P Rated GIP Index Government 41 Days
Summary
Notes:
1. The Short Term Portfolio is managed by the County.
2. Based on the fiscal year end balance.
© 2016 PFM Asset Management LLC
1. As of September 30, 2016, the County's Portfolio is in compliance with the Investment Policy. The investment composition and allocation is provided on the Asset
Allocation Chart in this report.
Page 5 of 32

Tab II
© 2016 PFM Asset Management LLC Page 6 of 32

EXECUTIVE SUMMARY For the Fiscal Year Ended September 30, 2016
The Long Term Fund Portfolio is of high credit quality and invested in U.S. Treasury, Federal Agency,
Agency Mortgage Backed Securities, municipal obligations, corporate notes and commercial paper
securities.
The Long Term Fund Portfolio’s 1 Year total return performance of 1.20% outperformed the benchmark
performance of 0.88% by 0.32%
PFM continued to actively manage the Portfolio during the fiscal year and found value in the market, taking
advantage of market inefficiencies or changes in economic outlook. As a result, the Portfolio realized
$289,569 in gains on sales (based on amortized cost) during the fiscal year. PFM is continually in the
market monitoring for opportunities to add value to the Portfolio.
Yields drifted modestly higher during the third quarter as early-quarter Brexit fears faded and U.S. economic
data rebounded, bringing the Fed closer to an eventual rate hike, perhaps in December.
We sought to generally maintain portfolio durations and maturity distributions comparable to those of
benchmarks to reduce potential performance mismatches given the uncertain rate environment.
PFM will continue to navigate the market environment with a keen focus on relative value sector analysis,
prudent duration management, and efficient yield curve placement. While producing strong investment
returns remains a priority, it is secondary to maintaining safety and liquidity, particularly in the current
environment where we expect yields to trend higher.
© 2016 PFM Asset Management LLC Page 7 of 32

BREVARD COUNTY LONG TERM
For the Fiscal Year Ended September 30, 2016
Portfolio Snapshot
Portfolio StatisticsAs of September 30, 2016
190,568,783
-
190,764,523
0.93%
1.87 Years
AA
Average Maturity:
Average Credit: **
Par Value:
PFM
Amortized Cost:
Yield at Market:
Effective Duration: 1.81 Years
Credit Quality (S&P Ratings)
7.8%
A-
A
3.6%
A-1
3.0%
4.7%AA
5.8%AA-
75.2%
10%
20%
Total Market Value: 191,793,513
Security Market Value: 191,285,924
Accrued
Interest: Cash:
507,589
-
AA+
30%
50%
0 - 1 Year 1 - 2 Years 2 - 3 Years 3 - 4 Years 4 - 5 Years > 5 Years
16.5%
35.5%
Maturity Distribution
47.2%
0.0% 0.0% 0.8%
Sector Allocation
Commercial
Paper
3.0%
Corporate
21.5%
** An average of each security’s credit rating assigned a numeric value and adjusted for its relative weighting in the portfolio.
Federal
Agency/GSE
52.7%
U.S. Treasury
20.2%
Municipal
1.8%
Mortgage-Backed
0.8%
Page 8 of 32

BREVARD COUNTY LONG TERM
For the Fiscal Year Ended September 30, 2016
Portfolio Performance
Portfolio Performance (Total Return)
Portfolio/Benchmark
Annualized Return
Since Inception
(03/31/02) **
BREVARD COUNTY LONG TERM
BofA ML 1-3 Year U.S. Treasury Index
2.69%
2.46%
Difference 0.23%
-0.4%
0.0%
0.4%
0.8%
1.2%
2.0%
1.6%
2.4%
2.8%
Current Quarter 1 Year 3 Year 5 Year 10 Year Since Inception
-0.01%
Portfolio performance is gross of fees unless otherwise indicated. **Since Inception performance is not shown for periods less than one year.
1.20%
0.99% 0.93%
2.51%2.69%
-0.11%
0.88% 0.85%0.69%
2.25%
2.46%
To
tal
Retu
rn
BREVARD COUNTY LONG TERM BofA ML 1-3 Year U.S. Treasury Index
Effective Current
Duration Quarter 1 Year 3 Year 5 Year 10 Year
1.81 -0.01% 1.20% 0.99% 0.93% 2.51%
1.83 -0.11% 0.88% 0.85% 0.69% 2.25%
0.10% 0.32% 0.14% 0.24% 0.26%
Page 9 of 32

BREVARD COUNTY LONG TERM
For the Fiscal Year Ended September 30, 2016
Portfolio Performance
Portfolio Performance (Total Return)
Quarter Ended Effective
DurationPortfolio/Benchmark
Annualized Return
3 Year 5 Year09/30/16 06/30/16 03/31/16 12/31/15 1 Year
Difference 0.32%0.10% 0.14% 0.24%-0.02% 0.09% 0.15%
-0.44%-0.6%
-0.4%
-0.2%
0.0%
0.4%
0.2%
0.6%
0.8%
1.0%
1.2%
09/30/16 06/30/16 03/31/16 12/31/15 1 Year 3 Year 5 Year
-0.01%
0.51%
0.99%
-0.29%
1.20%
0.99%0.93%
-0.11%
0.53%
0.90% 0.88% 0.85%
0.69%
To
tal
Retu
rn
BREVARD COUNTY LONG TERM
Portfolio performance is gross of fees unless otherwise indicated.
BofA ML 1-3 Year U.S. Treasury Index
BREVARD COUNTY LONG TERM 1.81 -0.01% 0.51% 0.99% -0.29% 1.20% 0.99% 0.93%
BofA ML 1-3 Year U.S. Treasury Index 1.83 -0.11% 0.53% 0.90% -0.44% 0.88% 0.85% 0.69%
Page 10 of 32

BREVARD COUNTY LONG TERM
For the Fiscal Year Ended September 30, 2016
Portfolio Performance
Portfolio Performance (Total Return)
-0.44%
-0.6%
-0.4%
-0.2%
0.0%
0.4%
0.2%
0.6%
0.8%
09/30/16 06/30/16 03/31/16 12/31/15 1 Year 3 Year 5 Year
-0.01%
0.51%
-0.29%
-0.11%
0.53%
0.69%
To
tal
Retu
rn
BREVARD COUNTY LONG TERM BofA ML 1-3 Year U.S. Treasury Index
Portfolio performance is gross of fees unless otherwise indicated. ** Fees were calculated based on average assets during the period at the contractual rate.
Quarter Ended Annualized Return
EffectivePortfolio/Benchmark Duration
09/30/16 06/30/16 03/31/16 12/31/15 1 Year 3 Year 5 Year
BREVARD COUNTY LONG TERM 1.81 -0.01% 0.51% 0.99% -0.29% 1.20% 0.99% 0.93%
Net of Fees ** - -0.02% 0.50% 0.98% -0.30% 1.14% 0.93% 0.87%
BofA ML 1-3 Year U.S. Treasury Index 1.83 -0.11% 0.53% 0.90% -0.44% 0.88% 0.85% 0.69%
Difference (Gross) 0.10% -0.02% 0.09% 0.15% 0.32% 0.14% 0.24%
Difference (Net) 0.09% -0.03% 0.08% 0.14% 0.26% 0.08% 0.18%
1.20%1.2%
1.0%0.99% 0.99%
0.90% 0.88% 0.85%0.93%
Page 11 of 32

BREVARD COUNTY LONG TERM
For the Fiscal Year Ended September 30, 2016
Portfolio Performance
Portfolio Earnings
Quarter-Ended September 30, 2016
Market Value Basis Accrual (Amortized Cost) Basis
Net Purchases/Sales
Change in Value
Interest Earned
$192,534,868.57
($678,212.57)
($570,731.79)
$553,902.26
($16,829.53)
$191,285,924.21
$191,282,049.97
($678,212.57)
$160,686.03
$553,902.26
$714,588.29
$190,764,523.43
Portfolio Earnings
Beginning Value (06/30/2016)
Ending Value (09/30/2016)
Page 12 of 32
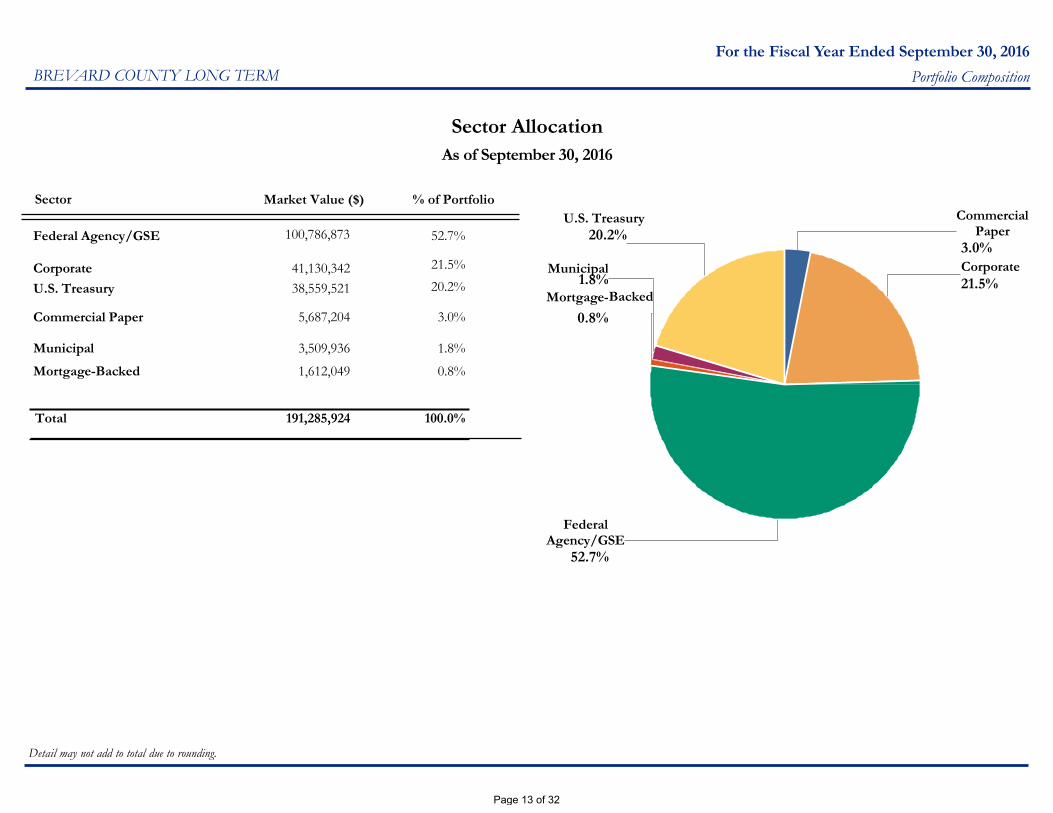
Corporate 41,130,342 21.5% Municipal
U.S. Treasury 38,559,521 20.2%1.8%
Mortgage-
Commercial Paper 5,687,204 3.0% 0.8%
Municipal 3,509,936 1.8%
Mortgage-Backed 1,612,049 0.8%
Total 191,285,924 100.0%
BREVARD COUNTY LONG TERM
For the Fiscal Year Ended September 30, 2016
Portfolio Composition
Sector Allocation
As of September 30, 2016
Market Value ($) % of PortfolioSector
Federal Agency/GSE 100,786,873 52.7%
CommercialPaper
3.0%
Corporate
21.5%
FederalAgency/GSE
52.7%
Backed
20.2%U.S. Treasury
Detail may not add to total due to rounding.
Page 13 of 32

BREVARD COUNTY LONG TERM
For the Fiscal Year Ended September 30, 2016
Portfolio Composition
Sector Allocation
As of September 30, 2016
Market Value ($)Sector % of Portfolio % of Benchmark
191,285,924 100.0% 100.0%Total
0%
20%
40%
60%
80%
100%
120%
Commercial Paper Corporate
BREVARD COUNTY LONG TERM
Detail may not add to total due to rounding.
Federal Agency/GSE Mortgage-Backed Municipal U.S. Treasury
3.0%
21.5%
52.7%
0.8% 1.8%
20.2%
0.0% 0.0% 0.0% 0.0% 0.0%
100.0%
BofA ML 1-3 Year U.S. Treasury Index
Federal Agency/GSE 100,786,873 52.7% -
Corporate 41,130,342 21.5% -
U.S. Treasury 38,559,521 20.2% 100.0%
Commercial Paper 5,687,204 3.0% -
Municipal 3,509,936 1.8% -
Mortgage-Backed 1,612,049 0.8% -
Page 14 of 32

BREVARD COUNTY LONG TERM
For the Fiscal Year Ended September 30, 2016
Portfolio Composition
Sector Allocation
September 30, 2016 June 30, 2016 March 31, 2016 December 31, 2015
70%
60%
50%
40%
30%
20%
10%
0%
100%
90%
80%
September 2016 June 2016 March 2016 December 2015
Mortgage-Backed
Municipal
Commercial Paper
U.S. Treasury
Corporate
Federal Agency/GSE
Detail may not add to total due to rounding.
Sector MV ($MM) % of Total MV ($MM) % of Total MV ($MM) % of Total MV ($MM) % of Total
Federal Agency/GSE 100.8 52.7% 54.8 28.5% 25.8 13.4% 26.4 13.8%
Corporate 41.1 21.5% 42.5 22.1% 44.5 23.1% 45.5 23.7%
U.S. Treasury 38.6 20.2% 78.7 40.8% 101.7 52.9% 101.1 52.9%
Commercial Paper 5.7 3.0% 11.5 6.0% 12.7 6.6% 10.8 5.6%
Municipal 3.5 1.8% 3.3 1.7% 5.8 3.0% 5.8 3.0%
Mortgage-Backed 1.6 0.8% 1.8 0.9% 1.9 1.0% 1.9 1.0%
Total $191.3 100.0% $192.5 100.0% $192.4 100.0% $191.5 100.0%
Page 15 of 32

BREVARD COUNTY LONG TERM
For the Fiscal Year Ended September 30, 2016
Portfolio Composition
Maturity Distribution
As of September 30, 2016
>5
YearsPortfolio/Benchmark
BREVARD COUNTY LONG TERM
BofA ML 1-3 Year U.S. Treasury Index
0.8%
0.0%
10%
20%
35.5%
30%
50%
60%
52.8%
3.0%
0-1 Years 1-2 Years
BREVARD COUNTY LONG TERM
2-3 Years 3-4 Years 4-5 Years
BofA ML 1-3 Year U.S. Treasury Index
> 5 Years
16.5%
47.2%
0.0% 0.0% 0.8%
44.2%
0.0% 0.0% 0.0%
Yield Average 0-1 1-2 2-3 3-4 4-5
at Market Maturity Years Years Years Years Years
0.93% 1.87 yrs 16.5% 35.5% 47.2% 0.0% 0.0%
0.78% 1.95 yrs 3.0% 52.8% 44.2% 0.0% 0.0%
Page 16 of 32
BREVARD COUNTY LONG TERM
For the Fiscal Year Ended September 30, 2016
Portfolio Composition
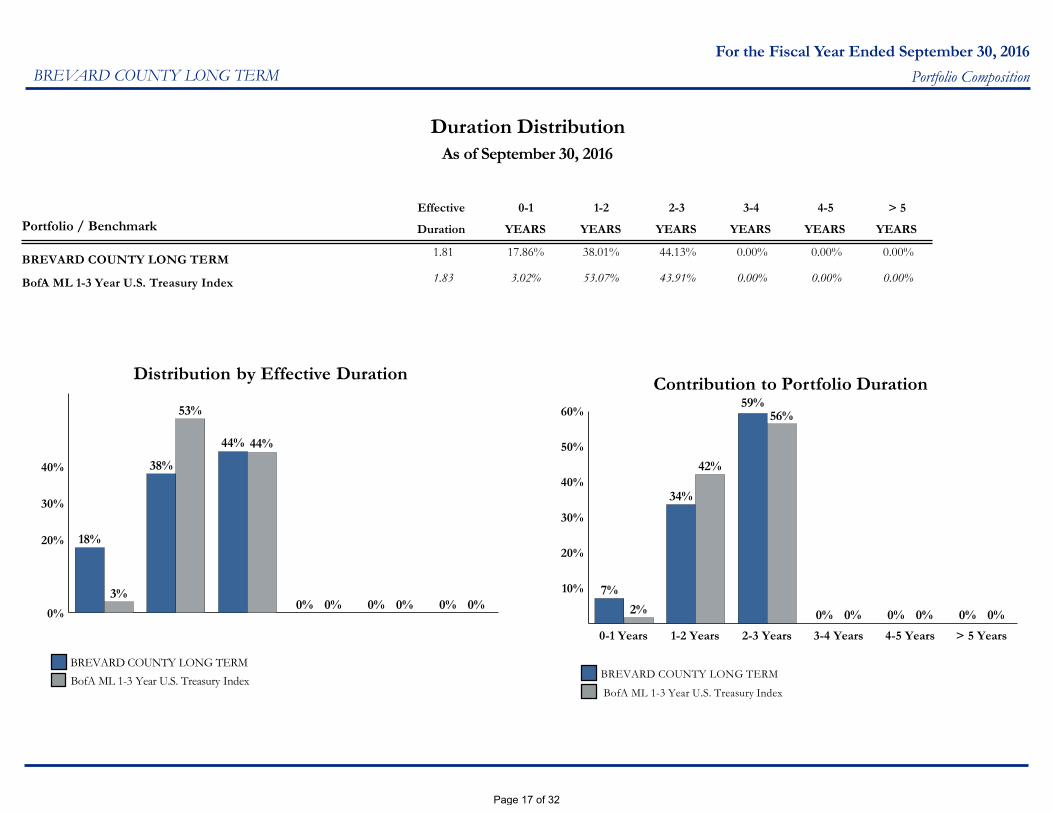
Duration Distribution
As of September 30, 2016
Portfolio / Benchmark
BREVARD COUNTY LONG TERM
BofA ML 1-3 Year U.S. Treasury Index
0%
20%
30%
40%
18%
38%
44% 44%
0% 0% 0% 0% 0% 0%3%
53%
Distribution by Effective Duration
BREVARD COUNTY LONG TERM
BofA ML 1-3 Year U.S. Treasury Index
10%
20%
30%
40%
50%
60%
2%
0-1 Years 1-2 Years 2-3 Years
BREVARD COUNTY LONG TERM
BofA ML 1-3 Year U.S. Treasury Index
3-4 Years 4-5 Years > 5 Years
7%
34%
59%56%
0% 0% 0% 0% 0% 0%
42%
Contribution to Portfolio Duration
Effective 0-1 1-2 2-3 3-4 4-5 > 5
Duration YEARS YEARS YEARS YEARS YEARS YEARS
1.81 17.86% 38.01% 44.13% 0.00% 0.00% 0.00%
1.83 3.02% 53.07% 43.91% 0.00% 0.00% 0.00%
Page 17 of 32

BREVARD COUNTY LONG TERM
For the Fiscal Year Ended September 30, 2016
Portfolio Composition
Credit Quality
As of September 30, 2016
S&P Rating Market Value ($) % of Portfolio A
7.8%
A-
3.6%
A-1
3.0%
AA
4.7%
AA-
5.8%
AA+
75.2%
Detail may not add to total due to rounding.
AA+ $143,765,731 75.2%
A $14,833,463 7.8%
AA- $11,122,730 5.8%
AA $8,970,303 4.7%
A- $6,906,494 3.6%
A-1 $5,687,204 3.0%
Totals $191,285,924 100.0%
Page 18 of 32

BREVARD COUNTY LONG TERM
For the Fiscal Year Ended September 30, 2016
Portfolio Composition
Issuer Distribution
As of September 30, 2016
Market Value ($) % of PortfolioIssuer
To
p5
=77.1
%
To
p10
=89.3
%
FEDERALHOME LOAN BANKS 47,193,434 24.7%
FANNIE MAE 39,387,301 20.6%
UNITED STATES TREASURY 38,559,521 20.2%
FREDDIE MAC 15,818,188 8.3%
JP MORGAN CHASE & CO 6,504,257 3.4%
BERKSHIRE HATHAWAY INC 5,225,782 2.7%
HSBC HOLDINGS PLC 4,863,044 2.5%
BANK OF NEW YORK CO INC 4,828,618 2.5%
GENERAL ELECTRIC CO 4,356,697 2.3%
AMERICAN EXPRESS CO 4,097,971 2.1%
DEERE & COMPANY 3,028,790 1.6%
APPLE INC 2,807,288 1.5%
TOYOTA MOTOR CORP 2,702,403 1.4%
REGIONAL TRANS AUTH, IL 2,268,434 1.2%
CATERPILLAR INC 2,113,011 1.1%
WELLS FARGO& COMPANY 2,008,998 1.1%
BANK OF MONTREAL 1,991,470 1.0%
PFIZER INC 1,476,087 0.8%
Page 19 of 32

BREVARD COUNTY LONG TERM
For the Fiscal Year Ended September 30, 2016
Portfolio Composition
Issuer Market Value ($) % of Portfolio
STATE OF CONNECTICUT 1,241,502 0.7%
CISCO SYSTEMS INC 813,130 0.4%
Grand Total: 191,285,924 100.0%
Page 20 of 32

BREVARD COUNTY LONG TERM
For the Fiscal Year Ended September 30, 2016
Portfolio Composition
Sector/Issuer Distribution
As of September 30, 2016
Corporate
Sector / Issuer Market Value ($) % of Sector % of Total Portfolio
Commercial Paper
BANK OF MONTREAL 1,991,470 35.0% 1.0%
JP MORGAN CHASE & CO 3,695,734 65.0% 1.9%
Sector Total 5,687,204 100.0% 3.0%
AMERICAN EXPRESS CO 4,097,971 10.0% 2.1%
APPLE INC 2,807,288 6.8% 1.5%
BANK OF NEW YORK CO INC 4,828,618 11.7% 2.5%
BERKSHIRE HATHAWAY INC 5,225,782 12.7% 2.7%
CATERPILLAR INC 2,113,011 5.1% 1.1%
CISCO SYSTEMS INC 813,130 2.0% 0.4%
DEERE & COMPANY 3,028,790 7.4% 1.6%
GENERAL ELECTRIC CO 4,356,697 10.6% 2.3%
HSBC HOLDINGS PLC 4,863,044 11.8% 2.5%
JP MORGAN CHASE & CO 2,808,523 6.8% 1.5%
PFIZER INC 1,476,087 3.6% 0.8%
TOYOTA MOTOR CORP 2,702,403 6.6% 1.4%
WELLS FARGO& COMPANY 2,008,998 4.9% 1.1%
Sector Total 41,130,342 100.0% 21.5%
Page 21 of 32

100.0%191,285,924Portfolio Total 100.0%
BREVARD COUNTY LONG TERM For the Fiscal Year Ended September 30, 2016
Portfolio Composition
Sector / Issuer Market Value ($) % of Sector % of Total Portfolio
Federal Agency/GSE
FANNIE MAE 37,775,252 37.5% 19.7%
FEDERALHOME LOAN BANKS 47,193,434 46.8% 24.7%
FREDDIE MAC 15,818,188 15.7% 8.3%
Sector Total 100,786,873 100.0% 52.7%
Mortgage-Backed
FANNIE MAE 1,612,049 100.0% 0.8%
Sector Total 1,612,049 100.0% 0.8%
Municipal
REGIONAL TRANS AUTH, IL 2,268,434 64.6% 1.2%
STATE OF CONNECTICUT 1,241,502 35.4% 0.6%
Sector Total 3,509,936 100.0% 1.8%
U.S. Treasury
UNITED STATES TREASURY 38,559,521 100.0% 20.2%
Sector Total 38,559,521 100.0% 20.2%
Page 22 of 32

Tab III
© 2016 PFM Asset Management LLC Page 23 of 32

For the Fiscal Year Ended September 30, 2016
BREVARD COUNTY, FLORIDA Short Term and Bond Portfolio Yields
Short Term and Bond Portfolio Yields
Yields1,2 Yield at Cost as of Percent of Portfolio Yield at Cost as of Percent of Portfolio
Security Type September 30, 2016 September 30, 2016 September 30, 2015 September 30, 2015
Florida PRIME (SBA) 0.78% 13.96% 0.25% 13.90%
SunTrust Bank Account4
0.07% 20.37% 0.07% 17.84%
SunTrust Public Now Account4 0.00% 0.00% 0.35% 5.42%
Florida Community Bank CD 0.95% 5.44% 0.78% 2.72%
Florida Community Bank Demand Deposit 0.50% 2.73% 0.50% 2.72%
Florida Community Bank Public Funds Money Market4
0.50% 11.00% 0.50% 10.96%
PFM Fund - Govt Select, Instl Money Market Fund 0.27% 11.15% 0.12% 11.12%
Bank United Money Market Fund 0.50% 5.45% 0.50% 5.43%
Fidelity Prime Money Market Fund 0.00% 0.00% 0.00% 0.00%
JP Morgan Prime Money Market Fund 0.00% 0.00% 0.00% 0.00%
U.S. Treasury Note 0.00% 0.00% 0.00% 0.00%
Federal Farm Credit Bureau 0.00% 0.00% 0.32% 5.42%
Federal Home Loan Bank 0.75% 13.55% 0.41% 13.56%
Federal Home Loan Mortgage Corp. 0.00% 0.00% 0.00% 0.00%
Federal National Mortgage Association 0.00% 0.00% 0.00% 0.00%
Bank United CD 0.90% 16.36% 0.65% 10.91%
Total Average Yield2 0.55% 100.00% 0.34% 100.00%
Benchmarks September 30, 2016 September 30, 2015
S&P Rated GIP Index Government 30 Day Yield3 0.44% 0.16%
Notes:
1. Yields are presented as "Yield on Cost" pursuant to the County's Investment Policy Performance Section for short-term securities and compared to the benchmark which is the Standard & Poor's GIP 30 Day Index.
2. Yield on cost is a dollar weighted yield.
3. Monthly yield, gross of fees. Source Standard & Poor's Financial Institutions Ratings.
4. Bank Deposits in excess of $250,000 are collateralized under Florida State Statute 280 with U.S. Government and U.S. Government Agency securities, including Mortgage Backed Securities.
© 2016 PFM Asset Management LLC
Page 24 of 32

For the Fiscal Year Ended September 30, 2016
BREVARD COUNTY, FLORIDA Short Term and Bond Portfolio Composition
Short Term and Bond Portfolio Composition (Market Value)Balance as of Percent of Balance as of Percent of
Security Type1 September 30, 2016 Portfolio September 30, 2015 Portfolio
Florida PRIME (SBA) $25,769,231 13.96% $25,629,986 13.90%
Federal Farm Credit Bureau 0 0.00% 10,003,900 5.42%
Federal Home Loan Bank 25,022,400 13.55% 25,005,350 13.56%
Federal Home Loan Mortgage Corp. 0 0.00% 0 0.00%
Federal National Mortgage Association 0 0.00% 0 0.00%
U.S. Treasury Note 0 0.00% 0 0.00%
SunTrust Bank Account3
37,606,092 20.37% 32,897,805 17.84%
SunTrust Public Now Account3 0 0.00% 10,000,000 5.42%
Florida Community Bank Public Funds Money Market3
20,308,573 11.00% 20,216,439 10.96%
Florida Community Bank Demand Deposit3
5,038,555 2.73% 5,013,440 2.72%
PFM Fund - Govt Select, Instl Money Market Fund 20,582,530 11.15% 20,507,694 11.12%
Bank United Money Market Fund 10,062,750 5.45% 10,012,638 5.43%
Fidelity Prime Money Market Fund 0 0.00% 0 0.00%
JP Morgan Prime Money Market Fund 0 0.00% 0 0.00%
Certificate of Deposit 40,257,766 21.80% 25,132,040 13.63%
Totals $184,647,896 100.00% $184,419,292 100.00%
Notes:
1. Investment balances are market values as of September 30, 2016.
2. Credit rating of securities held in portfolio. Standard & Poor's is the source of the credit ratings. The SBA Fund B and Bank Deposits are not rated.
3. Bank Deposits in excess of $250,000 are collateralized under Florida State Statute 280 with U.S. Government and U.S. Government Agency securities, including Mortgage Backed Securities.
© 2016 PFM Asset Management LLC
Florida PRIME (SBA)
13.96%
Federal Home Loan Bank
13.55%
SunTrust Bank Account320.37%
Florida Community Bank Public Funds
Money Market311.00%
PFM Fund - Govt Select, Instl Money
Market Fund11.15%
Florida Community Bank Demand
Deposit32.73%
Bank United Money Market Fund
5.45%
Certificate of Deposit21.80%
Portfolio Compositionas of September 30, 2016¹
AA+13.55%
AAAm25.10%
Not Rated61.35%
Credit Quality Distribution as of September 30, 2016²
Page 25 of 32

For the Fiscal Year Ended September 30, 2016
BREVARD COUNTY, FLORIDA Short Term and Bond Portfolio Holdings
Short Term and Bond Portfolio Holdings and Yields¹ as of September 30, 2016
Security Description CUSIP
Purchase
Date
Maturity
Date Par Value Book Amount Market Value
Yield on
Cost2
State Board of Administration - Fund A $25,769,231 $25,769,231 $25,769,231 0.78%
SunTrust Bank Account 37,606,092 37,606,092 37,606,092 0.07%
SunTrust Public Funds Account 0 0 0
Bank United CD 1815043014 11/19/2015 11/19/2016 20,129,804 20,129,804 20,129,804 0.75%
Bank United CD 1815057503 1/28/2016 1/28/2018 10,079,976 10,079,976 10,079,976 1.20%
Bank United Money Market 10,062,750 10,062,750 10,062,750 0.50%
Florida Community Bank CD 3136318000 3/19/2016 3/19/2017 10,047,986 10,047,986 10,047,986 0.95%
Florida Community Bank Demand Deposit Account 5,038,555 5,038,555 5,038,555 0.50%
Florida Community Bank Public Funds Money Market 20,308,573 20,308,573 20,308,573 0.50%
PFM Fund - Govt Select, Instl Money Market Fund 20,582,530 20,582,530 20,582,530 0.27%
Federal Home Loan Bank 3130A0C65 1/7/2016 12/28/2016 10,000,000 9,988,533 10,006,800 0.76%
Federal Home Loan Bank 3130A6VS3 12/14/2015 12/14/2016 15,000,000 15,000,000 15,015,600 0.75%
Grand Total $184,625,496 $184,614,029 $184,647,896 0.55%
Notes:
1. Yields are presented as "Yield on Cost" pursuant to the County's Investment Policy Performance Section for short-term securities and compared to the benchmark which is the Standard & Poor's GIP 30 Day Index.
2. Yield on Cost is a dollar weighted yield.
3. Bank Deposits in excess of $250,000 are collateralized under Florida State Statute 280 with U.S. Government and U.S. Government Agency securities, including Mortgage Backed Securities.
© 2016 PFM Asset Management LLC
Page 26 of 32

For the Fiscal Year Ended September 30, 2016
BREVARD COUNTY, FLORIDA Overall Investment Maturity Distribution
Long Term and Short Term Fund Portfolios Maturity DistributionMaturity Distribution1 September 30, 2016 September 30, 2015
Overnight (Money Market Fund) $119,367,730 $124,278,003
Under 6 Months 60,887,394 48,879,456
6 - 12 Months 25,844,108 58,403,022
1 - 2 Years 78,211,259 79,972,161
2 - 3 Years 90,515,035 64,067,105
3 - 4 Years 0 0
4 - 5 Years 0 0
5 Years and Over 1,615,884 2,056,249
Totals $376,441,409 $377,655,996
Notes:
1. Callable securities in portfolio are included in the maturity distribution analysis to their stated maturity date, although they may be called prior to maturity.
© 2016 PFM Asset Management LLC
4.19%
20.78% 24.04%
0.43%
31.71%
14.66%2.68%
3.64% 8.84%
21.18% 16.96%
0.54%
32.91%
9.30% 6.62%
0%
10%
20%
30%
40%
50%
60%
70%
80%
90%
100%
Percen
tage of T
otal Portfolios
Short Term September 30, 2015 Long Term September 30, 2015
Short Term September 30, 2016 Long Term September 30, 2016
Portfolio Maturity DistributionPortfolio Maturity Distribution
Overnight 6-12 MonthsUnder 6 Months 1- 2 Years 3- 4 Years 4- 5 Years2- 3 Years 5 Years and Over
1.55%
Page 27 of 32

For the Month Ended September 30, 2016BREVARD COUNTY, FLORIDA Asset Allocation
Security Type1
Amortized Cost
(Includes Interest)
Allocation
Percentage Notes
Permitted
by Policy
In
Compliance
United States Treasury Securities 38,471,543.68 10.23% 100% YES
United States Government Agency Securities - 0.00% 100% YES
Federal Instrumentalities 125,754,144.42 33.46% 2 75% YES
Supranationals - 0.00% 15% YES
Mortgage-Backed Securities 1,587,152.80 0.42% 2 25% YES
Asset-Backed Securities - 0.00% 25% YES
Certificates of Deposit and Savings Account 40,257,766.43 10.71% 3 50% YES
Repurchase Agreements - 0.00% 40% YES
Commercial Paper 5,684,277.84 1.51% 50% YES
Corporate Notes 41,252,394.27 10.97% 50% YES
Bankers' Acceptances - 0.00% 10% YES
State and/or Local Government Debt (GO) 2,274,749.61 0.61% 25% YES
State and/or Local Government Debt (Revenue) 1,236,382.02 0.33% 25% YES
Fixed Income Money Market Mutual Funds 20,582,529.59 5.48% 3 50% YES
Bank Savings/Time Deposits 73,015,969.11 19.43% 3 100% YES
Intergovernmental Investment Pool 25,769,231.01 6.86% 3 50% YESNotes:
1. End of month trade-date amortized cost of portfolio holdings, including accrued interest.
2. The combined total of Federal Instrumentalities and Mortgage Backed Securities can not be more than 75%. The combined total as of September 30, 2016 is 33.88%.
3. Managed by the County.
© PFM Asset Management LLC
United States Treasury Securities
10.23%
Federal Instrumentalities
33.46% Mortgage‐Backed Securities0.42%
Certificates of Deposit and Savings Account
10.71%
Commercial Paper 1.51%
Corporate Notes 10.97%
State and/or Local Government Debt
(GO)0.61%
State and/or Local Government Debt
(Revenue)0.33%
Fixed Income Money Market Mutual Funds
5.48%
Bank Savings/Time Deposits19.43%
Intergovernmental Investment Pool
6.86%
Page 28 of 32

For the Month Ended September 30, 2016
BREVARD COUNTY, FLORIDA Asset Allocation
Individual Issuer Breakdown
Amortized Cost
(Includes Interest)
Allocation
Percentage Notes
Permitted
by Policy
In
Compliance
Government National Mortgage Association (GNMA) - 0.00% 10% YES
Federal Farm Credit Bank (FFCB) - 0.00% 25% YES
Federal Home Loan Bank (FHLB) 72,242,062.16 19.22% 25% YES
Federal National Mortgage Association (FNMA) 39,249,329.47 10.44% 25% YES
Federal Home Loan Mortgage Corporation (FHLMC) 15,849,905.59 4.22% 25% YES
State of Connecticut Municipal Bonds 1,236,382.02 0.33% 5% YES
Regional Transportation Authority Municipal Bonds 2,274,749.61 0.61% 5% YES
Caterpillar, Inc. Corporate Notes 2,112,835.92 0.56% 5% YES
General Electric Capital Corporation Corporate Notes 4,403,860.43 1.17% 5% YES
Toyota Motor Corporation Corporate Notes 2,719,665.53 0.72% 5% YES
Cisco Systems, Inc. Corporate Notes 811,039.50 0.22% 5% YES
Deere & Company Corporate Notes 3,034,969.31 0.81% 5% YES
Apple, Inc. Corporate Notes 2,815,784.49 0.75% 5% YES
Pfizer, Inc. Corporate Notes 1,480,856.73 0.39% 5% YES
Berkshire Hathaway, Inc. Corporate Notes 5,227,598.55 1.39% 5% YES
HSBC Holdings plc Corporate Notes 4,878,079.77 1.30% 5% YES
JP Morgan Chase & Company Corporate Notes 2,803,558.15 0.75% 5% YES
Wells Fargo & Company Corporate Notes 2,024,297.70 0.54% 5% YES
Bank of New York Company Inc. Corporate Notes 4,827,276.40 1.28% 5% YES
American Express Company Corporate Notes 4,112,571.79 1.09% 5% YES
Bank of Montreal Commercial Paper 1,991,227.66 0.53% 5% YES
JP Morgan Chase & Company Commercial Paper 3,693,050.18 0.98% 5% YES
Bank United Money Market 10,062,749.69 2.68% 3 100% YES
Florida Community Bank Public Funds Money Market 20,308,572.67 5.40% 3 100% YES
Bank United Certificate of Deposit 30,209,780.35 8.04% 3 10% YES
PFM Fund - Govt Select, Instl Cl Money Market Fund 20,582,529.59 5.48% 3 10% YES
SunTrust Bank Account 37,606,092.14 10.00% 3 100% YES
Florida Prime (SBA) 25,769,231.01 6.86% 3 10% YES
Florida Community Bank CD 10,047,986.08 2.67% 3 10% YES
Florida Community Bank Demand Deposit Account 5,038,554.61 1.34% 3 100% YES
Notes:
1. End of month trade-date amortized cost of portfolio holdings, including accrued interest.
2. The combined total of Federal Instrumentalities and Mortgage Backed Securities can not be more than 75%. The combined total as of September 30, 2016 is 33.88%.
3. Managed by the County.
© PFM Asset Management LLC
Page 29 of 32

BREVARD COUNTY LONG TERM
For the Fiscal Year Ended September 30, 2016
Portfolio Activity
Important Disclosures
This material is based on information obtained from sources generally believed to be reliable and available to the public, however PFM Asset Management LLC cannot
guarantee its accuracy, completeness or suitability. This material is for general information purposes only and is not intended to provide specific advice or a specific
recommendation. All statements as to what will or may happen under certain circumstances are based on assumptions, some but not all of which are noted in the
presentation. Assumptions may or may not be proven correct as actual events occur, and results may depend on events outside of your or our control. Changes in
assumptions may have a material effect on results. Past performance does not necessarily reflect and is not a guaranty of future results. The information contained in
this presentation is not an offer to purchase or sell any securities.
■ Market values which include accrued interest, are derived from closing bid prices as of the last business day of the month as supplied by a third party vendor.
Where prices are not available from generally recognized sources the securities are priced using a yield based matrix system to arrive at an estimated market
value.
■ In accordance with generally accepted accounting principles, information is presented on a trade date basis; forward settling purchases are included in the
monthly balances and forward settling sales are excluded.
■ Performance is presented in accordance with the CFA Institute’sGlobal Investment Performance Standards (GIPS). Unless otherwise noted, performance is
shown gross of fees. Quarterly returns are presented on an unannualized basis. Returns for periods greater than one year are presented on an annualized basis.
Past performance is not indicative of future returns.
■ Bank of America/Merrill Lynch Indices provided by Bloomberg Financial Markets.
■ Money market fund/cash balances are included in performance and duration computations.
■ Standard & Poor's is the source of the credit ratings. Distribution of credit rating is exclusive of money market fund/LGIP holdings.
■ Callable securities in portfolio are included in the maturity distribution analysis to their stated maturity date, although they may be called prior to maturity.
■ MBS maturities are represented by expected average life.
Page 30 of 32
BREVARD COUNTY LONG TERM
For the Fiscal Year Ended September 30, 2016
Appendix
Glossary
■ ACCRUED INTEREST: Interest that is due on a bond or other fixed income security since the last interest payment was made.
■ AGENCIES: Federal agency securities and/or Government-sponsored enterprises.
■ AMORTIZED COST: The original cost of the principal of the security is adjusted for the amount of the periodic reduction of any discount or premium from the purchase date until
the date of the report. Discount or premium with respect to short term securities (those with less than one year to maturity at time of issuance) is amortized on a straight line basis. Such
discount or premium with respect to longer term securities is amortized using the constant yield basis.
■ BANKERS’ ACCEPTANCE: A draft or bill or exchange accepted by a bank or trust company. The accepting institution guarantees payment of the bill, as well as the insurer.
■ COMMERCIAL PAPER: An unsecured obligation issued by a corporation or bank to finance its short-term credit needs, such as accounts receivable and inventory.
■ CONTIBUTION TO DURATION: Represents each sector or maturity range’s relative contribution to the overall duration of the portfolio measured as a percentage weighting.
Since duration is a key measure of interest rate sensitivity, the contribution to duration measures the relative amount or contribution of that sector or maturity range to the total rate
sensitivity of the portfolio.
■ DURATION TO WORST: A measure of the sensitivity of a security’s price to a change in interest rates, stated in years, computed from cash flows to the maturity date or to the put
date, whichever results in the highest yield to the investor.
■ EFFECTIVE DURATION: A measure of the sensitivity of a security’s price to a change in interest rates, stated in years.
■ EFFECTIVE YIELD: The total yield an investor receives in relation to the nominal yield or coupon of a bond. Effective yield takes into account the power of compounding on
investment returns, while nominal yield does not.
■ FDIC: Federal Deposit Insurance Corporation. A federal agency that insures bank deposits to a specified amount.
■ INTEREST RATE: Interest per year divided by principal amount, expressed as a percentage.
■ MARKET VALUE: The value that would be received or paid for an investment in an orderly transaction between market participants at the measurement date.
■ MATURITY: The date upon which the principal or stated value of an investment becomes due and payable.
■ NEGOTIABLE CERTIFICATES OF DEPOSIT: A CD with a very large denomination, usually $1 million or more that can be traded in secondary markets.
■ PAR VALUE: The nominal dollar face amount of a security.
Page 31 of 32

BREVARD COUNTY LONG TERM
For the Fiscal Year Ended September 30, 2016
Appendix
Glossary
■ PASS THROUGH SECURITY: A security representing pooled debt obligations that passes income from debtors to its shareholders. The most common type is the mortgage-backed
security.
■ REPURCHASE AGREEMENTS: A holder of securities sells these securities to an investor with an agreement to repurchase them at a fixed price on a fixed date.
■ SETTLE DATE: The date on which the transaction is settled and monies/securities are exchanged. If the settle date of the transaction occurs on a non-business day (i.e. coupon
payments and maturity proceeds), the funds are exchanged on the next business day.
■ TRADE DATE: The date on which the transaction occurred however the final consummation of the security transaction and payment has not yet taken place.
■ UNSETTLED TRADE: A trade which has been executed however the final consummation of the security transaction and payment has not yet taken place.
■ U.S. TREASURY: The department of the U.S. government that issues Treasury securities.
■ YIELD: The rate of return based on the current market value, the annual interest receipts, maturity value and the time period remaining until maturity, stated as a percentage, on an
annualized basis.
■ YTM AT COST: The yield to maturity at cost is the expected rate of return, based on the original cost, the annual interest receipts, maturity value and the time period from purchase
date to maturity, stated as a percentage, on an annualized basis.
■ YTM AT MARKET: The yield to maturity at market is the rate of return, based on the current market value, the annual interest receipts, maturity value and the time period
remaining until maturity, stated as a percentage, on an annualized basis.
Page 32 of 32