breaking the link between disadvantage and low attainment - everyone's business' (2009)
TRANSCRIPT

8/11/2019 'Breaking the Link Between Disadvantage and Low Attainment - Everyone's Business' (2009)
http://slidepdf.com/reader/full/breaking-the-link-between-disadvantage-and-low-attainment-everyones 1/44
A commitment from
The Children’s Plan
BREAKING THE LINKbetween disadvantageand low attainment
EVERYONE’S BUSINESS

8/11/2019 'Breaking the Link Between Disadvantage and Low Attainment - Everyone's Business' (2009)
http://slidepdf.com/reader/full/breaking-the-link-between-disadvantage-and-low-attainment-everyones 2/44
This Breaking the Link document is intended as the first in a series, each of which will go into more
detail on narrowing gaps in outcomes for specific groups, and the implications for different
services and delivery partners – covering the Department’s wider agenda for children and families.

8/11/2019 'Breaking the Link Between Disadvantage and Low Attainment - Everyone's Business' (2009)
http://slidepdf.com/reader/full/breaking-the-link-between-disadvantage-and-low-attainment-everyones 3/44

8/11/2019 'Breaking the Link Between Disadvantage and Low Attainment - Everyone's Business' (2009)
http://slidepdf.com/reader/full/breaking-the-link-between-disadvantage-and-low-attainment-everyones 4/44
2
Every child should be able to succeed, to leave primary school secure in the basics, to get the skills
and qualifications they need, and to go on to further education and a good job. All children
deserve this kind of good start in life, regardless of where they live, where they go to school, or
their family background.
This is the mission shared by hundreds of thousands of school leaders, teachers and other staff in
tens of thousands of schools across the country: to raise achievement for all pupils, and to break
the historic link between disadvantage and low educational attainment.
Over the past ten years, backed by sustained investment, the schools system has been
transformed. Teaching has never been a more attractive or higher status profession. School
facilities have never been better. Young people have never had such an exciting range ofopportunities, and results have never been higher. This is a massive credit to the professionalism
of all those who work in education.
At the same time that standards have risen across the board, the most deprived areas and the
most deprived schools have made the most progress. Yet there is still far too strong a link
between family income and achievement at school. The proportion of children entitled to free
school meals – roughly the poorest 15% – who get 5 or more good GCSEs including English and
maths has gone up from under 15% in 2002 to 23.5% in 2008, and they are narrowing the gap
with other pupils at both primary and secondary school. But they are still less than half as likely toget these good GCSE grades as children who are not entitled to free school meals.
The highest performing maintained schools, serving some of the most deprived areas, have gone
even further: they have broken the link between poverty and attainment for their pupils. Now the
challenge is to break the link for all pupils, whether they are in a school or an area with
concentrated deprivation, or as most of them are, in more average schools spread out across
the country.
1. Foreword by theSecretary of State

8/11/2019 'Breaking the Link Between Disadvantage and Low Attainment - Everyone's Business' (2009)
http://slidepdf.com/reader/full/breaking-the-link-between-disadvantage-and-low-attainment-everyones 5/44
Breaking the link between disadvantage and low attainment – Everyone’s Business 3
This is a challenge particularly to headteachers and their senior staff: to secure the best possible
progress for their disadvantaged pupils. But schools can’t do this on their own. The solutions do
not lie uniquely with schools, but stretch out across all other services. So the challenge applies to
local authorities, and to the leaders of every service which supports young people, from early
years to age 19 and beyond. And, of course, our commitment to abolish child poverty by 2020 is
a key part of our long term strategy.
I am really inspired by the example of the best schools leading our system and breaking the link.
I am determined that government will back schools and teachers to do even more, so that every
child, and not just some, can succeed at school.
Ed Balls
March 2009

8/11/2019 'Breaking the Link Between Disadvantage and Low Attainment - Everyone's Business' (2009)
http://slidepdf.com/reader/full/breaking-the-link-between-disadvantage-and-low-attainment-everyones 6/44
4
School standards in England have been transformed over recent years
It is a tribute to the hard work of thousands of teachers and school leaders that educationalstandards have been transformed in England over the past decade. Backed by sustained
investment, schools have achieved large rises in the attainment of their pupils. The school system
has never been better at fulfilling its purpose: to help every child and young person develop and
succeed, so they are secure and ready to progress to the next stage of their life.
Over this period England has gone from below to above average in comparison to other advanced
countries. This picture is confirmed by independent international evidence such as the recent
Trends in International Mathematics and Science Study (TIMSS) 2007 study of attainment at ages
10 and 14. This was published in December 2008, and showed that English children have madesignificant gains in maths since 20031 and are continuing to achieve excellent results in science.
In both subjects and at both ages English children perform in the top ten of the 59 countries
studied. England is the most consistently high performing European country in the 2007 study,
at both ages and for both subjects.
But these international studies also show there is further to go in some important respects to
become truly world class. For example, the recent Programme for International Student
Assessment (PISA) results showed that although England’s average results in the 2006 assessment
were well above the OECD mean, there was more variance, both between schools and especially
between pupils in the same school, than in the most successful countries such as Finland.
The chart opposite, which uses the PISA 2006 data, illustrates a similar point. The closer a country
is to the top of the chart, the better its average student performance in science. The closer a
country is to the right-hand side of the chart, the weaker the link between the socio-economic
background of its pupils and their performance in science. In both respects, the UK is above
average, but in both respects there is further to go to join the very best of the world’s education
systems.
1 Average scales scores up from 531 to 541 at age 10, and 498 to 513 at age 14
2. The evidence

8/11/2019 'Breaking the Link Between Disadvantage and Low Attainment - Everyone's Business' (2009)
http://slidepdf.com/reader/full/breaking-the-link-between-disadvantage-and-low-attainment-everyones 7/44
Breaking the link between disadvantage and low attainment – Everyone’s Business 5
600
300
550
500
450
400
350
30 020 10
Above-average level of student performance in scienceAbove average impact of socio-economic background
Below-average level of student performance in scienceAbove-average impact of socio-economic background
Above-average level of student performance in scienceBelow-average impact of socio-economic background
Liechtenstein Germany
France
BelgiumHungary
New ZealandNetherlands
SloveniaSwitzerland
CzechRepublic
Austria
Chinese Taipei
UnitedKingdom
Ireland
Australia
Sweden
EstoniaCanada
Finland
Korea
Japan
Hong Kong-China
Macao-China
Luxembourg Slovak Republic
United StatesLithuania
Portugal Greece
PolandDenmark
Spain
Croatia
Israel
Italy
Latvia NorwayRussian Federation
Iceland
Bulgaria Chile
Argentina
UruguayRomania
MexicoBrazil
Serbia
Columbia
Jordan
Indonesia Tunisia
Montenegro
Azerbaijan
Thailand
Turkey
Below-average level of student performance in scienceBelow-average impact of socio-economic background
Kyrgyzstan
OECD mean
A
v e r a g e s c a l e s c o r e
Chart 1 – UK’s performance is good but not yet world class
More young people than ever are achieving good exam results
Since 1997 school standards, measured by average attainment of the pupil cohort, have risen
steeply with strong improvement in national tests and examinations.
In primary schools the rise has been sustained and consistent. In 2008 81% of pupils achieved at
least level 4 (national expectations) in Key Stage 2 English, and 78% in mathematics, whereas in
1997 these figures were 63% and 62%. Last year over 100,000 more 11 year olds than in 1997
achieved the target level for their age in English.
There is a similar picture for secondary schools. In 1997 45% of 15 year olds achieved 5 good
GCSEs (5AC), and an estimated 36% achieved the tougher measure including both English and
maths (5ACEM). By 2008 these figures had risen to 65% and 48% respectively, with the result thatthe number of pupils achieving these levels last year were 129,000 and 76,500 larger than in 1997.

8/11/2019 'Breaking the Link Between Disadvantage and Low Attainment - Everyone's Business' (2009)
http://slidepdf.com/reader/full/breaking-the-link-between-disadvantage-and-low-attainment-everyones 8/44
Breaking the link between disadvantage and low attainment – Everyone’s Business6
35.9
44.745.6
46.3
47.6
53.0
35
37
39
41
43
45
47
49
51
53
55
1997 2005 2006 2007 2008 2009 2010 2011
% p
u p i l s a c h i e v i n g 5 + A * - C i n c E n g l i s h a n d m a t h s
Over 76,500 morepupils achieved 5+
A*-C GCSE
including English
and maths than
did in 1997.
Line indicates a break in the time series between the 1997 estimate and the actual figures for 2005 onwards.
Our national
target for 2011
Chart 2: GCSE results including English and maths have risen
significantly over the past decade
These are the best results ever, and they represent life-changing opportunities, to progress to
further and higher education and a secure future, for a very large number of young people everyyear. It is a success for which schools can legitimately take pride and credit. However, these are
the national averages of improved attainment, measured across the whole cohort of over
600,000 young people every year. We also need to look at the picture in more detail at the level of
different areas, different schools, different ethnicities, and finally – if we want to break the link
between a child’s chance of success and their background – at pupils from different socio-
economic backgrounds.
8/11/2019 'Breaking the Link Between Disadvantage and Low Attainment - Everyone's Business' (2009)
http://slidepdf.com/reader/full/breaking-the-link-between-disadvantage-and-low-attainment-everyones 9/44
Breaking the link between disadvantage and low attainment – Everyone’s Business 7
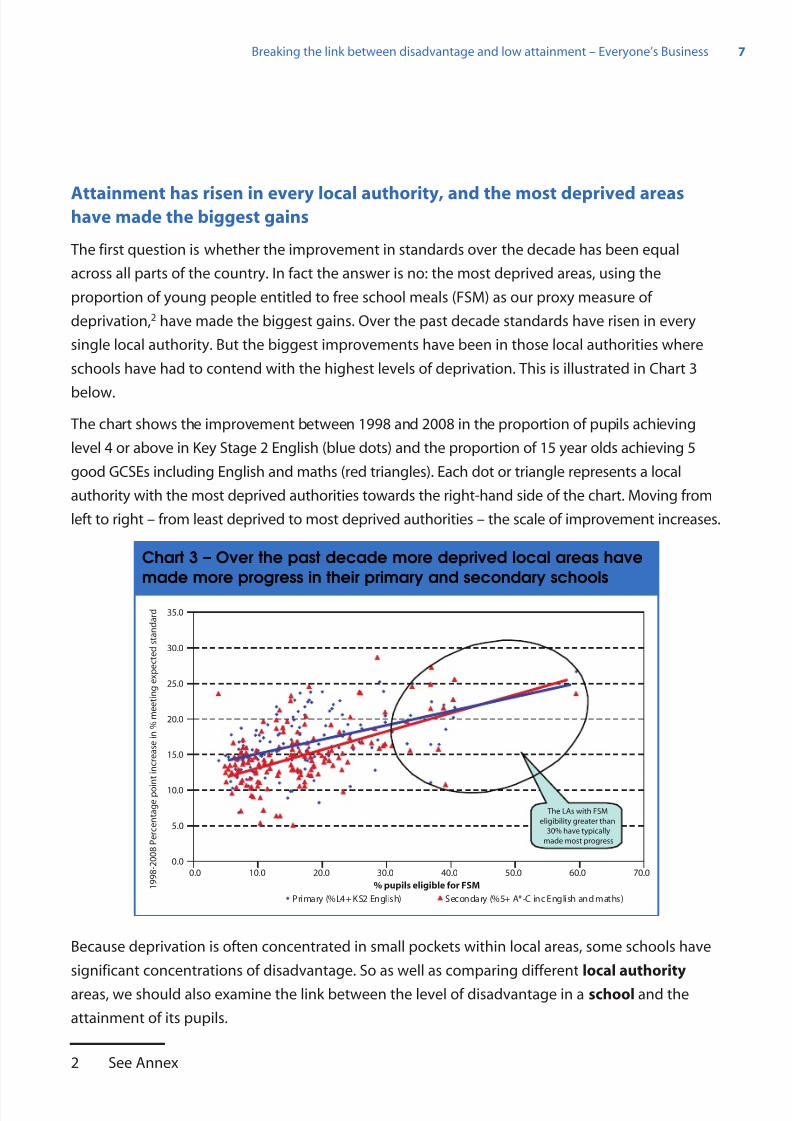
Attainment has risen in every local authority, and the most deprived areashave made the biggest gains
The first question is whether the improvement in standards over the decade has been equal
across all parts of the country. In fact the answer is no: the most deprived areas, using the
proportion of young people entitled to free school meals (FSM) as our proxy measure of
deprivation,2 have made the biggest gains. Over the past decade standards have risen in every
single local authority. But the biggest improvements have been in those local authorities where
schools have had to contend with the highest levels of deprivation. This is illustrated in Chart 3
below.
The chart shows the improvement between 1998 and 2008 in the proportion of pupils achieving
level 4 or above in Key Stage 2 English (blue dots) and the proportion of 15 year olds achieving 5
good GCSEs including English and maths (red triangles). Each dot or triangle represents a local
authority with the most deprived authorities towards the right-hand side of the chart. Moving from
left to right – from least deprived to most deprived authorities – the scale of improvement increases.
0.0
5.0
10.0
15.0
20.0
25.0
30.0
35.0
0.0 10.0 20.0 30.0 40.0 50.0 60.0 70.0
% pupils eligible for FSM 1 9 9 8 - 2 0 0 8 P e r c e n t a g e p o i n t i n c r e a s e i n % m
e e t i n g e x p e c t e d s t a n d a r d
Primary (%L4+ KS2 English) Secondary (%5+ A*-C inc English and maths)
The LAs with FSM
eligibility greater than
30% have typically
made most progress
Chart 3 – Over the past decade more deprived local areas have
made more progress in their primary and secondary schools
Because deprivation is often concentrated in small pockets within local areas, some schools have
significant concentrations of disadvantage. So as well as comparing different local authority
areas, we should also examine the link between the level of disadvantage in a school and the
attainment of its pupils.
2 See Annex

8/11/2019 'Breaking the Link Between Disadvantage and Low Attainment - Everyone's Business' (2009)
http://slidepdf.com/reader/full/breaking-the-link-between-disadvantage-and-low-attainment-everyones 10/44
Breaking the link between disadvantage and low attainment – Everyone’s Business8
The schools serving the most deprived pupils have made the most progress
Over the past decade the whole range of schools, from those with the lowest proportion of pupils
from low income backgrounds to those serving very disadvantaged communities, have improved
their results substantially. But it is the schools with the most deprived intakes which have made
the largest gains.
In the chart below, each set of three vertical bars represents a group of schools. In each set of
three bars, the left hand (yellow) bar is for 1999, the middle (green) bar is for 2005 and the right
hand (purple) bar is the latest year (2007 for primary and 2008 for secondary). For each bar, thebox shows the inter-quartile range of performance. The horizontal line is the median performing
school, and the ‘whiskers’ above and below the boxes show the 5th and 95th percentile ranges.
The left hand set of three bars represents the least deprived schools (with under 8% FSM in
primary and under 5% FSM in secondary). The set of three bars on the right-hand side represents
the most deprived schools with over 50% of their pupils eligible for FSM.
In each group of schools, attainment has risen consistently from 1999, through 2005, to the latest
year. But the improvement has been greatest for the more deprived schools (shown to the right
hand side of the charts). Chart 4 shows that median attainment at level 4+ in KS2 English tests inthe most deprived primary schools has risen by nineteen percentage points compared to a six
percentage points increase in the least deprived primary schools.
0
10
20
30
40
50
60
70
80
90
100
1 999 2005 200 7 1999 2005 20 07 1999 200 5 2 007 1999 20 05 2 007 199 9 20 05 2007
4 930 5231 545 1 4525 3702 36 20 2656 234 3 2 426 1548 14 62 1 300 102 6 822 63 6
=<8% FSM >8% & =<20%FSM
>20% & =<35%FSM
>35% & =<50%FSM
>50% FSM
% o
f P u p i l s a c h i e v i n g L 4 + E n g l i s h
Primary schools with
highest deprivation levels saw
a 19ppt improvementbetween 1999 and 2007.
Primary schools with
lowest deprivation levels
saw a 6ppt i mprovementbetween 1999 and 2007.
Primary School FSM bands
95th
75th
50th
25th
5th
Percentile
distribution
Chart 4 – Primary schools which serve more deprived pupils have
narrowed the attainment gap with schools serving more affluent
pupils

8/11/2019 'Breaking the Link Between Disadvantage and Low Attainment - Everyone's Business' (2009)
http://slidepdf.com/reader/full/breaking-the-link-between-disadvantage-and-low-attainment-everyones 11/44
Breaking the link between disadvantage and low attainment – Everyone’s Business 9
Chart 5 below shows the same pattern in secondary schools using the 5+ A*-C measure where
between 1999 and 2008 there was a 36 percentage points increase for the most deprived schools,
and 10 percentage points for the least deprived schools. The most deprived schools started
further behind but improved more than twice as fast.
0
10
20
30
40
50
60
70
80
90
100
Secondary School FSM bands
% o
f P u p i l s a c h i e v i n g 5 + A * - C G C S E s o r e q u i v a l e n t
95th
75th
50th
25th
5th
Percentile
distribution
1 9 9 9
2 0 0 5
2 0 0 8
1 9 9 9
2 0 0 5
2 0 0 8
1 9 9 9
2 0 0 5
2 0 0 8
1 9 9 9
2 0 0 5
2 0 0 8
1 9 9 9
2 0 0 5
2 0 0 8
1 9 9 9
2 0 0 5
2 0 0 8
1 9 9 9
2 0 0 5
2 0 0 8
264 438 477 494 646 659 448 486 462 585 539 537 552 510 498 298 244 208 165 97 73
=<5% FSM >5% & =
<9% FSM
>9% & =
<13% FSM
>13% & =
<21% FSM
>21% & =
<35% FSM
>35% &
=<50%
>50% FSM
Schools with lowest
deprivation levels saw a
10ppt improvementbetween 1999 and 2008.
Schools with highestdeprivation levels saw
a 36ppt improvementbetween 1999 and 2008.
Chart 5 – On the 5+ A*-C measure, the most deprived schools
started well behind but have made huge progress in the last ten
years
There is something else very important in the above chart that can be seen from the ‘whiskers’
indicating the range of performance. The highest attaining schools in the group with the highest
levels of deprivation are now achieving the same levels of attainment of 5+ A-Cs as average
schools in the least deprived group (in other words, the top whisker of the purple bar for the right
hand group is now level with the median line of the purple bar of the left hand group). Yet in 1999
(yellow bars) this was far from being true: even the best performing schools in deprived areas
were well behind the average for the most affluent areas. In ten years these schools have broken
the link between deprivation and attainment.
Chart 6 shows that a similar pattern for secondary schools can be seen when using the more
challenging measure, 5+ A*-C including English and maths. The gains may not be as impressive as
the 5+ A*-C measure, but the chart again shows that the most deprived schools have improved at
the fastest rate – increasing the median attainment by 19 percentage points between 1999 and
2008 compared to a ten percentage point gain in the least deprived schools.

8/11/2019 'Breaking the Link Between Disadvantage and Low Attainment - Everyone's Business' (2009)
http://slidepdf.com/reader/full/breaking-the-link-between-disadvantage-and-low-attainment-everyones 12/44
Breaking the link between disadvantage and low attainment – Everyone’s Business10
0
10
20
30
40
50
60
70
80
90
100
Secondary School FSM bands
% o
f P u p i l s a c h i e v i n g
5 + A * - C
G C S E s o r e q u i v a l e n t
i n c l u d i n g
E n g l i s h a n d M a t h s
95th
75th
50th
25th
5th
Percentile
distribution
1 9 9 9
2 0 0 5
2 0 0 8
1 9 9 9
2 0 0 5
2 0 0 8
1 9 9 9
2 0 0 5
2 0 0 8
1 9 9 9
2 0 0 5
2 0 0 8
1 9 9 9
2 0 0 5
2 0 0 8
1 9 9 9
2 0 0 5
2 0 0 8
1 9 9 9
2 0 0 5
2 0 0 8
264 438 477 494 646 659 448 486 462 585 539 537 552 510 498 298 244 208 165 97 73
=<5% FSM >5% & =
<9% FSM
>9% & =
<13% FSM
>13% & =
<21% FSM
>21% & =
<35% FSM
>35% &
=<50%
>50% FSM
Schools with lowest
deprivation levels saw a
10ppt improvement
between 1999 and 2008.
Schools with highest
deprivation levels saw a
19ppt improvement
between 1999 and 2008.
Chart 6 – On 5+ A*-C including English and maths, the most
deprived schools have again made the fastest improvement over
the last ten years
Further evidence that it is possible for schools to break the link between deprivation andattainment can be found in Ofsted’s recent report ’Twelve Outstanding Secondary Schools’3.
It draws from the practice, experience, and ambition of twelve consistently outstanding
maintained community schools which have been judged as outstanding in two or more
inspections, serve disproportionately disadvantaged communities, and have exceptionally good
results. These are among the very best schools in the country.
Deprivation presents schools with special challenges. Schools facing high levels of deprivation
can’t do it on their own, and need support from the whole range of local children’s services.
They need – and get – additional financial support too. But the experience of the best schools
shows that it can be done, and that it has been done.
Underperforming minority ethnic groups have made above average progress
Recent years have also seen big improvements for all the major minority ethnic groups that were
previously underperforming. The performance of the major census groups Black, Asian and Mixed
has improved faster than the cohort average at both primary and secondary levels over the past
five years. At Key Stage 4, as Chart 7 below illustrates, between 2003–08 Black pupils made a
14.7 point gain against the 5ACEM threshold, compared with a 6.7 point gain for the whole
cohort, so the gap between their performance and average performance narrowed substantially.
3 http://www.ofsted.gov.uk/Ofsted-home/Twelve-outstanding-secondary-schools-Excelling-against-the-odds

8/11/2019 'Breaking the Link Between Disadvantage and Low Attainment - Everyone's Business' (2009)
http://slidepdf.com/reader/full/breaking-the-link-between-disadvantage-and-low-attainment-everyones 13/44
Breaking the link between disadvantage and low attainment – Everyone’s Business 11
0.0
10.0
20.0
30.0
40.0
50.0
60.0
70.0
80.0
Black Mixed White Asian Chinese
% a
c h i e v i n g 5 + A * - C i n c l u d i n
g E n g l i s h a n d M a t h s
2003 2008
6.7pt improvement
for white pupils14.7pt improvement
for black pupils
25.5
38.841.2 41.2
66.0
40.2
46.9 47.9
50.6
69.5
Chart 7 – Black pupils are catching up: since 2003 their GCSE
attainment has increased at the fastest rate of any major ethnic
group
The reasons for this improvement are complex but they certainly include the emphasis which has
been placed on minority ethnic achievement at national, local and school level, through targeted
projects led by the National Strategies and delivered by local authorities and schools. But perhaps
even more significant is the contribution which local communities themselves have made. The
raising of aspirations of parents, families, and pupils and backed up by schools determined not to
permit underperformance to continue, has achieved this large improvement in the life chances
of many young people from minority ethnic backgrounds. Despite this there is still much more
to do as absolute achievement for some minority ethnic groups still lags behind the cohort as
a whole.
Disadvantaged pupils have made big gains, but there is still a strong link
between disadvantage and achievement
Both FSM pupils and non-FSM pupils have made significant gains at both primary and secondary
school in recent years.
The attainment of FSM pupils has improved strongly since 1997. An estimated 20,000 more FSM
pupils now achieve the expected standard at age 11 in maths than ten years ago, and over 16,000more in English. In maths their chances of success have increased from 38% in 1998 to 60% in
2007; and from 45% to 62% in English.

8/11/2019 'Breaking the Link Between Disadvantage and Low Attainment - Everyone's Business' (2009)
http://slidepdf.com/reader/full/breaking-the-link-between-disadvantage-and-low-attainment-everyones 14/44
Breaking the link between disadvantage and low attainment – Everyone’s Business12
It is also important to look at the gap in attainment between FSM pupils and the rest of the
cohort. Chart 8 below show KS2 performance in maths for pupils eligible for FSM and the rest of
the cohort. It shows some encouraging progress, with the gap narrowing by five percentage
points in maths over the past nine years; in English the equivalent gap has narrowed by three
percentage points. However, the chart also shows that this gap remains large.
38%
54% 53%55% 56%
58%60%
63%
77% 76% 78% 78% 79% 80%
0%
10%
20%
30%
40%
50%
60%
70%
80%
90%
1998 2002 2003 2004 2005 2006 2007
P e r c e n t a g e o f p u p i l s a c h i e v i n g l e v e l 4 + i n M a t h s a t K e y S t a g e 2
Pupils not eligible for FSM
Pupils eligible for FSM
Gap of20ppts
Gap of23ppts
Gap of25ppts
Maintained
mainstream only All maintained school
The gap at L4+ in KS2 mathsbetween FSM pupils and the rest
of the cohort has closed by
5 percentage points between1998 and 2007
Chart 8 – In KS2 maths the gap between FSM pupils and the rest
of the cohort has narrowed by 5 percentage points

8/11/2019 'Breaking the Link Between Disadvantage and Low Attainment - Everyone's Business' (2009)
http://slidepdf.com/reader/full/breaking-the-link-between-disadvantage-and-low-attainment-everyones 15/44
Breaking the link between disadvantage and low attainment – Everyone’s Business 13
0%
10%
20%
30%
40%
50%
60%
70%
80%
90%
1998 2002 2003 2004 2005 2006 2007
P e r c e n t a g e
o f p u p i l s a c h i e v i n g l e
v e l 4 + i
n
E n g l i s h
a t K e y S t a g e
2
Pupils not eligible for FSM
Pupils eligible for FSM
Maintained
mainstream only All maintained school
45%
53% 54%
58% 60%61% 62%
69%
79% 79%81% 82% 83% 83%
Gap of 21ppts
Gap of 26ppts
Gap of 24
ppts
The gap at L4+ in KS2 English
between FSM pupils and the
rest of the cohort has closed by
3 percentage points between
1998 and 2007
Chart 9 – The same is true for KS2 English – the gap between FSM
pupils and the rest of the cohort has narrowed by 3 percentage
points
A similar pattern can be seen at Key Stage 4 (Chart 10 below), where the gap between the
achievement of FSM pupils and the rest of the cohort of 5+ GCSE or equivalents at A*-C has
narrowed by four percentage points from 31 percentage points in 2002 to 27 points in 2008.

8/11/2019 'Breaking the Link Between Disadvantage and Low Attainment - Everyone's Business' (2009)
http://slidepdf.com/reader/full/breaking-the-link-between-disadvantage-and-low-attainment-everyones 16/44
Breaking the link between disadvantage and low attainment – Everyone’s Business14
P e r c e n t a g e o f p u p i l s a c h i e v i n g
5 + A
* - C
G C S E o r e q u i v a l e n t
70%
60%
50%
40%
30%
20%
10%
0%2002 2003 2004 2005 2006 2007 2008
Pupils not eligible for FSM
Pupils eligible for FSM
Gap of27 ppts
Gap of31 ppts
Gap of29 ppts
15 year olds End of Key Stage 4
The gap at 5+ A*-C between
FSM pupils and the rest of the
cohort has closed by 4
percentage points between
2002 and 2008
Chart 10 – In secondary schools (using 5+ A*-C) the gap
between FSM pupils and the rest of the cohort has narrowed by 4
percentage points since 2004
This narrowing of the gap is similarly repeated at GCSE subject level, as shown by chart 11.
In GCSE English and in GCSE maths the proportion of FSM pupils achieving grade A*-C has
increased at a faster rate than the rest of the cohort, with the gap narrowing in both subjects by
two percentage points since 2004. In maths the chances of an FSM pupil achieving A*-C have
risen from 25% in 2004 to 35% in 2008; and from 32% to 39% in English.

8/11/2019 'Breaking the Link Between Disadvantage and Low Attainment - Everyone's Business' (2009)
http://slidepdf.com/reader/full/breaking-the-link-between-disadvantage-and-low-attainment-everyones 17/44
Breaking the link between disadvantage and low attainment – Everyone’s Business 15
% A c
h i e v i n g A * - C
Not el igib le for FSM Pupi ls eligible for FSM
0%
10%
20%
30%
40%
50%
60%
70%
2004 2008 2004 2008Year
29
ng s Maths
27
28
26
The gap, for both English and Maths,has narrowed by 2 percentage points
Chart 11 – In the key GCSE subjects of English and maths FSM
pupils are narrowing the gap
The chances of an FSM pupil achieving the more challenging measure of 5+ A*-C including
English and maths has increased from under 15% in 2002 to 23.5% in 2008. Despite this increase
of over eight percentage points there has been little gap narrowing.
Disadvantaged pupils fall behind from the early years
The social class gap in attainment opens up by 22 month. Chart 12 below illustrates that an FSM
child has around 3 times worse odds of achieving good school outcomes than a non-FSM child at
every critical point in their education after age 5.
The chart shows the outcome of FSM and non-FSM pupils at six stages: Foundation Stage, end of
Key Stage 1, end of Key Stage 2, end of Key Stage 3, at GCSE and entry into Higher Education (HE).
For each of the six stages there are a pair of bars: the blue bar represents the outcome for pupils
who are not eligible for FSM, and the red bar – which is always below the level of the blue bar –
shows the outcome for pupils eligible for FSM.
The black dot above each pair of bars shows the odds of an FSM pupil achieving the expected
standard for their age in comparison to a pupil not eligible for FSM. The best odds of an FSM pupil
achieving the expected standard occur in the Foundation Stage, and even then the odds are thatthey are two and a half times less likely to achieve it than the more affluent pupils. The odds for
FSM pupils worsen at the end of Key Stage 1 and remain stable at about three times less likely to
achieve the expected standard in Key Stage 2 and through to age 19.

8/11/2019 'Breaking the Link Between Disadvantage and Low Attainment - Everyone's Business' (2009)
http://slidepdf.com/reader/full/breaking-the-link-between-disadvantage-and-low-attainment-everyones 18/44

8/11/2019 'Breaking the Link Between Disadvantage and Low Attainment - Everyone's Business' (2009)
http://slidepdf.com/reader/full/breaking-the-link-between-disadvantage-and-low-attainment-everyones 19/44
17
For most pupils school is a rich and rewarding experience, but it is an uncomfortable fact that at
every ability level in the system, pupils from poor backgrounds achieve less well than their
counterparts. The reasons are complex, and not purely linked to money. Of course, absolute levels
of poverty may mean children suffer from poor housing or an inadequate diet. But, even in
families above the poverty line, parents may be sceptical about the value of education and not
see that success at school is important for their children.
There is much that can be done to support schools to address these issues. But real progress in
breaking the link between deprivation and low educational attainment relies most of all on the
leadership of every teacher in every school, and on their ability to transmit their own passion for
transforming opportunity.
Early years and the home
Even when children are very young, the link between cognitive development and family
deprivation is already apparent. For example, research4 has identified significant gaps in
developmental tasks have opened up at 22 months, and the Millennium Cohort Study shows
lower vocabulary at age three for children from poorer households. Investment in early years
services for children and families such as Sure Start and free nursery education will address these
early gaps, and specific new interventions including “Every Child A Talker” are designed to tacklesome of the key issues.
Nevertheless, children may not experience the benefits at home which more advantaged children
take for granted, for example access to a wide range of books or educational software. Parents
want to help their children succeed, but do not necessarily know the best way to do this 5. We are
providing targeted support, for example through promoting family reading and seeking to help
parents who may themselves have had a poor experience of schools not to pass on those
negative perceptions to their children.
4 Feinstein (2003) ‘Inequality in the Early Cognitive Development of British Children in the 1970 Cohort’, Economica
70, pp. 73–97
5 See Jim Knight’s speech to SSAT Nov 2008 http://www.dcsf.gov.uk/speeches 27/11/08 SSAT Annual Conference
3. Why disadvantaged pupilsprogress less well at school

8/11/2019 'Breaking the Link Between Disadvantage and Low Attainment - Everyone's Business' (2009)
http://slidepdf.com/reader/full/breaking-the-link-between-disadvantage-and-low-attainment-everyones 20/44

8/11/2019 'Breaking the Link Between Disadvantage and Low Attainment - Everyone's Business' (2009)
http://slidepdf.com/reader/full/breaking-the-link-between-disadvantage-and-low-attainment-everyones 21/44

8/11/2019 'Breaking the Link Between Disadvantage and Low Attainment - Everyone's Business' (2009)
http://slidepdf.com/reader/full/breaking-the-link-between-disadvantage-and-low-attainment-everyones 22/44
Breaking the link between disadvantage and low attainment – Everyone’s Business20
Behaviour
Pupils eligible for FSM are seven times more likely to be permanently excluded from primary
school than those who are not eligible, and three and a half times as likely to be permanently
excluded from secondary school. Sir Alan Steer has been conducting a comprehensive Behaviour
Review for the Department, and in February 2009 presented the fourth in his series of reports
highlighting the need for school behaviour policies to be set in the context of policies on learning
and teaching. The links between poor behaviour and low attainment are not straightforward, but
if pupils are failing to keep up in lessons they can become bored and disruptive, preferring to gain
notoriety amongst their friends than admit they do not understand something. Expressing
emotion can be a cultural taboo, especially for boys. Children from disadvantaged backgrounds
sometimes do not have the skills or self-confidence to deal with criticism or set-backs, which may
make them more likely to express denial or to respond negatively and inappropriately when
challenged. Programmes such as SEAL address this by helping pupils develop self-belief and to
manage conflict.
Outside influences
Aspiration is a key issue: what do young people want to do with their lives, and do they
understand how to achieve that? At puberty, the influence of peer groups becomes much
stronger which can create a culture of it being “not cool to learn”. Recent research by Cabinet
Office has shown a significant disparity in aspirations, with young people from traditional
working-class communities showing less ambition than more recently arrived groups. An inter-
generational pattern of worklessness can lead to insularity and low horizons. Schools can begin to
change this by providing access to positive role-models from similar backgrounds with whom
young people can identify. Schools can also provide a range of experiences, in arts, sport or
community volunteering, which gives children a glimpse into other worlds and helps them to find
something they can succeed at. And schools are making sure that they all have productive links to
business and to Universities, so that young people learn early what is possible for them and are
motivated to take advantage of the opportunities.
Schools can make a much wider contribution to a community. We know less about the influence
of communities on children than we do about the importance of the immediate family, and this is
something the “Inspiring Communities” pathfinders announced in the New Opportunities White
Paper will address. Schools themselves can have a significant effect on local culture: those which
succeed in the most disadvantaged areas respect the local community, employing local people
wherever possible, but insistng upon high standards and expectations for everyone.
8/11/2019 'Breaking the Link Between Disadvantage and Low Attainment - Everyone's Business' (2009)
http://slidepdf.com/reader/full/breaking-the-link-between-disadvantage-and-low-attainment-everyones 23/44
Breaking the link between disadvantage and low attainment – Everyone’s Business 21
Schools cannot do this in isolation. We know that teachers, particularly in disadvantaged areas,
often spend a lot of time dealing with pupils’ and parents’ wider problems. Extended services can
make a big difference: having integrated health and social care on school sites means that
problems getting in the way of children’s learning can be more easily dealt with.
Over 15,500 schools (72%) across the country now offer access to extended services, and all
schools are expected to do so by 2010. While awareness of and satisfaction with services among
parents is relatively high, the challenge remains to ensure that particularly disadvantaged groups
participate and make use of the offer.
In particular, children from relatively deprived families are a little less likely to have used activities
and childcare than their peers and these families are less likely to state that the offer meets their
needs. The data shows there is a participation gap between FSM eligible pupils and those not
eligible, with non FSM showing typically a 10% higher participation rate. This shows that, whilst a
good start has been made in enabling disadvantaged children to participate in high quality after
school activities, more needs to be done to maximise the benefits these activities can bring to
children’s engagement with learning. For example, schools need to do more to consult and
actively involve children and parents in designing the package of activities which will engage
them best, whilst exploring and tackling other barriers to their participation, such as transport
difficulties or attitudes.
To ensure that cost of activities does not act as a barrier for participation of the most
disadvantaged pupils, we are rolling out the extended schools subsidy, worth £265m over the
current spending period. This is designed to provide funding to clusters of schools to ensure that
the most disadvantaged children can take part in activities of their choosing.
Wider opportunities
Ensuring the curriculum is relevant and engaging is, of course, important for all pupils but
especially those who have not been well served by the traditional curriculum. The new Diplomas,
with their mix of theoretical and practical learning, give an opportunity to motivate pupils and
demonstrate the relevance of education to what they want to do in their lives. Many schools are
exploring how to improve the match between the basic curriculum and the needs and aspirations
of their pupils, extending the range of curricular pathways where possible. They also take every
chance to celebrate success, so that pupils can see that they are making progress and have
tangible, realistic goals to work towards.
Our 14-19 Qualifications Strategy is designed to ensure that there is a high quality learning route
accessible for all young people, whatever their talents and aspirations. We are streamlining the
current qualifications so that all young learners have a choice between four nationally available

8/11/2019 'Breaking the Link Between Disadvantage and Low Attainment - Everyone's Business' (2009)
http://slidepdf.com/reader/full/breaking-the-link-between-disadvantage-and-low-attainment-everyones 24/44
Breaking the link between disadvantage and low attainment – Everyone’s Business22
learning routes: GCSE and A-Level; the Diploma; Apprenticeships; and the Foundation Learning
Tier Progression Pathways. These are broad and flexible programmes of study which offer
different types of learning that are appropriate for different learners – from those wishing to
follow a traditional academic programme, to those who have a clear idea about the occupation
they want to train for. For example, apprenticeships (programmes of learning completed in the
workplace) enable young people to ‘earn while they learn’, thus breaking through any financial
barriers to further study and, through the relationship with an employer, providing a direct route
into the world of work. The range of apprenticeships has increased considerably in recent years.
We are expanding these opportunities even further so that apprenticeships are a recognised, highquality mainstream education and training option with clear entry and progression routes.
Links to SEN and other additional needs
An FSM child is also more likely to have been identified with special educational needs (SEN).
There is a very large overlap between FSM status and either having a statement of SEN or being
categorised as School Action Plus. An FSM child may also come from one of the minority ethnic
groups that underperform compared to the rest of the cohort. There is often an interaction effect
between these factors. The interventions which will help a child to succeed are likely to be very
similar in each case – a clear assessment of where they are starting from, personalised learning to
make sure they have the basic educational and personal skills in place, a rigorous approach to
tracking their progress, high aspirations and stretching, relevant targets.
All of this demonstrates why pupils from deprived backgrounds are likely to underperform, and
explains why schools should identify and closely monitor the progress of their FSM pupils.
The evidence is clear: given two pupils on the same level of attainment who are both performingbelow expectations, the child from the deprived background is more likely to fall behind.
Later in this document we discuss planned changes to the accountability framework to encourage
a more rounded view of the factors affecting children’s achievement.

8/11/2019 'Breaking the Link Between Disadvantage and Low Attainment - Everyone's Business' (2009)
http://slidepdf.com/reader/full/breaking-the-link-between-disadvantage-and-low-attainment-everyones 25/44
Breaking the link between disadvantage and low attainment – Everyone’s Business 23
Symptoms, issues and responses
The chart below summarises the main symptoms and causes of the atttainment gap for
disadvantaged pupils, and the strategies which schools and local authorities can adopt to
address them:
Why do disadvantaged children progress less well?
Some symptoms and issues Possible school and LA responses
Cognitive gaps already evident before age 5 Children’s Centres, support for families and early
reading
Weaker home learning environment Schools working closely with parents
Lower prior attainment at each Key Stage Personalisation, progress, ‘keep up not catch-up’
Harder to recover from stalled learning Tracking, early intervention, one-to-one tuition
Quality of teaching for children in lower sets In-school teacher deployment, training
Behaviour, exclusion and absence issues Behaviour, exclusion and absence policies, SEAL,new curriculum
Aspirations, peer influences, “not cool
to learn”
Positive role-models, active information, advice
and guidance policiesWeak family/community networks School/cluster/LA action to compensate
Narrow experiences and opportunities Broader curriculum; extended school services
SEN/disadvantage overlap Ensure SEN policies focus on progress
Gaps are too often an “invisible issue” Use new accountability framework
The effects of disadvantage are cumulative and pervasive because poor pupils typically make
slower progress than pupils with similar attainment from more affluent backgrounds.
To weaken the link between disadvantage and achievement we must continue to raise attainment
overall, and accelerate the rate of progress made by the lowest performers. And at the same time
we must focus resources on children from disadvantaged backgrounds because without extra
help and support they will fall even further behind.
This is not an impossible task. Schools in London and elsewhere are already showing impressive
rates of improvement for children from deprived backgrounds. Nor does it require a whole new
pedagogy or approach. Repeated examples show that what really makes a difference is the
consistency with which schools engage all their pupils, always being determined to go the extra
mile to help them to achieve.

8/11/2019 'Breaking the Link Between Disadvantage and Low Attainment - Everyone's Business' (2009)
http://slidepdf.com/reader/full/breaking-the-link-between-disadvantage-and-low-attainment-everyones 26/44
24
Breaking the link between disadvantage and attainment means securing good progress for pupils
from disadvantaged backgrounds, wherever these pupils are found. Part of this strategy will
involve focusing on particular areas and schools where there is concentrated disadvantage, but a
very important part of it will mean securing better progress for disadvantaged pupils in schools
which are not serving particularly disadvantaged communities.
We must continue addressing disadvantage where it is concentrated in
particular areas and schools
As the data shows, we have seen encouraging success at the area and school level. One such
example is in London, where gaps have narrowed and average results have improved very
significantly over the last five years. In 2002 5ACEM attainment in London was 39%, below the
national figure of 40%; in 2008 that had reversed and London attainment of 51% exceeded the
national figure of 48%. The most disadvantaged pupils in London also very significantly
outperform those nationally: in 2008 33.8% of FSM pupils in London achieved 5ACEM compared
to 23.5% of FSM pupils nationally.
We are building on the successes of many schools in London and elsewhere in launching the
National Challenge, which aims to raise achievement in the secondary schools with the lowest
results, so that all schools in England will achieve at least 30% 5ACEM by 2011. We are making amajor targeted investment of £400m to raise performance in the secondary schools, spread all
over the country, where average attainment and progress are below this minimum benchmark.
Their numbers have fallen from 1600 in 1997 to just 440 now. The extra investment will support
those schools to set and achieve even higher ambitions for their pupils, by providing school
leadership teams and teachers with the tools and support to make long lasting change. Many of
the schools that have now moved securely above the 30% threshold have relatively
disadvantaged intakes, proving deprivation need not be a barrier. The National Challenge
programme aims not only to ensure that all communities have schools where results are good,
but also to raise achievement in some schools where disadvantage is concentrated.
4. Breaking the link inevery school

8/11/2019 'Breaking the Link Between Disadvantage and Low Attainment - Everyone's Business' (2009)
http://slidepdf.com/reader/full/breaking-the-link-between-disadvantage-and-low-attainment-everyones 27/44
Breaking the link between disadvantage and low attainment – Everyone’s Business 25
But disadvantaged pupils are not only found in disadvantaged schools
Disadvantaged pupils are more likely to be concentrated in primary schools with high FSM
proportions; this is less true in secondary schools. About half (48%) of pupils entitled to FSM are to
be found in the third of schools with greatest concentration of disadvantage, and the other half
are spread across the other two thirds of schools. And as the chart below shows, nearly a third
(28%) are in schools with below average deprivation. So to break the link between deprivation
and attainment, it will also be essential for schools which have less deprived intakes than average
to secure good progress for their deprived pupils.
P e r c e n t a g e o f c o m p u l s a r y s c h o o l
a g e p u p i l s e l i g i b l e f o r F S M
i n m a i n t a i n e d m a i n s t r e a m s e c o n d a r y
s c h o o l s ( 2 0 0 8 S c h o o l C e n s u s )
5
1112
20
28
16
8
0
5
10
15
20
25
30
0-5% 5-9% 9-13% 13-21% 21-35% 35-50% 50+%
Secondary school FSM band
28% of disadvantaged
pupils (eligible for FSM)
attend relatively affluent
secondary schools, with
below average entitlement
to FSM (less than 13%)
Nationally 13% of
secondary school pupils
are eligible for FSM
Chart 15 – 28% of FSM and secondary pupils attend schools with
below-average FSM numbers
Poor children don’t only, or even mainly, live or go to school in deprived areas. They are dispersed
across the whole country. The map opposite shows FSM distribution by the smallest available
geographical area comprising approximately 1,500 inhabitants. It shows a much greater dispersal
with pockets of deprivation even in areas which are otherwise relatively affluent. This map
highlights that FSM children are found just about everywhere, and that the issue is therefore one
for every head and every school.

8/11/2019 'Breaking the Link Between Disadvantage and Low Attainment - Everyone's Business' (2009)
http://slidepdf.com/reader/full/breaking-the-link-between-disadvantage-and-low-attainment-everyones 28/44
Breaking the link between disadvantage and low attainment – Everyone’s Business26
Chart 16 – FSM children are widely dispersed

8/11/2019 'Breaking the Link Between Disadvantage and Low Attainment - Everyone's Business' (2009)
http://slidepdf.com/reader/full/breaking-the-link-between-disadvantage-and-low-attainment-everyones 29/44
Breaking the link between disadvantage and low attainment – Everyone’s Business 27
The relative gap in performance between FSM and non-FSM children is
greatest in the least deprived schools
Chart 17 below shows that in the least deprived schools the 5ACEM gap is 36 percentage points,
whereas in the schools where over half their pupils are eligible for FSM it is only 9 percentage
points.
0
10
20
30
40
50
60
70
0-5%
% p u p i l s a c h i e v i n g 5 + A * - C i n c E n g l i s h a n d m a t h s
5-9% 9-13% 13-21% 21-35% 35-50% 50%+
School FSM band
Not eligible for FSM Pupils eligible for FSMLeast deprived schools Most deprived schools
63
53
46
40
36
31
35
30
26
22
1921
20
26
Chart 17: The relative gap in performance between FSM and
non-FSM children is greatest in the least deprived schools

8/11/2019 'Breaking the Link Between Disadvantage and Low Attainment - Everyone's Business' (2009)
http://slidepdf.com/reader/full/breaking-the-link-between-disadvantage-and-low-attainment-everyones 30/44
Breaking the link between disadvantage and low attainment – Everyone’s Business28
This analysis shows that there is an important job to do in schools with relatively small numbers of
deprived pupils. Such pupils may do well compared to deprived pupils in other areas and other
parts of the country. But the relative gap with other pupils in the same area and school is large.
Schools which actively track this gap often find that simply being aware of it is the most important
step towards addressing it. Some schools are already succeeding in narrowing it, and case studies
from these are included in the next section of this document. The Extra Mile schools which began
their trial work last September have also addressed the issues across the whole range of their
work, from admissions and transitions, classroom teaching and homework, sport and recreation,
and relations with the parents and families. The problem is common to all schools, even thoughthe solutions may be individual.
So we need a strategy for gap-narrowing that works in every school
Building on the December publication of ‘21st Century Schools: A World-Class Education for Every
Child’ we will publish a White Paper, later in the spring, which will set out how we will create a
system within which the individual needs of pupils and their families shape the services which are
provided by schools and the wider system of children’s services. In this system:
Schools will set high aspirations for all children, will focus on the engagement of pupils inz
learning, will monitor their progress closely and will work to identify early and address barriers
to achievement.
This will include tailoring learning experiences to children’s needs, for example through use of
group or one-to-one work; ensuring that every child has someone within the school who
knows them well and is able to support their development and decision-making; and working
to effectively engage parents and carers to support children’s learning and development.
School staff will be able to identify children and young people’s additional needs and willz
know how to access the required support, either within the school, from a partner school, or
from wider services for children and young people within the Children’s Trust.
Schools will have staff members with the capacity to investigate issues and, where appropriate,
make formal assessments of needs; and with strong links to wider local children’s services, for
example through local multi-agency arrangements, which will enable them to access specialist
services where needed.
Schools will exercise a strong voice on the local Children’s Trust, which will ensure that services
are coordinated and integrated around children’s needs. Legislation currently before
Parliament would give schools a place on Children’s Trust Boards and would give schools a
greater opportunity to inform and influence the Children and Young People’s Plan in each
local area and the way that services are commissioned and configured.

8/11/2019 'Breaking the Link Between Disadvantage and Low Attainment - Everyone's Business' (2009)
http://slidepdf.com/reader/full/breaking-the-link-between-disadvantage-and-low-attainment-everyones 31/44
Breaking the link between disadvantage and low attainment – Everyone’s Business 29
Schools will work in partnership with each other and with wider children’s services to sharez
expertise and to ensure a wide and engaging offer to children, young people and families.
Schools will be able to provide a wider, more engaging curriculum offer and will be able to
access more specialist teaching through working together in partnership and sharing
resources. And, similarly, pupils will benefit from school staff engaging in high quality
collaborative professional development, which will enable them to extend and exchange
expertise and effective practice, including strategies for narrowing gaps.
Resources in the system will be deployed to best effect to improve outcomes for all childrenz
and young people.
The current review of the distribution of the Dedicated Schools Grant will consider how to
put in place a funding system which better reflects need, and to give schools greater
flexibility to meet the learning and development needs of all their pupils, including those
who need extra services and support if they are to reach their full potential.
The accountability system will give schools stronger incentives to reduce variances, narrowz
gaps and achieve good progress for all pupils
Members of the school workforce have an over-riding motivation, namely to make a
difference to the life chances of young people. For many there is a particular driver: to lift
the aspirations and achievement of disadvantaged children, and hence contribute to a fairer
and more equal society.
Through the introduction of the new School Report Card, we aim to reward this motivation
to see every child make good progress. We intend to put in place a system which
encourages and recognises schools for the progress and achievements of all pupils rather
than just their average or borderline pupils, or those who will be easiest to help to progress,
while leaving weaker or more disadvantaged pupils to struggle or disengage from learning.
The School Report Card will recognise schools’ achievement across a wider range of
outcomes than the accountability system has done hitherto. It will focus not only on
averages of academic attainment across the cohort, but also on the progress of all pupils;
on narrowing the gaps between different groups of children and young people; on working
in partnership; and on achievement across all five ECM outcomes. The School Report Card
and other elements of the accountability system will challenge but also support schools to
have regard to this wider set of outcomes.

8/11/2019 'Breaking the Link Between Disadvantage and Low Attainment - Everyone's Business' (2009)
http://slidepdf.com/reader/full/breaking-the-link-between-disadvantage-and-low-attainment-everyones 32/44
Breaking the link between disadvantage and low attainment – Everyone’s Business30
Our spring White Paper will set out proposals for a refocused accountability system. It will
be accompanied by further consultation on how it could help schools focus on all pupils –
not just those close to a borderline, but those currently well below or well above it; thus
narrowing gaps in attainment, delivering to every child’s full potential at all ranges of ability
and attainment, and recognising the contribution schools make across the full range of
children’s development.

8/11/2019 'Breaking the Link Between Disadvantage and Low Attainment - Everyone's Business' (2009)
http://slidepdf.com/reader/full/breaking-the-link-between-disadvantage-and-low-attainment-everyones 33/44
31
In developing a strategy for breaking the link between deprivation and attainment we need to
build on what is already happening successfully and bring out the elements which work most
effectively.
From the evidence, analysis and front-line experience which is reflected in the preceding sections,
we have developed a framework for structured approach at school and local level. It is based on
five broad areas of action – as shown in the illustration below. Over the coming months we intend
to develop this framework, in consultation with schools and LAs.
Headteachers/school leaders to ensure staff take special noteof disadvantaged/other vulnerable pupils, and target andtrack their progress
Ensure that EY services, and school support for parents, target
disadvantage. Focus on home/school interface (eg homework,
reading, resources).
Ensure teachers know and intervene early for FSM pupils
(eg 1:1 tuition). Consider redeployment of teachers to support
pupils with lowest attainment.
Broaden pupils’ experiences, raise aspirations, address linked
issues (health etc). Use extended services, and lessons from
Extra Mile project, to target disadvantage.
Raising visibility and awareness
Early years, parents
Targeted support in basics
Beyond classroom – extended school and
other services; post 16
Use external and self-evalutation to focus on gaps and
progress, not just average attainment. Consider deployment
of extra resources where most effective.School and LA accountability and funding
Chart 18 – Framework for school and LA action
5. Breaking the link – a priorityfor national, local and schoolaction

8/11/2019 'Breaking the Link Between Disadvantage and Low Attainment - Everyone's Business' (2009)
http://slidepdf.com/reader/full/breaking-the-link-between-disadvantage-and-low-attainment-everyones 34/44
Breaking the link between disadvantage and low attainment – Everyone’s Business32
We have looked at what is happening in the most effective schools and local authorities, and
gathered case studies of some of the most innovative practice. In doing so we have found that
there emerged a natural framework for action, breaking into five main headings as in the chart,
and we have organised the case studies using the same headings:
Raising visibility and awareness
The first step to addressing under-performance is to recognise where it exists, and to consider likely causes. This requires
schools to identify and track individual pupil progress, recognising that certain groups of students face similar
challenges. Collaboration with feeder schools and LA services can help prevent gaps ever emerging.
Henry Compton School (Fulham) has prioritised the early identification of Y6 SEN pupils at feeder primaries.An LA-funded transition learning mentor works with the feeder schools, collecting relevant data to develop a
transition and learning profile. Literacy and numeracy are prioritised. Before the pupil transfers the new tutor
already has CAT scores, observation notes, resilience profiles and personalised timetables. A KS3 nurture group is
provided for those most at risk. External input from support agencies including speech and language therapy, EPS
lesson support and CAMHS services is available. The impact on pupils is remarkable: in a school with 29% SEN, 50%
EAL, 40% FSM and 20% in-year mobility, only 1 permanent exclusion was made in the last 3 years. Persistent
absence continues to fall. Pupils’ progress is good, achievement is improving and the curriculum embraces a wide
range of needs. All pupils are guaranteed FE places. The school now aims to develop a learning support unit for
hard to reach pupils.
Bow School of Maths and Computing in Tower Hamlets was supported by the London Challenge Keys to Success
programme from 2003 to 2007. This small multicultural school for boys has 80% BME, 60% FSM, 60% EAL, and high
rates of SEN and mobility. In 2005, 29% of pupils achieved 5ACEM; in 2008, this had risen to 37%. Over the sameperiod, the attainment of FSM pupils increased at twice the rate of non-FSM pupils (whose attainment also rose),
from 29% 5ACEM to 40% – thus actually reversing the FSM gap.
Raising awareness of the challenges at all levels throughout a school can highlight issues which might otherwise have
gone unrecognised.
Springfields School (Wiltshire) is a BESD) special school centre of excellence, removing all barriers to achievement
for SEN children. It has reduced both fixed and permanent exclusions sharply by developing innovative outreach
and in-reach packages, ensure consistency in behaviour management, an support fresh starts and planned
transfers. Springfields is a completely non excluding school. NEET figures have been zero for two years, the average
point score at the end of Key Stage 4 has doubled, and unauthorised absence is running at 1%.Springfields ensures
real continuity of provision for its pupils – their aspirations and best interests come first in all decisions. Early
identification of needs and swift referral is the key to preventing further disaffection.
Q3 Academy, formerly Dartmouth High School (Birmingham), focused on disproportionate Black Caribbean
exclusions. A thorough look at data enabled the school to focus on specific areas which could reduce the risk of
exclusion. The reintegration package was reviewed and a stronger intervention programme for students returning
from fixed period exclusions was introduced. This led to a drop in repeat fixed period exclusions and permanent
exclusions.

8/11/2019 'Breaking the Link Between Disadvantage and Low Attainment - Everyone's Business' (2009)
http://slidepdf.com/reader/full/breaking-the-link-between-disadvantage-and-low-attainment-everyones 35/44
Breaking the link between disadvantage and low attainment – Everyone’s Business 33
Parental Engagement and Early Years
Parental engagement in a child’s learning has a major impact on later achievement – more significant than parental
income. Schools have found many ways to link with their local communities and make parents feel welcome and
connected with their child’s learning.
Copeland Secondary School in Wembley (Brent) is aware of the importance of role models. This is reflected in
their workforce, 45% of whom come from minority ethnic backgrounds. The school has introduced a number of
strategies to strengthen parental engagement, for example providing online support and direction to help parents
support their children with homework activities.
Blue Gate Fields Infant School (Stepney, Tower Hamlets), has run a range of initiatives designed to encourage
parents to support their children’s early year’s development. Nearly all pupils are EAL. Activities on offer are based
on developing parenting skills and experiences in order to help develop children’s learning. In addition, all parentsare encouraged to become volunteers during the school day through a six-week parent volunteer programme.
A toy library for parents with pre-nursery children develops parents’ playing skills with their children. An oracy
group encourages families to play games together and practice speaking English in a safe environment. Parents,
pupils and school staff believe the work has had a positive impact.
Parent support groups set up at Lister Community School (Newham) for Somali and Bengali parents have helped
involve them in the wider school community. The groups help the school share information on school policies,
curriculum issues, and adult learning, as well as offer support and advice about services and entitlements. The
success of the groups and contributions from parents have resulted in new initiatives – such as special family
learning sessions for Bengali-speaking parents and children, joint social events and learning opportunities. The
school is seeing regular attendance from parents who had previously been hard to reach. The school is extending
this approach within the local school cluster.
At Caslon Primary School (Dudley), family learning is at the heart of the school’s drive to improve standards and
engage with the community. Caslon serves an area of deprivation where levels of adult education are in the lowest
10 percent nationally. It is working hard to raise aspirations through partnership with parents. The school offers
access to a wide range of family and adult learning courses and community activities. In 2008, over 35 different
qualifications were achieved by Caslon parents studying through the school. This has led parents to engage
directly with their children’s learning. Adult learning is having a positive impact on pupils’ motivation, attendance
and standards – the school’s Key Stage 2 scores have increased in each of the last four years, from 160 to 240.
7 Source: Teachers TV – www.teachers.tv/video/3053

8/11/2019 'Breaking the Link Between Disadvantage and Low Attainment - Everyone's Business' (2009)
http://slidepdf.com/reader/full/breaking-the-link-between-disadvantage-and-low-attainment-everyones 36/44
Breaking the link between disadvantage and low attainment – Everyone’s Business34
Targeted support in basics
A rigorous focus on teaching and learning ensures that all pupils make progress.
In 2008 35% of the pupils attending Lent Rise primary school in Buckinghamshire were identified as having SEN –
around double the national average. However, 95% of 11 year olds achieved national expectations in English, and
100% in science and maths. This reflects the school’s determination to prove that having SEN doesn’t mean a child
can’t achieve.
Schools like Colveston Primary School in Hackney get to grips with disaffection early on, and teach basic but
crucial behavioural skills to help their Black boys stay focused on their own development.
Barlow Hall Primary School (Manchester) has 83% BME, 31% EAL, and 44% FSM pupils. Since starting Every Child
a Reader in 2006, Barlow Hall has embarked on “a fascinating and critically important journey which has helped to
transform our school”. The Reading Recovery teacher worked closely with the Year 1 link teacher and the newlyestablished literacy leadership team to implement a structured approach to the teaching and learning of reading
across the school. Almost all the children involved in Reading Recovery come from families with a history of
learning difficulties. The children’s achievement – level 2B+ at the end of year 2 – is beginning to break the
intergenerational cycle of disadvantage.
It is essential to ensure that the most challenging schools get their fair share of the most effective teachers.
Teach First puts high quality, well-motivated graduates into challenging secondary schools to teach priority
subjects. Teach Firsters raise standards for pupils and across the whole staff, and often stay on beyond their basic
two year placements. The Teach First Programme is now being expanded so that by 2013/14 there will be over 800
new trainees entering challenging schools.
The Teaching Leaders programme is designed for secondary middle-leaders in challenging urban schools in
London. Each teacher on the programme has an individually tailored school project aimed at: achievingmeasurably higher pupil achievement in urban schools; closing the achievement gap; and showing sustainable
improvements to behaviour and attendance. Following an initial cohort of 32, a second cohort of between 60-80
is to be recruited. The impact will then be evaluated and if successful, it may be expanded to other areas of the
country.
8 Source: Teachers TV – www.teachers.tv/video/3053

8/11/2019 'Breaking the Link Between Disadvantage and Low Attainment - Everyone's Business' (2009)
http://slidepdf.com/reader/full/breaking-the-link-between-disadvantage-and-low-attainment-everyones 37/44

8/11/2019 'Breaking the Link Between Disadvantage and Low Attainment - Everyone's Business' (2009)
http://slidepdf.com/reader/full/breaking-the-link-between-disadvantage-and-low-attainment-everyones 38/44
Breaking the link between disadvantage and low attainment – Everyone’s Business36
School and LA accountability
Local authorities can take the lead in initiatives which narrow achievement gaps.
Somerset Local Authority narrowed the early years achievement gap by 3% in 2008 (to 33% down from 36% in
2007). This is partly due to good joint planning to support young children with additional needs on transition to
school. A planning meeting is held at least two terms before any child identified at Early Years Action Plus begins
school. 78 such meetings were held last year, co-ordinated through multi agency inclusion support teams, with a
designated leading professional taking responsibility for the school entry planning process.
National Leaders of Education: A world class education system requires confident leaders of their own schools,
who also work effectively with other leaders to provide well-integrated services. Challenging schools – both
primary and secondary – need special help, and the programme has therefore been expanded to meet this
requirement. Some 250 NLEs are now in place. More than 50,000 children have already benefited from theprogramme. Standards at supported schools are showing measurable improvements.
Hallfield Infant School (Westminster) has developed particular focus for children learning EAL, who make up 80%
of the cohort, and for boys. Analysis of the 2008 Profile results helped practitioners identify the need for further
development on planning and provision around problem solving and early mathematical mark making across
Problem Solving, Reasoning and Numeracy. A weekly “problem” is introduced and the children are encouraged to
investigate and solve it during the week. Opportunities are also made available so that children can extend and
adapt the initial problem.
Everton Children and Family Centre (Liverpool) have re-evaluated ways of working to develop a system of
personalised learning based on the children’s interests. This has led to a deeper understanding of each children’s
needs and his/her next learning steps. The results are a positive impact on the speed of children’s progress,
particularly of those children who need to make faster progress to catch up. Additionally, the Centre has a strong
parental support programme in place including ‘Fun Fridays’ for parents to become actively involved in their
children’s learning, Dads’ Clubs on weekdays and Saturdays, and courses to support adult learning.
Holmewood Nursery and Children’s Centre (Lambeth) have developed strong parent and community links,
particularly to provide opportunities to improve the home learning environment through ongoing education for
parents. Parents speak highly of the programmes offered by the school which have given them confidence and
support in developing their children’s learning. To improve outcomes in the locality further the school promotes
good practice with other settings through the local buddying arrangements

8/11/2019 'Breaking the Link Between Disadvantage and Low Attainment - Everyone's Business' (2009)
http://slidepdf.com/reader/full/breaking-the-link-between-disadvantage-and-low-attainment-everyones 39/44
Breaking the link between disadvantage and low attainment – Everyone’s Business 37
These case studies show how much good practice is already to be found, in so many parts of the
country, and at so many levels in the system. This good practice is the main reason why the
attainment gaps for disadvantaged pupils are beginning to narrow. But it is clear that we need
to accelerate progress.
The Department has reviewed all areas of existing policy to see how they could be delivered
differently or more effectively so as to provide an even stronger focus on breaking the link
between disadvantage and attainment. The definition we have used is a broad and inclusive one.
It encompasses all groups where the data shows a real risk of under- performance – not just FSM
children, but all other groups for whom we have set specific national targets, namely:
the seven under-performing minority ethnic groups, including Gypsy, Roma and Travellerz
children, for whom local authorities have this year set statutory attainment targets
pupils with identified special educational needsz
children looked after by a local authority.z
In addition we monitor and target improvements for four groups who are particularly vulnerable:
children with English as an additional language; new arrivals; highly mobile children; and those
caught up in the criminal justice system, or with a parent in custody. The degree of overlap
between all these groups is high and the effect of being in two or three of them can be much
greater than singly. The Department will continue to monitor and provide good data at national
and wherever possible at local level to enable progress for these groups to be tracked.
Personalisation means addressing the individual learning needs of every child: not just those who
may fall below the average, but also those who may fail to reach the much higher thresholds of
which they are capable. Of the roughly ten per cent of pupils identified by schools as gifted and
talented, there is a significant under-representation of those from disadvantaged backgrounds.
This suggests that great potential is currently going unrecognised, and perhaps undeveloped.
Our policy direction set out in this document targets gaps at the bottom, and also the gaps at the
top. Our gifted and talented guidance strongly encourages schools to ensure that they identify a
genuinely representative sample of their intake.

8/11/2019 'Breaking the Link Between Disadvantage and Low Attainment - Everyone's Business' (2009)
http://slidepdf.com/reader/full/breaking-the-link-between-disadvantage-and-low-attainment-everyones 40/44
Breaking the link between disadvantage and low attainment – Everyone’s Business38
The education system has available some very useful levers to narrow gaps and break the link.
These include:
new national and local targets, less burdensome and more focused on underperformance,z
based on accurate pupil level data and good analysis of trends
existing school self-evaluation arrangements, backed up by a revised Ofsted framework forz
inspection and monitoring
planned changes in the school accountability regime, notably the introduction of schoolz
report cards (on which we have just completed a first round of consultations)
a vision for the well integrated school of the 21st century, which we intend to publish in ourz
White Paper in May.
But as always, real and lasting change will come not through levers operated from above, but
rather from commitment and action at school and local level. We will need to translate national
strategies into local action that engages and gets behind the efforts of school leaders, classroom
teachers and the wider school and children’s workforce. Breaking the link means a radical change
in the way schools link up with other services.
This is a challenge particularly to headteachers and their senior staff: to secure the best possible
progress for their disadvantaged pupils. But schools can’t do this on their own. The solutions do
not lie uniquely with schools, but stretch out across all other services. So the challenge applies to
local authorities, and to the leaders of every service which supports young people, from early
years to age 19 and beyond. And, of course, our commitment to abolish child poverty by 2020 is
a key part of our long term strategy.
Inspired by the example of the best schools which are leading the system and breaking the link,
we are determined to back schools and teachers across our country so that every child – and not just some – can succeed.

8/11/2019 'Breaking the Link Between Disadvantage and Low Attainment - Everyone's Business' (2009)
http://slidepdf.com/reader/full/breaking-the-link-between-disadvantage-and-low-attainment-everyones 41/44
39
There are different proxies for disadvantage and the Government uses several of them, singly or incombination, for different purposes. In section 2 of Deprivation and Education – the evidence on pupils inEngland (published simultaneously with this document) we explain the relationship between the two mainones used in analysis of school results, namely eligibility for free school meals (FSM) which is a binarymeasure based on family income, and area-based measures notably the Income Deprivation AffectingChildren Index (IDACI).
These and other proxies are acknowledged to be imperfect, but are still very useful in analysis of theimpact of deprivation on attainment. The Department recently analysed the relationship between the fourmain ones: (FSM, IDACI, IMD and ACORN) and found that when converted to comparable format as binaryvariables, these measures have a similar relationship when applied to (for example) GCSE results andcontextual value added measures.
FSM has particular value because it is a longstanding measure (its definition has barely changed over twodecades); it is available at school as well as system level; it links objective and checked information aboutfamily income to the child’s full school record including attainment; and being binary, it focuses on arelatively small group, roughly the bottom 15% by family income. The weaknesses of FSM include thefollowing: not all children eligible for FSM are registered accordingly, either for administrative reasons orreluctance of parents to claim; a few children are ineligible who are in fact equally poor; and there is
variability in local practice concerning encouraging parental applications and in registering and recordingeligibility.
Acknowledging all these weaknesses, the Department’s view is that assessments based on FSM have afairly high level of credibility, so long as it is remembered that FSM is a proxy for deprivation and not adefinition of it. This means that, especially at school level, professionals within the education service shouldlook also at the deprivation-related needs of a broader group of vulnerable children. This group shouldinclude most or all FSM children, but also others known or believed to be in comparable circumstances.
A further point is that FSM is a measure which brings value and benefit for the children themselves whenthey are correctly registered for it. First, of course, it confers eligibility for its primary purpose, namely adaily free school meal; there is clear evidence linking good nutrition with pupils’ health, behaviour,concentration, well-being and wider outcomes at school. For this reason, take-up of school meals is aNational Indicator. Beyond this, however, there is an indirect link between FSM eligibility and thedeprivation factors which underpinned historic calculations of the deprivation element of DedicatedSchool Grant (DSG), worth some £3 billion in the current year, or over 10% of the DSG total of £29 billion.
This historic deprivation element was based in part on numbers of adults eligible for income support andcertain other benefits, and these are also the determinants of current eligibility for FSM,
If the whole of the notional deprivation element of DSG (£3 billion) were divided by the current number ofFSM children (some 15% of the total school population) the unit value would be £2,615. Thus the notionalfunding per deprived pupil, using FSM as the proxy for this, is £6,010 or 75% higher than the £3,395notional unit value for each non-deprived pupil.
Many local authorities’ local formulae for distributing funding to schools use eligibility for FSM as anexplicit factor. This reinforces the importance of ensuring that eligible parents are given every opportunityto apply for FSM, since under-registration could mean that the school their child attends may not receiveits full funding entitlement.
As discussed elsewhere in this document, the national school funding formula is currently being reviewedand any changes made would feed into school funding arrangements from 2011.
6. Annex: Note on proxy indicators ofdeprivation

8/11/2019 'Breaking the Link Between Disadvantage and Low Attainment - Everyone's Business' (2009)
http://slidepdf.com/reader/full/breaking-the-link-between-disadvantage-and-low-attainment-everyones 42/44

8/11/2019 'Breaking the Link Between Disadvantage and Low Attainment - Everyone's Business' (2009)
http://slidepdf.com/reader/full/breaking-the-link-between-disadvantage-and-low-attainment-everyones 43/44

8/11/2019 'Breaking the Link Between Disadvantage and Low Attainment - Everyone's Business' (2009)
http://slidepdf.com/reader/full/breaking-the-link-between-disadvantage-and-low-attainment-everyones 44/44