brazil monthly chart pack | february 2017
TRANSCRIPT

February 2017
Gabriela Morales
Brazil Monthly Chart Pack:
The credit market
OFFICIAL
1

2
1. Credit once helped pushing us down here
OFFICIAL

OFFICIAL
Despite the history of high inflation, a cheap credit spree marked Brazil’s recent past
Source: Central Bank of Brazil (BCB).
25
27
29
31
33
35
37
39
41
43
45
% Average interest rate for Households
OFFICIAL
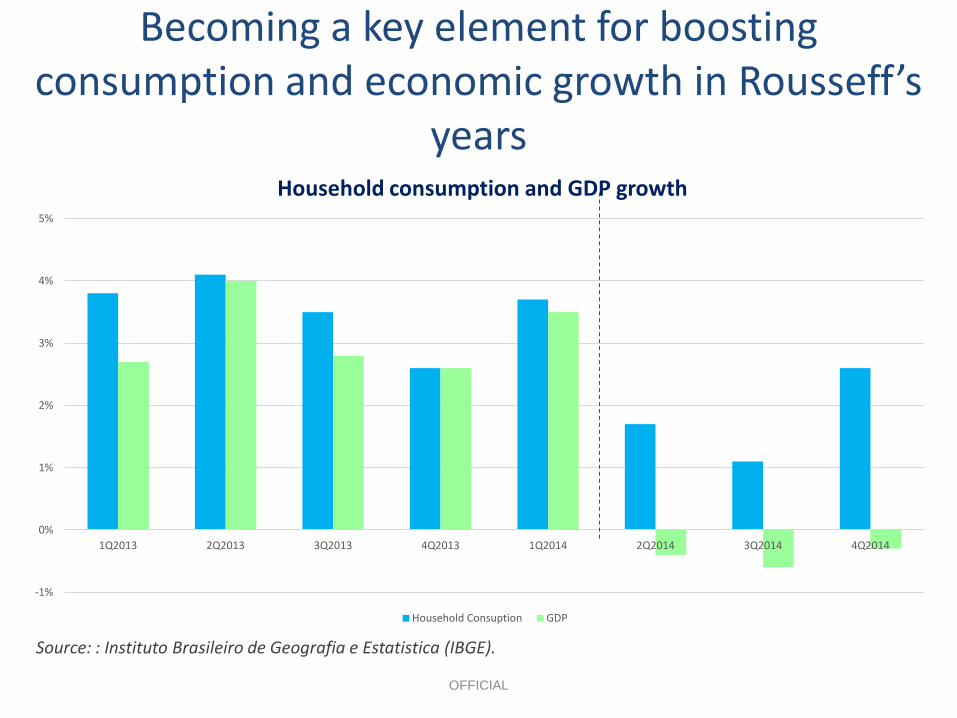
Becoming a key element for boosting consumption and economic growth in Rousseff’s
years
Source: : Instituto Brasileiro de Geografia e Estatistica (IBGE).
-1%
0%
1%
2%
3%
4%
5%
1Q2013 2Q2013 3Q2013 4Q2013 1Q2014 2Q2014 3Q2014 4Q2014
Household consumption and GDP growth
Household Consuption GDP

OFFICIAL
However, soon the bill had to come. Brazilians felt it hard, as interest rates climbed at the same
pace as they before were pushed down
Source: Instituto Brasileiro de Geografia e Estatistica (IBGE); Central Bank of Brazil (BCB).
0
2
4
6
8
10
12
0
2
4
6
8
10
12
14
16
Jan
-13
Feb
-13
Mar
-13
Ap
r-1
3
May
-13
Jun
-13
Jul-
13
Au
g-1
3
Sep
-13
Oct
-13
No
v-1
3
Dec
-13
Jan
-14
Feb
-14
Mar
-14
Ap
r-1
4
May
-14
Jun
-14
Jul-
14
Au
g-1
4
Sep
-14
Oct
-14
No
v-1
4
Dec
-14
Jan
-15
Feb
-15
Mar
-15
Ap
r-1
5
May
-15
Jun
-15
Jul-
15
Au
g-1
5
Sep
-15
Oct
-15
No
v-1
5
Dec
-15
% % Inflation and Interest rate
IPCA SELIC

OFFICIAL
Which restricted the credit market…
Source: Central Bank of Brazil (BCB).
20.57
18.76
16.44
14.48
11.29
6.69
-3.51 -5
0
5
10
15
20
25
2010 2011 2012 2013 2014 2015 2016
Credit Growth (%)

OFFICIAL
…Affecting economic activity and supporting the country’s path into a vicious cycle
Source: Instituto Brasileiro de Geografia e Estatistica (IBGE); Central Bank of Brazil (BCB).
-10%
-5%
0%
5%
10%
15%
2010 2011 2012 2013 2014 2015 2016
Industrial activity growth
-8%
-4%
0%
4%
8%
12%
2010 2011 2012 2013 2014 2015 2016
Retail sales growth

OFFICIAL
As unemployment skyrocketed, households struggled to cover debts contracted during the
“good old days”
Source: Central Bank of Brazil (BCB).
40
41
42
43
44
45
46
47
0
2
4
6
8
10
12
14
Jan
-14
Feb
-14
Mar
-14
Ap
r-1
4
May
-14
Jun
-14
Jul-
14
Au
g-1
4
Sep
-14
Oct
-14
No
v-1
4
Dec
-14
Jan
-15
Feb
-15
Mar
-15
Ap
r-1
5
May
-15
Jun
-15
Jul-
15
Au
g-1
5
Sep
-15
Oct
-15
No
v-1
5
Dec
-15
Jan
-16
Feb
-16
Mar
-16
Ap
r-1
6
May
-16
Jun
-16
Jul-
16
Au
g-1
6
Sep
-16
Oct
-16
No
v-1
6
Dec
-16
Ho
useh
old
deb
t (%) U
ne
mp
loym
ent
(%)
Unemployment and Household Debt
OFFICIAL
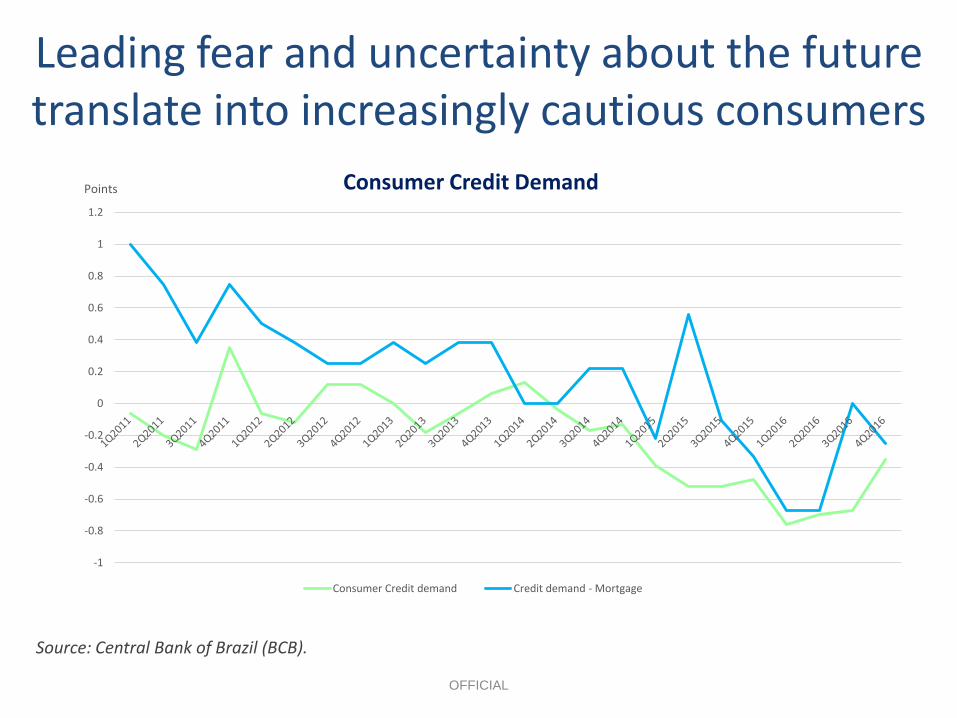
Leading fear and uncertainty about the future translate into increasingly cautious consumers
Source: Central Bank of Brazil (BCB).
-1
-0.8
-0.6
-0.4
-0.2
0
0.2
0.4
0.6
0.8
1
1.2
Points Consumer Credit Demand
Consumer Credit demand Credit demand - Mortgage

OFFICIAL
Meanwhile, corporate credit followed the same path
Source: Central Bank of Brazil (BCB).
12
14
16
18
20
22
24 %
Average interest rate for Non-financial corporations
OFFICIAL
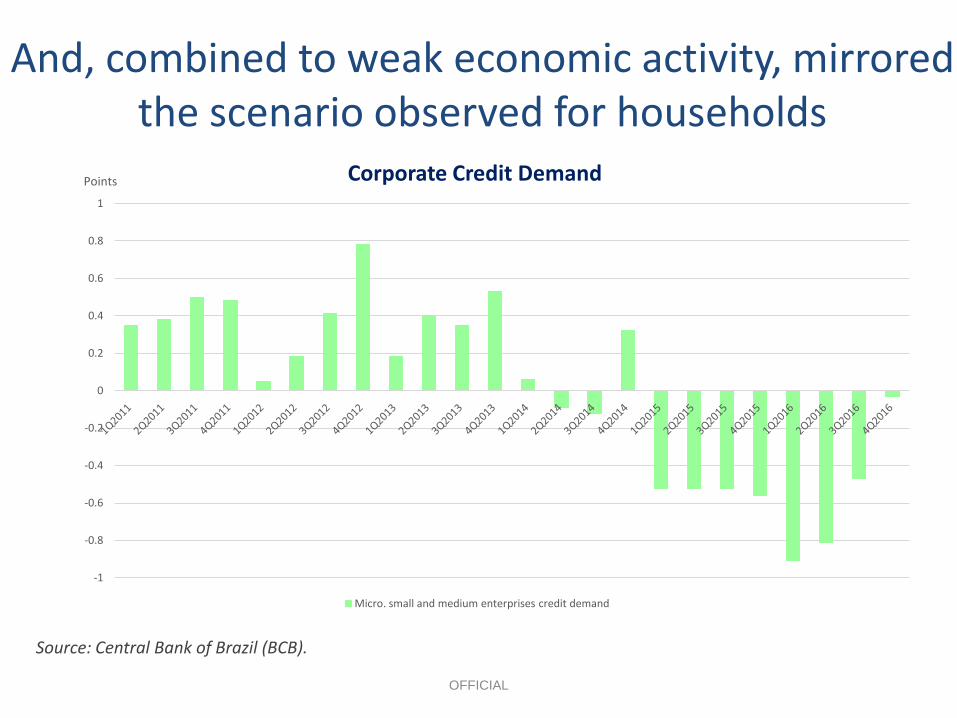
And, combined to weak economic activity, mirrored the scenario observed for households
Source: Central Bank of Brazil (BCB).
-1
-0.8
-0.6
-0.4
-0.2
0
0.2
0.4
0.6
0.8
1
Points Corporate Credit Demand
Micro. small and medium enterprises credit demand

12
2. Now, credit will be key for driving us from here
OFFICIAL

OFFICIAL
As inflation cedes, monetary easing is finally a reality for a new confidence boosted Central Bank
Source: Instituto Brasileiro de Geografia e Estatistica (IBGE); Central Bank of Brazil (BCB).
0
2
4
6
8
10
12
11
11.5
12
12.5
13
13.5
14
14.5
Jan-16 Feb-16 Mar-16 Apr-16 May-16 Jun-16 Jul-16 Aug-16 Sep-16 Oct-16 Nov-16 Dec-16 Jan-17 Feb-17
% %
Inflation and Interest rate
IPCA SELIC
OFFICIAL
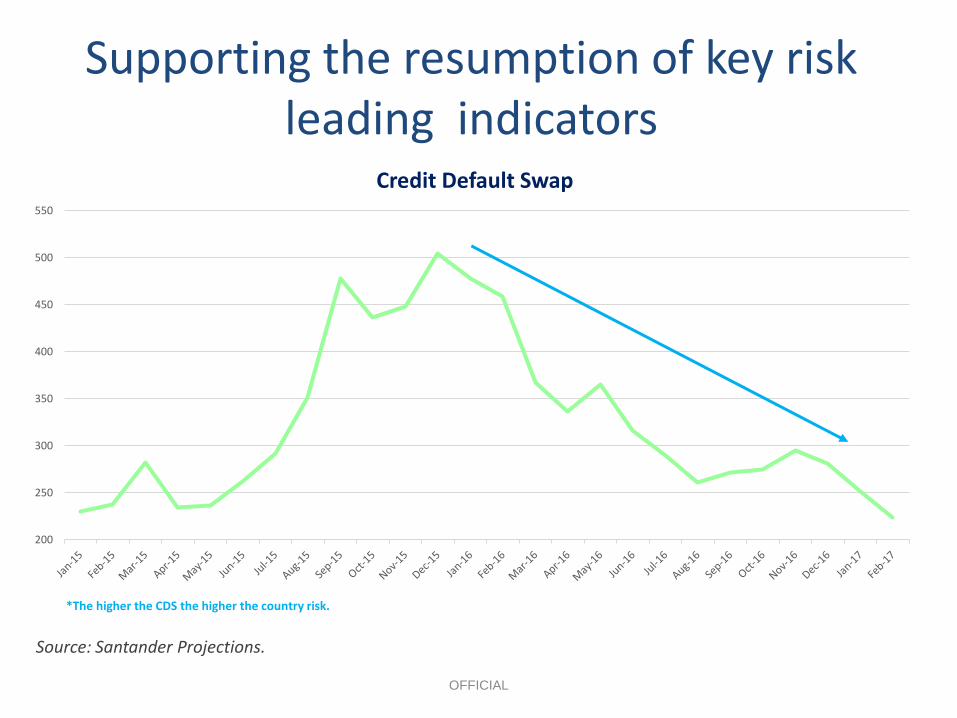
Supporting the resumption of key risk leading indicators
Source: Santander Projections.
200
250
300
350
400
450
500
550
Credit Default Swap
*The higher the CDS the higher the country risk.

OFFICIAL
Alongside its confidence peers
Source: Confederacao Nacional da Industria (CNI).
63.40
44.50
59.80
40
45
50
55
60
65
70
0-100 points Industry Confidence Index
Confidence
Lack of Confidence

OFFICIAL
Meanwhile, banks are well capitalized and the financial market remains solid
Source: IMF.
3.8%
1.7%
37.0%
7.6%
9.2%
3.2%
0.0% 5.0% 10.0% 15.0% 20.0% 25.0% 30.0% 35.0% 40.0%
Brazil
China
Greece
India
Russian Federation
South Africa
IMF Financial Soundness Indicator (Bank non-performing loans to total gross loans 2016)

OFFICIAL
And ready for a fresh start
Source: Central Bank of Brazil (BCB); Santander Projections.
Projections
7.9%
-3.9%
9.8%
24.0%
-2.3%
8.5%
-10%
-5%
0%
5%
10%
15%
20%
25%
30%
35%
2013 2014 2015 2016 2017 2018 2019
Directed and non-directed credit
Non-directed credit Directed credit

OFFICIAL
Driving what may hopefully look something like that: credit supply + confidence + uncertainty =
investments
Source: Instituto Brasileiro de Geografia e Estatistica (IBGE); Santander Projections.
Projections
11.29
6.69
-3.55
3.2
8.9 9.6
10.5
-5
0
5
10
15
2014 2015 2016 2017 2018 2019 2020
Credit growth (%)
Projections
Source: Central Bank of Brazil (BCB); Santander Projections.
-4.2%
-13.9%
-10.2%
3.5%
6.0% 5.0%
4.0%
-15%
-10%
-5%
0%
5%
10%
2014 2015 2016 2017 2018 2019 2020
Investment (FBKF)
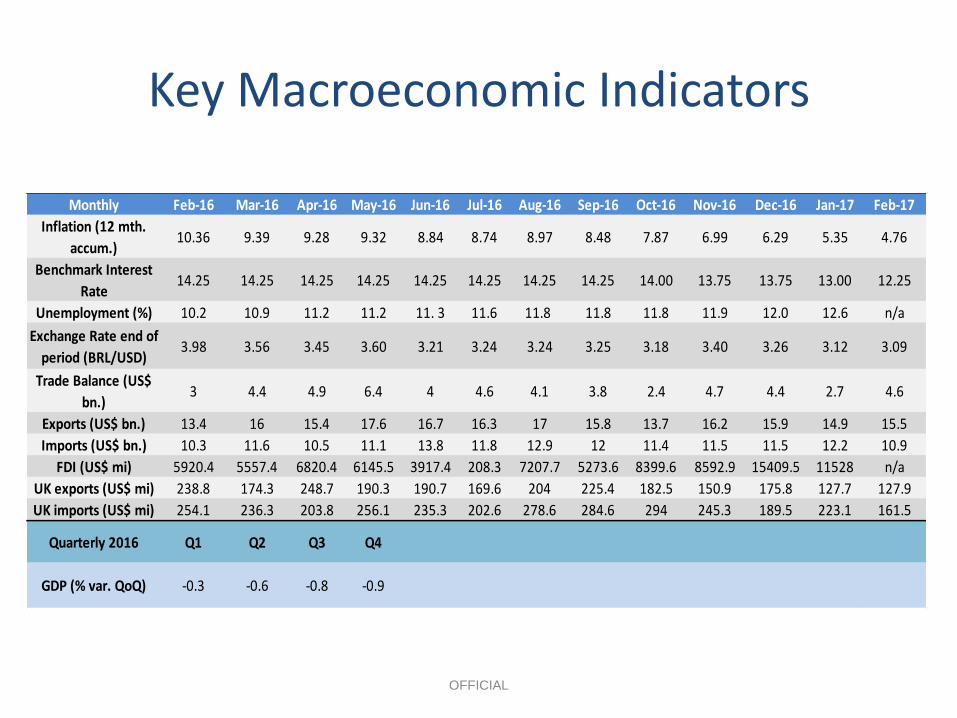
Key Macroeconomic Indicators
OFFICIAL
Monthly Feb-16 Mar-16 Apr-16 May-16 Jun-16 Jul-16 Aug-16 Sep-16 Oct-16 Nov-16 Dec-16 Jan-17 Feb-17
Inflation (12 mth.
accum.)10.36 9.39 9.28 9.32 8.84 8.74 8.97 8.48 7.87 6.99 6.29 5.35 4.76
Benchmark Interest
Rate14.25 14.25 14.25 14.25 14.25 14.25 14.25 14.25 14.00 13.75 13.75 13.00 12.25
Unemployment (%) 10.2 10.9 11.2 11.2 11. 3 11.6 11.8 11.8 11.8 11.9 12.0 12.6 n/a
Exchange Rate end of
period (BRL/USD)3.98 3.56 3.45 3.60 3.21 3.24 3.24 3.25 3.18 3.40 3.26 3.12 3.09
Trade Balance (US$
bn.)3 4.4 4.9 6.4 4 4.6 4.1 3.8 2.4 4.7 4.4 2.7 4.6
Exports (US$ bn.) 13.4 16 15.4 17.6 16.7 16.3 17 15.8 13.7 16.2 15.9 14.9 15.5
Imports (US$ bn.) 10.3 11.6 10.5 11.1 13.8 11.8 12.9 12 11.4 11.5 11.5 12.2 10.9
FDI (US$ mi) 5920.4 5557.4 6820.4 6145.5 3917.4 208.3 7207.7 5273.6 8399.6 8592.9 15409.5 11528 n/a
UK exports (US$ mi) 238.8 174.3 248.7 190.3 190.7 169.6 204 225.4 182.5 150.9 175.8 127.7 127.9
UK imports (US$ mi) 254.1 236.3 203.8 256.1 235.3 202.6 278.6 284.6 294 245.3 189.5 223.1 161.5
Quarterly 2016 Q1 Q2 Q3 Q4
GDP (% var. QoQ) -0.3 -0.6 -0.8 -0.9