borough of poole school funding 2018-19...
TRANSCRIPT

Poole School Funding Consultation 2018-19 Children’s O&S Appendix A
1
Borough of Poole
SCHOOL FUNDING
2018-19
CONSULTATION
Issue date: 9 November 2017
Closing date: 23 November 2017

Poole School Funding Consultation 2018-19 Children’s O&S Appendix A
2

Poole School Funding Consultation 2018-19 Children’s O&S Appendix A
3
CONTENTS
1 Introduction 5
2 School Funding for Poole 2018/19 and 2019/20 10
3 Schools Block Funding for Mainstream Schools
3.1 Summary Funding and NFF formula for Schools 10
3.2 Local Formula Transition to the National Formula 13
3.3 Minimum Funding Guarantee 15
3.4 Funding Floor 16
3.5 Review of Existing Factors and Data Options 19
3.6 Transfer of Funding to High Needs 25
3.7 Proposals for Unit Values 25
3.8 Limiting Gains & Affordability 27
3.9 Financial Impact of options 29
3.10 Growth Fund 30
4 High Needs Block
4.1 Overview 32
4.2 Budget 2017-18 and Draft Budget 2018-19 32
4.3 Summary of High Needs Budget Issues 34
4.4 Exploring Solutions 35
4.5 Balancing the Budget & and Consideration of Options 36
5 Central Schools Services Block – Services for all schools
5.1 Funding and Draft Budget 37
5.2 School Admissions and Servicing Schools Forum 38
5.3 DfE Licenses 38
5.4 Ex ESG Services 38
6 Next Steps 40

Poole School Funding Consultation 2018-19 Children’s O&S Appendix A
4
Appendix 1: National Fair Funding & Poole Formulae Factors 41
Appendix 2: National & Local Mainstream Formula Unit Values 44
Appendix 3: National Formula for Poole (School view) 45
Appendix 4 Primary Prior Attainment Scaling 46
Appendix 5 Indicative Financial Impact of Options for Schools 47
Appendix 6 High Needs Report to Schools Forum October 2017 49
Appendix 7: Summary of Consultation Questions 68
Appendix 8 Glossary of Terms 71

Poole School Funding Consultation 2018-19 Children’s O&S Appendix A
5
1 Introduction
This document has been distributed to all Headteachers and Chairs of Governors in mainstream and special schools in Poole. It contains the detail of the DfE national school funding system through the Dedicated School Grant (DSG) for the two years 2018-19 and 2019-20 and options for local implementation.
The DSG is allocated to the Local Authority (LA) through four separate funding blocks to support expenditure on early years, mainstream schools, pupils with high needs and central school services. The financial year 2018-19 is particularly important because it represents a major step towards a national funding formula for mainstream schools, with implications for the funding supporting pupils with high needs.
A national formula to replace LA historic funding levels for early years was introduced for 2017-18 with funding levels announced for the three years up to 2019-20. The local arrangements were determined last year for the same period with factors and unit values in the Early Years Single Funding Formula (EYSFF) set to reflect the new funding level and national policy changes.
This document, therefore, considers only the national changes and local proposals for the remaining three DSG funding block.
Views are being sought from schools to help the LA and Schools Forum make decisions for the financial year 2018-19.
The main decisions relate to funding levels for all mainstream schools as follows:
How the funding should be distributed between mainstream schools through the local formula.
How much funding should be set aside in the Growth Fund and what distribution methodology should be adopted to meet the extra costs of in-year basic need pupil growth in mainstream schools.
Whether any funding should be transferred from mainstream school funding to support the growth in pupils assessed with special education needs (SEN) or excluded from mainstream schools.
A further decision applicable for all schools is how to allocate the DSG Central Services funding to support LA services for schools.
It remains the Government’s aspiration to fund all mainstream schools in the same way and the factors and methods within the National Fair Funding (NFF) Formula introduced for 2018-19 and 2019-20 are expected to prevail now for some years. Unit values will change over time and there is likely to be some evolution and refinement to reflect changing government policy.
In 2018-19 and 2019-20 a local formula is to remain in place to allocate funding to mainstream schools. In 2018-19 it is to be effective for maintained schools from April 2018 and for academies from September 2018. It is expected that the factors and data choices in 2018-19 will continue in the same way for 2019-20, with only unit values changing to reflect that the first year is a transition to a new formula and that data changes can impact on overall formula affordability.
There will be a short separate consultation issued in December for maintained schools only to consider how much funding can be retained from maintained school

Poole School Funding Consultation 2018-19 Children’s O&S Appendix A
6
budget shares to support central LA costs for statutory duties or de-delegated services on behalf of maintained schools only. This decision will not be needed until the January Schools Forum meeting as it does not impact on amounts in other DSG expenditure areas.
DfE Stage 2 Consultation Outcome
The government consulted over spring 2017 on the method to distribute funding through the three DSG funding blocks with a consideration of how LAs should be required to implement the new system locally. The proposals indicated that Poole would receive an increase in funding for mainstream schools through the Schools Block, no increase for pupils with high needs (but with protection for historic spend) and with funding for central school services broadly equivalent to current (2017-18) budgets. It was proposed that the Schools Block funding was to be ring-fenced with only a small transfer to other expenditure blocks possible with the agreement of Schools Forum.
In August it was confirmed that the approach detailed in the consultation had broadly been adopted but with an increase in national funding made available for mainstream pupils and those with high needs through the Schools and High Needs Blocks, respectively. The full outcome of the consultation was published by the ESFA in September alongside the final national formulae to be used and indicative funding allocations to the LA for each of the three funding blocks.
Funding allocations for 2018-19 will be finalised to take account of the October 2017 census pupil numbers and high needs data returns as part of the DSG Settlement expected in late December.
Mainstream School Formula Options
The National Formula for mainstream schools is described in Section 2. The government has not provided LAs with sufficient funding to implement the National Formula in full for 2018-19. Individual school gains are capped at 3% and funding to provide a minimum floor has been scaled back to reflect national affordability. It is important to recognise that the National Formula operates at the LA level. The local funding formula is determined according to separate Regulations. This means that some aspects of the budget calculations, for example the Minimum Funding Guarantee (MFG), will necessarily remain different compared with the National Formula for individual schools over 2018-19 and 2019-20.
Mainstream school funding growth covering the next 2 years will be disappointing for a number of schools but it reflects the growing national and local demand for pupils to be educated in higher cost specialist provision.
Included in Section 3 are two main options for updating the local mainstream formula.
Option 1 in the document is to replicate the National Formula as closely as possible with adjustments made only to continue using a LAC factor, comply with the local formula Regulations or to maintain affordability.
Option 2 is to make significant progress towards the National Formula but retain some different use of factors, data and funding levels in the local formula.
The final mainstream formula to be adopted will be decided by the LA after taking into account consultation feedback from Poole schools and Schools Forum.

Poole School Funding Consultation 2018-19 Children’s O&S Appendix A
7
There are two new decisions to make for 2018-19 and these involve how much funding to allocate above the funding formula to a small number of schools.
The first is at what level to set the MFG. This is a statutory mechanism within the formula and is used to guarantee a level of historic per pupil funding where the local funding formula provides less funding than the previous year. The maximum possible MFG protection is for no change in the level of funding per pupil (MFG set at 0%) with the greatest reduction permitted being at 1.5%. This means that the DfE headline announcement of a 0.5% minimum increase per pupil in 2018-19 and a further 0.5% in 2019-20 cannot be achieved for all schools, whichever formula option is taken forward. Proposals for the MFG are considered in Section 3.3
The second new decision is whether to set a minimum per pupil funding level for each phase of school (Primary, Middle, and Secondary) through a newly permitted floor factor in 2018-19. Unlike the MFG, the floor mechanism is not related to the historic level of the school budget but to the level of funding provided through the new local formula. The National Formula for 2018-19 applied to the pupil data for 3 Poole schools provides a level of funding below a nationally set threshold (floor). These allocations have been topped up to bring per pupil funding up to the floor level. These increases have not been subject to the 3% cap applicable for schools with formula allocations. More Primary phase schools would benefit in 2019-20 if the floor is raised to the level provided through the National Formula in the second year. Schools benefitting if a floor is set would be those attracting little funding through pupil characteristics with most funding allocated according to numbers on roll (NOR) through the Basic Entitlement factor. Options are considered in Section 3.4.
Other decisions concern a number of differences between the way the existing local formula uses factors and data compared with the new National Formula (Section 3.5)
Any transfer of mainstream school funding to support pupils with high needs will reduce funding available for the local mainstream formula. Section 3.6 considers how the formula could be adjusted to reflect lower funding being available.
Proposals for unit values taking into account overall affordability are considered in Section 3.7. The financial impact of options is shown in Section 3.9 at summary level with the detail for individual schools in Appendix 5. These figures are provided on the basis that all available funding is allocated to schools, with no reduction made for a transfer to high needs.
Final decisions on the local formula will be made at the Council meeting on 19 December 2017, after taking into account the views of schools and Schools Forum.
During December the ESFA will provide the October 2017 data to enable final mainstream budgets to be calculated and overall affordability of planned unit values to be assessed. Included in Section 3.8 are options of how the final formula could be adjusted to take into account affordability later in the process.
Growth Fund
As in previous years, Schools Forum is to agree the level of the Growth Fund and how it is to be allocated to schools with basic need growth. Proposals are included in Section 3.10 and for 2018-19 are unchanged from 2017-18. The opportunity has been taken within this consultation to also consider 2019-20 as change may be necessary as pupils start moving on to secondary schools in September 2019.

Poole School Funding Consultation 2018-19 Children’s O&S Appendix A
8
Transfer of Schools Block Funding to High Needs
Schools Forum has an important consultation role with oversight of all DSG budgets and will need to decide if a level of mainstream school funding is to be transferred to support the growth in pupils with SEN or excluded from mainstream schools.
A funding transfer is permitted of up to 0.5% of Schools Block funding. A higher level would require the approval of the DfE. The alternative to a funding transfer is that the high needs budget growth is restricted to the level of funding provided through the national high needs formula and this could have implications for mainstream schools. In December 2017, Schools Forum will be deciding only for 2018-19 as fresh decisions are needed for each year.
The LA is working with school representatives over the autumn to explore the issues in detail with a view to making a recommendation to Schools Forum in December. Section 4 provides an overview of the issues with Appendix 6 including the report to Schools Forum at the October meeting.
Central School Services Block
Central schools services include LA support to all schools for a range of services, charges from the DfE over which locally there is no control (copyright licenses) and other statutory services supporting individual pupils or the schools funding system as a whole. The allocation to individual LA central budgets is considered in Section 5 for all schools to consider, with decision-making by Schools Forum in December.
Next Steps
Elected Members on 28 November 2017 are scheduled to consider the outcome of this consultation with all schools at the Children’s Services Overview and Scrutiny (CSO&S) Committee.
Schools Forum on 13 December 2017 will make its recommendation to the LA on the mainstream schools formula element of the consultation. At the same meeting final budget decisions will be made concerning any transfer of mainstream school funding to high needs budgets, the detail of the Growth Fund and budgets for central LA services for schools.
The Chair of the CSO&S Committee in consultation with the Children’s Services Portfolio Holder will take into account the views of both the Committee and Schools Forum before making a recommendation to the Council meeting on 19 December where the final mainstream school formula for 2018-19 is to be agreed.
The unit values in the agreed formula will be tested for affordability following receipt of the October 2017 school census data from the ESFA in December, with any final adjustments made according to the agreed method.
All final mainstream school budgets and the level and detail of the Growth Fund are to be provided to the ESFA by the 19 January 2018.

Poole School Funding Consultation 2018-19 Children’s O&S Appendix A
9
Budget Timetable
Consultation Issued 9 November 2017
Consultation Evening 16 November 2017
Consultation Closes 23 November 2017
Children’s Services Overview & Scrutiny (CSO&S) 28 November 2017
LMS meeting to consider schools consultation feedback 7 December 2017
Schools Forum recommendations and decisions 13 December 2017
Chair of CSO&S / Portfolio Holder consider final formula 14+ December 2017
Council Meeting to decide local formula 19 December 2017
Schools Forum updated on final formula 10 January 2018
Mainstream school budgets sent to ESFA 19 January 2018

Poole School Funding Consultation 2018-19 Children’s O&S Appendix A
10
2 School Funding for Poole 2018-19 and 2019-20
A summary of the indicative funding provided by the DfE for 2018-19 and 2019-20 for the three DSG blocks within this consultation is detailed in the table below:
Table 1 – Indicative DSG Funding 2018-19 & 2019-20
DSG Funding Block 2017-18 £000’s
2018-19 £000’s
2018-19 £000’s
2019-20 £000’s
Mainstream Schools 71,657 73,798 +2,141 +968
High Needs 15,262 15,427 +165 +74
Central Services 552 540 -12 0
Total 87,471 89,765 +2,294 +1,042
. Mainstream school funding provides for individual school budgets and the Growth Fund. It is included in Table 1 at the level announced in September 2017 and it remains based on 2017-18 pupil numbers. The funding growth is, therefore, due only to the introduction of the National Formula. Some elements of this funding are now fixed but final funding to the LA will be updated to reflect numbers on roll at mainstream schools from the October 17 school census. High Needs and Central Services funding are shown at the announced levels with both subject to adjustment to reflect final data movements in the autumn. The allocation of the DSG in 2017-18 (baseline) for each block has been reset by the DfE to reflect budgeted expenditure at the local level (excluding any use of DSG reserves or other income). Any DfE guarantees of historic funding levels operate from these revised positions. The reset of the baselines means that the 2017-18 Council decision to transfer £628k of Mainstream Schools funding to High Needs is now locked in to the High Needs historic protection arrangements with funding restored to schools through the new National Formula.
3 Schools Block Funding for Mainstream Schools
3.1 Summary Funding & NFF Formula for Schools
3.1.1 Funding Summary 2018-19 and 2019-20
The National Formula for mainstream schools has provided an increase of 3% in 2018-19 and a further 1.3% for 2019-20.
The Schools Block comprises 3 funding elements:
1. National Formula with separate primary and secondary per pupil funding levels. The National Formula has been applied to the 2017-18 data for each school, the outcome being amalgamated and divided by pupil numbers to derive the primary and secondary unit funding levels to the LA.

Poole School Funding Consultation 2018-19 Children’s O&S Appendix A
11
2. Local formula elements outside of the national formula. This is provided at the historic (2017-18) budgeted level. This includes for Poole the business rates (funded at cost to all schools) and the exceptional premises factor (joint use agreements applicable for 2 schools). The funding provided should cover estimated costs for each year.
3. Growth Fund allocations for basic need pupil growth. This is at the 2017-18 central budget level plus the allocation through the formula to Ocean academy as a growing school. This funding is expected to be sufficient to cover pupil growth again in 2018-19.
Table 2 below summarises the announced detail of Poole DSG for the next two
years:
Table 2: Poole Mainstream Schools Block Funding 2018-19 and 2019-20
Funding Stream
NOR
2017-18 Number
Budget Baseline 2017-18 £000’s
Funding Rates
2018-19
Equivalent Funding 2018-19 £000’s
Equivalent Funding 2019-20 £000’s
Primary 10,821 £3,651 39,507
Secondary 6,652 £4,959 32,987
National Formula 70,353 72,494 73,462
Business Rates 595 Historic Budget
595 595
Joint Use Factor 101 101 101
Growth via Formula 153 Historic Budget
608 608 Growth Fund (Central) 455
Total 17,473 71,657 73,798 74,766
Total per pupil £4,101 £4,224 £4,279
Annual Increase 3% 1.3%
The 2018-19 and 2019-20 equivalent funding totals are calculated by the ESFA using 2017-18 pupil numbers and data from the October 2016 census to provide a direct comparison with current funding.
The Primary and Secondary funding rates per pupil are now final for 2018-19. Total funding will be updated to reflect numbers on roll (NOR) for each phase separately from the October 2017 census. Other funding streams in the Schools Block are now fixed for 2018-19.
The equivalent funding for 2019-20 is also based on the 2017-18 budget characteristic data and pupil numbers from the October 2016 census. The National Formula will be applied to the October 2017 census data to derive the final phase funding rates for 2019-20.
3.1.2 National Formula 2018-19 and 2019- 20
The National Formula to set the LA Primary Phase and Secondary Phase funding rates in 2018-19 and 2019-20 is detailed in Appendices 1 and 2. The funding factors and data methodology is described in Appendix 1 with the unit values applied for each factor shown in Appendix 2. The appendices also include a comparison with the current formula used to calculate the 2017-18 Poole school budgets. The unit

Poole School Funding Consultation 2018-19 Children’s O&S Appendix A
12
values will necessarily be different where data is used differently within the formula and this will be explored in detail in Section 3.5.
The level of funding through the National Formula for individual schools is used to derive the Primary and Secondary unit values for the LA allocation. School level funding is provided in Appendix 3.
National Formula allocations by factor for 2018-19 compared with the local formula for 2017-18 are shown below in Table 3.
Table 3 – Impact by factor of the National Formula for 2018-19
Formula Factors
National Formula £000’s
2018-19
Local Formula £000’s
2017-18
Growth / (Reduction)
£000’s %
Primary Basic Entitlement 29,853 30,149 (295) (1.0%)
Secondary Basic Entitlement 27,091 26,872 219 1.0%
Deprivation Primary 2,830 2,989 (159) (5.3%)
Deprivation Secondary 2,022 2,089 (67) (4.5%)
Low Prior Attainment Primary 3,435 1,624 1,810 111%
Low Prior Attainment Secondary 2,397 1,454 943 65%
EAL Primary 389 534 (145) (27%)
EAL Secondary 106 97 8 9%
Looked After Children 0 96 (96) (100%)
Lump Sum 4,070 4,364 (295) (7%)
Floor Factor Primary (1 school) 61 0 61 New
Floor Factor Secondary (2 schools) 522 0 522 New
Minimum 0.5% uplift 117 238 (121) Different Basis Cap at 3% for schools above floor (246) 0 (246)
Total National Formula 72,647 70,506 2,141 3.0%
Total Primary Phase 39,593 38,664 929 2.4%
Total Secondary Phase 33,054 31,842 1212 3.8%
Table 3 above shows a significant increase in funding to support pupils with low prior attainment (a proxy for SEN) with reductions across most other factors. The new funding floor allocations attributable to only 3 schools account for 27% of overall growth.
The reasons for the 2019-20 growth in National Formula allocations (based on data for 2017-18) are as follows:
National Formula 2018-19 (above) 72,647
Release of capped funding 246
Further 0.5% MFG (note 2018-19 funding includes top up to 0% plus 0.5%) 22
Primary floor raised 334
Middle floor raised 8
Secondary floor raised 358
National Formula 2019-20 73,615
The higher floors in 2019-20 apply to potentially 9 Primary schools (£395k), 1 Middle School (£8k) and 2 Secondary schools (£880k).
Poole School Funding Consultation 2018-19 Children’s O&S Appendix A
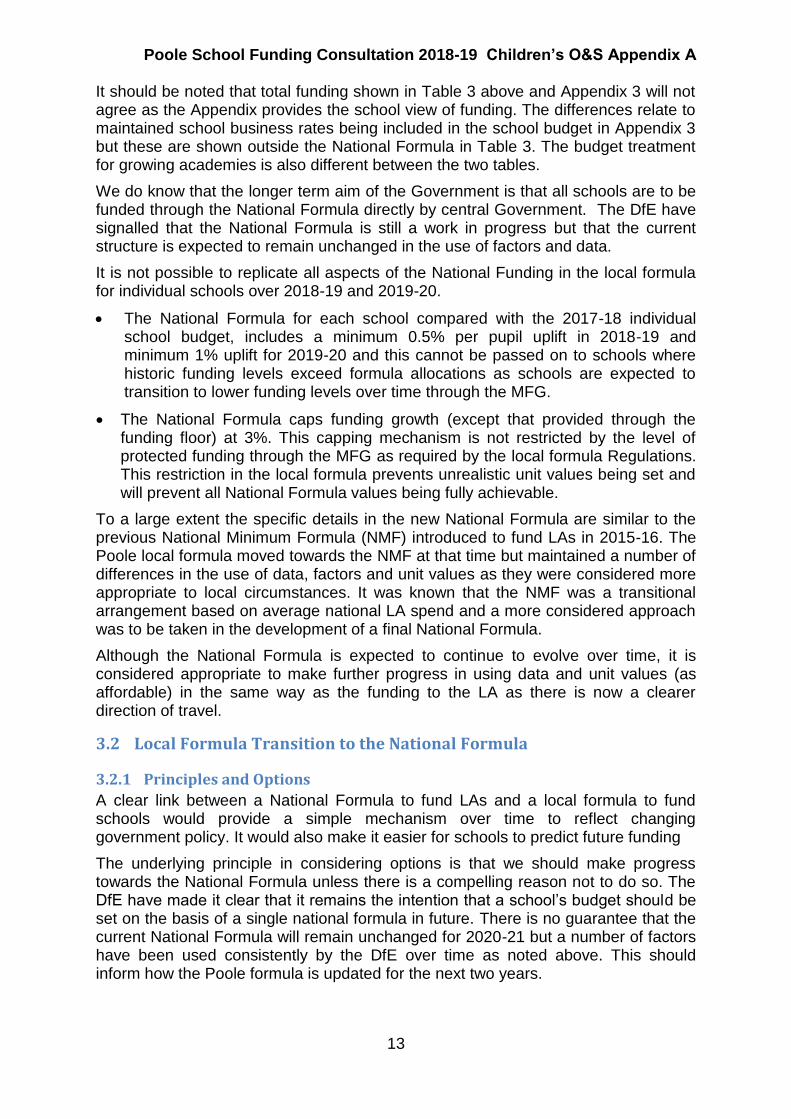
13
It should be noted that total funding shown in Table 3 above and Appendix 3 will not agree as the Appendix provides the school view of funding. The differences relate to maintained school business rates being included in the school budget in Appendix 3 but these are shown outside the National Formula in Table 3. The budget treatment for growing academies is also different between the two tables.
We do know that the longer term aim of the Government is that all schools are to be funded through the National Formula directly by central Government. The DfE have signalled that the National Formula is still a work in progress but that the current structure is expected to remain unchanged in the use of factors and data.
It is not possible to replicate all aspects of the National Funding in the local formula for individual schools over 2018-19 and 2019-20.
The National Formula for each school compared with the 2017-18 individual school budget, includes a minimum 0.5% per pupil uplift in 2018-19 and minimum 1% uplift for 2019-20 and this cannot be passed on to schools where historic funding levels exceed formula allocations as schools are expected to transition to lower funding levels over time through the MFG.
The National Formula caps funding growth (except that provided through the funding floor) at 3%. This capping mechanism is not restricted by the level of protected funding through the MFG as required by the local formula Regulations. This restriction in the local formula prevents unrealistic unit values being set and will prevent all National Formula values being fully achievable.
To a large extent the specific details in the new National Formula are similar to the previous National Minimum Formula (NMF) introduced to fund LAs in 2015-16. The Poole local formula moved towards the NMF at that time but maintained a number of differences in the use of data, factors and unit values as they were considered more appropriate to local circumstances. It was known that the NMF was a transitional arrangement based on average national LA spend and a more considered approach was to be taken in the development of a final National Formula.
Although the National Formula is expected to continue to evolve over time, it is considered appropriate to make further progress in using data and unit values (as affordable) in the same way as the funding to the LA as there is now a clearer direction of travel.
3.2 Local Formula Transition to the National Formula
3.2.1 Principles and Options
A clear link between a National Formula to fund LAs and a local formula to fund schools would provide a simple mechanism over time to reflect changing government policy. It would also make it easier for schools to predict future funding
The underlying principle in considering options is that we should make progress towards the National Formula unless there is a compelling reason not to do so. The DfE have made it clear that it remains the intention that a school’s budget should be set on the basis of a single national formula in future. There is no guarantee that the current National Formula will remain unchanged for 2020-21 but a number of factors have been used consistently by the DfE over time as noted above. This should inform how the Poole formula is updated for the next two years.
Poole School Funding Consultation 2018-19 Children’s O&S Appendix A
14
The main options for consultation are whether to adopt the National Formula with the inclusion of a LAC factor and adjustments for general affordability (option 1) or to continue to maintain some differences in factors, use of data and unit values to reflect local priorities or circumstances (option 2). LAC has been included in both options as the LA wants to maintain funding levels for this vulnerable group with the LMS working group generally in support.
Where factors are used consistently between the National and local formulae only unit values will be considered for change in option 2, with the general presumption being that most will move towards the National Formula, taking into account data variations and overall formula affordability. This does mean the unit values for some factors will reduce from the 2017-18 levels in both options.
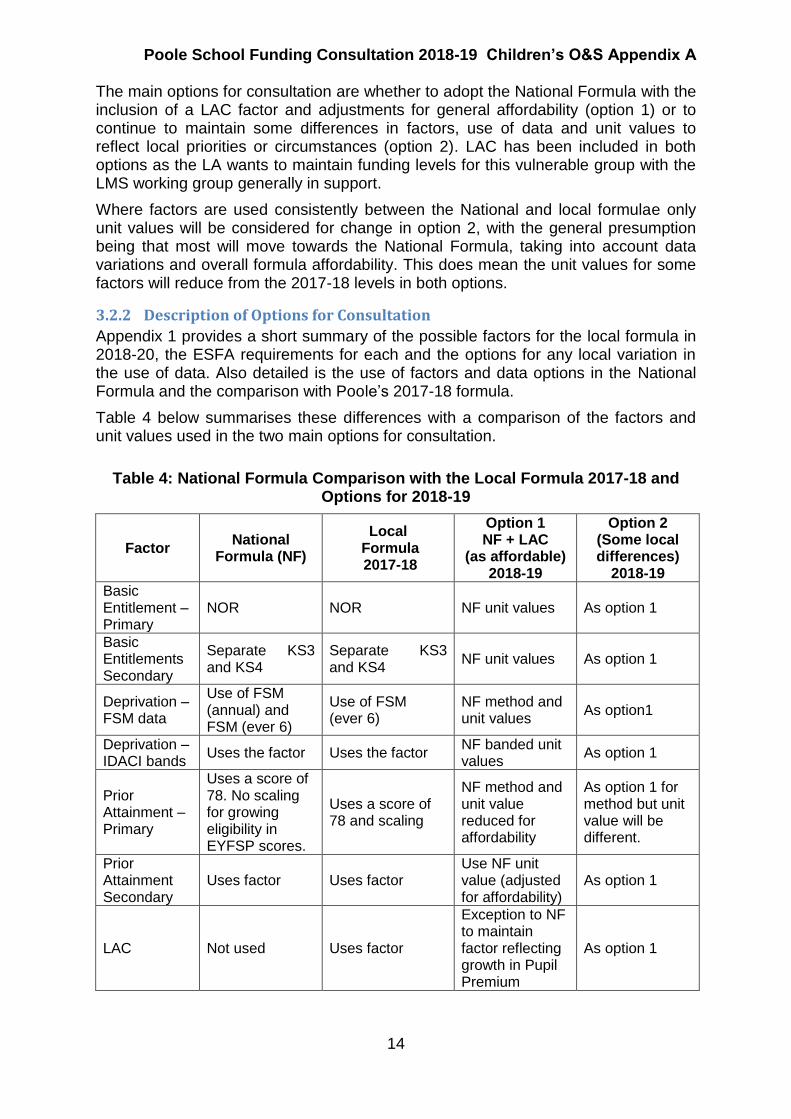
3.2.2 Description of Options for Consultation
Appendix 1 provides a short summary of the possible factors for the local formula in 2018-20, the ESFA requirements for each and the options for any local variation in the use of data. Also detailed is the use of factors and data options in the National Formula and the comparison with Poole’s 2017-18 formula.
Table 4 below summarises these differences with a comparison of the factors and unit values used in the two main options for consultation.
Table 4: National Formula Comparison with the Local Formula 2017-18 and Options for 2018-19
Factor National
Formula (NF)
Local Formula 2017-18
Option 1 NF + LAC
(as affordable) 2018-19
Option 2 (Some local differences)
2018-19
Basic Entitlement – Primary
NOR NOR NF unit values As option 1
Basic Entitlements Secondary
Separate KS3 and KS4
Separate KS3 and KS4
NF unit values As option 1
Deprivation – FSM data
Use of FSM (annual) and FSM (ever 6)
Use of FSM (ever 6)
NF method and unit values
As option1
Deprivation – IDACI bands
Uses the factor Uses the factor NF banded unit values
As option 1
Prior Attainment – Primary
Uses a score of 78. No scaling for growing eligibility in EYFSP scores.
Uses a score of 78 and scaling
NF method and unit value reduced for affordability
As option 1 for method but unit value will be different.
Prior Attainment Secondary
Uses factor Uses factor Use NF unit value (adjusted for affordability)
As option 1
LAC Not used Uses factor
Exception to NF to maintain factor reflecting growth in Pupil Premium
As option 1

Poole School Funding Consultation 2018-19 Children’s O&S Appendix A
15
Factor National
Formula (NF)
Local Formula 2017-18
Option 1 NF + LAC
(as affordable) 2018-19
Option 2 (Some local differences)
2018-19
EAL Use of EAL 3 year data
Use of EAL 2 year data
Use NF method and unit value
Maintain EAL 2 year data and higher funding
Lump sum No differentiation by phase
Difference by phase with higher unit values
Use NF level As option1
Floor factor Phase levels set Not permitted by regulations in 2017-18
Use NF levels
Set at level to restrict budget growth to cap applicable to other schools.
Cap (not to include floor factor)
Budget growth per pupil capped at 3% with no link to MFG level
No schools required capping
Aim for 3% cap (as affordable) Restriction in local formula linked to MFG
Capping for affordability. Restriction in local formula linked to MFG
MFG per pupil. In Local formula must be between 0% and minus 1.5%
Plus 0.5% in 2018-19 and 1% in 2019-20
Regulation minus 1.5%
Suggest: 2018-19
0% 2019-20
minus 1.5%
As Option 1
The use of both FSM measures to allocate deprivation funding, a funding floor and discretion in setting the MFG were not available for 2017-18 but need to be considered for use in 2018-19 and 2019-20.
There are many variations that could be considered to update the local formula but the 2 options being considered will help to illustrate the impact of particular elements – such as a variable MFG and funding floor support to help schools respond to individual questions in the consultation. The final formula, after taking account of consultation feedback, is likely to be a variation of one of the options.
All proposals have been drawn up using data from 2017-18 to set unit values. This is to enable a direct comparison to be made with the current unit values and formula allocations across schools. This means that unit values may need to be updated should there be a significant change in the pupil data for 2018-19 when released by the ESFA in December. Proposals, therefore, include how the formula should be updated in considering overall affordability later in the process.
The overall financial impact for individual schools will change from that estimated in this document when the data is updated in December, particularly where there is a change in pupil numbers, and schools should bear this in mind when estimating final funding for 2018-19.
3.3 Minimum Funding Guarantee (MFG)
It is important to note that the MFG allocations in school budgets protect a higher level of historic allocations per pupil and funding will need to move down towards the local formula over time.

Poole School Funding Consultation 2018-19 Children’s O&S Appendix A
16
The National Formula to the LA for each school compared with the individual school budgets for 2017-18 includes a minimum 0.5% per pupil uplift in 2018-19 and minimum 1% uplift for 2019-20. This is a departure from the Regulations governing the local formula where the MFG must be set between 0% and minus 1.5% per pupil. Options 1 and 2, therefore, must both depart from the National Formula
To help schools adjust to lower funding it is proposed that the MFG is set close to the maximum protection of no reduction in per pupil funding compared with 2017-18 (MFG set at 0%) for 2018-19 but that it then continues at minus 1.5% for 2019-20.
In the first year of the new formula few schools will receive MFG protection due to the increase in funding but two Poole schools have already seen reduced formula funding annually since the first funding reforms in 2013-14. Now it is possible to vary the MFG locally, respite for one year at least can be considered, enabling the budget to remain protected to improve stability.
In the second year (2019-20) other schools might be drawn within the scope of the MFG because annual data has changed. These changes should be allowed to flow through the formula to prevent locked in historic funding growing, especially as some data changes may reflect more permanent trends.
Schools with significant MFG allocations in 2017-18 will inevitably be disappointed that despite the introduction of a National Formula, no formula option could provide an increase in funding. However, this is within the context that they will remain funded at a higher level than the formula provides for other schools in Poole. Although the formula changes will have a limited benefit in cash terms over the next two years for schools remaining supported by the MFG, it will improve their financial outlook for the longer term.
Consultation Questions
1 Do you agree the MFG should be set with little reduction in per pupil funding in 2018-19 (MFG set close to 0%) to allow more time for the small number of schools with per pupil funding below the new formula to make budget adjustments?
Yes No Unsure
2 Do you agree the MFG should continue again at minus 1.5% in 2019-20 as funding cannot be protected for ever and data movements need to be reflected in funding?
Yes No Unsure
Please explain your choices
3.4 Funding Floor
3.4.1 National Formula Floor Factor
The introduction of a funding floor is a response by the DfE to the Stage 2 School Funding Consultation earlier in the year. Funding has been included through the National Formula to the LA to enable a minimum level of per pupil funding (a floor) to be set in the local formula for each school phase. The floor mechanism enables additional allocations to be made to a small number of schools where pupil characteristic funding is relatively low in the new local formula.

Poole School Funding Consultation 2018-19 Children’s O&S Appendix A
17
The level of the floor is to apply to schools equally within a phase. If a minimum per pupil level of funding is set in the local formula, where the formula would otherwise provide a lower level, funding is topped up through a floor factor to the minimum. The principle here is to ensure all schools receive a minimum per pupil funding level regardless of the characteristics of their pupils.
The funding floors within the National Formula are detailed in Table 5 below:
Table 5 – National Formula Minimum per Pupil Funding Floor
Phase 2018-19 2019-20
Floor Level
Number of Schools
Floor Level
Number of Schools *
Primary £3,300 1 £3,500 9
Middle - Primary/ Key Stage 3
£3,300/ £4,000
0 £3,500/ £4,200
1
Secondary £4,600 2 £4,800 2
* Estimated
The number of schools for 2019-20 is estimated based on 2017-18 data as a number of Primary schools and the Middle school are close to the floor level. Data changes (particularly from the EYFSP scores moving into year 5 in October 2017) are likely to reduce the number of schools requiring funding to be topped up to the higher floor levels shown in Table 5 for 2019-20.
Any additional funding provided through a floor factor is not subject to the 3% cap on gains each year in the National Formula and similarly are not to be capped in the local formula, if used. This is to ensure any funding through the floor factor is set at a level actually to be distributed to schools rather than becoming only a notional allocation because it is subsequently capped for overall formula affordability.
3.4.2 Funding Floor Options
The Regulations for the local formula are that before the comparison is made between the level of formula funding and any minimum level (floor), premises factors and the lump sum are included in the formula per pupil calculation (that is, business rates are not on top of the minimum level).
Included in option 1 is a floor set at the National Formula levels in Table 5. Top up (floor factor funding) to bridge the gap between the floor and the formula allocation reflects that estimated business rates have been included in establishing the formula per pupil funding level in compliance with the Regulations.
The variation illustrated in option 2 has set the floor to deliver a funding percentage increase broadly equivalent to the cap for other schools. As the top up level differs between schools within a phase it cannot be set to provide an equal level of growth at school level where there is more than one eligible school within a phase.
Funding released has been used to manage other formula changes, including setting a cap above the 3% provided by the National Formula.
As an illustration if no floor was set and the released extra funding was not recycled to other factors, the individual primary school concerned would receive a formula

Poole School Funding Consultation 2018-19 Children’s O&S Appendix A
18
increase in the region of 2.5% dependent on the option taken forward. Similarly, in the Secondary phase, increases for the two schools would be in the range 0.3% to 0.5%.
Using the 2017-18 data, a comparison of how much funding above the needs-led formula would be provided to potentially 3 eligible schools in 2018-19 is shown in shown in Table 6 below for each option:
Table 6 – Funding Floor Options for 2018-19
Eligible Schools
Option 1 Option 2
Floor Factor £000’s
Budget Growth%
Floor Factor £000’s
Budget Growth%
Baden Powell Junior 47 4.6% 46 4.5%
Parkstone Grammar 235 6.5% 170 4.5%
Poole Grammar 218 6.2% 154 4.7%
Total Floor Funding 500 370
Maximum growth other schools 4.1% 4.5%
This methodology in setting the level of the floor would need to be reviewed again for 2019-20 given the further significant increase in funding for the floor factor for secondary phase schools. In the primary phase, potentially more schools will be drawn within scope for funding as the floor is raised, but a number may also have funding released from the cap in 2019-20 and not need to be topped up.
Consultation Questions
3 Do you agree that extra funding should be provided on top of the needs-led formula for schools where pupil characteristic funding is low, through the introduction of a per pupil funding floor?
Yes No Unsure
Please explain your choice
4 If the local formula should include a per pupil funding floor, how should the level be set for each phase:
(a) At the level of National Formula as in option 1
(b) At a level in 2018-19 to provide a % increase similar to the maximum applicable to other schools as in option 2.
(c) Can you suggest an alternative option to consider?
Please provide the rationale for your preference
5 If the local formula is to set a floor below the National Formula level or not set a floor at all, how should the funding released be redistributed.
Please rank options and provide rationale
Options Rank
Raise the cap for schools not receiving their full formula allocations
Increase a factor unit value - please specify
Transfer funding to support pupils with high needs

Poole School Funding Consultation 2018-19 Children’s O&S Appendix A
19
Other option to be specified

Poole School Funding Consultation 2018-19 Children’s O&S Appendix A
20
3.5 Review of Other Factors and Data Options
3.5.1 General approach
Schools are being asked to comment on whether the Poole approach in the use of data should be changed to agree to the DfE National Formula method (option 1) as a principle or to remain as used in the Poole formula if there is a clear preference from schools to retain the current differences (option 2).
A number of existing factors in the local formula do not conform to the National Formula use of data and the LAC factor has been dropped from the National Formula.
The differences between the options are explored in this section. In making comparisons between options it should be noted that option 1 departs from the National formula with the inclusion of a LAC factor and option 2 incorporates some movement towards the National Formula in other factors and unit values.
Option 2 incorporates the National Formula approach to deprivation funding, the use of data in the low Primary Low Prior Attainment factor and introduction of a floor but at a lower level than the National formula.
The National Formula and local formula Regulations from 2018-19 allow both FSM measures to be used alongside IDACI post code data in the local formula to reflect deprivation across schools. The use of all 3 data sets in funding factors would have been preferred by the LA at the outset of funding reform in 2013-14 had the method been available at that time. It has, therefore, been incorporated in both formula options.
Option 2 also incorporates the National Formula approach to the use of data in the low Primary Low Prior Attainment factor. This is because in the October 2017 census data used for 2018-19 school budgets there will be only year 6 pupils assessed using the older measure, with the need to scale data for consistency in 2019-20 falling away. The increase in funding for 2018-19 can be used to smooth this transition for schools with year 6 and provide greater funding stability.
In the use of EAL data and level of funding, option 2 retains the 2017-18 formula approach continuing to reflect the historic local preference of schools and Schools Forum. These were confirmed most recently for the 2015-16 formula allocations following extensive engagement and consultation with schools but views may have changed with the National Formula being now more fully developed.
The LA is not considering making changes to factors and data options where they are used in the same way as the DfE in the National Formula. Proposals include updating only unit values of these factors. Where a factor or data is being used differently in Poole’s current formula it has been considered within the context that the National Formula has continued many of the approaches from the earlier NMF, indicating these are likely to remain the DfE preferences.
The potential move to the National Formula approach is considered for each factor individually below but it needs to be borne in mind that funding changes from using data differently in one factor may be compensated by changes elsewhere in the formula. It should also be borne in mind that it is better to make significant changes to formula elements at the same time and particularly when there is funding growth as this provides greater funding stability.

Poole School Funding Consultation 2018-19 Children’s O&S Appendix A
21
3.5.2 Individual Factor Review
The summary of the formula factors in Table 4 shows that the differences between the DfE methodology to fund LAs through the National Formula and the 2017-18 Poole formula are few. In addition to the introduction of a floor, the approaches currently differ only in the following areas:
The newly permitted use for 2018-20 of data for FSM (annual) alongside FSM (ever 6) with a corresponding large disparity in comparison with the 2017-18 local unit values for FSM (ever 6).
Poole in the Primary Prior Attainment factor adopted the option to scale the new early years data (in 2018-19 would no now be for 5 year groups) to be comparable with the previous measure due to the increase in pupils eligible for funding using the newer measure.
The National Formula does not include a LAC factor with £400 added to the Pupil Premium for eligible pupils from 2018-19.
Choice of EAL 3 in the National Formula and EAL 3 in the local formula
The next section considers if option 2 is taken forward (to maintain some differences in the local formula) how much progress should be made towards the national formula over 2018-19 and 2019-20.
Consultation Question
6 Should Poole as a principle use factors and data in the local formula in the same way as the National Formula (option 1) or continue to use some local differences if there is still a clear rationale for doing so (option 2)?
Which do you prefer in principle?
Option 1 Option 2 Not Sure
Please provide reasons for your choice.
3.5.3 Introduction of FSM (annual) alongside FSM (ever 6)
The ability to reflect both FSM annual and 6 year data separately in the local needs-led formula is considered to be an improvement, with the change included in both options at National Formula unit values. The two factors reflect different aspects of school costs linked to pupils from low income families.
The National Formula provides a unit funding level for FSM annual at a level that largely reflects the cost of the provision of a daily school meal. It equates to £2.32 per day, comparable with the funding through the separate grant for infant free school meals.
The unit funding of FSM ever 6 has been reduced accordingly in the National Formula (compared with the earlier NMF) and both local formula options.

Poole School Funding Consultation 2018-19 Children’s O&S Appendix A
22
Table 7 - Comparison of FSM based on 2017-18 data
Phase
2017-18 2018-19 NF / Options1 + 2 Change
FSM 6 £000’s
FSM £000’s
FSM 6 £000’s
Total £000’s
£000’s %
Infant 363 135 242 376 14 3.9%
Primary 813 292 543 835 22 2.6%
Junior 544 148 363 511 (33) (6.0%)
Primary Phase 1,720 574 1,149 1,723 3 0.2%
Secondary 1,339 263 1,008 1,271 (68) (5.1%)
Total Schools 3,059 837 2,157 2,994 (65) (2.1%)
The overall difference in funding is small but there is some distributional impact between schools as for all individual factor changes. Mitigation is provided by additional funding for Low Prior Attainment in both options.
Consultation Question
7 Do you agree the local formula should introduce the use of FSM (annual) alongside FSM (ever 6) as in the National Formula?
Yes No Not Sure
If no or not sure please provide reasons
3.5.4 Primary Prior Attainment Data Scaling
Scaling is a permitted technical adjustment to data to ensure a greater level of consistency across primary year groups. At national and local level, the EYFSP measure introduced in 2013 identifies significantly more pupils as not making good progress than previously. In Poole 37% were identified in July 2016 using the new measure compared with 15% from the old measure applicable now for year 6 only.
The option to allow the data under the new measure to be scaled down to be consistent with the old has existed since introduction but both the NMF and National Formula have not adopted this approach. The National Formula has reflected the growth in eligibility for lower age groups and provided a significant increase in funding for this factor. As pupils move through primary age groups over the next 2 years the National Formula should continue to reflect the continued growth in eligibility as there is no expectation that unit values will be reduced.
Although the National Formula has not scaled back the number of pupils identified as not making a good level of development, the unit value remains higher than the Poole 2017-8 unit value which has used scaling to reduce the number of identified children in younger age groups.
The EYFSP is used to identify pupils for funding across all primary age groups with only a single unit value possible.
The data in Table 8 below summarises the data for the EYFSP at the October 2016 census as the % of pupils not making a good level of development.

Poole School Funding Consultation 2018-19 Children’s O&S Appendix A
23
Table 8 – Primary EYFSP Proportion of Pupils Identified for funding (at October 2016)
School Phase / Proportion Identified
October 16 New Measure
Years 1-4
October 16 Old Measure
Year 5-6
Infant & First 31% 0%
Primary Schools 36% 17%
Junior Schools 46% 14%
Middle School 0% 6%
All Primary Phase 37% 15%
Given the different age ranges within schools in the Primary phase in Poole the option to scale data has been applied to ensure schools with older primary pupils were not disadvantaged by the change in measure. Appendix 4 provides the detail of this approach. However, in funding for 2018-19 there will be just one year group assessed by the old measure and it may no longer be appropriate to scale back the new measure from the remaining 5 years to achieve consistency.
Not scaling back will give the later EYFSP scores greater influence in funding allocations and benefit schools with younger age groups. As funding is provided by the National Formula without scaling there would be no detriment to schools with year 6 and in 2019-20 the old measure will fall away and scaling would no longer need to be an aspect of the local formula. .
The National Formula for 2018-19 is based on October 2016 data. The October 2017 data to use in the local formula allocations for 2018-19 will include a further year group with greater eligibility for funding. The unit value from the National Formula will necessarily need to be reduced if data for younger age groups is not scaled down. Continuing to use scaling would divert the National Formula away from infant schools towards junior and middle schools with year 6. However, a significant number of infant and first schools will have funding capped in 2018-19 due to the growth in funding for Low Prior Attainment and will not see the full increase until 2019-20.
Consultation Question
8 Do you agree we should adopt the National Formula approach and stop scaling back EYFSP data for years 1 to 5 to the level of the previous measure (now applicable only for year 6).
Yes No Not Sure
If no please provide reasons
3.5.5 Looked After Children (LAC) Factor
The National Formula does not include a LAC factor, with the Pupil Premium being increased from 2018-19, by the national average level of previous LA allocations to schools. This equates to less than the unit value within Poole’s 2017-18 formula for eligible pupils.
Delegated budget support for LAC is important to the LA as it allows schools to decide some elements of support to pupils without seeking agreement from LAs. The Pupil Premium is allocated by the Virtual Headteacher of the home authority

Poole School Funding Consultation 2018-19 Children’s O&S Appendix A
24
Virtual School and Poole has no control over how other LAs allocate this funding for their children in Poole schools. In both options for consideration a LAC factor has been included at the same unit value to broadly maintain existing funding levels between the delegated budget and Pupil Premium in 2018-19.
The Pupil Premium has been increased by £400 per eligible pupil for 2018-19, with the 2017-18 Poole formula currently providing £1004. It is proposed that existing funding levels across both funding streams are broadly maintained. Included in both options 1 and 2 is a LAC factor with a funding value of £600. The formula cost based on 2017-18 data would be £57,397.
Consultation Question
9 Do you agree we should continue to maintain LAC funding in the local formula to broadly maintain the 2017-18 funding level between the delegated LAC factor (£600) and increase in the Pupil Premium (£400)?
Yes No Unsure
Please explain the reasons:
3.5.6 EAL Data
EAL data in both phases identifies pupils according to the time since entry to the UK education system but excluding time in year R. The time periods of entry are within one year (EAL 1), two years (EAL 2) or 3 years (EAL 3). Separate unit values are possible for each phase.
The national formula uses data for EAL 3, with the 2017-18 Poole formula using data for EAL 2 and this is maintained in option 2.
EAL 2 data was preferred for each phase from the detailed consultation with schools at the start of funding reform and the introduction of the new formula for 2013-14. It was considered that this provides the correct balance to tackle the specific issues of this group. The data to identify EAL pupils for the first year only was not considered a sufficient time period for additional needs to have been reduced. This was felt to be the case across phases as much of the first year could be taken up on social aspects as well as potential remedial education with a longer period necessary to make an impact with extra funding. By year 3, the extra support already provided should have significantly reduced or eliminated this specific disadvantage.
The table below summarises the October 16 data to illustrate the impact of each measure on the number of pupils identified and the different funding allocated in options 1 and 2.
Table 9 - Funding Options for EAL (Data October 2016)
PHASE Data
EAL 3 Data EAL 2
Option 1 EAL 3
% of Phase
Option 2 EAL 2
% of Phase
Pupils Pupils £000’s. % £000’s %
Infant & First 245 239 126 32 230 43
Primary 405 283 209 54 271 51
Junior 105 35 54 14 33 6
Primary 755 557 389 100 534 100
Secondary 76 52 106 97

Poole School Funding Consultation 2018-19 Children’s O&S Appendix A
25
The above table demonstrates that the number of identified pupils in infant schools is maximised after 2 years (the small increase between EAL 2 and EAL 3 is due to the extra year group in first schools). The table also demonstrates that the Poole current approach regardless of data option allocates more funding through this factor than the National Formula (option 1 above). Although the difference of £136k is relatively small as a proportion of overall funding it is important to a number of schools, particularly in the town centre.
Use of the data within other LAs is mixed and the choice will determine the unit funding level with EAL 1 requiring the highest level and EAL 3 the lowest for a given total funding to allocate.
Consultation Questions
10 Should we adopt the National Formula approach and use EAL 3 rather the current EAL 2?
Yes No Not Sure
11 Whichever data set is selected should we reduce the funding allocated to EAL to the level allocated through the National Formula?
Yes No Not Sure
Please explain the reasons for your choices.
3.6 Transfer of Funding to High Needs
3.6.1 DSG Regulations
It is possible to transfer funding from Mainstream Schools to support expenditure in other funding blocks. This requires the agreement of Schools Forum from 2018-19 onwards. A transfer can be made of up to 0.5% of Mainstream School Funding. A transfer above this level requires the approval of the Secretary of State.
Separate decisions are to be made for 2018-19 and 2019-20 and Schools Forum will need to consider whether to transfer funding in 2018-19 at the December 2017 meeting. Any transfer will reduce the funding available for the mainstream school formula.
Section 4 provides the detail of the High Needs budgets and considers the reasons for rising demand and low funding growth and the need to make a funding transfer. The funding available for the mainstream school formula in the two main options considered in Section 3 have assumed that no transfer is to take place.
3.6.2 Funding Transfer Principle
It is proposed that if a transfer of funding is to take place then the principle should be that all schools make a contribution through lower formula allocations compared with the level calculated without a transfer.
Only schools funded according to the formula will see funding reduce if unit values alone are reduced. Those with funding capped, protected by the MFG or with floor funding are unaffected by reduced unit values alone so other formula mechanisms will also need to be adjusted.

Poole School Funding Consultation 2018-19 Children’s O&S Appendix A
26
3.6.3 Funding Transfer Proposed Formula Adjustments
The proposed formula variations to allow for a funding transfer, using option 2 and a 0.5% transfer is illustrated in Table 10:
Table 10 – Illustration of Proposed Formula Adjustments to Transfer 0.5% of School Funding to High Needs
School Formula Position
Proposed formula variation Number
of Schools
£000’s
Floor funding Reduce the floor by 0.5% 3 41
Capped funding Lower the cap by 0.5% 7 316
Formula funding Reduce the Low Prior Attainment factor unit values by 6%
25
MFG Protection Reduce MFG by 0.5% (to minus 0.5%)
2 14
Total Transfer at 0.5% of Mainstream Funding 37 371
The financial impact for schools is shown for a transfer of funding of 0.5% with the impact double for a transfer of 1%. Each phase would contribute broadly equally to the transfer by this method.
Consideration of the need to transfer funding is included in Section 4. The consultation questions in this section consider only a proposal of how the formula would need to be adjusted to release funding for a transfer if one is agreed by Schools Forum.
Consultation Questions
12 Do you agree with the principle that if a funding transfer takes place all schools should make a contribution through a lower budget allocation than would otherwise have been the case?
Yes No Unsure
If no, please suggest an alternative
13 If you agree that all schools should make a contribution, do you agree with the approach outlined in Table 10?
Yes No Unsure
If no, please suggest an alternative
3.7 Proposals for Unit Values
3.7.1 Summary
The local formula Regulations do not contain all the freedoms needed for the LA to adopt all aspects of the National Formula. In addition, the use of lagged data means unit values in the National Formula for the Primary Low Prior Attainment factor will be unaffordable when the final data for October 2017 is received due to growing eligibility. Local choices to allocate more or less funding to a particular factor will also

Poole School Funding Consultation 2018-19 Children’s O&S Appendix A
27
impact on other unit values, with overall affordability from other data changes in December a further consideration.
The LA is proposing to adopt National Formula unit values in most cases and use different unit values for EAL to reflect a different data method and preserve higher historic funding levels in the Primary phase.
An overview of the unit values used to model options is included at Appendix 2 and includes a comparison with the National Formula and 2017-18 local formula. This is summarised in Table 11 below where progress towards the National Formula funding is shown.
Table 11 – Comparison of proposed unit values for 2018-19
Factor National
Formula (NF)
Local Formula 2017-18
Option 1 2018-19
Option 2 2018-19
Basic Entitlement – Primary
£2,747 £2,774 NF NF
Basic Entitlements KS 3
£3,863 £3,857 NF NF
Basic Entitlements KS 4
£4,386 £4,312 NF NF
Deprivation – FSM annual
£440 £440
(equivalent) NF NF
FSM ever 6 Primary
£540 £538
(equivalent) NF NF
FSM ever 6 Secondary
£785 £840
(equivalent) NF NF
IDACI bands Primary
Range 1 - 5 £200 – £420
Range 1 - 5 £209 – £619
NF NF
IDACI bands Secondary
Range 1 – 5 £290 - £600
Range 1 – 5 £289 - 669
NF NF
Prior Attainment – Primary
£1,050 £497
(No scaling equivalent)
£1,046
£1,046
Prior Attainment Secondary
£1,550 £940 £1,545 £1,545
LAC 0 £1004 £600 £600
EAL Primary £515 EAL 3
£706 EAL 3 equivalent
NF 17/18 local
formula
EAL Secondary £1,385 EAL 3
£1,275 EAL 3 equivalent
NF 17/18 local
formula
Lump sum Primary
£110,000 £115,797 NF NF
Lump Sum Secondary
£110,000 £125,155 NF NF
Floor factors 2018/19
P £3,300 KS3 £4,000
S £4,600 N/A NF
Limited to % cap increase
Cap - greater than 3% possible due to savings on business rates
3% N/A 4.1% 4.5%

Poole School Funding Consultation 2018-19 Children’s O&S Appendix A
28
Where data is used differently in the 2017-18 local formula and option 2 the unit values have been adjusted in Table 11 above to reflect the equivalent unit value if the National Formula methods had been applied to the different level of funding allocated. Table 11 unit values and the level of the cap are included on the basis that no funding is transferred to high needs.
The unit value for the Primary Low Prior Attainment factor may need to reduce by approximately 10% from the indicative value in Table 11. The data for the October 2017 census will identify more pupils as not making good progress compared with the October 2016 census used for financial modelling. As the new measure will become applicable for year 5 for Primary, Junior and Middle Schools a reduction in unit value may be accompanied by the identification of more children. The overall change in financial impact compared with the illustration in this paper should be relatively small. The initial impact for Infant and First Schools of a lower unit value is likely to be greater as the identification of children should not be greater in October 2017 data. However, for some schools in this group funding is likely to remain capped due to the increase in unit value for this factor in 2018-19, whichever option is chosen.
Consultation Question
14 Do you agree with how unit values have been updated in Table 11 (excluding the floor factor which is considered in section 3.4)?
Yes No Not Sure
If no, which unit values should be different from those proposed and why?
3.8 Limiting Gains & Affordability
3.8.1 Application of a cap on gains
To manage national funding affordability, a cap on increases above 3% has been applied in the National Formula for each year and a similar cap on gains will be needed locally to manage overall affordability each year. The increases to school budgets as a result of the introduction of a funding floor are not capped and this is by Regulation not local choice.
3.8.2 Impact of Final Data on Affordability
Final school budgets will be calculated following receipt of the October 2017 census data from the DfE in December and application of the agreed local formula. Affordability of planned unit values and other formula elements will need to be assessed again at that time.
These final formula adjustments could involve:
1. In the case of a funding shortfall:
Capping gains at a level below the planned threshold % making slower progress towards longer term funding levels..
Applying lower MFG protection (if greater protection than minus 1.5% is initially planned) making faster progress towards the formula funding levels for schools with protected historic funding.

Poole School Funding Consultation 2018-19 Children’s O&S Appendix A
29
Reduction in the Low Prior attainment or Basic Entitlement unit values equally per pupil for each phase.
Reducing the unit values of other factors or the level of the funding floor.
A combination of the above.
2. In the case of a funding surplus:
Capping gains at a higher threshold than planned to make faster progress towards the higher longer term formula funding level.
Applying greater MFG protection (if a level less than 0% is initially planned) to make slower progress towards the formula funding level.
Increase the Low Prior Attainment or Basic Entitlement unit values equally per pupil for each phase.
Increasing the unit value of other factors or the level of the funding floor.
A combination of the above.
3.8.3 Proposal for a shortfall in funding
It is proposed to manage any shortfall in funding by lowering the threshold for the cap to reduce the increase in funding that can be allocated. The cap however, is restricted to the size of the MFG allocations and if this condition is breached the unit values of the Low Prior Attainment factor in each phase will be reduced as an equal amount per pupil to balance the remaining shortfall.
3.8.4 Proposal to allocate any excess of funding
It is proposed to allocate any excess funding to the Low Prior Attainment factor for each phase as an equal amount per pupil as this funding has been reduced below the National Formula level to manage other formula differences and overall affordability.
Consultation Questions
15 Do you agree that to manage any shortfall in funding the threshold for the cap should be lowered as the first step followed by a reduction in the unit values for Low Prior Attainment funding as described?
Yes No Not Sure
If No please explain your choice and suggest an alternative method.
16 Do you agree that to allocate any excess funding the unit values for Low Prior Attainment factors should be uplifted as an equal amount per pupil?
Yes No Not Sure
If No please explain your choice and suggest an alternative method.

Poole School Funding Consultation 2018-19 Children’s O&S Appendix A
30
3.9 Financial Impact of Options
3.9.1 Summary of Formula Options by Factor for 2018-19
A summary impact by factor is included in Table 12 below. This shows the funding provided through the National formula for 2018-19 and compares with the two options and the 2017-18 local formula. The table demonstrates that both options make considerable progress towards the National Formula in how funding is allocated between factors (and schools). It also shows the impact of the small number of differences that could be retained as described through the two options.
Table 12 - Comparison Options for 2018-19 (Based on 2017-18 data)
Funding Factor
National Formula £000’s
2018-19
Local Formula £000’s
2017-18
Local Option 1 £000’s
2018-19
Local Option 2 £000’s
2018-19
Primary Basic Entitlement 29.853 30,149 29.853 29.853
Secondary Basic Entitlement 27,091 26,872 27,091 27,091
Deprivation Primary 2,830 2,989 2,830 2,830
Deprivation Secondary 2,022 2,089 2,022 2,022
Low Prior Attainment Primary 3,435 1,624 3,422 3,422
Low Prior Attainment Secondary 2,397 1,454 2,388 2,388
EAL Primary 389 534 389 534
EAL Secondary 106 97 106 97
LAC 0 96 57 57
Lump Sum 4,070 4,364 4,070 4,070
Floor Factor Primary 61 0 47 46
Floor Factor Secondary 522 0 453 324
MFG - NF has different basis 117 238 87 83
Capped funding above floor (246) 0 (75) (77)
Total National Formula 72,647 70,506 72,740 72,740
Total Primary Phase 39,593 38,664 39,632 39,749
Total Secondary Phase 33,054 31,842 33,108 32,991
3.9.2 Funding Impact of Proposals for Individual Schools
A summary of the impact for schools for options 1 and 2 is provided in Table 13 below:
Table 13 - Summary Formula Impact for Schools (Based on 2017-18 data)
Formula Position Option 1 Number
Option 2 Number
Floor funding 3 3
Capped funding 7 7
Fully formula funded 25 25
MFG funding 2 2
Total Mainstream Schools 37 37
Poole School Funding Consultation 2018-19 Children’s O&S Appendix A
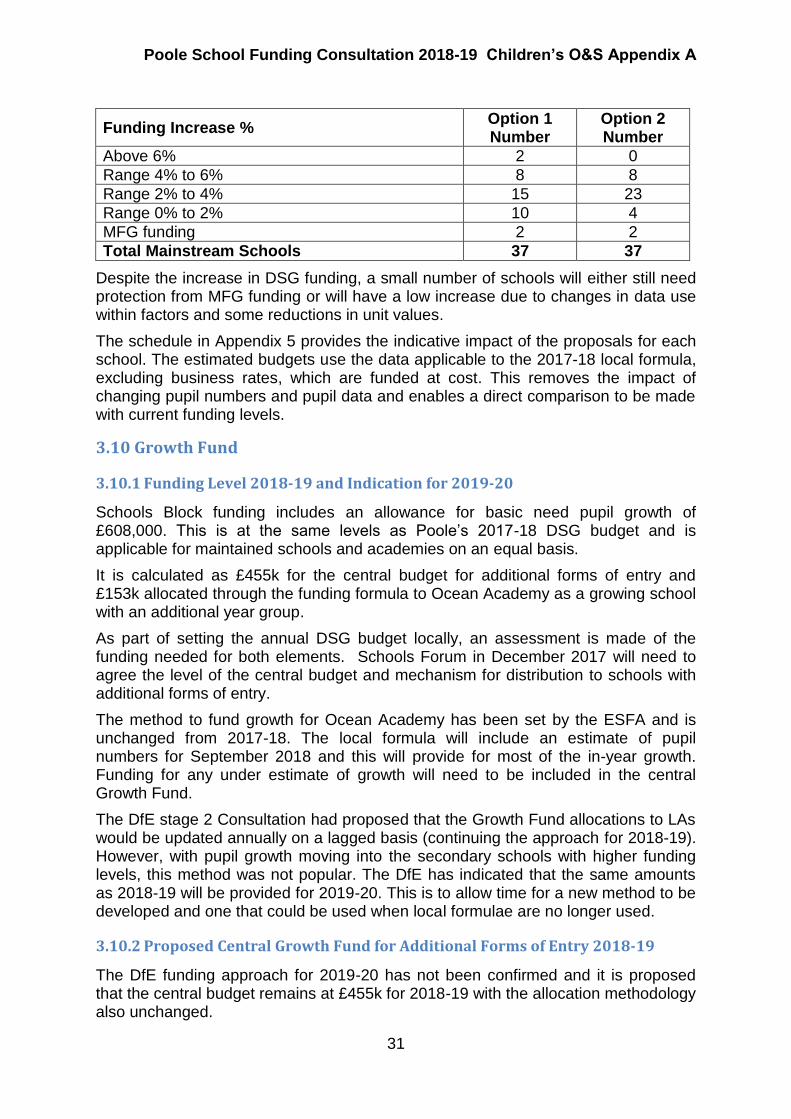
31
Funding Increase % Option 1 Number
Option 2 Number
Above 6% 2 0
Range 4% to 6% 8 8
Range 2% to 4% 15 23
Range 0% to 2% 10 4
MFG funding 2 2
Total Mainstream Schools 37 37
Despite the increase in DSG funding, a small number of schools will either still need protection from MFG funding or will have a low increase due to changes in data use within factors and some reductions in unit values.
The schedule in Appendix 5 provides the indicative impact of the proposals for each school. The estimated budgets use the data applicable to the 2017-18 local formula, excluding business rates, which are funded at cost. This removes the impact of changing pupil numbers and pupil data and enables a direct comparison to be made with current funding levels.
3.10 Growth Fund
3.10.1 Funding Level 2018-19 and Indication for 2019-20
Schools Block funding includes an allowance for basic need pupil growth of £608,000. This is at the same levels as Poole’s 2017-18 DSG budget and is applicable for maintained schools and academies on an equal basis.
It is calculated as £455k for the central budget for additional forms of entry and £153k allocated through the funding formula to Ocean Academy as a growing school with an additional year group.
As part of setting the annual DSG budget locally, an assessment is made of the funding needed for both elements. Schools Forum in December 2017 will need to agree the level of the central budget and mechanism for distribution to schools with additional forms of entry.
The method to fund growth for Ocean Academy has been set by the ESFA and is unchanged from 2017-18. The local formula will include an estimate of pupil numbers for September 2018 and this will provide for most of the in-year growth. Funding for any under estimate of growth will need to be included in the central Growth Fund.
The DfE stage 2 Consultation had proposed that the Growth Fund allocations to LAs would be updated annually on a lagged basis (continuing the approach for 2018-19). However, with pupil growth moving into the secondary schools with higher funding levels, this method was not popular. The DfE has indicated that the same amounts as 2018-19 will be provided for 2019-20. This is to allow time for a new method to be developed and one that could be used when local formulae are no longer used.
3.10.2 Proposed Central Growth Fund for Additional Forms of Entry 2018-19
The DfE funding approach for 2019-20 has not been confirmed and it is proposed that the central budget remains at £455k for 2018-19 with the allocation methodology also unchanged.

Poole School Funding Consultation 2018-19 Children’s O&S Appendix A
32
This budget allows funding for approximately 290 additional pupils in primary schools from September 2018.
Funding is to be provided for the expanded entry year group only. This means that pupils filling up to the planned admission number (PAN) in other year groups will not be funded through this mechanism. This is consistent with the treatment for other schools with surplus capacity where this would need to be funded through agreed de-delegation (maintained) or exception request to the ESFA (academies).
Any net reduction in numbers on roll (NOR) across other year groups is to be taken into account so numbers funded overall cannot exceed actual numbers on roll in October 18. The funding level will be for 7 months of the year at the level of the Basic Entitlement only.
The 2018-19 local formula allocation for Ocean Academy will already include funding for estimated pupil growth at September 2018. The October 2018 census will be used to recalculate the budget and an allowance for additional pupils in each of the 4 year groups has been included in the Growth Fund. The ESFA will adjust Ocean Academy’s budget directly and recoup any increase in allocations from Poole’s Growth Fund.
3.10.3 Planning for Pupil Growth in 2019-20
There is no basic need growth at secondary level in 2018-19 but it will move into this phase in September 2019.
The strategy to create extra places in the primary phase was to increase the PAN for schools that were generally already full and a new junior school was opened.
In managing the growth in places needed for Secondary Schools, the agreed LA strategy is that current surplus capacity should be used and this will be followed by PAN increases as necessarily in future years. This means basic need growth will feed into potentially two secondary schools in 2019-20 without an increase in PAN being needed.
It is proposed that the increase in year 7 for the 2 schools is treated as basic need growth and the increase at September 2019 funded from the Growth Fund for that year.
Consultation Questions
17 Do you agree with the approach to the Growth Fund in 2018-19 and allocation methodology between schools?
Yes No Unsure
If no please comment on your reasons
18 Do you agree with the general approach for secondary school basic need growth in 2019-20?
Yes No Unsure
If no please comment on your reasons

Poole School Funding Consultation 2018-19 Children’s O&S Appendix A
33
4 High Needs Block
4.1 Overview
High needs expenditure primarily supports individual placements for pupils excluded from mainstream schools or with some level of SEND either remaining in mainstream schools or within specialist high cost provision.
Pupils with SEND in mainstream schools are supported by a combination of the school delegated budget (Schools Block funding) and top up funding (SEN packages) and outreach services funded from the High Needs funding block.
In individual mainstream schools the largest impact on overall funding (and costs) is changing numbers on roll. This is because the Basic Entitlement factor has the largest unit value and is applicable for all pupils. The funding factor with the next highest impact in both Primary and Secondary phases is Low Prior Attainment. In both options within this consultation, proposals contain a large increase for this factor, with a large part of the overall increase of £2.1 million for 2018-19 attributable to this factor through the National Formula.
In contrast, funding through the national formula for the High Needs block will be relatively unchanged over the next two years with only small adjustments according to the changing number of pupils placed in high cost provision. The costs of a growing number of children will be far greater than the additional funding.
Poole has low funding growth in the High Needs block over 2018-19 and 2019-20 because of high historic spending in this area compared nationally.
Budget pressures are growing in this area of expenditure due to the:
High level of permanent exclusion for younger children (particularly in year 9) in recent years, with this trend continuing in academic year 2017-18.
Increasing numbers of pupils being placed in specialist provision rather than remaining in mainstream schools.
The report to Schools Forum at Appendix 6 provides full details of these issues.
4.2 Budget 2017-18 and Draft Budget 2018-19
4.2.1 Budget Position 2017-18
High needs expenditure in 2017-18 is forecast to be at least £0.6 million higher than the budget due to the continued rise in pupils requiring SEND placements across all age groups and provision types (state funded, charitable and independent special schools and post 16 providers). This annual shortfall can almost be met from savings on other DSG budgets and applying all of the remaining DSG reserves. However, costs have continued to rise over the autumn and estimates of the annual position and impact for future years will be updated for the December report.
4.2.2 High Needs Budget Summary 2018-19
The October Schools Forum report estimated the 2018-19 high needs budget growth for SEND at £1million compared with the 2017-18 budget for SEND. No account has yet been taken of potential further growth needed for pupils permanently excluded from mainstreams schools. The budget for pupils excluded from mainstream schools has already been increased in 2017-18 by £220k and already totals £1 million

Poole School Funding Consultation 2018-19 Children’s O&S Appendix A
34
overall. This is despite an investment of £652k from DSG reserves in an attempt to address this problem over the last two years through the Quay Early Intervention Project (£326k annually).
The high needs budgets are detailed in Table 14 for 2017-18 alongside the initial draft for 2018-19 reported to Schools Forum in October.
Table 14: High Needs Budgets 2017-18 and Draft for 2018-19 (at October 2017)
High Needs Budget
17/18 18/19
Comments
Budget £000’s
Draft Budget £000’s
Special Places (Poole as host):
- Poole Maintained 1,040 1,040 Specialist 2018/19 placements will change (from autumn data return)
- Poole Academy 1,220 1,220 - Post School (includes FE) 236 236 - Mainstream post 16 statements 102 102
SEND Places 2,598 2,598
Quay School Places: Place numbers continue to be under pressure
- Medical (Base + NHS) 806 806 - Permanent Exclusion 600 600
Quay Places 1,406 1,406
Early Intervention Projects: No funding available to continue
- Quay - Summer 2017 (from reserves) 134 0 - Secondary (Quay) 204 0 - Primary (Ambitions) 204 0
Early Intervention 542 0
Top up funding (Poole children only)
- High Needs Contingency 132 132
Growing number of placements in specialist provision
- Maintained/Academy 4,268 4,775 - Excluded Pupils 400 400 - Independent Special 4,333 4,505 - Post Schools 536 871
Top Up 9,669 10,683 Growth £1 million
SEN support services: - Special School Outreach 227 227 Mainstream support
- Hospital Education - private providers 100 100 Children outside school, Home / In-year fair access - Other Education Out of School 130 130
- Support for Inclusion 53 53 SEN pupils re-integration
- Specialist Support pupils aged 2 - 4 538 538 Early Years only
- Specialist Support - Sensory impaired 286 286 Pan Dorset Service
SEN Support 1,334 1,334
Total High Needs Expenditure 15,549 16,021
DSG High Needs Funding 15,262 15,427 Demographic growth only
Funded by Reserves in 17-18 287 0 All used end 2017-18
Total Funding 15,549 15,427
Funding Shortfall 0 594 To be resolved

Poole School Funding Consultation 2018-19 Children’s O&S Appendix A
35
SEN and permanent exclusion activity over the autumn term is indicating that the estimates prepared in September in Table 14 for 2018-19 will likely need to be increased in the next report to Schools Forum in December. The shortfall of £0.6m already identified would not be covered by a 0.5% funding transfer from mainstream schools. To allow for further budget growth, including for permanently exclude pupils, a transfer of up to 1% would be required. To also continue some level of early intervention support, a transfer above 1% would be needed.
4.3 Summary of High Needs Budgets Issues
Poole’s High Needs expenditure has been high compared nationally over many years and this reflects the pattern of provision rather than providing for more pupils with SEND. This is the reason Poole’s High Needs funding from the DfE is growing only to take account of demographic changes rather than seeing any meaningful increase over the next two years. High LA historic expenditure is protected in the new national high needs formula through an MFG mechanism in a similar way to mainstream school funding.
The growth in specialist placements has become a national issue with some LAs finding their High Needs budgets in deficit already in 2016-17. Poole managed (just) to contain pressures overall last year but this will not be possible in the future with current arrangements. Current pressures are clearly linked to government policy and LAs are raising this issue nationally.
The report for Schools Forum in October reproduced as Appendix 6 contained further detail of high needs budgets. It showed where budget pressures were emerging and explored issues through local activity and financial data alongside national benchmarking information. It also included work being undertaken by the LA to stem further budget growth where possible.
The main conclusion is that budget growth is linked to the rising number of pupils requiring placements and whilst a review of the costs of individual placements may be able to find some savings the greatest reduction on the budget requirement needs to be made by reducing the number of pupils with high cost placements outside mainstream schools.
A summary of the data using the references in Appendix 6 is as follow:
The vast majority of the current £15.5m budget is spent on provision for individual pupils in schools and other education provides (darker blue area in Chart 1),
Poole schools currently identify a greater proportion of pupils with SEND below the EHCP threshold (14%) compared nationally (12%). The proportion has fallen in Poole and nationally since 2014 but the gap between the two has widened (Chart 2).
Poole proportion of pupils with an EHCP was below the national average over 2014 to 2017 but the gap is closing (Chart 2).
Poole had a lower proportion of pupils with EHCP in mainstream schools at January 2017 (33.5%) compared nationally (43.5%). This difference cannot be explained by the use of SEND bases in other areas (Table1).
Poole has a higher proportion of pupils with EHCP outside the state sector (Chart 3 and Table 1) and these are reflected in higher costs (Table 2).

Poole School Funding Consultation 2018-19 Children’s O&S Appendix A
36
The rate of Permanent Exclusions from Poole schools is higher than nationally (Chart 6).
By the end of September 2017, 52 of the 60 places at the Quay school were already filled by excluded pupils, with 48 continuing from the previous academic year (report paragraph 3.5.4). Few pupils return to mainstream schools after permanent exclusion.
4.4 Exploring Solutions
4.4.1 Internal Review Group
Schools Forum at their meeting on 11 October 2017 agreed to set up a Task and Finish Group, comprising representatives from the LA, mainstream schools and high needs providers. The Group over 3 meetings will explore short and medium term measures to reduce the current pressure on the High Needs budgets and report to the December Schools Forum. The work will specifically be to:
1. Consider the data explaining the reasons for financial pressures in high needs budgets.
2. Consider both short term and longer term solutions. 3. Prepare a draft action plan for presentation to the SEND Partnership Group on 7
December. 4. Present the action plan and make recommendations to Schools Forum regarding
whether any mainstream school funding should be transferred to support budgets for high needs in 2018-19.
Key Questions to Explore
Permanent Exclusions:
Why has investment of DSG reserves in early intervention of £326k per annum
over 2015-16 and 2016-17 not reduced high needs funding for Poole pupils
excluded from mainstream schools?
Why in Poole are exclusions continuing to rise in Year 9?
What are the potential actions for: o Local Authority o Schools
Identification of Pupils with Special Education Needs & Budget Implications
Why is Poole identifying more pupils below the statutory thresholds (School Support)?
Why do we support fewer pupils at statutory threshold within our mainstream schools and more within specialist provision?
How effective are Poole Outreach services in supporting mainstream schools to support pupils above and below the statutory threshold?
How should the increase in funding for Low Prior Attainment in the mainstream school formula (whichever option is taken forward) impact on high needs budgets?
Do we understand the expenditure on our most expensive placements?
What does our local provision look like and where do we need to place outside the region?

Poole School Funding Consultation 2018-19 Children’s O&S Appendix A
37
What are the potential actions for: o Local Authority o Schools
4.4.2 External Review
An external review of high needs budgets is also taking place across Bournemouth and Poole funded by a DfE specific grant. This may identify further insight and potential solutions across a wider area for us to consider. This review has been underway since September with a draft report to be presented to the SEND Partnership and task & finish Group on 7 December. The outcome from both reviews will reported to Schools Forum on 13 December to aid decision-making.
4.5 Balancing the Budget & Consideration of Options
A large proportion of the High Needs budget is supporting individual pupil placements in specialist provision and the areas to reduce the budget are, therefore, limited.
It is clear that to maintain the current level of services for mainstream schools and individual pupils within the High Needs block a transfer of funding will be required from mainstream schools. The outcomes from the reviews may identify some solutions to reduce costs but these are likely to be for the longer term.
A transfer of funding to High Needs budgets would reduce the amount of funding available for the mainstream formula and how this reduction could be shared between schools is considered above in section 3.6.
The consultation questions in this section are seeking school preferences for how the high needs budget should be balanced. Options are needed to fund the unavoidable costs from more pupils being supported as high needs from SEN or permanent exclusion (requiring a transfer of up to 1%). Also included is whether a higher level of transfer should be considered to maintain all current services, provide for the growth in high needs pupils, and to include some level of early intervention funded centrally. The alternative to a funding transfer is that services will end and/or top up from schools is reduced.
Consultation Questions
19 Would you support a transfer of funding to high needs of up to 0.5% of school funding (£372k)?
Yes No Unsure
Please provide reasons
20 Would you support a transfer of funding to high needs of up to 1% of school funding (£744k)?
Yes No Unsure
Please provide reasons
21 Would you support a transfer of funding to high needs above 1% of school funding?

Poole School Funding Consultation 2018-19 Children’s O&S Appendix A
38
Yes No Unsure
Please provide reasons
22 Would you support a transfer of funding to continue the Early Intervention Projects (applicable only after SEN and permanent exclusion budgets have been balanced).
Funding transfer level Yes No Unsure
Within a 0.5% transfer
Within a 1.0% transfer
Within greater than 1% transfer
Please explain reasons
23 If Schools Forum is unable to agree a transfer of sufficient funding to maintain current levels of the high needs budgets please rank preferences of budgets that you would prefer to be maintained as far as affordable.
High Needs Budget Rank
Mainstream School top up funding rate
Outreach Services (alternative of buy back)
Special Schools top up funding
Early Intervention Projects
Please explain reasons
5 Central Schools Services Block
5.1 Funding and Draft Budget 2018-19
A national formula has also been introduced for 2018-19 to determine LA allocations for Central Service for all schools. It is largely based on pupil numbers but with an allowance to reflect relative levels of deprivation across LAs.
Services for maintained schools only are not included in the Central Schools Services Block. These are funded through 2 different mechanisms and are deducted from individual school budget shares or place funding after they have been calculated as for 2017-18. A separate consultation on these budgets will follow later.
Central School Services are statutory duties of the LA but the allocation to budgets is decided by Schools Forum.
Table 15 – Central School Services 2018-19
Central School Services
Budget £000’s
2017-18
Draft Budget £000’s
2018-19
School Admissions 150 150 Servicing Schools Forum 6 6

Poole School Funding Consultation 2018-19 Children’s O&S Appendix A
39
Licences purchased by DfE 86 86 Ex ESG Services all schools 295 295 Standards Board Independent Chair 15 3
Total Expenditure 552 540
DSG Funding 552 540
5.2 School Admissions and Servicing of the Schools Forum
These budgets have been funded from the DSG over many years, with the funding level not being increased since at least 2013-14. Budgets are needed at these levels to maintain current services for schools. Any reduction and schools would need to consider how individually they manage the Schools Admissions Forum and school admissions in the absence of co-ordinated arrangements.
The Schools Forum Budget supports the cost of the meeting itself and attendance of early years voluntary and private sector members at sub group meetings. A reduction in this budget could end the support to sub group members or reduce the number of Schools Forum meetings from 5 to 4 annually (there is a minimum requirement of 4 meetings).
5.3 DfE Licenses
The list of licences negotiated on behalf of all schools by the DfE is to be included in the budget 2018-19 consultation. However, the LA has no influence over which licenses are included or the level of the DfE change on the DSG.
The list of licenses included in the charge is as follows:
Christian Copyright Licensing International (CCLI) Copyright Licensing Agency (CLA) Education Recording Agency ERA) Filmbank Distributers Ltd (For the PVSL) Mechanical Copyright Protection Society (MCPS) Motion Picture Licensing Company (MPLC) Newspaper Licensing Agency (NLA) Performing Rights Society (PRS) Phonographic Performance Limited (PPL) Schools Printed Music Licence (SPML)
5.4 Ex ESG Services
These services are LA statutory duties on behalf of all schools, including academies and special schools. The proposed budget allocations are at the same level of funding for 2018-19.

Poole School Funding Consultation 2018-19 Children’s O&S Appendix A
40
Table 16: Proposed DSG Central Budget for LA Statutory Duties 2018-19
Services 2017-18 Budget £000’s
2017-18 Draft
£000’s
Statutory and Regulatory Duties
Service Leadership – Director 3 3 Service Planning (includes Standard Board activity) 120 120 Finance (Statutory returns, budgets, funding formulae) 40 40 Standing Advisory Committees for Religious Education 5 5
168 168
Education Welfare
School attendance, pupils excluded, child employment 87 87
Asset Management
Capital programme (including for early years and high needs)
40 40 Landlord duties (includes academy leaseholds, early years).
Total Budget to be Agreed (equivalent to ESG transfer) 295 295
Independent Chair for Standards Board (agreed in October) 15 3
Total DSG Retained Duties Budget 310 298
Schools will need to consider if the Independent Chair of Standards Board is to continue and how this is funded.
If this level of funding is not allocated to support the LA costs then the consequences could be that:
Activity supporting the Standards Board would need to be reduced.
Pupils with poor school attendance could be left unsupported
Support to schools with basic need capital projects would reduce
Potential capital bidding rounds could be left unsupported with lost opportunity of drawing government funds into Poole. As an illustration of activity in 2016-17 support was provided to early years private providers in bidding successfully for expansion projects.
Consultation Question
24 Do you have any comments on the budgets in the LA Central Services Block?

Poole School Funding Consultation 2018-19 Children’s O&S Appendix A
41
6 Next Steps A summary of consultation questions is included at Appendix 7. The consultation closes on 23 November 2017 but earlier responses are welcomed.
Please respond using the Consultation Response Form to the following e-mail address:
or by mail to:
Nicola Webb Financial Services Borough of Poole Civic Centre POOLE BH15 2RU
Responses will be collated and considered at the LMS meeting on 7 December 2017 and Schools Forum will make a recommendation to the Council on 13 December 2017.
At the 13 December meeting Schools Forum will also make final decisions on any transfer of mainstream funding to support high needs, the level of the Growth Fund and Central Services supporting schools.
Schools Forum recommendations and comments from schools will be taken into account by the Children’s Services Overview and Scrutiny Committee Chairman and the Cabinet Portfolio Holder for Children’s Services. A recommendation to Council for the agreement of the mainstream formula for 2018-19 will be considered at the Council meeting on 19 December 2017.
Schools Forum will receive a report at the 10 January 2018 meeting detailing the outcome of the agreed mainstream formula for 2018-19 and final schools budget calculations to be sent to the ESFA taking into account the October 2017 census.

Poole School Funding Consultation 2018-19 Children’s O&S Appendix A
42
Appendix 1 National Fair Funding Formula 2018- 20 & Poole Formula Factors in 2017-18
Possible LMS Formula Factors
DfE National Formula 2018/19
Poole LMS Formula 2017/18
Basic Entitlement
Compulsory
Based on NOR
Primary at least £2000
Secondary value or KS3 and KS4 separately with a minimum of £3,000
Used separate KS3 and KS4 data
Used separate KS3 and KS4 data Consult on unit values
Deprivation
Compulsory factor
FSM (annual)
FSM Ever 6
IDACI bands (post codes)
Combination of both FSM measures and IDACI bands possible from 2018/19.
Used combination of: FSM annual FSM Ever 6 IDACI bands
Used Combination of FSM Ever 6 measure IDACI bands Consult on whether to add FSM annual and level of unit values.
Prior Attainment
Optional (used by nearly all LAs)
Primary years 1 to 5 use revised EYFSP data (identifies more children than previous).
Primary year 6 option of using scores below 73 or 78 of previous EYFSP measure.
Primary option to scale down years 1 to 5 data equally for consistency with other year groups.
Secondary no data choice and national scaling applied for consistency between year groups - pupils with KS2 scores below level 4 in English or Maths.
Uses a score of 78 (now only for year 6) No scaling used Unit value will be lower without scaling as it is applied to a higher number of pupils.
Uses a score of 78 (will be only for year 6 in 2018-19) Scaling used The rational is that year groups across the phase differ by school and those with older age groups would be disadvantaged. Scaling would be applied to reduce data in year groups 1 to 5 for consistency with year 6. The national formula unit value is higher than the local scaled factor unit value so no school would be disadvantaged by adopting the national formula for this factor. To consult. The need to apply scaling will fall away in 2019-20.

Poole School Funding Consultation 2018-19 Children’s O&S Appendix A
43
Possible LMS Formula Factors
DfE National Formula 2018/19
Poole LMS Formula 2017/18
Looked after Children
Optional
No data choice
Single unit value for both phases
No longer used – funding will be added instead to the Pupil Premium. Previous LAC funding will not be included in the MFG preventing it becoming locked in with double funding.
Factor Used Only £400 is being added to the Pupil Premium. The factor could still be used locally. To consult on use of factor at £600 and if retained the funding source.
EAL
Optional
Data choice in both phases based on time since entry to UK education system above year R: Within previous:
o One year o Two years o Three years
Separate phase unit values possible
Use of three year data This option identifies the greatest number of children so the unit value would be lower than other options. Separate unit values – higher at secondary
Uses two year data as there is no data capture for time in year R. Infant schools data is therefore capped at 2 years. Data for other schools increases at 3 years. Separate unit values – higher at secondary Moving to the national formula may now be more appropriate. To consult
Pupil Mobility
Optional
Counts pupils admitted outside normal cycle within previous 3 years above 10% threshold.
Not used in the national formula but provided to LAs at historic cost.
Not used No plans to change (locally mobility highly correlated with deprivation)
Sparsity National guidance contains these complex arrangements.
Used nationally but there is no allocation for Poole
Not used and not relevant
Lump sum
Optional
Used by all LAs
Differentiation by phase permitted since14/15 (middle schools split)
Max of £175,000
New short term arrangements for amalgamating schools (not currently applicable for Poole).
No differentiation by phase
Small differentiation by phase. To consult on unit values

Poole School Funding Consultation 2018-19 Children’s O&S Appendix A
44
Possible LMS Formula Factors
DfE National Formula 2018/19
Poole LMS Formula 2017/18
Business rates
Optional
Used by all LAs
Funded at cost
Funding to the LA outside the national formula at historic cost. But it is included in the formula for calculation of the uplift to the funding floor.
Used and expected, with no changes proposed.
PFI, and London Fringe factors
Not used Not used and not relevant
Exceptional Premises Costs
Optional
Must be EFA approved – most frequent being rents and joint use sports facilities.
Factor must be at least 1% of individual school budget and apply to less than 5% of schools in the LA.
Funding to the LA outside the national formula at historic cost (Factor is for specific issues applicable to individual schools).
Used to fund the additional costs of the joint use sports facilities at St Aldhelm’s and Magna academies. No changes proposed
Funding Floor
Optional
Outside any cap applied to limit increases
Minimum per pupil funding for primary, KS3 in middle schools and secondary pupils.
A new potential factor in 2018-19 To consult on usage and at what level
Minimum Funding Guarantee Local formula must apply between 0% and minus 1.5%
National formula applies +0.5 % protection in 2018-19 and +1% in 2019/20
To consult on level of the MFG

Poole School Funding Consultation 2018-19 Children’s O&S Appendix A
45
Appendix 2
National & Local Mainstream Formula Unit Values
Formula Factors National Formula 2018-19
Local Formula
17-18
Option 1 2018-19
Option 2 2018-19
Basic (Primary) £2,746.99 £2,774.17 £2,746.99 £2,746.99
Basic (KS3) £3,862.65 £3,857.23 £3,862.65 £3,862.65
Basic (KS4) £4,385.81 £4,311.82 £4,385.81 £4,385.81
Free School Meals Ever 6 (P) £540.00 £808.52 £540.00 £540.00
Free School Meals Ever 6 (S) £785.00 £1,041.61 £785.00 £785.00
Free School Meals (P) £440.00 £0.00 £440.00 £440.00
Free School Meals (S) £440.00 £0.00 £440.00 £440.00
IDACI (PF) £200.00 £209.14 £200.00 £200.00
IDACI (PE) £240.00 £260.19 £240.00 £240.00
IDACI (PD) £360.00 £371.46 £360.00 £360.00
IDACI (PC) £390.00 £495.27 £390.00 £390.00
IDACI (PB) £420.00 £619.09 £420.00 £420.00
IDACI (PA) (no Poole pupils) £600.00 £691.15 £600.00 £600.00
IDACI (SF) £290.00 £289.06 £290.00 £290.00
IDACI (SE) £390.00 £378.88 £390.00 £390.00
IDACI (SD) £515.00 £470.32 £515.00 £515.00
IDACI (SC) £560.00 £554.08 £560.00 £560.00
IDACI (SB) £600.00 £669.45 £600.00 £600.00
IDACI (SA) (no Poole pupils) £810.00 £818.79 £810.00 £810.00
LAC £0.00 £1,003.80 £600.00 £600.00
Low Prior Attainment (P) * £1,050.00 £1,029.15 £1,046.00 £1,046.00
Low Prior Attainment (S) £1,550.00 £940.07 £1,544.57 £1,544.57
EAL (P) ** £515.00 £958.80 £515.00 £958.80
EAL (S) ** £1,385.00 £1,863.92 £1,385.00 £1,863.92
Lump Sum (P) £110,000.00 £115,797.02 £110,000.00 £110,000.00
Lump Sum (S) £110,000.00 £125,155.40 £110,000.00 £110,000.00
Floor - Primary £3,300.00 Not
Applicable
£3,300.00 £3,295.54
Floor - Middle £3,650.00 £3,650.00 £3,650.00
Floor - Secondary £4,600.00 £4,600.00 £4,524.37
Joint Use Factor 101k 101k 101k 101k
Equivalent unit values where data is used differently are shown to aid comparison in
Table 11 in Section 3.7:
* Primary Low Prior Attainment uses scaling in Local Formula 2017-18. Propose to
cease in both options.
** EAL 2 used in the National Formula and Option 1, EAL 3 used in Local Formula
2017-18 and Option 2.
These unit values in Appendix 2 assume no funding transfer is made to High Needs

Poole School Funding Consultation 2018-19 Children’s O&S Appendix A
46
Appendix 3
National Fair Funding (NFF) Formula
by School
Baseline funding
(2017-18)
Notional NFF
funding
% change baseline
% change
in pupil-
led
Illustrative total NFF funding
% change baseline
% change
in pupil-led
Baseline Notional NFF 2018-19 Illustrative NFF - fully
INFANT & FIRST Lilliput 1,164,000 1,195,000 2.7% 3.0% 1,260,000 8.2% 9.1% Springdale 991,000 1,017,000 2.7% 3.0% 1,043,000 5.2% 6.0% Merley 1,029,000 1,057,000 2.7% 3.0% 1,080,000 5.0% 5.5% Broadstone First 1,010,000 1,037,000 2.7% 3.0% 1,057,000 4.7% 5.2% Sylvan Infant 1,356,000 1,392,000 2.7% 3.0% 1,418,000 4.6% 5.1% Twin Sails 1,277,000 1,312,000 2.7% 3.0% 1,325,000 3.8% 4.1% Ad Astra 984,000 1,010,000 2.7% 3.0% 1,017,000 3.4% 3.8% Stanley Green 1,012,000 1,039,000 2.7% 3.0% 1,045,000 3.3% 3.7% Courthill 1,224,000 1,250,000 2.1% 2.3% 1,250,000 2.1% 2.3% Canford Heath Infant 1,225,000 1,248,000 1.8% 2.0% 1,248,000 1.9% 2.0% Bearwood 799,000 802,000 0.4% 0.5% 806,000 0.9% 1.0% Old Town 923,000 927,000 0.4% 0.5% 931,000 0.9% 1.0%
Total Infant & First 12,994,000 13,286,000 2.2% 13,480,000 3.7%
PRIMARY Bishop Aldhelm's 1,953,000 2,008,000 2.8% 3.0% 2,052,000 5.0% 5.4% Heatherlands 2,140,000 2,200,000 2.8% 3.0% 2,219,000 3.7% 4.0% Longfleet 2,019,000 2,076,000 2.8% 3.0% 2,086,000 3.3% 3.5% St Joseph's 1,460,000 1,495,000 2.4% 2.6% 1,495,000 2.4% 2.6% Hillbourne 1,236,000 1,262,000 2.1% 2.3% 1,262,000 2.1% 2.3% Talbot 1,983,000 2,021,000 1.9% 2.1% 2,021,000 1.9% 2.1% St Mary's 1,460,000 1,486,000 1.8% 1.9% 1,486,000 1.8% 1.9% Turlin Moor 1,302,000 1,325,000 1.8% 2.0% 1,325,000 1.8% 2.0% Manorside 1,203,000 1,209,000 0.5% 0.5% 1,214,000 0.9% 1.0%
Total Primary 14,756,000 15,082,000 2.2% 15,160,000 2.7%
JUNIOR Baden-Powell 2,283,000 2,402,000 5.2% 5.5% 2,548,000 11.6% 12.2% Hamworthy Park 1,474,000 1,515,000 2.8% 3.0% 1,533,000 4.0% 4.3% Haymoor 1,292,000 1,328,000 2.7% 3.0% 1,328,000 2.8% 3.0% Branksome 1,171,000 1,201,000 2.6% 3.0% 1,203,000 2.7% 3.1% Oakdale 1,679,000 1,715,000 2.2% 2.3% 1,715,000 2.2% 2.3% Canford Heath Junior 1,629,000 1,652,000 1.4% 1.5% 1,652,000 1.4% 1.5%
Total Junior 9,528,000 9,813,000 3.0% 9,979,000 4.7%
MIDDLE & SECONDARY Parkstone Grammar 3,868,000 4,154,000 7.4% 7.6% 4,334,000 12.1% 12.4% Poole Grammar 3,819,000 4,089,000 7.1% 7.3% 4,267,000 11.7% 12.1% St Aldhelm's 1,911,000 1,963,000 2.7% 3.0% 2,007,000 5.0% 5.5% Corfe Hills 3,897,000 4,011,000 2.9% 3.0% 4,069,000 4.4% 4.5% Poole High 7,617,000 7,841,000 2.9% 3.0% 7,903,000 3.8% 3.8% Magna 4,087,000 4,205,000 2.9% 3.0% 4,214,000 3.1% 3.2% St Edward's 4,266,000 4,385,000 2.8% 2.9% 4,385,000 2.8% 2.9% Broadstone Middle 1,861,000 1,898,000 2.0% 2.1% 1,898,000 2.0% 2.1% Carter 1,937,000 1,946,000 0.5% 0.5% 1,955,000 0.9% 1.0%
Total Middle & Secondary 33,263,000 34,492,000 3.7% 35,032,000 5.3%
TOTAL (ex ocean) 70,541,000 72,673,000 3.0% 73,651,000 4.4%
Ocean - as full basis 1,285,000 ** ** ** 1,346,000 4.8% 5.2%
TOTAL ALL SCHOOLS 71,826,000 74,997,000 4.4%
** Calculation adjusted for growing school to ensure lump sum correctly reflected in impact

Poole School Funding Consultation 2018-19 Children’s O&S Appendix A
47
Appendix 4
Primary Prior Attainment – Scaling Option
This appendix provides the technical detail of the option to scale data to maintain consistency in pupil eligibility age across groups.
In the first year of the new EYFSP, the proportion of pupils identified in Poole was high compared nationally but more recent data is more in line with the original pilots and national data. The actual scaling factor to apply in 2018-19 would depend on the % identified according to the new and old measures in the final data from DfE in December. In 2017-18 the scaling factor was 40%.
The new measure data was adjusted in 2017-18 using the data in Table 8 as follows:
New measure proportion overall (37%)
Multiplied by scaling (40% - a calculated figure)
Equal to Old Measure Proportions overall (15%)
Data measured by the New EYFSP (years 1 to 4) for each school was multiplied by 40%.
If the flexibility is used, the new measure EYFSP data must be scaled back equally across schools (but cannot be scaled to a lower proportion of children than the previous measure provides for year 6). The distribution of eligible pupils between schools for the five year groups, therefore, would still reflect the new measure but would remain different from year 6.
The distribution of funding through the factor has changed between schools progressively over time as more year groups have been brought within the scope of the new measure.

Poole School Funding Consultation 2018-19 Children’s O&S Appendix A
48
Indicative Financial Impact of Options for Schools (based on 2017-18 data) - Primary Appendix 5 (a)
School NOR
17/18 NFF (TO LA)*
17/18 LA Formula
18/19 Local Formula Option 1
18/19 Local Formula Option 2
£ excl premises
Per pupil
£ excl premises
Per pupil
£ excl premises
Per pupil
Change from 17/18
£ excl premises
Per pupil
Change from 17/18
£ %
£ %
Ad Astra 269
1,009,870 3,754
983,660 3,657
1,017,389 3,782 33,729 3.4%
1,022,057 3,799 38,397 3.9% Canford Heath 355
1,247,748 3,515
1,225,210 3,451
1,247,452 3,514 22,242 1.8%
1,251,475 3,525 26,265 2.1%
Courthill 357
1,249,500 3,500
1,223,874 3,428
1,247,095 3,493 23,221 1.9%
1,268,219 3,552 44,345 3.6% Lilliput 360
1,195,432 3,321
1,163,817 3,233
1,202,669 3,341 38,852 3.3%
1,204,001 3,344 40,184 3.5%
Old Town 222
926,745 4,175
922,682 4,156
922,827 4,157 145 0.0%
953,536 4,295 30,854 3.3% Stanley Green 285
1,038,904 3,645
1,011,849 3,550
1,046,506 3,672 34,657 3.4%
1,051,981 3,691 40,132 4.0%
Sylvan 347
1,372,921 3,957
1,336,137 3,851
1,386,409 3,995 50,272 3.8%
1,390,700 4,008 54,563 4.1% Twin Sails 353
1,312,411 3,718
1,277,389 3,619
1,325,122 3,754 47,733 3.7%
1,329,338 3,766 51,949 4.1%
Infant 2,548
9,353,531 3,671
9,144,619 3,589
9,395,469 3,687 250,850 2.7%
9,471,308 3,717 326,689 3.6% Broadstone 302
1,036,866 3,433
1,009,870 3,344
1,046,765 3,466 36,895 3.7%
1,045,799 3,463 35,929 3.6%
Merley 305
1,056,620 3,464
1,029,049 3,374
1,066,730 3,497 37,681 3.7%
1,069,947 3,508 40,898 4.0% Springdale 298
1,016,963 3,413
990,547 3,324
1,026,649 3,445 36,102 3.6%
1,029,731 3,455 39,184 4.0%
First 905
3,110,450 3,437
3,029,466 3,347
3,140,144 3,470 110,678 3.7%
3,145,477 3,476 116,011 3.8% Bearwood 208
802,393 3,858
798,948 3,841
799,653 3,844 705 0.1%
802,800 3,860 3,852 0.5%
Bishop Aldhelm's 583
1,996,931 3,425
1,941,972 3,331
1,971,240 3,381 29,268 1.5%
1,975,947 3,389 33,975 1.7% Heatherlands 610
2,155,309 3,533
2,095,737 3,436
2,174,311 3,564 78,574 3.7%
2,177,551 3,570 81,814 3.9%
Hillbourne 331
1,234,923 3,731
1,209,134 3,653
1,235,793 3,734 26,659 2.2%
1,239,586 3,745 30,452 2.5% Longfleet 596
2,076,028 3,483
2,018,765 3,387
2,061,562 3,459 42,797 2.1%
2,066,147 3,467 47,382 2.3%
Manorside 281
1,208,815 4,302
1,203,349 4,282
1,203,349 4,282 0 0.0%
1,203,349 4,282 0 0.0% St Joseph's 389
1,494,682 3,842
1,459,982 3,753
1,494,118 3,841 34,136 2.3%
1,509,936 3,882 49,954 3.4%
St Mary's 417
1,486,382 3,564
1,460,239 3,502
1,487,091 3,566 26,852 1.8%
1,495,482 3,586 35,243 2.4% Talbot 511
1,980,392 3,876
1,941,919 3,800
1,980,230 3,875 38,311 2.0%
1,988,696 3,892 46,777 2.4%
Turlin Moor 299
1,306,452 4,369
1,283,185 4,292
1,307,733 4,374 24,548 1.9%
1,309,160 4,378 25,975 2.0% Primary 4,225
15,742,307 3,726
15,413,230 3,648
15,715,080 3,720 301,850 2.0%
15,768,654 3,732 355,424 2.3%
Baden-Powell & St Peter's 728
2,402,400 3,300
2,283,238 3,136
2,388,100 3,280 104,862 4.6%
2,384,851 3,276 101,613 4.5%
Branksome Heath 286
1,163,574 4,068
1,132,887 3,961
1,165,389 4,075 32,502 2.9%
1,163,718 4,069 30,831 2.7% Canford Heath 472
1,652,000 3,500
1,629,173 3,452
1,639,959 3,474 10,786 0.7%
1,636,869 3,468 7,696 0.5%
Hamworthy Park 393
1,514,605 3,854
1,473,694 3,750
1,529,605 3,892 55,911 3.8%
1,527,414 3,887 53,720 3.6% Haymoor 349
1,327,761 3,804
1,292,292 3,703
1,329,671 3,810 37,379 2.9%
1,328,495 3,807 36,203 2.8%
Ocean 216
850,557 3,944
820,459 3,804
852,018 3,951 31,559 3.8%
846,488 3,925 26,029 3.2% Oakdale 482
1,715,061 3,558
1,678,863 3,483
1,716,225 3,561 37,362 2.2%
1,715,069 3,558 36,206 2.2%
Junior 2,926
10,625,957 3,632
10,310,606 3,524
10,620,967 3,630 310,361 3.0%
10,602,904 3,624 292,298 2.8%

Poole School Funding Consultation 2018-19 Children’s O&S Appendix A
49
All Phase 10,604
38,832,246 3,662
37,897,921 3,574
38,871,660 3,666 973,739 2.6%
38,988,343 3,677 1,090,422 2.9%
Indicative Financial Impact of Options for Schools (based on 2017-18 data) - Middle & Secondary Appendix 5 (b)
School NOR
17/18 NFF (TO LA)*
17/18 LA Formula
18/19 Local Formula Option 1
18/19 Local Formula Option 2
£ excl premises
Per pupil
£ excl premises
Per pupil
£ excl premises
Per pupil
Change from 17/18
£ excl premises
Per pupil
Change from 17/18
£ %
£ %
Broadstone Middle 493
1,898,050 3,850
1,860,983 3,775
1,889,646 3,833 28,663 1.5%
1,889,646 3,833 28,663 1.5% Magna Poole 708
3,663,258 5,174
3,568,574 5,040
3,666,273 5,178 97,699 2.7%
3,666,480 5,179 97,906 2.7%
Carter Community 321
1,943,439 6,054
1,934,318 6,026
1,934,318 6,026 0 0.0%
1,934,318 6,026 0 0.0% Poole High 1,564
7,796,677 4,985
7,572,793 4,842
7,860,594 5,026 287,801 3.8%
7,857,579 5,024 284,786 3.8%
St Edward's 900
4,353,043 4,837
4,234,216 4,705
4,363,100 4,848 128,884 3.0%
4,365,016 4,850 130,800 3.1% Corfe Hills 819
4,010,758 4,897
3,897,143 4,758
4,052,416 4,948 155,273 4.0%
4,065,671 4,964 168,528 4.3%
Parkstone 903
4,153,800 4,600
3,867,642 4,283
4,118,800 4,561 251,158 6.5%
4,050,509 4,486 182,866 4.7% Poole Grammar 889
4,089,400 4,600
3,818,729 4,296
4,056,150 4,563 237,421 6.2%
3,988,918 4,487 170,188 4.5%
St Aldhelms 319
1,905,697 5,974
1,853,395 5,810
1,927,218 6,041 73,823 4.0%
1,933,520 6,061 80,125 4.3%
Middle/Secondary 6,916
33,814,122 4,889
32,607,795 4,715
33,868,515 4,897 1,260,720 3.9%
33,751,656 4,880 1,143,861 3.5%
All Schools 17,520
72,646,369 4,147
70,505,716 4,024
72,740,175 4,152 2,234,459 3.2%
72,739,999 4,152 2,234,283 3.2%
Rates & Joint Use
696,289
696,000
602,192
(93,808) (13.5%)
602,192
(93,808) (13.5%)
Growth
455,000
455,000
455,000
455,000 Total
73,797,658
71,656,716
73,797,367
73,797,191
All figures in appendix 5 (a) and 5 (b) assume that no funding transfer has been made to High Needs
* These figures are the NFF figures received by the LA. These differ from those in Appendix 3 as the basis for calculation is different for academies (business rates). For Magna Academy the figures in Appendix 3 are based on estimated pupil numbers whereas the figures above use actual October 16 numbers used in LA school budget calculations. Similarly, for Ocean, Appendix 3 provides the impact based on the school being full, whereas the budget above is that based on estimated NOR as used in the 2017-18 initial school budget calculations.

Poole School Funding Consultation 2018-19 Children’s O&S Appendix A
50
Appendix 6
BOROUGH OF POOLE
POOLE SCHOOL’S FORUM
11 OCTOBER 2017
POOLE HIGH NEEDS BLOCK OF THE DEDICATED SCHOOL’S GRANT
PART OF THE PUBLISHED FORWARD PLAN: YES STATUS (Strategic and Financial) 1. PURPOSE 1.1 This report describes for members of School’s Forum the budgets and related
activity data within Poole’s High Needs Block of the Dedicated Schools Grant (DSG). The information is considered within the national context with current budget pressures and implications highlighted.
1.2 Special Educational Needs and Disabilities (SEND) budgets and activity are
considered in detail. The budget and recent trends for pupils permanently excluded from mainstream schools are also included at summary level. A detailed information pack of data for fixed term and permanent exclusions is included in confidential appendices A to C to this report.
1.3 The actions being taken by the Local Authority SEND Services to reduce the
pressure on the high needs budget also included. 2. DECISION REQUIRED 2.1 Poole School’s Forum appoint representatives to form a task and finish group
with the Head of Children, Young People & Learning, the Special Educational Needs and Disabilities Senior Manager and the Head of Accountancy to focus on what further actions should be taken by both the Local Authority and schools to reduce the pressure on high needs budgets and report back to Poole School’s Forum.
3. SUMMARY HIGH NEEDS BUDGET 2017-18 & DATA TRENDS 3.1 What funding does the High Needs Block cover? 3.1.1 The High Needs Block pays for the following:
Poole Special Schools place funding
Special school top up funding in Poole and other LA areas for Poole children
Poole Special School Outreach Services
The Quay School Provision (Excluded Pupils, Hospital Pebble Lodge and those unable to attend school for medical reasons)

Poole School Funding Consultation 2018-19 Children’s O&S Appendix A
51
Poole contribution to the PAN Dorset Hearing Impaired/Visual Impaired Joint Arrangement
Provision for permanently excluded pupils not at The Quay School
The Quay School Early Intervention Project (Secondary)
Ambitions Early Intervention Project (Primary)
Support for all pupils in mainstream schools (Poole and outside Poole) with either a Statement of Special Educational Need/Education, Health and Care Plan – EHCP) where support is above £6,000 per pupil
Pupils with a Statement of Special Educational Need /EHCP placed in non-maintained/independent special schools/specialist provision
Support in pre-school provision for under 5’s identified with SEND
Support for inclusion and education out of schools 3.1.2 How funding is distributed between education providers and central budgets
(including for early years) for 2017-18 is shown in Chart 1 below.
Chart 1 – Total High Needs Block Budget 2017-18
The above chart shows that the vast majority of the high needs budget of £15.549 million is allocated to education providers to support individual children with central support services a relatively small proportion of overall spend.
3.1.3 The main cost driver of the budget is, therefore, the number of children
identified with high needs. This includes those excluded from mainstream schools or with medical needs and those assessed above the SEND threshold delegated to schools through the mainstream formula (funded from the Schools Block of the DSG). In 2017-18, the notional delegated budget for SEN in the mainstream formula is £5.4 million with the total budget set aside
£14,542,000
£538,000
£130,000
£53,000
£286,000
£469,000
Total High Needs Block Budget 17-18 £15.549m
Schools, Academies & Other Education Providers
Early Years HN
Support for individual pupils (e.g. IYFA, Virtual School)
Support for Inclusion
Sensory Impaired Service

Poole School Funding Consultation 2018-19 Children’s O&S Appendix A
52
to support individual pupils identified as high needs, therefore, £20.9 million of DSG funding.
3.2 Children Identified with SEND in Poole 3.2.1 Current school census data for Poole compared with the England average for
pupils identified with SEND is detailed in Chart 2 as follows:
3.2.2 More pupils are identified with SEND in Poole schools than the national
average, but those with a statutory assessment (EHCP) are lower than typical. This could mean that in Poole, more of the mainstream delegated school budgets are allocated to individual children than would be expected by pupil characteristic data.
3.2.3 In 2017 the proportion of children in Poole schools with statutory assessments
is just below the England average but the proportion without statutory assessment is well above average. The total, therefore, is also well above the national average in 2017. The gap was relatively small in 2014.
3.2.4 The graph above shows that the proportion of pupils with some level of SEND
reduced between 2014 and 2016. By 2017 this trend had started to reverse locally. Poole’s data in 2014 was similar to the national trend but the England average proportion has fallen more sharply and is continuing to reduce. The reduced proportion of children over time is largely due to non-statutory assessments in both cases with statutory cases relatively flat over time. We need to explore with schools why Poole is now out of step with national trends.
0
2
4
6
8
10
12
14
16
18
20
2014 2015 2016 2017
Pe
rce
nta
ge
Chart 2: The proportion of children and young people with SEND
(source: school census)
Poole Total
Poole Non-Statutory
Poole Statutory
England Total
England Non-Statutory
England Statutory

Poole School Funding Consultation 2018-19 Children’s O&S Appendix A
53
3.3 Why are central SEND budgets high in Poole with the number of EHCP below the national average?
3.3.1 Typically mainstream provision for pupils with SEND has the least cost on the
central budget as a level of funding has already been delegated to support these pupils through the funding formula (notional SEN allocations).
LA funded special schools (maintained and academy) cater for the next level of complexity in needs with generally higher costs than mainstream provision, funded through fixed place funding and top up funding graduated according to need.
Non-maintained special schools (NMSS) are in the charitable sector and typically cost more than state funded special schools but less than the independent sector, the letter generally is used to place children with the most complex needs and costs can be very high.
3.3.2 Chart 3 below shows the latest (August 2017) placements by sector for Poole
compared with January 2017 and data for the national average.
Chart 3 above shows that Poole has a lower proportion (33.1%) of EHCP in mainstream schools than the average (43.5%). Conversely, Poole has a greater proportion in high cost NMSS and Independent schools (Poole at 11% with national average only 5.2%). The budget implications are that Poole is high spending compared nationally.
0% 20% 40% 60% 80% 100%
England Jan 2017
Poole Jan 2017
Poole Aug 2017
England Jan 2017 Poole Jan 2017 Poole Aug 2017
Mainstream 43.5 33.5 33.1
Special School 36.0 35.2 34.0
NMSS / Independent 5.2 12.1 11.0
Post-16 11.2 14.2 13.9
Other 4.1 5.0 8.0
Chart 3: Placement types for children with a statement or EHCP

Poole School Funding Consultation 2018-19 Children’s O&S Appendix A
54
3.4 ECH Assessment Request Trends in Poole 3.4.1 Poole’s requests for EHCP’s are now at an all time high.
This means we have had an enormous increase in our numbers of Statements/EHCP’s in 2016 (the green line) and continuing in 2017 (purple).
The number of statements/EHCP is expected to grow over the year as new children enter the system and the needs of older children change but this growth over last year was high being a total of 616 in September 2016 growing to 726 by August (18% growth over the year).
Jan Feb Mar Apr May Jun Jul Aug Sep Oct Nov Dec
2014 10 7 17 14 20 15 3 3 2 9 9 9
2015 13 10 12 6 6 14 9 2 10 5 9 14
2016 5 14 26 7 17 16 16 7 16 16 17 25
2017 13 7 15 17 19 17 19 5
0
5
10
15
20
25
30
Chart 4: Requests for EHC Assessments
Sep Oct Nov Dec Jan Feb Mar Apr May Jun Jul Aug
EHCPs 323 353 390 445 447 463 485 507 539 560 596 619
Statements 293 269 243 217 212 205 194 175 168 156 130 107
Total 616 622 633 662 659 668 679 682 707 716 726 726
0
100
200
300
400
500
600
700
Chart 5: Number of Poole Statements and EHCPs

Poole School Funding Consultation 2018-19 Children’s O&S Appendix A
55
3.5 Permanent Exclusion Trends 3.5.1 Poole also has budget pressure due to the pattern of permanent exclusions.
The summary trend is shown in Chart 6 below
3.5.2 The data shows that while the rate of permanent exclusion in Poole
decreased significantly in 2015-16 it remained above the national level and in 2016-17 increased further. National data for 2016-17 will not be available until July 2018. A separate confidential Exclusions Data Pack in Appendices A to C provides full details of exclusion trends in Poole.
3.5.3 In 2016-17 there was a total of 30 Poole pupils of secondary school age who
were permanently excluded (24 from Poole secondary schools and 6 from out borough secondary schools). Following exclusion these pupils accessed high cost education provision at the Quay School.
3.5.4 As of 30 September 2017 there were 53 pupils already identified as needing
one of the 60 places at The Quay School for Alternative Provision (AP) made up as follows:
Quay School pupils already attending at the end of the summer term 2016/17
48*
September 2017 starters 1
Pupils identified as needing a place at Quay School where a start is being arranged
3
Total number of Quay School pupils identified as at 30 September 2017
52
Total number of places available at Quay School for the remainder of the Academic year 2017/18
8
2011/12 2012/13 2013/14 2014/15 2015/16 2016/17
England 0.07 0.06 0.06 0.07 0.08
Poole 0.07 0.05 0.1 0.2 0.11 0.15
0
0.05
0.1
0.15
0.2
0.25
Chart 6: number of permanent exclusions as a percentage of the school population (source DfE to 2015/16, Poole data 2016/17)

Poole School Funding Consultation 2018-19 Children’s O&S Appendix A
56
* The 48 pupils continuing in the provision from the academic year 2016-17 include 2 pupils undergoing managed moves from Quay School to mainstream schools.
More places will become available when pupils on roll at the Quay school transfer to the roll of a new school, but these numbers are currently expected to be very low.
3.5.5 If permanent exclusions continue at the same rate in 2017-18 as they did in
2016-17 then the number of pupils needing education will exceed the 60 places available at the Quay School. This is expected to occur in December 2017/January 2018 but this may be sooner or later as it is dependant upon the rate of permanent exclusion and pupils needing AP moving in to Poole.
3.5.6 The Quay School has advised that when 60 pupils are accessing AP and the
7 Early Intervention Places are in use the school will be at capacity in all its AP and cannot admit any additional pupils. This means that when the number of pupils needing alternative provision exceeds 60 either the Early Intervention Places will need to be used for pupils permanently excluded or alternative arrangements will need to be made for their education at greater cost to the High Needs Block.
3.5.7 It is expected that the budget growth of £220k for 2017-18 will not be sufficient
if the current pattern of exclusions continues in the autumn and spring terms. The full budget for excluded pupils is already £1 million and provides for 60 (full time equivalent) pupils. Further budget growth is, therefore, likely to be needed in 2018-19.
4. BENCHMARKING SEN BUDGET AND ACTIVITY DATA 2016-17 4.1 A new benchmarking tool was provided by the DfE in July 2017. It links the
January 2016-17 SEN activity data return with the 2016-17 budget return from all LAs. Appendix D is a report providing Schools Forum with a comprehensive set of benchmarking data comparing Poole with national trends for 2016-17. The tool is to be updated later in the year with national SEN activity and budgets for 2017-18. In the meantime, the report considers only updated local information where useful.
4.2 The main points are as follows:
1. SEN placements (SEND 2 return) benchmarking has shown that Poole has a trend of faster EHCP growth than average.
2. Budget (Section 251) benchmarking each year has shown Poole to be
high cost for special educational needs placements overall.
3. The relative number of EHCP per child population in Poole remained below average at January 2016. Poole’s total per child was similar to Dorset.

Poole School Funding Consultation 2018-19 Children’s O&S Appendix A
57
Table 1 - EHCPs per 1000 of 2-18 population
Number or children per 1000 Poole England
Overall number of EHCPs 19.5 23.2
Mainstream (excludes bases) 6.9 9.7
Special Schools/Academies/Bases 8.1 10.3
NMSS & Independent 2.6 1.5
Hospital/Alternative Provision 0.2 0.1
Post 16 0.4 1.1
Other (eg early years, home educated) 1.4 0.6
Source: SEND2 data return January 2016
Compared with the national average, Poole places fewer children per 1000 child population in mainstream and state funded special schools with higher levels in NMSS and independent providers.
4. Budget allocations for top up funding to a large extent reflect the pattern of
provision by provider type.
Table 2: 2016-17 Budgets for top up funding by providers type
Budget per head (2-18 population)
Public Provider
Non Public Provider
Poole £
Average £
Poole £
Average £
Early Years 0 2 0 1
Primary Mainstream 23 48 0 6
Secondary Mainstream 12 28 0 8
Special Schools/Academies 100 101 159 52
PRU/AP 12 15 0 3
Post school 3 13 15 16
Income -1 -1 0 -1
a. Poole placements in mainstream schools are lower than typical (table1)
and so too is the budget (table 2). b. Despite Poole’s relatively low number of EHCP placements in public
sector special schools and academies (table 1) the budget for top up funding is at average level (table 2).
c. Relatively more pupils are placed in non-public sector institutions (table 1) and this is reflected in the budget (table 2).
5. HIGH NEEDS NATIONAL FORMULA 2018-19 AND 2019-20 5.1 What are the funding implications from the national high needs formula
from 2018-19?
The total of national funding allocated through the new high needs formula is largely based on the overall level of LAs spending. It reflects the transfers from the Schools Block in 2017-18 with historic funding levels guaranteed

Poole School Funding Consultation 2018-19 Children’s O&S Appendix A
58
through a funding floor. The floor is raised for each LA individually in 2018-19 and 2019-20 to reflect forecast rising pupil numbers from national statistics.
More significant increases have been provided through the new formula for low spending areas. Poole is relatively high spending due to the pattern of provision shown in Chart 3 and Table 2 above. The new formula provides less funding than current Poole budgets. There is a mechanism within the new formula to protect historic funding levels. Poole in 2018-19 will receive £855k of protected (floor) funding but this means that only small increases will be received related to demographic growth for some years.
5.2 The indicative funding allocation for Poole is shown in Table 3 below.
Table 3: Indicative High Needs National funding Formula (NFF) for Poole 2018-19 and 2019-20 - £000’s
Funding Element - £000’s Baseline NFF NFF
2017-18 2018-19 2019-20
Basic entitlement (NOR in special schools)* 1,036 1,036 1,036
Formula - pupil characteristics 13,848 14,008 14,078
Hospital Education (Quay + Independent) 906 911 915
Import/(export) adjustment * (528) (528) (528)
Total High Needs Block Funding 15,262 15,427 15,501
+165 +74
The allocations for 2018-19 and 2019-20 are indicative as those marked * reflect 2017-18 data and amounts will be updated from autumn data returns in the final Funding Settlement in December 2017.
The basic entitlement (at £4,000 per pupil) will be updated to reflect any change in pupil numbers in:
Poole special schools, as place funding is paid from the DSG of the host LA.
Independent schools and post 16 specialist placements for Poole children.
The import/export adjustment is at £6,000 per pupil and will reflect the net position between Poole as the host LA for special schools and the FE College compared with the number of Poole children placed in other LA areas.
5.3 The low growth in funding over at least the next 2 years means collective
action is needed to reverse current trends and stem further growth in the future. The next section includes future budget estimates in more detail.

Poole School Funding Consultation 2018-19 Children’s O&S Appendix A
59
6. SEND BUDGET MONITORING IN 2017-18 AND ESIMATES FOR 2018-19 AND 2019-20
6.1 Budgets are monitored monthly with reporting to Council quarterly. The latest
reported budget position for 2017-18 is at the end of September and this shows a current forecast over spend on SEND budgets of £748k.
6.2 The table below provides a summary budget 2017-18 monitoring statement and includes a forecast for 2018-19 and 2019-20. These forecasts will change as the year progresses with the best estimate for 2018-19 established by December.
Table 4: Summary SEND Expenditure - Outturn 2016-2017, Budget Monitoring 2017-18 and Forecasts for 2018-19 and 2019-20.
Budget Detail
2016/17 2017/18 2018/19 2019/20
Outturn £k
Budget £k
Forecast £k
Variance £k
Forecast £k
Forecast £k
NMSS & Independent Special
4,462 4,333 4,480 (147) 4,505 4,678
FE Independent Specialist
595 536 833 (297) 871 865
Packages (Poole & other LA)
962 959 993 (34) 1,028 1,046
Bespoke Packages & Equipment
288 269 232 37 234 234
Exceptional Circumstances
0 34 6 28 34 34
Total SEN Packages 1,250 1,262 1,231 31 1,296 1,314
Poole Special School Top-Up
2,265 2,276 2,286 (10) 2,396 2,396
Other LA Special School Top-Up
721 695 1,004 (309) 985 923
The Quay School SEN Top-Up
34 35 82 (47) 98 128
Total Top Up 3,020 3,006 3,372 (366) 3,479 3,447
Special School Outreach
227 227 227 0 227 227
Sensory Impaired Service
248 286 255 31 286 286
TOTAL 9,802 9,650 10,398 (748) 10,664 10,817
Annual Forecast increase
+596
+266 +153
+6.1% +2.5% +1.4%
6.2.1 In addition to the figures in Table 4, Place funding for Schools and FE,
(including for post 16 statements in mainstream settings) of £2,598k is paid from Poole’s DSG in 2017-18. Any increase in places for Poole children in 2018-19 and 2019-20 will be a cost to Poole’s DSG through the import/export adjustment in Table 3.

Poole School Funding Consultation 2018-19 Children’s O&S Appendix A
60
6.2.2 The outturn for 2016-17 represented a net budget deficit for SEN and this was met from a surplus in other central budgets. Actual expenditure last year is higher than the 2017-18 budget. This is due to a number of unexpected costs in the final quarter of last year that were unforeseen at the time the budget was set. These costs included enhanced support packages in mainstream schools, additional place funding as special schools became full in neighbouring LAs and increased top up rates for pupils assessed as needing greater support in special schools. A significant portion of these costs are on-going in future years.
6.2.3 There are currently 25 more pupils requiring support in the forecast for 2017-
18 than budgeted. These additional placement costs and the higher costs identified late last year are leading to the estimated £748k over spend shown in Table 4 above.
6.2.4 Placement changes and pupil movements occur often with the forecast being
updated regularly during the year. A significant element of the budget relates to placements for individual known children and takes account of leavers with a contingency included for new children requiring placements. Once children are placed it is difficult to reverse any trends as costs for individual placements will continue to be incurred annually.
7. IMPACT OF THE PRESSURE ON THE HIGH NEEDS BLOCK 7.1 The funding from the High Needs Block is allocated to meet the needs of
individual pupils identified with SEND, excluded from school and/or with health needs.
7.2 Poole Schools Forum has previously agreed to transfer funding from the
Schools Block of the DSG to the High Needs Block to support the rising cost of exclusions and to fund early intervention projects. This funding has been restored to mainstream schools through the Schools Block national funding formula in 2018-19.
7.3 The funding transfer now captured within the high needs block allocation for
2018-19 within Poole’s funding floor will be needed to support the rising costs of pupils with SEND shown in Table 4. The small increase allocated for demographic growth and the forecast rising demand also means that a potential transfer of funding from the Schools Block up to the permitted maximum estimated at £362k is also likely to be insufficient to manage all the budget pressure from exclusions and SEND unless budgets can be reduced or reprioritised.
7.4 Options include that provision for individual pupils funded from the High
Needs Block is reduced and/or stopped. Decisions could be to:

Poole School Funding Consultation 2018-19 Children’s O&S Appendix A
61
Reduce the level of outreach from special schools to mainstream schools paid centrally with potentially moving to a buy back service. This carries the risk of unsustainability.
Develop new funding mechanisms for Early Intervention Projects
Reduce the banding rates at Poole Special Schools and other LA Special Schools where possible (potentially breaking the LA agreement to adopt the host LA funding levels, a decision that could rebound on Poole special schools).
Any other options Poole School’s Forum could recommend. 7.4 Alternatively, Poole School’s Forum could agree they wish to continue with
the current service strategy as far as affordable with a transfer of funding from the Schools Block (for mainstream school funding) to the High Needs Block. Clearly, the impact of this would be less funding for the mainstream schools formula.
8. ACTIONS ALREADY BEING TAKEN BY THE LOCAL AUTHORITY 8.1 The Local Authority is putting in place the following:
Like all Local Authorities, Poole is undertaking a review to put in place a High Needs Provision Plan. ISOS have been commissioned to undertake this review on behalf of Poole and Bournemouth and their report will be used to inform the financial strategy going forward.
Reviewing all high cost placement and contacts and looking to see if a more cost effective alternative can be put in place. This however is challenging to implement and could lead to more SEND Tribunals.
Appointing a member of staff who will have a focus on reducing SEND Tribunals, mediating in complex cases and looking at further strategies to be put in place to reduce demand based on analysis of trends.
Reviewing the current decision-making panels (looking at requests for EHCP’s, support and placements) to ensure more involvement from schools.
Producing a clear handbook for all schools with detail of how the graduated response (Code of Practice 2014) should be implemented in Poole.
8.2 Alongside other LAs nationally, though the Local Government Association,
representations are being made to central Government regarding the inadequacy of high needs funding in the context of national policies.
9. CONCLUSIONS 9.1 It is clear from the data and financial analysis presented in this paper that
Poole schools and the Local Authority need to work together to ensure the most effective use of the DSG for Poole children and young people.

Poole School Funding Consultation 2018-19 Children’s O&S Appendix A
62
9.2 It is therefore proposed that a task and finish group of representatives from
Poole School’s Forum meet to consider what other plans/strategies might be considered.
Report Authors and Vicky Wales Contact Officers: Head of Children, Young People & Learning Tel: 01202 262261 Teresa Jones Senior Manager - SEND Children, Young People & Learning Tel: 01202 262259 Nicola Webb Head of Accountancy Financial Services Tel: 01202 633296

Poole School Funding Consultation 2018-19 Children’s O&S Appendix A
63
Appendices A to C have been distributed to Schools Forum members as a confidential data pack and are therefore not available as part of this report.
Poole School Funding Consultation 2018-19 Children’s O&S Appendix A
64
Appendix D
Poole - Benchmarking SEND Budget 2016/17
This short paper reviews the latest benchmarking information provided by the DfE. It is been provided to help LAs understand their EHCPs education provision within the financial context of budgeted expenditure and high needs funding proposals. Comparison with Bournemouth has been included for additional context. The cost of SEND provision is continuing to rise annually, funding in the future is not expected to rise significantly (if at all) and Poole is known to be already relatively high spending compared nationally. The profile of provision in Poole, therefore, needs to be considered urgently and this will form the major part of the work in the SEND review to be published by the end of the financial year. However, the budget context is now urgent and needs to be considered now ahead of the outcome of the planned review.
1. SEN Benchmarking Summary – Poole Compared with Bournemouth and all England Average A. Introduction SEND placements (SEND 2 return) benchmarking has shown that Poole has a trend of faster EHCP growth than average. Budget (Section 251) benchmarking each year has shown Poole to be high cost for special educational needs placements. These 2 data sets have been illustrating why Poole SEN budgets have been rising and becoming unsustainable without transferring funding from schools. National comparisons are particularly relevant within the context of increased ring-fencing of the School Block within the DSG and high needs allocations to the LA being made according to a national formula from 2018/19. Poole can expect to be in the high needs funding floor for some years as historic funding is protected and with only small increases to reflect rising pupil numbers over the next 2 years. In July 2017 the DfE brought the above 2 data streams together in a new benchmarking tool using information for 2016/17. It compared LA placements for children with EHCPs at January 2016 (from the SEND2 return) expressed as the number per head of child population across provision types. This information was presented alongside budget information for 2016/17. The two data sets should be highly correlated, and therefore useful in helping LAs better understand their relative costs. Poole can use this to make an early start in establishing what changes need to be considered to reduce costs as part of the SEN review. B. EHCP/Statement Trends 2013-2017 (SEND2 returns) In previous benchmarking reviews Poole had a relatively high level of EHCPs growth compared nationally. In the 5 year period up to January 2017, Poole’s number of EHCP has increased by 37% compared with the national average of 23%. Some of this increase (local and national) is due to the changes in funding

Poole School Funding Consultation 2018-19 Children’s O&S Appendix A
65
responsibility from 2015 for post 16 pupils post school (that is, not in mainstream or special schools). Table 1 below shows the trend in the number of EHCP over a 5 year period 2013-2017. It does not relate the number of EHCP maintained to child populations (this is considered in the new benchmarking tool below in section C) showing only trends.
Table 1 – Numbers of ECHP 2013-2017
2013 2014 2015 2016 2017
5 year Growth
Poole 480 485 510 555 659 37%
Year on year growth 1.0% 5.2% 8.8% 18.7%
Bournemouth 665 680 705 750 858 29%
Year on year growth 2.3% 3.7% 6.4% 14.4%
England 233,430 237,110 240,185 256,315 287,290 23%
Year on year growth 1.6% 1.3% 6.7% 12%
LAs became responsible for funding post 16 EHCPs in post school provision (FE and Independent Specialist providers) in 2015 with DfE budgets transferred to the DSG (it was assumed LAs could make savings). Special school provision for post 16 was already being met from the DSG. Table 2 below shows where pupils with EHCP are placed (as a proportion of the total) and shows the trend over the last 5 years. It also provides a comparison of the latest return (January 2017) with the English average. Table 2 – Poole Placements Trend 2013-2017
Placements/Proportion 2013
% 2014
% 2015
% 2016
% 2017
% England 2017 %
Mainstream – Public 38.5 39.3 38.8 35.3 33.0 36.4
Mainstream – Private 0.5 1.1
Special & Bases 43.5 43.0 42.5 41.4 35.2 42.0
NMSS & Independent 16.8 15.8 16.7 13.6 12.1 5.2
Hospital/AP 0 1 0 0.7 0.8 0.8
Early Years Settings X 0 0.6 X 0.3 0.4
Post 16 – FE Not LA funding responsibility
1.3 11.5 10.1
Post 16 - Specialist X 2.7 1.1
Other * 0.8 0.6 1.4 6.9 3.8 2.9
Awaiting Provision x
Total 100% 100% 100% 100% 100% 100%
x mean– less than 0.05% so nil when rounded *Other includes children educated at home. The change in funding responsibility in 2015 will reduce the proportion of overall placements in existing providers in the initial rows in the table as post school providers are now included. As EHCPs also now continue up to aged 25 the proportion allocated to post school providers will continue to grow for several years, with the comparison with the latest England average being the more relevant trend.

Poole School Funding Consultation 2018-19 Children’s O&S Appendix A
66
The 2017 data shows the same profile as the 2016 data used in the new benchmarking tool (in Section C). During 2016 there was an increase in EHCPs issued for mainstream pupils requiring no additional funding (cost less than £6,000). C. Relative number of EHCP and Placement Profile 2016 The relative number of EHCP per child population in Poole remained below average at January 2016. Poole’s total per child is similar to Dorset. It had been known, however, that Poole placements in mainstream schools were lower than typical. This means more pupils are placed in higher cost specialist provision, and particularly within non-public sector institutions which tend to be the most expensive. Table 3 - EHCPs per 1000 of 2-18 population
Number or children per 1000 Note Poole Bournemouth England
Overall number of EHCPs (chart 1) 1 19.5 low 22.8 average 23.2
Mainstream (excludes bases) 2 6.9 very low 8.5 low 9.7
Special Schools/Academies/Bases 3 8.1 low 9.6 10.3
NMSS & Independent 4 2.6 high 2.4 high 1.5
Hospital/Alternative Provision 0.2 0 0.1
Post 16 5 0.4 low 1.5 high 1.1
Other 6 1.4 high 0.6 0.6
Source: SEND2 data return January 2016 1. Poole and Bournemouth overall numbers reflect relative demographics. 2. Both have relatively low numbers in mainstream schools. 3. Both have relatively low numbers in publicly funded special schools and
mainstream bases. 4. Both have high numbers in Non Maintained Special Schools (NMSS) and
Independent Schools. 5. Poole is low on post 16 (staying on in special schools). Bournemouth has
instead the Linwood provision. 6. Other includes education at home and early years D. Place Funding The benchmarking tables include place funding but these are less relevant to EHCP trends as all special school places are paid for by the host Authority (ie including places used cross border). The charts also include AP places for hospital education (also includes cross border pupils so Poole will be high compared nationally as not all Local Authorities provide) and for permanently excluded pupils unrelated to EHCPs.
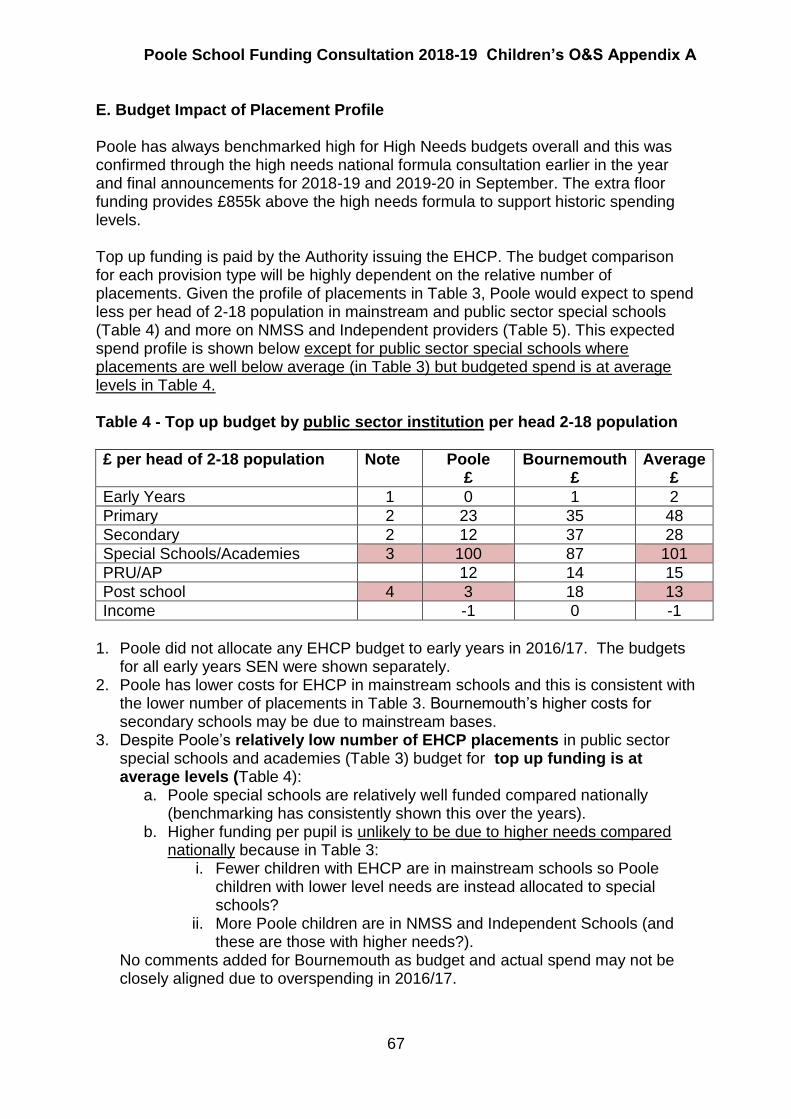
Poole School Funding Consultation 2018-19 Children’s O&S Appendix A
67
E. Budget Impact of Placement Profile Poole has always benchmarked high for High Needs budgets overall and this was confirmed through the high needs national formula consultation earlier in the year and final announcements for 2018-19 and 2019-20 in September. The extra floor funding provides £855k above the high needs formula to support historic spending levels. Top up funding is paid by the Authority issuing the EHCP. The budget comparison for each provision type will be highly dependent on the relative number of placements. Given the profile of placements in Table 3, Poole would expect to spend less per head of 2-18 population in mainstream and public sector special schools (Table 4) and more on NMSS and Independent providers (Table 5). This expected spend profile is shown below except for public sector special schools where placements are well below average (in Table 3) but budgeted spend is at average levels in Table 4. Table 4 - Top up budget by public sector institution per head 2-18 population
£ per head of 2-18 population Note Poole £
Bournemouth £
Average £
Early Years 1 0 1 2
Primary 2 23 35 48
Secondary 2 12 37 28
Special Schools/Academies 3 100 87 101
PRU/AP 12 14 15
Post school 4 3 18 13
Income -1 0 -1
1. Poole did not allocate any EHCP budget to early years in 2016/17. The budgets
for all early years SEN were shown separately. 2. Poole has lower costs for EHCP in mainstream schools and this is consistent with
the lower number of placements in Table 3. Bournemouth’s higher costs for secondary schools may be due to mainstream bases.
3. Despite Poole’s relatively low number of EHCP placements in public sector special schools and academies (Table 3) budget for top up funding is at average levels (Table 4):
a. Poole special schools are relatively well funded compared nationally (benchmarking has consistently shown this over the years).
b. Higher funding per pupil is unlikely to be due to higher needs compared nationally because in Table 3:
i. Fewer children with EHCP are in mainstream schools so Poole children with lower level needs are instead allocated to special schools?
ii. More Poole children are in NMSS and Independent Schools (and these are those with higher needs?).
No comments added for Bournemouth as budget and actual spend may not be closely aligned due to overspending in 2016/17.

Poole School Funding Consultation 2018-19 Children’s O&S Appendix A
68
4. Post schools (public sector) spend in Poole is low as there is little access to
public providers with few placements shown in Table 3 and therefore low spend in Table 4. To start addressing this imbalance, new provision is to be funded at B&P College for 2017/18 for ex Winchelsea pupils at post 16. Bournemouth is placing in Linwood’s provision designated as post school so costs are more at average levels.
Table 5 - Top up budget by non – public sector institution per head 2-18 population
£ per head of population Note Poole £
Bournemouth £
Average £
Early Years 1 0 0 1
Primary 1 0 0 6
Secondary 1 0 0 8
Special Schools 2 159 105 52
PRU/AP 0 0 3
Post school 3 15 0 16
Income 0 0 -1
1. Locally nothing in budget for 2016/17 but parents paying independent school
fees have started approaching Councils for SEN top up. 2. Higher budget as expected from relatively high number of pupils placed (Table 3)
in both Poole & Bournemouth. Note guidance states DSG is not to be used to fund special school placements post 19. In the same guidance the DfE have encouraged institutions to set up separate provision for EHCPs post 19.
3. Bournemouth is using Linwood post school provision instead of independent providers.
F. Indicative Benchmarking for 2017/18 Budgets (Draft issued by DfE for S.251 Budget checking on 17 July 2017) Table 6 – SEN Top up Budgets 2017/18
Per 0 - 19 Child Population Poole Average
Public Sector Schools 137 188
NMSS and Independent 143 79
Budget Profile for Poole in 2017/18 compared with England Average (mean) is similar to the 2016/17 profile. Note that the two data sets are not directly comparable as the data for 2016/17 (Tables 4 and 5), has the denominator is 2-18 child population but in the 2017/18 budget information the denominator is all children 0-19.

Poole School Funding Consultation 2018-19 Children’s O&S Appendix A
69
Appendix 7
Summary of Consultation Questions
Minimum Funding Guarantee
1 Do you agree the MFG should be set with little reduction in per pupil funding in 2018-19 (MFG set close to 0%) to allow more time for the small number of schools with per pupil funding below the new formula to make budget adjustments?
2 Do you agree the MFG should continue again at minus 1.5% in 2019-20 as funding cannot be protected for ever and data movements need to be reflected in funding?
Funding Floor
3 Do you agree that extra funding should be provided on top of the needs-led formula for schools where pupil characteristic funding is low, through the introduction of a per pupil funding floor?
4 If the local formula should include a per pupil floor, how should the level of the
funding floor be set for each phase:
(a) At the level of National Formula as in option 1
(b) At a level in 2018-19 to provide a % increase similar to the maximum applicable to other schools as in option 2.
(c) Can you suggest an alternative option to consider?
Please provide the rationale for your preference
5 If the local formula is to set a floor below the National Formula level or not set a floor at all, how should the funding released be redistributed.
Please rank options and provide rationale
Options Rank
Raise the cap for schools not receiving their full formula allocations
Increase a factor unit value - please specify
Transfer funding to support pupils with high needs
Other option to be specified
Local Formula Principles, Factors and Methodology
6 Should Poole as a principle use factors and data in the local formula in the same way as the DfE national formula (option 1) or continue to use some local differences if there is still a clear rationale for doing so (option 2)?
7 Do you agree the local formula should introduce the use of FSM (annual) alongside FSM (ever 6) as in the National Formula?

Poole School Funding Consultation 2018-19 Children’s O&S Appendix A
70
8 Do you agree we should adopt the National Formula approach and stop scaling back EYFSP data for years 1 to 5 to the level of the previous measure (now applicable only for year 6).
9 Do you agree we should continue to maintain LAC funding in the local formula
to broadly maintain the 2017-18 funding level between the delegated LAC
(£600) factor and increase in the Pupil Premium (£400)?
10 Should we adopt the National Formula approach and use EAL 3 rather the current EAL 2?
11 Whichever data set is selected should we reduce the funding allocated to EAL to the level allocated through the National Formula?
Formula Adjustment for a Transfer to High Needs (if agreed)
12 Do you agree with the principle that if a funding transfer takes place and less funding is available for the mainstream school formula, all schools should make a contribution through a lower budget allocation than would otherwise have been the case?
13 If you agree that all schools should make a contribution, do you agree with the approach outlined in Table 10?
Unit Values
14 Do you agree with how unit values in Table 11 have been updated (excluding the floor factor which is considered in section 3.4)?
Managing Affordability
15 Do you agree that to manage any shortfall in funding the threshold for the cap should be lowered as the first step followed by a reduction in the unit values for Low Prior Attainment funding as described?
16 Do you agree that to allocate any excess funding the unit values for Low Prior Attainment factors should be uplifted as an equal amount per pupil?
Growth Fund
17 Do you agree with the approach to the Growth Fund in 2018-19 and allocation methodology between schools?
18 Do you agree with the general approach for secondary school basic need growth in 2019-20?
Transfer of Funding To High Needs
19 Would you support a transfer of funding to high needs of up to 0.5% of school funding (£372k)?

Poole School Funding Consultation 2018-19 Children’s O&S Appendix A
71
20 Would you support a transfer of funding to high needs of up to 1% of school funding (£744k)?
21 Would you support a transfer of funding to high needs above 1% of school funding?
22 Would you support a transfer of funding to continue the Early Intervention Projects (applicable only after SEN and permanent exclusion budgets have been balanced)?
Funding transfer level Yes No Unsure
Within a 0.5% transfer
Within a 1.0% transfer
Within greater than 1% transfer
23 If Schools Forum is unable to agree a transfer of sufficient funding to maintain current levels of the high needs budgets please rank preferences of budgets that you would prefer to be maintained as far as affordable.
High Needs Budget Area Rank
Mainstream School top up funding rate
Outreach Services (alternative of buy back)
Special Schools top up funding
Early Intervention Projects
24 Do you have any comments on the budgets in the LA Central Services Block?

Poole School Funding Consultation 2018-19 Children’s O&S Appendix A
72
Appendix 8
SCHOOL AND LOCAL AUTHORITY FUNDING GLOSSARY OF KEY NATIONAL AND LOCAL TERMS
ACRONYM TITLE DEFINITION
ACA Area Cost Adjustment
A weighting applied by the Government to local government areas to reflect differences in the costs of inputs required, such as pay expenditure.
AP Alternative Provision
Education for pupils:
Due to permanent exclusion, illness or other reasons, would not otherwise receive a suitable education.
On a fixed period exclusion. Being directed by schools to off-site provision
to improve their behaviour or requiring a different curriculum offer.
AWPU Age Weighted Pupil Unit
Funding allocated within the local schools funding formula to reflect age group entitlement difference for primary and secondary aged pupils. A mandatory factor in the local schools funding formula termed Basic Entitlement.
CAP Capping
Formula ceiling that can be set within the local schools funding formula to reduce increases for schools gaining in school budgets between years. This has to be set on a per pupil basis unique to each Local Authority and it cannot clawback more than is required in cash terms to finance the Minimum Funding Guarantee.
DSG Dedicated Schools Grant
National grant allocated to fund the provision of all schools, providers and other central services. Its deployment and grant conditions are prescribed in The School and Early Years Finance (England) Regulations.
ESFA Education & Skills Funding Agency
An executive agency of the DfE responsible for the funding of all state provided education from 2 to 19.
ESG Education Services Grant
Previously paid by the ESFA on a per pupil basis to:
Local Authorities for retained duties for all maintained schools and academies.
Local Authorities for general duties for maintained schools only.
Academies directly for general duties.
EYB Early Years Block That part of the DSG notionally allocated by the DfE for Early Years provision.
EYFSP Early Years Foundation Stage Profile
National standards set by the DfE for the learning, development and care of children from birth to aged 5.

Poole School Funding Consultation 2018-19 Children’s O&S Appendix A
73
ACRONYM TITLE DEFINITION
FSM Free Schools Meals
Pupils can qualify for such support subject to meeting national benefits entitlement criteria. One of the deprivation factors in the local school funding formula, which must contain at least one deprivation measure.
FY Financial Year Local Authority year from 1st April to 31st March. Also funding year for maintained schools.
HNB High Needs Block That part of the DSG for pupils requiring high needs provision and to fund central special needs support services.
IDACI
Income Deprivation Affecting Children Index
A national index of deprivation measuring in a local area the percentage of children under age 16 that live in low income households. One of the deprivation factors in the local school funding formula, which must contain at least one deprivation measure.
ISB Individual Schools Budget
The part of the DSG delegated as budget shares to individual schools and providers.
KS1 Key Stage 1 School year groups Reception to Year 2 (Age 4 to 6).
KS2 Key Stage 2 School year groups Year 3 to Year 6 (Age 7 to 10).
KS3 Key Stage 3 School year groups Year 7 to Year 9 (Age 11 to 13).
KS4 Key Stage 4 School year groups Year 10 to Year 11 (Age 14 to 15).
KS5 Key Stage 5 School and FE provider year groups Year 12 to Year 13 (Age 16 to 18).
LAC Looked After Child A child in the care of a Local Authority.
LPA Low Prior Attainment
Pupils designated as not reaching the required national standards as defined by the DfE:
Primary – not achieving the expected level of development within the EYFSP (pre and post 2013).
Secondary – not reaching level 4 in KS2 English or Maths.
LSFF Local Schools Funding Formula
The methodology within the APT for calculating and allocating budget shares to all mainstream schools – maintained and academies – within the parameters and datasets prescribed by the DfE.

Poole School Funding Consultation 2018-19 Children’s O&S Appendix A
74
ACRONYM TITLE DEFINITION
MFG Minimum Funding Guarantee
Percentage set locally from 2018-19 within EFSA parameters to guarantee changes in school budgets between years on a per pupil basis cannot reduce below a prescribed level.
NMF National Minimum Formula
LA Schools Block Formula introduced in 2015-16 to increase the per pupil funding for low funded LAs up to a national minimum (floor) to provide time for the NFF to be developed.
NSEN Notional SEN
An amount determined by each Local Authority via proxy indicators for each school within the school budget share local schools funding formula to support SEN.
NFF (NF in this document)
National Fair Funding Formula
Announced national arrangement from 2018-19 to cease the previous funding inequities between Local Authorities and individual schools.
NOR Number on Roll Actual pupils at each school on the national designated termly census dates (January, May and October).
NMSS Non Maintained Special Schools
Schools for high needs pupils not maintained by Local Authorities and not in the fully Independent Sector
PAN Published Admission Number
The number of new pupils that can be admitted at the start of each school year in the schools admission year group.
PGF Pupil Growth Fund
Subject to strict criteria, funding that can be operated outside of the local schools funding formula to support pupil growth for basic need, re-opening, diseconomy and reorganisation costs.
PP Pupil Premium Specific grant from the DfE allocated on national rates to support pupils eligible for FSM, service children, LAC and those adopted from care.
PVI Private, Voluntary and Independent Providers
Non-maintained early years providers. The nationally prescribed free entitlement provision for deprived 2 year olds and 3 and 4 year olds of 15 or 30 hours weekly provision for 38 weeks is funding from the EYB DSG on actual take up.
SB Schools Block That part of the DSG allocated by the DfE for pupils in mainstream schools.
SBGUF Schools Block Guaranteed Unit of Funding
The per pupil amount of the DSG allocate by the DfE and used to calculate the total SB DSG.
Note: Some of the terms in this glossary have not been used in this document but are included within DfE supporting information to which schools may refer in considering this consultation.