book review: - lahore school of · web viewthe lahore journal. of. economics. lahore school of...
TRANSCRIPT

THE LAHORE JOURNAL
OFECONOMICS
Lahore School of Economics
Haq Nawaz Shah An Analysis of Economies of Scope in Irrigated Agriculture in the Punjab (Pakistan)
M. Aslam Chaudhary and Farzana Naheed KhanEconomic and Social Determinants of Child Labour: A Case Study of Dera Ismail Khan, Pakistan
Karamat Ali and Rana Ejaz Ali Khan Private Schooling-A Quality PuzzleSalman AhmadPerformance of
Muhammad Akram, Lubna Shahnaz and SurayyaAn Analysis of Male Internal Migration and Its Correlation to Employment Status: Evidence from the Punjab
Review Essay:Shalendra D. SharmaThe IMF and the Argentine Meltdown - What Went Wrong and the Lessons Learnt
Book Reviews:

Commercial Banks in Pakistan: A Study in Risk Analysis
Haroon Jamal On the Estimation of an Absolute Poverty Line: An Empirical Appraisal
Qais AslamThe Future in Perspective
Rukhsana Shah Trade, Technology and International Competitiveness
Volume 7, No.2 July-Dec, 2002
THE LAHORE JOURNALOF
ECONOMICS
Editorial Board
Dr. Shahid Amjad Chaudhry EditorProf. Viqar Ahmed EditorDr. Salman Ahmad EditorMs. Nina Gera Co-Editor
Editorial Advisory BoardDr. Rashid AmjadDr. Pervez TahirDr. Khalid AftabDr. A. R. KemalDr. Moazam MehmoodDr. Naved HamidDr. Tariq Siddiqui
Dr. Munir AhmadDr. Nasim Hasan ShahDr. Sarfraz QureshiDr. Shahrukh Rafi KhanDr. Akmal HusainTariq HusainDr. Aslam ChaudhryDr. Nuzhat Ahmad
Editorial Staff: Tele. No:5876065 Ext. 153Telefax: 0092 - 42 - 5714936E-mail: [email protected]
Publisher : Lahore School of Economics, Lahore, Pakistan.
Correspondence relating to subscriptions and changes of address should be sent to The Lahore Journal of Economics, 105-C-2, Gulberg III, Lahore - 54660 - Pakistan
Instructions to authors can be found at the end of this issue. No responsibility for the views expressed by authors and reviewers in The

Lahore Journal of Economics is assumed by the Editor, the Co-Editor and the Publishers.
Copyright by: Lahore School of Economics
72002


THE LAHORE JOURNAL OF ECONOMICSContents Vol. 7, 2002
An Analysis of Economies of Scope in Irrigated Agriculturein the Punjab (Pakistan) 1
Haq Nawaz Shah
Economic and Social Determinants of Child Labour:A Case Study of Dera Ismail Khan, Pakistan 15
M. Aslam Chaudhary and Farzana Naheed Khan
Private Schooling-A Quality Puzzle 41Karamat Ali and Rana Ejaz Ali Khan
Performance of Commercial Banks in Pakistan:A Study in Risk Analysis 65
Salman Ahmad
On the Estimation of an Absolute Poverty Line:An Empirical Appraisal 77
Haroon Jamal
An Analysis of Male Internal Migration and Its Correlation toEmployment Status: Evidence from the Punjab 93
Muhammad Akram, Lubna Shahnaz and Surayya
Review Essay:The IMF and the Argentine Meltdown -What Went Wrong and the Lessons Learnt 109
Shalendra D. Sharma
Book Reviews:The Future in Perspective 119
Qais Aslam
Trade, Technology and International Competitiveness 127Rukhsana Shah

Haq Nawaz Shah
An Analysis of Economies of Scope in Irrigated Agriculture
in the Punjab (Pakistan)
Haq Nawaz Shah*
Abstract
In this paper scope economies for a sample of 387 farms in the Punjab province of Pakistan were estimated using nonparametric techniques and sources of economies of scope were determined by using econometric techniques. The result indicated that diversified farming in crop, livestock and custom hiring enterprises results in cost savings of 17.81% for all enterprises, 17.36% in the crop sector, 15.84% in the livestock sector and 1.90% for custom hiring. Econometric results indicate that overall economies of scope are inversely related to farm size, positively to location of farms nearer to the head reaches of canals and positively to the amount of capital used on a farm. The existence of Scope economies in Pakistan agriculture implies that production functions in agriculture are interdependent and the effects of Government policy of setting support prices of individual crops may affect resource allocation with respect to other crops on the same farms.
Introduction
Analysis of economies of scope is used to determine the cost savings associated from producing multiple products rather than specialising in a single product by a firm. Baumol, Panzar and Willig (1981) state that economics of scope are necessary for the existence for multi-product firms. They state that if joint production is not cheaper than production in a specialised way, the specialised firms will drive the diversified firms out of business. Widespread *The author is part of the visiting faculty, Department of Economics, Government College, Lahore.The author is grateful to Punjab Economic Research Institute (PERI) Lahore, for providing the data and to Prof. Dr. Alien M. Featherstone of Kansas State University, Manhattan, KS, the U.S.A., for programming this problem on GAMS.
1

The Lahore Journal of Economics, Vol.7, No.2
existence of multi-product farms, particularly the small ones, in developing countries may be explained through the benefits of economies of scope. From a technical point of view, the existence of economies of scope in the long run reflects technological interdependence among production functions. From a policy point of view, existence of economics of scope implies that the effects of a policy affecting the technology, output, or price of one of the products will be transmitted to other products.
In Pakistan, the government sets the support price of a crop on the basis of the cost of production of that crop1. Ali (1990) studied the supply response of five major crops to the government procurement prices2. Using a multi-output model for the period 1957-1986, he found that “a price policy based on the single crop cost of production is faulty because it does not take into account the cross effects on the production of other crops” (op. cit, p.323).
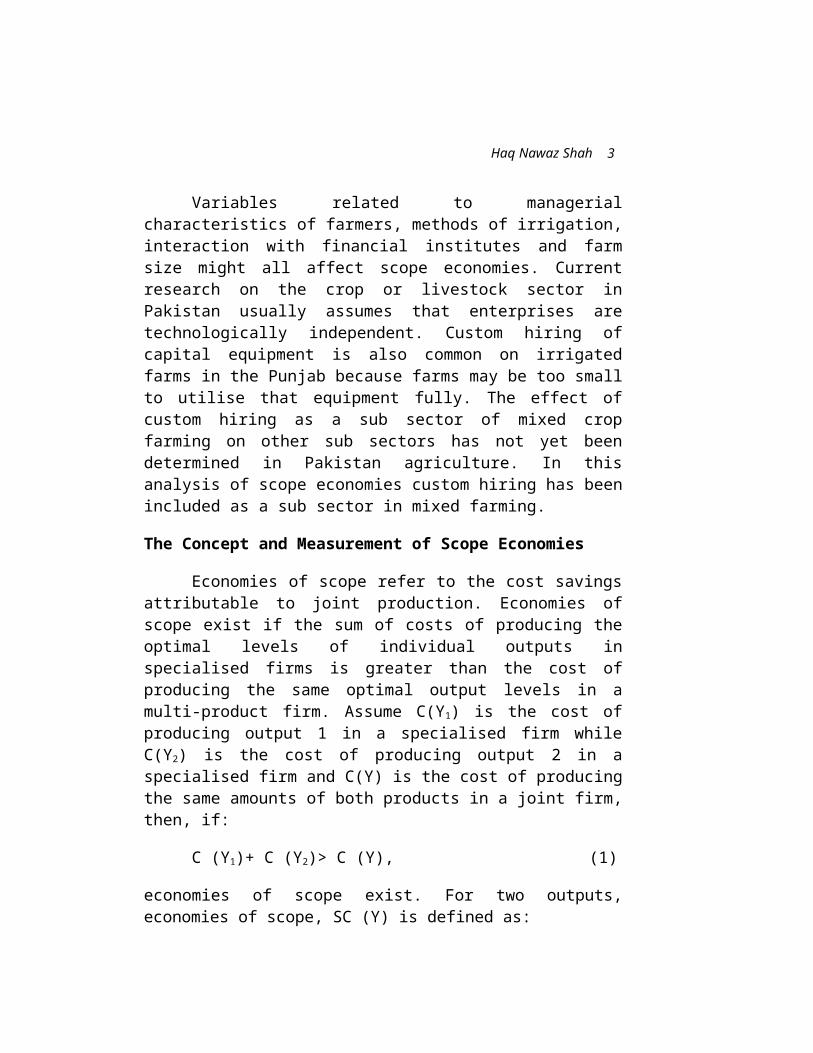
Variables related to managerial characteristics of farmers, methods of irrigation, interaction with financial institutes and farm size might all affect scope economies. Current research on the crop or livestock sector in Pakistan usually assumes that enterprises are technologically independent. Custom hiring of capital equipment is also common on irrigated farms in the Punjab because farms may be too small to utilise that equipment fully. The effect of custom hiring as a sub sector of mixed crop farming on other sub sectors has not yet been determined in Pakistan agriculture. In this analysis of scope economies custom hiring has been included as a sub sector in mixed farming.
The Concept and Measurement of Scope Economies
1 Support prices for different crops are recommended to the Government of Pakistan by a semi-autonomous body called the Agriculture Prices Commission (APCOM). The policy of APCOM is that the recommended price should be such that it covers at least the expenses involved in raising the crops.2 Wizarat (1981), Pinkney (1989), and Ali (1990) found that Pakistani farmers are responsive to price incentives.
2
Haq Nawaz Shah
Economies of scope refer to the cost savings attributable to joint production. Economies of scope exist if the sum of costs of producing the optimal levels of individual outputs in specialised firms is greater than the cost of producing the same optimal output levels in a multi-product firm. Assume C(Y1) is the cost of producing output 1 in a specialised firm while C(Y2) is the cost of producing output 2 in a specialised firm and C(Y) is the cost of producing the same amounts of both products in a joint firm, then, if:
C (Y1)+ C (Y2)> C (Y), (1)
economies of scope exist. For two outputs, economies of scope, SC (Y) is defined as:
SC (Y) =
C(Y1) + C(Y2) – C(Y)C(Y)
(2)
If SC(Y) is greater than zero, economies of scope exist. Economies of scope can be estimated by using parametric or non-parametric methods. Chavas and Aliber (1993) introduced a non-parametric approach for estimating economies of scope. They found that the crop and livestock sectors enjoyed fairly large economies of scope. They also found that economies of scope were inversely related to farm size. Following Chavas and Aliber (1993), the following model is specified for this data:
Minimize Cp(Y)=
N
N=1
PpnXpn
Subject to
(i)K
K=1
ZkXkm ≤ Xpn, n = 1,…..,N
(ii)K
K=1
ZkYK1 ≥ Ypi, i = 1,…..,M
3

The Lahore Journal of Economics, Vol.7, No.2
(iii)K
K=1
Zk = 1 k = 1,…..,K
(iv) Zk ≥ 0, For all k, (3)
In this model Cp(Y) is the minimum cost to produce the ith output of farm p, (i=l,2,....,M), Ppn is the price of farm p's input n, and x is the optimum use of input n for farm p to produce its bundle of outputs. The variable Zk is the intensity of the use of farm k's technology where k ranges from 1 to K. The intensity variables are used to construct the frontier technology set and are constrained to sum 1. The constraint allows the cost function to exhibit variable returns to scale. This linear programming model is solved for each farm in the sample and measures the minimum cost of producing the current bundle of outputs. To calculate the cost of producing only one output or a subset of that output, the constraint set (ii) in equation (3) is adjusted. For example, to calculate the cost of producing only output 1, the constraint set (ii) in equation (3) would be indexed for i=l. To calculate the cost of producing output 2 through M, the constraint set (ii) in equation (3) would be indexed for i=l,..., M. The minimum cost of producing any combination of output bundles in subsets or individually can be calculated by resolving this linear programming problem after adjusting the output constraint (ii).
Economies of scope are measured at the optimal level of output, which is obtained when a firm is producing on the frontier and no slack inputs and outputs exist. If slacks exist, they have to be adjusted before the nonparametric economies of scope models are solved. Testing for slacks can be thought of as testing for the sufficient conditions. Banker, Charnes and Cooper (1984) suggest a two-step procedure for testing if slacks in outputs and inputs exist. For this purpose, first the following linear programming model is solved:
Maximize hp=
M
m=1
m ypm
Subject to
4

Haq Nawaz Shah
(1)N
n=1
nXpn= 1,
(2)M
m=1
m ykm N
n=1
nXpn ≤ 0 k = 1,…..,K,
(3) m , n m,n,
(4) 0. (4)
In this model, Xkn is the nth input used by the kth production unit, ykm is the mth output produced by the kth production unit, m and n are constants, the subscript p represents the production unit whose efficiency is being measured relative to the whole sample and is a small "non-Archimedean" quantity. Next solve the following model:
Minwp=(p – [
N
n=1
Sn
+
M
m=1
Sm+])
Subject to
(i) O = pXpn K
k=1
Zk Xpk Sn n = 1,….N,
(ii) ypm =
K
k=1
yp
m
Zk – S +m, m = 1,
….M,
(iii) Zk , S -
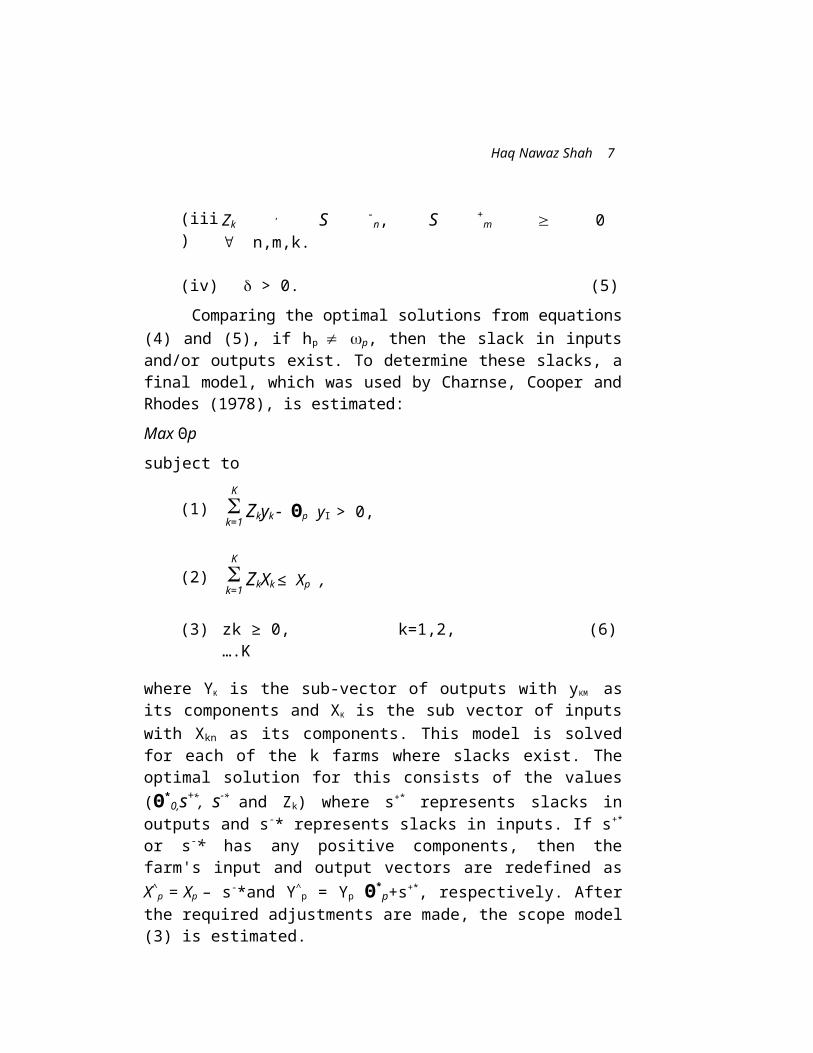
n, S +m 0 n,m,k.
(iv) > 0. (5)Comparing the optimal solutions from equations (4)
and (5), if hp p, then the slack in inputs and/or outputs exist. To determine these slacks, a final model, which was used by Charnse, Cooper and Rhodes (1978), is estimated:
5

The Lahore Journal of Economics, Vol.7, No.2
Max Θpsubject to
(1)K
k=1
Zkyk Θp yI > 0,
(2)K
k=1
ZkXk ≤ Xp ,
(3) zk ≥ 0, k=1,2,….K
(6)
where YK is the sub-vector of outputs with yKM as its components and XK is the sub vector of inputs with Xkn as its components. This model is solved for each of the k farms where slacks exist. The optimal solution for this consists of the values (Θ*
0,s+*, s-* and Zk) where s+*
represents slacks in outputs and s-* represents slacks in inputs. If s+* or s-* has any positive components, then the farm's input and output vectors are redefined as X^
p = Xp – s-*and Y^p = Yp Θ*
p+s+*, respectively. After the required adjustments are made, the scope model (3) is estimated.
Description of Data, Sample and Variables
The data used in this analysis were obtained from Punjab Economic Research Institute (PERI)3 which collected it in the crop year May 1990 to April 1991 from five districts (Vehari, Khanewal, Multan, Faisalabad and Gujrat) located in the central part of the Punjab for a benchmark survey for an irrigation project. In this study data of only 387 farms is included which produced the following crops: cotton, wheat, rice, sugarcane and corn. These crops covered 90 percent of cropped area of sample farms. They are also the major crops of irrigated agriculture in the Punjab. Appendix Tables 1 and 2 provide a summary of the 33 PERI had already published a report on this data before this data set was obtained from them. See S.A. Shahid, M. Ul-Haq, and M.J. Khan (1992) Benchmark Survey of Irrigation Systems Management and Rehabilitation Project Phase II In Punjab (Pakistan), Lahore, Punjab Economic Research Institute.
6
Haq Nawaz Shah
socio-economic characteristics of farms and their operators. 200 sample farmrs were not literate. The family size averaged 8.79 members resulting in availability of substantial family labour. On average, 129 man-days of total labour per acre were used, with 111 man-days contributed by family labour. The average cropping intensity on sample farms was 156% of cultivated area. The average farm size was 8.70 acres. Only 3.88% of farms exceeded 25 acres. Most of the irrigated area is either canal irrigated only, or tube-well irrigated only.
Appendix Table 3 gives a general categorisation of inputs used in this study. Following Grabowski and Pasurka (1988) the capital stock was measured as the total value of livestock, machinery, implements and buildings, capital input was measured as a flow variable by adding the return to farm capital to the average depreciation cost of farm assets. Buildings were assumed to depreciate at 2% per year, machines and their implements at 10% and hand tools at 20%. The return to farm capital was calculated at 10.59% that was the weighted average rate of interest on all scheduled bank advances in 1991 [GOP (1994), Table 7.7, Statistical Appendix]. Hired labour was measured in man-days hired, family labour in adult male units of full time farmers in the family working for the whole year. Family labour was valued at the wage rate of hired labour. Inputs for livestock consisted of only purchased inputs. It was assumed that all fodder crops produced by sample farms were fed to animals and included as an input.
Outputs used in the study were classified into three categories: (a) crops, (b) livestock, and (c) custom hiring services. The latter represent the family's non-labour resources (land, tractors, and tube-wells). Livestock production consisted of milk and non-milk outputs. The third output consisted of custom hiring of land and farm machinery services that is quite common in the sample area. The number of sample farmers producing different outputs is given in Table 2. In this sample, crops contributed 71%, livestock products 25%, and custom hiring 4% of the total farm revenue. Similarly, the inputs
7
The Lahore Journal of Economics, Vol.7, No.2
were aggregated in the categories as shown in Table 3. For the purpose of aggregation, each input and output prices were normalised on their mean price. Solution of the linear programming model showed that slacks in inputs or outputs existed for 11 farms. The input and output quantities for these farms were adjusted before the economies of scope measures were calculated.
Measures of Scope Economies for the Sample Farms
The means for estimated scope economics are presented in Table 1 below.Table 1: Estimates of Scope Economies on Sample
Farms
Measure of Scope Economy
Mean Standard
Minimum
Maximum
Overall 0.1781 0.1166 -0.5259 0.5663Animal Products 0.1584 0.1142 -0.5259 0.4756Crops 0.1736 0.1140 -0.5259 0.5613Custom Hiring 0.0190 0.0600 -0.5970 0.2886
For the sample as a whole, the average economies of scope (i.e., average reduction in cost due to diversification) equals 17.81% for diversified farming, 1.90% for custom hiring, 17.36% for the crop sector and 15.84% for the livestock sector. Thus, on average, diversification results in a 17.81% reduction in costs when compared to specialised farming operation. In this sample, 17 farmers produced only crop outputs, so they were specialised and had, by definition, a scope measure of zero. Out of the 370 farmers who had mixed farming, one farmer obtained diseconomies of scope, whereas all others had economies of scope. These results show that in Punjab agriculture, there are substantial economies of scope, particularly from the crop and livestock enterprises. Economies of scope due to the livestock sector are much larger compared to the relative contribution of livestock products to total farm output.
8
Haq Nawaz Shah
The average economies of scope from custom hiring for the whole sample are low because 83% of farmers had zero custom hiring output. For the sample of farmers who custom hired, overall economies of scope were 21.6% and custom hiring scope economies were 12.2%. Although crops and livestock diversification has higher cost savings, custom operations in Punjab agriculture brings about a cost reduction of 12.2% by increasing the utilisation of the (fixed) capacity of assets.
This study finds that combining custom hiring of non-labour resources with crop and livestock enterprises results in further cost savings. The popularity of mixed farming in the Punjab reflects the existence of cost savings from joint production. Research on crop sector production which excludes the livestock sector, or visa versa, in the Punjab is not likely to be appropriate. Finally, changes in pricing policy related to the crop sector will have substantial effects on the livestock sector.
Sources of Scope Economies
After determining that substantial economies of scope existed in Punjab agriculture, it was important to identify the factors that were associated with greater cost savings from diversification. A Tobit model (Greene 1990) was used to determine the factors associated with overall scope economies for various enterprise combinations and custom hiring. Only one farmer had a negative economies of scope measure. This observation was deleted from the analysis. Economies of scope were hypothesised to be a function of the age of the head of household, the level of education, the irrigation method used, the district in which the farm was located, farm size in cultivated acres, whether or not the farmer obtained loans from an institutional source. A value of 1 was assigned if the farm was situated along the first half of the canal and zero to others. Results are presented in Table 2 below.Table 2: Tobit Estimates of Overall Scope Economies
on Sample Farms
9

The Lahore Journal of Economics, Vol.7, No.2
Parameter Estimate t-valueConstant 0.13522 2.55*Age 0.00405 2.13*Age Squared -0.00004 -2.03*Education -0.00052 -0.41Canal Irrigation 0.02112 1.21District 1 -0.02752 -1.07District 2 -0.03740 -1.44District 3 -0.09736 -3.42*District 4 -0.07042 -2.27*Farm Size (acres) -0.00402 -4.70*Loan (binary variable) -0.02205 -1.91Capital (Rs) 0.0000 3.31*Situation towards head of the Canal (Binary variable)
0.03042 2.26*
Loglikelihood 296.345 -Number of Observations 386 -Positive observations 370 -Chi-square 83.05* -
* implies significant at 5 % level.
Factors significant at the 5% level of significance in explaining scope economies include age, age-squared, acres, capital, the district in which the farm is located, and the location along the canal. Economies of scope increase as the value of capital owned by a farmer increases. Overall economies of scope are negatively related to farm size. Smaller farms have larger cost savings from diversification than larger farms.
The variables for District 3 and District 4 are negative and significant implying that the average economies of scope are lower for these districts than that of the excluded district Gujarat. The average scope economies of District 1 and District 2 are not significantly different from that of Gujarat4. Gujarat is more diversified compared to other districts that are predominantly cotton-wheat growing districts. So Gujarat enjoys the largest amount of economies of scope of all districts in this sample. On specialised farms fixed facilities are unutilised 4 The included districts are as follows: District 1 - Faisalabad, District 2 - Khanewal, District 3 - Vehari, and District 4 - Multan. The excluded district is Gujarat.
10

Haq Nawaz Shah
or underutilised when the crop has been sown, whereas on a multi-product farm, facilities are jointly used. This economises cost of production. The variable “situation towards head of the canal” is positive and significant at 5% implying that farms located towards the head of the canal achieve more economies of scope. Both the age and the age-squared variables are significantly different from zero. The second derivative is negative indicating that economies of scope increase at a decreasing rate with age. May be older farmers are traditional while the younger ones have diversified their products.
Table 3 below gives estimates of the Tobit regression for custom hiring enterprises.
Table 3: Tobit Estimates of Scope Economies for Custom Hiring on Sample Farms
Parameter Estimate t-valueConstant -0.17129 -1.25Age 0.00249 0.5Age Squared -0.00002 -0.38Education -0.00232 0.70Canal Irrigation -0.07142 -1.76District 1 -0.04361 -0.74District 2 -0.12565 -1.94District 3 -0.10018 -1.44District 4 -0.13783 -1.50Farm Size (cultivated -0.00043 -0.22Loan (binary Variable) -0.00135 -0.05Capital Owned (Rs) 0.000002 5.24*Situation towards headof the Canal (Binary
0.05646 1.65
Logliklihood -65.4626 -Number of Observations 386 -Positive observations 63 -Chi-square 64.96* -* Implies significant at 5% level.
The table shows that scope economies from custom hiring are positively and significantly related to amount of capital. Thus farms with more capital have a higher ability
11

The Lahore Journal of Economics, Vol.7, No.2
to achieve cost savings from custom work than those without. Farm size and age are not related to the ability to achieve cost savings from custom hiring activities. Regional differences appear to be less important in custom hiring than they were for the overall economies of scope measures.
Summary and Conclusions
This study used non-parametric techniques to measure scope economies for a sample of 387 irrigated Punjab farms in Pakistan. Outputs included all livestock products, five major crops of Pakistan (i.e., wheat, cotton, sugar cane, rice and maize) and custom hiring services produced by sample farmers in the survey year 1990-1991. Large economies of scope exist in Punjab agriculture, especially from crop and livestock enterprises. Combining custom hiring of non-labour resources with crop and livestock enterprises results in scope economies of 12.2% for those farmers which custom hire. The popularity of mixed farming in the Punjab reflects the existence of cost savings from joint production. Research on the crop sector production which excludes the livestock sector, or vice versa, in the Punjab is not likely to be appropriate. Changes in pricing policy related to the crop sector will have substantial effects on the livestock sector.
Overall economies of scope measures differ depending on farm size, the amount of capital invested, and the location of the farm in the Punjab. Larger farms have less incentive to diversify than smaller farms. Farms located in the Vehari and Multan districts have less cost savings from diversification than from the Faisalabad, Khanewal, or the Gujarat districts. Farms with more capital have more opportunities which in all likelihood arise in custom hiring. Farms located towards the canal head derive more overall scope economies than those situated towards the tail end of canals because the former have a more abundant and reliable supply of canal irrigation water than the latter. Age is also statistically significant in explaining differences in economies of scope measures.
12

Haq Nawaz Shah
Custom hiring economies of scope are higher for those farmers with more capital.
Finally, smaller farms choose to practice mixed farming in order to decrease the cost of production. Larger scope economies on smaller farms may provide an explanation of why smaller farms have survived despite the erosion of their efficiency relative to larger crop farms as a result of the availability of mechanical technologies to large farmers in the post-green revolution period. On the whole, this study has produced new insights in the farming system in Pakistan.
13

The Lahore Journal of Economics, Vol.7, No.2
Appendix Table 1: Farmers Major Socio-Economic Characteristicsof the Sample
Attribute Mean Standar Minimu MaximuDeviati
Farm Manure (Loads)a 6.67 7.92 0 75.89Fertiliser (Nut. Kgs)a 91.22 46.97 0 336.55Total Labour (Man 128.7 106 10.44 627.89Family Labour (Man 111.4 108.48 3.20 627.89Area Sown/Cultivated 1.56 0.38 0.36 2.77Irrigation Water (Acre feet)
2.55 0.72 0.23 6.75Canal Irrigation-Acres 46.79 47.34 0 275.68Tube-well Irrigation- 42.74 63.73 0 481.00Mixed Irrigation-Acres 7.80 27.14 0 207.75Cultivated area 8.70 8.19 1 62Institutional Loans 9354 34415 0 487200Bullock Operations 4.51 6.38 0 26.89Tractor Operations 3.65 2.94 0 18.49Age of Operator 46.27 15.49 12 90Years of Schooling 3.93 4.59 0 16Family Size 8.79 4.23 2 29Farms with debt (%) 37.7 48.5 0 100Farms at head of 31.0 46.3 0 100Capital Stock (Rs) 16,92 44,464 0 24,700a denotes “per cultivated acre”. Source: compiled from sample data.
Appendix Table 2: Number of Sample Farmers Producing Different Farm Products
Outputs Number Producing
Crops 386Wheat 382Kharif Fodder 351Rabi Fodder 344Indigenous Cotton 42American Cotton 293Sugarcane 161Grain Maize 75Fine Rice 30
14
Haq Nawaz Shah
Livestock Products 370Custom Hiring Services Output 63Total Sample Size 387
Source: compiled from sample data
Appendix Table 3: Inputs Categories used in Analysis
Major Category Minor Category (if any)1. Land2. Labour (Three Types) Family Labour
Annually Hired Labour Casually Hired Labour
3. Irrigation Water (Two Types)
Canal Water Tube-well Water
4. Cultural Operations (Four Types)
Plowing (by bullocks, tractors)
Leveling (by bullocks, tractors)
Hoeing (by bullocks, tractors, manually)
Planking (by bullocks, tractors)
5. Capital Inputs (Five Types)
Buildings Machines (tube-wells,
tractors, combines) Mechanical implements Hand tools Livestock
6. Fertilizers Chemical fertiliser Animal manure
7. Seeds (All crops)8. Threshing and Picking9. Fodders and Feeds10. Miscellaneous Costs Weedicides
Insecticides
15

The Lahore Journal of Economics, Vol.7, No.2
Fuel, Electricity Repair and Maintenance
Source: compiled from sample data.
16

Haq Nawaz Shah
References
Ali, Mubarak, 1990, “The Response of Major Crops in Pakistan: An Application of the Simultaneous Equation Model.” Pakistan Development Review 29 (3&4): 305-25.
Banker, R.D., A.Charnes, and W.W. Cooper, 1984, “Some Models for Estimating Technical and Scale Efficiencies in Data Development Analysis,” Management Science, 30(9): 1078-92.
Baumo, W.M., J. Pnzar, and R.Willig, 1981, Contestable Markets and Theory of Market Structure, Harcourt, Brace, and Jovanovich, New York, New York.
Charnes, A., W.W. Cooper, and E. Rhodes, 1978, “Measuring the Efficiency Of Decision Making Units”, European Journal of Operations Research, 2:429-44.
Chavas, J.P. and M.Aliber, 1993, “An Analysis of Efficiency in Agriculture: A Nonparametric Approach”, Journal of Agricultural and Resource Economics, 18(1): 1-16.
Government Of Pakistan, Ministry of Food, Agriculture, and Cooperatives, 1992, Agricultural Statistics of Pakistan 1990-91, Islamabad: Food and Agricultural Division, Economic Wing.
Grabowski, R. and C. Pasurka, 1988, “The Relative Efficiency of Northern and Southern U.S. Farms in I960”, Southern Journal of Economics, 54: 598-614.
Grene, W.H., 1990, Econometric Analysis, Macmillan Publishing Company, New York, New York.
Pinckney, T.C., 1989, “The Multiple Effects of Procurement Price on Production and Procurement of Wheat in Pakistan”, Pakistan Development Review 28(2): 95-119.
17

The Lahore Journal of Economics, Vol.7, No.2
Shumway, C.R., R.D. Pope, E.K. Nash, 1984, “Allocatable Inputs and Jointness in Agricultural Production: Implications for Economic Modeling”, American Journal of Agricultural Economics, 66(1): 72-78.
18

M. Aslam Chaudhary and Farzana Naheed Khan
Economic and Social Determinants of Child Labour:
A Case Study of Dera Ismail Khan, Pakistan
M. Aslam Chaudhary and Farzana Naheed Khan*
Abstract
This paper identifies important economic and social determinants of child labour, taking grassroots level data on the working children of Dera Ismail Khan City of Pakistan. Working conditions and their impact on child health are also identified. The variables like fertility, adult literacy and schooling system etc., are empirically examined. The analysis shows that poverty is the main cause of child labour in the city while other factors such as fertility, family size, adult illiteracy and schooling system also contribute to the supply of child labour. The situation is comparatively less serious for female child labour, showing the importance of traditional factors, which restrict females from working outside their homes. The social system of the area does not allow female children to work outside the home. Therefore, female child labour is not wide spread in the city, which is contradictory to the findings of the national survey on child labour. Thus, national surveys do not accurately represent regional child labour by sex. The present study has been carried out in an area which is backward and where child labour is wide spread. Moreover, large family size and poor schooling are also keeping children away from school since parents think that poor quality education does not add to the children’s ability to improve their productivity. Additionally, working conditions for the children were analysed. The children work for the longest hours and are the worst paid of all
* The authors are Associate Professor and Lecturer, receptively, at the Quaid-I-Azam University, Islamabad, Pakistan. They are thankful to Dr Mohammad Khan for his valuable comments, which helped to improve the study. The views expressed are entirely those of the authors.
15

The Lahore Journal of Economics, Vol.7, No.2
labourers in the city. Child labour results indicated that working conditions were poor and dangerous and harmed children by ruining their eyesight, bone deformations, chronic lung diseases, and sometimes resulted in the death of children. In addition, the attitude of the bosses was also harsh towards young child labourers. These outcomes call for an effective policy to eliminate poverty. The policy requires spreading literacy and introducing effective and quality education that can lead to skill training, which in turn improves the productivity of children. Poor parents’ income may also be compensated to successfully eliminate child labour. Population control programmes need to be made more effective to control family size. Such programmes may be introduced through schools and adult literacy programmes.
Introduction
Poverty, income distribution, unemployment and child labour are some of the current economic problems faced by the developing countries. Among these child labour5 is a major challenge for humanity, not only for the developing countries but also for other modern civil societies. It is estimated that over 250 million children, between the ages of 5 and 14 years, working in developing countries6 are victims of child labour. Most of these victims are concentrated in Asia and Africa, which together account for more than 90 percent of total child labour in the world. Asia alone accounts for 61 percent of total child labour, as compared to 30 percent for Africa, 7 percent for Latin America and 1 percent for US, Canada, Europe and other nations.7 Within Asia, South Asia is a 5 Child labour is defined by article 32 of the ILO Convention (138), Article 2, on the Rights of the Child as any economic exploitation or work that is likely to be hazardous or interferes with the child’s education, or is harmful to the child’s health or physical, mental, spiritual, moral, or social development. Child labour is a term used for the work done by children that is too hard, too long in duration and too hazardous for a child’s physical or mental health. 6 According to the Bureau of Statistics of the International Labor Organization, at least 120 million of the world’s children between the ages of five and fourteen years do full time paid work (ILO 1996).7See Child Labor: Targeting the Intolerable, Geneva, 1998, p. 7.
16
M. Aslam Chaudhary and Farzana Naheed Khan
major breeding place for child labour. Besides, South Asia also accounts for over 40 percent of the world illiterates, the least gender sensitive, the most militant region (HDSA 1997)8 and it is one of the major debt dependent regions in the world (Chaudhary 1999 & 2002). Unfortunately, South Asia and Latin America are the regions which stand at the top being victims of poverty incidence and child labour in the world too.9 Child labour and poverty have a direct correlation. However, there are other dimensions of the problem as well such as social aspects, which will be focused on in this paper.
A child is considered as human capital in every family (Khasnabis 2001). Any investment made for educating and training a child is usually taken as the first best option because the long run returns on this investment are high (Khasnabis 2001). But this investment does have a longer gestation period. The alternative scenario is one in which the families cannot afford to allow for the gestation period and may not be able to bear the cost either. They need the child to support the family and, therefore, consequently the child is driven to work. This leads to lost opportunity not only for the child and family but also for the nation. This is the very reason that education and primary health is the responsibility of the state. Many states fail to deliver these services and therefore suffer from poor human resources. There is an ample body of literature that focuses on the economic determinants of child labour, but very few studies concentrate on pointing out the social and traditional aspects of the issue.
Basu (1999) puts forth determinants of child labour in detail. In the analysis of determinants of child labour, the supply side of children can be explained in terms of lack of income of the relevant household. Bequel and Boyden (1988), Boyden (1991) and Grootaert and Kanbur (1995) have identified poverty as the main cause of supply of child labour. On the other hand, Bhatty (1998) cites a 8 See Human Development in South Asia 1999, 1998 and 1999.9 See A profile of Poverty (1999), MHCHD, Islamabad.
17

The Lahore Journal of Economics, Vol.7, No.2
variety of studies on Indian child labour, showing that income and related variables do not seem to have any direct significant effect on child work. Ray (2000) shows that household poverty has an insignificant effect on child labour participation in Peru and Pakistan. Thus there is diversified literature on the subject.
In addition to the above-cited factors, there could be other economic and social factors that contribute to the phenomenon of child labour. Population growth has been debated extensively and a number of studies have also sought to establish the correlation between education and the economic value of children. Ray (2000a) shows a positive relationship between child labour and large family size. Societies with high birth rates are often ones where incidence of child labour is very high. Becker (1965) stated that there is widespread appreciation that the decisions about fertility, child labour and child schooling are interdependent. Bura (1995) showed that an important determinant of child labour was adult literacy that leads to reduction in child labour. Weiner (1991) established a relationship between child schooling and that it leads to child labour and recommended compulsory education to control child labour. These variables have been identified for child labour in Pakistan as well. Therefore, this study will take into account the above variables while analysing the issue.
Most of the studies on child labour have used macro data, drawing the same conclusion for a city such as Islamabad (federal capital) to a city in remote areas of Balochistan or for a city in NWFP where data for social indicators is either non-existent or very poor. This paper has been planned to examine factors which are considered to be the major determinants of child labour, using primary data on working children in Dera Ismail Khan city. The scope of the study pertains to the urban community, considered relatively backward in the country and where child labour is wide spread.
18

M. Aslam Chaudhary and Farzana Naheed Khan
According to the Child Labour Survey (1996), children’s percentage participation rate in the labour force is the highest for the province of NWFP. We have selected D. I. Khan as a representative city of NWFP to explore the reasons causing children to participate in economic activities. A large proportion of children whom the ILO classifies as child labourers work in agriculture.10 This is unpaid labour as most children work with their families on their own farmland or on someone else’s land [SPARC (2001)]. The situation is more serious for urban children where they work at different work places. The working conditions in these places do not provide the stimulation for proper physical and mental development as discussed by Bequele and Bayden (1988a). Thus, we have selected an urban city of NWFP where the exact situation can be identified in which children are forced to work.
Bequele and Bayden (1988a) have discussed the working conditions for working children. In addition to losing or forgoing an opportunity to get education and enjoying a healthy childhood, the child worker also bears other costs such as health hazards and physical hazards. These health hazards will be pointed out in the study. The formulation of policies that are effective in curbing child labour requires an analysis of the key determinants that have a significant effect on child employment. The most important objective is to identify a relationship between child labour and variables such as poverty, fertility and adult literacy rate etc. in order to learn about the main causes of child labour in the city. The next objective is to rank the variables identified as the main cause of child labour, keeping in mind that this is the area where the primary reason for theorising is to ultimately influence policy.
Weiner (1991) pointed out that 10 percent of all workers in Pakistan are between the ages of 10 and 14 years. While Basu (1999) stated that the working conditions are serious for the age group of 10-14 years in 10 About 70 percent of child labourers in Pakistan work in agriculture, see SPARC (2001).
19

The Lahore Journal of Economics, Vol.7, No.2
Asia. Consequences of child labour on working children are also explored in this study, considering working hours, behaviour of bosses and health status of children.11 After this the study is organised as follows. Section II provides historical background and literature review. Sample size and data are discussed in section III. The empirical findings are discussed in section IV, while section V provides conclusion and policy implications.
Historical Back Ground and Literature Review
Child labour first appeared with the development of domestic employment in agriculture and in the cottage as well as informal sector of the economy12. Children were used intensively at whatever task they could perform. This system was important in England, North America and in the Continent from the 16th to 18th centuries. The domestic system was largely replaced by the factory system associated with industrialisation or "Industrial Revolution" that gained impetus in the 18th Century. This system led to a large increase in the number of children working away from their families inside the villages or even outside the villages for long hours and under hard conditions. The children used to work for lower wages than that of adults and were not able to create labour troubles. Similar conditions were common in the United States and Canada too. The Select Committee Report of 1831-1832 is an enormous document reporting on a series of interviews of child labourers, factory owners and managers. The story that emerged is that children who worked for long hours were frequently beaten and paid a pittance. 11 Silver (1996) discussed child labour in Pakistan, and reported that children work for the longest hours and are the worst paid of all labourers. They earn on the average a third of the adult wage.12 International Labor Organization defines conditions of child labour as: i) Working too young ii) Working for long hours in some cases (12-16) hours per day. iii) Working under strain, physical, social and psychological. iv) Working on the streets in unhealthy and dangerous conditions. v) Working for very little pay as little as US $ 3 for a 60 hours a week.So, there are conditions for child labour. For simplicity we assume that c hild labour means exertion, physical or mental or both undergone in the performance of some task or work by which subsistence is obtained by a young person (5-14 year old) of either sex.
20

M. Aslam Chaudhary and Farzana Naheed Khan
According to the Census of England and Wales in 1861, 36.9 percent of boys in the age group 10-14 years were labourers. One of the more systematic investigations of the historical role of law in the decline of child labour occurs in the work of Mochling (1998). Her focus of study is the United States from 1880-1910. She concluded that the minimum age restriction had little impact on the employment of children in the United States. The origin of debates on child labour can be found in the writings of Karl Marx (1867), Marshall (1920) and Pigou (1920). With economic and social development, child labour was abolished in the developed countries. However, it is still present in developing countries.
In Pakistan, children have worked side by side with their parents either in their homes, in farming or in other family occupations. But this was child work, an occasional form of work having no element of exploitation. This form of work was acceptable and in fact prepared children for adulthood. But children seldom worked outside their villages without their family members until the 1960s. In this era, a dramatic effort was made to expand the manufacturing base in Pakistan, which led to a large increase in the number of children working outside their homes in factories and workplaces whose owners sought to maximise profits by keeping down labour costs. The range of child labour extends from children being involved in family occupations such as sheep rearing to pernicious forms reminiscent of children’s work. Children work in family based agriculture, factories, workshop, tailoring, handicrafts, carpet weaving, manufacturing surgical instruments, leather, footwear, brick kilns, stone/brick crushing and sports goods production.
Many children in Pakistan work under a bonded system. In this system an advance of bonded money, called peshgi, is given for a person. As long as the debt lasts the worker/debtor is bound to the creditor/employer. If the worker becomes ill or dies, the family is responsible for the debt and it is often passed down through generations. Often children are put to work to pay off
21

The Lahore Journal of Economics, Vol.7, No.2
existing debts. The peshgi system was legally abolished in 1988 in a case against brick kiln owners, and the Bonded Labour Abolition Act of 1992 cancelled all obligations of bonded labourers to their employers.
Children work for a variety of reasons. One of the most important reasons is poverty. Sometimes, children work to ensure the survival of their family and themselves. Though children are not well paid, they still serve as major contributors to family income in developing countries. There is no dearth of studies at the macro level, which show that the children of poor families have immediate economic value and poverty of the parents pushes many children into the labour market. Low income households face economic constraints in the present time, which makes it difficult for them to afford education along with making them short sighted by not investing in long term future returns (Bhatty, 1998) & (Dreze & Kingman, 1999).
Ranjan Ray (2000) tested two hypotheses and stated that there is a positive association between hours of child labour and poverty, and there is a negative association between child schooling and poverty. Ray has used data obtained from the Pakistan Integrated Household Survey, 1991. Both of these hypotheses are confirmed by the Pakistani data, but not by the Peruvian data. The reduction in poverty rates due to income from children’s labour is greater in Pakistan than in Peru. The nature of interaction between adult and child labour markets varies with the gender of the child and the adult. In Peru, rising men’s wages significantly reduced the labour hours of girls, whereas in Pakistan there is a strong complimentarity between women and girls’ labour markets. Both data sets confirm the positive role that increasing adult education can play in improving child welfare.
Taking a sample of 100 children from the urban areas of Pakistan, (Khan, 1982) hours worked by child labourers on variables such as age, schooling, family size, experience and family income were regressed. Poverty,
22

M. Aslam Chaudhary and Farzana Naheed Khan
illiteracy of parents and lack of educational facilities were identified as the variables, which lead to supply child labour. Competition in the global market has raised the demand for cheap and exploitable labour. This further impoverishes societies because wages are pushed lower by child labour and adults remain underemployed or out of work. Thus, the cycle of labour and deepening poverty continues through generations.
The existence of child labour is a cause of serious concern as it denies the right of childhood and education to children. Work imposed upon them damages their personality and harms them physically and psychologically. According to the Child Labour Survey 1996, there are 3.3 million working children between the ages of 5-14 years in Pakistan.13 The obvious solution is to abolish child labour, but there are problems associated with this solution. Sometimes children work to ensure the survival of their family and themselves; the alternative may further deepen poverty for the families. There is also the view that work can help a child in terms of his socialisation, in building self-esteem and training (Collins, 1983). What is striking and noteworthy is that child labour has not always been thought of as an evil. Presently, there is great focus on the issue both at the national and international level. Therefore, there is a direct need to identify the variables which could be the sources of this evil. There is a need to look beyond poverty to appropriately tackle the issue. Keeping this purpose in mind, the study is based on fresh survey and data is obtained at the grassroots level. The data, sample size and problems related to it are discussed in the next section.
The Data and Sample Size
The quality of data is very important in order to draw reliable conclusions. The collection of data was complex 13 Labour force sets the number at two million (1990-91). A report from UNICEF put the number at around eight million (1990) and economists at the Pakistan Institute of Development Economics estimated that there are 19 million working children, 7 million below the age of 10 and 12 million between 10 and 14 (1994).
23
The Lahore Journal of Economics, Vol.7, No.2
because of the non- reliable responses of child labour. A fairly representative and sound sample is essential if a limited survey is to yield fruitful results. In this survey we interviewed a sample of 125 working children in the age group of 5-14 years at different work places of Dera Ismail Khan City.
These children were interviewed at different work places and were involved in different economic activities such as embroidery, tailoring, workshops, service stations, woodworks, metal works, brick kilns, shops, at homes (domestic servants) and in hotels (helpers).14 Both boys & girls were interviewed. However, in the province of NWFP, girls are strictly limited to domestic activities. Hence older girls are not allowed to work at work places at all. In our sample girls are only 20 percent, while 80 percent of our sample consists of male children. Girls were working in some specific fields such as embroidery and tailoring in homes while male children were employed in all fields. The survey was designed and tested first so that each type of major activity was captured. Thereafter random sampling was adopted to collect samples at five different workplaces at the localities as mentioned in the appendix Table 1.
The major handicap encountered in data collection was to get information from teenage children who were afraid of their masters and hesitated in providing information. However, efforts were made to collect correct reliable information about child labour. This information was verified again and again pertaining to one workplace. The doubtful information was rechecked and matched with other responses and those which were not confirmed, were dropped. Total sample size was 115, however, after screening the data one hundred observations were utilised to draw meaningful results. The distribution of sample for different activities is given in Table 1, below.
14 We have conducted the survey for Dera Ismail Khan city only. Thus children involved in agriculture in the villages of the district D. I. Khan could not be included in the sample.
24

M. Aslam Chaudhary and Farzana Naheed Khan
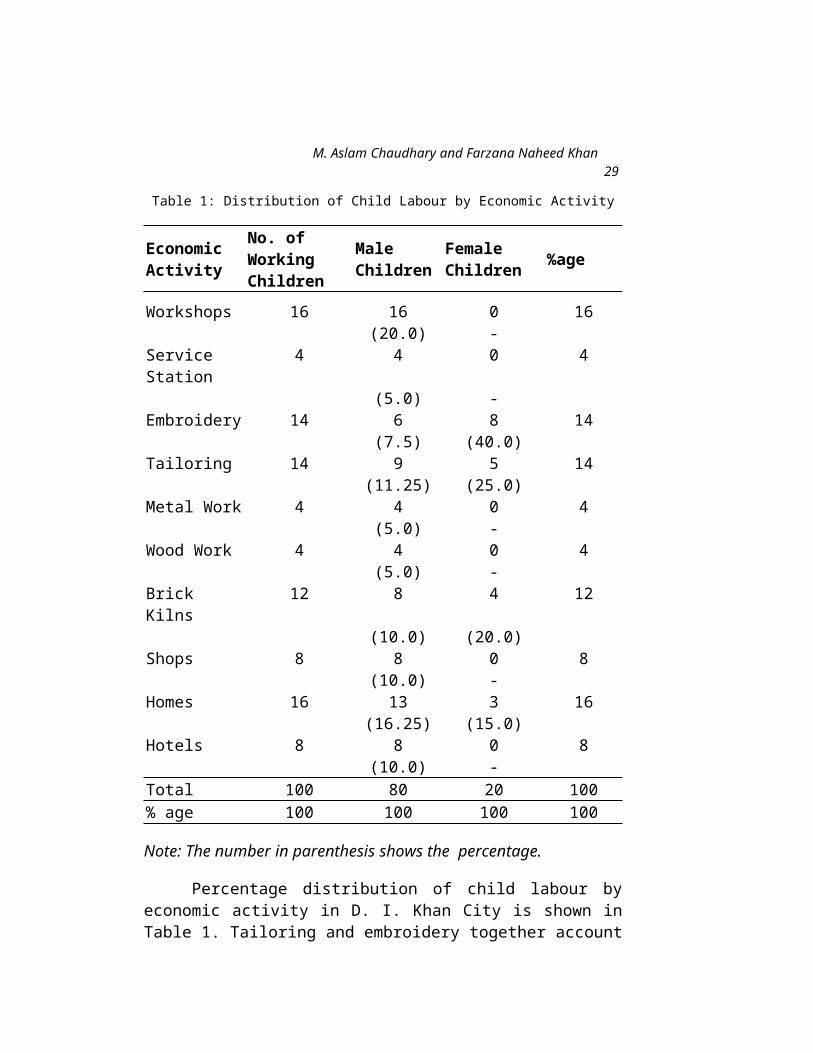
Table 1: Distribution of Child Labour by Economic Activity
Economic Activity
No. of WorkingChildren
Male Children
Female Children %age
Workshops 16 16 0 16(20.0) -
Service Station
4 4 0 4
(5.0) -Embroidery 14 6 8 14
(7.5) (40.0)Tailoring 14 9 5 14
(11.25) (25.0)Metal Work 4 4 0 4
(5.0) -Wood Work 4 4 0 4
(5.0) -Brick Kilns 12 8 4 12
(10.0) (20.0)Shops 8 8 0 8
(10.0) -Homes 16 13 3 16
(16.25) (15.0)Hotels 8 8 0 8
(10.0) -Total 100 80 20 100% age 100 100 100 100
Note: The number in parenthesis shows the percentage.
Percentage distribution of child labour by economic activity in D. I. Khan City is shown in Table 1. Tailoring and embroidery together account for 28 percent of child labour in the city. About 65 percent of the working female children are in this category, while 18.75 percent of male children are also engaged in this profession. The children working in the workshops account for one fifth of the child labour. In this activity the female participation rate is zero. Brick kilns accounting for 12 percent and 20 percent of female working children are also attached to this
25

The Lahore Journal of Economics, Vol.7, No.2
profession. The maximum number of male children are employed in workshops, engaged in repairing motor vehicles, etc.
Empirical Findings
Child labour and variables such as poverty, family size, schooling, adult literacy rate, and traditional/social factors are analysed to point out the main determinants of child labour.
4.1 Income, Poverty and Child Labour
There are different reasons due to which parents send their children to work when they should have been sent to schools instead. Children are sent to work to supplement the family income when income of the adult in the house is not sufficient to keep the pot boiling. Poverty is widely accepted as the main cause of child labour. Here poverty is measured in terms of income of the family member of earning adults per family, residential status of a family and presence of any other financial arrangement Zakat & charity etc.) for the family. These variables are used in order to capture different dimensions of poverty.
Table 2 shows that the problem of child labour is more serious for families with income less than Rs. 3000 per month, as they supply more than 80 percent of child labourers. About 81 percent children are from families earning less than Rs. 3000 per month, as compared to 19 percent children whose families have more than Rs. 3000 per month.15 Further analysis shows that 20 percent of the working male children are from families earning less than Rs. 1500 per month while 35 percent of the females belong to this income group.
The situation is not very serious for the females, who fall in the sample’s relatively top income groups. There were 16 females out of 20 (80 percent) who were from 15 It may be noted that the poverty line in Pakistan is Rs 450.00 per person / per month. The above figures are close to the poverty line. Thus these families fall below the poverty line.
26
M. Aslam Chaudhary and Farzana Naheed Khan
the income group earning less than Rs.2000 per month, as compared to only one working female child whose family earns more than Rs.3000. First, female child labourers are not large in number, as compared to their male counterparts. Second, females who are engaged in child labour belong to the middle category of the sample’s income group. This shows the importance of traditional social factors, which restrict female child labour. As income crosses Rs. 3000 females are strictly prohibited to work. The established female role in certain regions of the country shows that women are not permitted to do jobs outside their homes. Therefore, daughters are mainly limited to household activities. Such cultural and social norms restrict the employment of females outside their homes.
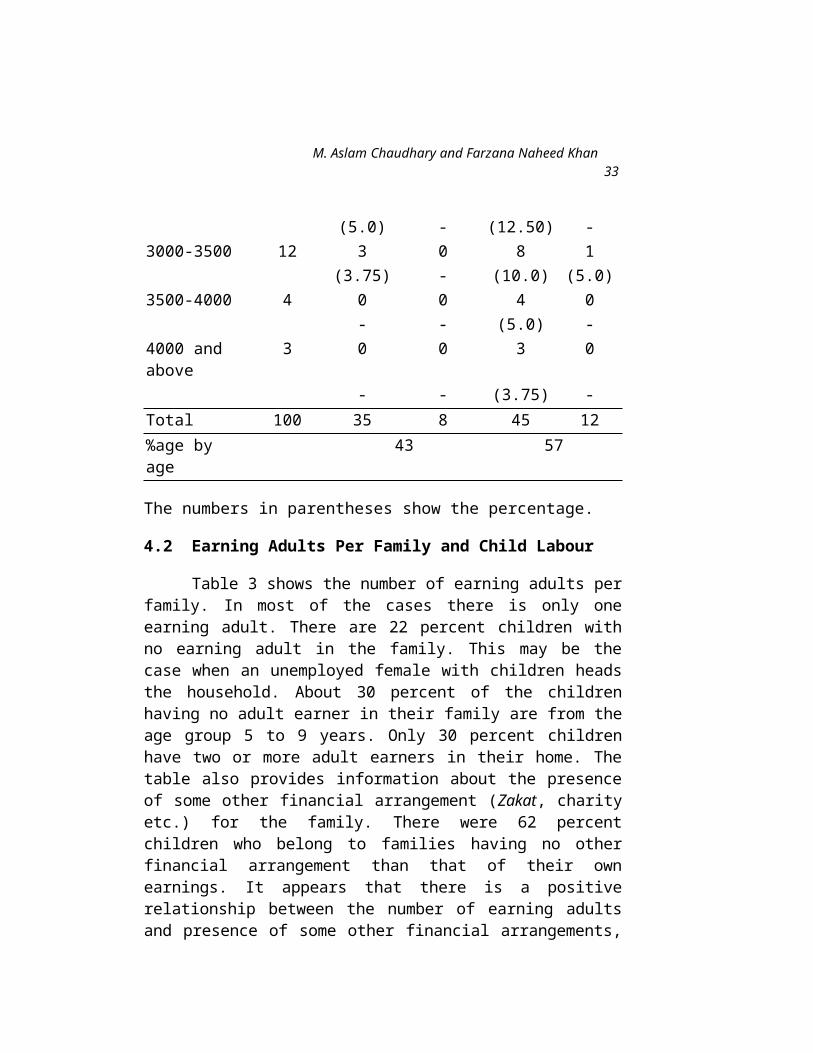
Table 2. Distribution of Child Labour by Income Group, Sex & Age in D. I. Khan
Income of the
Families of the
Working Children
No. ofChildren with
this income
Age group Age group5 to 9 year 9 to 14 year
Male Female Male Female
Less than 1500
23 11 3 5 4
(13.75) ((15.0) (6.25) (20.0)1500-2000 26 10 5 7 4
(12.5) (25.0) (8.75) (20.0)2000-2500 18 7 0 8 3
(8.75) - (10.0) (15.0)2500-3000 14 4 0 10 0
(5.0) - (12.50) -3000-3500 12 3 0 8 1
(3.75) - (10.0) (5.0)3500-4000 4 0 0 4 0
- - (5.0) -4000 and above
3 0 0 3 0
27
The Lahore Journal of Economics, Vol.7, No.2
- - (3.75) -Total 100 35 8 45 12%age by age
43 57
The numbers in parentheses show the percentage.
4.2 Earning Adults Per Family and Child Labour
Table 3 shows the number of earning adults per family. In most of the cases there is only one earning adult. There are 22 percent children with no earning adult in the family. This may be the case when an unemployed female with children heads the household. About 30 percent of the children having no adult earner in their family are from the age group 5 to 9 years. Only 30 percent children have two or more adult earners in their home. The table also provides information about the presence of some other financial arrangement (Zakat, charity etc.) for the family. There were 62 percent children who belong to families having no other financial arrangement than that of their own earnings. It appears that there is a positive relationship between the number of earning adults and presence of some other financial arrangements, showing that adults are in a better position to receive some charity.
Table 3: Earning Adults Per Family & Presence of any Financial Arrangement
No. of EarningAdults
No. of Childre
n
Age of Working Child
Any other arrangement %
age5 to 9 9 to 14 Yes No0 22 7 15 6 16 221 48 23 25 12 36 482 25 11 14 17 8 253 or more
5 2 3 3 2 5
Total 100 43 57 38 62 100
28

M. Aslam Chaudhary and Farzana Naheed Khan
4.3 Living Conditions
Living conditions like shelters represent poverty and level of living standard. Table 4 shows that 60 percent families have their own houses. However, the quality of these houses is very poor. These houses are made of mud and consist of only one room. These people are not in a position to rent accommodation. Most of these rooms are constructed on public property. Only 10 percent families were living in small rented houses, which were slightly better than mud houses. Thus the living conditions were poor with no piped water and medical center nearby.
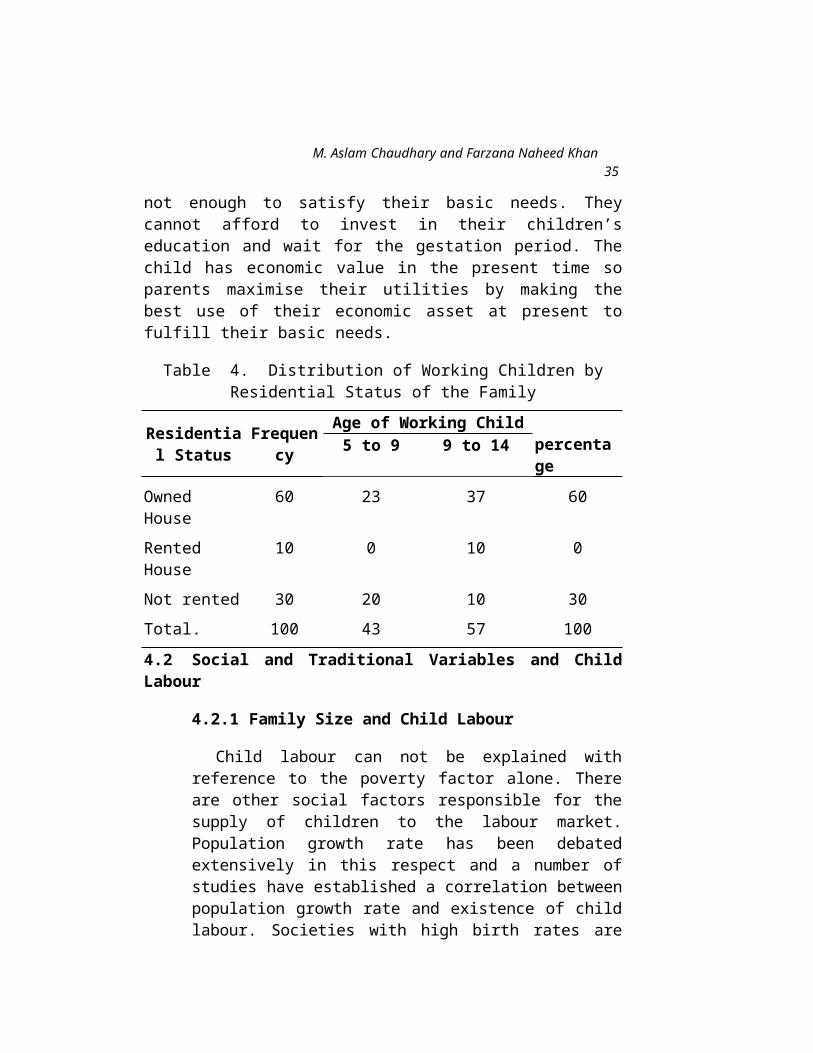
The overall analysis shows that there is an inverse relationship between the income level of the family and the incidence of child labour. The incomes of the families are so low that they are not enough to satisfy their basic needs. They cannot afford to invest in their children’s education and wait for the gestation period. The child has economic value in the present time so parents maximise their utilities by making the best use of their economic asset at present to fulfill their basic needs.
Table 4. Distribution of Working Children by Residential Status of the Family
Residential Status
Frequency
Age of Working Child percentage
5 to 9 9 to 14
Owned House
60 23 37 60
Rented House
10 0 10 0
Not rented 30 20 10 30Total. 100 43 57 1004.2 Social and Traditional Variables and Child Labour
4.2.1 Family Size and Child Labour
29

The Lahore Journal of Economics, Vol.7, No.2
Child labour can not be explained with reference to the poverty factor alone. There are other social factors responsible for the supply of children to the labour market. Population growth rate has been debated extensively in this respect and a number of studies have established a correlation between population growth rate and existence of child labour. Societies with high birth rates are often ones where incidence of child labour is very high. The reason for this being that it is difficult for the large family to meet their basic needs by the parents’ income alone.
Table 5 shows that more than 60 percent children were from families where the family has at least 7 members, as compared to only 7 percent children who had less than 3 members in their families. The smaller the family the less the number of children involved in child labour. This indicates that as the number of children in the family increases, there is higher probability of child participation in the labour market. Parents in developing countries make use of children’s ability to work, continue producing more children and send them to the labour market. In this situation children seem to be less of an economic burden, rather they share the burden of their parents to meet family expenditures.
Table 5. Distribution of Working Children by Family Size, & Child Employment
Family size
%age of children having
family size
No. of working children in the family
1 2 3 4 or more
1-2 7 7 0 0 03-4 15 12 3 0 05-6 15 6 5 3 17-8 20 4 7 6 39-10 23 0 7 11 511-12 15 1 3 6 5
30
M. Aslam Chaudhary and Farzana Naheed Khan
12 or more 5 0 1 1 3Total 100 30 26 27 17
There is a substitution effect of child labour on adults’ wages. A large presence of children in the labour market drives down the wages for adults, causing even higher unemployment. This cycle further increases the demand for cheap child labour. It is a vicious cycle and it is likely that the children of these children too will remain poor and be forced to work. The vicious circle continues and the number of child labourers continue to rise. UNICEF (1997) stated that these children will never be able to break out of the cycle of slavery: they will spend their lives on the plantations, marrying there and giving birth to the next generation of slaves.
4.2.2Adult Literacy and Child Labour
Another important determinant of child labour is adult illiteracy (Bura 1995). The parent’s perception of the value of schooling is a main determinant of child employment. Parents who are educated understand the importance of schooling. As a result, parental education plays an important role in determining child schooling and employment (Tienda 1979). Table 6 provides below empirical evidence in this regard.
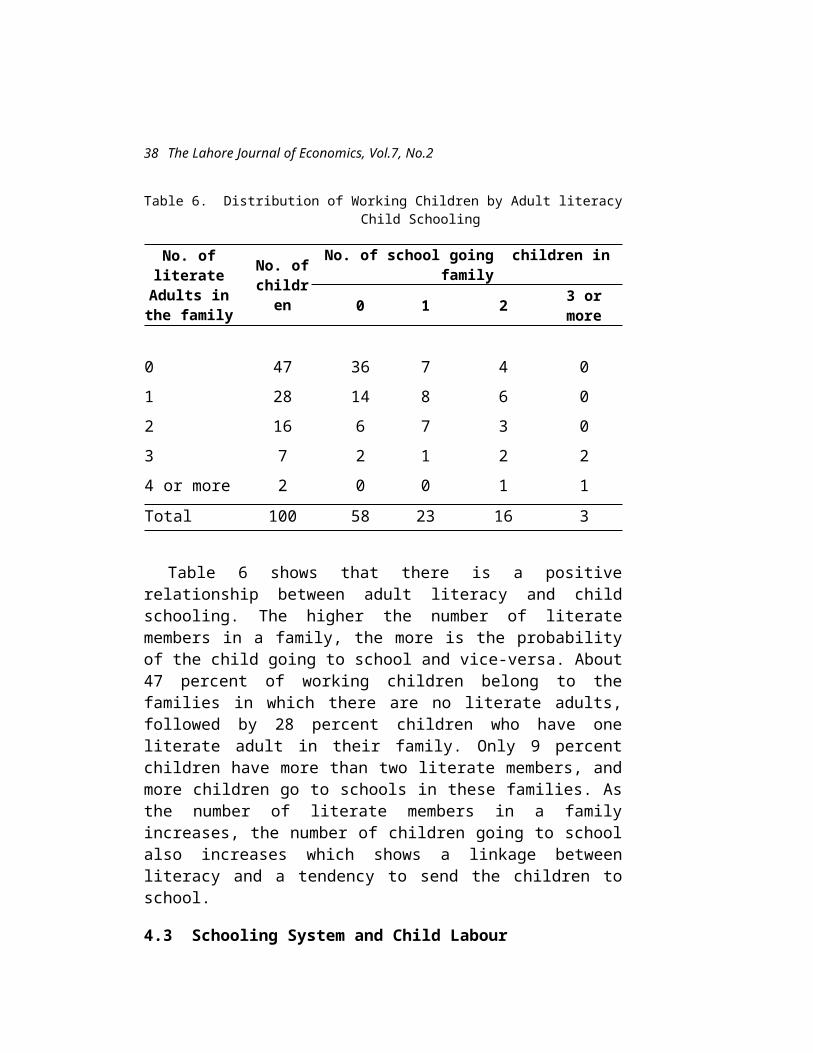
Table 6. Distribution of Working Children by Adult literacy Child Schooling
No. of literate
Adults in the family
No. of childre
n
No. of school going children in family
0 1 2 3 or more
0 47 36 7 4 01 28 14 8 6 02 16 6 7 3 0
31
The Lahore Journal of Economics, Vol.7, No.2
3 7 2 1 2 24 or more 2 0 0 1 1Total 100 58 23 16 3
Table 6 shows that there is a positive relationship between adult literacy and child schooling. The higher the number of literate members in a family, the more is the probability of the child going to school and vice-versa. About 47 percent of working children belong to the families in which there are no literate adults, followed by 28 percent children who have one literate adult in their family. Only 9 percent children have more than two literate members, and more children go to schools in these families. As the number of literate members in a family increases, the number of children going to school also increases which shows a linkage between literacy and a tendency to send the children to school.
4.3 Schooling System and Child Labour
Table 7 shows that there were 37 percent children who were once admitted in schools but they left after some time. More than 50 percent children left schools because of financial problems. They were not in a position to pay for the school fee and buy books. However 16 percent children left school because of the schooling system, the teacher’s attitude, distant school location etc., 13 percent children were out of schools because of cultural and traditional factors like their parents believing that schooling does not add to children’s productivity. Only 5 percent left school to learn some skill. An additional factor in parental decision making about a particular child’s education and child labour is likely to be the needs and prospects for their other children. Often parents may assign different values to their children and they try to manage their affairs by sending some children to work in order to finance the schooling of other family members.
32

M. Aslam Chaudhary and Farzana Naheed Khan
This phenomenon involves a certain number of children going to school while others work.
Table 7. Reasons for Leaving School
Reasons for Leaving School
Frequency Percentage
Cultural factors 5 13.51Family occupation 5 13.50Financial problems 19 51.35Schooling system 6 16.22To learn skill 2 5.41Total 37 100
Another objective of the present study was to learn about the age group in which concentration of working children is the highest. Table 8 shows that one fifth of the total working children are from the age group 5 to 8 years and too young to work. Most of these children work in workshops or in brick kilns where the environment is not suitable for their physical and mental development. The survey indicates that 48 percent of working children are below 10 years of age as compared to 52 percent children who are from the age group 10 to 14 years. One interesting finding of the present study is about female working children. About 45 percent female children are from the age group 10 years and above. The analysis shows that the situation is not serious for the females as they belong to the relatively upper age group. The girls older than 15 years are not allowed to work outside homes because of traditional factors. Such traditional and cultural practices restrict the employment of older girls outside their homes. This implies that for the elimination of female child labour more weight must be assigned to the age group of 5 to 10 years old. On the other hand, concentration of working male children is high for the age group 10 to 14 years and so more attention must be paid to this group for boys.
33

The Lahore Journal of Economics, Vol.7, No.2
Table 8. Distribution of Working Children by Age and Sex
Work place/ age
5 to 8 8 to 10 10 to12 12 to 14TotalMal
e Female
Male
Female
Male
Female
Male
Female
Workshops 5 0 4 0 3 0 4 0 16Service Station 2 0 1 0 1 0 0 0 4Embroidery 0 1 1 3 2 3 3 1 14Tailoring 0 0 0 2 4 2 5 1 14Metal Work 1 0 1 0 1 0 1 0 4Wood Work 1 0 1 0 1 0 1 0 4Brick Kilns 3 2 4 1 1 1 0 0 12Shops 1 0 2 0 3 0 2 0 8Homes (servants)
2 1 5 1 3 1 3 0 16
Hotels (helpers)
1 0 2 0 2 0 3 0 8
Total 16 4 21 7 21 7 22 2 100
percent age
20 28 28 24 100
An important objective of the study was to identify a relationship between child labour and variables such as poverty, family size, adult literacy and schooling system etc., to know about the main determinants of child labour and to provide policy guidelines to eliminate the problem. The analysis shows that at certain levels of poverty, child labour plays an instrumental role in the economic survival of the family. Poverty is one of the major sources of child labour. Population growth rate is another important determinant of child labour. Uneducated or poorly educated parents are also a cause of child labour. Children seek employment also simply because there is no access to school (distance, no
34

M. Aslam Chaudhary and Farzana Naheed Khan
school at all) or the school system is so poor that it does not deliver quality education. When there is access to school, the low quality of education often makes attendance a waste of time for the students. Schools suffer from problems such as overcrowding, inadequate transport facilities, and poor quality of teachers and most important are fees and the cost of books associated with it. Thus, schooling problems also contribute to keeping the children away from schools and add to child labour.
The determinants of child labour were also ranked according to their significance. Table 9 shows the overall results of the survey in this respect. There were 24 percent children in the labour market due to poverty and these children were mostly working in workshops or as servants in homes. About 12 percent children work because of debt liabilities and these children are mostly concentrated in brick kilns. The schooling system is responsible for 8 percent children in the labour market. About 11 percent children are in the labour market because the field of work is the same as their family occupation and they are trying to acquire some skills. One interesting feature is that there are 17 percent children who are in the labour market because they like it, the other option is school, which is not preferable to them. Such an answer may be expected from the children only when they are fully aware of the consequences.
Table 9: Reasons for Child LabourWorkplac
eChildLike
it
DebtLiabili
-ties
Family
Occupa-
tion
Poverty
Schooling
System
To Acqui
reSkill
Tradi-tions
or cultur
e
Total
Workshops 0 1 0 9 1 3 2 16Service Station 0 0 0 1 0 2 1 4Embroidery 3 0 3 1 1 4 2 14Tailoring 4 0 3 1 0 5 1 14Metal 0 0 1 2 0 0 1 4
35
The Lahore Journal of Economics, Vol.7, No.2
WorkWood Work 0 0 1 1 0 2 0 4Brick Kilns 0 10 0 2 0 0 0 12Shops 4 0 2 1 1 0 0 8Homes 3 1 0 6 2 0 4 16Hotels 3 0 1 0 3 0 1 8Total 17 12 11 24 8 16 12 1004.4 Consequences of Child Labour on Working Child Labourers
Working conditions and health status of child labour is very important. The payment given to a child as his reward is also considered important in terms of the exploitation of children. The International Labour Organisation (ILO) reported that children work the longest hours and are the worst paid of all labourers (Bequele & Boyden 1988). These aspects were also analysed for the study area.
4.4.1Working Conditions
Table 10 indicates the working conditions of children in the city (ies). The table shows that 55 percent children work for more than 10 hours per day. 27 percent children reported that the attitude of their boss is good with them, while only 27 percent children are happy with their bosses. However, 37 percent children reported that the behaviour of their bosses was bad with them. These children are not allowed holidays or off days even after months. The work imposed upon them often warps their personality and makes them physically and psychologically ill. Children are exposed to dust and fumes in repair shops, wood work factories and metal work factories.
Table 10: Distribution of the Working Hours & Work Conditions for Children
No. of Attitude of Boss
36

M. Aslam Chaudhary and Farzana Naheed Khan
Working hour per
day
childrenGood Normal Bad
2-4 4 2 1 14-6 6 2 1 36-8 10 4 4 28-10 25 5 15 510-12 30 7 8 1512-14 15 5 4 614-16 10 2 3 5Total 100 27 36 37
Children are often forced to drag loads of molten metal from blowing furnaces and amid noise levels that could cause deafness, besides losing or forgoing the opportunity of an education and enjoying childhood. There is additional cost in terms of health hazards. The eyes of children involved in doing embroidery work are affected within 5-8 years of employment. Table 11 shows the health status of working children. More than 40 percent children feel that their health status is worse than before as compared to only 24 percent children who stated that their health is better than before.
Table 11. Distribution for Health Status of Working Children
Workplace / Health status
Same Satisfactory
Bad Total
Workshops 5 3 8 16Service Station 1 1 2 4Embroidery 4 5 5 14Tailoring 3 4 7 14Metal Work 2 0 2 4Wood Work 1 1 2 4
37
The Lahore Journal of Economics, Vol.7, No.2
Brick Kilns 6 0 6 12Shops 5 3s 0 8Homes (servants)
4 5 7 16
Hotels (helpers) 4 2 2 8Total 35 24 41 100
Table 12 shows the monthly earnings of the children. About 24 percent children work with out any payment or reward. There were 23 percent children who received only Rs.100 per month16. This is not even enough for one week’s food for a child. The percentage of children paid more than Rs.1000 per month is zero.
16 It is less than $2 per month. In other words these children were paid less than 7 cents a day.
38

M. Aslam Chaudhary and Farzana Naheed Khan
Table 12. Distribution of Monthly Earnings of the Children
Earning ofChildrenIncome group
No. ofWorkin
gChildre
n
No. of Working Children % age5 to 9 year 9 to 14 year
Male Female Male Female
No wages 24 14 4 5 1
(17.50) (20.0) (6.25) (5.0) 24.38
0-100 23 10 3 8 2
(12.50) (15.0) (10.0) (10.0) 23.75
100-200 19 6 1 7 5
(7.50) (5.0) (8.75) (25.0) 23.12
200-500 24 5 0 15 4 (6.25) - (18.75) (20.0) 22.5500-1000 10 0 0 10 0 - - (12.50) - 6.251000-1500 0 0 0 0 0 - - - - 01500 and above 0 0 0 0 0 - - - - 0Total 100 35 8 45 12% age 100 43 57 100
The numbers in parentheses show the percentage.
Only 10 percent children earn more than Rs.500 per month but less than Rs.1000.
39

The Lahore Journal of Economics, Vol.7, No.2
The remaining 90 percent of the children are paid less than Rs.500 per month. It means that about 90 percent children were paid around $8 per month.
Children are put to such type of work that injures them. These children do not have a healthy environment for their physical growth. The children are at greatest risk from exploitation at work that results in ruining their eyesight and bone deformities, chronic lung diseases, and sometimes incidence leading to death. Those who survive pay a high price in the shape of lost physical and mental development, often passing that price on to their own children, forging the shackles of poverty, ignorance and servitude across generations.
Conclusion and Policy Implications
This paper focused on pointing out the major determinants of child labour in the Dera Ismail Khan City of Pakistan. Efforts were made to identify relationships between child labour and variables such as poverty, family size, adult literacy, schooling system and traditional factors in order to learn about the main causes of child labour in the city. Additionally, the age group of children who were the main victims of the problem was to be identified. Moreover, these variables were to be ranked as per their significance.
The analysis shows that poverty is the main cause of child labour in the city but there are other factors contributing to it such as family size, schooling system and illiteracy of parents. The analysis shows that at certain levels of poverty, child labour plays an instrumental role in the economic survival of the family. The child has economic value at present so parents maximise their utility by making the best use of their economic assets at present for the satisfaction of basic needs. Another important factor causing child labour is large family size. When family size is large, the family cannot afford food, clothing, education and other necessities and thus more children are sent to work. Parents below the poverty 1ine
40
M. Aslam Chaudhary and Farzana Naheed Khan
cannot afford to send their children to schools, where a child spends a lot of time and money on books and school fees, and ultimately he is unable to get a job or their education does not add to their earnings. The parents face a trade off; sending their child to school means waiting for the next 10 to 15 years. They think it is better for a child to learn some practical skill and be able to earn something immediately, rather than sending them to school for a longer period. In some cases children are sent to work, as it is their family occupation. The parents believe that the child should learn and acquire a skill from childhood so that he can earn more in his field within 5 to 10 years. The child labour scenario is not serious in the case of females. Given the traditional social values, females were less exposed to child labour. Besides, there was no working female from any family with income above Rs.3000. Our findings do not confirm that the female child labour problem is as serious as that of male’s, as identified by the national survey. Thus child labour by sex differs across regions of the country.
Children work the longest hours and are the worst paid of all labourers in the city. They are exposed to dust and fumes in repair shops, woodwork and metalwork factories. Children are put to work in ways that destroy the right to normal physical and mental development. Children are at greatest risk from exploitation at work which results in ruining their eyesight, causes bone deformities, chronic lung diseases, and sometimes it leads to death. The majority of child labour belongs to the middle age group of children.
For policy formulation an integrated approach to education, skill training, credit provision and income-generation will help in addressing the problem of child labour. Education in particular is a key strategy to combat child labour. The education offered must be effective, it must be affordable, of good quality and should improve the productivity of children. There is also a need to provide free basic education and also supplement the income of the parents so that they can send the children
41

The Lahore Journal of Economics, Vol.7, No.2
to school. Adult education programmes must be introduced effectively which will also help to reduce child labour. Education may be linked with skill training and provision of credit to attract the children and parents. Moreover, family planning must also be introduced through education and schools. This will help to reduce fertility and ultimately reduce family size and child labour. The present system of family planning is not helping achieve fruitful results. Along with these measures, enforcement of labour laws is essential.
42

M. Aslam Chaudhary and Farzana Naheed Khan
Appendix Table 1: Location of Work Places in Dera Ismail Khan City
S. No.
Work Place Locality
1 Brick Kilns Alongside Bannu Road and University Road
2 Embroidery Gomal Market, Khyber Market, Hiyatullah Mohalla
3 Homes (servants)
Cantt area, Circular Road, within Circular Road
4 Hotels (helpers)
Different areas
5 Metal Work Rahim Bazar
6 Service Station
Tank Ada and surroundings, Baanu Ada, University Road
7 Shops Gomal Market, Khyber Market, Hiyatullah Mohalla
8 Tailoring Gomal Market, Khyber Market, Hiyatullah Mohalla
9 Wood Work Rahim Bazar
10 Workshop Tank Ada and surroundings, Baanu Ada, University Road
43

The Lahore Journal of Economics, Vol.7, No.2
References
Ashagrie, K., 1993, “Statistics on Child Labour”, Bulletin of Labour Statistics, 3, 11-24.
Bassu, K., 1999, “Child Labour: Causes, Consequences and Cure with Remarks on International Labour Standards”, Journal of Economic Literature, 37, 3, 1089-1119.
Bassu, K., 2000, “The Intriguing Relation between Adult Minimum Wage and Child Labour”, The Economic Journal, 110, 50-60.
Becker, G., 1962, “Investment in Human Capital: A Theoretical Analysis”, Journal of Political Economy, LXX, 2, 9-49.
Becker, G., 1965, “The Theory of Allocation of Time”, The Economic Journal, 75, 493-517.
Bequel, A. and Boyden, J., 1988, “Combating Child labour ”, Geneva, ILO.
Bequele, A. and J. Boyden. J., 1988, “Working Children: Current Trends and Policy Responses”, International Labour Review, 127 (2), 153-171.
Bhatty, K., 1998, “Education Deprivation in India: A Survey of Field Investigations”, Economic and Political Weekly, 33 (27), 1731-1740.
Boyden, J., 1991, “Working Children in Lima, Peru”, In Williams Myers (ed), Protecting Working Children, London.
Bura, N. 1995, “Born to work: Child labour in India”, Oxford University Press, Delhi.
Chaudhary M. Aslam, 2002, Foreign Debt, Dependency and Economic Growth in South Asia, Journal of the Institute of Bankers in Pakistan, Karachi.
44

M. Aslam Chaudhary and Farzana Naheed Khan
Chaudhary M. Aslam and Kiyoshi Abe, 1999, Pakistan Economy: Past Trends, Current Situation and Future prospects, Chiba University Economic Journal, Japan.
Collins, J., 1983, “Fertility Determinants in a High Andes Community”, Population and Development Review, 9 (1), 61-75.
Dreze, J., and Kingman, G. 1999, “School Participation In Rural India”, Delhi School of Economics And University Of Oxford (Mimeo).
Grootaert, C. and Ravi, K., 1995, “Child Labour: An Economic Perspective”, International Labour Review, 134(2), 187-203.
Government of Pakistan, 2001, Economic Advisors Wing, Finance Division, “Economic Survey of Pakistan 2000-2001.
International Labour Office, 1992, World Labour Report 1992, Geneva.
International Labour Office, 1993, Bulletin of Labour Statistics, Geneva.
International Labour Organization, 1996, Bureau of Statistics, Geneva.
ILO, 1998, Child Labour: Targeting the Intolerable, Geneva.
Khan, S., 1982, “Labour Force Participation of Children: A Case Study”, Pakistan Economic And Social Review, 53-70.
Khasnabis, R., 2001, Child Labour In South Asia, New Delhi.
MHCHD, 1999, A Profile of Poverty Islamabad.
Marshall, A., 1920, Principles of Economics, 8th Ed. Macmillan, London. [Original published 1890].
45

The Lahore Journal of Economics, Vol.7, No.2
Marx, K., 1867, Capital: A Critique of Political Economy, [reference to 1954 ed. Progress Publishers, Moscow].
Mochling, C., 1998, State of Child Labour Laws and the Decline of Child Labour, Mimeo, Ohio State University.
Pigou, A., 1920, The Economics of Welfare, [reference to 1962 ed. Macmillan, London].
Ray, R., 2000, “Analysis of Child Labour in Peru and Pakistan. A Comparative Study”, Journal of Population Studies, 13(1), 3-19.
Ray, R., 2000, “Child Labour, Child Schooling, and their Interaction With Adult Labour: Empirical Evidence For Peru and Pakistan”, World Bank Economic Review, 14(2), 347-67.
SPARC, 2002, The State of Pakistan’s Children 2001, Islamabad.
Syed, K., A. Mirza, R. Sultana and I. Rana, 1991, “Child Labour: Socioeconomic Consequences”, Pakistan and Gulf Economist, 10, 36-39.
Tienda, M., 1979, “Economic Activity of Children in Peru: Labour Force Behavior in Rural and Urban Contexts”, Rural Sociology, 44, 370-391.
Silvers, J., 1996, “Child Labour in Pakistan”, The Atlantic Monthly, February.
UNICEF, 1997, State of the World’s Children Report.
Weiner, M., 1991, The Child and the State in India, Princeton University Press, New Jersey.
46

Karamat Ali and Rana Ejaz Ali Khan
Private Schooling - A Quality Puzzle
Karamat Ali and Rana Ejaz Ali Khan*
Abstract
Primary school enrollment rates in Pakistan are lower than in other countries at the same level of economic development. The proportion of children reaching grade 5 is about half that in Sri Lanka and China and three-quarter that in India. Nationally, the gross primary school ratio is 74, and 101 for boys and 45 for girls. According to the National Education Policy 1992-2002, the target of literacy rate was set at 70 percent by the year 2002, which was achievable besides other measures, by inviting the private sector into education. Now, overall, private education accounts for about 10-12 percent of gross enrollments. The government of Pakistan has established a goal of universal primary enrollment by the year 2006. In the present study the quality characteristics of private schooling are discussed, i.e. qualitative aspects of schools, physical infrastructure of schools, teachers’ qualification and salaries, and fee, dropout rate, and repletion rate of the students, etc.
Introduction
Education is considered to be the major form of investment in human capital and serves as a key input in human capital formation. It not only raises the productivity and efficiency of individuals but also improves the quality of life by increasing earnings. Getting more education not only ensures higher paying jobs but also creates awareness about health, hygiene and nutrition. There is evidence to suggest that it also leads to small family size and greater female labour force participation. The importance of education is reflected in the fundamental
* Karamat Ali is the Chairman, Department of Commerce, Bahaudin Zakaria University Multan. Rana Ejaz Ali Khan is Lecturer in Economics, Govt. Faridia College Pakpatan.
41

The Lahore Journal of Economics, Vol.7, No.2
teachings of Islam, which places great emphasis on acquiring education for both males and females.
Moreover, primary education is a fundamental human right. It is an essential feature of economic development. There is no country which is economically developed and has a low primary school enrollment rate. In Pakistan the gross primary school ratio is 101 for males and 45 for females and the percentage of primary school entrants reaching grade 5 is 48. The comparable figures in India are 110, 90 and 62 in Sri Lanka 114,112 and 98 [UNICEF 1999]. Alderman., Behrman., Ross and Sabot [1996] found that low school enrollment and achievement in Pakistan are caused by an insufficient number of schools.
The situation of education in Pakistan is generally unsatisfactory. Low enrollment rates at the primary level, wide disparities between regions and gender, lack of trained teachers, deficiency of proper teaching materials, and poor infrastructure of schools reflect the substandard state of education. In the rural areas, the situation is more distressing. The chronic neglect of the social sector in general, and of the education sector in particular is the primary reason for the sad way in which education has been ignored, that is the government barely spends $3 per capita on activities important for human care, compared with $130 spent by South Korea and Malaysia [Haq 1992:11]. Pakistan spends 2 percent of the central government expenditures on education, while Sri Lanka spends 10 percent and Bangladesh 11 percent [UNICEF 1999]. One of the reasons underlying the poor allocation for the social sector is the diversion of a huge chunk of budgetary resources to defense. Pakistan’s military expenditures have historically been in excess of 6.5 percent of the GNP [UNDP 1995].
Access to primary schooling is widely accepted as a priority in the fight against poverty. Nevertheless, the government of Pakistan faces a daunting task in its efforts to expand the delivery of educational services due to
42
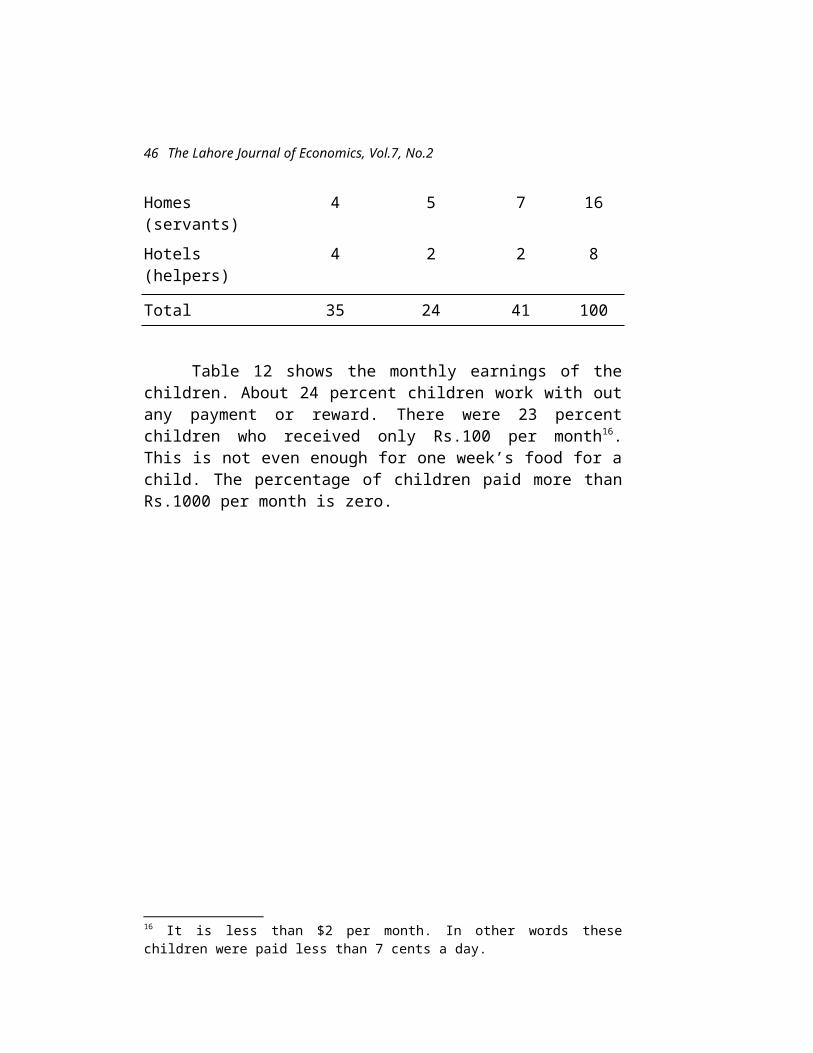
Karamat Ali and Rana Ejaz Ali Khan
rapidly expanding populations and tight government budgets. On the other hand, public educational expenditures are often used inefficiently, providing school buildings where they are unneeded, paying teachers who are unqualified or who do not perform, and providing school supplies that are inadequate and ill-timed.
Consequently, parents are responding to perceived inadequate public education by enrolling their children in private schools. As Kingdon [1996a] illustrates, the extent of this phenomenon in developing countries may be under-appreciated. Governments occasionally prohibit, often regulate, and frequently ignore private schooling. Thus data on the extent and distribution of such schooling is seldom collected by statistical agencies.
A principal reason for the reluctance of governments to recognise private education as contributing to its overall educational policy is a concern for equity, as equality of access to schooling may reduce earning inequality without the necessity of controversial asset or income transfers. It is not clear that poor households are able to pay enough to support the alternative of high-quality private schools. Conversely, private schools which can deliver services at fees sufficiently low to attract poor families may not deliver services of adequate quality. Some contend that private schools which cater to the poor are exploiting low income, often illiterate, parents who are not capable of assessing if their children are learning or not.
According to the National Commission on Education 1964, the objective of the commission was to equalise the opportunities for education and correct the growing imbalance between various types of education. For this purpose the government nationalised private schools, which literally ruined the excellent private educational institutions run by extremely dedicated foreign missionaries and Pakistani NGOs like Anjuman-e-Islam. The standard in privately run institutions was generally higher than in government institutions. Moreover, these institutions were self-financing and were in a very effective
43

The Lahore Journal of Economics, Vol.7, No.2
way supporting the inadequate government efforts in the field of education. By nationalisation the government bore the entire expenses of private schools so government expenditure on education doubled without any increase in capacity and substantial decline in quality of education in former private schools.
Because of official discouragement of the opening of private schools and the low level of expenditures on education during the 1970s, the growth rates of all educational indicators fell drastically. Negative growth rates were observed for both the number and enrollment in high schools. The period of the 1980s witnessed a rapid expansion in the education sector. Firstly, this was due to the fact that the number of institutions for females and number of female teachers both grew at rather high rates. Since the 1980s, enrolment at the primary level, especially for females has been greatly emphasised by each government. Secondly, total expenditure on education as a percentage of GNP was only 0.99 in 1960-61, the proportion was increasing, but slowly. There was a sharp increase in the proportion of expenditure on education as a percentage of GNP during 1983-88 and it reached 2.4 percent. The last but not least factor was private schooling, which again emerged after more than a decade.
Although the government is the main provider of education the private sector is also playing an important role. Private sector managed institutions, mainly schools, have grown rapidly in recent years, particularly in the big urban centers. In two studies17 conducted in Karachi, Lahore and in five districts of the Punjab, 54 percent of children of primary school-going age (while 70 percent in Lahore) from 3500 low and middle-income households were enrolled in private schools. In the Punjab, more than 95 percent of these schools were charging a monthly fee of less than Rs.100 per month. This indicates the extent of
17 Kardar, Shahid 1996 “Demand for Education among Low and Middle Households in Karachi” Systems (Private) Limited, October 1996; a study by the same author under the same title for Lahore and five districts of Punjab, September 1996.
44

Karamat Ali and Rana Ejaz Ali Khan
the insufficiency of government schools to deliver the quality of services demanded by parents.
The growth of the private education system is a positive development. Though this is mainly an urban phenomenon, it is increasingly filling the gap in the public education system. It is estimated that, overall, private education now accounts for about 10-12 percent of gross enrollment [Bregman and Mohammad 1998:81]. According to independent estimates, Punjab’s 80 percent school-going children attend government schools and the remaining 20 percent go to private schools. In the cities however, half the children go to private institutions18. Almost all these schools are profit-based, but parents are still willing to sacrifice a good deal of their meager incomes to get better educational quality in return. In these settings, head teachers, teachers, students and community are excited about the educational process and take schooling very seriously. Often this is not due to any positive support from the public education administration.
There are serious doubts about the quality of education in public sector schools. A survey19 of private and public schools in which children of low-income households were enrolled, showed that private schools were imparting education of a higher standard. In a test comprising simple arithmetic and Urdu language questions, administered to around 6800 students, children attending private schools (charging a monthly fee of Rs.100 or less) performed significantly better than those enrolled in public sector schools. Overall, in 75 percent of private schools more than 75 percent students passed both tests, in contrast with 33 percent in the case of public sector schools. Similar results were obtained from a survey20 of 302 schools in the Punjab. Overall, in 52 percent of the private schools, 75 percent students passed both tests whereas in government schools this percentage
18 The Daily “The News International” (Lahore) Sept. 7, 1999 19 Kardar, Shahid “A Case of Schools in Lahore” Systems (Private) Limited, 1994-520 Kardar, Shahid “Survey of Schools in Five Districts of Punjab” Systems (Private) Limited, 1997.
45

The Lahore Journal of Economics, Vol.7, No.2
was less than half, at 21.5 percent. The difference between private and public schools was more striking among the best performing institutions in the two categories. In 29 percent of private schools, 90 percent of students passed both the tests, compared to 9 percent in the case of government schools.
The conditions and quality of education of government schools has led many parents to reject them in favour of private schools which offer more relevant courses and above all teach English which enhances marketability. Furthermore, disillusionment with the examination system has led these schools to offer “O” and “A” level courses, which are accepted worldwide. Wright [1999:13] found that the rate of return to private schooling is not higher than the rate of return to public sector schooling. In terms of the school quality debate, the school quality does not have an impact on the rate of return to schooling.
Private schools are filling the gap left by the inadequate government schooling system. At present, there are 30,000 private schools, in which over a million children are enrolled [SPARC 1997:93]. The private schools are also filling the need for pre-school education, an area left largely neglected by the government. There is no official policy or programme concerning pre-school education although its benefits relating to lower dropout rates are quite established.
Private schools have better outcomes than government schools holding fixed measured home and school inputs into the human capital production process. This is consistent with the parents’ revealed preference for private schools over government schools, even by low income households which face higher costs for private schooling [Alderman, Orazem and Paterno 1996:23]. The consensus from studies of the relative effectiveness of public versus private schools in developing countries is that the predicted performance of children in private
46

Karamat Ali and Rana Ejaz Ali Khan
schools is higher than predicted performance in government schools [Kingdon 1996b].
The per pupil instructional expenditures are a measure of teacher resources available to students. Instructional expenditures are primarily teacher salaries. Because salaries rise with teacher education and experience, the measure should reflect teacher quality. Higher expenditures per pupil can indicate both higher salaries per teacher and lower pupil-teacher ratio. Due to lower pupil-teacher ratio in private schools, the per-pupil expenditures are better here [Alderman, Orazem and Paterno 1996:9].
The private schools have a good implication for the enrollment rate. As instructional expenditure in private schools rise holding fees constant, the no-schooling option decreases. The effect is most pronounced for the poorer households. At the same time, increase in private school instructional expenditure causes a shift toward private schools. The effect is partly a move from the no school to private school option, but it is primarily a shift from government schools [Alderman, Orazem and Paterno 1996:21].
The good quality of education in private schools is evident from the fact that in low-income neighbourhoods of Lahore a 10 percent increase in household income causes a 1.2 percent increase in the enrollment rate in these schools (Alderman, Orazem, and Paterno 1996]. The reduction in the proportion of children enrolled in government schools and increased use of private schools clearly indicates the increasing demand for better quality education and disillusionment with government schools [SPARC 1997:86].
On the other hand, the major objection to these schools is that they take unfair advantage of parents in search of quality education for their children by charging them exorbitant fees, without delivering quality education.
47
The Lahore Journal of Economics, Vol.7, No.2
Objective
The objective of the study is to analyse the quality of the private schools from four perspectives: Qualitative dimensions of school Physical structure of the school Teacher’s perspective Student’s perspective
Methodology and Survey
The universe of the study consisted of all the private schools in the country. To keep the study within manageable limits a sample approach has been adopted. The sample comprised private schools of Pakpattan city. The sample is selected purposely as the city is not as advanced as Karachi, Islamabad and Lahore, where national and some international chains of private educational institutions operate, and not so backward such as some cities in Balochistan and interior Sindh. Private schools in rural areas and deeni madaris were out of the scope of the study.
There are slightly more than 80 private schools in the city of Pakpattan, 60 private schools were surveyed. This includes all categories of schools regarding fees structure and medium of instruction.
Only those schools have been included in the survey which had been working for more than 2 years, because usually at the start of the school the number of students in the school are thin, which may cause a bias towards the calculation of ratios.
A comprehensive interview schedule was developed. The data analysed for the study was collected by interviewing the principals of the schools supported by staff members. The response rate was eighty percent (some participants hesitate to give information about their
48
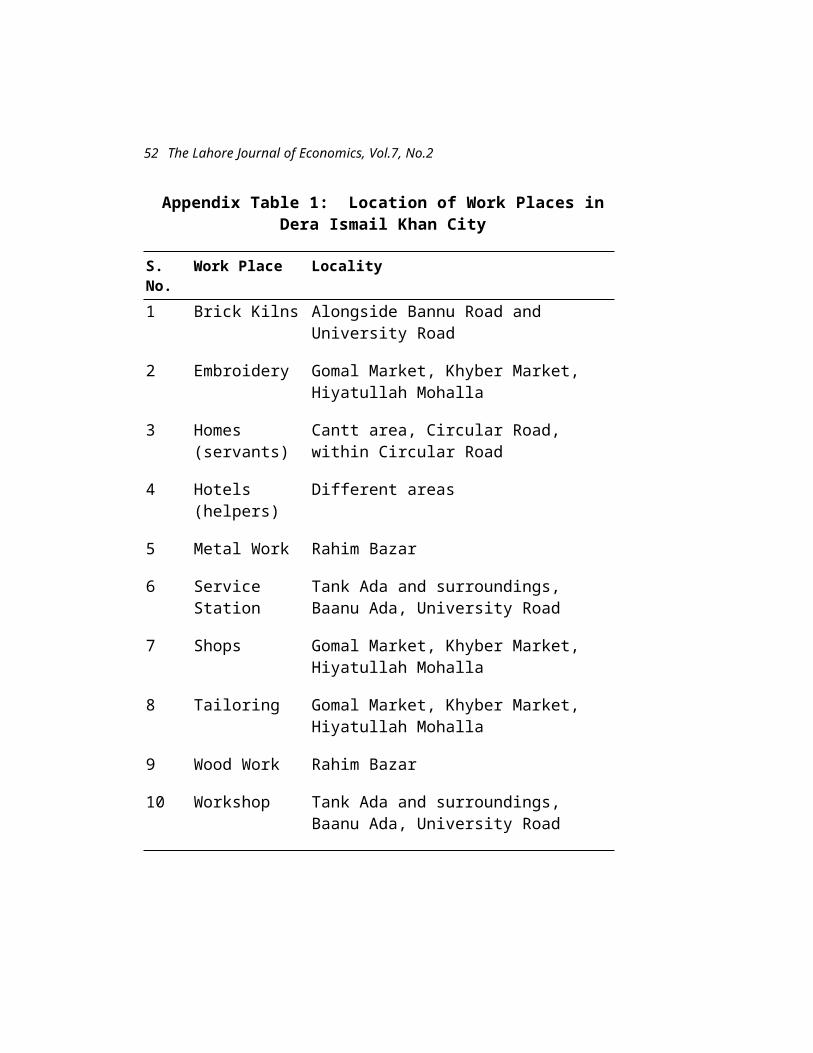
Karamat Ali and Rana Ejaz Ali Khan
school, may be due to fear of the imposition of tax). The questionnaire is presented at the end of the paper.
Results and Discussion
Private schools provide employment to local male and female educated youth. It was observed that several students come from villages or from a distance while the public sector schools are present near their residences. It seemed to support the findings of Alderman, Orazem and Paterno [1996:19] that the households are very sensitive to school quality.
The social and economic set up of the city differ from the big cities such as Karachi, Lahore and Islamabad, so no school of the national chain of private schools operates in the city. The reason is that there is no demand for such schools in the area or the people cannot afford such schools.
Qualitative Dimensions
Registered schools: 69 percent of the schools have been found registered. The condition of the unregistered schools reveals that they do not fulfill the requirements/conditions of registration.
Affiliated schools: Only 0.06 percent of the private schools have been found affiliated to board/district education committees. The ratio of affiliated schools is negligible, so a large majority of schools are not working under the rules and regulations of concerned boards/district education committees. As the affiliation of schools require some specifications concerning teachers’ education, training, salaries, and building structure etc. the majority of the schools are ignoring these requirements.
Level of school: The level of the schools to which they are offering education is presented in Table 1.
49

The Lahore Journal of Economics, Vol.7, No.2
Table–1: Schools by Level
Level of School SchoolsUpto grade 5 11
PercentUpto grade 8 80
PercentUpto grade 10 9
PercentTotal 100
It is evident from the table that the majority of the private schools in the city work up to grade 8. The reasons may be:
The schools upto grade 8 do not need affiliation The results of the schools upto grade 8 are made by the
schools, so it is easy to show the high pass percentage of schools
Due to dropout, there is less demand for schools after grade 8
Coeducation: The ratio of schools offering coeducation by grade is shown in Table 2.
Table-2: Schools Offering Co-education by Grade
Coeducation SchoolsUpto grade 5 100
PercentUpto grade 7 90
PercentUpto grade 10 3
PercentUpto grade 5 coeducation is prevalent in private
schools. This means the parents are ready to send their children to coeducational institutes at this level.
50

Karamat Ali and Rana Ejaz Ali Khan
The official policy of segregated boys and girls public sector schools and the resultant dual administrative system contributes to inefficient use of resources. The policy on segregated schools causes significant inefficiencies in location where all children of school-going age could be accommodated in one school. In sharp contrast, the private sector provides co-education schooling facilities up to grade 5, a situation readily accepted by the parents. The segregation policy is costly to implement, it also runs contrary to general sentiments [Kardar 1998:57].
Experience of school: The percentage ratio of private schools by their experience/working age is shown in Table 3.
Table-3: Working Age of Schools
Working Experience Schools1-5 years 56.5
Percent6-10 years 30 PercentMore than 10 years 13.5
PercentTotal 100
The table shows that more than half of the schools have been established within the last five years, so it is evident the trend of private schooling is increasing. It represents the increasing demand of private schools.
Time on task: The daily time on task is found 6 hours in the private schools that is equal to public sector schools. In the majority of the schools (62 percent) the annual time on task is 30 days (3 hours per day) more than public sector schools.
In Pakistan, taking into account all the formal vacations and holidays, the school year lasts on average only 6-7 months. The number of hours of instruction “time-
51
The Lahore Journal of Economics, Vol.7, No.2
on-task” for pupils at the level of basic education is less than 50 percent of that for Chinese and Japanese students, less than 75 percent of that for Korean and Taiwanese students [Bregman and Mohammad 1998:78-79].
The private schools under study offer more time on task as compared to public sector schools, as only 38 percent of private schools have summer vacations of 2 months, i.e. equivalent to the public sector schools, while the remaining have 1 month. So it is obvious that the time on task is higher than that of public sector schools.
The reason for more summer vacations in the public sector is given as the harsh weather conditions and scarce resistant facilities. The private schools have less summer vacation, whether they provide good weather resistant facilities or not. This needs further research.
Physical Structure of Schools:
Area of the schools: Some schools in the city are so congested that they have no place to gather the students at the daily commencement of the school. These schools do not even give recess to the students.
Physical Facilities: The ratio of the private schools providing different physical facilities is presented in Table 4.
Table-4: Schools Providing Different Physical Facilities
Physical Facility Schools Offering
Purpose built building 3 percentProvision of electricity 100 percentProvision of toilet for students 100 percentProvision of separate toilet for teachers
63 percent
Provision of boundary wall 100 percentProvision of potable water 100 percent
52

Karamat Ali and Rana Ejaz Ali Khan
Lawn used as playground 4 percentTable tennis facility 1 percentVolleyball ground NilBadminton court 1 percentBasketball court Nil
In the private schools the electricity, toilet for students, boundary wall, and potable water are provided by 100 percent of the schools. The majority of them have separate toilets for teachers. But in the public sector schools 21 percent are without potable water, 74.5 percent are without electricity, 61.52 percent are without toilets, and 74 percent are without a boundary wall21.
Although there are only 3 percent private schools working in purpose built buildings, all the schools work in safetywise satisfactory buildings. On the other hand in the district of Pakpattan 119 public sector schools work without buildings. In the province of Punjab 25 percent of the schools function in the buildings declared dangerous by the Building Department22. The figures boost the demand for private schools.
Private schools are far behind in the provision of games and exercise facilities. Only 4 percent of the schools provide lawns which operate as play grounds while the remaining provide no play grounds or exercise facilities as the space in these schools is insufficient for play and exercise. On the other hand 74 percent public sector schools have proper playgrounds23.
As the private schools have smaller area generally to analyse the provision of facilities for physical fitness of students, only those game facilities have been included in the study which require comparatively less space, i.e. table tennis, volley ball, badminton and basket ball. But
21 The Daily “The News International” (Lahore) Feb 3, 2002.22 The Daily “The News International” (Lahore) Feb 3, 2002.23 The Daily “The News International” (Lahore) Feb 3, 2002.
53

The Lahore Journal of Economics, Vol.7, No.2
almost none of the private schools provide these games, except 1 percent of schools have table tennis and the same ratio for basketball. As private schools are growing rapidly, it shows the high demand for these schools. The figures about the provision of games and exercise facilities are not supportive of the demand of private schools by parents. It means the parents do not take into account these facilities or are unconscious about the advantages of games/physical exercise that results in good physical and ultimately mental health.
Teachers’ Perspective: The qualification of teachers in the private schools is given in Table 5.
Table-5: Qualification of Teachers
Qualification TeachersMatric 10.4
percentMatric. PTC 9.4
percentFA/FSc 29.1
percentFA. CT/FSc. CT 8.6
percentBA/BSc 23.2
percentBA. B.ed/BSc. B.ed 11.0
percentMA/MSc 8.31
percentMA. M.ed/MSc. M.ed 0.80
percentTotal 100
The quality of education is directly proportional to the qualification of the teachers. The results of the present study show that the majority of the teachers (29.1) are simple FA/FSc certificate holders. The results of the present study are supported by the results of the
54
Karamat Ali and Rana Ejaz Ali Khan
Statistical Bureau of Pakistan24. According to the Bureau a significant number of school teachers in private schools are under-qualified. The Bureau revealed that more than 35.34 percent primary school teachers in the private sector are matriculates and the same ratio of the teachers possess intermediate certificates and only 5.48 percent have master’s degree. Similarly, private middle schools face the same plight where 28.27 percent have matriculation certificates and intermediate certificate holders are 34.13 percent and master’s degrees holders are 7.44 percent.
Trained Teachers: The percentage ratio of the trained teachers by their education level in the private
schools is shown in Table 6.
Table-6: Trained Teachers by their Qualifications
Qualification of Teachers Trained Teachers
Matric 36 percentFA/FSc 20 percentBA/BSc 23 percentMA/MSc 8 percent
The training of the teachers is an important measure of the quality of teaching. In private schools the majority of the teachers is untrained. The finding matches the results of the Statistical Bureau of Pakistan25 which states that more than two-thirds of the teachers at privately-run primary, middle and high schools in the country are raw and untrained. In the private primary schools 66.68 percent teachers are untrained. The ratio of the same kind of teachers in middle and high schools is 63.09 and 58.28 percent respectively.
24 Cited in the Daily “The News International” (Lahore) April 12, 200125 Cited in the Daily “The News International” (Lahore) April 12, 2001.
55
The Lahore Journal of Economics, Vol.7, No.2
Pay Structure of Teachers: The pay structure of the teachers in the private schools according to their qualification is shown in Table 7.
Table-7: Pay of Teachers by their Qualification
Qualification Average pay/month (Rupees)
Middle 500Matric/ Matric. PTC 680FA/ FA. CT/FSc/FSc. CT 920BA/ BA. B.ed/BSc/BSc. B.ed 1240MA/ MA. M.ed/MSc/MSc.M.ed 2010
It is evident from the table that the teachers are severely under-paid in private schools. Meir [1991] found that if the teachers are under-paid they are not motivated26. Hayes [1987:141] described that at low pay or under-pay, it is little wonder the best talent does not enter the field of education. It means that the low pay of the teachers represents the low standard of education in private schools. Alderman, Orazem and Paterno [1996:9] narrates that salaries rise with teacher education and experience, so high salaries reflect teacher quality. It implies that the quality of education in private schools remains low. The low quality may be negated by the fact that, despite paying much lower salaries to teachers, the private sector schools have higher instructional salaries per pupil than public sector schools, partly due to a lower pupil teacher ratio. If the lower salaries are still considered to be a proxy of low quality of education, it is against the findings of Alderman, Orazem and Paterno [1996:23] that the parents have strong demand for private schools in response to better quality and learning opportunities offered by these schools.26 Meir, U 1991 “Compulsory Education and Child Labor” pp.80 cited in Boyden, Jo 1994 “The Relationship between Education and Child Labor” Innocenti Occasional Papers, CRS # 9 (September). International Child Development Center, UNICEF, Florence
56
Karamat Ali and Rana Ejaz Ali Khan
The demand for private schools may be due to the unavailability of public schools as the public sector schools are present at long distances and the private schools exist at comparatively near distances. The other factor which explains the high demand for private schools may be the marketing strategy of the private schools which only exists in these schools.
The notion that the performance of teachers is eroded by the low salaries is negated by the survey results of private schools. The teachers in private schools get barely one-third the average salary earned by public sector schools but produce better output of students proxied by high demand for private schools. This suggests that factors other than salaries are more important in determining the quality of education.
The schools give increments annually: Only 61.5 percent of private schools give annual increments to the teachers. Like the pay structure in private schools, the ratio of the schools giving annual increments to teachers represent exploitation of the teachers.
The pay structure and the increment figures lead to the teachers’ casual behaviour. That is the reason experienced teachers are non-existent in private schools while the experience of teachers account for the quality of teaching.
Ratio of female to male teachers: The ratio of female to male teachers is 78.31 percent. The high female to male teachers’ ratio represent two aspects, i.e. female teachers are usually willing to work at low pay, that is the negative aspect and secondly female teachers are considered to be better school teachers especially up to grade 5. Moreover, Kim et. al. [1998a:12] found that female school teachers are critical to break the cultural barriers for girls’ schooling.
The private schools provide employment to educated girls of the city, which have less chances to avail
57

The Lahore Journal of Economics, Vol.7, No.2
job opportunities outside the city owing to the social and cultural background.
Family members of the school owners teaching in school: On average 1.2 teachers per school are owners of the school. Male family members of the owners teaching
in schools are 0.76 per school on average and female family members of the owners teaching in schools is 0.24
per school on average.
Student’s Perspective:
Fee structure: The percentage ratio of private schools with different fee structures is shown in Table 8.
Table-8: Fee Structure of Schools
Fee/month SchoolsUp to Rs.200 69 PercentRs.201-400 24 PercentRs.401 and above 7 PercentTotal 100
The fee structure shows that the majority of the private schools charge a fee up to Rs.200 per month. It shows that the lower class of the community also sends its children to private schools. It has been noted that all the schools charging a fee less than Rs.200 are offering Urdu as the medium of instruction. So if English is considered as a quality measure and a factor to cause the high demand for private schools, then both aspects are negated. Factors such as private schools are more prevalent than public schools, and private schools adopt marketing strategies become dominant.
Students failed in the last examination: It is found that only 16 students out of more than 6500 students failed in the last year in all the private schools of the city, and only 2 percent schools have passed the students on merit basis.
58
Karamat Ali and Rana Ejaz Ali Khan
The failure rate in the schools with respect to dropout rate of the students is a contradictory matter. Some studies argue that repetition is harmful as it hurts the child’s self-perception, offers no academic benefits to the child and it costs parents and economies financially. Holmes [1989] concluded that, in subsequent school years after repetition, retained children were almost one-third of the standard deviation behind their matched counterparts on achievement measures. Reynolds [1992] compared retained and promoted children who had been matched on the basis of achievement test scores and teacher ratings prior to grade repetition, and found that repeaters performed eight months lower in reading and seven months lower in mathematics than the matched control group.
Some other studies argue that repetition does not harm self-image and does impose student achievement by allowing students who are ill prepared for the next grade to catch up academically and emotionally [Eisemon et.al. 1993 and Gomes-Neto and Hannushek 1994]. Gomes-Neto and Hanushek [1994] found that repetition enhances student achievement, while retained students are below average in performance before repetition, they move to above average after repetition.
King et. al. [1999:15] found that in Pakistan promotion has a larger effect on continuation. However merit-based promotions have a 12 times larger effect than that of promotion based on other factors.
Low failure rate is a significant factor, which makes the private schools attractive for parents and students. Many children are discouraged by grade repetition and as success at government sector schools is not guaranteed it result in demand for private schools. Families may be bitterly disappointed by repetition phenomenon and they cannot afford repeating grades by the children, so they prefer private schools.
59

The Lahore Journal of Economics, Vol.7, No.2
The repetition rates are high in public sector schools as compared to private sector schools. Bregman and Mohammad [1998:73] narrated that repetition rates are less accurate in private sector schools because at primary and secondary level they depend heavily on assessment by untrained teachers, otherwise the failure rates are probably high.
Medium of instruction and fee structure: The percentage ratio of the private schools by medium of instruction and the fee structure is shown in Table 9.
Table-9: Schools by Medium of Instruction and Fee Structure
Medium of Instruction Fee/month SchoolsUrdu Up to Rs.200 90
PercentUrdu and English Rs.201-400 5
PercentEnglish Rs.401 and
above5 Percent
Total 100
The majority of schools charge fees less than Rs.200, and this means the demand for such schools is high in poor households. The notion confirms the findings of Alderman, Orazem and Paterno [1996:19] that private schools are the dominant choice even for poor households.
As concerns the medium of instruction and learning of English as a measure of quality of education and an incentive for the demand of private schools by parents, the majority of the schools are Urdu medium though they charge lower fees. That is they do not offer quality education in this sense.
Only 5 percent of the schools offer English as the medium of instruction to students, while they charge fees more than Rs.400 per month. If the offering of “O” and “A”
60

Karamat Ali and Rana Ejaz Ali Khan
level are assumed to be good standard of education, none of the schools offer “O” or “A” level courses including those which charge fees of Rs.400 or more per month.
Schools offering computer education: In the private schools 23 percent offer computer education. Computer education is considered as a quality symbol of the schools, even a status symbol. If it is considered as a quality measure, private schools are forward in this aspect as compared to public sector schools. As a status symbol, private schools are using it as marketing strategy because parents and even children are more attracted to the subject.
Pupil-teacher ratio: The pupil-teacher ratio for grade 1-10 is found to be 23.57, as approximately all the teachers teach all the grades and so it is difficult to calculate pupil-teacher ratio separately for grades 1-5, 6-8 and 9-10. But as the number of students decreases as the level of grade increases, the pupil-teacher ratio decreases.
The quality of education can be estimated by pupil-teacher ratio [Malik and Nazli 1999:371]. The pupil-teacher ratio in Pakistan is quite high, i.e. 43 at grade 5 level, and 19 at grade 10. The pupil-teacher ratio raises the utility in private schools but lowers it in public sector schools. The difference in parental response across the school types is in all likelihood related to the lower average pupil-teacher ratio in private schools than in public sector schools.
Dropout rate: The dropout rate in private schools at different grades is represented in Table 10.
Table-10: Dropout Rate of Students by Grade
Grade Dropout Rate
Grade 1-5 30.32Grade 6-8 27Grade 9-10 13
61
The Lahore Journal of Economics, Vol.7, No.2
By the assumption that private school goers do not change the option of public/private schools, and remain in private schools, the dropout rate up to grade 5 is calculated as 30.32 percent, i.e. out of the total students who get admission in grade 1, 30.32 percent do not reach grade 5. The figure may be biased due to the recognition of the fact that 56 percent of private schools have been opened in the last five years so the number of students up to grade 5 at the aggregate level for all the schools is high.
The dropout rate is another measure of the quality of education [Malik and Nazli 1999:371]. Pakistan faces a severe problem of extremely high dropout rates at the grade 5 level as compared to other countries. Only 48 percent of the enrolled students in Pakistan complete grade 5.
Pass percentage in the Board examination: The quality of education in private schools cannot be measured in terms of pass percentage in the board examination. The fact is that in order to maintain the 100 percent result in matric and middle examination, the schools mischievously keep the students in the previous class or make them appear as private students. In this way the school result remains 100 percent. So the failure rate in private schools is negligible even in the Board examination.
Conclusion
The average level of education of the teachers of private schools is far lower than the public sector schools. The majority of the schools operate in houses and the space available to the students is inadequate. Even though parents prefer private schools, the reasons may be as follows:
- The parents are enamoured by the quality of education in private schools.
62

Karamat Ali and Rana Ejaz Ali Khan
- The marketing strategy of private schools in stronger, so they attract more students.
- Despite the lower level of education of teachers in private schools, parents are satisfied, which means that the teachers are hardworking or strictly monitored.
- The schools economically exploit teachers.- Private schools have untrained teachers, which
causes the standard of education to slide.- The working days are more in private schools as
compared to government schools.- Teaching of English in private schools is better as
compared to public schools.
As concerns the provision of quality education by private schools to the poor community, the schools are playing a negligible role. The higher fee charging schools provide comparatively better education facilities.
At the aggregate level private schooling is contributing a great deal to the public. The private schooling sector saves a considerable amount of government expenditures. Moreover, they provide job opportunities to the youth of the city, especially girls.
More research is needed to assess the quality of the private schools.
Recommendations
Registration and affiliation of all private schools is recommended to boost the quality of education.
To keep the students physically fit, it is necessary to provide sports facilities to the students. The provision of this facility must be part of the conditions of registration or affiliation of schools.
Monitoring of the functioning of schools, pay structure of teachers, qualification of teachers, etc. by the
63

The Lahore Journal of Economics, Vol.7, No.2
education department is recommended. The parent teacher associations may also do the monitoring.
The examination system of the private schools needs to be improved and promotion should be based on merit.
As the dropout rate is also high in private schools, some general measures like parent teacher associations, ameliorating of financial problems of parents, extra classes to decrease failure rate and community participation are needed.
Private schools which offer good quality of education may be selected to be subsidised by the government to provide quality education to poor parents, as Kim et. al. [1998b] have suggested that subsidisation may boost the enrolment rate at the aggregate level.
Training of teachers is necessary for high quality education, so the private schooling sector or the public sector should provide training facilities for private sector teachers.
64

Karamat Ali and Rana Ejaz Ali Khan
Questionnaire
1. Name of school ………………
2. How long the school has been working ………….
3. Level of school ……………..
4. Medium of Instruction ……………….
5. Registered Y/N
6. Affiliated Y/N
7. Co-education Y/N if yes up to grade ……………..
8. Is the schooling offering A or O level Y/N
9. Daily duration of school ………………….
10. Duration of daily break ………………….
11. Duration of summer vacation …………….
12. Duration of winter vacation ………………
13. Is the school has following physical facilities:
a) Purpose built building Y/N
b) Electricity Y/N
c) Toilet for students Y/N
d) Separate toilet for teachers Y/N
e) Boundary wall Y/N
f) Drinking water Y/N
g) Lawn for playing games Y/N
h) Table tennis facility Y/N
65

The Lahore Journal of Economics, Vol.7, No.2
i) Volley ball ground Y/N
j) Badminton court Y/N
k) Basket ball court Y/N
14. Number of teachers in the school …….= Male …..+ Female …….
15. Number of family members of the owner of the school who are teaching in the school ………=Male …….+ Female. …….
16. Qualification of Teachers. Number of teachers having qualification:
a) Middle …………………
b) Matric …………………
c) Matric PTC. ……………
d) FA/FSc ………………..
e) FA/FSc.CT. ……………
f) BA/BSc. ……………….
g) BA/BSc. B.ed. ………….
h) MA/MSc. ………………
i) MA./MSc. M.ed. ……….
17. Pay Structure of Teachers. Teachers receiving pay according to their qualification
a) Middle. ……………………………
b) Matric./Matric PTC. ……………………
c) FA/FSc./FA. CT./FSc. CT. ………………….
d) BA./BSc./BA. B.ed./BSc. B.ed. ………………………
66
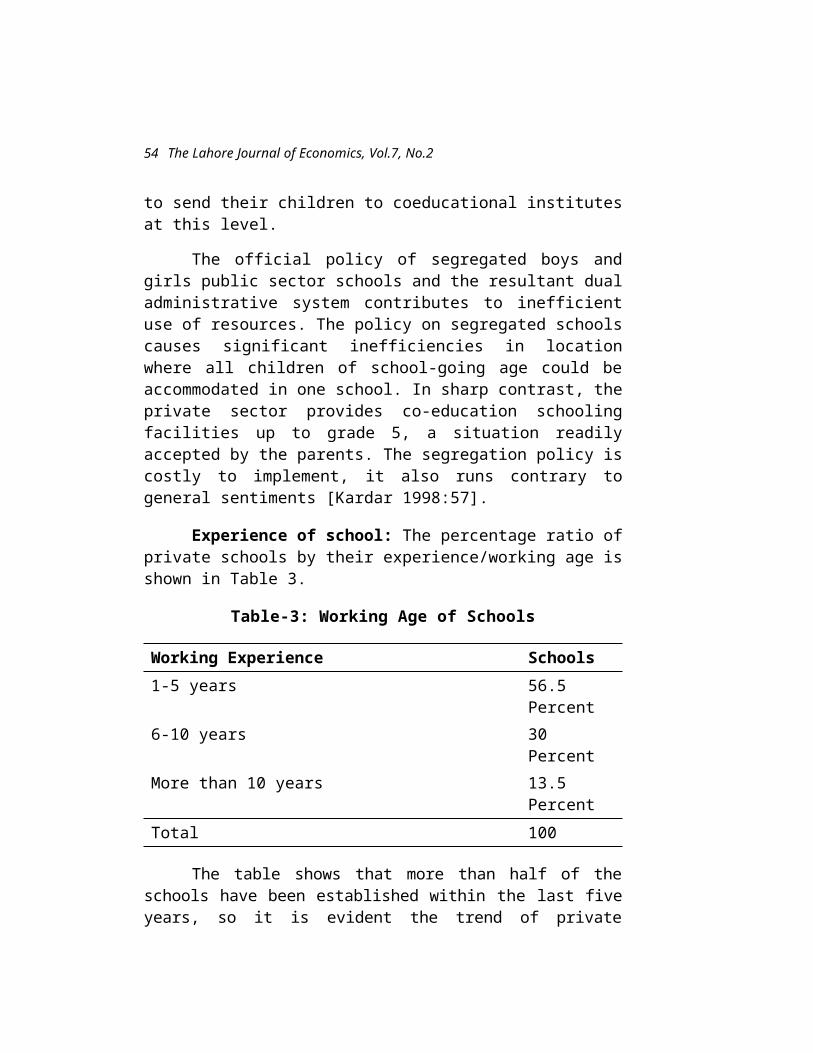
Karamat Ali and Rana Ejaz Ali Khan
e) MA./MSc./MA. M.ed./MSc. M.ed. ………………………..
f) Is school giving annual increments to teachers. Y/N
18. Fee structure of the school
a) Fee up to grade 5. ………………………….
b) Fee for grade 6-8. …………………………..
c) Fee for grade 9-10. ………………………….
19. Students failed in the last year. ……………………….
20. Does the school pass the students on merit Y/N
21. Total number of students in the school …………………
22. Students in class:
a) Play group. ……………….
b) Prep. ………………………
c) Nursery. ……………………
d) Grade I. …………………….
e) Grade II. ……………………
f) Grade III. ………………….
g) Grade IV. ………………….
h) Grade V. …………………….
i) Grade VI. ……………………
j) Grade VII. …………………..
k) Grade VIII. …………………
67
The Lahore Journal of Economics, Vol.7, No.2
l) Grade IX. …………………..
m) Grade X. …………… ………
68

Karamat Ali and Rana Ejaz Ali Khan
References
Alderman, Harold, Jere Behrman., David Ross. and Richard Sabot, 1996, “Decomposing the Gender Gap in Cognitive Skills in a Poor Rural Economy” Journal of Human Resources 32(1)
Alderman, Harold, Peter Orazem and Elizabeth M. Patero, 1996, “School Quality, School Cost, and the Public/Private School Choices of Low-Income Households in Pakistan” Working Paper Series on Impact Evaluation of Education Reforms, Paper No.2. The World Bank, Washington, D.C.
Bregman, Jacob and Nadeem Mohammad, 1998, “Primary and Secondary Education-Structural Issues” in Pervez Hoodbhoy (ed) Education and the State. Fifty Years of Pakistan. Oxford University Press, Karachi.
Eisemon, Thomas Owen, John Schwille, Robert Prouty., Francis Ukobizoba., Deogratias Kana and Gilbert Manirabona, 1993, “Providing Quality Education Resources are Scarce: Strategies for Increasing Primary School Effectiveness in Burundi” in H. Lebvin and M. Lockheed (ed) 1993 Effective Schools in Developing Countries, Falmer Press, London.
Gomes-Neta, Joao Batista and Eric A. Hanushek, 1994, “Causes and Consequences of Grade Repetition, Evidence from Brazil” Economic Development and Cultural Change 43(1)
Haq, Mehboob-ul, 1992, “GNP Numbers on People: New Global Challenges and Pakistan” Pakistan Banker July-December 1992.
Hayes, Lois, 1987, Crisis of Education in Pakistan Vanguard, Lahore.
Homes, C. Thomas, 1989, “Grade Level Retention Effects: A Meta-analysis of Research Studies” in Lorie A.
69

The Lahore Journal of Economics, Vol.7, No.2
Shepard and Mary Lee Smith (ed) 1989 Flunking Grades: Research and Policies on Retention. Falmer Press, London.
Kardar, Shahid, 1998, “The Economics of Education” in Pervez Hoodbhoy (ed) Education and the State. Fifty Years of Pakistan. Oxford University Press, Karachi.
Kim, Jooseop, Harold Alderman and Peter Orazem, 1998a, “Can Cultural Barriers Be Overcome in Girls’ Schooling?: The Community Support Program in Rural Balochistan” Working Paper Series on Impact Evaluation of Education Reforms, Paper No.10. The World Bank, Washington, D.C.
Kim, Jooseop, Harold Alderman and Peter Orazem, 1998b, “Can Private Schools Subsidies Increase Schooling for the Poor?: The Quetta Urban Fellowship Program” Working Paper Series on Impact Evaluation of Education Reforms, Paper No.11. The World Bank, Washington, D.C.
Kingdon, Geeta, 1996a, “Private Schooling in India: Size, Nature and Equity Effects” Working Paper No.72. London School of Economics, London.
Kingdon, Geeta, 1996b, “The Quality and Efficiency of Private and Public Education: A Case Study of Urban India” Oxford Bulletin of Economics and Statistics 58(1).
King, Elizabeth., Peter F. Orazem and Elizabeth M. Paterno, 1999, “Promoting With and Without Learning: Effects on Student’s Dropout” Working Paper Series on Impact Evaluation of Education Reforms. Paper No.18. The World Bank, Washington, D.C.
Malik, Sohail Jehangir and Hina Nazli, 1999, “Population, Employment, and the State of Human Resources” in Shahrukh Rafi Khan (ed) 1999 Fifty Years of Pakistan’s Economy. Traditional topics and
70

Karamat Ali and Rana Ejaz Ali Khan
Contemporary Concerns. Oxford University Press, Karachi.
Reynolds, Arthur, 1992, “Grade Retention and School Adjustment: An Explanatory Analysis” Educational Evaluation and Policy Analysis 14(2)
SPARC, 1997, The State of Pakistan’s Children 1997 Society for the Protection of Rights of Child, Islamabad.
UNDP, 1995, Human Development Report 1995 United Nations Development Program. Oxford University Press. Oxford.
UNICEF, 1999, State of the World’s Children 1999 UNICEF, New York.
Wright, Robert E., 1999, “The Rate of Return to Private Schooling” Discussion Paper No.92 University of String, Scotland, CERP, London and IZA, Bonn.
71
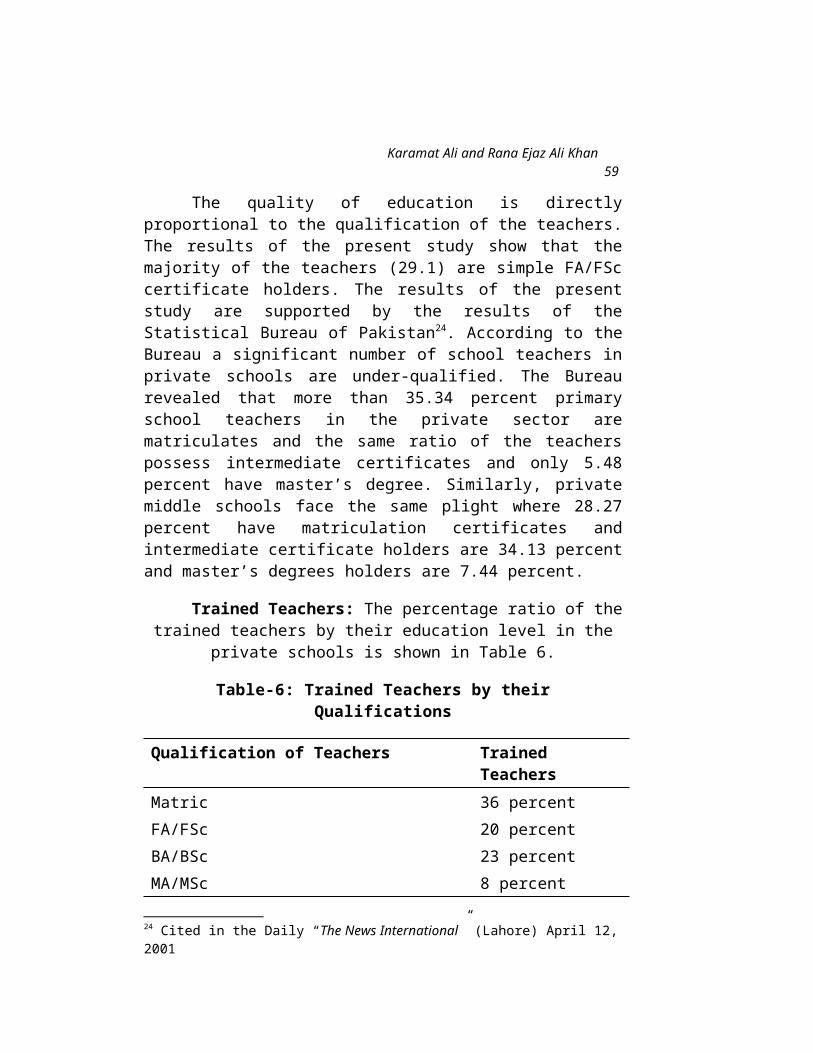
Salman Ahmad
Performance of Commercial Banks in Pakistan:
A Study in Risk Analysis
Salman Ahmad*
Introduction
The financial sector in Pakistan has evolved over the years in response to the growth of the economy and the government’s plans for the growth and development of the country. The sector as on 31 March 2002 comprises the State Bank of Pakistan, 4 state-owned banks, 2 newly privatised banks, 4 specialised banks, 14 private scheduled banks, about 30 leasing companies, 45 Modarabas, 14 investment banks, 3 stock exchanges, 58 insurance companies, and Government Saving Centers.
Commercial banks were nationalised in 1974 and are now in the process of being privatised. Two nationalised commercial banks have been privatised since 1990: Muslim Commercial Bank was sold by auction/ negotiation, while Allied Bank was sold to its employees .The market share of the nationalised commercial banks has been declining with the introduction of new private banks.
The three nationalised commercial banks in Pakistan—Habib Bank Limited, United Bank Limited, and National Bank of Pakistan—have a large branch network that allows them to expand and compete with the private banks in deposit mobilisation. The newly privatised banks have acquired the branch network that will allow them to expand and compete with the state-owned banks. While these institutions play an important role in financing short-term credit requirements, their success in raising deposits ensures that they have a significant surplus of funds that can be lent or invested in government securities.
* The author is Professor of Economics, Lahore School of Economics.
65
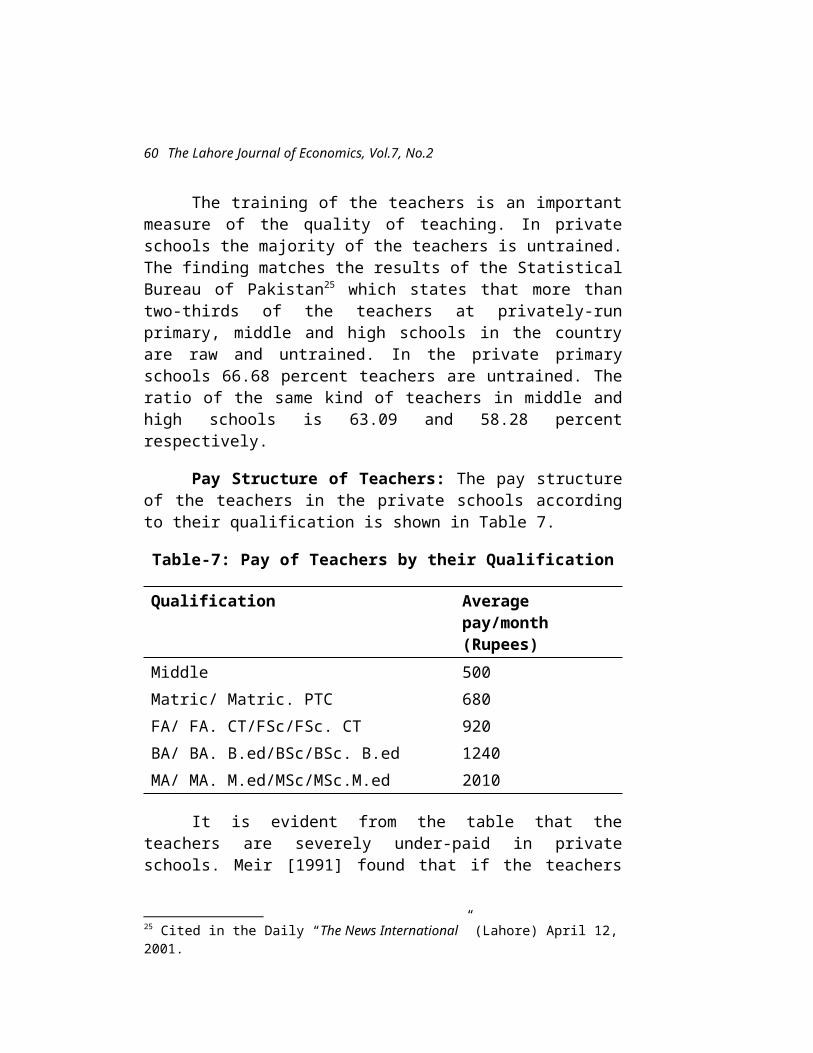
The Lahore Journal of Economics, Vol.7, No.2
There are 19 foreign banks which have been established from time to time. The foreign banks in Pakistan are branch operations; they are not separate legal entities. Much of their success can be attributed to their superior management skills and better access to international financial markets. A large fraction of foreign currency deposits are with foreign banks, partly because of their marketing efforts and partly because of their credibility as international banks. Foreign banks are only allowed four branches within the country.
In recent years, as external credit flows to developing countries have declined, the need for an efficient and viable financial sector has grown. An efficient financial system collects domestic savings and allocates the collective resources to the best possible investment opportunities, allowing for better domestic resource mobilisation and utilsation, and reducing the reliance on external financing.
Throughout the 1980s, Pakistan was able to achieve strong growth with low inflation. The banking sector operated inefficiently because of nationalisation.27
Financial intermediation was geared towards the financing needs of the government and those of the targeted sectors of the economy to which credit was officially directed. Although Pakistan’s economy opened up internationally in 1990, the government had a tight hold on entry to financial markets. The situation changed during the 90s with the entry of private banks in the country and subsequent competition. Financial reforms were initiated with a strong commitment to market-oriented development of the financial sector. These reforms are still underway and will need to be strengthened substantially if modern, competitive financial markets are to be developed.
Foreign banks have shown the highest growth rate in terms of deposits in the last three years. State-owned 27 Khan Bashir Ahmad, Financial Markets and Economic Development in Pakistan: 1947-1995, p.224
66

Salman Ahmad
banks averaged an annual growth of 12.7 per cent over the three-year period 1998-2001, while the recently privatised nationalised commercial banks averaged 18.2 per cent and foreign banks, 31.4 per cent. Foreign banks are also more efficient in terms of controlling administrative costs per branch. For example, growth of administrative costs averaged 19.7 per cent for state-owned banks, 18.3 per cent for the recently privatised banks, and 17.6 per cent for foreign banks. As a percentage of assets, administrative costs are the lowest for foreign banks.
The gross revenues of foreign banks have grown at a much faster pace than the rate of growth of their costs. For Pakistani banks, the difference in the growth rates is extremely narrow, if not negative. Bank deposits have grown significantly in recent years primarily because of the rapid growth of money supply, which increased by around 18 per cent and 20.6 per cent during 1999-2000. Money has also flowed into the banking system from the informal economy with the change in incentives following the recent slide of the stock market and the significant slump in the real estate market. Demand deposits constitute about 47-50 per cent of total bank deposits which is much higher than other countries. This also explains why the cost of funds have been low for commercial banks.
Profitability and Productivity of Commercial Banks
The profit earned by the commercial banks is the difference between the deposit rate and the lending rate, called the spread. In nominal terms, the spread has risen steadily from 5 per cent in 1986-87 to 6.2 per cent in 1992-93, but then fell to 2.8 per cent in 1997 and increased to 3.3 per cent in 2000. In real terms, the weighted average yield on deposits fell from 3.9 per cent in 1986-87 to –4.6 per cent in 1990-91, and –1.1 per cent in 1992-93.The weighted average yield on loans also declined; after declining from 8.9 per cent in 1986-87 to
67

The Lahore Journal of Economics, Vol.7, No.2
1.1 per cent in 1990-91.Thereafter, it climbed rapidly to 5.14 per cent by 1992-93.28
Foreign banks seem to be the main beneficiaries of the relatively large spreads, especially as the nationalised banks have to deal with problems of large overheads, increasing inefficiencies and nonperforming loans.
The three-year (1998-2001) averages of the profitability indicators for nationalised commercial banks and private commercial banks are illuminating. In the case of nationalised commercial banks, total administrative costs were 2 per cent of total assets compared with 0.85 per cent in the case of foreign banks, 0.6 per cent in the case of private banks. Pre-tax profits as a percentage of deposits are 0.6 per cent for nationalised commercial banks, 5 per cent for foreign, and 2.5 per cent for new private banks.
Over the years, the capital base of nationalised commercial banks has been severely affected by the poor quality of bank loans made on political and uneconomic grounds. As a result, the single most formidable problem facing the banks is the heavy burden of nonperforming loans. Pakistan introduced Prudential Regulations in 1993 to ensure that credit is not misused and the infected portfolio was minimum. However, the infected portfolio has increased to significant proportions ( see Table 1 below). On June 30, 2001, the Non-Performing Loans (NPLs) amounted to Rs. 279 billion, i.e., 8.2 per cent of GDP, 18.6 per cent of domestic assets, and 32.5 per cent of total credit made available to the private sector and public enterprises. Non-Performing Loans of the Commercial Banking sector were Rs. 221 billion,i.e, 6.5 per cent of GDP and 22.1 per cent of total deposits. Out of NPLs, the defaulted loans of the financial institutions and the commercial banking sector were Rs. 172 billion and Rs. 141 billion respectively. Because of such a large infected portfolio, the spread between lending and deposit rate has 28 Ul Haque, Nadeem, and Shahid Kardar, 1995 “ Development of the Financial Sector in Pakistan., p. 448.
68

Salman Ahmad
remained high. Though rescheduling of loans is common, the total advances of nationalised commercial banks categorised as bad and doubtful debts are Rs. 56 billion of which Rs.46 billion are classified as advances related to the private sector. Just under 23 per cent of the private sector’s classified debt pertains to advances under mandatory targets and concessional credit schemes. In 1998, the State Bank of Pakistan estimated that around 14.2 per cent of the loan portfolio of nationalised commercial banks were made up of nonperforming loans.
Table 1: Non-Performing and Defaulted Loans (Rs. billion)
Non-Performing Loans
Defaulted Loans
June 1998 207.9 146.1June 1999 212.1 143.1June 2000 239.5 148.1June 2001 279.1 172.4February 2002 278.6 168.1
Source: Unpublished data, cited in Pakistan Human Conditions Report 2002
The problem of debt recovery is not simply a technical issue. Not only have political pressures affected the quality of the loan portfolio of banks, they have also been instrumental in preventing banks to proceed against persistent defaulters and have resisted attempts to improve the enforcement mechanism.
Measures of Performance
. A total of 16 nationalised, privatised, private, and foreign banks were selected for the study. The standard tests used to measure the performance of commercial banks are applied. There are four ratios used in Risk analysis.
69
The Lahore Journal of Economics, Vol.7, No.2
These are:
1. Capital Risk
Capital base of financial institutions facilitates depositors in forming their risk perception about the institution. Also, it is the key parameter for financial managers to maintain adequate levels of capitalisation. Besides absorbing unanticipated shocks, it signals that the institution will continue to honour its obligations. In order to protect the interest of depositors and shareholders of commercial banks, the State Bank of Pakistan introduced the risk-based system for capital adequacy in November 1998 and asked banks to maintain 8 percent Capital to Risk Weighted Assets (CRWA) ratio. This is the benchmark set by the BASLE (Bank Supervision Regulation Committee) of Bank for International Settlements. Additionally, banks are required to achieve a minimum paid-up capital of Rs. 1 billion vide BSD circular No. 31 dated December 6, 2000.
Capital Risk is measured by the ratio of Equity Capital to Total Assets. This ratio for our sample of 16 banks is shown in Table 2. A higher percentage means that the bank is safer because it can withstand a sharper decline in the value of its assets. The table shows that this ratio has improved for most banks over the year 2000 to 2001. However, it is below the target of 8 per cent for all except Faysal bank, Prime Commercial bank, and Emirates Bank. The ratio has been low for nationalised commercial banks and foreign banks. This suggests a high degree of capital risk or inadequate capitalisation for the existing level of lending. Only four banks, Faysal Bank, Prime Commercial bank, the Bank of Punjab, and Emirates Bank had this ratio greater than 8 per cent. This lower ratio can be attributed to a fall in yield of government securities, and hence fall in returns on banks’ investment. Being zero-risk weighted, disinvestment of government securities inevitably led to a slight fall in the capital adequacy ratio. In addition, higher provisioning against Non-Performing Loans (NPL), which affects the capital base through
70
Salman Ahmad
profit/loss accounts, has further contributed to the decline of this ratio.
This had three implications. First, lending rates probably did not adequately reflect the prevailing risk premiums in the market and affected the spreads between lending and borrowing rates. Second, loan recovery was poor and the rate of default high with a corresponding write-off of losses and lower earnings. Third, volume growth did not adequately compensate for the reduced spreads over the long run.
71

The Lahore Journal of Economics, Vol.7, No.2
Table 2: Capital Adequacy of Commercial Banks in Pakistan
Capital Risk ( per cent)
2000 2001
1. Habib Bank Limited 3.81 3.842. United Bank Limited 3.79 4.333. Muslim commercial Bank Ltd. 3.20 3.684. Askari Commercial Bank Ltd. 5.06 5.055. Bank Al-Falah Ltd. 4.0 3.276. Bolan Bank Ltd. 1.5 1.67. Faysal Bank Ltd. 9.64 9.388. Platinum Commercial Bank Ltd. 5.65 1.149. Prime Commercial Bank Ltd. 9 10.310. Soneri Bank Ltd. 6.21 7.5711. The Bank of Punjab 10 1112. Union Bank Ltd. 3.65 3.7813. ABN AMRO Bank NV 2.14 1.414. Citi Bank NA 1.37 0.2415. Emirates Bank International
Ltd.9.6 10.2
16. Standard Chartered Grindlays Bank Ltd.
2 1
Source: Calculated from financial statements as on 31.12.2001.
2. Credit Risk
Asset quality determines the robustness of financial institutions against loss of value in the assets. The deteriorating value of assets, being the prime source of banking problems, directly pour into other areas, as losses are eventually written –off against capital, which ultimately jeopardises the earning capacity of the institution. With this backdrop, the asset quality is gauged
72

Salman Ahmad
in relation to the level and severity of non-performing assets, adequacy of provisions for bad loans, recoveries of loans, distribution of assets, etc. Although the banking system is infected with a large volume of Non-Performing Loans (NPLs), the severity of this problem has stabilised to some extent. This is not to say that the problem of NPLs has taken a secondary position. Unfortunately, it still remains the most dominant factor affecting the earning capacity of banks. Popular indicators include non-performing loans to advances, loan default to total advances, and recoveries to loan default ratios. We have used total loans to assets ratio to judge credit risk. It shows what percentage of assets are more risky because loans are the most risky assets on which default occurs. For a less risky bank, this ratio should be low and must decline overtime. The results for the years 2000 and 2001 are given in Table 3.The table shows that all the banks had above average credit risk, ranging from 30 to 60 per cent. Technically, a high credit risk should be associated with higher returns.
In the case of nationalised commercial banks, this ratio has declined for Habib Bank. It fell from 53.19 in 2000 to 50.10 in 2001. This shows that fresh loans are being extended much more prudently than was the case earlier. In other words, the percentage of loans out of total assets given to clients has fallen. In the case of private and privatised banks, this ratio has increased. The ratio for UBL increased from 39.95 to 47.77. For MCB, it increased from 42.5 to 52.73. For Bank Al-Falah, it increased from 49.13 to 55.27. Similarly, for Prime Commercial Bank, this ratio increased from 47.07 to 57.35. The same is the situation for Emirates Bank and Standard Chartered Bank. This ratio was very high for Platinum Bank, ABN-Amro, and Citi bank, although it has declined over the year 2000 to 2001.This improvement is much more pronounced given their share in total NPLs. It shows a marked improvement in recovery efforts by the private banks. The ratio is lowest for Bank of Punjab and Bolan Bank indicating that the banks are risk averse.
73
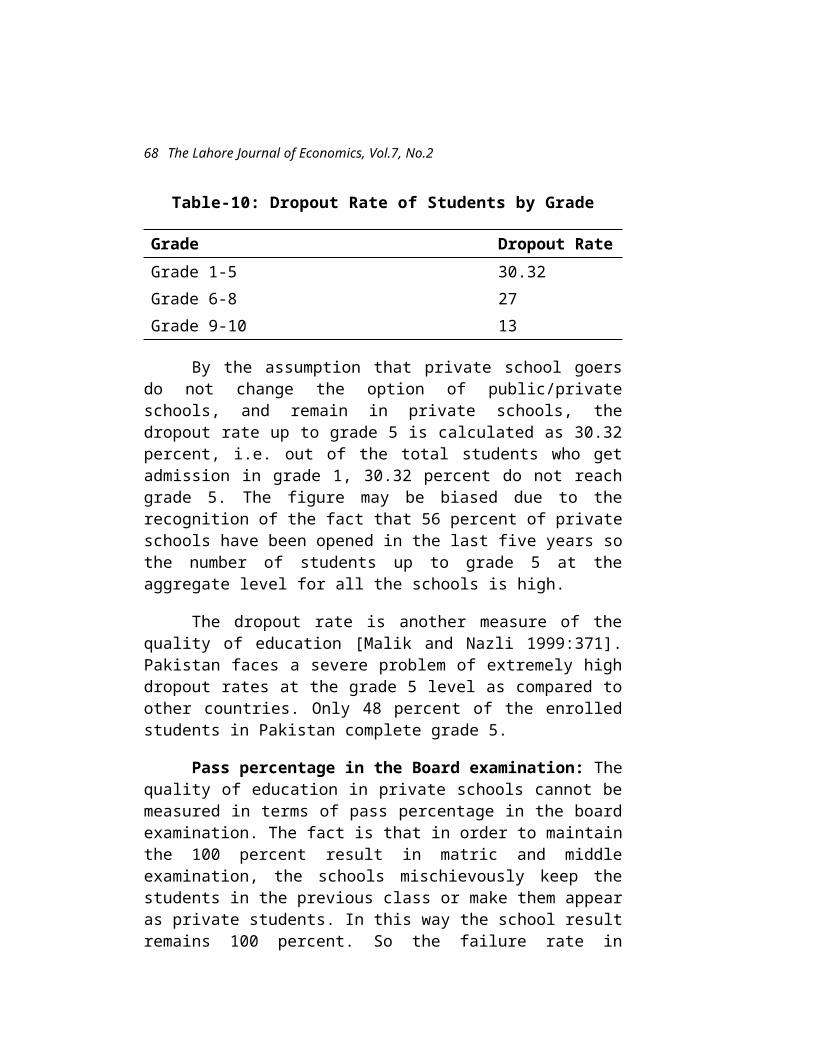
The Lahore Journal of Economics, Vol.7, No.2
Table 3: Asset Quality of Commercial Banks in Pakistan
Credit Risk ( per cent)2000 2001
1. Habib Bank Limited 53.19 50.102. United Bank Limited 39.95 47.103. Muslim commercial Bank Ltd. 42.5 52.734. Askari Commercial Bank Ltd. 46.53 45.695. Bank Al-Falah Ltd. 49.13 55.276. Bolan Bank Ltd. 33.91 35.557. Faysal Bank Ltd. 52.10 56.758. Platinum Commercial Bank
Ltd.65.35 39.71
9. Prime Commercial Bank Ltd. 47.07 57.3510. Soneri Bank Ltd. 54.34 49.6511. The Bank of Punjab 33.77 30.4312. Union Bank Ltd. 49.27 46.0313. ABN AMRO Bank NV 61 57.3714. Citi Bank NA 49.56 44.0415. Emirates Bank International
Ltd.48.60 52.13
16. Standard Chartered Grindlays Bank Ltd.
49.04 53.14
Source: Calculated from financial statements as on 31.12.2001
3. Liquidity Risk
An adequate liquidity position refers to a situation where the institution can obtain sufficient funds, either by increasing liabilities or by converting its assets quickly at a reasonable cost. It is, therefore, generally assessed in terms of overall assets and liability management, as mismatching of maturities of assets and liabilities gives rise to liquidity risk. Efficient fund management refers to a situation where a spread between rate sensitive assets (RSA) and rate
74

Salman Ahmad
sensitive liabilities ( RSL) is maintained. The most commonly used tool to evaluate interest rate exposure is the gap between RSA and RSL, while liquidity is gauged by liquid assets to total asset ratio. We have used investment in short-term securities to deposits as a measure of liquidity risk. A higher ratio shows that the bank has liquid assets available to meet deposit withdrawals. However, there is a tradeoff between liquidity and profitability. A bank that maintains higher liquidity is not investing its funds in long-term and risky projects. This is shown in Table 4. Foreign Banks have the lowest liquidity risk. For Standard Chartered, the liquidity ratio increased from 41.4 to 50.95, for Citibank, it increased from 12.9 to 19.75, for ABN AMRO, it increased from 15 to 25. The ratio decreased for private commercial banks showing increased liquidity risk. For Bank Alfalah the ratio fell from 32 to 28.6. For Bolan Bank the ratio fell fram 48 to 32. For Prime Commercial Bank the ratio also fell from 34 to 26.5. However it increased for Bank of Punjab from 19 to 33. For the banking sector as a whole, the ratio is quite low due to the after effects of freezing of Foreign Currency Accounts as the banks had less resources to invest in liquid funds. An alternative explanation is decreasing yields on short-term securities which render investment in such securities unattractive. Generally, declining ratio would imply that a smaller percentage of deposits are invested in liquid assets, thus raising the liquidity risk.
Table 4: Liquidity of Commercial Banks in Pakistan
Liquidity Risk ( per cent)2000 200
11. Habib Bank Limited 16 162. United Bank Limited 9.47 8.543. Muslim commercial Bank Ltd. 12 144. Askari Commercial Bank Ltd. 18.6 21.15. Bank Al-Falah Ltd. 32 28.66. Bolan Bank Ltd. 48 327. Faysal Bank Ltd. 13.66 13.4
5
75

The Lahore Journal of Economics, Vol.7, No.2
8. Platinum Commercial Bank Ltd. 11 279. Prime Commercial Bank Ltd. 34 26.510. Soneri Bank Ltd. 49.27 50.0
511. The Bank of Punjab 19 3312. Union Bank Ltd. 12.6 18.3
913. ABN AMRO Bank NV 15 2814. CitiBank NA 12.9 19.7
515. Emirates Bank International
Ltd.38.9 32.5
16. Standard Chartered Grindlays Bank Ltd.
41.4 50.95
Source: Calculated from financial statements as on 31.12.2001
4. Interest Rate Risk
The diversified nature of bank operations makes them vulnerable to various kinds of financial risks. Sensitivity analysis reflects the institution’s exposure to interest rate risk, foreign exchange volatility and equity price risk. Risk sensitivity is mostly evaluated in terms of the management’s ability to monitor and control market risk. For interest risk we have used a ratio of interest sensitive assets to interest sensitive liabilities. This is shown in Table 5. RSAs has diverged from RSLs, in absolute terms. Higher interest rate sensitivity of spread is reflected in less than 100 value of ratio between RSA and RSL. For most of the banks, this ratio declined between 2000 and 2001 indicating a rise in interest rate sensitivity. Only three banks had a ratio of more than 100. The highest is 588 per cent for Askari Commercial Bank during 2001. Faysal Bank had 200 per cent during 2000, the Bank of Punjab had 100 per cent during 2001 and Soneri Bank had 111 per cent during 2000.
Table 5: Market Risk of Commercial Banks in Pakistan
76

Salman Ahmad
Interest Rate Risk ( per cent)
2000 20011. Habib Bank Limited 93 892. United Bank Limited 94.7 85.43. Muslim commercial Bank Ltd. 95 854. Askari Commercial Bank Ltd. 534.6 5885. Bank Al-Falah Ltd. 87.98 89.376. Bolan Bank Ltd. 83 717. Faysal Bank Ltd. 200 1148. Platinum Commercial Bank
Ltd.81 72
9. Prime Commercial Bank Ltd. 82.9 8910. Soneri Bank Ltd. 111 10711. The Bank of Punjab 95 10012. Union Bank Ltd. 34.49 28.4913. ABN AMRO Bank NV 81 8614. Citi Bank NA 82.21 8815. Emirates Bank International
Ltd.68 67
16. Standard Chartered Grindlays Bank Ltd.
63 80
Source: Calculated from financial statements as on 31.12.2001
A discussion of all the four risk ratios for the 16 banks shows that the Bank of Punjab is performing well as far as the risk dimension is concerned.
77

The Lahore Journal of Economics, Vol.7, No.2
References
Berger, Allen.N., D. Hancock, and David B. Humphrey, 1993, “Bank Efficiency Derived from the Profit Function”, Journal of Banking and Finance 17, pp. 317-347.
Berger, Allen and David B. Humphrey, 1997, “Efficiency of Financial Institutions: International survey and Directions for Future Research,” European Journal of Operational Research 98 (92), pp. 175-212.
Berger, Allen N., and J. Mester, 1997, “Efficiency and Productivity Change in the U.S. Commercial Banking Industry: A comparison of the 1980s and 1990s,” Federal Reserve Bank of Philadelphia Working Paper 97-5, May, Philadelphia.
Berger, Allen N., and J. Mester, 2001, “Explaining the Dramatic Changes in the Performance of U.S. Banks: Technological Change, Deregulation, and Dynamic Changes in Competition,” Federal Reserve Bank of Philadelphia Working Paper 01-6, April, Philadelphia.
Gilbert R. Alton, and Paul W. Wilson, 1998, “Effects of Deregulation on the Productivity of Korean Banks,” Journal of Economics and Business, Vol.50,pp. 133-155.
Grabowski, Richard, Nanda Rangan, and Rasoul Rezvanian, 1994, “The Effects of Deregulation on the Efficiency of U.S. Banking Firms,” Journal of Business and Economics, Vol.46, pp. 39-54.
Hardy, Daniel C. and Emilia Bonaccorsi di Patti, 2001, “Bank Reform and Bank Efficiency in Pakistan,” IMF Working Paper wp/01/138, Washington: International Monetary Fund
Hempel, George H. and Simonson, Donald G., 1999, Bank Management, 5th ed. John Wiley & Sons. N.Y.
78

Salman Ahmad
Humphrey, David B., and Lawrence B. Pulley, 1997, “Banks, Responses to Deregulation: Profits, Technology and Efficiency,” Journal of Money, Credit and Banking,Vol.29, pp. 71-93.
Khan, Bashir A. 1999 Financial Markets and Economic Development in Pakistan: 1947-1995 in Khan, Shahrukh Rafi, Fifty Years of Pakistan’s Economy, Oxford University Press.
Klein, Michael U. 1992, “Commercial Banking in Pakistan”, in Financing Pakistan’s Development in the 1990, Anjum Nasim, Karachi: Lahore University of Management Sciences and Oxford University Press.
Mahmood Amir and Khan, Bashir A. 1996, “Industry Structure and the Conduct of the Pakistani Banking Industry”, Working Paper, Lahore University of Management Sciences.
State Bank of Pakistan, Annual Report 2000-2001.
Ul Haque, Nadeem, and Shahid Kardar, 1995, “Development of the Financial Sector in Pakistan,” in Shahid N. Zahid (ed.),1995, Financial Sector Development in Asia: Country Studies, Asian Development Bank, Manila.
79

Haroon Jamal
On the Estimation of an Absolute Poverty Line:
An Empirical Appraisal
Haroon Jamal*
The fad that different studies seeking to measure poverty in a given country often give differing results, although they apparently use the same method and same data source, has long disconcerted both experts in the field and the public in general. Such differences regarding poverty incidences reduce the credibility and technical reliability of these measurements, shed doubts on estimates of the level and evolution of poverty, and hinders inter-temporal comparisons. That is why it is„„ important to foster greater consensus among researchers regarding the criteria and procedure to be used, with a view to progressing towards a common pattern, which will make the measurements more consistent and homogeneous, and guarantee their effective comparability. This policy paper provides a recommended strategy for estimating an absolute poverty line using household survey data of the years 1987-88, 1996-97 and 1998.Introduction
What is poverty? Who are the poor? What are the ways of estimating its magnitude and depth? What are the ways of fighting it? We often tend to believe that these questions may be obvious or easily answered. But there are many views and several individuals who talk and write about poverty around the globe, without reaching an agreement as to what they are actually saying. Despite
* The author is Principal Economist at the Social Policy and Development Centre (SPDC), Karachi. The views expressed are those of the author and do not necessarily represent those of the SPDC.This article was read as a paper at the 2nd National Workshop on Poverty Analysis, Monitoring and Evaluation held at Bhurban in August 2002 under the auspices of Pakistan Institute of Development Economics and the World Bank Institute.
77

The Lahore Journal of Economics, Vol.7, No.2
having a common basis, there are a variety of definitions and conceptions about poverty.
The variation in concepts reveals the multidimensional nature of poverty. The main operational emphasis however, remains on poverty as understood in terms of deprivation of food and other 'basic' commodities, and therefore, on private income or private consumption shortfalls.
For an aggregate or macro perspective of income poverty, various choices are available to estimate poverty in a given region or territory. In broad terms, it is possible to say that the debates generally start with the diverse meanings, uses or functions, which the different authors attribute in their theorising on the concept of poverty. The diversion in estimates, as a result of using different methodologies and approaches, often creates confusion as to which estimate is more credible. Further evaluating poverty trends, which are important to inquire into the progress made on the poverty front, is difficult because of lack of consistency in adopting a specific methodology. The importance of the precise methodology in arriving at poverty estimates can be illustrated with the help of the following poverty incidences estimated from the 1996-97 Household Integrated Economic Survey (HIES) data.
Table 1: Percentage of Population Below Poverty Line Estimated from HIES 1996-97
Method and Approach Used By
Urban Rural Total1. Amjad and Kamal 42 27 322. S. M. Jafri 36 24 283. Ercelawn 53 29 364. Social Policy and
Development Center27 32 31
5. Haris Gazdar 21 38 336. World Bank — — 31
The above table shows the different and diverse magnitude of poverty incidence, measured as a proportion of poor to the total population. Except Haris Gazdar (1994)
78

Haroon Jamal
and the World Bank (2001), other poverty estimates are based on a calorific approach with different methodology and calorie norms. Gazdar's estimation is based on the Basic Needs Approach. This figure was also adopted by the World Bank in its Pakistan Poverty Assessment (1995). To calculate the estimates for 1996-97, the poverty line used by Gazdar is adjusted using food and non-food Consumer Price Indices. The World Bank (2001) figure is taken from the World Development Report (2000/2001) and it is estimated using a ‘dollar-a-day’ poverty line. Other incidences are calculated employing the exact methodology used by the above authors to calculate the level of poverty.
The poverty incidence derived for 1996-97 as a whole ranges from 28 to 36 percent. Urban-rural breakdowns of poverty are similarly diverse. The situation portrayed above creates much confusion about the creditability of poverty estimates.
The level of poverty should provide a compelling signal for priorities in poverty-alleviation policies. Thus, the objective of this policy paper is to discuss various methodological options available for estimating the poverty line and to recommend a poverty criterion for national debate and consensus.
Methodological Issues
The breadth of the topic requires some selectivity. The focus of this paper therefore, is to only discuss the relevant methodological issues necessary to estimate a monetary poverty line from household survey data and to recommend a path to follow.
Absolute and Relative Poverty
For an aggregate or macro perspective of income poverty, absolute or relative approaches are the two alternative options available. Absolute poverty refers to subsistence below minimum, socially acceptable living conditions, usually established based on nutritional
79
The Lahore Journal of Economics, Vol.7, No.2
requirements and other essential goods. Relative poverty compares the lowest segments of a population with the upper segments, usually measured in income quintiles or deciles. Absolute and relative poverty trends may move in opposite directions. For example, relative poverty may decline while absolute poverty increases if the gap between the upper and lower strata of population is reduced by a decline in the well being of the former at the same time that additional households fall beneath the absolute poverty line.
Therefore, the choice of an 'absolute vs. relative' poverty criterion depends upon how one begins with either an emphasis on the extent of a shortfall in the standard of living or inequality as a source of poverty. If relatively perceived, poverty would appear to be primarily an aspect of inequality. In less developed countries (LDCs) where average levels of income are lower, this approach is relatively uncommon and less preferred. Many development planners place the highest priority on reducing absolute poverty because of the urgency associated with starvation, malnutrition and other afflictions. Most, if not all, studies for LDCs argue that poverty alleviation efforts need to be judged by their success not just in reducing inequality per se, but also in their impact upon absolute levels of welfare.
Objective and Subjective Perspectives
Poverty can be approached from objective or subjective perspectives. The objective perspective involves normative judgments as to what constitutes poverty and what is required to move people out of their impoverished slate. The subjective approach places a premium on people's preferences, on how much they value goods and services. Poverty measurement has traditionally been dominated by the objective approach. Only relatively recently has the international community as a whole taken a serious interest in measuring subjective poverty. This is mainly because of mounting recognition of the limitations associated with so-called
80
Haroon Jamal
objective indicators and the value of understanding the perspectives of the poor in shaping policies and programmes. Clearly, both objective and subjective perspectives bring valuable insights to the measurements and analysis of poverty. Economists however have traditionally based their work on the objective approach, mainly because of the obstacles encountered when trying to aggregate multiple individual (subjective) utilities across a population.
How to Define Objective Absolute Needs
It is, however, difficult to translate absolute needs into a poverty criterion. Defining the scope of basic needs and their minimum levels remain an area of controversy. Most studies for LDCs use food adequacy or nutritional (calorie) requirements as a criterion to define poverty levels.
The alternative option is to take the poverty line as the cost of achieving a minimum bundle of basic household requirements or needs. A first attempt was made by Ahmad (1993) in the context of Pakistan. With the help of consultative exercises and opinion surveys, he arrived at the quantum and value of various components of basic needs separately for urban and rural areas. This approach was also used by Gazdar et al (1994) after some modification.
A commonly used poverty line for measuring progress in reducing poverty worldwide is the ‘dollar-a-day’ measure introduced in the World Development Report (1990). This poverty line is expressed in 1985 purchasing power parity (PPP) and refers to household expenditure per capita. This measure has several well-known deficiencies. It does not allow for cost-of-living differentials within countries (rural/urban, provincial) and also does not distinguish between transient and chronic poverty (depth and severity). It is argued that a national poverty line is necessary for all policy purposes.
81

The Lahore Journal of Economics, Vol.7, No.2
Therefore, the main choice to be made is between the calorie-based and basic-needs approach in setting the poverty line. Economists in most LDCs take the position that malnutrition must have a central place in the conception of poverty and thus, food adequacy should be given the highest priority among basic needs. This captures only one aspect of the idea of poverty, no doubt an important aspect. It then follows that a food adequacy standard of welfare would be the most useful approach to an aggregate criterion for absolute poverty.
The drawback with the second approach is the difficulty of interpreting the word 'basic' or 'sufficient'. Further, the second approach, which is based on express evaluations of social status, has been criticised on the grounds that it is arbitrary and subjective. Therefore the approach that shows the revealed behavior (based on actual consumption) should be the preferred approach.
Calorie Norms
To specify minimum calorie requirement is also not problem free. It is well known that calorie requirements vary between persons not only by sex and age, but also with climatic, work and living environments. Except for age and sex, the data is not rich enough to provide detailed information about a person's precise physiological condition of quantify a normal level of physical exertion. The conclusion that may be drawn therefore, is that the nutritional standard may depict a partial rather than complete picture of poverty.
By far the most common approach has been to use 2550 calories per day per adult (for urban as well as rural) as the calorific cut-off point. This calorie norm was recommended by the Pakistan Planning Commission and further supplemented by recommendations of the Food and Agriculture Organization (FAO) and World Health Organization (WHO).
As the rural lifestyle in general requires a greater consumption on calories than the urban lifestyle, than for
82

Haroon Jamal
any given level of income, rural households are likely to consume more calories, on average, than their urban counterparts. Therefore, it is argued that estimating the poverty line from a calorie-expenditure function using a unique caloric standard for the urban and- rural sub-sample would have the effect of over-estimating the urban poverty line in comparison with the rural.
A Working Group on Poverty Alleviation was formed in 1997 (GOP, 1997). The Group recommended 2550 and 2230 calorie requirements for rural and urban areas respectively.
The different calorie cut-off points for urban and rural are necessary in order to obtain reasonable estimations, but justifications in the difference in magnitude are not reported in the Working Group document.
Often the difference is based on a judgement on the part of the analyst in order to produce 'plausible' rural and urban estimates of poverty. Similar 'plausibility' may be induced in the case of national poverty line adjustments. The calorific approach has, therefore the appearance of 'objectivity' while relying, ultimately, on reasonable but subjective judgement in order to arrive at results that are 'plausible'.
The problem in specifying calorie requirements and the consequent ambiguity or arbitrariness should not be overlooked. It is highly recommended to adhere to a cutoff point, whatever it may be, for inter-temporal changes in poverty and the poverty line. This paper follows the Planning Commission recommendation of 2550 and 2230 calories per day per adult for rural and urban areas respectively.
Deprivation and Lack of Capability to Acquire Adequate Calories
Having arrived at nutritional norms, the next step is to translate these norms into monetary terms. Here, a
83
The Lahore Journal of Economics, Vol.7, No.2
number of options are available. To begin with, one possible capacity criterion would be in the form of the 'hypothetical' or 'typical' expenditure corresponding to requirements. Clearly there is a distinction between undernourished and being unable to avoid undernourishment. The latter concept is the most relevant one for public policy. For this exercise, calorie norms are translated by estimating the calorie-consumption functions.
Now poverty may be defined as the inability to obtain calorie requirements. Two choices are available to establish a relationship between calorie intake and household ability to acquire it. One could derive the food expenditure criterion from the calorie-expenditure relationship. But ignoring non-food expenditure may not be justified on various grounds. Very low non-food consumption, for instance, means that food expenditure could become highly vulnerable to even a small decrease in income. Therefore, a safety-margin in the poverty criterion is necessary to obtain a cut-off point, which may afford the critical expenditure necessary to acquire the usual means of subsistence. It is more or less a consensus among researchers and analysts to use non-durable expenditure (economic capacity) in the calorie-expenditure relationship for an upward adjustment to minimum food expenditure.
Poverty can then be used to define the poor by total expenditure falling short of the poverty line by the average dietary pattern and the expenditure would translate into fewer calories than required.
Consumption or Income as a Welfare Indicator
The next issue is to map the poverty line to household income or consumption. Most studies on poverty in Pakistan have used total expenditure as the capacity to meet the poverty criterion. The authors usually cite data considerations, such as understatement of
84

Haroon Jamal
income or prefer expenditure, since its relative stability over time is considered as a reflection of 'permanent' income. However, Ercelawn (1991) argued that similar understatements in expenditure are also possible and, more importantly, subsistence expenditure may well involve quasi-permanent indebtedness.
Armed with the argument, which draws attention to the fact that in an economy where most of the economically active population are not in salaried remuneration but are either self-employed or work in farms or other family business, the reporting of consumption expenditure is likely to be more reliable than that of income. Hence household consumption as a primary poverty criterion is preferred in this research.
Estimation of Poverty Line
The before mentioned discussion regarding the choices and preferences for defining and estimating the poverty line is recapitulated in Chart 1. This section provides details of actual computation of the poverty line from Household Integrated Economic Survey of 1987-88, 1996-97 and 1998-99. Similar methodology is applied to these household surveys.
Calorie Norm Conversion
In order to ease interpretation and also for specification of calorie-consumption function (CCF), minimum calorie requirements are converted into per capita term using household demographic data. Food Consumption Tables for Pakistan (2001) provide the recommended daily allowance for the Pakistani population for various age and sex compositions. These requirements are used to convert daily allowance from adult equivalent to per capita terms.
Estimation of Calorie-Consumption Functions
Having considered other options, it is preferred to estimate national calorie-consumption function separately for urban and rural areas. It is argued that consumption
85

The Lahore Journal of Economics, Vol.7, No.2
behaviour, purchasing patterns, dietary habits, taste, ecology etc., are extremely different for urban and rural groups, and simple inclusion of a dummy variable in the function would not give an
86
Haroon Jamal
accurate picture. A similar argument is true, to a lesser extent, in the case of the provinces. However, a separate province-wise estimation of function is not statistically recommended due to the small sample problem. It was also decided to estimate CCF from the lower quartile of distribution after ranking households by per capita expenditure.
The results of the estimated functions are displayed in Table 2 through Table 4. Daily calorie consumption is regressed on non-durable expenditure (excluding taxes). The functional forms are chosen on the basis of maximisation of R2 criterion. Nonetheless, other statistical tests are also applied before choosing the functional form.
Table 5 presents the estimated poverty lines from these data sets. As separate calorie-consumption functions are estimated for urban and rural areas, direct estimation of the national poverty line is not possible. A population weighted average poverty line, however, turns out as Rs. 206, Rs. 555 and Rs. 605 per capita per month in 1988, 1997 and 1999 prices respectively.
87

The Lahore Journal of Economics, Vol.7, No.2
Table 2: Estimated Calorie-Consumption Functions (1987-88)
Estimated
T-Value
R2 F-Value
Urban AreasDependent VariableLog (Per Capita Calorie Consumption)
0.12 47.8
(Constant) 6.875 178.9Per Capita Expenditure 0.003 13.09Dummy Variable for Sindh -0.043 -2.52Dummy Variable for NWFP 0.018 1.019Dummy Variable for 0.062 2.059Rural AreasDependent VariableLog (Per Capita Calorie Consumption).
0.13 57.4
(Constant) 6.918 178.1Per Capita Expenditure 0.004 14.08Dummy variable for Sindh 0.025 1.39Dummy Variable for NWFP -0.042 -2,19Dummy Variable for Baluchistan
-0.094 -3.33
Table 3: Estimated Calorie-Consumption Functions (1996-97)
Estimated Coefficient
T-Value
R2 F-Value
Urban AreasDependent VariableLog (Per Capita Calorie Consumption)
0.13 49.02
(Constant) 4.394 18.86Log (Per Capita 0.488 13.02Dummy Variable for Sindh -0.051 -Dummy Variable for NWFP 0.083 4.377Dummy Variable for 0.048 -Rural AreasDependent VariableLog (Per Capita Calorie Consumption)
0.19 124.35
88

Haroon Jamal
(Constant) 3.018 13.61Log (Per Capita 0.738 20.11Dummy Variable for Sindh -0.111 -5.72Dummy Variable for NWFP 0.017 1.01Dummy Variable for Balochistan
-0.159 -7.825
Table 4: Estimated Calorie-Consumption Functions (1998-99)
Estimated
T-Value
R2 F-Value
Urban AreasDependent VariableLog (Per Adult Caloric Consumption)
' 0.21 90.24
(Constant) 3.462 15.66Log (Per Adult Equivalent
0.633 18.09
Dummy variable for -0.136 -5.67Dummy Variable for NWFP
0.032 1.35Dummy Variable for Baluchistan
0.026 0.91
Rural Areas Dependent VariableLog (Per Adult Calorie Consumption)
0.24 176.18
(Constant) 6.927 262.00Per Adult Equivalent Expenditure 0.0013 25.49Dummy Variable for 0.051 -3.58.Dummy Variable for 0.033 2.05Dummy Variable for Balochistan -0.118 -5.54
Table 5: Estimated Poverty LinesRural Urba
Per Day Calorie Requirements - Per Adult Equivalent Unit
2550 2230Per Day Calorie Requirements - Per Capita (1987-88)
2100 1862Per Day Calorie Requirements - Per Capita (1996-97)
2090 1863Per Day Calorie Requirements - Per Capita (1998-99)
2099 1873
89
The Lahore Journal of Economics, Vol.7, No.2
Poverty Line - Rupees Per Capita Per Month (1987-88)
225 201Poverty Line - Rupees Per Capita Per Month (1996-97)
528 618Poverty Line - Rupees Per Capita Per Month (1998-99)
580 686
Poverty Aggregates
Once a poverty line is defined, and hence the individual/household poverty status determined through relating the poverty line and household consumption, the question is how to aggregate this information into a single index to proxy the status of a group of individuals. The issues in this regard primarily relate to assigning weights to differing intensities of poverty (Foster et.al.,1984). The most popular measure, namely the Head-Count Index assigns equal weights to all poor regardless of the extent of poverty. There are several other measures, which have been suggested. These measures are sensitive to distribution among the poor. A class of functional forms, which has been suggested by Foster, Greer, and Thorbeke (FGT) uses various powers of the proportional gap between the observed and the required expenditure as the weights to indicate the level of intensity of poverty. The higher the power the greater the weight assigned to a given level of poverty. It therefore, combines both the incidence and intensity. The following formula is employed for measuring various poverty aggregates.
P ° = (1/N) (Z - EXP) / Z ]°
Where;P ° = Aggregation measureN = Total number of householdsEXP = Observed Household ExpenditureZ = Poverty Line = Summation for all individuals who are below the poverty line
Putting = 0, the formula shows the head count index (HCI), i.e., proportion of households whose
90

Haroon Jamal
consumption falls below the poverty line. This simple measure ignores the depth of poverty. Putting = 1, the Proportionate Gap Index or Poverty Gap Index (PGI) is calculated. It measures the average distance from the poverty line. Although PGI shows the depth of poverty, it is insensitive to the distribution among the poor. Putting = 2, the FGT2 index is calculated. The index takes into account inequality amongst the poor and shows the severity of poverty by assigning greater weights to those households who are far from the poverty line.
Table 6 displays various measures of poverty for 1987-88. The estimated poverty lines are mapped on household per capita total expenditure for computing these measures. Overall, 23 percent people were poor, according to the above definition of poverty and the poverty line. Rural incidence, depth and severity of poverty are high as compared with their urban counterpart. Table 7, which displays the magnitude of estimated poverty measures from HIES 1996-97, displays an increase of 5 percent in poverty incidence. The table also confirms a relatively high increase in urban poverty during these years.
Table 6: Estimates of Poverty Measures, 1987-88(Percent of Poor Individuals)
Head Count Index (Incidence)
Poverty Gap Index (Depth)
FGT2 Index (Severity)
Pakistan
23 4.41 1.26Urban 19 3.50 1.00Rural 26 4.79 1.38Estimated from HIES (1987-88)
Table 7: Estimates of Poverty Measures, 1996-97 (Percent of Poor Individuals)
Head Count Index [Incidence]
Poverty Gap Index [Depth]
FGT2 Index [Severity]
Pakistan
28 5.54 1.67Urban 25 4.95 1.51
91

The Lahore Journal of Economics, Vol.7, No.2
Rural 30 5.80 1.74Estimated from HIES (1996-97)
Table 8 displays the magnitude of estimated poverty measures from 1998-99 HIES data. Few observations emerge quickly from the table. A sharp increase in the rural incidence is evident. The depth and severity of poverty have also increased noticeably during the period of three years, especially in the rural areas. No change in the poverty incidence in urban areas is observed.
92

Haroon Jamal
Table 8: Estimates of Poverty Measures, 1998-99(Percent of Poor Individuals)
Head Count Index [Incidence]
Poverty Gap Index [Depth]
FGT2 Index [Severity]
Pakistan
30 6.54 2.14Urban 25 5.65 1.85Rural 32 6.91 2.26Estimated from HIES (1998-99)
Concluding Remarks
The vast differences regarding the poverty incidences in a particular year reduce the credibility and technical reliability of the measurements, and hinder inter-temporal comparisons. It is, therefore, important to foster greater consensus among researchers regarding the criteria and procedure to be used, with a view to progressing towards a common pattern which will make the measurements more consistent and homogeneous, and guarantee their effective comparability.
This paper has suggested a recommended path or has set poverty criteria that are based upon nutritional norms and current relationship between diets and household expenditure. A step-by-step procedure is illustrated and applied for estimating the absolute poverty line using household survey data of HIES, 1987-88, 1996-97 and 1998-99. It is hoped that the paper can provide a base to achieve national consensus on this important issue.
The re-estimation of the poverty line for every year or for every new HIES data is not recommended due to operational implications. It is suggested to adopt a national (rural, urban) poverty line, at least for ten years for monitoring the impact of growth and poverty alleviation policies. Poverty measures from new available data may be computed by adjusting the national poverty
93
The Lahore Journal of Economics, Vol.7, No.2
line, either by CPI or by indexing price differentials between two consequent household surveys.
94

Haroon Jamal
References
Ahmad, M., 1993, Choice of a Norm of Poverty Threshold and Extent of Poverty in Pakistan, 1979-84, mimeo, Ministry of Finance, Islamabad.
Amjad, R and Kemal, A. R., 1997, Macroeconomic Policies and their Impact on Poverty Alleviation in Pakistan, The Pakistan Development Review, Vol. 36(1).
Ercclawn, A., 1991, Absolute Poverty as Risk to Hunger, mimeo, Applied Economics Research Centre.
Ercelawn, A., 1992, “Absolute Poverty in the 80’s - Rural and Urban Trends in Pakistan”, Applied Economics Research Centre, Discussion Paper No. 161.
Foster, J.E., J. Greer, and E. Thorbecke, 1984, “A Class of Decomposable Poverty Measures”, Econometrica, 52, pp. 761-66.
Gazdar, H et al, 1994, “Recent Trends in Poverty in Pakistan”, mimeo, London School of Economics,
Gazdar. H., 1998, “Review of Pakistan Poverty Data”, mimeo, Department of International Development, London.
Government of Pakistan, 2001, “Food Consumption Table for Pakistan”, Department of Agricultural Chemistry, NWFP Agriculture University, Peshawar.
Government of Pakistan, 1997, “Overcoming Poverty: Report of the Task Force on Poverty Alleviation”.
Jafri, S. M., 1999, “Assessing Poverty in Pakistan” In A Profile of Poverty in Pakistan, by Mahbubul Haq Centre for Human Development and United Nation Dcvelopment Program, Islamabad.
95

The Lahore Journal of Economics, Vol.7, No.2
Malik, M. H., 1988, “Some New Evidence on the Incidence of Poverty in Pakistan”, Pakistan Development Review, 27(4).
Qureshi, S. K. and Arif, G. M., 1999, “Profile of Poverty in Pakistan. 1998-99”, mimeo, Pakistan Institute of Development Economics.
Social Policy and Development Centre, 2000, Incidence of Income Poverty in Pakistan, Research Report No. 39.
Social Policy and Development Centre, 2000, Social Development in Pakistan, Annual Review - 2000, Oxford University Press, Karachi.
World Bank 2001, World Development Report, 2000/2001, Washington DC, USA.
96
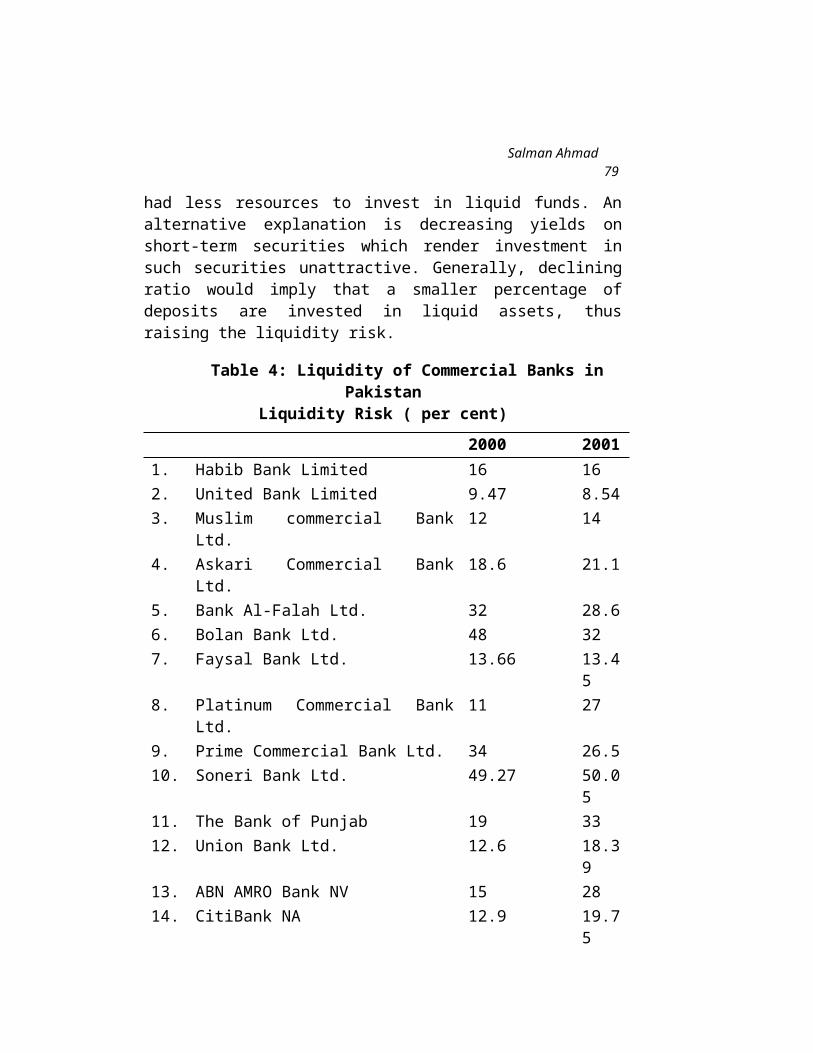
Muhammad Akram, Lubna Shahnaz and Surayya
An Analysis of Male Internal Migration and Its Correlation to
Employment Status: Evidence from the Punjab
Muhammad Akram, Lubna Shahnaz and Surayya*Introduction
Migration plays a pivotal role in the reallocation of human resources under changing demand and supply conditions. Migration takes place when an individual decides that it is preferable to move rather than to stay and where the difficulties of moving seem to be less than the expected rewards. In recent years there has been a trend of increasing migration rates. The United Nations (2000) estimates that about 140 million persons (roughly 2 per cent of the world’s population) reside in a country where they are not born.29 Usually migration takes place from the regions that are associated with poverty and insecurity towards regions which offer greater security of life, employment and basic social services. Poverty pushes people to migrate to urban areas-the outcome, the world’s urban population approaches 2.3 billion by 1990 with 61 per cent living in the metropolitan areas of developing countries and touches 66 per cent in 2000 (United Nations). Within the world Asia has about 15 of the largest cities of the world and most of them are growing at more than 5 per cent per annum. Increased rate of natural growth, immigration and rural-urban migration might be the causes of such a high rate of growth of urban population.
29*M. Akram and Lubna Shahnaz are doctoral candidates of economics at the Quaid e Azam University, Islamabad while Surayya is a lecturer at the International Islamic University (Women’s Campus) Islamabad.The authors are thankful to Ms. Zainab Kizilbash, Specialised Honours Graduate, York University, Canada for her sincere and valuable cooperation during this paper.? http://www.wider.unu.edu
93
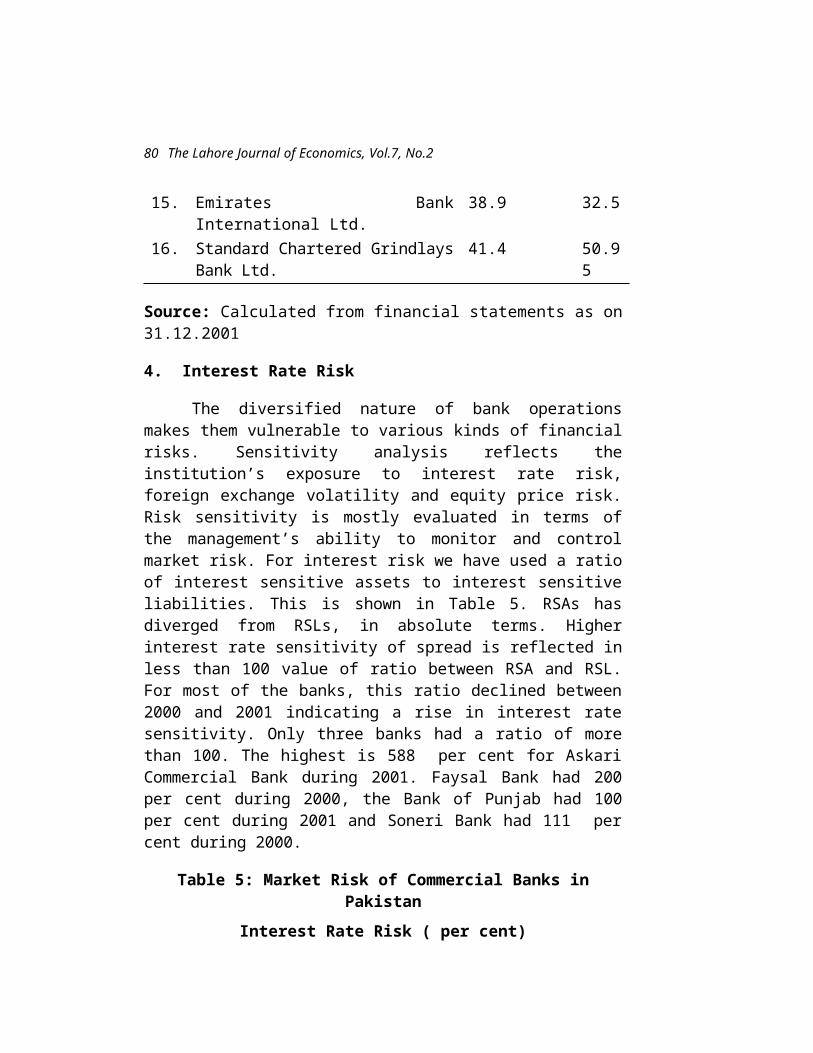
The Lahore Journal of Economics, Vol.7, No.2
Pakistan’s migration rates are highest as indicated by the urbanisation experience which is among the highest in Asia (Marwat, 1998). Population Labor Force and Migration Survey (PLM) 1979 explains that the share of rural-urban migration in total internal migration in 1972-79 was 29.8 per cent, while in 1978-79 this share increased to 38.42 per cent. According to the Population Census 1998, the urban/rural break up reveals that one in three persons live in urban areas as the share of rural population has declined by 4.2 per cent from 71.7 per cent in 1981 to 67.5 per cent in 1998. The other internal migration direction during the same period is as follows: rural to rural migration decreases from 41.3 per cent in 1972-79 to 20.3 per cent in 1996-97, while urban to rural migration direction decrease 13.9 per cent to 36.9 per cent, and urban to urban migration increases 14.9 per cent to 43 per cent during the same period.30
This increase occurred in spite of the relatively high cost of living in urban areas and relatively high urban unemployment rate. According to Todaro (1969) the expected urban to rural wage differential is the actual motivation for migration. Agesa (2000) explains this rural-urban wage differential and the gains in returns to observable productivity by stating that enhancing attributes may be a more accurate measure of the incentive to migrate. Migration literature suggest two further explanations for this phenomenon, first, non-economic factors may be a predominant influence on the migration decision. Bilsborrow et.al (1986) explain that high population density in rural areas may lead to an outflow of some of the rural population to urban areas. Second, Oucho (1998), suggests that social comforts and better housing attracts rural migrants to the city. So the economic theory, which perceives migration as an investment in human capital, is based on the maximisation behaviour of individuals. It measures the responsiveness of migration to the difference in earnings at different locations.
30 For details about data for the year 1972-79 see Demery and Arif, 1983 and for 1996-97 consult Khan and Shahnaz 2000.
94

Muhammad Akram, Lubna Shahnaz and Surayya
In the context of the increasing migration inflow in urban areas of Pakistan, the employment status of individuals is an extremely important issue, which must be analysed with respect to migration direction. Rapid urbanisation has required response by policy makers and planners to deal with this pressure created on the infrastructure of large urban centers by the influx of migrants. Several studies have been carried out in Pakistan to explore different dimensions of migration status in Pakistan.31 However, we could not find even a single study to investigate the role of employment status by migration direction in Pakistan.
This paper fills this gap and examines the factors that influence migration direction with special reference to employment status of the migrants (only male).32 It also takes into account the individual’s personal and household characteristics: age, education, marital status and household financial status etc. A reduced form model is estimated and this model portrays the decision making by the migrants as a simultaneous process as suggested by Greene (1992), and it translated into the multinomial logit model for estimation. In the present study we have used the multinomial logit model to analyse the relationship between migrants and their employment status by using the Pakistan Integrated Household Survey 1998-9. Within Pakistan, the volume of migrants is 6,701,256 in Punjab, which is 9 per cent of the population of the province (Population Census 1998). In urban areas 15.2 per cent are migrants while in the rural areas 6.4 per cent are migrants. Punjab has been used for our analysis because it offers the richest data on migration rates, as it is Pakistan’s most populated province.33 The migration rate in Punjab is the highest when compared to other provinces.31 See. For example, Irfan et.al (1983); Irfan (1986); Perveen (1993); Ahmed and Sirageldin (1994); Arif and Irfan (1997); Khan and Shahnaz (2000); Akram et.al (2001).32 Only male migrants are analysed because according to the Population Census (1998) about 97.4per cent females move from one place to another only because of non-economic reasons in Punjab.33 Punjab constituted 56.1per cent of the total population of Pakistan.
95

The Lahore Journal of Economics, Vol.7, No.2
Estimation Method
To examine the direction of migration decision of an individual we carry out a multivariate analysis. Our dependent variable in this model is categorised into five mutually exclusive categories. We assume that an individual in Punjab chooses from amongst five mutually exclusive and exhaustive alternatives available to him. These alternatives about the migration decision of an individual can take various options: first, the physical movement of individuals along with the change of residence from rural areas to urban areas (RUM) for any reason across the administrative district. Secondly, the physical movement of individuals along with the change of residence from urban areas to urban areas (UUM) for any reason across the administrative district. Thirdly, the physical movement of individuals along with the change of residence from rural areas to rural areas (RRM) for any reason across the administrative district. Fourth, the physical movement of individuals along with the change of residence from urban areas to rural areas (URM) for any reason across the administrative district. The last option is considered of individuals who do not physically move and have been living in the same place since birth (NM). These alternatives are categorised as 1,2,3,4, and 0 respectively. Akram et.al (2001) empirically analysed these alternatives by using the multinomial logit model. We used the same methodology for our empirical analysis.
Assuming that the errors in this model are independently and identically distributed with Weibull distribution then the difference between the errors has a logistic distribution (Greene (1992) and the multinomial logit is the appropriate technique of estimation. The probabilities in the multinomial logit model are therefore given by
. (1)
96
Muhammad Akram, Lubna Shahnaz and Surayya
where coefficients ’s are normalised to zero and x is the vector of explanatory variables. The multinomial logit model is identified by normalising the coefficient of one of the categories to zero. Hence we normalise the coefficient of the alternative of non migrant to zero.
The coefficients in our models are difficult to interpret because they only provide information on the effects of independent variables on the odds ratio. To interpret the effects of independent variables (x) on the probability of each category of migration we calculate partial derivatives as
…….…..(2)
where P is the probability of being a member of each alternative. The log of likelihood function is defined by defining for each individual dij = 1 if alternative category j is chosen for individual i, and 0 if not, for the other possible outcomes. Then for each individual i, one and only one of dij’s is one (Greene (1992). The log likelihood function is given by
(3)
Our model is based on the assumption that the five alternatives available for the migration decision of an individual are independent of each other. It is also assumed that for each individual all five options are simultaneously open. The parameters for each category of migration decision in each model are obtained from the estimation of a single maximum likelihood logit.
Data and Variables
The data on migration used in the analysis are obtained from the original data tapes of the Pakistan Integrated Household Survey, 1998-99 conducted by the Federal Bureau of Statistics of the Government of Pakistan. This
97

The Lahore Journal of Economics, Vol.7, No.2
nation wide survey records complete information on household composition: education, health, population, labour market activities, household expenditure, income and migration status, etc.34 The PIHS (1998-99) is based on a sample of 16,305 households and 114,996 individuals enumerated during the year 1998-99 all over Pakistan. Total sample consists of 66,656 population of ages 10 years and above having 36,384 males. A sample of 14,743 males drawn from the survey for Punjab consisting of 3383 migrants and 11,360 non-migrants.
Measuring Dependent and Independent Variables
We use migrants/non-migrant aged 10 and above for the units of observation in our empirical analysis. As was noted earlier, there are five different categories of migration direction from which an individual can decide to move. These combinations are 1) rural to urban migration, 2) urban to urban migration, 3) rural to rural migration, 4) urban to rural migration, 5) non-migration. Hence dependent variables in our analysis are RUM, UUM, RRM, URM and NM. The detailed explanation of both dependent and explanatory variables of the model is defined in Table 1. It is convenient to describe explanatory variables in various groups. The explanatory variables are those factors that may be affecting an individual’s decision to migrate-not migrate from one place to another. The first set of explanatory variables are the individual characteristics that include the age of the individual in completed years, age squared is included to capture the non-linear effect of individual age on the dependent variable. The educational status of the individual: primary, secondary and higher, which is given by three dummy variables, by keeping illiteracy as the base category. Marital status of the individual is also used as the dummy variable if the individual is unmarried. Second set of variables comprises individual employment status, which includes dummy variables for the employer, employee, unpaid family helpers and others, while self-employed is used as the base category. Third are household 34 Details are available in Pakistan Integrated Household Survey (1998-99).
98

Muhammad Akram, Lubna Shahnaz and Surayya
characteristics where we measure family type and ownership of the house, also introduced by the dummy variables. Fifth, is the economic status of the household: which measures per capita monthly income of the household in rupees.
Summary statistics of the variables as reported in Table 2 present some interesting patterns of migration status. As was mentioned earlier individuals of age 10 years and above are included in the sample. The mean age of the migrants is higher than that of non-migrants. The migration patterns show that migrants of age 37 years migrate from urban to urban areas, about 39 year of age migrate from rural to urban area and about 42 and 43 years migrate from rural to rural, urban to rural areas respectively. About 21 per cent migrants with primary education have migrated from urban to rural areas. With secondary education there is less tendency to move from rural to rural areas. Migrants with higher education migrate either from rural areas to urban areas or from urban to urban areas, which is about 13 and 27 per cent respectively. Majority of unmarried migrants migrate from urban to urban or from rural to urban areas, which are about 40 and 31 per cent respectively. The highest percentage of paid employees have moved from rural to the urban areas (42 per cent), followed by the employees who have moved in the urban-urban direction. The movement of the employer is very low in all the four migratory flows. The highest percentage of the employers has migrated from rural areas to the urban areas. The highest percentage of the self-employed male workers has migrated from one rural area to another rural area, which is about 39 per cent. Similarly the highest percentage (11.1 per cent) of the unpaid workers has moved from one rural area to another rural area. About 57 per cent migrants who have migrated from urban to urban areas belong to nuclear families. About 59 and 54 per cent migrants who have their own houses have migrated to the rural areas. Per capita annual income of the households is highest for those males who have migrated to urban areas
99

The Lahore Journal of Economics, Vol.7, No.2
perhaps due to the better economic opportunities available in the urban areas.
Empirical Estimates of Multinomial Logit Model
We estimate a multinomial logit model on migration decision direction on its various components. The estimated parameters for each category of the individual, i.e. RUM to NM are obtained from a single maximum likelihood multinomial logit model by using the data from Pakistan Integrated Household Survey 1998-99. Table 3 reports probability derivatives at the mean of the explanatory variable in bold letters followed by the estimated parameters while their asymptotic t-statistics are included in parentheses.
We find that age of the individual has a positive and significant effect on migration in all the four migratory flows while age squared has a negative and significant effect on migration except urban-rural migration, where it is negative but insignificant. The expected gains in initial earnings continue to provide young adults with strong incentives to migrate from the rural areas.
Primary education has a positive and significant effect on migration decision from rural to rural areas. Migrants with secondary education are about 4 per cent less likely to move from rural to rural area, while about 3 per cent are more likely to move from urban to urban areas. As educational level of migrants increased the probability of moving towards urban areas increased, as educational level was observed in the case of urban to urban migration. Migrants with primary education are about 1 per cent more likely to migrate, those with secondary education about 3 per cent more likely, and with higher education about 6 per cent more likely to migrate. The effect is also statistically significant in the case of secondary and higher education. The main reasons for migration in urban-urban migratory flow are economic.35
35 See Akram et.al (2001).
100

Muhammad Akram, Lubna Shahnaz and Surayya
Highly qualified people move from one urban center to another in search of better economic opportunities. About 8 per cent of migrants with higher education are less likely to migrate from rural to rural areas. It is less likely that an individual who is living in the rural area will move when he is unmarried and this effect is significant as well. It is about 2 per cent less likely that an unmarried individual will migrate from a rural to a rural area, while he is about 1 per cent more likely to migrate from an urban to urban area.
Employment status in the area of origin is crucial for the possibility of migration. Those who are self employed either in agriculture or in business, are less likely to migrate as compared to those who are either unemployed or work for private or public agencies. Employer’s effect on migration is positive only in the case of rural-rural migratory flow. This effect is insignificant as well. It is about 1 per cent more likely that a male employer will move in the rural-rural direction. The employers may belong to the agricultural occupation and move in a rural-rural direction. Agricultural occupation has positive and highly significant effect on migration from one rural area to another rural area Akram et.al (2001). Employer’s effect on migration is significant only in the case of urban-urban migratory flow, where it is negative. It is 4 per cent less likely that a male employer will move in the urban-urban direction.
Employee’s tendencies to move towards urban areas are prominent. Employee’s effect on migration is positive in the case of rural-urban and urban–urban migratory flows. This effect is significant only in the case of rural-urban migration. It is about 4 percent more likely that a paid employee will move in a rural-urban direction. Usually the wage rates are more competitive in urban areas and that may be the reason for paid employees to move to the urban areas. Unpaid family workers are about 6 per cent less likely to move from rural to urban areas or urban to urban areas and about 1 per cent less likely to move from urban to rural areas. The effect is also statistically significant. Unpaid workers migration flow is positive in
101

The Lahore Journal of Economics, Vol.7, No.2
case of rural to rural migration. However the effect is statistically insignificant.
The effect of the nuclear family is positive and significant in all the four migratory flows except urban-rural migration, where it is positive but insignificant. It is 2.2 per cent more likely that a person with a nuclear family will migrate from an urban to an urban area and 1 per cent more likely that he will move from a rural to a rural area, while it is 0.4 per cent more likely that he will migrate from a rural to an urban area. The reason behind the positive pattern in all the migration direction is that to move with a nuclear family is much easier than joint/extended families. Owning a house has a negative and significant effect in all the migratory flows except urban to rural flow where it is positive but insignificant. Per capita annual income of the household has a positive and highly significant effect on migration to urban areas. It has a negative and highly significant effect on migration to rural areas showing that households with better financial status can afford to migrate towards urban areas, as was observed urban areas have expensive cost of living as compared to rural areas. It is also because of the wage differential between the rural and urban areas.
Conclusion and policy implications
This paper was an attempt to identify those factors that influence the physical movement of an individual along with the change of residence from one place to another for any reason across the administrative district in the Punjab by using data from the Pakistan Integrated Household Survey 1998-99 and by estimating a multinomial logit model.
The present study has analysed the process of internal migration within the general theoretical framework of human capital theory which views migration as an investment with accompanying costs and returns. To analyse whether the migration decision is a rational choice in expectations of economic rewards in the destination or
102

Muhammad Akram, Lubna Shahnaz and Surayya
not, the classification of economic versus non-economic migrants was used to categorise the sample of migrants. The statistical analysis showed that the migrant population in the PIHS 1998-99 is mostly composed of males and females. The males undertook the decision of migration for economic motives, while the females’ decision to migrate is based on non-economic motives such as marriages.
The pattern of male internal migration is more evident predominantly in the urban-urban migratory flow than in rural-urban migratory flow. The reversal of the main direction of migration from the rural-urban direction to urban-urban direction is an important finding from the PIHS 1998-99. This is an indication of changed pattern of population distribution from rural-urban shift to urban-urban movements. We find that the individual’s decision to migrate in the Punjab is significantly influenced by his age, education level, family type, marital and employment status. The age variable reflects that the probability of migration increases with age. The possibility of getting a better-paid job is one of the crucial factors that affects the direction of migration decision.
Education plays an important role in setting the direction of all the migratory flows. The encouraging findings regarding migration, as a human capital investment is the significantly positive effect of education in terms of completed years of schooling on the probability of migration. The results indicate that additional years of schooling increase the probability of migration. That is why individuals with higher education are moving towards urban centers to get the benefits of better economic opportunities. Higher education appears to have a stronger effect on the probability of migrating than primary, secondary and college level education. Taken together these results do imply that there is evidence of the migration decision being positively linked to the human capital embodied in the individual.
103

The Lahore Journal of Economics, Vol.7, No.2
Employment opportunities for highly educated young people are relatively skill specific. Few local employment opportunities for educated persons compel them to stay in their areas of origin and are more likely to take jobs that poorly match their specific skills. They get a lower wage job there as compared to higher wage job which could be attained by migration to that area where their skills better match employer needs. We also find the evidence on employers’ migratory flow from rural to rural areas, which shows that they are providing agriculture related job opportunities there. Unpaid family workers move from one rural area to another rural area, while paid employees move towards urban areas. This phenomenon indicates that the wage structure is more competitive in urban areas. The results for self-employed workers indicate that the probability of migration is lower among the people who operate their own farm, business or industry as compared to government and private employees. The significantly negative coefficients of nuclear family reveal that belonging to a nuclear family system decreases the probability of migration or that belonging to an extended/joint family system increases the probability of migration.
104

Muhammad Akram, Lubna Shahnaz and Surayya
Table 1: Definition of Variables
Variables Description
Dependent VariablesRUM =1, if the physical movement of individual
along with the change of residence from rural area to urban area for any reason across the administrative district.
UUM = 2, if the physical movement of individual along with the change of residence from urban area to urban area for any reason across the administrative district.
RRM = 3, if the physical movement of individual along with the change of residence from rural area to rural area for any reason across the administrative district.
URM = 4, if the physical movement of individual along with the change of residence from urban area to rural area for any reason across the administrative district.
NM = 0, if the individuals did not physically move and are living in the same place since birth.
Explanatory Variables
Male CharacteristicsAGE Age of the male in complete years.AGES Age of the male in complete years squared.PRIMARY = 1 if individual highest level of completed
education is primary schooling and 0 otherwise.
SECONDARY
= 1, if individual highest level of completed education is secondary schooling and 0 otherwise.
HIGH = 1, individual highest level of completed education is 10 years and above schooling and 0 otherwise.
UNMAR =1, if the individual marital status is unmarried and 0 otherwise.
105

The Lahore Journal of Economics, Vol.7, No.2
Male Employment StatusEMPLOYER
=1, if the individual employment status is an employer:36 employing less than 10 and more than 10 persons and 0 otherwise.
EMPLOYEE
=1, if the individual employment status is paid employee,37 and 0 otherwise.
SELF EMPL
=1, if the individual employment status is self-employed:38 unpaid family helper and self employed, and 0 otherwise.
UNPAID =1, if the individual employment status is unpaid family helper39 and 0 otherwise.
OTHERS =1, if the individual belongs to some other employment status, which is mentioning above and 0 otherwise.
Household CharacteristicsFTYPE = 1 if individual lives in a nuclear family40
and 0 otherwise HOUSE =1, if the individual has his own house and 0
36 A person who has employed one or more persons, on continuous basis, during the reference period, is defined as employer. He may run an enterprise by himself or with one or more persons.37 A person who works for a public or private employer and receives remuneration in wages, salary, commission, tips, piece rates or pay in kind. It includes regular paid employee, casual paid employee, paid worker by piece rate or service performed, paid non-family apprentices. 38 A person who during the reference period performed some work for profit and family gain, in cash or in kind on a job where the remuneration is directly dependent upon the profits, or the potential profits, derived from the goods and services produced. Self employed persons do not get assistance from anyone, not even from unpaid family helpers. And own account non-agricultural worker: an own account worker is a person who operates his or her own economic enterprise or engages independently in a profession or trade and hires no employees, However, he/she may get the assistance of unpaid family helpers. Owner cultivator: means a person who cultivates his/her own land. Share cropper: means a person who cultivates land owned by others on the basis of sharing the produce. Contract cultivator: means a person who cultivates land owned by others on rent. 39 A person who works for pay in cash or in kind in an economic enterprise operated by a member of his/her household or other related persons is termed as unpaid family worker. 40 Nuclear Family is one consisting of a head, spouse and unmarried
sons or daughters.
106

Muhammad Akram, Lubna Shahnaz and Surayya
otherwise.
Economic Status of the HouseholdPERINCOM
Per capita annual income of the household in rupees.
107
The Lahore Journal of Economics, Vol.7, No.2
Table 2: Summary Statistics of Sample (N = 14742)
Variables
RUM UUM RRM URM NM
Individual’s CharacteristicsAGE1 39.548
(18.998)37.952(19.171)
42.978(21.150)
43.675(20.708)
28.597(17.197)
AGES 1924.697(1695.810)
1807.414(1609.959)
2294.001(1919.869)
2334.506(1943.979)
1113.524(1372.177)
PRIMARY 0.179(0.384)
0.129(0.335)
0.188(0.391)
0.208(0.407)
0.178(0.383)
SECONDARY
0.274(0.446)
0.273(0.445)
0.162(0.369)
0.368(0.483)
0.239(0.426)
HIGH 0.130(0.336)
0.273(0.445)
0.021(0.143)
0.048(0.213)
0.064(0.245)
UNMAR 0.308(0.462)
0.379(0.485)
0.265(0.442)
0.260(0.439)
0.555(0.497)
Males’ Employment StatusEMPLOYER
0.022(0.148)
0.018(0.134)
0.012(0.109)
0.013(0.113)
0.013(0.115)
EMPLOYEE
0.425(0.494)
0.407(0.492)
0.214(0.410)
0.251(0.435)
0.243(0.429)
SELF EMPL
0.207(0.405)
0.156(0.363)
0.395(0.489)
0.346(0.477)
0.236(0.425)
UNPAID 0.039(0.194)
0.026(0.159)
0.111(0.315)
0.043(0.204)
0.132(0.338)
OTHERS 0.004(0.066)
0.003(0.051)
0.006(0.077)
0.013(0.113)
0.005(0.073)
Household CharacteristicsFTYPE 0.473
(0.499)0.568(0.496)
0.484(0.500)
0.468(0.500)
0.496(0.500)
HOUSE 0.406(0.491)
0.352(0.478)
0.537(0.499)
0.593(0.492)
0.334(0.472)
Economic Status of the HouseholdPERINCOM
11953.979(15613.670)
15598.100(21514.739)
3902.552(4538.921)
4191.775(3890.922)
5931.849(8660.995)
108

Muhammad Akram, Lubna Shahnaz and Surayya
Sample Size
13789.3 per cent
7695.2 per cent
10066.8 per cent
2311.6 per cent
1135877 per cent
Source: Pakistan Integrated Household Survey (1998-99)
Note: Numbers in parentheses are standard deviations.
Table: 3 Multinomial Logit Estimates for Punjab’s Sample (N= 14742)
Variables
RUM UUM RRM URM NM
Constant
-0.262-4.243(-18.503)**
-0.184-5.108(-17.019)**
-0.160-3.514(-13.257)**
-0.067-5.517(-10.240)**
0.672
Males’ Characteristics
AGE1 0.0060.083(8.247)**
0.0020.069(5.269)**
0.0030.604(5.533)**
0.0000.050(2.285)**
-0.011
AGES -0.000-0.005(-5.168)**
-0.000-0.003(-2.518)*
-0.000-0.003(-2.758)**
-0.000-0.001(-0.619)
0.000
PRIMARY 0.0050.072(0.846)
0.0050.124(0.990)
-0.014-0.202(-2.244)**
0.0080.504(2.707)**
-0.004
SECONDARY
0.0070.104(1.361)
0.0240.514(4.936)**
-0.039-0.591(-6.177)**
0.0140.902(5.476)**
-0.005
HIGH -0.0000.025(0.225)
0.0601.245(10.190)**
-0.081-1.264(-5.471)**
0.0050.262(0.783)
0.016
109

The Lahore Journal of Economics, Vol.7, No.2
UNMAR -0.009-0.124(-1.135)
0.0090.157(1.098)
-0.017-0.283(-2.027)**
0.002 0.071(0.259)
0.016
Males’ Employment Status
EMPLOYER
-0.002-0.121(-0.538)
-0.040-0.897(-2.773)**
0.0090.088(0.283)
-0.003-0.224(-0.373)
0.036
EMPLOYEE
0.0340.441(6.480)**
0.0020.129(1.427)
-0.004-0.019(-0.208)
-0.001-0.036(-0.216)
-0.031
UNPAID -0.062-0.951(-6.348)**
-0.062-1.533(-6.471)**
0.0210.143(1.206)
-0.013-1.056(-3.089)**
0.116
OTHERS -0.009-0.158(-0.361)
-0.0250.565(-0.776)
0.0010.007(0.015)
0.0150.909(1.503)
0.019
110
Muhammad Akram, Lubna Shahnaz and Surayya
Household Characteristics
FTYPE 0.0010.081(1.294)
0.0220.503(6.116)**
0.0090.183(2.525)**
0.0000.083(0.586)
-0.032
HOUSE -0.054-0.809(-10.361)**
-0.039-1.015(-9.683)**
-0.005-0.232(-2.463)**
0.002-0.055(-0.030)
0.096
Economic Status of the Household
PERINCOM
0.0000.000(14.749)**
0.0000.000(14.558)**
-0.000-0.001(-6.718)**
-0.000-0.001(-4.290)**
-0.000
Sample Size
13789.3 per cent
7695.2 per cent
10066.8 per cent
2311.6 per cent
1135877 per cent
Number of Observations 14742Log Likelihood -10888.2
Note: Bold letters represent the partial derivatives at the mean of the dependent variables. ** Indicates significant at the 5 per cent level and * indicates significant at the 10 per cent level.
111

The Lahore Journal of Economics, Vol.7, No.2
ReferencesAgesa and Richard U., 2000, The Incentive for Rural to
Urban Migration a Reexamination of Harris - Todaro Model. Applied Economics Letters, 7:2 107-111.
Ahmed, Ather Maqsood and lsmail Siragldin, 1994, International Migration, Earnings and the Importance of Self-selection. Pakistan Development Review 33:3 211-227.
Akram Muhammad, Surayya and Lubna Shahnaz, 2001, Factors Affecting Male Internal Migration in Pakistan. Paper presented at the 2nd Annual Conference of Population Association of Pakistan “Pakistan Population Stabilisation Prospects” 31st October to 2nd November 2001, Islamabad, Pakistan.
Greene, William H., 1992, Econometric Analysis. Second Edition. New York: Macmillan Publishing Company.
Irfan. M., 1986, Migration and Development in Pakistan: Some Selected Issues. Pakistan Development Review 25:4 743-755.
Irfan. M. Lionel Demery and G. M. Arif, 1983, Migration Patterns in Pakistan: Preliminary results from the PLM Survey, 1979. Pakistan Institute of Development Economies: Studies in Population Labor Force and Migration Project. Report No. 6.
Khan, H. Aliya and Lubna Shahnaz, 2000, Determinants of Internal Migration in Pakistan: Evidence from the Labour Force Survey 1996-97. Pakistan Development Review 39:4 695-712
Perveen, Azra, 1993, Inter-Provincial Migration Pakistan, 1971-1981. Pakistan Development Review 32:4 725-735.
Pakistan, Government of 1998, The 1998 Census Report of Pakistan. Islamabad: Population Census Organisation.
112

Muhammad Akram, Lubna Shahnaz and Surayya
Sjaastad, L. A., 1962, The Costs and Returns of Human Migration. Journal of Political Economy 70:5 80-93.
Todaro. M., 1969, A Model of Labor Migration and Urban Unemployment in Less Developed Countries. The American Economic Review 59:1 138-148.
Marwat, Himayatullah, 1998, Urbanization and its Concomitant Hazards’. Pakistan , 2nd September 1998.
113

Shalendra D. Sharma
Review Essay:
The IMF and the Argentine Meltdown
What Went Wrong and the Lessons Learnt
Shalendra D. Sharma*
Mussa, Michael, 2002. Argentina and the Fund: From Triumph to Tragedy. Washington, DC.: Institute for International Economics (ISBN: 0-88132-339-X).
When Carlos Saul Menem was elected Argentina’s president in May 1989, the economy was already under the punishing throes of hyperinflation. To salvage investor confidence and stabilise the economy, the government resorted to a desperate measure. In March 1991 the Congress passed the “convertibility law” establishing the convertibility of the austral (the Argentine currency since 1985) at a rate of 10,000 australes per U.S. dollar. In January 1992, the peso replaced the austral (1 peso for 10,000 australes). Under this arrangement (a form of a currency board system), outflows of foreign currency reserves had to be matched by reductions in the domestic monetary base. The domestic currency could be issued only in exchange for a specified foreign currency at a fixed rate. The convertibility plan allowed the use of either U.S. dollars or Argentine pesos in any transactions except wage and tax payments. Most importantly, the peso/dollar exchange rate was pegged at one to one with full convertibility between the two currencies. This meant that the public could go to the Argentine central bank and exchange a peso for a dollar, or vice-versa, at any time.
To give credibility to its commitment, the government sharply curtailed the discretionary lending powers of the central bank and stipulated that each peso * The author is Associate Professor of Political Economy, University of San Francisco, San Francisco, California.
109
The Lahore Journal of Economics, Vol.7, No.2
in circulation had to be backed by the dollar (or similar hard currency) at the central bank. Moreover, the peso supply could not expand without a corresponding increase in the supply of dollars, and reserves consisting of gold and foreign currency or deposits and bonds payable in gold and foreign currency had to be maintained at a level no less than 100 per cent of the monetary base. Domestic money creation was also strictly limited as the currency board explicitly forbade monetising government deficits, that is, printing money to pay the bills. Indeed, the convertibility plan effectively tied the hands of domestic policymakers as the currency board shifted the burden of responsibility for monetary policy onto the external sector. Finally, cognisant of the fact that the currency board could not be sustained in the long run without sound fiscal discipline, the government introduced a set of sweeping measures designed to promote market-based structural reforms. Cumulatively, these measures altered the monetary system, improved fiscal and tax policies, deregulated the banking industry, liberalised trade, and reformed the public sector, including the privatisation of the country’s debt-ridden state-owned companies in sectors ranging from telephone, airline, railroad, shipping and petrochemicals.
Surpassing all expectations, Argentina’s far-reaching reforms produced an unprecedented economic recovery, ushering in a new era of prosperity. From 1991 to 1994, the Argentine economy enjoyed its longest expansion in the entire postwar period. The size of the economy expanded rapidly from an estimated US$141 billion in 1990 to US$298 billion in 1998. Inflation, which had been running at over a 1000 per cent annual rate in 1990, fell to less than 5 per cent by the end of 1994. In fact, consumer price inflation was negative by early 1999, while the wholesale prices rose by a mere 1.2 per cent. Price stability provided the framework for strong economic recovery, and between 1991-96, growth averaged almost 9 per cent annually, one of the highest in the world. Equally impressive, the federal government’s fiscal deficit receded from an average of about 6-8 per cent of GDP for
110

Shalendra D. Sharma
most of the 1980s to around 2 per cent by the mid-1990s. With such an enviable record, Argentina soon became the poster-child of development -- a model for other emerging economies to emulate.
The credibility of Argentina’s currency board was greatly enhanced by its handling of the Mexican peso crisis of 1994-95. In the early days of the crisis nervous investors pulled money out of Argentine banks (deposits fell by some 18 per cent), besides exchanging pesos for dollars. In 1995 alone, Argentina suffered a capital outflow of some US$6 billion. All this caused a contraction in the country’s money supply, resulting in a sharp drop in economic activity. Overall, the economy shrank by 2.8 per cent in 1995. Because the Argentine central bank had no control over monetary policy under the currency board system, it was relatively helpless in counteracting the contractionary monetary policy stemming from investor behaviour. Moreover, because the currency board did not allow the central bank to create pesos and lend them to the banks, it had very little capability to act as a lender of last resort.
Nevertheless, what the government could do, it did quite effectively -- namely, overhauling the banking system, slashing the federal budget and tightening fiscal policy. More importantly, the government’s take-charge response prompted the multilateral financial agencies to come forward with generous support. The prompt assistance by the IMF, the World Bank and the Inter-American Development Bank (which altogether lent over US$5 billion), enabled Argentina to shore up both the banking and the currency board system. The country’s ability to maintain its fixed exchange rate vis-a-vis the U.S. dollar boosted domestic and international investor confidence -- thereby enabling it to survive the contagion from the Mexican crisis. Indeed, after a sharp recession in 1995, the Argentine economy resumed rapid growth in late 1995 -- notching an impressive growth rate of 8.4 per cent in 1997.
111

The Lahore Journal of Economics, Vol.7, No.2
The Asian and the Russian financial shocks of 1997-98 posed another grave challenge. Yet, once again Argentina weathered the fallout relatively well. This further convinced many that the economic reform measures coupled with the convertibility plan was key to Argentina’s remarkable resilience. In fact, so enamoured were the international financial community with Argentina’s record that the IMF publicly applauded many of the country’s economic policies. Not surprisingly, Argentina became the quintessential emerging market economy -- a model for others to emulate. Not only did President Menem become the most sought-after speaker at gatherings of financial heads, Argentina was now able to float a large issue of medium-term and long-term debt on world credit markets at comparatively modest spreads over US Treasuries.
However, a decade after it began, the Argentine miracle was over. In late December 2001, Argentina defaulted on its US$155 billion of central and provincial government debt -- the largest sovereign debt default ever. On 6 January 2002, after three changes of government following large-scale street protests, the exchange rate peg was abandoned and the currency allowed to float freely against the dollar. Immediately, the peso was devalued to four pesos per dollar.
What went wrong? Clearly the Argentine tragedy was gradual in the making. Specifically, it was the third systemic financial shock, the Brazilian devaluation in January 1999 that fundamentally tested the feasibility of the currency board. As the devaluation of the Brazilian real pushed the bilateral exchange rate of the peso up by nearly 18 per cent in real terms, the adjustment burden in Argentina was sudden and harsh. Unlike Mexico and the Asian economies, Brazil is Argentina’s main trading partner and competitor. Brazil’s floating exchange rate made the real increasingly competitive against the Argentine peso. With its wages and inputs in dollars, Argentina’s exports were simply too expensive to compete with those of Brazil and other developing countries. The
112

Shalendra D. Sharma
appreciation of the dollar in the late 1990s further compounded the problem. As the currency board experienced overvaluation, Argentina’s exports became even less competitive on the world market. As these effects spilled over to the real side of the economy, it resulted in an overall slowdown in activity.
To keep the peso-dollar peg intact as the economy became less competitive, the authorities tightened macroeconomic policy and raised interest rates. The high interest rates produced a mushrooming government deficit because of the higher interest on the national debt and lower tax base as the economic downturn took its toll. The end result was a sluggish economy with growing debt and burgeoning trade imbalance and current-account deficit -- which reached nearly 5 per cent of GDP in 2000. Indeed, the trade imbalance made it impossible for Argentina to earn the foreign exchange needed to pay the interest on its foreign debt. Instead, it had to borrow to meet these interest payments -- causing the debt to grow even larger.
The 2000-2001 global economic slowdown sealed the fate of Argentina’s monetary and exchange rate arrangements. Industrial production declined by a massive 18 per cent by December 2001 on a year-on-year basis, while GDP had contracted by nearly 5 per cent. In mid-2000 the government raised income taxes in an effort to balance its budget. On 20 November 2001, the government was forced to create the so-called “corralito” (i.e. a bank deposit freeze). This measure imposed restrictions on deposit withdrawals, limiting the cash withdrawals from savings and checking accounts to $1,000 per month, besides levying a tax on financial transactions. But these efforts failed to stop or slow the economic decline. Most troubling was the steady rise in the current account deficit -- which had widened to nearly 7 per cent of GDP by the third-quarter of 2001. Despite significant IMF assistance, Argentina now faced a major crisis of confidence as bank deposits, both peso and dollar denominated became subject to unrelenting attrition.
113

The Lahore Journal of Economics, Vol.7, No.2
Roughly US$20 billion in capital fled the country in 2001, while the peso interest rates climbed to between 40 per cent to 60 per cent, further weakening the government’s budget position. Against these negative trends, domestic lending contracted, as did output and employment. At the end of 2001, Argentina moved to a dual exchange rate system by adopting a preferential exchange rate peg for exports. This move eliminated the characteristic of full convertibility. However, it failed to reassure the markets. The government then froze bank deposits in December 2001 in a last-ditch effort to save the financial system from collapse -- but it was too little too late. After all, Argentina’s fixed exchange rate system was based on full capital account convertibility. This not only allowed domestic residents to convert pesos to dollars at a fixed exchange rate on one peso per dollar, but also allowed an unlimited export of those dollars -- much of which had already taken place. In the end, unable to control the interest rate differentials between peso-denominated and dollar-denominated debt, Argentina abandoned it in January 2002. On February 3 the government announced it would turn all dollar debts into pesos at a rate of one-to-one. This change would help debtors pay back their loans since it will reduce the value of their debt substantially because the floating value of the local peso is at a volatile actual market rate of around two pesos per dollar. However, both the creditors and the banks will suffer losses because of the so-called “pesofication” of debt. Furthermore, this economic plan also turns all dollar deposits into local pesos at a rate of 1.4 to the dollar.
The Argentine meltdown raises some important broader questions. First, what role did the IMF play prior to the crisis? In his appropriately titled monograph, Argentina and the Fund: From Triumph to Tragedy former IMF chief economist Michael Mussa provides a balanced and well-reasoned analysis. Mussa's study traces the evolution of Argentina from being one of the Fund's greatest success stories through most of the 1990s to one of its most tragic failures. He emphasises that Argentina, during the past decade, is a particularly important case for evaluating the
114

Shalendra D. Sharma
role and performance of the IMF because unlike most other countries that have recently received large amounts of IMF financing, Argentina did not request support only as a crisis was under way or practically unavoidable, but rather was under the scrutiny of IMF-supported programmes throughout the period41. Although the key decisions in the vital areas of fiscal, monetary, and exchange rate policy were undoubtedly those of the Argentine authorities and generally enjoyed broad popular support, the IMF supported and praised these policies and thus must bear significant responsibility for their final tragic failure.
Specifically, to Mussa, the persistent inability of the Argentine authorities at all levels to run a responsible fiscal policy -- even when the economy was performing well -- was the primary avoidable cause of the country’s catastrophic financial collapse. He adds that this failure was clearly avoidable, especially when Argentina's economy was performing well. In particular, from 1993 to 1998, Argentina’s GDP advanced 26 per cent and the government enjoyed substantial fiscal benefits from privatisation and the Brady bond restructuring. However, during the same period the ratio of government debt to GDP rose from 29 to 41 per cent -- demonstrating an addiction to fiscal laxity. This would prove fatal in far less advantageous circumstances that prevailed after 1998. When times were good, however, the IMF failed to press Argentina to run a sustainable fiscal policy and thus it bears heavy responsibility for the critical failure in this vital area. Moreover, while the IMF accepted the convertibility plan as a basic policy choice of the Argentine authorities so long as it remained viable, it erred in the summer of 2001 by extending further massive support for unsustainable policies. Put bluntly, although the decision to persist with the convertibility plan, especially as it came under increasing pressure during the period 1999-41 Argentina has received extensive assistance from the IMF over the past years. For example, in March 2000, the IMF agreed to a 3-year, $7.2 billion arrangement with Argentina. Moreover, in January 2001, the IMF augmented its earlier agreement by pledging another $7 billion for it as part of a larger $40 billion assistance package which involves the Inter-American Development Bank, the World Bank, Spain, and private lenders.
115
The Lahore Journal of Economics, Vol.7, No.2
2001 were clearly the choice of the Argentine authorities, the IMF, nevertheless, supported these decisions and thus must share part of the blame for the Argentine tragedy.
Mussa notes that for more than a year after the Brazilian crisis, Argentina remained the darling of emerging-market finance and was able to continue floating large bond issues on private international credit markets. By late 2000, however, global markets came to question the sustainability of Argentina's finances and a potentially devastating crisis loomed. The IMF responded with a large international support package, conditioned on Argentina's commitment to rein in its fiscal deficit. Mussa concludes that this effort was reasonable to give Argentina a last chance to avoid disaster; despite clear risks that the effort might not succeed – albeit, those risks were not yet overwhelming. However, during the first eight months of 2001, Argentina's efforts in the fiscal area continued to fall short. Global financial markets became progressively more disillusioned. Domestic runs on Argentine banks depleted reserves. There was no longer a realistic hope of avoiding a sovereign debt restructuring and probably a revocation or substantial modification of the Convertibility Plan. At this point, Mussa concludes, the IMF made another important mistake by disbursing another large chunk of support for an effort that was doomed to fail and by not insisting that the Argentine authorities needed to consider an alternative policy strategy before events compelled an even more catastrophic outcome. That outcome was finally forced in early December 2001 by runs on Argentine banks and the government's decision to restrict bank withdrawals. Nevertheless, the situation continued to deteriorate.42 Despite the election by the Argentine Congress of a new President, Eduardo Duhalde, to fill out his predecessor's term, the Argentine government failed to put together a credible policy programme to stabilise the 42 On November 30, 2001, President de la Rua imposed a $ 1,000 per month limitation on personal bank withdrawals. As a result of this restriction and other austerity changes in the Argentine government, violent protest broke out and President de la Rua was forced out of office on December 20 of last year. Over the next ten days, there were four different presidents of Argentina, including Mr. Eduardo Duhalde, who is currently in power.
116

Shalendra D. Sharma
economy and financial system and begin the process of recovery. Rather, Duhalde’s prescriptions which included the end of the currency board and the implementation of a dual exchange rate in which the peso was floated for financial transactions and fixed the ratio at 1.4 pesos to the dollar for foreign trade and certain other transactions was clearly not enough. On top of that he also continued the freeze of bank deposits in dollars over certain thresholds.
In this context, the IMF correctly withheld further support. Mussa concludes by listing the requirements for a credible new Argentine economic programme: reasonable economic assumptions, fiscal discipline that recognises both Argentina's dire situation and the limits on available financing, a monetary policy that avoids hyperinflation, responsible efforts to resurrect the banking system, and fair treatment of external creditors and other claimants on defaulted contracts. He also suggests an appropriate scale of potential IMF support: a roll-over of payments already owed to the IMF plus, under stronger conditionality if it can be negotiated, additional money up to an annual limit of Argentina's IMF quota.
Mussa notes that it is essential for the IMF itself to learn the right lessons from the failures in Argentina. He argues that better mechanisms of responsibility and accountability are needed in the Fund. Internal discussion and dissent, including to countervail the tendency of many staff and management to give the benefit of the doubt to a country's authorities, needs to be encouraged, with more active involvement of the IMF's Executive Board. Critical evaluations of IMF programmes need to be seriously undertaken by the newly created independent evaluation office, with particular emphasis on programmes with high levels of Fund support. Finally, Mussa notes that the case of Argentina has general implications for the use and usefulness of large IMF support packages. Argentina, in addition to Russia and several smaller cases, shows that the frequently raised concern of "moral hazard" arising from such support has surely been over emphasised. The Argentine case indeed has provided a
117

The Lahore Journal of Economics, Vol.7, No.2
clear message that private creditors cannot rely on protection from the official sector when it engages in imprudent lending. Rather, private creditors and, more importantly, the international community as a whole need to have an IMF that applies responsible discretion in determining those circumstances in which it is reasonable and desirable—and those circumstances in which it is not reasonable or desirable—for the IMF to commit large-scale support.
More broadly, Mussa notes that if Argentina had decided in 1997 or even in mid-1998 that the convertibility plan had fulfilled its purpose and the time had come to shift to a more flexible regime for exchange rate and monetary policy, it might have been better able to manage the difficulties of 1999-2001. Clearly in a globalised world, a fixed exchange rate regime introduces unnecessary rigidity in the policy-making arena. Globalisation exposes economies to external shocks and these shocks can be more easily absorbed with flexible exchange rates. The Argentine authorities concern regarding inflation was valid, but these concerns need to be balanced against other objectives. There is little justification for maintaining a commitment to low inflation in the face of declining output and rising unemployment.
Second, what does the crisis tell us about the efficacy of currency boards? No doubt, the question of whether and when exactly the currency board could or should have been abandoned remains a matter of debate. One option would have been to do it as soon as the credibility of the monetary strategy had been established -- say after three years. Another possibility would have been in 1996-97 when the economy was rebounding after the Mexican crisis. In hindsight, this may have been the last chance for an orderly exit. Suffice it to note, a currency board system can be credible only if the central bank holds sufficient official foreign exchange reserves to at least cover the entire narrow money supply. In this way, financial markets and the public can be assured that every domestic currency bill is backed by an equivalent amount of foreign currency in the official coffers. This was not the case in Argentina. The Argentine case has
118

Shalendra D. Sharma
shown that if countries have open capital accounts, hard pegs based on currency boards are difficult to put in practice. For a fixed exchange rate regime to coexist with an open capital account, product and labour markets need to be highly flexible. Again, this was not the case in Argentina. More broadly, Argentina’s failed currency board illustrates that an improper exchange rate peg is doomed to failure no matter how rigorously one imposes conditions to engender credibility. Clearly, exchange rate arrangements are no cure for problems in the area of macroeconomic policy. Despite the relatively strong set of rules governing the conduct of Argentina’s currency board, the regime collapsed in relatively quick order when domestic and foreign investors determined that the Argentine government’s fiscal policies were unsustainable. The moral of the story is unambiguous: no fixed exchange rate regime, even one as institutionally strong as Argentina’s is completely sound. Perhaps the most important lesson from Argentina’s experience is that an exchange rate regime is only as good as its peg.
Third, is dollarisation the cure? Both, long before and following the devaluation, some Argentine policymakers suggested that dollarisation is the answer to Argentina’s woes. The argument is that market speculation over a possible devaluation resulted in a loss of credibility and that the replacement of Argentine pesos with U.S. currency as the only official medium of exchange would eliminate Argentina’s currency risks, lower interest rates and instill confidence. While they consider the convertibility plan to be the best policy decision of the 1990s, they now argue that it is time to take it further -- with dollarisation. Yet, dollarisation and currency boards help establish fiscal credibility, they do not guarantee fiscal health. Argentina benefited from the currency board-like system in the early years, but that success did not lead to consistent fiscal reform and investment. Under dollarisation, Argentina would have experienced the same exchange rate appreciation and therefore the same loss of competitiveness vis-à-vis its primary trading partners who were not tied to the dollar. Thus, Argentina would have probably ended up in a similar
119

The Lahore Journal of Economics, Vol.7, No.2
unsustainable fiscal situation. Either way, the miracle would have come to a similar abrupt and tragic end.
Finally, what explains why contagion was limited following the Argentine default? There are three basic explanations. First, the default was largely expected. Since the crisis unfolded almost in slow motion, investors had ample opportunity to restructure their portfolios in advance. With the exception of Uruguay, most Latin American banks have maintained only a small exposure to Argentina. The Chilean corporate sector holds large investments in Argentina and has reported substantial valuation losses. But they have not been large enough to have a significant impact on the Chilean stock market or banking sector. Second, better and more timely economic information has fostered increased investor discrimination. This is an important example of how the global effort to reform the architecture of the international financial system is bearing fruit. Third, the search for increased portfolio diversification in an environment of ample global liquidity, low returns in the US and growing concerns about the quality of US corporate bonds after Enron has favoured large and relatively liquid markets such as Mexico and Brazil. Argentina's share in the EMBI-Plus emerging market bond index has fallen from a peak of nearly 30 percent at the end of 1998, to 15 percent at the end of last October, to barely 2 percent now.
Currently, Argentina faces a highly complex set of challenges in the economic and financial sphere. Output and employment are depressed, the normal functioning of the banking system has been disrupted, the Government is unable to service its debts, and substitute quasi-currencies are circulating throughout the economy. The crisis has given rise to substantial financial losses, many of which have yet to be recognised and attributed. Confidence is at a low ebb, not only in the economic and financial system, but also in social and political structures more generally. Moreover, the present government is of an interim nature, and will hand over to a new administration following
120

Shalendra D. Sharma
elections scheduled for March 2003. Clearly, the rebuilding of the Argentine economy will be long and hard.
121

Qais Aslam
Book Review
Gerald M. Meier and Joseph E. Stiglitz (Eds.) Frontiers of Development Economics: The Future In Perspective, World Bank and Oxford University Press, Washington D. C. 2001, 575 pp.
Qais Aslam
The book consists of revised papers and commentary from the symposium “The Future of Development Economics” held in Dubrovnik in May 1999 and sponsored by the University of Zagreb and the World Bank. Nicholas Stem has written the forward to the book.
In the Introduction: Ideas for Development, G. M. Meier notes that “Over the past Half-Century, we have witnessed an unprecedented effort by the international community to accelerate the development of poor countries. This effort has been based on evolution in thinking about economic development - its nature, its causes, and the choice of policies for improving the rate and quality of the development process. Although the development record exhibits many successes, there are also failures and disappointed expectations”. He further points out “No formula exists for development. Aid alone cannot yield development”.
Gerald M. Meier: The Old Generation of Development Economics summarises the past and future of development economics from the viewpoint of the 'old generation’. To put the future of development economics in perspective, Meier reviews the development ideas from the first (1950-1975) and second (1975-the present) generation of development economists. Against this background, he then considers the unsettled questions and unfinished tasks for the next generation. These involve the recognition of an expanded meaning of 'economic development', more attention to the residual (total factor productivity) in the production-function approach to the sources of growth; refinement and
119
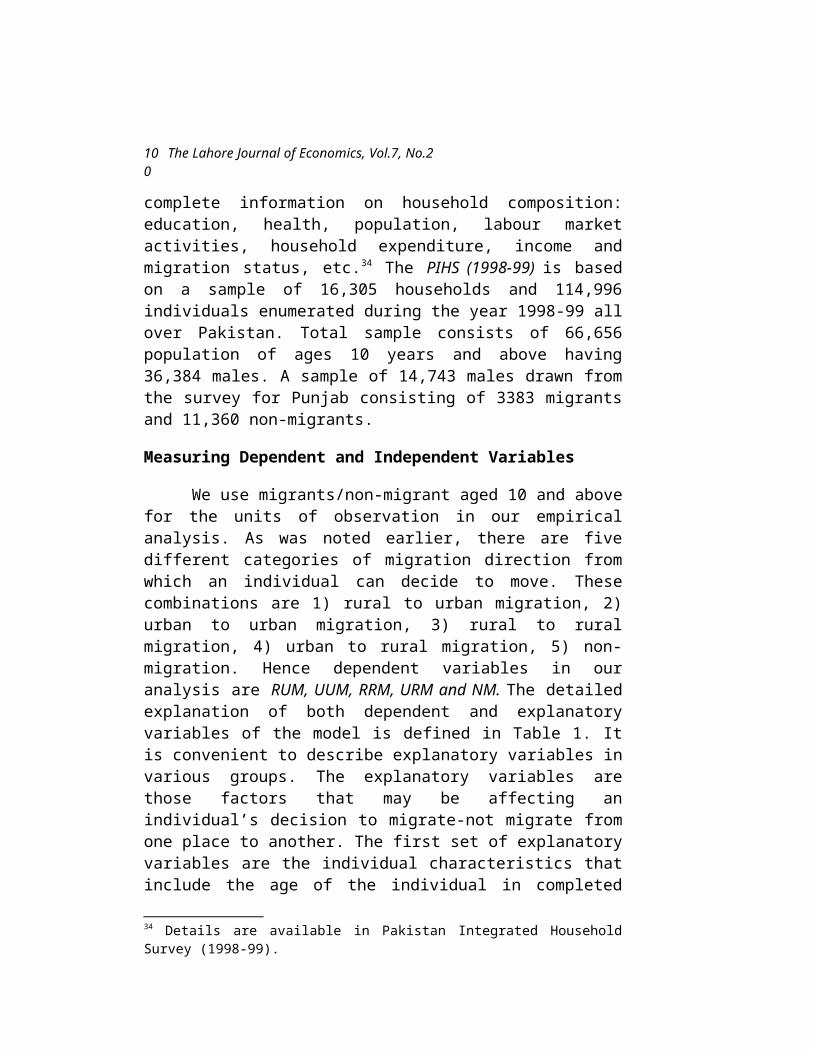
The Lahore Journal of Economics, Vol.7, No.2
extension of new growth theories in relation to the economics of ideas and knowledge; interpretation of ‘right institutions’; determination of sources and consequences of social capital; undertaking of multidisciplinary analysis; recognition of historical lessons; examination of the opportunities and problems being created by globalisation; and attention to new perspectives on the interdependence of the state and the market in the development process. Meier distinguishes between ordinary neoclassical economic analysis of development and a more comprehensive approach that look to the operation of large, innovative changes and political-economy issues in development policymaking. All these issues are subsumed in the general question of whether development economics is to be regarded simply as applied economics or whether there is a need for a special development theory to supplement general economic theory.
In On the Goals of Development Kaushik Basu maintains that new goals for development - beyond simply increasing the rate of economic growth - are implied by the movement toward “human development” or "comprehensive development'. But can these larger social and political goals be given more precise meaning, let alone be subjected to measurement and some operational metric for the purposes of evolution? This question receives prime attention. To the extent that income growth is relevant, Basu suggests that the focus should be on how the poorest people are faring and on the growth rate of the per capita income of the poorest quintile of the population. Of special interest is the relatively ignored subject of the strategic interaction between the goals of different countries and the issue of “conditional morality” that they present. Such an analysis is relevant for the design of coordinated actions by nations to achieve development objectives.
Irma Adelman in Fallacies in Development Theory and Their Implications for Policy identifies three major misconceptions, a) underdevelopment has but a single cause (whether it be low physical capital, missing
120

Qais Aslam
entrepreneurship, incorrect relative prices, barriers to international trade, hyperactive government, inadequate human capital, or ineffective government); b) a single criterion suffices in evaluating development performance; and c) development is a log-linear process. Adelman maintains that development should be analysed as a highly multifaceted, nonlinear, path-dependent, dynamic process involving systematically shifting interaction patterns that require changes in policies and institutions over time.
In Revisiting the Challenge of Development Vinod Thomas argues that development outcomes in the past decade confirm the essential contribution of market-friendly actions but also highlight missing or underemphasised ingredients. Foremost among the latter are the distribution of human development, the protection of the environment, globalisation and financial regulation, and the quantity of governance. Giving top priority to these issues would mean integrating the quality dimensions into development approaches instead of striving to maximise short-term growth. It would also replace the one-track effort to hasten the pace of market liberalisation and would expand the attention given to consensus building in civil society, along with the concern for policy changes.
In The Evolution of Thinking about Poverty - Exploring and Interactions Ravi Kanbur and Lyn Squire describe the progressive broadening of the definition and measure of poverty, from command over market-purchased goods (income) to other dimensions of living standards such as longevity, literacy, and health and, most recently, to concern about risk and vulnerability; and about powerlessness and lack of voice. Kanbur and Squire argue that although there are some correlations among these different dimensions, the broadening of the definition significantly changes our thinking about how to reduce poverty. The broader concept expands the set of relevant policies, but it also emphasises that poverty-reducing strategies must recognise interactions among
121

The Lahore Journal of Economics, Vol.7, No.2
policies: the impact of appropriately designed combinations will be greater than the sum of individual parts. The authors maintain that additional research is required to increase our understanding of those interactions, that in-depth country case studies are needed to explore the best policy combinations for countries with different problems and different capacities; and that institutional innovations designed to overcome information failures and knowledge gaps need to be carefully evaluated.
In Development Issues - Settled and Open Shahid Yusuf and Joseph E. Stiglitz consider which issues in development economics appear settled and which require future attention. Settled issues have to do with the following questions: what are the sources of growth? Does macroeconomic stability matter, and how can it be sustained? Should developing countries liberalise trade? How crucial are property rights? Is poverty reduction a function of growth and asset accumulation, or are poverty safety nets required? Can developing countries defer or downplay environmental problems? How closely should the state manage and regulate development? Current trends reveal a range of issues that are likely to call for future analysis and action. These trends relate to globalisation, localisation, environmental degradation, demographic change, food and water security, and urbanisation. The issues can be grouped under two headings: a) multilevel governance and regulation issues (participatory politics, organisational capability, decentralisation, inequality, and urban governance) and b) issues related to managing human capital and natural resources (cross-border migration, aging and capital supplies, management of the global commons, and food and water security). Responding to these issues could accelerate convergence of both income levels and human development levels. Fresh thinking on governance, institutions, regulatory policies, and measures for managing resources will lead to the highest payoff.
122

Qais Aslam
Institutions and incentive structures are also central in Pranab Bardhan’s discussions of Distributive Conflicts, Collective Action, and Institutional Economics. Drawing the connections between the new institutional economics and development economics, Bardhan gives particular attention to some issues such as a) the persistence of dysfunctional institutions in poor countries, b) institutional impediments as outcomes of distributive conflicts, c) the collective action problems these conflicts exacerbate, and d) a more complex and nuanced role of the state, to deal with the need for coordination. The analysis focuses on the effects of distributive conflicts among different social groups and asymmetries in bargaining power. Bardhan explains institutional failures and draws attention to the inevitable collective action problem at both the federal and local levels.
In Historical Perspectives on Development. Nicholas Crafts asks whether development economics has much to gain from resuming a closer relationship with economic history. Moving beyond growth regressions, the analysis focuses less on production and more on living standards, an area in which according to Crafts, development economists and economic historians can interact fruitfully. Central to both long-run economic history and development are endogenous institutional and technological changes. Crafts emphasises the importance of solving agency and appropriation problems in creating an environment conducive to innovation and productivity improvement. The next generation of development economists should be able to gain more insights from economic history than did the second generation.
Merilee S. Grindle in Quest of the Political - the Political Economy of Development Policymaking, asserts that there is still much to explain about development policymaking from a political-economic perspective. Grindle explicates two divergent traditions of political economy, based on economic and on sociological theory, that offer different interpretations of decision-making and the process of policy reform. Neither of these contending
123

The Lahore Journal of Economics, Vol.7, No.2
paradigms, Grindle argues, is adequate for understanding four real-world puzzles: why and when are politicians interested in supporting policy changes? How do political institutions affect the choices made by politicians? How are new institutions created or transformed? What are the consequences of new rules of the game for economic and political interaction? Grindle asserts that political-economy analysis should be able to model reality by reflecting the dynamics of policy and in the creation or transformation of institutions. The author emphasises that if development economists are to understand political decision-making, inquiry into political processes is especially needed.
In Modern Economic Theory and Development Karia Hoff & Joseph E. Stiglitz focus directly on the questions of what are the forces that can explain the divergence in income across countries and what interventions are more likely to promote development? The answers of the authors to these two fundamental questions reflect recent advances in economics of imperfect information and the economics of coordination failures. Instead of assuming that the information costs are negligible and the capacity to contract is limitless, Hoff & Stiglitz make explicit assumptions about individual-specific information constraints and the set of feasible transactions. This means that institutions, history, and distributional considerations do matter and that the analysis must go beyond the usual fundamentals of resources, technology, and preferences. Neither government-induced distortions, nor low capital accumulation have proved adequate for explaining underdevelopment. Hoff and Stiglitz emphasised that industrialised and developing countries are on different production functions and are organised in different ways.
The book closes with two sections of present reflections on the future of development economics by Nobel laureates and some original 'Pioneers' in the field.
The book Frontiers of Development Economics: The Future In Perspective makes interesting reading and gives
124

Qais Aslam
a comprehensive study of the present and future of development economics in the words of some of the leading development economists of today's world. It is spiced up by words of Nobel laureates and some of the 'Pioneers' in the field. The book teaches students and teachers of development economics as well as policymakers in the developing countries that in order to put the future of development economics in perspective, all these issues that have been thrashed out by eminent names in the book are subsumed in the general question of whether development economics is to be regarded simply as applied economics or whether there is a need for a special development theory to supplement general economic theory. If development economics has to achieve some goals in the developing world, reduce poverty levels, reduce income and other inequalities, and increase economic growth and over all development patterns, then the new goals for development - beyond simply increasing the rate of economic growth - are implied by the movement towards “human development” or “comprehensive development”. Such an analysis as done in the articles of the book, is relevant for the design of coordinated actions by nations to achieve development objectives. Development should be analysed as a highly multifaceted, nonlinear, path-dependent, dynamic process involving systematically shifting interaction patterns that require changes in policies and institutions over time. And that development outcomes in the past decade confirm the essential contribution of market-friendly actions have increased economic growth, but also highlight the missing or underemphasised ingredients. Poverty-reducing strategies, which must recognise interactions among policies: the impact of appropriately designed combinations will be greater than the sum of individual parts. That additional research is required to increase our understanding of those interactions, that in-depth country case studies are needed to explore the best policy combinations for countries with different problems and different capacities. And that institutional innovations designed in order to overcome information failures and
125

The Lahore Journal of Economics, Vol.7, No.2
knowledge gaps need to be carefully evaluated by economists and policymakers alike.
The book also advocates that fresh thinking on governance, institutions, regulatory policies, and measures for managing resources will lead to the highest payoff. It draws attention to the inevitable collective action problem at both federal and local levels in every government of the developing world. The book advises the next generation of development economists to gain more insights from economic history than did the second generation. If development economists are to understand political decision-making, inquiry into political processes is especially needed. The pivotal questions posed by the book of a) why different countries of North and South are on different levels of economic development and b) how this gap can be bridged, the book advocates that industrialised and developing countries are on different production functions and are organised in different ways, therefore should be taken as different groups in economic development theory.
In conclusion, the following should be considered:
1. Growth is not the only measure of economic development; there are other measures and important dimensions to economic development like political democracy, human rights, health, education, the environment, and equal access to opportunities. These are the new challenges, which have to be considered by modem development economists.
2. Statistics and research show that income inequality in rich nations with high economic growth is relatively the same as with countries of low economic growth, while other indicators (social, political, and economic) are low where high income countries have more equality and low income countries have high inequalities between the upper
126

Qais Aslam
richer portion of the population and the lower poorer portion of the population.
3. Enforcement of regulations such as those against employment of child labour and compulsory basic education for all will go a long way to reduce malpractices and exploitative practices in developing countries.
4. Can institutions be disregarded when they become dysfunctional or introduced when they are appropriate?
5. Public sectors are giving advantages to marginalised people and minorities, while the private sector is advantageous to the majority in a country or the educated who can innovate.
6. What would be the role of the bureaucracy if the implementation as well as formulation of policy is to be part of development economics?
7. How can actual changes to institutions be brought about? How strengthened will be the institutions at the grass roots levels? What is the role of the leader in institution building? The role of media in institution building and governance?
8. How large or small will be the decision making and law enforcing institutions in countries with larger population and or territory, but with small budgets, etc?
Government College Qais AslamLahore
127

Rukhsana Shah
Book Review
Haque Irfan ul Ed. Trade, Technology and International Competitiveness Economic Development Institute of the World Bank, Washington DC, 1995 pp 218.
The book deals with the issue of international competitiveness and why developing countries need to look at this aspect of world trade in the context of their aspirations and limitations, keeping in mind the fact that the global economic system is becoming more and more unipolar and sophisticated. Haque’s book consists of papers by a number of well-known economists and policy anaylists, all of whom deal in detail with the present scenario of world trade and the lessons learnt from the past.
International competitiveness as defined by the US Commission on Industrial Competitiveness is “the ability of a country to produce goods and services that meet the test of international markets and simultaneously to maintain and expand the real income of its citizens”. Haque explains in his Introduction that the issue of developing specific public policies to increase a country’s international competitiveness in the free market has become contentious, in that economists are divided both on their extent and efficacy. He argues that competitiveness need not become a “dangerous obsession”. The recent advances in thinking on the issues of trade, technology and competitiveness have a relevance for developing economies. These countries stand to learn a great deal from the current debate, as the benefits they can derive from their integration into the world economy will depend on their capacity to build and sustain their international competitiveness not only through technological innovation, but equally by developing a well-thought out theoretical framework for a viable public policy at home.
Recent developments in international trade have led to a much faster growth in trade rather than industrial
127
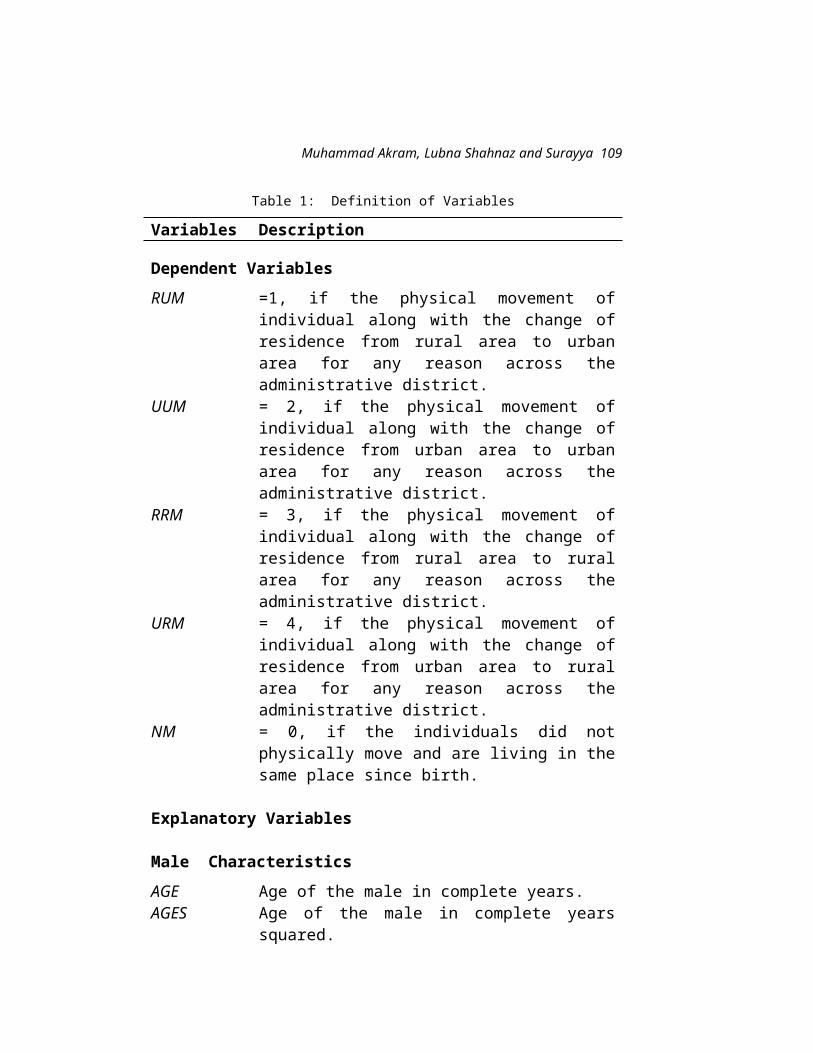
The Lahore Journal of Economics, Vol.7, No.2
output, with the result that exports today account for roughly one fifth of world output. The growth in exports has led to a major shift in favour of manufactures that account for about 80 percent of world exports. This has had a dramatic impact on the economic structures of many developing countries which are no longer following the traditional pattern of supplying primary products to industrialised countries in exchange for manufactured products.
The jump in manufactured exports has led to many changes in trading relationships, in that a) intraindustry trade has increased product differentiation and specialisation and b) there is an increase in resource outflows to developing countries due to their cheaper labour costs (which in turn has led to the controversy about the mobility of capital versus labour). On the other hand, within the supplier countries, this has led to a shift of resources (for example, from agriculture to industry), creating imbalances which may prove to be expensive in more than one sense. Countries that were following the strategy of building up their domestic industrial base for import substitution and overcoming their balance of payments difficulties have affected a change in public policy as a result of the export successes of the East Asian economies, and are trying to follow their path. But how equipped are they for this option?
The capitalist world economy thrives on enhanced consumer behaviour leading to technological innovation, economic growth and trade expansion. In order to survive in an increasingly competitive environment where the volume of trade, high standards of products, changing technology, and the backup of a strong trade balance remain the key factors, developing countries need to take a long look at their policy frameworks in the context of the external environment.
1. What is this external environment really like? Haque and his colleagues explain the challenges faced in
128

Rukhsana Shah
world trade not only by the developing countries, but by the developed ones as well. Briefly put, these are:
2. The dominance of big companies in world trade, the restrictions of playing on an even field, and the awareness of the inherent contradictions of a system which may or may not endure in the long run; the export bias of governments at the expense of local industrial self-sufficiency; development pressures;
3. The development of technology, the implications of its transfer, the absorption capacity of recipients and internal resource limitations; the question of investment in research and development vis a vis the returns from intellectual property;
4. Industrial policy and its success/failure in domestic development in relation to consumer behaviour and international trade;
5. The tension between outward investment and domestic unemployment in a free market;
6. Measuring capital costs versus productivity efficiency; the role of intangible inputs – design, service, management techniques, resource alternatives – in developing a comparative advantage; picking or creating “winners”;
7. Macro policies and structural adjustments in developing countries; implications for the production processes as well as poverty programmes; and the choices for governments;
8. The Uruguay Rounds and their impact on the policies of developing countries.
There is extensive discussion of these challenges and the book is full of examples and very good analysis especially by Sanjaya Lall on the Creation of Comparative Advantage and the Role of Industrial Policy. Haque and his colleagues hold that the world trade system would be
129

The Lahore Journal of Economics, Vol.7, No.2
strengthened through a positive contribution from developing countries. However, this to a large extent is dependent on the policies followed by these countries. While on the one hand, the example of the East Asian economies has vindicated the survival of the existing system despite (or because of), the disparities in world incomes, on the other hand, the options available to the poor countries of South Asia, Africa and Latin America are limited. These are countries nagged by the problems of balance of payments, low technology, poor human resource development, and limited competitive capability.
In the concluding chapter, Haque discusses the policy of import substitution, which had dominated the trade policies of India, Pakistan and some African countries previously as a viable alternative to their problem of balance of payments and the development of appropriate technology by protecting domestic industries. He rightly concludes that in this process, these countries lost out on technological innovation and higher consumer standards at home, while not being able to allocate resources to key areas in human resource development, physical infrastructure and agriculture that could have become comparative advantages. While on the one hand, developing countries need to sift the lessons of the NIEs of East Asia, on the other hand they also need to look at their own performance over the last few decades in evolving policies which could have addressed (and also anticipated) requirements of a world trade system based on the dominant economic theory.
There is no doubt that public policy is a viable instrument in creating international competitiveness by developing countries provided that the policy makers are informed and can take decisions over and above self-interest. While bureaucracy can play a neutral role, its practical and theoretical information is severely limited. On the other hand, entrepreneurs may have the required solutions, but they can become self-serving. In order to create a sustainable policy for economic growth through industrialisation and export enhancement, it is important to
130

Rukhsana Shah
have meaningful participation by all the stakeholders, including the workers. There is no question of economic growth without investing in human resource development and increasing the capacity needed for absorption of and innovation in technology – components of work ethics – to build international competitiveness. Similarly, protectionism and reliance on indigenous industrial investment and technological capability as in the case of Korea cannot be disregarded.
In this sense, this book is a must read for policy makers in Pakistan, especially the bureaucracy, which has failed to evolve a sound, long-term trade policy over the last fifteen years in the face of the changing global scenario, and domestic, macro-economics dominated environment. They need to review government investment made so far in human resource development, technology, and national industrial capability to give a direction to export development, rather than ritualisticaly setting annual export targets. Pakistan cannot develop international competitiveness without increasing, basically, its capacity to export. At the same time, apart from this very important book, policy makers should also try to develop indigenous alternative approaches, or at least catch up on the new ideas offered by the World Social Forum to counter the dominant world economic system.
Lahore School of Economic Rukhsana ShahLahore
131
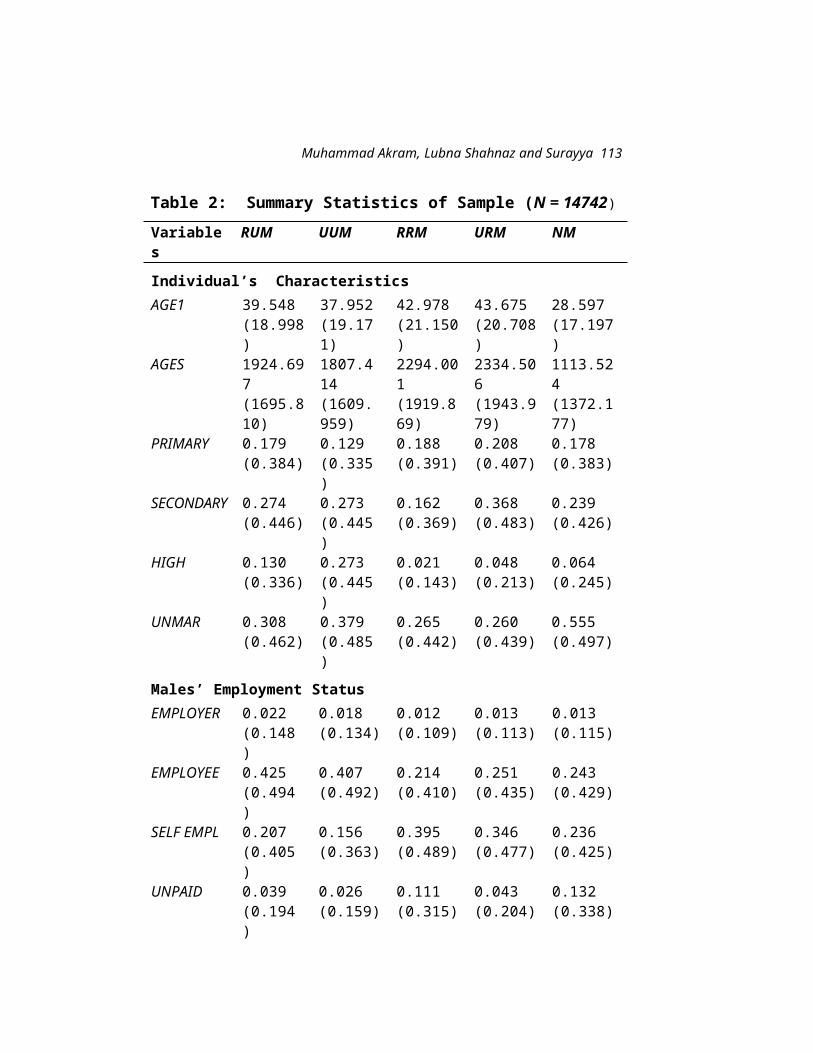
Notes For Authors1. Manuscripts of research articles, research notes, review
articles, comments, rejoinders and book reviews - in English only - should be sent in duplicate together with floppy in MS - Word to the Editor, The Lahore Journal of Economics, 105, C-2, Gulberg-III, Lahore-54660. Each request for a book review in the journal must be accompanied by one copy of the book concerned.
2. Manuscripts will be accepted for consideration on the understanding that they are original contributions to the existing knowledge in the fields of Economics, Banking, Current Affairs, Finance, Sociology, and Economic History.
3. Each manuscript should be typed and should carry a margin of an inch and a half on the left-hand side of the typed page.
4. The first page of the manuscript should have the title of the paper, the name(s) of author(s) and a footnote giving the current affiliation of the author(s) and any acknowledgments.
5. Detailed derivations of any main mathematical results reported in the text should be submitted separately along with the articles.
6. Tables for the main text and each of its appendices should be numbered serially and separately. The title of each table should be clearly expressive of the contents. The source of the table should be given in a footnote immediately below the line at the bottom of the table.
7. Footnotes should be numbered consecutively.
8. All references used in the text should be listed in alphabetical order of the authors’ surnames at the end of the text. References in the text should include the name(s) of author(s) with the year of publication in parentheses. Attempt should be made to conform to the style of the Journal. Further information on questions of style may be obtained from the Co-Editor, The Lahore Journal of Economics, Pakistan.
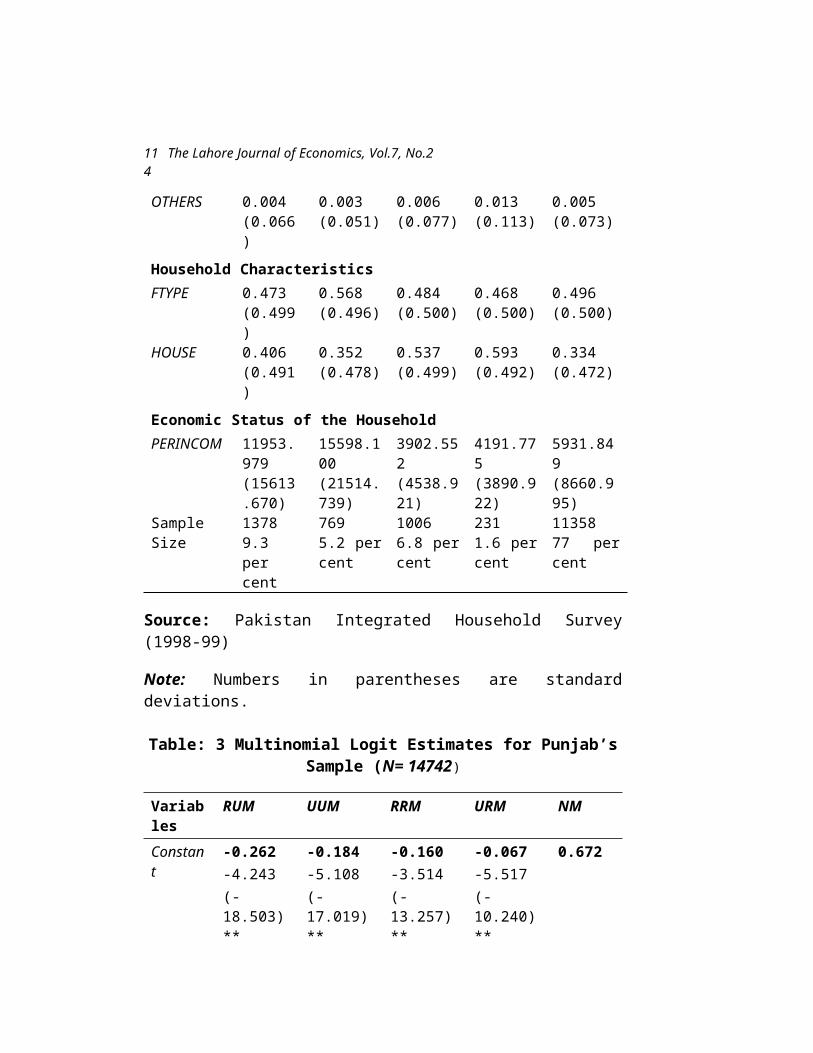
9. Each author will receive two copies of The Lahore Journal of Economics with the compliments of the LJE.
10. Book Reviews should give a description of the contents of the volume and a critical evaluation of the book. It should not exceed 5 or 6 typewritten pages.

THE LAHORE JOURNALOF
ECONOMICSLahore School of Economics
105-C-2, GULBERG III LAHORE, PAKISTAN. TEL: 5876065 Ext. 153 FAX: 5714936
SUBSCRIPTION FOR PUBLICATIONS
1. Kindly enter a subscription for the following publication of the Lahore School of Economics:
PublicationYearly subscription Yearly subscription Period Total
(within Pakistan) (outside Pakistan) (No. of years)Payment
1. The Lahore Journal Rs. 600.00 US $ 50 …......... ………….
of Economics2. The subscription is to be in the following name and
address:
Name: ----------------------------------------
Address: ----------------------------------------
----------------------------------------
----------------------------------------
3. A crossed cheque/demand draft for the sum of Pakistan Rupees/US $________ is enclosed made out in the name of The Lahore School of Economics to cover the above subscription.
4. Please address your order to: Nina Gera, Publications, Lahore School of Economics, 105-C-2, Gulberg III, Lahore 54660, Pakistan.
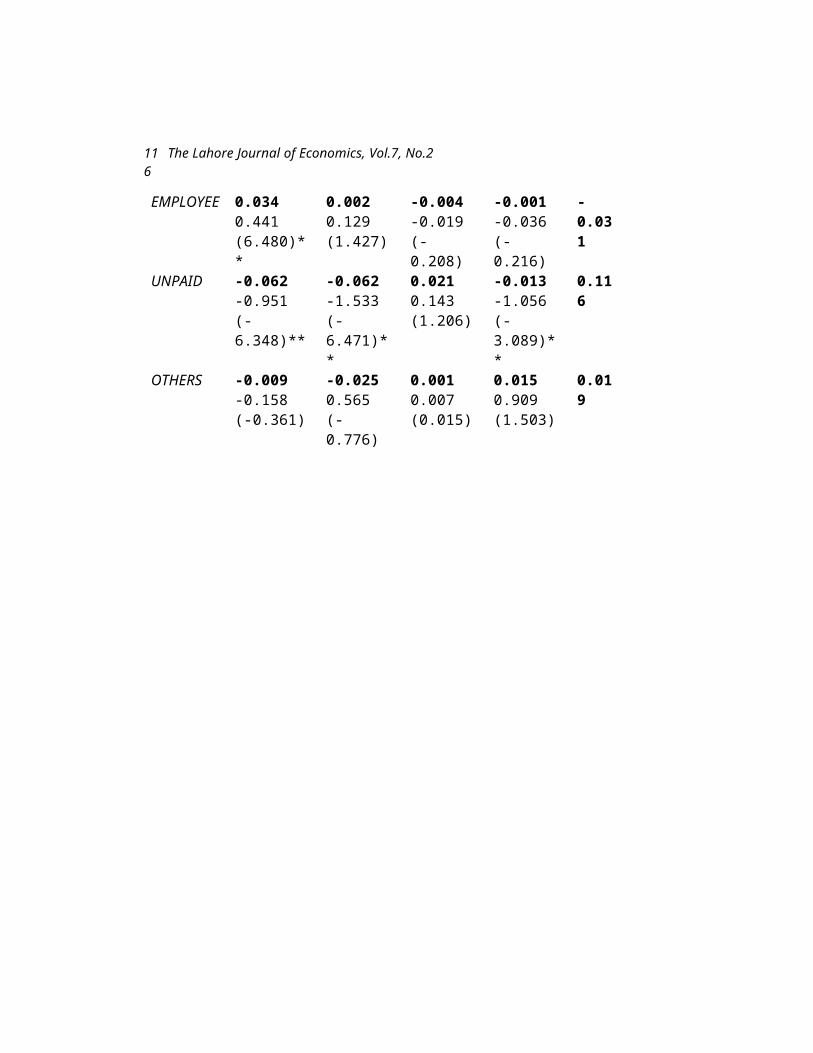
Signature:------------------------------------
Name:-----------------------------------------
Date:------------------------------------------
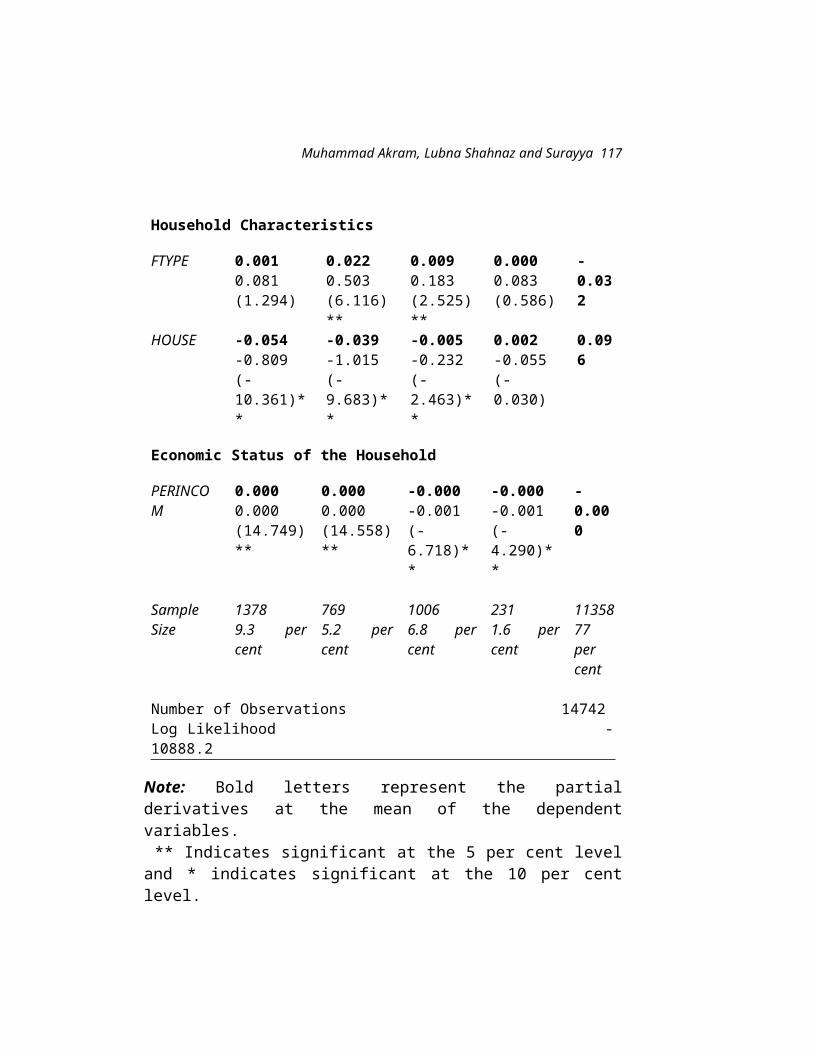
The Lahore School of Economics
The Lahore School of Economics (established 1993) is one of Pakistan’s leading centres of learning for teaching and research in economics, finance and business administration. The Lahore School of Economics’ objectives include: (i). The training of young Pakistanis as professional economists, finance managers, accountants, financial analysts, bankers and business executives, and (ii). Undertaking research in economics, management, finance and banking to further deepen understanding of major economic facts, issues and policies.
The Lahore School was granted a Charter in January, 1997 by an Act of the Provincial Assembly of the Punjab: The Lahore School of Economics Act 1997 (Act II of 1997). The Charter vests the powers of an independent degree granting institution to The Lahore School.
The Lahore School has both undergraduate and graduate programmes in economics, business information systems and finance. Its postgraduate programme leading to the MPhil degree is administered through the Lahore School’s Centre for Advanced Research in Economics and Business (CAREB). The student body and faculty comprise both national and expatriate Pakistanis and The

Lahore School encourages expatriate Pakistanis to join as students or as faculty.
The Lahore School’s publication programme comprises The Lahore Journal of Economics (a bi-annual publication), a Seminar Paper Series and a Text Book Series. The Programme encourages both in-house and external contributors.
For further information, please call (Pakistan 92-42-) 5714936 or 5874385 or E Mail: [email protected] or Web page: www.lahoreschoolofeconomics.edu.pk