the lahore journal of economics 22 : se (september 2017 ...€¦ · the lahore journal of economics...
TRANSCRIPT
The Lahore Journal of Economics 22 : SE (September 2017): pp. 73–110
Exchange Rate Management and Economic Growth: A Brewing Crisis
in Pakistan
Naved Hamid* and Azka Sarosh Mir**
Abstract
In this article it is argued that Pakistan has had a consistently overvalued exchange rate and the policy with regards to management of the exchange rate has undergone a significant change in recent years. We show that prior to March 2013, the policy target of the exchange management was stability of the real effective exchange rate. However, during the tenure of the current government, the policy target for exchange rate management seems to have been stability of the nominal exchange rate against the US dollar. As the currencies of Pakistan’s major trading partners (UK, Europe and China) have depreciated against the dollar during this period, the real effective exchange rate has appreciated by over 20 percent since the time that the current policy makers took office. Overvaluation in general and the recent reversal in the exchange rate management policy in particular have had an adverse impact on exports and the manufacturing sector. This not only has serious negative consequences for the long term, growth of the economy, but has greatly increased the short-term risk of a balance of payments crisis.
Keywords: Pakistan, exchange rate, overvaluation.
JEL Classification: F31, F33, F63, O24.
1. Introduction
It is widely accepted among development economists that the exchange rate plays an important role in resource allocation and economic performance of a country. In Pakistan, the exchange rate management policy has mostly been driven by individuals1, some of whom have relatively limited understanding of economics, and has tended to be non-transparent and subject to arbitrary changes. Moreover, the exchange rate has been generally overvalued and the misalignment has increased in recent years. It is our view, currency overvaluation is largely responsible
* Director, Centre for Research in Economics and Business, Lahore School of Economics, Pakistan. ** Research and Teaching Fellow, Centre for Research in Economics and Business, Lahore School
of Economics, Pakistan. 1 Usually, a senior policy maker in the Ministry of Finance in the Federal Government.

74 Naved Hamid and Azka Sarosh Mir
for the declining competiveness and growth of the tradable sector, particularly manufacturing, during the last decade. Also, we believe that the chronic overvaluation of the exchange rate is a key factor underlying the repeated balance of payments crises experienced by Pakistan since 1990. However, in Pakistan most policymakers and a few economists blame everything possible other than the misalignment of the exchange rate for these problems.
In this paper we argue that the exchange rate matters and the lack of a proper exchange rate management policy together with the increasing overvaluation of the currency in the last decade is leading to a decline in the contribution of the manufacturing sector and exports to the economy. Because manufacturing has historically driven growth across countries and since balance of payments crises have been responsible for ending every economic expansion over the last 30 years in Pakistan2, the increasing overvaluation, and the accompanying loss of competitiveness in manufacturing and exports, is jeopardizing the prospects for sustainable economic growth in the country. Therefore, in this paper we argue that reform of the exchange rate management policy is of the highest priority in Pakistan.
The rest of the paper is organized as follows. Section 2 summarizes the discussion on the importance of the exchange rate for a country’s economic development from both theoretical and empirical perspectives. Section 3 provides an overview of the evolution of exchange rate management regimes in Pakistan and a brief discussion on how policymakers in the 1980s undertook a radical reform of the exchange rate policy, involving a move to flexible exchange rates and a large reduction in the overvaluation of the Pakistani Rupee, with a salutary effect on the country’s performance in manufacturing, exports and economic growth. Section 4 focuses on whether the exchange rate in Pakistan is currently overvalued and, if so, to what extent. Section 5 discusses how the change in exchange rate policy in 2013 has resulted in increasing overvaluation of the currency which seems to be having the predicted negative effects on the economy. Section 6 concludes with some recommendations on reforms of the exchange rate management policy in Pakistan.
2. Why is the Exchange Rate Important?
A major element in the critique of the import substitution strategy followed by most developing countries in the 1950s and 1960s was that
2 which is usually followed by a long period of stagnation and low growth.
Exchange Rate Management and Economic Growth 75
overvalued exchange rates, which were an integral part of the strategy, discouraged exports, led to a slowdown of growth in the agricultural sector and limited employment generation in the manufacturing sector, even though the strategy led to rapid economic growth3. Since the 1990s, there has generally been consensus among development economists that competitive exchange rates are good for economic growth. However, in Pakistan the dominant view among public sector economists, policy makers and businessmen seems to be that the exchange rate does not matter because in the case of exports (and the manufacturing sector) the binding constraints are on the supply side (such as power shortages, security issues, etc.) and in the case of imports the demand is highly inelastic (because imports are mostly essential raw materials, oil, etc.). In this section, we briefly look at the theoretical reasons and the empirical evidence in support of our position that exchange rates do matter and are a key determinant of the long term economic performance of a country.
The various ways in which the exchange rate impacts the economy are well summarized by Frenkel and Taylor (2006) as follows: “It scales the national price system to the world’s, influences key macro-price ratios, such as those between tradable and non-tradable goods, capital goods and labor, and even exports and imports (via the costs of intermediate inputs and capital goods, for example),” (p. 1). In other words the exchange rate plays a significant part in determining resource allocation between sectors and the choice of technology, and as a result the growth rate of the economy. Economic growth is adversely affected by overvaluation because “[e]xcessively appreciated currencies affect mostly the profitability of investments in the manufacturing (tradable) sector where increasing returns are ubiquitous. By relocating resources to nonmanufacturing sectors, especially non-tradable activities and commodity production, where decreasing returns rule, overvaluations affect negatively the overall productivity dynamics of the economy” (Gala & Libanio, 2010, p. 11). This relationship between “manufacturing growth and economic growth” is referred to as Kaldor’s first growth law, which is often stated as ‘manufacturing is the engine of growth” (Thirlwall, 2015, p.272).
Pacheo-Lopez and Thirlwall (2013), further demonstrate that the “strong causal relation between the growth of manufacturing output and
3 The objective of the import substitution strategy was rapid industrialization, with growth in the
manufacturing sector being encouraged through subsidized credit, cheap imported capital goods
(because of an overvalued exchange rate) and protection from international competition. While the
manufacturing sectors grew rapidly in most developing countries in this period, manufacturing was
highly capital intensive and thus did not generate much employment.
76 Naved Hamid and Azka Sarosh Mir
the growth of GDP,” (p. 2) is not only due to “the static and dynamic returns to scale that characterize manufacturing more than agriculture and services [i.e., Kaldor’s mechanism, but also] through the impact that manufacturing output growth has on export growth, and the effect that export growth has on GDP growth by providing foreign exchange for imports and relaxing a balance of payments constraint on demand,” (pp. 11-12). In other words, an overvalued exchange rate has a two-fold effect – first, by reducing the profitability of the manufacturing sector relative to other sectors of the economy it negatively impacts investment and growth in the manufacturing sector and thus the growth of productivity and output in the economy; and second, by adversely affecting the competitiveness of exports (particularly of manufactured goods) it reduces export growth and thus limits GDP growth.
Historical experience seems to substantiate the insights above and it is seen that most developing countries that maintained competitive exchange rates were able to achieve higher growth. It is also often argued that competitive or undervalued exchange rates were a major factor in the success of export-led growth strategy followed by the East Asian economies4. Econometric evidence provides considerable support to this view. In one of the earliest studies, Dollar (1992) constructed an index of outward orientation based on extent of distortion in the real exchange rate for 95 developing countries for the period 1976-85, and found that this measure of outward orientation was highly correlated with GDP growth rates. Since then numerous other studies have validated these findings; for example, Williamson (2008, pp. 14-15) cites a number of econometric studies, such as Razin and Collins (1999), Prasad, Rajan, and Subramanian (2007)5, Aguirre and Calderon (2006), Rodrik (2007), and Bhalla (2007), which demonstrate that overvaluation of the currency harms growth in developing countries and a few of these articles (i.e., the last 3 listed above) also show that a small undervaluation is helpful to growth.
To summarize, as the exchange rate determines the relative prices of tradables and nontradables in a country, it influences resource allocation and investment decisions in the economy. Further, if the exchange rate in
4 As Edwards (2015) puts it, “The experience of the East Asian Tigers with export-led growth
attracted considerable attention, and a number of works were penned on the policies followed by
those nations. One of the messages that emerged from these case studies was that avoiding currency
overvaluation – and, in some cases deliberately encouraging undervaluation – had helped develop a
vibrant export sector” (pp. 40-41). 5 Prasad, et al., estimate that a “1 percent increase in average overvaluation accompanies a decline in
long run growth of about 0.1 percent” (page 18).
Exchange Rate Management and Economic Growth 77
a country is overvalued it will have a negative impact on the manufacturing sector, employment and exports and thus on the GDP growth rate in that country. These theoretical conclusions are widely supported by the available econometric evidence which shows that there is a significant negative correlation between overvalued exchange rates and GDP growth rates in developing countries.
3. Exchange rate regimes and policies in Pakistan
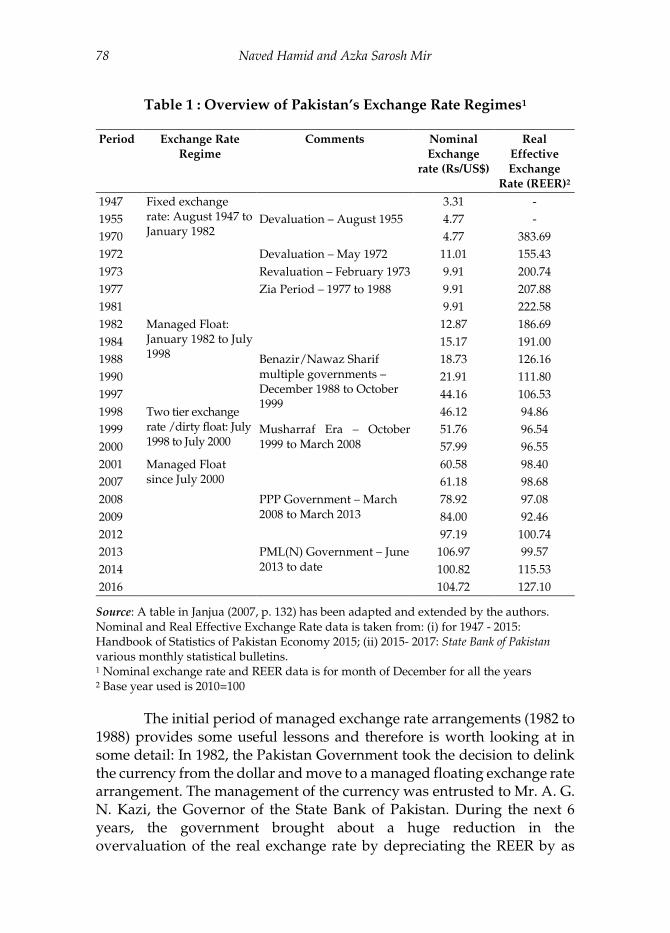
Pakistan has had various exchange rate arrangements since independence, starting with a fixed exchange rate regime between 1947 and 1982, with two major devaluations (in 1955 and 1972) and one revaluation (in 1973) during this period6 (see Table 1). In 1982, Pakistan moved to a managed floating arrangement which continued until 1998 after which, following the nuclear test in May 1998, there were several years of ad hoc exchange rate regimes and a substantial depreciation in the nominal exchange rate between 1998 and 2001. In 2001, Pakistan returned to a managed floating arrangement, which it has maintained since then. Pakistan has never made public the rules or targets that have guided its management of the exchange rate in different periods and since the guiding principles can change at any time without a formal discussion within the government, it potentially creates uncertainty for businesses particularly with regards to their investment and planning decisions.
6 In the 1960’s, Pakistan used a system of multiple exchange rates (under what was called the bonus
voucher scheme) to encourage exports. The 1960s was also a period when Pakistan had one of the
highest rates of growth in manufacturing, manufactured exports and GDP in the world.
78 Naved Hamid and Azka Sarosh Mir
Table 1 : Overview of Pakistan’s Exchange Rate Regimes1
Period Exchange Rate
Regime
Comments Nominal
Exchange
rate (Rs/US$)
Real
Effective
Exchange
Rate (REER)2
1947 Fixed exchange rate: August 1947 to January 1982
3.31 -
1955 Devaluation – August 1955 4.77 -
1970 4.77 383.69
1972 Devaluation – May 1972 11.01 155.43
1973 Revaluation – February 1973 9.91 200.74
1977 Zia Period – 1977 to 1988 9.91 207.88
1981 9.91 222.58
1982 Managed Float: January 1982 to July 1998
12.87 186.69
1984 15.17 191.00
1988 Benazir/Nawaz Sharif multiple governments – December 1988 to October 1999
18.73 126.16
1990 21.91 111.80
1997 44.16 106.53
1998 Two tier exchange rate /dirty float: July 1998 to July 2000
46.12 94.86
1999 Musharraf Era – October 1999 to March 2008
51.76 96.54
2000 57.99 96.55
2001 Managed Float since July 2000
60.58 98.40
2007 61.18 98.68
2008 PPP Government – March 2008 to March 2013
78.92 97.08
2009 84.00 92.46
2012 97.19 100.74
2013 PML(N) Government – June 2013 to date
106.97 99.57
2014 100.82 115.53
2016 104.72 127.10
Source: A table in Janjua (2007, p. 132) has been adapted and extended by the authors. Nominal and Real Effective Exchange Rate data is taken from: (i) for 1947 - 2015: Handbook of Statistics of Pakistan Economy 2015; (ii) 2015- 2017: State Bank of Pakistan various monthly statistical bulletins. 1 Nominal exchange rate and REER data is for month of December for all the years 2 Base year used is 2010=100
The initial period of managed exchange rate arrangements (1982 to 1988) provides some useful lessons and therefore is worth looking at in some detail: In 1982, the Pakistan Government took the decision to delink the currency from the dollar and move to a managed floating exchange rate arrangement. The management of the currency was entrusted to Mr. A. G. N. Kazi, the Governor of the State Bank of Pakistan. During the next 6 years, the government brought about a huge reduction in the overvaluation of the real exchange rate by depreciating the REER by as
Exchange Rate Management and Economic Growth 79
much as 43 percent between 1982 and 1988 (see Table 1)7. Interestingly, despite such a large depreciation in the exchange rate (47 percent in nominal terms) the economic managers were able to restrict the annual inflation rate to around 6 percent. This was the result of intelligent management of the adjustments in the nominal exchange rate8, deregulation of administered commodity prices (including wheat, sugar, edible oils and fertilizer) to reduce the fiscal impact of the devaluation, and slowing down monetary expansion by tapping new sources of non-bank borrowing9. The reduction in overvaluation seems to have had the effects that we would expect based on the discussion in Section 2, i.e. an impressive GDP growth rate (6.5 percent per annum over the 6 years) and an increase in the share of large scale manufacturing (LSM) in the GDP (from 11.9 percent in FY1982 to 13.0 percent in FY1988) and in Pakistan’s share in world exports (from 0.13 percent in 1982 to 0.16 percent in 1988)10.
An obvious question that arises is why was the economy unable to sustain this improved performance in the 1990s? The answer is that while the real exchange rate is important, other factors also have an impact on the performance of the economy. Among these factors, possibly one of the most important is political and policy stability, as that is generally a major consideration in private investment decisions. Unfortunately, the period 1988 to 1998 was characterized by considerable uncertainty on both counts, as the country had 4 general elections and 10 prime ministers (with the longest tenure of any government being that of Benazir Bhutto from 19 October 1993 to 5 November 1996, i.e. 3 years and 17 days) during these 10 years. It is not surprising therefore that the performance of the economy during this period was much worse than that of the previous period.
4. Is the Exchange Rate Overvalued in Pakistan?
Whether or not the exchange rate is overvalued has been a lasting debate among economists in Pakistan, but the rapid appreciation in the Real Effective Exchange Rate (REER) in recent years has brought this issue to the forefront in the country. There have been a number of academic
7 According to our estimates (using the R-JOS approach discussed in section 4.3) the real exchange
rate overvaluation was reduced from 81 percent in 1981 to 60 percent in 1988. 8 For example: “The policy in 1983 was to keep the real exchange rate steady against the basket of
currencies of 14 important trading partners. [but] When the dollar started falling in 1985, the
exchange rate management policy was changed [and it was] decided to allow the rupee to slide down
against the basket of currencies” (Hamid & Hamid, 1992, p. 50) 9 For a detailed discussion of the exchange rate reforms process, management of the currency
adjustments and implementation of measures to prevent inflation during this period see Hamid and
Hamid (1992) 10 See Data Appendix.
80 Naved Hamid and Azka Sarosh Mir
papers on the subject recently and most have concluded that the exchange rate is overvalued in Pakistan. For example, Ahmad (2009, p. 77) in her study of the Dutch Disease impacts of remittances and other capital inflows on the Real Exchange Rate (RER) and its overvaluation for the period 1971 to 2007, concluded that the “RER suffers from chronic overvaluation in Pakistan [and the] Dutch Disease hypothesis holds in the case of Pakistan”. Similarly, in his study on sources of RER misalignment, Hussain (2008, p. 14) concluded that “on average RER remains overvalued over the entire period [1970-2007]”. In a more recent study, Debowicz and Saeed (2014, p. 26) find that “the Pakistani rupee has been over-valued from 2006 to 2010 by on average 10 percent and as much as 25 percent in 2010”. However, other authors have found the opposite; an example is the paper by Hyder and Mahboob (2006, p. 258) who examined exchange rate misalignment in Pakistan for the period 1978-2005 and concluded that “the current exchange rate is not too far away from EREER [Equilibrium Real Effective Exchange Rate] and more or less reflects the underlying macroeconomic fundamentals”.
In this section our focus is on the extent of exchange rate misalignment, if any, in the post-2001 period. While there are a number of methodologies for estimating the RER and calculating the overvaluation (misalignment) of a country’s currency11, we discuss briefly below three approaches, which have been selected because of the credibility of the sources and the availability of estimates of possible exchange rate misalignment in the last decade. These are State Bank of Pakistan’s Real Effective Exchange Rate (REER) Index approach, the IMF’s External Balance Assessment (EBA) approach, and the Purchasing Power Parity (PPP) with Balassa-Samuelson Effect approach used by Rodrik (2008), the latter of which we have used in our empirical analysis.
4.1. State Bank of Pakistan’s (SBP) Real Effective Exchange Rate (REER) Index Approach
The REER index approach is based on the “absolute PPP hypothesis [which] states that the exchange rate between the currencies of two countries should equal the ratio of the price levels of the two countries,” (Khalid, 2015, p. 4). Thus, changes in a country’s competitiveness resulting from movements in the country’s nominal exchange rate can be measured by changes in the REER index. SBP’s REER index is constructed by adjusting the nominal exchange rate index (with a selected base year) for the difference in inflation in Pakistan and in its trading partners, using their
11 For an excellent summary of the different methodologies see Khalid (2015, pp. 4-5).
Exchange Rate Management and Economic Growth 81
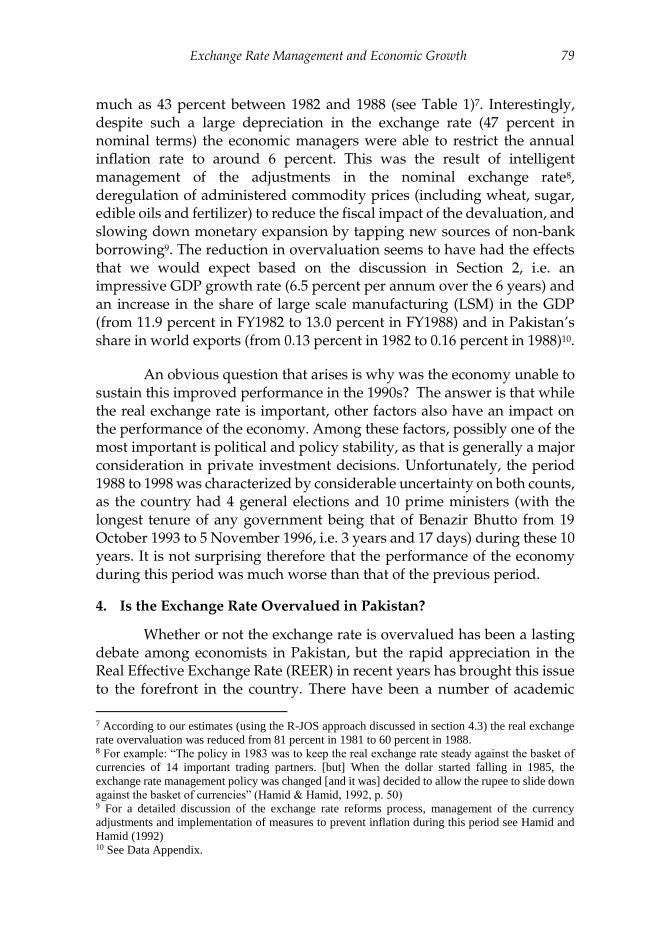
shares in Pakistan’s trade as weights. The REER index is used by many countries, including at times Pakistan, as a tool for exchange rate management. While the REER index provides valuable information on changes in a country’s competitiveness over time, it has two drawbacks: First, the underlying assumption is that there was no misalignment of the exchange rate in the base year which is usually selected because of convenience rather than any assessment of minimum exchange rate misalignment; And second, the implicit assumption is that the country’s economic fundamentals, which can affect the equilibrium exchange rate, have remain unchanged since the base year. In Figure 1, it can be seen that since 2001 (the base year) the REER was mostly below a 100 until December 2010 and slightly above it for the next 3 years. In December 2013 (when it was again a 100) the REER began to rise and it had increased to 127 in December 2016, i.e., according to this approach a significant overvaluation of the Rupee has taken place in the last three years.
Figure 1: Monthly Real Effective Exchange Rate (REER) Index – 2001-
2017 (Base 2010=100)
Source: Graph is based on the following: (i) January 2001 - June 2015: Handbook of Statistics of Pakistan Economy 2015 (http://www.sbp.org.pk/departments/stats/PakEconomy_HandBook/Chap-7.06.pdf ); (ii) July 2015- June 2017: State Bank of Pakistan various monthly statistical bulletins.
80.00
85.00
90.00
95.00
100.00
105.00
110.00
115.00
120.00
125.00
130.00
200
1 Ja
n.
Jul.
200
2 Ja
n.
Jul.
200
3 Ja
n.
Jul.
200
4 Ja
n.
Jul.
200
5 Ja
n.
July
200
6 Ja
n.
Jul.
200
7 Ja
n.
Jul.
200
8 Ja
n.
Jul.
200
9 Ja
n.
Jul.
201
0 Ja
n.
Jul.
201
1 Ja
n.
Jul.
201
2 Ja
n.
Jul.
2013
Jan
.Ju
l.2
014
Jan
.Ju
l.2
015
Jan
.Ju
l.2
016
Jan
.Ju
l.2
017
Jan
.

82 Naved Hamid and Azka Sarosh Mir
4.2. IMF’s External Balance Assessment (EBA)/EBA-lite Approach
The IMF’s External Balance Approach (EBA) was introduced in 2012 and the EBA-lite approach was introduced in 2014, with the main differences between the two methodologies being “the exclusion of public health spending ([because of] data limitations) and inclusion of aid and remittances” in the latter (IMF 2016(a), p. 6). The EBA-lite methodology “includes three approaches: the current account model, the real exchange rate model, and the external sustainability approach. The current account and exchange rate models are based on two panel regressions of current account and real exchange rate respectively. They provide current account and real exchange rate norms that are consistent with fundamental and desirable policies. External gaps [in the two approaches] are assessed by the difference between the actual current account and the real exchange rate and the corresponding norms. The external sustainability approach calculates a current account norm that would stabilize the net foreign asset (NFA) position at some benchmark level” which again provides an estimate of the external gap (IMF 2016(a), p. 7). In each of the three approaches, the exchange rate adjustment required to close the external gap provides a measure of the overvaluation of the currency. An IMF country report may give either the range, or an average, of the estimates of the exchange rate overvaluation from the three approaches as the misalignment of a country’s currency in a particular year. According to the IMF (2017, p. 11), based on the EBA approach, the real exchange rate in Pakistan was overvalued by 14 percent in 2016, while according to the EBA-lite approach overvaluation in Pakistan was much greater, i.e. around 20 percent.
4.3. Purchasing Power Parity (PPP) with Balassa-Samuelson Effect Approach
Rodrik (2008) uses PPP conversion factors to calculate the real exchange rate (RER) and then adjusts it for Balassa-Samuelson effect. This technique was initially developed by Johnson, Ostry and Subramanian (2007) and was subsequently adapted by Rodrik (2008); we refer to it as the R-JOS approach. Rodrik (2008) used a three step procedure to get the index of overvaluation: First, he used the data on nominal exchange rates and PPP conversion factors to calculate a real exchange rate (RER) using Penn World Tables; Second, he adjusted the RER for the Balassa-Samuelson effect, to account for lower prices of non-traded goods in low income countries, by regressing the RER, calculated in step 1, on real GDP per capita of each country and using the results to generate the predicted

Exchange Rate Management and Economic Growth 83
values of RER; And third, the predicted values of RER were used to calculate the overvaluation.12
We have used the R-JOS approach to estimate the real exchange rate for Pakistan for 1950-2014 and our estimates of exchange rate overvaluation since 2001 are shown in Figure 2. It is seen that the real exchange rate in Pakistan has been overvalued throughout the 2000-2014 period. The overvaluation was around 60 percent until 2006 after which it declined to 48 percent in 2008 and since then it has fluctuated between 51 percent and 54 percent. In 2014, overvaluation of the real exchange rate was about 54 percent.
Figure 2: Overvaluation Index Using R-JOS Procedure - 2001-2013
Source: Author’s calculations based on the data given in Penn World Table, version 9.0
To conclude this section, we discuss some comparative estimates for recent years (Table 2 provides a summary of the estimates of overvaluation from the three sources for the period 2008-2016). According to the SBP’s REER Index approach, the exchange rate has only shown significant overvaluation since 2014, being 27 percent overvalued in December 2016. IMF country reports over the years have indicated that the Pakistani rupee was only slightly overvalued until recently with the estimated overvaluation depending on the methodology (i.e. EBA or EBA-lite) applied. According to the latest report, the IMF estimates that the Rupee was overvalued by about 20 percent in 2016. Our estimates, as shown in Figure 2, indicate substantial overvaluation throughout the period and in 2016 the overvaluation was probably over 50 percent. It is
12 For more details regarding R-JOS procedure, see the Methodology Appendix.
40
45
50
55
60
65
70
2001 2002 2003 2004 2005 2006 2007 2008 2009 2010 2011 2012 2013 2014
RER overvaluation using R-JOS procedure
84 Naved Hamid and Azka Sarosh Mir
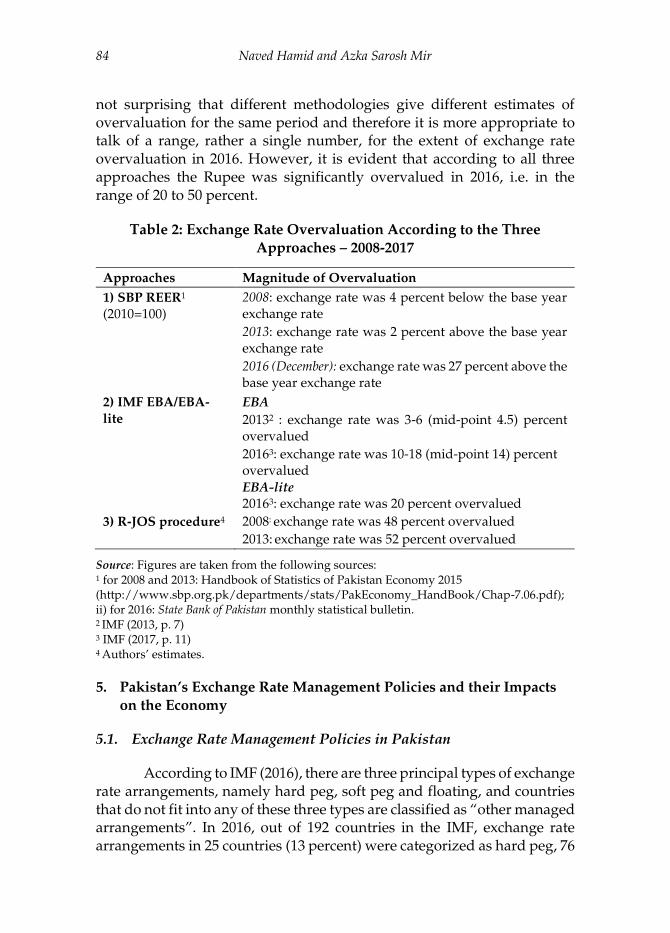
not surprising that different methodologies give different estimates of overvaluation for the same period and therefore it is more appropriate to talk of a range, rather a single number, for the extent of exchange rate overvaluation in 2016. However, it is evident that according to all three approaches the Rupee was significantly overvalued in 2016, i.e. in the range of 20 to 50 percent.
Table 2: Exchange Rate Overvaluation According to the Three
Approaches – 2008-2017
Approaches Magnitude of Overvaluation
1) SBP REER1 (2010=100)
2008: exchange rate was 4 percent below the base year exchange rate
2013: exchange rate was 2 percent above the base year exchange rate
2016 (December): exchange rate was 27 percent above the base year exchange rate
2) IMF EBA/EBA-
lite EBA
20132 : exchange rate was 3-6 (mid-point 4.5) percent overvalued
20163: exchange rate was 10-18 (mid-point 14) percent overvalued
EBA-lite 20163: exchange rate was 20 percent overvalued
3) R-JOS procedure4 2008: exchange rate was 48 percent overvalued
2013: exchange rate was 52 percent overvalued
Source: Figures are taken from the following sources: 1 for 2008 and 2013: Handbook of Statistics of Pakistan Economy 2015 (http://www.sbp.org.pk/departments/stats/PakEconomy_HandBook/Chap-7.06.pdf); ii) for 2016: State Bank of Pakistan monthly statistical bulletin. 2 IMF (2013, p. 7) 3 IMF (2017, p. 11) 4 Authors’ estimates.
5. Pakistan’s Exchange Rate Management Policies and their Impacts
on the Economy
5.1. Exchange Rate Management Policies in Pakistan
According to IMF (2016), there are three principal types of exchange rate arrangements, namely hard peg, soft peg and floating, and countries that do not fit into any of these three types are classified as “other managed arrangements”. In 2016, out of 192 countries in the IMF, exchange rate arrangements in 25 countries (13 percent) were categorized as hard peg, 76
Exchange Rate Management and Economic Growth 85
(40 percent) as soft peg, 71 (37 percent) as floating, and 20 (10 percent) as “other managed arrangements” (see Table 3). Mostly a country’s exchange rate management policy is guided by some rules and objectives and, out of the 192 countries, 82 (43 percent) had an “exchange rate anchor” as the guide and in 62 countries (32 percent) “monetary aggregates and inflation” were the target. In only 27 (14 percent) countries (excluding the 21 countries with free floating arrangements), was the monetary policy framework classified as “other”, i.e., as having “no stated nominal anchor of exchange rate; rather, they monitor different indicators for monetary policy implementation” (footnote 2, Table 3).
Thus Pakistan was one of only 9 (5 percent) countries whose exchange rate arrangements in 2016 were classified by IMF as “other managed arrangement” and whose monetary policy framework was also classified as “others” (Table 3). It may be mentioned that Pakistan is the only country in South Asia that does not have a declared basis for its exchange rate management policy; the rest are either classified as floating (i.e., India), or as having a soft peg (i.e. Nepal, Bangladesh and Sri Lanka). In other words, Pakistan is a fairly unusual country in terms of its exchange rate management policies. This is also evident from the fact that IMF (2015) classified Pakistan’s de facto exchange rate arrangement as “other managed” and the de jure arrangement as “managed float with no predetermined path” (informational annex, p. 3). This classification is there because Pakistan’s exchange rate arrangement “does not meet the criteria for any other categories” and/or may be “characterized by frequent shifts in policies” (IMF, 2016b, p. 48).

86 Naved Hamid and Azka Sarosh Mir
Table 3: IMF Classification of Exchange Rate Arrangements and
Monetary Policy Frameworks
Exchange rate
Arrangements
Monetary Policy Framework Total
Exchange
rate Anchor1
Target
Monetary
Aggregates
and Inflation
Other2
Hard Peg
No Separate legal tender 14 - - 14
Currency board 11 - - 11
Soft Peg
Conventional Peg 42 (Nepal3) - 2 44
Stabilized arrangements 7 8 (Bangladesh4)
3 18
Crawling peg 3 - - 3
Crawl-like arrangements 2 3 5 (Sri Lanka5) 10
Pegged exchange rate with horizontal bands
- - 1 1
Floating
Floating - 33 (India6) 7 40
Free Floating - 10 21 31
Residual
Other managed arrangement 3 8 9 (Pakistan7) 20
Total 82 62 48 192
Source: IMF Annual report on Exchange Rate Arrangements and Exchange Rate restrictions (AREAER) 2016. 1Exchange rate acts an anchor of monetary policies. There is buying and selling of foreign exchange by the monetary authorities to maintain the exchange rate within a range or predetermined level. US dollar, Euro, Composite and other are some of the exchange rate anchors used by countries according to IMF. 2Countries classified as others have no stated nominal anchor of exchange rate, rather they monitor different indicators for monetary policy implementation. 3 The country’s exchange rate flexibility is limited vis-à-vis another single currency. 4 The country’s exchange flexibility is limited vis-à-vis the U.S. dollar. 5 The country’s exchange flexibility is limited vis-à-vis the U.S. dollar. 6 The country’s monetary policy framework is such that it targets inflation. 7 The country monetary policy framework is based on monitoring of various indicators as it does not have stated nominal anchor of exchange rate.
Although Pakistan does not have a stated exchange rate target, which creates uncertainty for economic decision makers in the private sector, ex-post it is possible, by looking at the historical nominal and real effective exchange rates, to deduce what may have been the implicit target of the exchange rate management policy of the government/SBP in

Exchange Rate Management and Economic Growth 87
different periods. Next, we attempt to identify the implicit exchange rate policies under different political regimes since 2001 and the apparent impact,13 in the last decade, of these on large scale manufacturing, exports, contribution of the external sector to domestic demand (i.e. net exports) and current account deficit.
The monthly nominal exchange rate (PRs/US$) and REER index for the period 2001 to 2017 and trends14 in these two variables during each regime are plotted in Figures 3 and 4 respectively. In the Musharraf era, the nominal exchange rate was very stable for most of the period, increasing slowly from PRs 59.06 to a US$ in January 2001 to PRs 60.68 to a US$ in October 200715, i.e. by under 3 percent (Figure 3). The REER index was much more variable and it increased from 93.32 in January 2001 to 100.49 in October 2007, i.e. by over 7 percent (Figure 4). As the REER index fluctuated much more than the nominal exchange rate and appreciated significantly as well, it seems that during the Musharraf regime the implicit exchange rate policy was a soft peg with the dollar.
Figure 3: Monthly Average Nominal Exchange Rate (Rs./$)
Source: Author’s calculation are based on the following: (i) January 2001- June 2015: Handbook of Statistics of Pakistan Economy 2015 (http://www.sbp.org.pk/departments/stats/PakEconomy_HandBook/Chap-7.05.pdf ); (ii) July 2015- December 2016: State Bank of Pakistan various monthly statistical bulletins.
13 As we are going to look at the impact by observing trends in these variable in different periods and
not through a rigorous econometric analysis, this obviously is only the apparent impact. 14 Trend was estimated by regressing the monthly exchange rate (or REER Index) on the time variable
and the predicted values were plotted. 15 October 2007 is chosen as end year for this purpose because after that, as discussed below, the
Musharraf Government had limited ability to manage the nominal exchange rate.
40
50
60
70
80
90
100
110
120
2001
Jan
.Ju
l.20
02 J
an.
Jul.
2003
Jan
.Ju
l.20
04 J
an.
Jul.
2005
Jan
.Ju
l.20
06 J
an.
Jul.
2007
Jan
.Ju
l.20
08 J
an.
Jul.
2009
Jan
.Ju
l.20
10 J
an.
Jul.
2011
Jan
.Ju
l.20
12 J
an.
Jul.
2013
Jan
.Ju
l.20
14 J
an.
Jul.
2015
Jan
.Ju
l.20
16 J
an.
Jul.
trend monthly average nominal exchange rate (Rs/$)
Jume 2013 (PML (N)
Nov. 2008 (IMF loan)
March 2008 (PPP Govt)

88 Naved Hamid and Azka Sarosh Mir
Figure 4: Monthly Real Effective Exchange Rates (REER) Index (Base
2010=100)
Source: Author’s calculations based on the following: (i) January 2001- June 2015: Handbook of Statistics of Pakistan Economy 2015 (http://www.sbp.org.pk/departments/stats/PakEconomy_HandBook/Chap-7.06.pdf); (ii) July 2015- December 2016: State Bank of Pakistan various monthly statistical bulletins.
In 2007, the government stopped adjusting domestic administered prices of energy (i.e. power and oil) and other commodities (such as fertilizer and wheat) in response to changes in international prices. Thus the rapid increase in oil and other commodity prices, starting in the second-half of 2007, increased both fiscal and current account (CA) deficits. Initially, the government kept the nominal exchange rate stable, but as international reserves declined, this became increasingly difficult and the nominal exchange rate started to depreciate in the last quarter of 2007 and continued to do so in 2008. By October 2008 the nominal exchange rate had depreciated to PRs 80.43, i.e. almost 25 percent in one year. Exchange rate stability was restored only in November 2008 when the Pakistan Peoples’ Party (PPP) government, which had come into power in March 2008, reached an agreement with the IMF for a loan of about US$7.6 billion.
For most of the PPP government’s remaining time, i.e. November 2008 to March 2013, management of the economy was largely guided by policy conditions under the IMF Program. Still, the government implemented an exchange rate policy which minimized appreciation of the REER, despite double-digit inflation. During this period, the REER appreciated by only about 5.5 percent (see Figure 4) as the government allowed the nominal exchange rate to depreciate to PRs 98.06 per US$ in March 2013, i.e. by over 20 percent (see Figure 3). Thus, one can conclude
80859095
100105110115120125130
2001
Jan
.Ju
l.20
02 J
an.
Jul.
2003
Jan
.Ju
l.20
04 J
an.
Jul.
2005
Jan
.Ju
l.20
06 J
an.
Jul.
2007
Jan
.Ju
l.20
08 J
an.
Jul.
2009
Jan
.Ju
l.20
10 J
an.
Jul.
2011
Jan
.Ju
l.20
12 J
an.
Jul.
2013
Jan
.Ju
l.20
14 J
an.
Jul.
2015
Jan
.Ju
l.20
16 J
an.
Jul.
trend monthly REER
June 2013 (PML(N) Govt.)Nov. 2008 (IMF
Loan)
March 2008 (PPP Govt.)
Exchange Rate Management and Economic Growth 89
that under the PPP Government the implicit exchange rate policy was a soft peg with a trade-weighted basket of currencies.
After the general election in 2013, a PML(N) Government took office in June of the same year. Over the previous fiscal year (FY2013), international reserves with the State Bank of Pakistan (SBP) had declined substantially (from US$ 10.8 billion at the end of FY2012 to US$ 6 billion at the end of FY2013) and this decline continued in the first few months of the PML(N) Government, with the reserves reaching a low of US$ 3 billion (i.e., less than one month’s imports) by end-November 2013 (SBP, 2017). As a result, during the first few months of the PML(N) Government, there was increasing speculation against the Pakistani Rupee, which depreciated to PRs 107.50 per US$ in November. The declining value of the Rupee was the subject of widespread criticism by the opposition parties and in the media and, as a result, in December the Finance Minister announced that the Government would ensure that the nominal exchange rate be brought down to the level that prevailed when the PML(N) Government came into power in June 2013 (i.e. around Rs 99 per US$) (EIU, 2013). In the meantime, in September 2013, the IMF had approved a three year arrangement under the Extended Fund Facility (EFF) for Pakistan for an amount of US$ 6.64 billion. Also in early 2014, Pakistan received a loan of US$ 1.5 billion from Saudi Arabia in response to a request by the Prime Minister (Dawn, 2014). The inflow of IMF and Saudi funds made it possible for the SBP to intervene in the foreign exchange market and bring down the nominal exchange rate as pledged by the finance minister. The government succeeded in bringing the exchange rate down to PRs 97.49 per US$ in April 2014 and since then a strong Rupee has been a cornerstone of the government’s economic policy.
It can be seen from Figures 3 and 4 that during the period of the PML(N) government (except during the episode discussed above) there is hardly any fluctuation in the nominal exchange rate and the trend line is virtually flat (in December 2016 the rate was PRs 104.77, i.e. a depreciation of less than 6 percent in the prior three and a half years), while the REER index has been subject to substantial fluctuations and the trend line is sharply rising with the REER index appreciating by about 16 percent over the same three and a half year period). Thus we can conclude that PML(N) Government’s implicit exchange rate policy has been a soft peg with the dollar. An important reason for the appreciation in the REER, despite relatively low inflation in Pakistan during this period, was the large depreciation in the currencies of Pakistan’s major trading partners (UK, Europe and China) against the dollar.

90 Naved Hamid and Azka Sarosh Mir
5.2. Effect of Overvaluation on the Economy?
As argued in Section 2, overvaluation of the currency has adverse implications for the economy through its negative impact on tradables (manufacturing and agricultural sectors) relative to the rest of the economy. Overvaluation not only reduces exports, which negatively effects the production of tradables for the international market, but it also makes imports cheaper and thus it negatively effects the production of tradables for the domestic market. In this section, we look at the changes in the share in the GDP of large scale manufacturing (LSM), exports and net exports (which to an extent reflects the total short-term negative effect on production of tradables in the economy) since 2006. The objective is to see if the changes in the overvaluation of the Pakistani Rupee, arising from the different exchange rate policies followed by the PPP and PML(N) governments, are associated with changes in these variables.
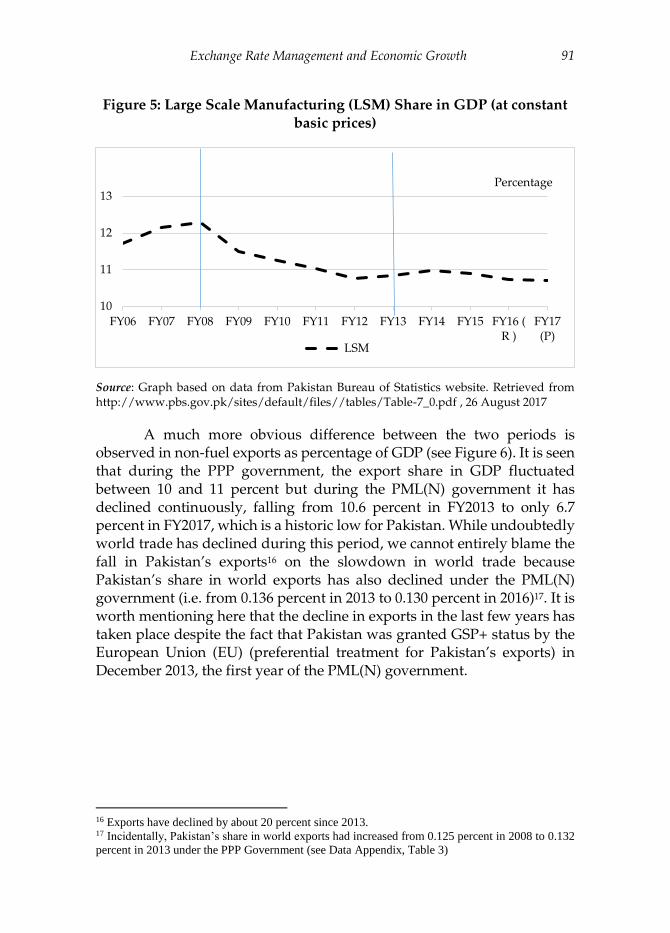
Value added in LSM as a percentage of GDP is presented Figure 5, and it is seen that during the PPP government’s tenure, LSM’s share in GDP declined sharply in the first year (from 12.3 percent in FY2008 to 11.5 percent in FY2009) as IMF conditions, such as reduction in the fiscal deficit as well as in growth of the money supply (i.e., Net Domestic Assets), resulted in a sharp contraction in effective demand. With inflation at double digit levels, contractionary fiscal and monetary policies remained in place and the LSM’s share continued to decline, though more gradually, to 10.8 percent in FY2013. Under the PML(N) government, which also negotiated an IMF loan in September 2013, contractionary policies continued as did the decline in the LSM’s share. In other words, due to generally contractionary policies since November 2008 and the underlying large chronic overvaluation, increases in overvaluation in recent years did not have a significant effect, though there has been a small dip in the share of LSM over the last few years (when most of the appreciation in the REER index took place).
Exchange Rate Management and Economic Growth 91
Figure 5: Large Scale Manufacturing (LSM) Share in GDP (at constant
basic prices)
Source: Graph based on data from Pakistan Bureau of Statistics website. Retrieved from http://www.pbs.gov.pk/sites/default/files//tables/Table-7_0.pdf , 26 August 2017
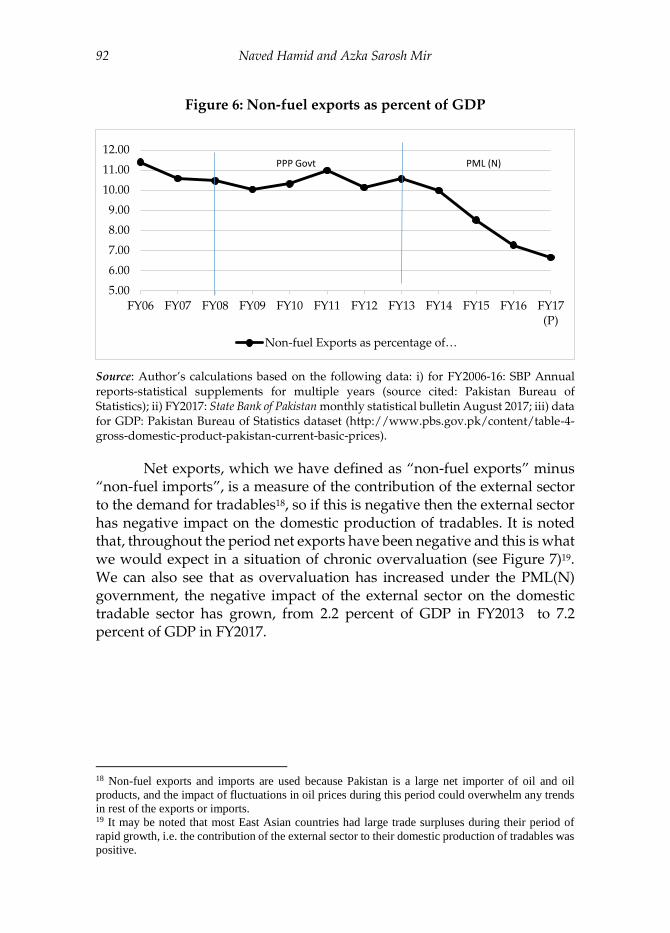
A much more obvious difference between the two periods is observed in non-fuel exports as percentage of GDP (see Figure 6). It is seen that during the PPP government, the export share in GDP fluctuated between 10 and 11 percent but during the PML(N) government it has declined continuously, falling from 10.6 percent in FY2013 to only 6.7 percent in FY2017, which is a historic low for Pakistan. While undoubtedly world trade has declined during this period, we cannot entirely blame the fall in Pakistan’s exports16 on the slowdown in world trade because Pakistan’s share in world exports has also declined under the PML(N) government (i.e. from 0.136 percent in 2013 to 0.130 percent in 2016)17. It is worth mentioning here that the decline in exports in the last few years has taken place despite the fact that Pakistan was granted GSP+ status by the European Union (EU) (preferential treatment for Pakistan’s exports) in December 2013, the first year of the PML(N) government.
16 Exports have declined by about 20 percent since 2013. 17 Incidentally, Pakistan’s share in world exports had increased from 0.125 percent in 2008 to 0.132
percent in 2013 under the PPP Government (see Data Appendix, Table 3)
10
11
12
13
FY06 FY07 FY08 FY09 FY10 FY11 FY12 FY13 FY14 FY15 FY16 (R )
FY17(P)
Percentage
LSM
92 Naved Hamid and Azka Sarosh Mir
Figure 6: Non-fuel exports as percent of GDP
Source: Author’s calculations based on the following data: i) for FY2006-16: SBP Annual reports-statistical supplements for multiple years (source cited: Pakistan Bureau of Statistics); ii) FY2017: State Bank of Pakistan monthly statistical bulletin August 2017; iii) data for GDP: Pakistan Bureau of Statistics dataset (http://www.pbs.gov.pk/content/table-4-gross-domestic-product-pakistan-current-basic-prices).
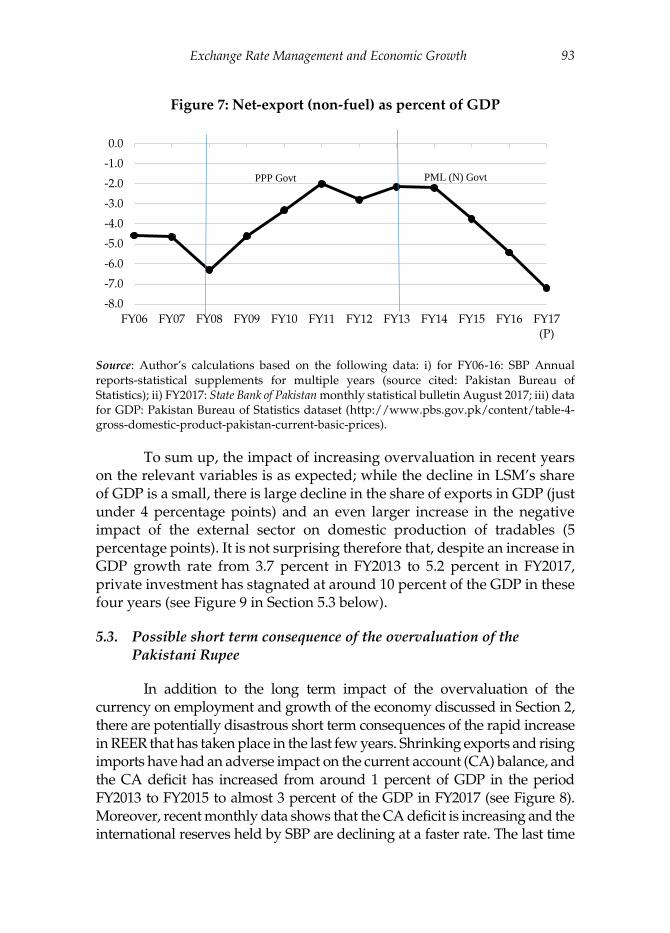
Net exports, which we have defined as “non-fuel exports” minus “non-fuel imports”, is a measure of the contribution of the external sector to the demand for tradables18, so if this is negative then the external sector has negative impact on the domestic production of tradables. It is noted that, throughout the period net exports have been negative and this is what we would expect in a situation of chronic overvaluation (see Figure 7)19. We can also see that as overvaluation has increased under the PML(N) government, the negative impact of the external sector on the domestic tradable sector has grown, from 2.2 percent of GDP in FY2013 to 7.2 percent of GDP in FY2017.
18 Non-fuel exports and imports are used because Pakistan is a large net importer of oil and oil
products, and the impact of fluctuations in oil prices during this period could overwhelm any trends
in rest of the exports or imports. 19 It may be noted that most East Asian countries had large trade surpluses during their period of
rapid growth, i.e. the contribution of the external sector to their domestic production of tradables was
positive.
5.00
6.00
7.00
8.00
9.00
10.00
11.00
12.00
FY06 FY07 FY08 FY09 FY10 FY11 FY12 FY13 FY14 FY15 FY16 FY17(P)
Non-fuel Exports as percentage of…
PML (N)PPP Govt
Exchange Rate Management and Economic Growth 93
Figure 7: Net-export (non-fuel) as percent of GDP
Source: Author’s calculations based on the following data: i) for FY06-16: SBP Annual reports-statistical supplements for multiple years (source cited: Pakistan Bureau of Statistics); ii) FY2017: State Bank of Pakistan monthly statistical bulletin August 2017; iii) data for GDP: Pakistan Bureau of Statistics dataset (http://www.pbs.gov.pk/content/table-4-gross-domestic-product-pakistan-current-basic-prices).
To sum up, the impact of increasing overvaluation in recent years on the relevant variables is as expected; while the decline in LSM’s share of GDP is a small, there is large decline in the share of exports in GDP (just under 4 percentage points) and an even larger increase in the negative impact of the external sector on domestic production of tradables (5 percentage points). It is not surprising therefore that, despite an increase in GDP growth rate from 3.7 percent in FY2013 to 5.2 percent in FY2017, private investment has stagnated at around 10 percent of the GDP in these four years (see Figure 9 in Section 5.3 below).
5.3. Possible short term consequence of the overvaluation of the Pakistani Rupee
In addition to the long term impact of the overvaluation of the currency on employment and growth of the economy discussed in Section 2, there are potentially disastrous short term consequences of the rapid increase in REER that has taken place in the last few years. Shrinking exports and rising imports have had an adverse impact on the current account (CA) balance, and the CA deficit has increased from around 1 percent of GDP in the period FY2013 to FY2015 to almost 3 percent of the GDP in FY2017 (see Figure 8). Moreover, recent monthly data shows that the CA deficit is increasing and the international reserves held by SBP are declining at a faster rate. The last time
-8.0
-7.0
-6.0
-5.0
-4.0
-3.0
-2.0
-1.0
0.0
FY06 FY07 FY08 FY09 FY10 FY11 FY12 FY13 FY14 FY15 FY16 FY17(P)
PML (N) GovtPPP Govt

94 Naved Hamid and Azka Sarosh Mir
this happened was in 2007-2008, which ultimately forced Pakistan to go to the IMF for balance of payments support, which had serious negative consequences for GDP growth and investment in the country and it is probably useful to revisit that experience.
Figure 8: Current account deficit as percentage of GDP
Source: Author’s calculations based on the following data: (i) FY2006-14: Handbook of Statistics of Pakistan Economy 2015 (http://www.sbp.org.pk/departments/stats/PakEconomy_HandBook/Chap-7.01.pdf); (ii) FY15-17: State Bank of Pakistan monthly statistical bulletins for August 2017; (iii) data for GDP: Pakistan Bureau of Statistics dataset (http://www.pbs.gov.pk/content/table-4-gross-domestic-product-pakistan-current-basic-prices).
The balance of payments crisis of 2008 and the policies that Pakistan was forced to adopt under the IMF stabilization program had a huge negative impact on economic growth and investment and the economy entered a period of stagnation from which it is just beginning to emerge. Pakistan received an IMF loan in November 2008 (mid-FY2008) and GDP growth declined dramatically from about 5 percent in FY2008 to 0.5 percent in FY2009 (see Figure 9). In the next two years, while GDP growth recovered somewhat, private and public investment that had declined by over 3 and 1 percentage points respectively in FY2009, continued to decline. It is only nine years later that GDP growth has reached the FY2008 level, while private investment as percentage of GDP is still significantly below that level (i.e. 10 percent of the GDP in FY2017 compared to 15 percent in FY2008). In other words, the negative short- and medium-term consequences of increasing overvaluation can be so serious that is critical to revise the exchange policy at the earliest.
-1
0
1
2
3
4
5
6
7
8
9
FY06 FY07 FY08 FY09 FY10 FY11 FY12 FY13 FY14 FY15 FY16 FY17(P)
current account deficit as percentage of GDP
PML (N) GovtPPP Govt.

Exchange Rate Management and Economic Growth 95
Figure 9: Impact of IMF loan in November 2009
Source: Graph is based on the following data: (i) Private and Public Investments FY2006-FY14: SBP Annual reports – statistical supplements for various years; (ii) Private and Public Investments FY2015-FY17: Pakistan Economic Survey 2016-2017; (iii) for GDP growth rate FY2006-14: Handbook of Statistics of Pakistan Economy 2015 (http://www.sbp.org.pk/departments/stats/PakEconomy_HandBook/Chap-1.3.pdf); (iv) GDP growth rate FY2015-17: Pakistan Economic survey 2016-2017. Retrieved from http://www.finance.gov.pk/survey/chapters_17/01-Growth.pdf, August 28, 2017.
6. What should be Pakistan’s Exchange Rate Management Policy?
It is evident from the discussion so far that Pakistan needs to move away from its current ad hoc exchange rate management policy and at the minimum make public the objectives and the guiding principles of its exchange rate policy even if it is simply announcing that it will be using a trade weighted basket of currencies as its exchange rate anchor. Such an announcement will, at least, remove some of the current uncertainty regarding the exchange rate among private economic decision makers and prevent any further appreciation of the Pakistani Rupee in real terms. However, we would recommend going further and adopting a more sophisticated policy which is aimed at restoring the competitiveness of the economy by eliminating the overvaluation of the RER (say over a period of 3 to 5 years) and then keeping the RER stable at that level. It is important to note that, as Frenkel (2008) puts it, “[r]eal exchange-rate stability does not mean mechanically indexing the nominal exchange rate to the difference between domestic and international inflation. The aim is to achieve stability over more extended periods. The main goal here is to reduce uncertainty about the real exchange rate over the time frames that
0.0
2.0
4.0
6.0
8.0
10.0
12.0
14.0
16.0
0.0
1.0
2.0
3.0
4.0
5.0
6.0
7.0
FY06 FY07 FY08 FY09 FY10 FY11 FY12 FY13 FY14 FY15 FY16 FY17
GDP growth rate Private investment as a % GDP
Public Investment as a % GDP
IMF approves $ 7.6
Billion loan – Nov. 2008

96 Naved Hamid and Azka Sarosh Mir
matter for decisions about recruitment and investment in existing or new tradable activities” (pp. 192-193).
It is often argued that devaluation has not worked in Pakistan in the past, so why should we expect it to work now? The reasons given for why devaluation won’t work in Pakistan fall into two groups: First, that in Pakistan the demand for imports and the supply of exports are both inelastic20; and second, that devaluation will result in inflation which will quickly erode its benefits, if any. These are valid arguments, to some extent, but inelasticity of demand for imports or supply of exports can only be in the short term, and if private decision makers find the government’s commitment to “maintaining a competitive real exchange rate” credible, then consumption, production and investment decisions will ensure that demand for imports and supply of exports are both elastic in the long term. The inflation argument only applies if devaluation is not supported by complementary monetary and fiscal policies to manage effective demand and thus limit its inflation impact and most economists would agree that for devaluation to work it is essential that it be supported with appropriate demand management policies. Moreover, the demand management policies would not have an adverse impact on GDP growth because with a competitive exchange rate the impetus to growth comes from external rather than domestic demand.
The argument about inflation on a more sophisticated level is often referred to as the “macroeconomic policy trilemma, also called the impossible trinity, [which says that] a country must choose between free capital mobility, exchange-rate management and an independent monetary policy. Only two of the three are possible. A country that wishes to fix the value of its currency and also have an interest-rate policy that is free from outside influence cannot allow capital to flow freely across its borders” (Economist, 2016). For example, if a country successfully devalues its currency so that it has a competitive real exchange rate and maintains it at that level it will generate surpluses on the balance of payments which will lead to an increase in the money supply and inflation resulting in appreciation of the currency in real terms. However, East Asian countries (particularly Japan in 1960s and 70s and China in the 1990s and 2000s) successfully dealt with this problem by accumulating international reserves and sterilizing the impact of increasing reserves on domestic
20 Or as some put it, on the demand side: ‘most of our imports are essentials and prices don’t matter’
and on the supply side: ‘there is no surplus available for export’. This argument in a sense is a throwback
to the “trade elasticity pessimism” of the 1950s and 60s (for example, see Edwards, 2015, p. 29)

Exchange Rate Management and Economic Growth 97
money supply (and inflation) through contractionary monetary and/or fiscal policies. However, they were also able to have an independent (i.e. contractionary) monetary policy because they restricted capital mobility21.
To sum up, if Pakistan wishes to restore its international competitiveness to enhance growth and employment generation it needs to eliminate the overvaluation of the currency and adopt an exchange rate policy which is aimed at maintaining a competitive real exchange rate. This would involve devaluing the Rupee (over a period of 3 to 5 years) until the desired real exchange rate is reached and then maintaining it at that level. As discussed earlier, overvaluation of the real exchange rate ranges from 20 to 50 percent and it may seem that a large adjustment would be impossible to undertake. However, as discussed in Section 3, in the 1980s Pakistan was able to manage a change of a similar magnitude in the REER without excessive inflation and with a positive impact on manufacturing, exports and GDP growth. Finally, it must be reiterated that for such a policy to work, one, it will be necessary to prevent the impact of devaluation on inflation to erode the improvement in the real exchange rate through appropriate monetary and fiscal policies; and two, long term commitment to the exchange rate policy must be credible and the implementation of the policy must be relatively transparent so that the adjustment in the real exchange rate has the desired impact on investment and resource allocation decisions in the country.
21 Generally, foreign direct investment (FDI) was allowed freely but portfolio and debt inflows were
relatively restricted. The East Asian Financial Crisis in 1997 was the consequence of many East and
Southeast Asian countries ignoring the “monetary policy trilemma”, i.e. maintaining fixed exchange
rates and keeping domestic interest relatively high (i.e. higher than in the developed countries) to
control inflation, while allowing virtually unrestricted capital mobility.
98 Naved Hamid and Azka Sarosh Mir
References
Aguirre, A., and Calderón, C. (2006). The effects of real exchange rate misalignments on economic growth. Central Bank of Chile, Santiago. Photocopy.
Ahmad, H. (2009). Capital flows and real exchange rate overvaluation - A chronic ailment: Evidence from Pakistan. The Lahore Journal of Economics, 14: SE, pp. 51-86.
Bhalla, S. S. (2007). There are no growth miracles. Paper presented at the International Monetary Fund, August 21.
Caballero, R.J., and Schmidt-Hebbel, K. (2015). Economic Policies in Emerging-Market Economies. Festschrift in Honor of Vittorio Corbo, Central Bank of Chile/Banco Central de Chile, pp. 23-60.
Dawn. (2014). Saudi Arabia loaned Pakistan $1.5bn to shore up economy. Retrieved from https://www.dawn.com/news/1092913/saudi-arabia-loaned-pakistan-15bn-to-shore-up-economy
Debowicz, D., and Saeed, W. (2014). Exchange rate misalignment and economic development: The case of Pakistan. BWPI Working Paper 210, Brooks World Poverty Institute.
Dollar, D. (1992). Outward-oriented developing economies really do grow more rapidly: Evidence from 95 LDCs, 1976-1985. Economic Development and Cultural Change, 40(3), pp. 523-544.
Economist. (2016). What is the impossible trinity? Retrieved from https://www.economist.com/blogs/economist-explains/2016/09/economist-explains-economics-4
Sebastián E. (2015). The war of ideas in economic development: A historical
perspective. Central Banking, Analysis, and Economic Policies Book
Series, 21, 023-060.
EIU. (2013). Pakistan: Finance minister pledges to arrest rupee decline. Retrieved from http://www.eiu.com/industry/article/1501351534/ pakistan-finance-minister-pledges-to-arrest-rupee-decline/2013-12-17
Exchange Rate Management and Economic Growth 99
Frenkel, R., and Taylor, L. (2006). Real exchange rate, monetary policy, and employment. DESA Working Paper No. 19, United Nations Department of Economic and Social Affairs.
Frenkel, R. (2008). The competitive real exchange-rate regime, inflation and monetary policy. CEPAL Review No. 96, pp. 191-201, Economic Commission for Latin America and the Caribbean.
Hamid, J., and Hamid, N. (1992). Exchange rate reforms in Pakistan, 1982. In Managing Policy Reforms in the Real World Asian Experiences, ed. Lamb, G. and Weaving, R., pp. 44-56. Economic Development Institute (EDI) Seminar Series, World Bank
Hussain, S. (2008). Sources of real exchange rate misalignment evidence from Pakistan. SBP Working Paper Series No. 26, State Bank of Paksitan.
Hyder, Z., and Mahboob, A. (2006). Equilibrium real effective exchange rate and exchange rate misalignment in Pakistan. SBP Research Bulletin, 2-1, 237-263, State Bank of Paksitan.
IMF. (2013). Pakistan: 2013 article iv consultation and request for an extended arrangement under the extended fund facility. International Monetary Fund.
IMF (2015). Pakistan: Staff report for the 2015 article iv consultation, ninth review under the extended arrangement, request for waivers of nonobservance of performance criteria, and request for modification of a performance criterion. International Monetary Fund.
IMF (2016a). Methodological note on EBA-lite summary. IMF Policy Paper. International Monetary Fund.
IMF. (2016b). Annual report on exchange arrangements and exchange restrictions (AREAER). International Monetary Fund.
IMF. (2017). Pakistan : 2017 article iv consultation-press release; staff report; informational annex; and statement by the executive director for Pakistan. International Monetary Fund.
Janjua, M. A. (2007). Pakistan’s external trade: does exchange rate misalignment matter for Pakistan? The Lahore Journal of Economics, Special Edition (September 2007), 125-154.
100 Naved Hamid and Azka Sarosh Mir
Johnson, S., Ostry, J. D., and Subramanian, A. (2007). The prospects for sustained growth in Africa: Benchmarking the constraints. NBER Working Paper Series, Working Paper 13120. National Bureau of Economic Research.
Khalid, A. (2015). Is the PKR overvalued? State Bank of Pakistan. Retrieved from http://www.sbp.org.pk/publications/staff-notes/Is-the-PKROvervalued.pdf
Pakistan Bureau of Statistics. (n.d.). All reports and publications [Webpage]. Retrieved from http://www.pbs.gov.pk/content/all-reports-and-publications
Pakistan, Ministry of Finance. (2017). Pakistan economic survey 2016–17. Retrieved from http://www.finance.gov.pk/survey_1617.html
Pacheco-López, P., and Thirlwall, A. P. (2013). A New Interpretation of Kaldor's first growth law for open developing countries. School of Economics. Discussion Papers, No. 1312. University of Kent.
Penn World Table version 9.0. (n.d.). The database. Retrieved from Groningen growth and development centre: http://www.rug.nl/ggdc/productivity/pwt/
Prasad, E., Rajan, R., and Subramanian, A. (2007). Foreign capital and economic growth. NBER Working Paper Series, Working Paper 13619. National Bureau of Economic Research.
Razin, O., and Collins, S. M. (1999). Real Exchange Rate Misalignments and Growth. In The Economics of Globalization: Policy Perspectives from Public Economics, ed. Razin, A., and Sadka, E. Cambridge University Press.
Rodrik, D. (2007). The real exchange rate and economic growth: Theory and evidence. Harvard University, Cambridge, MA. Photocopy.
Rodrik, D. (2008). The real exchange rate and economic growth. Brookings Papers on Economic Activity, 2008 (2), 365-412.
State Bank of Pakistan. (2017). Foreign exchange reserves (archive). Retrieved from http://www.sbp.org.pk/ecodata/FER/index.asp
Exchange Rate Management and Economic Growth 101
State Bank of Pakistan. (2015). Handbook of statistics on Pakistan economy 2015. Retrieved from http://www.sbp.org.pk/departments/ stats/PakEconomy_HandBook/index.htm
State Bank of Pakistan. (n.d.). Publications [Reports]. Retrieved from http://www.sbp.org.pk/publications/index2.asp
Thirlwall, A. P. (2015). Kaldor’s vision of the growth and development process. In Essays on Keynesian and Kaldorian Economics, pp. 271-285. Palgrave Macmillan, UK.
Williamson, J. (2008). Exchange rate economics. Working Paper Series, WP08-3. Peterson Institute of International Economic, Washington, DC.
World Bank. (2016). Data [Database]. Retrieved from https://data.worldbank.org/topic/trade
102 Naved Hamid and Azka Sarosh Mir
Methodology Appendix
R-JOS methodology for calculating overvaluation
The R-JOS methodology has been used to compute the overvaluation index. This approach uses PPP conversion factors to calculate the real exchange rate (RER) and then adjusts it for Balassa-Samuelson effect. Rodrik (2008) uses a three step procedure to estimate the overvaluation index.
First, “data on exchange rates (XRAT) and Purchasing Power Parity conversion factors (PPP) from Penn World Tables version 6.2 [is used] to calculate ‘real’ exchange rate (RER)” (Rodrik, 2008, p. 371) as follows:
ln RERit = ln (XRATit / PPPit )
where i indexes countries and t indexes five-year the time periods (Rodrik, 2008, p. 371).
Second, the RER is adjusted for Balassa-Samuelson effect in order to take into account the fact that non-traded goods are cheaper in low per capita income countries. To adjust RER for this effect, RER is regressed on real GDP per capita (RGDPCH) as shown in equation (1).
ln RERit = α + β ln RGDPCHit + γf + μit (1)
where β is the estimate of Balassa-Samuelson effect, γf denotes the time period fixed effects and μit is the error term.
Third, using the results from equation (1), predicted values of RER, i.e. RER(hat) are generated and these are used to calculate the overvaluation index as shown below:.
ln UNDERVALit = ln RERit – ln RER(hat)it (3)
If the computed index is less than one it indicates that locally produced goods are relatively cheaper in dollar terms and thus the currency is undervalued and vice versa.
We have applied the above methodology, but with two main differences. First, we have used the latest version of Penn World Table (version 9.0) for PPP conversion factors compared to Rodrik who used version 6.2, because the latest version has data to 2014 while version 6.2

Exchange Rate Management and Economic Growth 103
had data only to 2004. However, to check if we were replicating Rodrik’s methodology accurately, we estimated equation (1) using version 6.2 and obtained same results to those reported in Rodrik’s paper. Second, in running the regression for equation (1) we have used one-year rather than five-year fixed effects as used by Rodrik (2008) and in all other calculations we have denoted “t” as one-year time period rather than five-year time periods. This change was made because we are interested in looking at the overvaluation in a particular year, or change in overvaluation over a specific time period which was not possible using five year averages. However, we also calculated the overvaluation using five-year fixed effects/periods and the results were more or less the same as the five-year average overvaluation that we get using one-year time period for all comparable periods.

104 Naved Hamid and Azka Sarosh Mir
Data Appendix
Table 1: Annual Average Nominal and Real Effective Exchange Rates
Fiscal Year (FY)
(1970 = FY1969-70)
Nominal Exchange Rate
(Rs./$)
Real Effective Exchange
Rate (REER) Index
(Base 2010=100)
1970 4.77 -
1971 4.77 382.45
1972 5.81 325.72
1973 10.55 158.05
1974 9.91 189.28
1975 9.91 206.68
1976 9.91 220.65
1977 9.91 222.71
1978 9.91 208.97
1979 9.91 189.46
1980 9.91 192.23
1981 9.91 200.76
1982 10.56 214.32
1983 12.69 190.70
1984 13.49 194.80
1985 15.17 193.70
1986 16.15 165.94
1987 17.18 138.57
1988 17.60 129.03
1989 19.22 127.10
1990 21.45 115.85
1991 22.42 111.82
1992 24.84 108.51
1993 25.96 110.50
1994 30.16 105.63
1995 30.85 106.07
1996 33.57 105.54
1997 38.99 104.07
1998 43.20 108.18
1999 46.79 97.80
2000 51.77 98.70
2001 58.44 95.74
2002 61.43 97.17
2003 58.50 97.37
2004 57.57 95.38
2005 59.36 95.78
Exchange Rate Management and Economic Growth 105
Fiscal Year (FY)
(1970 = FY1969-70)
Nominal Exchange Rate
(Rs./$)
Real Effective Exchange
Rate (REER) Index
(Base 2010=100)
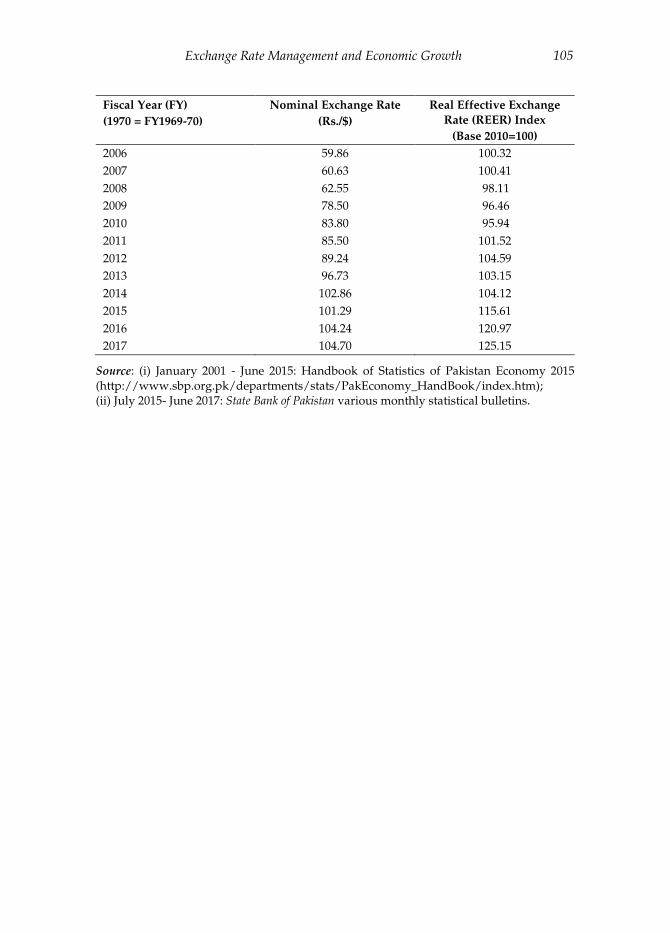
2006 59.86 100.32
2007 60.63 100.41
2008 62.55 98.11
2009 78.50 96.46
2010 83.80 95.94
2011 85.50 101.52
2012 89.24 104.59
2013 96.73 103.15
2014 102.86 104.12
2015 101.29 115.61
2016 104.24 120.97
2017 104.70 125.15
Source: (i) January 2001 - June 2015: Handbook of Statistics of Pakistan Economy 2015 (http://www.sbp.org.pk/departments/stats/PakEconomy_HandBook/index.htm); (ii) July 2015- June 2017: State Bank of Pakistan various monthly statistical bulletins.

106 Naved Hamid and Azka Sarosh Mir
Table 2A: Large Scale Manufacturing (LSM) as a Percentage of
GDP - 1980 to 1999 (At constant prices - Base 1980-81=100)
Fiscal Year (FY)
(1980 = FY1979-80) LSM % GDP
1980 10.55 1981 11.08 1982 11.91 1983 11.90 1984 12.32 1985 12.23 1986 12.34 1987 12.50 1988 13.00 1989 12.69 1990 12.70 1991 12.69 1992 12.71 1993 12.94 1994 12.13 1995 12.45 1996 12.21 1997 11.78 1998 12.18 1999 12.11
Source: Authors’ calculations based on the following data: (i) 1982–97: 50 years of Pakistan, vol. 1 (1947–1997) (http://www.pbs.gov.pk/content/50-years-pakistan-volume-i-5); (ii) 1997–99: PBS year book 2007. Retrieved from http://www.pbs.gov.pk/content/pakistan-statistical-year-book-2007, 29 August 2017

Exchange Rate Management and Economic Growth 107
Table 2B: Large Scale Manufacturing (LSM) as a Percentage of
GDP - 2000 to 2017 (At constant prices - Base 2005-06=100)
Fiscal Year (FY)
(2000 = FY1999-2000) LSM % GDP
2000 8.34 2001 8.99 2002 9.10 2003 9.28 2004 10.23 2005 11.24 2006 11.71 2007 12.16 2008 12.29 2009 11.50 2010 11.26 2011 11.04 2012 10.76 2013 10.84 2014 10.98 2015 10.90 2016 (R ) 10.74 2017 (P) 10.70
Source: Authors’ calculations based on data from Pakistan Bureau of Statistics in Table 7 --- Sectoral Shares in GDP (at constant basic prices). Retrieved from http://www.pbs.gov.pk/content/table-7-sectoral-shares-gdp-constant-basic-prices, 26 August 2017

108 Naved Hamid and Azka Sarosh Mir
Table 3: Share of Pakistan’s Exports in World Exports
Calendar year
Pakistan exports
($ million)
World exports
($ million)
Pakistan’s
Export Share (%)
A: 1980 to 1990 1980 2618 2018861 0.130 1981 2883 2003617 0.144 1982 2397 1871539 0.128 1983 3077 1815242 0.170 1984 2558 1942848 0.132 1985 2740 1959044 0.140 1986 3384 2148521 0.158 1987 4172 2522646 0.165 1988 4522 2900615 0.156 1989 4709 3137428 0.150 1990 5615 3566861 0.157
B: 2006 to 2016 2006 16932 11969551 0.141 2007 17837 13800097 0.129 2008 20323 16004384 0.127 2009 17523 12410003 0.141 2010 21410 15109860 0.142 2011 25383 18047716 0.141 2012 24567 18086187 0.136 2013 25121 18461313 0.136 2014 24706 18653106 0.132 2015 22089 16274862 0.136 2016 20524 15767927 0.130
Source: Author’s calculations based on the following data: (i) for 1980 to 1990: World Bank: Retrieved from https://data.worldbank.org/topic/trade , August 29, 2017; (ii) for 2006 to 2016: UN Commodity Trade. 2008 to 2016: 2016 International Trade Statistics Yearbook, Volume I and for 2006 to 2007: 2008 International Trade Statistics Yearbook, Volume I. Retrieved from https://comtrade.un.org/pb/first.aspx , September 5, 2017.

Exchange Rate Management and Economic Growth 109
Table 4: Data Used in Figures 6 to 8 in the Paper
Fiscal Year
(FY)
(2006 =
FY2005-06)
Current1 account
deficit
($ million)
Non-fuel2
exports
($ million)
Non-fuel2
imports
($ million)
Net
Non-fuel
exports
(% of GDP)
GDP (Market
Prices)3
(Rs million)
GDP
($ million)
2006 4990 15623.5 21906 -4.577 8216160 137264.1
2007 6878 16117 23204.5 -4.651 9239786 152385.7
2008 13874 17792.9 28500 -6.295 10637772 170077.8
2009 9261 16882 24629.1 -4.607 13199707 168152.8
2010 3946 18281 24173 -3.321 14866996 177406.9
2011 -214 23454 27726 -1.998 18276440 213755.3
2012 4658 22728 29002 -2.793 20046500 224646.1
2013 2496 24431 29407 -2.150 22385657 231430.8
2014 3130 24388 29781 -2.204 25168805 244692.1
2015 2,795 23079 33246 -3.753 27443022 270922.6
2016 4,867 20627 35791 -5.431 29102630 279201.8
2017 (P) 12,098 20269 42184 -7.200 31862167 304380.3
Note: P = Provisional Sources: Author’s calculations based on the following data: 1 (i) FY2006-14: Handbook of Statistics of Pakistan Economy 2015
(http://www.sbp.org.pk/departments/stats/PakEconomy_HandBook/Chap-7.01.pdf);
(ii) FY2015-17: State Bank of Pakistan monthly statistical bulletins for August 2017; 2 (i) for FY2006-16: SBP Annual reports-statistical supplements for multiple years; (ii) FY2017: State Bank of Pakistan monthly statistical bulletin August 2017; 3 Pakistan Bureau of Statistics dataset (http://www.pbs.gov.pk/content/table-4-gross-
domestic-product-pakistan-current-basic-prices)
110 Naved Hamid and Azka Sarosh Mir
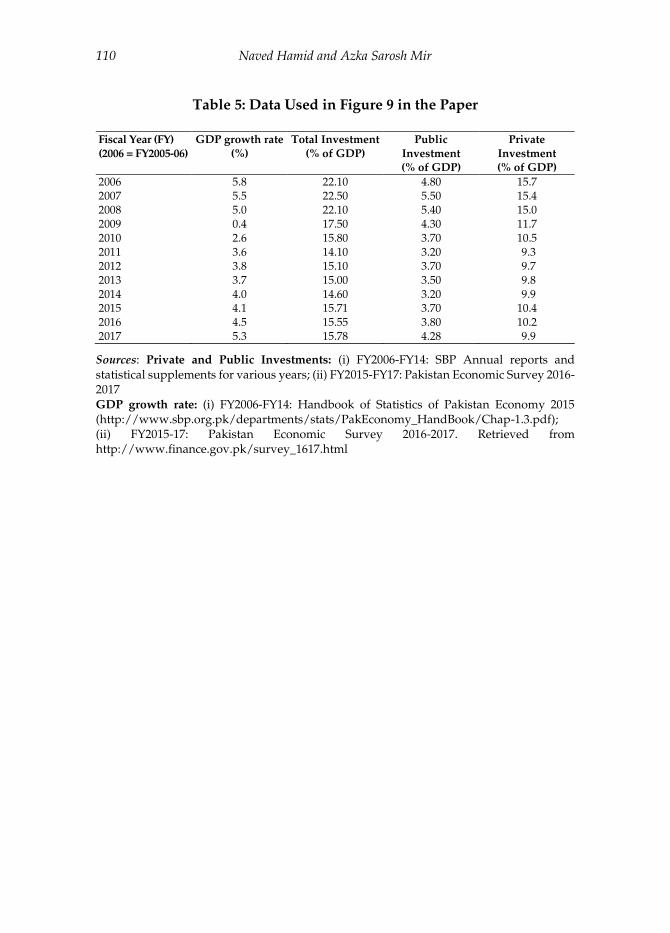
Table 5: Data Used in Figure 9 in the Paper
Fiscal Year (FY)
(2006 = FY2005-06)
GDP growth rate
(%)
Total Investment
(% of GDP)
Public
Investment (% of GDP)
Private
Investment (% of GDP)
2006 5.8 22.10 4.80 15.7 2007 5.5 22.50 5.50 15.4 2008 5.0 22.10 5.40 15.0 2009 0.4 17.50 4.30 11.7 2010 2.6 15.80 3.70 10.5 2011 3.6 14.10 3.20 9.3 2012 3.8 15.10 3.70 9.7 2013 3.7 15.00 3.50 9.8 2014 4.0 14.60 3.20 9.9 2015 4.1 15.71 3.70 10.4 2016 4.5 15.55 3.80 10.2 2017 5.3 15.78 4.28 9.9
Sources: Private and Public Investments: (i) FY2006-FY14: SBP Annual reports and statistical supplements for various years; (ii) FY2015-FY17: Pakistan Economic Survey 2016-2017 GDP growth rate: (i) FY2006-FY14: Handbook of Statistics of Pakistan Economy 2015 (http://www.sbp.org.pk/departments/stats/PakEconomy_HandBook/Chap-1.3.pdf); (ii) FY2015-17: Pakistan Economic Survey 2016-2017. Retrieved from http://www.finance.gov.pk/survey_1617.html