bois de sioux watershed restoration and protection plan ... data summary.pdf · water ecology...
TRANSCRIPT
w a t e re c o l o g yc o m m u n i t y
Bois de Sioux Watershed Restoration and Protection Plan (WRAP):data inventory, data gaps, and load duration curves
Consultants: Emmons & Olivier Resources, Inc.
Produced for:the Minnesota Pollution Control Agency & the Bois de Sioux Watershed District
April 1, 2013

Document Component SpecsText: Staples • multipurpose paper, 24 lb. text – 50% post-consumer fibers, FSC Certified.Back Cover: Neenah Paper • Esse • Texture, Sapphire • 100 lb. cover • 30% post-consumer fibers, Green Seal® CertifiedWire Binding: Manufactured using recycled high carbon steel
Cover ImagesLeft Image: Stream Data Collection by EOR staff
Right Image: Impaired Stream in the Bois de Sioux Watershed District

Bois de Sioux Watershed Restoration and Protection Plan – Data Inventory, Data Gaps, and Load Duration Curves
April 1, 2013
Primary Authors and Contributors
Emmons & Olivier Resources, Inc. Nancy-Jeanne LeFevre
Meghan Jacobson Jason Naber
Minnesota Pollution Control Agency
Jack Frederick Kevin Stroom
Bois de Sioux Watershed District
Jon Roeschlein Charlie Anderson- WSN Engineering
Bois de Sioux WRAP – Data Inventory, Gaps, and LDCs (2003-2012), 4.1.2013
Emmons & Olivier Resources, Inc.
ii
Table of Contents
1 Introduction .............................................................................................................. 1
2 Impairments ............................................................................................................. 1 3 Water Quantity Data Inventory ................................................................................. 4 4 Water Quality Data Inventory ................................................................................... 4
4.1 Streams .......................................................................................................................... 4 4.2 Lakes ............................................................................................................................12
4.2.1 Impaired Lakes ......................................................................................................12 4.2.2 Lake Traverse ........................................................................................................13
5 Biological Data Inventory ....................................................................................... 13 6 Habitat Data Inventory ........................................................................................... 14
7 Data Gaps .............................................................................................................. 14
8 Related Plans and Studies ..................................................................................... 16
9 Load Duration Curve Methods ............................................................................... 16
9.1 Introduction ...................................................................................................................16 9.2 Flow derivation ..............................................................................................................17 9.3 Water quality targets / pollutants analyzed ....................................................................17
10 Flow Duration Curves ............................................................................................. 19 11 Load Duration Curves ............................................................................................ 21
11.1 Impaired Reach: Bois de Sioux River (09020101-501) ..................................................21 11.2 Impaired Reach: Rabbit River (09020101-502) ..............................................................23 11.3 Impaired Reach: Bois de Sioux River (09020101-503) ..................................................25 11.4 Impaired Reach: Doran Slough (09020101-510) ...........................................................27 11.5 Impaired Reach: Judicial Ditch 2 (09020101-516) .........................................................29 11.6 Impaired Reach: Judicial Ditch 12 (09020101-517) .......................................................30 11.7 Impaired Reach: Lateral Three of Judicial Ditch 2 (09020101-527) ...............................31
12 References ............................................................................................................. 32

Bois de Sioux WRAP – Data Inventory, Gaps, and LDCs (2003-2012), 4.1.2013
Emmons & Olivier Resources, Inc.
iii
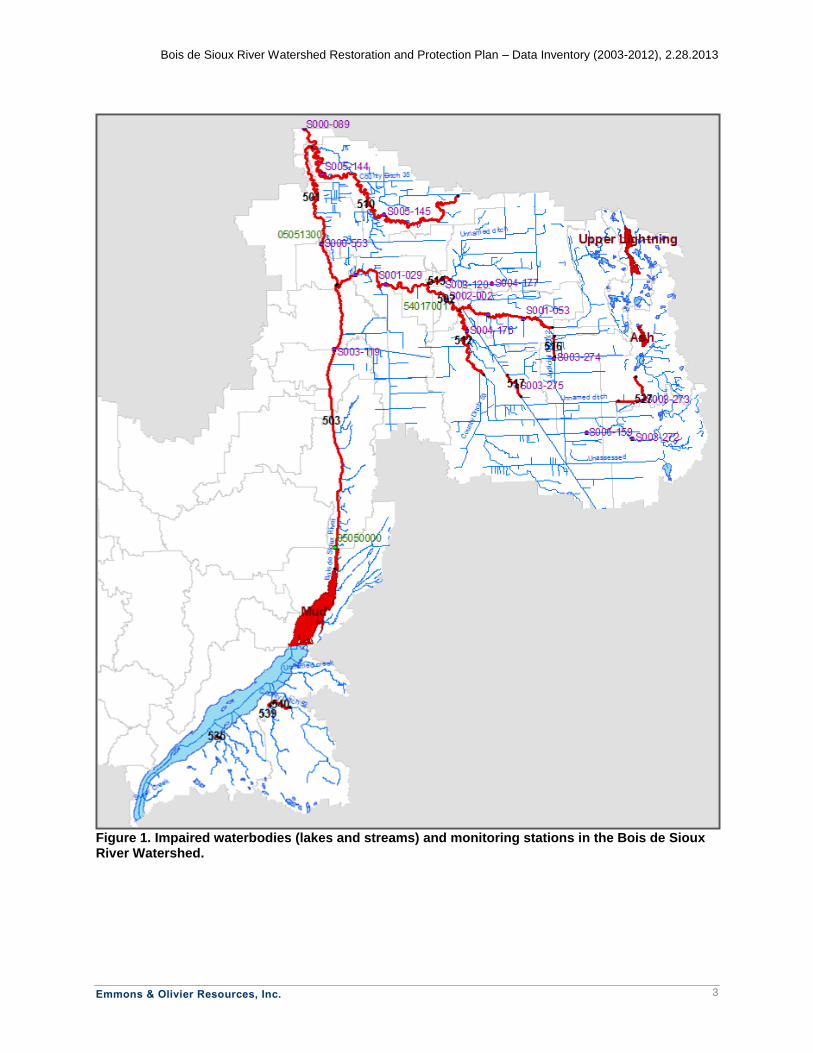
List of Figures Figure 1. Impaired waterbodies (lakes and streams) and monitoring stations in the Bois de
Sioux River Watershed. ...................................................................................................... 3 Figure 2. Flow duration curve for the Bois de Sioux River near Doran, MN (USGS 05051300),
2003-2012. .........................................................................................................................19 Figure 3. Flow duration curve for the Rabbit River at Campbell, CR4 (DNR/USGS 54017001),
2007-2011. .........................................................................................................................20 Figure 4. Flow duration curve for the Bois de Sioux River near White Rock, SD (USGS
05050000), 2003-2012. ......................................................................................................20 Figure 5. Load duration curve for E. coli at Bois de Sioux River (09020101-501). .....................21 Figure 6. Load duration curve for total suspended solids at Bois de Sioux River (09020101-501).
...........................................................................................................................................22 Figure 7. Load duration curve for total phosphorus at Bois de Sioux River (09020101-501). .....22 Figure 8. Load duration curve for chlorophyll-a at Bois de Sioux River (09020101-501). ...........23 Figure 9. Load duration curve for E. coli at Rabbit River (09020101-502). ................................23 Figure 10. Load duration curve for total suspended solids at Rabbit River (09020101-502). .....24 Figure 11. Load duration curve for total phosphorus at Rabbit River (09020101-502). ..............24 Figure 12. Load duration curve for chlorophyll-a at Rabbit River (09020101-502). ....................25 Figure 13. Load duration curve for E. coli at Bois de Sioux River (09020101-503). ...................25 Figure 14. Load duration curve for total suspended solids at Bois de Sioux River (09020101-
503). ..................................................................................................................................26 Figure 15. Load duration curve for total phosphorus at Bois de Sioux River (09020101-503)....26 Figure 16. Load duration curve for chlorophyll-a at Bois de Sioux River (09020101-503). .........27 Figure 17. Load duration curve for E. coli at Doran Slough (09020101-510). ............................27 Figure 18. Load duration curve for total suspended solids at Doran Slough (09020101-510). ...28 Figure 19. Load duration curve for total phosphorus at Doran Slough (09020101-510). ............28 Figure 20. Load duration curve for total suspended solids at Judicial Ditch 2 (09020101-516). .29 Figure 21. Load duration curve for total phosphorus at Judicial Ditch 2 (09020101-516). ..........29 Figure 22. Load duration curve for total suspended solids at Judicial Ditch 12 (09020101-517).
...........................................................................................................................................30 Figure 23. Load duration curve for total phosphorus at Judicial Ditch 12 (09020101-517). ........30 Figure 24. Load duration curve for total suspended solids at Lateral Three of JD 2 (09020101-
527). ..................................................................................................................................31 Figure 25. Load duration curve for total phosphorus at Lateral Three of JD 2 (09020101-527). 31

Bois de Sioux WRAP – Data Inventory, Gaps, and LDCs (2003-2012), 4.1.2013
Emmons & Olivier Resources, Inc.
iv
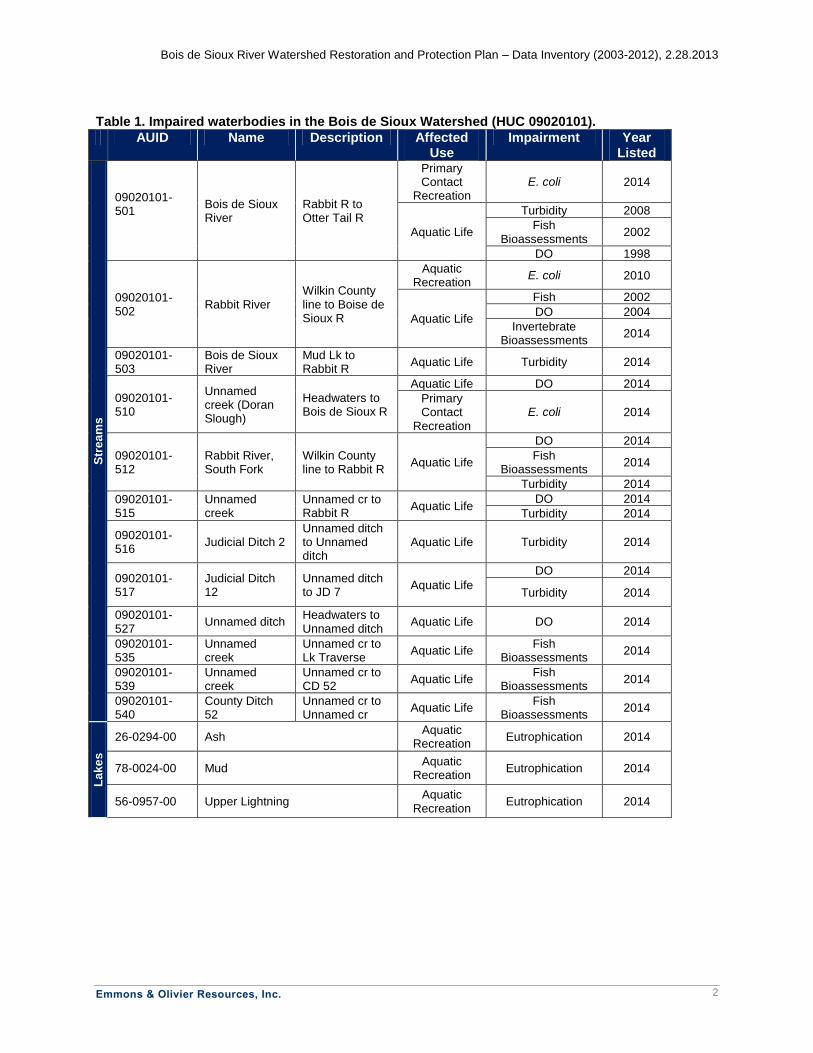
List of Tables Table 1. Impaired waterbodies in the Bois de Sioux Watershed (HUC 09020101). .................... 2 Table 2. Existing daily USGS flow data summary for Bois de Sioux River Watershed, 2003-
2012. ................................................................................................................................... 4 Table 3. Potential stressors and water quality parameters ......................................................... 5 Table 4. Stream monitoring programs in the Bois de Sioux River Watershed, 2003-2012. ......... 6 Table 5. Stream data inventory: temperature, DO, TSS, turbidity, TP, chl-a, and E. coli data
summary for the Bois de Sioux River Watershed, 2003-2012. ............................................ 7 Table 6. Stream data: March and April (snowmelt) data summary for temp, DO, TSS, turbidity,
and TP, 2003-2012. ............................................................................................................ 9 Table 7. Stream monitoring station locations by AUID. ..............................................................11 Table 8. Lake monitoring programs in the Bois de Sioux River Watershed, 2003-2012. ............12 Table 9. Impaired lakes data inventory: TP, chl-a, Secchi transparency, DO, DO saturation, and
temperature data summary for Bois de Sioux River Watershed, 2003-2012.......................12 Table 10. Impaired lakes growing season (June – September) means for TP, chl-a, and Secchi
transparency, 2003-2012. ..................................................................................................13 Table 11. Lake Traverse data inventory: TP, chl-a, Secchi transparency, DO, DO saturation,
and temperature data summary for Bois de Sioux River Watershed, 2003-2012. ...............13 Table 12. Lake Traverse growing season (June – September) means for TP, chl-a, and Secchi
transparency, 2003-2012. ..................................................................................................13 Table 13. Water chemistry data gaps of impaired streams in the Bois de Sioux Watershed (HUC
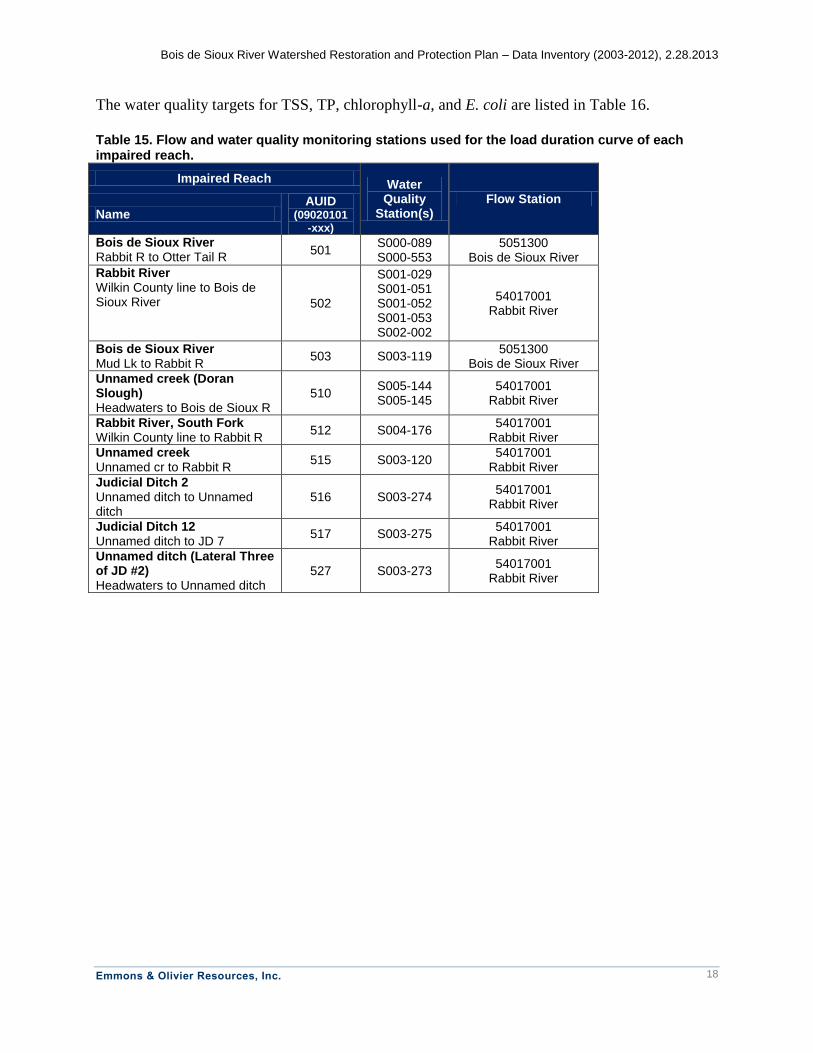
09020101) for the period 2003-2012. .................................................................................15 Table 14. Related Plans and Studies Useful for the Bois de Sioux River WRAP. ......................16 Table 15. Flow and water quality monitoring stations used for the load duration curve of each
impaired reach. ..................................................................................................................18 Table 16. Water quality targets for load duration curve analysis. ...............................................19

Bois de Sioux River Watershed Restoration and Protection Plan – Data Inventory (2003-2012), 2.28.2013
Emmons & Olivier Resources, Inc.
1
1 Introduction
The purpose of this report is to provide a data inventory, identify data gaps, and present the load
duration curve analyses as a part of Phase I of the Bois de Sioux Watershed Restoration and
Protection Plan. The findings herein are intended to support MPCA’s stressor identification for
impairments in the Bois de Sioux River Watershed (HUC 09020101).
2 Impairments
Stream and lake impairments in the Bois de Sioux Watershed (HUC 09020101) are shown in
Table 1. Impairments shown include those from the 2012 Impaired Waters list and impairments
identified in the 2012 MPCA assessment cycle for the draft 2014 Impaired Waters list.
Impairments addressed in this report include dissolved oxygen (DO), Escherichia coli (E. coli),
fish bioassessments, invertebrate bioassessments, turbidity, and eutrophication. Impaired streams
and lakes are mapped in Figure 1.
Bois de Sioux River Watershed Restoration and Protection Plan – Data Inventory (2003-2012), 2.28.2013
Emmons & Olivier Resources, Inc.
2
Table 1. Impaired waterbodies in the Bois de Sioux Watershed (HUC 09020101).
AUID Name Description Affected Use
Impairment Year Listed
Str
ea
ms
09020101-501
Bois de Sioux River
Rabbit R to Otter Tail R
Primary Contact
Recreation E. coli 2014
Aquatic Life
Turbidity 2008
Fish Bioassessments
2002
DO 1998
09020101-502
Rabbit River Wilkin County line to Boise de Sioux R
Aquatic Recreation
E. coli 2010
Aquatic Life
Fish 2002
DO 2004
Invertebrate Bioassessments
2014
09020101-503
Bois de Sioux River
Mud Lk to Rabbit R
Aquatic Life Turbidity 2014
09020101-510
Unnamed creek (Doran Slough)
Headwaters to Bois de Sioux R
Aquatic Life DO 2014
Primary Contact
Recreation
E. coli 2014
09020101-512
Rabbit River, South Fork
Wilkin County line to Rabbit R
Aquatic Life
DO 2014
Fish Bioassessments
2014
Turbidity 2014
09020101-515
Unnamed creek
Unnamed cr to Rabbit R
Aquatic Life DO 2014
Turbidity 2014
09020101-516
Judicial Ditch 2 Unnamed ditch to Unnamed ditch
Aquatic Life Turbidity 2014
09020101-517
Judicial Ditch 12
Unnamed ditch to JD 7
Aquatic Life
DO 2014
Turbidity 2014
09020101-527
Unnamed ditch Headwaters to Unnamed ditch
Aquatic Life DO 2014
09020101-535
Unnamed creek
Unnamed cr to Lk Traverse
Aquatic Life Fish
Bioassessments 2014
09020101-539
Unnamed creek
Unnamed cr to CD 52
Aquatic Life Fish
Bioassessments 2014
09020101-540
County Ditch 52
Unnamed cr to Unnamed cr
Aquatic Life Fish
Bioassessments 2014
La
ke
s
26-0294-00 Ash Aquatic
Recreation Eutrophication 2014
78-0024-00 Mud Aquatic
Recreation Eutrophication 2014
56-0957-00 Upper Lightning Aquatic
Recreation Eutrophication 2014
Bois de Sioux River Watershed Restoration and Protection Plan – Data Inventory (2003-2012), 2.28.2013
Emmons & Olivier Resources, Inc.
3
Figure 1. Impaired waterbodies (lakes and streams) and monitoring stations in the Bois de Sioux River Watershed.

Bois de Sioux River Watershed Restoration and Protection Plan – Data Inventory (2003-2012), 2.28.2013
Emmons & Olivier Resources, Inc.
4
3 Water Quantity Data Inventory
There are three long-term flow monitoring sites. Table 2 identifies flow data from USGS stations
over the most recent 10-year period. Station locations are mapped in Figure 1. Table 2. Existing daily USGS flow data summary for Bois de Sioux River Watershed, 2003-2012.
Station Waterbody Data Availability for the Period from 2003-2012
USGS 05051300 Bois de Sioux River near Doran, MN All years
DNR/USGS 54017001
Rabbit River at Campbell, CR4 2007-20111
USGS 05050000 Bois de Sioux River near White Rock, SD
All years
1 The original data inventory report (2.28.2013) identified data availability for the entire 10-year period (2003-
2012). Upon further investigation and correspondence with DNR/MPCA Cooperative Stream Gaging personnel, it was determined that 2012 data are not yet available and that data preceding 2007 are of unsuitable quality for use in the load duration curve analysis. “…data [from gage 54017001] prior to 2007 should all be considered poor. From its installation until 2007, the gage was used for flood warning purposes only. This means it was intended to be a stage recorder for high flows only, we took little to no flow measurements to develop a rating curve or verify flows and shifts. This is also around the time that more rigorous data QA/QC procedures were adopted. MPCA supplied funding in 2007 to upgrade this station to a full flow station, so data should be more reliable considering the increase in frequency of flow measurements and tightening of data QA/QC policies.” (Andrea Bergman, DNR, personal correspondence, 3.15.2013).
Data are available from some Bois de Sioux Watershed District gage stations in upper reaches of
the watershed. Stage-discharge rating curves have been developed for a portion of the sites. Data
from these gages are not daily or year-round. The calibrated HSPF model (being developed
under separate contract) will estimate flow at the pour point (or nearly) of each HUC 12
watershed; this simulated flow is expected to be available for use in conducting the load duration
curve analysis and TMDL calculations.
4 Water Quality Data Inventory
Water quality data have been collected at multiple sites in the watershed over the last several
decades. The data used for this project is from the MPCA’s EQuIS database, retrieved mid-
February 2013. The data analyzed consist of all stream data in the watershed and lake data from
only the impaired lakes. The following water quality data inventory focuses on data from the last
ten years (2003-2012). Section 4.1 Streams and Section 4.2 Lakes include several tables of
information: the monitoring programs under which data was collected and submitted to the
MPCA EQuIS database, (this includes data from the MPCA’s 2010-2011 Intensive Watershed
Monitoring), the number of sampling dates and years of water quality data at each monitoring
site, and targeted summary tables of existing water quality conditions.
4.1 Streams
The parameters of interest for the stream data inventory include those directly related to the
potential stressors to the biota, selected from the Red River Valley Biotic Impairment
Assessment1, which identified a set of stressors as likely leading to biotic impairments in the Red
1 EOR 2009. Red River Valley Biotic Impairment Assessment. Prepared for the Minnesota Pollution Control Agency.

Bois de Sioux River Watershed Restoration and Protection Plan – Data Inventory (2003-2012), 2.28.2013
Emmons & Olivier Resources, Inc.
5
River Valley. The following are the potential stressors and the water quality parameters that are
the focus of this data inventory (Table 3).
Table 3. Potential stressors and water quality parameters
Potential Stressor Water Quality Parameter
Instream sediment from field and gully erosion Turbidity, TSS
Intermittent stream flow *
Channelization *
Pesticides Pesticides
Low dissolved oxygen Dissolved oxygen
High temperature Temperature
Fish passage blockage *
* These potential stressors cannot be evaluated with water quality data.
In addition to turbidity, TSS, DO, and temperature data, E. coli, total phosphorus (TP), and
chlorophyll-a (chl-a) data were also inventoried for streams.
Pesticide data were collected at four locations (on- time grab samples) in July 2012. The
Minnesota Department of Agriculture (MDA) has not yet provided the results, but they are
anticipated spring of 2013. MPCA will no longer be collecting pesticide samples as a part of
their Stressor ID program. Instead, MDA will be doing stream monitoring for pesticides in
conjunction with MPCA WRAPs.
The most highly monitored reaches (AUIDs) within the Bois de Sioux River Watershed are
along the Bois de Sioux River (09020101-501, Rabbit R to Otter Tail R) and the Rabbit River
(09020101-502, Wilkin County line to Bois de Sioux River). Data from these sites may be the
best indicators of long-term changes within the Bois de Sioux River Watershed.

Bois de Sioux River Watershed Restoration and Protection Plan – Data Inventory (2003-2012), 2.28.2013
Emmons & Olivier Resources, Inc.
6
Table 4. Stream monitoring programs in the Bois de Sioux River Watershed, 2003-2012. Data summarized for streams includes turbidity, TSS, DO, temperature, E. coli, TP, and chl-a. Source: MPCA’s EQuIS
Monitoring Project Notes Description
Citizen Stream Monitoring Program
2004 & 2006; primarily 2007
(Mar/Apr – Sept/Oct) Weekly in 2007
11 sites
Condition monitoring providing an expanded monitoring network. Of the parameters relevant for this project only temperature data is available.
Major Watershed Pollutant Load
Monitoring Network
2008 – 2012
(year-round) Twice per month in growing
season, else, monthly
3 sites
The purpose of the project is to meet the information goal of determining status and trends (temporal and spatial) in nutrient and sediment loads carried by streams in the state. Basin planners and resource management partners at all levels will use river nutrient and sediment loads at the mouths of the 81 DNR major watersheds (8 digit USGS HUCs), in order to develop goals for long-term management.
MN Dept of Agriculture Water Quality
Monitoring Program (MNDA)
2005 – 2011
(May – July) Every other week
1 site
The MDA is meeting statutory requirements to determine the impact of pesticides on the environment and to use the data as feedback in the pesticide management process.
Mustinka and Bois de Sioux Intensive Water Chemistry Monitoring
2010 – 2011
(May/Jun – Aug/Sept) Every other week
3 sites
Monitoring is conducted to determine the overall health of the water resources, identify impaired waters, and identify waters in need of additional protection efforts to prevent impairments. Condition monitoring is conducted via a 10-year cycle (2 years of every 10 years) through which trends and watershed restoration and protection plans are identified.
Red River Basin Stream Monitoring &
Assessment;(and 5/11/2011 Sand Hill Intensive Watershed Monitoring SWAG)
2008 – 2010
(Jun/Jul – Sep/Oct) Weekly
6 sites
Condition monitoring, sample identified sites to provide necessary data to assess streams in the Red River Basin.
Red River Basin Condition Monitoring
Network
2003 – 2007, 2009 – 2012
(April – October) Weekly in summer, else, less
7 sites
The purpose of the Red River Basin Monitoring Network is to provide accurate, long-term information concerning the condition of the Red River and its tributaries to the resource managers of the Red River Basin.
Red River Basin GAP
2008 – 2009
(July – October; April – June) Weekly
2 sites
Condition to provide the necessary data to support the development of multi-parameter, watershed-based TMDLs within the Red River Basin.
Red River Basin River Watch Project
2003 – 2006 2008 – 2012
(April – October) Monthly
12 sites
To develop reliable baseline data using standard scientific methods comparable between sampling organizations and water bodies. Also to provide students and citizens with hands-on opportunities to foster greater awareness and understanding of their local watersheds. Most of the sampling done for this project will be via volunteers.
Upper Red River TMDL Project
2003
(March – June) Monthly 4 sites
Investigate the water quality of the surface water impairments in the Bois de Sioux, Ottertail Whiskey Creek and Red River of the North watersheds.

Bois de Sioux River Watershed Restoration and Protection Plan – Data Inventory (2003-2012), 2.28.2013
Emmons & Olivier Resources, Inc.
7
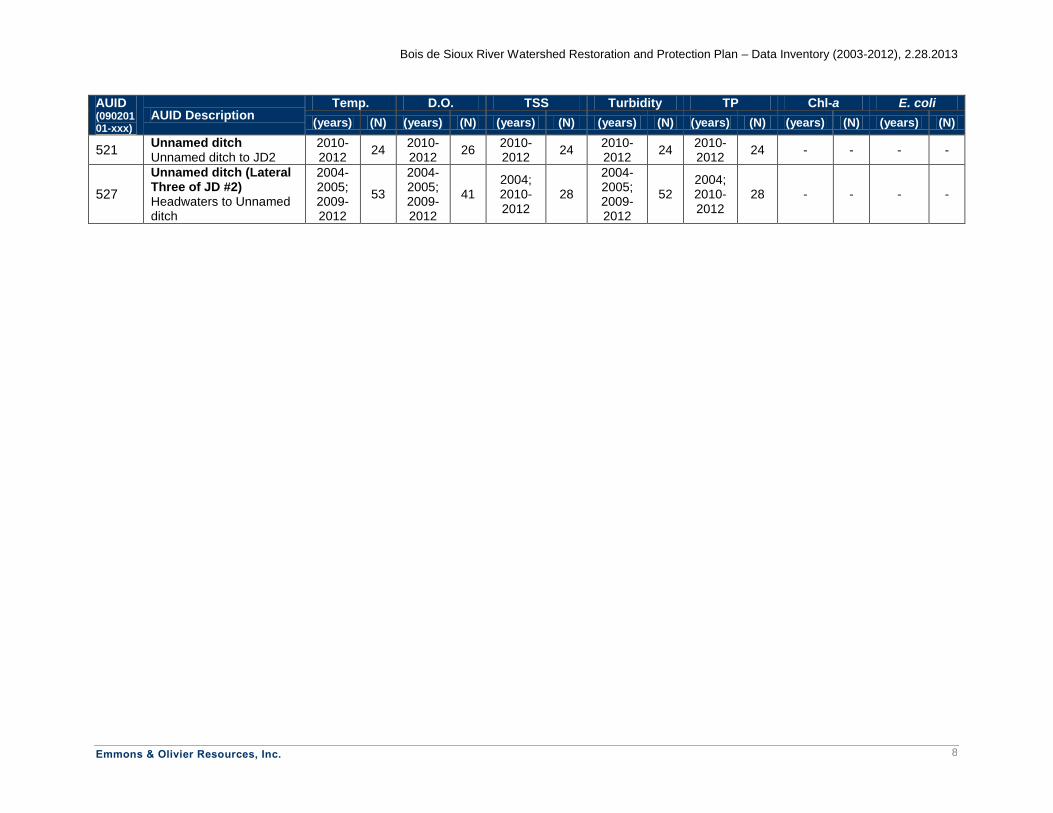
Table 5. Stream data inventory: temperature, DO, TSS, turbidity, TP, chl-a, and E. coli data summary for the Bois de Sioux River Watershed, 2003-2012. Table 7 identifies the stream monitoring stations on each of these AUIDs. AUID (09020101-xxx)
AUID Description Temp. D.O. TSS Turbidity TP Chl-a E. coli
(years) (N) (years) (N) (years) (N) (years) (N) (years) (N) (years) (N) (years) (N)
501 Bois de Sioux River Rabbit R to Otter Tail R
2003-2012
283 2003-2012
277 2003-2012
264 2003-2012
444 2003-2012
300 2010 15 2008-2011
32
502 Rabbit River Wilkin County line to Bois de Sioux River
2003-2012
263 2003-2012
261
2003-2008; 2010; 2012
103 2003-2012
296 2003-2010; 2012
109 2003; 2009-2010
19 2003; 2008-2011
39
503 Bois de Sioux River Mud Lk to Rabbit R
2009-2011
40 2009-2011
40 2009; 2010
29 2009-2011
43 2009-2010
22 2009 8 2009-2011
29
510
Unnamed creek (Doran Slough) Headwaters to Bois de Sioux R
2008-2011
53 2008-2011
66 2008-2011
36 2008-2011
71 2008-2009
19 - - 2008-2011
34
512
Rabbit River, South Fork Wilkin County line to Rabbit R
2005-2012
40 2005-2012
58 - - 2005-2012
40 - - - - - -
513 County Ditch 9 Unnamed ditch to Unnamed cr
2005-2012
39 2005-2012
40 - - 2005-2012
39 - - - - - -
515 Unnamed creek Unnamed cr to Rabbit R
2004-2005; 2007-2012
35
2004-2005; 2007-2012
35 - -
2004-2005; 2007-2012
35 - - - - - -
516 Judicial Ditch 2 Unnamed ditch to Unnamed ditch
2004-2005; 2007-2012
64
2004-2005; 2007-2012
52 2004; 2010-2012
28
2004-2005; 2007-2012
64 2004; 2010-2012
28 - - - -
517 Judicial Ditch 12 Unnamed ditch to JD 7
2004-2012
59 2004-2012
64 2004; 2010-2012
25 2004-2012
58 2004; 2010-2012
25 - - - -
520
Unnamed ditch (North Lateral One of JD #12) Unnamed ditch to Unnamed ditch
2004-2005; 2009-2010; 2012
41 - - 2004; 2010-2011
21
2004-2005; 2009-2010; 2012
41 2004; 2010-2011
21 - - - -
Bois de Sioux River Watershed Restoration and Protection Plan – Data Inventory (2003-2012), 2.28.2013
Emmons & Olivier Resources, Inc.
8
AUID (09020101-xxx)
AUID Description Temp. D.O. TSS Turbidity TP Chl-a E. coli
(years) (N) (years) (N) (years) (N) (years) (N) (years) (N) (years) (N) (years) (N)
521 Unnamed ditch Unnamed ditch to JD2
2010-2012
24 2010-2012
26 2010-2012
24 2010-2012
24 2010-2012
24 - - - -
527
Unnamed ditch (Lateral Three of JD #2) Headwaters to Unnamed ditch
2004-2005; 2009-2012
53
2004-2005; 2009-2012
41 2004; 2010-2012
28
2004-2005; 2009-2012
52 2004; 2010-2012
28 - - - -
Bois de Sioux River Watershed Restoration and Protection Plan – Data Inventory (2003-2012), 2.28.2013
Emmons & Olivier Resources, Inc.
9
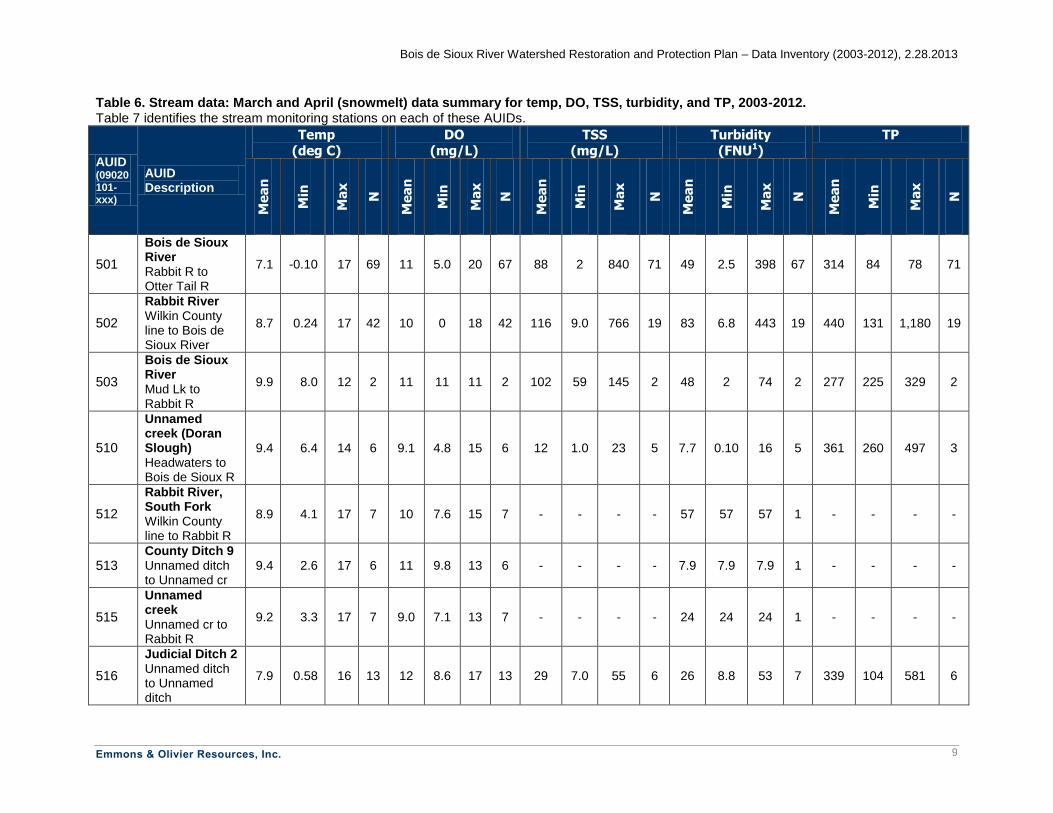
Table 6. Stream data: March and April (snowmelt) data summary for temp, DO, TSS, turbidity, and TP, 2003-2012. Table 7 identifies the stream monitoring stations on each of these AUIDs.
AUID (09020101-xxx)
AUID Description
Temp (deg C)
DO (mg/L)
TSS (mg/L)
Turbidity (FNU1)
TP
Me
an
Min
Ma
x
N
Me
an
Min
Ma
x
N
Me
an
Min
Ma
x
N
Me
an
Min
Ma
x
N
Me
an
Min
Ma
x
N
501
Bois de Sioux River Rabbit R to Otter Tail R
7.1 -0.10 17 69 11 5.0 20 67 88 2 840 71 49 2.5 398 67 314 84 78 71
502
Rabbit River Wilkin County line to Bois de Sioux River
8.7 0.24 17 42 10 0 18 42 116 9.0 766 19 83 6.8 443 19 440 131 1,180 19
503
Bois de Sioux River Mud Lk to Rabbit R
9.9 8.0 12 2 11 11 11 2 102 59 145 2 48 2 74 2 277 225 329 2
510
Unnamed creek (Doran Slough) Headwaters to Bois de Sioux R
9.4 6.4 14 6 9.1 4.8 15 6 12 1.0 23 5 7.7 0.10 16 5 361 260 497 3
512
Rabbit River, South Fork Wilkin County line to Rabbit R
8.9 4.1 17 7 10 7.6 15 7 - - - - 57 57 57 1 - - - -
513 County Ditch 9 Unnamed ditch to Unnamed cr
9.4 2.6 17 6 11 9.8 13 6 - - - - 7.9 7.9 7.9 1 - - - -
515
Unnamed creek Unnamed cr to Rabbit R
9.2 3.3 17 7 9.0 7.1 13 7 - - - - 24 24 24 1 - - - -
516
Judicial Ditch 2 Unnamed ditch to Unnamed ditch
7.9 0.58 16 13 12 8.6 17 13 29 7.0 55 6 26 8.8 53 7 339 104 581 6

Bois de Sioux River Watershed Restoration and Protection Plan – Data Inventory (2003-2012), 2.28.2013
Emmons & Olivier Resources, Inc.
10
AUID (09020101-xxx)
AUID Description
Temp
(deg C)
DO
(mg/L)
TSS
(mg/L)
Turbidity
(FNU1)
TP
Me
an
Min
Ma
x
N
Me
an
Min
Ma
x
N
Me
an
Min
Ma
x
N
Me
an
Min
Ma
x
N
Me
an
Min
Ma
x
N
517
Judicial Ditch 12 Unnamed ditch to JD 7
8.0 1.4 16 14 11 8.9 14 14 17 4.8 25 7 12 5.4 19 8 341 101 812 7
520
Unnamed ditch (North Lateral One of JD #12) Unnamed ditch to Unnamed ditch
8.7 4.4 14 8 13 8.4 16 8 4.5 1.6 8.0 5 7.8 1.2 31 5 204 36 508 5
521 Unnamed ditch Unnamed ditch to JD2
6.5 2.4 13 6 12 11 13 6 23 6 39 6 15 3.1 26 6 335 116 585 6
527
Unnamed ditch (Lateral Three of JD #2) Headwaters to Unnamed ditch
7.6 1.3 14 10 11 8.8 20 10 6.9 3.2 14 7 5.4 0.40 10 7 348 78 948 7
1 Turbidity is expressed in many units in the EQuIS database (FNMU, FNU, NTRU, NTU). Data from all units are included in the inventory (Table
5), but for the purposes of analyzing the data, only data having units of FNU were used. Data with units of FNU had the most available data in March and April.

Bois de Sioux River Watershed Restoration and Protection Plan – Data Inventory (2003-2012), 2.28.2013
Emmons & Olivier Resources, Inc.
11
Table 7. Stream monitoring station locations by AUID. AUID (09020101 -xxx)
Monitoring Station
Monitoring Station Location
501
S000-089 BOIS DE SIOUX R. AT BRECKENRIDGE
S000-553 BOIS DE SIOUX R ON CSAH-6 5.1 MI SW OF DORAN
502
S001-029 RABBIT RIVER AT US-75, 5 MILES NW OF CAMPBELL
S001-051 RABBIT R AT CSAH-9 8 MI NW OF CAMPBELL
S001-052 RABBIT R AT CSAH-2 3 MI SE OF CAMPBELL
S001-053 RABBIT R AT CSAH-19 2.5 MI N OF NASHUA
S002-002 RABBIT R,
AT CSAH-4 RT BANK OF BRG, 0.1 MI SW OF CAMPBELL
503 S003-119 BOIS DE SIOUX R AT MN-55 2 MI E FAIRMOUNT ND/5.4 W TENNEY MN
510
S005-144 UNN STR (DORAN SLOUGH) AT 190TH AVE 2.6 MI S OF BRECKENRIDGE
S005-145 UNN STR (DORAN SLOUGH) ON US-75, 1 MI SW OF DORA
512 S004-176 RABBIT R AT CR-152, 3.1 MI SE OF CAMPBELL
513 S004-177 CD-9 AT UNN RD, 3 MI NE OF CAMPBELL
515 S003-120 UNN TRIB TO THE RABBIT R AT MN-9, 1.5 MI NO. OF CAMPBELL
516 S003-274 JD #2 ON MN-55, 2 MI E OF NASHUA
517 S003-275 JD #12 AT 2ND STREET BRIDGE ON EAST EDGE OF TINTAH
520 S003-272 NORTH LATERAL ONE OF JD #12 AT CR-41, 9.8 MI SE OF TINTAH
521 S006-159 UNN DTCH AT INTERSECTION 240TH ST & CR-40, 5.5 MI SE TINTAH
527 S003-273 LATERAL THREE OF JD #2 AT CR-42, 9.1 MI ESE OF TINTAH

Bois de Sioux River Watershed Restoration and Protection Plan – Data Inventory (2003-2012), 2.28.2013
Emmons & Olivier Resources, Inc.
12
4.2 Lakes
The parameters of interested for the lake data inventory include those pollutants and indicators
associated with eutrophication: total phosphorus (TP), Secchi transparency, chl-a, DO, DO
saturation, and temperature.
4.2.1 Impaired Lakes
Table 8. Lake monitoring programs in the Bois de Sioux River Watershed, 2003-2012. Data summarized for lakes includes TP, Secchi transparency, chl-a, DO, DO saturation, and temperature. Source: MPCA’s EQuIS
Monitoring Project Notes Description
Clean Water Legacy Surface Water
Monitoring
2010
(May – Sept) Monthly
Ash Lake
Condition monitoring to complete or enhance the dataset for assessment.
2008 – 2009
(May – Sept) Monthly
Mud Lake
2009 – 2010
(May – Sept) Monthly
Upper Lightning Lake
DNR Shallow Lakes Monitoring Program
2003 & 2009
(Sept; June) Monthly
Ash Lake The Shallow Lakes Program works to protect and enhance wildlife habitat on lakes dominated by the shallow water (or littoral) zone.
2005 & 2008
(Aug; July) Monthly
Upper Lightening Lake
Ducks Unlimited MN DNR Shallow Lake
Wildlife Study
2009 – 2011
(Jun/July/Aug - Sept) Monthly
Ash Lake
Ducks Unlimited works in Minnesota through its Living Lakes Initiative to restore shallow lakes, an important migration habitat for waterfowl.
Table 9. Impaired lakes data inventory: TP, chl-a, Secchi transparency, DO, DO saturation, and temperature data summary for Bois de Sioux River Watershed, 2003-2012. All monitoring stations within a single lake were lumped for this data summary.
Lake (AUID)
TP chl-a Secchi
transparency D.O.
D.O. Saturation
Temp.
(years) (N) (years) (N) (years) (N) (years) (N)1 (years) (N)
1 (years) (N)
1
Ash (26-0294-00)
2003; 2009-2011
15 2009-2011
13 2003; 2009-2011
13 2010 5 2010 5 2003; 2009-2011
12
Mud (78-0024-00)
2008-2009
10 2008-2009
10 2008-2009
10 2008-2009
11 2008-2009
11 2008-2009
11
Upper Lightening (56-0957-00)
2005; 2008-2010
12 2008-2010
11 2005; 2008-2010
12 2009-2010
10 2009-2010
10 2005; 2008-2010
12
1 Data collected on a single day as a profile of the water column is counted as one.

Bois de Sioux River Watershed Restoration and Protection Plan – Data Inventory (2003-2012), 2.28.2013
Emmons & Olivier Resources, Inc.
13
Table 10. Impaired lakes growing season (June – September) means for TP, chl-a, and Secchi transparency, 2003-2012. All monitoring stations within a single lake were lumped for this data summary.
Lake (AUID)
TP chl-a Secchi
transparency Mean (µg/L)
N Mean (µg/L)
N Mean (m)
N
Ash (26-0294-00)
179 14 70 12 0.29 12
Mud (78-0024-00)
426 8 29 8 0.30 8
Upper Lightening (56-0957-00)
84 10 32 9 1.1 10
4.2.2 Lake Traverse
As a follow-up to the Technical Advisory Committee meeting on March 7, 2013, data from Lake
Traverse, although not listed as impaired, was retrieved and evaluated. Lake Traverse is a
reservoir located in the Northern Glaciated Plains Ecoregion and is a Class 2B and 3C water.
Eutrophication standards are ≤65 µg/L total phosphorus, ≤22 µg/L chlorophyll-a, and Secchi
transparency of ≥0.9 meters. Based on growing season means for the period from 2003-2012
(Table 12), it appears that Lake Traverse does not meet state eutrophication standards for TP;
however, Lake Traverse is not listed on the draft 2012 list of impaired waters. In addition,
MPCA has not indicated that it will be listed on the 2014 list.
Table 11. Lake Traverse data inventory: TP, chl-a, Secchi transparency, DO, DO saturation, and temperature data summary for Bois de Sioux River Watershed, 2003-2012. All monitoring stations within a single lake were lumped for this data summary.
Lake (AUID)
TP chl-a Secchi
transparency D.O.
D.O. Saturation
Temp.
(years) (N) (years) (N) (years) (N) (years) (N)1 (years) (N)
1 (years) (N)
1
Traverse (78-0025-00)
2008; 2010
19 2008; 2010
15 2004-2011
44 2008; 2010
61 2008; 2010
60 2008; 2010
61
1 Data collected on a single day as a profile of the water column is counted as one.
Table 12. Lake Traverse growing season (June – September) means for TP, chl-a, and Secchi transparency, 2003-2012. All monitoring stations within a single lake were lumped for this data summary.
Lake (AUID)
TP chl-a Secchi
transparency Mean (µg/L)
N Mean (µg/L)
N Mean (m)
N
Traverse (78-0025-00)
213 12 19.6 12 0.98 36
5 Biological Data Inventory
MPCA Stressor ID Staff will provide a summary of available biological data. This summary is
not yet available. Initial findings are typical of stressors in the Red River Basin. MPCA Staff is
completing the Bois de Sioux Monitoring and Assessment Report that covers the biological,
chemical, and Minnesota Stream Habitat Assessment (MSHA) data that was collected in the
initial phase of the WRAP plus any additional data that went into the impairment assessments.
Bois de Sioux River Watershed Restoration and Protection Plan – Data Inventory (2003-2012), 2.28.2013
Emmons & Olivier Resources, Inc.
14
6 Habitat Data Inventory
Minnesota Stream Habitat Assessment (MSHA) data is being used by MPCA Stressor ID Staff to
link biological communities to measures of habitat health. This data will be summarized as a part
of the Bois de Sioux Monitoring and Assessment Report and may also be useful for the stream
geomorphic assessment.
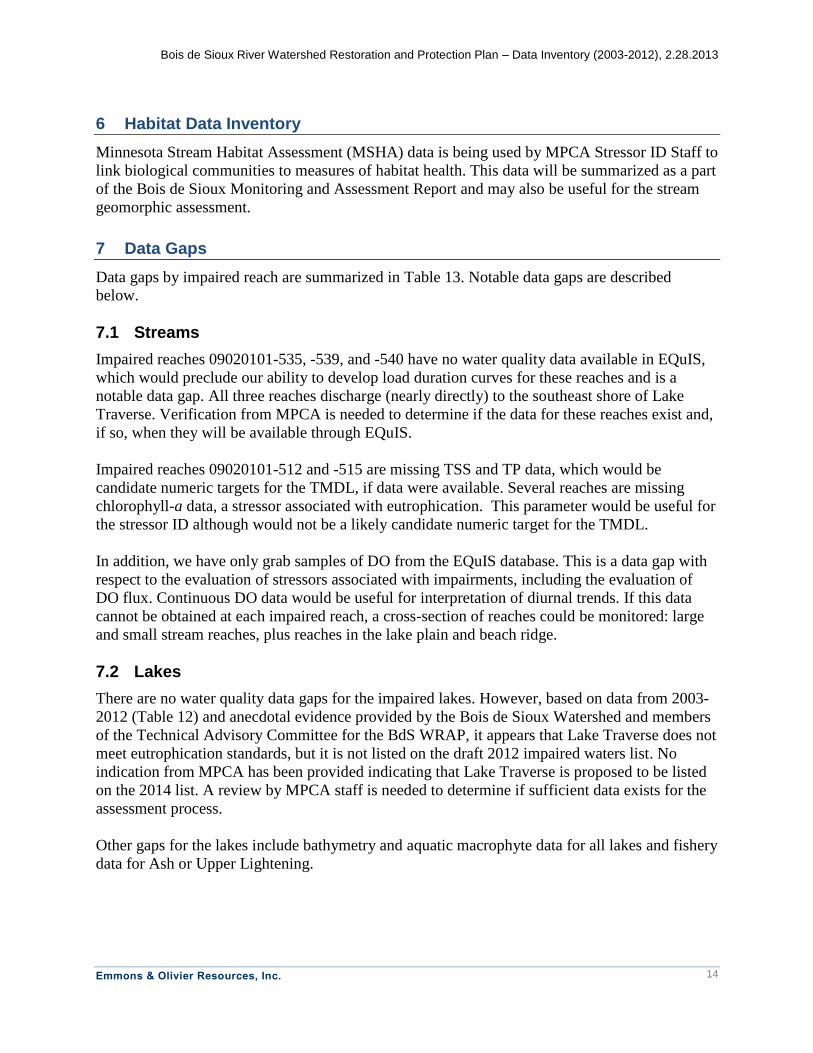
7 Data Gaps
Data gaps by impaired reach are summarized in Table 13. Notable data gaps are described
below.
7.1 Streams
Impaired reaches 09020101-535, -539, and -540 have no water quality data available in EQuIS,
which would preclude our ability to develop load duration curves for these reaches and is a
notable data gap. All three reaches discharge (nearly directly) to the southeast shore of Lake
Traverse. Verification from MPCA is needed to determine if the data for these reaches exist and,
if so, when they will be available through EQuIS.
Impaired reaches 09020101-512 and -515 are missing TSS and TP data, which would be
candidate numeric targets for the TMDL, if data were available. Several reaches are missing
chlorophyll-a data, a stressor associated with eutrophication. This parameter would be useful for
the stressor ID although would not be a likely candidate numeric target for the TMDL.
In addition, we have only grab samples of DO from the EQuIS database. This is a data gap with
respect to the evaluation of stressors associated with impairments, including the evaluation of
DO flux. Continuous DO data would be useful for interpretation of diurnal trends. If this data
cannot be obtained at each impaired reach, a cross-section of reaches could be monitored: large
and small stream reaches, plus reaches in the lake plain and beach ridge.
7.2 Lakes
There are no water quality data gaps for the impaired lakes. However, based on data from 2003-
2012 (Table 12) and anecdotal evidence provided by the Bois de Sioux Watershed and members
of the Technical Advisory Committee for the BdS WRAP, it appears that Lake Traverse does not
meet eutrophication standards, but it is not listed on the draft 2012 impaired waters list. No
indication from MPCA has been provided indicating that Lake Traverse is proposed to be listed
on the 2014 list. A review by MPCA staff is needed to determine if sufficient data exists for the
assessment process.
Other gaps for the lakes include bathymetry and aquatic macrophyte data for all lakes and fishery
data for Ash or Upper Lightening.
Bois de Sioux River Watershed Restoration and Protection Plan – Data Inventory (2003-2012), 2.28.2013
Emmons & Olivier Resources, Inc.
15
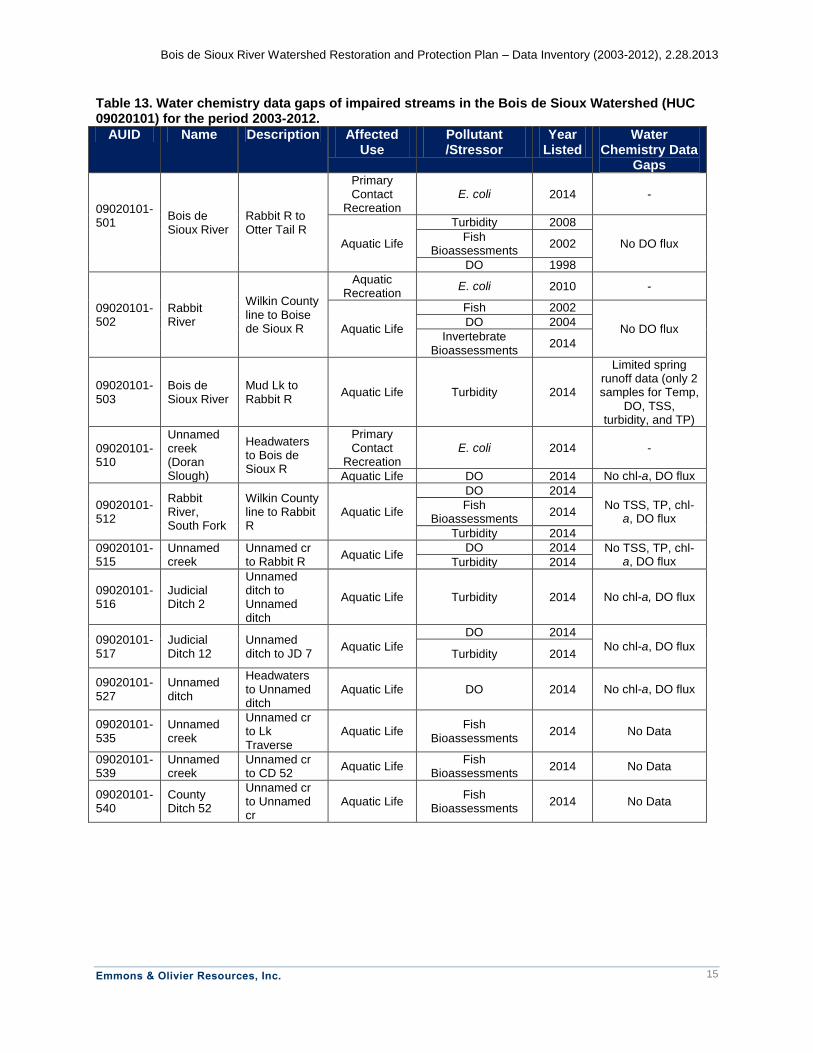
Table 13. Water chemistry data gaps of impaired streams in the Bois de Sioux Watershed (HUC 09020101) for the period 2003-2012.
AUID Name Description Affected Use
Pollutant /Stressor
Year Listed
Water Chemistry Data
Gaps
09020101-501
Bois de Sioux River
Rabbit R to Otter Tail R
Primary Contact
Recreation E. coli 2014 -
Aquatic Life
Turbidity 2008
No DO flux Fish
Bioassessments 2002
DO 1998
09020101-502
Rabbit River
Wilkin County line to Boise de Sioux R
Aquatic Recreation
E. coli 2010 -
Aquatic Life
Fish 2002
No DO flux DO 2004
Invertebrate Bioassessments
2014
09020101-503
Bois de Sioux River
Mud Lk to Rabbit R
Aquatic Life Turbidity 2014
Limited spring runoff data (only 2 samples for Temp,
DO, TSS, turbidity, and TP)
09020101-510
Unnamed creek (Doran Slough)
Headwaters to Bois de Sioux R
Primary Contact
Recreation E. coli 2014 -
Aquatic Life DO 2014 No chl-a, DO flux
09020101-512
Rabbit River, South Fork
Wilkin County line to Rabbit R
Aquatic Life
DO 2014
No TSS, TP, chl-a, DO flux
Fish Bioassessments
2014
Turbidity 2014
09020101-515
Unnamed creek
Unnamed cr to Rabbit R
Aquatic Life DO 2014 No TSS, TP, chl-
a, DO flux Turbidity 2014
09020101-516
Judicial Ditch 2
Unnamed ditch to Unnamed ditch
Aquatic Life Turbidity 2014 No chl-a, DO flux
09020101-517
Judicial Ditch 12
Unnamed ditch to JD 7
Aquatic Life
DO 2014
No chl-a, DO flux Turbidity 2014
09020101-527
Unnamed ditch
Headwaters to Unnamed ditch
Aquatic Life DO 2014 No chl-a, DO flux
09020101-535
Unnamed creek
Unnamed cr to Lk Traverse
Aquatic Life Fish
Bioassessments 2014 No Data
09020101-539
Unnamed creek
Unnamed cr to CD 52
Aquatic Life Fish
Bioassessments 2014 No Data
09020101-540
County Ditch 52
Unnamed cr to Unnamed cr
Aquatic Life Fish
Bioassessments 2014 No Data

Bois de Sioux River Watershed Restoration and Protection Plan – Data Inventory (2003-2012), 2.28.2013
Emmons & Olivier Resources, Inc.
16
8 Related Plans and Studies
Table 14 identifies plans and studies that may be useful during development of the Bois de Sioux River
WRAP.
Table 14. Related Plans and Studies Useful for the Bois de Sioux River WRAP.
Plan or Study Description
EOR. Mustinka River (09020102) and Bois de Sioux River (09020101) HSPF Model, in progress.
Model results may guide TMDLs, existing load determinations, and implementation strategy.
MNDNR. Regional Hydrogeologic Assessments: Southern Red River Valley (1996), Otter Tail (2002), Traverse-Grant (2008). Available at: http://www.dnr.state.mn.us/waters/ groundwater_section/mapping/status.html
Data are useful for identifying groundwater characteristics of the watershed.
HDR. 2003. Overall Plan: Bois de Sioux Watershed District.
Useful quick reference for watershed and water resource characteristics. Identifies watershed goals and objectives, subwatershed implementation plans, annual monitoring and evaluation program, and District policies.
WSN. 2011. Bois de Sioux Tributary HEC-HMS Model.
Useful channel cross-section data, stream layers, subwatershed boundaries, 5m DEM (incl. one with hydrologic corrections), identification of breakout flows.
North Ottawa Hydro Report http://www.frontiernet.net/~bdswd/Files/NO_2011HydroReport.pdf 2011 Level and Flow Data for the North Ottawa project.
BdSWD Annual Report 2011 http://www.frontiernet.net/~bdswd/Files/2011%20Annual%20Report%20(BdSWD).pdf Summary of District Projects and Activities in 2011.
Application of Flow Reduction Strategy in the BdSWD
http://www.frontiernet.net/~bdswd/Files/FlowReductionStrategyinBdSW.pdf 2010 Report including strategies to reduce flooding in the BdSWD and Red River Basin.
Rabbit River Turbidity TMDL http://www.pca.state.mn.us/index.php/view-document.html?gid=15970
Mustinka River Turbidity TMDL http://www.pca.state.mn.us/index.php/view-document.html?gid=14019
Mustinka River Turbidity TMDL Implementation Plan
http://www.pca.state.mn.us/index.php/view-document.html?gid=15421
Mustinka River WRAP- in progress
The Mustinka River watershed is located immediately adjacent and has similar characteristics to the Bois de Sioux/Rabbit watershed. Work Plan and TMDL analysis prepared for the Mustinka WRAP may have applicable components to the Bois de Sioux WRAP.
9 Load Duration Curve Methods
9.1 Introduction
Load duration curves (LDCs) illustrate pollutant concentrations with respect to flow on the same
day and, thereby, provide information as to the timing and source of pollutants in the water body.
The y-axis of an LDC represents the pollutant load, and the x-axis represents flow in terms of the
probability of exceedance: low flows have a high probability of exceedance and high flows have
a low probability of exceedance. In this way, the same load of pollutant would have higher
concentrations at low flows and lower concentrations at high flows, indicating different pollutant
sources (e.g. septic field leaching versus stormwater runoff). The LDC represents the loading
capacity at the water quality target for the pollutant.
Bois de Sioux River Watershed Restoration and Protection Plan – Data Inventory (2003-2012), 2.28.2013
Emmons & Olivier Resources, Inc.
17
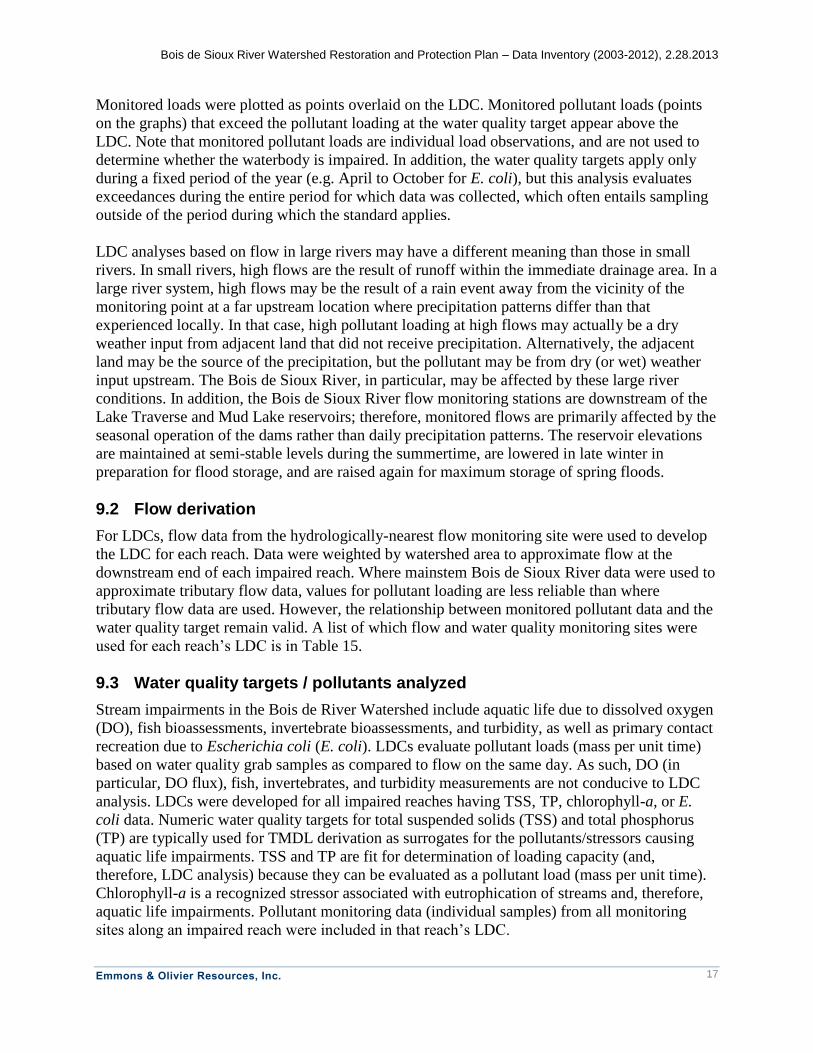
Monitored loads were plotted as points overlaid on the LDC. Monitored pollutant loads (points
on the graphs) that exceed the pollutant loading at the water quality target appear above the
LDC. Note that monitored pollutant loads are individual load observations, and are not used to
determine whether the waterbody is impaired. In addition, the water quality targets apply only
during a fixed period of the year (e.g. April to October for E. coli), but this analysis evaluates
exceedances during the entire period for which data was collected, which often entails sampling
outside of the period during which the standard applies.
LDC analyses based on flow in large rivers may have a different meaning than those in small
rivers. In small rivers, high flows are the result of runoff within the immediate drainage area. In a
large river system, high flows may be the result of a rain event away from the vicinity of the
monitoring point at a far upstream location where precipitation patterns differ than that
experienced locally. In that case, high pollutant loading at high flows may actually be a dry
weather input from adjacent land that did not receive precipitation. Alternatively, the adjacent
land may be the source of the precipitation, but the pollutant may be from dry (or wet) weather
input upstream. The Bois de Sioux River, in particular, may be affected by these large river
conditions. In addition, the Bois de Sioux River flow monitoring stations are downstream of the
Lake Traverse and Mud Lake reservoirs; therefore, monitored flows are primarily affected by the
seasonal operation of the dams rather than daily precipitation patterns. The reservoir elevations
are maintained at semi-stable levels during the summertime, are lowered in late winter in
preparation for flood storage, and are raised again for maximum storage of spring floods.
9.2 Flow derivation
For LDCs, flow data from the hydrologically-nearest flow monitoring site were used to develop
the LDC for each reach. Data were weighted by watershed area to approximate flow at the
downstream end of each impaired reach. Where mainstem Bois de Sioux River data were used to
approximate tributary flow data, values for pollutant loading are less reliable than where
tributary flow data are used. However, the relationship between monitored pollutant data and the
water quality target remain valid. A list of which flow and water quality monitoring sites were
used for each reach’s LDC is in Table 15.
9.3 Water quality targets / pollutants analyzed
Stream impairments in the Bois de River Watershed include aquatic life due to dissolved oxygen
(DO), fish bioassessments, invertebrate bioassessments, and turbidity, as well as primary contact
recreation due to Escherichia coli (E. coli). LDCs evaluate pollutant loads (mass per unit time)
based on water quality grab samples as compared to flow on the same day. As such, DO (in
particular, DO flux), fish, invertebrates, and turbidity measurements are not conducive to LDC
analysis. LDCs were developed for all impaired reaches having TSS, TP, chlorophyll-a, or E.
coli data. Numeric water quality targets for total suspended solids (TSS) and total phosphorus
(TP) are typically used for TMDL derivation as surrogates for the pollutants/stressors causing
aquatic life impairments. TSS and TP are fit for determination of loading capacity (and,
therefore, LDC analysis) because they can be evaluated as a pollutant load (mass per unit time).
Chlorophyll-a is a recognized stressor associated with eutrophication of streams and, therefore,
aquatic life impairments. Pollutant monitoring data (individual samples) from all monitoring
sites along an impaired reach were included in that reach’s LDC.
Bois de Sioux River Watershed Restoration and Protection Plan – Data Inventory (2003-2012), 2.28.2013
Emmons & Olivier Resources, Inc.
18
The water quality targets for TSS, TP, chlorophyll-a, and E. coli are listed in Table 16.
Table 15. Flow and water quality monitoring stations used for the load duration curve of each impaired reach.
Impaired Reach Water
Quality Station(s)
Flow Station
Name AUID
(09020101 -xxx)
Bois de Sioux River Rabbit R to Otter Tail R
501 S000-089 S000-553
5051300 Bois de Sioux River
Rabbit River Wilkin County line to Bois de Sioux River 502
S001-029 S001-051 S001-052 S001-053 S002-002
54017001 Rabbit River
Bois de Sioux River Mud Lk to Rabbit R
503 S003-119 5051300
Bois de Sioux River
Unnamed creek (Doran Slough) Headwaters to Bois de Sioux R
510 S005-144 S005-145
54017001 Rabbit River
Rabbit River, South Fork Wilkin County line to Rabbit R
512 S004-176 54017001
Rabbit River
Unnamed creek Unnamed cr to Rabbit R
515 S003-120 54017001
Rabbit River
Judicial Ditch 2 Unnamed ditch to Unnamed ditch
516 S003-274 54017001
Rabbit River
Judicial Ditch 12 Unnamed ditch to JD 7
517 S003-275 54017001
Rabbit River
Unnamed ditch (Lateral Three of JD #2) Headwaters to Unnamed ditch
527 S003-273 54017001
Rabbit River

Bois de Sioux River Watershed Restoration and Protection Plan – Data Inventory (2003-2012), 2.28.2013
Emmons & Olivier Resources, Inc.
19
Table 16. Water quality targets for load duration curve analysis.
Pollutant /Stressor
Water Quality Target
Reference
Total Suspended Solids
65 mg/L Aquatic Life Water Quality Standards Draft Technical Support Document for Total Suspended Solids (Turbidity) (MPCA 2011), South River Nutrient Region
Total Phosphorus 150 µg/L Minnesota Nutrient Criteria Development for Rivers (MPCA 2013), South River Nutrient Region
Chlorophyll-a 35 µg/L Minnesota Nutrient Criteria Development for Rivers (MPCA 2013), South River Nutrient Region
E. coli 126 org /100mL The MPCA’s Guidance Manual for Assessing the Quality of Minnesota Surface Waters for Determination of Impairment: 305(b) Report and 303(d) List (MPCA 2012)
10 Flow Duration Curves
Data from each of three long-term daily flow stations is provided in the following three flow
duration curves. Section 11 entails the load duration curves, which accounts for the area-
weighted flows at each impaired reach, the water quality standard, and existing water quality
data.
Figure 2. Flow duration curve for the Bois de Sioux River near Doran, MN (USGS 05051300), 2003-2012.

Bois de Sioux River Watershed Restoration and Protection Plan – Data Inventory (2003-2012), 2.28.2013
Emmons & Olivier Resources, Inc.
20
Figure 3. Flow duration curve for the Rabbit River at Campbell, CR4 (DNR/USGS 54017001), 2007-2011.
Figure 4. Flow duration curve for the Bois de Sioux River near White Rock, SD (USGS 05050000), 2003-2012.

Bois de Sioux River Watershed Restoration and Protection Plan – Data Inventory (2003-2012), 2.28.2013
Emmons & Olivier Resources, Inc.
21
11 Load Duration Curves
11.1 Impaired Reach: Bois de Sioux River (09020101-501)
Figure 5. Load duration curve for E. coli at Bois de Sioux River (09020101-501).

Bois de Sioux River Watershed Restoration and Protection Plan – Data Inventory (2003-2012), 2.28.2013
Emmons & Olivier Resources, Inc.
22
Figure 6. Load duration curve for total suspended solids at Bois de Sioux River (09020101-501).
Figure 7. Load duration curve for total phosphorus at Bois de Sioux River (09020101-501).

Bois de Sioux River Watershed Restoration and Protection Plan – Data Inventory (2003-2012), 2.28.2013
Emmons & Olivier Resources, Inc.
23
Figure 8. Load duration curve for chlorophyll-a at Bois de Sioux River (09020101-501).
11.2 Impaired Reach: Rabbit River (09020101-502)
Figure 9. Load duration curve for E. coli at Rabbit River (09020101-502).

Bois de Sioux River Watershed Restoration and Protection Plan – Data Inventory (2003-2012), 2.28.2013
Emmons & Olivier Resources, Inc.
24
Figure 10. Load duration curve for total suspended solids at Rabbit River (09020101-502).
Figure 11. Load duration curve for total phosphorus at Rabbit River (09020101-502).
Bois de Sioux River Watershed Restoration and Protection Plan – Data Inventory (2003-2012), 2.28.2013
Emmons & Olivier Resources, Inc.
25
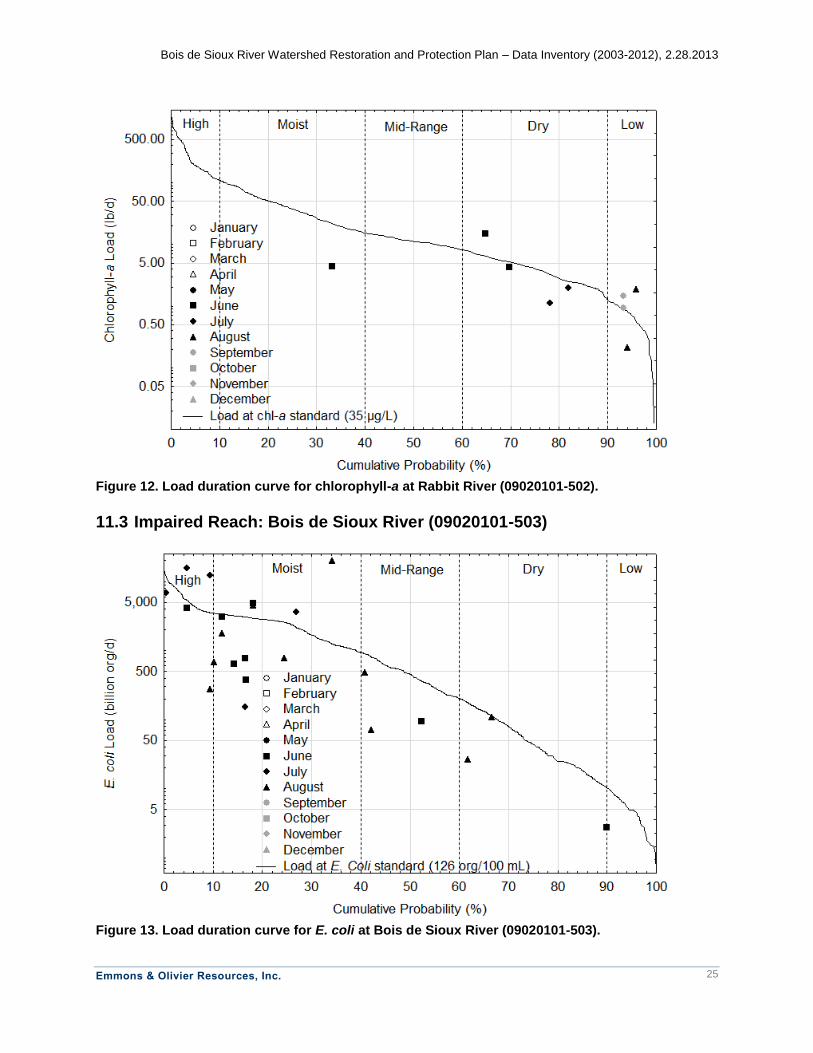
Figure 12. Load duration curve for chlorophyll-a at Rabbit River (09020101-502).
11.3 Impaired Reach: Bois de Sioux River (09020101-503)
Figure 13. Load duration curve for E. coli at Bois de Sioux River (09020101-503).

Bois de Sioux River Watershed Restoration and Protection Plan – Data Inventory (2003-2012), 2.28.2013
Emmons & Olivier Resources, Inc.
26
Figure 14. Load duration curve for total suspended solids at Bois de Sioux River (09020101-503).
Figure 15. Load duration curve for total phosphorus at Bois de Sioux River (09020101-503).

Bois de Sioux River Watershed Restoration and Protection Plan – Data Inventory (2003-2012), 2.28.2013
Emmons & Olivier Resources, Inc.
27
Figure 16. Load duration curve for chlorophyll-a at Bois de Sioux River (09020101-503).
11.4 Impaired Reach: Doran Slough (09020101-510)
Figure 17. Load duration curve for E. coli at Doran Slough (09020101-510).

Bois de Sioux River Watershed Restoration and Protection Plan – Data Inventory (2003-2012), 2.28.2013
Emmons & Olivier Resources, Inc.
28
Figure 18. Load duration curve for total suspended solids at Doran Slough (09020101-510).
Figure 19. Load duration curve for total phosphorus at Doran Slough (09020101-510).

Bois de Sioux River Watershed Restoration and Protection Plan – Data Inventory (2003-2012), 2.28.2013
Emmons & Olivier Resources, Inc.
29
11.5 Impaired Reach: Judicial Ditch 2 (09020101-516)
Figure 20. Load duration curve for total suspended solids at Judicial Ditch 2 (09020101-516).
Figure 21. Load duration curve for total phosphorus at Judicial Ditch 2 (09020101-516).

Bois de Sioux River Watershed Restoration and Protection Plan – Data Inventory (2003-2012), 2.28.2013
Emmons & Olivier Resources, Inc.
30
11.6 Impaired Reach: Judicial Ditch 12 (09020101-517)
Figure 22. Load duration curve for total suspended solids at Judicial Ditch 12 (09020101-517).
Figure 23. Load duration curve for total phosphorus at Judicial Ditch 12 (09020101-517).

Bois de Sioux River Watershed Restoration and Protection Plan – Data Inventory (2003-2012), 2.28.2013
Emmons & Olivier Resources, Inc.
31
11.7 Impaired Reach: Lateral Three of Judicial Ditch 2 (09020101-527)
Figure 24. Load duration curve for total suspended solids at Lateral Three of JD 2 (09020101-527).
Figure 25. Load duration curve for total phosphorus at Lateral Three of JD 2 (09020101-527).

Bois de Sioux River Watershed Restoration and Protection Plan – Data Inventory (2003-2012), 2.28.2013
Emmons & Olivier Resources, Inc.
32
12 References
Aquatic Life Water Quality Standards Draft Technical Support Document for Total Suspended
Solids (Turbidity). May 2011. wq-26-11. http://www.pca.state.mn.us/index.php/view-
document.html?gid=14922
MPCA (Minnesota Pollution Control Agency). 2012. Guidance Manual for Assessing the
Quality of Minnesota Surface Waters for Determination of Impairment: 305(b) Report and
303(d) List. wq-iw1-04. http://www.pca.state.mn.us/index.php/view-document.html?gid=16988
MPCA (Minnesota Pollution Control Agency). January 2013. Minnesota Nutrient Criteria
Development for Rivers, Draft January 2013. wq-s6-08.
http://www.pca.state.mn.us/index.php/view-document.html?gid=14947