board report regular board meeting july 26, 2018 …
TRANSCRIPT
Metro
Board Report
Los Angeles CountyMetropolitan Transportation
AuthorityOne Gateway Plaza
3rd Floor Board RoomLos Angeles, CA
File #: 2018-0236, File Type: Contract Agenda Number: 23.
REGULAR BOARD MEETINGJULY 26, 2018
SUBJECT: CRENSHAW NORTHERN EXTENSION
ACTION: RECEIVE AND FILE
RECOMMENDATION
RECEIVING AND FILING the Crenshaw Northern Extension Feasibility/Alternatives Analysis StudyReport (Attachment D).
ISSUE
The Crenshaw Northern Extension is a Measure M project with a groundbreaking date of Fiscal Year(FY) 2041, project completion date of FY2047 and a funding allocation of $2.24 billion (2015$). AFeasibility/Alternatives Analysis Study has been completed, which yielded five potential alignmentalternatives. Targeted stakeholder and elected officials outreach regarding the Study outcomes hasbeen undertaken to date, which provided valuable feedback. A key outcome of the Study was thefinding that all the alternatives studied exceed the funding allocation, some by approximately double.Broader public/stakeholder outreach is needed to obtain input on these five alignments, along withpotential additional technical study, to prepare the project for subsequent environmental review.
Staff will return in September with a work plan of next steps, in consultation with cities of Los Angelesand West Hollywood, essential local partners for this project.
BACKGROUND
A northern extension of the Crenshaw Line was first identified as a part of planning studies for theCrenshaw/LAX Line project in 2009. Studies at that time considered an extension of theCrenshaw/LAX Line north of the Expo Line, to the Metro Purple Line on Wilshire Boulevard, with thepotential to ultimately extend farther north to the Metro Red Line in Hollywood via West Hollywood.Funding for the extension was not identified at the time and therefore the northern terminus of theCrenshaw/LAX Project was set at the Exposition/Crenshaw Station; further studies of the northernextension were deferred.
In February 2016, the Crenshaw Northern Extension was included in the Chief Executive Officer’s“Operation Shovel Ready Initiative” list of projects for advancement through early stages of projectplanning. The Crenshaw Northern Extension Feasibility Study was initiated in May 2016. Following
Metro Printed on 7/20/2018Page 1 of 5
powered by Legistar™
File #: 2018-0236, File Type: Contract Agenda Number: 23.
the passage of the Measure M in November 2016, it was further expanded to include an AlternativesAnalysis. The study defines and analyzes four potential alignment alternatives that could extend theCrenshaw Line northward from the Metro Expo Line to the Metro Purple Line on Wilshire Boulevardand onto the Metro Red Line in Hollywood, as well as one alignment alternative that would extendfrom the Expo Line to the Red/Purple Line Wilshire/Vermont Station with a connection to Hollywoodvia transfer to the existing Metro Red Line, but would not serve West Hollywood.
DISCUSSION
Alternatives for the Crenshaw Northern Extension
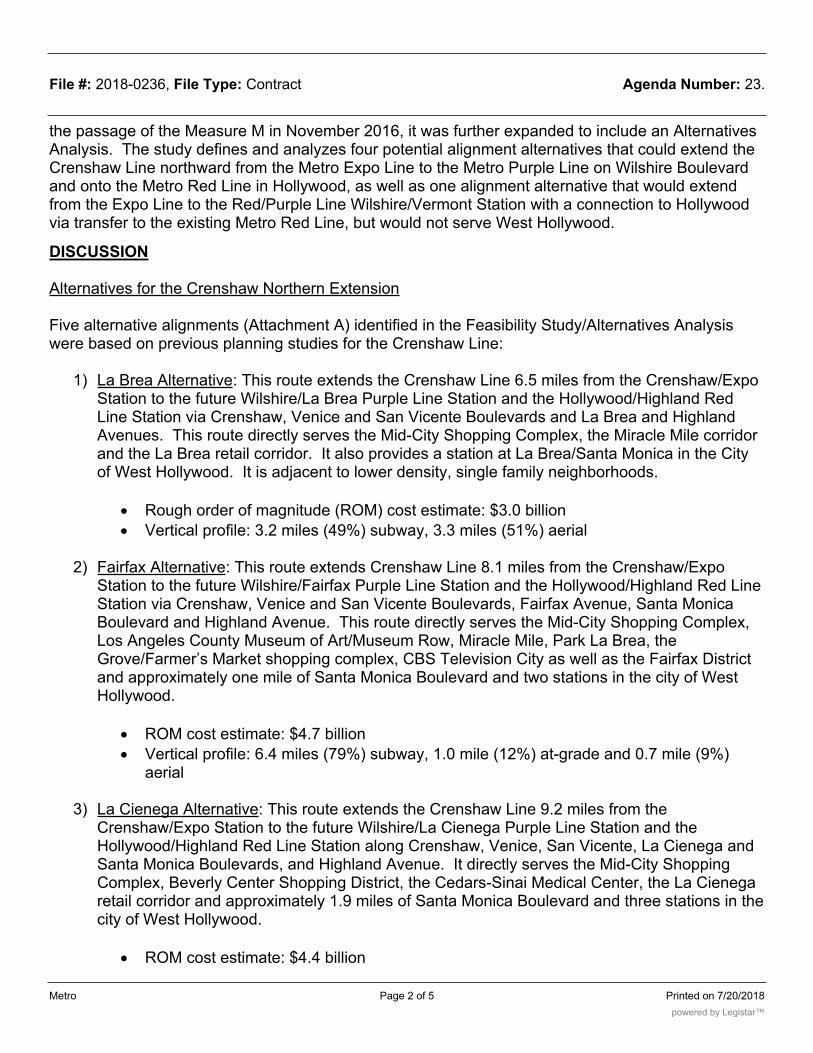
Five alternative alignments (Attachment A) identified in the Feasibility Study/Alternatives Analysiswere based on previous planning studies for the Crenshaw Line:
1) La Brea Alternative: This route extends the Crenshaw Line 6.5 miles from the Crenshaw/ExpoStation to the future Wilshire/La Brea Purple Line Station and the Hollywood/Highland RedLine Station via Crenshaw, Venice and San Vicente Boulevards and La Brea and HighlandAvenues. This route directly serves the Mid-City Shopping Complex, the Miracle Mile corridorand the La Brea retail corridor. It also provides a station at La Brea/Santa Monica in the Cityof West Hollywood. It is adjacent to lower density, single family neighborhoods.
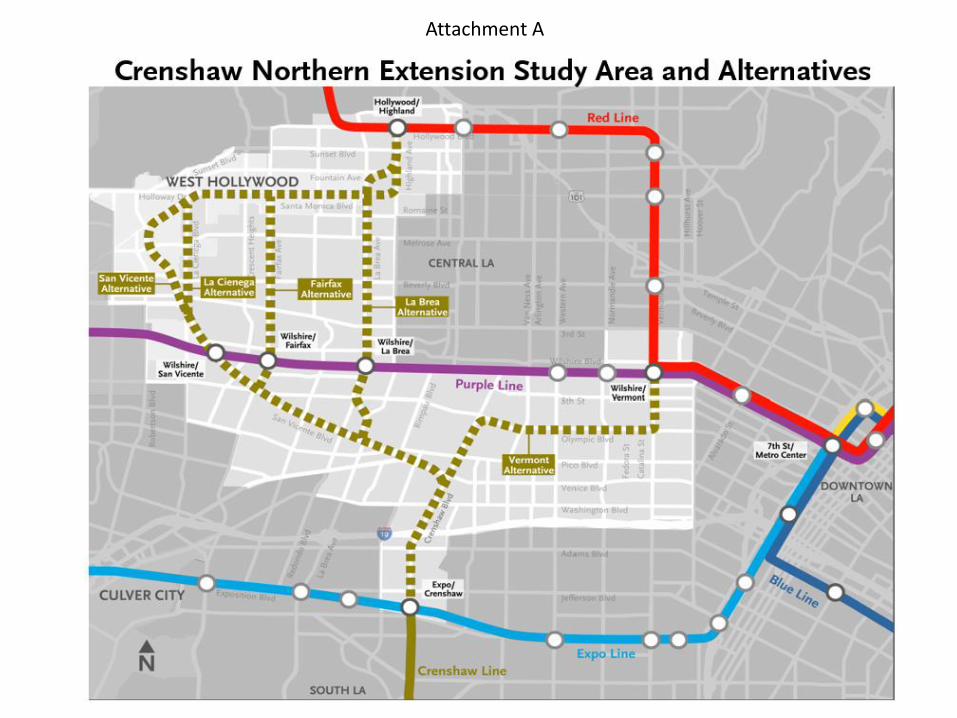
· Rough order of magnitude (ROM) cost estimate: $3.0 billion
· Vertical profile: 3.2 miles (49%) subway, 3.3 miles (51%) aerial
2) Fairfax Alternative: This route extends Crenshaw Line 8.1 miles from the Crenshaw/ExpoStation to the future Wilshire/Fairfax Purple Line Station and the Hollywood/Highland Red LineStation via Crenshaw, Venice and San Vicente Boulevards, Fairfax Avenue, Santa MonicaBoulevard and Highland Avenue. This route directly serves the Mid-City Shopping Complex,Los Angeles County Museum of Art/Museum Row, Miracle Mile, Park La Brea, theGrove/Farmer’s Market shopping complex, CBS Television City as well as the Fairfax Districtand approximately one mile of Santa Monica Boulevard and two stations in the city of WestHollywood.
· ROM cost estimate: $4.7 billion
· Vertical profile: 6.4 miles (79%) subway, 1.0 mile (12%) at-grade and 0.7 mile (9%)aerial
3) La Cienega Alternative: This route extends the Crenshaw Line 9.2 miles from theCrenshaw/Expo Station to the future Wilshire/La Cienega Purple Line Station and theHollywood/Highland Red Line Station along Crenshaw, Venice, San Vicente, La Cienega andSanta Monica Boulevards, and Highland Avenue. It directly serves the Mid-City ShoppingComplex, Beverly Center Shopping District, the Cedars-Sinai Medical Center, the La Cienegaretail corridor and approximately 1.9 miles of Santa Monica Boulevard and three stations in thecity of West Hollywood.
· ROM cost estimate: $4.4 billion
Metro Printed on 7/20/2018Page 2 of 5
powered by Legistar™

File #: 2018-0236, File Type: Contract Agenda Number: 23.
· Vertical profile: 5.1 miles (56%) subway, 2.7 miles (29%) aerial, 1.4 (15%) miles at-grade
4) San Vicente Alternative: This route extends the Crenshaw/Line 9.5 miles from theCrenshaw/Expo Station to the future Wilshire/La Cienega Purple Line Station to theHollywood/Highland Red Line Station along Crenshaw, Venice, San Vicente and Santa MonicaBoulevards, and Highland Avenue. It directly serves the Mid-City Shopping Complex, BeverlyCenter Shopping District, Cedars-Sinai Medical Center, the Pacific Design Center, WestHollywood Library/Park and approximately 2.5 miles of Santa Monica Boulevard and threestations in the city of West Hollywood.
· ROM cost estimate: $4.3 billion
· Vertical profile: 5.2 miles (55%) subway, 2.9 miles (30%) aerial, 1.4 miles (15%) at-grade
A fifth alignment, which would not directly connect to Hollywood/Highland nor serve the city of WestHollywood, was added to the study because it offers the shortest connection to both the Red andPurple Lines at the Wilshire/Vermont Station:
5) Vermont Alternative: This route extends Crenshaw Line 4.8 miles from Crenshaw/Expo to theexisting Wilshire/Vermont Red/Purple Line Station along Crenshaw and Olympic Boulevards,and Vermont Avenue. It serves the Olympic Boulevard retail corridor in Koreatown.
· ROM cost estimate: $3.6 billion
· Vertical profile: 4.8 miles (100%) subway
Although the Vermont Alternative is the shortest, it would only extend as far north as theWilshire/Vermont Station, where riders would transfer to the Metro Red Line to reach the northernterminus of the study corridor at the Hollywood/Highland Station. This alignment would not connectthrough or directly serve West Hollywood and would not serve the Mid-City area as broadly as theother four alternatives.
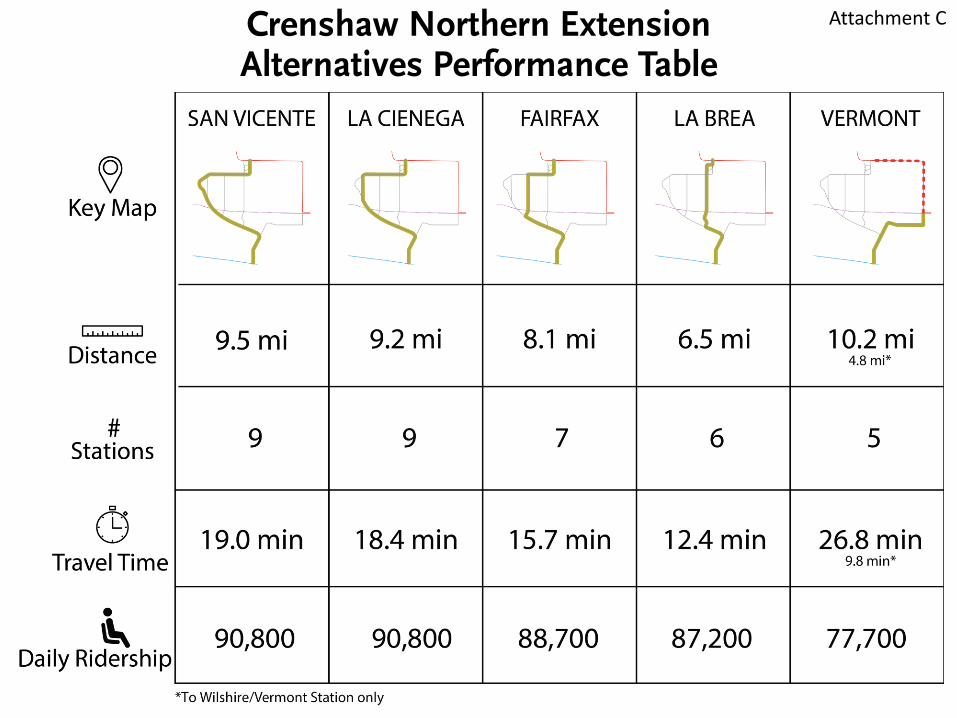
Performance of Alternatives - Ridership
All five study alternatives demonstrate high ridership potential. The alternatives, except the VermontAlternative, would result in a regional, north-south light rail transit link through a congested corridor,providing access to major activity centers and areas of high population and employment density.Ridership projections range from 77,700 project boardings for the Vermont Alternative to between87,000 and 90,000 project boardings for the La Brea, Fairfax, La Cienega and San VicenteAlternatives.
All alternatives would result in greatly reduced transit travel times compared with existing conditions.Current peak period transit travel times between the Expo/Crenshaw Station and Hollywood/HighlandStation are approximately 45 minutes and include at least one transfer. Estimated end-to-end traveltimes on the alternatives range from 12.4 minutes on the La Brea Alternative to 19 minutes on theSan Vicente Alternative and nearly 27 minutes on the Vermont Alternative, which requires a transfer
Metro Printed on 7/20/2018Page 3 of 5
powered by Legistar™

File #: 2018-0236, File Type: Contract Agenda Number: 23.
at Wilshire/Vermont to complete the trip to Hollywood/Highland. The average travel time savingsexperienced for each rider on the project alternatives ranges from 17 minutes and 18 minutes perproject trip on the Vermont and La Brea Alternatives, respectively, to 20 minutes per project trip onthe San Vicente or La Cienega Alternatives.
Of the four alternatives that connect to Hollywood/Highland, the longer western alternatives alongSan Vicente and La Cienega provide access to a greater number of high density activity centers thanthe eastern alignments such as La Brea. This is because of the land uses and higher number ofresidents and jobs within a ½ mile radius surrounding proposed stations along the longer alignments.For example, the San Vicente and La Cienega corridor stations would serve approximately 60,000residents and 70,000 jobs within a ½ mile radius, while the La Brea corridor stations would only serveapproximately 25,000 residents and 16,000 jobs.
Performance of Alternatives - Cost
The capital cost of each alternative is largely a function of its vertical profile, length and number ofstations. Due to the high densities and levels of congestion throughout the Study Area, any newfixed guideway transit would likely need significant segments of subway tunneling and/or aerial,grade separated guideway to operate effectively and safely within the Study Area. As shown inAttachment B, costs are greater than the funding allocation in Measure M, which assumes a mix offunding sources. This is a significant outcome of the Study, which guides how to proceed further intothe planning, design and environmental review process. Attachment C provides a comparison tableof the key performance metrics.
DETERMINATION OF SAFETY IMPACT
These actions will not have any impact on the safety of our customers and/or employees becausethis Project is at the study phase and no capital or operational impacts result from this Board action.
FINANCIAL IMPACT
The FY 2018-19 budget includes an initial $500,000 in Cost Center 4350 (Systemwide Team 2),Project 475558 (Crenshaw Northern Extension) to begin the draft environmental study of theCrenshaw Northern Extension project upon identification of the preferred corridor alternatives by theBoard.
Impact to Budget
The source of funding for this project is Measure M 35%. As these funds are earmarked for theCrenshaw Northern Extension project, they are not eligible for Metro bus and rail capital andoperating expenditures.
ALTERNATIVES CONSIDERED
The Board may determine to receive and file the Feasibility/Alternatives Analysis Study and decline
Metro Printed on 7/20/2018Page 4 of 5
powered by Legistar™

File #: 2018-0236, File Type: Contract Agenda Number: 23.
to conduct any further work, absent a realistic delivery and funding strategy to deliver the projectearlier than FY2047. This is not recommended because the city of West Hollywood has proposed anEarly Project Delivery Strategy to consider and in 2016, Metro committed to conducting a study andenvironmental review.
NEXT STEPS
There has been a long-standing interest among West Hollywood local elected officials andstakeholders to accelerate the delivery of the Crenshaw Northern Extension. Within the provisionsallowed under Measure M, Metro staff has committed to exploring a viable path forward to acceleratethe project, consistent with adopted Board policy: Early Project Delivery Strategy. A significantfinding emerging out of the Feasibility/Alternatives Analysis Study done to date is the fact that thecost of all five alternatives exceed Measure M funding allocations, some by approximately double.Any potential acceleration strategy at this juncture would have to address that factor, either throughmitigating cost, securing new revenue, or a hybrid of both.
To better target project delivery options and a funding strategy, there is a need to conduct broadpublic outreach and potential further technical study to prepare for a next stage of environmentalreview. Staff will consult with the cities of Los Angeles and West Hollywood to develop a strategy ofnext steps and attendant schedules for the next stage analyses. Metro staff is targeting to return tothe Board in September, contingent on the city consultative process.
ATTACHMENTS
Attachment A - Map of Crenshaw Northern Extension AlternativesAttachment B - Capital Costs: Range of AlternativesAttachment C - Alternatives Performance TableAttachment D - Crenshaw Northern Extension Feasibility/Alternatives Analysis Report Executive
Summary
Prepared by: Alex Moosavi, Transportation Planning Manager (213) 922-2661David Mieger, Executive Officer (213) 922-3040Manjeet Ranu, Senior Executive Officer (213) 418-3157
Reviewed by: Therese McMillan, Chief Planning Officer (213) 922-7077
Metro Printed on 7/20/2018Page 5 of 5
powered by Legistar™
Attachment A
Crenshaw North Extension Capital Costs: Range of Alternatives
1
Attachment B
Crenshaw Northern ExtensionAlternatives Performance Table
Attachment C

ES - 1
Attachment D

CRENSHAW NORTHERN EXTENSION FEASIBILITY/ALTERNATIVES ANALYSIS STUDY Project Ref: 60493606
Final Report Executive Summary
Prepared for:
Los Angeles County
Metropolitan Transportation Authority
Prepared by:
AECOM
300 S Grand Avenue
Los Angeles, California 90071
June, 2018

Table of Contents
Background ................................................................................................................................................. ES-1
Purpose and Need .......................................................................................................................................ES-5
Definition of Alternatives ........................................................................................................................... ES-12
Performance of Alternatives ...................................................................................................................... ES-27
Findings and Next Steps ........................................................................................................................... ES-33

ES-1
Background The Crenshaw Northern Extension is a Measure M project that would extend the under-construction Metro Crenshaw Line from its current terminus at the Metro Expo Line north to the Metro Purple and Red Lines. The purpose of this study is to define and evaluate project alignments and alternatives in support of future screening and public outreach efforts that will inform the recommendation of alternative(s) to be carried forward for environmental review.
The study evaluates several alignment corridors that would provide a critical north-south regional transit link through Central Los Angeles, connecting the South Bay, South LA, and Metro Green and Expo Lines, with Mid-City, West Hollywood, Hollywood, and the Metro Red and Purple Lines, while serving major activity centers and areas of high population and employment density. In order to maximize cost-effectiveness, the study identifies and evaluates opportunities for above-grade and at-grade profiles wherever feasible, based on existing and planned physical conditions, including roadway width, traffic volumes, land use, and engineering feasibility. All five study corridors demonstrate high ridership potential, particularly at major connection points with the Metro rail system, underscoring the regional benefits of the project. The capital cost of each alternative is largely a function of vertical profile, length, and number of stations. Future studies will be needed to screen the five alternatives down to a Locally Preferred Alternative that can be environmentally cleared for construction.
Study Area The Crenshaw Northern Extension Feasibility/ Alternatives Analysis Study Area (Study Area) (Figure ES - 1) is 17 square miles and includes portions of the City of Los Angeles, the City of West Hollywood, and the City of Beverly Hills.
Figure ES - 1 Crenshaw Northern Extension Feasibility/Alternatives Analysis Study Area
Crenshaw Line

ES-2
Figure ES - 3 Comparison of Population Density of the Study Area and Major Cities
The Study Area is characterized by neighborhoods originally built-out in the first half of the 20th century, containing a mix of high-density residential communities and employment clusters shaped largely by the extensive streetcar and interurban rail network that existed at the time. The extensive arterial street network and proximity to major regional centers such as Hollywood, Downtown LA and the Wilshire corridor supported the continued densification of the Study Area following the streetcar era. The dense, mixed-use character of the Study Area (Figure ES - 2) would benefit from enhancements to the transit network to support existing densities and future population and employment growth.
The Study Area itself is similar in size, in terms of population and jobs, to many major U.S. cities (Figure ES - 3), and its influence on regional travel demand is comparable to downtown Los Angeles, with significant regional activity centers including major retail and commercial centers, employment centers, medical facilities, and cultural sites (Figure ES-5).
Today, with approximately 19,800 residents and 10,900 jobs per square mile, the Study Area population and employment densities are more than twice the City of LA average, and almost ten times the LA County average. In 2040, the Study Area is projected to have a total population of about 397,000, or 27,629 people per square mile, which is similar to the population density of New York City1.
1 http://www1.nyc.gov/site/planning/data-maps/nyc-population/population-facts.page
La Brea Ave./Wilshire Bl. Looking North
Figure ES - 2 Urban Character of the Study Area
Mixed-use Development – La Brea Ave.
Pacific Design Center – West Hollywood

ES-3
The number of jobs within the Study Area is a major driver of regional travel demand, acting as a Central Business District (CBD). In fact, the employment contained within the Study Area is comparable to the combined employment of the CBDs of San Jose, San Diego, and Sacramento, as well as the other major cities shown in Figure ES-4.
Figure ES - 4 Comparison of Employment in the Study Area and Major
Cities’ Central Business Districts
Figure ES - 5 Regional Activity Centers in the Study Area

ES-4
Existing and Planned Metro Network Metro’s extensive bus and rail network provides interurban high-capacity transit across the region. The Study Area is served from east to west by the Expo light rail line, and Purple Line subway, and Metro Local and Rapid bus routes provide service on most arterial roadways. The Study Area lacks a reliable, high-capacity transit service for trips moving north and south through the Study Area and connecting to Metro's regional rail lines. The existing Metro rail and bus rapid transit (BRT) network began with the opening of the Blue Line in 1990 and currently supports 384,604 daily boardings at 110 stations along 123 route-miles (Figure ES - 6). In addition, there are two rail lines under construction in or adjacent to the Study Area: the Purple Line subway extension to Westwood is scheduled for completion by 2026; and the Crenshaw Line, from the Expo Line south to the Los Angeles International Airport (LAX) and the South Bay, will open in 2019.
Therefore, by 2026, the Metro system will include five primarily east-west fixed-guideway transit lines west of Downtown Los Angeles (the Green, Expo, Purple, Red, and Orange Lines), with only a single north-south link providing service between the Expo Line and points south. Due to the lack of a high-capacity north-south transit line, trips between the San Fernando Valley, Central LA, Mid-City, South LA, the Westside, LAX, and the South Bay experience significant travel time delays due to slow and unreliable bus service or the need for significant out-of-the-way travel via Downtown LA.
Over the coming decades, Metro will greatly expand the fixed-guideway rail and bus network throughout Los Angeles County due to the passage of the Measure M ballot initiative in November, 2016. The ½-cent sales tax increase is expected to provide upwards of $130 billion for the development of new transit lines and other transportation capital investments throughout Los Angeles County (Figure ES - 7). The Measure M expenditure plan identifies $2.24 billion (2015 $) for the Crenshaw Northern Extension project beginning in 2040.
Figure ES - 6 Metro's Existing Fixed Guideway Network Figure ES - 7 Measure M 2040 Fixed Guideway Network

ES-5
Previous Studies The Crenshaw Northern Extension Feasibility/Alternatives Analysis Study (Study) builds mainly upon portions of alignments previously identified in the Wilshire/La Brea LRT Extension Feasibility (Figure ES-8) and Westside Subway Extension studies.
Figure ES - 8 Potential Crenshaw North Extension Alignments Studied in Wilshire/La Brea LRT
Extension Feasibility Study (2009)

ES-6
Purpose and Need Existing travel conditions, transportation infrastructure performance, and demand demonstrate the challenges associated with the lack of high-capacity north-south transportation infrastructure in the Study Area.
The Study Area is characterized by high-density residential and commercial uses that draw tourism, shopping and employment. The roadway network is made of a grid of narrow arterials that date to the early twentieth century. The resulting demand on the existing transportation network results in some of the region’s highest local surface street congestion. These conditions will intensify as population and employment within the Study Area continue to grow, posing risks to economic development, quality of life, and the environment.
Five mobility problems identified in this Study demonstrate the overall need for the project:
Transit Network: Transit options within the Study Area are limited to east-west rail services and buses that operate on congested roadways. North-south travel on the rail network requires transferring through downtown Los Angeles, thus decreasing network efficiency.
Congestion & Transit Reliability: Commuters’ willingness to use transit is negatively impacted by long and unpredictable travel times due to traffic congestion.
Travel Demand: High demand exists for trips within the Study Area as well as trips between the Study Area and surrounding region. Projected increased travel demand will place additional strain on an already overburdened system and further increase travel times.
Demand for High-Quality (Fast and Reliable) Transit Service: The Study Area consists largely of transit supportive land uses that attract a high volume of transit trips from both within the Study Area and the entire region. Despite existing high levels of transit use, transit ridership is constrained by slow speeds, circuitous travel routes, high travel times, and unreliability due to congestion.
Transit Dependency: The Study Area has a significant proportion of transit-dependent residents. Transit-dependent residents are disproportionately impacted by long travel times and crowding on the existing transit system. The Crenshaw Northern Extension Project has the potential to address these mobility challenges by providing reliable, high-speed and high-capacity transit service that serves as a critical link in the regional transit network, enhancing mobility both within the Study Area and the broader region, particularly to the north (San Fernando Valley/North County) and south (South LA, LAX, and South Bay).

ES-7
Mobility Problem: Transit Network
Transit options within the Study Area are limited to east-west rail service and buses that operate on congested roadways. This leaves the Study Area with a network deficiency that impacts regional mobility and local access by creating unnecessarily long and circuitous trips caused by the need to transfer in Downtown Los Angeles to travel to, through, and within the Study Area. The addition of a north-south transit line in the Study Area has the potential to (1) effectively serve local population, employment, and activity centers within the Study Area, and (2) form part of a well-connected transit system for regional transit users travelling to or through the Study Area.
The Study Area is located on a major east-west, employment-rich axis (the Wilshire Corridor), which connects Downtown LA and the
Westside. This jobs-rich corridor attracts hundreds of thousands of daily trips from the Study Area and entire region. A connection is needed through the Study Area to link transit trips from the north and south conveniently to the Wilshire corridor without detouring through Downtown LA.
The project would close a gap in the regional network by linking the Metro Red, Purple and Expo Lines, and leveraging the high-volume east-west network to facilitate new north-south connections, including higher demand for the under construction Crenshaw line (Figure ES - 9).
Figure ES - 9 Potential North-South Connectivity

ES-8
Mobility Problem: Travel Demand
Travel demand is projected to increase for trips within, to and from the Study Area, which will be inhibited by continually increasing congestion.
The high population and employment densities result in high demand for travel within, to, and from the Study Area. On an average weekday, roughly 64,000 round-trips occur within the Study Area, but the 209,000 round-trips that leave and nearly 261,000 round-trips that enter the Study Area show the significantly greater regional demand (Figure ES - 10). Heavy north-south travel demand to the Study Area is indicated by the more than 80,000 weekday round-trips that are made from the South Bay and over 110,000 weekday round-trips from the San Fernando Valley to the Study Area.
Seven out of the ten highest-ridership Metro bus routes travel through the Study Area (Figure ES - 11), indicating high existing transit demand. The highest bus-stop activity occurs at major transfer points between east-west and north-south services. Significant transit capacity for east-west routes will be added with the Purple Line extension which is expected to increase transit ridership in the Study Area and facilitate east-west travel along the Wilshire Boulevard corridor, resulting in an even greater need for north-south connections.
The Crenshaw Northern Extension project would provide a high-capacity, grade-separated transit service to meet growing travel demand.
Figure ES - 10 Study Area Travel Market (2012)
Figure ES - 11 Metro Bus Routes with Top Daily Ridership in the Study Area
6 of Metro’s top 10 highest ridership bus routes traverse the Study Area which would be strengthened by additional connections to the regional rail network.

ES-9
Mobility Problem: Congestion & Transit Reliability
Travel times within the Study Area are high, negatively influencing commuters’ willingness to use transit and disproportionately impacting those dependent on transit service.
Arterial bus service throughout the Study Area is generally frequent, with good geographic coverage. However, this service is increasingly slow and unpredictable: bus travel speeds average below 10 miles per hour throughout the day on major arterials within the Study Area, with the lowest average speed at around 7 miles per hour during PM peak hours. The resulting decreased transit level of service is primarily due to the high roadway congestion in the Study Area.
According to the Westside Cities and Central Los Angeles Arterial Performance Baseline Conditions Analysis (2017) conducted by Metro, many of the above mentioned key arterials in the Study Area are on the list of the 10 worst-performing corridors in jurisdictions within Central L.A. and Westside Cities Sub-regions(Figure ES - 12). For example, the average travel speeds on Santa Monica Boulevard, La Brea Avenue and Melrose Avenue are all less than 15 miles per hour during PM peak hour2, the result of intense delays. Sunset Boulevard within the City of West Hollywood, as well as Santa Monica Boulevard and La Cienega Boulevard within the City of Los Angeles are among the 10 least reliable segments due to their severe congestion during the PM peak hour3. This is another indicator that surface streets in the Study Area experience poor travel time reliability, suggesting a need for transportation improvements that offer an alternative to congestion.
The project must increase the efficiency and convenience of transit trips by providing faster, more reliable service in an exclusive guideway that is not affected by local roadway congestion.
2 Westside Cities and Central LA Arterial Performance Baseline Conditions Analysis Reports, Exhibit 3.8 3 Westside Cities and Central LA Arterial Performance Baseline Conditions Analysis Reports, Exhibit 3.17
Figure ES - 12 5PM Hour Speeds on Central Los Angeles and Westside Subregions
ES-10
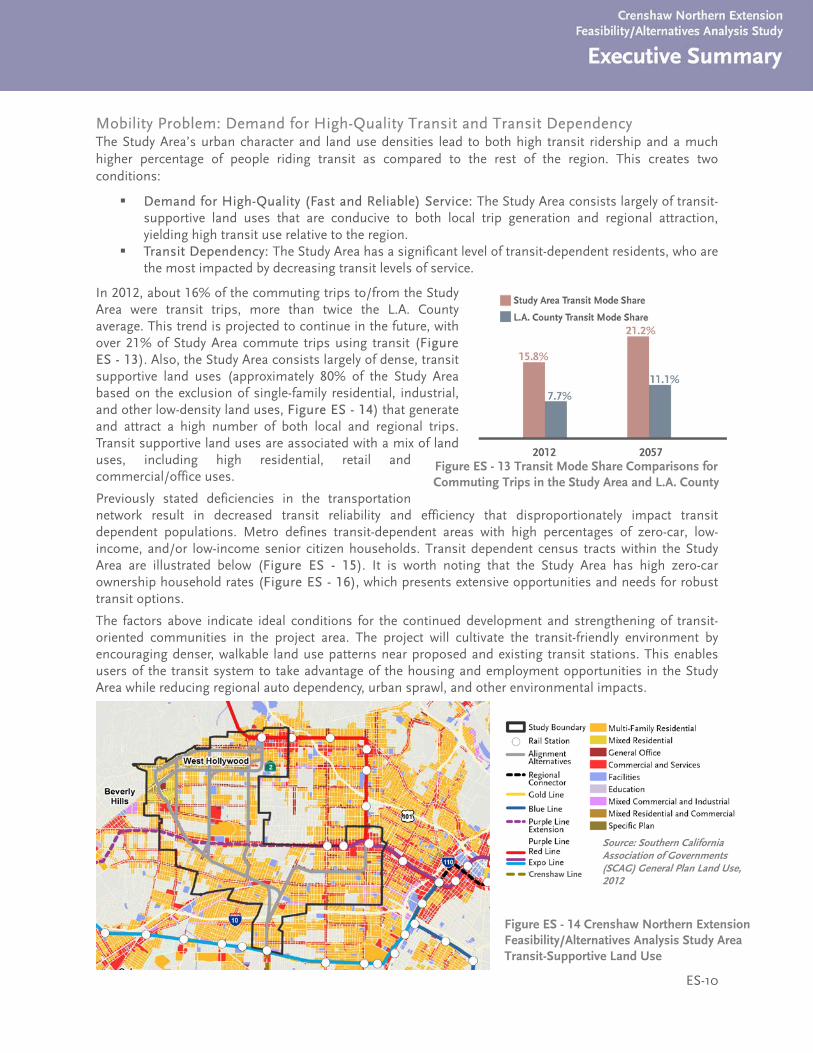
Figure ES - 13 Transit Mode Share Comparisons for Commuting Trips in the Study Area and L.A. County
Mobility Problem: Demand for High-Quality Transit and Transit Dependency The Study Area’s urban character and land use densities lead to both high transit ridership and a much higher percentage of people riding transit as compared to the rest of the region. This creates two conditions:
Demand for High-Quality (Fast and Reliable) Service: The Study Area consists largely of transit-supportive land uses that are conducive to both local trip generation and regional attraction, yielding high transit use relative to the region.
Transit Dependency: The Study Area has a significant level of transit-dependent residents, who are the most impacted by decreasing transit levels of service.
In 2012, about 16% of the commuting trips to/from the Study Area were transit trips, more than twice the L.A. County average. This trend is projected to continue in the future, with over 21% of Study Area commute trips using transit (Figure ES - 13). Also, the Study Area consists largely of dense, transit supportive land uses (approximately 80% of the Study Area based on the exclusion of single-family residential, industrial, and other low-density land uses, Figure ES - 14) that generate and attract a high number of both local and regional trips. Transit supportive land uses are associated with a mix of land uses, including high residential, retail and commercial/office uses.
Previously stated deficiencies in the transportation network result in decreased transit reliability and efficiency that disproportionately impact transit dependent populations. Metro defines transit-dependent areas with high percentages of zero-car, low-income, and/or low-income senior citizen households. Transit dependent census tracts within the Study Area are illustrated below (Figure ES - 15). It is worth noting that the Study Area has high zero-car ownership household rates (Figure ES - 16), which presents extensive opportunities and needs for robust transit options.
The factors above indicate ideal conditions for the continued development and strengthening of transit-oriented communities in the project area. The project will cultivate the transit-friendly environment by encouraging denser, walkable land use patterns near proposed and existing transit stations. This enables users of the transit system to take advantage of the housing and employment opportunities in the Study Area while reducing regional auto dependency, urban sprawl, and other environmental impacts.
Figure ES - 14 Crenshaw Northern Extension Feasibility/Alternatives Analysis Study Area Transit-Supportive Land Use
Source: Southern California Association of Governments (SCAG) General Plan Land Use, 2012
Crenshaw Line

ES-11
Figure ES - 15 Crenshaw Northern Extension Study Area Transit Dependency by Census Tract
Figure ES - 16 Crenshaw Northern Extension Study Area Percentage of Zero-Car Ownership Households by Census Tract

ES-12
Definition of Alternatives As previously mentioned, this Study builds upon alignments studied in the Wilshire/La Brea LRT Extension Feasibility Study (2009) with the following four route alternatives that extend from Expo/Crenshaw to Hollywood/Highland (Figure ES - 17):
San Vicente Boulevard: Mid-City to Hollywood/Highland via San Vicente Blvd. and Santa Monica Blvd.
La Cienega Boulevard: Mid-City to Hollywood/Highland via San Vicente Blvd., La Cienega Blvd., and Santa Monica Blvd.
Fairfax Avenue: Mid-City to Hollywood/Highland via San Vicente Blvd., Fairfax Ave., and Santa Monica Blvd.
La Brea Avenue: Mid-City to Hollywood/Highland via La Brea Avenue.
A fifth route, the Vermont Avenue alternative, from Crenshaw Boulevard to Wilshire/Vermont via
Olympic Boulevard and Vermont Avenue, was added to the study because it offers the shortest connection to both the Red and Purple Lines at the Wilshire/Vermont station. All other alternatives connect to the Metro Purple Line along Wilshire Boulevard and the Metro Red Line at the Hollywood/ Highland Station.
With the alternative routes established, cost-effective alignment configurations were developed that would accommodate reliable transit service while maximizing use of at- or above-ground guideway. This was accomplished by exploring opportunities where, based on existing physical conditions, the guideway could fit within existing roadways without major impacts. Guideway alignment options were created based on existing street right-of-way, traffic conditions, track geometry, and other engineering criteria (Figure ES - 17), then further refined considering operations, environmental impacts, urban design issues, and stakeholder feedback.
The first step was to determine whether an existing corridor could physically support an aerial or at-grade guideway (Figure ES-18, ES-19). At-grade or aerial guideway is preferable where possible because the capital cost for constructing an underground alignment can be 2.5 to over 3 times greater. Then, track geometry concepts were developed for transitions between vertical profiles to create complete alignment alternatives (Figure ES-20). While the alternatives defined reflect the guideway configurations that the project team determined to be the most feasible options, additional study is still required to further define the feasibility of at-grade operation based on Metro’s Grade Crossing and Safety Policy.
Figure ES - 17 Crenshaw Northern Extension Feasibility/Alternatives Analysis Study Universe of Alternatives

ES-13
Figure ES - 18 – Alignment Constraints: Right-of-Way and Required Grade Separations at Congested Intersections
60 - 75 ft. curb-curb: Aerial profile may be feasible with minor impacts to existing right-of-way, street section, and/or adjacent properties
80+ ft. curb-curb: At-grade and aerial profiles may be feasible within right-of-way and/or street section
< 60 ft. curb-curb: Tunnel alignment: at-grade or aerial infeasible without major impacts to existing right-of-way, street section, and/or adjacent properties
Figure ES - 19 Right-of-Way and Vertical Profile Configurations
ES-14
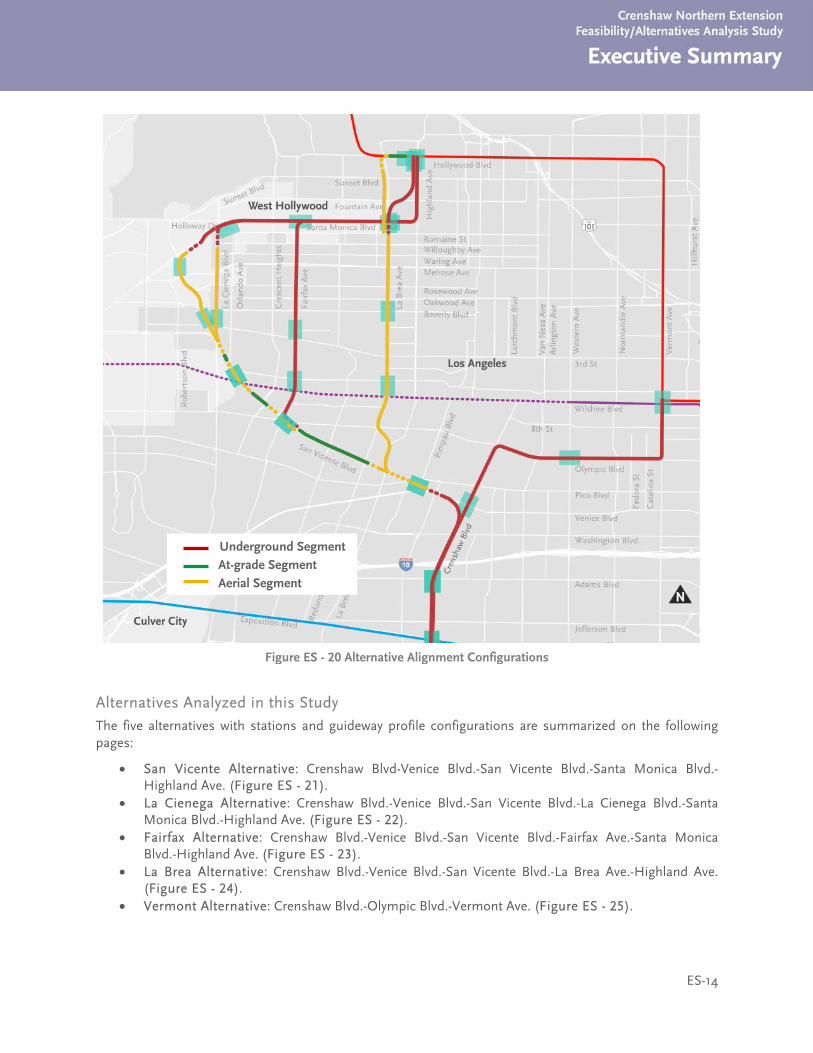
Alternatives Analyzed in this Study
The five alternatives with stations and guideway profile configurations are summarized on the following pages:
• San Vicente Alternative: Crenshaw Blvd-Venice Blvd.-San Vicente Blvd.-Santa Monica Blvd.-Highland Ave. (Figure ES - 21).
• La Cienega Alternative: Crenshaw Blvd.-Venice Blvd.-San Vicente Blvd.-La Cienega Blvd.-Santa Monica Blvd.-Highland Ave. (Figure ES - 22).
• Fairfax Alternative: Crenshaw Blvd.-Venice Blvd.-San Vicente Blvd.-Fairfax Ave.-Santa Monica Blvd.-Highland Ave. (Figure ES - 23).
• La Brea Alternative: Crenshaw Blvd.-Venice Blvd.-San Vicente Blvd.-La Brea Ave.-Highland Ave. (Figure ES - 24).
• Vermont Alternative: Crenshaw Blvd.-Olympic Blvd.-Vermont Ave. (Figure ES - 25).
Figure 20 – Proposed Alignment Configurations Based on Constraints
Underground Segment At-grade Segment Aerial Segment
Figure ES - 20 Alternative Alignment Configurations
ES-15
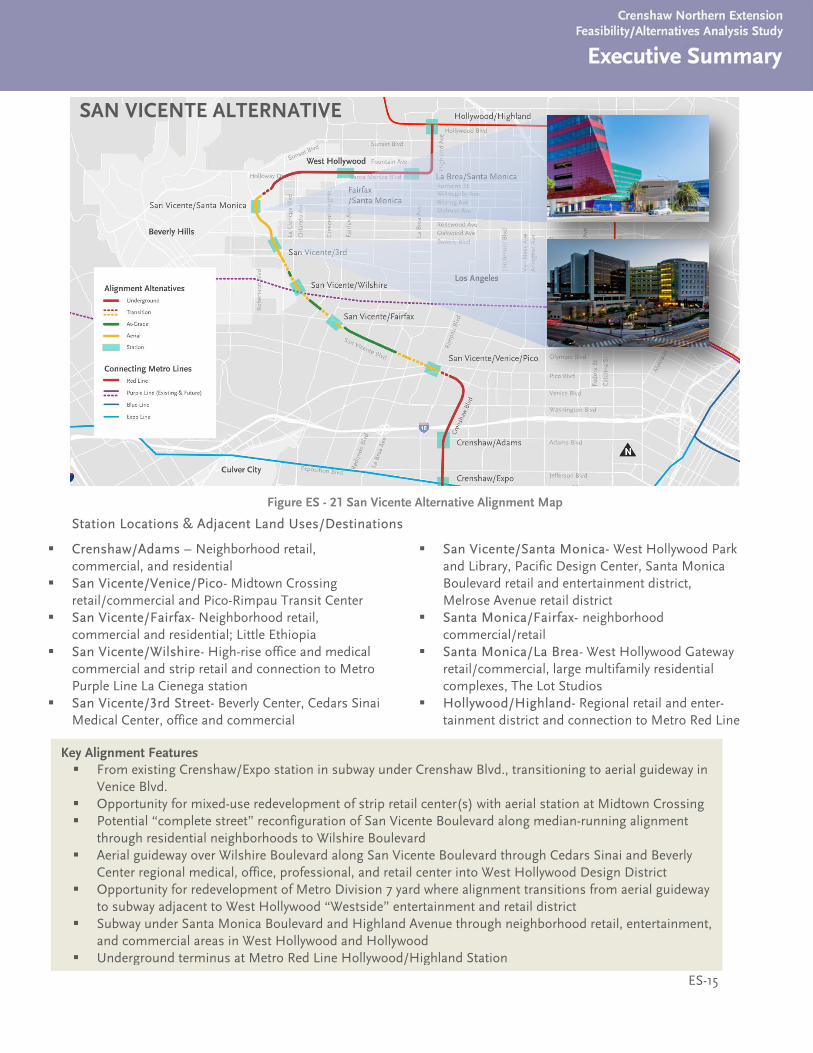
Station Locations & Adjacent Land Uses/Destinations
Crenshaw/Adams – Neighborhood retail, commercial, and residential
San Vicente/Venice/Pico- Midtown Crossing retail/commercial and Pico-Rimpau Transit Center
San Vicente/Fairfax- Neighborhood retail, commercial and residential; Little Ethiopia
San Vicente/Wilshire- High-rise office and medical commercial and strip retail and connection to Metro Purple Line La Cienega station
San Vicente/3rd Street- Beverly Center, Cedars Sinai Medical Center, office and commercial
San Vicente/Santa Monica- West Hollywood Park and Library, Pacific Design Center, Santa Monica Boulevard retail and entertainment district, Melrose Avenue retail district
Santa Monica/Fairfax- neighborhood commercial/retail
Santa Monica/La Brea- West Hollywood Gateway retail/commercial, large multifamily residential complexes, The Lot Studios
Hollywood/Highland- Regional retail and enter- tainment district and connection to Metro Red Line
Key Alignment Features From existing Crenshaw/Expo station in subway under Crenshaw Blvd., transitioning to aerial guideway in
Venice Blvd. Opportunity for mixed-use redevelopment of strip retail center(s) with aerial station at Midtown Crossing Potential “complete street” reconfiguration of San Vicente Boulevard along median-running alignment
through residential neighborhoods to Wilshire Boulevard Aerial guideway over Wilshire Boulevard along San Vicente Boulevard through Cedars Sinai and Beverly
Center regional medical, office, professional, and retail center into West Hollywood Design District Opportunity for redevelopment of Metro Division 7 yard where alignment transitions from aerial guideway
to subway adjacent to West Hollywood “Westside” entertainment and retail district Subway under Santa Monica Boulevard and Highland Avenue through neighborhood retail, entertainment,
and commercial areas in West Hollywood and Hollywood Underground terminus at Metro Red Line Hollywood/Highland Station
Figure ES - 21 San Vicente Alternative Alignment Map
SAN VICENTE ALTERNATIVE

ES-16
Station Locations & Adjacent Land Uses/Destinations
• Crenshaw/Adams – Neighborhood retail, commercial, and residential
• San Vicente/Venice/Pico- Midtown Crossing retail/ commercial and Pico-Rimpau bus transfer center
• San Vicente/Fairfax- Neighborhood retail, commercial and residential; Little Ethiopia
• San Vicente/Wilshire- High-rise office and medical commercial and strip retail and connection to Metro Purple Line La Cienega station
• La Cienega/3rd Street- Beverly Center, Cedars Sinai Medical Center, office and commercial
• La Cienega/Santa Monica- Santa Monica Boulevard neighborhood retail and entertainment district, Sunset Strip
• Santa Monica/Fairfax- neighborhood commercial/retail
• Santa Monica/La Brea- West Hollywood Gateway retail/commercial, large multifamily residential complexes, The Lot Studios
• Hollywood/Highland- Regional retail and enter- tainment district and connection to Metro Red Line
Key Alignment Features From existing Crenshaw/Expo station in subway under Crenshaw Blvd., transitioning to aerial
guideway in Venice Blvd. Opportunity for mixed-use redevelopment of strip retail center(s) with aerial station at Midtown
Crossing Potential “complete street” reconfiguration of San Vicente Boulevard along median-running
alignment through residential neighborhoods to Wilshire Boulevard Aerial guideway from Wilshire Boulevard along San Vicente and La Cienega Boulevards through
Cedars Sinai and Beverly Center regional medical, office, professional, and retail center Transition from aerial to subway on La Cienega Boulevard just south of Santa Monica Boulevard Subway under Santa Monica Boulevard and Highland Avenue through neighborhood retail and
commercial areas in West Hollywood and Hollywood Underground terminus at Metro Red Line Hollywood/Highland Station
LA CIENEGA ALTERNATIVE
Figure ES - 22 La Cienega Alternative Alignment Map
ES-17
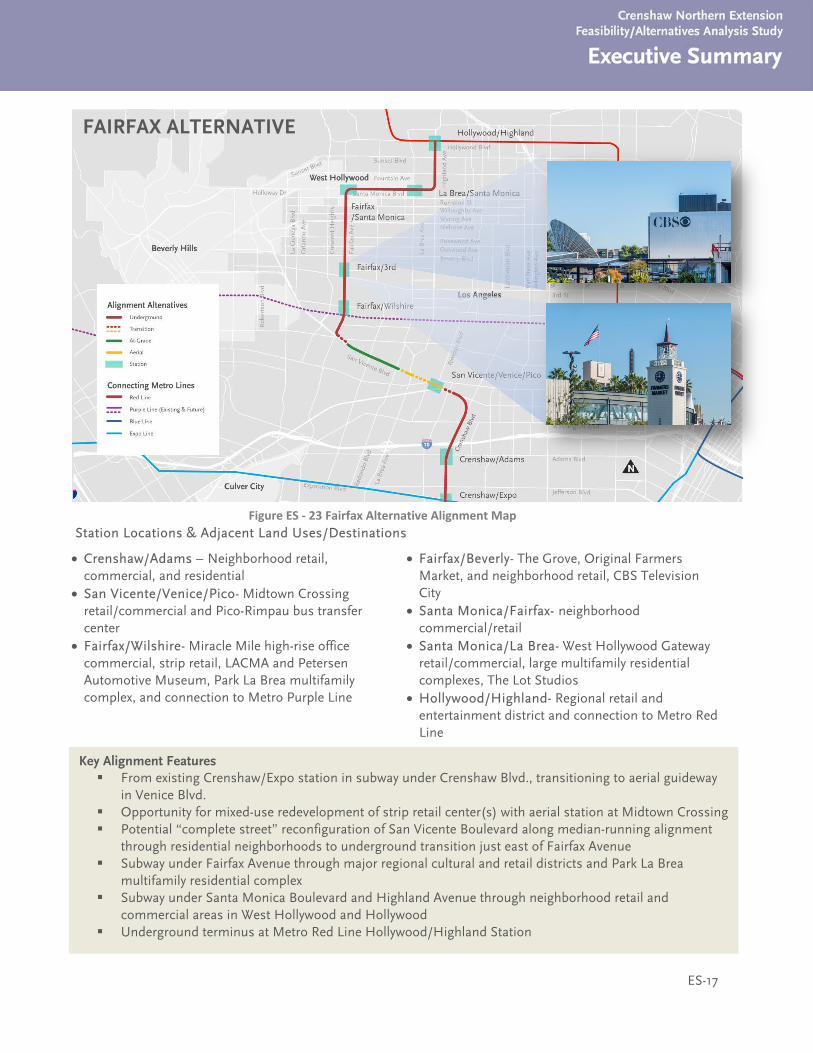
Station Locations & Adjacent Land Uses/Destinations
• Crenshaw/Adams – Neighborhood retail, commercial, and residential
• San Vicente/Venice/Pico- Midtown Crossing retail/commercial and Pico-Rimpau bus transfer center
• Fairfax/Wilshire- Miracle Mile high-rise office commercial, strip retail, LACMA and Petersen Automotive Museum, Park La Brea multifamily complex, and connection to Metro Purple Line
• Fairfax/Beverly- The Grove, Original Farmers Market, and neighborhood retail, CBS Television City
• Santa Monica/Fairfax- neighborhood commercial/retail
• Santa Monica/La Brea- West Hollywood Gateway retail/commercial, large multifamily residential complexes, The Lot Studios
• Hollywood/Highland- Regional retail and entertainment district and connection to Metro Red Line
FAIRFAX ALTERNATIVE
Figure ES - 23 Fairfax Alternative Alignment Map
Key Alignment Features From existing Crenshaw/Expo station in subway under Crenshaw Blvd., transitioning to aerial guideway
in Venice Blvd. Opportunity for mixed-use redevelopment of strip retail center(s) with aerial station at Midtown Crossing Potential “complete street” reconfiguration of San Vicente Boulevard along median-running alignment
through residential neighborhoods to underground transition just east of Fairfax Avenue Subway under Fairfax Avenue through major regional cultural and retail districts and Park La Brea
multifamily residential complex Subway under Santa Monica Boulevard and Highland Avenue through neighborhood retail and
commercial areas in West Hollywood and Hollywood Underground terminus at Metro Red Line Hollywood/Highland Station
ES-18
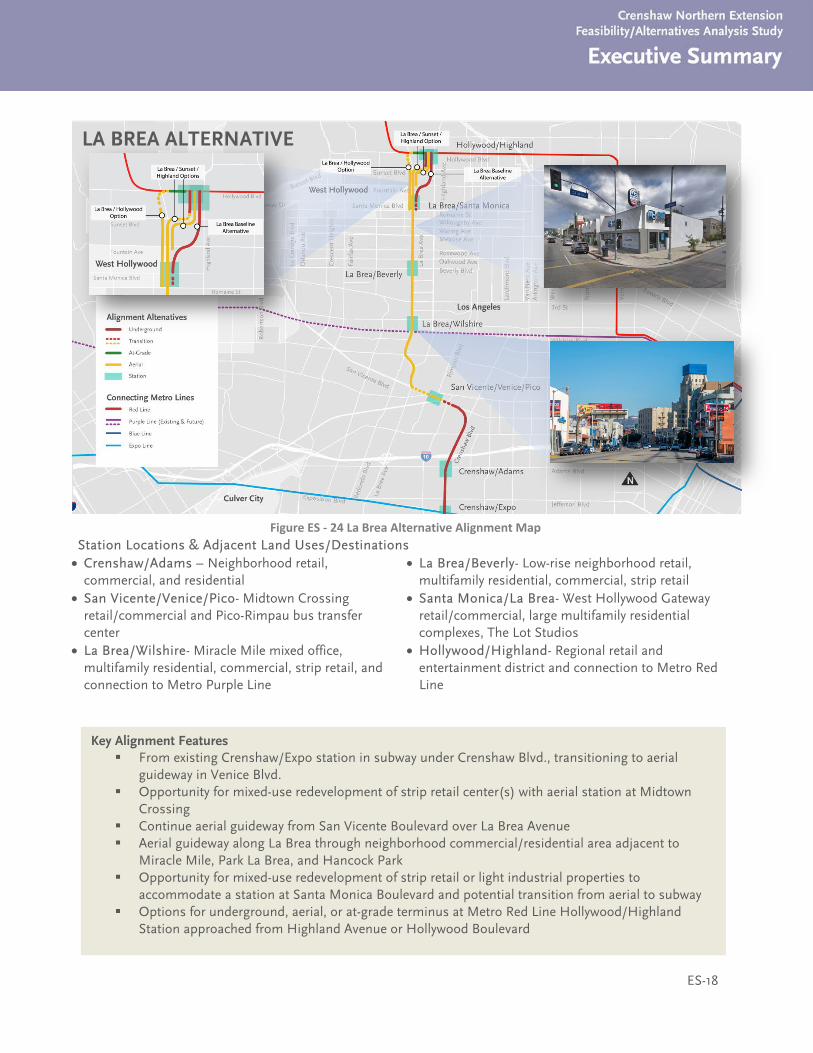
Station Locations & Adjacent Land Uses/Destinations • Crenshaw/Adams – Neighborhood retail,
commercial, and residential • San Vicente/Venice/Pico- Midtown Crossing
retail/commercial and Pico-Rimpau bus transfer center
• La Brea/Wilshire- Miracle Mile mixed office, multifamily residential, commercial, strip retail, and connection to Metro Purple Line
• La Brea/Beverly- Low-rise neighborhood retail, multifamily residential, commercial, strip retail
• Santa Monica/La Brea- West Hollywood Gateway retail/commercial, large multifamily residential complexes, The Lot Studios
• Hollywood/Highland- Regional retail and entertainment district and connection to Metro Red Line
Key Alignment Features Tunnel under residential neighborhoods from existing Crenshaw/Expo station to Midtown Crossing
(San Vicente/Venice/Pico) Opportunity for mixed-use redevelopment of strip retail center(s) with station and alignment
transition at Midtown Crossing Median-running opportunity for “complete street” reconfiguration of San Vicente Boulevard
through residential neighborhoods to transition underground at Fairfax Avenue Tunnel under Fairfax Avenue through major regional cultural and retail districts, and alongside Park
La Brea multifamily residential complex Tunnel under Santa Monica Boulevard and Highland Avenue through neighborhood retail and
commercial areas in West Hollywood and Hollywood Underground terminus at Metro Red Line Hollywood/Highland Station
Key Alignment Features From existing Crenshaw/Expo station in subway under Crenshaw Blvd., transitioning to aerial
guideway in Venice Blvd. Opportunity for mixed-use redevelopment of strip retail center(s) with aerial station at Midtown
Crossing Continue aerial guideway from San Vicente Boulevard over La Brea Avenue Aerial guideway along La Brea through neighborhood commercial/residential area adjacent to
Miracle Mile, Park La Brea, and Hancock Park Opportunity for mixed-use redevelopment of strip retail or light industrial properties to
accommodate a station at Santa Monica Boulevard and potential transition from aerial to subway Options for underground, aerial, or at-grade terminus at Metro Red Line Hollywood/Highland
Station approached from Highland Avenue or Hollywood Boulevard
LA BREA ALTERNATIVE
Figure ES - 24 La Brea Alternative Alignment Map
ES-19
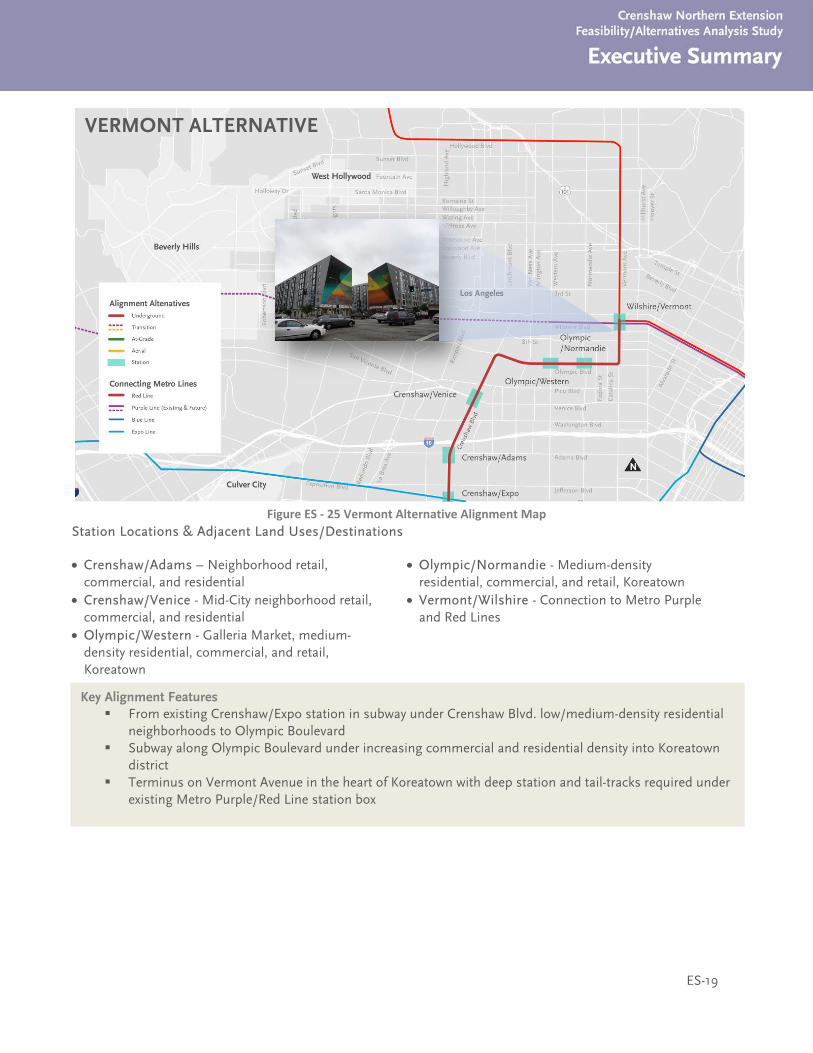
Station Locations & Adjacent Land Uses/Destinations
• Crenshaw/Adams – Neighborhood retail,commercial, and residential
• Crenshaw/Venice - Mid-City neighborhood retail,commercial, and residential
• Olympic/Western - Galleria Market, medium-density residential, commercial, and retail,Koreatown
• Olympic/Normandie - Medium-densityresidential, commercial, and retail, Koreatown
• Vermont/Wilshire - Connection to Metro Purpleand Red Lines
Key Alignment Features From existing Crenshaw/Expo station in subway under Crenshaw Blvd. low/medium-density residential
neighborhoods to Olympic Boulevard Subway along Olympic Boulevard under increasing commercial and residential density into Koreatown
district Terminus on Vermont Avenue in the heart of Koreatown with deep station and tail-tracks required under
existing Metro Purple/Red Line station box
VERMONT ALTERNATIVE
Figure ES - 25 Vermont Alternative Alignment Map

ES-27
Performance of Alternatives The alternatives definition effort results in five representative alignments which were evaluated against the following criteria:
• Ridership• User Benefit/Travel Time Savings• Vehicle Miles Traveled (VMT) Reduction• Cost Effectiveness• Environmental Impact
The five alternatives as defined are summarized below (Figure ES-26).
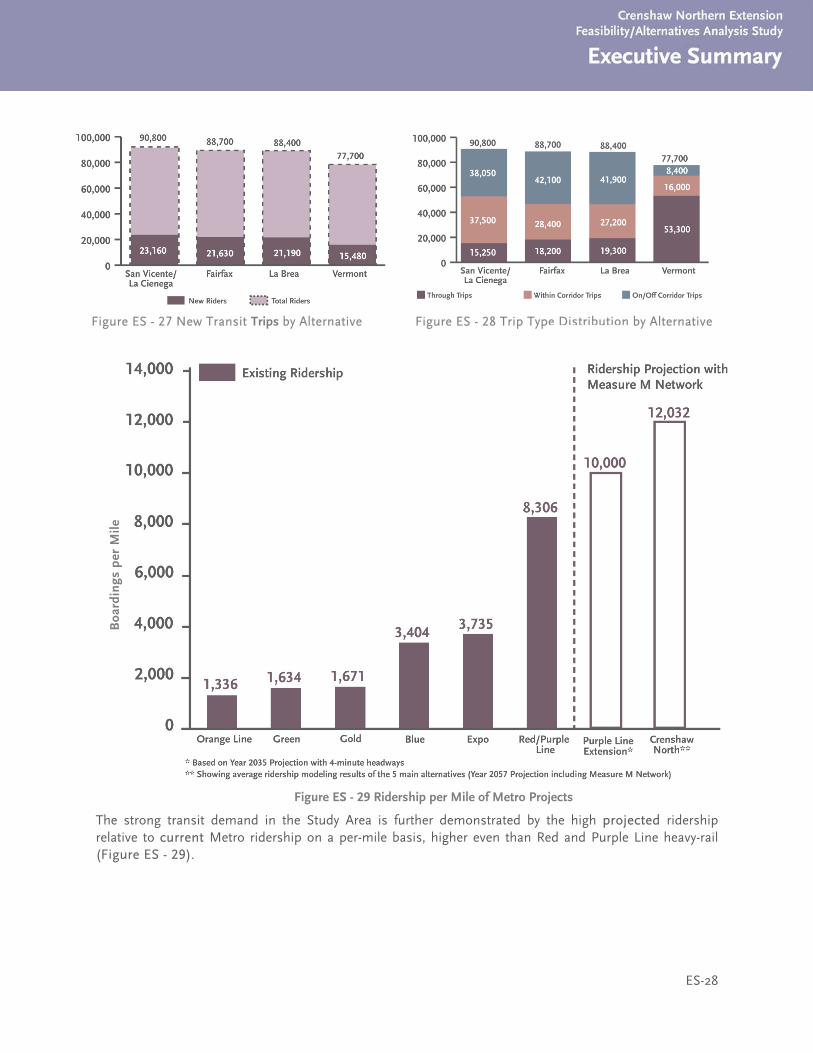
Ridership
The Crenshaw Northern Extension Alternatives are projected to have ridership ranging from 77,700 to 90,800 daily project boardings. 16% to 21% of those trips are taken by “new riders”, or trips that would not have used transit without the project (Figure ES - 27).
Alternatives with longer alignments and more stations generate a greater proportion of trips that begin and end within the project (local trips), while shorter alternatives with fewer stations generate a greater proportion of end-to-end “through” trips (Figure ES - 28). The Vermont Alternative produces the least ridership and fewest new riders, in addition to generating notably fewer trips to and from destinations along the route compared to the other alternatives.
Figure ES - 26 Summary of Alternatives Definition
*To Wilshire/Vermont Station only
ES-28
The strong transit demand in the Study Area is further demonstrated by the high projected ridership relative to current Metro ridership on a per-mile basis, higher even than Red and Purple Line heavy-rail (Figure ES - 29).
Figure ES - 29 Ridership per Mile of Metro Projects
Figure ES - 27 New Transit Trips by Alternative Figure ES - 28 Trip Type Distribution by Alternative
Boa
rdin
gs p
er M
ile
ES-29
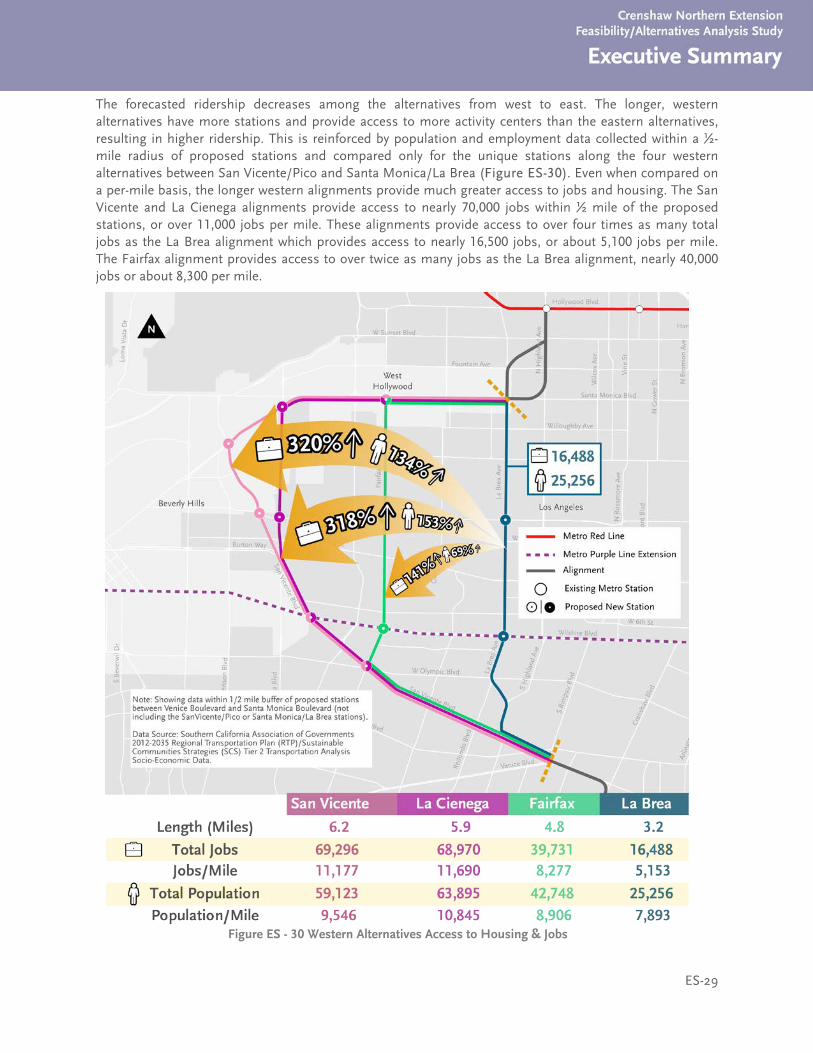
The forecasted ridership decreases among the alternatives from west to east. The longer, western alternatives have more stations and provide access to more activity centers than the eastern alternatives, resulting in higher ridership. This is reinforced by population and employment data collected within a ½-mile radius of proposed stations and compared only for the unique stations along the four western alternatives between San Vicente/Pico and Santa Monica/La Brea (Figure ES-30). Even when compared on a per-mile basis, the longer western alignments provide much greater access to jobs and housing. The San Vicente and La Cienega alignments provide access to nearly 70,000 jobs within ½ mile of the proposed stations, or over 11,000 jobs per mile. These alignments provide access to over four times as many total jobs as the La Brea alignment which provides access to nearly 16,500 jobs, or about 5,100 jobs per mile. The Fairfax alignment provides access to over twice as many jobs as the La Brea alignment, nearly 40,000 jobs or about 8,300 per mile.
Figure ES - 30 Western Alternatives Access to Housing & Jobs

ES-30
User Benefit (Time Savings)
All Crenshaw Northern Extension Alternatives analyzed in this Study would result in reduced transit travel times and improved transit service compared with existing conditions. Existing transit travel times between the Metro Expo/Crenshaw Station and Hollywood/Highland Station are approximately 45 minutes and include at least one transfer. Estimated end-to-end travel times on the alternatives range from 12 to 27 minutes (Figure ES - 26). The average travel time savings experienced for each rider on the project alternatives ranges from 17 minutes to 20 minutes (Figure ES - 31). The greater time savings for the western alternatives is a direct function of their higher ridership, and thus higher benefit.
Vehicle-Miles Reduction
All Crenshaw Northern Extension Alternatives analyzed in this Study would contribute to a substantial reduction in regional vehicle-miles travelled (VMT) by encouraging greater transit use. Among the five alternatives, La Brea Alternative will see the largest reduction of 383,930 VMT per year, followed by Fairfax Alternative with 358,888 miles of VMT reduction (Figure ES - 32).
The Vermont Alternative is the lowest performing of the project alternatives for several reasons:
• 70% of its ridership consists of through trips, which don’t serve origins and destinations within the Study Area that aren’t already served by the existing Metro Rail network
• The alignment is largely redundant with the existing rail system and all the western alignments, which connect riders to the Purple Line and Wilshire Blvd. corridor faster than via Vermont
• While this alternative shaves 1-2 minutes from existing travel times to points east (including Downtown LA, etc.), it imposes an over 8-minute penalty for trips between the Study Area and the Westside, as well as the San Fernando Valley (versus all other alternatives)
• This alignment does not serve any new neighborhoods or any areas that would not be served with any of the other alternatives and/or are already served by Metro Rail
Figure ES – 31 Travel Time Savings per Project Trip (mins)
Figure ES - 32 Annual VMT Reduction (miles)
ES-31
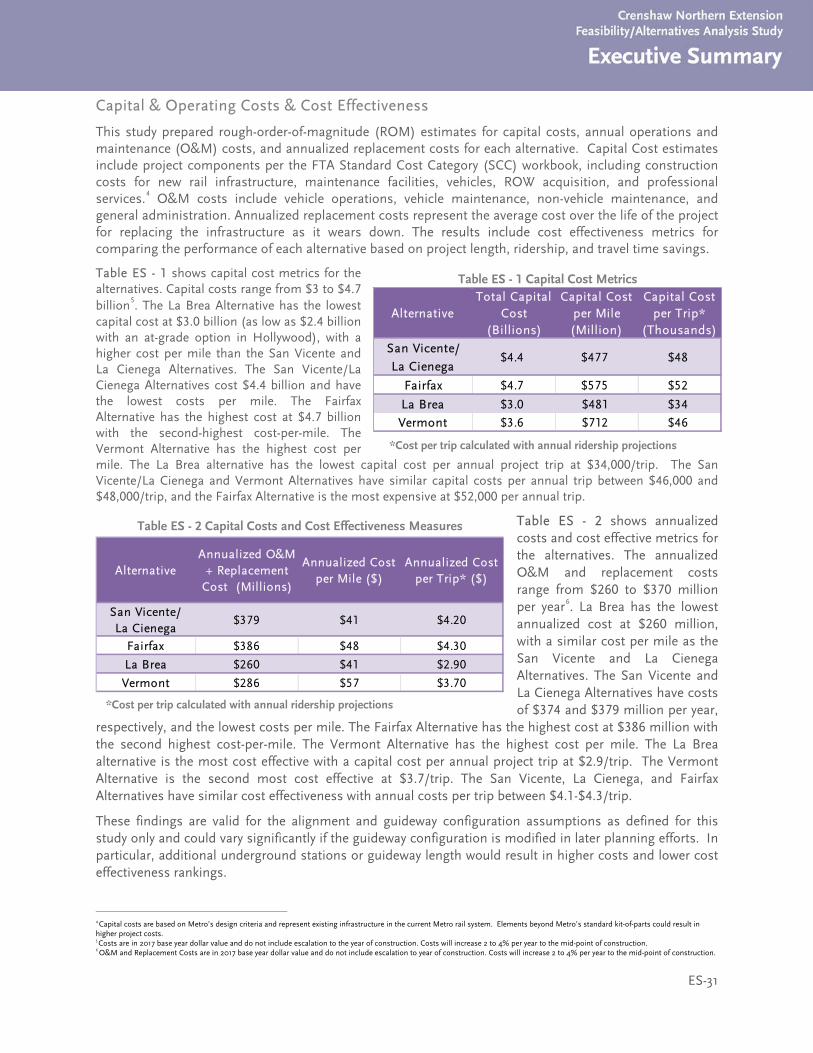
Capital & Operating Costs & Cost Effectiveness
This study prepared rough-order-of-magnitude (ROM) estimates for capital costs, annual operations and maintenance (O&M) costs, and annualized replacement costs for each alternative. Capital Cost estimates include project components per the FTA Standard Cost Category (SCC) workbook, including construction costs for new rail infrastructure, maintenance facilities, vehicles, ROW acquisition, and professional services.4 O&M costs include vehicle operations, vehicle maintenance, non-vehicle maintenance, and general administration. Annualized replacement costs represent the average cost over the life of the project for replacing the infrastructure as it wears down. The results include cost effectiveness metrics for comparing the performance of each alternative based on project length, ridership, and travel time savings.
Table ES - 1 shows capital cost metrics for the alternatives. Capital costs range from $3 to $4.7 billion5. The La Brea Alternative has the lowest capital cost at $3.0 billion (as low as $2.4 billion with an at-grade option in Hollywood), with a higher cost per mile than the San Vicente and La Cienega Alternatives. The San Vicente/La Cienega Alternatives cost $4.4 billion and have the lowest costs per mile. The Fairfax Alternative has the highest cost at $4.7 billion with the second-highest cost-per-mile. The Vermont Alternative has the highest cost per mile. The La Brea alternative has the lowest capital cost per annual project trip at $34,000/trip. The San Vicente/La Cienega and Vermont Alternatives have similar capital costs per annual trip between $46,000 and $48,000/trip, and the Fairfax Alternative is the most expensive at $52,000 per annual trip.
Table ES - 2 shows annualized costs and cost effective metrics for the alternatives. The annualized O&M and replacement costs range from $260 to $370 million per year6. La Brea has the lowest annualized cost at $260 million, with a similar cost per mile as the San Vicente and La Cienega Alternatives. The San Vicente and La Cienega Alternatives have costs of $374 and $379 million per year,
respectively, and the lowest costs per mile. The Fairfax Alternative has the highest cost at $386 million with the second highest cost-per-mile. The Vermont Alternative has the highest cost per mile. The La Brea alternative is the most cost effective with a capital cost per annual project trip at $2.9/trip. The Vermont Alternative is the second most cost effective at $3.7/trip. The San Vicente, La Cienega, and Fairfax Alternatives have similar cost effectiveness with annual costs per trip between $4.1-$4.3/trip.
These findings are valid for the alignment and guideway configuration assumptions as defined for this study only and could vary significantly if the guideway configuration is modified in later planning efforts. In particular, additional underground stations or guideway length would result in higher costs and lower cost effectiveness rankings.
4 Capital costs are based on Metro’s design criteria and represent existing infrastructure in the current Metro rail system. Elements beyond Metro’s standard kit-of-parts could result in higher project costs. 5 Costs are in 2017 base year dollar value and do not include escalation to the year of construction. Costs will increase 2 to 4% per year to the mid-point of construction. 6 O&M and Replacement Costs are in 2017 base year dollar value and do not include escalation to year of construction. Costs will increase 2 to 4% per year to the mid-point of construction.
Table ES - 1 Capital Cost Metrics
AlternativeTotal Capital
Cost (Billions)
Capital Cost per Mile (Million)
Capital Cost per Trip*
(Thousands)
San Vicente/
La Cienega
Fairfax $4.7 $575 $52
La Brea $3.0 $481 $34
Vermont $3.6 $712 $46
$4.4 $477 $48
*Cost per trip calculated with annual ridership projections
AlternativeAnnualized O&M
+ Replacement Cost (Millions)
Annualized Cost per Mile ($)
Annualized Cost per Trip* ($)
San Vicente/La Cienega
$379 $41 $4.20
Fairfax $386 $48 $4.30
La Brea $260 $41 $2.90
Vermont $286 $57 $3.70
Table ES - 2 Capital Costs and Cost Effectiveness Measures
*Cost per trip calculated with annual ridership projections
ES-32
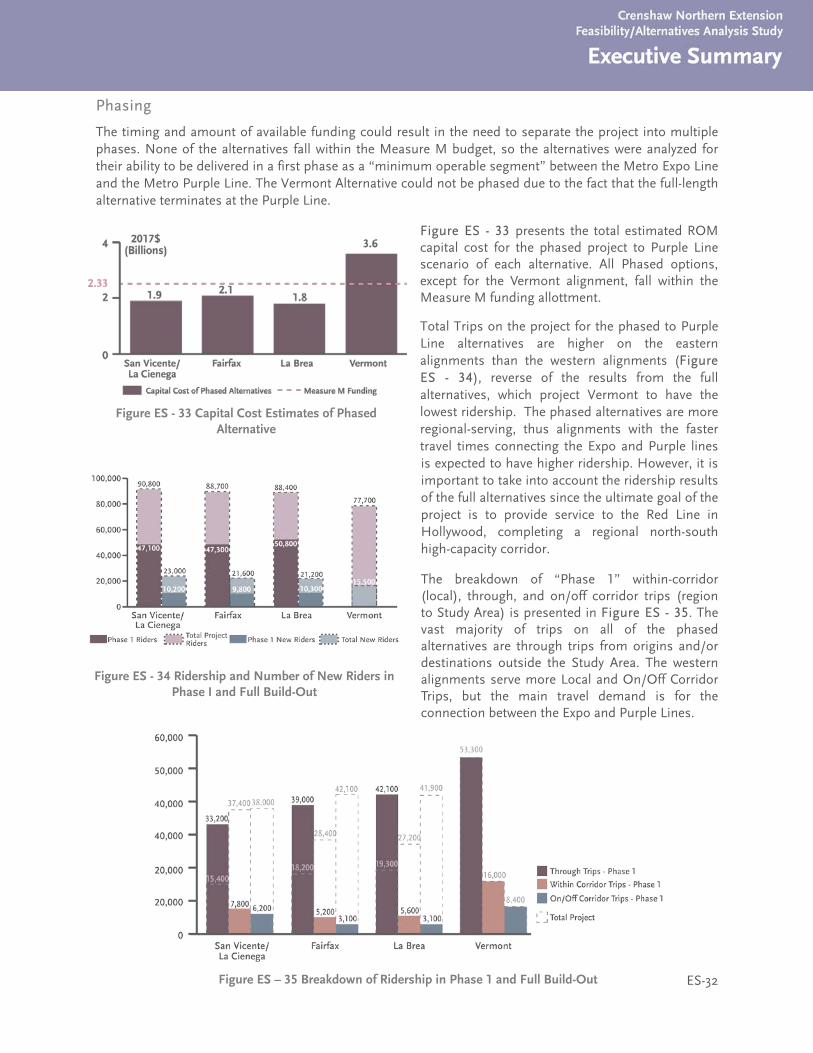
Phasing
The timing and amount of available funding could result in the need to separate the project into multiple phases. None of the alternatives fall within the Measure M budget, so the alternatives were analyzed for their ability to be delivered in a first phase as a “minimum operable segment” between the Metro Expo Line and the Metro Purple Line. The Vermont Alternative could not be phased due to the fact that the full-length alternative terminates at the Purple Line.
Figure ES - 33 presents the total estimated ROM capital cost for the phased project to Purple Line scenario of each alternative. All Phased options, except for the Vermont alignment, fall within the Measure M funding allottment.
Total Trips on the project for the phased to Purple Line alternatives are higher on the eastern alignments than the western alignments (Figure ES - 34), reverse of the results from the full alternatives, which project Vermont to have the lowest ridership. The phased alternatives are more regional-serving, thus alignments with the faster travel times connecting the Expo and Purple lines is expected to have higher ridership. However, it is important to take into account the ridership results of the full alternatives since the ultimate goal of the project is to provide service to the Red Line in Hollywood, completing a regional north-south high-capacity corridor.
The breakdown of “Phase 1” within-corridor (local), through, and on/off corridor trips (region to Study Area) is presented in Figure ES - 35. The vast majority of trips on all of the phased alternatives are through trips from origins and/or destinations outside the Study Area. The western alignments serve more Local and On/Off Corridor Trips, but the main travel demand is for the connection between the Expo and Purple Lines.
Figure ES - 34 Ridership and Number of New Riders in Phase I and Full Build-Out
Figure ES – 35 Breakdown of Ridership in Phase 1 and Full Build-Out
Figure ES - 33 Capital Cost Estimates of Phased Alternative
ES-33
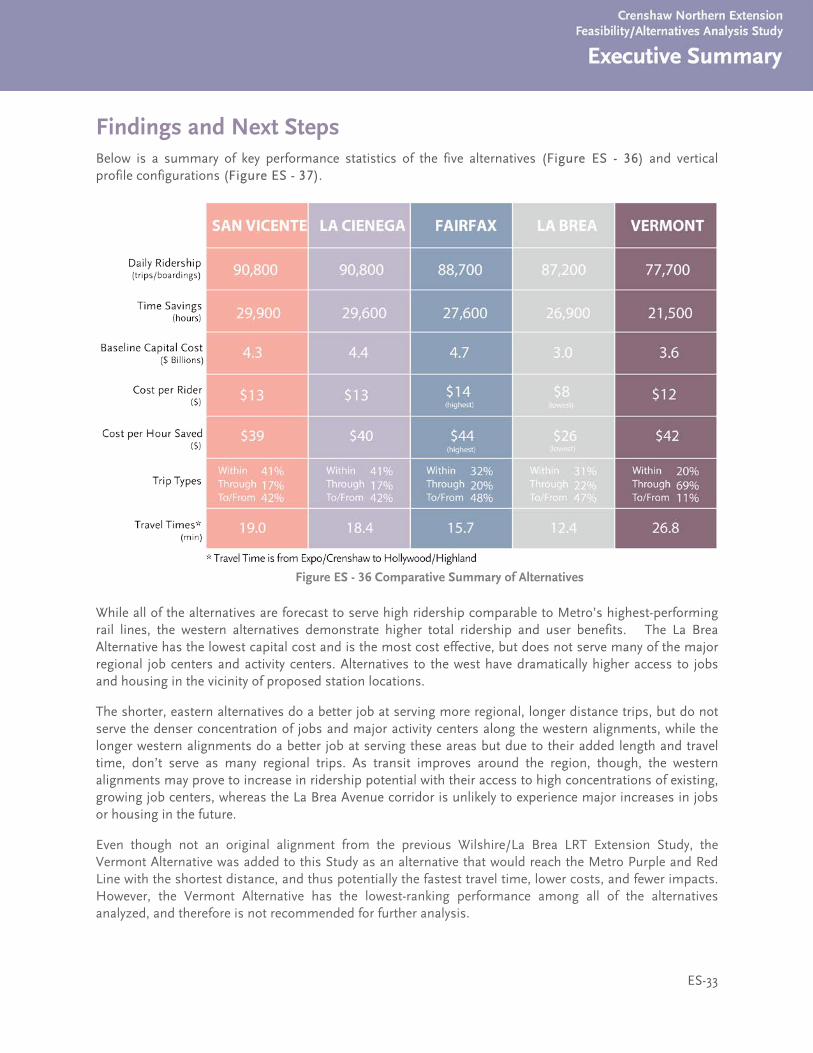
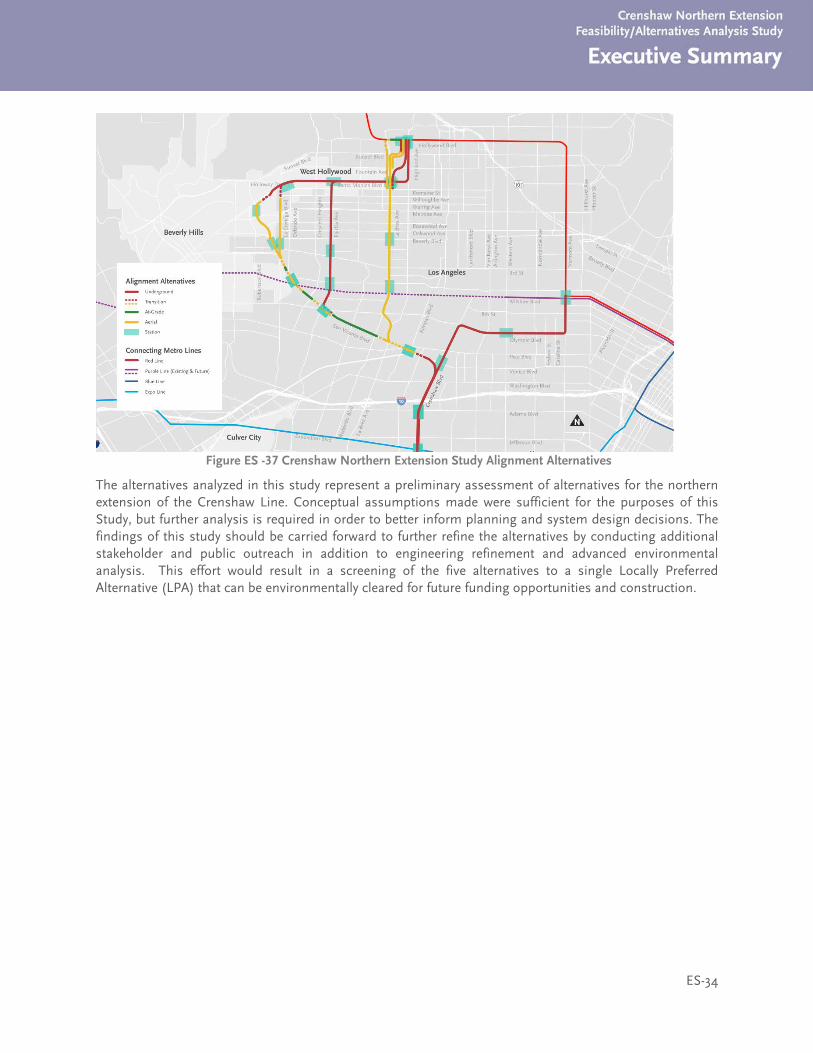
Findings and Next Steps Below is a summary of key performance statistics of the five alternatives (Figure ES - 36) and vertical profile configurations (Figure ES - 37).
While all of the alternatives are forecast to serve high ridership comparable to Metro’s highest-performing rail lines, the western alternatives demonstrate higher total ridership and user benefits. The La Brea Alternative has the lowest capital cost and is the most cost effective, but does not serve many of the major regional job centers and activity centers. Alternatives to the west have dramatically higher access to jobs and housing in the vicinity of proposed station locations.
The shorter, eastern alternatives do a better job at serving more regional, longer distance trips, but do not serve the denser concentration of jobs and major activity centers along the western alignments, while the longer western alignments do a better job at serving these areas but due to their added length and travel time, don’t serve as many regional trips. As transit improves around the region, though, the western alignments may prove to increase in ridership potential with their access to high concentrations of existing, growing job centers, whereas the La Brea Avenue corridor is unlikely to experience major increases in jobs or housing in the future.
Even though not an original alignment from the previous Wilshire/La Brea LRT Extension Study, the Vermont Alternative was added to this Study as an alternative that would reach the Metro Purple and Red Line with the shortest distance, and thus potentially the fastest travel time, lower costs, and fewer impacts. However, the Vermont Alternative has the lowest-ranking performance among all of the alternatives analyzed, and therefore is not recommended for further analysis.
Figure ES - 36 Comparative Summary of Alternatives
ES-34
The alternatives analyzed in this study represent a preliminary assessment of alternatives for the northern extension of the Crenshaw Line. Conceptual assumptions made were sufficient for the purposes of this Study, but further analysis is required in order to better inform planning and system design decisions. The findings of this study should be carried forward to further refine the alternatives by conducting additional stakeholder and public outreach in addition to engineering refinement and advanced environmental analysis. This effort would result in a screening of the five alternatives to a single Locally Preferred Alternative (LPA) that can be environmentally cleared for future funding opportunities and construction.
Figure ES -37 Crenshaw Northern Extension Study Alignment Alternatives