board of registered nursing education/licensing committee ... · pdf fileboard of registered...
TRANSCRIPT
BOARD OF REGISTERED NURSING Education/Licensing Committee
Agenda Item Summary
AGENDA ITEM: 7.1 DATE: February 11, 2016
ACTION REQUESTED: Vote On Whether To Ratify Minor Curriculum Revisions and
Acknowledge Receipt of Program Progress Report REQUESTED BY: Michael Jackson, MSN, RN Chairperson, Education/Licensing Committee BACKGROUND: According to Board policy, Nursing Education Consultants may approve minor curriculum changes that do not significantly alter philosophy, objectives, or content. Approvals must be reported to the Education/Licensing Committee and the Board. Minor Curriculum revisions include the following categories:
• Curriculum changes • Work Study programs • Preceptor programs • Public Health Nurse (PHN) certificate programs • Progress reports that are not related to continuing approval • Approved Nurse Practitioner program adding a category of specialization
The following programs have submitted minor curriculum revisions that have been approved by the NECs:
San Francisco State University Baccalaureate and Entry Level Master’s Degree Nursing Programs
Evergreen Valley College Associate Degree Nursing Program Kaplan College Associate Degree Nursing Program Santa Barbara City College Associate Degree Nursing Program University of San Diego Hahn School of Nursing and Beyster Institute for Nursing Research
Nurse Practitioner Program University of San Francisco Nurse Practitioner Program
Acknowledge Receipt of Program Progress Report: American University of Health Sciences Baccalaureate Degree Nursing Program California State University, San Marcos Baccalaureate Degree Nursing Program and ABSN Option University of San Diego Hahn School of Nursing and Beyster Institute for Nursing Research Entry
Level Master’s Degree Nursing Program, Nurse Practitioner Program, Clinical Nurse Specialist Program
United States University Entry Level Master’s Degree Nursing Program Cabrillo College Associate Degree Nursing Program Los Angeles Trade-Tech College Associate Degree Nursing Program Mt. San Jacinto, MVC Associate Degree Nursing Program Porterville College Associate Degree Nursing Program
NEXT STEP: Notify the programs of Board action. PERSON TO CONTACT: Leslie A. Moody, RN, MSN, MAEd Nursing Education Consultant

MINOR CURRICULUM REVISIONS Education/Licensing Committee
DATE: February 11, 2016
SCHOOL NAME APPROVED BY NEC
DATE APPROVED
SUMMARY OF CHANGES
San Francisco State University Baccalaureate and Entry Level Master’s Degree Nursing Program
S. Ward 12/18/2015 The program will separate theory and clinical nursing courses so that they have different course numbers without altering the course objectives, content, outcomes or methods of delivery. The clinical component of Advanced Medical Surgical and Critical Care Nursing Practicum (3 units) will be numbered either N521 or N523 depending on if a cohort or preceptorship model is used.
Evergreen Valley College Associate Degree Nursing Program
S. Engle 10/21/2015 Program submitted revised EDP-P-05 form to reflect that the program is 17.5 week semester with content delivered in 16 weeks. The units remain the same.
Kaplan College Associate Degree Nursing Program
L. Moody 11/19/2015 The program will change from enrolling 50 students 3 times per year to enrolling a cohort of 30-38 students approximately every 10 weeks beginning March 2016 in the following pattern: 2016: 4 starts – March 02-37 students, May 18-38 students, August 03-37 students, and October 19- 38 students. 2017: 5 starts – January 10-30 students, March 22-30 students, June 7-30 students, August 23-30 students, November 8-30 students. Subsequent years will have either 4 starts of 37/38 students or 5 starts with 30 students each depending on the cycle of ten-week quarters interspersed with break periods. This enrollment pattern will maintain and not exceed the currently approved enrollment level of 150 admissions per year. Faculty, clinical placements and classroom space have been evaluated to verify this pattern can be supported. Smaller cohort size will facilitate clinical placements, improve student learning experiences in the classroom setting, and align nursing program admission pattern with the general college to better integrate nursing students into the college community and experience.
Santa Barbara City College Associate Degree Nursing Program
C. Velas 10/26/2015 SBCC has had challenges getting all students scheduled for clinical hours in OB and Peds courses. Nursing 164-Nursing Care of Childbearing Families and Nursing 167-Pediatrics are currently 12 week courses that will extend to full 16 week semester courses effective Spring 2016. No units or content will change.
Page 1 of 2
MINOR CURRICULUM REVISIONS Education/Licensing Committee
DATE: February 11, 2016
SCHOOL NAME APPROVED BY NEC
DATE APPROVED
SUMMARY OF CHANGES
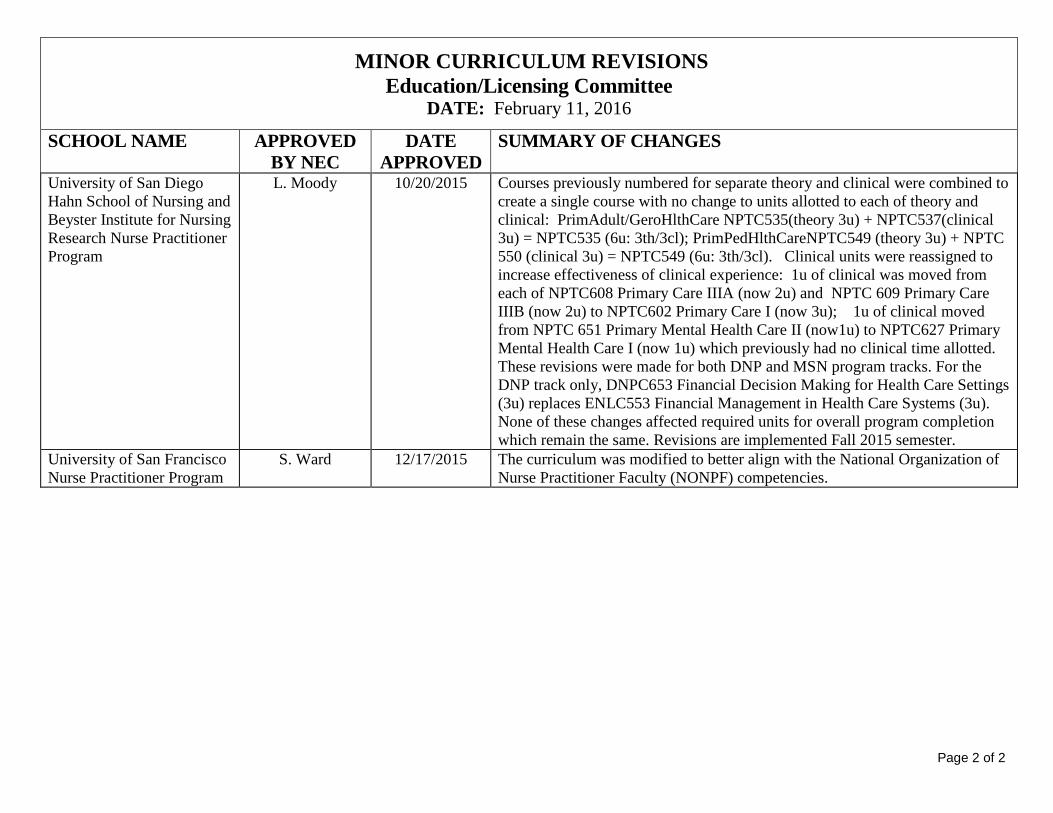
University of San Diego Hahn School of Nursing and Beyster Institute for Nursing Research Nurse Practitioner Program
L. Moody 10/20/2015 Courses previously numbered for separate theory and clinical were combined to create a single course with no change to units allotted to each of theory and clinical: PrimAdult/GeroHlthCare NPTC535(theory 3u) + NPTC537(clinical 3u) = NPTC535 (6u: 3th/3cl); PrimPedHlthCareNPTC549 (theory 3u) + NPTC 550 (clinical 3u) = NPTC549 (6u: 3th/3cl). Clinical units were reassigned to increase effectiveness of clinical experience: 1u of clinical was moved from each of NPTC608 Primary Care IIIA (now 2u) and NPTC 609 Primary Care IIIB (now 2u) to NPTC602 Primary Care I (now 3u); 1u of clinical moved from NPTC 651 Primary Mental Health Care II (now1u) to NPTC627 Primary Mental Health Care I (now 1u) which previously had no clinical time allotted. These revisions were made for both DNP and MSN program tracks. For the DNP track only, DNPC653 Financial Decision Making for Health Care Settings (3u) replaces ENLC553 Financial Management in Health Care Systems (3u). None of these changes affected required units for overall program completion which remain the same. Revisions are implemented Fall 2015 semester.
University of San Francisco Nurse Practitioner Program
S. Ward 12/17/2015 The curriculum was modified to better align with the National Organization of Nurse Practitioner Faculty (NONPF) competencies.
Page 2 of 2
MINOR CURRICULUM REVISIONS Education/Licensing Committee
DATE: February 11, 2016 SCHOOL NAME APPROVED
BY NEC DATE
APPROVED PROGRESS REPORT
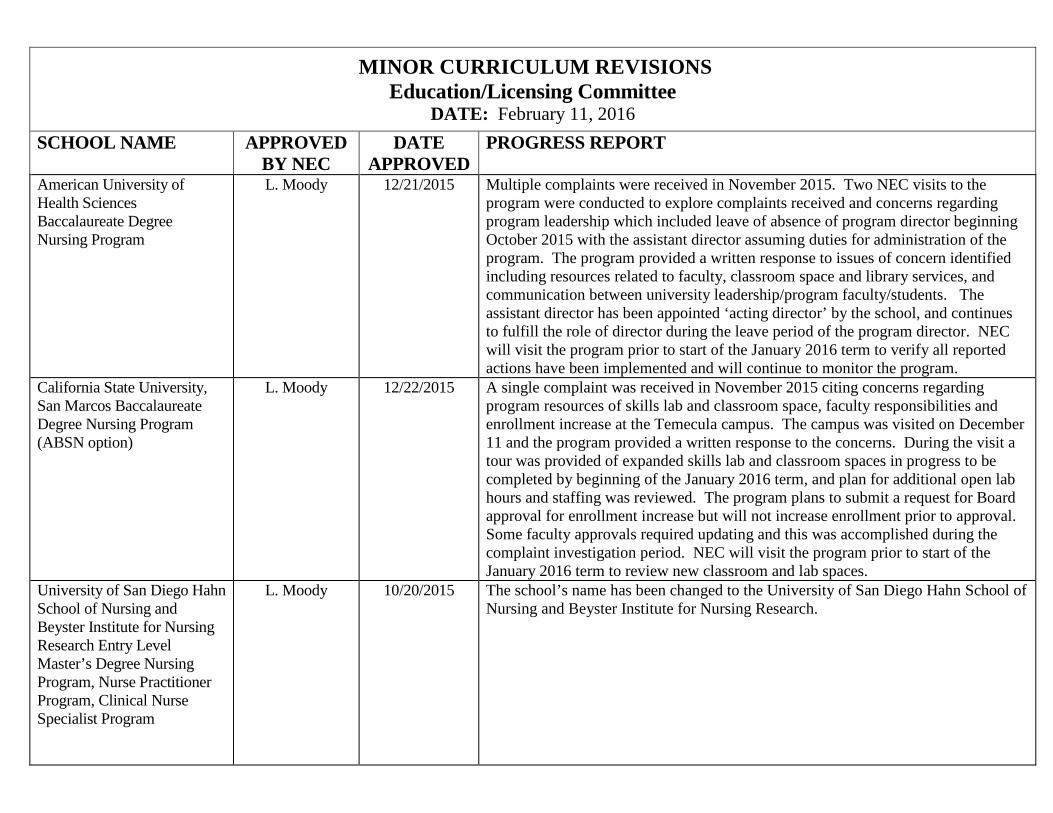
American University of Health Sciences Baccalaureate Degree Nursing Program
L. Moody 12/21/2015 Multiple complaints were received in November 2015. Two NEC visits to the program were conducted to explore complaints received and concerns regarding program leadership which included leave of absence of program director beginning October 2015 with the assistant director assuming duties for administration of the program. The program provided a written response to issues of concern identified including resources related to faculty, classroom space and library services, and communication between university leadership/program faculty/students. The assistant director has been appointed ‘acting director’ by the school, and continues to fulfill the role of director during the leave period of the program director. NEC will visit the program prior to start of the January 2016 term to verify all reported actions have been implemented and will continue to monitor the program.
California State University, San Marcos Baccalaureate Degree Nursing Program (ABSN option)
L. Moody 12/22/2015 A single complaint was received in November 2015 citing concerns regarding program resources of skills lab and classroom space, faculty responsibilities and enrollment increase at the Temecula campus. The campus was visited on December 11 and the program provided a written response to the concerns. During the visit a tour was provided of expanded skills lab and classroom spaces in progress to be completed by beginning of the January 2016 term, and plan for additional open lab hours and staffing was reviewed. The program plans to submit a request for Board approval for enrollment increase but will not increase enrollment prior to approval. Some faculty approvals required updating and this was accomplished during the complaint investigation period. NEC will visit the program prior to start of the January 2016 term to review new classroom and lab spaces.
University of San Diego Hahn School of Nursing and Beyster Institute for Nursing Research Entry Level Master’s Degree Nursing Program, Nurse Practitioner Program, Clinical Nurse Specialist Program
L. Moody 10/20/2015 The school’s name has been changed to the University of San Diego Hahn School of Nursing and Beyster Institute for Nursing Research.
MINOR CURRICULUM REVISIONS Education/Licensing Committee
DATE: February 11, 2016 SCHOOL NAME APPROVED
BY NEC DATE
APPROVED PROGRESS REPORT
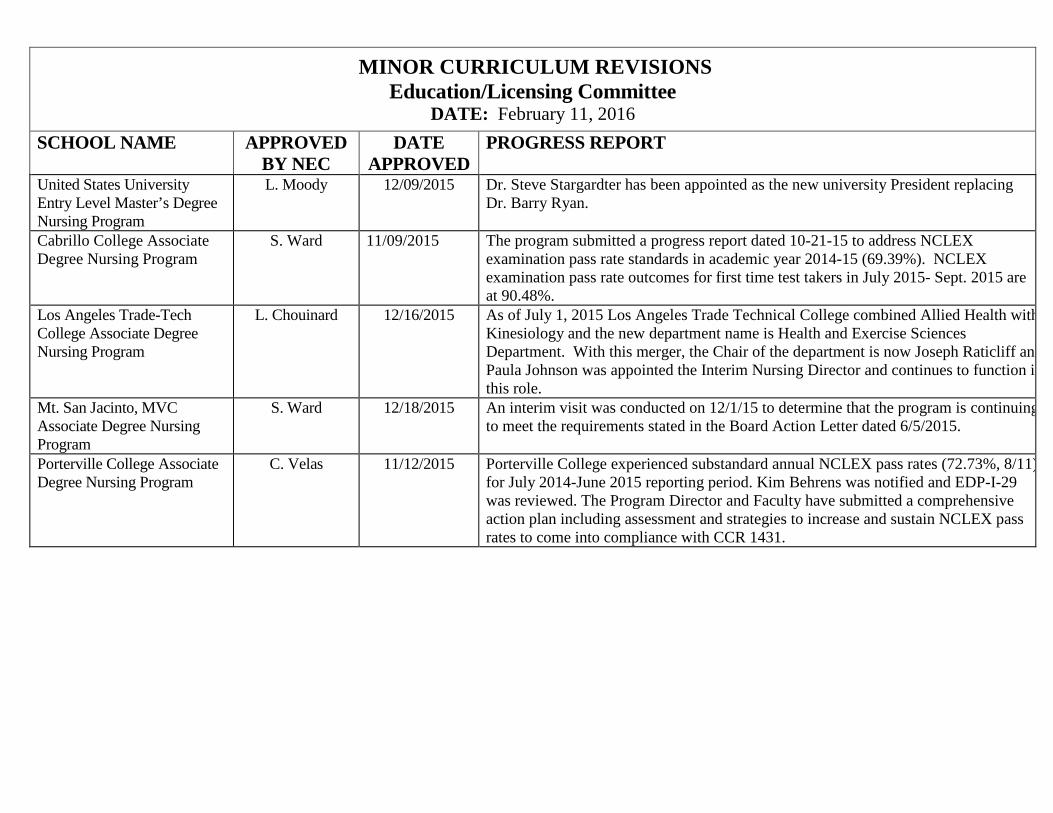
United States University Entry Level Master’s Degree Nursing Program
L. Moody 12/09/2015 Dr. Steve Stargardter has been appointed as the new university President replacing Dr. Barry Ryan.
Cabrillo College Associate Degree Nursing Program
S. Ward 11/09/2015 The program submitted a progress report dated 10-21-15 to address NCLEX examination pass rate standards in academic year 2014-15 (69.39%). NCLEX examination pass rate outcomes for first time test takers in July 2015- Sept. 2015 are at 90.48%.
Los Angeles Trade-Tech College Associate Degree Nursing Program
L. Chouinard 12/16/2015 As of July 1, 2015 Los Angeles Trade Technical College combined Allied Health with Kinesiology and the new department name is Health and Exercise Sciences Department. With this merger, the Chair of the department is now Joseph Raticliff and Paula Johnson was appointed the Interim Nursing Director and continues to function in this role.
Mt. San Jacinto, MVC Associate Degree Nursing Program
S. Ward 12/18/2015 An interim visit was conducted on 12/1/15 to determine that the program is continuing to meet the requirements stated in the Board Action Letter dated 6/5/2015.
Porterville College Associate Degree Nursing Program
C. Velas 11/12/2015 Porterville College experienced substandard annual NCLEX pass rates (72.73%, 8/11) for July 2014-June 2015 reporting period. Kim Behrens was notified and EDP-I-29 was reviewed. The Program Director and Faculty have submitted a comprehensive action plan including assessment and strategies to increase and sustain NCLEX pass rates to come into compliance with CCR 1431.
BOARD OF REGISTERED NURSING Education/Licensing Committee
Agenda Item Summary
AGENDA ITEM: 7.2 DATE: February 11, 2016
ACTION REQUESTED: Vote On Whether To Recommend Continuation of Approval of
Prelicensure Nursing Programs REQUESTED BY: Michael Jackson, MSN, RN
Chairperson, Education/Licensing Committee BACKGROUND: The Education/Licensing Committee met on January 14, 2016 and makes the following recommendations:
Continue Approval of Prelicensure Nursing Program San Diego State University Baccalaureate Degree Nursing Program Evergreen Valley College Associate Degree Nursing Program Los Angeles Harbor College Associate Degree Nursing Program Reedley College at Madera Community College Center LVN-RN Associate Degree
Nursing Program Continue Defer Action to Continue Approval of Prelicensure Nursing Program Fresno City College Associate Degree Nursing Program
A summary of the above requests and actions is attached. NEXT STEPS: Notify the programs of Board action. PERSON TO CONTACT: Leslie A. Moody, RN, MSN, MAEd
Nursing Education Consultant
Att to Board agenda item 7.2 ELC Committee Recommendations From 01/14/2016 meeting
Education/Licensing Committee Recommendations The Education/Licensing Committee met on January 14, 2016 and makes the following recommendations: CONTINUE APPROVAL OF PRELICENSURE NURSING PROGRAM • San Diego State University Baccalaureate Degree Nursing Program. Dr. Phillip Greiner, Professor/Director. Dr. Greiner has served as program director since June 2012 and Marjorie Peck, PhD, RN was appointed as assistant director August 2012. The SDSU BSN program enrolls 160 students annually each Fall and currently has approximately 473 students enrolled in the program. A continuing approval visit was conducted October 13-14, 2015 resulting in a finding of one area of noncompliance, 1427(c) clinical facility agreements. Neither the agreement template nor the executed clinical facility agreements contained the required elements. The program has created an addendum for the clinical facilities agreement that includes all required elements, which has been sent to all program clinical facilities for signature. Major curriculum revisions implemented in the past five year period included changing enrollment from twice per year to once annually and reduction of total units for graduation to 120. Opportunities for improvement currently being worked on by faculty include use of simulation and improving progression of content across program courses. Although the simulation lab is well equipped and utilized for some Med/Surg and OB instruction, faculty are working to further develop skills and expand the use of simulation for clinical instruction. The faculty is also in the process of reviewing and mapping content to improve leveling of skills and knowledge within and across courses, and expect this work will be completed and revisions ready for implementation no later than Fall 2016 following receipt of BRN approval for curriculum revision. Strengths of the program include a dedicated experienced faculty, supportive university leadership, effective program leadership and knowledgeable support services for program advisement and student success support. Students express strong satisfaction with their academic experience. Process for addition of two full-time tenure track faculty is in progress with qualified applicants under consideration and completion of hiring expected to occur soon. Filling these positions is important to ensure continuity of the program’s faculty and leadership resources including filling the position of assistant director vacated in December 2015 due to faculty retirement. Program graduates’ NCLEX outcomes have been consistently above the BRN minimum required threshold as well as above state and national average. ACTION: Continue approval of San Diego State University Baccalaureate Degree Nursing Program. • Evergreen Valley College Associate Degree Nursing Program. Antoinette Herrera, RN, MSN, EdD, Dean of Nursing & Allied Health. Dr. Herrera was approved as director July 1, 2013. Felicia Mesa RN, MS, CNS was appointed assistant director March 23, 2015. Maureen Adamski RN, MS was appointed assistant director September 4, 2012. A regularly scheduled continuing approval visit was conducted by this consultant and Dr. Carol Velas October 19-21, 2015. The program was found to be in compliance with BRN rules and regulations. Two recommendations were given in the areas California Code of Regulations (CCR) 1424 Administration & Organization of the nursing program (b) the policies and procedures by which the program is administered shall be in writing, shall reflect the philosophy and objectives of the program, and shall be available to all students and CCR 1425 (f) (A) content expert continuing education units are to be completed and documented. Details of the visit are found in the Consultant Approval Report for
Page 1 of 3
Att to Board agenda item 7.2 ELC Committee Recommendations From 01/14/2016 meeting Continuing Approval Review and the Report of Findings. The program submitted a progress report to address the recommendations. The program has dedicated and knowledgeable faculty. NCLEX pass rates for the past five academic years are above the BRN standard. Administration is supportive of the program. Clinical experiences are consistent with the program objectives. ACTION: Continue approval of Evergreen Valley College Associate Degree Nursing Program. • Los Angeles Harbor College Associate Degree Nursing Program. Ms. Lynn Yamakawa, Chairperson, Health Sciences Director. Ms. Yamakawa oversees Los Angeles Harbor College (LAHC) Associate Degree in Nursing and the EMT, CNA/HHA programs since 2009 and has 100% release time. She has worked for LAHC since 1995 in various positions. Susan Nowinski has served as ADON since August 2014 and has taught for LAHC since 2003. On November 16-17, 2015 a scheduled routine continuing approval visit was conducted at LAHC by Loretta Chouinard Nursing Education Consultant and Dr. Carol Velas, Nursing Education Consultant. The program was found to be in full compliance. LAHC’s Nursing program is a mature prelicensure program with experienced program leadership and faculty. In 2012, the nursing program was re-organized under the Economic and Workforce Development division and Dean. LAHC enrolls 40 nursing students per semester and graduates have consistently scored better than 95 percent on their first time NCLEX pass rate since 2008. ACTION: Continue approval of Los Angeles Harbor College Associate Degree Nursing Program. • Reedley College at Madera Community College Center LVN-RN Associate Degree Nursing Program. Ms. Kimi Kato-Gee, Program Director. The Board rendered the following action at its September 3, 2015 meeting: Defer action to continue approval for Reedley College At Madera Community College Center Associate Degree Nursing Program, with progress report due for January 2016 Education/Licensing Committee. Limit annual enrollments to fifteen students. The action was taken subsequent to the findings at the scheduled continuing approval visit conducted on April 30, 2015. There were three areas of non-compliance, and five recommendations were issued. The program responded with a progress report at the August 2015 Education and Licensing Committee to each area of non-compliance and for the recommendations. One area of non-compliance related to an inadequate number and type of faculty to teach the March 2016 course in obstetrical nursing, and to ensure a content expert in this nursing area remained - CCR section 1424 (d), 1424 (h). The recent retirement of the prior program director who served as instructor and content expert in obstetrics was in part related. This contributed to the action to defer continuing approval. The program subsequently secured BRN approval and hired two part-time faculty at the instructor level classification in obstetrics (OB), one of which is qualified and designated to serve as the (OB) content expert. Additionally, the program has scheduled two qualified part-time faculty to serve as clinical instructors in Ob, and has additional clinical faculty available if needed. The program also hired a part-time clinical teaching assistant in pediatrics, and is in the process of finalizing the hiring of a full-time faculty member qualified as an instructor in medical/surgical nursing. There are (8) enrolled student anticipated to continue in the Spring 2016 semester courses. The proposed faculty staffing plan indicates adequate type and number of resources to implement the OB course as planned. ACTION: Continue approval of Reedley College at Madera Community College Center LVN-RN Associate Degree Nursing Program.
Page 2 of 3
Att to Board agenda item 7.2 ELC Committee Recommendations From 01/14/2016 meeting CONTINUE DEFER ACTION TO CONTINUE APPROVAL OF PRELICENSURE NURSING PROGRAM • Fresno City College Associate Degree Nursing Program. Ms. Stephanie R. Robinson, Program Director. At the February 5, 2015 meeting, the Board voted to defer action to continue approval of Fresno City College Associate Degree Nursing Program subsequent to a scheduled continuing approval visit conducted on September 24-26, 2014 with a finding of non-compliance with CCR Section 1431 NCLEX examination outcome. BRN NCLEX Pass Rates First Time Candidates Report: 2013-2014 – 65.82% (354 taken, 233 passed); 2014-2015 – 67.30% (367 taken, 247 passed). The program submitted actions plans to address and improve outcomes since the findings were first reported to the Board. The most recent dated 9/1/15 and 12/3/15 are attached. An interim visit was conducted on 10/27/15 to determine progress toward resolution of examination outcomes. The program has identified and taken consistent actions related to determination of specific variables that have been determined as contributing to the outcomes, and has complied with Board policy related to the finding. The BRN NCLEX Pass Rates First Time Candidates Report for the first quarter 2015-2016 (July-Sept.) is 80.43 % (92 taken, 74 passed). Improvement has been demonstrated but a full year of outcomes is needed to establish compliance with the minimum NCLEX performance threshold. ACTION: Continue defer action to continue approval of Fresno City College Associate Degree Nursing Program. Program to return to ELC in October 2016.
Page 3 of 3
BOARD OF REGISTERED NURSING Education/Licensing Committee
Agenda Item Summary
AGENDA ITEM: 7.3 DATE: February 11, 2016
ACTION REQUESTED: Vote On Whether To Recommend Continuation of Approval of
Advance Practice Nursing Programs REQUESTED BY: Michael Jackson, MSN, RN
Chairperson, Education/Licensing Committee BACKGROUND: The Education/Licensing Committee met on January 14, 2016 and makes the following recommendations:
Continue Approval of Advance Practice Nursing Program San Diego State University Nurse Midwifery Program San Diego State University Nurse Practitioner Program
A summary of the above requests and actions is attached. NEXT STEPS: Notify the programs of Board action. PERSON TO CONTACT: Leslie A. Moody, RN, MSN, MAEd
Nursing Education Consultant

Att to Board agenda item 7.3 ELC Committee Recommendations From 01/14/2016 meeting
Education/Licensing Committee Recommendations The Education/Licensing Committee met on January 14, 2016 and makes the following recommendations: CONTINUE APPROVAL OF ADVANCED PRACTICE NURSING PROGRAM • San Diego State University Nurse Midwifery Program. Dr. Phillip Greiner, Professor/Director. Dr. Greiner is Director of the SDSU School of Nursing (SON). Dr. Lauren Hunter is Chair of the Women’s Health and Midwifery Program. The SDSU graduate Nurse-Midwifery (NM) Program offers three tracks: the Women’s Health and Midwifery track; the Women’s Health Nurse Practitioner (WHNP) track; and, the Nurse Midwife/Women’s Health Nurse Practitioner track. The NM program consists of 52 semester units (34 theory units, 15 clinical units-720 hours, and 3 units for thesis). The dual track NM/WHNP curriculum includes an additional 6 clinical units. The dual track program has 1008 clinical contact hours. The NM curriculum is offered as a single track or a dual track NM/WHNP program. The first class graduated in 2010. To date, there have been 56 graduates (WHNP-15, CNM/WHNP-41). All of these graduates have passed their national certification exams. NECs Carol Mackay and Wayne Boyer conducted this regularly scheduled continuing approval visit October 13-14, 2015. The program was found to be in compliance with the Board’s rules and regulations. One recommendation was made regarding resources. The chair position of the NM Program is a faculty position with no assigned time for administrative duties. The chair has requested administrative assigned time, but University administration considers these administrative responsibilities as part of faculty role. A two part recommendation was made: to provide sufficient time for the NM Program Chair to coordinate and administer the NM Program as part of her assigned time; and, to provide sufficient staff and support services for the NM Program. The strengths of the NM Program include: dedicated/hard working chairs and faculty; motivated, highly qualified students; a strong collegial/professional/respectful relationship between faculty and students; a strongly integrated curriculum; and highly qualified preceptors. Program challenges include preceptor record keeping. ACTION: Continue approval of the San Diego State University Nurse Midwifery Program. • San Diego State University Nurse Practitioner Program. Dr. Phillip Greiner, Professor/Director. Dr. Greiner is Director of the SDSU School of Nursing (SON). Dr. Lorraine Fitzsimmons is Chair of the AGNP Program. Dr. Lauren Hunter is Chair of the WHNP and Nurse Midwifery Program.The SDSU Nurse Practitioner (NP) Program offers two population tracks: the Adult-Gerontology NP (AGNP) track and the Women’s Health NP (WHNP) track. As of fall semester 2015, the AGNP curriculum consists of 31 semester units (18 theory and 13 clinical). The WHNP curriculum consists of 34 semester units (21 theory and 13 clinical). The Master’s Degree Program for both tracks totals 50 semester units. The AGNP curriculum is part of a dual track NP and Clinical Nurse Specialist preparation leading to a Master’s Degree in Nursing. The first class graduated in 1998. To date, there have been 164 graduates. All of these graduates have passed the national certification exam. The WHNP curriculum is offered as a single track or a dual track WHNP/Nurse Midwifery program. The first class graduated in 2010. To date, there have been 56 graduates (WHNP-15, CNM/WHNP-41). All of these graduates have passed their national certification exams. NECs Carol Mackay and Wayne Boyer conducted a regularly scheduled continuing approval visit October 13-14, 2015. The program was found to be in compliance with the Board’s rules and regulations. One recommendation was made regarding resources. The Chair position of the NP Program is a faculty position with no assigned time for administrative duties. The Chair has
Page 1 of 2
Att to Board agenda item 7.3 ELC Committee Recommendations From 01/14/2016 meeting requested administrative assigned time but University administration considers these administrative responsibilities as part of faculty role. A two part recommendation was made: to provide sufficient time for the NP Program Chair to coordinate and administer the NP Program as part of her assigned time; and, to provide sufficient staff and support services for the NP Program. The strengths of the NP Program include: dedicated/hard working chair and faculty; motivated, highly qualified students; strong collegial/respectful relationship between faculty and students; a strongly integrated curriculum; and, highly qualified preceptors. Program challenges include future retirements and program record keeping. ACTION: Continue approval of the San Diego State University Nurse Practitioner Program.
Page 2 of 2

BOARD OF REGISTERED NURSING Education/Licensing Committee
Agenda Item Summary
AGENDA ITEM: 7.4 DATE: February 11, 2016
ACTION REQUESTED: Vote On Whether To Recommend Approval of Major Curriculum
Revision REQUESTED BY: Michael Jackson, MSN, RN
Chairperson, Education/Licensing Committee BACKGROUND: The Education/Licensing Committee met on January 14, 2016 and makes the following recommendation:
Approve Major Curriculum Revision Unitek College LVN-RN Associate Degree Nursing Program (change to generic, increase
enrollment) A summary of the above request and action is attached.
Recommendation regarding the Major Curriculum Revision proposal for Simpson University Baccalaureate Degree Nursing Program (increase enrollment) was deferred with additional information to be reviewed at a future meeting. Golden West College Associate Degree Nursing Program (curriculum) was not presented and was removed from the ELC agenda. NEXT STEPS: Notify the programs of Board action. PERSON TO CONTACT: Leslie A. Moody, RN, MSN, MAEd
Nursing Education Consultant
Att to Board agenda item 7.4 ELC Committee Recommendations From 01/14/2016 meeting
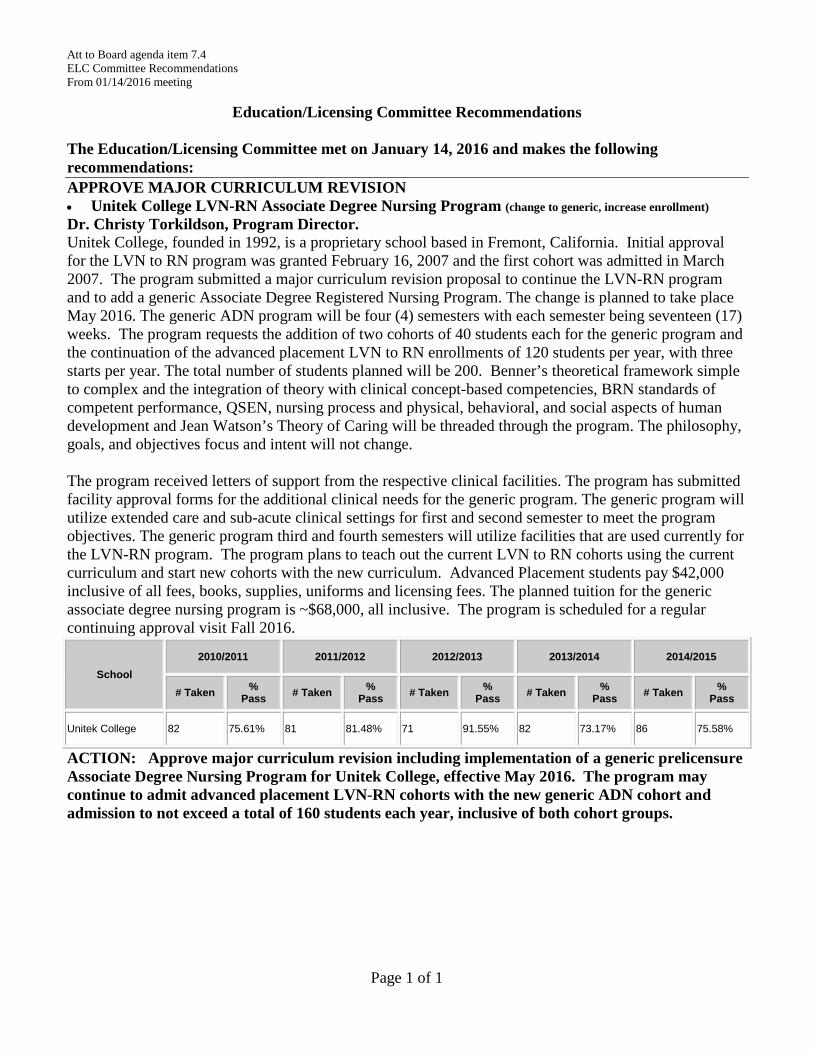
Education/Licensing Committee Recommendations The Education/Licensing Committee met on January 14, 2016 and makes the following recommendations: APPROVE MAJOR CURRICULUM REVISION • Unitek College LVN-RN Associate Degree Nursing Program (change to generic, increase enrollment) Dr. Christy Torkildson, Program Director. Unitek College, founded in 1992, is a proprietary school based in Fremont, California. Initial approval for the LVN to RN program was granted February 16, 2007 and the first cohort was admitted in March 2007. The program submitted a major curriculum revision proposal to continue the LVN-RN program and to add a generic Associate Degree Registered Nursing Program. The change is planned to take place May 2016. The generic ADN program will be four (4) semesters with each semester being seventeen (17) weeks. The program requests the addition of two cohorts of 40 students each for the generic program and the continuation of the advanced placement LVN to RN enrollments of 120 students per year, with three starts per year. The total number of students planned will be 200. Benner’s theoretical framework simple to complex and the integration of theory with clinical concept-based competencies, BRN standards of competent performance, QSEN, nursing process and physical, behavioral, and social aspects of human development and Jean Watson’s Theory of Caring will be threaded through the program. The philosophy, goals, and objectives focus and intent will not change. The program received letters of support from the respective clinical facilities. The program has submitted facility approval forms for the additional clinical needs for the generic program. The generic program will utilize extended care and sub-acute clinical settings for first and second semester to meet the program objectives. The generic program third and fourth semesters will utilize facilities that are used currently for the LVN-RN program. The program plans to teach out the current LVN to RN cohorts using the current curriculum and start new cohorts with the new curriculum. Advanced Placement students pay $42,000 inclusive of all fees, books, supplies, uniforms and licensing fees. The planned tuition for the generic associate degree nursing program is ~$68,000, all inclusive. The program is scheduled for a regular continuing approval visit Fall 2016.
School 2010/2011 2011/2012 2012/2013 2013/2014 2014/2015
# Taken % Pass # Taken %
Pass # Taken % Pass # Taken %
Pass # Taken % Pass
Unitek College 82 75.61% 81 81.48% 71 91.55% 82 73.17% 86 75.58%
ACTION: Approve major curriculum revision including implementation of a generic prelicensure Associate Degree Nursing Program for Unitek College, effective May 2016. The program may continue to admit advanced placement LVN-RN cohorts with the new generic ADN cohort and admission to not exceed a total of 160 students each year, inclusive of both cohort groups.
Page 1 of 1
BOARD OF REGISTERED NURSING Education/Licensing Committee
Agenda Item Summary
AGENDA ITEM: 7.5 DATE: February 11, 2016
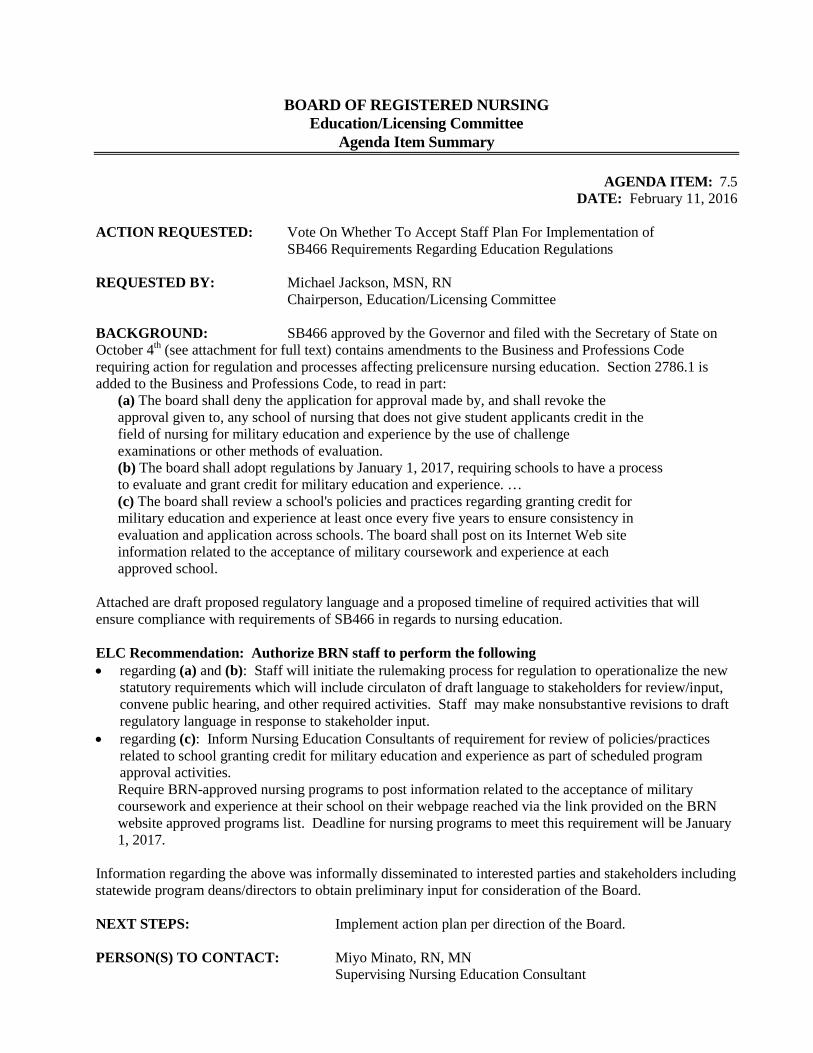
ACTION REQUESTED: Vote On Whether To Accept Staff Plan For Implementation of
SB466 Requirements Regarding Education Regulations REQUESTED BY: Michael Jackson, MSN, RN Chairperson, Education/Licensing Committee BACKGROUND: SB466 approved by the Governor and filed with the Secretary of State on October 4th (see attachment for full text) contains amendments to the Business and Professions Code requiring action for regulation and processes affecting prelicensure nursing education. Section 2786.1 is added to the Business and Professions Code, to read in part: (a) The board shall deny the application for approval made by, and shall revoke the approval given to, any school of nursing that does not give student applicants credit in the field of nursing for military education and experience by the use of challenge examinations or other methods of evaluation. (b) The board shall adopt regulations by January 1, 2017, requiring schools to have a process to evaluate and grant credit for military education and experience. … (c) The board shall review a school's policies and practices regarding granting credit for military education and experience at least once every five years to ensure consistency in evaluation and application across schools. The board shall post on its Internet Web site information related to the acceptance of military coursework and experience at each approved school. Attached are draft proposed regulatory language and a proposed timeline of required activities that will ensure compliance with requirements of SB466 in regards to nursing education. ELC Recommendation: Authorize BRN staff to perform the following • regarding (a) and (b): Staff will initiate the rulemaking process for regulation to operationalize the new
statutory requirements which will include circulaton of draft language to stakeholders for review/input, convene public hearing, and other required activities. Staff may make nonsubstantive revisions to draft regulatory language in response to stakeholder input.
• regarding (c): Inform Nursing Education Consultants of requirement for review of policies/practices related to school granting credit for military education and experience as part of scheduled program approval activities.
Require BRN-approved nursing programs to post information related to the acceptance of military coursework and experience at their school on their webpage reached via the link provided on the BRN website approved programs list. Deadline for nursing programs to meet this requirement will be January 1, 2017. Information regarding the above was informally disseminated to interested parties and stakeholders including statewide program deans/directors to obtain preliminary input for consideration of the Board. NEXT STEPS: Implement action plan per direction of the Board. PERSON(S) TO CONTACT: Miyo Minato, RN, MN
Supervising Nursing Education Consultant
BILL NUMBER: SB 466 CHAPTERED BILL TEXT CHAPTER 489 FILED WITH SECRETARY OF STATE OCTOBER 4, 2015 APPROVED BY GOVERNOR OCTOBER 4, 2015 PASSED THE SENATE SEPTEMBER 4, 2015 PASSED THE ASSEMBLY SEPTEMBER 3, 2015 AMENDED IN ASSEMBLY SEPTEMBER 1, 2015 AMENDED IN ASSEMBLY AUGUST 18, 2015 AMENDED IN ASSEMBLY JUNE 18, 2015 AMENDED IN SENATE APRIL 30, 2015 AMENDED IN SENATE APRIL 23, 2015 AMENDED IN SENATE APRIL 20, 2015 INTRODUCED BY Senator Hill (Principal coauthor: Assembly Member Bonilla) FEBRUARY 25, 2015 An act to amend Sections 2701, 2708, and 2786 of, to add Sections 2718 and 2786.1 to, and to repeal Section 2736.5 of, the Business and Professions Code, relating to nursing. LEGISLATIVE COUNSEL'S DIGEST SB 466, Hill. Registered nurses: Board of Registered Nursing. The Nursing Practice Act provides for the licensure and regulation of registered nurses by the Board of Registered Nursing within the Department of Consumer Affairs. Existing law requires the board to appoint an executive officer to perform duties delegated by the board. Existing law repeals those provisions establishing the board and the executive officer position on January 1, 2016. This bill would extend the repeal date to January 1, 2018. The act authorizes the board to take disciplinary action against a certified or licensed nurse or to deny an application for a certificate or license for certain reasons, including unprofessional conduct. Existing law establishes the California State Auditor's Office, which is headed by the California State Auditor, to conduct financial and performance audits as directed by statute. This bill would require the board, by February 1, 2016, to contract with the California State Auditor's Office to conduct a performance audit of the board's enforcement program, as specified. The bill would require the board to reimburse the office for the cost of the performance audit. The bill would require the office to report the results of the audit to the Governor, the department, and the appropriate policy committees of the Legislature by January 1, 2017. The bill would require the board's staff and management to cooperate with the office and provide the office with access to data, case files, employees, and information. The act authorizes any person who has served on active duty in the medical corps of the Armed Forces of the United States and who successfully completed the course of instruction to qualify him or her for rating as a medical service technician--independent duty, or other equivalent rating, and whose service in the Armed Forces was under honorable conditions to submit the record of that training to the board for evaluation. The act requires the board to grant a license to that person if he or she meets specified qualifications and the board determines that his or her education would give reasonable assurance of competence to practice as a registered nurse in this state. The act requires the board to maintain records of

those applicants, including, but not limited to, applicants who are rejected from examination. This bill would repeal those provisions. The act requires the board to maintain a list of approved schools or programs of nursing in this state, as specified, and provides that an approved school or program of nursing is one that has been approved by the board and meets certain academic requirements. The act requires the board to deny an application for approval of, and to revoke the approval given to, any school of nursing that does not give student applicants credit for previous education and the opportunity to obtain credit for other acquired knowledge by the use of challenge examinations or other methods of evaluation. This bill would require the board to deny or revoke approval of a school of nursing that does not give student applicants credit in the field of nursing for military education and experience by the use of challenge examinations or other methods of evaluation. The bill would require the board, by January 1, 2017, to adopt regulations requiring schools seeking approval to have a process to evaluate and grant credit, as defined, for military education and experience. The bill would require the board to review a school's policies and practices regarding granting credit for military education and experience at least once every 5 years to ensure consistency in evaluation and application across schools. The bill would require the board to post on its Internet Web site information related to the acceptance of military coursework and experience at each approved school. THE PEOPLE OF THE STATE OF CALIFORNIA DO ENACT AS FOLLOWS: SECTION 1. Section 2701 of the Business and Professions Code is amended to read: 2701. (a) There is in the Department of Consumer Affairs the Board of Registered Nursing consisting of nine members. (b) For purposes of this chapter, "board," or "the board," refers to the Board of Registered Nursing. Any reference in state law to the Board of Nurse Examiners of the State of California or the California Board of Nursing Education and Nurse Registration shall be construed to refer to the Board of Registered Nursing. (c) The board shall have all authority vested in the previous board under this chapter. The board may enforce all disciplinary actions undertaken by the previous board. (d) This section shall remain in effect only until January 1, 2018, and as of that date, is repealed, unless a later enacted statute that is enacted before January 1, 2018, deletes or extends that date. Notwithstanding any other law, the repeal of this section renders the board subject to review by the appropriate policy committees of the Legislature. SEC. 2. Section 2708 of the Business and Professions Code is amended to read: 2708. (a) The board shall appoint an executive officer who shall perform the duties delegated by the board and who shall be responsible to it for the accomplishment of those duties. (b) The executive officer shall be a nurse currently licensed under this chapter and shall possess other qualifications as determined by the board. (c) The executive officer shall not be a member of the board. (d) This section shall remain in effect only until January 1, 2018, and as of that date is repealed, unless a later enacted statute, that is enacted before January 1, 2018, deletes or extends that date. SEC. 3. Section 2718 is added to the Business and Professions Code, to read:
2718. (a) (1) By February 1, 2016, the board shall contract with the office to conduct a performance audit of the board's enforcement program. The board shall reimburse the office for the cost of the performance audit. The office shall report the results of the audit, with any recommendations, to the Governor, the department, and the appropriate policy committees of the Legislature by January 1, 2017. (2) The performance audit shall include, but not be limited to, an evaluation of all the following: (A) The quality and consistency of, and compliance with, complaint processing and investigation. (B) The consistency and adequacy of the application of board sanctions or discipline imposed on licensees. (C) The accuracy and consistency in implementing the laws and rules affecting discipline, including adherence to the Division of Investigation Case Acceptance Guidelines (Consumer Protection Enforcement Initiative Model), as revised July 1, 2014. (D) The timeframes for completing complaint processing, investigation, and resolution. (E) Staff concerns regarding licensee disciplinary matters or procedures. (F) The appropriate utilization of licensed professionals to investigate complaints. (G) The adequacy of the board's cooperation with other state agencies charged with enforcing related laws and regulations regarding nurses. (H) Any existing backlog, the reason for the backlog, and the timeframe for eliminating the backlog. (I) The adequacy of board staffing, training, and fiscal resources to perform its enforcement functions. (b) Board staff and management shall cooperate with the office and shall provide the office with access to data, case files, employees, and information as the office may, in its discretion, require for the purposes of this section. (c) For the purposes of this section, "office" means the California State Auditor's Office. SEC. 4. Section 2736.5 of the Business and Professions Code is repealed. SEC. 5. Section 2786 of the Business and Professions Code is amended to read: 2786. (a) An approved school of nursing, or an approved nursing program, is one that has been approved by the board, gives the course of instruction approved by the board, covering not less than two academic years, is affiliated or conducted in connection with one or more hospitals, and is an institution of higher education. For purposes of this section, "institution of higher education" includes, but is not limited to, community colleges offering an associate of arts or associate of science degree and private postsecondary institutions offering an associate of arts, associate of science, or baccalaureate degree or an entry-level master's degree, and is an institution that is not subject to the California Private Postsecondary Education Act of 2009 (Chapter 8 (commencing with Section 94800) of Part 59 of Division 10 of Title 3 of the Education Code). (b) A school of nursing that is affiliated with an institution that is subject to the California Private Postsecondary Education Act of 2009 (Chapter 8 (commencing with Section 94800) of Part 59 of Division 10 of Title 3 of the Education Code), may be approved by the board to grant an associate of arts or associate of science degree to individuals who graduate from the school of nursing or to grant a baccalaureate degree in nursing with successful completion of an additional course of study as approved by the board and the institution involved. (c) The board shall determine by regulation the required subjects
of instruction to be completed in an approved school of nursing for licensure as a registered nurse and shall include the minimum units of theory and clinical experience necessary to achieve essential clinical competency at the entry level of the registered nurse. The board's regulations shall be designed to require all schools to provide clinical instruction in all phases of the educational process, except as necessary to accommodate military education and experience as specified in Section 2786.1. (d) The board shall perform or cause to be performed an analysis of the practice of the registered nurse no less than every five years. Results of the analysis shall be utilized to assist in the determination of the required subjects of instruction, validation of the licensing examination, and assessment of the current practice of nursing. SEC. 6. Section 2786.1 is added to the Business and Professions Code, to read: 2786.1. (a) The board shall deny the application for approval made by, and shall revoke the approval given to, any school of nursing that does not give student applicants credit in the field of nursing for military education and experience by the use of challenge examinations or other methods of evaluation. (b) The board shall adopt regulations by January 1, 2017, requiring schools to have a process to evaluate and grant credit for military education and experience. The regulations shall be adopted pursuant to the Administrative Procedure Act (Chapter 3.5 (commencing with Section 11340) of Part 1 of Division 3 of Title 2 of the Government Code). The word "credit," as used in this subdivision, is limited to credit for licensure only. The board is not authorized to prescribe the credit that an approved school of nursing shall give toward an academic certificate or degree. (c) The board shall review a school's policies and practices regarding granting credit for military education and experience at least once every five years to ensure consistency in evaluation and application across schools. The board shall post on its Internet Web site information related to the acceptance of military coursework and experience at each approved school.
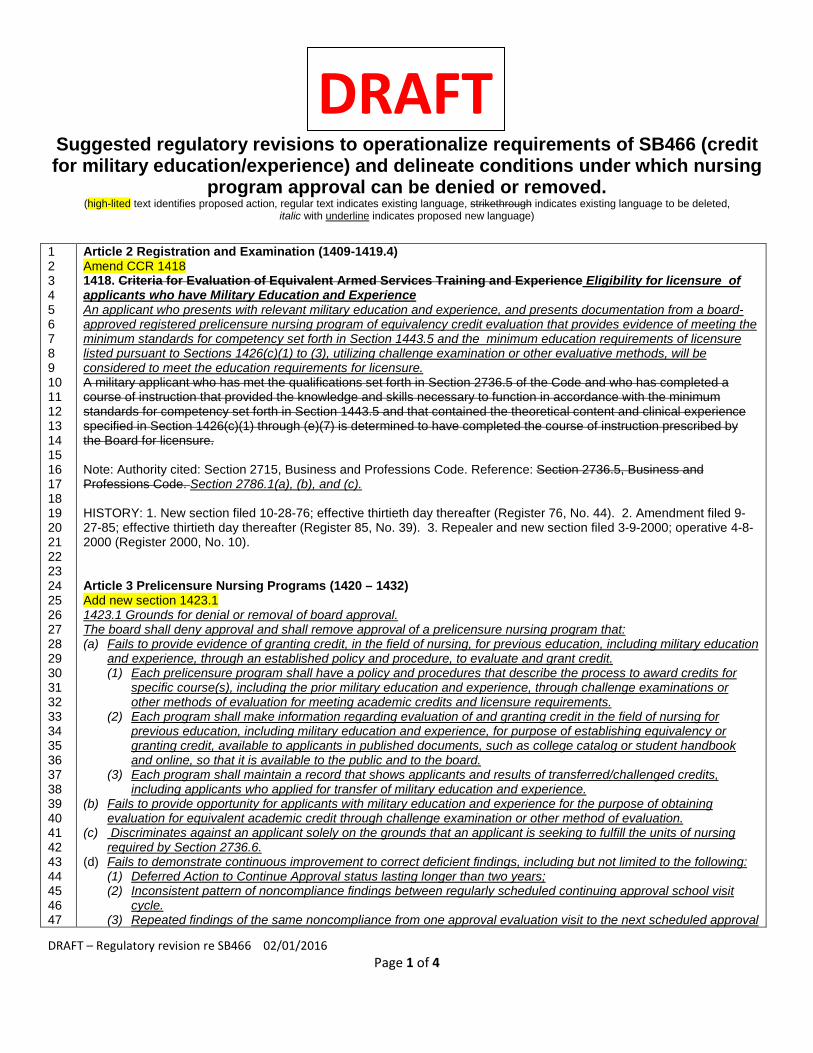
Suggested regulatory revisions to operationalize requirements of SB466 (credit for military education/experience) and delineate conditions under which nursing
program approval can be denied or removed. (high-lited text identifies proposed action, regular text indicates existing language, strikethrough indicates existing language to be deleted,
italic with underline indicates proposed new language)
1 2 3 4 5 6 7 8 9 10 11 12 13 14 15 16 17 18 19 20 21 22 23 24 25 26 27 28 29 30 31 32 33 34 35 36 37 38 39 40 41 42 43 44 45 46 47
Article 2 Registration and Examination (1409-1419.4) Amend CCR 1418 1418. Criteria for Evaluation of Equivalent Armed Services Training and Experience Eligibility for licensure of applicants who have Military Education and Experience An applicant who presents with relevant military education and experience, and presents documentation from a board-approved registered prelicensure nursing program of equivalency credit evaluation that provides evidence of meeting the minimum standards for competency set forth in Section 1443.5 and the minimum education requirements of licensure listed pursuant to Sections 1426(c)(1) to (3), utilizing challenge examination or other evaluative methods, will be considered to meet the education requirements for licensure. A military applicant who has met the qualifications set forth in Section 2736.5 of the Code and who has completed a course of instruction that provided the knowledge and skills necessary to function in accordance with the minimum standards for competency set forth in Section 1443.5 and that contained the theoretical content and clinical experience specified in Section 1426(c)(1) through (e)(7) is determined to have completed the course of instruction prescribed by the Board for licensure. Note: Authority cited: Section 2715, Business and Professions Code. Reference: Section 2736.5, Business and Professions Code. Section 2786.1(a), (b), and (c). HISTORY: 1. New section filed 10-28-76; effective thirtieth day thereafter (Register 76, No. 44). 2. Amendment filed 9-27-85; effective thirtieth day thereafter (Register 85, No. 39). 3. Repealer and new section filed 3-9-2000; operative 4-8-2000 (Register 2000, No. 10). Article 3 Prelicensure Nursing Programs (1420 – 1432) Add new section 1423.1 1423.1 Grounds for denial or removal of board approval. The board shall deny approval and shall remove approval of a prelicensure nursing program that: (a) Fails to provide evidence of granting credit, in the field of nursing, for previous education, including military education
and experience, through an established policy and procedure, to evaluate and grant credit. (1) Each prelicensure program shall have a policy and procedures that describe the process to award credits for
specific course(s), including the prior military education and experience, through challenge examinations or other methods of evaluation for meeting academic credits and licensure requirements.
(2) Each program shall make information regarding evaluation of and granting credit in the field of nursing for previous education, including military education and experience, for purpose of establishing equivalency or granting credit, available to applicants in published documents, such as college catalog or student handbook and online, so that it is available to the public and to the board.
(3) Each program shall maintain a record that shows applicants and results of transferred/challenged credits, including applicants who applied for transfer of military education and experience.
(b) Fails to provide opportunity for applicants with military education and experience for the purpose of obtaining evaluation for equivalent academic credit through challenge examination or other method of evaluation.
(c) Discriminates against an applicant solely on the grounds that an applicant is seeking to fulfill the units of nursing required by Section 2736.6.
(d) Fails to demonstrate continuous improvement to correct deficient findings, including but not limited to the following: (1) Deferred Action to Continue Approval status lasting longer than two years; (2) Inconsistent pattern of noncompliance findings between regularly scheduled continuing approval school visit
cycle. (3) Repeated findings of the same noncompliance from one approval evaluation visit to the next scheduled approval
DRAFT
DRAFT – Regulatory revision re SB466 02/01/2016 Page 1 of 4

48 49 50 51 52 53 54 55 56 57 58 59 60 61 62 63 64 65 66 67 68 69 70 71 72 73 74 75 76 77 78 79 80 81 82 83 84 85 86 87 88 89 90 91 92 93 94 95 96 97 98 99 100 101 102 103 104 105 106 107 108
visit. Note: Authority cited: Sections 2786, 2786.1, 2788, Business and Professions Code. Add new section 1423.2 1423.2 Board shall establish conditions for denial or revocation of approval of a nursing program. (a) Upon sufficient evidence of noncompliance and lack of demonstrated corrective actions to remove noncompliance, the board may take actions to:
(1) Deny approval of a nursing program; or (2) Revoke approval from a nursing program; or (3) Place a nursing program on a warning status with intent to revoke approval and close the program; or (4) Close a program when a program has been on a warning status for one year and the program fails to show
substantive corrective changes. (b) The board shall provide specific requirements for correction of noncompliance findings and a return date for review of the program’s approval status. (c) The board shall place a school on a warning status with intent to withdraw approval when a nursing program shows conditions pursuant to Section 1423.1(d). (d) The board retains the authority to revoke approval and close a nursing program in situations that require immediate action, including but not limited to the loss of school’s accreditation or lack of effective nursing program leadership. Note: Authority cited: Sections 2786, 2786.1, 2788, Business and Professions Code. Amend Section 1424 by adding 1424(b)(3) and (4) 1424. Administration and Organization of the Nursing Program (a) There shall be a written statement of philosophy and objectives that serves as a basis for curriculum structure. Such statement shall take into consideration the individual difference of students, including their cultural and ethnic background, learning styles, goals, and support systems. It shall also take into consideration the concepts of nursing and man in terms of nursing activities, the environment, the health-illness continuum, and relevant knowledge from related disciplines. (b) The policies and procedures by which the program is administered shall be in writing, shall reflect the philosophy and objectives of the program, and shall be available to all students. (1) The nursing program shall have a written plan for evaluation of the total program, including admission and selection procedures, attrition and retention of students, and performance of graduates in meeting community needs. (2) The program shall have a procedure for resolving student grievances. (3) The program shall have policies and procedures that demonstrate consistent granting of credit for military education and acquired knowledge by providing opportunity to obtain credit by the following methods, including but not limited to the listed methods: (a) the use of challenge examinations; or (b) the use of evaluative methods to validate achievement of course objectives and competencies. (4) The program shall make available the policies and procedures, including the acceptance of military coursework and experience, on the school’s website, in a manner that allows access to the information via the board’s posted list of approved Registered Nursing Programs. (c) There shall be an organizational chart which identifies the relationships, lines of authority and channels of communication within the program, between the program and other administrative segments of the institution with which it is affiliated, and between the program, the institution and clinical agencies. (d) The program shall have sufficient resources, including faculty, library, staff and support services, physical space and equipment, including technology, to achieve the program's objectives. (e) The director and the assistant director shall dedicate sufficient time for the administration of the program. (f) The program shall have a board-approved assistant director who is knowledgeable and current regarding the program and the policies and procedures by which it is administered, and who is delegated the authority to perform the director's duties in the director's absence. (g) Faculty members shall have the primary responsibility for developing policies and procedures, planning, organizing, implementing and evaluating all aspects of the program. (h) The faculty shall be adequate in type and number to develop and implement the program approved by the board, and shall include at least one qualified instructor in each of the areas of nursing required by section 1426(d) who will be the content expert in that area. Nursing faculty members whose teaching responsibilities include subject matter directly related to the practice of nursing shall be clinically competent in the areas to which they are assigned. (i) When a non-faculty individual participates in the instruction and supervision of students obtaining clinical experience, his or her responsibilities shall be described in writing and kept on file by the nursing program. (j) The assistant director shall function under the supervision of the director. Instructors shall function under the supervision of the director or the assistant director. Assistant instructors and clinical teaching assistants shall function under the supervision of an instructor. (k) The student/teacher ratio in the clinical setting shall be based on the following criteria:
DRAFT – Regulatory revision re SB466 02/01/2016 Page 2 of 4

109 110 111 112 113 114 115 116 117 118 119 120 121 122 123 124 125 126 127 128 129 130 131 132 133 134 135 136 137 138 139 140 141 142 143 144 145 146 147 148 149 150 151 152 153 154 155 156 157 158 159 160 161 162 163 164 165 166 167 168 169
(1) Acuity of patient needs; (2) Objectives of the learning experience; (3) Class level of the students; (4) Geographic placement of students; (5) Teaching methods; and (6) Requirements established by the clinical agency. Note: Authority cited: Sections 2715, 2786, 2786.1 and 2786.6, Business and Professions Code. Reference: Sections 2786-2788, Business and Professions Code. HISTORY 1. Amendment of subsections (b) and (g) filed 4-27-87; operative 5-27-87 (Register 87, No. 18). 2. Amendment filed 9-21-2010; operative 10-21-2010 (Register 2010, No. 39). Amend 1426 by adding 1426(d)(1) 1426. Required Curriculum (a) The curriculum of a nursing program shall be that set forth in this section, and shall be approved by the board. Any revised curriculum shall be approved by the board prior to its implementation. (b) The curriculum shall reflect a unifying theme, which includes the nursing process as defined by the faculty, and shall be designed so that a student who completes the program will have the knowledge, skills, and abilities necessary to function in accordance with the registered nurse scope of practice as defined in code section 2725, and to meet minimum competency standards of a registered nurse. (c) The curriculum shall consist of not less than fifty-eight (58) semester units, or eighty-seven (87) quarter units, which shall include at least the following number of units in the specified course areas: (1) Art and science of nursing, thirty-six (36) semester units or fifty-four (54) quarter units, of which eighteen (18) semester or twenty-seven (27) quarter units will be in theory and eighteen (18) semester or twenty-seven (27) quarter units will be in clinical practice. (2) Communication skills, six (6) semester or nine (9) quarter units. Communication skills shall include principles of oral, written, and group communication. (3) Related natural sciences (anatomy, physiology, and microbiology courses with labs), behavioral and social sciences, sixteen (16) semester or twenty-four (24) quarter units. (d) Theory and clinical practice shall be concurrent in the following nursing areas: geriatrics, medical-surgical, mental health/psychiatric nursing, obstetrics, and pediatrics. Instructional outcomes will focus on delivering safe, therapeutic, effective, patient-centered care; practicing evidence-based practice; working as part of interdisciplinary teams; focusing on quality improvement; and using information technology. Instructional content shall include, but is not limited to, the following: critical thinking, personal hygiene, patient protection and safety, pain management, human sexuality, client abuse, cultural diversity, nutrition (including therapeutic aspects), pharmacology, patient advocacy, legal, social and ethical aspects of nursing, and nursing leadership and management. (1) Theory and clinical practice requirements of the curriculum will be adjusted in recognition of military education and experiences of the student, when applicable, through an individualized instructional plan that results in meeting the same course objectives and competency standards. (e) The following shall be integrated throughout the entire nursing curriculum: (1) The nursing process; (2) Basic intervention skills in preventive, remedial, supportive, and rehabilitative nursing; (3) Physical, behavioral, and social aspects of human development from birth through all age levels; (4) Knowledge and skills required to develop collegial relationships with health care providers from other disciplines; (5) Communication skills including principles of oral, written, and group communications; (6) Natural science, including human anatomy, physiology, and microbiology; and (7) Related behavioral and social sciences with emphasis on societal and cultural patterns, human development, and behavior relevant to health-illness. (f) The program shall have tools to evaluate a student's academic progress, performance, and clinical learning experiences that are directly related to course objectives. (g) The course of instruction shall be presented in semester or quarter units or the equivalent under the following formula: (1) One (1) hour of instruction in theory each week throughout a semester or quarter equals one (1) unit. (2) Three (3) hours of clinical practice each week throughout a semester or quarter equals one (1) unit. With the exception of an initial nursing course that teaches basic nursing skills in a skills lab, 75% of clinical hours in a course must be in direct patient care in an area specified in section 1426(d) in a board-approved clinical setting. Note: Authority cited: Sections 2715, 2786.1 and 2786.6, Business and Professions Cod. Reference: Sections 2785-2788, Business and Professions Code. HISTORY: 1. Amendment of subsection (d) filed 4-27-87; operative 5-27-87 (Register 87, No. 18).
DRAFT – Regulatory revision re SB466 02/01/2016 Page 3 of 4
170 171 172 173 174 175 176 177 178 179 180 181 182
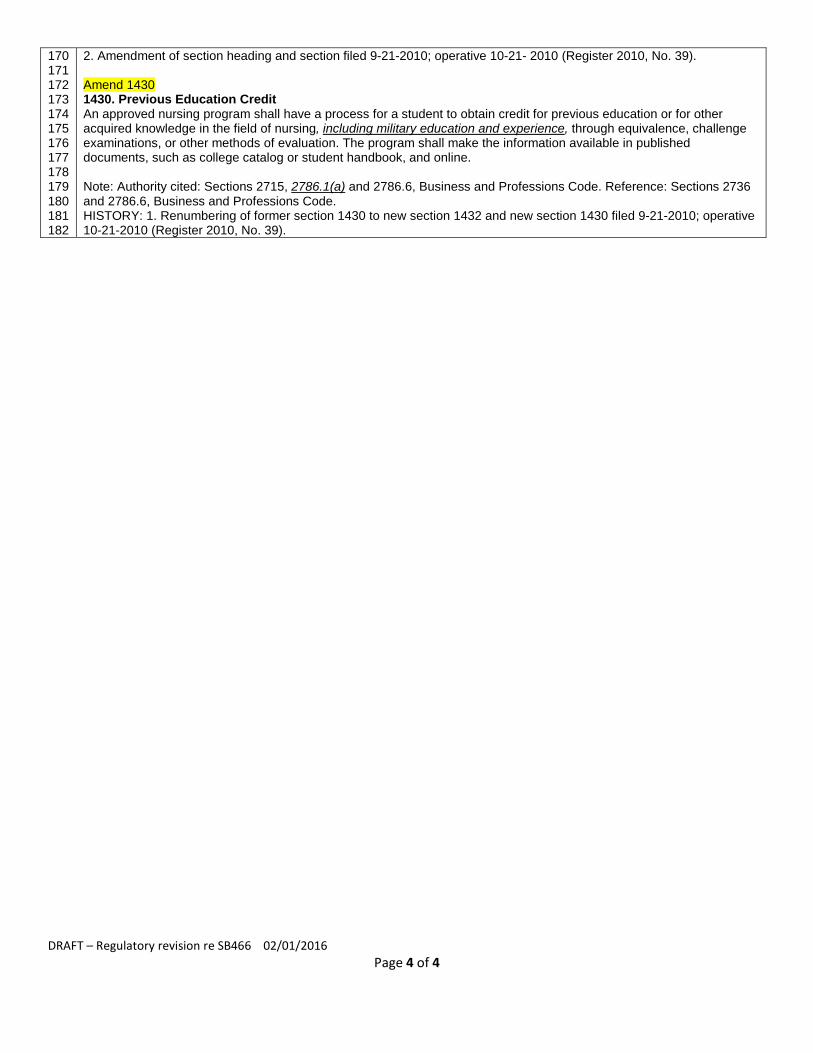
2. Amendment of section heading and section filed 9-21-2010; operative 10-21- 2010 (Register 2010, No. 39). Amend 1430 1430. Previous Education Credit An approved nursing program shall have a process for a student to obtain credit for previous education or for other acquired knowledge in the field of nursing, including military education and experience, through equivalence, challenge examinations, or other methods of evaluation. The program shall make the information available in published documents, such as college catalog or student handbook, and online. Note: Authority cited: Sections 2715, 2786.1(a) and 2786.6, Business and Professions Code. Reference: Sections 2736 and 2786.6, Business and Professions Code. HISTORY: 1. Renumbering of former section 1430 to new section 1432 and new section 1430 filed 9-21-2010; operative 10-21-2010 (Register 2010, No. 39).
DRAFT – Regulatory revision re SB466 02/01/2016 Page 4 of 4
Proposed Timeline of Activities
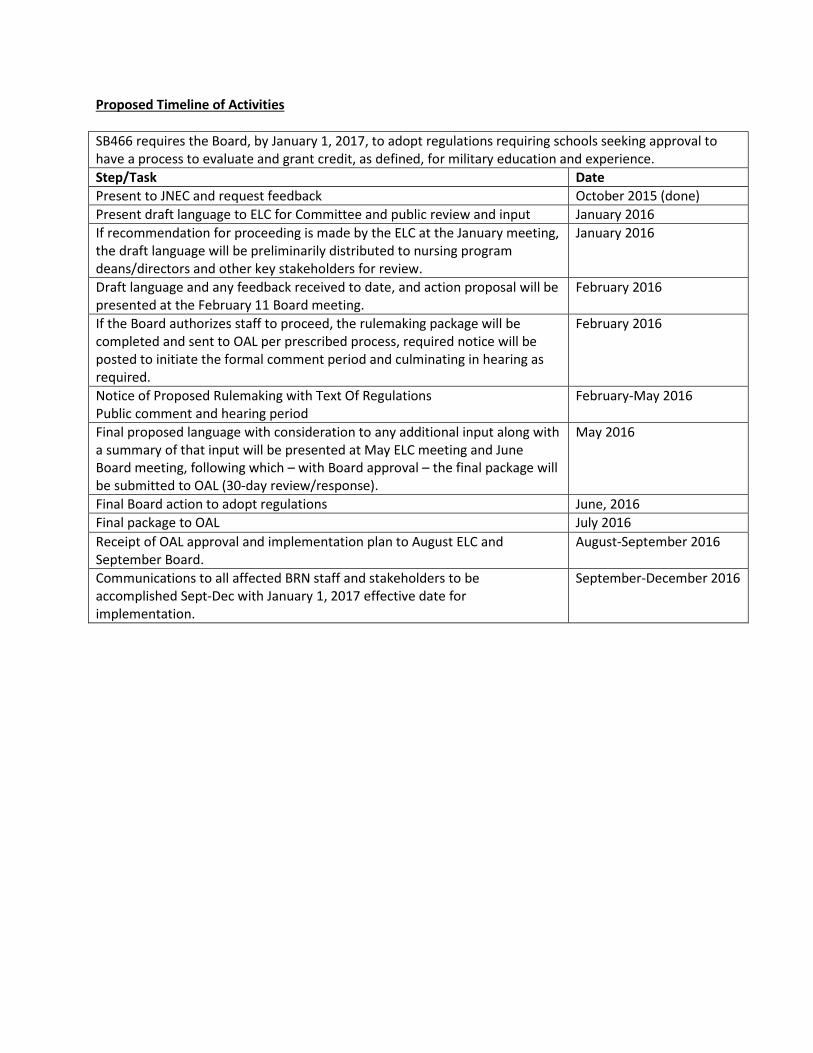
SB466 requires the Board, by January 1, 2017, to adopt regulations requiring schools seeking approval to have a process to evaluate and grant credit, as defined, for military education and experience. Step/Task Date Present to JNEC and request feedback October 2015 (done) Present draft language to ELC for Committee and public review and input January 2016 If recommendation for proceeding is made by the ELC at the January meeting, the draft language will be preliminarily distributed to nursing program deans/directors and other key stakeholders for review.
January 2016
Draft language and any feedback received to date, and action proposal will be presented at the February 11 Board meeting.
February 2016
If the Board authorizes staff to proceed, the rulemaking package will be completed and sent to OAL per prescribed process, required notice will be posted to initiate the formal comment period and culminating in hearing as required.
February 2016
Notice of Proposed Rulemaking with Text Of Regulations Public comment and hearing period
February-May 2016
Final proposed language with consideration to any additional input along with a summary of that input will be presented at May ELC meeting and June Board meeting, following which – with Board approval – the final package will be submitted to OAL (30-day review/response).
May 2016
Final Board action to adopt regulations June, 2016 Final package to OAL July 2016 Receipt of OAL approval and implementation plan to August ELC and September Board.
August-September 2016
Communications to all affected BRN staff and stakeholders to be accomplished Sept-Dec with January 1, 2017 effective date for implementation.
September-December 2016

BOARD OF REGISTERED NURSING Education/Licensing Committee
Agenda Item Summary
AGENDA ITEM: 7.6 DATE: February 11, 2016
ACTION REQUESTED: 2014-2015 Annual School Survey Reports (Draft) REQUESTED BY: Michael Jackson, MSN, RN
Chairperson, Education/Licensing Committee BACKGROUND:
The BRN 2014-2015 Annual School Survey was conducted from October 1, 2015 to November 16, 2015. The survey was sent to all California pre-licensure nursing programs and was conducted on behalf of the BRN by the Center for the Health Professions at the University of California, San Francisco. The BRN would like to thank all of the schools for their participation and prompt responses to the survey and the Education Issues Workgroup for contributing their time and assistance on the survey document and reviewing reports. BRN and UCSF staff work each year with nursing program directors who make up the Workgroup, representing various prelicensure programs from around the state who review and edit the survey questions if needed. This allows the survey to be a current document that can be used to capture data on new and emerging trends. The draft of the statewide Annual School Reports includes data on new and continuing student enrollments, graduations, faculty, etc. from California pre-licensure nursing programs. There are two reports; one is a trend report which includes historical data for the past ten years on some of the more significant data and the second includes current year detailed data from most all of the questions asked on the survey. NEXT STEPS: Finalize and Publish Reports. PERSON(S) TO CONTACT: Julie Campbell-Warnock
Research Program Specialist (916) 574-7681

California Board of Registered Nursing DRAFT 2014-2015 Annual School Report
Data Summary and Historical Trend Analysis
A Presentation of Pre-Licensure Nursing Education Programs in California
January 26, 2016
Prepared by: Lisel Blash, MPA Dennis Keane, MPH Joanne Spetz, PhD University of California, San Francisco 3333 California Street, Suite 265 San Francisco, CA 94118

2014-2015 BRN Annual School Report
PREFACE
Nursing Education Survey Background Development of the 2014-2015 Board of Registered Nursing (BRN) School Survey was the work of the Board's Education Issues Workgroup, which consists of nursing education stakeholders from across California. A list of workgroup members is included in the Appendices. The University of California, San Francisco was commissioned by the BRN to develop the online survey instrument, administer the survey, and report data collected from the survey.
Funding for this project was provided by the California Board of Registered Nursing.
Organization of Report The survey collects data about nursing programs and their students and faculty from August 1 through July 31. Annual data presented in this report represent August 1, 2014 through July 31, 2015. Demographic information and census data were requested for October 15, 2015.
Data from pre- and post-licensure nursing education programs are presented in separate reports and will be available on the BRN website. Data are presented in aggregate form and describe overall trends in the areas and over the times specified and, therefore, may not be applicable to individual nursing education programs.
Statistics for enrollments and completions represent two separate student populations. Therefore, it is not possible to directly compare enrollment and completion data.
Availability of Data The BRN Annual School Survey was designed to meet the data needs of the BRN as well as other interested organizations and agencies. A database with aggregate data derived from the last ten years of BRN School Surveys will be available for public access on the BRN website. Parties interested in accessing data not available on the website should contact Julie Campbell-Warnock at the BRN at [email protected].
Value of the Survey This survey has been developed to support nursing, nursing education and workforce planning in California. The Board of Registered Nursing believes that the results of this survey will provide data-driven evidence to influence policy at the local, state, federal and institutional levels.
The BRN extends appreciation to the Education Issues Workgroup and all survey respondents. Your participation has been vital to the success of this project.
University of California, San Francisco 2
2014-2015 BRN Annual School Report
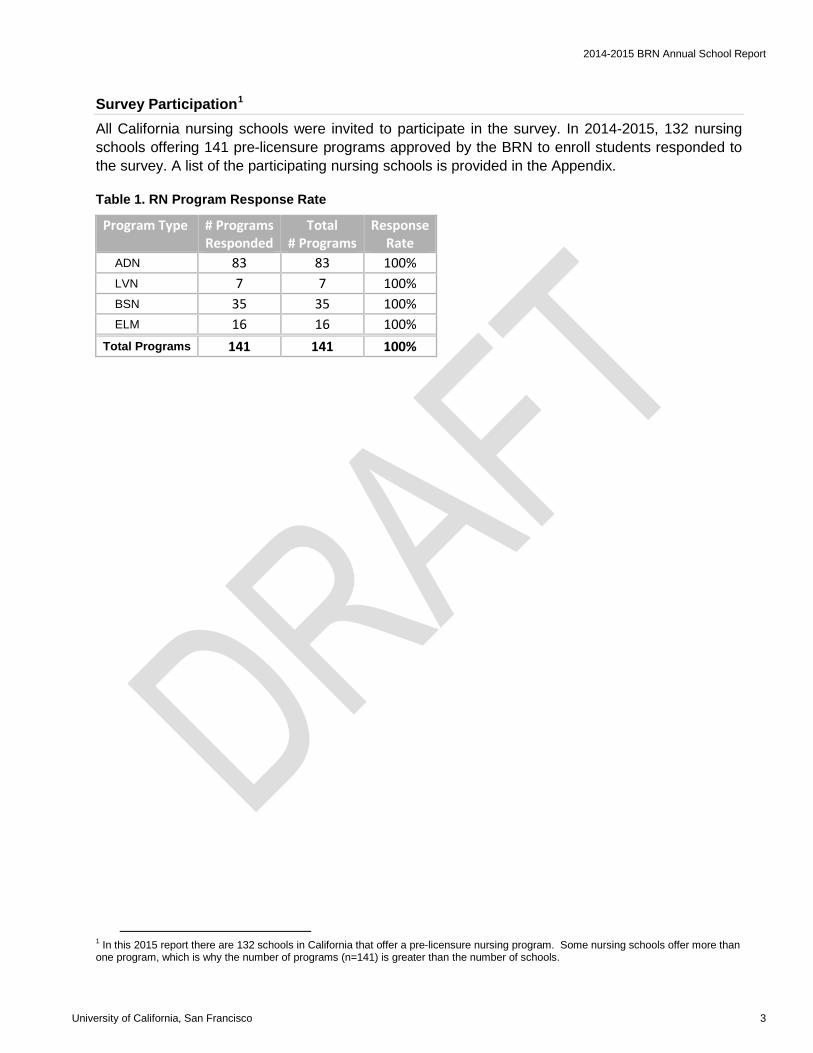
Survey Participation1 All California nursing schools were invited to participate in the survey. In 2014-2015, 132 nursing schools offering 141 pre-licensure programs approved by the BRN to enroll students responded to the survey. A list of the participating nursing schools is provided in the Appendix.
Table 1. RN Program Response Rate
1 In this 2015 report there are 132 schools in California that offer a pre-licensure nursing program. Some nursing schools offer more than one program, which is why the number of programs (n=141) is greater than the number of schools.
Program Type # Programs Responded
Total # Programs
Response Rate
ADN 83 83 100% LVN 7 7 100% BSN 35 35 100% ELM 16 16 100%
Total Programs 141 141 100%
University of California, San Francisco 3
2014-2015 BRN Annual School Report
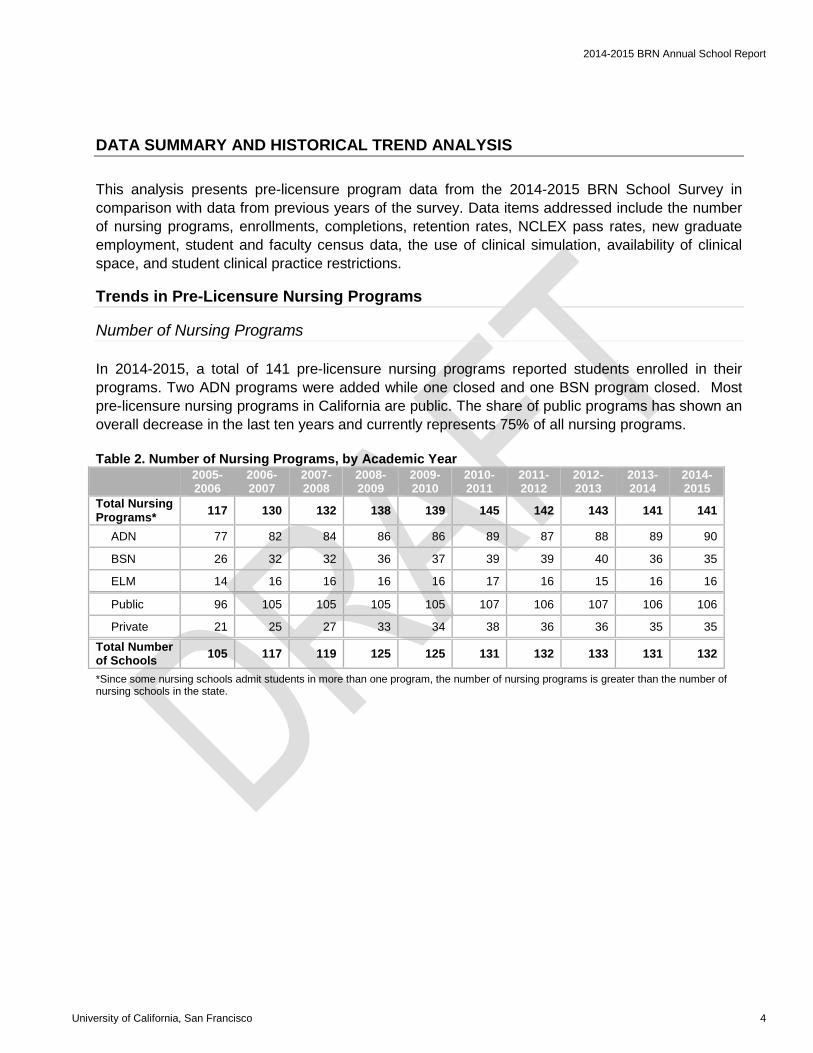
DATA SUMMARY AND HISTORICAL TREND ANALYSIS This analysis presents pre-licensure program data from the 2014-2015 BRN School Survey in comparison with data from previous years of the survey. Data items addressed include the number of nursing programs, enrollments, completions, retention rates, NCLEX pass rates, new graduate employment, student and faculty census data, the use of clinical simulation, availability of clinical space, and student clinical practice restrictions.
Trends in Pre-Licensure Nursing Programs
Number of Nursing Programs
In 2014-2015, a total of 141 pre-licensure nursing programs reported students enrolled in their programs. Two ADN programs were added while one closed and one BSN program closed. Most pre-licensure nursing programs in California are public. The share of public programs has shown an overall decrease in the last ten years and currently represents 75% of all nursing programs. Table 2. Number of Nursing Programs, by Academic Year
2005-2006
2006-2007
2007-2008
2008-2009
2009-2010
2010-2011
2011-2012
2012-2013
2013-2014
2014-2015
Total Nursing Programs* 117 130 132 138 139 145 142 143 141 141
ADN 77 82 84 86 86 89 87 88 89 90
BSN 26 32 32 36 37 39 39 40 36 35
ELM 14 16 16 16 16 17 16 15 16 16
Public 96 105 105 105 105 107 106 107 106 106
Private 21 25 27 33 34 38 36 36 35 35
Total Number of Schools 105 117 119 125 125 131 132 133 131 132
*Since some nursing schools admit students in more than one program, the number of nursing programs is greater than the number of nursing schools in the state.
University of California, San Francisco 4
2014-2015 BRN Annual School Report
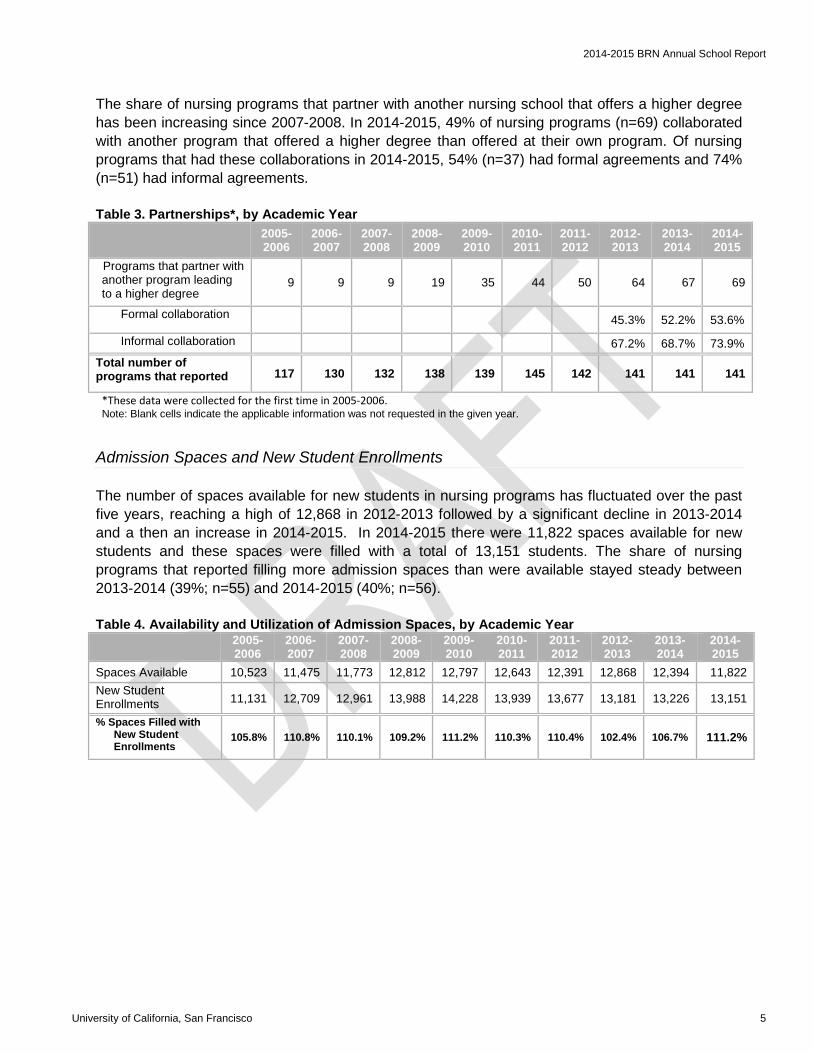
The share of nursing programs that partner with another nursing school that offers a higher degree has been increasing since 2007-2008. In 2014-2015, 49% of nursing programs (n=69) collaborated with another program that offered a higher degree than offered at their own program. Of nursing programs that had these collaborations in 2014-2015, 54% (n=37) had formal agreements and 74% (n=51) had informal agreements. Table 3. Partnerships*, by Academic Year
2005-2006
2006- 2007
2007- 2008
2008- 2009
2009- 2010
2010- 2011
2011- 2012
2012- 2013
2013- 2014
2014-2015
Programs that partner with another program leading to a higher degree
9 9 9 19 35 44 50 64 67 69
Formal collaboration 45.3% 52.2% 53.6%
Informal collaboration 67.2% 68.7% 73.9% Total number of programs that reported 117 130 132 138 139 145 142 141 141 141
*These data were collected for the first time in 2005-2006. Note: Blank cells indicate the applicable information was not requested in the given year.
Admission Spaces and New Student Enrollments
The number of spaces available for new students in nursing programs has fluctuated over the past five years, reaching a high of 12,868 in 2012-2013 followed by a significant decline in 2013-2014 and a then an increase in 2014-2015. In 2014-2015 there were 11,822 spaces available for new students and these spaces were filled with a total of 13,151 students. The share of nursing programs that reported filling more admission spaces than were available stayed steady between 2013-2014 (39%; n=55) and 2014-2015 (40%; n=56). Table 4. Availability and Utilization of Admission Spaces, by Academic Year
2005-2006
2006-2007
2007-2008
2008-2009
2009- 2010
2010-2011
2011-2012
2012-2013
2013-2014
2014-2015
Spaces Available 10,523 11,475 11,773 12,812 12,797 12,643 12,391 12,868 12,394 11,822 New Student Enrollments 11,131 12,709 12,961 13,988 14,228 13,939 13,677 13,181 13,226 13,151
% Spaces Filled with New Student Enrollments
105.8% 110.8% 110.1% 109.2% 111.2% 110.3% 110.4% 102.4% 106.7% 111.2%
University of California, San Francisco 5

2014-2015 BRN Annual School Report
The number of qualified applications received by California nursing programs has shown an overall decline since its ten-year high in 2009-2010, with the lowest overall number of applications received in the past ten years reported in 2014-2015. The number of applications received to ADN programs has seen the most decline. However, even with these declines, nursing programs continue to receive more applications requesting entrance into their programs than can be accommodated. Since these data represent applications and an individual can apply to multiple nursing programs, the number of applications is likely greater than the number of individuals applying for admission to nursing programs in California.
Table 5. Student Admission Applications*, by Academic Year
2005-2006
2006-2007
2007-2008
2008-2009
2009- 2010
2010-2011
2011-2012
2012-2013
2013-2014
2014-2015
Qualified Applications 28,410 28,506 34,074 36,954 41,634 37,847 38,665 35,041 31,575 28,165
ADN 19,724 19,559 25,021 26,185 28,555 24,722 23,913 19,979 16,682 15,988 BSN 7,391 7,004 7,515 8,585 10,680 11,098 12,387 12,476 12,695 10,026 ELM 1,295 1,943 1,538 2,184 2,399 2,027 2,365 2,586 2,198 2,151 % Qualified Applications Not Enrolled
60.8% 55.4% 62.0% 62.1% 65.4% 63.2% 64.6% 62.4% 58.1% 53.3%
*These data represent applications, not individuals. A change in the number of applications may not represent an equivalent change in the number of individuals applying to nursing school. In 2014-2015, 13,151 new students enrolled in registered nursing programs, which is a slight decline from the previous year. Over the last year, ADN programs saw a slight enrollment decline, while BSN and ELM programs had an increase in enrollments. Private programs had an increase, while public programs had a decrease. Public programs have seen their enrollments decline by 22% (n=2,267) in the last nine years, while new enrollments have more than doubled (114%; n=2,709) in private programs during the same time period. Table 6. New Student Enrollment by Program Type, by Academic Year
2005-2006
2006-2007
2007-2008
2008-2009
2009- 2010
2010-2011
2011-2012
2012-2013
2013-2014
2014-2015
New Student Enrollment 11,131 12,709 12,961 13,988 14,228 13,939 13,677 13,181 13,226 13,151
ADN 7,778 8,899 8,847 9,412 8,594 7,688 7,411 7,146 7,135 6,903
BSN 2,709 3,110 3,404 3,821 4,842 5,342 5,445 5,185 5,284 5,354
ELM 644 700 710 755 792 909 821 850 807 894
Private 2,024 2,384 2,704 3,774 4,607 4,773 4,795 4,642 4,920 5,093
Public 9,107 10,325 10,257 10,214 9,621 9,166 8,882 8,539 8,306 8,058
University of California, San Francisco 6
2014-2015 BRN Annual School Report
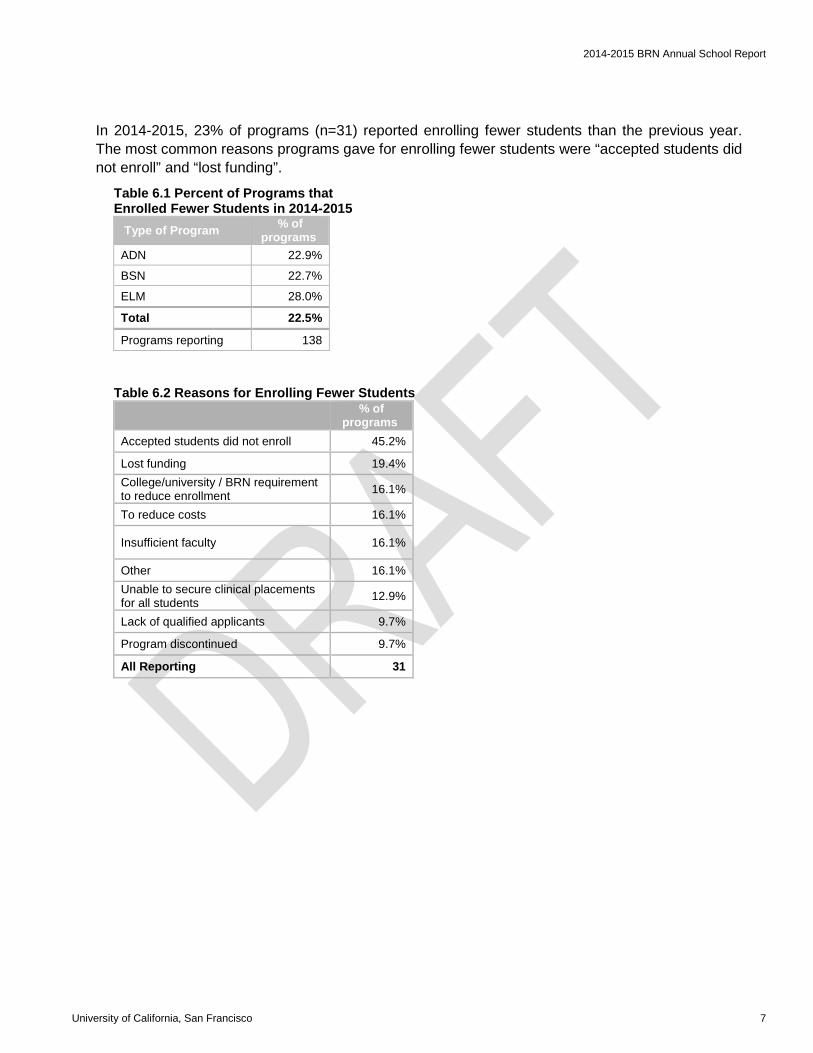
In 2014-2015, 23% of programs (n=31) reported enrolling fewer students than the previous year. The most common reasons programs gave for enrolling fewer students were “accepted students did not enroll” and “lost funding”.
Table 6.1 Percent of Programs that Enrolled Fewer Students in 2014-2015
Type of Program % of programs
ADN 22.9%
BSN 22.7%
ELM 28.0%
Total 22.5%
Programs reporting 138
Table 6.2 Reasons for Enrolling Fewer Students % of
programs Accepted students did not enroll 45.2%
Lost funding 19.4% College/university / BRN requirement to reduce enrollment 16.1%
To reduce costs 16.1%
Insufficient faculty 16.1%
Other 16.1% Unable to secure clinical placements for all students 12.9%
Lack of qualified applicants 9.7%
Program discontinued 9.7%
All Reporting 31
University of California, San Francisco 7
2014-2015 BRN Annual School Report
Student Census Data
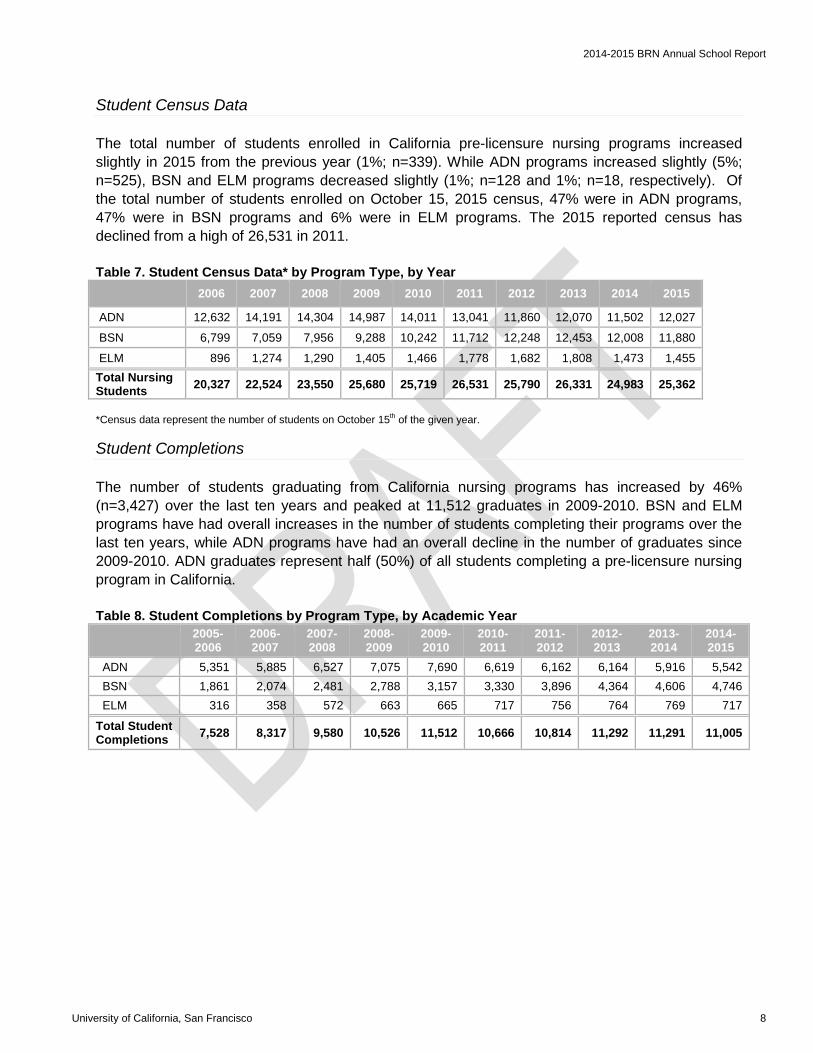
The total number of students enrolled in California pre-licensure nursing programs increased slightly in 2015 from the previous year (1%; n=339). While ADN programs increased slightly (5%; n=525), BSN and ELM programs decreased slightly (1%; n=128 and 1%; n=18, respectively). Of the total number of students enrolled on October 15, 2015 census, 47% were in ADN programs, 47% were in BSN programs and 6% were in ELM programs. The 2015 reported census has declined from a high of 26,531 in 2011. Table 7. Student Census Data* by Program Type, by Year
*Census data represent the number of students on October 15th of the given year.
Student Completions
The number of students graduating from California nursing programs has increased by 46% (n=3,427) over the last ten years and peaked at 11,512 graduates in 2009-2010. BSN and ELM programs have had overall increases in the number of students completing their programs over the last ten years, while ADN programs have had an overall decline in the number of graduates since 2009-2010. ADN graduates represent half (50%) of all students completing a pre-licensure nursing program in California. Table 8. Student Completions by Program Type, by Academic Year
2005-2006
2006-2007
2007-2008
2008-2009
2009-2010
2010-2011
2011-2012
2012-2013
2013-2014
2014-2015
ADN 5,351 5,885 6,527 7,075 7,690 6,619 6,162 6,164 5,916 5,542 BSN 1,861 2,074 2,481 2,788 3,157 3,330 3,896 4,364 4,606 4,746 ELM 316 358 572 663 665 717 756 764 769 717
Total Student Completions 7,528 8,317 9,580 10,526 11,512 10,666 10,814 11,292 11,291 11,005
2006 2007 2008 2009 2010 2011 2012 2013 2014 2015
ADN 12,632 14,191 14,304 14,987 14,011 13,041 11,860 12,070 11,502 12,027
BSN 6,799 7,059 7,956 9,288 10,242 11,712 12,248 12,453 12,008 11,880
ELM 896 1,274 1,290 1,405 1,466 1,778 1,682 1,808 1,473 1,455 Total Nursing Students 20,327 22,524 23,550 25,680 25,719 26,531 25,790 26,331 24,983 25,362
University of California, San Francisco 8

2014-2015 BRN Annual School Report
Retention and Attrition Rates
The attrition rate among nursing programs has declined since 2005-2006 with the lowest in 2012-2013 at 12.3% and was reported at 14.3% in 2014-2015. Of the 10,454 students scheduled to complete a nursing program in the 2014-2015 academic year, 79% (n=8,256) completed the program on-time, 6.7% (n=700) are still enrolled in the program, and 14.3% (n=1,498) left the program with 7.3% (n=769) dropping out and 7.0% (n=729) being dismissed from the program.
Table 9. Student Retention and Attrition, by Academic Year
2005-2006
2006-2007
2007-2008
2008-2009
2009- 2010
2010-2011
2011-2012
2012-2013
2013-2014
2014-2015
Students Scheduled to Complete the Program 8,208 8,852 9,769 10,630 10,162 10,007 9,595 11,579 10,366 10,454
Completed On Time 6,047 6,437 7,254 7,990 7,845 7,742 7,570 9,389 7,745 8,256
Still Enrolled 849 996 950 1,078 928 742 631 762 1,203 700 Total Attrition 1,312 1,419 1,565 1,562 1,389 1,523 1,394 1,428 1,418 1,498 Attrition-Dropped Out 769 Attrition-Dismissed 729 Completed Late 615 487 435 573 1,013 833
Retention Rate* 73.7% 72.7% 74.3% 75.2% 77.2% 77.4% 78.9% 81.1% 74.7% 79.0% Attrition Rate** 16.0% 16.0% 16.0% 14.7% 13.7% 15.2% 14.5% 12.3% 13.7% 14.3% % Still Enrolled 10.3% 11.3% 9.7% 10.1% 9.1% 7.4% 6.6% 6.6% 11.6% 6.7% *Retention rate = (students completing the program on-time) / (students scheduled to complete) **Attrition rate = (students dropped or dismissed who were scheduled to complete) / (students scheduled to complete the program) Note: Blank cells indicate that the applicable information was not requested in the given year. Attrition rates vary by program type and continue to be lowest among ELM programs and highest among ADN programs. Over the last ten years, ADN programs have seen overall improvement in their average attrition rates, while BSN & ELM programs have seen fluctuations in their attrition rates. Historically, attrition rates in public programs have been higher than those in private programs over most of the past ten years. However, this gap has narrowed in the past three years as average private program attrition rates have increased and average public program attrition rates have decreased. Table 10. Attrition Rates by Program Type*, by Academic Year
2005-2006
2006-2007
2007-2008
2008-2009
2009- 2010
2010-2011
2011-2012
2012-2013
2013-2014
2014-2015
ADN 18.3% 19.0% 19.0% 17.6% 16.6% 18.1% 17.7% 14.0% 15.3% 16.2% BSN 10.5% 8.7% 8.6% 9.0% 8.1% 10.0% 9.7% 10.3% 13.1% 13.0% ELM 5.0% 7.2% 5.6% 5.2% 5.6% 8.9% 7.3% 4.9% 4.7% 7.1% Private 14.6% 7.9% 9.2% 10.0% 8.9% 12.4% 10.9% 11.9% 14.4% 13.1% Public 16.2% 17.7% 17.5% 16.0% 14.8% 15.9% 15.5% 12.5% 13.4% 14.5% *Changes to the survey that occurred prior to 2005-2006 may have affected the comparability of these data to data in subsequent years.
University of California, San Francisco 9

2014-2015 BRN Annual School Report
Retention and Attrition Rates for Accelerated Programs Average retention rates for accelerated programs are higher than those for traditional programs. In 2014-2015, only 1.4% of students in accelerated programs were dismissed and 2.7% dropped out. Table 11. Student Retention and Attrition for Accelerated Programs*, by Academic Year
2007-2008
2008-2009
2009- 2010
2010-2011
2011-2012
2012- 2013
2013-2014
2014-2015
Students Scheduled to Complete the Program 686 784 1,159 1,040 1,281 1,035 1,049 1,386
Completed On Time 569 674 1,059 878 1,156 875 919 1,310 Still Enrolled 88 83 71 69 53 63 39 19 Total Attrition 28 27 29 93 72 97 91 57 Attrition-Dropped Out 37 Attrition-Dismissed 20 Completed Late 45 34 72 45 61 41
Retention Rate** 82.9% 86.0% 91.4% 84.4% 90.2% 84.5% 87.6% 94.5% Attrition Rate*** 4.1% 3.4% 2.5% 8.9% 5.6% 9.4% 8.7% 4.1% % Still Enrolled 12.8% 10.6% 6.1% 6.6% 4.1% 6.1% 3.7% 1.4% *These data were collected for the first time in 2007-2008. **Retention rate = (students who completed the program on-time) / (students scheduled to complete the program) ***Attrition rate = (students who dropped or were dismissed who were scheduled to complete) / (students scheduled to complete the program) Note: Blank cells indicate that the applicable information was not requested in the given year. Attrition rates in accelerated programs have varied over the last seven years. Both accelerated ADN and BSN programs had better attrition rates in 2014-2015 than in 2013-2014. The average attrition rates for accelerated programs was lower than for their traditional counterparts with BSN accelerated programs having the lowest average attrition rate at 3.6%. Table 12. Attrition Rates by Program Type for Accelerated Programs*, by Academic Year
2007-2008
2008-2009
2009- 2010
2010-2011
2011-2012
2012-2013
2013-2014
2014-2015
ADN 24.7% 18.5% 6.6% 7.9% 6.3% 21.6% 15.4% 10.9% BSN 6.8% 7.0% 5.8% 9.2% 5.4% 8.7% 6.8% 3.6% ELM** 5.7% *These data were collected for the first time in 2007-2008. ** Blank cells indicate that the applicable information was not requested in the given year.
University of California, San Francisco 10

2014-2015 BRN Annual School Report
NCLEX Pass Rates Over the last ten years, NCLEX pass rates have typically been higher for ELM graduates than for ADN or BSN program graduates. Improved pass rates for ADN and BSN graduates and lower pass rates for ELM students have narrowed this gap in recent years. All program types had similar 2014-2015 NCLEX pass rates in comparison to the previous year. The NCLEX passing standard was increased in April 2013, which may have impacted the NCLEX pass rates in 2013-2014 and 2014-2015. Table 13. First Time NCLEX Pass Rates* by Program Type, by Academic Year
2005-2006
2006-2007
2007-2008
2008-2009
2009-2010
2010-2011
2011-2012
2012-2013
2013-2014
2014-2015
ADN 87.3% 87.8% 85.4% 87.5% 88.6% 87.4% 89.8% 88.8% 83.1% 84.3% BSN 83.1% 89.4% 85.9% 88.7% 89.2% 87.9% 88.7% 87.1% 82.3% 84.4% ELM 92.4% 89.6% 92.3% 90.6% 89.6% 88.2% 88.9% 91.8% 81.9% 80.7% *NCLEX pass rates for students who took the exam for the first time in the given year. NCLEX pass rates for students graduated from accelerated nursing programs are generally comparable to pass rates of students who completed traditional programs. While the pass rates have fluctuated over time, students who graduated from accelerated programs in 2014-2015 had higher average pass rates than their traditional counterparts. Table 14. First Time NCLEX Pass Rates for Accelerated Programs* by Program Type, by Academic Year
2007-2008
2008-2009
2009- 2010
2010-2011
2011-2012
2012-2013
2013-2014
2014-2015
ADN 86.7% 93.7% 89.0% 83.9% 85.8% 93.5% 68.8% 95.5% BSN 89.4% 92.1% 88.5% 90.9% 89.9% 83.9% 82.0% 91.1% ELM** 90.0%
* These data were collected for the first time in 2007-2008. ** Blank cells indicate that the applicable information was not requested in the given year.
University of California, San Francisco 11
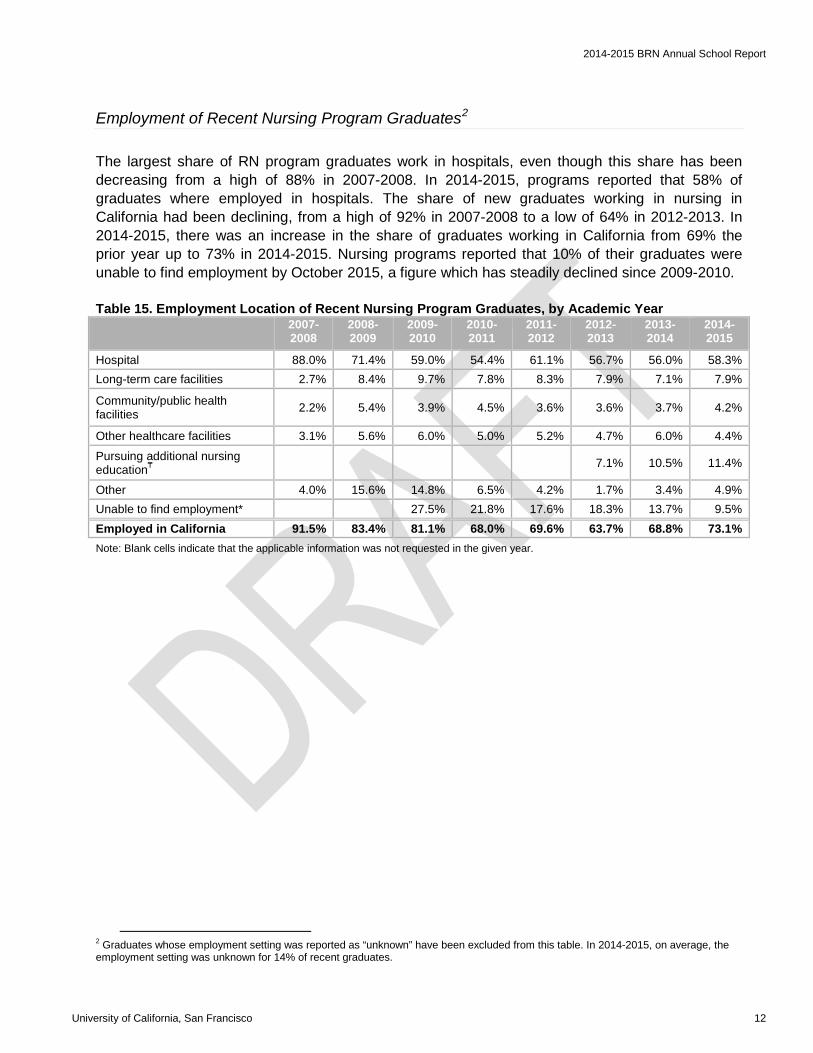
2014-2015 BRN Annual School Report
Employment of Recent Nursing Program Graduates2 The largest share of RN program graduates work in hospitals, even though this share has been decreasing from a high of 88% in 2007-2008. In 2014-2015, programs reported that 58% of graduates where employed in hospitals. The share of new graduates working in nursing in California had been declining, from a high of 92% in 2007-2008 to a low of 64% in 2012-2013. In 2014-2015, there was an increase in the share of graduates working in California from 69% the prior year up to 73% in 2014-2015. Nursing programs reported that 10% of their graduates were unable to find employment by October 2015, a figure which has steadily declined since 2009-2010. Table 15. Employment Location of Recent Nursing Program Graduates, by Academic Year
2007-2008
2008-2009
2009-2010
2010-2011
2011-2012
2012-2013
2013-2014
2014-2015
Hospital 88.0% 71.4% 59.0% 54.4% 61.1% 56.7% 56.0% 58.3% Long-term care facilities 2.7% 8.4% 9.7% 7.8% 8.3% 7.9% 7.1% 7.9%
Community/public health facilities 2.2% 5.4% 3.9% 4.5% 3.6% 3.6% 3.7% 4.2%
Other healthcare facilities 3.1% 5.6% 6.0% 5.0% 5.2% 4.7% 6.0% 4.4%
Pursuing additional nursing education₸ 7.1% 10.5% 11.4%
Other 4.0% 15.6% 14.8% 6.5% 4.2% 1.7% 3.4% 4.9% Unable to find employment* 27.5% 21.8% 17.6% 18.3% 13.7% 9.5% Employed in California 91.5% 83.4% 81.1% 68.0% 69.6% 63.7% 68.8% 73.1% Note: Blank cells indicate that the applicable information was not requested in the given year.
2 Graduates whose employment setting was reported as “unknown” have been excluded from this table. In 2014-2015, on average, the employment setting was unknown for 14% of recent graduates.
University of California, San Francisco 12
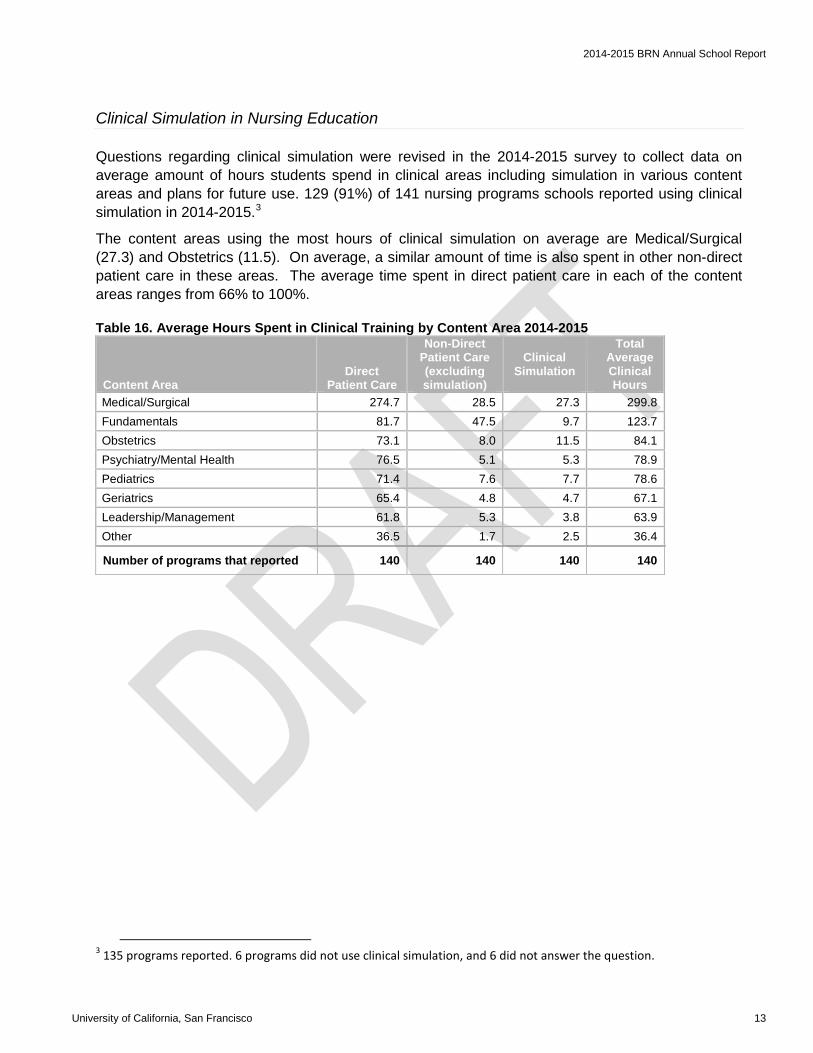
2014-2015 BRN Annual School Report
Clinical Simulation in Nursing Education
Questions regarding clinical simulation were revised in the 2014-2015 survey to collect data on average amount of hours students spend in clinical areas including simulation in various content areas and plans for future use. 129 (91%) of 141 nursing programs schools reported using clinical simulation in 2014-2015.3
The content areas using the most hours of clinical simulation on average are Medical/Surgical (27.3) and Obstetrics (11.5). On average, a similar amount of time is also spent in other non-direct patient care in these areas. The average time spent in direct patient care in each of the content areas ranges from 66% to 100%.
Table 16. Average Hours Spent in Clinical Training by Content Area 2014-2015
Content Area Direct
Patient Care
Non-Direct Patient Care (excluding simulation)
Clinical Simulation
Total Average Clinical Hours
Medical/Surgical 274.7 28.5 27.3 299.8 Fundamentals 81.7 47.5 9.7 123.7 Obstetrics 73.1 8.0 11.5 84.1 Psychiatry/Mental Health 76.5 5.1 5.3 78.9 Pediatrics 71.4 7.6 7.7 78.6 Geriatrics 65.4 4.8 4.7 67.1 Leadership/Management 61.8 5.3 3.8 63.9 Other 36.5 1.7 2.5 36.4
Number of programs that reported 140 140 140 140
3 135 programs reported. 6 programs did not use clinical simulation, and 6 did not answer the question.
University of California, San Francisco 13
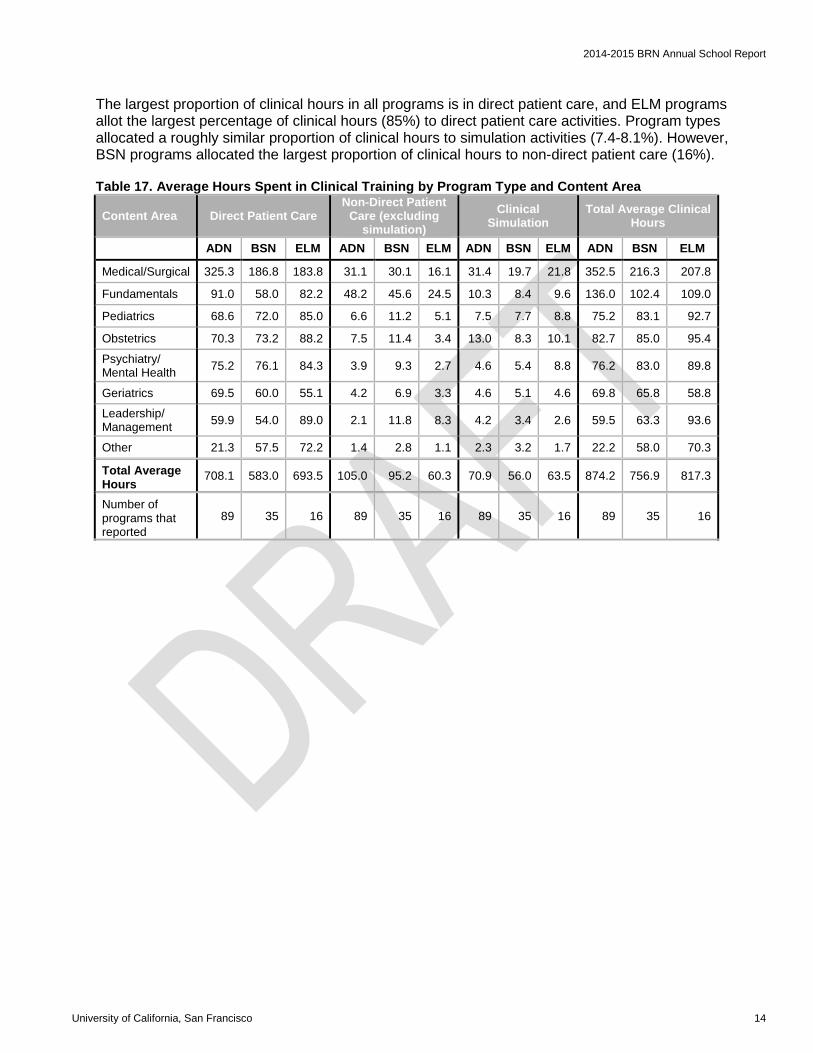
2014-2015 BRN Annual School Report
The largest proportion of clinical hours in all programs is in direct patient care, and ELM programs allot the largest percentage of clinical hours (85%) to direct patient care activities. Program types allocated a roughly similar proportion of clinical hours to simulation activities (7.4-8.1%). However, BSN programs allocated the largest proportion of clinical hours to non-direct patient care (16%).
Table 17. Average Hours Spent in Clinical Training by Program Type and Content Area
Content Area Direct Patient Care Non-Direct Patient
Care (excluding simulation)
Clinical Simulation
Total Average Clinical Hours
ADN BSN ELM ADN BSN ELM ADN BSN ELM ADN BSN ELM
Medical/Surgical 325.3 186.8 183.8 31.1 30.1 16.1 31.4 19.7 21.8 352.5 216.3 207.8
Fundamentals 91.0 58.0 82.2 48.2 45.6 24.5 10.3 8.4 9.6 136.0 102.4 109.0
Pediatrics 68.6 72.0 85.0 6.6 11.2 5.1 7.5 7.7 8.8 75.2 83.1 92.7
Obstetrics 70.3 73.2 88.2 7.5 11.4 3.4 13.0 8.3 10.1 82.7 85.0 95.4
Psychiatry/ Mental Health 75.2 76.1 84.3 3.9 9.3 2.7 4.6 5.4 8.8 76.2 83.0 89.8
Geriatrics 69.5 60.0 55.1 4.2 6.9 3.3 4.6 5.1 4.6 69.8 65.8 58.8
Leadership/ Management 59.9 54.0 89.0 2.1 11.8 8.3 4.2 3.4 2.6 59.5 63.3 93.6
Other 21.3 57.5 72.2 1.4 2.8 1.1 2.3 3.2 1.7 22.2 58.0 70.3
Total Average Hours
708.1 583.0 693.5 105.0 95.2 60.3 70.9 56.0 63.5 874.2 756.9 817.3
Number of programs that reported
89 35 16 89 35 16 89 35 16 89 35 16
University of California, San Francisco 14
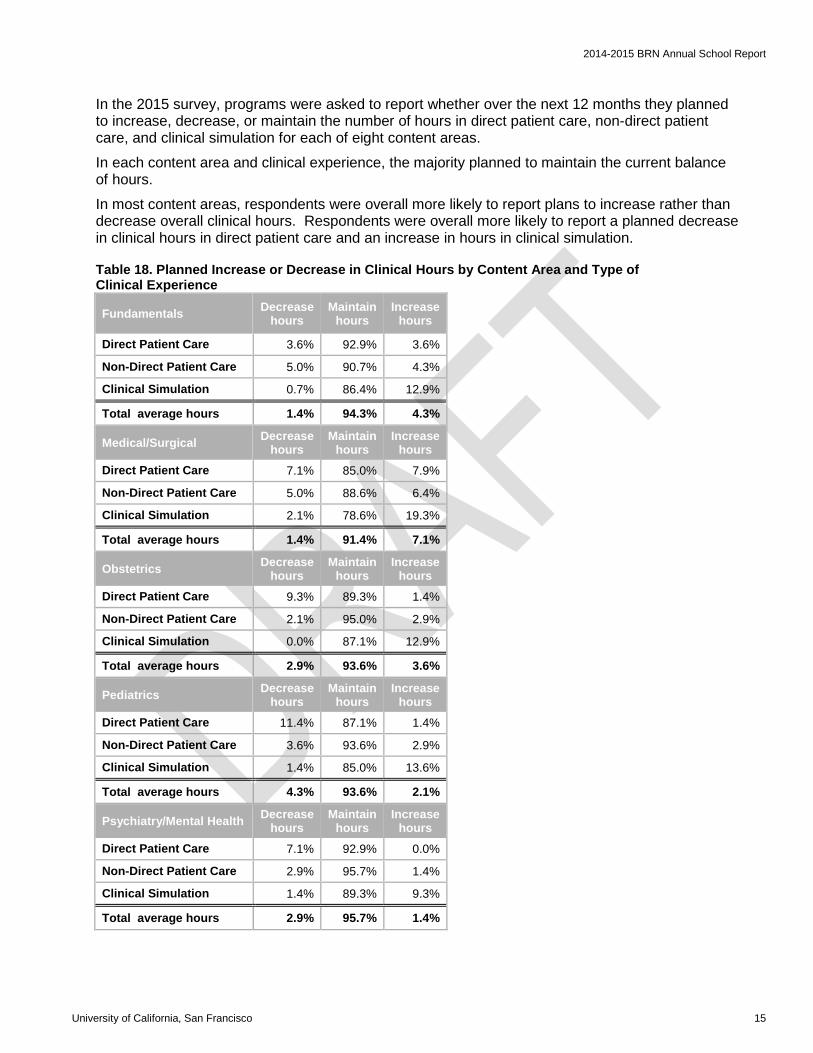
2014-2015 BRN Annual School Report
In the 2015 survey, programs were asked to report whether over the next 12 months they planned to increase, decrease, or maintain the number of hours in direct patient care, non-direct patient care, and clinical simulation for each of eight content areas.
In each content area and clinical experience, the majority planned to maintain the current balance of hours.
In most content areas, respondents were overall more likely to report plans to increase rather than decrease overall clinical hours. Respondents were overall more likely to report a planned decrease in clinical hours in direct patient care and an increase in hours in clinical simulation.
Table 18. Planned Increase or Decrease in Clinical Hours by Content Area and Type of Clinical Experience
Fundamentals Decrease hours
Maintain hours
Increase hours
Direct Patient Care 3.6% 92.9% 3.6%
Non-Direct Patient Care 5.0% 90.7% 4.3%
Clinical Simulation 0.7% 86.4% 12.9%
Total average hours 1.4% 94.3% 4.3%
Medical/Surgical Decrease hours
Maintain hours
Increase hours
Direct Patient Care 7.1% 85.0% 7.9%
Non-Direct Patient Care 5.0% 88.6% 6.4%
Clinical Simulation 2.1% 78.6% 19.3%
Total average hours 1.4% 91.4% 7.1%
Obstetrics Decrease hours
Maintain hours
Increase hours
Direct Patient Care 9.3% 89.3% 1.4%
Non-Direct Patient Care 2.1% 95.0% 2.9%
Clinical Simulation 0.0% 87.1% 12.9%
Total average hours 2.9% 93.6% 3.6%
Pediatrics Decrease hours
Maintain hours
Increase hours
Direct Patient Care 11.4% 87.1% 1.4%
Non-Direct Patient Care 3.6% 93.6% 2.9%
Clinical Simulation 1.4% 85.0% 13.6%
Total average hours 4.3% 93.6% 2.1%
Psychiatry/Mental Health Decrease hours
Maintain hours
Increase hours
Direct Patient Care 7.1% 92.9% 0.0%
Non-Direct Patient Care 2.9% 95.7% 1.4%
Clinical Simulation 1.4% 89.3% 9.3%
Total average hours 2.9% 95.7% 1.4%
University of California, San Francisco 15

2014-2015 BRN Annual School Report
Table 18. Planned Increase or Decrease in Clinical Hours by Content Area and Type of Clinical Experience
Geriatrics Decrease hours
Maintain hours
Increase hours
Direct Patient Care 2.9% 95.7% 1.4%
Non-Direct Patient Care 1.4% 97.1% 1.4%
Clinical Simulation 0.7% 92.1% 7.1%
Total average hours 0.0% 97.1% 2.9%
Leadership/Management Decrease hours
Maintain hours
Increase hours
Direct Patient Care 3.6% 94.3% 2.1%
Non-Direct Patient Care 2.1% 97.1% 0.7%
Clinical Simulation 0.0% 92.9% 7.1%
Total average hours 0.7% 97.9% 1.4%
Other Decrease hours
Maintain hours
Increase hours
Direct Patient Care 1.4% 97.1% 1.4%
Non-Direct Patient Care 0.7% 97.9% 1.4%
Clinical Simulation 0.0% 99.3% 0.7%
Total average hours 0.0% 98.6% 1.4%
Respondents were asked why they were reducing the clinical hours in their program if they indicated in the prior questions that they were decreasing clinical hours in any content area. 26% (n=37) programs reported they have plans to decrease their overall clinical hours in some area. Respondents frequently commented that they were not decreasing clinical hours overall, often noting that they were shifting allocations (54%). The inability to find sufficient clinical space (24%) and other (22%) were also commonly noted.
More than a third (33%, n=46) of the 140 programs have plans to increase staff dedicated to administering clinical simulation at their school in the next 12 months.
Table 19. Why Program is Reducing Clinical Hours %
Not decreasing overall; shifting allocations 54.1%
Unable to find sufficient clinical space 24.3%
Other 21.6%
Can teach required content in less time 13.5%
Insufficient clinical faculty 8.1%
Funding issues or unavailable funding 0.0%
Total reporting 37
University of California, San Francisco 16
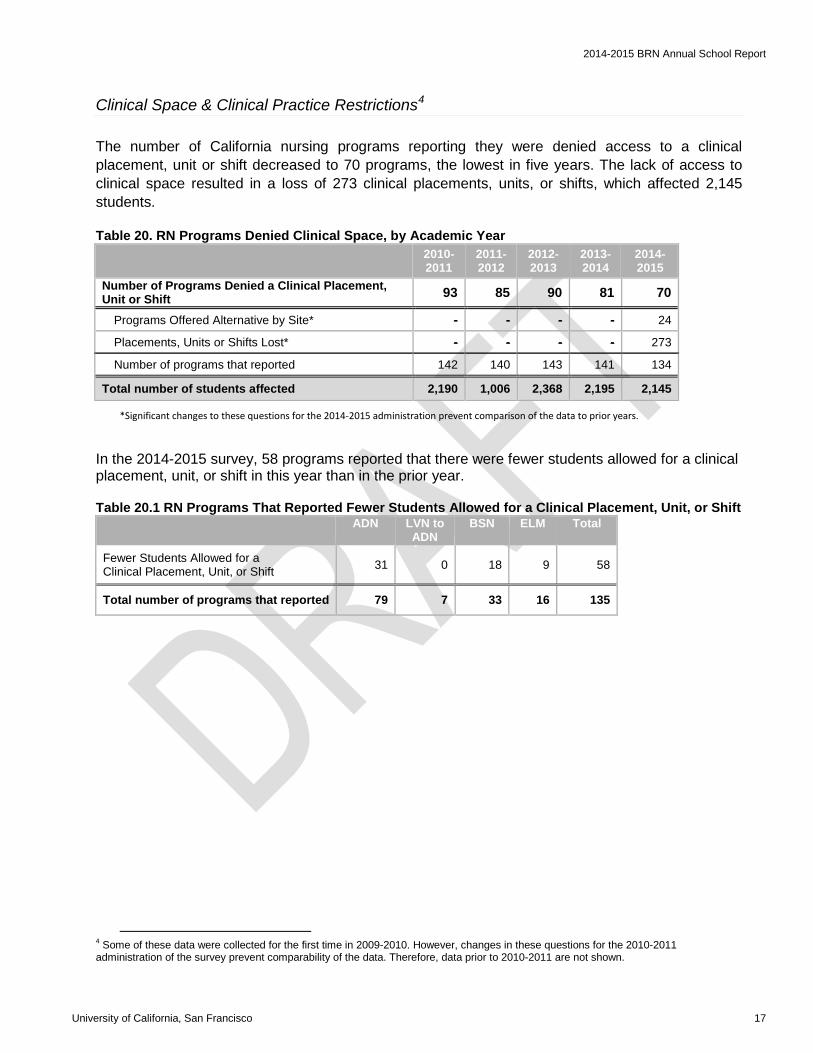
2014-2015 BRN Annual School Report
Clinical Space & Clinical Practice Restrictions4 The number of California nursing programs reporting they were denied access to a clinical placement, unit or shift decreased to 70 programs, the lowest in five years. The lack of access to clinical space resulted in a loss of 273 clinical placements, units, or shifts, which affected 2,145 students.
Table 20. RN Programs Denied Clinical Space, by Academic Year
2010-2011
2011-2012
2012-2013
2013-2014
2014-2015
Number of Programs Denied a Clinical Placement, Unit or Shift 93 85 90 81 70
Programs Offered Alternative by Site* - - - - 24
Placements, Units or Shifts Lost* - - - - 273
Number of programs that reported 142 140 143 141 134
Total number of students affected 2,190 1,006 2,368 2,195 2,145
*Significant changes to these questions for the 2014-2015 administration prevent comparison of the data to prior years.
In the 2014-2015 survey, 58 programs reported that there were fewer students allowed for a clinical placement, unit, or shift in this year than in the prior year.
Table 20.1 RN Programs That Reported Fewer Students Allowed for a Clinical Placement, Unit, or Shift ADN LVN to
ADN BSN ELM Total
Fewer Students Allowed for a Clinical Placement, Unit, or Shift 31 0 18 9 58
Total number of programs that reported 79 7 33 16 135
4 Some of these data were collected for the first time in 2009-2010. However, changes in these questions for the 2010-2011 administration of the survey prevent comparability of the data. Therefore, data prior to 2010-2011 are not shown.
University of California, San Francisco 17

2014-2015 BRN Annual School Report
Competition for space arising from an increase in the number of nursing students continued to be the most frequently reported reason why programs were denied clinical space, though the share of programs citing it as a reason has been declining since 2009-2010. Table 21. Reasons for Clinical Space Being Unavailable*, by Academic Year
Data were collected for the first time in the 2009-2010 or 2010-2011 survey. Note: Blank cells indicate that the applicable information was not requested in the given year.
2009-2010
2010-2011
2011-2012
2012-2013
2013-2014
2014-2015
Competition for clinical space due to increase in number of nursing students in region 71.4% 64.5% 58.8% 54.5% 46.9% 48.7%
Displaced by another program 62.3% 40.9% 44.7% 42.2% 43.2% 39.5% Staff nurse overload or insufficient qualified staff 54.5% 46.2% 54.1% 41.1% 45.7% 38.2% Visit from Joint Commission or other accrediting agency 21.1% 21.0% 26.3%
Decrease in patient census 35.1% 30.1% 31.8% 30.0% 28.4% 25.0% No longer accepting ADN students 26.0% 16.1% 21.2% 20.0% 23.5% 21.1% Change in facility ownership/management 11.8% 12.9% 21.1% 14.8% 21.1% Closure, or partial closure, of clinical facility 23.7% 25.9% 26.7% 25.9% 18.4% Nurse residency programs 28.6% 18.3% 29.4% 17.8% 18.5% 18.4% Clinical facility seeking magnet status 36.4% 12.9% 18.8% 15.5% 11.1% 17.1% Implementation of Electronic Health Records system 3.5% 32.3% 22.2% 13.2% The facility began charging a fee (or other RN program offered to pay a fee) for the placement and the RN program would not pay
4.9% 1.3%
Facility moving to a new location 6.2% 0.0% Other 20.8% 9.7% 10.6% 11.1% 11.1% 21.1% Number of programs that reported 77 93 85 90 81 76
University of California, San Francisco 18
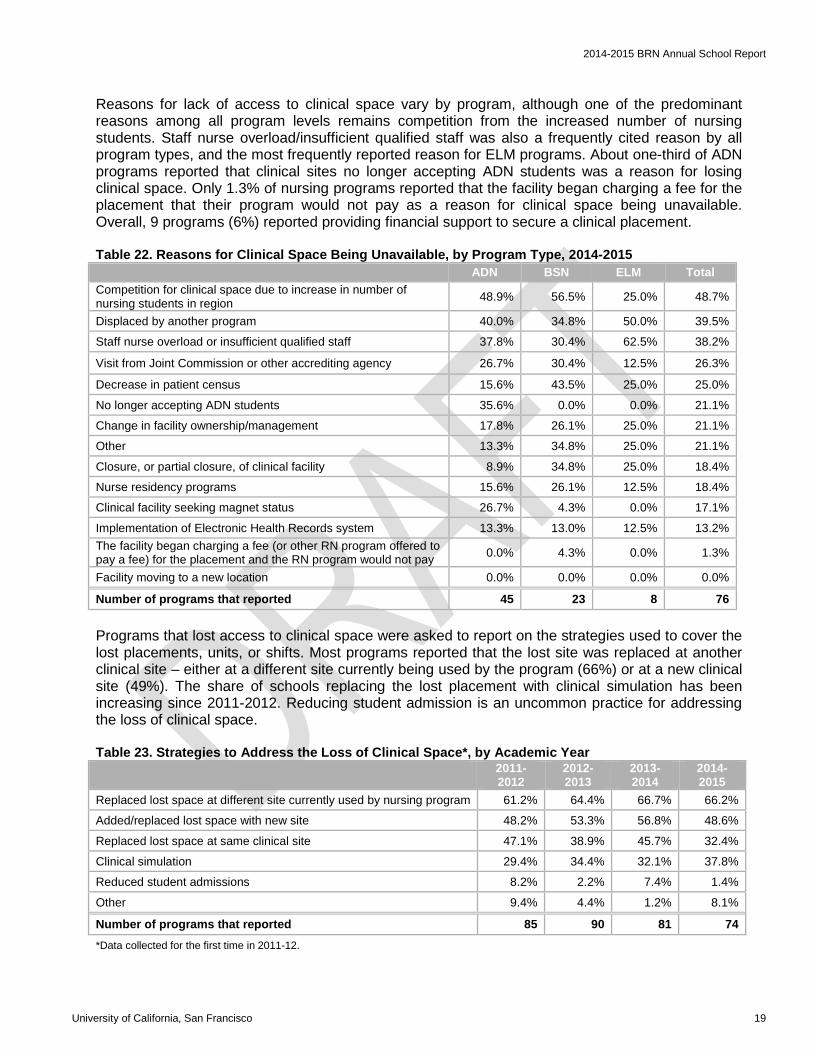
2014-2015 BRN Annual School Report
Reasons for lack of access to clinical space vary by program, although one of the predominant reasons among all program levels remains competition from the increased number of nursing students. Staff nurse overload/insufficient qualified staff was also a frequently cited reason by all program types, and the most frequently reported reason for ELM programs. About one-third of ADN programs reported that clinical sites no longer accepting ADN students was a reason for losing clinical space. Only 1.3% of nursing programs reported that the facility began charging a fee for the placement that their program would not pay as a reason for clinical space being unavailable. Overall, 9 programs (6%) reported providing financial support to secure a clinical placement. Table 22. Reasons for Clinical Space Being Unavailable, by Program Type, 2014-2015
ADN BSN ELM Total Competition for clinical space due to increase in number of nursing students in region 48.9% 56.5% 25.0% 48.7%
Displaced by another program 40.0% 34.8% 50.0% 39.5%
Staff nurse overload or insufficient qualified staff 37.8% 30.4% 62.5% 38.2%
Visit from Joint Commission or other accrediting agency 26.7% 30.4% 12.5% 26.3%
Decrease in patient census 15.6% 43.5% 25.0% 25.0%
No longer accepting ADN students 35.6% 0.0% 0.0% 21.1%
Change in facility ownership/management 17.8% 26.1% 25.0% 21.1%
Other 13.3% 34.8% 25.0% 21.1%
Closure, or partial closure, of clinical facility 8.9% 34.8% 25.0% 18.4%
Nurse residency programs 15.6% 26.1% 12.5% 18.4%
Clinical facility seeking magnet status 26.7% 4.3% 0.0% 17.1%
Implementation of Electronic Health Records system 13.3% 13.0% 12.5% 13.2% The facility began charging a fee (or other RN program offered to pay a fee) for the placement and the RN program would not pay 0.0% 4.3% 0.0% 1.3%
Facility moving to a new location 0.0% 0.0% 0.0% 0.0%
Number of programs that reported 45 23 8 76 Programs that lost access to clinical space were asked to report on the strategies used to cover the lost placements, units, or shifts. Most programs reported that the lost site was replaced at another clinical site – either at a different site currently being used by the program (66%) or at a new clinical site (49%). The share of schools replacing the lost placement with clinical simulation has been increasing since 2011-2012. Reducing student admission is an uncommon practice for addressing the loss of clinical space. Table 23. Strategies to Address the Loss of Clinical Space*, by Academic Year 2011-
2012 2012-2013
2013-2014
2014-2015
Replaced lost space at different site currently used by nursing program 61.2% 64.4% 66.7% 66.2%
Added/replaced lost space with new site 48.2% 53.3% 56.8% 48.6%
Replaced lost space at same clinical site 47.1% 38.9% 45.7% 32.4%
Clinical simulation 29.4% 34.4% 32.1% 37.8%
Reduced student admissions 8.2% 2.2% 7.4% 1.4%
Other 9.4% 4.4% 1.2% 8.1%
Number of programs that reported 85 90 81 74 *Data collected for the first time in 2011-12.
University of California, San Francisco 19

2014-2015 BRN Annual School Report
Thirty-seven (26%) nursing programs in the state reported an increase in out-of-hospital clinical placements in 2014-2015 which is the lowest number reported for the past six years. For the last three years, the most frequently reported non-hospital clinical site was a skilled nursing/rehabilitation facility, reported by 49% of all responding programs in 2014-2015. Public health or community health facilities are also common alternatives for hospital clinical placements (43%). Since 2010-2011, the shares of nursing programs using school health service and correctional facilities as an alternative for hospital placements have been increasing. Table 24. Alternative Out-of-Hospital Clinical Sites* Used by RN Programs, by Academic Year 2010-
2011 2011-2012
2012-2013
2013-2014
2014-2015
Skilled nursing/rehabilitation facility 47.3% 46.4% 45.0% 43.9% 48.6%
Public health or community health agency 43.6% 51.8% 55.0% 53.7% 43.2%
School health service (K-12 or college) 30.9% 30.4% 22.5% 39.0% 40.5%
Medical practice, clinic, physician office 23.6% 33.9% 22.5% 34.1% 32.4%
Outpatient mental health/substance abuse 36.4% 42.9% 20.0% 39.0% 29.7%
Surgery center/ambulatory care center 20.0% 23.2% 30.0% 19.5% 29.7%
Hospice 25.5% 25.0% 27.5% 29.3% 24.3%
Home health agency/home health service 30.9% 32.1% 35.0% 29.3% 21.6%
Correctional facility, prison or jail 5.5% 7.1% 5.0% 7.3% 10.8%
Case management/disease management 7.3% 12.5% 5.0% 12.2% 8.1%
Urgent care, not hospital-based 9.1% 12.5% 5.0% 7.3% 8.1%
Renal dialysis unit 12.7% 5.4% 5.0% 4.9% 5.4%
Occupational health or employee health service 5.5% 5.4% 0% 2.4% 0.0%
Other 12.2% 13.5%
Number of programs that reported 55 56 40 41 37
*These data were collected for the first time in 2010-2011.
University of California, San Francisco 20
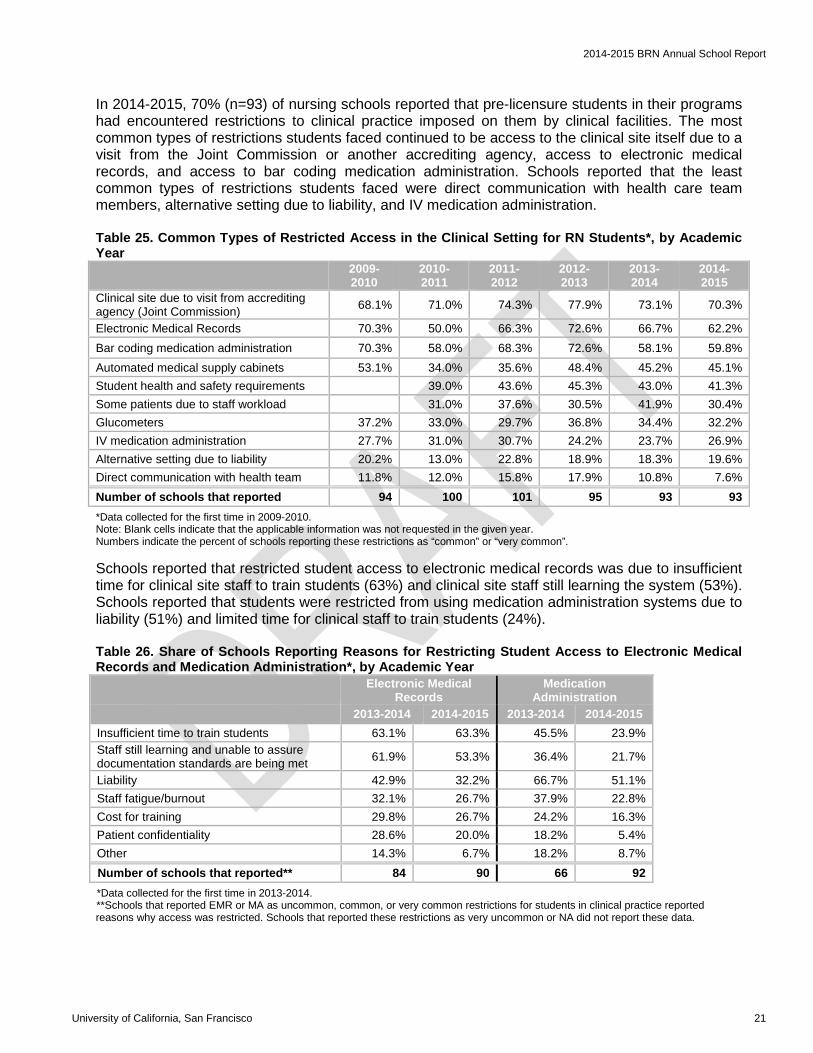
2014-2015 BRN Annual School Report
In 2014-2015, 70% (n=93) of nursing schools reported that pre-licensure students in their programs had encountered restrictions to clinical practice imposed on them by clinical facilities. The most common types of restrictions students faced continued to be access to the clinical site itself due to a visit from the Joint Commission or another accrediting agency, access to electronic medical records, and access to bar coding medication administration. Schools reported that the least common types of restrictions students faced were direct communication with health care team members, alternative setting due to liability, and IV medication administration. Table 25. Common Types of Restricted Access in the Clinical Setting for RN Students*, by Academic Year 2009-
2010 2010-2011
2011-2012
2012-2013
2013-2014
2014-2015
Clinical site due to visit from accrediting agency (Joint Commission) 68.1% 71.0% 74.3% 77.9% 73.1% 70.3%
Electronic Medical Records 70.3% 50.0% 66.3% 72.6% 66.7% 62.2% Bar coding medication administration 70.3% 58.0% 68.3% 72.6% 58.1% 59.8% Automated medical supply cabinets 53.1% 34.0% 35.6% 48.4% 45.2% 45.1% Student health and safety requirements 39.0% 43.6% 45.3% 43.0% 41.3% Some patients due to staff workload 31.0% 37.6% 30.5% 41.9% 30.4% Glucometers 37.2% 33.0% 29.7% 36.8% 34.4% 32.2% IV medication administration 27.7% 31.0% 30.7% 24.2% 23.7% 26.9% Alternative setting due to liability 20.2% 13.0% 22.8% 18.9% 18.3% 19.6% Direct communication with health team 11.8% 12.0% 15.8% 17.9% 10.8% 7.6% Number of schools that reported 94 100 101 95 93 93 *Data collected for the first time in 2009-2010. Note: Blank cells indicate that the applicable information was not requested in the given year. Numbers indicate the percent of schools reporting these restrictions as “common” or “very common”. Schools reported that restricted student access to electronic medical records was due to insufficient time for clinical site staff to train students (63%) and clinical site staff still learning the system (53%). Schools reported that students were restricted from using medication administration systems due to liability (51%) and limited time for clinical staff to train students (24%). Table 26. Share of Schools Reporting Reasons for Restricting Student Access to Electronic Medical Records and Medication Administration*, by Academic Year
Electronic Medical Records
Medication Administration
2013-2014 2014-2015 2013-2014 2014-2015 Insufficient time to train students 63.1% 63.3% 45.5% 23.9% Staff still learning and unable to assure documentation standards are being met 61.9% 53.3% 36.4% 21.7%
Liability 42.9% 32.2% 66.7% 51.1% Staff fatigue/burnout 32.1% 26.7% 37.9% 22.8% Cost for training 29.8% 26.7% 24.2% 16.3% Patient confidentiality 28.6% 20.0% 18.2% 5.4% Other 14.3% 6.7% 18.2% 8.7% Number of schools that reported** 84 90 66 92 *Data collected for the first time in 2013-2014. **Schools that reported EMR or MA as uncommon, common, or very common restrictions for students in clinical practice reported reasons why access was restricted. Schools that reported these restrictions as very uncommon or NA did not report these data.
University of California, San Francisco 21
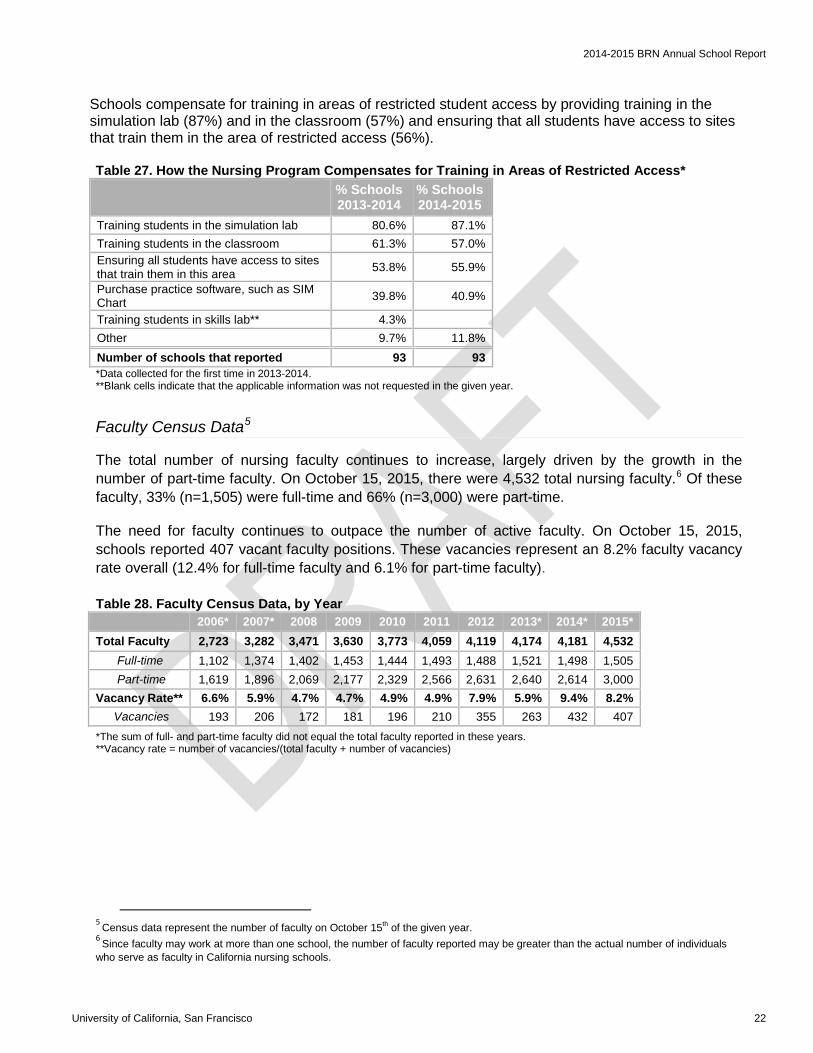
2014-2015 BRN Annual School Report
Schools compensate for training in areas of restricted student access by providing training in the simulation lab (87%) and in the classroom (57%) and ensuring that all students have access to sites that train them in the area of restricted access (56%). Table 27. How the Nursing Program Compensates for Training in Areas of Restricted Access* % Schools
2013-2014 % Schools 2014-2015
Training students in the simulation lab 80.6% 87.1% Training students in the classroom 61.3% 57.0% Ensuring all students have access to sites that train them in this area 53.8% 55.9%
Purchase practice software, such as SIM Chart 39.8% 40.9%
Training students in skills lab** 4.3% Other 9.7% 11.8% Number of schools that reported 93 93 *Data collected for the first time in 2013-2014. **Blank cells indicate that the applicable information was not requested in the given year.
Faculty Census Data5
The total number of nursing faculty continues to increase, largely driven by the growth in the number of part-time faculty. On October 15, 2015, there were 4,532 total nursing faculty.6 Of these faculty, 33% (n=1,505) were full-time and 66% (n=3,000) were part-time. The need for faculty continues to outpace the number of active faculty. On October 15, 2015, schools reported 407 vacant faculty positions. These vacancies represent an 8.2% faculty vacancy rate overall (12.4% for full-time faculty and 6.1% for part-time faculty). Table 28. Faculty Census Data, by Year
2006* 2007* 2008 2009 2010 2011 2012 2013* 2014* 2015* Total Faculty 2,723 3,282 3,471 3,630 3,773 4,059 4,119 4,174 4,181 4,532
Full-time 1,102 1,374 1,402 1,453 1,444 1,493 1,488 1,521 1,498 1,505 Part-time 1,619 1,896 2,069 2,177 2,329 2,566 2,631 2,640 2,614 3,000
Vacancy Rate** 6.6% 5.9% 4.7% 4.7% 4.9% 4.9% 7.9% 5.9% 9.4% 8.2% Vacancies 193 206 172 181 196 210 355 263 432 407
*The sum of full- and part-time faculty did not equal the total faculty reported in these years. **Vacancy rate = number of vacancies/(total faculty + number of vacancies)
5 Census data represent the number of faculty on October 15th of the given year. 6 Since faculty may work at more than one school, the number of faculty reported may be greater than the actual number of individuals who serve as faculty in California nursing schools.
University of California, San Francisco 22

2014-2015 BRN Annual School Report
In 2014-2015, 85 of 132 schools (64%) reported that faculty in their programs work an overloaded schedule, and 97% (n=82) of these schools pay the faculty extra for the overloaded schedule.
Table 29. Faculty with Overloaded Schedules*, by Academic Year
2008-2009
2009-2010
2010-2011
2011-2012
2012-2013
2013-2014
2014-2015
Schools with overloaded faculty 81 84 85 87 94 99 85 Share of schools that pay faculty extra for the overload 92.6% 90.5% 92.9% 94.3% 93.6% 95.0% 96.5%
Total number of schools 125 125 131 132 133 131 132 *These data were collected for the first time in 2008-09.
University of California, San Francisco 23

2014-2015 BRN Annual School Report
Summary
Over the past decade, the number of California pre-licensure nursing programs has grown dramatically, increasing from 117 programs in 2005-2006 to 141 programs in 2014-2015. In the past ten years, the share of nursing programs that partner with other schools to offer programs that lead to a higher degree increased from 9 to 69.
California RN programs reported number of admission spaces available has fluctuated over the past nine years. New student enrollments have also fluctuated over the past nine years, reaching a peak of 14,228 in 2009-2010 and remaining stable around 13,200 for the past three years. This decline was largely due to fewer qualified applications to ADN programs.
Pre-licensure RN programs reported 11,005 completions in 2014-2015 —a 46% increase in student completions since 2005-2006. After four consecutive years of growth in the number of graduates from California nursing programs, programs reported fewer students graduating from their programs in 2010-2011 compared to the previous year. The number of graduates has fluctuated slightly since 2010-2011.
After three years of an increasing average retention rate, to its ten-year high of 81% in 2012-2013, the retention rate declined to 79% in 2014-2015. If retention rates remain at current levels, the declining rate of growth among new student enrollments will likely lead to further declines in the number of graduates from California nursing programs. At the time of the survey, 10% of new nursing program graduates were unable to find employment, which is a decline from the high of 28% in 2009-2010. The number of new graduates employed in California has increased for the second year and was reported at 73%.
Clinical simulation has become widespread in nursing education, with 91% (n=129) of programs reporting using it in some capacity in 2015. The importance of clinical simulation is underscored by data showing the continued use of out-of-hospital clinical placements and programs continuing to report being denied access to clinical placement sites that were previously available to them. In addition, the majority of schools—73% in 2014-2015—reported that their students had faced restrictions to specific types of clinical practice.
Expansion in RN education has required nursing programs to hire more faculty to teach the growing number of students. Even as the number of new student enrollments has started to decline, the number of faculty has continued to rise, largely driven by increases in part-time faculty as the number of full-time faculty has stayed relatively level since 2011. The number of nursing faculty has increased by 66% in the past ten years, from 2,723 in 2006 to 4,532 in 2015. In 2015, 407 faculty vacancies were reported, representing an overall faculty vacancy rate of 8.2% (12.4% for full-time faculty and 6.1% for part-time faculty). This vacancy rate is the second highest reported in the last ten years but a slight decrease from 2014.
University of California, San Francisco 24
2014-2015 BRN Annual School Report
APPENDICES
APPENDIX A – List of Survey Respondents by Degree Program ADN Programs (83) American Career College* American River College Antelope Valley College Bakersfield College Butte Community College Cabrillo College Cerritos College Chabot College Chaffey College Citrus College City College of San Francisco CNI College College of Marin College of San Mateo College of the Canyons College of the Desert College of the Redwoods College of the Sequoias Contra Costa College Copper Mountain College Cuesta College Cypress College De Anza Community College East Los Angeles College El Camino College El Camino College - Compton Educ Center Evergreen Valley College Fresno City College Glendale Community College Golden West College Grossmont College Hartnell College Imperial Valley College ITT Technical Institute Kaplan College Long Beach City College Los Angeles City College Los Angeles County College of Nursing & Allied Health Los Angeles Harbor College Los Angeles Pierce College Los Angeles Southwest College Los Angeles Trade-Tech College
Los Angeles Valley College Los Medanos College Mendocino College Merced College Merritt College Mira Costa College Modesto Junior College Monterey Peninsula College Moorpark College Mount Saint Mary's University Los Angeles AD Mount San Antonio College Mount San Jacinto College Napa Valley College Ohlone College Pacific Union College Palomar College Pasadena City College Porterville College Rio Hondo College Riverside City College Sacramento City College Saddleback College San Bernardino Valley College San Diego City College San Joaquin Delta College San Joaquin Valley College Santa Ana College Santa Barbara City College Santa Monica College Santa Rosa Junior College Shasta College Shepherd University Sierra College Solano Community College Southwestern Community College Stanbridge College Ventura College Victor Valley College Weimar Institute* West Hills College Yuba College .
University of California, San Francisco 25
2014-2015 BRN Annual School Report
LVN to ADN Programs Only (7) Allan Hancock College Carrington College College of the Siskiyous Gavilan College Mission College
Reedley College at Madera Community College Center Unitek College
BSN Programs (35) American University of Health Sciences Azusa Pacific University Biola University Concordia University Irvine CSU Bakersfield CSU Channel Islands CSU Chico CSU Dominguez Hills CSU East Bay CSU Fresno CSU Fullerton CSU Long Beach CSU Northridge CSU Sacramento CSU San Bernardino CSU San Marcos CSU Stanislaus Dominican University of California Holy Names University
Loma Linda University Mount Saint Mary's University Los Angeles BSN National University Point Loma Nazarene University Samuel Merritt University San Diego State University San Francisco State University Simpson University Sonoma State University University of California Irvine University of California Los Angeles University of Phoenix University of San Francisco Valley Foundation School of Nursing at SJSU West Coast University Western Governors University
ELM Programs (16) Azusa Pacific University California Baptist University Charles R. Drew University CSU Dominguez Hills CSU Fresno CSU Fullerton CSU Long Beach CSU Los Angeles Samuel Merritt University
San Francisco State University United States University University of California Los Angeles University of California San Francisco University of San Diego, Hahn School of Nursing University of San Francisco Western University of Health Sciences
* - New GADN programs in 2014-2015.
University of California, San Francisco 26
2014-2015 BRN Annual School Report
APPENDIX B – BRN Education Issues Workgroup Members Members Organization Loucine Huckabay, Chair California State University, Long Beach Judee Berg California Institute for Nursing and Health Care Audrey Berman Samuel Merritt University Stephanie L. Decker Kaiser Permanente National Patient Care Services Brenda Fong Community College Chancellor’s Office Deloras Jones Independent Consultant, Former Executive Director of
California Institute for Nursing and Health Care Judy Martin-Holland University of California, San Francisco Robyn Nelson West Coast University Tammy Rice Saddleback College Stephanie R. Robinson Fresno City College Paulina Van California State University, East Bay Ex-Officio Member Louise Bailey California Board of Registered Nursing Project Manager Julie Campbell-Warnock California Board of Registered Nursing
University of California, San Francisco 27
California Board of Registered Nursing 2014-2015 Annual School Report
Data Summary for Pre-Licensure Nursing Programs
January 27, 2016
Prepared by: Lisel Blash, MPA Dennis Keane, MPH Joanne Spetz, PhD University of California, San Francisco 3333 California Street, Suite 265 San Francisco, CA 94118
University of California, San Francisco 1
2014-2015 BRN Annual School Report – Data Summary
TABLE OF CONTENTS PREFACE ............................................................................................................................... 3
Nursing Education Survey Background ............................................................................... 3 Organization of Report ........................................................................................................ 3 Availability of Data ............................................................................................................... 3 Value of the Survey ............................................................................................................. 3 Survey Participation ............................................................................................................ 4
DATA SUMMARY – Pre-Licensure Programs ...................................................................... 5
Number of California Nursing Programs .............................................................................. 5 Number of Students who Enrolled in California Nursing Programs ...................................... 6 Newly Enrolled Nursing Students ........................................................................................ 8 Currently Enrolled Nursing Students .................................................................................. 12 Students who Completed a Nursing Program .................................................................... 15 Faculty Data ...................................................................................................................... 20 Nursing Program Data ....................................................................................................... 31 School Data ....................................................................................................................... 47
APPENDICES ....................................................................................................................... 61
APPENDIX A – List of Survey Respondents by Degree Program ...................................... 61 APPENDIX B – Definition List ............................................................................................ 63 APPENDIX C – BRN Education Issues Workgroup Members ........................................... 66
University of California, San Francisco 2
2014-2015 BRN Annual School Report – Data Summary
PREFACE
Nursing Education Survey Background Development of the 2014-2015 Board of Registered Nursing (BRN) school survey was the work of the Board's Education Issues Workgroup, which consists of nursing education stakeholders from across California. A list of workgroup members is included in the Appendices. The University of California, San Francisco was commissioned by the BRN to develop the online survey instrument, administer the survey, and report data collected from the survey.
Funding for this project was provided by the California Board of Registered Nursing.
Organization of Report The survey collects data about nursing programs and their students and faculty from August 1 through July 31. Annual data presented in this report represent August 1, 2014 through July 31, 2015. Demographic information and census data were requested for October 15, 2015.
Data from pre- and post-licensure nursing education programs are presented in separate reports and will be available on the BRN website. Data are presented in aggregate form and describe overall trends in the areas and over the times specified and, therefore, may not be applicable to individual nursing education programs.
Statistics for enrollments and completions represent two separate student populations. Therefore, it is not possible to directly compare enrollment and completion data.
Availability of Data The BRN Annual School Survey was designed to meet the data needs of the BRN as well as other interested organizations and agencies. A database with aggregate data derived from the last ten years of BRN School Surveys will be available for public access on the BRN website. Parties interested in accessing data not available on the website should contact Julie Campbell-Warnock at the BRN at [email protected].
Value of the Survey This survey has been developed to support nursing, nursing education and workforce planning in California. The Board of Registered Nursing believes that the results of this survey will provide data-driven evidence to influence policy at the local, state, federal and institutional levels.
The BRN extends appreciation to the Education Issues Workgroup and all survey respondents. Your participation has been vital to the success of this project.
University of California, San Francisco 3
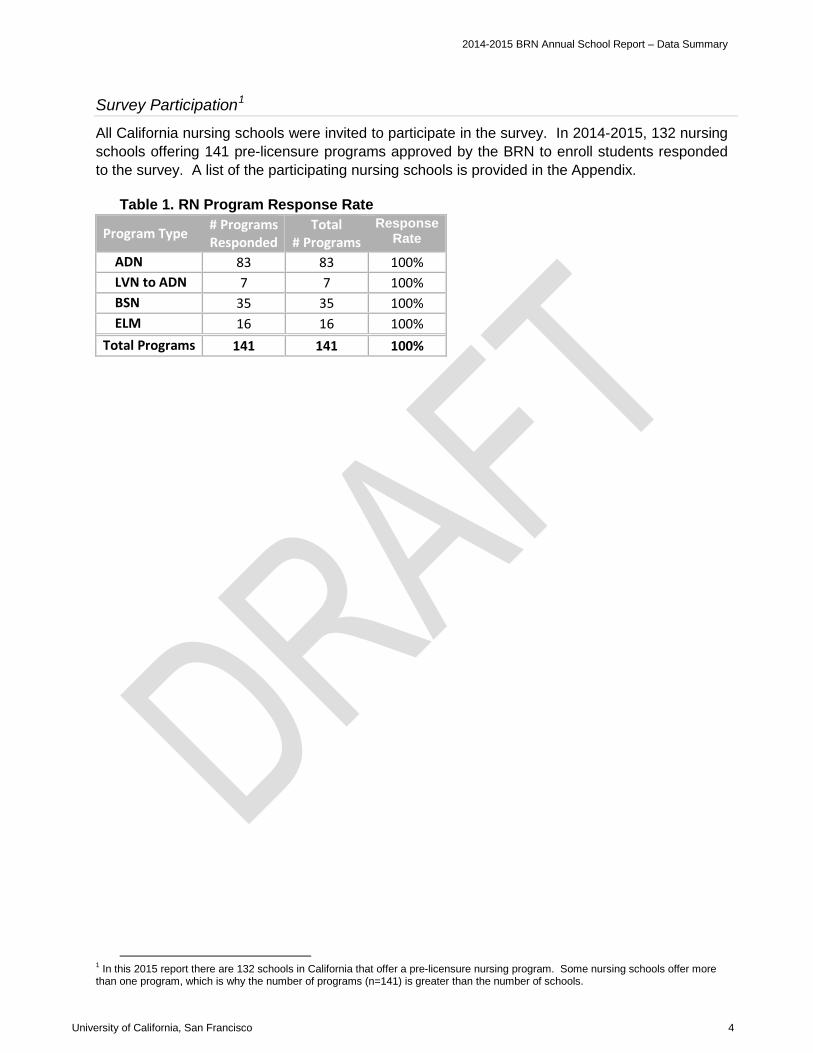
2014-2015 BRN Annual School Report – Data Summary
Survey Participation1
All California nursing schools were invited to participate in the survey. In 2014-2015, 132 nursing schools offering 141 pre-licensure programs approved by the BRN to enroll students responded to the survey. A list of the participating nursing schools is provided in the Appendix.
Table 1. RN Program Response Rate
1 In this 2015 report there are 132 schools in California that offer a pre-licensure nursing program. Some nursing schools offer more than one program, which is why the number of programs (n=141) is greater than the number of schools.
Program Type # Programs Responded
Total # Programs
Response Rate
ADN 83 83 100% LVN to ADN 7 7 100% BSN 35 35 100% ELM 16 16 100%
Total Programs 141 141 100%
University of California, San Francisco 4
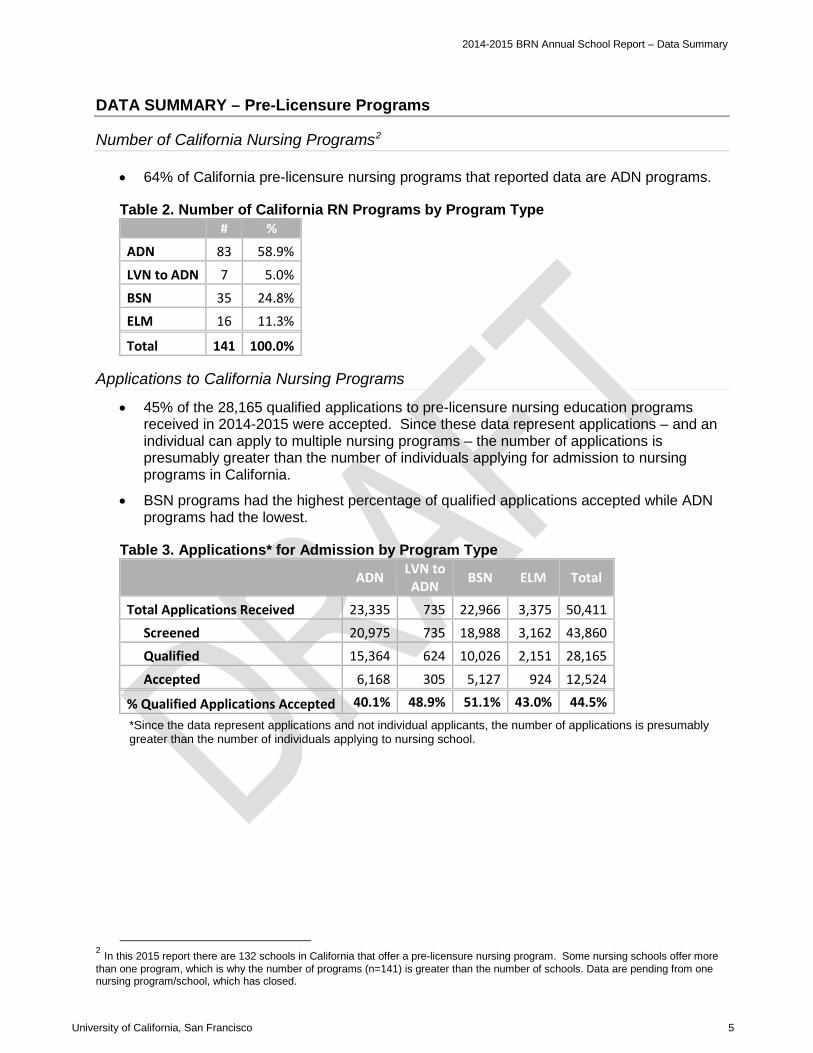
2014-2015 BRN Annual School Report – Data Summary
DATA SUMMARY – Pre-Licensure Programs
Number of California Nursing Programs2
• 64% of California pre-licensure nursing programs that reported data are ADN programs.
Table 2. Number of California RN Programs by Program Type # %
ADN 83 58.9%
LVN to ADN 7 5.0% BSN 35 24.8% ELM 16 11.3%
Total 141 100.0%
Applications to California Nursing Programs
• 45% of the 28,165 qualified applications to pre-licensure nursing education programs received in 2014-2015 were accepted. Since these data represent applications – and an individual can apply to multiple nursing programs – the number of applications is presumably greater than the number of individuals applying for admission to nursing programs in California.
• BSN programs had the highest percentage of qualified applications accepted while ADN programs had the lowest.
Table 3. Applications* for Admission by Program Type
ADN LVN to ADN BSN ELM Total
Total Applications Received 23,335 735 22,966 3,375 50,411 Screened 20,975 735 18,988 3,162 43,860 Qualified 15,364 624 10,026 2,151 28,165
Accepted 6,168 305 5,127 924 12,524
% Qualified Applications Accepted 40.1% 48.9% 51.1% 43.0% 44.5% *Since the data represent applications and not individual applicants, the number of applications is presumably greater than the number of individuals applying to nursing school.
2 In this 2015 report there are 132 schools in California that offer a pre-licensure nursing program. Some nursing schools offer more than one program, which is why the number of programs (n=141) is greater than the number of schools. Data are pending from one nursing program/school, which has closed.
University of California, San Francisco 5
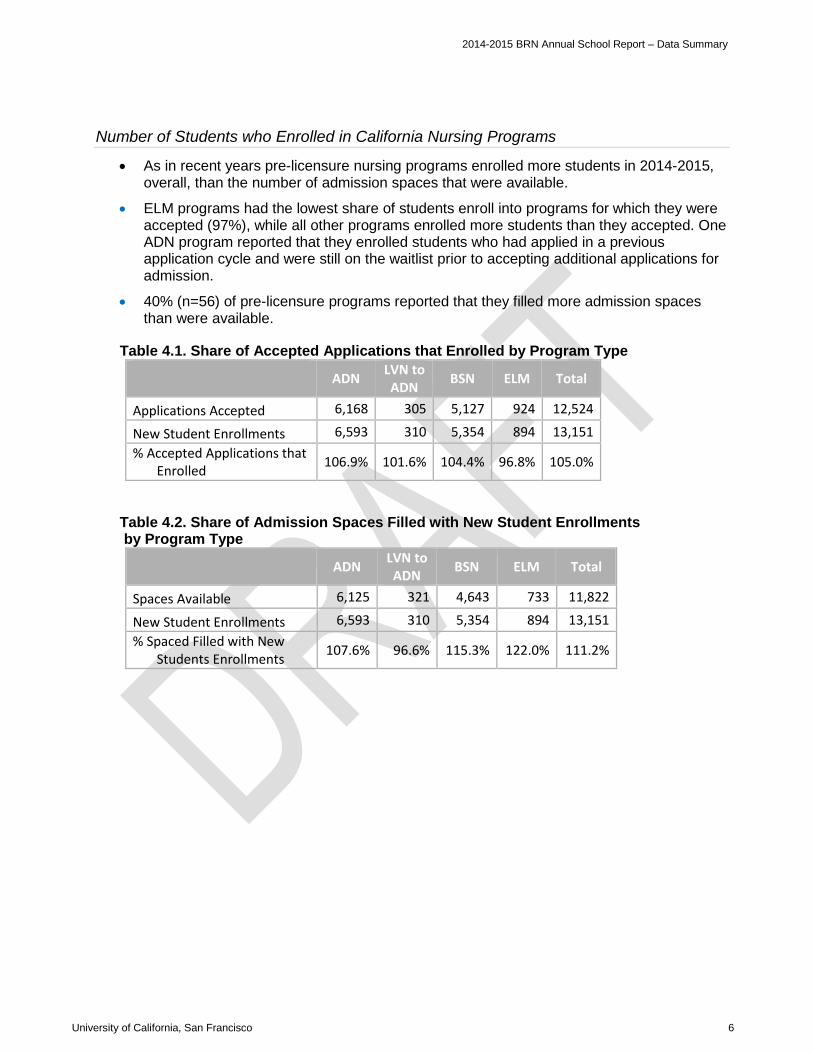
2014-2015 BRN Annual School Report – Data Summary
Number of Students who Enrolled in California Nursing Programs
• As in recent years pre-licensure nursing programs enrolled more students in 2014-2015, overall, than the number of admission spaces that were available.
• ELM programs had the lowest share of students enroll into programs for which they were accepted (97%), while all other programs enrolled more students than they accepted. One ADN program reported that they enrolled students who had applied in a previous application cycle and were still on the waitlist prior to accepting additional applications for admission.
• 40% (n=56) of pre-licensure programs reported that they filled more admission spaces than were available.
Table 4.1. Share of Accepted Applications that Enrolled by Program Type ADN LVN to
ADN BSN ELM Total
Applications Accepted 6,168 305 5,127 924 12,524
New Student Enrollments 6,593 310 5,354 894 13,151 % Accepted Applications that
Enrolled 106.9% 101.6% 104.4% 96.8% 105.0%
Table 4.2. Share of Admission Spaces Filled with New Student Enrollments by Program Type
ADN LVN to ADN BSN ELM Total
Spaces Available 6,125 321 4,643 733 11,822
New Student Enrollments 6,593 310 5,354 894 13,151 % Spaced Filled with New
Students Enrollments 107.6% 96.6% 115.3% 122.0% 111.2%
University of California, San Francisco 6

2014-2015 BRN Annual School Report – Data Summary
• In 2014-2015, 23% of programs (n=31) reported enrolling fewer students than the previous year. The most common reasons programs gave for enrolling fewer students were “accepted students did not enroll” and “lost funding”.
Table 5.1 Programs That Enrolled Fewer Students in 2014-2015
Type of Program % of programs
ADN 22.9% BSN 22.7% ELM 28.0% Total 22.5% Programs reporting 138
Table 5.2 Reasons for Enrolling Fewer Students
% of programs
Accepted students did not enroll 45.2% Lost funding 19.4% College/university / BRN requirement to reduce enrollment
16.1%
To reduce costs 16.1%
Insufficient faculty 16.1%
Other 16.1% Unable to secure clinical placements for all students 12.9%
Lack of qualified applicants 9.7% Program discontinued 9.7% All Reporting 31
University of California, San Francisco 7
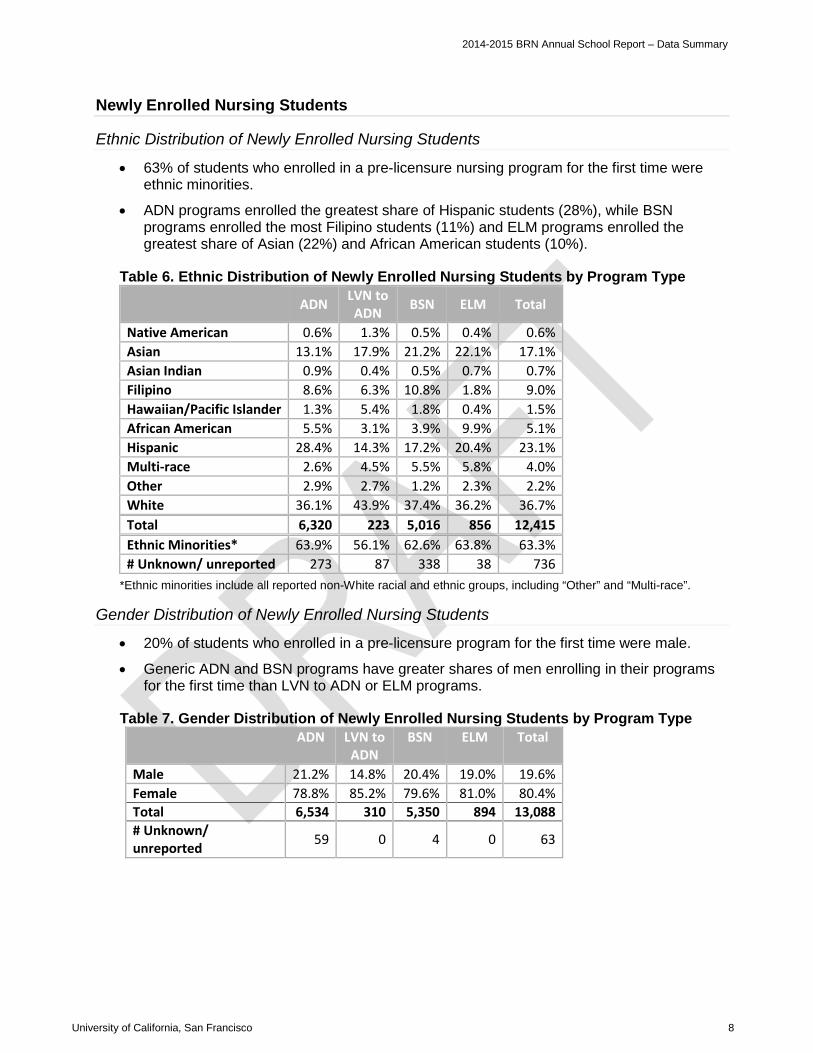
2014-2015 BRN Annual School Report – Data Summary
Newly Enrolled Nursing Students
Ethnic Distribution of Newly Enrolled Nursing Students
• 63% of students who enrolled in a pre-licensure nursing program for the first time were ethnic minorities.
• ADN programs enrolled the greatest share of Hispanic students (28%), while BSN programs enrolled the most Filipino students (11%) and ELM programs enrolled the greatest share of Asian (22%) and African American students (10%).
Table 6. Ethnic Distribution of Newly Enrolled Nursing Students by Program Type ADN LVN to
ADN BSN ELM Total
Native American 0.6% 1.3% 0.5% 0.4% 0.6% Asian 13.1% 17.9% 21.2% 22.1% 17.1% Asian Indian 0.9% 0.4% 0.5% 0.7% 0.7% Filipino 8.6% 6.3% 10.8% 1.8% 9.0% Hawaiian/Pacific Islander 1.3% 5.4% 1.8% 0.4% 1.5% African American 5.5% 3.1% 3.9% 9.9% 5.1% Hispanic 28.4% 14.3% 17.2% 20.4% 23.1% Multi-race 2.6% 4.5% 5.5% 5.8% 4.0% Other 2.9% 2.7% 1.2% 2.3% 2.2% White 36.1% 43.9% 37.4% 36.2% 36.7% Total 6,320 223 5,016 856 12,415 Ethnic Minorities* 63.9% 56.1% 62.6% 63.8% 63.3% # Unknown/ unreported 273 87 338 38 736
*Ethnic minorities include all reported non-White racial and ethnic groups, including “Other” and “Multi-race”.
Gender Distribution of Newly Enrolled Nursing Students
• 20% of students who enrolled in a pre-licensure program for the first time were male.
• Generic ADN and BSN programs have greater shares of men enrolling in their programs for the first time than LVN to ADN or ELM programs.
Table 7. Gender Distribution of Newly Enrolled Nursing Students by Program Type ADN LVN to
ADN BSN ELM Total
Male 21.2% 14.8% 20.4% 19.0% 19.6% Female 78.8% 85.2% 79.6% 81.0% 80.4% Total 6,534 310 5,350 894 13,088 # Unknown/ unreported 59 0 4 0 63
University of California, San Francisco 8
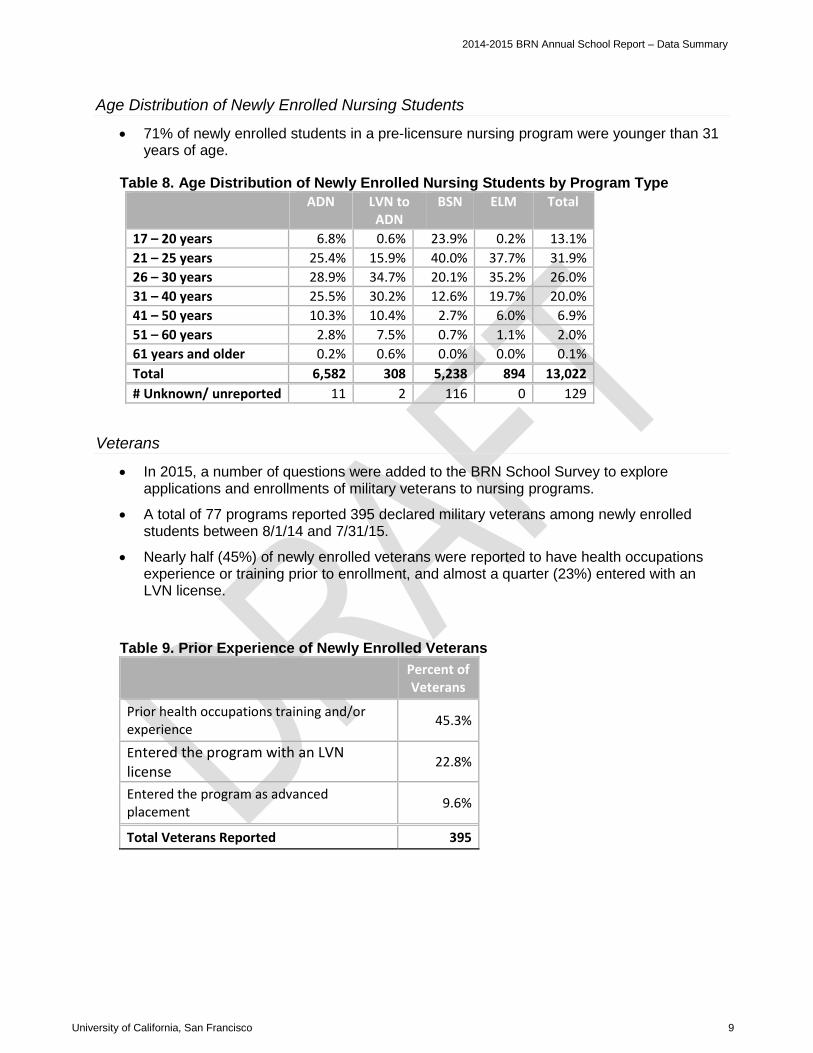
2014-2015 BRN Annual School Report – Data Summary
Age Distribution of Newly Enrolled Nursing Students
• 71% of newly enrolled students in a pre-licensure nursing program were younger than 31 years of age.
Table 8. Age Distribution of Newly Enrolled Nursing Students by Program Type ADN LVN to
ADN BSN ELM Total
17 – 20 years 6.8% 0.6% 23.9% 0.2% 13.1% 21 – 25 years 25.4% 15.9% 40.0% 37.7% 31.9% 26 – 30 years 28.9% 34.7% 20.1% 35.2% 26.0% 31 – 40 years 25.5% 30.2% 12.6% 19.7% 20.0% 41 – 50 years 10.3% 10.4% 2.7% 6.0% 6.9% 51 – 60 years 2.8% 7.5% 0.7% 1.1% 2.0% 61 years and older 0.2% 0.6% 0.0% 0.0% 0.1% Total 6,582 308 5,238 894 13,022 # Unknown/ unreported 11 2 116 0 129
Veterans
• In 2015, a number of questions were added to the BRN School Survey to explore applications and enrollments of military veterans to nursing programs.
• A total of 77 programs reported 395 declared military veterans among newly enrolled students between 8/1/14 and 7/31/15.
• Nearly half (45%) of newly enrolled veterans were reported to have health occupations experience or training prior to enrollment, and almost a quarter (23%) entered with an LVN license.
Table 9. Prior Experience of Newly Enrolled Veterans
Percent of Veterans
Prior health occupations training and/or experience 45.3%
Entered the program with an LVN license
22.8%
Entered the program as advanced placement 9.6%
Total Veterans Reported 395
University of California, San Francisco 9

2014-2015 BRN Annual School Report – Data Summary
• 47 programs reported that special admission considerations are offered for military
veterans; the most common special consideration offered was credit for equivalent courses or transfer credits (60%). Credit for pre-requisites and fundamentals for military medic or corpsman experience was reported by 30% of programs.
Table 10. Special Admission Considerations Offered Veterans %
Credit for equivalent courses or transfer credits 59.6%
Credit for pre-requisites and fundamentals for military medic or corpsman experience 29.8%
Review of individual transcripts 25.5% No special consideration for admission 14.9% Priority admission 14.9% Other 8.5%
Total Programs Reporting 47
• The most common special option offered was challenge exams, regardless of LVN licensure (49%).
Table 11. Special Options, Tracks, or Services Offered Veterans %
Offering challenge exams, regardless of LVN licensure 48.7%
No special options, tracks or services offered 43.6%
Counseling 17.9%
Offering challenge exams, if the veteran has an LVN license 16.7%
Medic/LVN to RN program 11.5% Other 11.5%
NCLEX support course specifically for veterans 0.0%
Total Programs Reporting 78
University of California, San Francisco 10
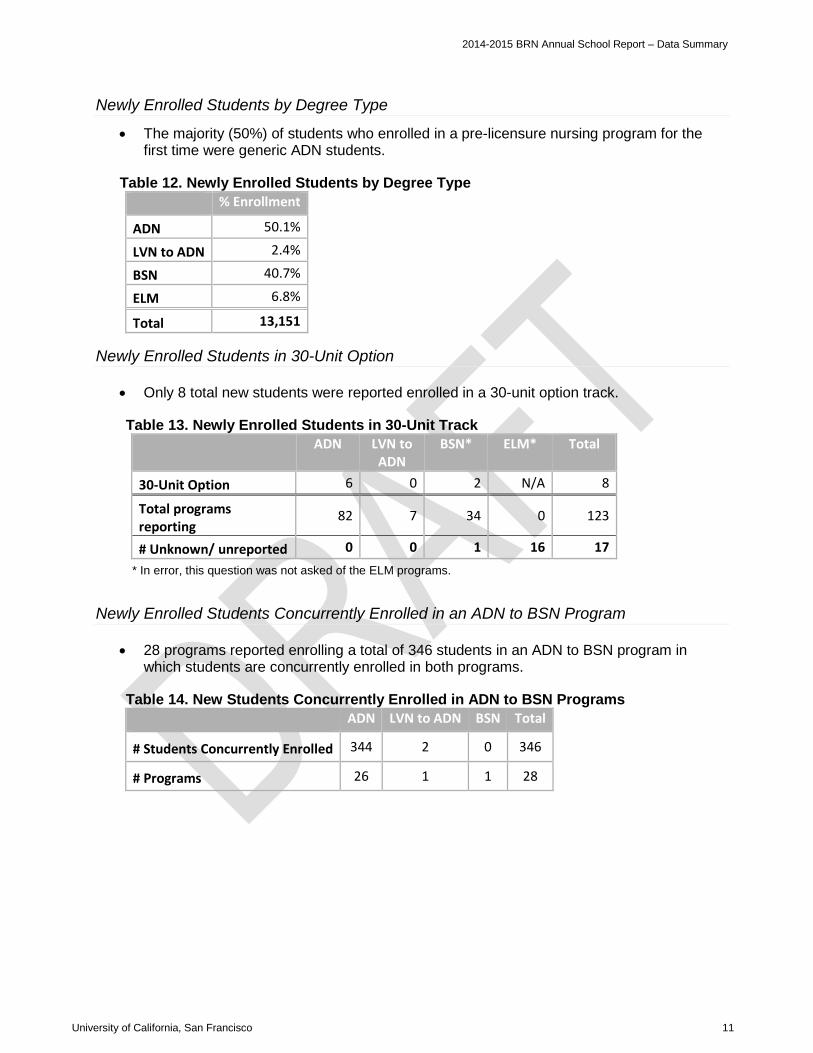
2014-2015 BRN Annual School Report – Data Summary
Newly Enrolled Students by Degree Type
• The majority (50%) of students who enrolled in a pre-licensure nursing program for the first time were generic ADN students.
Table 12. Newly Enrolled Students by Degree Type % Enrollment
ADN 50.1%
LVN to ADN 2.4%
BSN 40.7%
ELM 6.8%
Total 13,151
Newly Enrolled Students in 30-Unit Option
• Only 8 total new students were reported enrolled in a 30-unit option track.
Table 13. Newly Enrolled Students in 30-Unit Track ADN LVN to
ADN BSN* ELM* Total
30-Unit Option 6 0 2 N/A 8
Total programs reporting
82 7 34 0 123
# Unknown/ unreported 0 0 1 16 17 * In error, this question was not asked of the ELM programs.
Newly Enrolled Students Concurrently Enrolled in an ADN to BSN Program
• 28 programs reported enrolling a total of 346 students in an ADN to BSN program in which students are concurrently enrolled in both programs.
Table 14. New Students Concurrently Enrolled in ADN to BSN Programs ADN LVN to ADN BSN Total
# Students Concurrently Enrolled 344 2 0 346
# Programs 26 1 1 28
University of California, San Francisco 11

2014-2015 BRN Annual School Report – Data Summary
Currently Enrolled Nursing Students
Nursing Student Census Data
• On October 15, 2015, a total of 25,362 nursing students were enrolled in a California nursing program that leads to RN licensure.
• BSN programs had the greatest share of students enrolled, at 47% of all nursing students enrolled on October 15, 2015.
Table 15. Nursing Student Census Data by Program Type ADN LVN to ADN BSN ELM Total
Total Nursing Students 11,773 254 11,880 1,455 25,362
• Overall, 63% of students enrolled in a pre-licensure nursing program as of October 15, 2015 represented an ethnic minority group.
• The share of ethnic minority nursing students was similar across programs.
• Generic ADN programs had the greatest share of Hispanic (28%) while BSN programs have the most Asian (23%) and Filipino students (10%) and ELM students had the greatest share of African American students (9%).
Table 16. Ethnic Distribution of Nursing Student Census Data by Program Type ADN LVN to ADN BSN ELM Total
Native American 0.5% 0.5% 0.5% 0.4% 0.5% Asian 12.2% 16.7% 23.2% 22.1% 17.7% Asian Indian 0.9% 1.0% 1.9% 1.1% 1.4% Filipino 8.8% 7.4% 9.9% 2.3% 8.9% Hawaiian/Pacific Islander 1.3% 7.9% 0.8% 0.3% 1.0%
African American 5.2% 3.9% 3.7% 8.6% 4.7% Hispanic 28.1% 15.8% 17.7% 20.2% 22.9% Multi-race 3.1% 5.4% 4.8% 6.2% 4.1% Other 2.9% 3.9% 1.2% 1.6% 2.0% White 37.1% 37.4% 36.4% 37.4% 36.8%
Total 11,456 203 10,655 1,414 23,728
Ethnic Minorities* 62.9% 62.6% 63.6% 62.6% 63.2%
# Unknown/ unreported
317 51 1,225 41 1,634
*Ethnic minorities include all reported non-White racial and ethnic groups, including “Other” and “Multi-race”.
University of California, San Francisco 12
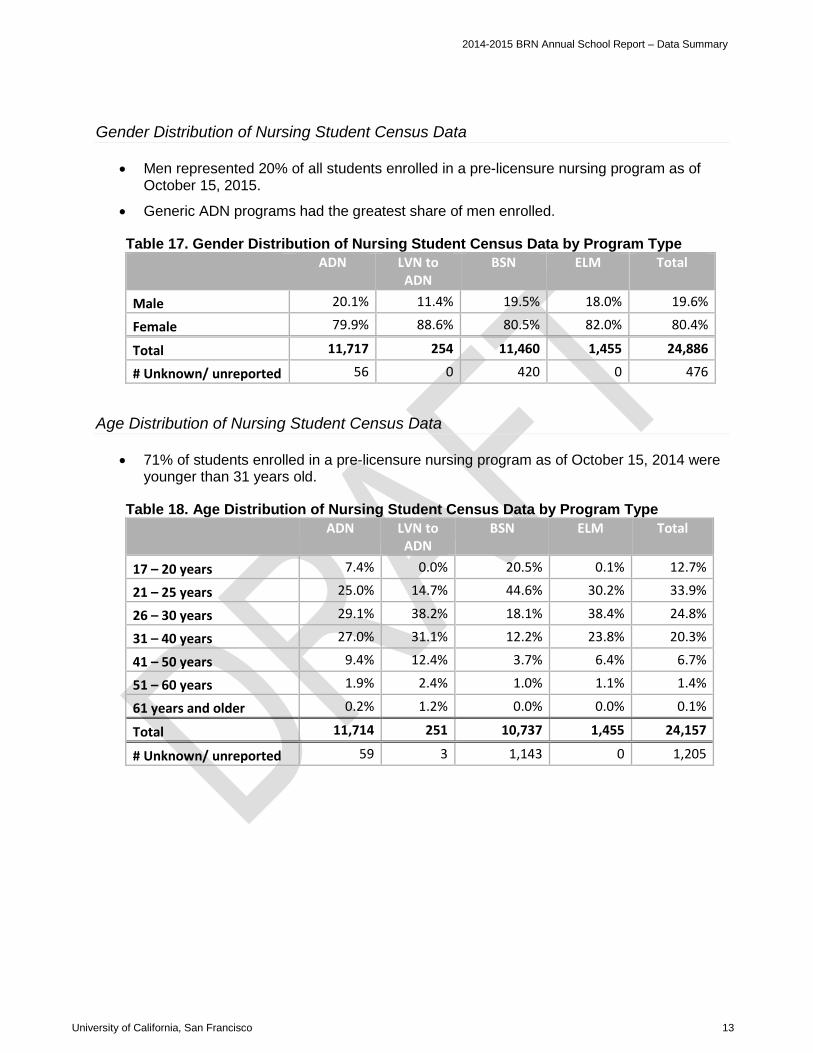
2014-2015 BRN Annual School Report – Data Summary
Gender Distribution of Nursing Student Census Data
• Men represented 20% of all students enrolled in a pre-licensure nursing program as of October 15, 2015.
• Generic ADN programs had the greatest share of men enrolled.
Table 17. Gender Distribution of Nursing Student Census Data by Program Type ADN LVN to
ADN BSN ELM Total
Male 20.1% 11.4% 19.5% 18.0% 19.6%
Female 79.9% 88.6% 80.5% 82.0% 80.4%
Total 11,717 254 11,460 1,455 24,886
# Unknown/ unreported 56 0 420 0 476
Age Distribution of Nursing Student Census Data
• 71% of students enrolled in a pre-licensure nursing program as of October 15, 2014 were younger than 31 years old.
Table 18. Age Distribution of Nursing Student Census Data by Program Type ADN LVN to
ADN BSN ELM Total
17 – 20 years 7.4% 0.0% 20.5% 0.1% 12.7%
21 – 25 years 25.0% 14.7% 44.6% 30.2% 33.9%
26 – 30 years 29.1% 38.2% 18.1% 38.4% 24.8%
31 – 40 years 27.0% 31.1% 12.2% 23.8% 20.3%
41 – 50 years 9.4% 12.4% 3.7% 6.4% 6.7%
51 – 60 years 1.9% 2.4% 1.0% 1.1% 1.4%
61 years and older 0.2% 1.2% 0.0% 0.0% 0.1%
Total 11,714 251 10,737 1,455 24,157
# Unknown/ unreported 59 3 1,143 0 1,205
University of California, San Francisco 13
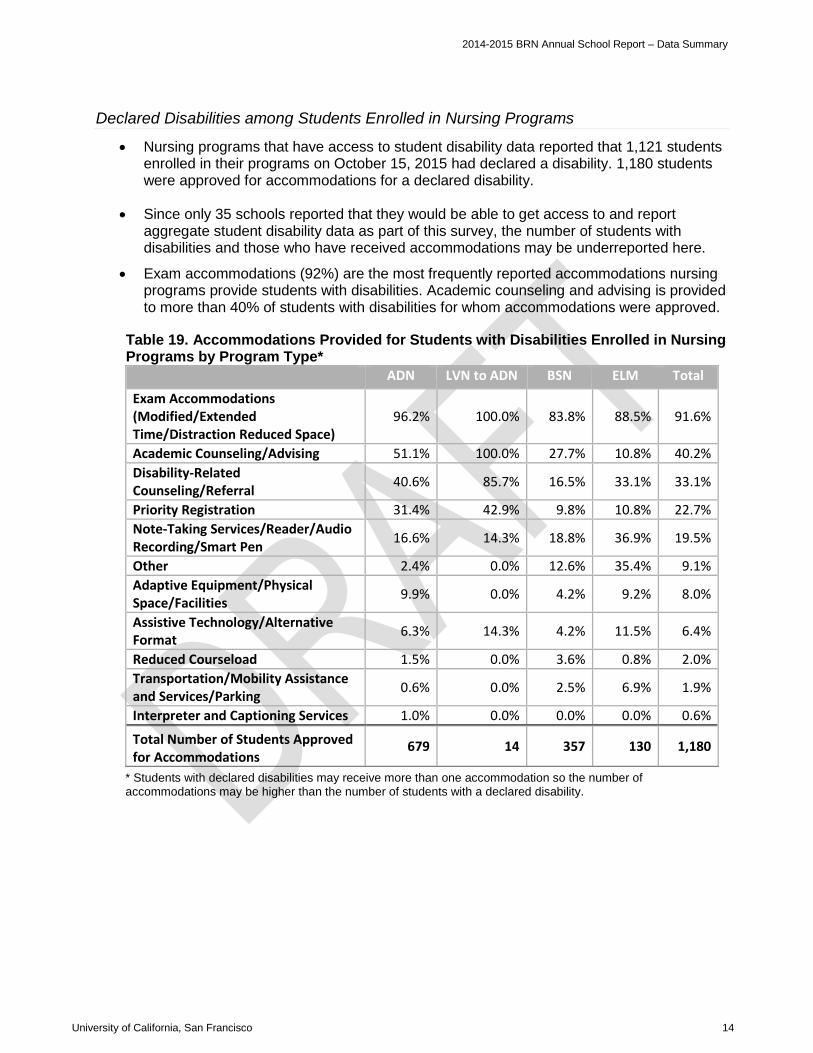
2014-2015 BRN Annual School Report – Data Summary
Declared Disabilities among Students Enrolled in Nursing Programs
• Nursing programs that have access to student disability data reported that 1,121 students enrolled in their programs on October 15, 2015 had declared a disability. 1,180 students were approved for accommodations for a declared disability.
• Since only 35 schools reported that they would be able to get access to and report aggregate student disability data as part of this survey, the number of students with disabilities and those who have received accommodations may be underreported here.
• Exam accommodations (92%) are the most frequently reported accommodations nursing programs provide students with disabilities. Academic counseling and advising is provided to more than 40% of students with disabilities for whom accommodations were approved.
Table 19. Accommodations Provided for Students with Disabilities Enrolled in Nursing Programs by Program Type*
ADN LVN to ADN BSN ELM Total Exam Accommodations (Modified/Extended Time/Distraction Reduced Space)
96.2% 100.0% 83.8% 88.5% 91.6%
Academic Counseling/Advising 51.1% 100.0% 27.7% 10.8% 40.2% Disability-Related Counseling/Referral 40.6% 85.7% 16.5% 33.1% 33.1%
Priority Registration 31.4% 42.9% 9.8% 10.8% 22.7% Note-Taking Services/Reader/Audio Recording/Smart Pen 16.6% 14.3% 18.8% 36.9% 19.5%
Other 2.4% 0.0% 12.6% 35.4% 9.1% Adaptive Equipment/Physical Space/Facilities 9.9% 0.0% 4.2% 9.2% 8.0%
Assistive Technology/Alternative Format 6.3% 14.3% 4.2% 11.5% 6.4%
Reduced Courseload 1.5% 0.0% 3.6% 0.8% 2.0% Transportation/Mobility Assistance and Services/Parking 0.6% 0.0% 2.5% 6.9% 1.9%
Interpreter and Captioning Services 1.0% 0.0% 0.0% 0.0% 0.6%
Total Number of Students Approved for Accommodations
679 14 357 130 1,180
* Students with declared disabilities may receive more than one accommodation so the number of accommodations may be higher than the number of students with a declared disability.
University of California, San Francisco 14
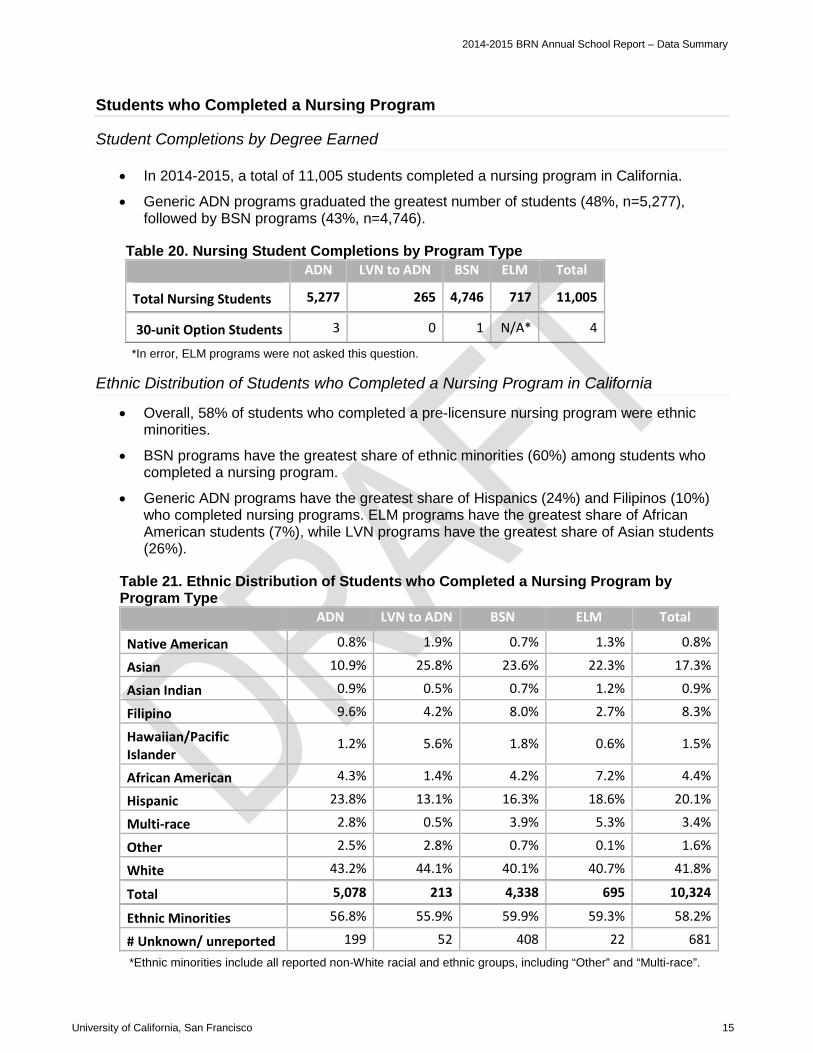
2014-2015 BRN Annual School Report – Data Summary
Students who Completed a Nursing Program
Student Completions by Degree Earned
• In 2014-2015, a total of 11,005 students completed a nursing program in California.
• Generic ADN programs graduated the greatest number of students (48%, n=5,277), followed by BSN programs (43%, n=4,746).
Table 20. Nursing Student Completions by Program Type ADN LVN to ADN BSN ELM Total
Total Nursing Students 5,277 265 4,746 717 11,005
30-unit Option Students 3 0 1 N/A* 4
*In error, ELM programs were not asked this question.
Ethnic Distribution of Students who Completed a Nursing Program in California
• Overall, 58% of students who completed a pre-licensure nursing program were ethnic minorities.
• BSN programs have the greatest share of ethnic minorities (60%) among students who completed a nursing program.
• Generic ADN programs have the greatest share of Hispanics (24%) and Filipinos (10%) who completed nursing programs. ELM programs have the greatest share of African American students (7%), while LVN programs have the greatest share of Asian students (26%).
Table 21. Ethnic Distribution of Students who Completed a Nursing Program by Program Type
ADN LVN to ADN BSN ELM Total
Native American 0.8% 1.9% 0.7% 1.3% 0.8%
Asian 10.9% 25.8% 23.6% 22.3% 17.3%
Asian Indian 0.9% 0.5% 0.7% 1.2% 0.9%
Filipino 9.6% 4.2% 8.0% 2.7% 8.3%
Hawaiian/Pacific Islander
1.2% 5.6% 1.8% 0.6% 1.5%
African American 4.3% 1.4% 4.2% 7.2% 4.4%
Hispanic 23.8% 13.1% 16.3% 18.6% 20.1%
Multi-race 2.8% 0.5% 3.9% 5.3% 3.4%
Other 2.5% 2.8% 0.7% 0.1% 1.6%
White 43.2% 44.1% 40.1% 40.7% 41.8%
Total 5,078 213 4,338 695 10,324
Ethnic Minorities 56.8% 55.9% 59.9% 59.3% 58.2%
# Unknown/ unreported 199 52 408 22 681 *Ethnic minorities include all reported non-White racial and ethnic groups, including “Other” and “Multi-race”.
University of California, San Francisco 15
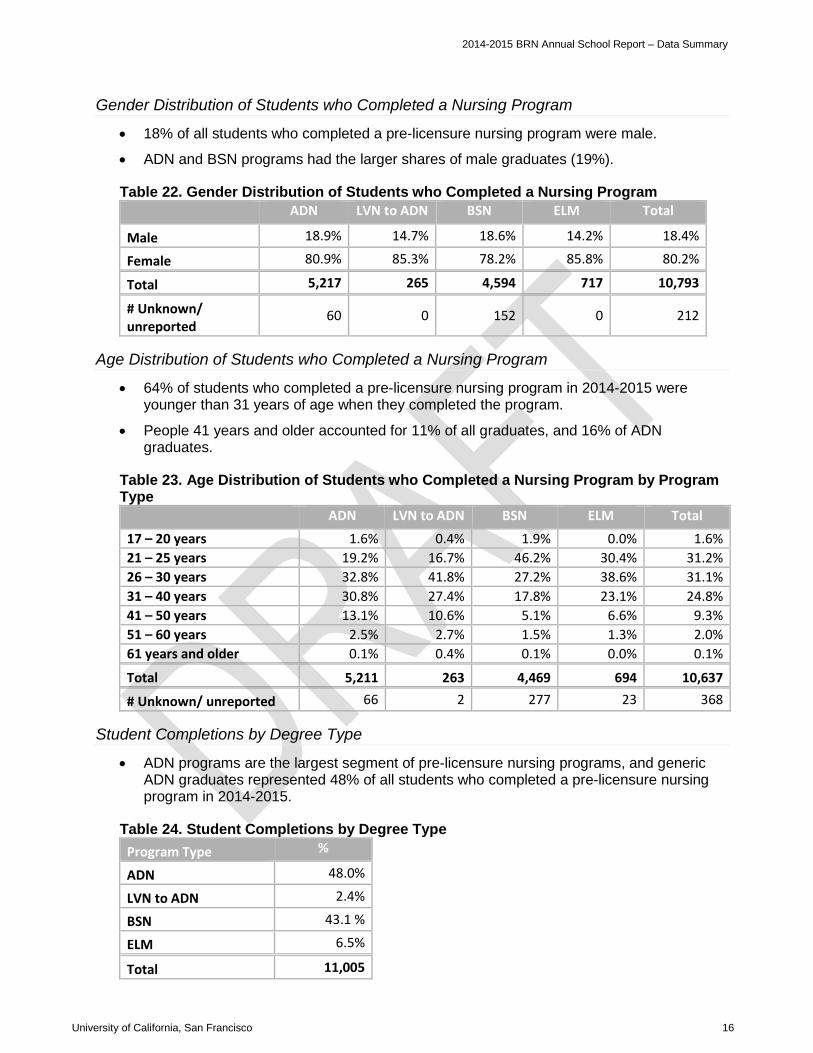
2014-2015 BRN Annual School Report – Data Summary
Gender Distribution of Students who Completed a Nursing Program
• 18% of all students who completed a pre-licensure nursing program were male.
• ADN and BSN programs had the larger shares of male graduates (19%).
Table 22. Gender Distribution of Students who Completed a Nursing Program ADN LVN to ADN BSN ELM Total
Male 18.9% 14.7% 18.6% 14.2% 18.4%
Female 80.9% 85.3% 78.2% 85.8% 80.2%
Total 5,217 265 4,594 717 10,793
# Unknown/ unreported
60 0 152 0 212
Age Distribution of Students who Completed a Nursing Program
• 64% of students who completed a pre-licensure nursing program in 2014-2015 were younger than 31 years of age when they completed the program.
• People 41 years and older accounted for 11% of all graduates, and 16% of ADN graduates.
Table 23. Age Distribution of Students who Completed a Nursing Program by Program Type
ADN LVN to ADN BSN ELM Total 17 – 20 years 1.6% 0.4% 1.9% 0.0% 1.6% 21 – 25 years 19.2% 16.7% 46.2% 30.4% 31.2% 26 – 30 years 32.8% 41.8% 27.2% 38.6% 31.1% 31 – 40 years 30.8% 27.4% 17.8% 23.1% 24.8% 41 – 50 years 13.1% 10.6% 5.1% 6.6% 9.3% 51 – 60 years 2.5% 2.7% 1.5% 1.3% 2.0% 61 years and older 0.1% 0.4% 0.1% 0.0% 0.1%
Total 5,211 263 4,469 694 10,637
# Unknown/ unreported 66 2 277 23 368
Student Completions by Degree Type
• ADN programs are the largest segment of pre-licensure nursing programs, and generic ADN graduates represented 48% of all students who completed a pre-licensure nursing program in 2014-2015.
Table 24. Student Completions by Degree Type Program Type %
ADN 48.0%
LVN to ADN 2.4%
BSN 43.1 %
ELM 6.5%
Total 11,005
University of California, San Francisco 16
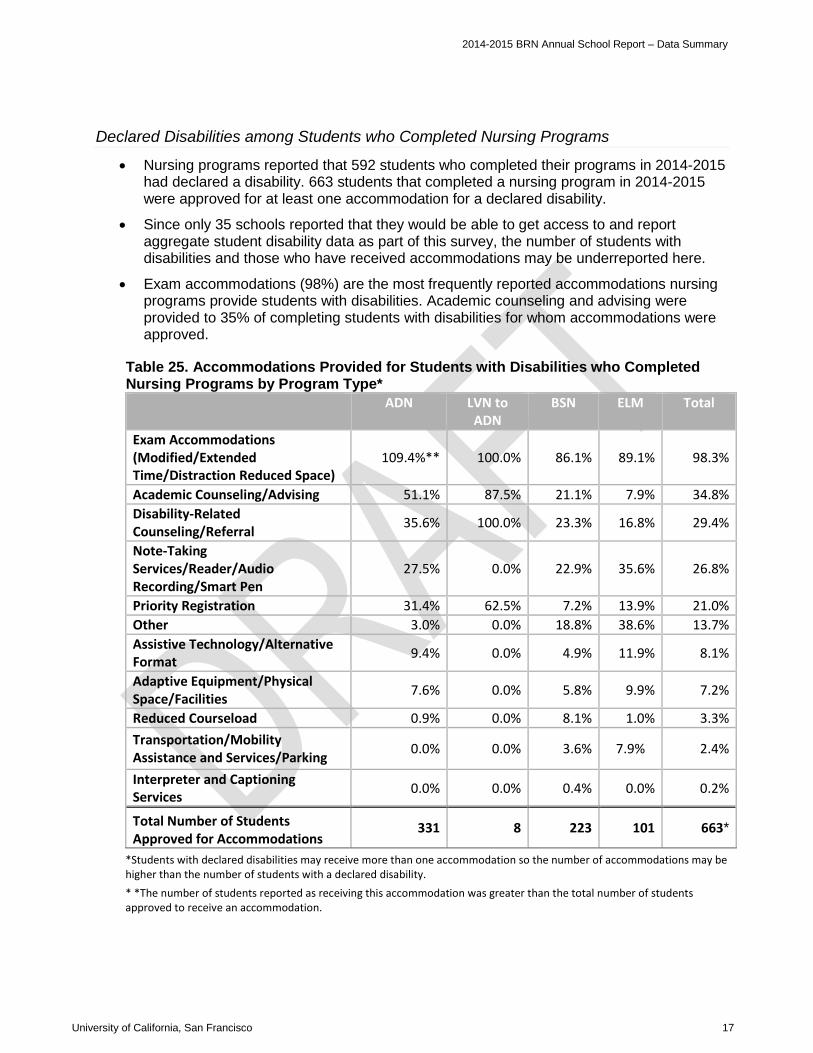
2014-2015 BRN Annual School Report – Data Summary
Declared Disabilities among Students who Completed Nursing Programs
• Nursing programs reported that 592 students who completed their programs in 2014-2015 had declared a disability. 663 students that completed a nursing program in 2014-2015 were approved for at least one accommodation for a declared disability.
• Since only 35 schools reported that they would be able to get access to and report aggregate student disability data as part of this survey, the number of students with disabilities and those who have received accommodations may be underreported here.
• Exam accommodations (98%) are the most frequently reported accommodations nursing programs provide students with disabilities. Academic counseling and advising were provided to 35% of completing students with disabilities for whom accommodations were approved.
Table 25. Accommodations Provided for Students with Disabilities who Completed Nursing Programs by Program Type*
ADN LVN to ADN
BSN ELM Total
Exam Accommodations (Modified/Extended Time/Distraction Reduced Space)
109.4%** 100.0% 86.1% 89.1% 98.3%
Academic Counseling/Advising 51.1% 87.5% 21.1% 7.9% 34.8% Disability-Related Counseling/Referral 35.6% 100.0% 23.3% 16.8% 29.4%
Note-Taking Services/Reader/Audio Recording/Smart Pen
27.5% 0.0% 22.9% 35.6% 26.8%
Priority Registration 31.4% 62.5% 7.2% 13.9% 21.0% Other 3.0% 0.0% 18.8% 38.6% 13.7% Assistive Technology/Alternative Format 9.4% 0.0% 4.9% 11.9% 8.1%
Adaptive Equipment/Physical Space/Facilities 7.6% 0.0% 5.8% 9.9% 7.2%
Reduced Courseload 0.9% 0.0% 8.1% 1.0% 3.3% Transportation/Mobility Assistance and Services/Parking 0.0% 0.0% 3.6% 7.9% 2.4%
Interpreter and Captioning Services 0.0% 0.0% 0.4% 0.0% 0.2%
Total Number of Students Approved for Accommodations
331 8 223 101 663*
*Students with declared disabilities may receive more than one accommodation so the number of accommodations may be higher than the number of students with a declared disability. * *The number of students reported as receiving this accommodation was greater than the total number of students approved to receive an accommodation.
University of California, San Francisco 17

2014-2015 BRN Annual School Report – Data Summary
Completion, Retention and Attrition Data
• The overall attrition rate for pre-licensure nursing education programs in California was 14% in 2014-2015.
• Generic ADN programs had the highest attrition rate (16%) and ELM programs the lowest (7%).
Table 26. Completion, Retention and Attrition Data by Program Type ADN LVN to
ADN BSN ELM Total
Students Scheduled to Complete the Program 5,602 286 3,750 816 10,454
Completed On-time 4,349 239 2,948 720 8,256 Still Enrolled 337 10 315 38 700 Total Attrition 916 37 487 58 1,498 Attrition-Dropped Out 533 20 166 50 769
Attrition-Dismissed 383 17 321 8 729 Completed Late 492 19 317 5 833
Retention Rate* 77.6% 83.6% 78.6% 88.2% 79.0%
Attrition Rate** 16.4% 12.9% 13.0% 7.1% 14.3% *Retention rate = (students who completed the program on-time) / (students scheduled to complete the program) **Attrition rate = (students who dropped or were dismissed who were scheduled to complete) / (students scheduled to complete the program)
• The overall attrition rate for accelerated programs was significantly lower than for traditional programs at 4% compared to 14%.
• As with traditional programs, accelerated ADN programs had the highest attrition rate at 11% in 2014-2015. Accelerated BSN programs had the lowest attrition rate at 4%.
Table 27. Completion, Retention and Attrition Data for Accelerated Programs by Program Type
ADN BSN ELM Total Students Scheduled to Complete the Program 46 1,183 157 1,386
Completed On-time 38 1,126 146 1,310
Still Enrolled 3 14 2 19 Total Attrition 5 43 9 57 Attrition-Dropped Out 3 29 5 37 Attrition-Dismissed 2 14 4 20
Completed Late 3 19 19 41
Retention Rate* 82.6% 95.2% 93.0% 94.5%
Attrition Rate** 10.9% 3.6% 5.7% 4.1% *Retention rate = (students who completed the program on-time) / (students scheduled to complete the program)
**Attrition rate = (students who dropped or were dismissed who were scheduled to complete) / (students scheduled to complete the program
University of California, San Francisco 18

2014-2015 BRN Annual School Report – Data Summary
Employment of Recent Nursing Program Graduates
• On average, 58% of recent RN graduates employed in nursing in October 2015 were working in hospitals.
• Graduates of BSN programs were the most likely to work in hospitals (79%), while graduates of LVN to ADN programs were the least likely (36%).
• Statewide, Deans and Directors reported that 10% of nursing students were unable to find employment by October 2015, with LVN to ADN programs reporting the highest share of recent graduates (15%) unable to find employment.
• Nursing schools reported that 73% of their recent RN graduates employed in nursing were employed in California.
Table 28. Employment of Recent Nursing Program Graduates
ADN LVN to ADN BSN ELM Total
Hospital 52.6% 36.0% 79.4% 55.6% 58.3% Long-term care facility 9.8% 16.2% 4.4% 1.5% 7.9% Community/Public Health Facility 3.5% 10.9% 3.4% 6.0% 4.2% Other Healthcare Facility 5.1% 2.0% 2.5% 5.5% 4.4%
Pursuing additional nursing education 12.3% 19.5% 2.0% 21.8% 11.4%
Other setting 6.1% 0.4% 4.7% 1.4% 4.9% Unable to find employment 11.6% 14.9% 3.8% 8.2% 9.5%
*Graduates whose employment setting was reported as “unknown” have been excluded from this table. In 2014-2015, on average, the employment setting was unknown for 14% (n=1,493) of recent graduates.
Student Debt Load
• In 2015, school representatives were asked to provide the average student debt load upon graduation.
• The overall average debt load of nursing graduates was $22,773. ELM students had the highest average debt load, and ADN students had the lowest debt load.
• Private school graduates had an average debt load at $50,374, while public school graduates averaged $11,338.
Table 29. Student Debt Load of Recent Nursing Program Graduates
ADN LVN to ADN BSN ELM Total
Average Debt Load $10,308 $17,734 $30,943 $68,780 $22,773
Private $35,381 $31,084 $42,441 $92,806 $50,374
Public $6,866 $8,833 $14,846 $44,754 $11,338
Total Programs Reporting 58 5 24 12 99
University of California, San Francisco 19
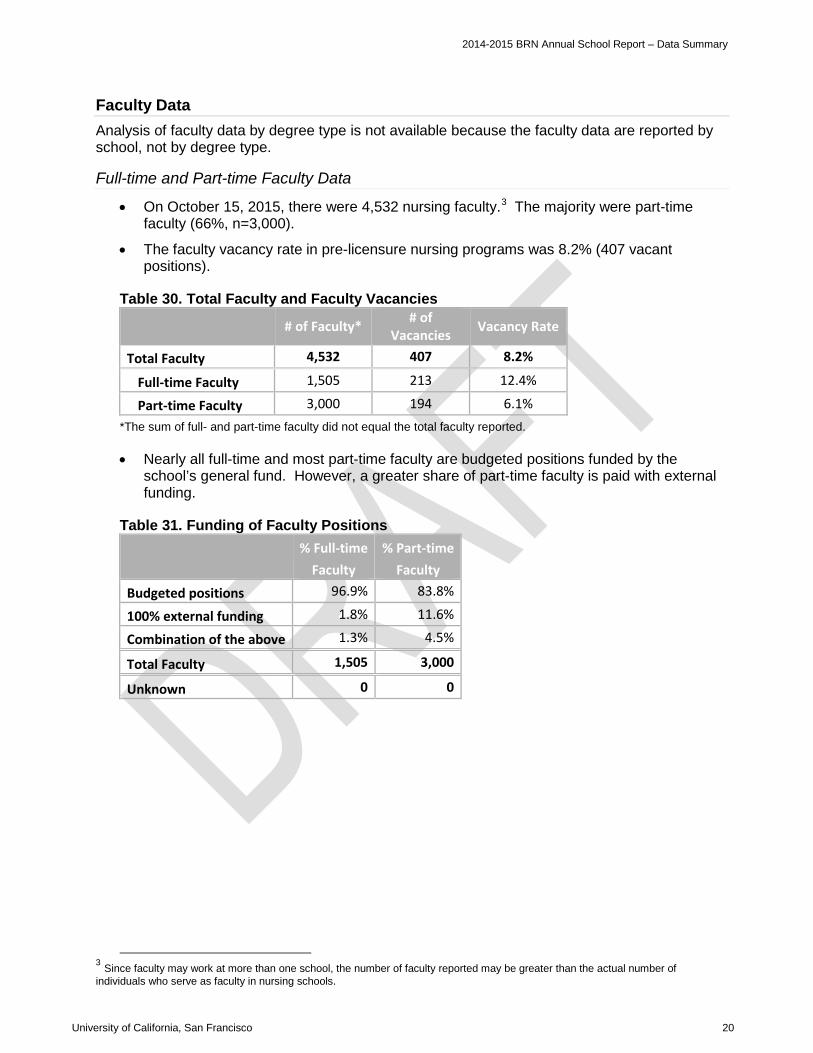
2014-2015 BRN Annual School Report – Data Summary
Faculty Data Analysis of faculty data by degree type is not available because the faculty data are reported by school, not by degree type.
Full-time and Part-time Faculty Data
• On October 15, 2015, there were 4,532 nursing faculty.3 The majority were part-time faculty (66%, n=3,000).
• The faculty vacancy rate in pre-licensure nursing programs was 8.2% (407 vacant positions).
Table 30. Total Faculty and Faculty Vacancies
# of Faculty* # of Vacancies Vacancy Rate
Total Faculty 4,532 407 8.2%
Full-time Faculty 1,505 213 12.4%
Part-time Faculty 3,000 194 6.1% *The sum of full- and part-time faculty did not equal the total faculty reported.
• Nearly all full-time and most part-time faculty are budgeted positions funded by the school’s general fund. However, a greater share of part-time faculty is paid with external funding.
Table 31. Funding of Faculty Positions % Full-time
Faculty % Part-time
Faculty Budgeted positions 96.9% 83.8%
100% external funding 1.8% 11.6%
Combination of the above 1.3% 4.5%
Total Faculty 1,505 3,000
Unknown 0 0
3 Since faculty may work at more than one school, the number of faculty reported may be greater than the actual number of individuals who serve as faculty in nursing schools.
University of California, San Francisco 20

2014-2015 BRN Annual School Report – Data Summary
• The majority of full-time faculty (81%) teaches both clinical and didactic courses, while the majority of part-time faculty (80%) teaches clinical courses only.
Table 32. Faculty Teaching Assignments % Full-time
Faculty % Part-time
Faculty Clinical courses only 8.8% 80.3%
Didactic courses only 10.7% 7.0%
Clinical & didactic courses 80.5% 12.7%
Total Faculty 1,505 3,000
Unknown 0 0
• 85 of 132 schools (64%) reported that faculty in their programs work an overloaded schedule, and 97% (n=82) of these schools pay the faculty extra for the overloaded schedule.
Faculty for Next Year
• 42% of schools reported that their externally funded positions will continue to be funded for the 2015-2016 academic year. If these positions are not funded, schools reported that they would be able to enroll a total of only 10,849 students across all pre-licensure RN programs in 2015-2016, which would be an 18% decrease in new enrollments compared to the 13,151 new students that enrolled in RN programs in 2014-2015.
Table 33. External Funding for Faculty Next Year % Schools
Will continue 41.5% Will not continue 1.5% Unknown 14.6%
Not applicable 42.3%
Number of schools reporting 130
University of California, San Francisco 21
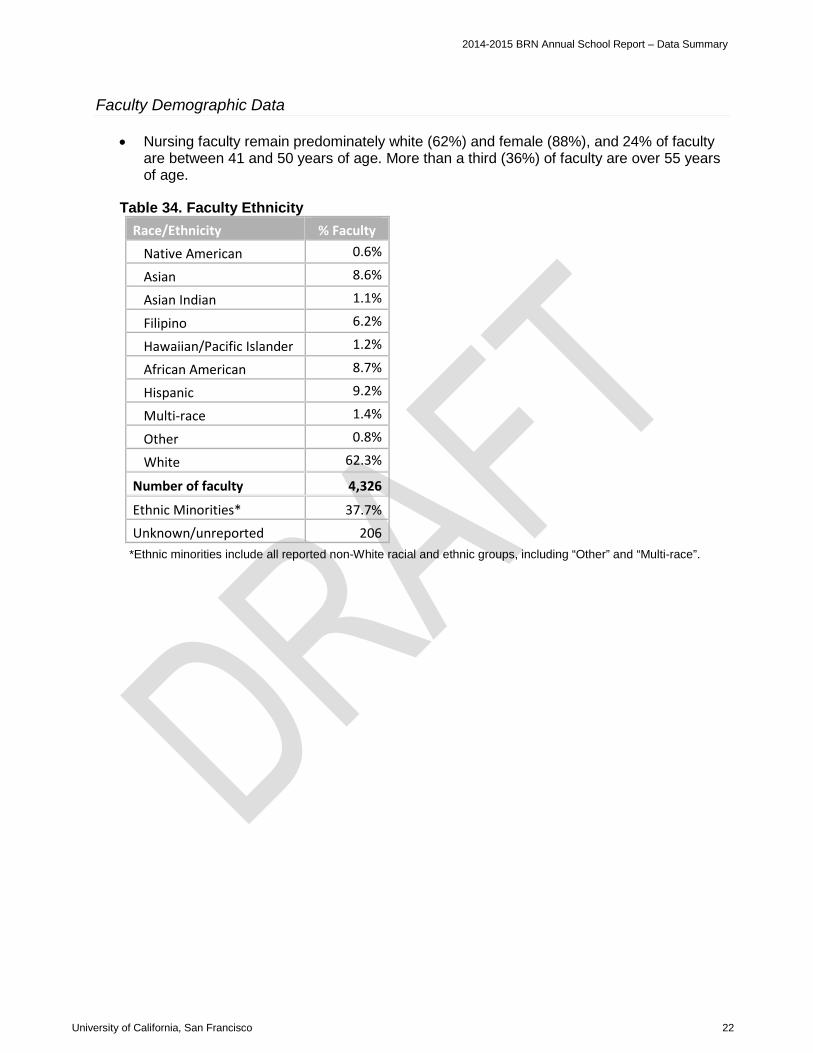
2014-2015 BRN Annual School Report – Data Summary
Faculty Demographic Data
• Nursing faculty remain predominately white (62%) and female (88%), and 24% of faculty are between 41 and 50 years of age. More than a third (36%) of faculty are over 55 years of age.
Table 34. Faculty Ethnicity Race/Ethnicity % Faculty
Native American 0.6%
Asian 8.6%
Asian Indian 1.1%
Filipino 6.2%
Hawaiian/Pacific Islander 1.2%
African American 8.7%
Hispanic 9.2%
Multi-race 1.4%
Other 0.8%
White 62.3%
Number of faculty 4,326
Ethnic Minorities* 37.7% Unknown/unreported 206
*Ethnic minorities include all reported non-White racial and ethnic groups, including “Other” and “Multi-race”.
University of California, San Francisco 22
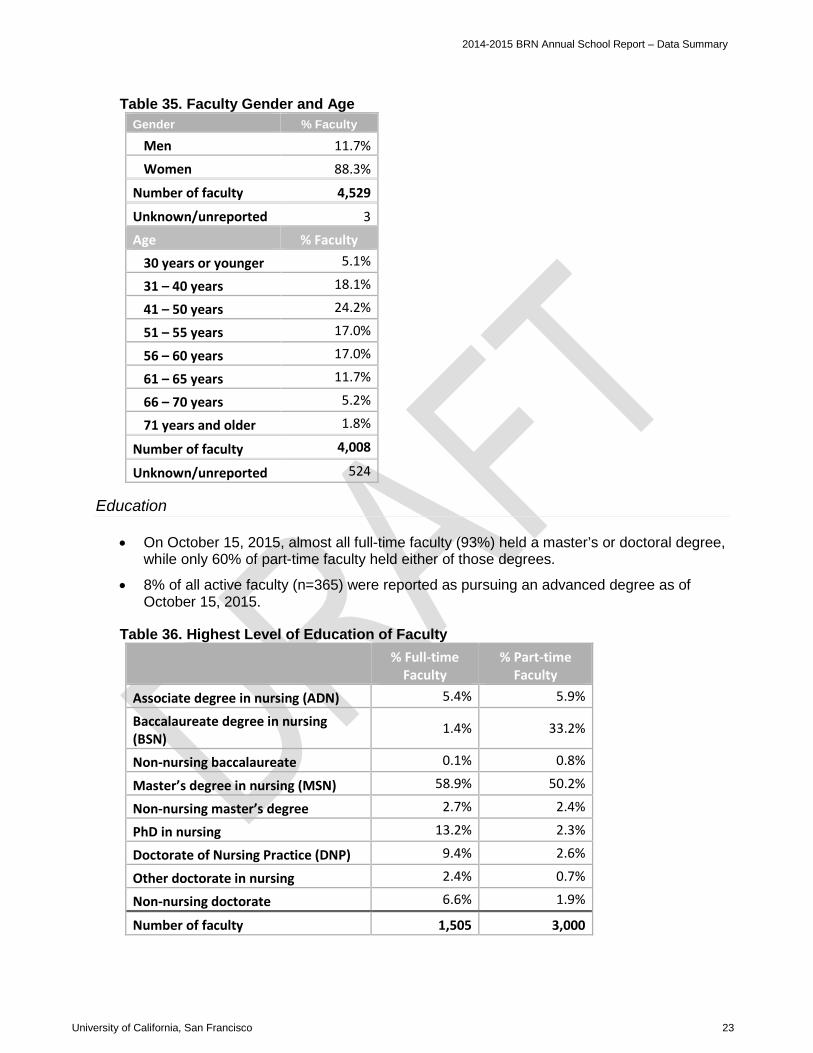
2014-2015 BRN Annual School Report – Data Summary
Table 35. Faculty Gender and Age Gender % Faculty
Men 11.7%
Women 88.3%
Number of faculty 4,529
Unknown/unreported 3
Age % Faculty 30 years or younger 5.1%
31 – 40 years 18.1%
41 – 50 years 24.2%
51 – 55 years 17.0%
56 – 60 years 17.0%
61 – 65 years 11.7%
66 – 70 years 5.2%
71 years and older 1.8%
Number of faculty 4,008
Unknown/unreported 524
Education
• On October 15, 2015, almost all full-time faculty (93%) held a master’s or doctoral degree, while only 60% of part-time faculty held either of those degrees.
• 8% of all active faculty (n=365) were reported as pursuing an advanced degree as of October 15, 2015.
Table 36. Highest Level of Education of Faculty % Full-time
Faculty % Part-time
Faculty Associate degree in nursing (ADN) 5.4% 5.9%
Baccalaureate degree in nursing (BSN)
1.4% 33.2%
Non-nursing baccalaureate 0.1% 0.8%
Master’s degree in nursing (MSN) 58.9% 50.2%
Non-nursing master’s degree 2.7% 2.4%
PhD in nursing 13.2% 2.3%
Doctorate of Nursing Practice (DNP) 9.4% 2.6%
Other doctorate in nursing 2.4% 0.7%
Non-nursing doctorate 6.6% 1.9%
Number of faculty 1,505 3,000
University of California, San Francisco 23
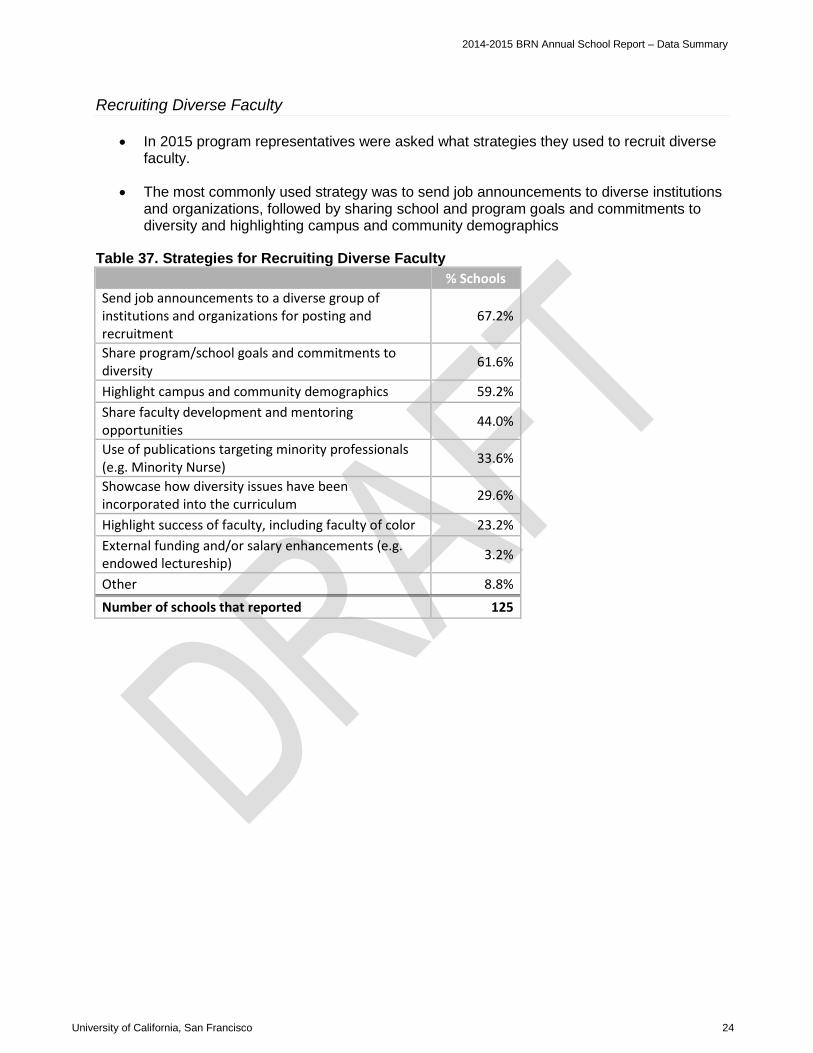
2014-2015 BRN Annual School Report – Data Summary
Recruiting Diverse Faculty
• In 2015 program representatives were asked what strategies they used to recruit diverse faculty.
• The most commonly used strategy was to send job announcements to diverse institutions and organizations, followed by sharing school and program goals and commitments to diversity and highlighting campus and community demographics
Table 37. Strategies for Recruiting Diverse Faculty % Schools Send job announcements to a diverse group of institutions and organizations for posting and recruitment
67.2%
Share program/school goals and commitments to diversity 61.6%
Highlight campus and community demographics 59.2% Share faculty development and mentoring opportunities 44.0%
Use of publications targeting minority professionals (e.g. Minority Nurse) 33.6%
Showcase how diversity issues have been incorporated into the curriculum 29.6%
Highlight success of faculty, including faculty of color 23.2% External funding and/or salary enhancements (e.g. endowed lectureship) 3.2%
Other 8.8% Number of schools that reported 125
University of California, San Francisco 24

2014-2015 BRN Annual School Report – Data Summary
Methods Used to Prepare Part-time Faculty to Teach
• Faculty orientations and program policies were the most frequently reported methods used to prepare part-time faculty to teach.
• Mentoring programs, specific orientation programs, administrative policies, teaching strategies, and curriculum review were also frequently reported methods.
Table 38. Methods Used to Prepare Part-time Faculty to Teach % Schools Faculty orientation 89.8% Program policies 86.7% Mentoring program 79.7% Specific orientation program 70.3% Administrative policies 68.0% Teaching strategies 66.4% Curriculum review 63.3% External training program 10.2% Other 6.3% None 2.3% Number of schools that reported 125
University of California, San Francisco 25
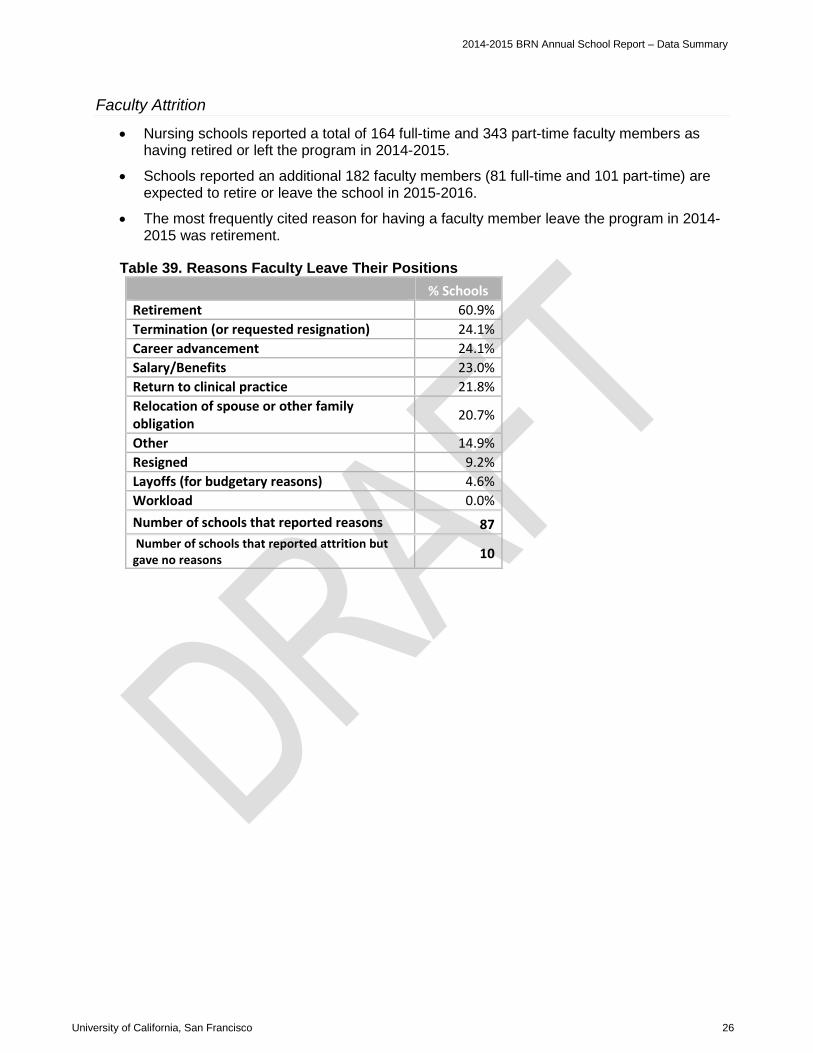
2014-2015 BRN Annual School Report – Data Summary
Faculty Attrition
• Nursing schools reported a total of 164 full-time and 343 part-time faculty members as having retired or left the program in 2014-2015.
• Schools reported an additional 182 faculty members (81 full-time and 101 part-time) are expected to retire or leave the school in 2015-2016.
• The most frequently cited reason for having a faculty member leave the program in 2014-2015 was retirement.
Table 39. Reasons Faculty Leave Their Positions % Schools Retirement 60.9% Termination (or requested resignation) 24.1% Career advancement 24.1% Salary/Benefits 23.0% Return to clinical practice 21.8% Relocation of spouse or other family obligation 20.7%
Other 14.9% Resigned 9.2% Layoffs (for budgetary reasons) 4.6% Workload 0.0% Number of schools that reported reasons 87 Number of schools that reported attrition but gave no reasons 10
University of California, San Francisco 26
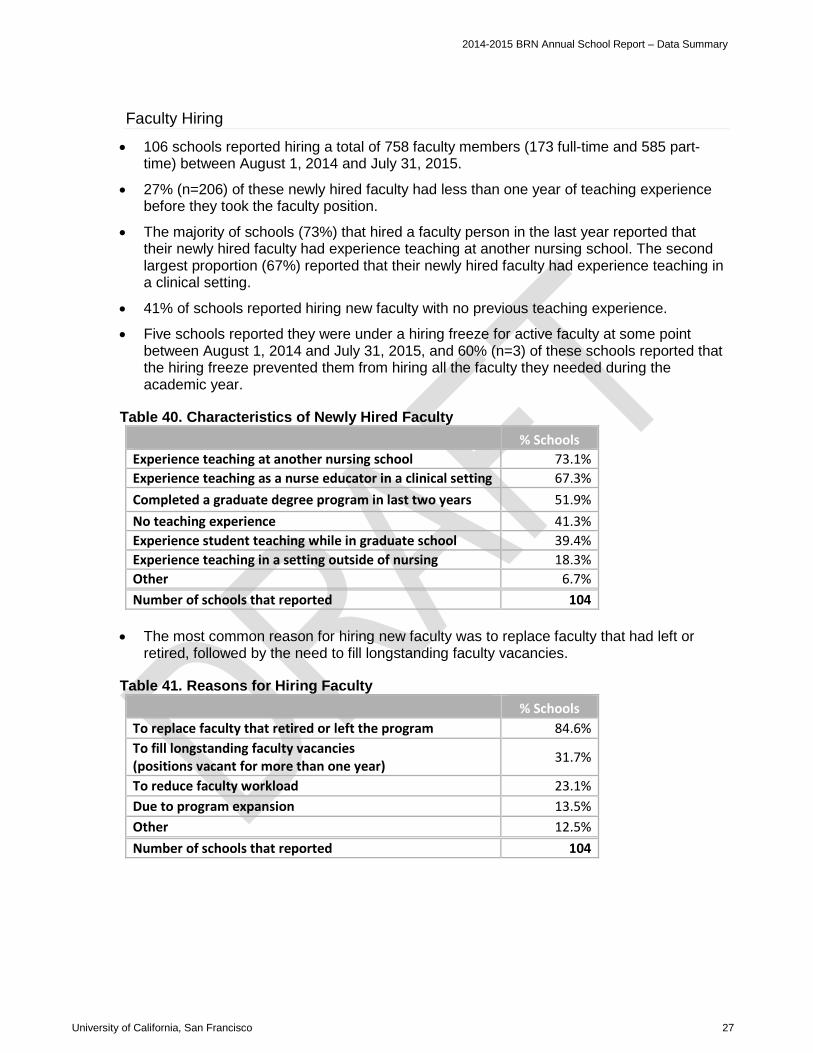
2014-2015 BRN Annual School Report – Data Summary
Faculty Hiring
• 106 schools reported hiring a total of 758 faculty members (173 full-time and 585 part-time) between August 1, 2014 and July 31, 2015.
• 27% (n=206) of these newly hired faculty had less than one year of teaching experience before they took the faculty position.
• The majority of schools (73%) that hired a faculty person in the last year reported that their newly hired faculty had experience teaching at another nursing school. The second largest proportion (67%) reported that their newly hired faculty had experience teaching in a clinical setting.
• 41% of schools reported hiring new faculty with no previous teaching experience.
• Five schools reported they were under a hiring freeze for active faculty at some point between August 1, 2014 and July 31, 2015, and 60% (n=3) of these schools reported that the hiring freeze prevented them from hiring all the faculty they needed during the academic year.
Table 40. Characteristics of Newly Hired Faculty % Schools Experience teaching at another nursing school 73.1% Experience teaching as a nurse educator in a clinical setting 67.3% Completed a graduate degree program in last two years 51.9% No teaching experience 41.3% Experience student teaching while in graduate school 39.4% Experience teaching in a setting outside of nursing 18.3% Other 6.7% Number of schools that reported 104
• The most common reason for hiring new faculty was to replace faculty that had left or
retired, followed by the need to fill longstanding faculty vacancies.
Table 41. Reasons for Hiring Faculty % Schools To replace faculty that retired or left the program 84.6% To fill longstanding faculty vacancies (positions vacant for more than one year) 31.7%
To reduce faculty workload 23.1% Due to program expansion 13.5% Other 12.5% Number of schools that reported 104
University of California, San Francisco 27
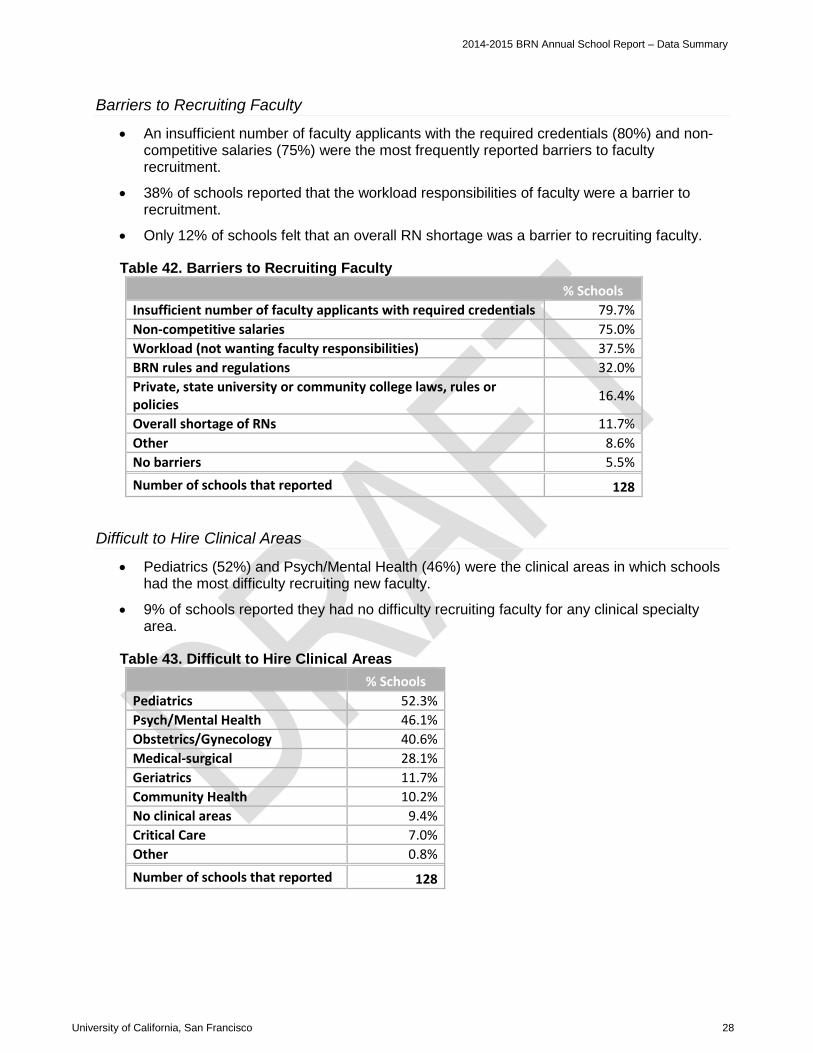
2014-2015 BRN Annual School Report – Data Summary
Barriers to Recruiting Faculty
• An insufficient number of faculty applicants with the required credentials (80%) and non-competitive salaries (75%) were the most frequently reported barriers to faculty recruitment.
• 38% of schools reported that the workload responsibilities of faculty were a barrier to recruitment.
• Only 12% of schools felt that an overall RN shortage was a barrier to recruiting faculty.
Table 42. Barriers to Recruiting Faculty % Schools Insufficient number of faculty applicants with required credentials 79.7% Non-competitive salaries 75.0% Workload (not wanting faculty responsibilities) 37.5% BRN rules and regulations 32.0% Private, state university or community college laws, rules or policies 16.4%
Overall shortage of RNs 11.7% Other 8.6% No barriers 5.5% Number of schools that reported 128
Difficult to Hire Clinical Areas
• Pediatrics (52%) and Psych/Mental Health (46%) were the clinical areas in which schools had the most difficulty recruiting new faculty.
• 9% of schools reported they had no difficulty recruiting faculty for any clinical specialty area.
Table 43. Difficult to Hire Clinical Areas % Schools Pediatrics 52.3% Psych/Mental Health 46.1% Obstetrics/Gynecology 40.6% Medical-surgical 28.1% Geriatrics 11.7% Community Health 10.2% No clinical areas 9.4% Critical Care 7.0% Other 0.8% Number of schools that reported 128
University of California, San Francisco 28
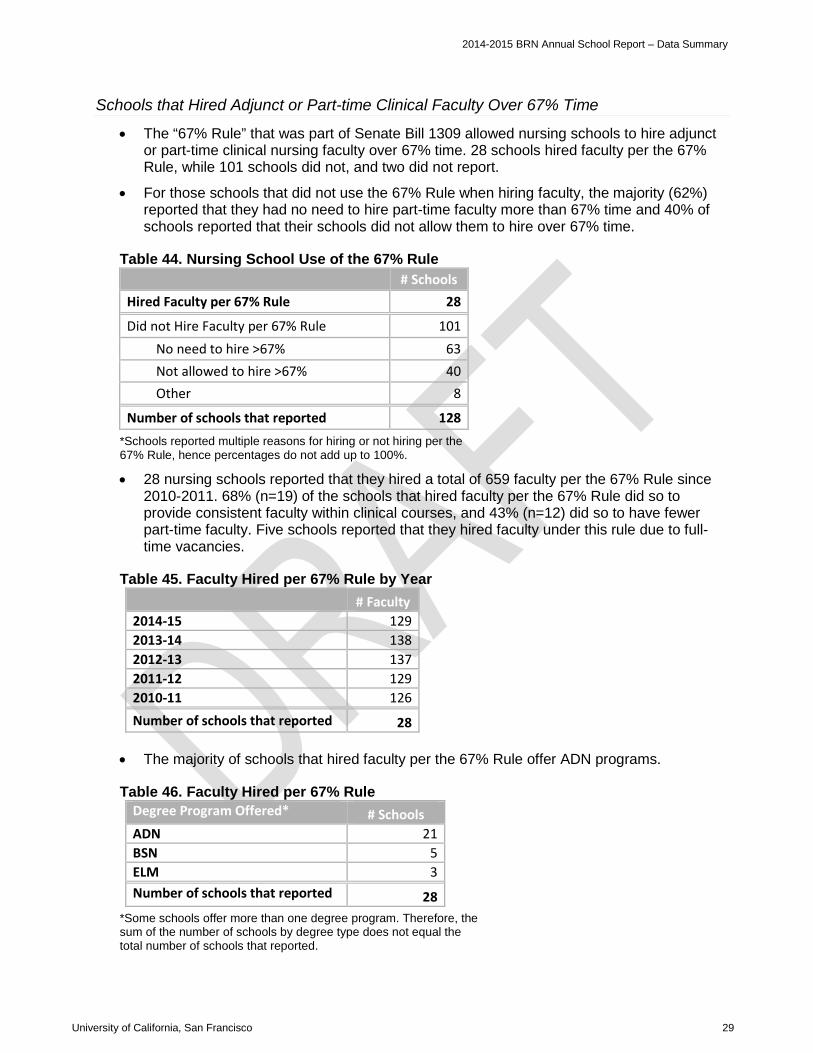
2014-2015 BRN Annual School Report – Data Summary
Schools that Hired Adjunct or Part-time Clinical Faculty Over 67% Time
• The “67% Rule” that was part of Senate Bill 1309 allowed nursing schools to hire adjunct or part-time clinical nursing faculty over 67% time. 28 schools hired faculty per the 67% Rule, while 101 schools did not, and two did not report.
• For those schools that did not use the 67% Rule when hiring faculty, the majority (62%) reported that they had no need to hire part-time faculty more than 67% time and 40% of schools reported that their schools did not allow them to hire over 67% time.
Table 44. Nursing School Use of the 67% Rule # Schools Hired Faculty per 67% Rule 28
Did not Hire Faculty per 67% Rule 101 No need to hire >67% 63 Not allowed to hire >67% 40 Other 8
Number of schools that reported 128 *Schools reported multiple reasons for hiring or not hiring per the 67% Rule, hence percentages do not add up to 100%.
• 28 nursing schools reported that they hired a total of 659 faculty per the 67% Rule since 2010-2011. 68% (n=19) of the schools that hired faculty per the 67% Rule did so to provide consistent faculty within clinical courses, and 43% (n=12) did so to have fewer part-time faculty. Five schools reported that they hired faculty under this rule due to full-time vacancies.
Table 45. Faculty Hired per 67% Rule by Year Hired # Faculty 2014-15 129 2013-14 138 2012-13 137 2011-12 129 2010-11 126 Number of schools that reported 28
• The majority of schools that hired faculty per the 67% Rule offer ADN programs.
Table 46. Faculty Hired per 67% Rule Degree Program Offered* # Schools ADN 21 BSN 5 ELM 3 Number of schools that reported 28
*Some schools offer more than one degree program. Therefore, the sum of the number of schools by degree type does not equal the total number of schools that reported.
University of California, San Francisco 29

2014-2015 BRN Annual School Report – Data Summary
Faculty Salaries
• On average, full-time faculty with doctoral degrees earn more than those with master’s degrees.
Table 47. Average Annual Salary Paid for Full-Time Faculty by Highest Degree Earned & Length of Academic Appointment
Master’s Degree Doctoral Degree Average
Low Average
High Average
Low Average
High
9 months $62,221 $81,710 $74,915 $105,252 10 months $75,024 $93,771 $77,205 $97,317 11 months $77,197 $96,281 $93,019 $127,034 12 months $74,536 $99,213 $80,336 $108,970
*Total full-time salaries of less than $10,000 per year were eliminated from this analysis.
University of California, San Francisco 30
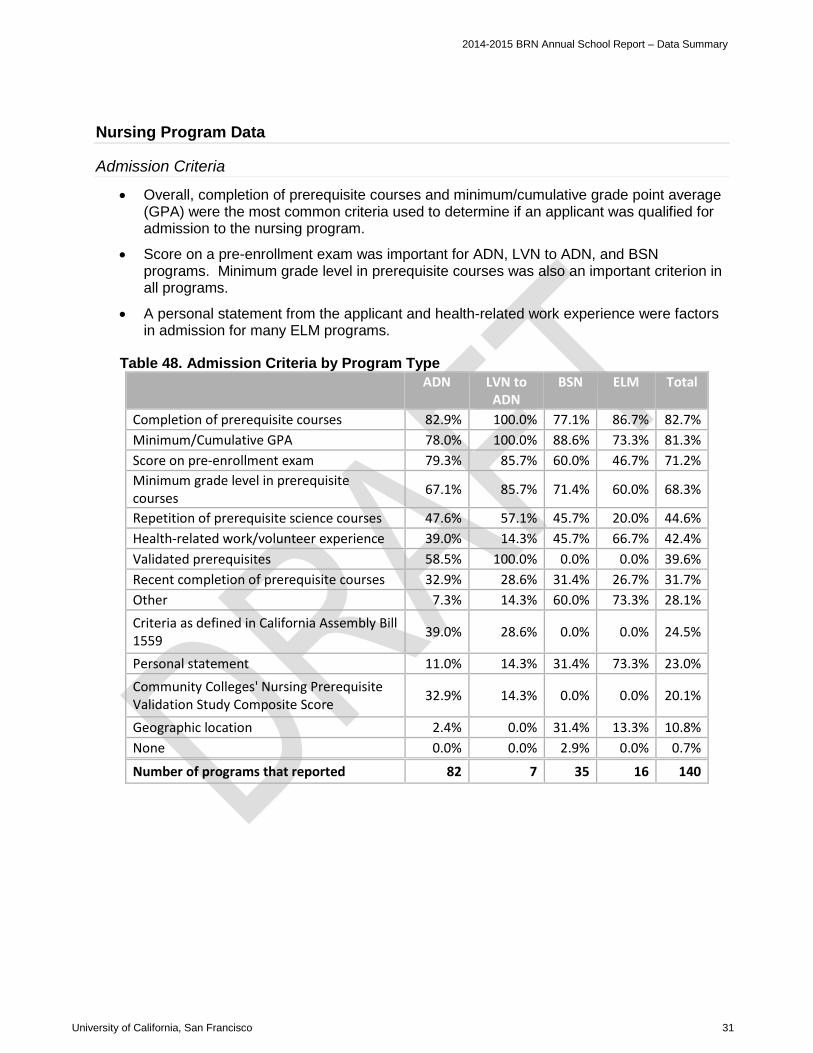
2014-2015 BRN Annual School Report – Data Summary
Nursing Program Data
Admission Criteria
• Overall, completion of prerequisite courses and minimum/cumulative grade point average (GPA) were the most common criteria used to determine if an applicant was qualified for admission to the nursing program.
• Score on a pre-enrollment exam was important for ADN, LVN to ADN, and BSN programs. Minimum grade level in prerequisite courses was also an important criterion in all programs.
• A personal statement from the applicant and health-related work experience were factors in admission for many ELM programs.
Table 48. Admission Criteria by Program Type ADN LVN to
ADN BSN ELM Total
Completion of prerequisite courses 82.9% 100.0% 77.1% 86.7% 82.7% Minimum/Cumulative GPA 78.0% 100.0% 88.6% 73.3% 81.3% Score on pre-enrollment exam 79.3% 85.7% 60.0% 46.7% 71.2% Minimum grade level in prerequisite courses 67.1% 85.7% 71.4% 60.0% 68.3%
Repetition of prerequisite science courses 47.6% 57.1% 45.7% 20.0% 44.6% Health-related work/volunteer experience 39.0% 14.3% 45.7% 66.7% 42.4% Validated prerequisites 58.5% 100.0% 0.0% 0.0% 39.6% Recent completion of prerequisite courses 32.9% 28.6% 31.4% 26.7% 31.7% Other 7.3% 14.3% 60.0% 73.3% 28.1% Criteria as defined in California Assembly Bill 1559 39.0% 28.6% 0.0% 0.0% 24.5%
Personal statement 11.0% 14.3% 31.4% 73.3% 23.0% Community Colleges' Nursing Prerequisite Validation Study Composite Score 32.9% 14.3% 0.0% 0.0% 20.1%
Geographic location 2.4% 0.0% 31.4% 13.3% 10.8% None 0.0% 0.0% 2.9% 0.0% 0.7%
Number of programs that reported 82 7 35 16 140
University of California, San Francisco 31
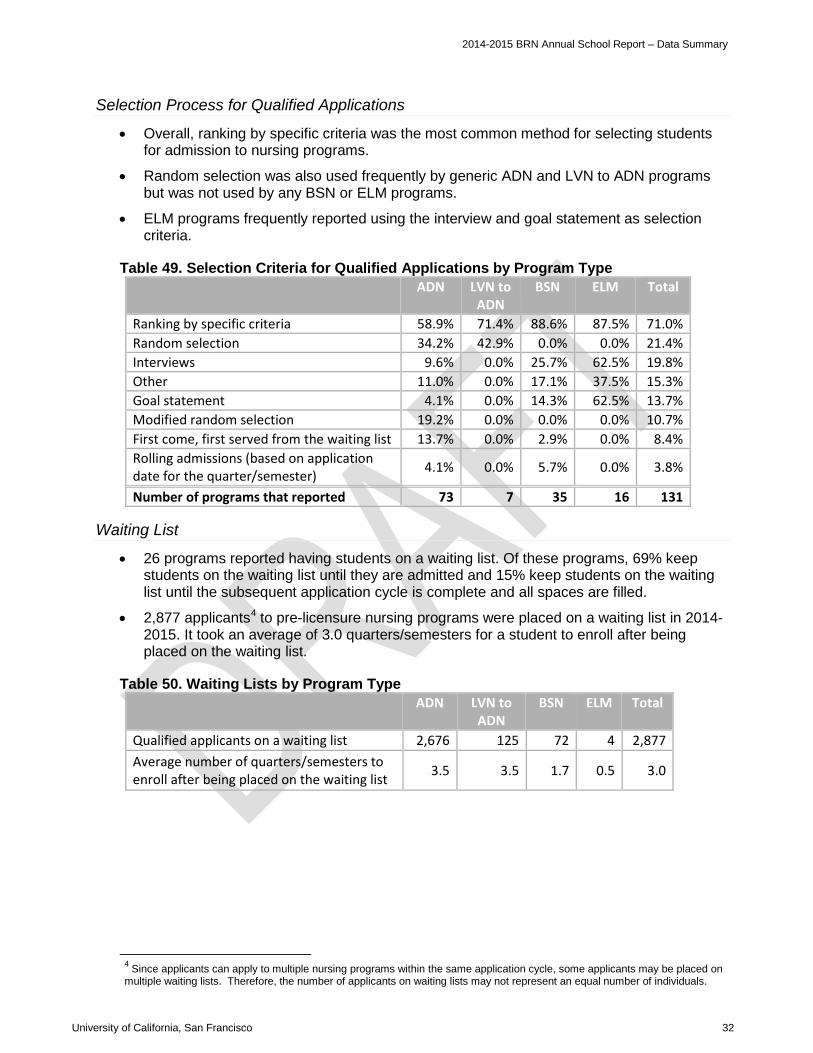
2014-2015 BRN Annual School Report – Data Summary
Selection Process for Qualified Applications
• Overall, ranking by specific criteria was the most common method for selecting students for admission to nursing programs.
• Random selection was also used frequently by generic ADN and LVN to ADN programs but was not used by any BSN or ELM programs.
• ELM programs frequently reported using the interview and goal statement as selection criteria.
Table 49. Selection Criteria for Qualified Applications by Program Type ADN LVN to
ADN BSN ELM Total
Ranking by specific criteria 58.9% 71.4% 88.6% 87.5% 71.0% Random selection 34.2% 42.9% 0.0% 0.0% 21.4% Interviews 9.6% 0.0% 25.7% 62.5% 19.8% Other 11.0% 0.0% 17.1% 37.5% 15.3% Goal statement 4.1% 0.0% 14.3% 62.5% 13.7% Modified random selection 19.2% 0.0% 0.0% 0.0% 10.7% First come, first served from the waiting list 13.7% 0.0% 2.9% 0.0% 8.4% Rolling admissions (based on application date for the quarter/semester) 4.1% 0.0% 5.7% 0.0% 3.8%
Number of programs that reported 73 7 35 16 131
Waiting List
• 26 programs reported having students on a waiting list. Of these programs, 69% keep students on the waiting list until they are admitted and 15% keep students on the waiting list until the subsequent application cycle is complete and all spaces are filled.
• 2,877 applicants4 to pre-licensure nursing programs were placed on a waiting list in 2014-2015. It took an average of 3.0 quarters/semesters for a student to enroll after being placed on the waiting list.
Table 50. Waiting Lists by Program Type ADN LVN to
ADN BSN ELM Total
Qualified applicants on a waiting list 2,676 125 72 4 2,877 Average number of quarters/semesters to enroll after being placed on the waiting list 3.5 3.5 1.7 0.5 3.0
4 Since applicants can apply to multiple nursing programs within the same application cycle, some applicants may be placed on multiple waiting lists. Therefore, the number of applicants on waiting lists may not represent an equal number of individuals.
University of California, San Francisco 32
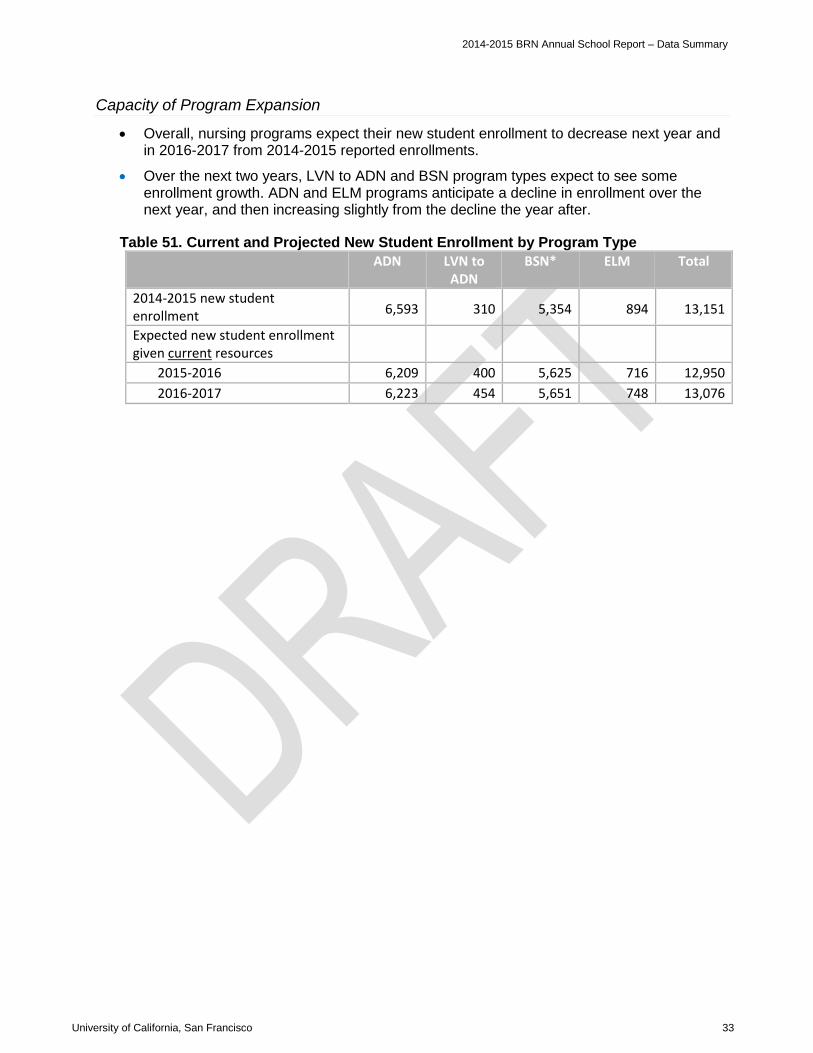
2014-2015 BRN Annual School Report – Data Summary
Capacity of Program Expansion
• Overall, nursing programs expect their new student enrollment to decrease next year and in 2016-2017 from 2014-2015 reported enrollments.
• Over the next two years, LVN to ADN and BSN program types expect to see some enrollment growth. ADN and ELM programs anticipate a decline in enrollment over the next year, and then increasing slightly from the decline the year after.
Table 51. Current and Projected New Student Enrollment by Program Type ADN LVN to
ADN BSN* ELM Total
2014-2015 new student enrollment 6,593 310 5,354 894 13,151
Expected new student enrollment given current resources
2015-2016 6,209 400 5,625 716 12,950 2016-2017 6,223 454 5,651 748 13,076
University of California, San Francisco 33
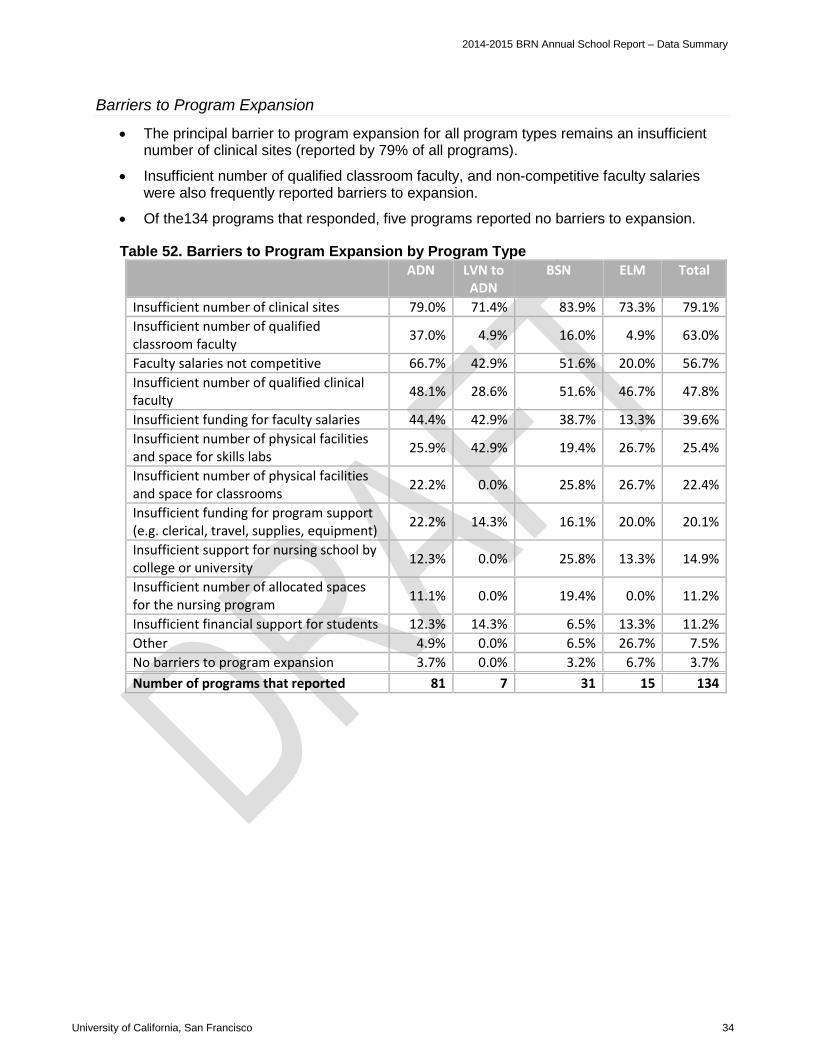
2014-2015 BRN Annual School Report – Data Summary
Barriers to Program Expansion
• The principal barrier to program expansion for all program types remains an insufficient number of clinical sites (reported by 79% of all programs).
• Insufficient number of qualified classroom faculty, and non-competitive faculty salaries were also frequently reported barriers to expansion.
• Of the134 programs that responded, five programs reported no barriers to expansion.
Table 52. Barriers to Program Expansion by Program Type ADN LVN to
ADN BSN ELM Total
Insufficient number of clinical sites 79.0% 71.4% 83.9% 73.3% 79.1% Insufficient number of qualified classroom faculty 37.0% 4.9% 16.0% 4.9% 63.0%
Faculty salaries not competitive 66.7% 42.9% 51.6% 20.0% 56.7% Insufficient number of qualified clinical faculty 48.1% 28.6% 51.6% 46.7% 47.8%
Insufficient funding for faculty salaries 44.4% 42.9% 38.7% 13.3% 39.6% Insufficient number of physical facilities and space for skills labs 25.9% 42.9% 19.4% 26.7% 25.4%
Insufficient number of physical facilities and space for classrooms 22.2% 0.0% 25.8% 26.7% 22.4%
Insufficient funding for program support (e.g. clerical, travel, supplies, equipment) 22.2% 14.3% 16.1% 20.0% 20.1%
Insufficient support for nursing school by college or university 12.3% 0.0% 25.8% 13.3% 14.9%
Insufficient number of allocated spaces for the nursing program 11.1% 0.0% 19.4% 0.0% 11.2%
Insufficient financial support for students 12.3% 14.3% 6.5% 13.3% 11.2% Other 4.9% 0.0% 6.5% 26.7% 7.5% No barriers to program expansion 3.7% 0.0% 3.2% 6.7% 3.7% Number of programs that reported 81 7 31 15 134
University of California, San Francisco 34
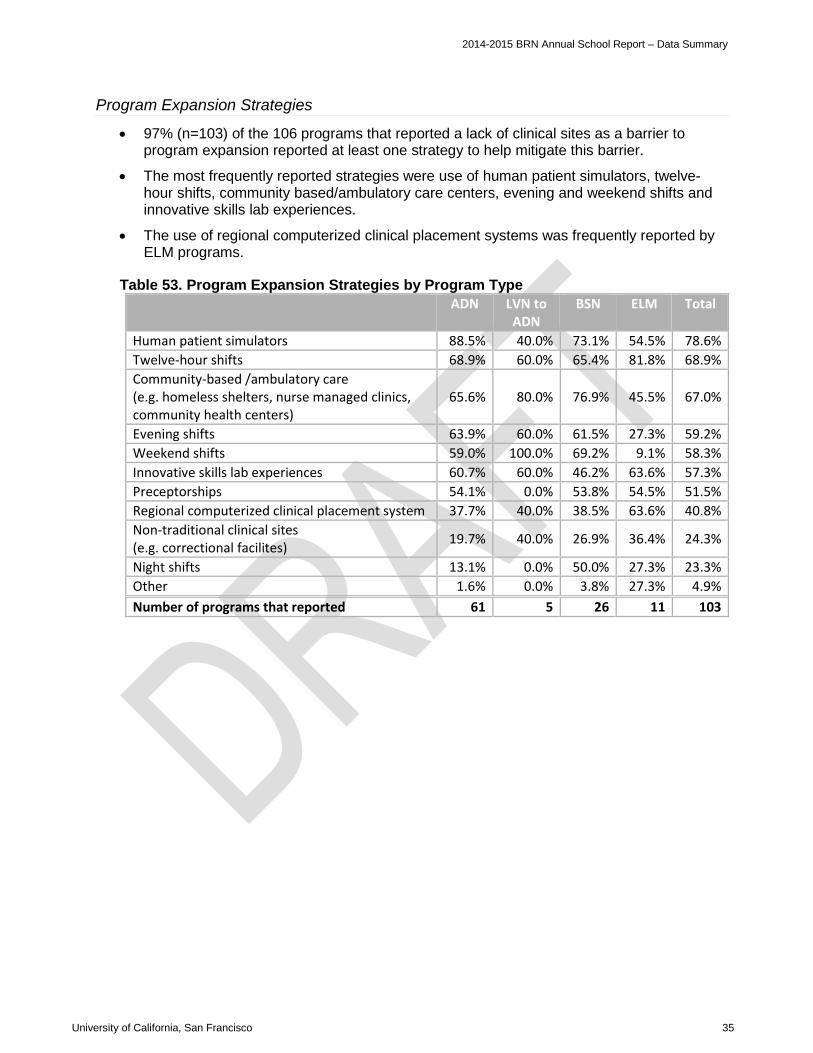
2014-2015 BRN Annual School Report – Data Summary
Program Expansion Strategies
• 97% (n=103) of the 106 programs that reported a lack of clinical sites as a barrier to program expansion reported at least one strategy to help mitigate this barrier.
• The most frequently reported strategies were use of human patient simulators, twelve-hour shifts, community based/ambulatory care centers, evening and weekend shifts and innovative skills lab experiences.
• The use of regional computerized clinical placement systems was frequently reported by ELM programs.
Table 53. Program Expansion Strategies by Program Type ADN LVN to
ADN BSN ELM Total
Human patient simulators 88.5% 40.0% 73.1% 54.5% 78.6% Twelve-hour shifts 68.9% 60.0% 65.4% 81.8% 68.9% Community-based /ambulatory care (e.g. homeless shelters, nurse managed clinics, community health centers)
65.6% 80.0% 76.9% 45.5% 67.0%
Evening shifts 63.9% 60.0% 61.5% 27.3% 59.2% Weekend shifts 59.0% 100.0% 69.2% 9.1% 58.3% Innovative skills lab experiences 60.7% 60.0% 46.2% 63.6% 57.3% Preceptorships 54.1% 0.0% 53.8% 54.5% 51.5% Regional computerized clinical placement system 37.7% 40.0% 38.5% 63.6% 40.8% Non-traditional clinical sites (e.g. correctional facilites) 19.7% 40.0% 26.9% 36.4% 24.3%
Night shifts 13.1% 0.0% 50.0% 27.3% 23.3% Other 1.6% 0.0% 3.8% 27.3% 4.9% Number of programs that reported 61 5 26 11 103
University of California, San Francisco 35
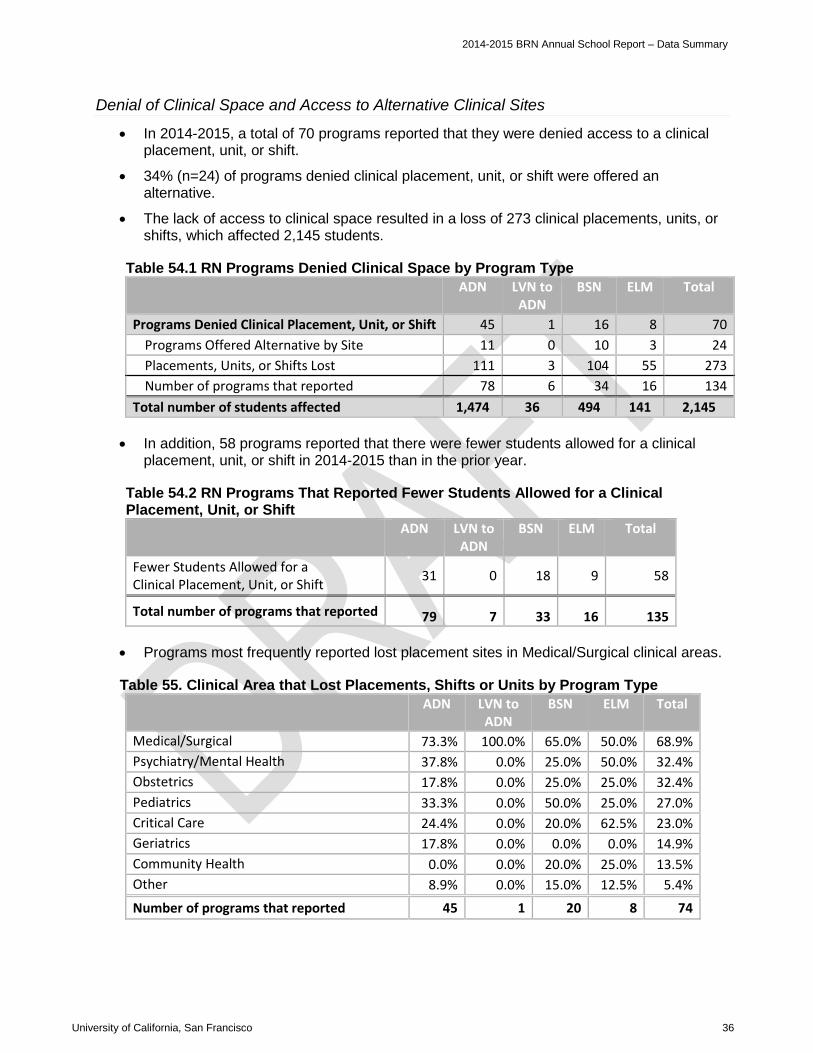
2014-2015 BRN Annual School Report – Data Summary
Denial of Clinical Space and Access to Alternative Clinical Sites
• In 2014-2015, a total of 70 programs reported that they were denied access to a clinical placement, unit, or shift.
• 34% (n=24) of programs denied clinical placement, unit, or shift were offered an alternative.
• The lack of access to clinical space resulted in a loss of 273 clinical placements, units, or shifts, which affected 2,145 students.
Table 54.1 RN Programs Denied Clinical Space by Program Type ADN LVN to
ADN BSN ELM Total
Programs Denied Clinical Placement, Unit, or Shift 45 1 16 8 70 Programs Offered Alternative by Site 11 0 10 3 24 Placements, Units, or Shifts Lost 111 3 104 55 273 Number of programs that reported 78 6 34 16 134
Total number of students affected 1,474 36 494 141 2,145
• In addition, 58 programs reported that there were fewer students allowed for a clinical placement, unit, or shift in 2014-2015 than in the prior year.
Table 54.2 RN Programs That Reported Fewer Students Allowed for a Clinical Placement, Unit, or Shift
ADN LVN to ADN
BSN ELM Total
Fewer Students Allowed for a Clinical Placement, Unit, or Shift 31 0 18 9 58
Total number of programs that reported 79 7 33 16 135
• Programs most frequently reported lost placement sites in Medical/Surgical clinical areas.
Table 55. Clinical Area that Lost Placements, Shifts or Units by Program Type ADN LVN to
ADN BSN ELM Total
Medical/Surgical 73.3% 100.0% 65.0% 50.0% 68.9% Psychiatry/Mental Health 37.8% 0.0% 25.0% 50.0% 32.4% Obstetrics 17.8% 0.0% 25.0% 25.0% 32.4% Pediatrics 33.3% 0.0% 50.0% 25.0% 27.0% Critical Care 24.4% 0.0% 20.0% 62.5% 23.0% Geriatrics 17.8% 0.0% 0.0% 0.0% 14.9% Community Health 0.0% 0.0% 20.0% 25.0% 13.5% Other 8.9% 0.0% 15.0% 12.5% 5.4% Number of programs that reported 45 1 20 8 74
University of California, San Francisco 36
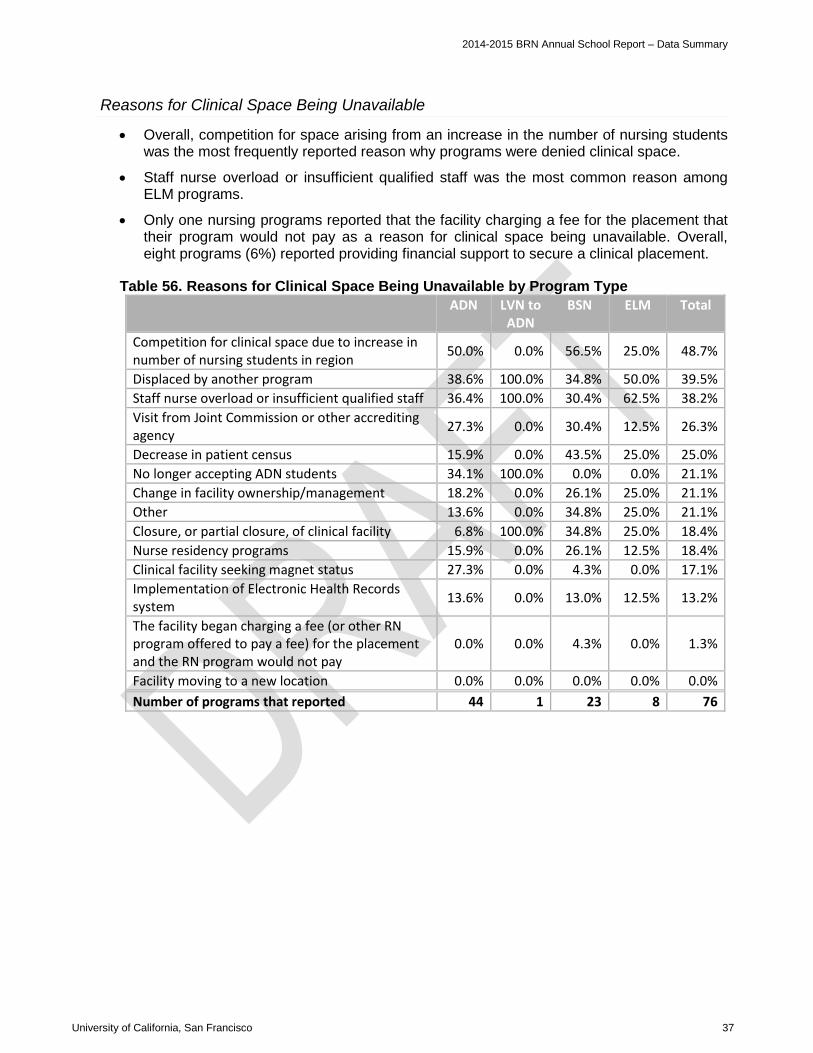
2014-2015 BRN Annual School Report – Data Summary
Reasons for Clinical Space Being Unavailable
• Overall, competition for space arising from an increase in the number of nursing students was the most frequently reported reason why programs were denied clinical space.
• Staff nurse overload or insufficient qualified staff was the most common reason among ELM programs.
• Only one nursing programs reported that the facility charging a fee for the placement that their program would not pay as a reason for clinical space being unavailable. Overall, eight programs (6%) reported providing financial support to secure a clinical placement.
Table 56. Reasons for Clinical Space Being Unavailable by Program Type ADN LVN to
ADN BSN ELM Total
Competition for clinical space due to increase in number of nursing students in region 50.0% 0.0% 56.5% 25.0% 48.7%
Displaced by another program 38.6% 100.0% 34.8% 50.0% 39.5% Staff nurse overload or insufficient qualified staff 36.4% 100.0% 30.4% 62.5% 38.2% Visit from Joint Commission or other accrediting agency 27.3% 0.0% 30.4% 12.5% 26.3%
Decrease in patient census 15.9% 0.0% 43.5% 25.0% 25.0% No longer accepting ADN students 34.1% 100.0% 0.0% 0.0% 21.1% Change in facility ownership/management 18.2% 0.0% 26.1% 25.0% 21.1% Other 13.6% 0.0% 34.8% 25.0% 21.1% Closure, or partial closure, of clinical facility 6.8% 100.0% 34.8% 25.0% 18.4% Nurse residency programs 15.9% 0.0% 26.1% 12.5% 18.4% Clinical facility seeking magnet status 27.3% 0.0% 4.3% 0.0% 17.1% Implementation of Electronic Health Records system 13.6% 0.0% 13.0% 12.5% 13.2%
The facility began charging a fee (or other RN program offered to pay a fee) for the placement and the RN program would not pay
0.0% 0.0% 4.3% 0.0% 1.3%
Facility moving to a new location 0.0% 0.0% 0.0% 0.0% 0.0% Number of programs that reported 44 1 23 8 76
University of California, San Francisco 37
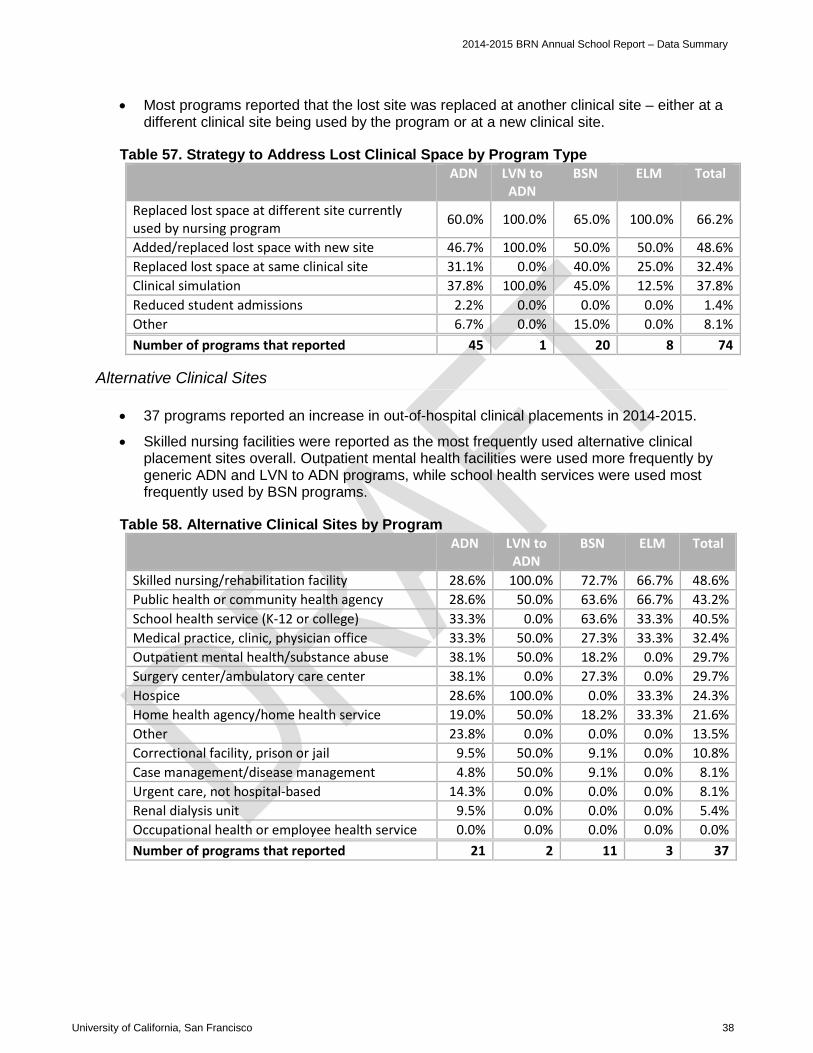
2014-2015 BRN Annual School Report – Data Summary
• Most programs reported that the lost site was replaced at another clinical site – either at a different clinical site being used by the program or at a new clinical site.
Table 57. Strategy to Address Lost Clinical Space by Program Type ADN LVN to
ADN BSN ELM Total
Replaced lost space at different site currently used by nursing program 60.0% 100.0% 65.0% 100.0% 66.2%
Added/replaced lost space with new site 46.7% 100.0% 50.0% 50.0% 48.6% Replaced lost space at same clinical site 31.1% 0.0% 40.0% 25.0% 32.4% Clinical simulation 37.8% 100.0% 45.0% 12.5% 37.8% Reduced student admissions 2.2% 0.0% 0.0% 0.0% 1.4% Other 6.7% 0.0% 15.0% 0.0% 8.1% Number of programs that reported 45 1 20 8 74
Alternative Clinical Sites
• 37 programs reported an increase in out-of-hospital clinical placements in 2014-2015.
• Skilled nursing facilities were reported as the most frequently used alternative clinical placement sites overall. Outpatient mental health facilities were used more frequently by generic ADN and LVN to ADN programs, while school health services were used most frequently used by BSN programs.
Table 58. Alternative Clinical Sites by Program ADN LVN to
ADN BSN ELM Total
Skilled nursing/rehabilitation facility 28.6% 100.0% 72.7% 66.7% 48.6% Public health or community health agency 28.6% 50.0% 63.6% 66.7% 43.2% School health service (K-12 or college) 33.3% 0.0% 63.6% 33.3% 40.5% Medical practice, clinic, physician office 33.3% 50.0% 27.3% 33.3% 32.4% Outpatient mental health/substance abuse 38.1% 50.0% 18.2% 0.0% 29.7% Surgery center/ambulatory care center 38.1% 0.0% 27.3% 0.0% 29.7% Hospice 28.6% 100.0% 0.0% 33.3% 24.3% Home health agency/home health service 19.0% 50.0% 18.2% 33.3% 21.6% Other 23.8% 0.0% 0.0% 0.0% 13.5% Correctional facility, prison or jail 9.5% 50.0% 9.1% 0.0% 10.8% Case management/disease management 4.8% 50.0% 9.1% 0.0% 8.1% Urgent care, not hospital-based 14.3% 0.0% 0.0% 0.0% 8.1% Renal dialysis unit 9.5% 0.0% 0.0% 0.0% 5.4% Occupational health or employee health service 0.0% 0.0% 0.0% 0.0% 0.0% Number of programs that reported 21 2 11 3 37
University of California, San Francisco 38
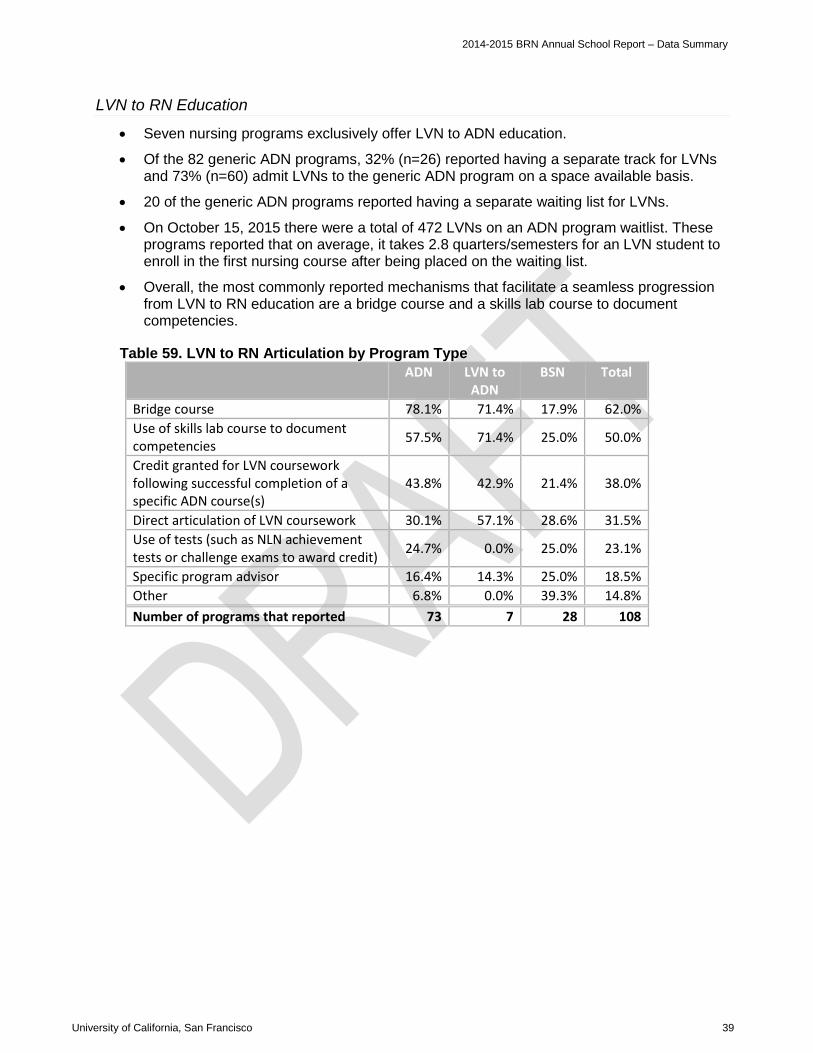
2014-2015 BRN Annual School Report – Data Summary
LVN to RN Education
• Seven nursing programs exclusively offer LVN to ADN education.
• Of the 82 generic ADN programs, 32% (n=26) reported having a separate track for LVNs and 73% (n=60) admit LVNs to the generic ADN program on a space available basis.
• 20 of the generic ADN programs reported having a separate waiting list for LVNs.
• On October 15, 2015 there were a total of 472 LVNs on an ADN program waitlist. These programs reported that on average, it takes 2.8 quarters/semesters for an LVN student to enroll in the first nursing course after being placed on the waiting list.
• Overall, the most commonly reported mechanisms that facilitate a seamless progression from LVN to RN education are a bridge course and a skills lab course to document competencies.
Table 59. LVN to RN Articulation by Program Type ADN LVN to
ADN BSN Total
Bridge course 78.1% 71.4% 17.9% 62.0% Use of skills lab course to document competencies 57.5% 71.4% 25.0% 50.0%
Credit granted for LVN coursework following successful completion of a specific ADN course(s)
43.8% 42.9% 21.4% 38.0%
Direct articulation of LVN coursework 30.1% 57.1% 28.6% 31.5% Use of tests (such as NLN achievement tests or challenge exams to award credit) 24.7% 0.0% 25.0% 23.1%
Specific program advisor 16.4% 14.3% 25.0% 18.5% Other 6.8% 0.0% 39.3% 14.8% Number of programs that reported 73 7 28 108
University of California, San Francisco 39
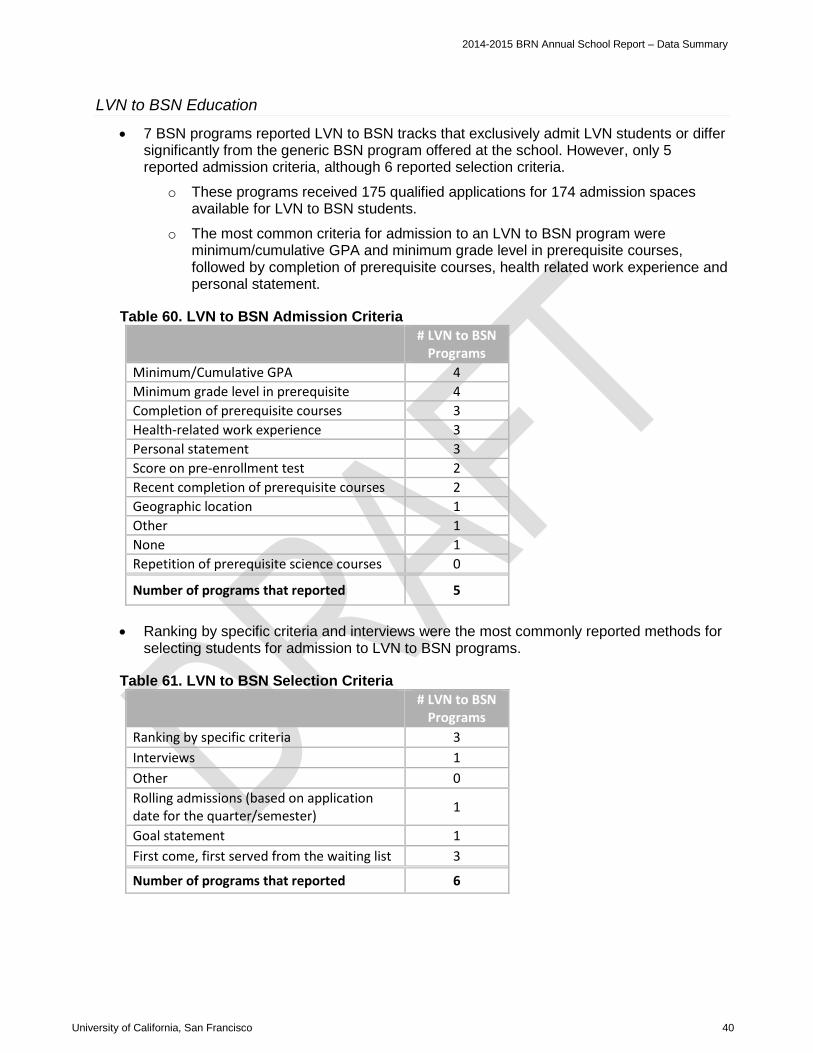
2014-2015 BRN Annual School Report – Data Summary
LVN to BSN Education
• 7 BSN programs reported LVN to BSN tracks that exclusively admit LVN students or differ significantly from the generic BSN program offered at the school. However, only 5 reported admission criteria, although 6 reported selection criteria.
o These programs received 175 qualified applications for 174 admission spaces available for LVN to BSN students.
o The most common criteria for admission to an LVN to BSN program were minimum/cumulative GPA and minimum grade level in prerequisite courses, followed by completion of prerequisite courses, health related work experience and personal statement.
Table 60. LVN to BSN Admission Criteria # LVN to BSN
Programs Minimum/Cumulative GPA 4 Minimum grade level in prerequisite
4
Completion of prerequisite courses 3 Health-related work experience 3 Personal statement 3 Score on pre-enrollment test 2 Recent completion of prerequisite courses 2 Geographic location 1 Other 1 None 1 Repetition of prerequisite science courses 0
Number of programs that reported 5
• Ranking by specific criteria and interviews were the most commonly reported methods for selecting students for admission to LVN to BSN programs.
Table 61. LVN to BSN Selection Criteria # LVN to BSN
Programs Ranking by specific criteria 3 Interviews 1 Other 0 Rolling admissions (based on application date for the quarter/semester) 1
Goal statement 1 First come, first served from the waiting list 3
Number of programs that reported 6
University of California, San Francisco 40
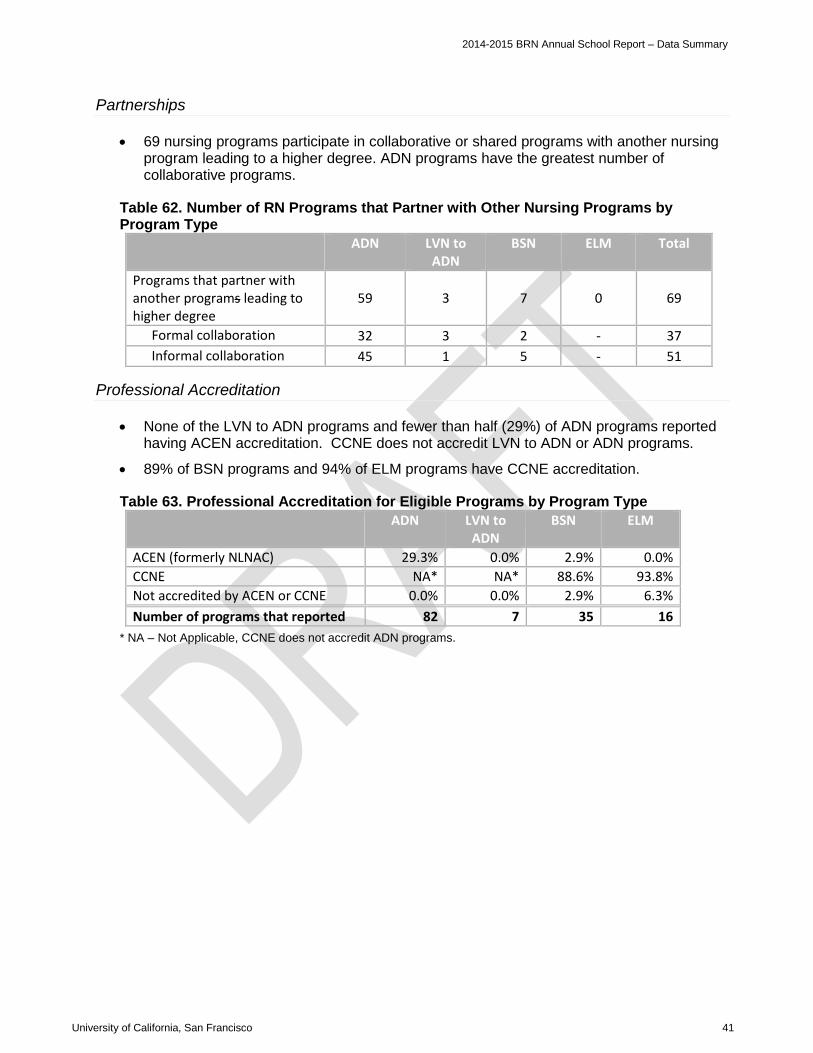
2014-2015 BRN Annual School Report – Data Summary
Partnerships
• 69 nursing programs participate in collaborative or shared programs with another nursing program leading to a higher degree. ADN programs have the greatest number of collaborative programs.
Table 62. Number of RN Programs that Partner with Other Nursing Programs by Program Type
ADN LVN to ADN
BSN ELM Total
Programs that partner with another programs leading to higher degree
59 3 7 0 69
Formal collaboration 32 3 2 - 37 Informal collaboration 45 1 5 - 51
Professional Accreditation
• None of the LVN to ADN programs and fewer than half (29%) of ADN programs reported having ACEN accreditation. CCNE does not accredit LVN to ADN or ADN programs.
• 89% of BSN programs and 94% of ELM programs have CCNE accreditation.
Table 63. Professional Accreditation for Eligible Programs by Program Type ADN LVN to
ADN BSN ELM
ACEN (formerly NLNAC) 29.3% 0.0% 2.9% 0.0% CCNE NA* NA* 88.6% 93.8% Not accredited by ACEN or CCNE 0.0% 0.0% 2.9% 6.3% Number of programs that reported 82 7 35 16
* NA – Not Applicable, CCNE does not accredit ADN programs.
University of California, San Francisco 41

2014-2015 BRN Annual School Report – Data Summary
First Time NCLEX Pass Rates
• In 2014-2015, 84% (n=8,958) of nursing students who took the NCLEX for the first time passed the exam.
• The NCLEX pass rate was highest for students who graduated from ADN and BSN programs.
Table 64. First Time NCLEX Pass Rates by Program Type ADN LVN to
ADN BSN ELM Total
First Time NCLEX* Pass Rate 84.5% 80.2% 84.4% 80.7% 84.1%
# Students that took the NCLEX
5,274
288
4,407
683
10,652
# Students that passed the NCLEX
4,456
231
3,720
551
8,958
*These data represent nursing students who took the NCLEX for the first time in 2014-15.
• Overall, pass rates in accelerated programs were higher than those in traditional programs; 91% (n=806) of nursing students in an accelerated track who took the NCLEX for the first time in 2014-2015 passed the exam.
• In 2014-2015, all accelerated programs had a higher average pass rate than their traditional counterparts.
Table 65. NCLEX Pass Rates for Accelerated Programs by Program Type ADN BSN ELM Total
First Time NCLEX* Pass Rate 95.5% 91.1% 90.0% 91.1%
# Students that took the NCLEX 44 620 221 885
# Students that passed the NCLEX 42 565 199 806
*These data represent nursing students who took the NCLEX for the first time in 2014-15. ** No LVN to ADN programs reported data in this area.
University of California, San Francisco 42

2014-2015 BRN Annual School Report – Data Summary
Clinical Simulation5
• 129 of 141 nursing programs (91%) reported using clinical simulation in 2014-2015.6
• Medical/surgical, and obstetrics are the content areas in which programs use the most hours of clinical simulation.
• The largest proportion of clinical hours in all programs is in direct patient care, and ELM programs allot the largest percentage of clinical hours (85%) to direct patient care activities.
• Program types allocated a roughly similar proportion of clinical hours to simulation activities (7.4-8.1%). However, BSN programs allocated the largest proportion of clinical hours to non-direct patient care (16%).
Table 66. Average Hours Spent in Clinical Training by Program Type and Content Area
Content Area Direct Patient Care Non-Direct Patient
Care (excluding simulation)
Clinical Simulation Total Average Clinical Hours
ADN BSN ELM ADN BSN ELM ADN BSN ELM ADN BSN ELM Medical/ Surgical 325.3 186.8 183.8 31.1 30.1 16.1 31.4 19.7 21.8 352.5 216.3 207.8
Fundamentals 91.0 58.0 82.2 48.2 45.6 24.5 10.3 8.4 9.6 136.0 102.4 109.0
Obstetrics 70.3 73.2 88.2 7.5 11.4 3.4 13.0 8.3 10.1 82.7 85.0 95.4 Leadership/ Management 59.9 54.0 89.0 2.1 11.8 8.3 4.2 3.4 2.6 59.5 63.3 93.6
Pediatrics 68.6 72.0 85.0 6.6 11.2 5.1 7.5 7.7 8.8 75.2 83.1 92.7 Psychiatry/ Mental Health 75.2 76.1 84.3 3.9 9.3 2.7 4.6 5.4 8.8 76.2 83.0 89.8
Other 21.3 57.5 72.2 1.4 2.8 1.1 2.3 3.2 1.7 22.2 58.0 70.3
Geriatrics 69.5 60.0 55.1 4.2 6.9 3.3 4.6 5.1 4.6 69.8 65.8 58.8
Total Average Clinical Hours
708.1 583.0 693.5 105.0 95.2 60.3 70.9 56.0 63.5 874.2 756.9 817.3
Number of programs that reported
89 35 16 89 35 16 89 35 16 89 35 16
5 Questions related to clinical simulation were revised for the 2014-15 survey administration. Some of the question content changed, as did the unit of analysis from nursing school to nursing program.
6 6 programs did not use simulation, and 6 did not answer this question
University of California, San Francisco 43
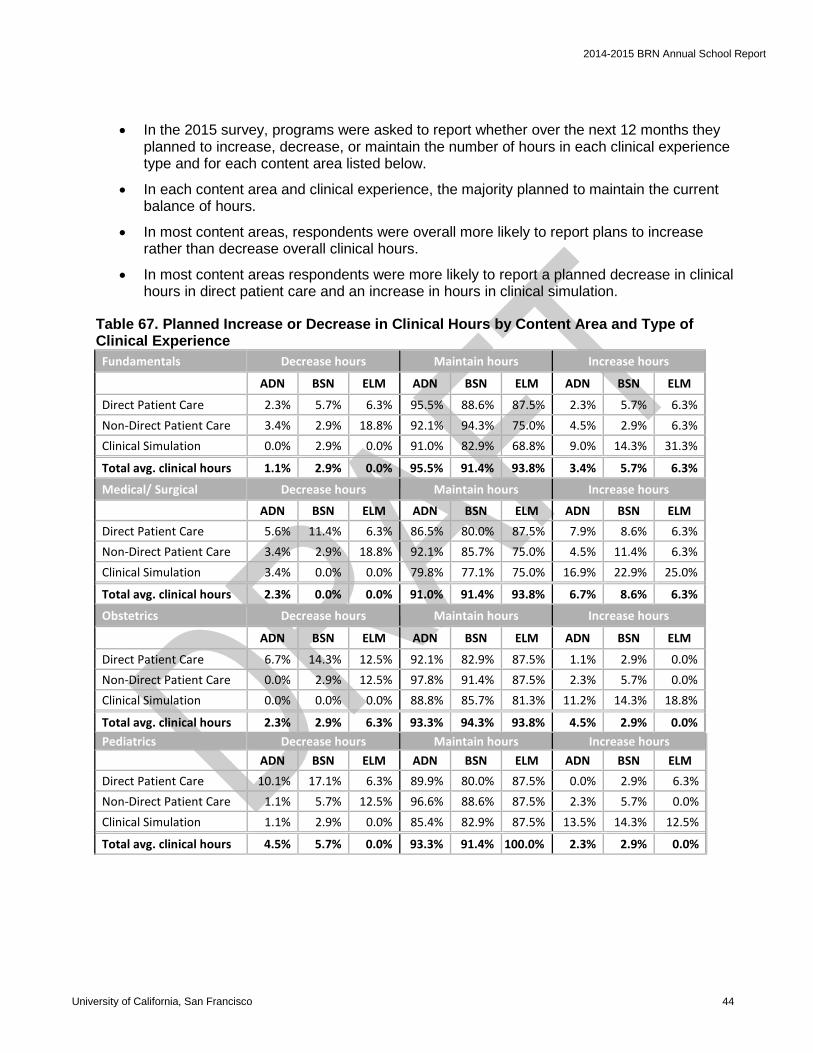
2014-2015 BRN Annual School Report
• In the 2015 survey, programs were asked to report whether over the next 12 months they planned to increase, decrease, or maintain the number of hours in each clinical experience type and for each content area listed below.
• In each content area and clinical experience, the majority planned to maintain the current balance of hours.
• In most content areas, respondents were overall more likely to report plans to increase rather than decrease overall clinical hours.
• In most content areas respondents were more likely to report a planned decrease in clinical hours in direct patient care and an increase in hours in clinical simulation.
Table 67. Planned Increase or Decrease in Clinical Hours by Content Area and Type of Clinical Experience
Fundamentals Decrease hours Maintain hours Increase hours
ADN BSN ELM ADN BSN ELM ADN BSN ELM
Direct Patient Care 2.3% 5.7% 6.3% 95.5% 88.6% 87.5% 2.3% 5.7% 6.3% Non-Direct Patient Care 3.4% 2.9% 18.8% 92.1% 94.3% 75.0% 4.5% 2.9% 6.3% Clinical Simulation 0.0% 2.9% 0.0% 91.0% 82.9% 68.8% 9.0% 14.3% 31.3%
Total avg. clinical hours 1.1% 2.9% 0.0% 95.5% 91.4% 93.8% 3.4% 5.7% 6.3%
Medical/ Surgical Decrease hours Maintain hours Increase hours
ADN BSN ELM ADN BSN ELM ADN BSN ELM Direct Patient Care 5.6% 11.4% 6.3% 86.5% 80.0% 87.5% 7.9% 8.6% 6.3% Non-Direct Patient Care 3.4% 2.9% 18.8% 92.1% 85.7% 75.0% 4.5% 11.4% 6.3% Clinical Simulation 3.4% 0.0% 0.0% 79.8% 77.1% 75.0% 16.9% 22.9% 25.0%
Total avg. clinical hours 2.3% 0.0% 0.0% 91.0% 91.4% 93.8% 6.7% 8.6% 6.3%
Obstetrics Decrease hours Maintain hours Increase hours
ADN BSN ELM ADN BSN ELM ADN BSN ELM
Direct Patient Care 6.7% 14.3% 12.5% 92.1% 82.9% 87.5% 1.1% 2.9% 0.0% Non-Direct Patient Care 0.0% 2.9% 12.5% 97.8% 91.4% 87.5% 2.3% 5.7% 0.0% Clinical Simulation 0.0% 0.0% 0.0% 88.8% 85.7% 81.3% 11.2% 14.3% 18.8%
Total avg. clinical hours 2.3% 2.9% 6.3% 93.3% 94.3% 93.8% 4.5% 2.9% 0.0% Pediatrics Decrease hours Maintain hours Increase hours ADN BSN ELM ADN BSN ELM ADN BSN ELM Direct Patient Care 10.1% 17.1% 6.3% 89.9% 80.0% 87.5% 0.0% 2.9% 6.3% Non-Direct Patient Care 1.1% 5.7% 12.5% 96.6% 88.6% 87.5% 2.3% 5.7% 0.0% Clinical Simulation 1.1% 2.9% 0.0% 85.4% 82.9% 87.5% 13.5% 14.3% 12.5%
Total avg. clinical hours 4.5% 5.7% 0.0% 93.3% 91.4% 100.0% 2.3% 2.9% 0.0%
University of California, San Francisco 44
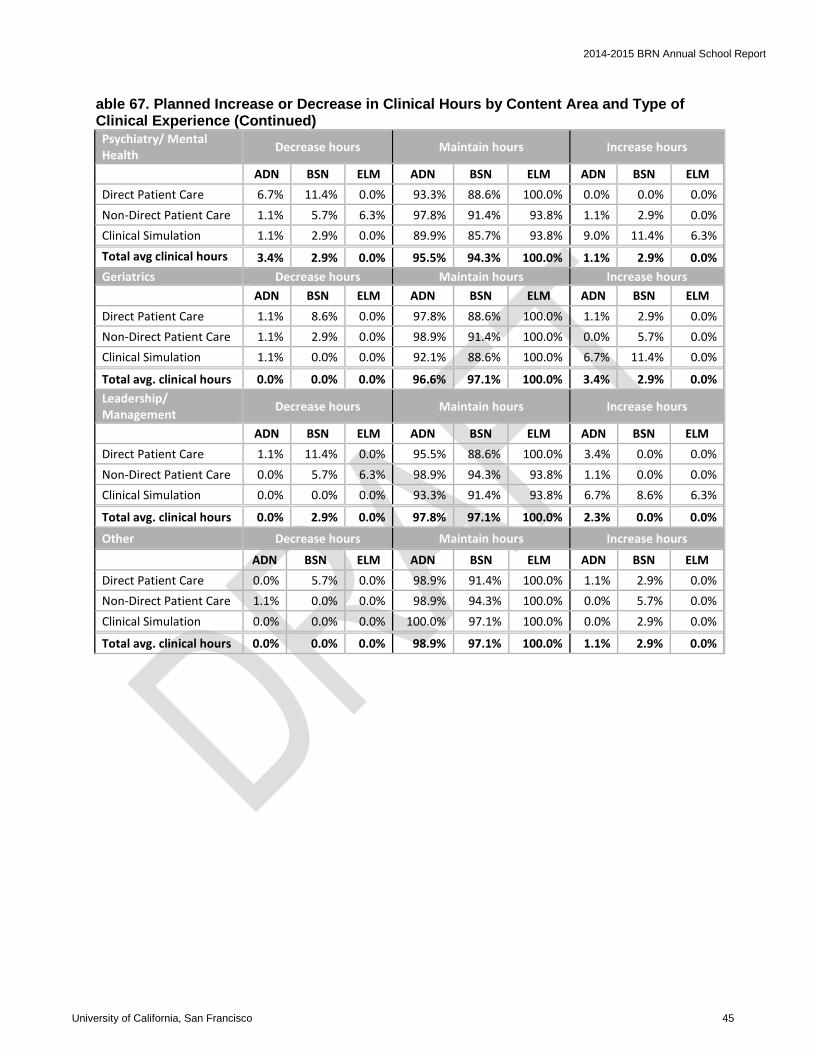
2014-2015 BRN Annual School Report
able 67. Planned Increase or Decrease in Clinical Hours by Content Area and Type of Clinical Experience (Continued)
Psychiatry/ Mental Health Decrease hours Maintain hours Increase hours
ADN BSN ELM ADN BSN ELM ADN BSN ELM Direct Patient Care 6.7% 11.4% 0.0% 93.3% 88.6% 100.0% 0.0% 0.0% 0.0% Non-Direct Patient Care 1.1% 5.7% 6.3% 97.8% 91.4% 93.8% 1.1% 2.9% 0.0% Clinical Simulation 1.1% 2.9% 0.0% 89.9% 85.7% 93.8% 9.0% 11.4% 6.3% Total avg clinical hours 3.4% 2.9% 0.0% 95.5% 94.3% 100.0% 1.1% 2.9% 0.0% Geriatrics Decrease hours Maintain hours Increase hours ADN BSN ELM ADN BSN ELM ADN BSN ELM Direct Patient Care 1.1% 8.6% 0.0% 97.8% 88.6% 100.0% 1.1% 2.9% 0.0% Non-Direct Patient Care 1.1% 2.9% 0.0% 98.9% 91.4% 100.0% 0.0% 5.7% 0.0% Clinical Simulation 1.1% 0.0% 0.0% 92.1% 88.6% 100.0% 6.7% 11.4% 0.0%
Total avg. clinical hours 0.0% 0.0% 0.0% 96.6% 97.1% 100.0% 3.4% 2.9% 0.0% Leadership/ Management Decrease hours Maintain hours Increase hours
ADN BSN ELM ADN BSN ELM ADN BSN ELM Direct Patient Care 1.1% 11.4% 0.0% 95.5% 88.6% 100.0% 3.4% 0.0% 0.0% Non-Direct Patient Care 0.0% 5.7% 6.3% 98.9% 94.3% 93.8% 1.1% 0.0% 0.0% Clinical Simulation 0.0% 0.0% 0.0% 93.3% 91.4% 93.8% 6.7% 8.6% 6.3%
Total avg. clinical hours 0.0% 2.9% 0.0% 97.8% 97.1% 100.0% 2.3% 0.0% 0.0%
Other Decrease hours Maintain hours Increase hours
ADN BSN ELM ADN BSN ELM ADN BSN ELM Direct Patient Care 0.0% 5.7% 0.0% 98.9% 91.4% 100.0% 1.1% 2.9% 0.0% Non-Direct Patient Care 1.1% 0.0% 0.0% 98.9% 94.3% 100.0% 0.0% 5.7% 0.0% Clinical Simulation 0.0% 0.0% 0.0% 100.0% 97.1% 100.0% 0.0% 2.9% 0.0%
Total avg. clinical hours 0.0% 0.0% 0.0% 98.9% 97.1% 100.0% 1.1% 2.9% 0.0%
University of California, San Francisco 45

2014-2015 BRN Annual School Report
Respondents were asked why they were reducing the clinical hours in their program if they indicated in the prior questions that they were decreasing clinical hours in any content area.
• Respondents frequently commented that they were not decreasing clinical hours overall, often noting that they were shifting allocations (54%). The inability to find sufficient clinical space (24%) and other (22%) were also commonly noted. ”Other” reasons given included to “strengthen skills before start of clinicals” and “low census in acute pediatric unit”.
• More than a third (33%, n=46) of the 140 programs have plans to increase staff dedicated to administering clinical simulation at their school in the next 12 months.
Table 68. Why Program is Reducing Clinical Hours % Not decreasing overall; shifting allocations 54.1%
Unable to find sufficient clinical space 24.3% Other 21.6% Can teach required content in less time 13.5% Insufficient clinical faculty 8.1% Funding issues or unavailable funding 0.0%
Total reporting 37
RN Refresher Course
In 2014-2015, five nursing programs offered an RN refresher course, and 84 students completed one of these courses.
University of California, San Francisco 46
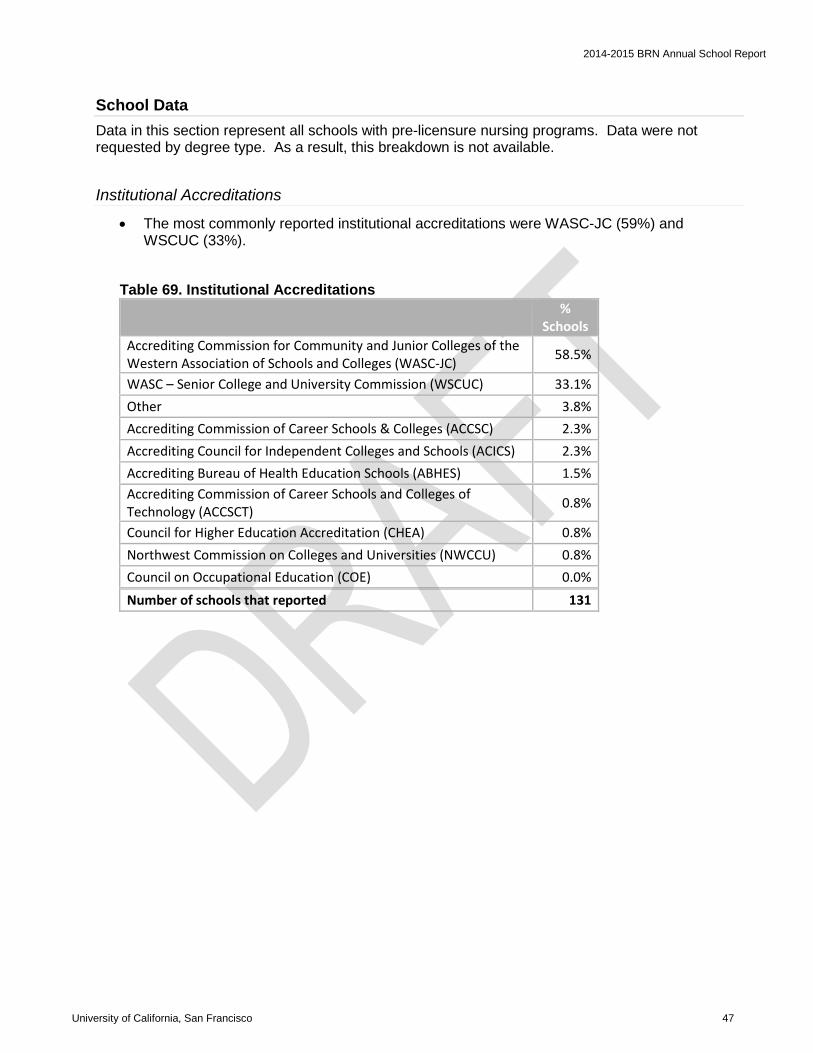
2014-2015 BRN Annual School Report
School Data Data in this section represent all schools with pre-licensure nursing programs. Data were not requested by degree type. As a result, this breakdown is not available.
Institutional Accreditations
• The most commonly reported institutional accreditations were WASC-JC (59%) and WSCUC (33%).
Table 69. Institutional Accreditations
%
Schools Accrediting Commission for Community and Junior Colleges of the Western Association of Schools and Colleges (WASC-JC) 58.5%
WASC – Senior College and University Commission (WSCUC) 33.1% Other 3.8% Accrediting Commission of Career Schools & Colleges (ACCSC) 2.3% Accrediting Council for Independent Colleges and Schools (ACICS) 2.3% Accrediting Bureau of Health Education Schools (ABHES) 1.5% Accrediting Commission of Career Schools and Colleges of Technology (ACCSCT) 0.8%
Council for Higher Education Accreditation (CHEA) 0.8% Northwest Commission on Colleges and Universities (NWCCU) 0.8% Council on Occupational Education (COE) 0.0% Number of schools that reported 131
University of California, San Francisco 47

2014-2015 BRN Annual School Report
Nursing Program Directors
• The largest proportion of nursing program directors’ time, on average, was spent on managing nursing compliance (17.5%), managing human resources (10.6%), and managing the curriculum (9.1%).
Table 70. Nursing Program Directors’ Time
% of Time Spent
Manage nursing program compliance 17.5% Manage human resources 10.6% Manage curriculum 9.1% Collaborate with college/district 8.8% Facilitate student needs and activities 8.0% Manage fiscal resources 7.6% Manage student enrollment 7.3% Manage clinical resources 6.7% Administration of other programs 6.5% Promote community awareness and public relations 4.9% Teaching students 3.9% Manage college facilities 3.4% Manage information technology 3.2% Research 1.7% Other (please describe) 0.8% Number of Schools that Reported 131
University of California, San Francisco 48
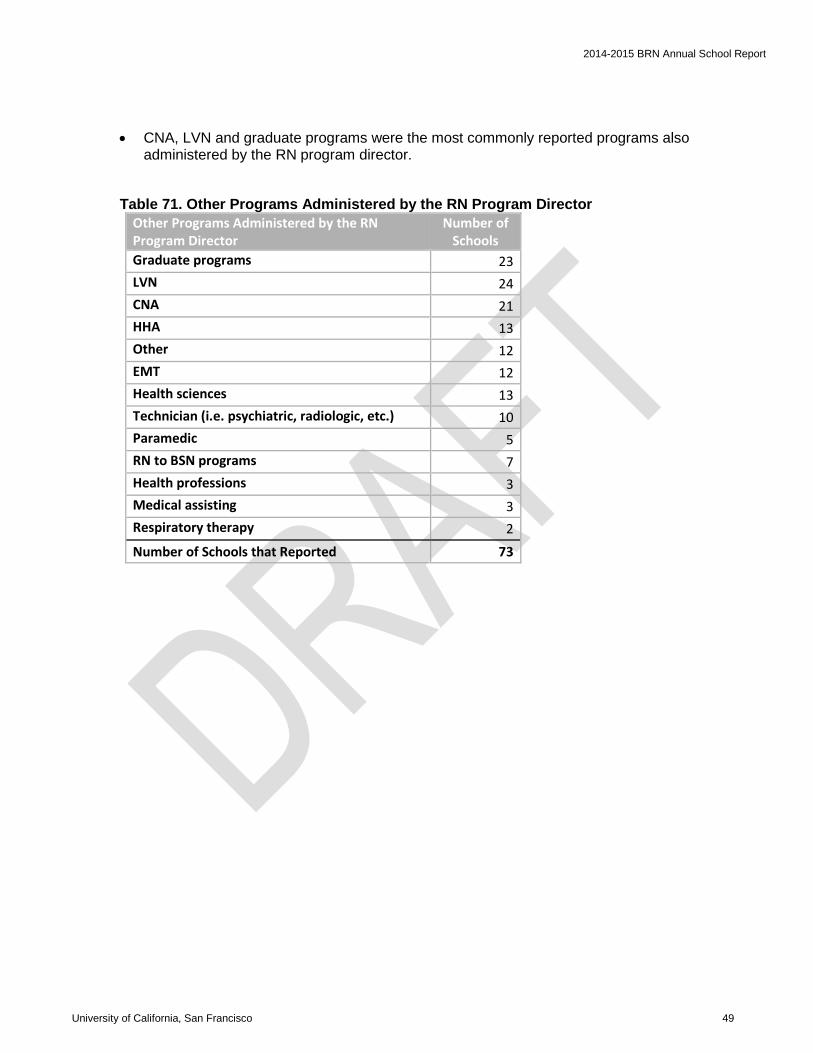
2014-2015 BRN Annual School Report
• CNA, LVN and graduate programs were the most commonly reported programs also administered by the RN program director.
Table 71. Other Programs Administered by the RN Program Director Other Programs Administered by the RN Program Director
Number of Schools
Graduate programs 23 LVN 24 CNA 21 HHA 13 Other 12 EMT 12 Health sciences 13 Technician (i.e. psychiatric, radiologic, etc.) 10 Paramedic 5 RN to BSN programs 7 Health professions 3 Medical assisting 3 Respiratory therapy 2 Number of Schools that Reported 73
University of California, San Francisco 49
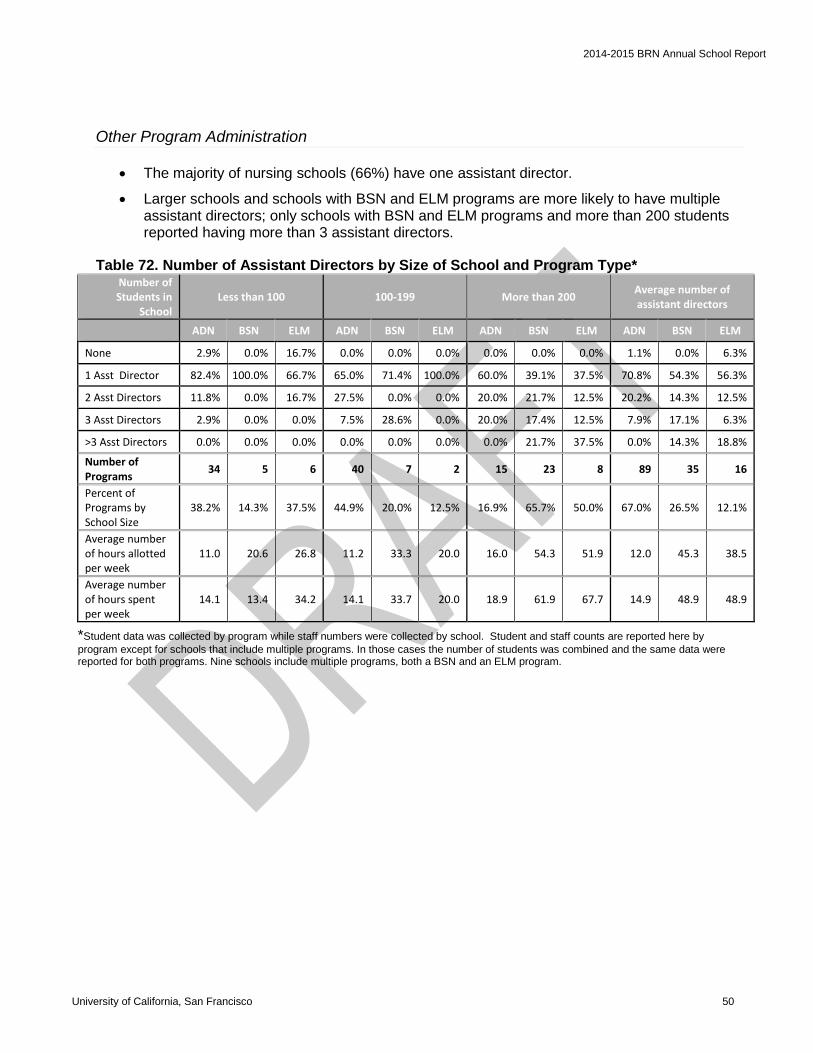
2014-2015 BRN Annual School Report
Other Program Administration
• The majority of nursing schools (66%) have one assistant director.
• Larger schools and schools with BSN and ELM programs are more likely to have multiple assistant directors; only schools with BSN and ELM programs and more than 200 students reported having more than 3 assistant directors.
Table 72. Number of Assistant Directors by Size of School and Program Type* Number of Students in
School Less than 100 100-199 More than 200 Average number of
assistant directors
ADN BSN ELM ADN BSN ELM ADN BSN ELM ADN BSN ELM
None 2.9% 0.0% 16.7% 0.0% 0.0% 0.0% 0.0% 0.0% 0.0% 1.1% 0.0% 6.3%
1 Asst Director 82.4% 100.0% 66.7% 65.0% 71.4% 100.0% 60.0% 39.1% 37.5% 70.8% 54.3% 56.3%
2 Asst Directors 11.8% 0.0% 16.7% 27.5% 0.0% 0.0% 20.0% 21.7% 12.5% 20.2% 14.3% 12.5%
3 Asst Directors 2.9% 0.0% 0.0% 7.5% 28.6% 0.0% 20.0% 17.4% 12.5% 7.9% 17.1% 6.3%
>3 Asst Directors 0.0% 0.0% 0.0% 0.0% 0.0% 0.0% 0.0% 21.7% 37.5% 0.0% 14.3% 18.8%
Number of Programs 34 5 6 40 7 2 15 23 8 89 35 16
Percent of Programs by School Size
38.2% 14.3% 37.5% 44.9% 20.0% 12.5% 16.9% 65.7% 50.0% 67.0% 26.5% 12.1%
Average number of hours allotted per week
11.0 20.6 26.8 11.2 33.3 20.0 16.0 54.3 51.9 12.0 45.3 38.5
Average number of hours spent per week
14.1 13.4 34.2 14.1 33.7 20.0 18.9 61.9 67.7 14.9 48.9 48.9
*Student data was collected by program while staff numbers were collected by school. Student and staff counts are reported here by program except for schools that include multiple programs. In those cases the number of students was combined and the same data were reported for both programs. Nine schools include multiple programs, both a BSN and an ELM program.
University of California, San Francisco 50
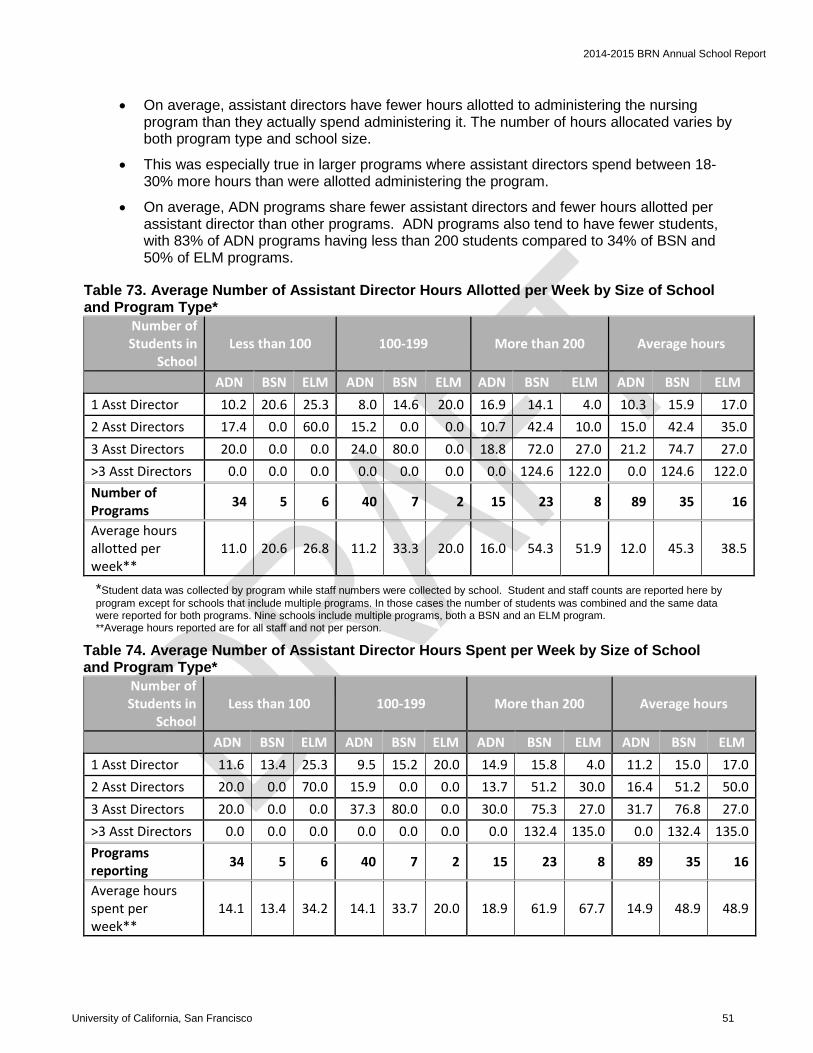
2014-2015 BRN Annual School Report
• On average, assistant directors have fewer hours allotted to administering the nursing program than they actually spend administering it. The number of hours allocated varies by both program type and school size.
• This was especially true in larger programs where assistant directors spend between 18-30% more hours than were allotted administering the program.
• On average, ADN programs share fewer assistant directors and fewer hours allotted per assistant director than other programs. ADN programs also tend to have fewer students, with 83% of ADN programs having less than 200 students compared to 34% of BSN and 50% of ELM programs.
Table 73. Average Number of Assistant Director Hours Allotted per Week by Size of School and Program Type*
Number of Students in
School Less than 100 100-199 More than 200 Average hours
ADN BSN ELM ADN BSN ELM ADN BSN ELM ADN BSN ELM 1 Asst Director 10.2 20.6 25.3 8.0 14.6 20.0 16.9 14.1 4.0 10.3 15.9 17.0 2 Asst Directors 17.4 0.0 60.0 15.2 0.0 0.0 10.7 42.4 10.0 15.0 42.4 35.0 3 Asst Directors 20.0 0.0 0.0 24.0 80.0 0.0 18.8 72.0 27.0 21.2 74.7 27.0 >3 Asst Directors 0.0 0.0 0.0 0.0 0.0 0.0 0.0 124.6 122.0 0.0 124.6 122.0 Number of Programs 34 5 6 40 7 2 15 23 8 89 35 16
Average hours allotted per week**
11.0 20.6 26.8 11.2 33.3 20.0 16.0 54.3 51.9 12.0 45.3 38.5
*Student data was collected by program while staff numbers were collected by school. Student and staff counts are reported here by program except for schools that include multiple programs. In those cases the number of students was combined and the same data were reported for both programs. Nine schools include multiple programs, both a BSN and an ELM program. **Average hours reported are for all staff and not per person.
Table 74. Average Number of Assistant Director Hours Spent per Week by Size of School and Program Type*
Number of Students in
School Less than 100 100-199 More than 200 Average hours
ADN BSN ELM ADN BSN ELM ADN BSN ELM ADN BSN ELM 1 Asst Director 11.6 13.4 25.3 9.5 15.2 20.0 14.9 15.8 4.0 11.2 15.0 17.0 2 Asst Directors 20.0 0.0 70.0 15.9 0.0 0.0 13.7 51.2 30.0 16.4 51.2 50.0 3 Asst Directors 20.0 0.0 0.0 37.3 80.0 0.0 30.0 75.3 27.0 31.7 76.8 27.0 >3 Asst Directors 0.0 0.0 0.0 0.0 0.0 0.0 0.0 132.4 135.0 0.0 132.4 135.0 Programs reporting 34 5 6 40 7 2 15 23 8 89 35 16
Average hours spent per week**
14.1 13.4 34.2 14.1 33.7 20.0 18.9 61.9 67.7 14.9 48.9 48.9
University of California, San Francisco 51
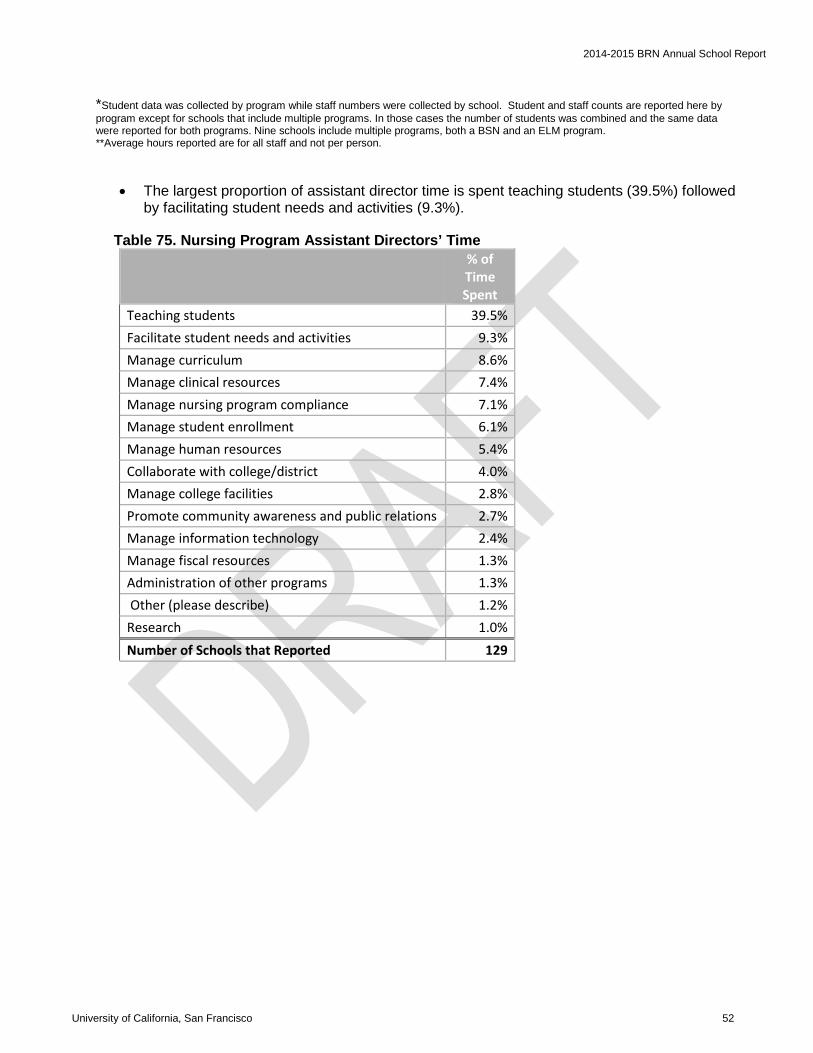
2014-2015 BRN Annual School Report
*Student data was collected by program while staff numbers were collected by school. Student and staff counts are reported here by program except for schools that include multiple programs. In those cases the number of students was combined and the same data were reported for both programs. Nine schools include multiple programs, both a BSN and an ELM program. **Average hours reported are for all staff and not per person.
• The largest proportion of assistant director time is spent teaching students (39.5%) followed by facilitating student needs and activities (9.3%).
Table 75. Nursing Program Assistant Directors’ Time
% of Time Spent
Teaching students 39.5% Facilitate student needs and activities 9.3% Manage curriculum 8.6% Manage clinical resources 7.4% Manage nursing program compliance 7.1% Manage student enrollment 6.1% Manage human resources 5.4% Collaborate with college/district 4.0% Manage college facilities 2.8% Promote community awareness and public relations 2.7% Manage information technology 2.4% Manage fiscal resources 1.3% Administration of other programs 1.3% Other (please describe) 1.2% Research 1.0% Number of Schools that Reported 129
University of California, San Francisco 52
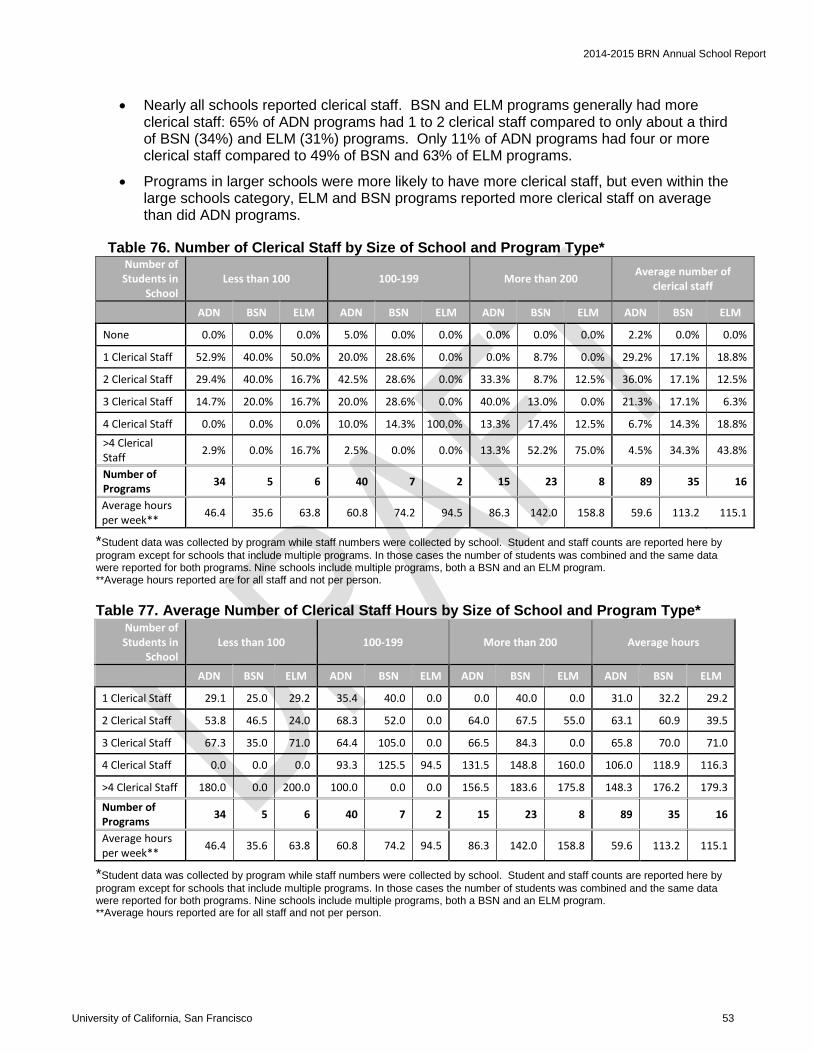
2014-2015 BRN Annual School Report
• Nearly all schools reported clerical staff. BSN and ELM programs generally had more clerical staff: 65% of ADN programs had 1 to 2 clerical staff compared to only about a third of BSN (34%) and ELM (31%) programs. Only 11% of ADN programs had four or more clerical staff compared to 49% of BSN and 63% of ELM programs.
• Programs in larger schools were more likely to have more clerical staff, but even within the large schools category, ELM and BSN programs reported more clerical staff on average than did ADN programs.
Table 76. Number of Clerical Staff by Size of School and Program Type* Number of Students in
School Less than 100 100-199 More than 200 Average number of
clerical staff
ADN BSN ELM ADN BSN ELM ADN BSN ELM ADN BSN ELM
None 0.0% 0.0% 0.0% 5.0% 0.0% 0.0% 0.0% 0.0% 0.0% 2.2% 0.0% 0.0%
1 Clerical Staff 52.9% 40.0% 50.0% 20.0% 28.6% 0.0% 0.0% 8.7% 0.0% 29.2% 17.1% 18.8%
2 Clerical Staff 29.4% 40.0% 16.7% 42.5% 28.6% 0.0% 33.3% 8.7% 12.5% 36.0% 17.1% 12.5%
3 Clerical Staff 14.7% 20.0% 16.7% 20.0% 28.6% 0.0% 40.0% 13.0% 0.0% 21.3% 17.1% 6.3%
4 Clerical Staff 0.0% 0.0% 0.0% 10.0% 14.3% 100.0% 13.3% 17.4% 12.5% 6.7% 14.3% 18.8%
>4 Clerical Staff 2.9% 0.0% 16.7% 2.5% 0.0% 0.0% 13.3% 52.2% 75.0% 4.5% 34.3% 43.8%
Number of Programs 34 5 6 40 7 2 15 23 8 89 35 16
Average hours per week** 46.4 35.6 63.8 60.8 74.2 94.5 86.3 142.0 158.8 59.6 113.2 115.1
*Student data was collected by program while staff numbers were collected by school. Student and staff counts are reported here by program except for schools that include multiple programs. In those cases the number of students was combined and the same data were reported for both programs. Nine schools include multiple programs, both a BSN and an ELM program. **Average hours reported are for all staff and not per person.
Table 77. Average Number of Clerical Staff Hours by Size of School and Program Type* Number of Students in
School Less than 100 100-199 More than 200 Average hours
ADN BSN ELM ADN BSN ELM ADN BSN ELM ADN BSN ELM
1 Clerical Staff 29.1 25.0 29.2 35.4 40.0 0.0 0.0 40.0 0.0 31.0 32.2 29.2
2 Clerical Staff 53.8 46.5 24.0 68.3 52.0 0.0 64.0 67.5 55.0 63.1 60.9 39.5
3 Clerical Staff 67.3 35.0 71.0 64.4 105.0 0.0 66.5 84.3 0.0 65.8 70.0 71.0
4 Clerical Staff 0.0 0.0 0.0 93.3 125.5 94.5 131.5 148.8 160.0 106.0 118.9 116.3
>4 Clerical Staff 180.0 0.0 200.0 100.0 0.0 0.0 156.5 183.6 175.8 148.3 176.2 179.3
Number of Programs 34 5 6 40 7 2 15 23 8 89 35 16
Average hours per week** 46.4 35.6 63.8 60.8 74.2 94.5 86.3 142.0 158.8 59.6 113.2 115.1
*Student data was collected by program while staff numbers were collected by school. Student and staff counts are reported here by program except for schools that include multiple programs. In those cases the number of students was combined and the same data were reported for both programs. Nine schools include multiple programs, both a BSN and an ELM program. **Average hours reported are for all staff and not per person.
University of California, San Francisco 53
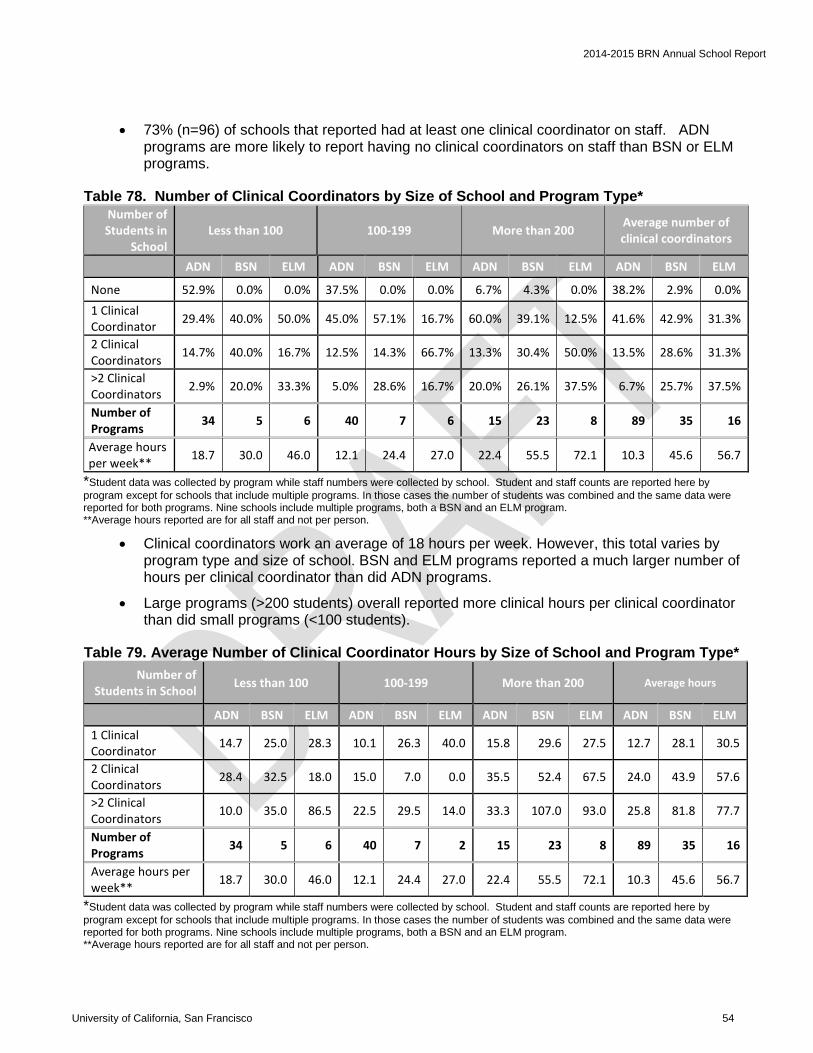
2014-2015 BRN Annual School Report
• 73% (n=96) of schools that reported had at least one clinical coordinator on staff. ADN programs are more likely to report having no clinical coordinators on staff than BSN or ELM programs.
Table 78. Number of Clinical Coordinators by Size of School and Program Type* Number of Students in
School Less than 100 100-199 More than 200 Average number of
clinical coordinators
ADN BSN ELM ADN BSN ELM ADN BSN ELM ADN BSN ELM
None 52.9% 0.0% 0.0% 37.5% 0.0% 0.0% 6.7% 4.3% 0.0% 38.2% 2.9% 0.0% 1 Clinical Coordinator 29.4% 40.0% 50.0% 45.0% 57.1% 16.7% 60.0% 39.1% 12.5% 41.6% 42.9% 31.3%
2 Clinical Coordinators 14.7% 40.0% 16.7% 12.5% 14.3% 66.7% 13.3% 30.4% 50.0% 13.5% 28.6% 31.3%
>2 Clinical Coordinators 2.9% 20.0% 33.3% 5.0% 28.6% 16.7% 20.0% 26.1% 37.5% 6.7% 25.7% 37.5%
Number of Programs 34 5 6 40 7 6 15 23 8 89 35 16
Average hours per week** 18.7 30.0 46.0 12.1 24.4 27.0 22.4 55.5 72.1 10.3 45.6 56.7
*Student data was collected by program while staff numbers were collected by school. Student and staff counts are reported here by program except for schools that include multiple programs. In those cases the number of students was combined and the same data were reported for both programs. Nine schools include multiple programs, both a BSN and an ELM program. **Average hours reported are for all staff and not per person.
• Clinical coordinators work an average of 18 hours per week. However, this total varies by program type and size of school. BSN and ELM programs reported a much larger number of hours per clinical coordinator than did ADN programs.
• Large programs (>200 students) overall reported more clinical hours per clinical coordinator than did small programs (<100 students).
Table 79. Average Number of Clinical Coordinator Hours by Size of School and Program Type* Number of
Students in School Less than 100 100-199 More than 200 Average hours
ADN BSN ELM ADN BSN ELM ADN BSN ELM ADN BSN ELM 1 Clinical Coordinator 14.7 25.0 28.3 10.1 26.3 40.0 15.8 29.6 27.5 12.7 28.1 30.5
2 Clinical Coordinators 28.4 32.5 18.0 15.0 7.0 0.0 35.5 52.4 67.5 24.0 43.9 57.6
>2 Clinical Coordinators 10.0 35.0 86.5 22.5 29.5 14.0 33.3 107.0 93.0 25.8 81.8 77.7
Number of Programs 34 5 6 40 7 2 15 23 8 89 35 16
Average hours per week** 18.7 30.0 46.0 12.1 24.4 27.0 22.4 55.5 72.1 10.3 45.6 56.7
*Student data was collected by program while staff numbers were collected by school. Student and staff counts are reported here by program except for schools that include multiple programs. In those cases the number of students was combined and the same data were reported for both programs. Nine schools include multiple programs, both a BSN and an ELM program. **Average hours reported are for all staff and not per person.
University of California, San Francisco 54
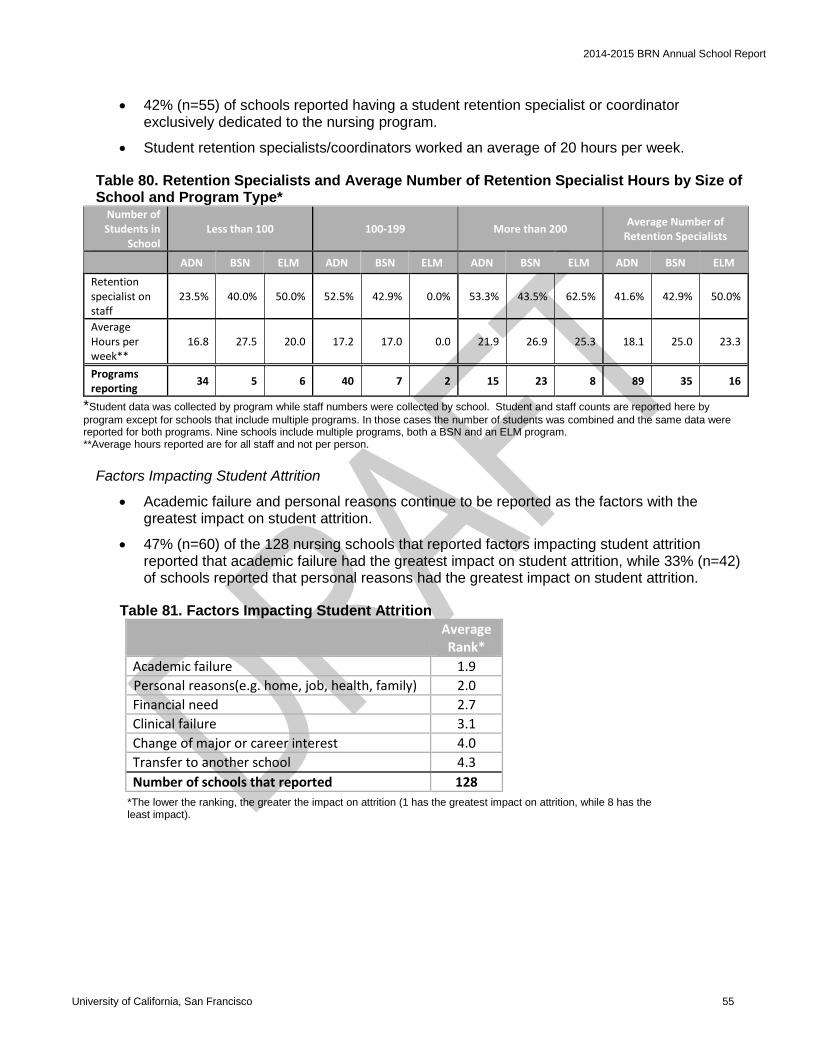
2014-2015 BRN Annual School Report
• 42% (n=55) of schools reported having a student retention specialist or coordinator exclusively dedicated to the nursing program.
• Student retention specialists/coordinators worked an average of 20 hours per week.
Table 80. Retention Specialists and Average Number of Retention Specialist Hours by Size of School and Program Type*
Number of Students in
School Less than 100 100-199 More than 200 Average Number of
Retention Specialists
ADN BSN ELM ADN BSN ELM ADN BSN ELM ADN BSN ELM
Retention specialist on staff
23.5% 40.0% 50.0% 52.5% 42.9% 0.0% 53.3% 43.5% 62.5% 41.6% 42.9% 50.0%
Average Hours per week**
16.8 27.5 20.0 17.2 17.0 0.0 21.9 26.9 25.3 18.1 25.0 23.3
Programs reporting 34 5 6 40 7 2 15 23 8 89 35 16
*Student data was collected by program while staff numbers were collected by school. Student and staff counts are reported here by program except for schools that include multiple programs. In those cases the number of students was combined and the same data were reported for both programs. Nine schools include multiple programs, both a BSN and an ELM program. **Average hours reported are for all staff and not per person.
Factors Impacting Student Attrition
• Academic failure and personal reasons continue to be reported as the factors with the greatest impact on student attrition.
• 47% (n=60) of the 128 nursing schools that reported factors impacting student attrition reported that academic failure had the greatest impact on student attrition, while 33% (n=42) of schools reported that personal reasons had the greatest impact on student attrition.
Table 81. Factors Impacting Student Attrition Average
Rank* Academic failure 1.9 Personal reasons(e.g. home, job, health, family) 2.0 Financial need 2.7 Clinical failure 3.1 Change of major or career interest 4.0 Transfer to another school 4.3 Number of schools that reported 128
*The lower the ranking, the greater the impact on attrition (1 has the greatest impact on attrition, while 8 has the least impact).
University of California, San Francisco 55
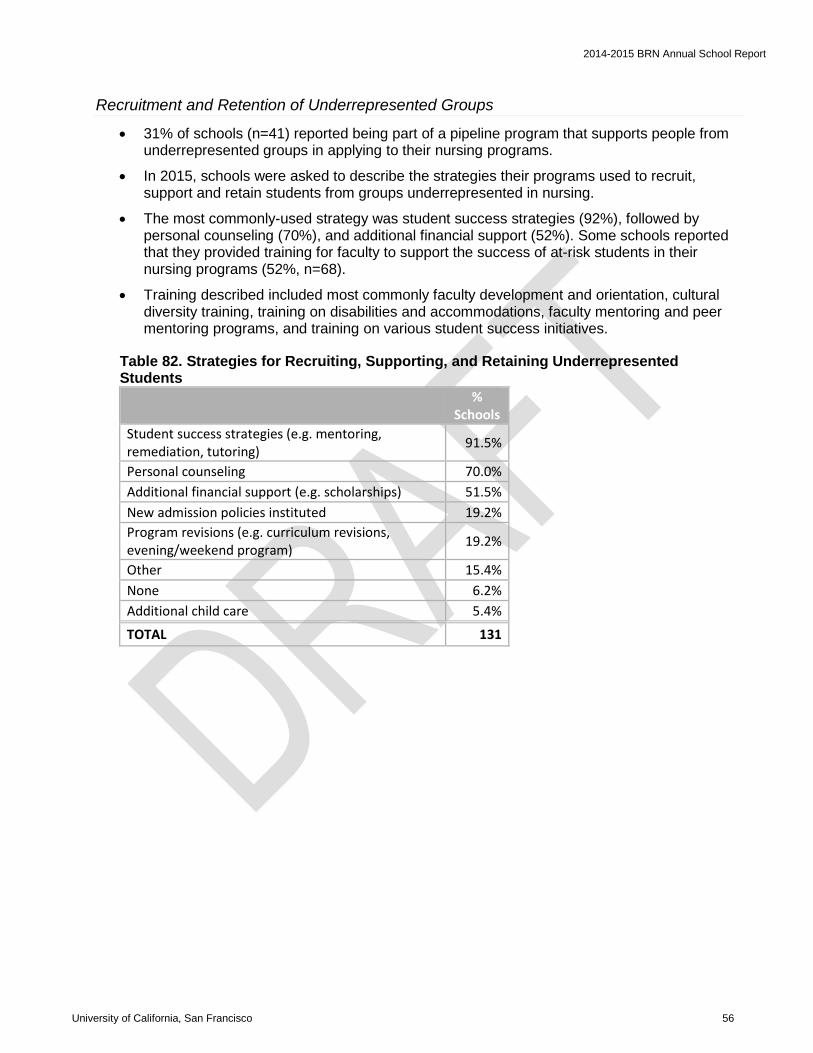
2014-2015 BRN Annual School Report
Recruitment and Retention of Underrepresented Groups
• 31% of schools (n=41) reported being part of a pipeline program that supports people from underrepresented groups in applying to their nursing programs.
• In 2015, schools were asked to describe the strategies their programs used to recruit, support and retain students from groups underrepresented in nursing.
• The most commonly-used strategy was student success strategies (92%), followed by personal counseling (70%), and additional financial support (52%). Some schools reported that they provided training for faculty to support the success of at-risk students in their nursing programs (52%, n=68).
• Training described included most commonly faculty development and orientation, cultural diversity training, training on disabilities and accommodations, faculty mentoring and peer mentoring programs, and training on various student success initiatives.
Table 82. Strategies for Recruiting, Supporting, and Retaining Underrepresented Students
%
Schools Student success strategies (e.g. mentoring, remediation, tutoring) 91.5%
Personal counseling 70.0% Additional financial support (e.g. scholarships) 51.5% New admission policies instituted 19.2% Program revisions (e.g. curriculum revisions, evening/weekend program) 19.2%
Other 15.4% None 6.2% Additional child care 5.4%
TOTAL 131
University of California, San Francisco 56
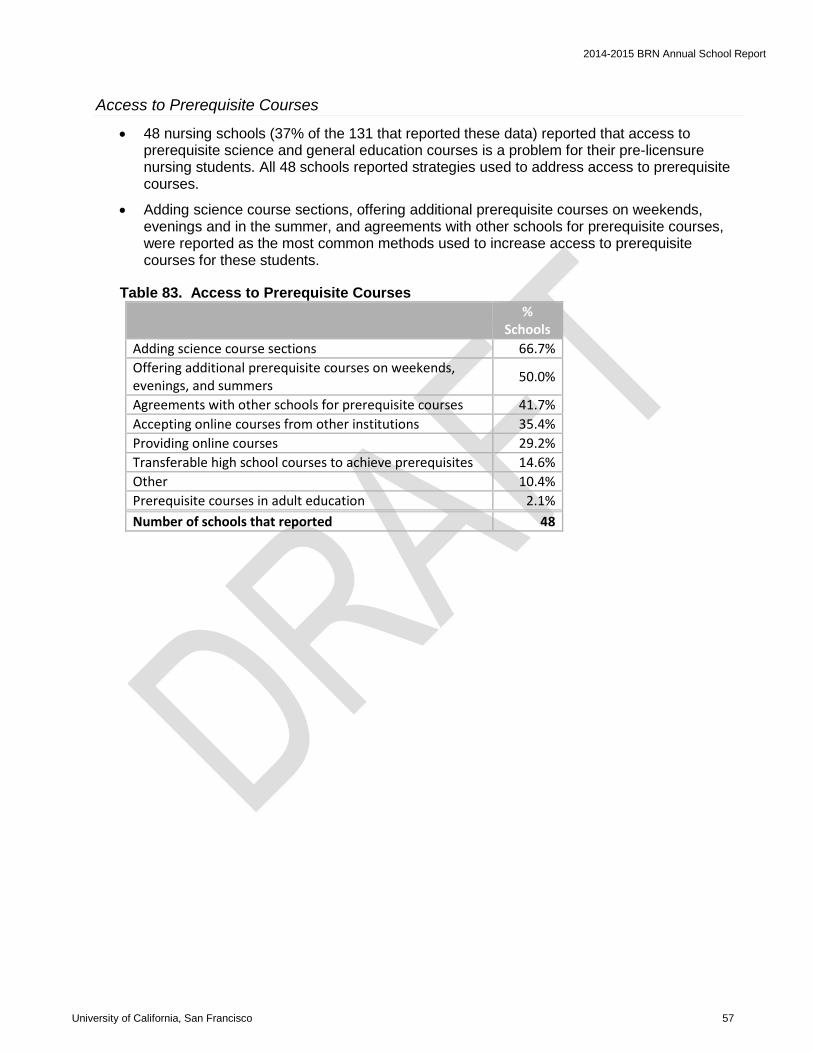
2014-2015 BRN Annual School Report
Access to Prerequisite Courses
• 48 nursing schools (37% of the 131 that reported these data) reported that access to prerequisite science and general education courses is a problem for their pre-licensure nursing students. All 48 schools reported strategies used to address access to prerequisite courses.
• Adding science course sections, offering additional prerequisite courses on weekends, evenings and in the summer, and agreements with other schools for prerequisite courses, were reported as the most common methods used to increase access to prerequisite courses for these students.
Table 83. Access to Prerequisite Courses
% Schools
Adding science course sections 66.7% Offering additional prerequisite courses on weekends, evenings, and summers 50.0%
Agreements with other schools for prerequisite courses 41.7% Accepting online courses from other institutions 35.4% Providing online courses 29.2% Transferable high school courses to achieve prerequisites 14.6% Other 10.4% Prerequisite courses in adult education 2.1% Number of schools that reported 48
University of California, San Francisco 57
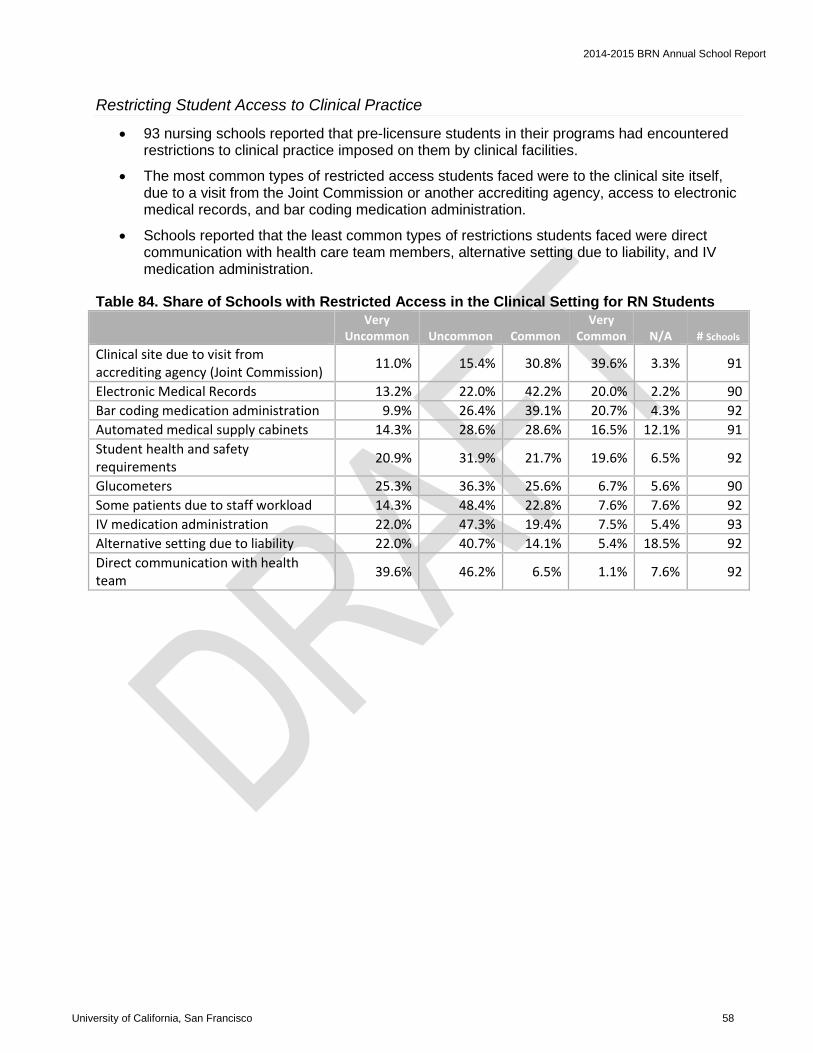
2014-2015 BRN Annual School Report
Restricting Student Access to Clinical Practice
• 93 nursing schools reported that pre-licensure students in their programs had encountered restrictions to clinical practice imposed on them by clinical facilities.
• The most common types of restricted access students faced were to the clinical site itself, due to a visit from the Joint Commission or another accrediting agency, access to electronic medical records, and bar coding medication administration.
• Schools reported that the least common types of restrictions students faced were direct communication with health care team members, alternative setting due to liability, and IV medication administration.
Table 84. Share of Schools with Restricted Access in the Clinical Setting for RN Students
Very
Uncommon Uncommon Common Very
Common N/A # Schools Clinical site due to visit from accrediting agency (Joint Commission) 11.0% 15.4% 30.8% 39.6% 3.3% 91
Electronic Medical Records 13.2% 22.0% 42.2% 20.0% 2.2% 90 Bar coding medication administration 9.9% 26.4% 39.1% 20.7% 4.3% 92 Automated medical supply cabinets 14.3% 28.6% 28.6% 16.5% 12.1% 91 Student health and safety requirements 20.9% 31.9% 21.7% 19.6% 6.5% 92
Glucometers 25.3% 36.3% 25.6% 6.7% 5.6% 90 Some patients due to staff workload 14.3% 48.4% 22.8% 7.6% 7.6% 92 IV medication administration 22.0% 47.3% 19.4% 7.5% 5.4% 93 Alternative setting due to liability 22.0% 40.7% 14.1% 5.4% 18.5% 92 Direct communication with health team 39.6% 46.2% 6.5% 1.1% 7.6% 92
University of California, San Francisco 58
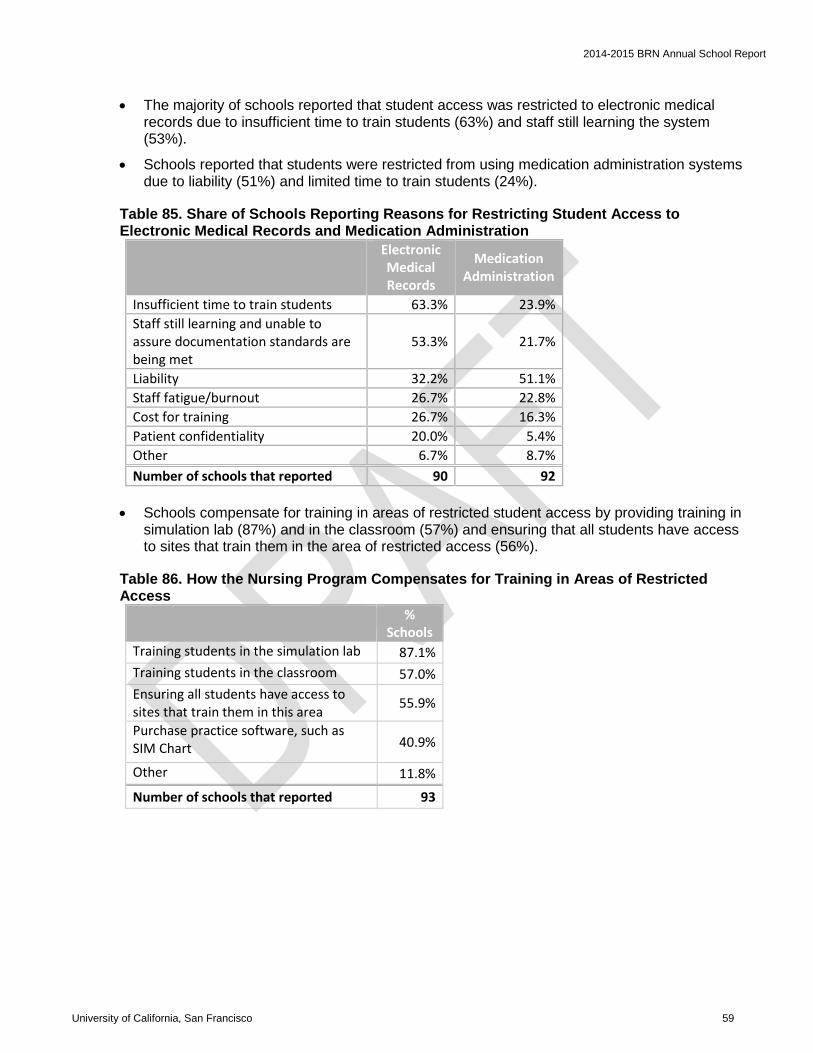
2014-2015 BRN Annual School Report
• The majority of schools reported that student access was restricted to electronic medical records due to insufficient time to train students (63%) and staff still learning the system (53%).
• Schools reported that students were restricted from using medication administration systems due to liability (51%) and limited time to train students (24%).
Table 85. Share of Schools Reporting Reasons for Restricting Student Access to Electronic Medical Records and Medication Administration
Electronic Medical Records
Medication Administration
Insufficient time to train students 63.3% 23.9% Staff still learning and unable to assure documentation standards are being met
53.3% 21.7%
Liability 32.2% 51.1% Staff fatigue/burnout 26.7% 22.8% Cost for training 26.7% 16.3% Patient confidentiality 20.0% 5.4% Other 6.7% 8.7% Number of schools that reported 90 92
• Schools compensate for training in areas of restricted student access by providing training in
simulation lab (87%) and in the classroom (57%) and ensuring that all students have access to sites that train them in the area of restricted access (56%).
Table 86. How the Nursing Program Compensates for Training in Areas of Restricted Access
% Schools
Training students in the simulation lab 87.1% Training students in the classroom 57.0% Ensuring all students have access to sites that train them in this area 55.9%
Purchase practice software, such as SIM Chart 40.9%
Other 11.8%
Number of schools that reported 93
University of California, San Francisco 59
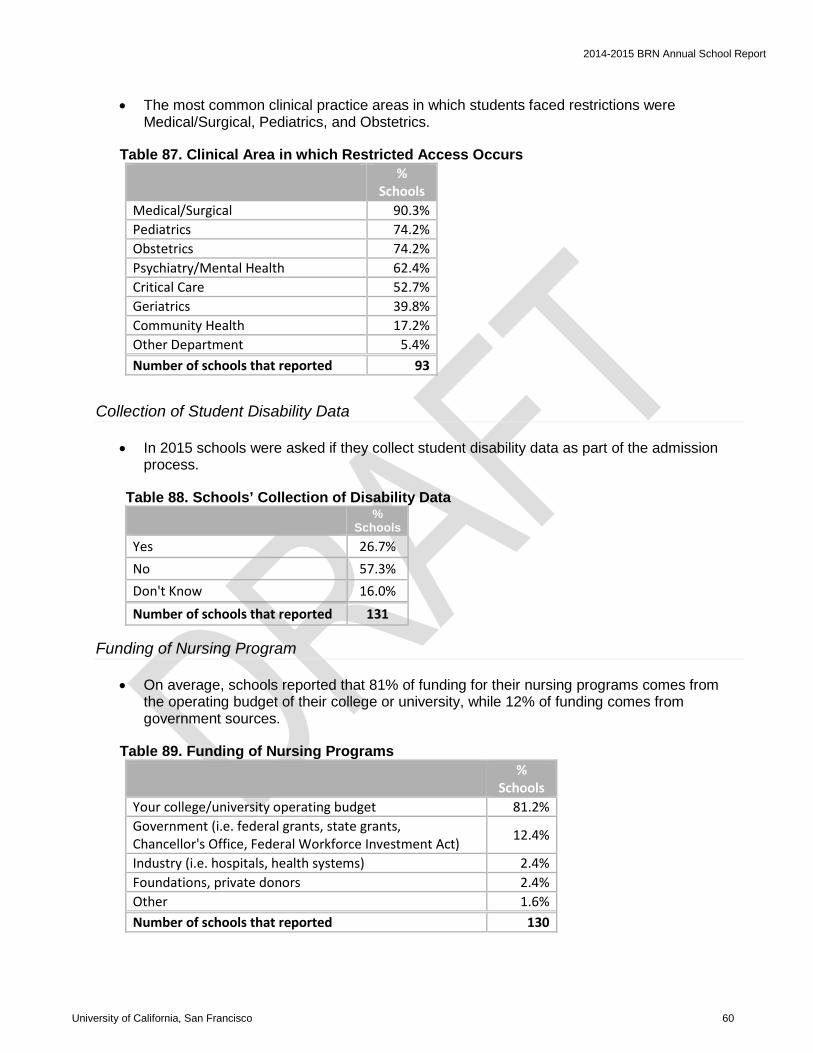
2014-2015 BRN Annual School Report
• The most common clinical practice areas in which students faced restrictions were Medical/Surgical, Pediatrics, and Obstetrics.
Table 87. Clinical Area in which Restricted Access Occurs %
Schools Medical/Surgical 90.3% Pediatrics 74.2% Obstetrics 74.2% Psychiatry/Mental Health 62.4% Critical Care 52.7% Geriatrics 39.8% Community Health 17.2% Other Department 5.4% Number of schools that reported 93
Collection of Student Disability Data
• In 2015 schools were asked if they collect student disability data as part of the admission process.
Table 88. Schools’ Collection of Disability Data
%
Schools Yes 26.7% No 57.3% Don't Know 16.0% Number of schools that reported 131
Funding of Nursing Program
• On average, schools reported that 81% of funding for their nursing programs comes from the operating budget of their college or university, while 12% of funding comes from government sources.
Table 89. Funding of Nursing Programs %
Schools Your college/university operating budget 81.2% Government (i.e. federal grants, state grants, Chancellor's Office, Federal Workforce Investment Act) 12.4%
Industry (i.e. hospitals, health systems) 2.4% Foundations, private donors 2.4% Other 1.6% Number of schools that reported 130
University of California, San Francisco 60

2014-2015 BRN Annual School Report
APPENDICES
APPENDIX A – List of Survey Respondents by Degree Program ADN Programs (83) American Career College* American River College Antelope Valley College Bakersfield College Butte Community College Cabrillo College Cerritos College Chabot College Chaffey College Citrus College City College of San Francisco CNI College College of Marin College of San Mateo College of the Canyons College of the Desert College of the Redwoods College of the Sequoias Contra Costa College Copper Mountain College Cuesta College Cypress College De Anza Community College East Los Angeles College El Camino College El Camino College - Compton Educ Center Evergreen Valley College Fresno City College Glendale Community College Golden West College Grossmont College Hartnell College Imperial Valley College ITT Technical Institute Kaplan College Long Beach City College Los Angeles City College Los Angeles County College of Nursing & Allied Health Los Angeles Harbor College Los Angeles Pierce College Los Angeles Southwest College Los Angeles Trade-Tech College
Los Angeles Valley College Los Medanos College Mendocino College Merced College Merritt College Mira Costa College Modesto Junior College Monterey Peninsula College Moorpark College Mount Saint Mary's University Los Angeles AD Mount San Antonio College Mount San Jacinto College Napa Valley College Ohlone College Pacific Union College Palomar College Pasadena City College Porterville College Rio Hondo College Riverside City College Sacramento City College Saddleback College San Bernardino Valley College San Diego City College San Joaquin Delta College San Joaquin Valley College Santa Ana College Santa Barbara City College Santa Monica College Santa Rosa Junior College Shasta College Shepherd University Sierra College Solano Community College Southwestern Community College Stanbridge College Ventura College Victor Valley College Weimar Institute* West Hills College Yuba College .
University of California, San Francisco 61

2014-2015 BRN Annual School Report
LVN to ADN Programs Only (7) Allan Hancock College Carrington College College of the Siskiyous Gavilan College Mission College
Reedley College at Madera Community College Center Unitek College
BSN Programs (35) American University of Health Sciences Azusa Pacific University Biola University Concordia University Irvine CSU Bakersfield CSU Channel Islands CSU Chico CSU Dominguez Hills CSU East Bay CSU Fresno CSU Fullerton CSU Long Beach CSU Northridge CSU Sacramento CSU San Bernardino CSU San Marcos CSU Stanislaus Dominican University of California Holy Names University
Loma Linda University Mount Saint Mary's University Los Angeles BSN National University Point Loma Nazarene University Samuel Merritt University San Diego State University San Francisco State University Simpson University Sonoma State University University of California Irvine University of California Los Angeles University of Phoenix University of San Francisco Valley Foundation School of Nursing at SJSU West Coast University Western Governors University
ELM Programs (16) Azusa Pacific University California Baptist University Charles R. Drew University CSU Dominguez Hills CSU Fresno CSU Fullerton CSU Long Beach CSU Los Angeles Samuel Merritt University
San Francisco State University United States University University of California Los Angeles University of California San Francisco University of San Diego, Hahn School of Nursing University of San Francisco Western University of Health Sciences
* - New GADN programs in 2014-2015.
University of California, San Francisco 62
2014-2015 BRN Annual School Report
APPENDIX B – Definition List
The following definitions apply throughout the survey whenever the word or phrase being defined appears unless otherwise noted.
Accelerated Program: An Accelerated Program's curriculum extends over a shorter time-period than a traditional program. The curriculum itself may be the same as a generic curriculum or it may be designed to meet the unique learning needs of the student population. Active Faculty: Faculty who teach students and have a teaching assignment during the time period specified. Include deans/directors, professors, associate professors, assistant professors, adjunct professors, instructors, assistant instructors, clinical teaching assistants, and any other faculty who have a current teaching assignment. Adjunct Faculty: A faculty member that is employed to teach a course in a part-time and/or temporary capacity. Advanced Placement Students: Pre-licensure students who entered the program after the first semester/quarter. These students include LVNs, paramedics, military corpsmen, and other health care providers, but does not include students who transferred or were readmitted. Assembly Bill 1559 Criteria: Requires California Community College (CCC) registered nursing programs who determine that the number of applicants to that program exceeds the capacity and elects, on or after January 1, 2008 to use a multicriteria screening process to evaluate applicants shall include specified criteria including, but not limited to, all of the following: (1) academic performance, (2) any relevant work or volunteer experience, (3) foreign language skills, and (4) life experiences and special circumstances of the applicant. Additional criteria, such as a personal interview, a personal statement, letter of recommendation, or the number of repetitions of prerequisite classes or other criteria, as approved by the chancellor, may be used but are not required. Assistant Director: A registered nurse administrator or faculty member who meets the qualifications of section 1425(b) of the California Code of Regulations (Title 16) and is designated by the director to assist in the administration of the program and perform the functions of the director when needed. Attrition Rate: The total number of generic students dropped or disqualified who were scheduled to complete the program between August 1, 2014 and July 31, 2015, divided by the total number of generic students enrolled who were scheduled to complete during the same time period. Census Data: Number of students enrolled or faculty present on October 15, 2015. Clinical Placement: A cohort of students placed in a clinical facility or community setting as part of the clinical education component of their nursing education. If you have multiple cohorts of students at one clinical facility or community setting, you should count each cohort as a clinical placement.
University of California, San Francisco 63
2014-2015 BRN Annual School Report
Clinical Practice with Real Patients: Any clinical experience or training that occurs in a clinical setting and serves real patients, including managing the care, treatments, counseling, self-care, patient education, charting and administration of medication. Include non-direct patient care activities such as working with other health care team members to organize care or determine a course of action as long as it occurs in the clinical setting to guide the care of real patients. Clinical Practice without Real Patients (excluding simulation): Excluding simulation, any clinical experience or training that occurs that does not include real patients and is not directly related to the support of real patients. Include practicing on other students, skills lab, etc. Do not include activities such as communicating with health care team members to organize care for real patients. Clinical Simulation: Clinical simulation provides a simulated real-time nursing care experience which allows students to integrate, apply, and refine specific skills and abilities that are based on theoretical concepts and scientific knowledge. It may include videotaping, de-briefing and dialogue as part of the learning process. Collaborative/Shared Education: A written agreement between two or more nursing programs specifying the nursing courses at their respective institutions that are equivalent and acceptable for transfer credit to partner nursing programs. These partnerships may be between nursing programs offering the same degree or between an entry degree nursing program(s) and a higher degree nursing program(s). These later arrangements allow students to progress from one level of nursing education to a higher level without the repetition of nursing courses. Completed on Schedule Students: Students scheduled on admission to complete the program between August 1, 2014 and July 31, 2015. Contract Education: A written agreement between a nursing program and a health care organization in which the nursing program agrees to provide a nursing degree program for the organization's employees for a fee. Distance Education: Any method of presenting a course where the student and teacher are not present in the same room (e.g., internet web based, teleconferencing, etc.). Entry-level Master’s (ELM): A master’s degree program in nursing for students who have earned a bachelor’s degree in a discipline other than nursing and do not have prior schooling in nursing. This program consists of pre-licensure nursing courses and master's level nursing courses. Evening Program: A program that offers all program activities in the evening (i.e. lectures, etc.).This does not include a traditional program that offers evening clinical rotations. Full-Time Faculty: Faculty that work 1.0 FTE, as defined by the school. Generic Pre-licensure Students: Students who enter the program in the first nursing course. Hi-Fidelity Mannequin: A portable, realistic human patient simulator designed to teach and test students’ clinical and decision-making skills. Home Campus: The campus where your school’s administration is based. Include data here about any satellite campuses if they are located in the same county as your home campus.
University of California, San Francisco 64

2014-2015 BRN Annual School Report
Hybrid Program: Combination of distance education and face-to-face courses. LVN to BSN Program: A program that exclusively admits LVN to BSN students. If the school also has a generic BSN program, the LVN to BSN program is offered separately or differs significantly from the generic program. LVN 30 Unit Option Students: LVNs enrolled in the curriculum for the 30-unit option. Part-Time Faculty: Faculty that work less than 1.0 FTE and do not carry a full-time load, as defined by school policy. This includes annualized and non-annualized faculty. Readmitted Students: Returning students who were previously enrolled in your program. Retention Rate: The total number of generic students who completed the program between August 1, 2014 and July 31, 2015 divided by the total number of generic students enrolled who were scheduled to complete during the same time period. Satellite/Alternate campus: A campus other than your home campus that is approved by the BRN as an alternate/secondary location, operates under the administration of your home campus, is in a county other than where your home campus is located, is in California, and enrolls pre-licensure registered nursing students. Screened applications: The number of applications selected from the total applicant pool to undergo additional screening to determine if they were qualified for admission to the nursing program between 8/1/14 and 7/31/15. Shared Faculty: A faculty member is shared by more than one school, e.g. one faculty member teaches a course in pediatrics to three different schools in one region. Students who Dropped Out or were Disqualified: Students who have left the program prior to their scheduled completion date occurring between August 1, 2014 and July 31, 2015. Time Period for the Survey: August 1, 2014 - July 31, 2015. For those schools that admit multiple times a year, combine all student cohorts. Traditional Program: A program on the semester or quarter system that offers most courses and other required program activities on weekdays during business hours. Clinical rotations for this program may be offered on evenings and weekends. Transfer Students: Students in your programs that have transferred nursing credits from another pre-licensure program. This excludes RN to BSN students. Validated Prerequisites: The nursing program uses one of the options provided by the California Community College Chancellor's Office for validating prerequisite courses. Waiting List: A waiting list identifies students who qualified for the program, were not admitted in the enrollment cycle for which they applied, and will be considered for a subsequent enrollment cycle without needing to reapply.
University of California, San Francisco 65

2014-2015 BRN Annual School Report
APPENDIX C – BRN Education Issues Workgroup Members Members Organization Loucine Huckabay, Chair California State University, Long Beach Judee Berg California Institute for Nursing and Health Care Audrey Berman Samuel Merritt University Stephanie L. Decker Kaiser Permanente National Patient Care Services Brenda Fong Community College Chancellor’s Office Deloras Jones Independent Consultant, Former Executive Director of
California Institute for Nursing and Health Care Judy Martin-Holland University of California, San Francisco Robyn Nelson West Coast University Tammy Rice Saddleback College Stephanie R. Robinson Fresno City College Paulina Van California State University, East Bay Ex-Officio Member Louise Bailey California Board of Registered Nursing Project Manager Julie Campbell-Warnock California Board of Registered Nursing
University of California, San Francisco 66