bmc genomics - university of california,...
TRANSCRIPT

This Provisional PDF corresponds to the article as it appeared upon acceptance. Fully formattedPDF and full text (HTML) versions will be made available soon.
Development and implementation of high-throughput SNP genotyping in barley
BMC Genomics 2009, 10:582 doi:10.1186/1471-2164-10-582
Timothy J Close ([email protected])Prasanna R Bhat ([email protected])
Stefano Lonardi ([email protected])Yonghui Wu ([email protected])Nils Rostoks ([email protected])
Luke Ramsay ([email protected])Arnis Druka ([email protected])
Nils Stein ([email protected])Jan T Svensson ([email protected])
Steve Wanamaker ([email protected])Serdar Bozdag ([email protected])
Mikeal L Roose ([email protected])Matthew J Moscou ([email protected])
Shiaoman Chao ([email protected])Rajeev Varshney ([email protected])
Peter Szucs ([email protected])Kazuhiro Sato ([email protected])
Patrick M Hayes ([email protected])David E Matthews ([email protected])
Andris Kleinhofs ([email protected])Gary J Muehlbauer ([email protected])
Joseph DeYoung ([email protected])David F Marshall ([email protected])
Kavitha Madishetty ([email protected])Raymond D Fenton ([email protected])
Pascal Condamine ([email protected])Andreas Graner ([email protected])
Robbie Waugh ([email protected])
ISSN 1471-2164
Article type Research article
Submission date 31 July 2009
Acceptance date 4 December 2009
BMC Genomics
© 2009 Close et al. , licensee BioMed Central Ltd.This is an open access article distributed under the terms of the Creative Commons Attribution License (http://creativecommons.org/licenses/by/2.0),
which permits unrestricted use, distribution, and reproduction in any medium, provided the original work is properly cited.

Publication date 4 December 2009
Article URL http://www.biomedcentral.com/1471-2164/10/582
Like all articles in BMC journals, this peer-reviewed article was published immediately uponacceptance. It can be downloaded, printed and distributed freely for any purposes (see copyright
notice below).
Articles in BMC journals are listed in PubMed and archived at PubMed Central.
For information about publishing your research in BMC journals or any BioMed Central journal, go to
http://www.biomedcentral.com/info/authors/
BMC Genomics
© 2009 Close et al. , licensee BioMed Central Ltd.This is an open access article distributed under the terms of the Creative Commons Attribution License (http://creativecommons.org/licenses/by/2.0),
which permits unrestricted use, distribution, and reproduction in any medium, provided the original work is properly cited.

- 1 -
Development and implementation of high-throughput
SNP genotyping in barley
Timothy J. Close1§
, Prasanna R. Bhat
1,12, Stefano Lonardi
2, Yonghui Wu
2,13, Nils
Rostoks3,14
, Luke Ramsay3, Arnis Druka
3, Nils Stein
4, Jan T. Svensson
1,15, Steve
Wanamaker1, Serdar Bozdag
2,16, Mikeal L. Roose
1, Matthew J. Moscou
1,17,
Shiaoman Chao5, Rajeev Varshney
4,18, Péter Szőcs
6, Kazuhiro Sato
7, Patrick M.
Hayes6, David E. Matthews
8, Andris Kleinhofs
9, Gary J. Muehlbauer
10, Joseph
DeYoung11
, David F. Marshall3, Kavitha Madishetty
1, Raymond D. Fenton
1,
Pascal Condamine1,19
, Andreas Graner4, Robbie Waugh
3.
1 Dept. of Botany & Plant Sciences, University of California (UCR), Riverside, CA,
92521, USA 2Dept. of Computer Sciences, University of California (UCR), Riverside, CA, 92521,
USA 3Scottish Crop Research Institute (SCRI), Invergowrie, Dundee, DD2 5DA, Scotland,
UK 4 Leibniz Institute of Plant Genetics and Crop Plant Research (IPK), Corrensstrasse 3,
D-06466, Gatersleben, Germany 5USDA-ARS Biosciences Research Lab, Fargo, ND, 58105-5674, USA 6Department of Crop and Soil Science, Oregon State University, Corvallis, OR,
97331, USA 7Research Institute for Bioresources, Okayama University, Kurashiki, 710-0046,
Japan 8USDA-ARS, Cornell University, Ithaca, NY, 14853, USA 9Department of Crop and Soil Sciences, Washington State University, Pullman, WA,
99164, USA 10Department of Agronomy and Plant Genetics, University of Minnesota, St. Paul,
MN, 55108, USA 11Southern California Genotyping Consortium, University of California, Los Angeles,
CA, 90095, USA
Current addresses: 12Monsanto Research Centre, Bangalore, 560092, India

- 2 -
13Google, Mountain View, CA, 94043, USA 14Faculty of Biology, University of Latvia, 4 Kronvalda Boulevard, Riga, LV-1586,
Latvia 15University of Copenhagen, Frederiksberg C, DK-1871, Denmark 16NIH National Cancer Institute, Neuro-Oncology Branch, Bethesda, MD, 20892,
USA 17Department of Plant Pathology, Iowa State University, Ames, Iowa, 50011, USA 18International Crops Research Institute for Semi Arid Tropics, Patancheru - 502 324,
Andhra Pradesh, India 19NetSocial Marketing, Le Puech, 15600 Montmurat, France §Corresponding author
Email addresses:
TJC: [email protected]
PRB: [email protected]
JTS: [email protected]
MLR: [email protected]
MJM: [email protected]
PMH: [email protected]
DEM: [email protected]
GJM: [email protected]

- 4 -
Abstract
Background
High density genetic maps of plants have, nearly without exception, made use
of marker datasets containing missing or questionable genotype calls derived from a
variety of genic and non-genic or anonymous markers, and been presented as a single
linear order of genetic loci for each linkage group. The consequences of missing or
erroneous data include falsely separated markers, expansion of cM distances and
incorrect marker order. These imperfections are amplified in consensus maps and
problematic when fine resolution is critical including comparative genome analyses
and map-based cloning. Here we provide a new paradigm, a high-density consensus
genetic map of barley based only on complete and error-free datasets and genic
markers, represented accurately by graphs and approximately by a best-fit linear
order, and supported by a readily available SNP genotyping resource.
Results
Approximately 22,000 SNPs were identified from barley ESTs and sequenced
amplicons; 4,596 of them were tested for performance in three pilot phase Illumina
GoldenGate assays. Data from three barley doubled haploid mapping populations
supported the production of an initial consensus map. Over 200 germplasm selections,
principally European and US breeding material, were used to estimate minor allele
frequency (MAF) for each SNP. We selected 3,072 of these tested SNPs based on
technical performance, map location, MAF and biological interest to fill two 1536-
SNP “production” assays (BOPA1 and BOPA2), which were made available to the
barley genetics community. Data were added using BOPA1 from a fourth mapping

- 5 -
population to yield a consensus map containing 2,943 SNP loci in 975 marker bins
covering a genetic distance of 1099 cM.
Conclusions
The unprecedented density of genic markers and marker bins enabled a high
resolution comparison of the genomes of barley and rice. Low recombination in
pericentric regions is evident from bins containing many more than the average
number of markers, meaning that a large number of genes are recombinationally
locked into the genetic centromeric regions of several barley chromosomes.
Examination of US breeding germplasm illustrated the usefulness of BOPA1 and
BOPA2 in that they provide excellent marker density and sensitivity for detection of
minor alleles in this genetically narrow material.
Background
Complete genome sequences of many plants, including economically
important small grain cereals such as barley, are unlikely to be available in the near
future if they have large genomes and contain much repetitive DNA. The barley
genome is 5200 Mbp, which is more than twelve times rice, and composed of at least
80% highly repetitive DNA, which is likely to preclude a whole-genome assembly
from shotgun sequences obtained with currently available technologies. However,
access to most of the genes of barley and numerous other organisms can be gained
through cDNAs (generally expressed sequence tags; ESTs) and sequenced PCR
amplicons, which provide a facile route to single nucleotide polymorphisms (SNPs) in
protein-encoding transcribed genes. As of the January 2, 2009 release of dbEST, there
were 525,527 Sanger-sequenced ESTs from barley. These were derived principally
from eight malting barley cultivars and one wild barley accession, with a minor

- 6 -
fraction from several other barley genotypes. Here we describe the use of the majority
of this transcriptome sequence resource to develop high-throughput SNP genotyping
in barley, application of the new SNP methods to the production of a high-density and
high quality SNP map that can be related readily to prior maps through shared
markers and other grass genomes through synteny, and deployment of these new
resources in support of marker-assisted breeding and association genetic analyses.
In recent years there has been a surge in marker density and convergence
toward consensus maps for barley. Rostoks et al. [1] developed a consensus map
containing 1230 markers (RFLP, AFLP, SSR, SNP) from three doubled haploid
populations. Wenzl et al. [2] combined DArT with RFLP, SSR and STS from nine
mapping populations to create a consensus map containing 2935 markers. Marcel et
al. [3] compiled RFLP, AFLP and SSR data from six mapping populations to produce
a consensus map containing 3458 markers. Stein et al. [4] used three doubled haploid
mapping populations and combined new data from 1,055 markers (RFLP, SSR, SNP)
with prior data from 200 anchor markers to produce a 1255 marker consensus map.
Varshney et al. [5] produced a 775 SSR consensus map by joining six independent
maps. Potokina et al. [6] combined SNP and other transcript derived markers to
position 1596 loci on the Steptoe x Morex [7] linkage map. Hearnden et al. [8]
combined 1000 SSR and DArT markers on a map from a wide cross. Several
additional maps which have used portions of the SNP data described in the present
work have been published or are nearing publication including a 2890 SNP and STS
map from the Haruno Nijo x OUH602 population [9] and a 2383 marker map (DArT,
SNP, SSR, AFLP, RFLP, STS, QTL) from the Oregon Wolfe Barley population [10],
among others. Marker intersection between these maps is significant, but missing
data, non-uniform data quality and anonymity of many markers constrain the accuracy

- 7 -
of the map merging process and the resolution of synteny between barley and other
genomes. Here we describe a new element of the map convergence equation, a high
fidelity and dense consensus map produced entirely from transcribed gene SNPs using
only a very robust portion of genotyping data derived from four mapping populations
utilizing the Illumina GoldenGate assay (Illumina Inc., San Diego, CA). Maps that
include SNPs in protein-coding genes facilitate genome content comparisons by virtue
of the high conservation of protein sequences across genera, thus enabling sequence
similarity searches to find orthologs. The SNPs and data described herein have been
made available incrementally in parallel with their production since mid-2005 to the
barley community to facilitate research. Here we provide full details of the
development of the SNP genotyping platform and some of the insight it has brought.
Results and Discussion
Identification of SNPs and development of GoldenGate Assays
Details of the identification of approximately 22,000 SNPs from EST and PCR
amplicon sequence alignments, and development of three test phase and two
production scale Illumina GoldenGate oligonucleotide pool assays (OPAs), are briefly
summarized in Methods and provided more fully in Supplemental Text (Additional
File 1). In total, 4596 SNPs were tested using 576 DNA samples on pilot OPAs
POPA1 and POPA2, and 480 DNA samples on POPA3, followed by selection of
3072 technically satisfactory and genetically most informative SNPs for
representation on two production OPAs (BOPA1, BOPA2) (Figure 1). Of these 4596
SNPs, 3456 originated from ESTs and 1140 from PCR amplicons derived from
genomic sequences. Of the 3072 SNPs selected for two production OPAs, 2279 were
from ESTs and 793 from PCR amplicons. There was considerable intersection in the
sets of SNPs provided by each identification path. For all OPAs preference was given

- 8 -
to SNPs identified by amplicon sequencing. The final tally of surviving SNPs from
each selection path included 65.9% (2279/3456) of the EST-derived and 69.6%
(793/1140) of the PCR amplicon-derived SNPs. By this metric, the overall success
rates were essentially equal for the two strategies for SNP discovery, ESTs versus
genomic amplicon sequences.
The yield of SNPs from each of 253 pairwise genotype alignments of ESTs
(see Supplemental Text for SNP selection details, Additional File 1) revealed a strong
linear relationship (r2 = 0.84) between the number of SNPs and the product of the
number of ESTs.. For example, the initial set of 36 pairwise genotype comparisons
between eight malting barley cultivars and one wild barley accession (used for
POPA1 and POPA2) is provided in Figure S1, Additional File 2), where this linear
relationship and the higher frequency of SNPs when including the wild barley
accession are readily apparent. In retrospect, it was fortuitous for SNP discovery that
researchers in each country chose their own local favourite malting barley for EST
sequencing.
Genetic linkage maps
For each of the four mapping populations the linkage groups separated cleanly
using MSTMap (see Methods) at LOD 4 or 5 and generally remained intact at higher
LOD values. The four maps from individual crosses were fused using MergeMap (see
Methods) to form a consensus map containing 2943 SNP loci with a total map length
of 1099 cM (Table 1). The identity and polarity of linkage groups were determined by
integrating 110 previously mapped bin markers [11] into the SxM and consensus
maps (Table S1, Additional File 3). Because the SNP data are more complete and
seem generally to be of higher quality than the SxM bin marker data, the 2943 “SNP-
only” map and its distance coordinates are taken as the central point of reference in

- 9 -
this paper (Figure S2, Additional File 4). Table S1 (Additional File 3) provides map
coordinates for each of the four individual maps, the SxM map with 110 bin markers,
the 2943 SNP-only consensus map and the 3053 marker consensus map containing
2943 SNPs and 110 SxM bin markers. The number and distribution of loci for each
individual SNP-only map and the consensus SNP-only map are given in Table 1. In
all maps, chromosome 5H has the greatest length, a mean of 198 cM, consistent with
previously published linkage maps. Chromosome 5H is also the most populated with
535 SNP loci and is subdivided into the largest number of marker bins (180). On the
lower end of the spectrum chromosome 4H has only 338 SNP loci distributed among
113 marker bins covering 125 cM. The relationship of nearly one marker bin per cM
holds for all seven linkage groups.
Once the SNP loci were arranged by position on the consensus map, graphical
visualization enabled inspection of the distribution of recombination events. The
genotype data and graphical genotype displays for three of the four mapping
populations (MxB, OWB, SxM) are provided in Table S2 (Additional File 5), where it
can be seen that there are no singleton double recombinant loci in densely marked
regions of any of the maps. Since such loci are often indicative of genotyping errors,
the complete absence of suspicious double recombinants can be considered an
indicator of high fidelity of the data from the 2943 SNP loci selected for linkage map
production. Other quality metrics include the frequency of missing data or apparent
heterozygosity; aside from two instances of apparent heterozygosity at locus 1_1166
in two seemingly identical OWB doubled haploid lines #22 and #70 (Figure 2D,
Table S2, Additional File 5), all individuals in all three mapping populations had
homozygous genotype calls for all loci and no missing data. This is 100% of 153,636
possible genotype calls in the MxB population, 99.999% of 145,266 possible

- 10 -
genotype calls in the OWB population and 100% of 116,840 possible genotype calls
in the SxM population. The high fidelity and lack of missing data among these
selected 2943 SNPs facilitated the production of individual and consensus maps.
More than 300 SNPs with imperfect but still high quality data (for example 3_1104,
Figure 2C) were not utilized for this map.
Figure 3 illustrates the number of shared markers between any two, any three
and all four maps. The substantial number of shared markers facilitated the production
of a consensus map. The number of pairwise shared markers ranged from 303
between the HxO and OWB maps to 786 shared between the MxB and SxM maps.
Three-way shared markers range from 120 when including all maps except MxB to
321 when including all maps except HxO. The lower number of shared markers
involving the HxO map is due to the fact that this population was genotyped using
only BOPA1, whereas the other three populations were genotyped using all three Pilot
OPAs (see Methods). Table S1 (Additional File 3) provides complete information on
the map locations of all markers, where it can also be seen that there was no
disagreement in the order of shared markers in any of the six pairwise comparisons of
linkage maps, or between the consensus map and any individual map. It should be
noted, however, that this does not guarantee that the marker order in the 2943-SNP
consensus map perfectly matches the order of the corresponding nucleotides within
the genome sequence. The consensus map is simply one of many possible non-
conflicting linear representations of the consensus DAGs (Figure 4, Figures S3-S9,
Additional Files 6, 7, 8, 9, 10, 11 and 12). The limit of knowledge of non-shared
marker order is more accurately shown in the consensus DAGs of each linkage group.
As more data accumulate from additional mapping populations, linkage
disequilibrium analyses and genome sequencing, the number of non-conflicting linear

- 11 -
map orders will be reduced, ideally to just one possible order. Naturally, the
consensus map will evolve toward finer resolution and convergence on the correct
order of all markers.
Segregation distortion was observed in all four mapping populations, being
most pronounced in the MxB population in the pericentric regions of 1H, 2H, 5H and
7H and the long arm of 7H. Interestingly, on 7H the distortion was toward the
maternal allele (Morex) in the pericentric region but toward the paternal allele (Barke)
on the long arm.
Alternative marker names
Table S3 (Additional File 13) provides a cross-reference between synonymous
marker names, relating SNPs mapped in the present work to the same genes mapped
previously using other marker systems [3]. To generate this cross reference, all of the
HarvEST:Barley assembly #35 unigenes (U35; Table S4, Additional File 14) were
searched using BLASTN against the GrainGenes "Sequenced Probes" database
(http://wheat.pw.usda.gov/GG2/index.shtml) at a cut-off of 1e-10. Probes that
matched more than three U35 unigenes were ignored. The result was 636 previously
mapped probes matching 1114 unigenes. The list of probes was then reduced to those
mapped in Marcel et al. [3] and the list of unigenes was limited to those which were
sources of the 2943 mapped SNPs. Finally, the map position of the SNP and the
previously mapped probe were compared, discarding a few with gross mismatches in
genome location (presumably paralogous loci mapped by the probe). The resulting
intersection contains 55 SNPs representing 51 U35 unigenes matching 51 sequenced
probes. By comparing the map positions in Table S3 (Additional File 13) one can see
that there is perfect co linearity of shared marker order between the two maps, though
there are differences in map distances throughout each linkage group. There are no

- 12 -
shared markers on 4HL, which illustrates the need for a more comprehensive cross-
reference resource than just these two consensus maps. A similar operation can be
performed to relate other maps to the present 2943 SNP map. It should be noted also
that the original SNP names from SCRI (“ABC” format, Table S4, Additional File 14)
correspond in many cases to SNPs used in Rostoks et al. [1] and the original SNP
names from IPK (“ConsensusGBS” format, Table S4, Additional File 14) correspond
to SNPs in Kota et al. [12]. Thus, those two maps can be readily cross-referenced to
the present map using in-common marker names. Also, as stated above, 110 bin
markers from the SxM map of Kleinhofs and Graner [11] are included in Table S1
(Additional File 3). Overall, cross-referencing the 2943 SNP-only map to previous
maps provides an important bridge between additional resources including a physical
map now being coupled to the 2943 SNP-only map and QTLs, simple trait
determinants and deletion sites that already have been mapped in prior work. Szőcs et
al. [10] included 1472 of the SNPs developed in the present work in addition to SSRs,
AFLPs and DArT markers, making the resulting OWB map an excellent new point of
cross-reference for barley markers.
Synteny
Each barley SNP source sequence was compared to the rice (Oryza sativa)
version 5 and version 6 gene models [13] using BLASTX, and the top hit was taken
as the most similar rice gene. These rice best hit coordinates were used as the basis of
alignments of each of the seven barley chromosomes with the twelve rice
chromosomes. Figure 5 is a screen shot from HarvEST:Barley [14] showing a detailed
alignment of barley chromosome 5H with rice chromosomes. From this and each of
the other six barley-rice alignments the marker density is sufficient to clearly reveal
major elements of barley-rice synteny, consistent in general with prior publications on

- 13 -
Triticeae-rice synteny (for example [15, 16]. The short arm of barley 5H is syntenic
with rice 12L. The long arm of barley 5H is syntenic with an interspersion of rice 12S
and 11S genes followed by rice 9S, then rice 9L, then rice 3L. The position of the
centromere in each barley chromosome was determined using flow-sorted
chromosome arms in work that will be described in detail elsewhere (Prasanna Bhat et
al. in preparation). Of the seven barley chromosomes, 5H has the most complex
barley-rice synteny relationship, being the only barley chromosome composed of
major syntenous blocks from more than two ancestors of rice chromosomes. An
illustration of barley-rice synteny for all seven barley chromosomes is provided in
Figure 6. The simplest relationships are essentially total synteny between barley 3H
versus rice 1 (3HS = 1S, 3HL = 1L) and barley 6H versus rice 2 (6HS = 2S, 6HL =
2L). The four remaining barley chromosomes each are composed of ancestors of two
rice chromosomes, in each case having one ancestral chromosome nested within the
pericentric region, flanked by segments of the other syntenic chromosome. Detailed
views of synteny similar to Figure 5, but with zoom-in and active links to external
databases, are available for all seven chromosomes through the Windows version of
HarvEST:Barley [14].
An interesting consequence of the evolutionary history of barley chromosomes
is that the number of expressed genes in the pericentric regions is highly variable,
ranging from relatively few in the cases of barley 3H and 6H to very many in the most
extreme case of barley 7H. The relative genetic map density of expressed genes has
major implications for plant breeding efforts. If, for example, a trait maps to an
ancestral telomeric region within the pericentric region of barley 7H then it will be
much less likely that the gene controlling that trait can be separated from
neighbouring genes by recombination than, for example, a gene located in the

- 14 -
ancestral centromeric region of rice chromosome 9, which is located in a more
recombinationally active region on barley chromosome 5H. For example there have
been several as yet unsuccessful attempts to map-base clone Mlg, a powdery mildew
resistance gene located in the gene-dense pericentric region of 4H (Matthew Moscou,
unpublished data). Similarly, the level of difficulty in map-based cloning efforts will
also depend on the gene density in regions of low recombination. Due to high gene
density in ancestral telomeric regions which are now nested within barley
chromosomes, the pericentric regions of five barley chromosomes (1H, 2H, 4H, 5H
and 7H) have high gene density.
The version 6 rice genome sequence coordinates, including chromosome, arm
and base pair position, are included in Table S4 (Additional File 14), along with the
chromosome and arm position from version 5. The 2943 genetically mapped barley
SNPs were derived from 2786 source sequences, of which 2703 have a rice BLASTX
match of at least 7 x e-5. A total of 36 of these had a best BLASTX against a gene
positioned to different rice chromosomes when comparing ortholog locations in rice
version 5 to version 6. It is interesting that 14 of the 36 (39%) changes in the rice
genome annotations brought rice-barley synteny into line with the barley genetic map,
9 of the 36 (25%) changes degraded rice-barley synteny and 12 (33%) had a neutral
effect because neither the version 5 nor 6 rice annotations were syntenic with barley.
One had a neutral effect because both BLAST hits were consistent with syntenic
duplications in the barley and rice genomes. It is not unusual to find imperfect
synteny such as the 12 of 36 (33%) revised but non-syntenic positions; in fact 745 of
the 2703 mapped barley SNP source sequences (27.6%) do not point to a best rice
BLASTX within the major synteny block. However, from this comparison of the
edited positions in rice versions 5 versus 6 to the 2943 SNP barley genetic linkage

- 15 -
map, it appears that the barley SNP map is the more stable point of reference.
Consequently, it may be of some benefit to use the barley genetic map for further
revisions of the rice genome sequence.
BOPA1 and BOPA2 elements and performance
As discussed above, the two production OPAs, BOPA1 and BOPA2, had
somewhat different design elements. These differences have been reflected in the
performance of BOPA1 and BOPA2 for the genotyping of breeding germplasm
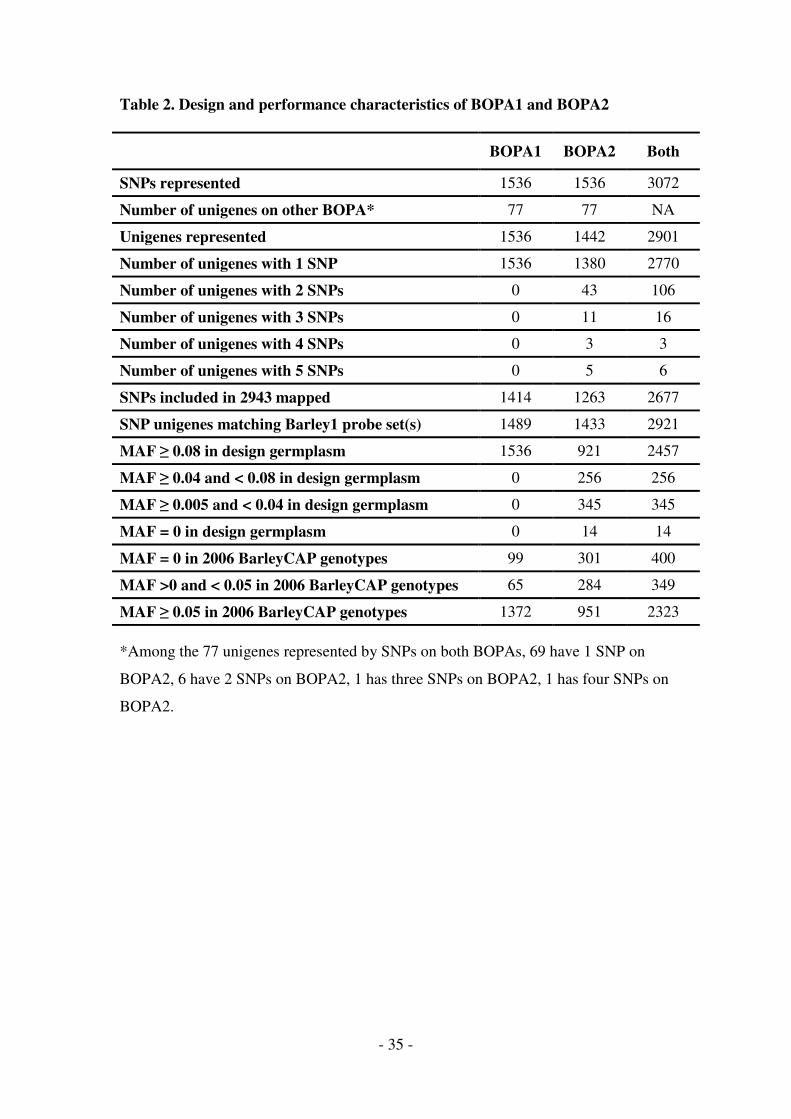
within the BarleyCAP project [17]. Table 2 provides a comparison of BOPA1 and
BOPA2 in relation to both SNP representation and the performance on 960 year 2006
US breeder DNA samples in the BarleyCAP project. Table 2 also summarizes
information provided in greater detail in Table S4 (Additional File 14) on the
relationship of BOPA SNPs to probe sets on the Affymetrix Barley1 GeneChip [18]
and the 2943 mapped SNPs in the present work. Extensive analyses of the diversity of
breeding germplasm will be the subject of other papers; here we emphasize only the
elements and fundamental performance characteristics of BOPA1 and BOPA2. One
can see that BOPA1, which was designed using only SNPs with a minor allele
frequency (MAF) of at least 0.08 in the design germplasm, yielded MAF values less
than 0.05 for only 164 SNPs (10.7%) in the US breeding materials. In contrast
BOPA2, which targeted 615 SNPs with MAF less than 0.08 in the design germplasm,
yielded MAF values less than 0.05 for 585 SNPs (38.1%) in the breeding germplasm.
This included about three times as many SNPs with MAF = 0 (301 versus 99) and 4.4
times as many SNPs (284/65) with MAF between 0 and 0.05. Thus, BOPA2 has
greater sensitivity to detect rare alleles than does BOPA1, some of which may be
important for the development of new varieties containing uncommon alleles of

- 16 -
certain genes. But, this increased sensitivity is counterbalanced by a compromise in
the reduced frequency of informative SNPs in general.
Table S5 (Additional File 15) lists the MAF values determined during the
design of BOPA1 and BOPA2 versus the observed MAF values in year 2006 and year
2007 BarleyCAP breeding germplasm. For example, 11 of 157 SNPs with a design
MAF of 0.01 or lower had an observed MAF of at least 0.08 in year 2006 or 2007
breeding germplasm. Similarly, 25 of 283 SNPs with a design MAF of 0.024 or lower
had an observed MAF of at least 0.10 in year 2006 or 2007 breeding germplasm. The
differences between BOPA1 and BOPA2 should be carefully considered by potential
users, and the characteristics of specific SNPs should be considered when selecting
subsets of SNPs for other platforms.
Other characteristics of the 2943 SNP map
It is perhaps of relevance that there were significant differences in the genetic
length of some of the individual chromosomes in the different populations (Table 1).
For example, the genetic length of chromosome 4H in the SxM population is
expanded relative to the same chromosome in any other population, and all of the
other chromosomes have a longer genetic length in the OWB population than in the
other populations. Also, the genetic map lengths are consistently higher than would be
expected from cytogenetic counts of chiasmata per meiosis for this species, as
previously noted [19] despite the fact that methodological errors in genotyping can be
ruled out in the present work because of the lack of any suspicious-looking singleton
double recombinants. The notable deviations from mean genetic distance values
indicate that the genetic background as well as environmental factors may have had a
significant effect on recombination, and presumably also chiasmata counts, in this
species. Also, although the broad patterns of synteny within grasses recognized

- 17 -
previously by many investigators has been confirmed by this work, the hitherto
unprecedented density of gene-derived markers enable further delineation of several
inversions and rearrangements of gene order at macro-, meso- and micro-synteny
levels. Chromosome 5H (Figure 5) provides one example of such rearrangements at
the macrosynteny level . The HarvEST:Barley (http://harvest.ucr.edu) synteny viewer
provides zoom-in functionality to enable visualization at meso and micro-synteny
levels as well.
Access to the linkage map and SNP data
The 2943 SNP linkage map can be accessed by several browsers including
HarvEST:Barley [14 ]or[20], GrainGenes [21], NCBI [22] and THT [23]. New
versions of the map may become available as additional mapping populations are
applied to BOPA1 and BOPA2, linkage disequilibrium is used for mapping and the
physical map and genome sequence are coupled to the genetic linkage map.
Conclusions
The unprecedented density of genic markers and marker bins enabled a high
resolution comparison of the genomes of barley and rice. Low recombination in
pericentric regions is evident from bins containing many more than the average
number of markers, meaning that a large number of genes are recombinationally
locked into the genetic centromeric regions of several barley chromosomes.
Examination of US breeding germplasm illustrated the usefulness of BOPA1 and
BOPA2 in that they provide excellent marker density and sensitivity for detection of
minor alleles in this genetically narrow material.

- 18 -
Methods
Five 1536-SNP GoldenGate assays (Figure 1, Table 2)
Three pilot-phase 1536-SNP GoldenGate assays were developed. These “pilot
OPAs” are referred to as POPA1, POPA2 and POPA3. Two 1536-SNP production-
scale OPAs, referred to as BOPA1 and BOPA2, were developed from SNPs tested on
the pilot OPAs. All sequences used as SNP sources were generated using the Sanger
dideoxy chain termination method.
POPA1 and POPA2
The contents of POPA1 and POPA2 came from an initial list of SNPs
comprised of the union of three intersecting lists from SCRI (1,658 SNPs), IPK (985
SNPs) and UCR (12,615 SNPs). SCRI and IPK SNPs were derived from PCR
amplicon sequences, whereas UCR SNPs were derived nearly entirely from EST
sequences. In the selection of SNPs for the OPAs, preference was given to SNPs
derived from amplicon sequences. Nearly all SNPs on POPA1 and about 60% of the
SNPs on POPA2 targeted stress-regulated genes. The composition of POPA1
included 1524 barley SNPs, one per gene, of which 1033 were derived from ESTs and
491 from amplicon sequences. The composition of POPA2 included 1536 barley
SNPs, one per gene including 258 genes represented on POPA1, of which 1456 were
from ESTs and 80 from amplicon sequences.
BOPA1
BOPA1 represented 705 SNPs from POPA1 and 832 from POPA2, including
one SNP in common. All BOPA1 SNPs had a satisfactory technical performance on
POPA1 or POPA2 and a minor allele frequency of at least 0.08. To the extent of

- 19 -
results presented in this manuscript, BOPA1 included 1414 mapped and 122
unmapped SNPs.
POPA3
Residual SNPs from the sources of POPA1 and POPA2 were insufficient to
complete the design of POPA3 without compromising on the SNP selection criteria.
Additional SNPs for POPA3 came from three sources: 1) an extended list of 5,732
SNPs identified in SCRI amplicon sequences, 2) colleagues who contributed SNPs
from amplicon sequences of specific genes of biological interest and 3) an expanded
barley EST resource. The first two of these additional sources were exhausted for
POPA3 design. In the selection of EST-derived SNPs, priority was given to genes
previously classified as having interesting expression patterns during malting or upon
exposure to pathogens, or relevant to malting, brewing quality, abiotic stress or
phenology. The composition of POPA3 included 1536 barley SNPs, in many cases
more than one per gene and in some cases including genes represented on POPA1 or
POPA2. In total, 967 POPA3 SNPs were derived from ESTs and 569 from amplicon
sequences.
BOPA2
BOPA2 represented 406 SNPs from POPA1, 178 from POPA2 and 952 from
POPA3. The primary emphases of BOPA2 were representation of mapped SNPs that
were not included on BOPA1 and inclusion of multiple SNPs for certain genes to
reveal haplotypes at these loci, with some weight given to MAF. BOPA2 contained
921 SNPs with MAF at least 0.08, 256 SNPs with MAF at least 0.04 but less than
0.08, 345 SNPs with MAF least 0.005 but less than 0.04, and 14 SNPs with only one
allele (MAF = 0) in the germplasm examined using POPA3. To the extent of results
- 20 -
presented in this manuscript, BOPA2 included 1263 mapped and 273 unmapped
SNPs. A total of 967 SNPs were from ESTs and 569 from amplicon sequences.
SNP annotations
Table S4 (Additional File 14) provides alternative SNP names arising from
this work, and several annotation fields for all SNPs represented on POPA1, POPA2,
POPA3, BOPA1 and BOPA2. The annotations include BLAST hits to the rice and
Arabidopsis genomes and UniProt, the relationship of SNP source sequences to
HarvEST:Barley unigenes and probe sets on the Affymetrix Barley1 GeneChip and
source consensus sequences. To assign SNP loci on the genetic map to chromosome
arms, centromere positions were identified using flow-sorted chromosome arms
following the method described in Simkova et al. [24]; results of this work will be
described elsewhere (Bhat et al., in preparation). The annotation information in Table
S4 (Additional File 14) is also available from HarvEST:Barley [14] and [20]. The
HarvEST BLAST server [25] provides the 2943 mapped SNP unigene sequences as a
searchable database.
DNA sources
Genomic DNAs of 93 doubled haploid maplines and the parents (Dom, Rec)
of the Oregon Wolfe Barley (OWB) population [26] [27] 148 doubled haploids and
the parents of the Steptoe x Morex (SxM) population [7] [28] , 95 doubled haploid
maplines and the parents of the Haruna Nijo x OHU602 (HxO) population and 213
additional germplasm samples were purified using Plant DNeasy (Qiagen, Valencia,
CA, USA) starting with 100-300 mg of young seedling leaves. Genomic DNAs of 93
doubled haploid maplines and the Barke parent from the Morex x Barke population
(Stein et al. unpublished) were produced using a CTAB method. All DNA samples

- 21 -
were checked for concentration using UV spectroscopy and Quant-iT PicoGreen
(Invitrogen, Carlsbad, CA, USA) and adjusted to approximately 120 ng/µl in TE
buffer.
Data production for map construction and MAF estimation
DNA concentrations were re-checked using Quant-iT PicoGreen (Invitrogen,
Carlsbad, CA) and standardized to 80 ng/µl in TE buffer in preparation for the
GoldenGate assay and 5 µl (400 ng) were used for each assay. Data were generated
from each progeny line in the OWB, SxM and MxB doubled haploid populations
using POPA1 and POPA2. Data were also produced using POPA3 from the complete
OWB and MxB sets of DNA samples, but from only 92 SxM doubled haploids. Data
from 95 HxO doubled haploids using BOPA1 were also generated. For each of these
four mapping populations, extensive integration of SNP data with other types of
marker data will be described elsewhere (for example OWB marker integration in
Szőcs et al. [10]). Data used for the determination of allele frequency (see below)
came from 125 germplasm samples for POPA1, 195 germplasm samples for POPA2,
and 189 germplasm samples for POPA3.
Data processing
Raw data were transformed to genotype calls, initially using Illumina GenCall
and subsequently using Illumina BeadStudio version 3 with the genotyping module.
For each OPA, the data from all samples were visually inspected to manually set 1536
archetypal clustering patterns. The cluster positioning was guided by knowledge that
heterozygotes are nearly non-existent in doubled haploids and rare in highly inbred
parental genotypes and germplasm samples. Several “synthetic heterozygote” DNA
samples were made by mixing parental DNAs in a 1:1 mass ratio (Figure 2A, green

- 22 -
dots), and included to anchor heterozygote cluster positions to enable the
identification of true heterozygotes which occur at a significant frequency in
germplasm samples that have not been sufficiently inbred to reach a state of genome-
wide allele fixation. The spatial positions of heterozygote and homozygote data
clusters were confined to areas of high certainty so that data points with less certainty
fell outside the boundaries of heterozygotes and homozygotes and were scored as “no-
call” (Fig 2A, one germplasm sample as black dot). Polymorphisms with theta
compressed clusters were not used if the compression was such that any homozygote
call was not plainly distinguishable (Figure 2B, set as Gentrain 0.000, 100% “no
call”). Vertically separated data clusters were not accepted as polymorphisms (Figure
2C). Following the production of one master workspace for each Pilot OPA using all
DNA samples, customized workspaces were produced for each mapping population to
optimize the genotype calls via minor adjustments of cluster positions. Genotype calls
were exported as spreadsheets from BeadStudio and then parsed to create input for
mapping programs.
Individual and consensus map production
Individual maps were made principally using MSTMap [29] [30] for each data
set from the four doubled haploid mapping populations. In brief, MSTMap first
identifies linkage groups, then determines marker order by finding the minimum
spanning tree of a graph for each linkage group, then calculates distances between
marker using recombination frequencies. JoinMap 4 [31] was used to confirm linkage
groups and marker order determined by MSTMap. Raw data for problematic markers
were reviewed using BeadStudio and then either the marker was discarded entirely if
any ambiguity in data calling could not be resolved or individual genotype calls were
modified if it was plainly evident that such adjustments were warranted. Each such

- 23 -
review of primary data was followed by the production of new maps; this iterative
process generally involved 10-20 cycles for each individual map. At several points, a
consensus map was produced using MergeMap [32], which also flags problematic
markers for review. MergeMap takes into account marker order from individual maps
and calculates a consensus marker order. Briefly, the input to MergeMap is a set of
directed acyclic graphs (DAGs) [33] from each individual map, and the output is a set
of consensus DAGs (Figure 3, Figures S3-S9, Additional Files 6 -12), where each is
consistent with all (or nearly all) of the markers in the individual input maps.
MergeMap then linearizes each consensus DAG using a mean distance
approximation. The consensus map coordinates from MergeMap were normalized to
the arithmetic mean cM distance for each linkage group from the four individual maps
(Figure S2, see Additional File 4 and Table S4, see Additional File 14).
Implementation of BOPA1 and BOPA2 in US barley breeding germplasm
As part of Barley CAP [17], the two BOPAs have been part of an effort to
genotype a total of 3840 US barley breeding lines contributed from ten US barley
breeding programs for association mapping analyses. As of January 2009, data from
both BOPAs had been generated for 1920 breeding lines, with 960 submitted from the
selections of each of two years, 2006 and 2007. Table S5 (Additional File 15)
provides MAF for observed in these samples for each SNP in BOPA1 and BOPA2.
Abbreviations
AFLP = amplified fragment length polymorphism, DAG = directed acyclic graph,
DArT = diversity array technology, EST = expressed sequence tag, QTL =
quantitative trait locus, RFLP = restriction fragment length polymorphism, SNP =

- 24 -
single nucleotide polymorphism, SSR = simple sequence repeat, STS = sequence
tagged site
Authors' contributions
The contributions of authors and other colleagues, locations of work
conducted and cost sharing are detailed in Supplemental Text (Additional File 1),
which contains citations of references 34-39 and Additional Files 16-20, and is
essentially an expanded version of Methods.
Acknowledgements
This research was supported by NSF DBI Grant No. 0321756 “Coupling EST
and Bacterial Artificial Chromosome Resources to Access the Barley Genome”,
USDA-CSREES-NRI Grant No. 2006-55606-16722 “Barley Coordinated
Agricultural Project: Leveraging Genomics, Genetics, and Breeding for Gene
Discovery and Barley Improvement”, the Biotechnology and Biological Sciences
Research Council and Scottish Executive Environment and Rural Affairs Department,
and core funding from the Leibniz Institute of Plant Genetics and Crop Plant
Research.

- 25 -
References
1. Rostoks N, Mudie S, Cardle L, Russell J, Ramsay L, Booth A, Svensson JT,
Wanamaker SI, Walia H, Rodriguez EM, Hedley PE, Liu H, Morris J, Close,
TJ, Marshall DF, Robbie Waugh R: Genome-wide SNP discovery and
linkage analysis in barley based on genes responsive to abiotic stress.
Molecular Genetics and Genomics 2005, 274: 515-527.
2. Wenzl P, Li H, Carling J, Zhou M, Raman H, Paul E, Hearnden P, Maier C,
Xia L, Caig V, Ovesná J, Cakir M, Poulsen D, Wang J, Raman R, Smith KP,
Muehlbauer GJ, Chalmers KJ, Kleinhofs A, Huttner E, Kilian A: A high-
density consensus map of barley linking DArT markers to SSR, RFLP
and STS loci and agricultural traits. BioMed Central Genomics 2006,
7:206.
3. Marcel TC, Varshney RK, Barbieri M, Jafary H, de Kock MJD, Graner A,
Niks RE: A high-density consensus map of barley to compare the
distribution of QTLs for partial resistance of Puccinia hordei and of
defence gene homologues. Theoretical and Applied Genetics 2007, 114: 487-
500.
4. Stein N, Prasad M, Scholz U, Thiel T, Zhang H, Wolf M, Kota R, Varshney
RK, Perovic D, Grosse I, Graner A: A 1,000-loci transcript map of the
barley genome: new anchoring points for integrative grass genomics.
Theoretical and Applied Genetics 2007, 114: 823-839.
5. Varshney RK, Marcel TC, Ramsay L, Russell J, Röder MS, Stein N, Waugh
R, Langridge P, Niks RE, Graner A: A high density barley microsatellite
consensus map with 775 SSR loci. Theoretical and Applied Genetics 2007,
114:1091-1103.

- 26 -
6. Potokina E, Druka A, Luo Z, Wise R, Waugh R, Kearsey M: Gene expression
quantitative trait locus analysis of 16,000 barley genes reveals a complex
pattern of genome-wide transcriptional regulation. Plant Journal 2008, 53:
90-101.
7. Kleinhofs A, Kilian A, Saghai Maroof MA, Biyashev RM, Hayes P, Chen FQ,
Lapitan N, Fenwick A, Blake TK, Kanazin V, Ananiev E, Dahleen L, Kudrna
D, Bollinger J, Knapp SJ, Liu B, Sorrells M, Heun M, Franckowiak JD,
Hoffman D, Skadsen R, Steffenson BJ: A molecular, isozyme and
morpohological map of the barley (Hordeum vulgare) genome. Theoretical
and Applied Genetics 1993, 86:705-712.
8. Hearnden PR, Eckermann PJ, McMichael GL, Hayden MJ, Eglinton JK,
Chalmers KJ: A genetic map of 1,000 SSR and DArT markers in a wide
barley cross. Theoretical and Applied Genetics 2007, 115:383-391.
9. Sato K, Nankaku N, Takeda K: A high density transcript linkage map of
barley derived from a single population. Heredity 2009, 103:110-117.
10. Szőcs P, Blake VC, Bhat PR, Close TJ, Cuesta-Marcos A, Muehlbauer GJ,
Ramsay LV, Waugh R, Hayes PM: An integrated resource for barley
linkage map and malting quality QTL alignment. The Plant Genome 2009,
2:134-140.
11. Kleinhofs A, Graner A: An integrated map of the barley genome. In DNA
Markers in Plants. Edited by Vasil IK. Dordrecht, The Netherlands: Kluwer
Academic; 2001:187-199.
12. Kota R, Varshney RK, Prasad M, Zhang H, Stein N, Graner A: EST-derived
single nucleotide polymorphism markers for assembling genetic and

- 27 -
physical maps of the barley genome. Functional and Integrative Genomics
2008, 8:223-233.
13. Rice Genome Annotation Project Database
[http://rice.plantbiology.msu.edu/pseudomolecules/info.shtml]
14. HarvEST:Barley [http://harvest.ucr.edu]
15. Sorrells ME, LaRota M, Bermudez-Kandianis CE, Greene RA, Kantety R,
Munkvold JD, Miftahudin, Mahmoud A, Ma X, Gustafson PJ, Qi LL, Echalier
B, Gill BS, Matthews DE, Lazo GR, Chao S, Anderson OD, Edwards H,
Linkiewicz AM, Dubcovsky J, Akhunov ED, Dvorak J, Zhang D, Nguyen HT,
Peng J, Lapitan NL, Gonzalez-Hernandez JL, Anderson JA, Hossain K,
Kalavacharla V, Kianian SF, Choi DW, Close TJ, Dilbirligi M, Gill KS,
Steber C, Walker-Simmons MK, McGuire PE, Qualset CO: Comparative
DNA sequence analysis of wheat and rice genomes. Genome Research
2003, 13:1818-1827.
16. Salse J, Bolot S, Throuds M, Jouffe V, Piegu B, Quraishi UM, Calcagno T,
Cooke R, Delseny M, Feuillet C: Identification and characterization of
shared duplications between rice and wheat provide new insight into
grass genome evolution. Plant Cell 2008, 20:11-24.
17. The barley Coordinated Agricultural Project (CAP) [ www.barleycap.org]
18. Close TJ, Wanamaker SI, Caldo RA, Turner SM, Ashlock DA, Dickerson JA,
Wing RA, Muehlbauer GJ, Kleinhofs A, Wise RP: A new resource for cereal
genomics: 22K barley GeneChip comes of age. Plant Physiology 2004, 134:
960-968.
19. Nilsson NO, Sall T, Bengston BO: Chiasma and recombination data in
plants – are they compatible? Trends in Genetics 1993, 9: 344-348.

- 28 -
20. HarvEST:Web [www.harvest-web.org]
21. GrainGenes [http://wheat.pw.usda.gov/GG2/index.shtml]
22. National Center for Biotechnology Information
[http://www.ncbi.nlm.nih.gov/]
23. The Hordeum Toolbox [http://www.hordeumtoolbox.org/]
24. Šimková H, Svensson JT, Condamine P, Hřibová E, Suchánková P, Bhat PR,
Bartoš J, Šafář J, Close TJ, Doležel J: Coupling amplified DNA from flow-
sorted chromosomes to high-density SNP mapping in barley. BMC
Genomics 2008, 9:294.
25. The HarvEST BLAST Server [http://138.23.191.145/blast/index.html]
26. Costa JM, Corey A, Hayes PM, Jobet C, Kleinhofs A, Kopsich-Obusch A,
Kramer SF, Kudrna D, Li M, Riera-Lizarazu O, Sato K, Szőcs P, Toojinda T,
Vales MI, Wolfe RI : Molecular mapping of the Oregon Wolfe Barleys: a
phenotypically polymorphic doubled-haploid population. Theoretical and
Applied Genetics 2001, 103:415-424.
27. Barley World [http://barleyworld.org/oregonwolfe.php]
28. GrainGenes:The Steptoe x Morex Barley Mapping Population
[http://wheat.pw.usda.gov/ggpages/SxM/]
29. Wu Y, Bhat PR, Close TJ, Lonardi S: Efficient and accurate construction of
genetic linkage maps from the minimum spanning tree of a graph. PLoS
Genetics 2008, 4(10): e1000212. DOI:10.1371/journal.pgen.1000212
30. MSTmap Online [http://138.23.191.145/mstmap/]
31. Kyazma JoinMap [http://www.kyazma.nl/index.php/mc.JoinMap/]
32. Wu Y, Close TJ, Lonardi S: On the accurate construction of consensus
genetic maps. In Proceedings of LSS Computational Systems Bioinformatics

- 29 -
Conference: 26-29 August2008; Stanford. Edited by Peter Markstein.
2008:285-296.
33. Yap IV, Schneider D, Kleinberg J, Matthews D, Cartinhour S, McCouch SR:
A graph-theoretic approach to comparing and integrating genetic,
physical and sequence-based maps. Genetics 2003, 165: 2235-2247.
34. Walia H, Wilson C, Wahid A, Condamine P, Cui X, Close TJ: Expression
analysis of barley (Hordeum vulgare L.) during salinity stress. Functional
and Integrative Genomics 2006, 6: 143-156.
35. Svensson JT, Crosatti C, Campoli C, Bassi R, Stanca AM, Close TJ, Cattivelli
L: Transcriptome analysis of cold acclimation in barley Albina and
Xantha mutants. Plant Physiology 2006, 141: 257-270.
36. Tommasini L, Svensson JT, Rodriguez EM, Wahid A, Malatrasi M, Kato K,
Wanamaker S, Resnik J, Close TJ: Dehydrin gene expression provides an
indicator of low temperature and drought stress: transcriptome-based
analysis of barley (Hordeum vulgare L.). Functional and Integrative
Genomics 2008, 8:387-405.
37. Huang XM, Madan A: CAP3: a DNA sequence assembly program. Genome
Research 1999, 9:868–877.
38. Cui X, Xu J, Asghar R, Condamine P, Svensson JT, Wanamaker S, Stein N,
Roose M, Close TJ: Detecting single-feature polymorphisms using
oligonucleotide arrays and robustified projection pursuit. Bioinformatics
2005, 21: 3852-3858.
39. MapInspect
[http://www.plantbreeding.wur.nl/UK/software_mapinspect.html]

- 30 -
Figures
Figure 1 - Five 1536-plex GoldenGate assays
The numbers of SNPs selected from each Pilot OPA (POPA1, POPA2, POPA3) for
the design of each production scale OPA (BOPA1, BOPA2) are indicted next to the
arrows connecting the pilot and production OPAs. See Supplemental Text (Additional
File 1) for complete details.
Figure 2 - Examples of SNP data
A) Typical clustering of satisfactory data for POPA SNP 3_0004; red cluster area =
homozygous AA, blue = homozygous BB, green dots within purple cluster area are
1:1 mixtures of parental DNA for three DH mapping populations. One germplasm
sample (black dot) was outside of any call cluster and was thus scored “no call”. B)
Typical theta compressed data for POPA SNP 3_1104; although the polymorphism
can be mapped in an individual population there are often wrong calls in such data
and the cluster separation is problematic for general use in germplasm analyses or
with multiple mapping populations; set to Gentrain 0.000, 100% “no call”. C) Typical
vertically separated clusters for POPA SNP 3_0070; generally polymorphic for a
different locus than the source of the targeted SNP, which results in wrong annotation
and degraded synteny; set to Gentrain 0.000, 100% “no call”. D) Data for POPA SNP
1_1166 (ABC07305-1-4-322) from the OWB population; two DH samples behave as
heterozygotes (purple cluster), far from the homozygotes (red = AA; blue = BB),
instead with the 1:1 mixture of parental DNAs (green dot in purple cluster).
Figure 3 - Venn diagram showing marker overlap
A four-way Venn diagram illustrates all unique, two-way, three-way and four-way
sets of shared markers. The mapping populations are abbreviated as in the text: MxB

- 31 -
= Morex x Barke, OWB = Oregon Wolfe Barley, SxM = Steptoe x Morex, HxO =
Haruna Nijo x OHU602.
Figure 4 - Segment of a consensus directed acyclic graph
A typical segment of a directed acyclic graph representing the consensus map of one
barley linkage group is shown. Each oval represents one bin of SNP markers, using
POPA names for SNPs. Where an oval contains more than one SNP, it means that
there was no evidence of recombination in any mapping population between those
markers. The observed recombination frequencies between marker bins are shown.
The exact order of marker bins cannot be solved with certainty unless markers are
shared between maps. Recombination frequencies are often not proportional to
physical distance, nor consistent, when comparing two or more maps from different
mapping populations. Therefore directed acyclic graphs provide a more exact
description of the limit of knowledge of the marker order than does a linear map
derived using approximations based on recombination values. See the text for further
discussion.
Figure 5 - Barley-rice synteny in detail for 5H
HarvEST screenshot showing barley-rice synteny for chromosome 5H. Colored lines
connect each barley locus to the position of the best BLAST hit on the rice genome.
Figure 6 - Barley-rice synteny summary
Seven barley linkage groups represented as rice synteny blocks. Numbers inside each
barley chromosome indicate syntenic rice chromosome arm.

- 32 -
Additional Files
Additional File 1 – Supplemental Text
Additional File 2 - Figure S1
SNP yield. The near-linear relationship between the number of SNPs and the product
of the number of EST sequences for pairwise genotype comparisons is shown by
plotting all values versus a linear regression line. Each axis is on a logarithmic scale.
Oval shapes indicate a comparison involving the wild barley accession OHU602. See
text for additional details.
Additional File 3 - Table S1
All individual and consensus maps, including SxM bin markers.
Additional File 4 - Figure S2
Consensus 2943 SNP genetic linkage map.
Additional File 5 - Table S2
All data from MxB, OWB and SxM mapping populations.
Additional File 6 - Figure S3
Complete consensus directed acyclic graphs for barley chromosomes 1H.
Additional File 7 - Figure S4
Complete consensus directed acyclic graphs for barley chromosomes 2H.
Additional File 8 - Figure S5
Complete consensus directed acyclic graphs for barley chromosomes 3H.
Additional File 9 - Figure S6
Complete consensus directed acyclic graphs for barley chromosomes 4H.
Additional File 10 - Figure S7
Complete consensus directed acyclic graphs for barley chromosomes 5H.
Additional File 11 - Figure S8

- 33 -
Complete consensus directed acyclic graphs for barley chromosomes 6H.
Additional File 12 - Figure S9
Complete consensus directed acyclic graphs for barley chromosomes 7H.
Additional File 13 – Table S3
Synonymous marker names.
Additional File 14 - Table S4
All marker consensus map coordinates, names, source types, BLASTs, probe sets,
sequences.
Additional File 15 - Table S5
Minor allele frequencies for each SNP on BOPA1 and BOPA2.
Additional File 16 - Table S6
POPA1 SNPs.
Additional File 17 - Table S7
POPA2 SNPs.
Additional File 18 - Table S8
POPA3 SNPs..
Additional File 19 - Table S9
BOPA1 SNPs.
Additional File 20 - Table S10
BOPA2 SNPs.

- 34 -
Table 1. Distribution of SNPs in four individual maps and consensus map
Chromosome
Map Count
type 1H 2H 3H 4H 5H 6H 7H All
Morex x Barke markers 215 279 246 141 299 219 248 1652
bins 60 72 77 39 74 54 65 443
cM 134.0 151.9 178.1 112.4 195.7 133.8 158.9 1064.9
Oregon Wolfe Barley markers 168 235 255 211 278 202 213 1562
bins 65 73 91 60 89 64 67 509
cM 145.4 181.0 199.3 121.8 231.1 152.3 186.7 1217.6
Steptoe x Morex markers 148 217 242 130 225 122 183 1270
bins 49 57 63 49 80 40 57 396
cM 139.7 148.8 154.7 141.5 187.3 123.8 140.8 1036.6
Haruna Nijo x OHU602 markers 93 131 123 97 108 92 88 732
bins 46 65 58 48 58 40 47 362
cM 145.2 162.6 162.7 124.5 176.4 123.0 182.5 1076.7
Consensus markers 341 485 475 338 535 352 417 2943
bins 125 161 152 113 180 111 133 975
cM 141.1 161.1 173.7 125.1 197.6 133.2 167.2 1099.0
- 35 -
Table 2. Design and performance characteristics of BOPA1 and BOPA2
BOPA1 BOPA2 Both
SNPs represented 1536 1536 3072
Number of unigenes on other BOPA* 77 77 NA
Unigenes represented 1536 1442 2901
Number of unigenes with 1 SNP 1536 1380 2770
Number of unigenes with 2 SNPs 0 43 106
Number of unigenes with 3 SNPs 0 11 16
Number of unigenes with 4 SNPs 0 3 3
Number of unigenes with 5 SNPs 0 5 6
SNPs included in 2943 mapped 1414 1263 2677
SNP unigenes matching Barley1 probe set(s) 1489 1433 2921
MAF ≥ 0.08 in design germplasm 1536 921 2457
MAF ≥ 0.04 and < 0.08 in design germplasm 0 256 256
MAF ≥ 0.005 and < 0.04 in design germplasm 0 345 345
MAF = 0 in design germplasm 0 14 14
MAF = 0 in 2006 BarleyCAP genotypes 99 301 400
MAF >0 and < 0.05 in 2006 BarleyCAP genotypes 65 284 349
MAF ≥ 0.05 in 2006 BarleyCAP genotypes 1372 951 2323
*Among the 77 unigenes represented by SNPs on both BOPAs, 69 have 1 SNP on
BOPA2, 6 have 2 SNPs on BOPA2, 1 has three SNPs on BOPA2, 1 has four SNPs on
BOPA2.

PilotOPA1ÑRQRC3Ò1_xxxx
PilotOPA2ÑRQRC4Ò2_xxxx
PilotOPA3ÑRQRC5Ò3_xxxx
BarleyOPA2ÑDQRC4Ò12_xxxxx
406
178952
BarleyOPA1ÑDQRC3Ò11_xxxxx
705 832
Figure 1

Figure 2

MxB
OWB SxM
HxO
597
163
210
77
113
97
34
86
107
112
106
359
235
243
404
Figure 3

Figure 4

Figure 5

Figure 6

Additional files provided with this submission:
Additional file 1: Supplemental_Text(revised_261109).doc, 54Khttp://www.biomedcentral.com/imedia/1427573585328820/supp1.docAdditional file 2: Supplemental_FigS1.doc, 165Khttp://www.biomedcentral.com/imedia/7848153993263085/supp2.docAdditional file 3: Supplemental_TableS1.xls, 1363Khttp://www.biomedcentral.com/imedia/9912798193263080/supp3.xlsAdditional file 4: Supplemental_FigS2.doc, 3685Khttp://www.biomedcentral.com/imedia/2351535463263094/supp4.docAdditional file 5: Supplemental_TableS2.xls, 6564Khttp://www.biomedcentral.com/imedia/1833488695326309/supp5.xlsAdditional file 6: Supplemental_FigS3.jpg, 681Khttp://www.biomedcentral.com/imedia/1215693416326309/supp6.jpegAdditional file 7: Supplemental_FigS4.jpg, 973Khttp://www.biomedcentral.com/imedia/1047276924326309/supp7.jpegAdditional file 8: Supplemental_FigS5.jpg, 850Khttp://www.biomedcentral.com/imedia/1957788623326309/supp8.jpegAdditional file 9: Supplemental_FigS6.jpg, 616Khttp://www.biomedcentral.com/imedia/3179174623263095/supp9.jpegAdditional file 10: Supplemental_FigS7.jpg, 1132Khttp://www.biomedcentral.com/imedia/1642455843326310/supp10.jpegAdditional file 11: Supplemental_FigS8.jpg, 639Khttp://www.biomedcentral.com/imedia/1572304095326311/supp11.jpegAdditional file 12: Supplemental_FigS9.jpg, 947Khttp://www.biomedcentral.com/imedia/1249846616326311/supp12.jpegAdditional file 13: Supplemental_TableS3.doc, 102Khttp://www.biomedcentral.com/imedia/1397250425326311/supp13.docAdditional file 14: Supplemental_TableS4.xls, 9871Khttp://www.biomedcentral.com/imedia/6850076232631131/supp14.xlsAdditional file 15: Supplemental_TableS5.xls, 640Khttp://www.biomedcentral.com/imedia/1500569166326311/supp15.xlsAdditional file 16: Supplemental_TableS6.xls, 495Khttp://www.biomedcentral.com/imedia/1548296124326311/supp16.xlsAdditional file 17: Supplemental_TableS7.xls, 502Khttp://www.biomedcentral.com/imedia/1302785537326310/supp17.xlsAdditional file 18: Supplemental_TableS8.xls, 320Khttp://www.biomedcentral.com/imedia/1112553469326310/supp18.xlsAdditional file 19: Supplemental_TableS9.xls, 511Khttp://www.biomedcentral.com/imedia/1614550331326311/supp19.xlsAdditional file 20: Supplemental_TableS10.xls, 323Khttp://www.biomedcentral.com/imedia/1826479810326311/supp20.xls