bitcoin ringing the bell for a new asset class
TRANSCRIPT

Join the conversation on Twitter @ARKinvest www.ark-invest.com
BitcoinRinging the Bell For a New Asset Class
Published: January 16, 2017
AuthorChris Burniske, Analyst at ARK Invest
Co-AuthorAdam White, VP & General Manager at Coinbase

BITCOIN: RINGING THE BELL FOR A NEW ASSET CLASS ARK INVEST + COINBASE | CHRIS BURNISKE AND ADAM WHITE
2
CHRIS BURNISKE
Chris Burniske serves as Blockchain Products Lead at ARK Invest, working on both research and business development. In 2015, ARK Invest became the first public fund manager to invest in bitcoin, offering the first two ETFs with bitcoin exposure. Chris frequently appears in media outlets including CNBC, Bloomberg, Forbes, USA Today, the Washington Post, and more. He graduated Phi Beta Kappa with a BS from Stanford.
ADAM WHITE
Adam White is the Vice President and General Manager of GDAX. He has worked as a consultant at Bain & Co. and as a product manager at Activision Blizzard. Prior to that, he tested experimental aircraft as a Captain in the United States Air Force. Adam holds an MBA from Harvard Business School and a BS in Optical Engineering from the University of California, Davis.
SPECIAL THANKS to our contributorsCatherine Wood / Brett Winton / Kellen Carter / Will Scherer / Sebastian Benkert / Lisa Dodd / Faith McCormick / Kristen Stone
ABOUT THE AUTHORS

3 BITCOIN: RINGING THE BELL FOR A NEW ASSET CLASS ARK INVEST + COINBASE | CHRIS BURNISKE AND ADAM WHITE
INTRO
Bitcoin and its underlying blockchain technology have become a force of innovation since being introduced in the midst of the 2007-2008 Financial Crisis.1 The utility of the technology has driven the value of the currency that rides on top of it—bitcoin with a lower-case “b”—to grow by more than 220 fold in the last five years.2 This means a person who invested $10,000 in bitcoin at the start of 2012 would now be a multi-millionaire. We believe that technical jargon, bad actors, price volatility, and sensational media have kept much of the masses away from what could be the biggest technological development since the Internet.
While this paper will not dive into the specifics of the technology,3 ARK Invest and Coinbase encourage readers new to the subject to start with the originating white paper by Satoshi Nakamoto4 and follow it with Marc Andreesen’s article in the New York Times.5
Despite storing over fifteen billion dollars in value,6 bitcoin still generates confusion around its classification as an asset. The Commodity Futures Trading Commission (CFTC) asserts that it’s a commodity,7 the Internal Revenue Service (IRS) deems it property,8 and the U.S. Securities and Exchange Commission (SEC) has decided to approach it on a case-by-case basis.9
The term cryptocurrency further muddles the regulatory situation, as it implies cryptocurrencies are a subset of the currency asset class, which we think is not the case. In our opinion, it may be better to consider other naming conventions, such as cryptotoken, blockchain asset, or digital asset.
The definition of an asset class was addressed in Robert Greer’s seminal 1997 paper, “What is an Asset Class, Anyway?”10 In his paper, Greer lays out three superclasses of assets, which include capital assets, consumable/transformable assets, and store of value assets. He goes on to say “the lines between asset classes can still be fuzzy,” as is the case with gold fulfilling both consumable/transformable and store of value asset profiles, as shown in Table 1.
Greer derives his three asset superclasses from a study of “fundamental economic features” and the correlation of their returns.11 Nested within the superclasses are traditional asset classes—as listed on the left hand side of the table below—which is the layer of classification that this paper will focus on.12
1 “History of Bitcoin,” History of Bitcoin, Accessed January 2017, http://historyofbitcoin.org
2 ARK Investment Management LLC & Coinbase, data sourced from CoinDesk BPI. Unless otherwise stated, bitcoin price data is as of January 1, 2017, as is bitcoin market capitalization data.
3 To summarize, Bitcoin is a protocol that facilitates a 100% digital, transparent and immutable ledger, enabling the transfer of value across the Internet without the need for centralized custodians. The Bitcoin protocol is composed of three moving parts: miners, Bitcoin’s blockchain, and bitcoin (the currency). The miners are the machines that mathematically compile transactions—employing a robust consensus mechanism to maintain an ongoing blockchain (i.e., digital ledger)—and bitcoin is the fuel that incentivizes the machines to churn, while also serving as a unit of account within the ledger.
4 “Bitcoin: A Peer-to-Peer Electronic Cash System,” Satoshi Nakamoto, 2008, https://bitcoin.org/bitcoin.pdf
5 “Why Bitcoin Matters,” Marc Andreessen, January 2014, http://dealbook.nytimes.com/2014/01/21/why-bitcoin-matters
6 Crypto-Currency Market Capitalizations, CoinMarketCap, Accessed January 2017, http://coinmarketcap.com
7 “Release: PR7231-15,” CFTC, September 2015, http://www.cftc.gov/PressRoom/PressReleases/pr7231-15
8 “IRS Virtual Currency Guidance,” IRS, March 2014, https://www.irs.gov/uac/Newsroom/IRS-Virtual-Currency-Guidance
9 “Adapting the Regulatory Framework to Blockchain Technology,” Panel Speakers, April 2015, Coala Blockchain Workshops.
10 “What is an Asset Class, Anyway?” Robert J. Greer, 1997, The Journal of Portfolio Management.
11 Id.
12 While not the focus of this paper, ARK and Coinbase believe bitcoin, and cryptocurrencies more broadly, would fall primarily under the store of value asset superclass, though with consumable/transformable superclass characteristics as well.

4 BITCOIN: RINGING THE BELL FOR A NEW ASSET CLASS ARK INVEST + COINBASE | CHRIS BURNISKE AND ADAM WHITE
Building upon Greer’s work, ARK Invest and Coinbase have defined four distinct characteristics that delineate the boundaries among traditional asset classes:
| Investability
| Politico-Economic Features
| Correlation of Returns: Price Independence
| Risk-Reward Profile
First, we think that an asset class must be sufficiently investable, providing ample liquidity and opportunity to invest. Second, it should have a distinct politico-economic profile that arises from its basis of value, governance, and use cases. Third, an asset’s market value should fluctuate independently of other assets in the marketplace, exhibiting low correlation of returns. Lastly, the prior three characteristics should lead to a differentiated risk-reward profile, which can be broken down into absolute returns and volatility. Combined, these four characteristics clarify which assets belong in each class.
For example, equities and bonds are considered different asset classes because after fulfilling the investability requirement, they differ in the latter three characteristics listed above. The politico-economic profiles of the two are different: an equity provides a perpetual claim on a company’s future cash flows, while a bond provides fixed periodic payments over a finite period of time secured by a company’s underlying assets. They
DEFAULT for axis and labels:Tw Cen MT, Regular, 7-8ptAxis Color = RGB 90,90,90
EQUITIES
BONDS
INCOME-PRODUCING REAL ESTATE
PHYSICAL COMMODITIES (e.g., grains or energy products)
PRECIOUS METALS (e.g., Gold)
CURRENCY
FINE ART
“Ongoing source of something of value…valued on the basis of net present
value of its expected returns.”
“You can consume it. You can transform it into another asset. It has economic value. But it does not yield
an ongoing stream of value.”
“Cannot be consumed; nor can it generate income. Nevertheless, it has value; it is a store of value asset.”
CAPITAL ASSETS
CONSUMABLE/TRANSFORMABLE ASSETS
STORE OF VALUE ASSETS
X
X
X
X
X
X
X
X
TABLE 1Categorization of Traditional Asset Classes by their Superclass
Source: “What is an Asset Class, Anyway?” Robert J. Greer, 1997, The Journal of Portfolio Management

5 BITCOIN: RINGING THE BELL FOR A NEW ASSET CLASS ARK INVEST + COINBASE | CHRIS BURNISKE AND ADAM WHITE
behave differently in the marketplace, as witnessed in a “risk-off” environment in which equities struggle and bonds rally. Their historic risk-reward profiles are different, as stocks tend to have higher absolute returns with higher price volatility, while bonds have lower absolute returns with lower volatility.
By analyzing bitcoin’s behavior in the context of these four criteria, ARK Invest and Coinbase aim to unearth its merit as a bellwether for the cryptocurrency asset class. That said, cryptocurrency as an asset class cannot be proven as unique without observing its behavior relative to traditional asset classes: equities, bonds, precious metals, real estate, energy commodities, and fiat currencies.
METHODOLOGY
ARK Invest and Coinbase have selected the following commonly used benchmarks,13 respectively, to compare cryptocurrency to other traditional asset classes:
| The S&P 500 Index (SPX) (“US equities”);
| The Bloomberg Barclays US Aggregate Bond Index (LBUSTRUU) (“US bonds”);
| The index underlying the SPDR Gold Shares ETF (GOLDLNPM) (“gold”);
| The Morgan Stanley Capital International (MSCI) US Real Estate Investment Trust Index (RMZ) (“US real estate”);
| The Crude Oil Futures (CL1 COMB) (“oil”); and
| The MSCI Global Currency Index (MXEF0CX0) (“Emerging Market Currencies”).
We chose these benchmarks as standard representatives of many different asset classes since bitcoin is a standard example of the cryptocurrency asset class.
13 Index data was sourced from Bloomberg as total return with reinvested dividends and coupons where relevant.
6 BITCOIN: RINGING THE BELL FOR A NEW ASSET CLASS ARK INVEST + COINBASE | CHRIS BURNISKE AND ADAM WHITE
INVESTABILITY
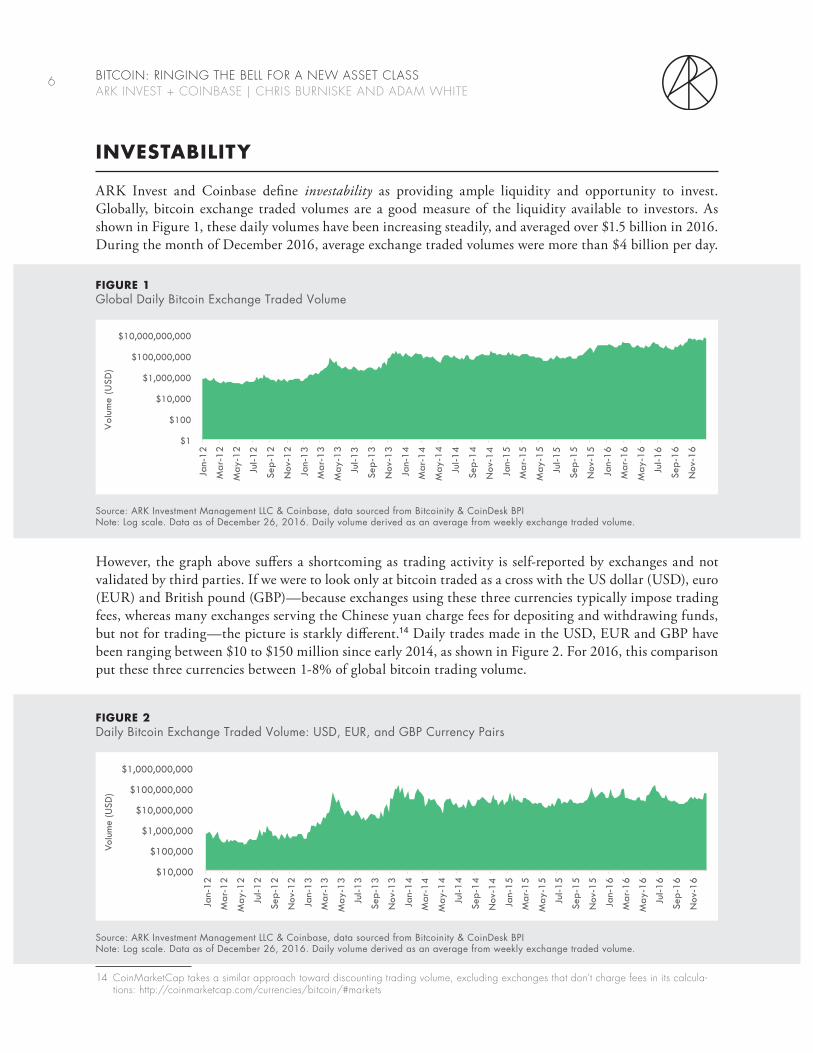
ARK Invest and Coinbase define investability as providing ample liquidity and opportunity to invest. Globally, bitcoin exchange traded volumes are a good measure of the liquidity available to investors. As shown in Figure 1, these daily volumes have been increasing steadily, and averaged over $1.5 billion in 2016. During the month of December 2016, average exchange traded volumes were more than $4 billion per day.
DEFAULT for axis and labels:Tw Cen MT, Regular, 7-8ptAxis Color = RGB 90,90,90
Vol
ume
(USD
)
$1
$100
$10,000
$1,000,000
$100,000,000
$10,000,000,000
Jan-
12
Mar
-12
May
-12
Jul-1
2
Sep-
12
Nov
-12
Jan-
13
Mar
-13
May
-13
Jul-1
3
Sep-
13
Nov
-13
Jan-
14
Mar
-14
May
-14
Jul-1
4
Sep-
14
Nov
-14
Jan-
15
Mar
-15
May
-15
Jul-1
5
Sep-
15
Nov
-15
Jan-
16
Mar
-16
May
-16
Jul-1
6
Sep-
16
Nov
-16
FIGURE 1 Global Daily Bitcoin Exchange Traded Volume
Source: ARK Investment Management LLC & Coinbase, data sourced from Bitcoinity & CoinDesk BPINote: Log scale. Data as of December 26, 2016. Daily volume derived as an average from weekly exchange traded volume.
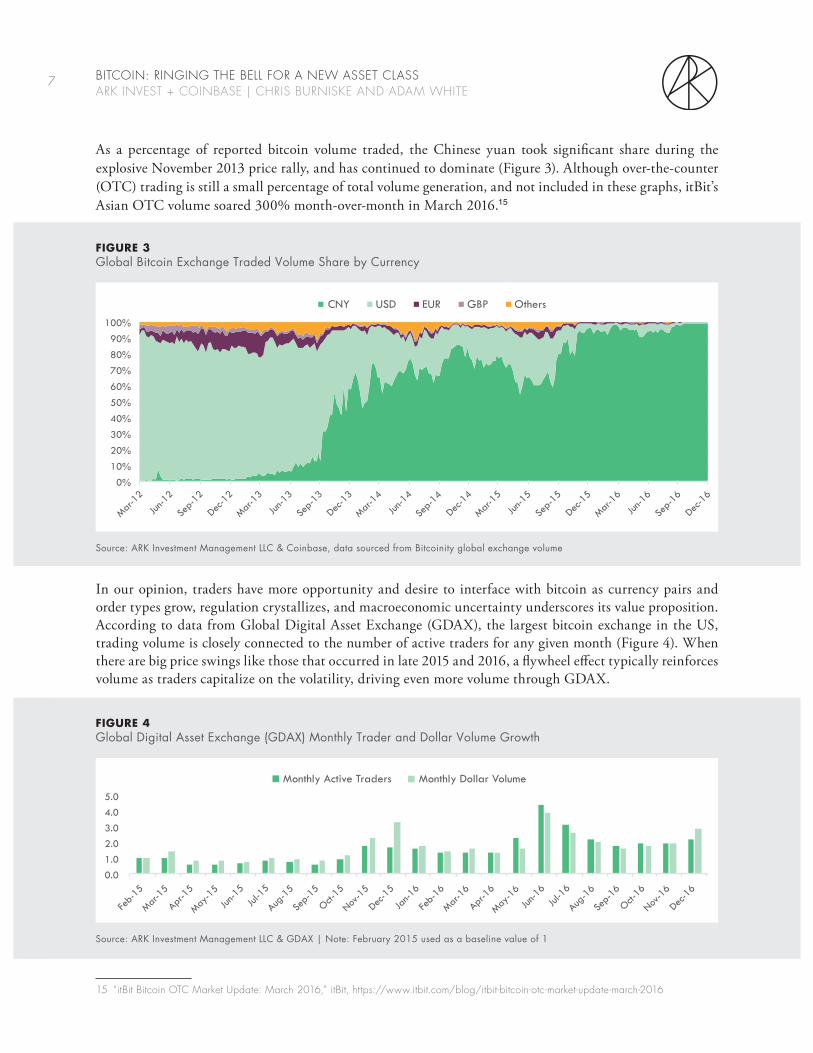
However, the graph above suffers a shortcoming as trading activity is self-reported by exchanges and not validated by third parties. If we were to look only at bitcoin traded as a cross with the US dollar (USD), euro (EUR) and British pound (GBP)—because exchanges using these three currencies typically impose trading fees, whereas many exchanges serving the Chinese yuan charge fees for depositing and withdrawing funds, but not for trading—the picture is starkly different.14 Daily trades made in the USD, EUR and GBP have been ranging between $10 to $150 million since early 2014, as shown in Figure 2. For 2016, this comparison put these three currencies between 1-8% of global bitcoin trading volume.
DEFAULT for axis and labels:Tw Cen MT, Regular, 7-8ptAxis Color = RGB 90,90,90
$10,000
$100,000
$1,000,000
$10,000,000
$100,000,000
$1,000,000,000
Jan-
12
Mar
-12
May
-12
Jul-1
2
Sep-
12
Nov
-12
Jan-
13
Mar
-13
May
-13
Jul-1
3
Sep-
13
Nov
-13
Jan-
14
Mar
-14
May
-14
Jul-1
4
Sep-
14
Nov
-14
Jan-
15
Mar
-15
May
-15
Jul-1
5
Sep-
15
Nov
-15
Jan-
16
Mar
-16
May
-16
Jul-1
6
Sep-
16
Nov
-16
Volu
me
(USD
)
FIGURE 2Daily Bitcoin Exchange Traded Volume: USD, EUR, and GBP Currency Pairs
Source: ARK Investment Management LLC & Coinbase, data sourced from Bitcoinity & CoinDesk BPINote: Log scale. Data as of December 26, 2016. Daily volume derived as an average from weekly exchange traded volume.
14 CoinMarketCap takes a similar approach toward discounting trading volume, excluding exchanges that don’t charge fees in its calcula-tions: http://coinmarketcap.com/currencies/bitcoin/#markets
7 BITCOIN: RINGING THE BELL FOR A NEW ASSET CLASS ARK INVEST + COINBASE | CHRIS BURNISKE AND ADAM WHITE
As a percentage of reported bitcoin volume traded, the Chinese yuan took significant share during the explosive November 2013 price rally, and has continued to dominate (Figure 3). Although over-the-counter (OTC) trading is still a small percentage of total volume generation, and not included in these graphs, itBit’s Asian OTC volume soared 300% month-over-month in March 2016.15
In our opinion, traders have more opportunity and desire to interface with bitcoin as currency pairs and order types grow, regulation crystallizes, and macroeconomic uncertainty underscores its value proposition. According to data from Global Digital Asset Exchange (GDAX), the largest bitcoin exchange in the US, trading volume is closely connected to the number of active traders for any given month (Figure 4). When there are big price swings like those that occurred in late 2015 and 2016, a flywheel effect typically reinforces volume as traders capitalize on the volatility, driving even more volume through GDAX.
DEFAULT for axis and labels:Tw Cen MT, Regular, 7-8ptAxis Color = RGB 90,90,90
0.0 1.0 2.0 3.0 4.0 5.0
Feb-
15
Mar-1
5
Apr-1
5
May-1
5
Jun-1
5
Jul-1
5
Aug-1
5
Sep-
15
Oct-15
Nov-1
5
Dec-1
5
Jan-1
6
Feb-
16
Mar-1
6
Apr-1
6
May-1
6
Jun-1
6
Jul-1
6
Aug-1
6
Sep-
16
Oct-16
Nov-1
6
Dec-1
6
Monthly Active Traders Monthly Dollar Volume
FIGURE 4Global Digital Asset Exchange (GDAX) Monthly Trader and Dollar Volume Growth
Source: ARK Investment Management LLC & GDAX | Note: February 2015 used as a baseline value of 1
$0.2$ -
$0.4$0.6$0.8$1,0$1,2$1,4$1,6
bitcoin GLD US Equity (Gold) VNQ US Equity (US Real Estate)
Billi
ons
(USD
)
FIGURE 5Daily Liquidity (Trailing Three Month Average)
Source: ARK Investment Management LLC & Coinbase, data sourced from Bitcoinity, Bloomberg, & TradeBlockNote: As of May 6th, 2016
15 “itBit Bitcoin OTC Market Update: March 2016,” itBit, https://www.itbit.com/blog/itbit-bitcoin-otc-market-update-march-2016
DEFAULT for axis and labels:Tw Cen MT, Regular, 7-8ptAxis Color = RGB 90,90,90
0%
10%
20%
30%
40%
50%
60%
70%
80%
90%
100%
Mar-1
2
Jun-1
2
Sep-
12
Dec-1
2
Mar-1
3
Jun-1
3
Sep-
13
Dec-1
3
Mar-1
4
Jun-1
4
Sep-
14
Dec-1
4
Mar-1
5
Jun-1
5
Sep-
15
Dec-1
5
Mar-1
6
Jun-1
6
Sep-
16
Dec-1
6
CNY USD EUR GBP Others
FIGURE 3Global Bitcoin Exchange Traded Volume Share by Currency
Source: ARK Investment Management LLC & Coinbase, data sourced from Bitcoinity global exchange volume

8 BITCOIN: RINGING THE BELL FOR A NEW ASSET CLASS ARK INVEST + COINBASE | CHRIS BURNISKE AND ADAM WHITE
As of December 30, 2016, bitcoin’s average daily liquidity for the trailing three months16 was more than three fold the SPDR Gold Shares ETF (GLD) and nearly ten times that of the Vanguard REIT ETF (VNQ), as shown in Figure 5.17 These numbers are surprising considering bitcoin stored $15 billion in value at the time, while the GLD stored $34 billion and the VNQ stored $58 billion. In our opinion, superior volume with a fraction of the assets under management underscores that bitcoin is punching significantly above its weight in providing retail investors liquidity.
DEFAULT for axis and labels:Tw Cen MT, Regular, 7-8ptAxis Color = RGB 90,90,90
$-
$1,000,000,000
$2,000,000,000
$3,000,000,000
$4,000,000,000
bitcoin GLD US Equity (Gold) VNQ US Equity (US Real Estate)
FIGURE 5Daily Liquidity (Trailing Three Month Average)
Source: ARK Investment Management LLC & Coinbase, data sourced from Bitcoinity, Bloomberg, & CoinDesk BPINote: Data as of December 30, 2016
Trading is only half of the investability equation, as traders are short-term “investors,” while many retail holders are long-term oriented. From 2012 to 2015, users on Coinbase’s wallet and retail conversion service were increasingly using bitcoin strictly as an investment, or long-term store of value, as shown in Figure 6. In 2016, that trend softened, perhaps because new use cases and decreasing volatility have increased the utility of bitcoin as a means of exchange.
DEFAULT for axis and labels:Tw Cen MT, Regular, 7-8ptAxis Color = RGB 90,90,90
44% 56% 52% 64% 54%
0%
50%
100%
2012 2013 2014 2015 2016
Strictly as an Investment Transactional Medium
FIGURE 6 How Coinbase Users Interact with Bitcoin
Source: ARK Investment Management LLC & CoinbaseNote: This graph includes all Coinbase users with a material amount of bitcoin in their wallets. If a user sends a material amount of bitcoin to another address over the course of the year they are considered as approaching bitcoin as a transactional medium. Users that only purchased or held bitcoin during the year are considered as using bitcoin strictly as an investment. This graph differs from data previously published due to dormant users that have now become transacting users and data that Coinbase previously referenced where user behavior was analyzed in dollar terms rather than actions.
16 As addressed earlier in the piece, much of this liquidity goes through the CNY to bitcoin pair.
17 On a trailing three-month average basis that includes October, November, and December 2016.

9 BITCOIN: RINGING THE BELL FOR A NEW ASSET CLASS ARK INVEST + COINBASE | CHRIS BURNISKE AND ADAM WHITE
Since Coinbase stored over a billion dollars of bitcoin as of January 1, 2017–more than any other provider in the world–arguably it is a representative sample of the ecosystem as a whole. If we assume transactors and investors hold roughly the same amount of bitcoin in their wallets, then between 50 to 60% of bitcoin worldwide—or north of $7.5 billion out of a $15 billion base—is strictly a store of value. While the value that bitcoin stores is non-trivial, we believe it still has enormous headroom in relation to the roughly $70 trillion dollars stored in global equity markets.18
Digging deeper into the numbers, ARK and Coinbase estimate that more than ten million people around the world hold a material amount of bitcoin. Meanwhile, over 500 million people hold stocks directly or indirectly.19 Even a modest uptake by those who have shown a propensity to hold higher-risk assets would increase bitcoin liquidity materially. Moreover, while bitcoin is perhaps held by 2% of current equity investors, it has penetrated less than 0.2% of the global population.20 Ultimately, it seems likely that as cryptocurrencies mature, the number of holders will expand meaningfully, providing a positive tailwind for investability within the asset class.
The question of who and how many people hold bitcoin highlights a key characteristic of bitcoin’s investability: the censorship-resistant nature of its distributed and permissionless blockchain. While exchanges need a banking relationship to convert local fiat currency into bitcoin, “mining”21 is a mechanism by which citizens can acquire bitcoin independent of regulation or capital controls. Local currency buys the mining equipment that then generates bitcoin, which can be traded for a number of fiat currencies. As more support infrastructure is built around the network, bitcoin may become the most secure and accessible asset available to the public.
In summation, while bitcoin is not yet the most liquid or widely held asset on the worldwide market, we believe its thin market and fringe status is an overstated and stale argument. A surprisingly robust ecosystem has grown in the eight years since its inception, giving retail investors the tools and opportunity to drive billions of dollars in daily liquidity. There are many companies that aim to broaden retail exposure to bitcoin, such as Lawnmower’s “Bitcoin investing, simplified” mobile app.22 Meanwhile, an institutional infrastructure is building with products like Grayscale’s Bitcoin Investment Trust,23 TeraExchange’s Bitcoin forwards,24 Revoltura’s BitcoinETI,25 Vontobel’s bitcoin tracker certificate,26 and potentially exchange-traded funds (ETFs). With each month, bitcoin cements its role as a tradeable and investable asset, drawing second looks from many investors who wrote it off as fraud or fad.
18 “WFE Full Year Statistics,” World Federation of Exchanges, February 2016, https://www.world-exchanges.org/home/index.php/news/world-exchange-news/wfe-full-year-statistics-show-2015-global-equity-trading-volumes-rise-55-as-volatility-boosts-activity
19 “One Half-Billion Shareholders and Counting,” Grout, P.A., W.L. Megginson and A. Zalewska, 22nd Australasian Finance and Banking Conference 2009, August 2009, http://papers.ssrn.com/sol3/papers.cfm?abstract_id=1457482
20 Based on a world population of 7.5 billion people, per “Current World Population,” Worldometers, Accessed January 2017, http://www.worldometers.info/world-population
21 “Mining” refers to the computers that secure and record transactions submitted to Bitcoin’s network. In exchange for this service miners receive newly minted bitcoin.
22 “Bitcoin investing, simplified,” Lawnmower, Accessed January 2017, https://lawnmower.io
23 “The Bitcoin Investment Trust,” Grayscale, in which ARK Investment Management LLC invests. Accessed January 2017, http://grayscale.co
24 “Bitcoin Forwards,” TeraExchange, Accessed January 2017, http://www.teraexchange.com
25 “BitcoinETI,” Revoltura, Accessed January 2017, http://revoltura.com/introducing-bitcoineti
26 “Vontobel issues first bitcoin certificate on Swiss Exchange,” Vontobel, July 2016, https://www.vontobel.com/CH/EN/News/media-infor-mation-vontobel-issues-first-bitcoin-certificate-on-swiss-exchange

10 BITCOIN: RINGING THE BELL FOR A NEW ASSET CLASS ARK INVEST + COINBASE | CHRIS BURNISKE AND ADAM WHITE
POLITICO-ECONOMIC PROFILE
The politico-economic profile of an asset class is driven primarily by its basis of value, governance, and use cases. In each, bitcoin is distinct from the other major asset classes with gold providing a useful backdrop for comparison (Table 2).
| BASIS OF VALUE
Critics of bitcoin often point out that if it unravels, the platform offers no recourse to tangible goods, nor is any single legal entity accountable for its functioning. Instead, holding bitcoin represents a publicly verified claim on an open but limited resource that can facilitate transactions of all kinds. Bitcoin’s vast potential is what sustains its value currently. As more infrastructure is built around it, we think that demand will rise relative to its mathematically metered supply, increasing its price support. A purely digital and consensus-based asset may seem foreign, but it’s no surprise that such an asset was born in an increasingly digital and socially networked world.
| GOVERNANCE
While bitcoin’s basis of value is unique, its governance is arguably more of an anomaly. Bitcoin transactions are verified through a decentralized and open network of computers called “miners.” Furthermore, the code that miners run is open-source and subject to change by the community. Bitcoin supply is mathematically metered by this software and will converge to a fixed 21 million units by 2140 (Figure 7, 8).27 Its supply characteristics are in contrast to fiat currencies, which are governed by monetary policies that can lead to frequent supply shocks (Figure 9, 10). Meanwhile, the global gold supply has inflated steadily over the last hundred years (Figure 11, 12).
Compared to bitcoin, no asset has evolved from concept to billions of dollars in stored value so quickly. Moreover, no asset in history has followed such a predictable supply trajectory.
27 “Controlled Supply,” Bitcoin Wiki, Accessed January 2017, https://en.bitcoin.it/wiki/Controlled_supply
TABLE 2
| In contrast to other asset classes, gold has unique physical properties—malleability, density, divisibility—that have made it suitable as a unit of account throughout history.
| Gold is scarce, unlike equities, bonds, real estate, currencies, and to some degree, oil.
| Gold retains value even in the absence of an underlying legal structure, in contrast to equities, bonds, and real estate.
BASIS OF VALUE
| Gold’s use cases are diverse, which is highlighted in the context of Greer’s three asset superclasses: capital assets, consumable/transformable assets, and store of value assets. Most traditional asset classes are nested under only one of Greer’s superclasses. Gold, on the other hand, falls under both the store of value superclass (e.g., gold bars), and consumable/transformable asset class (e.g., gold circuitry in electronics).
USE CASES
| Gold’s supply is governed by economic factors affecting the mining community.
| In contrast to other asset classes, little regulatory governance affects the provisioning of gold. At times, however, nation-states have played a heavy-handed role, even outlawing private ownership.
GOVERNANCE
GOLD: POLITICO-ECONOMIC PROFILE

11 BITCOIN: RINGING THE BELL FOR A NEW ASSET CLASS ARK INVEST + COINBASE | CHRIS BURNISKE AND ADAM WHITE
DEFAULT for axis and labels:Tw Cen MT, Regular, 7-8ptAxis Color = RGB 90,90,90
0%
2%
4%
6%
8%
10%
12%
2012
-201
6
2016
-202
0
2020
-202
4
2024
-202
8
2028
-203
2
2032
-203
6
2036
-204
0
2040
-204
4 0
5,000,000
10,000,000
15,000,000
20,000,000
2008
2016
2024
2032
2040
2048
2056
2064
2072
2080
Num
ber
of B
itcoi
n
FIGURE 7 Bitcoin Average Annual Rate of Supply Increase
FIGURE 8 Bitcoin Outstanding
Source: ARK Investment Management LLC & Coinbase, data sourced from Bitcoin Wiki
DEFAULT for axis and labels:Tw Cen MT, Regular, 7-8ptAxis Color = RGB 90,90,90
0%10%20%30%40%50%60%70%80%90%
Rate
of
Supp
ly In
crea
se
$0$500
$1,000$1,500$2,000$2,500$3,000$3,500$4,000$4,500
USD
(Bi
llion
s)
-10% 0%
20%
40%
60%
80%
100%
1986
1988
1990
1992
1994
1996
1998
2000
2002
2004
2006
2008
2010
2012
2014
2016
$0
$1,000
$2,000
$3,000
$4,000
$5,000
Dec
-84
Dec
-86
Dec
-88
Dec
-90
Dec
-92
Dec
-94
Dec
-96
Dec
-98
Dec
-00
Dec
-02
Dec
-04
Dec
-06
Dec
-08
Dec
-10
Dec
-12
Dec
-14
Dec
-16
USD
(Bill
ions
)
FIGURE 9US Monetary Base Annual Rate of Supply Increase
FIGURE 10 US Monetary Base
Source: ARK Investment Management LLC & Coinbase, data sourced from Federal Reserve Bank of St. Louis
DEFAULT for axis and labels:Tw Cen MT, Regular, 7-8ptAxis Color = RGB 90,90,90
0.0%
0.5%
1.0%
1.5%
2.0%
2.5%
1880 1900 1920 1940 1960 1980 2000 2020
Rate
of
Supp
ly In
crea
se
-
50,000
100,000
150,000
200,000
1880 1900 1920 1940 1960 1980 2000 2020
Stoc
k A
bove
Gro
und
(Met
ric T
ons)
FIGURE 11 Gold Supply Annual Rate of Supply Increase
FIGURE 12 Gold Outstanding
Source: ARK Investment Management LLC, Number Sleuth ("All The World's Gold Facts")

12 BITCOIN: RINGING THE BELL FOR A NEW ASSET CLASS ARK INVEST + COINBASE | CHRIS BURNISKE AND ADAM WHITE
| USE CASES
Bitcoin’s obvious applications resemble those of fiat currencies and gold, while its potential lies outside the realm of any other asset class. For example, it could one day serve as a platform for auto-executing a myriad of contracts, enabling Bitcoin to act as a digital ledger for a host of assets from houses to loans to Internet-connected-devices.28
To illustrate bitcoin’s common use cases today, the ratio of its trading volume to transactional volume can be compared to that of fiat currencies. As discussed in the “Investability” section, in 2016 trading volume averaged more than $1.5 billion a day. Transactional volume also is growing rapidly—having topped as much as $0.5 billion in one day—29and is now consistently north of $200 million daily, as shown in Figure 13.30
DEFAULT for axis and labels:Tw Cen MT, Regular, 7-8ptAxis Color = RGB 90,90,90
Mill
ions
(USD
)
$-
$50
$100
$150
$200
$250
Jan-
13
Mar
-13
May
-13
Jul-1
3
Sep-
13
Nov
-13
Jan-
14
Mar
-14
May
-14
Jul-1
4
Sep-
14
Nov
-14
Jan-
15
Mar
-15
May
-15
Jul-1
5
Sep-
15
Nov
-15
Jan-
16
Mar
-16
May
-16
Jul-1
6
Sep-
16
Nov
-16
Jan-
17
FIGURE 13Daily Bitcoin Transactional Volume (Trailing Quarter Average)
Source: ARK Investment Management LLC & Coinbase, data sourced from Blockchain.info and CoinbaseNote: Daily average, based on a trailing quarter
28 “Smart Contracts on Bitcoin Blockchain,” BitFury, April 2015, http://bitfury.com/white-papers-research/page:2
29 On March 7th, 2014 it reached as high as $578M, per Blockchain.info
30 A point of confusion for many is that there are on-blockchain (on-chain) transactions verified directly by the mining network, and off-block-chain (off-chain) transactions that occur within hosted bitcoin wallet services like Coinbase. An off-chain transaction can be thought of as an “intra-net” transaction, that in this case Coinbase facilitates within its platform, as opposed to the on-blockchain “inter-net” of Bitcoin’s network. Over the last year Coinbase’s off-chain transaction volume has averaged 5% that of Bitcoin’s on-chain volume, implying at a minimum that daily blockchain transaction volume should be multiplied by 1.05. A multiplier of 1.05 was incorporated in Figure 13 be-ginning in November 2013, as that was when Coinbase reached significant enough scale to warrant the adjustment. ARK and Coinbase believe it produces a better combined picture of worldwide on-chain and off-chain volume, which henceforth will be referred to simply as transactional volume.

13 BITCOIN: RINGING THE BELL FOR A NEW ASSET CLASS ARK INVEST + COINBASE | CHRIS BURNISKE AND ADAM WHITE
The bitcoin price rallies of late 2013 and 2015 obfuscate the longer term trend in Figure 13. When averaged over a year, the daily transactional volume illustrates the traction bitcoin is gathering. For instance, transactional volume grew 60%, 15%, and 118% year-over-year in 2014, 2015, and 2016, respectively, demonstrating real underlying demand for bitcoin as a means of exchange (Figure 14).
DEFAULT for axis and labels:Tw Cen MT, Regular, 7-8ptAxis Color = RGB 90,90,90
Mill
ions
(USD
)
$0
$50
$100
$150
$200
2011 2012 2013 2014 2015 2016
FIGURE 14Daily Bitcoin Transactional Volume (Annual Average)
Source: ARK Investment Management LLC & Coinbase, data sourced from Blockchain.info & CoinbaseNote: Average daily transactional volume calculated for each year
A comparison of bitcoin’s global trading volume to its transactional volume highlights that the use of bitcoin as an investment medium is increasing faster than its transactional applications. Despite day-to-day fluctuations, the significant shift towards trading volume became clear in late 2015, as shown in Figure 15.
DEFAULT for axis and labels:Tw Cen MT, Regular, 7-8ptAxis Color = RGB 90,90,90
0
1
10
100 Daily Ratio One Year Rolling Average Ratio
Dec-1
2
Mar-1
3
Jun-1
3
Sep-
13
Dec-1
3
Mar-1
4
Jun-1
4
Sep-
14
Dec-1
4
Mar-1
5
Jun-1
5
Sep-
15
Dec-1
5
Mar-1
6
Jun-1
6
Sep-
16
Dec-1
6
FIGURE 15Global Daily Bitcoin Volumes: Trading Relative to Transacting
Source: ARK Investment Management LLC & Coinbase, data sourced from Bitcoinity, Blockchain.info, Coinbase & CoinDesk BPINote: Log scale.

14 BITCOIN: RINGING THE BELL FOR A NEW ASSET CLASS ARK INVEST + COINBASE | CHRIS BURNISKE AND ADAM WHITE
Although many find bitcoin’s use as a speculative instrument alarming, when compared to fiat currencies,31 bitcoin strikes a closer balance between trading and transacting, as shown below. This means that when people use bitcoin—as opposed to fiat currency—they are more likely to use it to transmit value for goods and services than as a speculative instrument. As previously mentioned, bitcoin’s trading volume is increasing at a faster rate than its transactional volume, as can be seen in the jump of the ratio from 2014 to 2016 (Figure 16).32 While concerning to some, ARK and Coinbase see bitcoin’s increased trading volume as a healthy step towards increasing liquidity and decreasing volatility, which may help to further catalyze transactional volume.
DEFAULT for axis and labels:Tw Cen MT, Regular, 7-8ptAxis Color = RGB 90,90,90
0
10
20
30
Bitcoin Global Fiat Currency
2014 2016
FIGURE 16Trading Relative to Transacting
Source: ARK Investment Management LLC & Coinbase, data sourced from Bitcoinity, Blockchain.info, Coinbase, CoinDesk BPI, Finance Magnates, IMF, Reuters & World Bank | Note: Global Fiat Currency ratios derived by dividing Global FX Volumes by Global GDP
While the prior two graphs provide perspective, this data does suffer from the self-reporting shortcoming referenced in the “Investability” section. Limiting the analysis to trading in the more regulated US dollar,
31 Fiat currency refers to a currency that has been backed by a nation-state as legal tender, but has no underlying anchor of value.
32 Additionally, the ramifications of stringent regulations can be seen in the drop of FX trading volumes for fiat currencies thus far in 2016.
DEFAULT for axis and labels:Tw Cen MT, Regular, 7-8ptAxis Color = RGB 90,90,90
0.0 0.2 0.4 0.6 0.8 1.0 1.2 1.4 1.6
Dec-1
2
Mar-1
3
Jun-1
3
Sep-
13
Dec-1
3
Mar-1
4
Jun-1
4
Sep-
14
Dec-1
4
Mar-1
5
Jun-1
5
Sep-
15
Dec-1
5
Mar-1
6
Jun-1
6
Sep-
16
Dec-1
6
Daily Ratio One Year Rolling Average Ratio
FIGURE 17
Global Daily Bitcoin Volumes Trading (USD, EUR, GBP) Relative to Transacting
Global Daily Bitcoin Volumes: Trading (USD, EUR, GBP) Relative to Transacting
Source: ARK Investment Management LLC & Coinbase, data sourced from Bitcoinity, Blockchain.info, Coinbase & CoinDesk BPI

15 BITCOIN: RINGING THE BELL FOR A NEW ASSET CLASS ARK INVEST + COINBASE | CHRIS BURNISKE AND ADAM WHITE
euro, and British pound, the ratio looks quite different, as shown in Figure 17. Although trading relative to transacting varies day-to-day, the trend has been stable over time. Roughly half as much trading volume, relative to global transactional volume, goes through these three currency pairs. The stable ratio implies that bitcoin trading in the more regulated currencies has been growing at roughly the same rate as worldwide bitcoin transactional volumes, a trend we find intriguing.
The number of people using bitcoin to transact likely will grow as its more innovative use cases evolve. These use cases may harness the power of Bitcoin’s blockchain more abstractly, facilitating the transfer of real estate, bonds, and autos, decentralized venture funding, or votes in an election via smart contracts. These applications clearly separate bitcoin from all other asset classes.
CORRELATION OF RETURNS: PRICE INDEPENDENCE
Given its unique politico-economic characteristics, bitcoin’s price should behave differently relative to other assets as it is pushed and pulled by distinct market forces. Market behavior can be quantified by correlation, a standardized measure of how assets move together, ranging from +1 to -1.33 If two assets are correlated perfectly at “+1,” then when one is up 5%, the other is up 5% as well. If they are negatively correlated at “-1,” then when one is up 5%, the other will be down 5%. In “A Random Walk Down Wall Street,” Burton Malkiel, a Professor of Economics at Princeton University, offers a simple illustration of correlation coefficients in the context of a portfolio of assets (Table 3).
As shown in Table 3, the more negatively correlated assets are, the more diversification they will provide in an overall portfolio, lowering overall risk. A strong negative correlation still implies a tight relationship, albeit inverse. For example, going long and short on the same equity should have a correlation of -1, suggesting gains will be offset by losses of equivalent magnitude. Consequently, assets that are close to zero in their correlation are not tethered in their market behavior, which we think is key to bitcoin’s classification as a new and distinct asset class.
ARK and Coinbase calculated the one year rolling correlations among the various standard assets over the last five years, yielding 21 combinations (Table 4). While assets may be uncorrelated when “times are good,” when “times are bad” they often move in tandem, converging on correlations of +1 or -1. To create the table below, we extracted the maximum “absolute value” correlation associated with each asset pair. After identifying the number, we included the correct sign.
33 “Correlation,” Investopedia, Accessed January 2017, http://www.investopedia.com/terms/c/correlation.asp
DEFAULT for axis and labels:Tw Cen MT, Regular, 7-8ptAxis Color = RGB 90,90,90
NO RISK REDUCTION IS POSSIBLE
MODERATE RISK REDUCTION IS POSSIBLE
CONSIDERABLE RISK REDUCTION IS POSSIBLE
MOST RISK CAN BE ELIMINATED
ALL RISK CAN BE ELIMINATED
CORRELATION COEFFICIENT EFFECTS OF DIVERSIFICATION ON RISK
+1.0
+0.5
0
-0.5
-1.0
TABLE 3The Correlation Coefficient and the Ability of Diversification to Reduce Risk
Source: A Random Walk Down Wall Street, Burton G. Malkiel, 2015

16 BITCOIN: RINGING THE BELL FOR A NEW ASSET CLASS ARK INVEST + COINBASE | CHRIS BURNISKE AND ADAM WHITE
Strikingly, bitcoin’s price movements have been separate and distinct from those of other asset classes during the last six years. Bitcoin is the only asset that maintains consistently low correlations with every other asset. Remarkably, the maximum correlation, positive or negative, that bitcoin exhibited with each of the other assets is near the minimum correlation, positive or negative, that any of the other paired assets displayed with each other (Table 4).
As shown in the following four figures, rolling one year correlations further demonstrate bitcoin’s independent behavior within the capital markets. We start this comparison with fiat currencies because bitcoin’s primary use cases have been a means of exchange and store of value. In an investing context, however, for bitcoin to fall into the fiat currency asset class, it should behave similarly to other fiat currencies in the marketplace. Given bitcoin’s nascent nature, one would expect it to behave most similarly to the emerging market currencies. To explore this possibility, we compared bitcoin’s returns with the MSCI Global Currency Index, a broad representation of emerging market currencies (Figure 18).
DEFAULT for axis and labels:Tw Cen MT, Regular, 7-8ptAxis Color = RGB 90,90,90
S&P 500 US Bonds Bitcoin Gold US Real Estate Oil Emerging Market CurrenciesS&P 500 -0.67 0.35 0.48 0.87 0.73 0.83US Bonds -0.67 0.28 0.53 0.59 -0.52 0.57Bitcoin 0.35 0.28 -0.51 -0.39 -0.37 0.27Gold 0.48 0.53 -0.51 0.45 0.52 0.62US Real Estate 0.87 0.59 -0.39 0.45 0.63 0.74Oil 0.73 -0.52 -0.37 0.52 0.63 0.63Emerging Market Currencies 0.83 0.57 0.27 0.62 0.74 0.63
Low correlation (-0.4 to 0.4) in green, Mid correlation (absolute value 0.4 to 0.666) in white, High correlation (absolute value > 0.666) in redNumbers in the table were chosen based on the maximum "absolute value" one-year rolling correlation that paired assets displayed since 2011
TABLE 4Correlation Table
Source: ARK Investment Management LLC & Coinbase, data sourced from Bloomberg & CoinDesk BPI
DEFAULT for axis and labels:Tw Cen MT, Regular, 7-8ptAxis Color = RGB 90,90,90
-0.4
-0.2
0
0.2
0.4
Dec-1
1
Mar-1
2
Jun-1
2
Sep-
12
Dec-1
2
Mar-1
3
Jun-1
3
Sep-
13
Dec-1
3
Mar-1
4
Jun-1
4
Sep-
14
Dec-1
4
Mar-1
5
Jun-1
5
Sep-
15
Dec-1
5
Mar-1
6
Jun-1
6
Sep-
16
FIGURE 18
Global Daily Bitcoin Volumes Trading (USD, EUR, GBP) Relative to Transacting
One Year Rolling Correlation: Bitcoin and Emerging Market Currencies
Source: ARK Investment Management LLC & Coinbase, data sourced from Bloomberg & CoinDesk BPINote: Data as of December 30, 2016. The correlation between the two assets over the previous year was calculated on each day represented. When strung together these correlations create a graph showing the one year rolling correlation.

17 BITCOIN: RINGING THE BELL FOR A NEW ASSET CLASS ARK INVEST + COINBASE | CHRIS BURNISKE AND ADAM WHITE
Since December 2011, on average bitcoin has experienced a one year rolling correlation of -0.05 with emerging market currencies, never reaching higher than 0.27 (Figure 18). When compared to the 0.7 average correlation that US Stocks have maintained with both international stocks and emerging market stocks from 1988 to 201134—a good indicator of how assets in the same class should behave—clearly bitcoin and fiat currencies do not belong in the same bucket. As David Yermack from the National Bureau of Economic Research asserted in 2013, “Bitcoin’s value is almost completely untethered to that of other currencies… Macroeconomic events that cause similar impacts on the value of various currencies do not seem to affect [bitcoin] either positively or negatively.”35 If anything, in 2016 bitcoin has behaved contrary to other currencies that are affected by macroeconomic dislocations.36
Next, we investigate bitcoin’s performance relative to gold. People typically hold gold as a “safe” investment because its underlying value is not necessarily tied to economic conditions. In this vein, bitcoin has often been compared to digital gold.37 If bitcoin were highly correlated with gold, it might indicate that both assets were being used as similar “risk-off” investments, suggesting that bitcoin could be included in the precious metals asset class.
Surprisingly, bitcoin’s correlation with gold slipped into sustained negative territory beginning in 2015 (Figure 19). Where once bitcoin and gold had a low positive correlation, for most of 2015 and 2016 they displayed moderate negative correlation. Investors may have learned gold is not the safe haven once believed, as vehicles like the SPDR Gold Shares ETF lost more than 40% of their value from 2011 peaks to 2015 troughs.
DEFAULT for axis and labels:Tw Cen MT, Regular, 7-8ptAxis Color = RGB 90,90,90
-0.5
-0.3
-0.1
0.1
0.3
0.5
Dec-1
1
Mar-1
2
Jun-1
2
Sep-
12
Dec-1
2
Mar-1
3
Jun-1
3
Sep-
13
Dec-1
3
Mar-1
4
Jun-1
4
Sep-
14
Dec-1
4
Mar-1
5
Jun-1
5
Sep-
15
Dec-1
5
Mar-1
6
Jun-1
6
Sep-
16
FIGURE 19
Global Daily Bitcoin Volumes Trading (USD, EUR, GBP) Relative to Transacting
One Year Rolling Correlation: Bitcoin and Gold
Source: ARK Investment Management LLC & Coinbase, data sourced from Bloomberg & CoinDesk BPINote: Data as of December 30, 2016. The correlation between the two assets over the previous year was calculated on each day represented. When strung together these correlations create a graph showing the one year rolling correlation.
The negative correlation shown in 2015 and 2016 may suggest that some financial markets participants exchanged gold for bitcoin at the margin. Indeed, in 2013 when bitcoin made its first run into the $1000’s, there were net outflows from gold ETFs and similar investment products.38 Assets under management (AUM) for the two largest gold ETF’s, the SPDR Gold Shares ETF (GLD) and iShares Gold Trust (IAU),
34 “Dynamic Correlations: The implications for portfolio construction,” Vanguard, April 2012, http://www.vanguard.com/pdf/s130.pdf
35 “Is Bitcoin a Real Currency?” David Yermack, December 2013, National Bureau of Economic Research.
36 “Markets Using Bitcoin as a Disaster Hedge,” CNBC, June 2016, http://video.cnbc.com/gallery/?video=3000529359&play=1
37 “Digital Gold,” Nathaniel Popper, May 2015, HarperCollins.
38 “Interactive Gold Market Charting,” World Gold Council, Accessed January 2017, http://www.gold.org/supply-and-demand/interac-tive-gold-market-charting
18 BITCOIN: RINGING THE BELL FOR A NEW ASSET CLASS ARK INVEST + COINBASE | CHRIS BURNISKE AND ADAM WHITE
dropped from $73.5 billion and $11.9 billion at the start of 2013, to $30 billion and $6.2 billion by the end of 2013, respectively. The price of gold only fell 25% in that year, so it’s safe to assume that a large chunk of this AUM drop can be attributed to outflows. Meanwhile, in 2013, bitcoin started at a market capitalization of $143 million and ended at $8.9 billion. In other words, while GLD and IAU’s AUM were halved in 2013, bitcoin’s AUM grew sixty fold.39
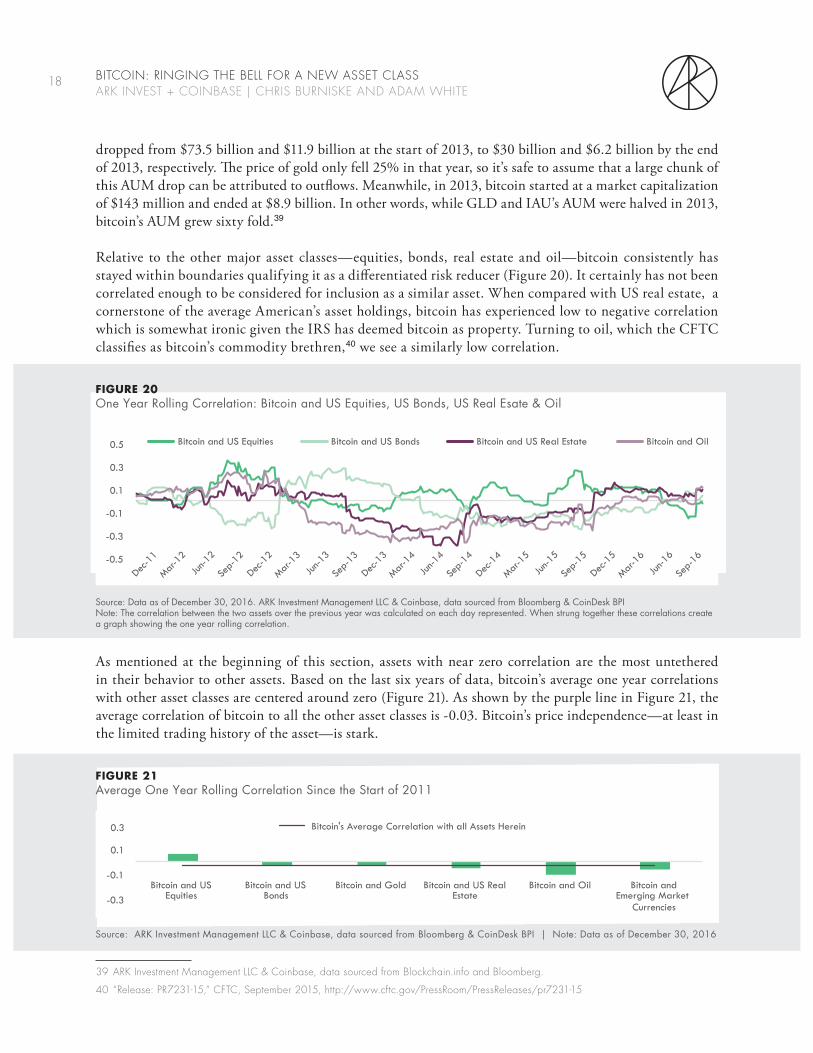
Relative to the other major asset classes—equities, bonds, real estate and oil—bitcoin consistently has stayed within boundaries qualifying it as a differentiated risk reducer (Figure 20). It certainly has not been correlated enough to be considered for inclusion as a similar asset. When compared with US real estate, a cornerstone of the average American’s asset holdings, bitcoin has experienced low to negative correlation which is somewhat ironic given the IRS has deemed bitcoin as property. Turning to oil, which the CFTC classifies as bitcoin’s commodity brethren,40 we see a similarly low correlation.
As mentioned at the beginning of this section, assets with near zero correlation are the most untethered in their behavior to other assets. Based on the last six years of data, bitcoin’s average one year correlations with other asset classes are centered around zero (Figure 21). As shown by the purple line in Figure 21, the average correlation of bitcoin to all the other asset classes is -0.03. Bitcoin’s price independence—at least in the limited trading history of the asset—is stark.
39 ARK Investment Management LLC & Coinbase, data sourced from Blockchain.info and Bloomberg.
40 “Release: PR7231-15,” CFTC, September 2015, http://www.cftc.gov/PressRoom/PressReleases/pr7231-15
DEFAULT for axis and labels:Tw Cen MT, Regular, 7-8ptAxis Color = RGB 90,90,90
-0.5
-0.3
-0.1
0.1
0.3
0.5 Bitcoin and US Equities Bitcoin and US Bonds Bitcoin and US Real Estate Bitcoin and Oil
Dec-1
1
Mar-1
2
Jun-1
2
Sep-
12
Dec-1
2
Mar-1
3
Jun-1
3
Sep-
13
Dec-1
3
Mar-1
4
Jun-1
4
Sep-
14
Dec-1
4
Mar-1
5
Jun-1
5
Sep-
15
Dec-1
5
Mar-1
6
Jun-1
6
Sep-
16
FIGURE 20
Global Daily Bitcoin Volumes Trading (USD, EUR, GBP) Relative to Transacting
One Year Rolling Correlation: Bitcoin and US Equities, US Bonds, US Real Esate & Oil
Source: Data as of December 30, 2016. ARK Investment Management LLC & Coinbase, data sourced from Bloomberg & CoinDesk BPI Note: The correlation between the two assets over the previous year was calculated on each day represented. When strung together these correlations create a graph showing the one year rolling correlation.
DEFAULT for axis and labels:Tw Cen MT, Regular, 7-8ptAxis Color = RGB 90,90,90
-0.3
-0.1
0.1
0.3
Bitcoin and US Equities
Bitcoin and US Bonds
Bitcoin and Gold Bitcoin and US Real Estate
Bitcoin and Oil Bitcoin and Emerging Market
Currencies
Bitcoin's Average Correlation with all Assets Herein
FIGURE 21Average One Year Rolling Correlation Since the Start of 2011
Source: ARK Investment Management LLC & Coinbase, data sourced from Bloomberg & CoinDesk BPI | Note: Data as of December 30, 2016

19 BITCOIN: RINGING THE BELL FOR A NEW ASSET CLASS ARK INVEST + COINBASE | CHRIS BURNISKE AND ADAM WHITE
RISK-REWARD PROFILES
Risk-reward profiles are exactly as they sound: a comparison of risk in the form of volatility, and reward in the form of absolute returns. When compared, these values produce the Sharpe Ratio, a measure of returns per unit of risk taken. Our analysis of volatility, absolute returns, and the Sharpe Ratio41 span six years.
VOLATILITY
Bitcoin’s volatility is clear in its daily percent price changes. For example, if bitcoin ended Monday at $100, and ended Tuesday at $140, then its daily percent change was 40%. With daily price changes as high as 50%, bitcoin has been volatile for much of the last six years, as shown in Figure 22. In contrast, on any given day, stocks and bonds rarely fluctuate by 50% in the absence of a severe financial crisis.
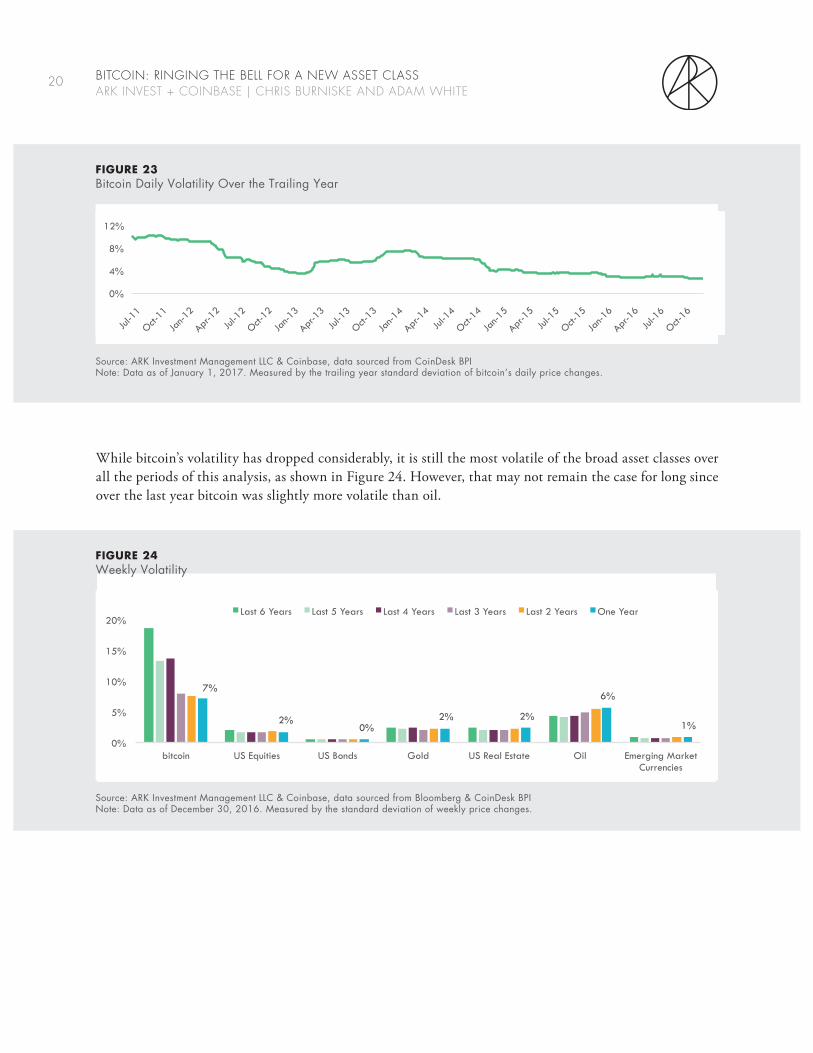
While daily percent change is a useful metric, investors most often measure volatility via the standard deviation of those changes. While bitcoin still experiences large price swings, the magnitude of those swings has diminished resulting in decreased volatility. As of January 1, 2017, bitcoin’s daily volatility was about one-fifth that of five years ago, and 28% less than January 1, 2016 (Figure 23). Bitcoin’s decreasing volatility in the face of 2016 price appreciation is particularly notable. In April 2016, lower volatility triggered headlines as investors began to realize bitcoin had been more stable than gold over the short period of one month.42 The decline in bitcoin’s volatility has been caused by a number of factors: more stable and liquid spot exchanges, greater regulatory clarity, broader ownership, and increasingly reliable price discovery data.
41 Using methods outlined here, “Standard Deviation and Sharpe Ratio,” Morningstar, January 2005, http://corporate.morningstar.com/US/documents/MethodologyDocuments/MethodologyPapers/StandardDeviationSharpeRatio_Definition.pdf
42 “Is Bitcoin Becoming More Stable Than Gold?” Stephanie Yang, April 2016, http://blogs.wsj.com/moneybeat/2016/04/19/is-bitcoin-becoming-more-stable-than-gold
DEFAULT for axis and labels:Tw Cen MT, Regular, 7-8ptAxis Color = RGB 90,90,90
-60%
-40%
-20%
0%
20%
40%
60%
Apr-1
1
Jul-1
1
Oct-11
Jan-1
2
Apr-1
2
Jul-1
2
Oct-12
Jan-1
3
Apr-1
3
Jul-1
3
Oct-13
Jan-1
4
Apr-1
4
Jul-1
4
Oct-14
Jan-1
5
Apr-1
5
Jul-1
5
Oct-15
Jan-1
6
Apr-1
6
Jul-1
6
Oct-16
FIGURE 22Bitcoin Daily Price Change
Source: Source: ARK Investment Management LLC & Coinbase, data sourced from CoinDesk BPI | Note: Data as of January 1, 2017
20 BITCOIN: RINGING THE BELL FOR A NEW ASSET CLASS ARK INVEST + COINBASE | CHRIS BURNISKE AND ADAM WHITE
While bitcoin’s volatility has dropped considerably, it is still the most volatile of the broad asset classes over all the periods of this analysis, as shown in Figure 24. However, that may not remain the case for long since over the last year bitcoin was slightly more volatile than oil.
DEFAULT for axis and labels:Tw Cen MT, Regular, 7-8ptAxis Color = RGB 90,90,90
7%
2% 0%
2% 2%
6%
1%
0%
5%
10%
15%
20%
bitcoin US Equities US Bonds Gold US Real Estate Oil Emerging Market Currencies
Last 6 Years Last 5 Years Last 4 Years Last 3 Years Last 2 Years One Year
FIGURE 24Weekly Volatility
Source: ARK Investment Management LLC & Coinbase, data sourced from Bloomberg & CoinDesk BPINote: Data as of December 30, 2016. Measured by the standard deviation of weekly price changes.
DEFAULT for axis and labels:Tw Cen MT, Regular, 7-8ptAxis Color = RGB 90,90,90
0%
4%
8%
12%
Jul-1
1
Oct-11
Jan-1
2
Apr-1
2
Jul-1
2
Oct-12
Jan-1
3
Apr-1
3
Jul-1
3
Oct-13
Jan-1
4
Apr-1
4
Jul-1
4
Oct-14
Jan-1
5
Apr-1
5
Jul-1
5
Oct-15
Jan-1
6
Apr-1
6
Jul-1
6
Oct-16
FIGURE 23Bitcoin Daily Volatility Over the Trailing Year
Source: ARK Investment Management LLC & Coinbase, data sourced from CoinDesk BPINote: Data as of January 1, 2017. Measured by the trailing year standard deviation of bitcoin’s daily price changes.

21 BITCOIN: RINGING THE BELL FOR A NEW ASSET CLASS ARK INVEST + COINBASE | CHRIS BURNISKE AND ADAM WHITE
ABSOLUTE RETURNS
For the balance of its short life, bitcoin has provided investors with stellar absolute returns, above and beyond that of any other asset class. As shown in Figure 25, only over the “Last 3 Years” have the compound annual returns been in the single digits.
DEFAULT for axis and labels:Tw Cen MT, Regular, 7-8ptAxis Color = RGB 90,90,90
286%
185% 194%
9% 78%
129%
0%
100%
200%
300%
400%
Last 6 Years Last 5 Years Last 4 Years Last 3 Years Last 2 Years One Year
FIGURE 25Bitcoin: Compound Annual Returns
Source: ARK Investment Management LLC & Coinbase, data sourced from CoinDesk BPINote: Data as of January 1, 2017
Turning now to comparisons with the other major asset classes, if one had invested $10,000 in bitcoin five years ago, it would now be worth nearly $2.3 million and have outperformed the other broad asset classes by 114 to 416 fold, as shown in Figure 26.
If one had made a $10,000 investment three years ago—in the midst of bitcoin’s decline from its November 2013 price spike—it would have taken two and a half years to break even. Breaking even would have first required an investor to endure a greater than 70% loss in value. As shown in Figure 27, however, the second half of 2016 has taken bitcoin from being the second worst-performing asset to nearly tied with US equities for second best, during the referenced 3 year period.
DEFAULT for axis and labels:Tw Cen MT, Regular, 7-8ptAxis Color = RGB 90,90,90
$1,000
$10,000
$100,000
$1,000,000
$10,000,000
Dec-1
1
Mar-1
2
Jun-1
2
Sep-
12
Dec-1
2
Mar-1
3
Jun-1
3
Sep-
13
Dec-1
3
Mar-1
4
Jun-1
4
Sep-
14
Dec-1
4
Mar-1
5
Jun-1
5
Sep-
15
Dec-1
5
Mar-1
6
Jun-1
6
Sep-
16
bitcoin US Equities US Bonds Gold US Real Estate Oil Emerging Market Currencies
FIGURE 26Growth of Assumed $10,000 Investment from December 2011 to December 2016
Source: ARK Investment Management LLC & Coinbase, data sourced from Bloomberg & CoinDesk BPINote: Data as of December 30, 2016. Log-scale. Past performance does not guarantee future results. The performance data quoted represents past performance and current returns may be lower or higher.

22 BITCOIN: RINGING THE BELL FOR A NEW ASSET CLASS ARK INVEST + COINBASE | CHRIS BURNISKE AND ADAM WHITE
Bitcoin’s fall from its November 2013 peak was prolonged and painful, finally hitting a bottom on January 14, 2015 at $177. During that time, some in the media pronounced bitcoin dead—a claim now made over 100 times.43 From its bottom, bitcoin entered a relatively stable trading range between $200 and $300 for the first three quarters of 2015.44
Then, in late October and early November 2015, bitcoin’s price spiked 55% in 84 hours.45 While it’s possible to identify the broad cause—an increase in demand—isolating a singular reason for the increased demand is not possible. We do know that China experienced high trading volumes, causing a 5-10% premium in bitcoin prices on Chinese exchanges compared to US exchanges. GDAX observed that global algorithmic traders then boosted their trading volumes to exploit the arbitrage opportunity. The spike also likely had roots in Europe’s VAT tax ruling, which put bitcoin on par with traditional currencies for tax purposes. As a result of this significant regulatory ruling, and increasing interest among financial institutions, in late 2015 Coinbase’s daily new user sign-ups were 70% higher than average in many geographies.46
Unlike bitcoin’s price surge in November 2013, its ascent and descent in late 2015 proved to be more moderate, and it stabilized in a $350 to $450 trading range for the first four months of 2016. Towards the end of May 2016, bitcoin began to ascend again, and similar moves continued through 2016, taking bitcoin through the $1,000 mark on January 1, 2017. In 2016, much of the interest in bitcoin has been driven by macroeconomic forces, most notably devaluation of the Chinese yuan.47 Other notable drivers of interest
43 “Bitcoin Obituaries,” 99 Bitcoins, Accessed January 2017, https://99bitcoins.com/obituary-stats
44 CoinDesk BPI data.
45 “Bitcoin’s Big Week In The Rearview Mirror,” Samantha Sharf, November 2015, http://www.forbes.com/sites/samantha-sharf/2015/11/13/bitcoins-big-week-in-the-rearview-mirror/#7a85e0053599
46 Coinbase data.
47 “Why bitcoin just had an amazing year,” Washington Post, January 2017, https://www.washingtonpost.com/news/wonk/wp/2017/01/03/why-bitcoin-just-had-an-amazing-year/
DEFAULT for axis and labels:Tw Cen MT, Regular, 7-8ptAxis Color = RGB 90,90,90
$- $2,000 $4,000 $6,000 $8,000
$10,000 $12,000 $14,000 $16,000 $18,000
Dec-13 Mar-14 Jun-14 Sep-14 Dec-14 Mar-15 Jun-15 Sep-15 Dec-15 Mar-16 Jun-16 Sep-16 Dec-16
bitcoin US Equities US Bonds Gold US Real Estate Oil Emerging Market Currencies
FIGURE 27Growth of Assumed $10,000 Investment from December 2013 to December 2016
Source: ARK Investment Management LLC & Coinbase, data sourced from Bloomberg & CoinDesk BPINote: Data as of December 30, 2016. Past performance does not guarantee future results. The performance data quoted represents past performance and current returns may be lower or higher.

23 BITCOIN: RINGING THE BELL FOR A NEW ASSET CLASS ARK INVEST + COINBASE | CHRIS BURNISKE AND ADAM WHITE
in bitcoin included Brexit,48 India’s banknote ban,49 Venezuela’s hyperinflation,50 and Trump’s surprise election.51 As a result, if one were to have put $10,000 dollars into bitcoin one year ago, it would have been the best performing of the broad asset classes (Figure 28).
As modern portfolio theory suggests, neither absolute return nor volatility is a sufficient indicators of a good investment. Instead, one must adjust absolute returns for the amount of volatility, or risk, to calculate risk adjusted returns. The most common measure of risk adjusted returns is the Sharpe Ratio, which measures
48 “Bitcoin gains validity as digital gold after Brexit vote,” CNBC, June 2016, http://www.cnbc.com/2016/06/27/bitcoin-gains-validi-ty-as-digital-gold-after-brexit-vote.html
49 “Bitcoin Activity in India Has Doubled Since the Banknote Ban,” Engadget, December 2016, http://www.cnbc.com/2016/06/27/bit-coin-gains-validity-as-digital-gold-after-brexit-vote.html
50 “Venezuelans are turning to bitcoin as the bolívar crumbles,” Quartz, November 2016, http://www.cnbc.com/2016/06/27/bit-coin-gains-validity-as-digital-gold-after-brexit-vote.html
51 “U.S. Election Sends Bitcoin Surging,” Bloomberg, November 2016, http://www.cnbc.com/2016/06/27/bitcoin-gains-validity-as-digi-tal-gold-after-brexit-vote.html
DEFAULT for axis and labels:Tw Cen MT, Regular, 7-8ptAxis Color = RGB 90,90,90
$-
$5,000
$10,000
$15,000
$20,000
$25,000
Dec-15 Jan-16 Feb-16 Mar-16 Apr-16 May-16 Jun-16 Jul-16 Aug-16 Sep-16 Oct-16 Nov-16 Dec-16
bitcoin US Equities US Bonds Gold US Real Estate Oil Emerging Market Currencies
FIGURE 28Growth of Assumed $10,000 Investment from December 2015 to December 2016
Source: ARK Investment Management LLC & Coinbase, data sourced from Bloomberg & CoinDesk BPINote: Data as of December 30, 2016. Past performance does not guarantee future results. The performance data quoted represents past performance and current returns may be lower or higher.
DEFAULT for axis and labels:Tw Cen MT, Regular, 7-8ptAxis Color = RGB 90,90,90
-1.0
0.0
1.0
2.0
bitcoin US Equities US Bonds Gold US Real Estate Oil Emerging Market Currencies
Last 6 Years Last 5 Years Last 4 Years Last 3 Years Last 2 Years One Year
FIGURE 29Sharpe Ratio
Source: ARK Investment Management LLC & Coinbase, data sourced from Bloomberg & CoinDesk BPINote: Data as of December 30, 2016

24 BITCOIN: RINGING THE BELL FOR A NEW ASSET CLASS ARK INVEST + COINBASE | CHRIS BURNISKE AND ADAM WHITE
returns above the risk free rate divided by the volatility of the asset.52 Assets can be compared to one another because each unit of return is standardized per unit of risk. Assets with the highest Sharpe Ratio best compensate investors for the risk they are taking.
Although bitcoin has been extremely volatile historically, when its returns are adjusted to account for volatility, its Sharpe Ratios have been superior (Figure 29). US equities, US bonds and US real estate did deliver better Sharpe Ratios over the 3 year period, but bitcoin has outperformed for every other period. Over the last year it has compensated investors nearly twice as much as US equities relative to the risk taken, as defined by the Sharpe Ratio. When compared to what the CFTC would call its commodity counterparts, bitcoin has outperformed gold and oil on a risk adjusted basis in all six periods of our analysis.
CONCLUSION
Bitcoin exhibits characteristics of a unique asset class—meeting the bar of investability, and differing substantially from other assets in terms of its politico-economic profile, price independence, and risk-reward characteristics. Because our analysis encompasses only six years, it will be important for the community to continue to monitor its behavior in the context of the broader markets.
As Bitcoin’s open-source software evolves, bitcoin will differentiate itself further from other asset classes. Recent innovations like segregated witness53 promise to catalyze bitcoin’s more innovative use cases. Smart contracts and sidechains, for example, could enable entirely new financial services like liquid private markets and truly peer-to-peer loan issuance.
ARK and Coinbase believe bitcoin is the first of its kind in what is rapidly becoming a distinct asset class. Since cryptocurrencies are subject to the strong network effects of users and developers, they may submit to a “winner takes most” model unlike bonds and equities. The cryptocurrencies that successfully foster the flywheel of user and developer engagement could grow to formidable market capitalizations. In a world where the trend is clearly offline to online, why should financial assets be excused from the transformation?
52 In other words, excess returns divided by total risk. The risk free rate used to derive excess returns is the three month US Treasury Bill.
53 “Segregated Witness Benefits,” Bitcoin Core, Accessed January 2017, https://bitcoincore.org/en/2016/01/26/segwit-benefits
©2017, ARK Investment Management LLC. All content is original and has been researched and produced by ARK Investment Management LLC (“ARK”) unless otherwise stated herein. No part of this content may be reproduced in any form, or referred to in any other publication, without the express written permission of ARK.
This material is for informational purposes only and does not constitute, either explicitly or implicitly, any provision of services or products by ARK. Nothing contained herein constitutes investment, legal, tax or other advice and is not to be relied on in making an investment or other decision. Investors should determine for themselves whether a particular service or product is suitable for their investment needs or should seek such professional advice for their particular situation.
All statements made herein are strictly beliefs and points of view held by ARK. Certain of the statements contained herein may be statements of future expectations and other forward-looking statements that are based on ARK’s current views and assumptions and involve known and unknown risks and uncertainties that could cause actual results, performance or events to differ materially from those expressed or implied in such statements. In addition to statements that are forward-looking by reason of context, the words “may, will, should, could, expects, plans, intends, anticipates, believes, estimates, predicts, potential, projected, or continue” and similar expressions identify forward-looking statements. ARK assumes no obligation to update any forward-looking information contained herein. Although ARK has taken reasonable care to ensure that the information contained herein is accurate, no representation or warranty (including liability towards third parties), expressed or implied, is made by ARK as to its accuracy, reliability or completeness.
Any reference to a particular company or security is not an endorsement by ARK of that company or security or a recommendation by ARK to buy, sell or hold such security. ARK and clients as well as its related persons may (but do not necessarily) have financial interests in securities or issuers referenced. Past performance does not guarantee future results. The performance data quoted represents past performance and current returns may be lower or higher.
Any descriptions of, references to, or links to other publications, sites, products or services do not constitute an endorsement, authorization, sponsorship by or affiliation with ARK with respect to any such publication, site, product or service or its sponsor, unless expressly stated by ARK. Any such publication, site, product or service have not necessarily been reviewed by ARK and are provided or maintained by third parties over whom ARK exercises no control. ARK expressly disclaims any responsibility for the content, the accuracy of the information, and/or quality of products or services provided by or advertised by these third-party publications or sites.
ARK Invest155 West 19th, 5th Floor New York, NY [email protected] www.ark-invest.com
JOIN THE CONVERSATION
@ARKblockchain@ARKinvest
@coinbase@GDAX
Coinbase, Inc.548 Market Street #54008San Francisco, CA [email protected]