birgit drager- tropinone reductases, enzymes at the branch point of tropane alkaloid metabolism
TRANSCRIPT

Phytochemistry Vol. 67, No. 4, 2006
Contents
REVIEW
Tropinone reductases, enzymes at the branch point of tropane alkaloid metabolism pp 327–337
Birgit Drager *
Two specific tropinone reductases produce tropine or pseudotropine. Enzymes were
isolated, characterised, cloned, and expressed from Solanaceae. Stereospecificity of
reduction is achieved by binding tropinone in the enzymes� active centres in opposite
orientation.
NH3C
O
TR IITR I
pseudotropinetropine
NH3C
OH
tropinone
N
OH
H3C
hyoscyamine, scopolamine calystegines
PROTEIN BIOCHEMISTRY
Characterization of a GDP-DD-mannose 300,500-epimerase from rice pp 338–346
Kentaroh Watanabe, Kiyoshi Suzuki, Shinichi Kitamura *
GDP-DD-mannose 30 0,50 0-epimerase (GME), a key enzyme in vitamin C biosynthesis,
catalyzes the synthesis of GDP-LL-galactose and GDP-LL-gulose from GDP-DD-mannose.
Isolation and characterisation of a Salvia bogotensis seed lectin specific for theTn antigen
pp 347–355
Nohora Vega, Gerardo Perez *
A lectin was isolated from Salvia bogotensis seeds and characterised. An essential step
in its purification was the removal of the abundant pigments and polysaccharides which
are present in seeds. The lectin showed strong specific binding to Tn antigen-bearing
glycoproteins such as asialo ovine and bovine submaxillary mucins.
PHYTOCHEMISTRY
www.elsevier.com/locate/phytochem
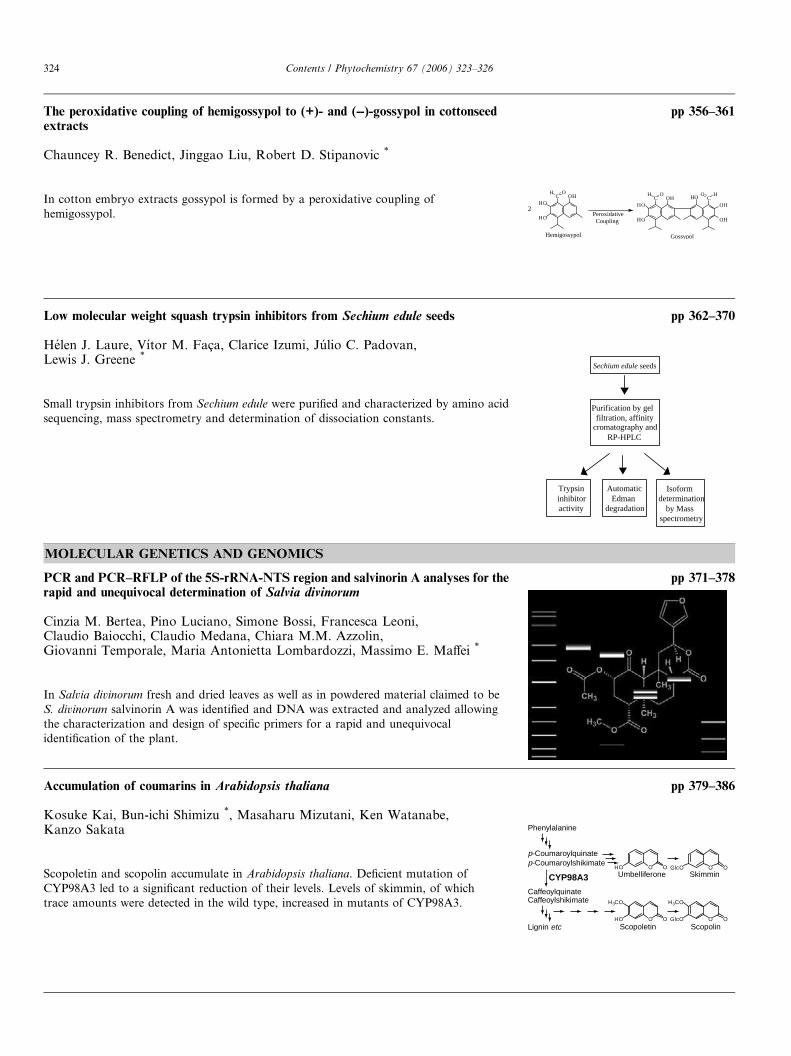
The peroxidative coupling of hemigossypol to (+)- and (--)-gossypol in cottonseedextracts
pp 356–361
Chauncey R. Benedict, Jinggao Liu, Robert D. Stipanovic *
In cotton embryo extracts gossypol is formed by a peroxidative coupling of
hemigossypol.
OHHO
HO
CH O
OHHO
HO
CH O
OH
OH
CHO
O
Hemigossypol Gossypol
H
2Peroxidative Coupling
Low molecular weight squash trypsin inhibitors from Sechium edule seeds pp 362–370
Helen J. Laure, Vıtor M. Faca, Clarice Izumi, Julio C. Padovan,Lewis J. Greene *
Small trypsin inhibitors from Sechium edule were purified and characterized by amino acid
sequencing, mass spectrometry and determination of dissociation constants.
Sechium edule seeds
Purification by gelfiltration, affinity
cromatography andRP-HPLC
AutomaticEdman
degradation
Trypsininhibitoractivity
Isoformdetermination
by Massspectrometry
MOLECULAR GENETICS AND GENOMICS
PCR and PCR–RFLP of the 5S-rRNA-NTS region and salvinorin A analyses for therapid and unequivocal determination of Salvia divinorum
pp 371–378
Cinzia M. Bertea, Pino Luciano, Simone Bossi, Francesca Leoni,Claudio Baiocchi, Claudio Medana, Chiara M.M. Azzolin,Giovanni Temporale, Maria Antonietta Lombardozzi, Massimo E. Maffei *
In Salvia divinorum fresh and dried leaves as well as in powdered material claimed to be
S. divinorum salvinorin A was identified and DNA was extracted and analyzed allowing
the characterization and design of specific primers for a rapid and unequivocal
identification of the plant.
Accumulation of coumarins in Arabidopsis thaliana pp 379–386
Kosuke Kai, Bun-ichi Shimizu *, Masaharu Mizutani, Ken Watanabe,Kanzo Sakata
Scopoletin and scopolin accumulate in Arabidopsis thaliana. Deficient mutation of
CYP98A3 led to a significant reduction of their levels. Levels of skimmin, of which
trace amounts were detected in the wild type, increased in mutants of CYP98A3.
O OHO O OGlcO
O OGlcO
H3CO
O OHO
H3CO
Phenylalanine
p-Coumaroylquinatep-Coumaroylshikimate
CaffeoylquinateCaffeoylshikimate
CYP98A3
Lignin etc
Umbelliferone Skimmin
Scopoletin Scopolin
324 Contents / Phytochemistry 67 (2006) 323–326

Flavonoid 30-O-methyltransferase from rice: cDNA cloning, characterization andfunctional expression
pp 387–394
Bong-Gyu Kim, Youngshim Lee, Hor-Gil Hur, Yoongho Lim,Joong-Hoon Ahn *
An O-methyltransferase from rice that transfers a methyl group to the 30-hydroxy group of
flavonoids was characterized.
O
O
HO
OH
OH
OCH3
OH
O
O
HO
OH
OH
OH
OH
ECOLOGICAL BIOCHEMISTRY
Simultaneous quantitative LC–ESI-MS/MS analyses of salicylic acid and jasmonicacid in crude extracts of Cucumis sativus under biotic stress
pp 395–401
Guillem Segarra *, Olga Jauregui, Eva Casanova, Isabel Trillas
Noticeable improvements to the simultaneous quantitation of salicylic acid and jasmonic
acid applied to the better understanding of plant–fungal interactions.
Targeted metabolite profiling provides a functional link among eucalypt taxonomy,physiology and evolution
pp 402–409
Andrew Merchant *, Andreas Richter, Marianne Popp, Mark Adams
Concentrations of a cyclohexanepentol �DD-quercitol� are found to be common among species
of Eucalyptus naturally distributed below the 500 mm yr)1 rainfall isohyet. The occurrence
of DD-quercitol represents a quantitative yet discrete phytochemical link with taxonomy and
evolution of the genus Eucalyptus.
Altitudinal variation of secondary metabolite profiles in flowering heads ofArnica montana cv. ARBO
pp 410–418
Renate Spitaler, P. Daniel Schlorhaufer, Ernst P. Ellmerer, Irmgard Merfort,Sigmar Bortenschlager, Hermann Stuppner, Christian Zidorn *
The altitudinal variation on the contents of secondary metabolites in flowering heads of
Arnica montana was assessed. Plants of A. montana cultivar ARBO were grown in nine
experimental plots at altitudes between 590 and 2230 m at Mount Patscherkofel near
Innsbruck/Austria. The proportion of flavonoids with vicinal free hydroxy groups in ring B
to flavonoids lacking this feature significantly increased with elevation. Additionally, the
level of phenolic acids, in particular the level of 1-methoxyoxaloyl-3,5-dicaffeoylquinic acid,
also positively correlated with the altitude of the growing site.
Contents / Phytochemistry 67 (2006) 323–326 325

OTHER CONTENTS
Announcement: Phytochemical Society of North America p I
Author Index p II
Guide for Authors pp III–IV
* Corresponding author
INDEXEDNDEXED/ABSTRACTEDABSTRACTED ININ: Current Awareness in Biological Sciences (CABS), Curr Cont ASCA. Chem. Abstr. BIOSIS Data, PASCAL-CNRS Data, CAB Inter, Cam Sci Abstr, Curr Cont/Agri Bio Env Sci, Curr Cont/Life Sci, Curr Cont Sci Cit Ind, Curr Cont SCISEARCHData, Bio Agri Ind
The Editors encourage the submission of articles online, thus reducing publication times. For further information and to submit your manuscript,
please visit the journal homepage at http://www.elsevier.com/locate/phytochem
ISSN 0031-9422
326 Contents / Phytochemistry 67 (2006) 323–326

Review
Tropinone reductases, enzymes at the branch point oftropane alkaloid metabolism
Birgit Drager *
Faculty of Pharmacy, Martin Luther University Halle-Wittenberg, Hoher Weg 8, D-06120 Halle/Saale, Germany
Received 12 September 2005; received in revised form 28 November 2005
In Memoriam Professor Martin Luckner 1935–2004
Abstract
Two stereospecific oxidoreductases constitute a branch point in tropane alkaloid metabolism. Products of tropane metabolism are thealkaloids hyoscyamine, scopolamine, cocaine, and polyhydroxylated nortropane alkaloids, the calystegines. Both tropinone reductasesreduce the precursor tropinone to yield either tropine or pseudotropine. In Solanaceae, tropine is incorporated into hyoscyamine andscopolamine; pseudotropine is the first specific metabolite on the way to the calystegines. Isolation, cloning and heterologous expressionof both tropinone reductases enabled kinetic characterisation, protein crystallisation, and structure elucidation. Stereospecificity ofreduction is achieved by binding tropinone in the respective enzyme active centret in opposite orientation. Immunolocalisation of bothenzyme proteins in cultured roots revealed a tissue-specific protein accumulation. Metabolite flux through both arms of the tropane alka-loid pathway appears to be regulated by the activity of both enzymes and by their access to the precursor tropinone. Both tropinonereductases are NADPH-dependent short-chain dehydrogenases with amino acid sequence similarity of more than 50% suggesting theirdescent from a common ancestor. Putative tropinone reductase sequences annotated in plant genomes other that Solanaceae await func-tional characterisation.� 2005 Elsevier Ltd. All rights reserved.
Keywords: Solanaceae; Tropane alkaloid; Hyoscyamine; Scopolamine; Calystegine; Tropinone reductase; Short-chain dehydrogenase
Contents
1. Tropane alkaloids . . . . . . . . . . . . . . . . . . . . . . . . . . . . . . . . . . . . . . . . . . . . . . . . . . . . . . . . . . . . . . . . . . . . . . . . . . . 3282. Two separate tropinone reductases . . . . . . . . . . . . . . . . . . . . . . . . . . . . . . . . . . . . . . . . . . . . . . . . . . . . . . . . . . . . . . . 3283. Pseudotropine forming tropinone reductase and calystegines . . . . . . . . . . . . . . . . . . . . . . . . . . . . . . . . . . . . . . . . . . . . . 3294. Tropinone reductase protein structure and function . . . . . . . . . . . . . . . . . . . . . . . . . . . . . . . . . . . . . . . . . . . . . . . . . . . 3295. Flux regulation of the tropane pathway by tropinone reductases . . . . . . . . . . . . . . . . . . . . . . . . . . . . . . . . . . . . . . . . . . 3326. Evolution of tropinone reductases . . . . . . . . . . . . . . . . . . . . . . . . . . . . . . . . . . . . . . . . . . . . . . . . . . . . . . . . . . . . . . . . 334
Acknowledgements . . . . . . . . . . . . . . . . . . . . . . . . . . . . . . . . . . . . . . . . . . . . . . . . . . . . . . . . . . . . . . . . . . . . . . . . . . . 335References . . . . . . . . . . . . . . . . . . . . . . . . . . . . . . . . . . . . . . . . . . . . . . . . . . . . . . . . . . . . . . . . . . . . . . . . . . . . . . . . . 336
0031-9422/$ - see front matter � 2005 Elsevier Ltd. All rights reserved.
doi:10.1016/j.phytochem.2005.12.001
* Tel.: +49 345 55 25 765; fax: +49 345 55 27 021.E-mail address: [email protected].
www.elsevier.com/locate/phytochem
Phytochemistry 67 (2006) 327–337
PHYTOCHEMISTRY

1. Tropane alkaloids
Tropane alkaloids have been established drugs for med-ical treatment since many years. They are obtained fromSolanaceae, e.g., Atropa belladonna, Hyoscyamus niger,and Datura stramonium. After alkaloids were detected aschemical constituents of plants and named as such (Meiss-ner, 1819), efforts to provide pure compounds for medica-tion yielded atropine from Atropa belladonna L., deadlynightshade (Mein, 1833), and hyoscyamine from Hyoscya-
mus niger L., black henbane (Geiger and Hesse, 1833).Later ‘‘atropine’’ was defined as the racemic mixture ofthe enantiomer (S)-hyoscyamine, which occurs naturallyin plants and possesses high pharmacological activity,and of (R)-hyoscyamine, which forms during plant extrac-tion and which is pharmacologically mostly inactive. Thealkaloid scopolamine was detected only 1892 from Scopolia
atropoides (Schmidt, 1892) and proved later to be identicalwith a compound named hyoscine that was separated fromhyoscyamine in extracts from Hyoscyamus muticus (Laden-burg, 1881). Nowadays, therapeutic tropane alkaloids ofSolanaceae are extracted from Duboisia cultivars, mostlyhybrids of D. leichhardtii and D. myoporoides, native toAustralia. Duboisia species grow as perennial trees, andcultivated hybrids may contain more than 4% alkaloids(dry mass) in their leaves, scopolamine being a major alka-loid (Lean and Ralph, 1944; Hills et al., 1954). World con-sumption of scopolamine is several fold higher than that ofhyoscyamine (Bruhn, 1989) mainly due to the fact that sco-polamine is used as starting material for the semi-synthesisof several important drugs.
Atropine is applied as injection for premedication forsurgery, against colic in the digestive system, and as anti-dote against intoxication with organophosphorous insecti-cides. Scopolamine is used against motion disease in theform of an adhesive tape fixed behind the ear (ScopodermTTS�, Novartis), from which it is liberated over severalhours. Scopolamine as N-butyl hydrobromide derivativefor oral application acts against spasm of the bladder, ofthe intestine, or of the gall bladder, as it carries the advan-tage of having no side effects in the central nervous system
due to the quarterny ammonium salt not being transportedthrough the brain blood barrier. Further derivatives of sco-polamine are anticholinergic drugs inhaled against asthma,such as ipratropiumbromid. Research on tropane deriva-tives recently produced a novel compound, tiotropiumbro-mide (Spiriva� Boehringer Ingelheim). The compound isanother semi-synthetic derivative of scopolamine with anexceptional long half-life time of several days and was spe-cifically designed to treat chronic obstructive pulmonarydisease (COPD).
Tropane alkaloid containing Solanaceae, however well-known they seemed to be, revealed a new group of nortro-pane alkaloids only 15 years ago. Calystegines carry threeto five hydroxyl groups in various positions, thereby arewater-soluble and escape in typical alkaloid extractionschemes (Fig. 1). The compounds were initially detectedin Calystegia sepium (L.) R. Br., Convolvulaceae (Gold-mann et al., 1990). Based on the nortropane bicyclic ringit was assumed that calystegines arise from the tropanealkaloid biosynthetic pathway, and they were found in tro-pane alkaloid containing Solanaceae (Drager et al., 1994,1995). Specific extraction and purification schemes had tobe developed for the polyhydroxy alkaloids; chromatogra-phy also demanded adapted techniques (Drager, 1995,2002). Calystegines resemble monosaccharides in structure,and it is not surprising that they have shown to be strongglycosidase inhibitors (Asano et al., 2000). Intoxicationof cattle by feed plants containing alkaloidal glycosidaseinhibitors is known for several Fabaceae, e.g., Swainsonia,Oxytropis and Astragalus species, the indolizidine deriva-tive swainsonine being one of the strongest toxins. Similarintoxications symptoms after ingestion of Ipomoea species(Convolvulaceae) prompted phytochemical investigationand yielded several calystegines in I. aff. calobra (Molyneuxet al., 1995) and in I. carnea (Haraguchi et al., 2003).Swainsonine, however, was found in addition, and toxicityof calystegines for cattle was questioned (Ikeda et al.,2003).
2. Two separate tropinone reductases
The tropine esters hyoscyamine and scopolamine weretaken as the major products of the tropane pathway inSolanaceae, as was the methylecgonine ester cocainein some Erythroxylum species. Martin Luckner in hisrenowned book on Secondary Metabolism in Microorgan-isms, Plants, and Animals wrote in 1990 ‘‘In most of thealkaloids the tropane moiety at position 3 is ester-boundto an acid’’ (Luckner, 1990). It was thought accordinglythat tropinone should be reduced stereospecifically to tro-pine (3a-tropanol) in Solanaceae (Fig. 2), and not to theisomeric pseudotropine (3b-tropanol). Measurement oftropinone reducing enzyme activities in Datura stramoniumprotein extracts confirmed this view: tropine only wasfound as reduction product, pseudotropine was notdetected (Koelen and Gross, 1982). The first tropinone
N
OHOH
H
HOHO
N
OHHO
H
OH
N
OHOH
HO
H
OHN
OHOH
HO
HOH N
OHOH
H
HOHO OH
calystegine B2
calystegine A3 calystegine B1
calystegine B4 calystegine C1
calystegine A5
76
5 4
21
3
N
OHHO
H
OH
Fig. 1. Examples for calystegine structures. The basic skeleton is 8-azabicyclo[3.2.1]octane-3b-ol with two to four further hydroxyl groups invarious positions and orientations.
328 B. Drager / Phytochemistry 67 (2006) 327–337

reductase purification from Hyoscyamus niger, however,yielded an enzyme specific for pseudotropine formation(Drager et al., 1988). In addition, pseudotropine wasproved not to be isomerised into tropine in plant tissues(Yamada et al., 1990). As this enzyme was not responsiblefor tropine formation, another tropine-specific reductasewas postulated. Two separate tropinone reductases werepurified from H. niger root cultures (Hashimoto et al.,1992) and also from D. stramonium roots (Portsteffenet al., 1992). Atropa belladonna also contained two specificenzymes (Drager and Schaal, 1994). It became customaryto abbreviate the tropine-forming enzyme with TRI (EC1.1.1.206) and the pseudotropine-forming enzyme withTRII (EC 1.1.1.236). TRII activity was found to be strongin many Solanaceae tissues, e.g., shortly after applicationof tropinone, pseudotropine accumulated faster than tro-pine (Drager and Schaal, 1994). Esters of pseudotropine,e.g., with acetic acid or tiglic acid, were identified only as
minor alkaloids in those plants, and the metabolic role ofTRII and the destination of pseudotropine formed wereenigmatic.
3. Pseudotropine forming tropinone reductase andcalystegines
The molecular structure of calystegines shows an equa-torial hydroxyl group (referring to the six-memberedchair-shaped ring) in position 3, the typical feature of pseu-dotropine (Fig. 1). It has been hypothesised since 1994 thatTRII and the reduction product pseudotropine were thefirst molecules on the way to the formation of calysteginesfrom tropinone (Drager et al., 1994). Calystegines weresubsequently detected in many Solanaceae, also in speciesthat were before assumed not to possess the tropane alka-loid pathway such as Solanum tuberosum, potato (Drageret al., 1995). Further species and genera of Convolvulaceaeother than Calystegia sepium were screened for calyste-gines, and the compounds were found in many generaand considered as a typical chemical constituent of Convol-vulaceae (Schimming et al., 1998, 2005). In Calystegia
sepium root cultures, calystegines were identified as theonly products of the tropane alkaloid pathway, and thisgave the chance for a targeted and efficient incorporationof labelled tropane precursors. 15N-labelled tropinonewas administered to root cultures, and the label was tracedin calystegines by GC–MS and by NMR (Fig. 3). Six daysafter treatment almost total calystegine A3 and about halfof the calystegines B1 and B2 were labelled by 15N. This wasthe first experimental evidence for the decent of calyste-gines from the tropane pathway (Scholl et al., 2001,2003). In potato, the surprising finding of calystegines insprouting tubers was confirmed by a detailed analysis ofplant tissues of many developmental stages (Keiner andDrager, 2000). Biosynthesis was assumed to proceed bythe tropane pathway in potato as well, and the identifica-tion of potato genes and enzymes specific to tropane alka-loid metabolism proved the concept. A typical TRII wasisolated and characterised from potato (Keiner et al.,2002), and recently putrescine N-methyltransferase, thefirst enzyme of tropane alkaloid metabolism was clonedand characterised from potato (Stenzel et al., 2006).
4. Tropinone reductase protein structure and function
Purification of both tropinone reductases from D. stra-
monium (Portsteffen et al., 1992, 1994) and from H. niger
(Hashimoto et al., 1992) yielded enzymes with similar pro-tein properties, but with different catalytic and kineticbehaviour. Molecular mass of the protein subunits wasdetermined to be between 28,000 and 30,000 Dalton.Sequencing of cDNA coding for D. stramonium TRs con-firmed the protein subunits to consist of 273 (TRI) and260 (TRII) amino acids and to have a molecular mass of
N
OH
H3C
tropinoneNADPH
calystegine A3
N
OHOH
HO
H
NH3C
OH
tropine, NADP pseudotropine, NADP
TR I TR II
putrescine
phenyl-lactic acid
N-methylputrescine
PMT
(S)-hyoscyamine and further calystegines
O
NH3C
O
C
C
H
HO H2C
O
NH3C
O
C
C
H
O
H2COH
(S)-scopolamine
PMT = putrescine N-methyl transferase
TRI = tropine formingtropinone reductase
TRII = pseudotropine forming tropinone reductase
NH3C
O
1 2
345
6 7
Fig. 2. Biosynthesis of tropane alkaloids. Tropinone reductases form abranch point in the pathway leading to hyoscyamine and scopolamine(TRI) and to calystegines (TRII).
B. Drager / Phytochemistry 67 (2006) 327–337 329

29,615 and 28,310 Dalton, respectively (Nakajima et al.,1993). Amino acid sequence homology (167 identicalamino acid residues, 64%) and comparison of conservedamino acid motifs grouped both tropinone reductases intothe family of short-chain dehydrogenases.
The similarity in protein type of both reductases ren-dered the apparent difference in reaction stereospecificityeven more intriguing. Differences in tropinone acceptanceand fixation were suspected to be responsible for the selec-tive formation of tropine and pseudotropine, because reac-tion velocity, substrate affinity, and pH optima for TRIand TRII were conspicuously different (Table 1). TRIcatalysed reduction of tropinone and oxidation of tropine,whereas TRII was not, or only very slightly, active in catal-ysis of the oxidation reaction (Hashimoto et al., 1992; Port-steffen et al., 1994). In particular, pH dependency ofturnover velocities and KM values were different for bothenzymes. The catalytic constant of TRI of D. stramonium
was 11-fold higher than that of TRII at pH 7.0. TRIshowed the maximal reduction activity at acidic pH witha very high KM value only. Together, this was taken asan indication that acidic pH favoured turnover, butuncharged tropinone was fixed better in the active centreof the enzyme (Portsteffen et al., 1994). Another strong
indication for differential substrate handling of both TRscame from incubations with substrate analogues (Table2). Molecules with variations in charge and shape wereaccepted differentially by TRI and TRII. Quinuclidinoneand TBON (8-thiabicylo[3.2.1]octan-3-one, the sulfur ana-logue of tropinone), for example are good substrates for allTRI enzymes, but are not accepted by TRIIs.
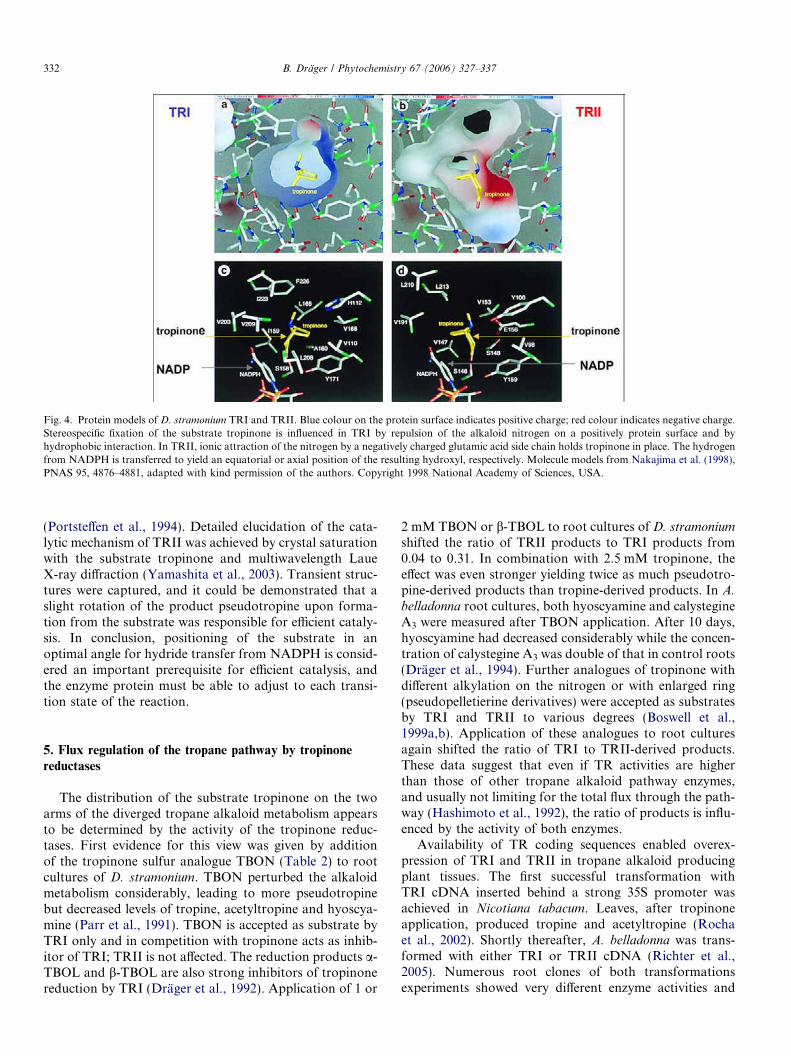
After heterologous expression in E. coli, sufficientenzyme protein was available for crystallisation and pro-tein structure elucidation of TRI and TRII (Nakajimaet al., 1998). Modelling of the tropinone binding site ofTRI and TRII suggested two different ways of substratefixation (Fig. 4). In TRII tropinone is attached by ionicinteraction of the tropinone nitrogen to the side chain ofglutamic acid (Glu156) in the active centre. In TRI, thenitrogen is repulsed by a histidine (His112) in the sameposition and fixed in the opposite orientation by hydropho-bic interactions. This causes uncharged tropinone to befixed more easily, and it may also fix TBON, which is notcharged. Selective and differential fixation of the substratetropinone in the active centre (with NADPH always occu-pying the same position) explains how both enzymes suc-ceed in stereospecific product formation. The concept wassupported by site-directed mutagenesis at those residues
NH3C
O tropinone
TRII
NH3C
OH
N
OHOH
HO
H
OH
pseudotropine
calystegine A3(calystegine B2)
silylationGC-MS
N OT MS
H
+
15N: Mr 15714N: Mr 156
( )
0
10
20
30
40
50
60
70
80
90
100
0 control 48h 96h 144h
156 in %
157 in %
Fragments 156 and 157 in calystegine A3
Fragments 156 and 157 in calystegine B2
0
10
20
30
40
50
60
70
80
90
100
0h control 48h 96h 144h
156 in %
157 in %
Fig. 3. Calystegine biosynthesis by the tropane alkaloid pathway. 15N-labelled tropinone applied to root cultures is incorporated into calystegines.Percentage of label in calystegines is detected by GC–MS. The pyrrolidine ring fragment mass (156) is enhanced +1 (157) after 15N-tropinone applicationin a time-dependent manner, as shown for calystegines A3 and B2 (data adapted from Scholl et al., 2001).
330 B. Drager / Phytochemistry 67 (2006) 327–337

assumed to be responsible for substrate fixation. Some ofthe enzymes with exchanged amino acids formed bothproducts (Nakajima et al., 1994, 1999a). The higher reac-tion velocity of TRI was explained by the relatively lowsubstrate – and product – fixation caused by the chargednitrogen at the hydrophobic protein active site. Results ofreduction of the sulfur analogue TBON confirmed this
idea. TBON was reduced slowly by TRI (35% of maximalcatalytic velocity), probably because it is non-charged andbound more strongly. Reduction yielded both products,80% a-TBOL (8-thiabicylo[3.2.1]octan-3a-ol) with an axialhydroxyl group like tropine and 20% b-TBOL with equato-rial hydroxyl group like pseudotropine, demonstrating thatthe substrate TBON was fixed less stereospecifically in TRI
Table 2Substrates for tropinone reductases
Substrate D. stramonium
TRIH. niger
TRID. stramonium
TRIIH. niger
TRIIA. belladonna
TRIIS. tuberosum
TRII
Tropinone Vmax 100% 100% 100% 100% 100% 100%KM 1.30 mM, pH 6.4 1.01 mM 0.033 mM 0.034 mM 0.090 mM 0.033 mM
N-Methyl-4-pieridinone Vmax 180% 13% 28% 512% 313% 140%KM 1.40 mM 0.231 mM 20 mM 0.770 mM 0.650 mM n.d.
N-Propyl-4-pieridinone Vmax 78% – – 530% 129% 84%KM – – – 0.265 mM n.d. n.d.
4-Methyl-cyclohexanone Vmax 39% 64% 22% 113% n.d. 17.2%KM 0.030 mM 0.012 mM 2.8 mM 2.03 mM n.d. n.d.
3-Methyl-cyclohexanone Vmax n.d. 85% n.d. 172% n.d. 13.4%KM n.d. 0.041 mM n.d. 7.580 mM n.d. n.d.
4-Ethyl-cyclohexanone Vmax 41% 107% 58% 172% n.d. n.d.KM 0.045 mM 0.030 mM n.d. 0.534 mM n.d. n.d.
Quinuclidinone Vmax 80% 136% – – – –KM 2.2 mM 1.810 mM – – – –
TBONa Vmax 35% 40% – – – –KM 0.033 mM 0.033 – – – –
4-Tetrahydro-thiopyranone Vmax 83% n.d. 115% n.d. 71% n.d.KM 0.030 mM n.d. 2.0 mM n.d. 0.380 mM n.d.
References Portsteffenet al. (1994)
Hashimotoet al. (1992)
Portsteffenet al. (1994)
Hashimotoet al. (1992)
Drager and Schaal(1994)
Keineret al. (2002)
TRI and TRII enzymes show differential preferences for substrate analogues.n.d., not determined; –, no activity.
a 8-Thiabicylo[3.2.1]octan-3-one.
Table 1Tropinone reductases from Solanaceae
Enzyme KM tropinone(mM)
KM
NADPH (lM)Kcat (s�1) pH optimum
reduct./oxid.KM tropine orw-tropine (mM)
KM NADP+(lM)
References
D. stramonium TRI 0.775 (pH 5.9) 58 25.6 (pH 7.0) 6.4/9.9 0.18 105 Nakajima et al. (1994)Portsteffen et al. (1994)Nakajima et al. (1999a)
H. niger TRI 1.01 (pH 5.9) 11.3 n. d. 6.1/7.6 2.6 41.5 Hashimoto et al. (1992)
D. stramonium TRII 0.033 (pH 5.95) 16 2.73 (pH 7.0) 6.25 broad/– – – Nakajima et al. (1994)Portsteffen et al. (1994)Nakajima et al. (1999a)
H. niger TRII 0.034 (pH 5.9) 6.1 n.d. 5.8 broad/– 0.687 (1.3% of act.with tropinone)
251 Drager et al. (1988)Hashimoto et al. (1992)
A. belladonna TRII 0.090 (pH 6.25) 21 n.d. 6.25 broad/– – – Drager and Schaal (1994)
S. tuberosum TRII 0.033 (pH 6.4) 20 n. d. 5.0 broad/– – – Keiner et al. (2002)
TRI and TRII enzymes can be grouped by typical differences in kinetic performance.n.d., not determined; –, no activity.
B. Drager / Phytochemistry 67 (2006) 327–337 331
(Portsteffen et al., 1994). Detailed elucidation of the cata-lytic mechanism of TRII was achieved by crystal saturationwith the substrate tropinone and multiwavelength LaueX-ray diffraction (Yamashita et al., 2003). Transient struc-tures were captured, and it could be demonstrated that aslight rotation of the product pseudotropine upon forma-tion from the substrate was responsible for efficient cataly-sis. In conclusion, positioning of the substrate in anoptimal angle for hydride transfer from NADPH is consid-ered an important prerequisite for efficient catalysis, andthe enzyme protein must be able to adjust to each transi-tion state of the reaction.
5. Flux regulation of the tropane pathway by tropinone
reductases
The distribution of the substrate tropinone on the twoarms of the diverged tropane alkaloid metabolism appearsto be determined by the activity of the tropinone reduc-tases. First evidence for this view was given by additionof the tropinone sulfur analogue TBON (Table 2) to rootcultures of D. stramonium. TBON perturbed the alkaloidmetabolism considerably, leading to more pseudotropinebut decreased levels of tropine, acetyltropine and hyoscya-mine (Parr et al., 1991). TBON is accepted as substrate byTRI only and in competition with tropinone acts as inhib-itor of TRI; TRII is not affected. The reduction products a-TBOL and b-TBOL are also strong inhibitors of tropinonereduction by TRI (Drager et al., 1992). Application of 1 or
2 mM TBON or b-TBOL to root cultures of D. stramonium
shifted the ratio of TRII products to TRI products from0.04 to 0.31. In combination with 2.5 mM tropinone, theeffect was even stronger yielding twice as much pseudotro-pine-derived products than tropine-derived products. In A.
belladonna root cultures, both hyoscyamine and calystegineA3 were measured after TBON application. After 10 days,hyoscyamine had decreased considerably while the concen-tration of calystegine A3 was double of that in control roots(Drager et al., 1994). Further analogues of tropinone withdifferent alkylation on the nitrogen or with enlarged ring(pseudopelletierine derivatives) were accepted as substratesby TRI and TRII to various degrees (Boswell et al.,1999a,b). Application of these analogues to root culturesagain shifted the ratio of TRI to TRII-derived products.These data suggest that even if TR activities are higherthan those of other tropane alkaloid pathway enzymes,and usually not limiting for the total flux through the path-way (Hashimoto et al., 1992), the ratio of products is influ-enced by the activity of both enzymes.
Availability of TR coding sequences enabled overex-pression of TRI and TRII in tropane alkaloid producingplant tissues. The first successful transformation withTRI cDNA inserted behind a strong 35S promoter wasachieved in Nicotiana tabacum. Leaves, after tropinoneapplication, produced tropine and acetyltropine (Rochaet al., 2002). Shortly thereafter, A. belladonna was trans-formed with either TRI or TRII cDNA (Richter et al.,2005). Numerous root clones of both transformationsexperiments showed very different enzyme activities and
Fig. 4. Protein models of D. stramonium TRI and TRII. Blue colour on the protein surface indicates positive charge; red colour indicates negative charge.Stereospecific fixation of the substrate tropinone is influenced in TRI by repulsion of the alkaloid nitrogen on a positively protein surface and byhydrophobic interaction. In TRII, ionic attraction of the nitrogen by a negatively charged glutamic acid side chain holds tropinone in place. The hydrogenfrom NADPH is transferred to yield an equatorial or axial position of the resulting hydroxyl, respectively. Molecule models from Nakajima et al. (1998),PNAS 95, 4876–4881, adapted with kind permission of the authors. Copyright 1998 National Academy of Sciences, USA.
332 B. Drager / Phytochemistry 67 (2006) 327–337

alkaloid patterns. Wild type roots contained two timesmore TRII products than TRI products. The transforma-tion effect on the alkaloid pattern was stronger with TRIoverexpression than with TRII (Fig. 5). These results con-firm that in vivo activities of TRI and TRII both affect theproducts of the tropane alkaloid biosynthesis. They do not,however, prove that both enzymes compete for their sub-strate tropinone within the same tissues or cells.
Similar bifurcations involving specific and stereoselec-tive reduction and oxidation steps are known from othersecondary product biosynthesis pathways. In Mentha
piperita plants (Lamiaceae), the major constituent of theessential oil is (�)-menthol, a monoterpene. In the courseof the biosynthesis, the menthol precursor (+)-pulegoneis reduced to give either (�)-menthone by NADPH depen-dent double bond reduction or (+)-menthofuran by P450dependent monooxidation. At this branch point of thepathway, the monooxygenase menthofuran synthase wasproven to exert control over the pulegone reductase andto regulate the total flux into menthol biosynthesis (Mah-moud and Croteau, 2003). In flavonoid biosynthesis, adiversion of the pathway is located at the metabolite dihy-droflavanol, in which the 3-ketofunction is stereospecifi-cally reduced by NADPH dependent dihydrokaempferolreductase (EC 1.1.1.219) leading finally to coloured antho-cyanins. Alternatively, dihydroflavanols are oxidised byflavonol synthase introducing a double bond in 2–3-posi-tion leading to white or yellow flavonols. Flavonolsynthase is, dependent on the plant species, a soluble diox-ygenase or a P450 monooxygenase. The flux regulation atthis branch point again is species dependent and mostlyperformed by enzyme expression in a development- and tis-sue-specific manner (Winkel-Shirley, 2001a,b). Combina-
tions of cis-acting elements and DNA-binding factorshave recently been shown to be responsible for differentialexpression of flavonoid pathway enzymes in Arabidopsis
thaliana (Hartmann et al., 2005). Cardiac glycoside biosyn-thesis, as well, involves stereospecific reduction of a doublebond at a branch point of the pathway. An instructive andcolourful overview on the biology and biochemistry of car-diac glycoside was written by Professor Martin Lucknertogether with his colleague and friend Professor MaxWichtl (Luckner and Wichtl, 2000). In the course of theformation of the cardenolide skeleton, progesterone isreduced to either 5b-pregnan-3,20-dione or to 5a-preg-nan-3,20-dione, the latter being a metabolite in the forma-tion of brassinosteroids, ubiquitous phytohormones inplants (Nomura et al., 2004). Progesterone 5b-reductaseis specific for cardenolide forming plant tissues and wasisolated and purified from Digitalis purpurea (Gaertneret al., 1990, 1994). The molecular structure of the geneand of the protein forming this key enzyme of cardenolidebiosynthesis will be most interesting in order to clarify thequestion how the flux of steroid skeletons into the carden-olide pathway is controlled.
The substrate tropinone is hardly ever seen to accumu-late in any tropane alkaloid producing plant tissue. Besidesspecific reduction activities the availability of the substratetropinone may be regulating the metabolite flow into eitherarm of the tropane alkaloid biosynthesis. Transcripts andproteins of both enzymes were localised in root culturesof H. niger. Reporter gene fusion to promoter regions ofboth TRs suggested expression in mature roots rather thanin young roots (Nakajima et al., 1999b). Within the rootcross sections not much difference between TRI and TRIIpromoter controlled expression was seen. Endodermis,
0
1
2
3
4
5
WT VC TRI-1 TRI-2 TRI-3 TRI-4 TRI-5 TRI-6 TRII-1 TRII-2 TRII-3 TRII-4 TRII-5 TRII-6 TRII-7 TRII-8
molar ratio TRI : TRII derived alkaloids
Fig. 5. Molar alkaloid ratio in root cultures of A. belladonna after overexpression of TRI and TRII cDNA. Several clones of each transformationexperiment are shown. WT, wild type; VC, vector control; TRI-1–TRI-6, TRI overexpressing clones; TRII-1–TRII-8, TRII overexpressing clones.
B. Drager / Phytochemistry 67 (2006) 327–337 333

pericycle, and some cortex cells were stained by expressionof the reporter gene. Run-on transcription assays andNorthern blots showed similar transcription rates for bothenzymes. Actual in situ activity of enzymes however, is bet-ter demonstrated by visualisation of the individual enzymeproteins. Immunostaining of TRI and TRII proved partialdifferent localisation of TRI and TRII within the rootdiameter (Nakajima and Hashimoto, 1999). TRI proteinsignal was strong in the endodermis and in some cortexcells, while TRII protein concentration was highest in thepericycle. Two further enzyme proteins participating in tro-pane alkaloid formation were localised before in the pericy-cle of roots: the first specific enzyme of the alkaloidpathway, putrescine N-methyltransferase (EC 2.1.1.53) inA. belladonna (Suzuki et al., 1999) and hyoscyamine 6b-hydroxylase (EC 1.14.11.11, forming scopolamine) in H.
niger (Hashimoto et al., 1991). It is therefore striking thatTRI responsible for hyoscyamine formation was absentfrom the pericycle. The results require the concept thatthere is transport of metabolites between tissue layers inorder to complete tropane alkaloid biosynthesis. As a con-sequence, transport as well as enzyme activity may be lim-iting and regulating alkaloid biosynthetic activity.
In Solanum tuberosum, transcripts for TRII involved incalystegine formation were found in tuber sprouts, whichare stem tissues (Keiner et al., 2002). Before, tropane alka-loid formation was thought to be generally restricted toroots, and it will be interesting to see in detail the localisa-tion of tropane alkaloid metabolism and the enzymesinvolved in potato.
6. Evolution of tropinone reductases
In the rice and in the Arabidopsis genomes, putativetropinone reductases were annotated, similarly in ESTcollections of apple (Malus · domestica, Rosaceae), ofMedicago truncatula and soy bean, Glycine max (both Fab-aceae), and of tomato (Lycopersicon esculentum, Solana-ceae). In tomato, calystegines have been detected (Asanoet al., 1997). For the other plants with putative TRsequences tropane alkaloids were never described, and phy-tochemical investigations of some of these species did notreveal any tropine, pseudotropine or derived products(Drager, unpublished). Tropane alkaloid accumulation isknown as typical feature of Solanaceae; further sporadicoccurrence was reported in several mostly unrelated taxa.Surveys on occurrence of tropane alkaloids in general(Lounasmaa and Tamminen, 1993; Griffin and Lin, 2000)and of calystegines in particular (Drager, 2004) encompasseight plant families. They appear scattered within the largeclade of core eudicots (Fig. 6). Erythroxylum species areknown for cocaine and related alkaloid structures, andrecently calystegines were identified in many Erythroxylumspecies (Brock et al., 2005). Proteaceae contain tropanealkaloids with an extraordinary pyranone structure linkedto the tropane bicyclus. Morus species like Convolvulaceae
contain calystegines. Cochlearia arctica (Brassicaceae) wasreported to synthesise cochlearine, which is the 3-hydroxy-benzoic acid ester of tropine. The widespread occurrence oftropane alkaloids in higher plants raises the question fortheir evolutionary development. A repeated and indepen-dent (polyphyletic) emergence of the tropane biosyntheticsteps in distant plant families appears to be the mostrational explanation. Sequencing and comparison of trop-inone reductase genes and of further enzymes involved intropane alkaloid formation is required for definite conclu-sions. Up to now, DNA sequences of tropinone reductaseswith enzymatic characterisation have only been isolatedfrom Solanaceae. A cDNA coding for a tropinone reduc-tase from Calystegia sepium (EMBL accession AJ540305)with 55% amino acid identity to H. niger TRI wassequenced, but enzyme activity of the protein encodedwas not yet described. It is conceivable that this enzymeis involved in tropane alkaloid formations as tropine deriv-atives occur in Convolvulaceae, and Solanaceae andConvolvulaceae are closely related in the same order Sola-nales. The DNA sequences that are annotated as ‘‘putativetropinone reductases’’ in fully sequenced genome shareabout 50% identity to TRs suggesting that they are relatedmore closely and possibly possess a common ancestor likeTRI and TRII (Nakajima et al., 1993).
Tropinone reductases belong to the enzyme family ofshort-chain dehydrogenases/reductases (SDR), which islarge and of old origin. SDRs are present in all livingorganisms. About 3000 different sequences of SDRenzymes were annotated in the databases in 2003. In thehuman genome for example, 63 SDR genes were identified(Oppermann et al., 2003). The proteins are characterised bya length of approximately 250 amino acids and a NADP orNADPH binding domain at the N-terminus. The three-dimensional structure of SDRs contains a Rossman foldtypical for nucleotide binding proteins and comprised ofa sheet of six to seven parallel b-strands flanked by mostlyfour a-helices (Kallberg et al., 2002). Hydride transfer iscatalysed by a conserved triad of amino acids Ser, Tyr,and Lys. Mutagenesis and structure determination on 3b/17b-hydroxysteroid dehydrogenase identified an additionalAsp as crucial residue for catalysis that was found in mostSDRs (Filling et al., 2002). In spite of a highly conservedprotein structure, DNA sequences coding for SDRenzymes share low residue identity; 10–30% are mostlyfound. The DNA sequences that are annotated as ‘‘puta-tive tropinone reductases’’ in fully sequenced genome shareabout 50% identity to TRs suggesting that they are relatedmore closely and possibly possess a common ancestor likeTRI and TRII (Nakajima et al., 1993). Clustering of SDRwith the aim of reconstruction of evolutionary origins hasbeen difficult because of the low sequence residue similar-ity. Therefore, a protein structure-based phylogenetic anal-ysis for SDR with a focus on 17b-hydroxysteroiddehydrogenases was undertaken (Breitling et al., 2001).This approach proved successful for detecting two structur-ally independent subgroups of 17b-hydroxysteroid dehy-
334 B. Drager / Phytochemistry 67 (2006) 327–337

drogenases. TRs were included in this analysis, but depend-ing on the clustering algorithm, they were placed into dif-ferent neighbourhoods together with, e.g., carbonyl orsteroid reducing enzymes from different fungal, mamma-lian, or bacterial origin suggesting that more TR andrelated SDR protein structures must be included to providea better clustering basis for this method.
Acknowledgements
Dr. Peter Stevens, Missouri Botanical Garden, preparedthe angiosperm tree in Fig. 6 and made it public available.Dr. Keiji Nakajima and Dr. Takashi Hashimoto, NaraInstitute of Science and Technology, Japan, kindly agreedto reproduction of the tropinone reductase models in
Fig. 6. Occurrence of tropane alkaloids in the angiosperms. Tropane alkaloids were reported within a section of the eudicots. Hatched lines indicate thissection. The tree diagram was taken from the angiosperm phylogeny website, Missouri Botanical Garden (http://www.mobot.org/MOBOT/Research/APweb/welcome.html) with kind permission of the author Dr. Peter Stevens. The original tree on the website is linked on all terminal taxa to pages withdetailed taxon characterisation.
B. Drager / Phytochemistry 67 (2006) 327–337 335

Fig. 4. The manuscript was critically read and corrected byDr. Yvonne Sichhardt, Martin Luther University Halle-Wittenberg and by Dr. Randolph R.J. Arroo, De Mont-ford University Leicester, UK. Work in the author’s labo-ratory was financially supported by the German ResearchFoundation (DFG).
References
Asano, N., Kato, A., Matsui, K., Watson, A.A., Nash, R.J., Molyneux,R.J., Hackett, L., Topping, J., Winchester, B., 1997. The effects ofcalystegines isolated from edible fruits and vegetables on mammalianliver glycosidases. Glycobiology 7, 1085–1088.
Asano, N., Nash, R.J., Molyneux, R.J., Fleet, G.W., 2000. Sugar-mimicglycosidase inhibitors: natural occurrence, biological activity andprospects for therapeutic application. Tetrahedron: Asymmetry 11,1645–1680.
Boswell, H.D., Drager, B., McLauchlan, W.R., Portsteffen, A., Robins,D.J., Robins, R.J., Walton, N.J., 1999a. Specificities of the enzymes ofN-alkyltropane biosynthesis in Brugmansia and Datura. Phytochemis-try 52, 871–878.
Boswell, H.D., Drager, B., Eagles, J., McClintock, C., Parr, A.,Portsteffen, A., Robins, D.J., Robins, R.J., Walton, N.J., Wong, C.,1999b. Metabolism of N-alkyldiamines and N-alkylnortropinones bytransformed root cultures of Nicotiana and Brugmansia. Phytochem-istry 52, 855–869.
Breitling, R., Laubner, D., Adamski, J., 2001. Structure-based phyloge-netic analysis of short-chain alcohol dehydrogenases and reclassifica-tion of the 17beta-hydroxysteroid dehydrogenase family. Mol. Biol.Evol. 18, 2154–2161.
Brock, A., Bieri, S., Christen, P., Drager, B., 2005. Calystegines in wildand cultivated Erythroxylum species. Phytochemistry 66, 1231–1240.
Bruhn, J.G., 1989. The use of natural products in modern medicine. ActaPharm. Nordica 1, 117–130.
Drager, B., 1995. Identification and quantification of calystegines,polyhydroxyl nortropane alkaloids. Phytochem. Anal. 6, 31–37.
Drager, B., 2002. Analysis of tropane and related alkaloids. J. Chroma-togr. A 978, 1–35.
Drager, B., 2004. Chemistry and biology of calystegines. Nat. Prod. Rep.21, 211–223.
Drager, B., Schaal, A., 1994. Tropinone reduction in Atropa belladonna
root cultures. Phytochemistry 35, 1441–1447.Drager, B., Hashimoto, T., Yamada, Y., 1988. Purification and charac-
terization of pseudotropine forming tropinone reductase from Hyo-
scyamus niger root cultures. Agr. Biol. Chem. 52, 2663–2667.Drager, B., Portsteffen, A., Schaal, A., MacCabe, P.H., Peerless, A.-C.J.,
Robins, R.J., 1992. Levels of tropinone-reductase activities influencethe spectrum of tropane esters found in transformed root cultures ofDatura stramonium L. Planta 188, 581–586.
Drager, B., Funck, C., Hoehler, A., Mrachatz, G., Nahrstedt, A.,Portsteffen, A., Schaal, A., Schmidt, R., 1994. Calystegines as a newgroup of tropane alkaloids in Solanaceae. Plant Cell Tiss. Organ Cult.38, 235–240.
Drager, B., van Almsick, A., Mrachatz, G., 1995. Distribution ofcalystegines in several Solanaceae. Planta Med. 61, 577–579.
Filling, C., Berndt, K.D., Benach, J., Knapp, S., Prozorovski, T.,Nordling, E., Ladenstein, R., Jornvall, H., Oppermann, U., 2002.Critical residues for structure and catalysis in short-chain dehydro-genases/reductases. J. Biol. Chem. 277, 25677–25684.
Gaertner, D.E., Wendroth, S., Seitz, H.U., 1990. A stereospecific enzymeof the putative biosynthetic pathway of cardenolides. Characterizationof a progesterone 5b-reductase from leaves of Digitalis purpurea L.FEBS Lett. 271, 239–242.
Gaertner, D.E., Keilholz, W., Seitz, H.U., 1994. Purification, character-ization and partial peptide microsequencing of progesterone 5b-
reductase from shoot cultures of Digitalis purpurea. Eur. J. Biochem.225, 1125–1132.
Geiger, P.L., Hesse, K., 1833. Darstellung des Atropins. Ann. Pharm. 5,43.
Goldmann, A., Milat, M.L., Ducrot, P.H., Lallemand, J.Y., Maille, M.,Lepingle, A., Charpin, I., Tepfer, D., 1990. Tropane derivatives fromCalystegia sepium. Phytochemistry 29, 2125–2128.
Griffin, W.J., Lin, G.D., 2000. Chemotaxonomy and geographicaldistribution of tropane alkaloids. Phytochemistry 53, 623–637.
Haraguchi, M., Gorniak, S.L., Ikeda, K., Minami, Y., Kato, A., Watson,A.A., Nash, R.J., Molyneux, R.J., Asano, N., 2003. Alkaloidalcomponents in the poisonous plant, Ipomoea carnea (Convolvulaceae).J. Agric. Food Chem. 51, 4995–5000.
Hartmann, U., Sagasser, M., Mehrtens, F., Stracke, R., Weisshaar, B.,2005. Differential combinatorial interactions of cis-acting elementsrecognized by R2R3-MYB, BZIP, and BHLH factors control light-responsive and tissue-specific activation of phenylpropanoid biosyn-thesis genes. Plant Mol. Biol. 57, 155–171.
Hashimoto, T., Hayashi, A., Amano, Y., Kohno, J., Iwanari, H., Usuda,S., Yamada, Y., 1991. Hyoscyamine 6 beta-hydroxylase, an enzymeinvolved in tropane alkaloid biosynthesis, is localized at the pericycleof the root. J. Biol. Chem. 266, 4648–4653.
Hashimoto, T., Nakajima, K., Ongena, G., Yamada, Y., 1992. Twotropinone reductases with distinct stereospecificities from culturedroots of Hyoscyamus niger. Plant Physiol. 100, 836–845.
Hills, K.L., Bottomley, W., Mortimer, P.I., 1954. Variation in the mainalkaloids of Duboisia myoporoides and Duboisia leichhardtii. III.Duboisia leichhardtii. Aust. J. Appl. Sci. 5, 276–282.
Ikeda, K., Kato, A., Adachi, I., Haraguchi, M., Asano, N., 2003.Alkaloids from the poisonous plant Ipomoea carnea: effects onintracellular lysosomal glycosidase activities in human lymphoblastcultures. J. Agric. Food Chem. 51, 7642–7646.
Kallberg, Y., Oppermann, U., Jornvall, H., Persson, B., 2002. Short-chaindehydrogenase/reductase (SDR) relationships: a large family witheight clusters common to human, animal, and plant genomes. ProteinSci. 11, 636–641.
Keiner, R., Drager, B., 2000. Calystegine distribution in potato (Solanum
tuberosum) tubers and plants. Plant Sci. 150, 171–179.Keiner, R., Kaiser, H., Nakajima, K., Hashimoto, T., Drager, B., 2002.
Molecular cloning, expression and characterization of tropinonereductase II, an enzyme of the SDR family in Solanum tuberosum
(L.). Plant Mol. Biol. 48, 299–308.Koelen, K.J., Gross, G.G., 1982. Partial purification and properties of
tropine dehydrogenase from root cultures of Datura stramonium.Planta Med. 44, 227–230.
Ladenburg, A., 1881. Die naturlich vorkommenden mydriatisch wirken-den Alkaloide. Justus Liebigs Ann. Chem. 206, 274–307.
Lean, J.A., Ralph, C.S., 1944. Production of hyoscyamine from Duboisia
species. I. Methods of quantitative estimation. J. Proc. Royal Soc. NewSouth Wales 77, 96–98.
Lounasmaa, M., Tamminen, T., 1993. The tropane alkaloids. In: Cordell,G.A. (Ed.), The Alkaloids, vol. 44. Academic Press, New York, pp. 1–114.
Luckner, M., 1990. Secondary Metabolism in Microorganisms, Plants,and Animals. Gustav Fischer Verlag, Jena, p. 360.
Luckner, M., Wichtl, M., 2000. Digitalis. Wissenschaftlicher Verlagsge-sellschaft, Stuttgart.
Mahmoud, S.S., Croteau, R.B., 2003. Menthofuran regulates essential oilbiosynthesis in peppermint by controlling a downstream monoterpenereductase. Proc. Natl. Acad. Sci. USA 100, 14481–14486.
Mein, K., 1833. Ueber die Darstellung des Atropins in weißen Krystallen.Ann. Pharm. 6, 67–72.
Meissner, W., 1819. Ueber ein neues Pflanzenalkali (Alkaloid). Journal furChemie und Physik 25, 379–381.
Molyneux, R.J., McKenzie, R.A., O’Sullivan, B.M., Elbein, A.D., 1995.Identification of the glycosidase inhibitors swainsonine and calystegineB2 in Weir vine (Ipomoea sp. Q6 [aff. calobra]) and correlation withtoxicity. J. Nat. Prod. 58, 878–886.
336 B. Drager / Phytochemistry 67 (2006) 327–337
Nakajima, K., Hashimoto, T., 1999. Two tropinone reductases, thatcatalyze opposite stereospecific reductions in tropane alkaloid biosyn-thesis, are localized in plant root with different cell-specific patterns.Plant Cell Physiol. 40, 1099–1107.
Nakajima, K., Hashimoto, T., Yamada, Y., 1993. Two tropinonereductases with different stereospecificities are short-chain dehydro-genases evolved from a common ancestor. Proc. Natl. Acad. Sci. USA90, 9591–9595.
Nakajima, K., Hashimoto, T., Yamada, Y., 1994. Opposite stereospec-ificity of two tropinone reductases is conferred by the substrate-binding sites. J. Biol. Chem. 269, 11695–11698.
Nakajima, K., Yamashita, A., Akama, H., Nakatsu, T., Kato, H.,Hashimoto, T., Oda, J., Yamada, Y., 1998. Crystal structures of twotropinone reductases: different reaction stereospecificities in the sameprotein fold. Proc. Natl. Acad. Sci. USA 95, 4876–4881.
Nakajima, K., Kato, H., Oda, J., Yamada, Y., Hashimoto, T., 1999a. Site-directed mutagenesis of putative substrate-binding residues reveals amechanism controlling the different stereospecificities of two tropinonereductases. J. Biol. Chem. 274, 16563–16568.
Nakajima, K., Oshita, Y., Kaya, M., Yamada, Y., Hashimoto, T., 1999b.Structures and expression patterns of two tropinone reductase genesfrom Hyoscyamus niger. Biosci. Biotech. Biochem. 63, 1756–1764.
Nomura, T., Jager, C.E., Kitasaka, Y., Takeuchi, K., Fukami, M.,Yoneyama, K., Matsushita, Y., Nyunoya, H., Takatsuto, S., Fujioka,S., Smith, J.J., Kerckhoffs, L.H., Reid, J.B., Yokota, T., 2004.Brassinosteroid deficiency due to truncated steroid 5alpha-reductasecauses dwarfism in the lk mutant of pea. Plant Physiol. 135, 2220–2229.
Oppermann, U., Filling, C., Hult, M., Shafqat, N., Wu, X., Lindh, M.,Shafqat, J., Nordling, E., Kallberg, Y., Persson, B., Jornvall, H., 2003.Short-chain dehydrogenases/reductases (SDR): the 2002 update.Chem-Biol. Interact. 143–144, 247–253.
Parr, A.J., Walton, N.J., Bensalem, S., Mccabe, P.H., Routledge, W.,1991. 8-Thiabicyclo(3.2.1)octan-3-one as a biochemical tool in thestudy of tropane alkaloid biosynthesis. Phytochemistry 30, 2607–2610.
Portsteffen, A., Drager, B., Nahrstedt, A., 1992. Two tropinone reducingenzymes from Datura stramonium transformed root cultures. Phyto-chemistry 31, 1135–1138.
Portsteffen, A., Drager, B., Nahrstedt, A., 1994. The reduction oftropinone in Datura stramonium root cultures by two specific reduc-tases. Phytochemistry 37, 391–400.
Richter, U., Rothe, G., Fabian, A.-K., Rahfeld, B., Drager, B., 2005.Overexpression of tropinone reductases alters alkaloid composition inAtropa belladonna root cultures. J. Exp. Bot. 56, 645–652.
Rocha, P., Stenzel, O., Parr, A., Walton, N., Christou, P., Drager, B.,Leech, M.J., 2002. Functional expression of tropinone reductase I (trI)and hyoscyamine-6beta-hydroxylase (h6h) from Hyoscyamus niger inNicotiana tabacum. Plant Sci. 162, 905–913.
Schimming, T., Tofern, B., Mann, P., Richter, A., Jenett-Siems, K.,Drager, B., Asano, N., Gupta, M.P., Correa, M.D., Eich, E., 1998.Phytochemistry and chemotaxonomy of the Convolvulaceae. 6.Distribution and taxonomic significance of calystegines in the Con-volvulaceae. Phytochemistry 49, 1989–1995.
Schimming, T., Jenett-Siems, K., Mann, P., Tofern-Reblin, B., Milson, J.,Johnson, R.W., Deroin, T., Austin, D.F., Eich, E., 2005. Calystegines
as chemotaxonomic markers in the Convolvulaceae. Phytochemistry66, 469–480.
Schmidt, E., 1892. Ueber scopolamin. Arch. Pharm. 230, 207.Scholl, Y., Hoke, D., Drager, B., 2001. Calystegines in Calystegia sepium
derive from the tropane alkaloid pathway. Phytochemistry 58, 883–889.Scholl, Y., Schneider, B., Drager, B., 2003. Biosynthesis of calystegines:
15N NMR and kinetics of formation in root cultures of Calystegia
sepium. Phytochemistry 62, 325–332.Stenzel, O., Teuber, M., Drager, B., 2006. Putrescine N-methyltransferase
in Solanum tuberosum L., a calystegine-forming plant. Planta 223, 200–212.
Suzuki, K., Yamada, Y., Hashimoto, T., 1999. Expression of Atropa
belladonna putrescine N-methyltransferase gene in root pericycle. PlantCell Physiol. 40, 289–297.
Winkel-Shirley, B., 2001a. Flavonoid biosynthesis. A colorful model forgenetics, biochemistry, cell biology, and biotechnology. Plant Physiol.126, 485–493.
Winkel-Shirley, B., 2001b. It takes a garden. How work on diverse plantspecies has contributed to an understanding of flavonoid metabolism.Plant Physiol. 127, 1399–1404.
Yamada, Y., Hashimoto, T., Endo, T., Yukimune, Y., Kohno, J.,Hamaguchi, N., Drager, B., 1990. Biochemistry of alkaloid productionin vitro. In: Charlwood, B., Rhodes, M. (Eds.), Secondary Products inPlant Tissue Cultures. Oxford Science Publications, Oxford, pp. 227–341.
Yamashita, A., Endo, M., Higashi, T., Nakatsu, T., Yamada, Y., Oda, J.,Kato, H., 2003. Capturing enzyme structure prior to reactioninitiation: tropinone reductase-II-substrate complexes. Biochemistry42, 5566–5573.
Birgit Drager is professor at the MartinLuther University Halle-Wittenberg. Shestudied pharmacy, food chemistry, andplant biology at the University of Mun-ster. PhD studies in plant biochemistryand biotechnology under the supervisionof Professor Dr. Wolfgang Barz werefinished in 1986 with a thesis on phenyl-propanoid metabolism of photoautotro-phic and photomixotrophic cell cultures.Birgit Drager was appointed a post doc-toral research fellow at the ResearchCenter for Cell and Tissue Culture ofKyoto University in Japan. In the labo-
ratory of Professor Yasuyuki Yamada and Professor Takashi Hashimotoshe joined in studies on tropane alkaloids biosynthesis. In 1995, shereceived her Habilitation and venia legendi for Pharmaceutical Biologyfrom Munster University. She was appointed a full professor of Phar-maceutical Biology at Halle University in 1996. Her research areas aremedicinal natural compounds and biochemistry and molecular biology ofplants. One research goal is the understanding of tropane alkaloid bio-synthetic steps, the regulation and the evolution of tropane metabolismand the role that tropane alkaloids play in planta.
B. Drager / Phytochemistry 67 (2006) 327–337 337
Characterization of a GDP-D-mannose 300,500-epimerase from rice
Kentaroh Watanabe a, Kiyoshi Suzuki a, Shinichi Kitamura a,b,*
a Graduate School of Agriculture and Biological Sciences, Osaka Prefecture University, Gakuen cho 1-1, Sakai, Osaka 599-8531, Japanb Graduate School of Life and Environmental Sciences, Osaka Prefecture University, Gakuen cho 1-1, Sakai, Osaka 599-8531, Japan
Received 7 September 2005; received in revised form 24 October 2005
Abstract
The enzymatic characterization of GDP-D-mannose 300,500-epimerase (GME), a key enzyme in the biosynthesis of vitamin C in plants isdescribed. The GME gene (Genbank Accession No. AB193582) in rice was cloned, and expressed as a fusion protein in Escherichia coli.Reaction products from GDP-D-mannose, as produced by GME catalysis, were separated by recycling HPLC on an ODS column, andwere determined to be GDP-L-galactose and GDP-L-gulose, based on their NMR spectra and sugar analysis. The reaction catalyzed byGME was inhibited by GDP, and was strongly accelerated by NAD+ in contrast to the case of GME from Arabidopsis thaliana. Thisdifference in the effect of NAD+ on GME activity can be attributed to the NAD binding domain which is conserved in the rice gene, butnot in the Arabidopsis thaliana gene. The apparent Km and kcat were determined to be 1.20 · 10�5 M and 0.127 s�1, respectively, in thepresence of 20 lM NAD+. The fractions of GDP-D-mannose, GDP-L-galactose and GDP-L-gulose, at equilibrium, were approximately0.75, 0.20 and 0.05, respectively.� 2005 Elsevier Ltd. All rights reserved.
Keywords: Oryza sativa; Gramineae; Plant AsA biosynthetic pathway; GDP-D-mannose 300,500-epimerase; GDP-D-mannose; GDP-L-galactose;GDP-L-gulose
1. Introduction
GDP-L-galactose (3) is a nucleotide-sugar (Fig. 1) thatserves as a biosynthetic precursor of L-galactosyl residuesin polysaccharides and oligosaccharides in plants (Seifert,2004; Reuhs et al., 2004). The L-galactosyl residue whichis contained in cell wall polysaccharides, glycolipidsand glycoproteins in higher plants is a minor componentand little information is available concerning itsbiosynthesis.
It is also noteworthy that GDP-L-galactose (3) is alsorequired for the synthesis of L-ascorbic acid (AsA; vitaminC) in plants. It is well-known that AsA functions as anantioxidant and an enzymatic cofactor. AsA also playsimportant roles in many different processes, including pho-tosynthesis, photo-protection, stress resistance, control of
cell growth and biosynthesis of hormones and cell wall con-stituents (Davey et al., 2000; Conklin and Barth, 2004). Asshown in Fig. 1, Smirnoff and Wheeler proposed the AsAbiosynthetic pathway in plants, known as the Smirnoffand Wheeler pathway, in which AsA is synthesized fromD-mannose via GDP-D-mannose (1), GDP-L-galactose (3),L-galactose and L-galactono-1,4-lactone (Wheeler et al.,1998; Smirnoff and Wheeler, 2000; Smirnoff et al., 2001,2004). GDP-D-mannose 300,500-epimerase (GME), a keyenzyme in this pathway, catalyzes the synthesis of GDP-L-galactose (3) and GDP-L-gulose (2) from GDP-D-man-nose (1). GME was first isolated and characterized froma type of green algae, Chlorella pyrenoidosa (Barber,1975, 1979; Hebda et al., 1979; Hebda and Barber, 1982).In higher plants, GME activity has been reported in bothpea and Arabidopsis (Wheeler et al., 1998), and wasrecently cloned and characterized in Arabidopsis (Woluckaet al., 2001b; Wolucka and Van, 2003). The reactioncatalyzed by GME is possibly the rate limiting step in the
0031-9422/$ - see front matter � 2005 Elsevier Ltd. All rights reserved.
doi:10.1016/j.phytochem.2005.12.003
* Corresponding author. Tel.: +81 72 254 9457; fax: +81 72 254 9458.E-mail address: [email protected] (S. Kitamura).
www.elsevier.com/locate/phytochem
Phytochemistry 67 (2006) 338–346
PHYTOCHEMISTRY

AsA biosynthetic pathway in plants. Experiments with anArabidopsis cell suspension culture indicate that the ratelimiting step in AsA biosynthesis occurs between D-man-nose and L-galactose (Davey et al., 1999). Moreover, astrong correlation between GME reaction and accumula-tion of AsA has been reported in the colorless microalga,Prototheca moriformis (Running et al., 2003).
In this study, we report on the cloning, expression andcharacterization of GME from rice (Oryza sativa L.). Thereappears to be a large difference in the activity of thisenzyme between rice and Arabidopsis, which may involvea difference in amino acid sequence. We also attemptedto establish a method for the efficient separation and recov-ery of rare nucleotide-sugars, GDP-L-galactose (3) andGDP-L-gulose (2), which represent key compounds in theplant AsA biosynthesis pathway (the Smirnoff and Wheelerpathway).
2. Results and discussion
2.1. Characterization of the OsGME cDNA clone
The cloned cDNA, OsGME (Oryza sativa GDP-D-man-nose 300,500-epimerase), appeared to encode a polypeptide of378 amino acids. The peptide sequence, as deduced fromOsGME cDNA is assumed to contain neither a transmem-
brane domain nor a signal peptide sequence, from the pre-diction using the SOSUI program (Mitaku et al., 2002) andSignalP version 3.0 (Bendtsen et al., 2004). An analysis bymeans of iPSORT (Bannai et al., 2002) predicted that theproduct of OsGME was localized in the cytoplasm. Thecalculated molecular mass and isoelectric point forthe enzyme was 42,778 Da and 5.75, respectively.
Using the clustal W program (Thompson et al., 1994),the amino acid sequence deduced from OsGME indicateda 91% identity with that from Arabidopsis thaliana
(Fig. 2A), and the sequence of OsGME shared high simi-larities with putative GME from Zea mays (97%), Sorghum
bicolor (97%), Hordeum vulgare (93%), Triticum aestivum(92%), Lycopersicon esculentum (92% and 91%), Medicago
truncatula (91%), Lotus corniculatus var. japonicus (91%),Solanum tuberosum (91%), Mesembryanthemum crystalli-
num (90%), Glycine max (90%), and Nicotiana tabacum
(89%) at the amino acid level. Fig. 2B shows a phylogenetictree constructed from the multiple amino acid sequencealignment obtained for these plants. Such a high similaritybetween monocots and dicots is very unique and a charac-teristic of the GME enzyme. In addition, the GME gene is asingle gene, as no homologous gene has been found in thesame species except for Lycopersicon esculentum.
The OsGME enzyme contains consensus motifs for theepimerase/dehydratase family, GxxGxxG and YxxxK(Fig. 2A and C). The motifs, GxxGxxG and YxxxK have
Fig. 1. Schematic diagram of a possible pathway for the biosynthesis of GDP-L-galactose and AsA (L-ascorbic acid). Enzymes catalyzing the numberedreactions are: (1) mannose-6-phosphate isomerase (EC 5.3.1.8); (2) phosphomannomutase (EC 5.4.2.8); (3) GDP-D-mannose pyrophosphorylase (EC2.7.7.22); (4) GDP-L-galactose pyrophosphatase (Barber, 1971); (5) L-galactose-L-phospate phosphatase (Laing et al., 2004); (6) L-galactose dehydrogenase(Gatzek et al., 2002); (7) L-galactono-1,4-lactone dehydrogenase (EC 1.3.2.3); (8) GDP-L-gulose pyrophosphatase; (9) L-gulose-1-phosphate phosphatase;(10) L-gulose dehydrogenase; (11) L-gulono-1,4-lactone oxidase/dehydrogenase; (12) myo-inositol oxygenase (Lorence et al., 2004); (13) D-glucuronic acidreductase (EC 1.1.1.19); (14) aldono lactonase; (15) glycosyl transferase. When EC numbers are not shown in parenthesis, they have not yet been identified.(Baig et al., 1970; Conklin, 2001; Reiter and Vanzin, 2001; Valpuesta and Botella, 2004).
K. Watanabe et al. / Phytochemistry 67 (2006) 338–346 339

been reported to be the NAD-binding domain (Bellama-cina, 1996) and a catalytic domain having short-chaindehydrogenase activity forms a catalytic triad with Tyr,Lys and Ser upstream (Jornvall et al., 1995). These twomotifs may contribute to the first step in the dehydrataseand epimerase enzyme mechanisms which occurs viaabstraction of the 4-hydroxyl proton and hydride transferfrom the C4 position of the sugar to the NAD+ bound atthe GxxGxxG motif, i.e. to yield the nucleotide-4-ketosugar intermediate (Liu et al., 1997). In the GME reactionmechanism proposed by Barber (1979), using tritium-labeled water and GME from Chlorella pyrenoidosa, themannosyl residue of GDP-D-mannose was also convertedto a 4-keto sugar intermediate, this suggests that thesemotifs function as for other epimerase enzymes as well. Itshould also be noted that the GxxGxxG motif in Arabidop-sis is not conserved. In addition, the GxxGxxG motif inGME from dicot plants is replaced to GxxGxxA, exceptfor Mesembryanthemum crystallinum (Fig. 2C).
2.2. Identification of products of OsGME
The OsGME expressed in Escherichia coli was success-fully purified to apparent homogeneity as evidenced bySDS–PAGE (Fig. 3A). Two products, GDP-L-galactose(3) and GDP-L-gulose (2), generated from GDP-D-man-nose (1) by the action of the purified OsGME were alsoisolated and characterized. The maximum yield of theseproducts from the recombinant OsGME was 20–25%(Fig. 3B). As shown in Fig. 4, these products wereseparated by reversed-phase recycle HPLC. The GDP-D-mannose (1) was removed completely after three recy-cles. The reaction products were divided into three frac-tions, products 1, 2 and 3, respectively. These fractionswere collected after the 10th, 12th and 9th cycles,respectively.
Products 1–3 were identified by NMR spectroscopicanalysis. Published NMR data for GDP-D-rhamnose(Kneidinger et al., 2001) and GDP-L-fucose (Albermann
Fig. 2. Amino acid sequence alignment and phylogenetic analysis of GME. (A) Amino acid sequence alignments of GME proteins were aligned withOryza sativa AB193582 and Arabidopsis thaliana AX647945 by the pairwise method using the clustalW program (Thompson et al., 1994). Gaps (-) wereintroduced to achieve maximum similarity. Identical amino acid residues among the sequences are highlighted by an asterisk (*) under the residue. Theputative nicotinamide-adenine dinucleotide binding motif, GxxGxxG (Bellamacina, 1996), and a putative catalytic domain, Ser and YxxxK motif(Jornvall et al., 1995) are highlighted in each box. (B) A Neighbor-Joining tree derived from the amino acid sequences of GME from various plants. Thephylogenetic analysis was performed using the TreeView program. The amino acid sequences shown in these diagrams are listed in the DDBJ databaseunder the following GenBank Accession Nos. Oryza, AB193582; Zea mays, AX647973; Sorghum, AX647983; Hordeum, AX647987; Triticum, AX647985;Arabidopsis, AX647945; Mesembryanthemum, AX647975; Medicago, AX647981; Lotus, AX647989; Glycine, AX647977; Solanum, AX647979;Lycopersicon 1, AX647971; Lycopersicon 2, AX647997; Nicotiana, CQ809292. The bar indicates substitutions per site. Plant species which have theGxxGxxG motif conserved (see Fig. 1C) are highlighted in dashed box. (C) Two motif sequence alignments of GME protein among higher plants washighlighted. Oryza (rice), Hordeum (barley), Triticum (wheat), Zea mays (maize), and Sorghum (millet) are monocots. Mesembryanthemum (iceplant),Solanum (potato), Nicotiana (tobacco), Lycopersicon (tomato), Medicago (alfalfa), Lotus, Glycine (soybean), and Arabidopsis are dicots.
340 K. Watanabe et al. / Phytochemistry 67 (2006) 338–346

et al., 2000) were used in the identification of the prod-ucts. Table 1 indicates the assignments of the NMRspectra for products 2 and 3; GDP-L-galactose (3) andGDP-L-gulose (2). When GDP-L-galactose (3) was ana-lyzed by 1H and 13C NMR spectroscopy, the assignmentsof the proton and carbon signals were obtainedfrom 1H–1H correlation spectroscopy (COSY; Fig. 5B),13C–1H heteronuclear multiple quantum coherence(HMQC; Fig. 5A), 13C–1H heteronuclear multiple-bondcorrelation (HMBC; not shown), and HomonuclearHartmann–Hahn (HOHAHA; not shown). ConcerningGDP-L-gulose (2), the assignments of its proton reso-nances were determined by 1H NMR spectroscopy and1H–1H correlation spectroscopy (COSY; Fig. 5C). How-ever, the 1H NMR spectra of the product 1 showed onlyguanine and ribose, suggesting that the product 1 was anartifact derived from GDP sugars during the preparationfor HPLC. The proton–proton coupling constants3JH,H+1 for GDP-L-galactose (3) and GDP-L-gulose (2)are summarized in Table 1.
Data for sugar analysis by gas–liquid chromatographyis shown in Fig. 6. The retention times of the alditolacetate derivatives for authentic D-mannose, D-altrose,L-galactose, and L-gulose were 44.5, 45.5, 48.5, and52.5 min, respectively. D-Altrose is produced fromD-mannose by epimerization at C-3, which suggests thatGDP-D-altrose is one of the products produced byOsGME. The nucleotide sugars in the reaction mixtureof OsGME were hydrolyzed and the monosaccharidesproduced were converted to alditol acetates, with the lat-ter separated by GLC. As a result, we confirmed thepresence of D-mannose, L-galactose and L-gulose;however, no derivative of D-altrose was detected. Thissuggests that the epimerization step is during the conversionof GDP-D-mannose (1) to GDP-L-gulose (2) (C5 epimeriza-tion) and then GDP-L-galactose (3) (C3 epimerization).
Fig. 3. SDS–PAGE analysis of GME and the HPLC products of GMEreaction. (A) Aliquots of the fractions were loaded onto a 10% SDS–PAGE gel and subjected to electrophoresis. The gel was stained withCoomassie brilliant blue R-250. Lane M, size markers; lane 1, MBP-GMEfusion proteins purified by amylose resin; lane 2, GME and MBP proteinsdigested by Factor Xa; lane 3, GME protein purified by anion exchangechromatography. (B) Elution profiles of the products of the GME reactionwith 0.1 mM GDP-D-mannose for 5 min at 37 �C (pH 7.5) detected byHPLC analysis on the ODS column. Purified protein (1 lM) derived fromE. coli expressing a vector inserted the GME gene and an empty vector areshown, respectively.
Fig. 4. Recycle HPLC of the products by GME reaction. After partial purification of the GME reaction mixture, the sample was injected into therecycling HPLC system using a reversed phase column with monitoring and detection by UV absorbance at 254 nm. Six millimolar phosphoric acid and2 mM potassium chloride were used as the mobile phase (Wolucka et al., 2001a). As the peaks were separated, the purified product was discharged byoperating a valve. As a result, three products were purified and are denoted as products 1, 2 and 3, respectively.
K. Watanabe et al. / Phytochemistry 67 (2006) 338–346 341

2.3. Biochemical characterization of OsGME
The enzymatic properties of the purified OsGME wereexamined by measuring the amount of products that con-tained both GDP-L-galactose (3) and GDP-L-gulose (2).The maximum activity of the enzyme was observed at pH7.5–8.0 in the absence of NAD+; however, the optimalpH shifted to 8.0–8.5 when NAD+ was present. Similarly,the optimal temperature for the OsGME shifted to 25 �C(addition of NAD+) from 20 �C (no addition of NAD+),suggesting that NAD+ contributes to the stability ofOsGME.
The effects of the substrate concentration on activitywere examined by measuring enzyme activities with vary-ing concentrations of GDP-D-mannose. When no NAD+
was added, the apparent Km, kcat, and kcat/Km was7.12 · 10�6 M, 3.03 · 10�2 s�1, and 4.26 · 103 s�1 M�1,respectively. These values were changed to 1.20 · 10�5 M,0.127 s�1, and 1.06 · 104 s�1 M�1, respectively, when20 lM NAD+ was added. These kinetics data indicate thatthe OsGME enzyme has a high affinity for GDP-D-man-nose (1) and that the rate of the catalytic reaction fromGDP-D-mannose (1) to GDP-L-gulose (2) and GDP-L-galactose (3) is low. By the addition of NAD, the affinityfor the substrate decreases slightly and rate of the catalyticreaction increases, indicating that NAD+ contributes to theturnover in the OsGME reaction.
The effects of additives on OsGME activity wereexamined by measuring enzyme activities with variousadditives of nucleotides and nucleotide sugars (Table2). It is remarkable that NAD(P)+ and NAD(P)H acti-vated the enzyme reaction by more than twice and thatGDP inhibited it by more than 80%. Inhibition of theenzyme by GDP was reported in GME from Arabidopsis,which suggests that the configuration of GDP is signifi-cant for substrate recognition. In contrast to NAD+,when almost all other nucleotides or nucleotide pentosewere added, the inhibition of the OsGME reaction was
limited from 44% to 110%. It is clear that the activityof the OsGME reaction is stimulated by exogenouslyadded nicotinamide-adenine dinucleotides, especially theoxidized forms NAD+ and NADP+. However, it shouldbe noted that the GME from Arabidopsis (Wolucka andVan, 2003) is inactivated by the reduced forms, NADHand NADPH. Moreover, the degrees with whichNAD+ and NADP+ contribute to the increase in activitydiffer greatly in rice (805% and 531% of control, respec-tively) and Arabidopsis (145% and 110% of control,respectively). These differences in the effect of nicotin-amide-adenine dinucleotides between the Arabidopsis
GME and OsGME can be attributed to differencesin their affinities for NAD+. As mentioned above, aNAD-binding motif is conserved in rice, but not inArabidopsis.
Equilibrium ratios of GDP-D-mannose (1), GDP-L-galactose (3) and GDP-L-gulose (2) in the reaction cata-lyzed by OsGME were determined by monitoring theamount of these substances produced or consumed in thereaction (Fig. 7). Using a reversed-phase recycle HPLC,we were able to separate and collect the enzymatic prod-ucts, GDP-L-galactose (3) and GDP-L-gulose (2). Thus,we also performed enzymatic reactions using GDP-L-galac-tose (3) and GDP-L-gulose (2) as substrates. No differencesin the equilibrium ratios of the reaction catalyzed byOsGME were observed. The equilibrium ratios of GDP-D-mannose (1), GDP-L-galactose (3) and GDP-L-gulose(2) were approximately 75%, 20% and 5%, respectively.These equilibrium ratios were not changed by the additivesshown in Table 2. Interestingly, only when GDP-L-gulose(2) was used as a substrate (Fig. 7C), the ratio of GDP-L-galactose (3) temporarily increased to more than the equi-librium ratio of GDP-L-galactose (3) before equilibrium.
It should be finally noted that although this enzyme isconsidered to be involved in ascorbic acid synthesis via L-galactose; however, the genetic evidence for this usingtransgenic plants will be required to clarify its role in rice.
Table 11H and 13C NMR assignments for GDP-L-galactose (3) and GDP-L-gulose (2)
Sugar residue 1 2 3 4 5 6
b-D-ribose 1H 5.95a 4.77 4.54 4.37 4.23 (2·)13C 87.8 74.8 71.4 84.7 66.43JH,H+1 6.1b 5.8 3.7 2.6 4.9
b-L-galactose 1H 4.97 3.62 3.69 3.93 3.75 3.75, 3.8213C 99.5 72.2 73.3 69.6 76.9 62.23JH,H+1 7.9 10 3.4 3.4 3.4
b-L-gulose 1H 5.30 3.76 4.11 3.84 4.08 3.74, 3.813JH,H+1 8.1 3.2 3.4 2.7 4.1
Nucleotide residue 2 4 5 6 8
Guanine 1H 8.1313C 155.0 152.7 117.2 160.0 138.5
a Chemical shifts (parts per million) of 1H and 13C NMR signals.b JH,H+1 (Hz) value of 1H NMR signal for nucleotide sugars.
342 K. Watanabe et al. / Phytochemistry 67 (2006) 338–346

3. Experimental
3.1. Cloning of the OsGME gene
An annotation of the coding sequences of the Oryza
sativa GDP-D-mannose 3,5-epimerase (OsGME) gene was
performed, comparing the rice genome sequences withthe GME gene sequence of Arabidopsis thaliana (GenbankAccession No. AX647945) using the BLAST program(Altschul et al., 1990). One candidate for the OsGME gene(Genbank Accession No. AB193582) was found, with ahomology to the Arabidopsis gene sequence of 80%. Toobtain cDNA of the OsGME gene, total RNA was isolated14 days postanthesis from the japonica rice (Oryza sativa
L.) variety Nipponbare, that had been grown in a green-house from May to September, 2001 (Suzuki et al.,2004). First-strand cDNA synthesis was carried out using5 lg of the total RNA with the OsGME-specific primer(5-GAGGAGCTGATTGATCTTCATGGTG-3) accord-ing to the protocol of the SuperScript First-Strand Synthe-sis System (Invitrogen, Tokyo, Japan). The reactionmixture was used as a template for PCR in a iCycler (BioRad Laboratories, Hercules, CA). The candidate genewas amplified with a set of specific primers, S-1 (5 0-GAT-CCCTCTCCGACCGACCAAG-3) and A-1 (5-GAG-GAGCTGATTGATCTTCATGGTG-3) in a volume of50 ll containing the cDNA template and LA Taq polymer-ase (Takara-Bio, Shiga, Japan). The PCR program was 35cycles at 95 �C for 1 min and 62 �C for 2 min, followed byincubation at 72 �C for 4 min. Five microliters of PCRproduct was analyzed by electrophoresis on a 1% agarosegel with ethidium bromide staining. The nucleotidesequence was then determined.
Fig. 5. Two-dimensional HMQC and H-H cosy. Panel A, a partial two-dimensional HMQC spectrum of GDP-L-galactose in D2O shows thesingle bond 13C–1H correlations arising from the ribose protons andthe pyranose protons to their respective carbons. Panels B and C show theconnectivities in the ribose and pyranose moieties of GDP-L-galactose andGDP-L-gulose, respectively. The 1H and 13C spectroscopic assignments arelisted in Table 1.
Fig. 6. Sugar analysis by GLC. A GLC of alditol acetates of L-galactoseand L-gulose. The GME reaction mixture was hydrolyzed and themonosaccharides converted to alditol acetates. The peaks at 15.1 min,44.1 min, 47.7 min, and 52.4 min correspond to alditol acetates of ribose,D-mannose, L-galactose, and L-gulose, respectively. Within the framework,references of alditol acetates of D-mannose, D-altorose, L-galactose, and L-gulose are shown.
K. Watanabe et al. / Phytochemistry 67 (2006) 338–346 343

3.2. Expression and purification of recombinant enzyme
The coding region of the cloned cDNA of GME wasamplified with the following set of specific primers,compS-1 (5 0-AACAACCTCGGGATCGAGGGAAGGA-TGGGGAGCTCGGAGAAGAAC-3 0) and compA-1(50-CGCGGATCCTTACTCCTTGCCATCGGCAGC-30),which contain restriction sites for BsoBI and BamHI,respectively. This product was inserted between the BsoBIand BamHI sites of pMAL-C2X (New England Biolabs,Beverly, MA). The construct that subcloned OsGME genein pMAL-C2X and insert-free pMAL-C2X (negative con-trol) was transformed to E. coli JM109. The E. coli cellswere grown at 37 �C, and the production of recombinantprotein was induced by treatment with 1 mM isopropylb-D-thiogalactopyranoside for 6 h. The E. coli cells wereharvested and sonicated in a buffer containing 50 mMTris–HCl buffer (pH 8.0), 50 mM NaCl, 1 mM EDTA,and 1 mM DTT. The crude soluble extract was placed onan amylose resin column (New England Biolabs), withthe latter washed with 10 mM Tris–HCl buffer, pH 7.4,containing 0.8% NaCl and 0.02% KCl; the bound proteinwas then eluted with the same buffer containing 10 mMmaltose. The purified recombinant enzyme (1 mg) wasdigested with 10 lg of Factor Xa (Haematologic Technol-ogies, Vermont, USA) at 4 �C for 24 h in order to splitoff the fused maltose binding protein. The sample was
applied onto a TOYOPEARL SuperQ-650M (Tosoh,Tokyo, Japan) column with 10 mM Tris–HCl buffer (pH7.5), and eluted with a linear gradient of 10–500 mMTris–HCl. Active fractions were collected, with the purifiedrecombinant enzyme examined for purity, specific activity,and substrate specificity. The concentration of GMEobtained was determined by the Bradford method (Brad-ford, 1976).
3.3. Enzymatic reaction and NMR spectroscopic analysis of
products
In order to identify products formed by the action of therecombinant enzyme, a relatively large scale reaction wasemployed. A reaction mixture consisting of 40 mMTris–HCl buffer, pH 7.5, 40 mg of GDP-D-mannose (Cal-biochem, Darmstadt, Germany), and 31 mg of the recom-binant GME in a final volume of 15 ml was incubated at
Fig. 7. Time courses of the GME reaction. Transition of GDP-D-mannose(1) (d), GDP-L-galactose (3) (h) and GDP-L-gulose (2) (m) in the GMEenzyme reaction. The enzyme reaction was performed in 40 mM Tris–HClbuffer (pH 8) at 20 �C using 0.1 mM substrate. Panels A–C show moment-to-moment change using GDP-D-mannose (1) (d), GDP-L-galactose (3)(h) and GDP-L-gulose (2) (m) as a substrate, respectively.
Table 2Effects of additives on GME activities
Additives Reaction rate (%)
Water 100NAD 805[0.11]a
NADH 240[14]a
NADP 531[0.51]a
NADPH 297[2.0]a
GMP 94GDP 19[1.0]b
GTP 74AMP 73ADP 64ATP 68CMP 51CDP 54CTP 52TMP 44TDP 55TTP 57UMP 44UDP 58UTP 64D-mannose 67UDP-glucose 104UDP-galactose 110UDP-xylose 79UDP-arabinose 83GDP-fucose 73
a Concentration (lM) of additive required for 200% activation of theenzyme reaction.
b Concentration (lM) of additive required for 50% inhibition of theenzyme reaction.
344 K. Watanabe et al. / Phytochemistry 67 (2006) 338–346

37 �C for 30 min. To terminate the enzyme reaction, theenzymes were removed using Centriprep filter devices witha molecular weight cut-off of 10,000 (Millipore, Bedford,MA), and the synthesized products were confirmed byHPLC analysis on an ODS column (UK-C18; 20 mmi.d. · 250 mm; Imtakt, Kyoto, Japan). Concerning thepurification of the synthesized products, they were roughlyfractionated by HPLC and the absorbance of the eluatewas monitored at 254 nm. The roughly purified productswere separated again by a recycle HPLC system using aUK-C18 column. A solution of 6 mM phosphoric acidand 2 mM potassium chloride was used for the mobilephase (Wolucka et al., 2001a) in both the standard HPLCsystem and the recycling HPLC system. Each of the threetypes of products were absorbed on a SuperQ Toyopearl650M column in H2O and eluted with 0.3 M NaCl. Finally,each product was desalted on a Sephadex G-10 gel filtra-tion chromatography column (Pharmacia, Freiburg, Ger-many) and lyophilized.
Lyophilized samples were dissolved in D2O and re-lyophilized, and then dissolved in D2O. Spectra wererecorded at 25 �C at 400 MHz for 1H and at 100 MHzfor 13C NMR using JNM-AL400 and JNM-A500 spec-trometers (JEOL, Tokyo, Japan). The analysis of the spec-tra obtained by measurement of 1H–1H correlatedspectroscopy (COSY), 13C–1H heteronuclear multiplequantum coherence (HMQC), 13C–1H heteronuclear multi-ple-bond correlation (HMBC), and Homonuclear Hart-mann–Hahn (HOHAHA) were performed using theALICE software program (JEOL, Tokyo, Japan).
3.4. Gas–liquid chromatography for sugar analysis
Nucleotide sugars were hydrolyzed by treatment withtrifluoroacetic acid at 100 �C for 6 h, and the monosaccha-rides were converted to alditol acetates by reduction, fol-lowed by treatment with acetic anhydride in an equalvolume of pyridine at 120 �C for 2 h. Separation of thealditol acetates was carried out on a chromatographicdevice GC-17A (Shimadzu, Kyoto, Japan) on a DB-225column (J&W scientific, Folsom, CA). One microliter ofthe sample was injected under split conditions at an oventemperature of 180 �C. After 45 min at 180 �C, the oventemperature was raised to 200 �C at 2 �C/min, and heldat 200 �C for 15 min. The injector and detector tempera-tures were 230 �C.
3.5. Enzyme assay
The activity of the GME enzyme was determined bymonitoring the formation of both GDP-L-galactose (3)and GDP-L-gulose (2) from GDP-D-mannose (1). In a typ-ical run, the reaction mixture contained 40 mM Tris–HClbuffer (pH 8.0), 10 lM GDP-D-mannose, 10 lM NAD+,and enzyme. In a study of the effect of nucleotide andnucleotide sugars on GME activity, the GME proteinwas separately mixed with each additive for 10 min at
20 �C, and the reaction was then started by the additionof GDP-D-mannose. After incubation at 20 �C for one to15 min, the reaction was terminated by dipping the mixtureinto a heated block at 100 �C for 1 min. The reaction prod-ucts were subjected to reversed phase HPLC on an ODScolumn (4.6 mm i.d. · 250 mm; Imtakt). The mobile phasesolution was a mixture of H2O–Et3N–AcOH (100:0.2:0.1,v:v:v) that had been filtered and degassed under reducedpressure, prior to use. Separation was carried out isocrati-cally at a flow rate of 0.8 ml/min at 37 �C, and the respec-tive samples were detected by their absorption at awavelength of 254 nm. In the kinetic studies, the trials wereperformed in triplicate, at a minimum and the standarderrors were less than 10%. Primary initial velocity datawere fitted to the Michaelis–Menten equation by non-linear regression (Origin, version 5.0).
References
Albermann, C., Distler, J., Piepersberg, W., 2000. Preparative synthesis ofGDP-b-L-fucose by recombinant enzymes from enterobacterialsources. Glycobiology 10, 875–881.
Altschul, S.F., Gish, W., Miller, W., Myers, E.W., Lipman, D.J., 1990.Basic local alignment search tool. J. Mol. Biol. 215, 403–410.
Baig, M.M., Kelly, S., Loewus, F., 1970. L-Ascorbic acid biosynthesis inhigher plants from 4-lactone and 4-lactone. Plant Physiol. 46, 277–280.
Bannai, H., Tamada, Y., Maruyama, O., Nakai, K., Miyano, S., 2002.Extensive feature detection of N-terminal protein sorting signals.Bioinformatics 18, 298–305.
Barber, G.A., 1971. The synthesis of L-glucose by plant enzyme systems.Arch. Biochem. Biophys. 147, 619–623.
Barber, G.A., 1975. The synthesis of guanosine 50-diphosphate-l-galactoseby extracts of Chlorella pyrenoidosa. Arch. Biochem. Biophys. 167,718–722.
Barber, G.A., 1979. Observations on the mechanism of the reversibleepimerization of GDP-D-mannose to GDP-L-galactose by an enzymefrom Chlorella pyrenoidosa. J. Biol. Chem. 254, 7600–7603.
Bellamacina, C.R., 1996. The nicotinamide dinucleotide binding motif: acomparison of nucleotide binding proteins. FASEB J. 10, 1257–1269.
Bendtsen, J.D., Nielsen, H., Heijne, G., Brunak, S., 2004. Improvedprediction of signal peptides: SignalP 3.0. J. Mol. Biol. 340, 783–795.
Bradford, M.M., 1976. A rapid and sensitive method for the quantitationof microgram quantities of protein utilizing the principle of protein-dye binding. Anal. Biochem. 72, 248–254.
Conklin, P.L., 2001. Recent advances in the role and biosynthesis ofascorbic acid in plants. Plant Cell Environ. 24, 383–394.
Conklin, P.L., Barth, C., 2004. Ascorbic acid, a familiar small moleculeintertwined in the response of plants to ozone, pathogens, and theonset of senescence. Plant Cell Environ. 27, 959–970.
Davey, M.W., Gilot, C., Persiau, G., Ostergaard, J., Han, Y., Bauw, G.C.,Van, M.M.C., 1999. Ascorbate biosynthesis in Arabidopsis cellsuspension culture. Plant Physiol. 121, 535–543.
Davey, M.W., Van, M.M., Inze, D., Sanmartin, M., Kanellis, A.,Smirnoff, N., Benzie, I.J.J., Strain, J.J., Favell, D., Fletcher, 2000.Plant L-ascorbic acid: chemistry, function, metabolism, bioavailabilityand effects of processing. J. Sci. Food Agric. 80, 825–860.
Gatzek, S., Wheeler, G.L., Smirnoff, N., 2002. Antisense suppression of L-galactose dehydrogenase in Arabidopsis thaliana provides evidence forits role in ascorbate synthesis and reveals light modulated L-galactosesynthesis. Plant J. 30, 541–553.
Hebda, P.A., Behrman, E.J., Barber, G.A., 1979. The guanosine 5 0-diphosphate D-mannose: guanosine 5 0-diphosphate L-galactoseepimerase of Chlorella pyrenoidosa. Chemical synthesis of guanosine
K. Watanabe et al. / Phytochemistry 67 (2006) 338–346 345

50-diphosphate L-galactose and further studies of the enzyme and thereaction it catalyzes. Arch. Biochem. Biophys. 194, 496–502.
Hebda, P.A., Barber, G.A., 1982. GDP-D-mannose: GDP-L-galactoseepimerase from Chlorella pyrenoidosa. Meth. Enzymol. 83, 522–525.
Jornvall, H., Persson, B., Krook, M., Atrian, S., Gonzalez-Duarte, R.,Jeffery, J., Ghosh, D., 1995. Short-chain dehydrogenases/reductases(SDR). Biochemistry 34, 6003–6013.
Kneidinger, B., Graninger, M., Adam, G., Puchberger, M., Kosma, P.,Zayni, S., Messner, P., 2001. Identification of two GDP-6-deoxy-D-lyxo-4-hexulose reductases synthesizing GDP-D-rhamnose in Aneu-
rinibacillus thermoaerophilus L420-91T. J. Biol. Chem. 276, 5577–5583.
Laing, W.A., Bulley, S., Wright, M., Cooney, J., Jensen, D., Barraclough,D., MacRae, E., 2004. A highly specific L-galactose-1-phosphatephosphatase on the path to ascorbate biosynthesis. Proc. Natl. Acad.Sci. USA 101, 16976–16981.
Liu, Y., Thoden, J.B., Kim, J., Berger, E., Gulick, A.M., Ruzicka, F.J.,Holden, H.M., Frey, P.A., 1997. Mechanistic roles of tyrosine 149 andserine 124 in UDP-galactose 4-epimerase from Escherichia coli.Biochemistry 36, 10675–10684.
Lorence, A., Chevone, B.I., Mendes, P., Nessler, C.L., 2004. myo-Inositoloxygenase offers a possible entry point into plant ascorbate biosyn-thesis. Plant Physiol. 134, 1200–1205.
Mitaku, S., Hirokawa, T., Tsuji, T., 2002. Amphiphilicity index of polaramino acids as an aid in the characterization of amino acid preferenceat membrane-water interfaces. Bioinformatics 18, 608–616.
Reiter, W.D., Vanzin, G.F., 2001. Molecular genetics of nucleotide sugarinterconversion pathways in plants. Plant Mol. Biol. 47, 95–113.
Reuhs, B.L., Glenn, J., Stephens, S.B., Kim, J.S., Christie, D.B., Glushka,J.G., Zablackis, E., Albersheim, P., Darvill, A.G., O’Neill, M.A., 2004.L-Galactose replaces L-fucose in the pectic polysaccharide rhamnoga-lacturonan II synthesized by the L-fucose-deficient mur1 Arabidopsis
mutant. Planta 219, 147–157.Running, J.A., Burlingame, R.P., Berry, A., 2003. The pathway of L-
ascorbic acid biosynthesis in the colourless microalga Prototheca
moriformis. J. Exp. Bot. 54, 1841–1849.
Seifert, G.J., 2004. Nucleotide sugar interconversions and cell wallbiosynthesis: how to bring the inside to the outside. Curr. Opin. PlantBiol. 7, 277–284.
Smirnoff, N., Wheeler, G.L., 2000. Ascorbic acid in plants: biosynthesisand function. Crit. Rev. Biochem. Mol. 35, 291–314.
Smirnoff, N., Conklin, P.L., Loewus, F.A., 2001. Biosynthesis of ascorbicacid in plants: A renaissance. Annu. Rev. Plant Physiol. Mol. Biol. 52,437–467.
Smirnoff, N., Running, J.A., Gatzak, S., 2004. Ascorbate biosynthesis: adiversity of pathways. In: Asard, H., May, J.M., Smirnoff, N. (Eds.),Vitamin C: Functions and Biochemistry in Animals and Plants. BIOSScientific Publishers, London & New York, pp. 7–29.
Suzuki, K., Watanabe, K., Masumura, T., Kitamura, S., 2004. Charac-terization of soluble and putative membrane-bound UDP-glucuronicacid decarboxylase (OsUXS) isoforms in rice. Arch. Biochem.Biophys. 431, 169–177.
Thompson, J.D., Higgins, D.G., Gibson, T.J., 1994. CLUSTAL W:improving the sensitivity of progressive multiple sequence alignmentthrough sequence weighting, position-specific gap penalties and weightmatrix choice. Nucl. Acids. Res. 22, 4673–4680.
Valpuesta, V., Botella, M.A., 2004. Biosynthesis of L-ascorbic acid inplants: new pathways for an old antioxidant. Trends Plant Sci. 9, 573–577.
Wheeler, G.L., Jones, M.A., Smirnoff, N., 1998. The biosynthetic pathwayof vitamin C in higher plants. Nature 393, 365–369.
Wolucka, B.A., Davey, M.W., Boerjan, W., 2001a. A high-performanceliquid chromatography radio method for determination of L-ascorbicacid and guanosine 5 0-diphosphate-L-galactose, key metabolites of theplant vitamin C pathway. Anal. Biochem. 294, 161–168.
Wolucka, B.A., Persiau, G., Van, D.J., Davey, M.W., Demol, H.,Vandekerckhove, J., Van, M.M., Zabeau, M., Boerjan, W., 2001b.Partial purification and identification of GDP-mannose 300,500-epimer-ase of Arabidopsis thaliana, a key enzyme of the plant vitamin Cpathway. Proc. Natl. Acad. Sci. USA 98, 14843–14848.
Wolucka, B.A., Van, M.M., 2003. GDP-mannose 3 0,5 0-epimerase formsGDP-L-gulose, a putative intermediate for the de novo biosynthesis ofvitamin C in plants. J. Biol. Chem. 278, 47483–47490.
346 K. Watanabe et al. / Phytochemistry 67 (2006) 338–346

Isolation and characterisation of a Salvia bogotensis seedlectin specific for the Tn antigen
Nohora Vega, Gerardo Perez *
Biochemistry Laboratory, Chemistry Department, Universidad Nacional de Colombia, Bogota, Colombia
Received 12 August 2005; received in revised form 30 September 2005
Abstract
A lectin was isolated and characterised from Salvia bogotensis seeds. Removal of the abundant pigments and polysaccharides, whichare present in seeds, was an essential step in its purification. Several procedures were assayed and the best suited, including Pectinex treat-ment, DEAE-cellulose and affinity chromatography, led to a protein being obtained amounting to 18–20 mg/100 g seeds having highspecific agglutination activity (SAA). The lectin specifically agglutinated human Tn erythrocytes and was inhibited by 37 mM GalNAc,0.019 mM ovine submaxillary mucin (OSM) or 0.008 mM asialo bovine submaxillary mucin (aBSM). Enzyme-linked lectinosorbentassay (ELLSA) revealed strong binding to aOSM and aBSM, corroborating Tn specificity, whereas no binding to fetuin or asialo fetuinwas observed. The lectin’s monomer MW (38,702 Da), amino acid composition, pI, carbohydrate content, deglycosylated form MW,thermal stability and Ca2+ and Mn2+ requirements were determined. Evidence of the existence of two glycoforms was obtained. Thelectin’s specificity and high affinity for the Tn antigen, commonly found in tumour cells, makes this protein a useful tool for immuno-histochemical and cellular studies.� 2005 Elsevier Ltd. All rights reserved.
Keywords: Salvia bogotensis; Lamiaceae; Lectin; Characterisation; Isolation; Tn antigen
1. Introduction
In the course of their research into lectins, Bird’s group(Bird and Wingham, 1974; Bird and Wingham, 1976, 1977)found lectins able to specifically recognise the Tn antigen(GalNAc-O-Ser/Thr) in several Old World species of Sal-via (Lamiaceae); this antigen is responsible for the erythro-cyte polyaggutinability shown by some individuals and hasbeen identified as being a tumour cell marker (Springer,1984; Lisowska, 1995). The latter is useful in diagnosiswhen following-up the evolution of several types of cancer.The Tn epitope has also been detected on human immuno-deficiency virus gp160 and gp120 proteins (Hansen et al.,1991).
Detailed studies, using Lamiaceae lectins, have been car-ried out on a few species from the Northern hemisphere’stemperate zone. The lectin from Salvia sclarea seeds(SSL) was the first to be isolated and partially characterised(Piller et al., 1986). This established its specific binding to
0031-9422/$ - see front matter � 2005 Elsevier Ltd. All rights reserved.
doi:10.1016/j.phytochem.2005.11.028
Abbreviations: ABTS, 2,20-azino-bis (3-ethylbenzthiazoline-6-sulfonicacid); aBSM, asialo bovine submaxillary mucin; BCA, bicinchoninic acid;BSA, bovine serum albumin; BSM, mucin; ConA, Concanavalin A; DAB,diaminobenzamidine; DDCA, diethyldithiocarbamic acid; DTT, dithio-threitol; EGTA, ethylene glycol-O,-O0-bis (2-amino-ethyl)-N,N,N 0,N 0-tet-raacetic acid; ELLSA, enzyme-linked lectinosorbent assay; EME,enzymatically modified erythrocytes; ERL, Erythrina rubrinervia lectin;SBoL, Salvia bogotensis lectin; SSL, Salvia sclarea lectin; MeCN, aceto-nitrile; MLL, Moluccella laevis lectin; GLL, Galactia lindenii lectin; DLL-II, Dioclea lehmanni lectin II; OSM, ovine submaxillary mucin; aOSM,asialo ovine submaxillary mucin; PVPP, polyvinylpolypyrrolidone; RBC,red blood cell; RT, room temperature; SAA, specific agglutination activ-ity; SDS, sodium dodecyl sulphate; VVB4, Vicia villosa isolectin B4; TBS,Tris buffer saline; TFA, trifluoroacetic acid; Gleheda, Glechoma hederacea
lectin.* Corresponding author. Tel.: +57 1 3165000x14465/14470; fax: +57 1
3165220.E-mail address: [email protected] (G. Perez).
www.elsevier.com/locate/phytochem
Phytochemistry 67 (2006) 347–355
PHYTOCHEMISTRY

both native Tn red blood cells (RBCs) and enzyme-treatedRBCs, as well as the inhibitory potential to a variety of car-bohydrates, Synsorb-coupled synthetic glycopeptides,BSM, and aBSM. Several molecular features of SSL havebeen described, such as MW and N-linked oligosaccharidestructures (Medeiros et al., 2000); competition bindingstudies with soluble synthetic glycopeptides have alsohelped to define the density requirements of Tn structures.
A lectin from Moluccella laevis (MLL) has been isolated(Lis et al., 1988). Besides recognising AMM and ONN
erythrocytes, the lectin binds strongly to Tn-bearing glyco-proteins (Duk et al., 1992), Tn-bearing lymphocytes (Thurn-her et al., 1993) and glycosphingolipids (Teneberg et al.,1994). Analysis of the lectin’s structural features revealed aunique subunit composition (Alperin et al., 1992), makingit an unusual lectin. Wang et al. (2003a) have recently founda lectin (Gleheda) in Glecoma hederacea leaves which readilyinteracts with O-glycans linked to asialo mucin or asialo fet-uin in which Gal/GalNAc are terminally exposed. Theauthors used sequence and molecular modelling studies todemonstrate that Gleheda is structurally and evolutionarilyrelated to legume lectins. A potentially interesting develop-ment arises from the insecticidal properties presented bythe lectin (Wang et al., 2003b).
Botanical studies have revealed the presence of around190 Lamiaceae species in Colombia, Salvia being the mostdiverse genus as it has 75 species (Wood and Harley, 1989;Fernandez-Alonso, 2003). We have recently carried out anextensive survey of six genera and 40 taxa as no data wasavailable concerning the presence of lectins in Colombianspecies of Lamiaceae (Fernandez-Alonso et al., 2003). Thisstudy revealed both the presence of lectins able to recog-nise the Tn antigen in more than 80% of the studied spe-cies and remarkable differences in lectin activity within agiven genus (i.e. eight out of 19 Salvia species had morethan 80% activity levels). Considering the potential appli-cations of anti-Tn lectins, we chose the Salvia bogotensis
(Benth.) species for this study, taking its endemic characterinto account (wide distribution throughout the easternColombian Cordillera), the availability of substantialamounts of seeds and its high lectin activity (98%). Thiswork describes isolating and characterising S. bogotensis
lectin (SBoL) as a first step in studying its interaction withTn-bearing cells.
2. Results and discussion
2.1. Lectin extraction
Removing troublesome abundant pigments which usu-ally appear in Lamiaceae seed protein extracts was anessential purification step when obtaining lectin. The prob-lems pertained to reduced protein solubility, inadequateassessment of elution profiles if followed by absorption at280 nm and inaccurate determination of A280
1% values whichcould be used for calculating lectin content in seeds.
Treatment with 0.1 M ascorbic acid, 2% polyvinylpoly-pyrrolidone (PVPP) or 0.5% diethyldithiocarbamic acid(DDCA) appreciably reduced the lectin’s activity (datanot shown) with no significant reduction of pigment inthe extract. This loss of activity, particularly with PVPP,has been observed in our laboratory with other proteins(Salvia palifolia or Hyptis mutabilis lectins); it is likelythat this was due to protein adsorption on PVPP. Thetotal loss of activity when including dithiotreitol (DTT)indicated the presence of disulphide bridges in theprotein.
The best results were obtained by including 5 mM thio-urea in PBS pH 7.2 and in dialysis solutions, which reducedthe amount of polyphenols by inhibiting polyphenoloxidases (Van Driessche et al., 1983) whilst keeping the lec-tin’s activity unaltered (79%). Most remaining pigmentswere effectively removed by DEAE-cellulose and DEAE-Sephadex during subsequent purification steps. Thisapproach has proved very effective in our hands whenworking with highly pigmented extracts from several Lam-iaceae species. It is likely that improved yields and higherspecific agglutination activities than those obtained withpreviously described Lamiaceae seed lectins (Piller et al.,1986; Alperin et al., 1992) have been due to the isolationprocedure described in this work.
There was 2.09% nitrogen content in seeds, amountingto 13.1% crude protein which is lower than that of mostlegume seeds; with the exception of S. palifolia (15.7%)and S. rubescens (19.6%) (Filgueira and Aldana, personalcommunication), no data is currently available for otherSalvia seeds. Non-protein nitrogen accounted for 0.11%;net protein content in seeds was thus 12.3%.
2.2. Lectin purification
Precipitation assays using PBS extracts showed that thelectin precipitated at 50% ethanol presenting 70–80% activ-ity as determined by ELLSA. Higher ethanol concentra-tions did not precipitate the lectin further as opposed toSSL behaviour which precipitated at 80% ethanol (Pilleret al., 1986). Dissolving the resulting precipitate led to avery viscous solution being formed, due to pectin-like poly-saccharides which are present in nearly all Salvia speciesand which usually hamper detecting lectin (Fernandez-Alonso et al., 2003); viscosity diminished after digestionwith Pectinex and chromatography over DEAE-Sephadex(at an improved flow) yielded a non-retained peak in whichlectin activity was readily detected (52%), even at low pro-tein concentrations.
Affinity chromatography on aBSM-Sepharose 4B of thenon-retained DEAE-Sephadex peak yielded two fractions(Fig. 1a); the first (I) was devoid of lectin activity (6.7%,1.9 mg protein/ml) and the second (II), eluted by pH11.4, presented 71–78% activity (0.4–0.5 mg protein/ml)after dialysis, as well as high Tn-specific agglutinationactivity (Table 1). The minor peak eluting before fractionII was devoid of lectin activity and was therefore discarded.
348 N. Vega, G. Perez / Phytochemistry 67 (2006) 347–355

Subsequent chromatography on DEAE-Sepharose(Fig. 1b) allowed a protein having similar activity (ELLSA)and higher specific agglutination activity to be recoveredfrom the non-retained fraction (I) (Table 1) which wasdevoid (after concentration) of contaminating pigments.This fraction had two major bands at 72.6 kDa (33% totalprotein) and 38.8 kDa (54.2%) and a minor band (12.6%)at 35.7 kDa by Tricine-PAGE (Fig. 1c) in reducing/non-reducing conditions; the two close bands were probablylectin glycoforms. Table 1 summarises the results obtainedduring the purification steps. Three consecutive extractionswere sufficient as very low lectin activity was detected in thefourth extract. The extracted protein (albumins and globu-lins) amounted to 22.5% of total protein in seeds. The solu-tion resulting from treatment with DEAE-cellulose wasfaintly coloured with the protein remaining dissolved (afterconcentration) at 3–4 mg/ml; 2823-fold purification wasachieved (Table 1), being significantly higher than thatfor S. sclarea lectin (87-fold) (Piller et al., 1986). Completeremoval of pigments after further chromatography onDEAE-Sepharose led to protein solutions being obtainedin subsequent assays in the 1.7–2 mg/ml range (after con-centration) without potentially interfering agents. The datapresented in Table 1 was taken into account when calculat-ing a lectin amount of 18–20 mg/100 g seeds, this beingsimilar to MLL (15–20 mg/100 g seeds; Alperin et al.,1992) and higher than SSL (5 mg/100 g seeds; Piller et al.,1986) or Gleheda (10 mg/kg leaves; Wang et al., 2003a).
2.3. Agglutination of human and animal erythrocytes
The lectin was unable to agglutinate human RBCs fromA, A1, B and O donors or T erythrocytes obtained afterenzymatic treatment; only Tn erythrocytes became aggluti-nated. Minimum required lectin concentration was 0.17 lg/ml, thus being more potent than Gleheda lectin (Wang et al.,2003a); no difference was observed among Rh+ and Rh�cells. No agglutination was detected with rabbit, cow, horse,or dog RBCs (even at 1.48 mg lectin/ml), apart from Lepe-
chinia bullata lectin which presented identical behaviour(Rojas, personal communication). In this respect, no datais currently available for other Lamiaceae lectins.
2.4. Carbohydrate and glycoprotein binding
Amongst the assayed sugars (ca. 35) only GalNAc(37.5 mM) completely inhibited Tn erythrocyte agglutina-tion by SBoL; specific interaction with Tn determinantwas advanced in the affinity chromatography experimentsdescribed above with aBSM-Sepharose. Erythroagglutina-tion by SSL and MLL was inhibited by lower GalNAc con-centrations (0.1 mM and 0.03 mM, respectively) and byP-NO2 Phenyl-a/b D-GalNAc (0.12/0.06 mM and 1.75/0.87 mM, respectively) (Piller et al., 1986; Lis et al., 1988;Lis and Sharon, 1994) whereas Gleheda inhibition assayswith trypsin-treated human RBCs revealed 50% inhibitionat 25 mM GalNAc (Wang et al., 2003a).
Fig. 1. Salvia bogotensis lectin chromatography on aBSM (a), DEAE-Sepharose (b) and Tricine-PAGE (c) of purified lectin. (a) Lectin-activefraction I from DEAE-Sephadex column was applied to an aBSM-Sepharose 4B column yielding lectin-active fraction II. Inset: SDS–PAGEof fraction II. MW standards (lane 1); non-reduced (15 lg, lane 2); mildreducing conditions (40 mM DDT, 3 min) (15 lg, lane 3); strong reducingconditions (2 M DTT, 30 min) (30 lg, lane 4). (b) Fraction II was appliedto a DEAE-Sepharose 4B column yielding lectin-active fraction I.(c) Tricine-PAGE of DEAE-Sepharose 4B fraction I. MW standards(lanes 1–3); fraction I under mild reducing conditions (lane 4), fraction Iunder non-reducing conditions (lane 5).
N. Vega, G. Perez / Phytochemistry 67 (2006) 347–355 349

Erythroagglutination was also inhibited by ovine sub-maxillary mucin (OSM) (13.8–15% GalNAc content) andaBSM (18% GalNAc content) at glycoprotein concentra-tions equivalent to 19 and 8 lM GalNAc, respectively; sim-ilar aBSM concentrations inhibited erythroagglutinationby SSL (Piller et al., 1986). Specific recognition of the Tndeterminant was corroborated by ELLSA assays in whichbiotinylated SBoL bound strongly to aOSM (Fig. 2).WB4 was used as control due to its well-established Tnspecificity (Tollefsen and Kornfeld, 1983). As expected,binding to OSM was significantly lower due to the low con-tent of exposed Tn determinants in natural mucins.
As expected, no lectin binding to Fetuin-Agarose orasialo Fetuin-Agarose was observed by affinity chromatog-raphy since Tn antigen is not exposed in them; weak inter-
action was detected with asialo agalacto Fetuin-Agarose astwo low-absorbing retained fractions could be recovered byelution at pHs 2.5 and 11.4 (results not shown). Althoughthese fractions showed some activity, they were heteroge-neous by SDS–PAGE and their study was not pursued fur-ther. The weak binding to asialo agalactoFetuin was due toa lower antigen density than in aBSM or aOSM (Wu et al.,2003).
2.5. Effect of pH, temperature and cation
Maximum pH stability of SBoL was reached at pH 7–8(SAA 0.44 lg/ml) and close to complete loss of activity wasonly observed (results not shown) at low (pH 2.0) or high(pH 12.5) pH values (SAA 14-28 lg/ml). Activity was notrecovered when the sample exposed to pH 12.5 wasbrought back to pH 7.0.
Assessing the effect of temperature showed that proteinactivity began to diminish above 40 �C, becoming com-pletely eliminated at 92 �C. The lectin’s thermal stabilityis remarkable as it retains 50% of its activity at 56 �C, thisbeing similar to Gleheda (Wang et al., 2003a); on the con-trary, SSL appears to be very labile as reported by Pilleret al. (1986). It should be stressed that the protein remainedactive after two years’ storage in 50% glycerol at �20 �C.
SBoL was fully active in PBS or 1% NaCl without requir-ing the addition of metals. Specific agglutination activitydiminished from 0.44 lg/ml to 28.5 lg/ml following deme-tallisation. Recovery of activity was minimal after re-equil-ibration with 0.1 M CaCl2 or 0.1 M MnCl2 since final SAAwere 14.25 lg/ml and 3.56 lg/ml, respectively. The lectin’sactivity therefore depended upon Ca2+ and Mn2+ beingbound to native protein as well as on intact disulfide bridges,being similar to SSL in this respect (Piller et al., 1986).
2.6. Molecular properties
Table 2 summarises the molecular properties of SBoL aswell as those of hitherto characterised Lamiaceae lectins.
Fig. 2. Salvia bogotensis lectin and Vicia villosa B4 isolectin binding toOSM and aOSM. ELLSA assays were carried out as described in Section 3.
Table 1Salvia bogotensis seed lectin purification
Purification step a Protein (mg/ml) Vol (ml) Total protein (mg) Specific agglutination activityb Purification (fold)
1. First extract 2.56 530 1356.8 – –2. Second extract 0.83 666 552.8 – –3. Third extract 0.44 578 254.3 – –Pool of extracts c 0.96 1589 1525.4 480.0 14. 50% ethanol 1.48 446 660 17.3 27.75. DEAE-peak I d 0.044 116 5.1 2.8 171.46. Affinity chromatography e 0.051 20 1.02 0.24 20007. DEAE-Sepharose chromatography f 0.09 16 1.44 0.17 2823.5
a 76.5 g of seeds extracted with PBS-5 mM thiourea buffer.b The specific agglutination activity is defined as the minimal protein concentration (lg/ml) required for agglutination. This assay was done with enzyme-
treated A+ erythrocytes (Hirohashi et al., 1985).c After pigment removal by DEAE-cellulose.d 37 mg of protein was applied to the DEAE-Sephadex column.e 5.6 mg of protein was applied to the aBSM-Sepharose 4B column.f 1.8 mg of protein was applied to the DEAE-Sepharose 4B column.
350 N. Vega, G. Perez / Phytochemistry 67 (2006) 347–355

SDS-PAGE of biotinylated SBoL showed a 72.6 and37.5 kDa band following glycoprotein staining usingDAB in the detection system (Amersham, 2001); the pro-tein had 16% carbohydrate. Sugar content is 10%–15% inLamiaceae lectins described to date (Piller et al., 1986;Lis and Sharon, 1994; Wang et al., 2003a). Tricine-PAGEanalysis of enzymatically deglycosylated SBoL (10 lg)revealed the presence of a major 40.1 kDa band (40.7%),as well as 72.6 kDa (22.6%) and 35.7 kDa (36.7%) bands(results not shown). This indicated that PNGase F deglyco-sylation was partial. The 4.4 kDa difference in molecularweight between glycosylated and deglycosylated monomeragreed with 16% carbohydrate content. SBoL carbohy-drate content, deglycosylated protein MW, lectin bindingby ConA (which binds glycans with a ‘‘mannose core’’)and the hypothesis that SBoL glycan is similar to that ofGleheda (in which 6–8 monosaccharide units are presentwith a ‘‘mannose core’’; Wang et al., 2003a) lead us to pro-posing a glycan-like structure having a 3–4 glycan/polypep-tide chain and the likely existence of two glycoformsdetectable by Tricine-PAGE as closely migrating bands,the 38.8 kDa band being predominant. Two to three oligo-saccharide chains are present in SSL (Medeiros et al., 2000)and 1–2 N-glycan per polypeptide chain have been pro-posed in Gleheda (Wang et al., 2003a).
SDS–PAGE analysis of aBSM-Sepharose 4B fractionII (Fig. 1a, inset) consistently revealed a 70–72 kDa bandas being a major constituent (lane 2); this band was resis-tant to ordinary reduction conditions (40 mM DTT,3 min) (lane 3), drastic conditions (2 M DTT, 30 min)(lane 4) being needed to halve its size. The evidencesuggested that S–S interchange, likely due to the basicpH employed in the purification, had taken place to someextent. Occurrence of this interchange at basic pH hasbeen well documented (Spackman et al., 1960) and, inour case, probably led to the 72.6 kDa band whichpresented S–S bonds fairly resistant to usual reductionconditions. It should be noted that Lis et al. (1988)observed MLL aggregation in PBS and that there is MSevidence of a similar situation for SSL as a 60 kDa pro-tein fraction is still present after reduction (Medeiroset al., 2000). Estimating MW by gel filtration was not
feasible as abnormally high elution volumes wereobserved with Spherogel TSK 3000 SW, Sephacryl S-200, Biogel P150 and Superose 12 which was most likelydue to protein interaction with the support.
Reduction and carboxymethylation of the proteinyielded a precipitate which was shown by Western blot asa band at 72.6 kDa (when using anti-SBoL antibody); thesupernatant showed a 38.8 kDa band and 35.7 kDa band(results not shown). This result corroborates the formationof a dimer that resists reducing conditions.
ES-MS analysis showed a 38,702 ± 22 Da mass proteinby tandem spectroscopy; this value agrees very well withthat of the main band observed by Tricine-PAGE forthe purified protein (Fig. 1c) or that obtained after drasticreduction (Fig. 1a, inset lane 4) corresponding to the lec-tin monomer. MALDI-TOF MS analysis of SSL yielded abroad peak having 60–61 kDa mass (Medeiros et al.,2000) considered to be the protein’s dimer form since ithad a 29.5–30 kDa mass after reduction and carboxy-methylation. Taking the ensemble of results pertainingto determining size into consideration, we propose thatthe lectin is a dimer consisting of non-covalently associ-ated monomers (38 kDa). In view of the existing evidence,the subunit arrangement in Lamiaceae lectins either corre-sponds to non-covalently linked subunits, as in SBoL andMLL, or dimers linked by S–S bonds, such as SSL andGleheda.
2.7. Amino acid analysis
Table 3 shows SBoL amino acid composition. Besidesthe high amounts of Ser, Glx, Gly, Ala and Lys, it is note-worthy that four 1/2 Cys were present. Taking into accountthat no free CySH was detected and that the resultsobtained by Tricine-PAGE showed no change in Mr beforeand after mild reduction (Fig. 1c), the four 1/2 Cys mostlikely form two intra-catenary disulfide bridges. Accordingto Alperin et al. (1992), no S–S link is present in the MLL26 kDa subunit, whereas an interchain S–S bond links thetwo subunits for SSL and Gleheda (Medeiros et al., 2000;Wang et al., 2003a). Considering that the protein pI is8.6–8.8, a considerable proportion of Glx and Asx should
Table 2Molecular properties of Salvia bogotensis and other Lamiaceae lectins
S. bogotensis S. sclareaa,b G. hederaceac M. laevisd
Mr subunits 38.8; 35.7 ekDa 32 bkDa 26–28 kDa 26 kDaMr protein 38,702 Da 60–61 kDab 80–93 kDa 130 kDaBands in SDS–PAGE 72.6; 38.8; 50; 35 kDaa 26 kDa (66%) 67; 42
35.7 kDa 72; 32 kDab 28 kDa (34%) 26 kDaNeutral sugars 16% 15%a 10% 10%pI 8.6–8.8 8.8, 8.0a,e; 5.5b 6.11 ND
a Piller et al. (1986).b Medeiros et al. (2000).c Wang et al. (2003a).d Alperin et al. (1992).e Minor band.
N. Vega, G. Perez / Phytochemistry 67 (2006) 347–355 351

correspond to AsN and GlN. Attempts to determine the N-terminal sequence were unsuccessful because the N-termi-nus was apparently blocked. Apart from Gleheda, noN-terminal sequence has yet been determined for any Lam-iaceae lectin.
The high amount of recovered protein and the devised,simple method for isolating the lectin showed that S. bogot-
ensis seeds represent an excellent source for obtaining aTn-specific lectin which can be used as a tool for immuno-histochemical and cellular studies concerning the presenceof this antigen in tumours.
3. Experimental
3.1. Chemicals and plant material
S. bogotensis (accession number: COL 422764) seedswere collected from the Mondonedo area, near Bogota.Fresh human blood was obtained from the U. Nacional’sClinical Laboratory. Animal erythrocytes were suppliedby the Veterinary Faculty’s Haematology Laboratory.Pharmacia and BioRad equipment were used for chroma-tography. ConA-Sepharose, Fetuin-Agarose and proteinsused as standards were all from Sigma. Bovine submaxil-lary mucin and ovine submaxillary mucin were from Fluka.Sugars were commercial products having the highest avail-able purity. The rest of the reagents were analytical grade.
3.2. General methods
Mature S. bogotensis seeds were ground to a fine pow-der; the resulting flour was subjected to preliminary analy-sis (humidity, nitrogen, ash, lipid and crude fibre content).Non-protein nitrogen was determined according to Perezet al. (1990).
Carbohydrate inhibition and demetallisation assays andneutral sugar, amino acid composition and extinctioncoefficient determination were performed by those methodscited by Perez (1984). Final carbohydrate concentrationwas 100 mM in most cases, except for a- and b-p-nitro-phenyl glucose, galactose or mannose derivatives whichwere 12.5 mM. The lectin was dialysed against PBS pH7.0 in the demetallisation assay (after dialysis against50 mM EDTA); erythroagglutinating activity was testedin the presence and absence of 5–100 mM Ca2+ andMn2+ (chloride ions). Specific agglutination activity wasdetermined as being the minimal protein concentration(lg/ml) required for agglutination. Protein was determinedby microKjeldahl, a modified Bradford method (Stoscheck,1990) or by bicinchoninic acid (BCA) assay. Erythroagglu-tination assays were done on human and animal RBCs asdescribed (Perez, 1984) and on T/Tn-exposed RBCs. A+human RBCs were enzymatically treated to expose T orTn determinants (Hirohashi et al., 1985).
3.3. Lectin extraction
Several procedures were assayed for removing pigmentsor diminishing their formation due to the seeds’ high poly-phenol content. The final procedure was as follows. Insmall scale experiments, seeds (1 g) were left to soak in20 mM sodium phosphate buffer – 150 mM NaCl (PBS) –5 mM thiourea, pH 7.0–7.2 (Van Driessche et al., 1983)for 2–3 h, at 4 �C; they were then macerated and extractedwith continuous stirring at 4 �C, for 16 h. The extract (hav-ing a viscous appearance) was centrifuged (38,000g, 1 h,4 �C). Supernatant haemagglutination activity was deter-mined and the supernatant was used immediately or trea-ted with Pectinex.
As a result of the previous assays, extractions were thendone on a larger scale (50–70 g) with PBS-5 mM thioureabuffer; three successive extractions were done in the condi-tions described. An aliquot (10–20 ml) of each extract wastaken for nitrogen determination by micro-Kjeldahl. Theextract pool was extensively dialysed against PBS-5 mMthiourea buffer and tested for haemagglutination and lectinactivity (ELLSA).
3.4. Pectinex treatment
Extract pH was adjusted to pH 4.7 with concentratedAcOH; Pectinex Ultra SP-L (Novo) was then added(40 ll/3 ml extract); the solution was incubated overnightat 28 �C, being occasionally shaken. Viscosity was mea-sured before and after treatment. The pH was adjusted to
Table 3Salvia bogotensis lectin amino acid composition
Aminoacid
Salvia bogotensis S. sclareaa G. hederaceab
AA/100 gprotein
Calculatedresidues/mol
Nearestintegerc
Calculatedresidues/mol
Residues/mol
Asx 5.42 15.3 15 58.6 31Thr 3.98 12.8 13 66.2 19Ser 16.03 59.8 60 73.2 20Glx 16.55 41.7 42 31.2 10Gly 16.06 91.5 92 126.8 20Ala 7.94 36.3 36 75.9 16Val 2.95 9.7 10 43.9 20Met 0.2d 0 0 1.3 4Cys 1.22d 3.9 4 1.2 3Ile 2.22 6.4 6 20.6 16Leu 3.46 9.9 10 27 15Tyr 2.30 4.6 5 12.4 4Phe 1.81 4.0 4 36.6 12His 1.55 3.7 4 9.4 9Lys 8.28 21.0 21 7.8 14Arg 1.29 2.7 3 13.2 6Pro 3.7 12.7 13 17.7 11Trpe 5.1 8.9 9 ND 5
Calculations are based on a Mr = 38,702 with 16% carbohydrate.a Calculated from Medeiros et al. (2000). Mr = 60,000.b Wang et al. (2003a).c Residues/polypeptide chain.d Determined as MetSO2 and CySO3.e Determined spectrophotometrically.
352 N. Vega, G. Perez / Phytochemistry 67 (2006) 347–355

7.0 with diluted NaOH and lectin activity was determined.Control experiments (dialysis and SDS–PAGE) revealedno evidence of proteolytic activity in the polygalacturonasepreparation.
3.5. Lectin purification
3.5.1. Pigment removal and Pectinex treatment
DEAE-cellulose (0.5 g) was added to 50 ml pooledextract to further remove pigments. The suspension was stir-red for 2 h at 4 �C and centrifuged at 38,000g for 30 min at4 �C. Cold EtOH was slowly added to the supernatant in acold room, with continuous stirring, up to 50% (V/V) andkept for 16 h at 4 �C. The suspension was centrifuged(38,000g, 30 min, 4 �C). The precipitate was suspended ina small volume of PBS-thiourea and extensively dialysedagainst H2O. The viscous solution was digested (or not) withPectinex and run, following the addition of 500 mM Tris–HCl – 1.5 M NaCl, pH 7.3, buffer (TBS · 10) (1/10 of totalvolume) through a DEAE-Sephadex column (2 · 15 cm)equilibrated in TBS. The non-retained peak (peak I) waseither used for affinity chromatography runs or concen-trated by Amicon PM 10, extensively dialysed against deion-ised H2O – 5 mM thiourea and stored at �20 �C.
3.5.2. Affinity chromatography on aBSM-Sepharose 4B
Different experimental affinity chromatography condi-tions were assayed leading us to the method described asfollows. aBSM was prepared by digesting 50 mg BSM in0.01 N HCl at 80 �C for 1 h; the acid was removed byfreeze-drying. The affinity support was prepared by cou-pling aBSM to BrCN-activated Sepharose 4B followingthe general technique described by Hermanson et al.(1992). Lectin-active fractions coming off the DEAE-Sephadex column were dialysed against PBS-5 mM thio-urea, centrifuged (7000g, 5 min, 4 �C) and the resultingsupernatant (50–100 ml) was applied to the aBSM-Sephar-ose 4B column (2 · 19 cm) equilibrated with PBS. The non-retained fraction was eluted with PBS and the retainedpeak was then eluted with 50 mM Tris-OH, pH 11.4. Onemillilitre fractions were received over 100 ll 2 N HCl toobtain a final pH close to neutrality and then pooled.The retained peak was extensively dialysed against20 mM NH4HCO3 and freeze-dried. Protein concentration,specific agglutination activity and ELLSA assays were car-ried out on PBS-dissolved protein. The support’s retentioncapacity was assessed by applying increasing amounts ofpooled extracts and checking the presence of lectin in thenon-retained peak.
3.5.3. DEAE-Sepharose chromatography
Remaining pigment was removed in all cases by passingthe affinity purified fractions over a DEAE-Sepharose col-umn (1 · 15 cm) equilibrated in TBS. The first peak, con-taining the lectin, was eluted with TBS, dialysed against20 mM NH4HCO3 and freeze-dried.
3.6. Lectin detection assay
ELLSA was used for detecting lectin in crude extracts,in fractions treated and non-treated with Pectinex andpurified protein, according to the described procedure(Duk et al., 1994). The plates (NUNC, F16 Maxisorp)were sensitised with aOSM (0.14 lg/ml), using biotinyla-ted Vicia villosa isolectin B4 (VVB4) as control as it isspecific for Tn antigen. Streptavidine-peroxidase (1.3 lg/ml) and H2O2-ABTS were added after suitable washesand Abs415 was read on a Bio-Rad ELISA autoreader.Activity (%) was calculated as (100�(Sample Abs/controlAbs)·100).
3.7. Polyacrylamide gel electrophoresis
Alkaline PAGE was carried out at pH 6.8 (concentra-tion gel), pH 8.8 (separation gel) and pH 8.3 (tank buffer).SDS–PAGE was performed in reducing and non-reduc-ing conditions on a 10–12% separating gel (Laemmli,1970) (10–20 lg protein/well). The behaviour of reducedand carboxymethylated protein (Yarwood, 1989) wasassessed by SDS–PAGE. Tricine-PAGE was run accord-ing to Schagger and von Jagow (1987) on 10% gels;15% separating gels were used for deglycosylatedsamples.
3.8. Effect of pH, temperature and cation
The effect of pH was tested (Banerjee et al., 2004) usinga 2–12.5 pH range with a lectin stock solution (228 lg/ml);specific agglutination activity was determined followingequilibration by dialysis (24 h) at the desired pH . Theeffect of temperature was assessed by erythroagglutinationassay after incubating the lectin (28 lg/ml) in PBS pH 7.0for 1 h at 25–92 �C. The effect of divalent metal ions on ery-throagglutinating activity was assayed on demetallisedsamples by extensive dialysis against 5–100 mM CaCl2 orMnCl2.
3.9. Binding to glycoproteins
Glycoprotein binding was assessed by ELLSA on OSMor aOSM-coated wells (0.13 lg/ml) using biotinylatedSBoL; the lectin was biotinylated (Wu et al., 1995) withtwo successive additions of sulfobiotin-X-NHS (Calbio-chem) (2:1 w/w, 12 h interval). Excess biotin was removedby ultrafiltration with 10 kDa Nanosep filters. BiotinylatedVVB4 was used as control. Binding was also assayed byaffinity chromatography on Fetuin-Agarose, asialo Fet-uin-Agarose obtained after neuraminidase treatment of10 ml Fetuin-Agarose (0.15 enzyme units, 90 min, 37 �C,TBS pH 7.3) or asialo agalacto Fetuin-Agarose preparedby b-galactosidase treatment of the latter support (10 mlgel equilibrated in 0.1 M phosphate buffer, pH 7.0, 20 mgenzyme, overnight at 37 �C).
N. Vega, G. Perez / Phytochemistry 67 (2006) 347–355 353

3.10. Molecular weight
Assays were carried out to determine native proteinMr on the following: (a) a Spherogel TSK 3000 SWHPLC column (15 · 300 mm) equilibrated in 10 mMphosphate buffer (pH 7.0) – 150 mM NaCl; (b) a Supe-rose 12 column (1 · 110 cm) equilibrated in 20 mM phos-phate buffer (pH 7.0) – 150 mM NaCl; (c) a Biogel P150column (1 · 100 cm) equilibrated in 100 mM phosphatebuffer (pH 7.0) – 150 mM NaCl; and (d) a SephacrylS-200 column (1 · 100 cm) equilibrated in PBS. Bovineserum albumin (66.2 kDa), a-amylase (50 kDa), ovalbu-min (45 kDa), b-lactoglobulin (36.8 kDa), myoglobin(17.2 kDa) and lysozyme (14.4 kDa) were used asstandards.
Subunit Mr was determined by the Laemmli (1970)procedure; the lectin (10 lg) to which SDS was added(300 lg) was run in reducing (40 mM DTT) and non-reducing conditions. Heat-denatured protein was digestedwith PNGAse F (1200 mU) (Montreuil et al., 1994) andafter microdialysis samples had been run on Tricine-PAGE.
Native protein molecular weight was determined bynanoflow electrospray mass spectrometry as described(Almanza et al., 2004).
3.11. Isoelectric point
The pI was determined with a 3.5–10 pH gradient innon-denaturing conditions following Bollag and Edel-stein’s procedure (1991).
3.12. Free cysteine content
The protein (5.9 mg/ml) was dissolved in 100 mM phos-phate buffer (pH 7.2) – 6 M guanidine HCl – 1 mM EDTA.Free cysteine was determined as described (Creighton, 1995).
3.13. N-terminal amino acid sequence
Following SDS–PAGE, the stained protein band wastransferred to PVDF (Matsudaira, 1987). Assays aimedat determining the protein’s N-terminal sequence were car-ried out with an Applied Biosystems 477A sequencer.
Acknowledgements
We wish to thank Dr J.L. Fernandez (ICN, UniversidadNacional) for species identification, Dr L. Ilag (Universityof Cambridge) for carrying out the MS of the protein, DrR. Moreira (U. Ceara) for stimulating discussions andthe amino acid determination and Dr M. Valle-de Sousa(U. Brasilia) for the N-terminal sequence assays. Financialsupport was provided by the Universidad Nacional’sChemistry Department and COLCIENCIAS.
References
Almanza, M., Vega, N., Perez, G., 2004. Isolating and characterising alectin from Galactia lindenii seeds that recognise blood group Hdeterminants. Biochim. Biophys. Acta 492, 180–190.
Alperin, D.M., Latter, H., Lis, H., Sharon, N., 1992. Isolation, by affinitychromatography and gel filtration in 8 M-urea, of an active subunitfrom the anti-(blood-group A + N)- specific lectin of Moluccella laevis.Biochem. J. 285, 1–4.
Amersham – Pharmacia Biodirectory, Stibo Graphic, Denmark, 2001, p.479.
Banerjee, S., Chaki, S., Bhowal, J., Chatterjee, B.P., 2004. Mucin bindingmitogenic lectin from fresh water Indian gastropod Belamyia bengal-
ensis: purification and molecular characterization. Arch. Biochim.Biophys. 421, 125–134.
Bird, G.W.G., Wingham, J., 1974. Haemagglutinins from Salvia. Vox.Sang. 26, 163–166.
Bird, G.W.G., Wingham, J., 1976. More Salvia agglutinins. Vox Sang 30,217–219.
Bird, G.W.G., Wingham, J., 1977. Yet more Salvia agglutinins. Vox Sang32, 121–122.
Bollag, D., Edelstein, S., Stuart, J., 1991. Isoelectric Focusing (IFC).Protein Methods, fourth ed. Wiley Liss, New York, pp 162–174.
Creighton, T.E., 1995. Disulphide bonds between cysteine residues. In:Creighton, T.E. (Ed.), Protein Structure – A Practical Approach. IRLPress, Oxford, p. 157.
Duk, M., Mitra, D., Lisowska, E., Kabat, E.A., Sharon, N., Lis, H.,1992. Immunochemical studies on the combining site of the A + Nblood type specific Moluccella laevis lectin. Carbohydr. Res. 236,245–258.
Duk, M., Lisowska, E., Wu, J.H., Wu, A.M., 1994. The biotin/avidin-mediated microtiter plate lectin assay with the use of chemicallymodified glycoprotein ligand. Anal. Biochem. 221, 266–272.
Fernandez-Alonso, J.L., 2003. Estudios en Labiatae de Colombia IV.Novedades en Salvia y sinopsis de las secciones Angulatae y Purpureae.Caldasia 25, 235–281.
Fernandez-Alonso, J.L., Vega, N., Filgueira, J.J., Perez, G., 2003. Lectinprospecting in Colombian Labiatae. A systematic–ecologicalapproach. Biochem. System. Ecol. 31, 617–633.
Hansen, J.E.S., Nielsen, C., Arendrup, M., Olofsson, S., Mathiesen, L.,Nielsen, J.O., Clausen, H., 1991. Broadly neutralizing antibodiestargeted to mucin-type carbohydrate epitopes of human immunode-ficiency virus. J. Virol. 65, 6461–6467.
Hermanson, G.T., Mallia, A.K., Smith, M.P., 1992. Activation Methods.Immobilized Affinity Ligand Techniques. Academic Press, San Diego,pp. 53–56.
Hirohashi, S., Clausen, H., Yamada, T., Shimosato, Y., Hakomori, S.-I.H., 1985. Blood group A cross-reacting epitope defined by mono-clonal antibodies NCC Lu-35 and 81 expressed in cancer of bloodgroup O or B individuals. Its identification as Tn antigen. Proc. Natl.Acad. Sci. USA 82, 7039–7043.
Laemmli, U.K., 1970. Cleavage of structural proteins during the asssem-bly of the head of bacteriophage T4. Nature 277, 680–685.
Lis, H., Sharon, N., 1994. Moluccella laevis lectin – An unusual proteinwith a unique specificity. Trends Glycosci. Glycotechnol. 6, 65–74.
Lis, H., Latter, H., Adar, R., Sharon, N., 1988. Isolation of two bloodtype A and N specific isolectins from Moluccella laevis seeds. FEBSLett. 233, 191–195.
Lisowska, E., 1995. Tn antigens and their significance in oncology. ActaBiochim. Pol. 42, 11–17.
Matsudaira, P., 1987. Sequence from picomole quantities of proteinselectroblotted onto polyvinylidene difluoride membranes. J. Biol.Chem. 262, 10035–10038.
Medeiros, A., Bianchi, S., Calvete, J., Balter, H., Bay, S., Robles, A.,Cantacuzene, D., Nimtz, M., Alzari, P., Osinaga, E., 2000. Biochem-ical and functional characterization of the Tn-specific lectin fromSalvia sclarea seeds. Eur. J. Biochem. 267, 1434–1440.
354 N. Vega, G. Perez / Phytochemistry 67 (2006) 347–355

Montreuil, J., Bouquelet, S., Debray, H., Lemoine, J., Michalski, J.C.,Spik, G., Strecker, G., 1994. Glycoproteins. In: Chaplin, M.F.,Kennedy, J.F. (Eds.), Carbohydrate Analysis. A Practical Approach.IRL Press, Oxford, p. 258.
Perez, G., 1984. Isolation and characterization of a lectin from the seeds ofErythrina edulis. Phytochemistry 23, 1229–1232.
Perez, G., Hernandez, M., Mora, E., 1990. A lectin from the seeds ofDioclea lehmanni. Phytochemistry 29, 1745–1749.
Piller, V., Piller, F., Cartron, J., 1986. Isolation and characterization of N-acetylgalactosamine specific lectin from Salvia sclarea seeds. J. Biol.Chem. 261, 14069–14075.
Schagger, H., von Jagow, G., 1987. Tricine-sodium dodecyl sulfate-polyacrylamide gel electrophoresis for the separation of proteins in therange from 1 to 100 kDa. Anal. Biochem. 166, 368–379.
Spackman, D.H., Stein, W.H., Moore, S., 1960. The disulfide bonds ofribonuclease. J. Biol. Chem. 235, 648–659.
Springer, G.F., 1984. T and Tn, general carcinoma autoantigens. Science244, 1198–1206.
Stoscheck, C.M., 1990. Increased uniformity in the response of theCoomassie blue G protein assay to different proteins. Anal. Biochem.184, 111–116.
Teneberg, S., Leonardsson, I., Angstrom, J., Ehrlich-Rogozinski, S.,Sharon, N., 1994. Characterization of the specificity of binding ofMoluccella laevis lectin to glycosphingolipids. Glycoconj. J. 11, 418–423.
Thurnher, M., Clausen, H., Sharon, N., Berger, E.G., 1993. Use of O-glycosylation-defective human lymphoid cell lines and flow cytometryto delineate the specificity of Molucella laevis lectin and monoclonal
antibody 5F4 for the Tn antigen (GalNac 1-O-Ser/Thr). Immunol.Lett. 36, 239–244.
Tollefsen, S.E., Kornfeld, R., 1983. The B4 lectin from Vicia villosa seedsinteracts with N-acetylgalactosamine residues a-linked to serine orthreonine residues in cell surface glycoproteins. J. Biol. Chem. 258,5172–5176.
Van Driessche, E., Beeckmans, S., Dejaegere, R., Kanarek, L., 1983.Thiourea: The antioxidant of choice for the purification of proteinsfrom phenol-rich plant tissues. Anal. Biochem. 141, 184–188.
Wang, W., Peumans, W.J., Rouge, P., Rossi, C., Proost, P., Chen, J., vanDamme, E.J.M., 2003a. Leaves of the Lamiaceae species Glechoma
hederacea (ground ivy) contain a lectin that is structurally andevolutionary related to the legume lectins. Plant J. 33, 293–304.
Wang, W., Hause, B., Peumans, W.J., Smagghe, G., Mackie, A., Fraser,R., van Damme, E.J.M., 2003b. The Tn antigen-specific lectin fromground ivy is an insecticidal protein with an unusual physiology. PlantPhysiol. 132, 1322–1334.
Wood, J.R.I., Harley, R.M., 1989. The genus Salvia (Labiatae) inColombia. Kew Bull. 44, 211–278.
Wu, A., Duk, M., Lin, M., Broadberry, R., Lisowska, E., 1995.Identification of variant glycophorins of human red cells by lectinob-lotting: application to the Mi. III variant that is relatively frequent inthe Taiwanese population. Transfusion 35, 571–576.
Wu, A.M., Wu, J.H., Lin, L.H., Lin, S.H., Liu, J.H., 2003. Binding profileof Artocarpus integrifolia agglutinin (Jacalin). Life Sci. 72, 2285–2302.
Yarwood, A., 1989. Manual methods of protein sequencing. In: Findlay,J.B.C., Geisow, M.J. (Eds.), Protein Sequencing. A PracticalApproach. IRL Press, Oxford, p. 143.
N. Vega, G. Perez / Phytochemistry 67 (2006) 347–355 355

The peroxidative coupling of hemigossypol to (+)- and(�)-gossypol in cottonseed extracts
Chauncey R. Benedict a, Jinggao Liu b, Robert D. Stipanovic c,*
a Professor Emeritus of Biochemistry, TAMU, College Station, TX 77843, USAb Department of Biochemistry and Biophysics, TAMU, College Station, TX 77843, USA
c USDA-ARS, Southern Plains Agricultural Research Center, 2765 F&B Road, College Station, TX 77845, USA
Received 11 March 2005; received in revised form 19 October 2005Available online 5 January 2006
Abstract
Peroxidase(s) present in embryo extracts of Gossypium hirsutum cv. Texas Marker 1 catalyzed a bimolecular coupling of [4-3H]-hemi-gossypol to [4,4 0-3H2]-gossypol. The reaction was dependent on the addition of H2O2 and was inhibited 71–94% by 1 and 10 mM sodiumazide. The phenolic coupling produced 53% (+)-gossypol and 47% (�)-gossypol in close agreement to the 49% (+)-gossypol and 51%(�)-gossypol found in the intact seed. The nearly racemic mixture of (+)-and (�)-gossypol produced in these embryo extracts can beaccounted for by non-enzymatic random coupling of the free radicals of hemigossypol produced by the peroxidase. In contrast,peroxidase reaction mixtures containing crude embryo extracts of G. hirsutum var. marie-galante produced 73% (+)-gossypol and27% (�)-gossypol. These data from the marie-galante extracts and the fact that these intact seed contain 95% (+)-gossypol suggest aregio-stereoselective bimolecular coupling of hemigossypol to gossypol. The development of the peroxidative coupling of hemigossypolto gossypol in maturing seed of G. hirsutum cv. Texas Marker 1 was correlated to the formation of gossypol and suggests that perox-idative coupling of hemigossypol contributes to gossypol biosynthesis.� 2005 Elsevier Ltd. All rights reserved.
Keywords: Gossypium hirsutum; Malvaceae; Cotton; Peroxidative coupling; Gossypol formation; Hemigossypol coupling; Dirigent protein
1. Introduction
Gossypol (6) is a polyphenolic bis-sesquiterpene foundin plants of the Malvaceae. A proposed pathway for thebiosynthesis of gossypol (6) from E,E-farnesyl diphos-phate (1) in cotton is shown in Fig. 1. The first step inthis pathway is the cyclization of E,E-farnesyl diphos-phate (1) to (+)-d-cadinene (2) catalyzed by (+)-d-cadin-ene synthase (Benedict et al., 1995; Davis and Essenberg,1995; Chen et al., 1995; Benedict et al., 2001): Thehydroxylation of (+)-d-cadinene (2) to form 8-hydroxy-(+)-d-cadinene (3) is catalyzed by (+)-d-cadinene-8-hydroxylase, a cytochrome P450 monooxygenase (Luoet al., 2001). Intact cotton cotyledons convert 8-
hydroxy-(+)-d-cadinene (3) to desoxyhemigossypol (4)and hemigossypol (5) demonstrating the functioning ofthe cytochrome P450 monooxygenase in the biosynthesisof gossypol (6) (Wang et al., 2003). The conversion of8-hydroxy-(+)-d-cadinene (3) to desoxyhemigossypol (4)requires hydroxylations, desaturations and cyclic etherformation. Stipanovic et al. (1992) demonstrated thatdesoxyhemigossypol (4) decomposes to hemigossypol (5)in solution by a non-enzymatic free radical oxidation.In studies on the structure of hemigossypol (5) it wasshown that horseradish peroxidase can dimerize hemi-gossypol (5) to gossypol (6) (Veech et al., 1976) but enzy-matic studies on the conversion of hemigossypol (5) togossypol (6) in cotton tissues are scarce. The purposeof this paper is to present data on the peroxidative cou-pling of hemigossypol (5) to form (+)- and (�)-gossypol(6) in cottonseed extracts.
0031-9422/$ - see front matter � 2005 Elsevier Ltd. All rights reserved.
doi:10.1016/j.phytochem.2005.11.015
* Corresponding author. Tel.: +1 979 260 9232; fax: +1 979 260 9319.E-mail address: [email protected] (R.D. Stipanovic).
www.elsevier.com/locate/phytochem
Phytochemistry 67 (2006) 356–361
PHYTOCHEMISTRY

2. Results and discussion
2.1. Identification of gossypol (6) formed from hemigossypol
(5) in the Gossypium hirsutum cv. Texas Marker 1 (TM1)
embryo extracts
A compound formed when hemigossypol (5) was com-bined with the TM1 embryo extracts in the presence ofH2O2 had a HPLC-retention time of 16.6 min; its massspectrum [EIMS (probe) 70 eV] showed ions at m/z (rel.int.): 518 [M]+ (2.2), 500 (17.2), 483 (33.7), 482 (100), 468(23.6), 467 (73.4), 454 (15.3) and 439 (20.2). This mass spec-trum agrees with that reported by Bell et al. (1975). A pro-posed fragmentation scheme that accounts for the majorpeaks in the mass spectrum is shown in Fig. 2. A singleion at m/z 518 accounts for gossypol (6). The loss ofH2O produces a single ion at m/z 500 and another loss ofH2O produces an ion at m/z 482. The loss of a methylgroup gives an ion at m/z 467 and the alternative loss ofan isopropyl group results in an ion at m/z 439. This frag-mentation pattern is consistent with the formation of gos-sypol (6) by a bimolecular coupling of hemigossypol (5) inthe embryo extracts.
2.2. Formation of [4,4 0-3H2]-gossypol (6) from [4-3H]-
hemigossypol (5) in TM1 embryo extracts
Gossypol (6) is formed by coupling of hemigossypol(5) at the 2 position (Fig. 1); Therefore, gossypol (6) pro-duced from [4-3H]-hemigossypol (5) will retain the tri-tium label. [4-3H]-Hemigossypol (5) was incubated witha cell free extract from TM1 embryo tissue in the pres-ence of H2O2. The product was submitted to HPLCanalysis. Authentic hemigossypol (5) and gossypol (6)eluted at 14.83 and 16.62 min, respectively. The productfrom the reaction contained the same two peaks. Frac-tions were collected every 15 s and were assayed for
radioactivity on a scintillation spectrometer. The radioac-tivity of the collected fractions peaked at 14.83 and16.62 min. The UV spectrum and the retention time ofthe peak eluting at 16.62 min agreed with that ofauthentic gossypol (6). These results are consistent withthe peroxidative coupling of [4-3H]-hemigossypol (5) atthe 2-position to give [4,4 0-3H2]-gossypol (6).
In the presence of 1 mM H2O2 in the mixture, 86% of[4-3H]-hemigossypol (5) was converted to [4,4 0-3H2]-gossy-pol (6) but only 6% of the [4-3H]-hemigossypol (5) was con-verted to [4,4 0-3H2]-gossypol (6) in the absence of H2O2.Others have shown that azide inhibits peroxidase enzymes(Brill and Weinryb, 1967). We have demonstrated that theenzymatic coupling of hemigossypol (5) to gossypol (6) inthe TM1 embryo extracts was inhibited 71% and 94%,respectively, by the addition of 1 and 10 mM sodium azideto the reaction mixtures. These data support the conclusionthat the bimolecular coupling of hemigossypol (5) to gossy-pol (6) was catalyzed by peroxidase(s) in the embryoextracts.
2.3. The enantiomers of gossypol (6) formed during theenzymatic coupling of hemigossypol (5) to gossypol (6) in
the TM1 embryo extracts
Racemic gossypol was first derivatized by reactionwith (+)-2-amino-1-propanol (Hron et al., 1999). Sincethe derivatizing reagent is itself chiral, it was possibleto separate the resulting mixture of diastereomers usingan achiral column. Two peaks were observed eluting at3.12 and 4.85 min. The peak eluting at 3.12 min wasshown to be the (+)-enantiomer by comparison of theretention time and the UV spectrum (obtained by thediode array detector) to that of a derivatized authenticsample of (+)-gossypol (6) obtained from Thespesia
populnea (King and de Silva, 1968). The reactionproduct from Section 2.1 above was derivatized with
1
4
OPPH
1 2
H
OH
3
OHO
HO
OHHO
HO
CH O
OHHO
HO
CH O
OH
OH
CHO
O
4
65
H
E,E-Farnesyldiphosphate
(+)- -Cadinene 8-Hydroxy-(+)- -cadinene
Desoxyhemigossypol
Hemigossypol Gossypol
Fig. 1. A proposed pathway for the biosynthesis of gossypol (6) in cottonseed from E,E-farnesyl diphosphate (1) with intermediates (+)-d-cadinene (2),8-hydroxy-(+)-d-cadinene (3), desoxyhemigossypol (4), and hemigossypol (5).
C.R. Benedict et al. / Phytochemistry 67 (2006) 356–361 357

(+)-2-amino-1-propanol and the resulting derivativeswere submitted to HPLC analysis (Fig. 3). The percent-ages of (+)- and (�)-gossypol (6) were 53 and 47, respec-tively, and indicates the formation of a racemic mixture.These percentages are in close agreement to the percent-ages of (+)- and (�)-gossypol (6) found in the intactTM1 seed [i.e., 49% (+)- and 51% (�)-gossypol (6)].
2.4. The enantiomers of (+)- and (�)-gossypol (6) formed
in G. hirsutum var. marie-galante (moco cotton) embryo
extracts
The percentage of (+)- and (�)-gossypol (6) in G. hirsu-
tum cottonseed ranges from a racemic mixture in G. hirsu-
tum cv. TM1 to a preponderance of (+)-gossypol (6) in G.
CHO
HO
HO
HCO
OH
OH
OH OH
H2O-
HOOH
O
O
O
O
m/z 518
m/z 482
-
CH3-
HOOH
O
O
O
O
CH(CH3)2-
m/z 467
HOOH
O
O
O
O
CHO
HO
HOOH
OH O
O
m/z 500
m/z 439
H2O
Gossypol
Fig. 2. The MS fragmentation scheme for gossypol (6) formed from hemigossypol (5) by peroxidative coupling with an enzyme extract from 35 day-post-anthesis embryos of Gossypium hirsutum cv. Texas Marker 1.
0
500
1000
1500
2000
2500
3000
3500
H
(+)-Gossypol derivative (-)-Gossypol derivative
Retention Time (min)
0 1 2 3 4 5 6
0
500
1000
1500
2000
2500
3000
3500
0
500
1000
1500
2000
2500
3000
3500
Hemigossypol derivative
(+)-Gossypol derivative (-)-Gossypol derivative
0 1 2 3 4 5 60 1 2 3 4 5 6
Det
ecto
r R
espo
nse
(mA
U)
Fig. 3. HPLC showing the (+)-2-amino-L-propanol derivatives of (+)-gossypol (6) (retention time 3.12 min, 53%) and (�)-gossypol (retention time4.85 min, 47%) formed during the enzymatic coupling of hemigossypol (5) with an enzyme extract from 35 day-post-anthesis embryos of Gossypium
hirsutum cv. Texas Marker 1; the derivative of unreacted hemigossypol (5) had a retention time of 1.79 min.
358 C.R. Benedict et al. / Phytochemistry 67 (2006) 356–361

hirsutum var. marie-galante. In separate experiments wedetermined that intact seed of moco cotton contained95% (+)-gossypol (6) and 5% (�)-gossypol (6) similar toreports by Cass et al. (1991). To assess the role of peroxi-dase and possible associated protein in the preferential for-mation of (+)-gossypol (6) in these seeds, reaction mixtureswere made containing an embryo extract of 35 days-post-anthesis, hemigossypol (5), and H2O2. The data in Fig. 4show that 72% (+)-gossypol (6) and 28% (�)-gossypol (6)were made in these mixtures, these percentages of (+)-and (�)-gossypol (6) were different than the racemic mix-ture of gossypol (6) formed in the TM1 embryo extracts.
Several possibilities may account for the formation ofpredominant amounts of (+)-gossypol (6) in intact seedand embryo extracts of the moco cotton. The presence ofa peroxidase together with a dirigent protein similar tothe dirigent protein isolated from Forsythia (Davin et al.,1997; Davin and Lewis, 2000) could direct the couplingof free radicals of hemigossypol formed by the oxidase(peroxidase/H2O2) in a stereospecific manner for preferen-tial formation of (+)-gossypol. An incomplete solubiliza-tion of the dirigent protein with the peroxidase in theembryo extracts could account for less (+)-gossypol (6)formed in the extracts compared to the intact seed. Alter-natively, other regio-stereospecific enzymes such as lac-case-type phenoloxidase (Niemetz and Gross, 2003) orcytochrome P450 (Stadler and Zenk, 1993) that were notmeasured, may play a role in the regio-stereospecific cou-pling of hemigossypol (5) in moco cotton.
2.5. Correlation of peroxidative coupling activity with
gossypol (6) content in maturing TM1 cottonseed
The correlation of the peroxidative coupling activity ofhemigossypol (5) to gossypol (6) with the formation of gos-sypol (6) in maturing cottonseed of TM1 is shown in Fig. 5.There is a high correlation of the coupling activity of hemi-gossypol (5) to gossypol (6) in extracts of the maturing seed
and the deposition of gossypol (6) in the intact maturingseed. The data are consistent with the conclusion that theperoxidative coupling activity of hemigossypol (5) contrib-utes to the biosynthesis of gossypol (6).
3. Experimental
3.1. Chemicals
The 3H2O (1 Ci/g) and ACS grade 30% H2O2 in water(v/w) were purchased from Sigma Chemical Company.(+)-2-Amino-1-propanol was purchased from AldrichChemical Company.
3.2. Plants
Plants of G. hirsutum cv. Texas Marker 1 were planted inCotton Variety Test Plots on the Texas A&M UniversityFarm. The plants were planted in 1 m wide rows and thestands were thinned early in the season to 1 m betweenplants. The fertilization, irrigation and pest control proce-dures were those used throughout the test plots. Plants ofG. hirsutum var. marie-galante (moco cotton) were grownin a greenhouse in 2 gal pots. In the greenhouse, the plantswere watered daily and fertilized with 20-20-20 Peter�s Sol-uble Fertilizer containing micronutrients. Pest controlspraying was applied weekly. Throughout the growing sea-son flowers of both TM1 and moco cottons were tagged onthe day of anthesis (full bloom). Bolls were harvestedthroughout the boll development period of about 50 dayspost anthesis.
3.3. Preparation of embryo extracts
Seeds were removed from the developing cotton bollsand the seed coat removed from the individual seed. Theembryos were ground to a powder in liquid N2 in a mortar.
2 3 4 5 6 7 8 9
0
25
50
75
100
125
150
175
(-)-Gossypol derivative
RetentionTime (min)
(+)-Gossypol derivative
2 3 4 5 6 7 8 9
Det
ecto
r R
espo
nse
(mA
U)
0
25
50
75
100
125
150
175
Fig. 4. HPLC showing the (+)-2-amino-L-propanol derivatives of (+)-gossypol (6) (retention time 3.11 min, 72%) and (�)-gossypol (retention time4.80 min, 28%) formed during the enzymatic coupling of hemigossypol (5) with an enzyme extracts from 35 days-post-anthesis embryos of Gossypium
hirsutum var. marie-galante.
C.R. Benedict et al. / Phytochemistry 67 (2006) 356–361 359

Ten ml/g seed of 0.1 M phosphate buffer pH 5.4 containing5% insoluble PVP was added to the powder and the mix-ture stirred to a smooth suspension. The suspension wastransferred to epitubes and centrifuged 14,000g for20 min. An aliquot of the supernatant phase was used asthe source of the coupling enzyme preparation.
3.4. Preparation of hemigossypol (5)
Hemigossypol (5) was purified from cotton stele extractsby the procedure of Bell (1967). Hemigossypol (5) wasidentified by 1H NMR spectroscopy on a BrukerARX-300 instrument and EIMS analysis using a Hew-lett–Packard 5989 GC-Electron Impact Quadrupole Massspectrometer operating at 70 eV using a direct insertionprobe method. Source was heated to 260 �C, and the quad-rupole to 100 �C.
3.5. Synthesis of [4-3H]-hemigossypol (5)
[4-3H]-Hemigossypol (5) was synthesized by anexchange reaction of 500 lCi 3H2O with hemigossypol (5)in the presence of trifluoroacetic anhydride by the proce-dure of Stipanovic et al. (1986). The label was almost exclu-sively located at the 4-position (95%) which would not beexpected to be lost during the coupling reaction.
3.6. Assay of the peroxidative coupling of hemigossypol (5)
to gossypol (6) in the embryo extracts
The reaction mixture for the peroxidative coupling ofhemigossypol (5) to gossypol (6) in embryo extracts con-tained 150 ll of embryo extract, 0.63 mM hemigossypol(5) containing 190 nmol and 3.1 · 105 dpm of [4-3H]-hemigossypol (5), and 1.0 mM H2O2 in a final volumeof 300 ll. The mixture was incubated at 32 �C for 30
min and the reaction stopped by the addition of 200 llhexane–EtOAc (1:1). The aqueous phase was extractedwith 200 ll hexane–EtOAc three times and the combinedextracts evaporated to dryness in a rotary evaporatorunder reduced pressure. The residue was dissolved in100 ll hexane–EtOAc (1:1 v/v) and 20 ll injected ontoa 250 · 4 mm Scientific Glass Engineering Mos-Hyper-sil-1 C8 column (5 lm) at a column temperature of 40�C and a flow rate of 1.25 ml/min using a Waters 600HPLC equipped with a diode array detector. A linearMeOH–H2O gradient containing 0.07% phosphoric acidwas used for column chromatography. The initialMeOH–H2O ratio was 2:8 progressing to 7:3 over 7min, to 8:2 over the next 5 min, to 9:1 over the next 7min, and to 100% MeOH over the last 4 min. Aliquotsof the column eluate were collected at 0.25 min intervalsand assayed for radioactivity in a Beckman ScintillationSpectrometer. [4-3H]-Hemigossypol (5) and [4,4 0-3H2]-gossypol (6) had elution times of 14.88 and 16.63 min,respectively, identical to the elution times of authenticsamples.
3.7. MS analysis of gossypol (6) enzymatically synthesized
by peroxidative coupling
The identity of the enzymatic reaction product formedby peroxidative coupling with embryo extracts was con-firmed by EIMS analysis using non-radioactive hemigossy-pol (5) as substrate. The peak corresponding to gossypol(6) with a retention time of 16.63 min was collected. Thefraction was diluted with an equal volume of water andextracted in hexane–EtOAc (1:1). The organic layer wasevaporated to dryness and analyzed by EIMS using a directinsertion probe 70 eV on a Hewlett–Packard 5989B MassSpectrometer. Source was heated to 260 �C, and the quad-rupole to 100 �C.
0
50
100
150
200
250
10 15 20 25 30 35 40 45 500
200
400
600
800
1000
1200
1400
1600
1800
Days-Post-Anthesis
Pe
roxi
da
seA
ctiv
ity(n
mo
lgo
ssyp
ol/h
/se
ed
)
Go
ssyp
olC
on
t en
t(n
mo
lgo
ssyp
ol/s
ee
d)
0
50
100
150
200
250
10 15 20 25 30 35 40 45 500
200
400
600
800
1000
1200
1400
1600
1800
Pe
roxi
da
seA
ctiv
ity(n
mo
lgo
ssyp
ol/h
/se
ed
)
Go
ssyp
olC
on
t en
t(n
mo
lgo
ssyp
ol/s
ee
d)
Fig. 5. Correlation between the peroxidative coupling activity and gossypol (6) content in maturing embryos of Gossypium hirsutum cv. Texas Marker 1[–d–, peroxidase activity (nmol gossypol/h/seed); –j–, gossypol (6) content (nmol gossypol/seed)].
360 C.R. Benedict et al. / Phytochemistry 67 (2006) 356–361

3.8. Analysis of the enantiomers of gossypol (6) formed
during the coupling of hemigossypol (5) to gossypol (6)
Following the coupling of hemigossypol (5) to gossypol(6) by embryo extract peroxidase (cf. Section 3.3), the reac-tion was stopped with hexane–EtOAc (1:1) and the (+)- and(�)-gossypol (6) extracted into the organic phase. Thisphase was evaporated to dryness in a rotary evaporatorunder reduced pressure. The residue was dissolved in 30 llof a derivatizing reagent prepared by dissolving 0.2 ml of(+)-2-amino-1-propanol in 8 ml of acetonitrile and 1.0 mlglacial acetic acid as described by Hron et al. (1999). Theresulting solution was heated for 30 min at 70 �C. A 10-llaliquot of the derivatized enantiomers of gossypol (6) wasinjected into a reversed-phase C18 column using a Hew-lett–Packard 1090 HPLC equipped with a diode arraydetector. The mobile phase was CH3CN–KH2PO4 (10mM) containing 2.5 mM tetrabutylammonium hydrogensulfate at pH 3.0 at a ratio of 71:29 with a flow rate of0.6 ml/min. The eluent was monitored at 254 nm.
The enantiomers of gossypol (6) present in intact seedwere analyzed by grinding 0.14 g of 36 days-post-anthesiscottonseed in a mortar in liquid N2. The powder wassuspended in 1.4 ml of EtOH–H2O–Et2O–HOAc (59:24:17:0.2) and shaken vigorously for 30 min. The mixture wasfiltered through a 0.45-lm filter and the filtrate was analyzedfor (+)- and (�)-gossypol (6) by HPLC following derivatiza-tion with (+)-2-amino-1-propanol as described above.
Acknowledgements
This work was supported in part by the Texas Agricul-tural Experiment Station and grants from the Texas Ad-vanced Technology Program and Cotton Incorporated toC.R.B. We thank Ms. JoAnn Patel for excellent technicalassistance.
References
Bell, A.A., 1967. Formation of gossypol in infected or chemically irritatedtissues of Gossypium spp. Phytopathology 57, 759–764.
Bell, A.A., Stipanovic, R.D., Howell, C.R., Fryxell, P.A., 1975. Antimi-crobial terpenoids of Gossypium: hemigossypol, 6-methoxyhemigossy-pol and -6 deoxyhemigossypol. Phytochemistry 14, 225–231.
Benedict, C.R., Alchanati, I., Harvey, P.J., Liu, J., Stipanovic, R.D.,Bell, A.A., 1995. The enzymatic formation of d-cadinene fromfarnesyl diphosphate in extracts of cotton. Phytochemistry 39, 327–331.
Benedict, C.R., Lu, J-L., Pettigrew, D.W., Liu, J., Stipanovic, R.D.,Williams, H.J., 2001. The cyclization of farnesyl diphosphate andnerolidyl diphosphate by a purified recombinant d-cadinene synthase.Plant Physiol. 125, 1754–1765.
Brill, A.S., Weinryb, I., 1967. Reaction of horseradish peroxidase withazide. Evidence for a methionine residue at the active site. Biochem-istry 6, 3528–3535.
Cass, Q.B., Tiritan, E., Matlin, S.A., Freire, E.C., 1991. Gossypolenantiomer ratios in cottonseed. Phytochemistry 30, 2655–2657.
Chen, X.-Y., Chen, Y., Heinstein, P., Davisson, V.J., 1995. Cloning,expression and characterization of (+)-d-cadinene synthase: a catalystfor cotton phytoalexin biosynthesis. Arch. Biochem. Biophys. 324,255–266.
Davin, L.B., Lewis, N.G., 2000. Dirigent proteins and dirigent sitesexplain the mystery of specificity of radical precursor coupling inlignan and ligoin biosynthesis. Plant Physiol. 123, 453–461.
Davin, L.B., Wang, H-B., Crowell, A.L., Bedgar, D.L., Martin, D.M.,Sarkanen, S., Lewis, N.G., 1997. Stereoselective bimolecular phenoxyradical coupling by an auxiliary (dirigent) protein without an activecenter. Science 275, 362–366.
Davis, G.D., Essenberg, M., 1995. (+)-d-Cadinene is a product ofsesquiterpene cyclase activity in cotton. Phytochemistry 39, 553–567.
Hron, R.J., Kim, H.L., Calhoun, M.C., Fisher, G.S., 1999. Determinationof (+) and (�) and total gassypol in cottonseed by high-performanceliquid chromatography. J. Am. Oil Chem. Soc. 76, 1351–1355.
King, T.J., de Silva, L.B., 1968. Optically active gossypol from Thespesia
populnea. Tetrahedron Lett. 1968, 261–263.Luo, P., Wang, Y-H., Wang, G-D., Essenberg, M., Chen, X-Y., 2001.
Molecular cloning and functional identification of (+)-d-cadinene-8-hydroxylase, a cytochrome P450 mono-oxygenase (CYP706B1) ofcotton sesquiterpene biosynthesis. Plant J. 28, 95–104.
Niemetz, R., Gross, G.G., 2003. Oxidation of pentagalloylglucose to theellagitannin tellimagranden II by a phenol oxidase from Tellima
grandiflora leaves. Phytochemistry 62, 301–306.Stadler, R., Zenk, M.H., 1993. the purification and characterization of a
unique cytochrome P450 enzyme from Berberis stolonifera plant cellcultures. J. Biol. Chem. 268, 823–831.
Stipanovic, R.D., Williams, H.J., Muehleisen, D.P., Plapp Jr., F.W., 1986.Synthesis of deuterated and tritiated gossypol. J. Labell. Compd.Radiopharm. 24, 741–743.
Stipanovie, R.D., Mace, M.E., Bell, A.A., Beier, R.C., 1992. The role offree radicals in the decomposition of the phytoalexin desoxyhemigossy-pol. J. Chem. Soc., Perkin Trans. 1, 3189–3191.
Veech, J.A., Stipanovic, R.D., Bell, A.A., 1976. Peroxidative conversion ofhemigossypol to gossypol. A revised structure for isohemigossypol. J.Chem. Soc., Chem. Commun., 144–145.
Wang, Y.H., Davila-Huerta, G., Essenberg, M., 2003. 8-Hydroxy-(+)-delta-cadinene is a precursor to hemigossypol in Gossypium hirsutum.Phytochemistry 64, 219–225.
C.R. Benedict et al. / Phytochemistry 67 (2006) 356–361 361
Low molecular weight squash trypsin inhibitorsfrom Sechium edule seeds
Helen J. Laure a,b, Vıtor M. Faca a,b, Clarice Izumi b,c,Julio C. Padovan b,d, Lewis J. Greene b,c,*
a Departamento de Bioquımica, Area de Biologia Molecular, Universidade Federal de Sao Paulo, Escola Paulista de Medicina, Sao Paulo, SP, Brazilb Centro de Quımica de Proteınas, Faculdade de Medicina de Ribeirao Preto, Brazil
c Departamento de Biologia Celular, Molecular e Bioagentes Patogenicos, Faculdade de Medicina de Ribeirao Preto, Universidade de Sao Paulo,
Av. Bandeirantes, 3900, 14049-900 Ribeirao Preto, SP, Brazild Laboratory for Mass Spectrometry and Gaseous Ion Chemistry, The Rockefeller University, New York, NY 10021-6399, USA
Received 11 February 2005; received in revised form 10 September 2005Available online 9 January 2006
Abstract
Nine chromatographic components containing trypsin inhibitor activity were isolated from Sechium edule seeds by acetone fraction-ation, gel filtration, affinity chromatography and RP-HPLC in an overall yield of 46% of activity and 0.05% of protein. The componentsobtained with highest yield of total activity and highest specific activity were sequenced by Edman degradation and their molecularmasses determined by mass spectrometry. The inhibitors contained 31, 32 and 27 residues per molecule and their sequences were:SETI–IIa, EDRKCPKILMRCKRDSDCLAKCTCQESGYCG; SETI–IIb, EEDRKCPKILMRCKRDSDCLAKCTCQESGYCGand SETI-V, CPRILMKCKLDTDCFPTCTCRPSGFCG. SETI–IIa and SETI–IIb, which differed by an amino-terminal E in the IIbform, were not separable under the conditions employed. The sequences are consistent with consensus sequences obtained from 37 otherinhibitors: CPriI1meCk_DSDCla_C_C_G_CG, where capital letters are invariant amino acid residues and lower case letters are the mostpreserved in this position. SETI–II and SETI–V form complexes with trypsin with a 1:1 stoichiometry and have dissociation constants of5.4 · 10�11 M and 1.1 · 10�9 M, respectively.� 2005 Elsevier Ltd. All rights reserved.
Keywords: Sechium edule (‘‘Chuchu’’); Cucurbitaceae; Serine protease; Squash trypsin inhibitor; Amino acid sequence; Trypsin activity; Mass spectro-metry
1. Introduction
Protein protease inhibitors are divided into four super-families, i.e., serine proteases, metalloproteases, cysteineproteases, and aspartic proteases (Laskowski and Kato,1980; Bode and Huber, 1993). They contain 29–190 aminoacid residues/molecule and do not represent a uniform evo-lutionary group. Inhibitors have a compact shape, a hydro-phobic nucleus, and some have several disulfide bridges/molecule (Bode and Huber, 1992, 1993). The plant serine
protease inhibitors are divided into families which includeKunitz, Bowman-Birk, Potato I and II and Squash, amongothers (Otlewski, 1993).
Squash-type trypsin inhibitors are the smallest serineprotease inhibitors known. They have been purified frommembers of the Cucurbitaceae family, such as Cucurbita,Cucumis and Momordica. These inhibitors form 1:1 com-plexes with trypsin, Factor XII of plasma and, in somecases, with elastase. The high association constants withbovine trypsin (108–1011 M�1) identify them as strong pro-tease inhibitors (Wieczorek et al., 1985; Krishnamoorthiet al., 1990). Their polypeptide chains are usually com-prised of 27–34 amino acid residues with, a high relative
0031-9422/$ - see front matter � 2005 Elsevier Ltd. All rights reserved.
doi:10.1016/j.phytochem.2005.11.016
* Corresponding author. Tel./fax: +55 16 2101 9366.E-mail address: [email protected] (L.J. Greene).
www.elsevier.com/locate/phytochem
Phytochemistry 67 (2006) 362–370
PHYTOCHEMISTRY
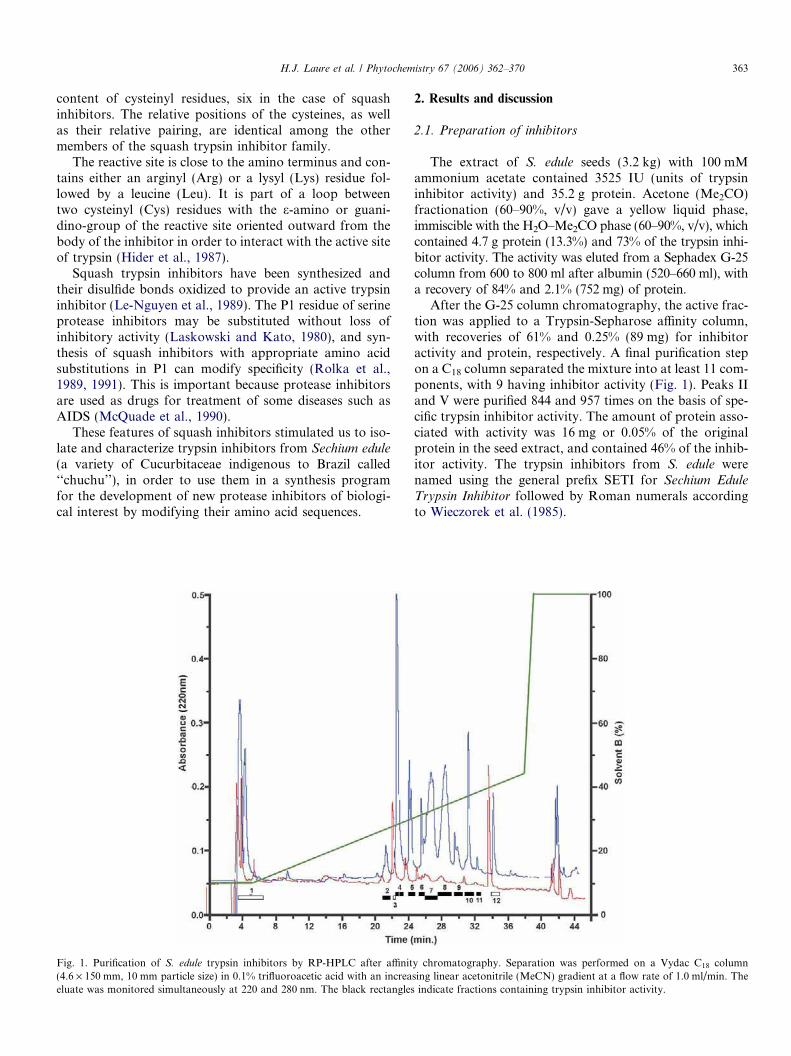
content of cysteinyl residues, six in the case of squashinhibitors. The relative positions of the cysteines, as wellas their relative pairing, are identical among the othermembers of the squash trypsin inhibitor family.
The reactive site is close to the amino terminus and con-tains either an arginyl (Arg) or a lysyl (Lys) residue fol-lowed by a leucine (Leu). It is part of a loop betweentwo cysteinyl (Cys) residues with the e-amino or guani-dino-group of the reactive site oriented outward from thebody of the inhibitor in order to interact with the active siteof trypsin (Hider et al., 1987).
Squash trypsin inhibitors have been synthesized andtheir disulfide bonds oxidized to provide an active trypsininhibitor (Le-Nguyen et al., 1989). The P1 residue of serineprotease inhibitors may be substituted without loss ofinhibitory activity (Laskowski and Kato, 1980), and syn-thesis of squash inhibitors with appropriate amino acidsubstitutions in P1 can modify specificity (Rolka et al.,1989, 1991). This is important because protease inhibitorsare used as drugs for treatment of some diseases such asAIDS (McQuade et al., 1990).
These features of squash inhibitors stimulated us to iso-late and characterize trypsin inhibitors from Sechium edule
(a variety of Cucurbitaceae indigenous to Brazil called‘‘chuchu’’), in order to use them in a synthesis programfor the development of new protease inhibitors of biologi-cal interest by modifying their amino acid sequences.
2. Results and discussion
2.1. Preparation of inhibitors
The extract of S. edule seeds (3.2 kg) with 100 mMammonium acetate contained 3525 IU (units of trypsininhibitor activity) and 35.2 g protein. Acetone (Me2CO)fractionation (60–90%, v/v) gave a yellow liquid phase,immiscible with the H2O–Me2CO phase (60–90%, v/v), whichcontained 4.7 g protein (13.3%) and 73% of the trypsin inhi-bitor activity. The activity was eluted from a Sephadex G-25column from 600 to 800 ml after albumin (520–660 ml), witha recovery of 84% and 2.1% (752 mg) of protein.
After the G-25 column chromatography, the active frac-tion was applied to a Trypsin-Sepharose affinity column,with recoveries of 61% and 0.25% (89 mg) for inhibitoractivity and protein, respectively. A final purification stepon a C18 column separated the mixture into at least 11 com-ponents, with 9 having inhibitor activity (Fig. 1). Peaks IIand V were purified 844 and 957 times on the basis of spe-cific trypsin inhibitor activity. The amount of protein asso-ciated with activity was 16 mg or 0.05% of the originalprotein in the seed extract, and contained 46% of the inhib-itor activity. The trypsin inhibitors from S. edule werenamed using the general prefix SETI for Sechium Edule
Trypsin Inhibitor followed by Roman numerals accordingto Wieczorek et al. (1985).
Fig. 1. Purification of S. edule trypsin inhibitors by RP-HPLC after affinity chromatography. Separation was performed on a Vydac C18 column(4.6 · 150 mm, 10 mm particle size) in 0.1% trifluoroacetic acid with an increasing linear acetonitrile (MeCN) gradient at a flow rate of 1.0 ml/min. Theeluate was monitored simultaneously at 220 and 280 nm. The black rectangles indicate fractions containing trypsin inhibitor activity.
H.J. Laure et al. / Phytochemistry 67 (2006) 362–370 363
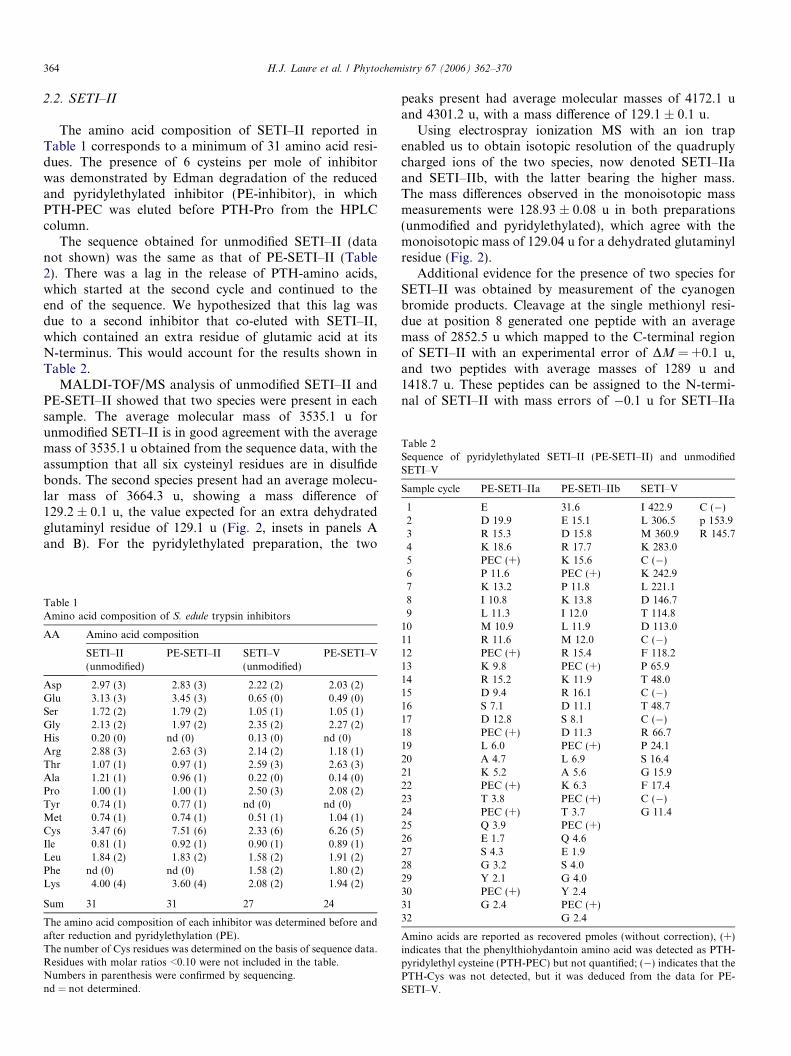
2.2. SETI–II
The amino acid composition of SETI–II reported inTable 1 corresponds to a minimum of 31 amino acid resi-dues. The presence of 6 cysteins per mole of inhibitorwas demonstrated by Edman degradation of the reducedand pyridylethylated inhibitor (PE-inhibitor), in whichPTH-PEC was eluted before PTH-Pro from the HPLCcolumn.
The sequence obtained for unmodified SETI–II (datanot shown) was the same as that of PE-SETI–II (Table2). There was a lag in the release of PTH-amino acids,which started at the second cycle and continued to theend of the sequence. We hypothesized that this lag wasdue to a second inhibitor that co-eluted with SETI–II,which contained an extra residue of glutamic acid at itsN-terminus. This would account for the results shown inTable 2.
MALDI-TOF/MS analysis of unmodified SETI–II andPE-SETI–II showed that two species were present in eachsample. The average molecular mass of 3535.1 u forunmodified SETI–II is in good agreement with the averagemass of 3535.1 u obtained from the sequence data, with theassumption that all six cysteinyl residues are in disulfidebonds. The second species present had an average molecu-lar mass of 3664.3 u, showing a mass difference of129.2 ± 0.1 u, the value expected for an extra dehydratedglutaminyl residue of 129.1 u (Fig. 2, insets in panels Aand B). For the pyridylethylated preparation, the two
peaks present had average molecular masses of 4172.1 uand 4301.2 u, with a mass difference of 129.1 ± 0.1 u.
Using electrospray ionization MS with an ion trapenabled us to obtain isotopic resolution of the quadruplycharged ions of the two species, now denoted SETI–IIaand SETI–IIb, with the latter bearing the higher mass.The mass differences observed in the monoisotopic massmeasurements were 128.93 ± 0.08 u in both preparations(unmodified and pyridylethylated), which agree with themonoisotopic mass of 129.04 u for a dehydrated glutaminylresidue (Fig. 2).
Additional evidence for the presence of two species forSETI–II was obtained by measurement of the cyanogenbromide products. Cleavage at the single methionyl resi-due at position 8 generated one peptide with an averagemass of 2852.5 u which mapped to the C-terminal regionof SETI–II with an experimental error of DM = +0.1 u,and two peptides with average masses of 1289 u and1418.7 u. These peptides can be assigned to the N-termi-nal of SETI–II with mass errors of �0.1 u for SETI–IIa
Table 1Amino acid composition of S. edule trypsin inhibitors
AA Amino acid composition
SETI–II(unmodified)
PE-SETI–II SETI–V(unmodified)
PE-SETI–V
Asp 2.97 (3) 2.83 (3) 2.22 (2) 2.03 (2)Glu 3.13 (3) 3.45 (3) 0.65 (0) 0.49 (0)Ser 1.72 (2) 1.79 (2) 1.05 (1) 1.05 (1)Gly 2.13 (2) 1.97 (2) 2.35 (2) 2.27 (2)His 0.20 (0) nd (0) 0.13 (0) nd (0)Arg 2.88 (3) 2.63 (3) 2.14 (2) 1.18 (1)Thr 1.07 (1) 0.97 (1) 2.59 (3) 2.63 (3)Ala 1.21 (1) 0.96 (1) 0.22 (0) 0.14 (0)Pro 1.00 (1) 1.00 (1) 2.50 (3) 2.08 (2)Tyr 0.74 (1) 0.77 (1) nd (0) nd (0)Met 0.74 (1) 0.74 (1) 0.51 (1) 1.04 (1)Cys 3.47 (6) 7.51 (6) 2.33 (6) 6.26 (5)Ile 0.81 (1) 0.92 (1) 0.90 (1) 0.89 (1)Leu 1.84 (2) 1.83 (2) 1.58 (2) 1.91 (2)Phe nd (0) nd (0) 1.58 (2) 1.80 (2)Lys 4.00 (4) 3.60 (4) 2.08 (2) 1.94 (2)
Sum 31 31 27 24
The amino acid composition of each inhibitor was determined before andafter reduction and pyridylethylation (PE).The number of Cys residues was determined on the basis of sequence data.Residues with molar ratios <0.10 were not included in the table.Numbers in parenthesis were confirmed by sequencing.nd = not determined.
Table 2Sequence of pyridylethylated SETI–II (PE-SETI–II) and unmodifiedSETI–V
Sample cycle PE-SETI–IIa PE-SETl–IIb SETI–V
1 E 31.6 I 422.9 C (�)2 D 19.9 E 15.1 L 306.5 p 153.93 R 15.3 D 15.8 M 360.9 R 145.74 K 18.6 R 17.7 K 283.05 PEC (+) K 15.6 C (�)6 P 11.6 PEC (+) K 242.97 K 13.2 P 11.8 L 221.18 I 10.8 K 13.8 D 146.79 L 11.3 I 12.0 T 114.8
10 M 10.9 L 11.9 D 113.011 R 11.6 M 12.0 C (�)12 PEC (+) R 15.4 F 118.213 K 9.8 PEC (+) P 65.914 R 15.2 K 11.9 T 48.015 D 9.4 R 16.1 C (�)16 S 7.1 D 11.1 T 48.717 D 12.8 S 8.1 C (�)18 PEC (+) D 11.3 R 66.719 L 6.0 PEC (+) P 24.120 A 4.7 L 6.9 S 16.421 K 5.2 A 5.6 G 15.922 PEC (+) K 6.3 F 17.423 T 3.8 PEC (+) C (�)24 PEC (+) T 3.7 G 11.425 Q 3.9 PEC (+)26 E 1.7 Q 4.627 S 4.3 E 1.928 G 3.2 S 4.029 Y 2.1 G 4.030 PEC (+) Y 2.431 G 2.4 PEC (+)32 G 2.4
Amino acids are reported as recovered pmoles (without correction), (+)indicates that the phenylthiohydantoin amino acid was detected as PTH-pyridylethyl cysteine (PTH-PEC) but not quantified; (�) indicates that thePTH-Cys was not detected, but it was deduced from the data for PE-SETI–V.
364 H.J. Laure et al. / Phytochemistry 67 (2006) 362–370
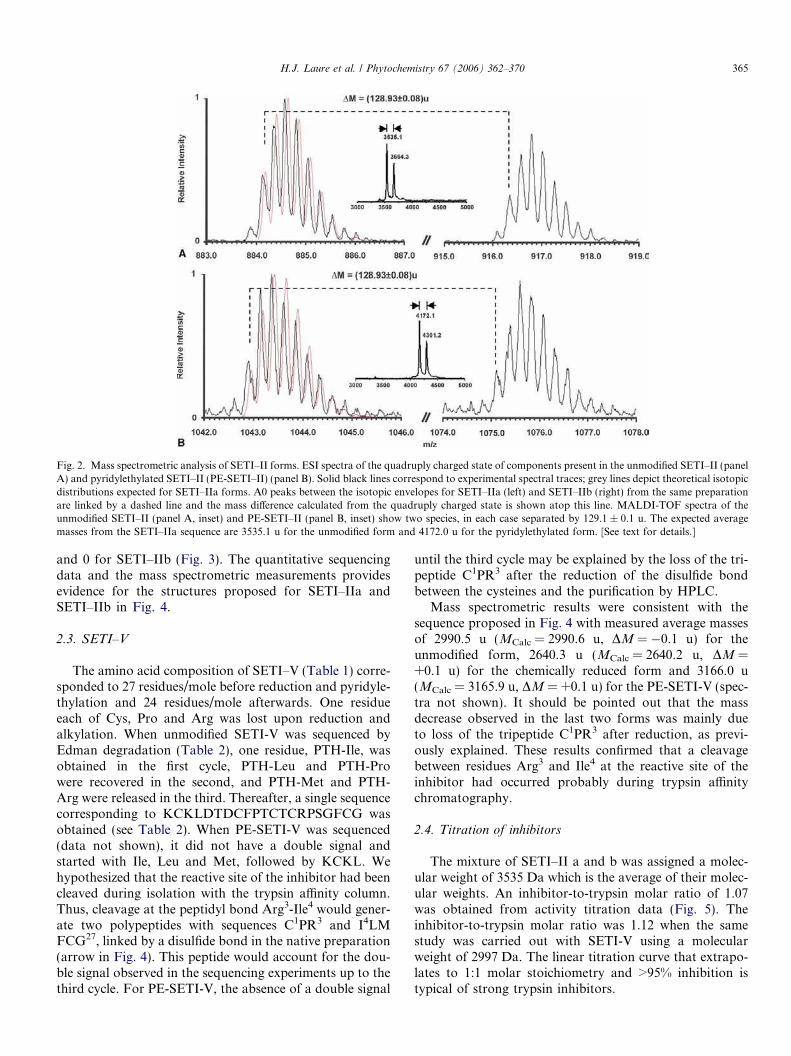
and 0 for SETI–IIb (Fig. 3). The quantitative sequencingdata and the mass spectrometric measurements providesevidence for the structures proposed for SETI–IIa andSETI–IIb in Fig. 4.
2.3. SETI–V
The amino acid composition of SETI–V (Table 1) corre-sponded to 27 residues/mole before reduction and pyridyle-thylation and 24 residues/mole afterwards. One residueeach of Cys, Pro and Arg was lost upon reduction andalkylation. When unmodified SETI-V was sequenced byEdman degradation (Table 2), one residue, PTH-Ile, wasobtained in the first cycle, PTH-Leu and PTH-Prowere recovered in the second, and PTH-Met and PTH-Arg were released in the third. Thereafter, a single sequencecorresponding to KCKLDTDCFPTCTCRPSGFCG wasobtained (see Table 2). When PE-SETI-V was sequenced(data not shown), it did not have a double signal andstarted with Ile, Leu and Met, followed by KCKL. Wehypothesized that the reactive site of the inhibitor had beencleaved during isolation with the trypsin affinity column.Thus, cleavage at the peptidyl bond Arg3-Ile4 would gener-ate two polypeptides with sequences C1PR3 and I4LMFCG27, linked by a disulfide bond in the native preparation(arrow in Fig. 4). This peptide would account for the dou-ble signal observed in the sequencing experiments up to thethird cycle. For PE-SETI-V, the absence of a double signal
until the third cycle may be explained by the loss of the tri-peptide C1PR3 after the reduction of the disulfide bondbetween the cysteines and the purification by HPLC.
Mass spectrometric results were consistent with thesequence proposed in Fig. 4 with measured average massesof 2990.5 u (MCalc = 2990.6 u, DM = �0.1 u) for theunmodified form, 2640.3 u (MCalc = 2640.2 u, DM =+0.1 u) for the chemically reduced form and 3166.0 u(MCalc = 3165.9 u, DM = +0.1 u) for the PE-SETI-V (spec-tra not shown). It should be pointed out that the massdecrease observed in the last two forms was mainly dueto loss of the tripeptide C1PR3 after reduction, as previ-ously explained. These results confirmed that a cleavagebetween residues Arg3 and Ile4 at the reactive site of theinhibitor had occurred probably during trypsin affinitychromatography.
2.4. Titration of inhibitors
The mixture of SETI–II a and b was assigned a molec-ular weight of 3535 Da which is the average of their molec-ular weights. An inhibitor-to-trypsin molar ratio of 1.07was obtained from activity titration data (Fig. 5). Theinhibitor-to-trypsin molar ratio was 1.12 when the samestudy was carried out with SETI-V using a molecularweight of 2997 Da. The linear titration curve that extrapo-lates to 1:1 molar stoichiometry and >95% inhibition istypical of strong trypsin inhibitors.
Fig. 2. Mass spectrometric analysis of SETI–II forms. ESI spectra of the quadruply charged state of components present in the unmodified SETI–II (panelA) and pyridylethylated SETI–II (PE-SETI–II) (panel B). Solid black lines correspond to experimental spectral traces; grey lines depict theoretical isotopicdistributions expected for SETI–IIa forms. A0 peaks between the isotopic envelopes for SETI–IIa (left) and SETI–IIb (right) from the same preparationare linked by a dashed line and the mass difference calculated from the quadruply charged state is shown atop this line. MALDI-TOF spectra of theunmodified SETI–II (panel A, inset) and PE-SETI–II (panel B, inset) show two species, in each case separated by 129.1 ± 0.1 u. The expected averagemasses from the SETI–IIa sequence are 3535.1 u for the unmodified form and 4172.0 u for the pyridylethylated form. [See text for details.]
H.J. Laure et al. / Phytochemistry 67 (2006) 362–370 365

2.5. Dissociation constants of the inhibitors
The dissociation constants were calculated from thesame data (Fig. 5) by Morrison�s procedure using the GraFit program (Knight, 1986) with Ki of 5.4 · 10�11 M and1.12 · 10�9 M for SETI–II and SETI-V, respectively (seeSection 3). The Ki values were within the range described forinhibitors of the ‘‘squash’’ family (10�8–10�11 M) (Otlewski,1990; Hamato et al., 1992).
2.6. Homology
Fig. 4 shows the primary structures of the inhibitorsdocumented here and the consensus sequence obtainedfrom 37 squash inhibitors. There is 29% identity of theamino acid sequence (not amino acid conserved) amongthe 37 inhibitors (algorithm Multalin from the PoleInformatique Lyonnais, France, Network Protein Seq-uence Analysis, URL. http://npsa-pbil.ibcp.fr/cgi-bin/
Fig. 3. MALDI-TOF/MS analysis of the cyanogen bromide cleavage products from reduced and pyridylethylated SETI–II (PE-SETI–II). Two N-terminal peptides are present at average masses of 1289.5 u (DM = �0.1 u) and 1418.7 u (DM = 0 u), and only a single carboxyl terminal peptide at mass2852.5 u (DM = +0.1 u). The mass pairs (1418.7,1400.6) and (1289.5, 1271.4) correspond respectively to the open and closed forms of the b-lactam ringformed by modification of the side chain of the methionyl residue upon cleavage by CNBr (homoserine or homoserine lactone). Three internal calibrantpeaks were used to calibrate the spectrum (only one is shown here). Peaks not identified in the spectrum correspond to sodium and copper adduct ions.[See text for experimental details and discussion.]
Fig. 4. Homology of the trypsin inhibitors from Sechium edule. The sequences for the three inhibitors were determined by automated Edman sequencingand confirmed by mass spectrometry. Cysteine was not identified in the native protein, but was identified positively when the reduced and pyridylethylatedform of the inhibitor were sequenced. Data for the consensus sequence were obtained by aligning 37 squash-type trypsin inhibitors using the alignmenttool Multalin (URL: http://npsa-pbil.ibcp.fr/cgi-bin/npsa_automat.pl?page=/NPSA/npsa_server.html) from the Pole Informatique Lyonnais, France.Invariant residues are printed in capital letters and the most preserved residues in many inhibitors in lower case letters in the consensus sequence.
366 H.J. Laure et al. / Phytochemistry 67 (2006) 362–370

npsa_automat.pl?page=/NPSA/npsa_server.html). Themost striking feature of the sequence is the conservationof the number and position of the six cysteinyl residues.One would expect that the disulfide bridges should be thesame in all inhibitors of this family. Indeed they are: 1–4,2–5 and 3–6 as determined by NMR for EETI-II (Heitzet al., 1989), by crystallography for CMTI-I (Bode et al.,1989) and by wet chemistry for MCTI-A (Hara et al.,1989) and SETI–IIa (Faca et al., 2004).
The arrow in Fig. 4 indicates the position of the reactivecenter consisting of Lys 0 or Arg 0 and Ile
00using the notation
of Schechter and Berger (1967). Variations in the aminoacid sequence are concentrated in the N-terminus region,i.e., before Cysl. Four other residues are invariant in thesequence: Pro (P2), Ile (P1 0), Gly (P22 0) and Gly (P24 0).All of these residues in CMTI-I are in contact with thetrypsin protease (Bode et al., 1989). In general there is onlyone aromatic amino acid in each molecule, located at posi-tion seven (P2 0) or 27 (P22 0), except for SETI-V which con-tains an extra aromatic residue (Phe) at P12 0.
Before the first invariant cysteine in SETI–II andSETI–V, other amino acids are present that extend theamino-terminus. If the inhibitor loses these N-terminalamino acids, for example a tripeptide, the association con-stant increases around 10-fold (Wieczorek et al., 1985).
However, when an extra residue such as pyroglutamic acidis added to the amino terminus the association constantdecreases 2.5-fold. A Lys residue at the P1 position inhibitstrypsin 2.7-fold stronger than an Arg at the same position(Otlewski, 1993), and we observe a decrease in the associa-tion constant when SETI–II is compared to SETI–V (seeFig. 4).
The present study documents the isolation and the pri-mary structure of a squash-type trypsin inhibitor. Its struc-ture is identical to others described in the literature,especially the relative positions of the cysteines residues,reactive site and disulfide bridges (Faca et al., 2004). Theloop which presents the reactive site (Arg or Lys (P1)and lie (P1 0)) is conserved and provides the limited numberof contacts with the reaction center of the trypsin, whichleads to binding constants of 10�9–10�10.
3. Experimental
3.1. Plant material
S. edule (central city food market) was obtained from acommercial source. The seeds were collected and trituratedusing a domestic blender.
3.2. Inhibitor preparation
3.2.1. Extraction of inhibitors from S. edule and acetone
precipitationFresh seeds (3.2 kg) obtained from S. edule were triturated
in 100 mM ammonium acetate buffer (10 L, pH 7.0) andmixed-for 64 h at 4 �C. After centrifugation (5000g for10 min at 4 �C) and lyophilization, the residue was suspendedin distilled H2O (800 ml), with the latter adjusted to aqueousMe2CO (6:4, v/v) and then centrifuged (5000g for 10 min).The supernatant was next adjusted to aqueous Me2CO(9:1, v/v) and centrifuged under the same conditions. A yel-low liquid phase formed at the bottom of the tube containing73% of total trypsin inhibitor activity was collected.
3.2.2. Sephadex G-25 size exclusion chromatography
A 20-ml aliquot of the yellow liquid obtained by acetonefractionation (353 mg protein and 194 IU) was diluted to50 ml with 5% aqueous acetic acid (HOAc, v/v) andapplied to a Sephadex G-25 column (2.5 · 250 cm). Thecolumn, previously standardized as described by Freitaset al. (1993), was eluted with 5% aqueous HOAc (v/v) at84 ml/h at room temperature with 14-ml fractions were col-lected. The effluent was monitored at 280 nm and trypsininhibitor activity was measured with DL-BAPNA asdescribed below.
3.2.3. Trypsin-Sepharose affinity chromatographyTrypsin-Sepharose-4B resin (Pharmacia) was prepared
by the method of Cuatrecasas (1970) using bovine trypsin.An aliquot of the eluate from the G-25 column (55.3 IU
Fig. 5. Titration of bovine trypsin with SETI–II and SETI–V. The assaysolution contained 0.28 mM DL-BAPNA and 28.6 nM trypsin in 50 mMTris–HCl buffer, pH 8.2 with 20 mM calcium chloride. The inhibitor-to-trypsin molar ratios determined for SETI–II and SETI–V were 1.07 (top)and 1.12 (bottom), respectively.
H.J. Laure et al. / Phytochemistry 67 (2006) 362–370 367

and 14.1 mg protein) in 5% aqueous HOAc (750 ll) wasapplied to 8 ml of a trypsin-Sepharose resin bed equili-brated with 100 mM Tris–HCl, pH 8.0. Protein bound tothe resin was eluted with 56 ml 500 mM KCl, pH 2.0. Frac-tions (4 ml) were collected into tubes containing 200 ll 1 MTris–HCl, pH 8.0.
3.2.4. Purification by RP-HPLC
Protein eluted from the trypsin-Sepharose affinity col-umn (0.23 mg protein containing 5.7 IU) was diluted to470 ll with 0.1% TFA and loaded on a Vydac C18 column(4.6 mm i.d. · 250 cm), equilibrated for 20 min with 90% Aand 10% B (solution A: 0.1% aqueous TFA; solution B:0.09% TFA in MeCN2–H2O (4:1)). After five minutes ofisocratic elution with 90% A, a linear gradient of 1% Bper minute was applied to the column for 33 min at 1 ml/min at room temperature. The eluate was monitored spec-trophotometrically at 220 and 280 nm simultaneously andpeaks were collected manually.
3.2.5. Reduction and alkylation
The inhibitor (containing 6 moles cysteine/mole inhibi-tor by amino acid analysis) was reduced and alkylated with4-vinylpyridine (Friedman et al., 1970; modified by Meneg-atti et al., 1992). Briefly 1 mole cysteine was reacted with 29moles DTT, in 250 mM Tris–HCl buffer, pH 8.2, undernitrogen for 4 h at 50 �C in the dark. Then, 52 moles4-vinylpyridine were added and the reaction was left tostand under nitrogen for an additional 4 h in the dark atroom temperature. The reaction was stopped by freezingin dry ice. PE-inhibitor was purified by RP-HPLC underthe same conditions as used for the unmodified inhibitor.
3.2.6. Trypsin activity
The trypsin used in these studies contained 55.4% activetrypsin (a stock solution was titrated with p-nitrophenyl gua-nidine benzoate chloride (NPGB) by the method of Chaseand Shaw (1967)). All concentrations of trypsin reportedhere are for active trypsin. Trypsin activity was determinedby the method of Erlanger et al. (1961) using benzoylDL-arginyl-p-nitroanilide (DL-BAPNA) as substrate. Asolution of active trypsin containing 13.60 lg/ml in 50 mMTris–HCl buffer, pH 8.2, with 20 mM CaCl2 (referred to asTris calcium buffer = TCB) and a solution of 0.3 mMDL-BAPNA in TCB were prepared daily.
The inhibitor in 50 ll TCB was preincubated with 50 llactive trypsin (13.60 lg/ml) in a 1 ml cuvette for 5 min at37 �C. The reaction was started by the addition of 900 ll0.3 mM DL-BAPNA in TCB and the product, p-nitroani-lide (p-NA, with 8800 M�1 cm�1 molar absorptivity Erlan-ger et al., 1961), was monitored at 410 nm, and recorded at0.1 AUFS for 4–6 min. Each measurement was made intriplicate and differences were 65%.
Trypsin activity is reported as lmoles p-NA hydrolyzedper min (lmol/min), with inhibitor activity (IU) reported inthe same units. Specific activity is reported as activity orinhibition per mg (or lg) protein. The trypsin used in this
study had a specific activity of 1.54 lmoles p-NA/lg activetrypsin.
3.2.7. Determination of the dissociation constant and
stoichiometry
The titration curve of trypsin with varying amounts ofinhibitor was used to determine the dissociation constantsand the stoichiometry for each inhibitor. Active trypsin(50 ll, 0.571 lM) and inhibitor (50 ll, 0–0.650 lM) werepreincubated in TCB for 5 min at 37 �C. The trypsin assaywas started by adding 900 ll 0.3 mM DL-BAPNA in TCB.The final concentrations were 28.6 nM active trypsin, 0–32 nM inhibitor and 0.270 mM DL-BAPNA. Residual tryp-sin activity was measured by release of p-NA that wasmonitored at 410 nm for 4–6 min at 0.1 AUFS. Each mea-surement was made in triplicate and differences were <5%.
The Ki was calculated using Morrison�s equation withthe Gra Fit program (Knight, 1986).
Morrison�s equation:
vi
v0
¼E0 � I0 � K i þ
ffiffiffiffiffiffiffiffiffiffiffiffiffiffiffiffiffiffiffiffiffiffiffiffiffiffiffiffiffiffiffiffiffiffiffiffiffiffiffiffiffiffiffiffiffiffiffiffi
ðE0 þ I0 � K iÞ2 � 4E0I0
q
2E0
where v0 = velocity without inhibitor; vi = velocity withthe inhibitor; E0 = total concentration of the enzyme;I0 = total concentration of the inhibitor; Ki = inhibitionconstant.
The stoichiometry of the reaction was obtained graphi-cally by extrapolation of the linear regression line plot ofvi/v0 versus inhibitor concentration.
3.2.8. Amino acid composition and protein determination
Amino acid compositions and total amount of proteinwere determined by amino acid analysis using the phenyl-thiocarbamyl (PTC) derivatization method (Bidlingmeyeret al., 1984). Briefly, samples were hydrolyzed with 6 NHCl in the vapor phase (110 �C) for 22 h (Atherton,1989), then derivatized with phenylisothiocyanate (PITC,Pierce), and applied to an RP-HPLC Picotag column. Anexternal standard (Amino Acid Standard H, Pierce Chem-ical Co., Rockford, IL), 100 pmoles, was used to calculatethe amino acid content of the sample.
3.2.9. Edman degradation
The inhibitors were sequenced with a Procise 491(Applied Biosystem, Foster City, CA) sequencer using afiberglass membrane treated with polybrene and a pulseliquid program. The HPLC system was calibrated with10 pmoles of the standard mixture of phenylthiohydantoin(PTH) amino acids (Applied Biosystem).
3.2.10. CNBr cleavage
Inhibitor, 50 pmoles in H2O–MeOH–HCO2H (5:3:2,v/v/v) containing a 500-fold molar excess of CNBr (PierceChemical Co.) to methionyl residues, was allowed to reactfor 30 min in the dark at room temperature. The reactionmixture was analyzed by MALDI-TOF/MS immediatelyafter CNBr treatment.
368 H.J. Laure et al. / Phytochemistry 67 (2006) 362–370
3.2.11. MALDI-TOF/MS
Samples were dissolved in a saturated solution ofa-cyano-4-hydroxy-cinnamic acid prepared in H2O–MeCN(2:1, v/v) and 0.1% TFA to a final concentration of400 fmol/ll. Aliquots of 0.5 ll (200 fmol) were depositedon gold-coated sample plates and allowed to air-dry. Thedry spots were washed twice with 0.5 ll of cold 0.1% aque-ous TFA solution, excess liquid being removed by vacuumsuction, and air-dried before the sample plate was intro-duced into the ionization source of the mass spectrometer.Two MALDI-TOF mass spectrometers were used in thisstudy. The principal device was a commercial instrument,STR Voyager (model STR, PE Biosystems, Foster City,CA) with delayed extraction and a reflector. This instru-ment is equipped with a nitrogen laser that delivers pulsesof ultraviolet light of 337 nm at 2 Hz to the matrix spots,with each pulse yielding a full mass spectrum. One-hundredindividual shots were averaged with software provided bythe manufacturer using 0.5 ns data channel widths to pro-duce a single mass spectrum.
The other instrument (Beavis and Chait, 1989, 1990) wasconstructed in the Laboratory for Mass Spectrometry andGaseous Ion Chemistry at the Rockefeller University anddetails of its operation can be found elsewhere (Cohenand Chait, 1996). This device is equipped with a Neodym-ium-YAG laser which pulses UV light at 355 nm. Data col-lection and analysis were performed with in-house software.One-hundred individual shots were averaged to produce asingle spectrum.
3.2.12. ESI/MS
ESI/MS analysis was performed on two different instru-ments, each fitted with an electrospray ionization sourcebuilt at the Rockefeller University: an ion trap mass spec-trometer, model LCQ (ThermoQuest Finnigan, San Jose,CA) and a triple quadrupole mass spectrometer, modelTSQ-700 (ThermoQuest Finnigan, San Jose, CA). Theinstruments were previously calibrated and tuned accord-ing to manufacturer�s instructions. Samples for ESI/MSanalysis were prepared by dilution to a final concentrationrange of 20–200 fmol/ll in a mixture of H2O–MeOH–HOAc at 49:50:1 (v/v/v), and infused at constant flow ratesof 0.5 or 1.0 ll/min with an infusion pump, model 22 (Har-vard, South Natick, MA), through a 50-lm i.d. fused silicacapillary directly into the ionization source of the massspectrometer. Desolvation conditions for peptide ionsincluded maintaining the heated capillary at 150 �C anddeclustering potentials of at least +38 V. Data were col-lected in the profile mode and 100 spectra were averagedduring acquisition time to produce a single final spectrum.
Acknowledgements
HJL was the recipient of a graduate student fellowshipfrom CNPq. JCP received a postdoctoral fellowship fromFAPESP. Research was supported by FAPESP, CNPq
and FINEP (PADCT). We thank Dr. Maria Luiza VilelaOliva (Universidade Federal de Sao Paulo) for permittingus to prepare the trypsin affinity column in her laboratoryand for many useful discussions, and Mrs. Elettra Greenefor correcting the manuscript.
References
Atherton, D., 1989. Successful PTC amino acid analysis at the picomolelevel. In: Hugli, T.E. (Ed.), Techniques in Protein Chemistry.Academic Press Inc., San Diego, pp. 273–283.
Beavis, R.C., Chait, B.T., 1989. Factors affecting the ultraviolet laserdesorption of proteins. Rapid Commun. Mass Spectrom. 3, 233–237.
Beavis, R.C., Chait, B.T., 1990. High-accuracy molecular mass determi-nation of proteins using matrix-assisted laser desorption massspectrometry. Anal. Chem. 62, 1836–1840.
Bidlingmeyer, B.A., Cohen, S.A., Tarvin, T.L., 1984. Rapid analysis ofamino acids using pre-column derivatization. J. Chromatogr. (Biomed.Appln.) 336, 93–104.
Bode, W., Huber, R., 1992. Natural protein proteinase inhibitors and theirinteraction with proteinases. Eur. J. Biochem. 204, 433–451.
Bode, W., Huber, R., 1993. Structural basis of the proteinase–proteininhibitor interaction. In: Aviles, F.X. (Ed.), Innovations in Proteasesand their Inhibitors. Walter de Gruyter, Berlin, pp. 81–122.
Bode, W., Greyling, H.J., Huber, R., Otlewski, J., Wilusz, T., 1989. Therefined 2.0 A X-ray crystal structure of the complex formed betweenbovine beta-trypsin and CMTI-I, a trypsin inhibitor from squash seeds(Cucurbita maxima). Topological similarity of the squash seed inhib-itor with the carboxypeptidase. A inhibitor from potatoes. FEBS Lett.242, 285–292.
Chase Jr., T., Shaw, E., 1967. p-Nitrophenyl-p0-guanidinobenzoate HCl:A new active site titrant for trypsin. Biochem. Biophys. Res. Commun.29, 508–514.
Cohen, S.L., Chait, B.T., 1996. Influence of matrix solution conditions onthe MALDI-MS analysis of peptides and proteins. Anal. Chem. 68,31–37.
Cuatrecasas, P., 1970. Protein purification by affinity chromatography.Derivatizations of agarose and polyacrylamide beads. J. Biol. Chem.245, 3059–3065.
Erlanger, B.F., Kokowsky, N., Cohen, W., 1961. The preparation andproperties of two new chromogenic substrates of trypsin. Arch.Biochem. Biophys. 95, 271–278.
Faca, V.M., Pereira, S.R., Laure, H.J., Greene, L.J., 2004. Determinationand reoxidation of the disulfide bridges of a squash-type trypsininhibitor from Sechium edule seeds. Protein J. 23, 309–315.
Freitas, O., Padovan, G.J., Vilela, L., dos Santos, J.E., de Oliveira, J.E.D.,Greene, L.J., 1993. Characterization of protein hydrolysates preparedfor enteral nutrition. J. Agric. Food Chem. 41, 1432–1438.
Friedman, M., Krull, L.H., Cavins, J.F., 1970. The chromatographicdetermination of cystine and cysteine residues in proteins as S-b-(4-pyridylethyl)cysteine. J. Biol. Chem. 245, 3868–3871.
Hamato, N., Takano, R., Kamei-Hayashi, K., Hara, S., 1992. Purificationand characterization of serine proteinase inhibitors from gourd(Lagenaria leucantha Rusby var. Gourda Makino) seeds. Biosci.,Biotechnol., Biochem. 56, 275–279.
Hara, S., Makino, J., Ikenaka, T., 1989. Amino acid sequences anddisulfide bridges of serine proteinase inhibitors from bitter gourd(Momordica charantia LINN.) seeds. J. Biochem. 105, 88–92.
Heitz, A., Chiche, L., Le-Nguyen, D., Castro, B., 1989. 1H 2D NMR anddistance geometry study of the folding of Ecballium elaterium trypsininhibitor, a member of the squash inhibitors family. Biochemistry 28,2392–2398.
Hider, R.C., Drake, A.F., Morrison, I.E.G., Kupryszewski, G., Wilusz,T., 1987. Structure analysis of inhibitors isolated from Cucurbitacaeseeds – (Circular dichroism studies). Int. J. Peptide Protein Res. 30,397–403.
H.J. Laure et al. / Phytochemistry 67 (2006) 362–370 369

Knight, C.G., 1986. The characterization of enzyme inhibition. In:Barrett, A.J., Salvesen, G. (Eds.), Proteinase Inhibitors. ElsevierScience, Amsterdam, The Netherlands, pp. 23–51.
Krishnamoorthi, R., Gong, Y., Richardson, M., 1990. A new proteininhibitor of trypsin and activated Hageman factor from. FEBS Lett.273, 163–167.
Laskowski Jr., M., Kato, I., 1980. Protein inhibitors of proteinases. Ann.Rev. Biochem. 49, 593–626.
Le-Nguyen, D., Mattras, H., Coletti-Previero, M-A., Castro, B., 1989.Design and chemical synthesis of a 32 residue chimeric microproteininhibiting both trypsin and carboxypeptidase A. Biochem. Biophys.Res. Commun. 162, 1425–1430.
McQuade, T.J., Tomasselli, A.G., Lui, L., Karacostas, V., Moss, B.,Sawer, T.K., Heinrikson, R.L., Tarpley, W.G., 1990. A synthetic HIV-1 protease inhibitor with antiviral activity arrests HIV-like particlematuration. Science 247, 454–456.
Menegatti, E., Tedeschi, G., Ronchi, S., Bortolotti, F., Ascenzi, P.,Thomas, R.M., Bolognesi, M., Palmieri, S., 1992. Purification,inhibitory properties and amino acid sequence of a new serineproteinase inhibitor from white mustard (Sinapis alba L.) seed. FEBSLett. 301, 10–14.
Otlewski, J., 1990. The squash inhibitor family of serine proteinases. Biol.Chem. Hoppe-Seyler 371 (Suppl.), 23–28.
Otlewski, J., 1993. The squash inhibitors of serine proteinases. In: Aviles,F.X. (Ed.), Innovations in Proteases and their Inhibitors. Walter deGruyter, Berlin, pp. 369–388.
Rolka, K., Kupryszewski, G., Ragnarsson, U., Otlewski, J., Wilusz, T.,Polanowski, A., 1989. Synthesis of an elastase inhibitor by monosub-stitution of arginine-5 with valine at the reactive site in a trypsin inhibitorfrom squash seeds (CMTI III). Biol. Chem. Hoppe-Seyler 370, 499–502.
Rolka, K., Kupryszewski, G., Ragnarsson, U., Otlewski, J., 1991.Chemical synthesis of new trypsin, chymotrypsin and elastase inhib-itors by amino-acid substitutions in a trypsin inhibitor from squashseeds (CMTI III). Biol. Chem. Hoppe-Seyler 372, 63–68.
Schechter, I., Berger, A., 1967. On the size of the active site in proteases. I.Papain. Biochem. Biophys. Res. Commun. 27, 157–162.
Wieczorek, M., Otlewski, J., Cook, J., Parks, K., Lulek, J., Wilimowska-Pelc, A., Polanowski, A., Wilusz, T., Laskowski Jr., M., 1985. Thesquash family of serine proteinase inhibitors. Amino acid sequencesand association equilibrium constants of inhibitors from squash,summer squash, zucchini, and cucumber seeds. Biochem. Biophys.Res. Commun. 126, 646–652.
370 H.J. Laure et al. / Phytochemistry 67 (2006) 362–370

PCR and PCR–RFLP of the 5S-rRNA-NTS region andsalvinorin A analyses for the rapid and unequivocal
determination of Salvia divinorum
Cinzia M. Bertea a,1, Pino Luciano a,1, Simone Bossi a, Francesca Leoni b, Claudio Baiocchi c,Claudio Medana c, Chiara M.M. Azzolin a, Giovanni Temporale b,
Maria Antonietta Lombardozzi b, Massimo E. Maffei a,*
a Department of Plant Biology and Centre of Excellence CEBIOVEM, University of Turin, Viale P.A. Mattioli, 25, 10125 Turin, TO, Italyb Central Direction of Anticrime Police, Interregional Department of Scientific Police, Piedmont and Aosta Valley,
Questura di Torino, Corso Vinzaglio 10, 10136 Turin, Italyc Department of Analytical Chemistry, University of Turin, Via P. Giuria 5, 10125 Turin, Italy
Received 19 October 2005; received in revised form 5 December 2005
Abstract
Salvia divinorum Epling & Jativa-M. is a perennial herb belonging to the Lamiaceae family; its active ingredient, the neoclerodanediterpene salvinorin A, is a psychotropic molecule that produces hallucinations. A comparative evaluation of S. divinorum fresh anddried leaves, S. officinalis fresh leaves, and dried powdered leaves claimed to be S. divinorum was done. HPLC–MS data confirmedthe presence of salvinorin A in both S. divinorun leaf extracts and the powdered leaves, whereas no salvinorin A was found in S. offici-
nalis. The non-transcribed spacer (NTS) in the 5S-rRNA gene of all leaf samples and the dried powdered leaves was amplified by PCRusing a pair of primers located at the 3 0 and 5 0 ends of the coding sequence of 5S-rRNA gene. The resulting PCR products (about 500 bpfor S. divinorum and 300 bp for S. officinalis) were gel purified, subcloned into pGEM�-T Easy vector and sequenced. By aligning theisolated nucleotide sequences, great diversities were found in the spacer region of the two species. Specific S. divinorum primers weredesigned on the sequence of the 5S-rRNA gene spacer region. In addition, a PCR–restriction fragment length polymorphism (PCR–RFLP) method was applied using NdeI and TaqI restriction enzymes. An NdeI site, absent in S. officinalis, was found in S. divinorum
NTS region at 428–433 bp. For TaqI, multiple sites (161–164, 170–173, and 217–220 bp) were found in S. officinalis, whereas a unique sitewas found in S. divinorum (235–238 bp). The results of this work show that the combined use of analytical chemical (HPLC–MS) andmolecular (DNA fingerprinting) methods lead to the precise and unequivocal identification of S. divinorum.� 2005 Elsevier Ltd. All rights reserved.
Keywords: Salvia divinorum Epling & Jativa-M.; Lamiaceae; Diviner’s sage; Salvinorin A; 5S-rRNA spacer region; DNA sequence analysis; NdeI andTaqI site PCR–RFLP; S. divinorun specific primer design
1. Introduction
Salvia divinorum Epling & Jativa-M. is a perennial herbbelonging to the Lamiaceae family and is most recognized
for its hallucinogenic properties (for reviews, see Valdeset al., 1983; Sheffler and Roth, 2003). The current distribu-tion of S. divinorum suggests that all existing stands of theplant have been intentionally cultivated by humans; noclearly wild populations of the species have been identifiedand it has been proposed that S. divinorum may in fact be ahybrid, resulting in substantially reduced fertility withinthe species (Reisfield, 1993). The active ingredient of
0031-9422/$ - see front matter � 2005 Elsevier Ltd. All rights reserved.
doi:10.1016/j.phytochem.2005.12.006
* Corresponding author. Tel.: +39 011 6705967; fax.: +39 011 2365967.E-mail address: [email protected] (M.E. Maffei).
1 These two authors contributed equally to the work.
www.elsevier.com/locate/phytochem
Phytochemistry 67 (2006) 371–378
PHYTOCHEMISTRY

S. divinorum is the neoclerodane diterpene salvinorin A, apsychotropic molecule that produces hallucinations (Yanand Roth, 2004; Babu et al., 2005). For this reason, S. divino-
rum is a frequently used hallucinogen (Giroud et al., 2000),with similar potency as LSD in producing hallucination(Siebert, 1994). S. divinorum is currently non-scheduled(i.e., legal) in the United States (Roth et al., 2004). At pres-ent, in almost all countries, the use of S. divinorum is notbanned because neither the plant nor or any of its constit-uents is listed in the controlled substance lists. In August2004, the plant and its main active principle, salvinorinA, were added to Lists of Controlled Illicit Substances inItaly and sales are also prohibited in Spain, Finland, Den-mark and Australia (Bucheler et al., 2005; Pichini et al.,2005). A recent pivotal study reported that salvinorin Awas a selective, high efficacy j-agonist in cloned humanj-receptors, and in guinea pig brain (Roth et al., 2002).Recently, it has been reported that salvinorin A producesdiscriminative stimulus effects similar to those of a high effi-cacy j-agonist also in non-human primates (Butelmanet al., 2004). Synthetic j-agonists administered systemicallyto humans are known to produce a variety of dose-depen-dent and reversible subjective/interoceptive effects, includ-ing sedation, dysphoria and ‘‘psychotomimetic’’ effects(Pfeiffer et al., 1986; Ur et al., 1997; Walsh et al., 2001).Salvinorin A is also the only known lipid-like molecule thatselectively and potently activates a G-protein coupledreceptor (GPCR), which has as its endogenous agonist apeptide; salvinorin A and a few C(4)- and C(2)-modifiedsalvinorin A analogues are the only known non-nitroge-nous opioid receptor agonist (Lee et al., 2005a,b; Beguinet al., 2005; Yan et al., 2005). HPLC (Gruber et al.,1999; Schmidt et al., 2005) and GC/MS (Pichini et al.,2005) methodologies to quantify salvinorin A in S. divino-
rum leaves have been developed in conventional and non-conventional biological matrices; whereas salvinorin Astructure has been determined using 1H nuclear magneticresonance (H NMR) and by independent single-crystalX-ray studies (Sheffler and Roth, 2003). Moreover, astraightforward synthesis of a deuterium labeled analogof salvinorin A and its utility as an internal standard forthe detection of salvinorin A and its metabolites in biolog-ical fluids by LC–MS have been described (Tidgewell et al.,2004). Finally, a microscopic survey of the S. divinorum
plant was performed to examine the various types of tric-homes present. Salvinorin A and related compounds havebeen found secreted as components of a complex resin thataccumulates in the subcuticular space of peltate glandulartrichomes (Siebert, 2004).
The concentration of salvinorin A in leaves at variousstages of development on an individual plant is oftenremarkably consistent. However, leaves collected from sep-arate plants can vary considerably, even when they aregenetically identical (Gruber et al., 1999). Often S. divino-rum is sold as a powder that can be easily adultered by add-ing dried leaves of other species, thus making hard toestablish the purity of the samples. The general approaches
to herbal identification depend on morphological, anatom-ical, and chemical analyses, but these characteristics areoften affected both by the environmental and/or develop-mental factors during plant growth (Cai et al., 1999) andthe status of samples.
Molecular genetic methods have several advantages overclassical morphological and chemical analyses. Forinstance, the genetic method requires genotype insteadthan phenotype, therefore DNA based experiments havebecome widely employed techniques for a rapid identifica-tion of herbal medicine. We recently demonstrated thatmolecular approaches represent a powerful tool to distin-guish the Acorus calamus diploid b-asarone-free cytotypefrom the other cytotypes which contain this dangerousmolecule (Bertea et al., 2005). Since by using PCRapproaches, only nanogram quantities of DNA arerequired to amplify and yield sufficient amounts of tem-plate DNA for molecular genetic analysis, we used biomo-lecular approaches to create a molecular fingerprintingallowing the rapid and precise identification of S. divino-
rum. Owing to the increasing awareness of the dangeroususe of this plant, the results presented here represent a pow-erful tool for the rapid identification of S. divinorum sam-ples for phytochemical, forensic and toxicologicalinvestigations aimed to detect and quantify this plant.
2. Results and discussion
The chemical characterization of the neoclerodane diter-pene salvinorin A is the only available method, besidesmorphological identification of the plant, when possible,used to distinguish samples of S. divinorum. In order tomake a direct and comparative analysis of known andunknown samples, we extracted dried and fresh leaves ofS. divinorum and S. officinalis as well as a sample consistingof dried powdered leaves claimed to be S. divinorum.HPLC–MS was performed on authentic salvinorin A,which was used as a reference standard for the chemicalidentification of this compound in all extracts. The elutionprofile of the authentic standard, as recorded at 250 nm bythe UV DAD detector, showed a tiny peak of salvinorin A.By using mass spectrometry in full scan mode from 50 to700 amu it was possible to better identify the salvinorinA standard as a clear peak. By measuring only the daugh-ter ion 373 in an ms/ms analysis it was possible to use thepeak area for the quantitative determination of the salvino-rin A standard, which in our case was 10 ppm. When asample of fresh S. divinorum leaves was analyzed, the samemethod was used and the salvinorin A was quantified. Thecontent of salvinorin A in dried S. divinorum leaves wasfound to be 12.18 mg g�1 d. wt (± 0.21), in fresh S. divino-
rum leaves the content was 1.14 mg g�1 d. wt (± 0.01),whereas in the dried powdered leaves claimed to be S.divinorum the content of salvinorin A was45.37 mg g�1 d. wt (± 1.64). The latter analysis confirmedthat the dried powdered leaves contained salvinorin A
372 C.M. Bertea et al. / Phytochemistry 67 (2006) 371–378

which was possibly indicating the presence of S. divinorum.However, analysis of S. officinalis leaves adulterated withexogenous salvinorin A may lead to the same conclusions.HPLC–MS analyses performed on leaf extracts of S. offici-
nalis did not show any salvinorin A content, thus S. offici-
nalis was used as a further control for molecular biologystudies. The content of salvinorin A detected in our freshS. divinorum samples was in line with the most recent find-ings (Gruber et al., 1999; Munro and Rizzacasa, 2003; Sie-bert, 2004), whereas the content in dried leaves and in thepowdered unknown sample was remarkably high. How-ever, high contents of salvinorin A have already beenreported (Pichini et al., 2005) and variability in salvinorinA content in different S. divinorum plant samples has beendocumented (Siebert, 2004).
In higher eukaryotes, the 5S-rRNA gene is separated bysimple spacers. The gene occurs as a tandem repeated unitconsisting of a �120 bp coding region separated by aspacer region of various size. Although the coding regionis highly conserved, the spacer regions are variable in differ-ent species. Thus, the diversity of the spacer region can beused as an identification basis (Cai et al., 1999). Here, twoprimers flanking the spacer region of 5S-rRNA, alreadyemployed for differing A. calamus chemotypes (Sugimotoet al., 1999) and A. calamus cytotypes (Bertea et al.,2005) were used in PCR analysis of genomic DNA isolatedfrom fresh and dried leaves of S. divinorum and theunknown powdered leaf material claimed to be S. divino-
rum. A single fragment of approximately 500 bp was pro-
duced from each S. divinorum samples (Fig. 1, lanes 1–3),whereas a single fragment of about 300 bp was producedfor S. officinalis (Fig. 1, lane 4). Fragments derived fromboth species were ligated into pGEM�-T Easy vector andthe nucleotide sequence was determined. The sequencedregion spans 487 bp for S. divinorum (NCBI GenBankAccession No. DQ230979) and 308 bp for S. officinalis
(NCBI GenBank Accession No. DQ230980). When DNAtemplates were isolated either from fresh or dried leavesor powdered leaf material, identical sequences wereobtained from all S. divinorum tested samples, includingthe unknown powder.
Sequence alignment of the 5S-rRNA spacer regionflanked by the 3 0- and 5 0-ends of the coding region is shownin Fig. 2. Surprisingly, S. officinalis presented a differenceof 179 nucleotides with respect to S. divinorum. The iden-tity between S. divinorum and S. officinalis 5S-rRNA spaceris very low, since the two sequences align only at theregions flanking the spacer domain (Fig. 2).
In order to characterize better S. divinorum and to sim-plify the identification method, nucleotide sequences of the5S-rRNA gene spacer region were used to design four spe-cific primers (Fig. 3).
PCR products derived from all possible combinations ofS. divinorum specific primers also used with the primersdesigned on the coding regions of the plant 5S-rRNA gene,were analyzed. A single fragment of 265 bp in length wasamplified using the primer SD1 in combination with theprimer 5S-P1 (Fig. 4, lane 1), whereas the second (5S-P1and SD2, Fig. 4, lane 2) and the third (5S-P1 and SD3,Fig. 4, lane 3) primer set amplified a fragment of 371 and466 bp, respectively (see also Fig. 3). The use of the specificforward primer SDF in combination with SD1, SD2, SD3and 5S-P1 produced single fragments of 127 bp (Fig. 4,lane 5), 233 bp (Fig. 4, lane 6), 327 bp (Fig. 4, lane 7)and 349 bp (Fig. 4, lane 8), respectively. All amplificationsoccurred only in S. divinorum and no PCR products weredetected when S. officinalis DNA was employed as a tem-plate (data not shown), indicating that this approach canbe used to identify easily S. divinorum.
In addition, a PCR–RFLP method was applied. Fromthe identified sequences, a NdeI site, absent in S. officinalis,
could be found in S. divinorum 5S-rRNA spacer region at428 bp position (Fig. 2, shaded square box). PurifiedPCR products obtained by using 5S-P1 and 5S-P2 primerswere digested with NdeI. As expected, PCR products fromS. divinorum could be digested by NdeI. Two fragments of428 and 59 bp were created from digested S. divinorum
DNA (Fig. 5, lane 2). When purified PCR products fromboth S. divinorum and S. officinalis were digested usingTaqI, a completely different RFLP profile was observed.TaqI cleaved S. divinorum 5S-rRNA spacer region at235 bp position, whereas in S. officinalis cleavages were at161, 170 and 217 bp (Fig. 2, empty square boxes). In S.divinorum two fragments of 235 and 252 bp were created(Fig. 5, lane 3), whereas in S. officinalis the same digestionproduced four fragments: 9 (not visible), 47, 91 and 161 bp
Fig. 1. PCR products generated by primers (5S-P1 and 5S-P2) flankingthe spacer region of 5S-rRNA gene using DNAs from S. divinorum freshleaves, dried leaves and powder and S. officinalis fresh leaves. A singlefragment of approximately 500 bp was produced from each S. divinorum
samples, whereas a single fragment of about 300 bp was produced for S.
officinalis. M = bp markers. The PCR products were separated by usingthe Agilent 2100 Bioanalyzer and the DNA 1000 LabChip� Kit (AgilentTechnologies).
C.M. Bertea et al. / Phytochemistry 67 (2006) 371–378 373

long (Fig. 5, lane 6). When TaqI digested products from S.
divinorum were digested with NdeI, four fragments werefound: one at about 60 bp and one at about 190 bp, deriv-ing from the cleavage of the former fragment at 252 bp, oneof uncleaved product at about 235 bp, and the fourth atabout 250 bp indicating an incomplete cleavage of the for-
mer 252 bp fragment (Fig. 5, lane 4). The PCR–RFLPapproach represents a powerful tool for plant materialidentification, and it was also successfully employed forthe identification of a b-asarone-free A. calamus cytotype(Bertea et al., 2005) and for the discrimination of Fritillaria
species (Cai et al., 1999).In conclusion, the results of this work demonstrated that
the combined use of analytical chemical (HPLC–MS) andmolecular (DNA fingerprinting) methods lead to the pre-cise and unequivocal identification of S. divinorum whenanalyzed in fresh, dried leaves or even when the morpho-logical identification is not possible, as in the case of pow-dered dried material. Furthermore, here we have developeda rapid and precise method of identification of S. divinorum
based on its 5S-rRNA spacer region sequence. Finally, wehave shown that a unique NdeI site on this sequence can
Fig. 2. Sequence aligment of the spacer regions of 5S-rRNA genes from S. divinorum and S. officinalis. Primer sequences (5S-P1 and 5S-P2) used foramplification are in bold. Identical sequences are indicated by (*). Gaps (-) are introduced for the best alignment. NdeI site is evidenced by the shadedsquared box, whereas TaqI sites are indicated by empty squared boxes.
Fig. 3. Position of the primers (5S-P1 and 5S-P2) flanking the spacerregion of 5S-rRNA gene and forward (SDF) and reverse (SD1, SD2 andSD3) specific primers used for PCR amplification of the 5S-rRNA spacerregion of S. divinorum.
374 C.M. Bertea et al. / Phytochemistry 67 (2006) 371–378

easily discriminate S. divinorum from any other plant,whereas TaqI generates distinctive fragments in S. divino-
rum and in S. officinalis, respectively. In this context onlyS. officinalis was used as a direct comparison, but manyother species are under study and will be reported soon.However a blast search revealed that even though the 5S-rRNA gene is highly conserved, the NTS region is highlyvariable from species to species, allowing its use as a molec-ular marker (in accordance with Ma et al., 2000). Theseresults are particularly applicable in all cases when a rapid,precise and unequivocal identification of S. divinorum isneeded, even when traces of S. divinorum are present in
drug samples. This newly developed method is particularlysuitable for phytochemical, forensic and toxicologicalinvestigations.
3. Experimental
3.1. Plant material
Healthy plants of S. divinorum were obtained from akind permission of use by the judge for preliminary inves-tigations GIP Dr Ferraro from samples used during the
Fig. 4. S. divinorum PCR products generated by primers 5S-P1! SD1 (lane 1); 5S-P1! SD2 (lane 2); 5S-P1!SD3 (lane 3); PCR products generated byprimers (5S-P1 and 5S-P2) flanking the spacer region of 5S-rRNA gene using DNAs from fresh leaves (lane 4); PCR products generated by primers SDF! SD1 (lane 5); SD F! SD2 (lane 6); SD F! SD3 (lane 7); SD F! 5S-P2 (lane 8); M = bp markers. See also Fig. 3 for primers design. The PCRproducts were separated by using the Agilent 2100 Bioanalyzer and the DNA 1000 LabChip� Kit (Agilent Technologies).
Fig. 5. PCR–RFLP analysis using NdeI and TaqI. S. divinorum undigested PCR products (lane 1); S. divinorum NdeI digested PCR products (lane 2); S.
divinorum TaqI PCR digested products (lane 3); S. divinorumTaqI PCR digested products subsequently digested with NdeI (lane 4); S. officinalis undigestedPCR products (lane 5); S. officinalis TaqI digested PCR products (lane 6). M = bp markers. The digested and undigested products were separated by usingthe Agilent 2100 Bioanalyzer and the DNA 1000 LabChip� Kit (Agilent Technologies).
C.M. Bertea et al. / Phytochemistry 67 (2006) 371–378 375

criminal proceeding 10061/05 RGPM. Plants were identi-fied by taxonomists of the Department of Plant Biologyof Turin. Plants of S. officinalis were grown for severalyears in the experimental plots of the Botanical Gardenof the University of Turin. Dried powdered leaf materialclaimed to be S. divinorum was provided by the Interre-gional Department of Scientific Police – Piedmont andAosta Valley – Questura di Torino, following a seizureby the Police Narcotics Section. A voucher specimen isdeposited at the Herbarium Taurinensis of the Departmentof Plant Biology of the University of Turin.
3.2. HPLC–MS
Fresh an dried leaves of S. divinorum, fresh leaves of S.
officinalis and the unknown dried powdered leaves werecrushed and homogenated in a mortar in presence of aceto-nitrile/water 50/50 extraction mixture with a ratio of5 mg ml�1 for fresh leaves and 2 mg ml�1 for died leavesand powder. The resulting extracts were filtered by a firstpassage through 8 layers of cheesecloth and then by filter-ing through 0.45 lm filters. The salvinorin A standard wasisolated from S. divinorum leaves and kindly provided byRizzacasa and Munro (Melbourne University); the com-pound was dissolved in methanol and then diluted to10 ppm with methanol/water 50/50 mixture. HPLC gradewater was obtained from MilliQ System Academic(Waters, Millipore) and methanol HPLC grade was pre-ventively filtered through 0.45 lm filters.
HPLC–MS analyses were performed using a Thermo-Finnigan Surveyor equipped with a diode array UVdetector PDA-UV 6000 LP and coupled with the massspectrometer LCQ Deca XP plus equipped with an electro-spray interface and an ion trap as mass analyzer. The chro-matographic separations were performed on a PhenomenexLuna C-18 column (150 · 2 mm, 3 lm particle size). Injec-tion volume was 10 ll and the flow rate was 200 ll min�1.The gradient for the mobile phase was: 80/20 to 0/100,0.05% formic acid in water/acetonitrile in 40 min. Solventsand reagents were purchased from Sigma–Aldrich (Milan,Italy). The LC column effluent was delivered into the ionsource using nitrogen as sheath and auxiliary gas (ClaindNitrogen Generator apparatus). The source voltage wasset at the 4.5 kV value in positive mode and 4.0 kV in neg-ative mode. The heated capillary value was maintainedat 300 �C. The acquisition method used was previouslyoptimized in the tuning section for the parent compound(capillary, magnetic lenses and collimating octapoles volt-ages) in order to achieve the maximum sensitivity. Thetuning parameters adopted for ESI source were set asfollows: source current 5.0 lA, capillary voltage 39.0 V,tube lens �20 V; for ions optics: multipole 1 offset�6.75 V, inter multipole lens voltage �16.0 V, multipole 2offset �10.50 V.
Peak identification and quantification was performedusing an external standard approach and performingMS/MS analysis of the 373 amu daughter ion generated
from 433 amu ion and comparing the resulting chromato-gram with those obtained in unknown samples. Mass spec-tra (m/z and, in brackets, abundance) data for salvinorinA: 373(4.9), 355(15.7), 341(13.5), 313(17.1), 299(2.8),295(2.3), 267(1.2), 247(1.9), 239(2.6), 221(1.6), 173(0.9).
3.3. Genomic DNA extraction
Plant material (200 mg of fresh leaves or 60 mg of driedleaves or powdered material) was frozen in liquid nitrogenand ground to a fine powder in a chilled mortar.
Genomic DNA was extracted from the ground powderby using DNeasy� Plant Mini Kit (Qiagen) following man-ufacturer’s instruction. The quantity and quality of theDNA were assessed by both spectrophotometric analysisusing a GeneRay UV-Photometer (Biometra�) and gelelectrophoresis.
3.4. PCR amplification, subcloning and sequencing
Approximately 20 ng of genomic DNA isolated fromfresh, dried leaves and powdered leaf material of S. divino-rum and fresh leaves of S. officinalis were used as a templatefor PCR amplification with forward primer 5S-P1 (5 0-GTGCTTGGGCGAGAGTAGTA-3 0) and reverse primer5S-P2 (5 0-TTAGTGCTGGTATGATCGCA-3 0) flankingthe NTS of 5S-rRNA gene (Sugimoto et al., 1999; Berteaet al., 2005). The amplification was carried out in a 50 llreaction mixture containing 5 ll 10· PCR reaction buffer(Fermentas), 0.2 mM dNTPs, 20 pmol forward and reverseprimers and 0.5 U of Taq DNA polymerase (Fermentas).The PCR reactions were carried out in a Whatman Biom-etra� T-Gradient Thermocycler. Cycling conditions con-sisted of an initial 2 min at 94 �C followed by 1 mindenaturing at 94 �C, 1 min annealing at 56 �C and 2 minelongation at 72 �C repeated for 50 cycles and with5 min extension at 72 �C.
One microliter of the amplification reaction was ana-lyzed by using the Agilent 2100 Bioanalyzer (Agilent Tech-nologies) and the DNA 1000 LabChip� Kit (AgilentTechnologies) following manufacturer’s instructions. TheDNA 1000 LabChip� kit provides sizing and quantitationof dsDNA fragments ranging from 25 to 1000 bp. PCRproducts were also analyzed by a 2% agarose gel electro-phoresis and visualized by ethidium bromide stainingunder UV. From this gel a band of about 500 bp for S.divinorum and about 300 bp for S. officinalis was purifiedby using GFXe PCR DNA and Gel Band PurificationKit (Amersham Biosciences) and then subcloned intopGEM�-T Easy vector (Promega). The ligated productswere transformed into the Escherichia coli SubcloningDH5a Efficiency Competent Cells (Invitrogen). Coloniescontaining DNA inserts of the correct size were pickedand grown overnight in 3 ml of Luria–Bertani (LB) liquidmedium. The mini-preparation of plasmid DNAs were per-formed using QIAprep� Spin Miniprep Kit, following
376 C.M. Bertea et al. / Phytochemistry 67 (2006) 371–378

manufacturer’s instructions. The plasmid DNAs wereemployed as a template for sequencing. ABI Prism, BigDyeTerminator and Cycle Sequencing Ready Reaction Kitwere used for sequence reaction with T7 and SP6 primers(Applied Biosystems). Sequences were detected by anABI 377 automated sequencer according to the manufac-turer’s protocol (Applied Biosystems). Both strands ofDNA were sequenced at least twice and the sequences werealigned by using ClustalX software.
3.5. PCR amplification using specific primers for
S. divinorum
The sequences derived from fresh, dried leaves andthe powdered leaf material of S. divinorum were alignedin a unique sequence that allowed the design of one for-ward specific primer SDF 5 0-TGGAAGTCAGTCAG-AGGGATTG-3 0 and three reverse specific primers: SD15 0-AGCGTTTTGAGCCATTTCG-3 0, SD2 5 0-ATA-GGAGTTACGGGAGCCACAG-3 0 and SD3 5 0-CCAT-CATGTCCACCGCAATGT-3 0, which correspondedrespectively to nucleotides 139–160, 247–265, 350–371,and 445–466 of the S. divinorum non-transcribed spacer(NTS) sequence. The specific primers were used for ampli-fication also in combination with primer 5S-P1 and 5S-P2.The conditions of the PCR reactions were the same as men-tioned above.
One microliter of the amplification products were sepa-rated with the Agilent 2100 Bioanalyzer (Agilent Technol-ogies) and DNA 1000 LabChip� Kit (AgilentTechnologies) following manufacturer’s instructions.
3.6. PCR–RFLP
The purified PCR products of the 5S-rRNA gene spacerregion of S. divinorum were digested with 10 U of NdeI(Promega) at 37 �C for 1 h. The purified PCR productsof the 5 S-rRNA gene spacer region of S. divinorum andS. officinalis were also digested with 10 U of TaqI (Pro-mega) at 65 �C for 1 h. One microliter of both digestionreactions was fractionated by using the Agilent 2100 Bio-analyzer (Agilent Technologies) and DNA 1000 LabChip�
Kit (Agilent Technologies) following manufacturer’sinstructions.
Acknowledgement
The author thank the GIP Dr Ferraro for the kind per-mission to use the plant of S. divinorum from the criminalproceeding 10061/05 RGPM.
References
Babu, K., Boyer, E.W., Hernon, C., Brush, E., 2005. Emerging drugs ofabuse. Clin. Ped. Emerg. Med. 6, 81–84.
Beguin, C., Richards, M.R., Wang, Y.L., Chen, Y., Liu-Chen, L.Y., Ma,Z.Z., Lee, D.Y.W., Carlezon, W.A., Cohen, B.M., 2005. Synthesis andin vitro pharmacological evaluation of salvinorin A analogues mod-ified at C(2). Bioorg. Med. Chem. Lett. 15, 2761–2765.
Bertea, C.M., Azzolin, C.M.M., Bossi, S., Doglia, G., Maffei, M., 2005.Identification of an EcoRI restriction site for a rapid and precisedetermination of b-asarone-free Acorus calamus cytotypes. Phyto-chemistry 66, 507–514.
Bucheler, R., Gleiter, C.H., Schwoerer, P., Gaertner, I., 2005. Use ofnonprohibited hallucinogenic plants: increasing relevance for publichealth? A case report and literature review on the consumption ofSalvia divinorum (Diviner’s Sage). Pharmacopsychiatry 38, 1–5.
Butelman, E.R., Harris, T.J., Kreek, M.J., 2004. The plant-derivedhallucinogen, salvinorin A, produces j-opioid agonist-like discrimina-tive effects in rhesus monkeys. Psychopharmacology 172, 220–224.
Cai, Z.H., Li, P., Dong, T.T.X., Tsim, K.W.K., 1999. Molecular diversityof 5S-rRNA spacer domain in Fritillaria species revealed by PCRanalysis. Planta Med. 65, 360–364.
Giroud, C., Felber, F., Augsburger, M., Horisberger, B., Rivier, L.,Mangin, P., 2000. Salvia divinorum: an hallucinogenic mint whichmight become a new recreational drug in Switzerland. Forensic Sci.Int. 112, 143–150.
Gruber, J.W., Siebert, D.J., Der Marderosian, A.H., Hock, R.S., 1999.High performance liquid chromatographic quantification of salvinorinA from tissues of Salvia divinorum Epling & Jativa-M. Phytochem.Anal. 10, 22–25.
Lee, D.Y.W., Karnati, V.V.R., He, M.S., Liu-Chen, L.Y., Kondaveti, L.,Ma, Z.Z., Wang, Y.L., Chen, Y., Beguin, C., Carlezon, W.A., Cohen,B., 2005a. Synthesis and in vitro pharmacological studies of new C(2)modified salvinorin A analogues. Bioorg. Med. Chem. Lett. 15, 3744–3747.
Lee, D.Y.W., He, M.S., Kondaveti, L., Liu-Chen, L.Y., Ma, Z.Z., Wang,Y.L., Chen, Y., Li, J.G., Beguin, C., Carlezon, W.A., Cohen, B.,2005b. Synthesis and in vitro pharmacological studies of C(4) modifiedsalvinorin A analogues. Bioorg. Med. Chem. Lett. 15, 4169–4173.
Ma, X.Q., Duan, J.A., Zhu, D.Y., Dong, T.T.X., Tsim, K.W.K., 2000.Species identification of Radix Astragali (Huangqi) by DNA sequenceof NTS 5S-rRNA spacer domain. Phytochemistry 54, 363–368.
Munro, T.A., Rizzacasa, M.A., 2003. Salvinorins D–F, new neoclerodanediterpenoids from Salvia divinorum, and an improved method for theisolation of salvinorin A. J. Nat. Prod. 66, 703–705.
Pfeiffer, A., Brantl, V., Herz, A., Emrich, H.M., 1986. Psychotomimesismediated by kappa opiate receptors. Science 233, 774–776.
Pichini, S., Abanades, S., Farre, M., Pellegrini, M., Marchei, E., Pacifici,R., de la Torre, R., Zuccaio, P., 2005. Quantification of the plant-derived hallucinogen salvinorin A in conventional and non-conven-tional biological fluids by gas chromatography/mass spectrometryafter Salvia divinorum smoking. Rapid Commun. Mass Spectrom. 19,1649–1656.
Reisfield, A.S., 1993. The botany of Salvia divinorum (Labiatae). SIDA 15,349–366.
Roth, B.L., Baner, K., Westkaemper, R., Siebert, D., Rice, K.C.,Steinberg, S., Ernsberger, P., Rothman, R.B., 2002. Salvinorin A: apotent naturally occurring nonnitrogenous kappa opioid selectiveagonist. Proc. Natl. Acad. Sci. USA 99, 11934–11939.
Roth, B.L., Lopezd, E., Beischeld, S., Westkaempere, R.B., Evans, J.M.,2004. Screening the receptorome to discover the molecular targets forplant-derived psychoactive compounds: a novel approach for CNSdrug discovery. Pharmacol. Therap. 102, 99–110.
Schmidt, M.S., Prisinzano, T.E., Tidgewell, K., Harding, W., Butelman,E.R., Kreek, M.J., Murry, D.J., 2005. Determination of salvinorin Ain body fluids by high performance liquid chromatography–atmo-spheric pressure chemical ionization. J. Chromatogr. B 818, 221–225.
Sheffler, D.J., Roth, B.L., 2003. Salvinorin A: the ‘‘magic mint’’hallucinogen finds a molecular target in the kappa opioid receptor.Trends Pharmacol. Sci. 24, 107–109.
Siebert, D.J., 1994. Salvia divinorum and salvinorin A: new pharmacologicfindings. J. Ethnopharmacol. 43, 53–56.
C.M. Bertea et al. / Phytochemistry 67 (2006) 371–378 377

Siebert, D.J., 2004. Localization of salvinorin A and related compounds inglandular trichomes of the psychoactive sage, Salvia divinorum. Ann.Bot. 93, 763–771.
Sugimoto, N., Kiuchi, F., Mikage, M., Mori, M., Mizukami, H., Tsuda,Y., 1999. DNA profiling of Acorus calamus chemotypes differing inessential oil composition. Biol. Pharm. Bull. 22, 481–485.
Tidgewell, K., Harding, W.W., Schmidt, M., Holden, K.G., Murryb, D.J.,Prisinzano, T.E., 2004. A facile method for the preparation ofdeuterium labelled salvinorin A: synthesis of [2,2,2-2H3]-salvinorin A.Bioorg. Med. Chem. Lett. 14, 5099–5102.
Ur, E., Wright, D.M., Bouloux, P.M., Grossman, A., 1997. The effects ofspiradoline (U-62066E), a kappa-opioid receptor agonist, on neuro-endocrine function in man. Br. J. Pharmacol. 120, 781–784.
Valdes III, L.J., Diaz, J.L., Paul, A.G., 1983. Ethnopharmacology of skaMaria Pastora (Salvia divinorum, Epling and Jativa-M.). J. Ethno-pharmacol. 7, 287–312.
Walsh, S.L., Strain, E.C., Abreu, M.E., Bigelow, G.E., 2001.Enadoline, a selective kappa opioid agonist: comparison withbutorphanol and hydromorphone in humans. Psychopharmacology157, 151–162.
Yan, F., Roth, B.L., Salvinorin, A., 2004. A novel and highly selective j-opioid receptor agonist. Life Sci. 75, 2615–2619.
Yan, F., Mosier, P.D., Westkaemper, R.B., Stewart, J., Zjawiony, J.K.,Vortherms, T.A., Sheffler, D.J., Roth, B.L., 2005. Identification of themolecular mechanisms by which the diterpenoid salvinorin A binds tokappa-opioid receptors. Biochemistry 44, 8643–8651.
378 C.M. Bertea et al. / Phytochemistry 67 (2006) 371–378

Accumulation of coumarins in Arabidopsis thaliana
Kosuke Kai a, Bun-ichi Shimizu a,*, Masaharu Mizutani a, Ken Watanabe b, Kanzo Sakata a
a Institute for Chemical Research, Kyoto University, Gokasho, Uji, Kyoto 611-0011, Japanb Ibaraki Agricultural Center, Ibaraki 311-4203, Japan
Received 6 July 2005; received in revised form 8 October 2005Available online 6 January 2006
Abstract
The biosynthesis of coumarins in plants is not well understood, although these metabolic pathways are often found in the plant king-dom. We report here the occurrence of coumarins in Arabidopsis thaliana ecotype Columbia. Considerably high levels of scopoletin and itsb-D-glucopyranoside, scopolin, were found in the wild-type roots. The scopolin level in the roots was �1200 nmol/gFW, which was�180-fold of that in the aerial parts. Calli accumulated scopolin at a level of 70 nmol/gFW. Scopoletin and scopolin formation were induced inshoots after treatment with either 2,4-dichlorophenoxyacetic acid (at 100 lM) or a bud-cell suspension of Fusarium oxysporum.
In order to gain insight into the biosynthetic pathway of coumarins in A. thaliana, we analyzed coumarins in the mutants obtainedfrom the SALK Institute collection that carried a T-DNA insertion within the gene encoding the cytochrome P450, CYP98A3, whichcatalyzes 3 0-hydroxylation of p-coumarate units in the phenylpropanoid pathway. The content of scopoletin and scopolin in the mutantroots greatly decreased to �3% of that in the wild-type roots. This observation suggests that scopoletin and scopolin biosynthesis in A.
thaliana are strongly dependent on the 3 0-hydroxylation of p-coumarate units catalyzed by CYP98A3. We also found that the level ofskimmin, a b-D-glucopyranoside of umbelliferone, was slightly increased in the mutant roots.� 2005 Elsevier Ltd. All rights reserved.
Keywords: Arabidopsis thaliana; Cruciferae; Scopoletin; Scopolin; Skimmin; Biosynthesis of coumarins; Cytochrome P450; CYP98A3; T-DNA insertiontag lines
1. Introduction
Coumarins are often found as plant secondary metabo-lites in the plant kingdom (Zobel, 1997). Many have trivialnames, such as umbelliferone (7-hydroxycoumarin), escule-tin (6,7-dihydroxycoumarin), scopoletin (7-hydroxy-6-methoxycoumarin) and others (1–9) (Fig. 1). Their exactroles in plants are unclear. However, they are thought toplay some role in plant defense due to the induction of theirbiosynthesis following various stress events (Garcia et al.,1995; Baillieul et al., 2003; Shimizu et al., 2005) as well astheir antimicrobial and antioxidative activities (Valleet al., 1997; Chong et al., 2002; Gachon et al., 2004; Carpi-nella et al., 2005). So far, comparatively little informationis available regarding the biosynthesis of coumarins in
plants. The tracer experiments using 14C-labelled ferulateor other intermediates showed that tobacco plants are ableto produce scopoletin (7) from the phenylpropanoid path-way (Fritig et al., 1970). In the biosynthetic pathway ofplant coumarins, it is thought that oxidation at the 2 0-posi-tion of the ring of cinnamates, cis–trans geometrical isom-erization of the side chain and lactonization occursuccessively (Keating and O’Kennedy, 1997; Maternet al., 1999). Several branch pathways from phenylpropa-noid compounds to coumarins are probable (Fig. 1).
Arabidopsis CYP98A3 (At2g40890) encodes the cyto-chrome P450 called p-coumaroylshikimate/quinate 3 0-hydrolxylase (C3 0H) (Schoch et al., 2001). The 3 0-hydroxyl-ation step was reported to be important role(s) to controlcarbon allocation to downstream processes in the phenyl-propanoid pathway (Anterola et al., 1999, 2002). Frankeet al. (2002a,b) also reported that the C3 0H activity isimportant in the lignin synthesis because the deficient
0031-9422/$ - see front matter � 2005 Elsevier Ltd. All rights reserved.
doi:10.1016/j.phytochem.2005.11.006
* Corresponding author. Fax: +81 774 38 3229.E-mail address: [email protected] (B.-i. Shimizu).
www.elsevier.com/locate/phytochem
Phytochemistry 67 (2006) 379–386
PHYTOCHEMISTRY

mutant of C3 0H, ref8, exhibits a dwarf phenotype anddecreases in guaiacyl and syringyl lignin. Thus deficiencyin the function of C3 0H causes significant effects on theprofile of the phenylpropanoid metabolism and therefore,the c3 0h mutant is an exploitable source to investigate thebiosynthesis pathways of phenylpropanoids.
We report here the occurrence of coumarins in A. thali-
ana ecotype Columbia. Levels of 7 and its b-D-glucopyr-anoside, scopolin (8), in A. thaliana were quantified bothbefore and after various treatments. Furthermore, we ana-lyzed coumarins in the c3 0h mutants of A. thaliana obtainedfrom the SALK Institute collection in order to collectinformation on the biosynthesis of 7 and 8.
2. Results and discussion
2.1. Analysis of coumarins in Arabidopsis thaliana
Recently, it was reported that A. thaliana containsscopoletin (7) and its b-D-glucopyranoside, scopolin (8)
(Rohde et al., 2004; Bednarek et al., 2005). We extensivelyanalyzed coumarins in A. thaliana. Quantified levels of cou-marins in A. thaliana are shown in Table 1. Compounds 7
and 8, which were identified by LC–MS/MS, accumulatedto considerably high levels. Trace amounts of skimmin (2),esculetin (4) and the b-glucoside of 4 were also detected.We could not identify whether the b-glucoside of 4 is cic-horiin (5) or esculin (6), since the standard of 5 wasunavailable. Additional coumarins were not detected inA. thaliana.
The roots accumulated higher amounts of the coumarinsthan the shoots. HPLC analysis with a fluorescence detec-tor showed that levels of 7 and 8 in roots were �15 and1200 nmol/gFW, respectively, which were �180-fold ofthose in the shoots (Table 1). The level of 8 was �85-foldof that of 7 both in the shoots and roots, indicating thatthe majority of 7 is stored as b-glucoside in A. thaliana,although the glucosylation step of the 7-position has notbeen elucidated in A. thaliana. The calli also contained 7
and 8 at �1 and 70 nmol/gFW, respectively, �10-fold ofthose in the shoots.
p-Coumarate (16) Caffeate (15) Ferulate (10)
NH3+
O-O
OH
O O-
OH
SCoA
PAL
C4'H
4'CL
HCT
O
O
OR
O
O
OR'''H3CO
O
O O-
OH
O O-
HO
OH
O SCoA
HOOH
O SCoA
H3CO
OH
O O-
H3CO
COMT
CCoAOMT
Phenylalanine
Cinnamate
p-Coumaroyl CoA Caffeoyl CoA Feruloyl CoA
C3'H
3' 3'
p-Coumaroylquinate (13)
p-Coumaroylshikimate (14)
Caffeoylquinate (11)
Caffeoylshikimate (12)
HCT
O
O
OR''R'O
Esculetin (R' = H, R'' = H) (4)Cichoriin (R' = H, R'' = Glc) (5)Esculin (R' = Glc, R'' = H) (6)
Scopoletin (R''' = H) (7)Scopolin (R''' = Glc) (8)Scoparone (R''' = CH3) (9)
6
7
Lignin
4'CL
etc.
OH
OOOH
OH
HO COO-
OH
OOOH
OH
HO COO-
HO
OH
OOOH
OH
HO
COO-
OH
OOOH
OH
COO-
Umbelliferone (R = H) (1)Skimmin (R = Glc) (2)Herniarin (R = CH3) (3)
Fig. 1. Proposed biosynthesis pathways of coumarins in plants. Coumarins, such as umbelliferone (1) and scopoletin (7), are biosynthesized via thephenylpropanoid pathway. The enzymes and their abbreviations are phenylalanine ammonia-lyase (PAL); cinnamate 4 0-hydroxylase (C4 0H); 4 0-hydroxycinnamoyl CoA ligase (4 0CL); hydroxycinnamoyl CoA:shikimate/quinate hydroxycinnamoyltransferase (HCT); p-coumaroylshikimate/quinate3 0-hydroxylase (C3 0H); caffeic/50-hydroxyferulic acid O-methyltransferase (COMT); caffeoyl CoA O-methyltransferase (CCoAOMT).
380 K. Kai et al. / Phytochemistry 67 (2006) 379–386

The accumulation level of 7 and 8 in the roots of A. tha-
liana was comparable to that observed in tobacco (Die-terman et al., 1964). Compound 7 has antimicrobial andantioxidative activities (Valle et al., 1997; Chong et al.,2002; Gachon et al., 2004; Carpinella et al., 2005). Levelsof 7 may increase after hydrolysis of 8 by b-glucosidaseswhen the plants are subjected to wounding or other dam-age. The roots are thought to always be exposed to chal-lenges by microorganisms and physical wounding. Thehigher protection mechanisms seem to be needed in rootsrather than in aerial parts of the plants, for example accu-mulating protective compounds such as coumarins. Therelease of coumarins in A. thaliana by the action ofenzymes such as glucosidase(s) is also of interest to ourgroup.
2.2. Induction of scopoletin (7) and scopolin (8) after
various treatments
Coumarins were induced by various stresses or chemicaltreatments, such as wounding, phytohormones and interac-tion with microorganisms (Dieterman et al., 1964; Hinoet al., 1982; Cabello-Hurtado et al., 1998; Shimizu et al.,2005). To investigate the effect of phytohormones on thecontent of scopoletin (7) and scopolin (8) in A. thaliana,we treated the shoots with salicylic acid, methyl jasmonate,2,4-dichlorophenoxyacetic acid (2,4-D), and kinetin andincubated for 48 h. The levels of 7 and 8 in the shootsincreased after treatment with 2,4-D, whereas all otherplant hormones had no effect on the level (data not shown).The levels of 7 and 8 significantly increased 12 h after thetreatment and reached 0.55 and 31 nmol/gFW, respec-tively, at 48 h (Fig. 2). Considering that the calli derivedfrom leaves with 2,4-D and kinetin contains a higher levelof 7 and 8 than the shoots (Table 1), auxin may regulate thelevels of 7 and 8.
Treatment with a bud-cell suspension of Fusarium oxy-
sporum f. sp. batatas O-17 (5 · 107 bud-cells/ml), patho-genic against sweet potato and morning glory (Ogawa,1988; Shimizu et al., 2000), induced 7 and 8 in the shootsof A. thaliana. The levels of 7 and 8 treated with a bud-cellsuspension at 48 h were 0.68 and 16 nmol/gFW, respec-tively. Neither wounding nor treatment with laminarinand chitosan had any effect on the levels of these couma-
rins. Compounds 7 and 8 can be induced by the fungusstimulant F. oxysporum f. sp. batatas O-17, whose mecha-nism of interaction with A. thaliana is unknown. It isknown that coumarins including furanocoumarins relateto plant defense with their antimicrobial activity (Johnsonet al., 1973; Desjardins et al., 1989; Baillieul et al., 2003).Compound 7 is reported to play an important role in pro-tecting against pathogen infection (Valle et al., 1997;Chong et al., 2002; Gachon et al., 2004; Carpinella et al.,2005) and scavenging reactive oxygen intermediate accom-panied by infection (Chong et al., 2002). In A. thaliana,Compounds 7 and 8 may also have protective role(s) fol-lowing infection by microorganisms.
2.3. T-DNA insertion mutant lines of C3 0H
In the first step to investigate the biosynthesis of scopo-letin (7) and scopolin (8) in A. thaliana, we isolated thefunctional deficient mutants of C3 0H encoded by the cyto-chrome P450 gene, CYP98A3 (At2g40890) (Schoch et al.,2001). C3 0H is an important enzyme in the pathway. There-fore, it is interesting to investigate the effect of the C3 0Hmutation on coumarin biosynthesis. In the Salk InstituteGenomic Analysis Laboratory T-DNA insertion collec-tion, there were two candidate mutant lines in which T-
Table 1The occurrence of the coumarins in A. thaliana
Coumarins Shoot (nmol/gFW) Root (nmol/gFW) Callus (nmol/gFW)
Umbelliferone (1) n.d. n.d. n.d.Skimmin (2) n.d. trace n.d.Herniarin (3) n.d. n.d. n.d.Esculetin (4) trace trace n.d.Cichoriin (5) or esculin (6) trace trace traceScopoletin (7) 0.0720 ± 0.0329 14.7 ± 0.494 3.02 ± 0.686Scopolin (8) 6.87 ± 0.337 1250 ± 171 69.1 ± 11.3Scoparone (9) n.d. n.d. n.d.
Accumulated coumarins in higher levels, 7 and 8, were quantified with HPLC analysis using a fluorescence detector (ex 340 nm, em 420 nm). Values showthe averages of 7 and 8 contents with standard errors (n = 3). n.d. (not detected), trace: by LC–MS/MS.
nmol
/gF
W s
hoot
nmol
/gF
W s
hoot
Time [h]Time [h]
Scopolin (8)Scopoletin (7) 40
30
20
10
0 10 20 30 40 500 10 20 30 40 50
0.8
0.6
0.4
0.2
Fig. 2. Scopoletin (7) and scopolin (8) level in shoots after treatments with2,4-D and F. oxysporum. 23–25-day-old plants were treated with the 2,4-D(100 lM: solid circle, control: open circle) or bud-cell suspension of F.
oxysporum f. sp. batatas O-17 (5 · 107 bud-cells/ml: solid square, control:open square). Shoots were extracted with MeOH containing 4-methylum-belliferone as an internal standard. The MeOH extracts were subjected toHPLC analysis using a fluorescence detector (ex 340 nm, em 420 nm).Values show the averages of scopoletin (7) and scopolin (8) contents. Thehorizontal axis shows time after the treatments. Bars show standard errors(n = 3).
K. Kai et al. / Phytochemistry 67 (2006) 379–386 381

DNA was inserted in the exon of the CYP98A3 gene. Thetwo T-DNA insertion mutant lines (SALK_112823 andSALK_125686) were obtained from the Arabidopsis Bio-logical Resource Center (Ohio State University, Colum-bus). After selection of the homozygous T-DNA insertionmutants, the exact position of T-DNA insertion was deter-mined by sequencing of the PCR products amplified withthe gene-specific and T-DNA specific primers (Fig. 3A).In both mutant lines T-DNA was found to be inserted inan exon of the CYP98A3 gene. The functional deficiencyof CYP98A3 was confirmed by RT-PCR (Fig. 3B). Thesec3 0h mutants exhibited the dwarf phenotype (Frankeet al., 2002a), which was most likely the result of low ligninlevels (Franke et al., 2002b).
2.4. Reduction of scopoletin (7) and scopolin (8) level by the
functional deficiency of C3 0H
The two c3 0h mutant lines (SALK_112823 andSALK_125686) were used to determine the levels of scopo-letin (7) and scopolin (8). Quantification by HPLC analysisshowed that the levels of 7 and 8 in the c3 0h roots were verylow compared to those in the wild-type roots (Fig. 4). Thec3 0h roots contained 7 and 8 at about 0.6 and 30 nmol/gFW, 9% and 3% of the wild-type roots, respectively.The severe reduction of the coumarins in the c3 0h mutantsindicates that 7 and 8 are biosynthesized via the phenyl-propanoid pathway in A. thaliana. These results are consis-tent with previously reported research (Fritig et al., 1970),which showed that 7 is biosynthesized from ferulate (10)rather than via the umbelliferone–esculetin–scopoletinpathway in tobacco plants. The ring modification stepsare likely to proceed at the cinnamic acid stage in A. thali-
ana. The biosynthesis of 7 and 8 is strongly dependent onthe 3 0-hydroxylation of p-coumarate units, indicating that
the 3 0-hydroxy group of caffeate units leads to the oxygenatom in the 6-methoxy group of 7. Franke et al. (2002b)reported that the mutant of CYP98A3, ref8, exhibited areduction in guaiacyl and syringyl lignin and soluble units.The supply of caffeoylquinate (11) and/or caffeoylshikimate(12) to the downstream biosynthesis including 7 and 8 pre-sumably fell due to the deficiency of CYP98A3.
The presence of small amounts of 7 and 8 detected in thec3 0h mutants indicates a slight conversion from p-couma-rate units to caffeate units in the phenylpropanoid pathwayby another enzyme(s). While CYP98A3 has been reportedto be the main C3 0H enzyme in A. thaliana (Schochet al., 2001; Franke et al., 2002a,b; Raes et al., 2003),another enzyme(s) might exhibit C3 0H activity in A. thali-
ana. The CYP98A family consists of three genes,CYP98A3, CYP98A8 and CYP98A9, in A. thaliana.Although CYP98A8 and CYP98A9 do not hydroxylatep-coumaroylquinate (13) and p-coumaroylshikimate (14)(Schoch et al., 2001), they might catalyze the 3 0-hydroxyl-ation of p-coumarate units of other phenylpropanoidderivatives.
2.5. Increase of skimmin (2) level in the c3 0h mutants
Besides the substantial reduction in the levels of scopole-tin (7) and scopolin (8), we explored changes in the levels ofother coumarins in the c3 0h mutants. The level of skimmin(2), the b-glucoside of umbelliferone (1), identified by LC–MS/MS was slightly but significantly increased in the c3 0hmutants. HPLC analysis with a fluorescence detectorshowed that the level of 2 in the c3 0h roots was found tobe�2 nmol/gFW (Fig. 5). A trace amount of 1, the aglyconof 2, was also detected in the c3 0h roots by LC–MS/MS(data not shown). The major form of 1 in the c3 0h mutantswas the b-glucoside 2 as well as that of 7 in the wild-type,indicating that the glucosylation in the 7-position of 1 islikely active in the c3 0h mutants. Compound 1 and its b-glu-coside 2 do not have a methoxy group at the C-6 position,and therefore, they seem to be derived from precursors
Fig. 3. Characterization of the T-DNA insertion mutants of CYP98A3.Two homozygous lines of the mutant were obtained. (A) The positions ofthe T-DNA insertion in SALK_112823 and SALK_125686 lines. Theexact positions of the respective T-DNA insertion were determined bysequencing of the PCR products amplified with the gene-specific and theleft border specific primers. L means the left border of T-DNA. (B) RT-PCR of CYP98A3 transcripts. Total RNA was extracted from thehomozygous mutant lines and wild-type (WT). RT-PCR was performedwith the CYP98A3 specific primers and the ACTIN specific primers(control).
WT
nm
ol/g
FW
root
nm
ol/g
FW
root
SALK_ SALK_112823 125686
0
200
400
800
600
1000
1200
1400
1600
WT SALK_ SALK_112823 125686
0
2
4
6
8
MutantsMutants
Scopolin (8)Scopoletin (7)
Fig. 4. The levels of scopoletin (7) and scopolin (8) in the roots of the c3 0h
mutants and wild-type. The roots of 25-day-old plants were extracted withMeOH containing 4-methylumbelliferone as an internal standard. TheMeOH extracts were subjected to HPLC analysis using a fluorescencedetector (ex 340 nm, em 420 nm). Values show the averages of scopoletin(7) and scopolin (8) contents. Bars show standard errors (n = 3).
382 K. Kai et al. / Phytochemistry 67 (2006) 379–386

before the 3 0-hydroxylation reaction by C3 0H. p-Coumarateunits were accumulated in the ref8 mutant (Franke et al.,2002b), indicating that the pathway producing p-coumarateunits is still active in the ref8 mutant. In this pathway, anunusual p-hydroxyphenyl lignin is formed from p-coumarylalcohol, which accumulated instead of the guaiacyl and syr-ingyl lignin formed from coniferyl and sinapyl alcohol,respectively. The accumulated p-coumarate units may besupplied as the source of 1 and 2 in the c3 0h mutants. Fur-thermore, our results indicate that the c3 0h mutants retain,to some degree, the biosynthetic activities for constructingthe coumarin structure from p-coumarates and ferulates,in which the 2 0-hydroxylation could be the key step of thecoumarin biosynthesis because of its irreversibility. It wasreported that phenoloxidase in Saxifraga stolonifera has2 0-oxidation activity for caffeate (15) toward esculetin (4)production (Sato, 1967). However, phenoloxidase cannotcatalyze 2 0-oxidation of p-coumarate (16) and ferulate(10), which lack the hydroxy groups necessary to form thequinone structure allowing the reaction. The 2 0-oxidase(s)of cinnamates in plants still remains to be unclear. Ourresults indicate that these biosynthetic activities in A. thali-
ana constructing the coumarin structure could produce 1
from p-coumarate units. The level of 2 in the c3 0h mutantswas very low,�0.16% compared to that of 8 in the wild-typeroots. Two reasons could be proposed for the low level of 2
in the c3 0h mutants. First, p-coumarate derivatives, whichdo not have the 3 0-hydroxy group, may be poor substratesof the 2 0-oxidase(s) in A. thaliana. Second, no appropriatesubstrates may accumulate in sufficient amounts to allowthe reaction to proceed efficiently to form 1. Biochemicaland genetic characterization of such enzyme(s) would pro-vide us further information on the biosynthetic pathwayof coumarins in A. thaliana.
A. thaliana is an excellent system for analyzing biosyn-thetic pathways in plants due to the large number of avail-able libraries of tag inserted lines and ease of culture.
3. Experimental
3.1. Instrumentation
HPLC analysis was performed using LC-10ADvp Sol-vent Delivery Unit (Shimadzu, Kyoto, Japan) and aWaters 470 Scanning Fluorescence Detector (Waters, Mil-ford, MA), whereas LC–MS/MS analysis utilized anAPI3000 LC–MS/MS System equipped with an electro-spray ion source (Applied Biosystems Japan, Tokyo,Japan).
3.2. Chemicals
Scopolin (8) and skimmin (2) were synthesized, accord-ing to the reported method by Gee et al. (1999). Scopoletin(7) and 4-methylumbelliferone were purchased from TokyoKasei Kogyo Co., Ltd. (Tokyo, Japan). Umbelliferone (1)and esculin (6) were purchased from Nacalai Tesque, Inc.(Kyoto, Japan). Esculetin (4) was purchased from AvocadoResearch Chemicals Ltd. (Lancashire, UK). Herniarin (3)was purchased from Acros Organics (Geel, Belgium).Scoparone (9) was purchased from Sigma–Aldrich Co.(St. Louis, MO).
3.3. Plant material
Seeds of A. thaliana (ecotype Columbia and mutants)were surface sterilized with 5% (v/v) NaOCl and sown on0.8% (w/v) agar-solidified medium supplemented withMurashige and Skoog salt, 1% (w/v) sucrose, 0.5 g/l 2-mor-pholinoethanesulfonic acid (pH 5.9), 100 mg/l myo-inosi-tol, 1 mg/l thiamine hydrochloride, 0.5 mg/l pyridoxinehydrochloride, and 0.5 mg/l nicotinic acid. Seeds on themedium were incubated at 4 �C in darkness for 2–3 daysand then placed at 22 �C under continuous light for �4weeks. The plates for collection of the roots were placedvertically, in which the roots grew down along the surfaceof the medium. Callus cultures were initiated from rosetteleaves grown on 0.8% (w/v) agar of Gamborg’s B5 basalmedium, pH 5.7, supplemented with 2% (w/v) glucose,0.5 mg/l 2,4-dichlorophenoxyacetic acid, and 0.05 mg/lkinetin. The plates were incubated at 22 �C under continu-ous light for 10 weeks.
3.4. Chemical and stress treatments
Leaves of 21-day-old plants were wounded by makingtwo small cutting traces on each leaf with scissors. Chemi-cal or fungal treatments were performed on 20–27-day-oldplants. Treatment solutions were as follows: 2,4-dichloro-phenoxyacetic acid [2,4-D, 100 lM in 0.1% (v/v) MeOH],salicylic acid [100 lM in 0.1% (v/v) MeOH], methyl jasmo-nate [100 lM in 0.1% (v/v) MeOH], kinetin (100 lM in1 mM KOH), chitosan (1 mg/ml in H2O), laminarin(1 mg/ml in H2O), and bud-cell suspension of F. oxysporum
f. sp. batatas O-17 (5 · 107 bud-cells/ml). Preparation of
WT SALK_ SALK_112823 125686
Mutants
3
2
1
0
nmol
/gF
W r
oot
n.d.
Skimmin (2)
Fig. 5. The level of skimmin (2) in the roots of the c3 0h mutants and wild-type. The roots of 25-day-old plants were extracted with MeOHcontaining 4-methylumbelliferone as an internal standard. The MeOHextracts were subjected to HPLC analysis using a fluorescence detector (ex320 nm, em 380 nm for the detection of skimmin (2), ex 340 nm, em420 nm for the detection of 4-methylumbelliferone). Values show theaverages of contents of 2. Bars show standard errors (n = 3). n.d.: notdetected (less than 87 pmol/gFW).
K. Kai et al. / Phytochemistry 67 (2006) 379–386 383

bud-cell suspension was described previously (Shimizuet al., 2000). All solutions contained 0.05% (v/v) polyoxy-ethylene(20) sorbitan monolaurate, except for the bud-cellsuspension. The solutions without hormones, polysaccha-rides, or bud-cells were used as the controls. The treatmentsolution was poured into the culture disks of the plants.The disks were gently agitated for 30 s to treat the shootsthoroughly before discard of the solution. After woundingor treatments, plants were incubated at 22 �C under contin-uous light, and the leaves or shoots were collected at differ-ent times.
3.5. Mutant verification
The seeds of the mutant lines (SALK_112823 andSALK_125686) in the Salk Institute Genomic AnalysisLaboratory T-DNA insertion collection were obtainedfrom the Arabidopsis Biological Resource Center (OhioState University, Columbus). Genomic DNA was extractedfrom the leaves, according to the method reported by Liuet al. (1995). T-DNA insertions were confirmed by DNAamplification with the left T-DNA border-specific primerLBb1 (5 0-GCGTGGACCGCTTGCTGCAACT-3 0) andthe gene-specific primers as follows: C3 0H-R (5 0-TTACA-TATCGTAAGGCACGCGTTT-3 0) for the SALK_112823line and C3 0H-F (5 0-ATGTCGTGGTTTCTAATAGCG-GTG-3 0) for the SALK_125686 line. PCR was performedusing a KOD Dash kit (Toyobo Co., Ltd., Osaka, Japan)according to the manufacturer’s instructions. The PCRwas carried out in a 10 ll reaction mixture containinggenomic DNA, 0.25 U of KOD Dash polymerase, 2 nmolof dNTP, 1 pmol of each primer, and 1 · KOD Dash buf-fer. The reaction mixture was first denatured at 94 �C for5 min, and the PCR amplification was performed in the fol-lowing 30 cycles of 94 �C for 30 s, 54 �C for 2 s, and 74 �Cfor 30 s. The absence of the wild-type amplification prod-uct with gene-specific primers, C3 0H-F and C3 0H-R, con-firmed the homozygous nature of the mutant lines. Theconditions of PCR amplification were the same as above.The position of the T-DNA insertion was confirmed bythe sequencing of PCR products amplified with the T-DNA specific primer, LBb1, and the gene-specific primerC3 0H-R (for SALK_112823) or C3 0H-F (forSALK_125686). Sequencing reactions were carried outusing a BigDye terminator cycle sequencing kit (AppliedBiosystems Japan). C3 0H-R or LBb1 was used for theSALK_112823 line as the primer, and C3 0H-F or LBb1was used for the SALK_125686 line.
To confirm the absence of functional transcripts, totalRNA was extracted from the roots, according to themethod reported by Shirzadegan et al. (1991). RT-PCRwas performed using a ReverTra Dash RT-PCR kit (Toy-obo, Osaka, Japan), according to the manufacturer’sinstructions. First-strand DNA was synthesized in a 20 llreaction mixture containing 0.7 lg of total RNA, 100 Uof ReverTra Ace reverse transcriptase, 10 pmol of oli-go(dT) primer, 20 nmol of dNTP, and 1 · RT buffer. The
RT reactions were carried out at 42 �C for 60 min and99 �C for 5 min. The reaction mixture was chilled to 4 �Cand diluted 2 times, and 0.5 ll of aliquot was used as a tem-plate for each of the PCR amplifications with the gene-spe-cific primers. C3 0H-F and C3 0H-R were used as the primersof C3 0H amplification. Nucleotide sequences of the primersof Actin2 amplification were as follows: act2-F, 5 0-GTGAAGGCTGGATTTGCAGGA-3 0 and act2-R, 5 0-AACCTCCGATCCAGACACTGT-3 0. The conditions ofC3 0H amplification by PCR were the same as the aboveexcept for 25 cycles. Actin2 amplification was performedby denaturing at 94 �C for 5 min following 23 cycles of94 �C for 30 s, 50 �C for 2 s, and 74 �C for 30 s. The mutantlines were kept as heterozygotes, because of the low viabil-ity and low fertility of homozygotes.
PCR was performed by a GeneAmp PCR system 9700(Applied Biosystems Japan) or TaKaRa PCR ThermalCycler Dice (Takara Bio Inc., Otsu, Japan). The PCRproducts were analyzed with a 1% (w/v) agarose gel con-taining 0.2 lg/ml of ethidium bromide, visualized with aUV transilluminator. DNA sequencing was performedwith a DNA sequencer model 377 (Applied BiosystemsJapan).
3.6. Identification of the coumarins by LC–MS/MS
The plant materials were soaked in MeOH overnight.The extracts were centrifuged for 10 min at 15,000g andthe supernatants were subjected to LC–MS/MS analysis.Separation of eight coumarins was performed accordingto the following conditions: a COSMOSIL 5C18-AR-II(4.6 · 150 mm; Nacalai Tesque), with H2O containing0.1% (v/v) HCO2H as solvent A and MeOH containing0.1% (v/v) HCO2H as solvent B, at a flow rate of 1.0 ml/min at 40 �C. Elution was started with isocratic conditionsof 15% solvent B for 2 min, following a linear gradient flowup to 55% in 18 min. The ionspray voltage was set at4.5 kV [for skimmin (2), herniarin (3), esculetin (4), esculin(6) and scopolin (8)], 4.6 kV [for scopoletin (7) and scopa-rone (9)], and 4.7 kV [for umbelliferone (1)]. The orificepotential was set at 30 V (for 8), 35 V (for 1, 2, 4 and 6),40 V (for 7), and 45 V (for 3 and 9). The ring potentialwas set at 190 V (for 4), 200 V (for 1, 2 and 8), 220 V(for 6), 240 V (for 7 and 9), and 250 V (for 3). The collisionenergy was set at 15 V (for 8), 20 V (for 2), 22.5 V (for 6),30 V (for 1, 3, 7 and 9), and 32.5 V (for 4). The detectionmode was multiple reaction monitoring (MRM) positiveto detect the low-level coumarins. The MRM series forthe detection of the coumarins were set at m/z 163.3/107.3 (for 1), m/z 325.2/163.0 (for 2), m/z 177.3/121.3(for 3), m/z 179.3/123.3 (for 4), m/z 341.3/179.2 (for 6),m/z 193.3/133.2 (for 7), m/z 355.1/193.0 (for 8), and m/z207.3/151.2 (for 9). The dwell time was 500 ms.
The coumarins that accumulated to a higher level weresubjected to further LC–MS/MS analysis for identificationwith the product ion scan mode. Conditions were as fol-lows: a COSMOSIL 5C18-AR-II (4.6 · 150 mm; Nacalai
384 K. Kai et al. / Phytochemistry 67 (2006) 379–386

Tesque), with H2O containing 0.1% (v/v) HCO2H as sol-vent A and MeOH containing 0.1% (v/v) HCO2H as sol-vent B, at a flow rate of 1.0 ml/min at 40 �C. Elution wasstarted with isocratic conditions of 15% solvent B for2 min, following a linear gradient flow up to 35% in14 min. For 7, the ionspray voltage was set at 4.6 kV, theorifice potential was 30 V, the ring potential was 220 V,and the collision energy was 30 V with N2 gas. Q1 waslocked on m/z 193.0 and Q3 was scanned from 100 to200 with a step size of 0.1 and with a dwell time of 1 ms/step. m/z (rel. int.): 178 (45), 165 (4), 150 (9), 137 (33),133 (100), 122 (16), 105 (6). For 8, the ionspray voltagewas set at 4.5 kV, the orifice potential was 30 V, the ringpotential was 200 V, and the collision energy was 50 V withN2 gas. Q1 was locked on m/z 355.1 and Q3 was scannedfrom 100 to 360 with a step size of 0.1 and with a dwell timeof 1 ms/step. m/z (rel. int.): 193 (100), 178 (46), 165 (7), 150(4), 137 (25), 133 (95), 122 (7), 105 (3). For 2, the ionsprayvoltage was set at 4.5 kV, the orifice potential was 35 V, thering potential was 200 V, and the collision energy was 50 Vwith N2 gas. Q1 was locked on m/z 325.2 and Q3 wasscanned from 100 to 330 with a step size of 0.1 and witha dwell time of 0.5 ms/step. m/z (rel. int.): 163 (100), 135(9), 119 (42), 107 (61).
3.7. Quantification of the coumarins
The plant materials were soaked for 22 h in MeOHcontaining 4-methylumbelliferone as an internal standard.The extracts were centrifuged for 10 min at 15,000g,after concentration or dilution, when needed. The super-natants were subjected to HPLC analysis on a COSMO-SIL 5C18-AR-II (4.6 · 150 mm; Nacalai Tesque), withH2O containing 0.1% (v/v) HCO2H as solvent A andMeOH containing 0.1% (v/v) HCO2H as solvent B, at aflow rate of 1.0 ml/min at 40 �C. Elution was started withisocratic conditions of 20% solvent B for 2 min, followinga linear gradient flow up to 56% in 16 min. Detection wasperformed using a fluorescence detector with an excitationwavelength at 340 nm and an emission wavelength at420 nm. Since skimmin (2) was less than 0.2% of scopolin(8) in the wild-type, other conditions were introduced toquantify the level of 2 in the mutant plants as follows:on a YMC-Pack Pro C18 AS-307-3 (4.6 · 75 mm; YMCCo., Ltd., Kyoto, Japan), with H2O containing 0.1% (v/v)HCO2H as solvent A and MeOH containing 0.1% (v/v)HCO2H as solvent B, at a flow rate of 0.75 ml/min at40 �C. Elution was started with isocratic conditions of8% solvent B for 18 min, following a linear gradient flowup to 60% in 10 min followed by an isocratic flow of60% solvent B for 5 min. The detection of 2 was per-formed with a fluorescence detector with an excitationwavelength at 320 nm and an emission wavelength at380 nm (0–20 min), and the detection of 4-methylumbel-liferone was performed with an excitation wavelengthat 340 nm and an emission wavelength at 420 nm (20–33 min).
Acknowledgments
We thank the Salk Institute Genomic Analysis Labora-tory for providing the sequence-indexed Arabidopsis T-DNA insertion mutants and the Arabidopsis BiologicalResource Center (Ohio State University, Columbus) forproviding seeds. We are grateful to Dr. Craig E. Wheelockof Kyoto University (Uji, Kyoto, Japan) for grammaticalcorrection of this manuscript.
References
Anterola, A.M., van Rensburg, H., van Heerden, P.S., Davin, L.B., Lewis,N.G., 1999. Multi-site modulation of flux during monolignol forma-tion in loblolly pine (Pinus taeda). Biochem. Biophys. Res. Commun.261, 652–657.
Anterola, A.M., Jeon, J.-H., Davin, L.B., Lewis, N.G., 2002. Transcrip-tional control of monolignol biosynthesis in Pinus taeda. J. Biol.Chem. 277, 18272–18280.
Baillieul, F., de Ruffray, P., Kauffmann, S., 2003. Molecular cloning andbiological activity of a-, b-, and c-megaspermin, three elicitins secretedby Phytophthora megasperma H20. Plant Physiol. 131, 155–166.
Bednarek, P., Schneider, B., Svatos, A., Oldham, N.J., Hahlbrock, K.,2005. Structural complexity, differential response to infection, andtissue specificity of indolic and phenylpropanoid secondary metabo-lism in Arabidopsis roots. Plant Physiol. 138, 1058–1070.
Cabello-Hurtado, F., Durst, F., Jorrin, J.V., Werck-Reichhart, D., 1998.Coumarins in Helianthus tuberosus: characterization, induced accu-mulation and biosynthesis. Phytochemistry 49, 1029–1036.
Carpinella, M.C., Ferrayoli, C.G., Palacios, S.M., 2005. Antifungalsynergistic effect of scopoletin, a hydroxycoumarin isolated fromMelia azedarach L. fruits. J. Agric. Food Chem. 53, 2922–2927.
Chong, J., Baltz, R., Schmitt, C., Beffa, R., Fritig, B., Saindrenan, P.,2002. Downregulation of a pathogen-responsive tobacco UDP-Glc:phenylpropaniod glucosyltransferase reduces scopoletin glucosideaccumulation, enhances oxidative stress, and weakens virus resistance.Plant Cell 14, 1093–1107.
Dieterman, L.J., Lin, C.-Y., Rohrbaugh, L., Thiesfeld, V., Wender, S.H.,1964. Identification and quantitative determination of scopolin andscopoletin in tobacco plants treated with 2,4-dichlorophenoxyaceticacid. Anal. Biochem. 9, 139–145.
Desjardins, A.E., Spencer, G.F., Plattner, R.D., Beremand, M.N., 1989.Furanocoumarin phytoalexins, trichothecene toxins, and infection ofPastinaca sativa by Fusarium sporotrichioides. Phytopathology 79, 170–175.
Franke, R., Humphreys, J.M., Hemm, M.R., Denault, J.W., Ruegger,M.O., Cusumano, J.C., Chapple, C., 2002a. The Arabidopsis REF8
gene encodes the 3-hydroxylase of phenylpropanoid metabolism. PlantJ. 30, 33–45.
Franke, R., Hemm, M.R., Denault, J.W., Ruegger, M.O., Humphreys,J.M., Chapple, C., 2002b. Changes in secondary metabolism anddeposition of an unusual lignin in the ref8 mutant of Arabidopsis.Plant J. 30, 47–59.
Fritig, B., Hirth, L., Ourisson, G., 1970. Biosynthesis of the coumarins:scopoletin formation in tobacco tissue cultures. Phytochemistry 9,1963–1975.
Gachon, C., Baltz, R., Saindrenan, P., 2004. Over-expression of ascopoletin glucosyltransferase in Nicotiana tabacum leads to preco-cious lesion formation during the hypersensitive response to tobaccomosaic virus but does not affect virus resistance. Plant Mol. Biol. 54,137–146.
Garcia, D., Sanier, C., Macheix, J.J., D’auzac, J., 1995. Accumulation ofscopoletin in Hevea brasiliensis infected by Microcyclus ulei (P. Henn.)V. ARX and evaluation of its fungitoxicity for three leaf pathogens ofrubber tree. Physiol. Mol. Plant Pathol. 47, 213–223.
K. Kai et al. / Phytochemistry 67 (2006) 379–386 385

Gee, K.R., Sun, W.-C., Bhalgat, M.K., Upson, R.H., Klaubert, D.H.,Latham, K.A., Hauglant, R.P., 1999. Fluorogenic substrates based onfluorinated umbelliferones for continuous assays of phosphatases andb-galactosidases. Anal. Biochem. 273, 41–48.
Hino, F., Okazaki, M., Miura, Y., 1982. Effects of kinetin on formation ofscopoletin and scopolin in tobacco tissue cultures. Agric. Biol. Chem.46, 2195–2202.
Johnson, C., Brannon, D.R., Kuc, J., 1973. Xanthotoxin: a phytoalexin ofPastinaca sativa root. Phytochemistry 12, 2961–2962.
Keating, G.J., O’Kennedy, R., 1997. The chemistry and occurrence ofcoumarins. In: O’Kennedy, R., Thornes, R.D. (Eds.), Coumarins:Biology, Application, and Mode of Action. Wiley, England, pp. 23–66.
Liu, Y.-G., Mitsukawa, N., Oosumi, T., Whittier, R.F., 1995. Efficientisolation and mapping of Arabidopsis thaliana T-DNA insert junctionsby thermal asymmetric interlaced PCR. Plant J. 8, 457–463.
Matern, U., Luer, P., Kreusch, D., 1999. Biosynthesis of coumarins. In:Sankawa, U. (Ed.), Comprehensive Natural Products Chemistry, vol.1. Elsevier Science, Amsterdam, pp. 623–637.
Ogawa, K., 1988. Studies on Fusarium wilt of sweet potato (Ipomoea
batatas L.). Bull. Natl. Agric. Res. Cent. 10, 1–29 (in Japanese).Raes, J., Rohde, A., Christensen, J.H., Van de Peer, Y., Boerjan, W.,
2003. Genome-wide characterization of the lignification toolbox inArabidopsis. Plant Physiol. 133, 1051–1071.
Rohde, A., Morreel, K., Ralph, J., Goeminne, G., Hostyn, V., De Rycke,R., Kushnir, S., Van Doorsselaere, J., Joseleau, J.-P., Vuylsteke, M.,Van Driessche, G., Van Beeumen, J., Messens, E., Boerjan, W., 2004.Molecular phenotyping of the pal1 and pal2 mutants of Arabidopsis
thaliana reveals far-reaching consequences on phenylpropanoid, aminoacid, and carbohydrate metabolism. Plant Cell 16, 2749–2771.
Sato, M., 1967. Metabolism of phenolic substances by the chloroplasts-III.Phytochemistry 6, 1363–1373.
Schoch, G., Goepfert, S., Morant, M., Hehn, A., Meyer, D., Ullmann, P.,Werck-Reichhart, D., 2001. CYP98A3 from Arabidopsis thaliana is a3 0-hydroxylase of phenolic esters, a missing link in the phenylpropa-noid pathway. J. Biol. Chem. 276, 36566–36574.
Shimizu, B.-I., Fujimori, A., Miyagawa, H., Ueno, T., Watanabe, K.,Ogawa, K., 2000. Resistance against fusarium wilt induced by non-pathogenic Fusarium in Ipomoea tricolor. J. Pesticide Sci. 25, 365–372.
Shimizu, B.-I., Miyagawa, H., Ueno, T., Sakata, K., Watanabe, K.,Ogawa, K., 2005. Morning glory systemically accumulates scopoletinand scopolin after interaction with Fusarium oxysporum. Z. Natur-forsch. 60c, 83–90.
Shirzadegan, M., Christie, P., Seemann, J.R., 1991. An efficient methodfor isolation of RNA from tissue cultured plant cells. Nucleic AcidsRes. 19, 6055.
Valle, T., Lopez, J.L., Hernandez, J.M., Corchete, P., 1997. Antifungalactivity of scopoletin and its differential accumulation in Ulmus pumila
and Ulmus campestris cell suspension cultures infected with Ophios-
toma ulmi spores. Plant Sci. 125, 97–101.Zobel, A.M., 1997. Coumarins in fruit and vegetables. In: Tomas-
Barberan, F.A.A., Robins, R.J. (Eds.), Phytochemistry of Fruits andVegetables, Proceedings of the Phytochemical Society of Europe, vol.41. Clarendon Press, Oxford, pp. 173–203.
386 K. Kai et al. / Phytochemistry 67 (2006) 379–386

Flavonoid 3 0-O-methyltransferase from rice: cDNAcloning, characterization and functional expression
Bong-Gyu Kim a, Youngshim Lee a, Hor-Gil Hur b, Yoongho Lim a, Joong-Hoon Ahn a,*
a Bio/Molecular Informatics Center, Department of Molecular Biotechnology, Konkuk University,
1 Hwayang-dong, Kwangjin-gu, Seoul 143-701, Republic of Koreab Department of Environmental Science and Engineering, Gwangju Institute of Science and Technology, Gwangju 500-712, Republic of Korea
Received 22 March 2005; received in revised form 8 October 2005
Abstract
Plant O-methyltransferases (OMTs) are known to be involved in methylation of plant secondary metabolites, especially phenylprop-anoid and flavonoid compounds. An OMT, ROMT-9, was cloned and characterized from rice using a reverse transcriptase polymerasechain reaction (RT-PCR). The blast results for ROMT-9 showed a 73% identity with caffeic acid OMTs from maize and Triticum aes-
tivum. ROMT-9 was expressed in Escherichia coli and its recombinant protein was purified using affinity chromatography. It was thentested for its ability to transfer the methyl group of S-adenosyl-L-methionine to the flavonoid substrates, eriodictyol, luteolin, quercetin,and taxifolin, all of which have a 3 0-hydroxyl functional group. The reaction products were analyzed using TLC, HPLC, HPLC/MS, andNMR spectroscopy. The NMR analysis showed that ROMT-9 transferred the methyl group specifically to the 3 0-hydroxyl group ofquercetin, resulting in the formation of its methoxy derivative. Furthermore, ROMT-9 converted flavonoids containing the 3 0-hydroxyfunctional group such as eriodictyol, luteolin, quercetin and taxifolin into the corresponding methoxy derivatives, suggesting thatROMT-9 is an OMT with strict specificity for the 3 0-hydroxy group of flavonoids.� 2005 Elsevier Ltd. All rights reserved.
Keywords: Rice; Oryza sativa; Gramineae; O-methyltransferase; Flavonoids; 30-O-methylation
1. Introduction
Plants produce many kinds of secondary metabolite thatare rarely found in other organisms. Flavonoids and phe-nylpropanoids are typical examples of natural plant prod-ucts with great structural diversity, which results from avariety of modification reactions that occur once the back-bone of these compounds is synthesized. CytochromeP450s (P450s), glycosyltransferases (GTs), and O-meth-yltransferases (OMTs) have been shown to be involved inthe biosynthesis of these compounds. The genes encodingthese products sometimes exist as gene families that havebeen made accessible through various plant genome pro-jects (Ausubel, 2002). Among the several modification
reactions, O-methylation that is mediated by OMTs trans-fers a methyl group, S-adenosyl-L-methionine (AdoMet),to the hydroxyl group of a methyl-acceptor molecule (Ibra-him et al., 1998; Ibrahim and Muzac, 2000). Plant OMTshave been functionally characterized from several plants.The most commonly studied OMTs are those that utilizephenylpropanoid and flavonoid compounds as substrates.The O-methylation of caffeoyl CoA provides the guaiacylbuilding blocks for the biosynthesis of lignin, while thatof flavonoids is known to reduce the chemical reactivityof phenolic hydroxyl groups and to increase antimicrobialactivity (Luckner, 1990; Ibrahim et al., 1998). SeveralOMTs are known to methylate flavonoids (Ibrahim andMuzac, 2000). Most of these enzymes are highly specific,as has been demonstrated with both purified native andrecombinant proteins. Sequences of a myriad of OMTgenes from genome projects from various plants have been
0031-9422/$ - see front matter � 2005 Elsevier Ltd. All rights reserved.
doi:10.1016/j.phytochem.2005.11.022
* Corresponding author. Tel.: +82 2 45 3764; fax: +82 2 456 7183.E-mail address: [email protected] (J.-H. Ahn).
www.elsevier.com/locate/phytochem
Phytochemistry 67 (2006) 387–394
PHYTOCHEMISTRY

deposited in the GenBank and The Institute of GenomeResearch (TIGR) databases. These sequences are anno-tated as OMTs based on primary sequence similarities.However, several previous studies showed that differencesof only a few amino acids could generate differences in sub-strate preferences and that 85%, or higher, sequence iden-tity among some OMTs might bias the prediction of theiractual substrates (Gauthier et al., 1998; Frick and Kut-chan, 1999; Wang and Pichersky, 1999; Schroder et al.,2002). This suggests that the biochemical analysis of eachgene is required for the functional characterization of indi-vidual OMTs.
Rice (Oryza sativa) is a major global foodstuff and agood model crop plant. Most of its genome sequence isnow available (Goff et al., 2002; Yu et al., 2002) and func-tional analysis of individual rice genes is ongoing. A varietyof OMTs are found in rice, although none of them has yetbeen functionally characterized with the exception of a fla-vonoid 7-OMT that is involved in sakuranetin biosynthesis(Rakwal et al., 2000). In order to determine the function ofsuch OMTs, we cloned an ROMT-9 from rice andexpressed it in Escherichia coli. Here, we report the molec-ular analysis and functional characterization of ROMT-9
from rice.
2. Results and discussion
2.1. Isolation and expression of ROMT-9
The rice genome was searched using a class 2 OMTdomain (SGLSSLVDVGGGTGALAAAIVRAYPHLK-GIVFDLPHVVADAPSADRVEFVGGD) and 19 uniqueOMT genes were found. Of these, 16 OMTs showedhomology with caffeic acid OMT (COMT) and three withcaffeoyl CoA OMT (CCoAOMT). cDNAs correspondingto the 19 OMT genes were cloned by RT-PCR using cDNAsynthesized from a 2-week-old whole rice plant and weresequenced. Among these, 15 OMTs were expressed inE. coli and the ROMT-9 (GenBank accession number29893141) was the most well-expressed protein. Thus,ROMT-9 was selected for further investigation. Sequenceanalysis of ROMT-9 showed an open reading frame(ORF) of 1164 base pairs encoding a 39.7-kDa protein witha calculated isoelectric point of 5.14. The predicted proteinsequence had a 73% identity with COMTs from Zea maysand Triticum aestivum and a 71% similarity with COMTsfrom Saccharum officinarum and Lolium perenne.
As OMTs utilize AdoMet as the methyl group donor, theAdoMet binding sites in OMTs are well conserved. Forinstance, eight amino-acid residues involved in the AdoMetbinding site were similar among chalcone O-methyltransfer-ase (ChOMT), isoflavone O-methyltransferase (IOMT) andCOMT although these enzymes utilize different substrates(Zubieta et al., 2001). The ROMT-9 AdoMet binding sitewas also predicted by comparing the ROMT-9 sequencewith other OMTs. As shown in Fig. 1, the AdoMet binding
site of the ROMT-9 is similar in the three OMTs. The sub-strate binding site was also predicted based on the deter-mined structure of COMT and IOMT (Zubieta et al.,2001). ROMT-9 has the same binding site as COMT exceptfor one amino-acid difference, Val321 instead of Ile 316(Fig. 1).
ROMT-9 was expressed in root, stem and leaf tissue,although its expression is higher in the stems and rootsthan in the leaves (data not shown).
To investigate the biological function of ROMT-9, itsopen reading frame was cloned into pET 15b vector,expressed as a His-tag fusion protein, and purified to nearhomogeneity, as indicated by SDS–PAGE. The molecularweight of the recombinant ROMT9 corresponded to thecombined molecular weight of ROMT-9 (ca. 39.7 kDa)and that of six histidine residues (ca. 0.09 kDa) (Fig. 2).
2.2. Determination of substrate
The purified ROMT-9 was incubated with several puta-tive substrates namely apigenin, caffeic acid (6), catechin(7), daidzein, eriodictyol (4), ferulic acid, 5-OH ferulic acid,genistein, gossypetin, luteolin (5), myricetin (3), naringenin,orcinol, quercetin (1) and taxifolin (2) in order to determineits substrate specificity range (Table 1). Analysis of themetabolites by both TLC and HPLC showed that catechin(1), eriodictyol (4), luteolin (5), myricetin (3), quercetin (1)and taxifolin (2) which all possess a 3 0-OH functionalgroup, acted as methyl acceptors, and each substrate pro-duced a new metabolite. However, the flavonoids thatlacked a 3 0-OH group did not give any reaction product.This result indicates that the methylation position is likelyto occur on the 3 0-OH group. Using luteolin (5), quercetin(1), and eriodictyol (4) as substrates, the enzyme reactionproducts were analyzed by HPLC. The reaction from eachsubstrate generated a new peak that exhibited a retentiontime that differed from that of the substrate. Luteolin (5)gave a product with a similar retention time (14.1 min)and UV spectrum to those of an authentic sample of 3 0-methylated luteolin (Fig. 3). In addition, both the retentiontimes and UV spectra of the reaction products of both quer-cetin (1) and eriodictyol (4) were indistinguishable fromthose of their authentic 3 0-methylated derivatives (datanot shown), indicating that ROMT-9 catalyzes methylgroup transfers preferentially to the 3 0-position of flavo-noids. Quercetin (1) (a flavonol) and luteolin (5) (a flavone),which both possess a C-ring double bond, were the best sub-strates among the several compounds tested (Table 1), indi-cating that the presence/absence of the 3-OH group haslittle, or no, influence on ROMT-9 reactivity towards thesesubstrates. Furthermore, ROMT-9 could transfer only onemethyl group into the 3 0 hydroxyl group of myricetin (3)and could not produce further methylation in other posi-tions. This is in contrast with the Arabidopsis thalianaAtOMT1, which exhibits a preference for quercetin (1) overluteolin (5) as a substrate (Muzac et al., 2000) and the Cath-
aranthus roseus CrOMT2, which catalyzes the sequential
388 B.-G. Kim et al. / Phytochemistry 67 (2006) 387–394

methylation of the two 3 0- and 5 0-hydroxyl groups ofmyricetin (3) (Cacace et al., 2003). In addition, ROMT9could not convert 4 0-methylated quercetin (tamarixetin)
while it could use 7-methylated quercetin (8) (rhamnetin(8)) as effectively as quercetin (1), indicating that the posi-tion of the methyl group is critical for the methylation ofROMT-9. It also contrasts with pFOMT3 0 from Chrysosp-
lenium americanum, which prefers trimethylated quercetinto un- or mono-methylated quercetin (Gauthier et al.,1996). Flavonoids, such as taxifolin (2) and eriodictyol(4), were less effective methyl acceptors (Table 1), possiblydue to the saturation of the C-ring. The fact that therewas no significant activity with caffeic acid (6) and 5-OHferulic acid as substrates indicates that ROMT-9 is notinvolved in the methylation of lignin precursors.
The kinetic parameters Km and Vmax for eriodictyol (4),luteolin (5), and quercetin (1) were determined usingLineweaver–Burk plots. As predicted from their relativeenzyme activities (Table 2), quercetin (1) appears to bethe best methyl acceptor, based on its turnover value(Kcat/Km), followed by luteolin and eriodictyol (Table 2).
A compound was found in the acid hydrolyzates of riceleaves that co-chromatographed with and exhibited a sim-ilar UV spectrum to an authentic sample of chrysoeriol, 3 0-methylated luteolin (data not shown). Therefore, the bio-logical function of ROMT-9 probably involves the transferof a methyl group to luteolin (5). By contrast, quercetin (1)and kaempferol, which are ubiquitous in other species such
Fig. 1. Sequence alignment of one COMT and four representative plant O-methyltransferases. Shown are primary sequences of COMT from alfalfa(AAB46623), AtOMT-1 from Arabidopsis (U70424), ROMT-9 from rice, chalcone O-methyltransferase (ChOMT; AAB48059) from alfalfa, and isoflavoneO-methyltransferase (IOMT; AAC49927) from alfalfa. : Active site dimer; : conserved residues and motifs for AdoMet binding; : catalytic residue; :active site substrate binding/positioning residue.
Fig. 2. SDS–PAGE of the expressed recombinant ROMT-9. M, Standardprotein markers; 1, E. coli lysate before induction; 2, E. coli lysate afterinduction; 3, soluble protein after induction; 4, His-tagged affinity-purifiedprotein.
B.-G. Kim et al. / Phytochemistry 67 (2006) 387–394 389

Table 1Relative activity of ROMT9 with various substrates
Substrate Structure Retention times (S/P; min)a Conversion rate (%)
Quercetin 1
O
O
HO
OH
OH
OH
OH
11.5/14.6 100b
Taxifolin 2
O
O
HO
OH
OH
OH
OH 7.4/9.6 71
Myricetin 3
O
O
HO
OH
OH
OH
OH
OH
9.4/14.7 94
Eriodictyol 4
O
O
HO
OH
OH
OH 11.4/14.3 92
Luteolin 5
O
O
HO
OH
OH
OH
11.3/14.1 96
Caffeic acid 6
COOH
HO
OH
5.1/7.2 15
Catechin 7
OHO
OH
OH
OH
OH
3.8/5.3 15
Rhamnetin 8
O
O
H3CO
OH
OH
OH
OH
17.4/20.3 88
a S, substrate (70 lM was used); P, product.b 100% is equivalent to 1250 pkat/mg.
390 B.-G. Kim et al. / Phytochemistry 67 (2006) 387–394

as Arabidopsis and soybean (Graham, 1991, 1998) were notdetected in rice leaf extract.
2.3. Determination of the methylation position in quercetin(1) by NMR spectroscopy
To verify the methylation position of quercetin (1) andto determine the regioselectivity of ROMT-9, quercetin(1) as substrate and its reaction product (9) were subjectedto NMR spectroscopic analysis. The 1H and 13C NMRspectra of the reaction product gave new peaks at 3.83and 55.9 ppm, respectively, which were not observed inquercetin (1) itself. Comparing the 1H and 13C NMR spec-tra of quercetin (1) with those of its reaction product(Agrawal, 1989; Harborne, 1994), all of the 1H and 13Cchemical shifts could be readily assigned. As the nOe cross
peak between H-2 0 at 7.75 ppm and the methyl proton at3.83 ppm was observed in the NOESY spectrum, the meth-ylated position was identified as the 3 0-hydroxyl group. Inorder to clarify this result, HMBC analysis was performed.Based on its interpretation (Fig. 4), C-3 0 was long-rangecoupled to the methyl proton, so that the methylated posi-tion appear to be the 3 0-hydroxyl group. The 1H NMRspectrum of the reaction product of quercetin (1)(Fig. 5(a)) was compared with that of an authentic sampleof isorhamnetin, 3 0-methyl quercetin (Fig. 5(b)). As aresult, ROMT-9 was shown to transfer a methyl group tothe 3 0-OH quercetin and to be a 3 0-O-methyltransferase.The assignments of the 1H and 13C NMR spectroscopicdata of the reaction product of quercetin (1) are listed inTable 3.
ROMT-9 gene turns out to be a flavonoid 3 0-O-methyl-transferase which prefers flavonol or flavone to flavanone.Flavonoid 3 0-methylation is one of the most common mod-ification reactions found in nature. ROMT9 is the first fla-vonoid 3 0-O-methyltransferase cloned in rice as far as weknow.
3. Experimental
3.1. Chemicals
Flavonoids were purchased from Indofinechemicals(Somerville, NJ, USA). HPLC-grade organic solvents werepurchased from Duksan Co. (Ansan, Korea).
Fig. 3. HPLC elution profiles and UV spectra for the reaction productfrom luteolin (5) (C: substrate, P: reaction product, S: methylatedauthentic compound).
Table 2Substrate specificity of purified recombinant protein ROMT-9
Substrate Relative activity (% of control) Km (lM) Vmax (pkat/mg) Vmax/Km Kcat/Km (lM�1 s�1)
Quercetin 1 100 61.8 1250.0 20.2 0.42Luteolin 5 96 61.9 833.3 13.5 0.28Eriodictyol 4 92 62.0 625.0 10.1 0.21
Enzyme assays were carried out using 1–2 lg of the purified ROMT-9, 10–200 lM of each substrates, and 40 lM of AdoMet.
19
4 3
O3'
5'
OOH
HO
OH
OH
OCH3
Fig. 4. The proton–carbon long-ranged couplings obtained from theHMBC interpretation of the reaction product (9) of quercetin (1)produced by the purified recombinant protein ROMT-9.
B.-G. Kim et al. / Phytochemistry 67 (2006) 387–394 391

3.2. Cloning of ROMT-9
Total RNA from the leaf, root, and stem tissues of 2-week-old rice plants was isolated using a Qiagen RNA iso-
lation kit (Qiagen, Gaithersburg, MD, USA). RT-PCR wasused to clone ROMT-9 from rice. cDNA was synthesizedin 20 ll reaction mixtures containing 2 lg of total RNA,Omniscript transcriptase (Qiagen, Gaithersburg, MD,
Fig. 5. The 1H NMR spectra of (a) the reaction product of quercetin and (b) the authentic sample of isorhamnetin.
Table 3The assignments of 1H and 13C NMR spectroscopic data for the product of quercetin 1 generated using purified recombinant protein ROMT-9 and 1a
substrate
7
6
5
10
9
8
4 3
2O1
1'
2'
3'
4'
5'
6'OH
OMe
OOH
HO
OH
Position dH (J, Hz)/ppm dC/ppm Long-ranged couplings by HMBC nOe cross peaks by NOESY
2 – 146.7 – –3 – 135.9 – –4 – 175.9 – –5 – 160.7 – –6 6.18 (d, 2.0) 98.3 C-5, C-7, C-8, C-10 –7 – 164.1 – –8 6.46 (d, 2.0) 93.7 C-6, C-7 0, C-9, C-10 –9 – 156.3 – –
10 – 103.1 – –1 0 – 122.1 – –2 0 7.75 (d, 2.0) 111.8 C-2, C-4 0, C-60 30-OMe3 0 – 147.5 – –4 0 – 148.9 – –5 0 6.93 (d, 8.5) 115.6 C-10, C-30 H-6 0
6 0 7.68 (dd, 8.5, 2.0) 121.8 C-2, C-2 0 H-5 0
3 0-OMe 3.83 (s) 55.9 C-30 H-2 0
392 B.-G. Kim et al. / Phytochemistry 67 (2006) 387–394

USA), 15 pmol oligo (dT)15 and 20U of RNasin (Promega,WI, USA). For the PCR we used Hot start Taq DNA poly-merase (Qiagen, Germany) under the following conditions;40 cycles of 1 min denaturation at 94 �C, 1 min annealingat 55 �C and 1.5 min amplification at 72 �C. The primersused were GCTAGCTAGGATGGGTTCTACA as a for-ward primer (starting 10-bp in front of the start codon)and CGATGGTCGAACACCTTGAT as the reverse pri-mer (ending 44-bp behind the stop codon). The PCR prod-uct was subcloned into the pGEMT-easy vector (Promega)and the resulting plasmid was sequenced (GenBank acces-sion number DQ288259).
3.3. Expression of ROMT-9 in Escherichia coli
To construct the expression vector for ROMT-9, itsORF was amplified by PCR with ATCATATGGGTTC-TACAGCCGCCGA as the forward primer and ATG-GATCCTCGCCAATCGCCTACTTGGA as the reverseprimer. The restriction enzyme sites, NdeI and BamHI(underlined), were added to facilitate the cloning process.The resulting PCR product was cut with NdeI and BamHI,and was subcloned into the corresponding sites of pET15b(Novagen, Madison, WI, USA). The transformant wasgrown in LB medium containing 50 lg/ml ampicillin. Theculture grew until an absorbance of 0.7 at 600 nm wasreached. At this point, IPTG was added at a final concen-tration of 1 mM and the transformant was grown for 5 h at30 �C. The bacterial cells were then harvested, resuspendedin His-tag binding buffer (20 mM NaH2PO4, 500 mMNaCl, pH 7.4), and lysed by sonication. The expressed pro-tein was purified with a His-tag affinity column (AmershamBiosciences, USA), and its purity was analyzed by SDS–PAGE.
3.4. Enzyme assay and analysis of reaction product
To determine the ROMT-9 enzymatic activity, a reac-tion mixture was prepared containing 1–2 lg of the puri-fied recombinant protein, 2 mM DTT, 40 lM AdoMetand 200 lM substrate in 10 mM Tris/HCl buffer (pH7.5) at a final volume of 500 ll. The reaction mixturewas incubated at 37 �C for 1 h, extracted twice with ethy-lacetate and the organics layer was evaporated to dryness.Flavonoids were also analyzed by HPLC (Palo Alto, CA,USA) using an Agilent 1000 C18 reversed-phase column(Waters, Milford, MA, USA; 4.60 · 250 mm, 0.6 lm)and a photodiode array detector. For analytical scale,the mobile phase consisted of 50 mM phosphate buffer(pH 3.0) that was programmed as follows: 10% acetoni-trile at 0 min, 30% acetonitrile at 10 min, 60% acetonitrileat 40 min, 90% acetonitrile at 45 min and 10% acetonitrileat 50 min. The flow rate was 1 ml/min and UV detectionwas performed at 270 nm. Quantification of the metabo-lites and the parent material over time was monitoredusing HPLC in duplicate experiments. Several differentconcentrations of each substrate were analyzed with
HPLC, and the resulting value was used as a standardfor the analysis of the remaining reaction product afterenzymatic conversion of substrates.
3.5. Liquid chromatography/mass spectrometry
Liquid chromatography (LC) was performed asdescribed above. Mass spectrometry (MS) was carriedout by coupling an HP 1100 system to a Quattro LC triplequadruple tandem mass spectrometer (Micromass, Man-chester, UK) with an electrospray ionization (ESI+) mode.Full scans were acquired in positive ion modes. The sourcetemperature, desolvation temperature, cone voltage, andcapillary voltage were kept at 110 �C, 180 �C, 28 V, and3.88 kV, respectively. An electron multiplier voltage of640 V was used. The nebulizer gas and desolvation gaswere ultra-pure nitrogen set at 81 l/h, 300 l/h.
3.6. Nuclear magnetic resonance spectroscopy
The nuclear magnetic resonance (NMR) spectra wereobtained on a Bruker Avance 400 instrument (9.4 T, Kar-lsruhe, Germany) in DMSO-d6. For the 1H NMR exper-iment, 32 transients were acquired with a 1-s relaxationdelay using 32K data points and the 90� pulse was9.8 ls, with a spectral width of 4500 Hz. The 13C NMRexperiments were carried out with spectral width of22,700 Hz using 64K data points, and its 90� pulse was10.3 ls. Two-dimensional spectra were acquired with2048 data points in t2 and 256 in t1 increments. TheCOSY and HMBC spectra were collected using the mag-nitude method, and the TOCSY, NOESY, and HMQCspectra, were produce with the phase sensitive mode.The data were processed using xwinnmr software pro-vided by Bruker.
Acknowledgements
This work was supported by a grant from the Biogreen21 Program, Rural Development Administration, Republicof Korea and partially by Grant KRF2004-F00019.
References
Agrawal, P.K. (Ed.), 1989. Carbon-13 NMR of Flavonoids. Elsevier, NewYork, pp. 152–155.
Ausubel, F.M., 2002. Summaries of National Science Foundation-Sponsored Arabidopsis 2010 Projects and National Science Founda-tion-Sponsored Plant Genome Projects that are generating Arabidop-sis Resources for the Community. Plant Physiol. 129, 394–437.
Cacace, S., Schroder, G., Wehinger, E., Starck, D., Schmidt, J.,Schroder, J., 2003. A flavonol O-methyltransferase from Catharan-
thus roseus performing two sequential methylations. Phytochemistry62, 127–137.
Frick, S., Kutchan, T.M., 1999. Molecular cloning and functionalexpression of O-methyltransferases common to isoquinoline alkaloidand phenylpropanoid biosynthesis. Plant J. 17, 329–339.
B.-G. Kim et al. / Phytochemistry 67 (2006) 387–394 393

Gauthier, A., Gulick, P.J., Ibrahim, R.K., 1996. cDNA cloning andcharacterization of a 30/50-O-methyltransferase for partially methyl-ated flavonols from Chrysosplenium americanum. Plant Mol. Biol. 32,1163–1169.
Gauthier, A., Gulick, P.J., Ibrahim, R.K., 1998. Characterization of twocDNA clones which encode O-methyltransferases for the methylationof both flavonoid and phenylpropanoid compounds. Arch. Biochem.Biophys. 351, 243–249.
Goff, S.A., Ricke, D., Lan, T.H., Presting, G., et al., 2002. A draftsequence of the rice genome (Oryza sativa L. ssp. japonica). Science296, 92–100.
Graham, T.L., 1991. Flavonoid and isoflavonoid distribution in develop-ing soybean seedling tissues and in seed and root exudates. PlantPhysiol. 95, 594–603.
Graham, T.L., 1998. Flavonoid and flavonol glycoside metabolism inArabidopsis. Plant Physiol. Biochem. 36, 135–144.
Harborne, J.B. (Ed.), 1994. The Flavonoids. Advances in Research.Chapman & Hall, London, pp. 452–453.
Ibrahim, R.K., Bruneau, A., Bantignies, B., 1998. Plant O-methyltrans-ferase: molecular analysis, common signature and classification. PlantMol. Biol. 36, 1–10.
Ibrahim, R.K., Muzac, I., 2000. The methyltransferase gene superfamily: atree with multiple branches. In: Romeo, J.T., Ibrahim, R.K., Varin, L.,
De Luca, V. (Eds.), Evolution of Metabolic Pathways. PergamonPress, Amsterdam, pp. 349–384.
Luckner, M., 1990. Secondary Metabolism in Microorganisms, Plants andAnimals, third ed. Springer-Verlag, New York.
Muzac, I., Wang, J., Anzellotti, D., Zhang, H., Ibrahim, R.K., 2000.Functional expression of an Arabidopsis cDNA clone encoding aflavonol 30-O-methyltransferase and characterization of the geneproduct. Arch. Biochem. Biophys. 375, 385–388.
Rakwal, R., Agrawal, G.K., Yonekura, M., Kodama, O., 2000. Naringe-nin 7-O-methyltransferase involved in the biosynthesis of the flavanonephytoalexin sakuranetin from rice (Oryza sativa L.). Plant Sci. 155,213–221.
Schroder, G., Wehinger, E., Schroder, J., 2002. Predicting the substratesof cloned plant O-methyltransferases. Phytochemistry 59, 1–8.
Wang, J., Pichersky, E., 1999. Identification of specific residues involved insubstrate discrimination in two plant O-methyltransferases. Arch.Biochem. Biophys. 368, 172–180.
Yu, J., Hu, S., Wang, J., Wong, G.K., et al., 2002. A draft sequence of therice genome (Oryza sativa L. ssp. indica). Science 296, 79–92.
Zubieta, C., He, X.Z., Dixon, R.A., Noel, J.P., 2001. Structures of twonatural product methyltransferases reveal the basis for substratespecificity in plant O-methyltransferases. Nat. Struct. Biol. 8, 271–279.
394 B.-G. Kim et al. / Phytochemistry 67 (2006) 387–394

Simultaneous quantitative LC–ESI-MS/MS analyses of salicylicacid and jasmonic acid in crude extracts of
Cucumis sativus under biotic stress
Guillem Segarra a,*, Olga Jauregui b, Eva Casanova a, Isabel Trillas a
a Departament de Biologia Vegetal, Facultat de Biologia, Universitat de Barcelona, Diagonal 645, 08028 Barcelona, Catalonia, Spainb Serveis Cientificotecnics, Universitat de Barcelona, Josep Samitier, 1-5, 08028 Barcelona, Catalonia, Spain
Received 4 October 2005; received in revised form 14 November 2005Available online 5 January 2006
Abstract
Salicylic acid (SA) and jasmonic acid (JA) are plant hormones involved in basal resistance against plant pathogens and also in inducedresistance. The aim of this study is to develop a fast and sensitive method to determine simultaneously the levels of both these hormones.The present paper proposes a method that includes hormone extraction with MeOH–H2O–HOAc (90:9:1, v/v), evaporation of theextracts, and injection into the liquid chromatography–electrospray ionization tandem mass spectrometry (LC–ESI-MS/MS) systemin multiple reaction monitoring (MRM). Endogenous SA and JA levels in noninfested control cucumber cotyledons were 30.96 and0.73 ng g�1 fresh weight, respectively. In roots, the levels were 8.31 and 15.82 ng g�1 FW, respectively. In plants treated with the biolog-ical control agent Trichoderma asperellum strain T-34, the levels of SA and JA did not differ from control plants. Rhizoctonia solani-diseased cucumber plants showed higher levels of SA and JA compared to noninfested controls (up to 2 and 13-fold higher, respectively).Detection limits for SA and JA were 0.45 and 0.47 ng g�1 fresh weight, respectively. The results of our research include the developmentof a method that is both fast and highly sensitive in the simultaneous quantitation of SA and JA from crude cucumber plant extracts,avoiding any purification and derivatization steps.� 2005 Elsevier Ltd. All rights reserved.
Keywords: Cucumis sativus; Cucumber; Jasmonic acid; Salicylic acid; LC–ESI-MS/MS; Plant defense; Quantitation; Rhizoctonia solani; Trichoderma spp.
1. Introduction
Plants have evolved a number of inducible defensemechanisms to respond to both biotic and abiotic stress.Local or systemic resistance is triggered in the majorityof plants by pathogen attack, lesions produced by insectfeeding, and other kinds of physical damage, as well as cer-tain chemical treatment and the presence of some biologi-cal control agents such as nonpathogenic rhizobacteria(Harman et al., 2004). Systemic acquired resistance(SAR) produced by pathogen attack is based on salicylicacid (SA) signaling and leads to pathogenesis-related pro-teins (PR) and phytoalexin synthesis, which may confer
protection against later attacks (Sticher et al., 1997). A sim-ilar response is produced when the plant is attacked by anecrotrophic pathogen and/or after insect wounding. Inthis case, molecular signaling is based on jasmonic acid(JA) and ethylene (Pieterse and Van Loon, 1999). Anotherkind of JA-dependent response is the so-called induced sys-temic resistance (ISR), which is produced when the rootsare colonized by certain nonpathogenic rhizobacteria. Inthis latter case, PR and phytoalexins do not accumulateuntil later pathogen attack, when the plant response ismagnified (Van Loon et al., 1998; Pozo et al., 2004). Whilemany SA and JA responses show mutual antagonism, somegenes are induced by both compounds, revealing complex-ities in the network of defense pathways (Delaney, 2004).Thus, the plant hormones JA and SA are major regulatorsof plant response to pathogen attack. However, there is
0031-9422/$ - see front matter � 2005 Elsevier Ltd. All rights reserved.
doi:10.1016/j.phytochem.2005.11.017
* Corresponding author. Tel.: +34 93 4021463; fax: +34 93 4112842.E-mail address: [email protected] (G. Segarra).
www.elsevier.com/locate/phytochem
Phytochemistry 67 (2006) 395–401
PHYTOCHEMISTRY

little information about the effect of fungal biological con-trol agents such as Trichoderma spp. on these plant hor-mones (Shoresh et al., 2005). A sensitive and reliablemethod to quantitate simultaneously such hormones inplant extracts would thus be of special interest for a betterunderstanding of plant defense mechanisms.
Under physiological conditions the plant regulators SAand JA, like all plant hormones, are present at very lowconcentrations against a background of a wide range ofmore abundant primary and secondary metabolites. There-fore, analytical methods to quantitate these hormonessimultaneously must be extremely selective and sensitive(Chiwocha et al., 2003). Different types of methods havebeen described to estimate SA and JA in plants. Liquidchromatography (LC), with fluorescence detection hasbeen used successfully for the quantitation of both SA(Meuwly and Metraux, 1993) and JA (Anderson, 1985),but these procedures include complex purification steps inorder to separate the desired compounds from a high num-ber of other interfering molecules present in the plant sam-ple as well as a derivatization step (in the case of JA). Gaschromatography coupled to mass spectrometry (GC/MS)has also been applied for the quantitation of SA (Scottand Yamamoto, 1994) and JA (Mueller and Brodschelm,1994) after derivatization of these molecules. Even thoughthe GC/MS quantitation step shows a high sensitivity forthese compounds, these methods rely on elaborate purifica-tion and concentration steps. Usually, ion-exchange col-umns or hydrophobic columns are used to purifypartially and to clean the plant samples (Mueller andBrodschelm, 1994; Scott and Yamamoto, 1994; Mulleret al., 2002). These time-consuming steps severely limitthe number of samples that can be processed in a day. Anew GC/MS method for the simultaneous quantitation ofSA and JA based on the collection of derivatized and vol-atilized compounds on polymeric adsorbent (Super Q) asthe only purification step has been described (Engelberthet al., 2003) but still relies on both purification and deriva-tization steps. LC coupled to mass spectrometry (LC/MS)is better suited for the analysis of nonvolatile polar com-pounds in their natural form (Glassbrook and Ryals,2001). The selectivity and sensitivity of this method relieson the application of multiple reaction monitoring(MRM), in which each ionized compound gives a distinctprecursor-to-product ion transition that is diagnostic forthe presence of that particular compound in an extract.Also, the need for complete resolution of compounds priorto analysis is bypassed because peaks containing co-elutingcompounds can be resolved by monitoring for specific pre-cursor-to-product ion transitions (Chiwocha et al., 2003).LC–MS has been applied for the quantitation of JA inplant samples (Tamogami and Kodama, 1998) but to ourknowledge only one paper describes simultaneous quanti-tation of both SA and JA by using this technique (Wilbertet al., 1998).
The aim of this study was to develop a method to deter-mine simultaneously SA and JA levels in cucumber cotyle-
dons and roots in a way that would combine speed with thehighest accuracy and with low limits of detection. In orderto achieve these objectives an LC–MS/MS method is pro-posed which shows noticeable chromatographic ameliora-tions with respect to other existing methods. Theseprocedures were tested to evaluate the effect of plant infes-tation with the necrotrophic pathogen Rhizoctonia solani
and the biological control agent Trichoderma asperellum
strain T-34 on the endogenous plant SA and JA levels.
2. Results
2.1. Liquid chromatography–mass spectrometry(LC–MS/MS)
Basic pH conditions as described by Wilbert et al. (1998)gave a poor peak shape for both compounds and SA elutedshowing peak tailing. The 5 mM NH4OAc pH 5/MeCNgradient method produced well-shaped peaks for SA at2.7 min with good sensitivity. Nevertheless, JA at 7 minpresented a high decrease in sensitivity in comparison withthe other LC conditions. Finally, acid pH conditions(0.05% HOAc in H2O/MeCN gradient) with a DiscoveryC18 150 · 2.1 mm, 5 lm (Supelco, Bellefonte, USA) gavethe best results in terms of sensitivity and peak shape. Thiscolumn has the main advantage of low bleeding at the endof the MeCN gradient compared with the other columns.Retention times in these conditions were 4.0 min for SAand 6.6 min for JA. These conditions allowed the injectionof a relatively high number of samples in a short time (upto 100 per day). Fig. 1 shows the overlaid trace chromato-grams of cucumber extracts from control plants and Rs-inoculated plants for SA and JA.
The spectra generated for both compounds in negativeion detection gave the deprotonated molecule [M � H]�
(m/z 137 for SA and m/z 209 for JA). The product ionscan spectrum of m/z 137 gave the ion [M � H � COO]�
(m/z 93) for SA. For JA, the product ion scan of m/z209 gave the [M � H � COO]� (m/z 165) and the m/z59. It should be noted that the MRM 209/59 transitiongave a signal 10 times greater than the 209/165 at thedescribed MS/MS conditions (CE-25). Quantitation ofSA and JA in cucumber plantlets was done by injectionof extracted and spiked samples in the LC–ESI(�)-MS/MS system in MRM mode (137/93 for SA and 209/59for JA). Identification of SA and JA was done on thebasis of retention time and presence of peak in theMRM trace compared with those of the standards.When possible, product ion scan experiments were doneto confirm positively the presence of both acids in thesamples. As can be seen in Fig. 2 an interference thatalmost coelutes with JA is present in the 209/165MRM trace in the cucumber extracts and does not allowthis trace to be used for quantification. Using theseMRM conditions background noise was minimized andsensitivity was very high.
396 G. Segarra et al. / Phytochemistry 67 (2006) 395–401

Fig. 1. Overlaid trace chromatograms in MRM mode of 137/93 for salicylic acid in cotyledon samples (A) and 209/59 for jasmonic acid in root samples(B). Empty arrows show the peak corresponding to the control sample. Filled arrows show the peak of the Rhizoctonia solani-inoculated sample.
Fig. 2. Trace chromatograms in MRM mode of 209/59 overlaid onto those of 209/165 for a 1 ng ll�1 jasmonic acid standard (A) and for a sample ofcucumber extract (B).
G. Segarra et al. / Phytochemistry 67 (2006) 395–401 397

2.2. Quality parameters of the LC–MS/MS method
In the optimum LC–MS/MS conditions describedabove, standards of SA and JA (200 and 4 ppb, respec-tively) were quantified (n = 10) on three different daysusing a standard addition calibration curve (from 50 to1000 and from 1 to 20 ppb, respectively). Good correlationcoefficients (r P 0.999) were obtained in the concentrationrange studied. The results for reproducibility were a rela-tive standard deviation (RSD) of 1.5% and 3.5% for run-to-run precision, and 2% and 3.5% for day-to-day precisionon SA and JA concentrations, respectively. The methodalso showed good precision with regard to retention time(0.4% and 0.1% for run-to-run and 0.7% and 0.1% inday-to-day for SA and JA, respectively). Detection limit(LOD) based on a signal-to-noise ratio of 3:1 was calcu-lated through the standard addition curves, giving a valueof 0.45 and 0.47 ng g�1 of SA and JA, respectively, in freshweight of plant.
2.3. Quantitation of SA and JA in cucumber cotyledons and
roots
Incidence of R. solani disease at 7 days after seeding was100% in R. solani-treated plants (Rs treatment) and 0% inplants from both control and T. asperellum isolate T-34
treatments. Disease severity was 4.0 ± 0.1 (mean ± s.e.) inRs-infected plants.
Cotyledons from diseased cucumber plants (grown inRs-inoculated substrate) showed significant higher levelsof endogenous SA and JA (up to 2- and 13-fold higher,respectively) than healthy plants (those grown in T-34-inoculated or control substrates) 72 h after seeding(Fig. 3(A) and (C)). In the same way, roots from diseasedcucumber plants showed significant higher levels of endog-enous SA and JA (up to 2 and 2.5-fold higher, respectively)than healthy plants 72 h after seeding (Fig. 3(B) and (D)).It is noticeable that SA quantities in cotyledons of Rs-trea-ted plants were approximately 4-fold higher than in roots,whereas JA quantities were 4-fold higher in roots than incotyledons and up to 20-fold higher in roots in the caseof healthy plants.
Extractions from lyophilized samples yielded half asmany SA levels as those from fresh samples. JA yields werenot affected by lyophilization (data not shown).
3. Discussion
In this paper we present a rapid, sensitive LC–MS/MSmethod for simultaneous quantitation of SA and JA,avoiding any purification and derivatization steps. Themethod shows good results in terms of detection limits,repeatability, and linearity. The method presents betterLOD for SA than that obtained by Meuwly and Metraux(1993) in cucumber leaves of 4 ng g�1 of fresh weight (10-fold more sensitive), and slightly better LOD for JA thanthat obtained by Rakwal et al. (2002) of 1 pg. Our methodshowed better chromatographic profiles than thoseobtained following the method described by Wilbert et al.(1998) which is the only other existing method for simulta-neous quantitative LC–MS/MS analysis of JA and SA.Another advantage of the method we describe is its speedand simplicity, allowing the analysis of high numbers ofsamples.
The SA levels found in healthy cucumber cotyledonsand roots in the present article are similar to those obtainedin other studies in the same plant species (Molders et al.,1996; Shoresh et al., 2005). Moreover basal SA levels werehigher in the cotyledons than in the roots, which is inaccordance with other studies (Molders et al., 1996; Shor-esh et al., 2005), while JA levels behaved in the oppositeway.
Our results show that both SA and JA endogenous lev-els rise locally (roots) and systemically (cotyledons) in R.
solani-diseased cucumber plants. The rise in SA after path-ogen attack has also been described in some works sincethe first reports (Malamy et al., 1990; Metraux et al.,1990). Free cucumber SA levels rose both locally andsystemically after Tobacco Necrosis Virus inoculation(Molders et al., 1996), while potato inoculation with Phy-
tophthora infestans led only to local increases of free SAin the infection site (Coquoz et al., 1995). The local and
Fig. 3. Salicylic acid (SA) content in cotyledons (A) and roots (B), andjasmonic acid (JA) content in cotyledons (C) and roots (D) of cucumberplants 72 h after seeding. Treatments consisted in different growth mediainoculation: Control, noninoculated; Rs, Rhizoctonia solani-inoculated;T-34, Trichoderma asperellum T-34-inoculated. Values represent themean ± s.e. (n = 5). Different letters indicate statistically significantdifferences between treatments in a Duncan multiple range test (P < 0.05).
398 G. Segarra et al. / Phytochemistry 67 (2006) 395–401
systemic rise of free JA in Arabidopsis after Alternaria
brassicola inoculation has also been reported (Penninckxet al., 1996). The increases in SA and JA observed in thediseased cucumber plants in comparison to healthy plantsare noticeable (from 2 to 13-fold), since a 59% increase inendogenous SA concentration is sufficient to induce theaccumulation of PR protein in tobacco leaves (Yalpaniet al., 1991).
The higher increases found for JA in cotyledons, in com-parison to those obtained for SA, suggest a major implica-tion of JA in this plant pathogen interaction. This isconsistent with the general observation that necrotrophicpathogens’ basal resistance is based on JA-related mecha-nisms (Thomma et al., 1998) while biotrophic or hemibio-trophic basal resistance is based on SA-related mechanisms(Delaney et al., 1994; Kachroo et al., 2000).
The fact that 72 h after seeding SA levels did not rise inT-34-inoculated cucumber plants agrees with the observa-tion made on the same plant species between 0 and 96 hpost inoculation with T. asperellum strain T203 (Shoreshet al., 2005). However, in the cited article the authors indi-rectly prove that JA may be playing a role in the inductionof resistance by the T203, while in our work we could notobserve, at the moment of the analyses, any increase of JAdue to the application of T-34.
4. Experimental
4.1. Plant material
Fifteen cucumber seeds (Cucumis sativus L. ‘Negrito’)were placed in each of five 400 ml plastic pots containingpeat from Klasmann (Palleter, Spain) amended with4 g l�1 CaCO3. Growth media had been previously inocu-lated with 2 g l�1 of a R. solani AG-4 isolate soil inoculum(Rs treatment) prepared according to Ko and Hora (1971)or 5 · 105 cfu ml�1 of T-34 isolate from T. asperellum (T-34treatment) (Trillas and Cotxarrera, 2003). We also includeda noninoculated treatment (control treatment). Pots werekept in a growth chamber at 25 ± 1 �C under a 16 h photo-period (200 lE m�2 s�1). Plants were fertilized twice a daywith 50 ml of the following solution: 0.5 g l�1 Peter’s foliarfeed 27-15-12 from Scotts (Heerlen, The Netherlands) com-plemented with 0.22 g l�1 CaCl2 and 0.25 g l�1 MgSO4 Æ7H2O.
4.2. Disease evaluation
Seven days after seeding, plants showing crown rootdamage or damping-off, which are typical symptoms pro-duced by R. solani, were considered as diseased plants. Dis-ease incidence was calculated as the percentage of diseasedplants over the total number of plants from each pot. Dis-ease severity was assessed using the following scale: 1,healthy plant; 2, light wounds; 3, severe wounds; 4, postemergency damping-off; 5, pre emergency damping-off.
4.3. Chemicals
Standards of salicylic acid >99% (Fluka, Buchs, Switzer-land) and (±)-jasmonic acid >97% (Sigma–Aldrich, Stein-heim, Germany) were prepared at a concentration of500 mg l�1 in MeOH. The working SA and JA solutionsof 1000 and 20 lg l�1, respectively, were made by dilutingthe standard solutions with the initial LC mobile phase(0.05% HOAc in H2O–MeCN, 85:15, v/v). MeOH ofHPLC grade was purchased from Panreac (Montcada iReixac, Spain), MeCN of HPLC grade from Sigma–Aldrich (Steinheim, Germany), HOAc from Merck(Darmstadt, Germany), and ultrapure H2O (Milli-Q) wasobtained from Millipore System (Bedford, USA).
4.4. Sample preparation
Seventy-two hours after seeding, the cucumber plantletswere washed under running tap water for 5 min and driedgently. Roots and cotyledons (excised from the shoots)from all the plantlets in each pot were pooled separatelyand quick-frozen in liquid N2. Frozen samples were thenground under liquid N2 with mortar and pestle. An amountof 250 mg of the resulting powder was extracted with 750 llMeOH–H2O–HOAc (90:9:1, v/v/v) and centrifuged for1 min at 10,000 rpm. The supernatant was collected andthe extraction was repeated. Pooled supernatants weredried under N2, resuspended in 200 ll of 0.05% HOAc inH2O–MeCN (85:15, v/v), and finally filtered with a Mil-lex-HV 0.45 lm filter from Millipore (Bedford, USA).Alternatively, frozen samples were lyophilized and groundwith agate mortar and pestle; in this case only 45 mg of theresulting powder was used for the extraction. Quantitationwas done by the standard addition method by spiking con-trol plant samples with SA and JA solutions (ranging from50 to 1000 ng ml�1 and from 1 to 20 ng ml�1, respectively),and extracting as described above.
4.5. Liquid chromatography
Analyses were carried out using an Agilent 1100 (Wal-drom, Germany) quaternary pump equipped with an auto-sampler. A Supelco Discovery C18 (Supelco, Bellefonte,USA) column (2.1 · 150 mm, 5 lm) was used at ambienttemperature and the injected volume was 10 ll. The elutiongradient was carried out with binary solvent system con-sisting of 0.05% HOAc in H2O (solvent A) and MeCN (sol-vent B) at a constant flow-rate of 600 ll min�1 and a split1/3. A linear gradient profile with the following propor-tions (v/v) of solvent B was applied (t (min), %B): (0,15), (3, 15), (5, 100), (6, 100), (7, 15), (8, 15) with 5 minfor re-equilibration.
4.6. Mass spectrometry
MS and MS/MS experiments were performed on an API3000 triple quadrupole mass spectrometer (PE Sciex,
G. Segarra et al. / Phytochemistry 67 (2006) 395–401 399

Concord, Ont., Canada). All the analyses were performedusing the Turbo Ionspray source in negative ion mode withthe following settings: capillary voltage �3500 V, nebulizergas (N2) 10 (arbitrary units), curtain gas (N2) 12 (arbitraryunits), collision gas (N2) 4 (arbitrary units). For SA analy-sis we used the following parameters: declustering potential(DP) �30 V, focusing potential (FP) �150 V, entrancepotential (EP) �10 V, collision energy (CE) �20 V (137/93), CXP �23 V. For JA analysis the following parameterswere used: declustering potential (DP) �37 V, focusingpotential (FP) �180 V, entrance potential (EP) �10 V, col-lision energy (CE) �25 V (209/59), CXP �23 V. Drying gas(N2) was heated to 400 �C and introduced at a flow-rate of5000 cm3min�1 All the MS and MS/MS parameters wereoptimized in infusion experiments using individual stan-dard solutions of SA and JA at a concentration of 1 ngll�1 diluted in mobile phase A/B (1:1, v/v). These solutionswere infused at a flow-rate of 10 ll min�1 into the massspectrometer using a Model 11 syringe pump (HarvardApparatus, Holliston, MA, USA). Full scan data acquisi-tion was performed scanning from m/z 100 to 800 in profilemode and using a cycle time of 2 s with a step size of 0.1 uand a pause between each scan of 2 ms. In product ion scanexperiments, MS/MS product ions were produced by colli-sion-activated dissociation (CAD) of selected precursorions in the collision cell of the triple quadrupole mass spec-trometer and mass analyzed using the second analyzer ofthe instrument. In negative mode, the spectrum for SAand JA gave the deprotonated molecule [M � H]�. Quan-titation was performed by injection of samples in MRMmode, because many compounds could present the samenominal molecular mass. Thus, the combination of the par-ent mass and unique fragment ions was used to monitorselectively SA and JA in crude plant extracts. MRM acqui-sition was done by monitoring the 137/93 and 209/59 tran-sitions for SA and JA, respectively; with a dwell time of1000 ms for each transition.
4.7. Other LC methods used for comparison
Different LC conditions were tested in order to obtainthe highest sensitivity and system performance. Basic pHconditions as described by Wilbert et al. (1998) were firsttested using a mobile phase 1% NH3/5 mM NH4OAc inH2O in a XTerra MS C18 50 · 2.1 mm, 3.5 lm (Waters,Milford, MA, USA) column. A Gemini 250 · 4.6 mm,5 lm (Phenomenex, Torrance, CA, USA) column was alsotested with a 5 mM NH4OAc pH 5/MeCN gradient (usinga flow-rate of 1.2 ml min�1).
Acknowledgements
We thank the Departament d’Universitats, Recerca iSocietat de la Informacio of the Government of Cataloniafor funding the Ph.D. studentship of Guillem Segarra. This
study was supported by the Ministerio de Educacion yCiencia (AGL2002-04313-C03-01), Spain.
References
Anderson, J.M., 1985. Simultaneous determination of absicisic acid andjasmonic acid in plant extracts using High Performance LiquidChromatography. J. Chromatogr. A 330, 347–355.
Chiwocha, S.D.S., Abrams, S.R., Ambrose, S.J., Cutler, A.J., Loewen,M., Ross, A.R.S., Kermode, A.R., 2003. A method for profiling classesof plant hormones and their metabolites using liquid chromatography–electrospray ionization tandem mass spectrometry: an analysis ofhormone regulation of thermodormancy of lettuce (Lactuca sativa L.)seeds. Plant J. 35, 405–417.
Coquoz, J.L., Buchala, A.J., Meuwly, P., Metraux, J.P., 1995. Arachi-donic-acid induces local but not systemic synthesis of salicylic-acid andconfers systemic resistance in potato plants to Phytophthora infestans
and Alternaria solani. Phytopathology 85, 1219–1224.Delaney, T.P., 2004. Salicylic acid. In: Davies, P.J. (Ed.), Plant Hormones.
Kluwer Academic Press, Dordrecht, pp. 635–653.Delaney, T.P., Uknes, S., Vernooij, B., Friedrich, L., Weymann, K.,
Negrotto, D., Gaffney, T., Gutrella, M., Kessmann, H., Ward, E.,Ryals, J., 1994. A central role of salicylic acid in plant diseaseresistance. Science 266, 1247–1250.
Engelberth, J., Schmelz, E.A., Alborn, H.T., Cardoza, Y.J., Huang, J.,Tumlinson, J.H., 2003. Simultaneous quantification of jasmonic acidand salicylic acid in plants by vapor-phase extraction and gaschromatography–chemical ionization–mass spectrometry. Anal. Bio-chem. 312, 242–250.
Glassbrook, N., Ryals, J., 2001. A systematic approach to biochemicalprofiling. Curr. Opin. Plant Biol. 4, 186–190.
Harman, G.E., Howell, C.R., Viterbo, A., Chet, I., Lorito, M., 2004.Trichoderma species – opportunistic, avirulent plant symbionts. Nat.Rev. Microbiol. 2, 43–56.
Kachroo, P., Yoshioka, K., Shah, J., Dooner, H.K., Klessig, D.F., 2000.Resistance to turnip crinkle virus in Arabidopsis is regulated by twohost genes and is salicylic acid dependent but NPR1, ethylene, andjasmonate independent. Plant Cell 12, 677–690.
Ko, W., Hora, F., 1971. A selective medium for the quantitativedetermination of Rhizoctonia solani in soil. Phytopathology 61, 707–710.
Malamy, J., Carr, J.P., Klessig, D.F., Raskin, I., 1990. Salicylic-acid – alikely endogenous signal in the resistance response of tobacco to viral-infection. Science 250, 1002–1004.
Metraux, J.P., Signer, H., Ryals, J., Ward, E., Wyssbenz, M., Gaudin, J.,Raschdorf, K., Schmid, E., Blum, W., Inverardi, B., 1990. Increase insalicylic-acid at the onset of systemic acquired-resistance in cucumber.Science 250, 1004–1006.
Meuwly, P., Metraux, J.P., 1993. Ortho-anisic acid as internal standardfor the simultaneous quantitation of salicylic acid and its putativebiosynthetic precursors in cucumber leaves. Anal. Biochem. 214, 500–505.
Molders, W., Buchala, A., Metraux, J.P., 1996. Transport of salicylic acidin tobacco necrosis virus-infected cucumber plants. Plant Physiol. 112,787–792.
Mueller, M.J., Brodschelm, W., 1994. Quantification of jasmonic acid bycapillary gas chromatography–negative chemical–ionization mass–spectrometry. Anal. Biochem. 218, 425–435.
Muller, A., Duchting, P., Weiler, E.W., 2002. A multiplex GC–MS/MStechnique for the sensitive and quantitative single-run analysis ofacidic phytohormones and related compounds, and its application toArabidopsis thaliana. Planta 216, 44–56.
Penninckx, I.A.M.A., Eggermont, K., Terras, F.R.G., Thomma, B.P.H.J.,DeSamblanx, G.W., Buchala, A., Metraux, J.P., Manners, J.M.,Broekaert, W.F., 1996. Pathogen-induced systemic activation of a
400 G. Segarra et al. / Phytochemistry 67 (2006) 395–401

plant defensin gene in Arabidopsis follows a salicylic acid-independentpathway. Plant Cell 8, 2309–2323.
Pieterse, C.M.J., Van Loon, L.C., 1999. Salicylic acid-independent plantdefence pathways. Trends Plant Sci. 4, 52–58.
Pozo, M.J., Van Loon, L.C., Pieterse, C.M.J., 2004. Jasmonates –signals in plant–microbe interactions. J. Plant Growth Regul. 23,211–222.
Rakwal, R., Tamogami, S., Agrawal, G.K., Iwahashi, H., 2002. Octade-canoid signaling component ‘‘burst’’ in rice (Oryza sativa L.) seedlingleaves upon wounding by cut and treatment with fungal elicitorchitosan. Biochem. Biophys. Res. Commun. 295, 1041–1045.
Scott, I.M., Yamamoto, H., 1994. Mass-spectrometric quantification ofsalicylic-acid in plant-tissues. Phytochemistry 37, 335–336.
Shoresh, M., Yedidia, I., Chet, I., 2005. Involvement of jasmonic acid/ethylene signaling pathway in the systemic resistance induced incucumber by Trichoderma asperellum T203. Phytopathology 95, 76–84.
Sticher, L., Mauchmani, B., Metraux, J.P., 1997. Systemic acquiredresistance. Annu. Rev. Phytopathol. 35, 235–270.
Tamogami, S., Kodama, O., 1998. Quantification of amino acid conju-gates of jasmonic acid in rice leaves by high-performance liquid
chromatography turboionspray tandem mass spectrometry. J. Chro-matogr. A 822, 310–315.
Thomma, B.P.H.J., Eggermont, K., Penninckx, I.A.M.A., Mauch-Mani,B., Vogelsang, R., Cammue, B.P.A., Broekaert, W.F., 1998. Separatejasmonate-dependent and salicylate-dependent defense-response path-ways in Arabidopsis are essential for resistance to distinct microbialpathogens. Proc. Natl. Acad. Sci. USA 95, 15107–15111.
Trillas, I., Cotxarrera, L., 2003. Substrates containing a Trichoderma
asperellum strain for biological control of Fusarium and Rhizoctonia.WO 03/000866 A1.
Van Loon, L.C., Bakker, P.A.H.M., Pieterse, C.M.J., 1998. Systemicresistance induced by rhizosphere bacteria. Annu. Rev. Phytopathol.36, 453–483.
Wilbert, S.M., Ericsson, L.H., Gordon, M.P., 1998. Quantification ofjasmonic acid, methyl jasmonate, and salicylic acid in plants bycapillary liquid chromatography electrospray tandem mass spectrom-etry. Anal. Biochem. 257, 186–194.
Yalpani, N., Silverman, P., Wilson, T.M.A., Kleier, D.A., Raskin, I.,1991. Salicylic-acid is a systemic signal and an inducer of pathogenesis-related proteins in virus-infected tobacco. Plant Cell 3, 809–818.
G. Segarra et al. / Phytochemistry 67 (2006) 395–401 401

Targeted metabolite profiling provides a functional link amongeucalypt taxonomy, physiology and evolution
Andrew Merchant a,*, Andreas Richter b, Marianne Popp b, Mark Adams c
a Institute of Land and Food Resource, School of Forest Ecosystem Science, The University of Melbourne, Water Street, Creswick, Vic. 3363, Australiab Institute for Ecology and Conservation Biology, University of Vienna, A-1091 Vienna, Austria
c Centre of Excellence in Natural Resource Management, The University of Western Australia, Crawley, WA 6009, Australia
Received 8 September 2005; received in revised form 26 November 2005
Abstract
Adaptation to aridity is considered a major factor in the evolution of the genus Eucalyptus. For the first time, targeted metaboliteprofiling has uncovered a quantitative yet discrete phytochemical link with eucalypt taxonomy. The distribution of cyclitols among Euca-
lyptus species, and a range of other Australian tree genera, support their proposed functions in plant tissues and provide putative linkswith the acclimation of trees to arid environments.� 2005 Elsevier Ltd. All rights reserved.
Keywords: Aridity; Eucalypts; Taxonomy; Evolution; Cyclitols; D-Quercitol
1. Introduction
Changing climatic conditions over geological time scaleshas played a major role in the evolution of Australian plantgenera, including Eucalyptus. At the beginning of the ter-tiary period, the Australian land mass began to movenorthwards to drier latitudes. The resultant generalincrease in aridity associated with this shift is widely attrib-uted as a defining factor in the evolution of many Austra-lian plant species. For example, even among the largegroup of ‘multistemmed’ eucalypts that are generallydrought-tolerant, speciation has been attributed tobetween-habitat variation in water availability of a few per-cent (Parsons, 1969a,b). At a larger scale, there are manyseemingly clear instances of speciation among Australiantree genera that are attributed to isolation of gene poolswithin environments that differed mainly in the availabilityof water (Davidson and Reid, 1980; Noble, 1989; Adams,1996).
Consideration of plant evolution has classically encom-passed morphological descriptions of species and theircontribution to reproductive fitness. Morphological fea-tures remain the primary basis of taxonomy that is, inturn, frequently related to evolution (‘morphometric’analysis, sensu Dunlop et al., 1998). In the last few dec-ades, advances in genomic analysis have enabled research-ers to observe patterns based upon a universal unit ofinheritance and better quantify the evolutionarily crucialinteraction of genes with their environment. In part, theseinteractions are reconciled through changes inmetabolism.
The relatively new approach of ‘metabolomics’ (sensu(Weckwerth, 2003)) offers considerable promise to thoseinterested in the relationships between plant function andtheir genotype. Analysis of primary and secondary metab-olites provides a means of assessing how and to whatdegree a plant responds to its environment. The analysisof these compounds, collectively termed the ‘metabolome’(Tweeddale et al., 1998), helps develop a process-basedunderstanding of plant adaptation to changingenvironments.
0031-9422/$ - see front matter � 2005 Elsevier Ltd. All rights reserved.
doi:10.1016/j.phytochem.2005.11.027
* Corresponding author. Tel.: +61 3 5321 4269; fax: +61 3 5321 4166.E-mail address: [email protected] (A. Merchant).
www.elsevier.com/locate/phytochem
Phytochemistry 67 (2006) 402–408
PHYTOCHEMISTRY

Table 1Quantification of cyclitols among a range of subgeneric groups from the genus Eucalyptus (X = <1 mg g�1, XX = 1–10 mg g�1, XXX = >10 mg g�1 leaf dry weight)
Species Subgenus Section Series D-Quercitol D-1-OMMI D-Pinitol Viburnitol L-Quebrachitol muco-Inositol Leucanthemitol chiro-Inositol scyllo-Inositol myo-Inositol Growth habit Annual rainfall Climatic zone Altitude Soil type
Angophora florida Angophora Floribundinas X XX Medium sized tree 12–20 m height 500–1000 mm Warm humid to warm subhumid 0–1100 m . . .On alluvial soils and deep sandy loams along flats and watercourses
Eucalyptus citriodora Corymbia Septentrionales Naviculares X XX Medium to tall up to 50 m height 650–1600 mm Warm humid to warm subhumid 450–1000 m . . .Tolerant of a variety of soils . . .podsola and residual podsols . . .Eucalyptus maculate Corymbia Septentrionales Naviculares X XX Tall tree 35–45 m 750–1750 mm Warm humid to warm subhumid 0–950 m . . .Variety of soils . . .moist but well drained with a moderately heavy texture . . .
Eucalyptus alpina Eucalyptus Renantheria Capitellatae X XX XX Small . . .of multistemmed habit 2–6 ma 1000–1250 ma . . .Sandstone peaks of Grampians NP . . .a
Eucalyptus obliqua Eucalyptus Eucalyptus Regnantes X XX XX Tall to very tall tree 45–90 m height 500–2400 mm Cool-subhumid to humid 0–1000 m . . .Wide range of soil with best development on good quality loamsEucalyptus seiberi Eucalyptus Cineraceae Consideration X XX XX 25–35 m 700–1400 mm Cool to warm, humid to subhumid 0–1100 m . . .Wide range of soil . . .usually sandy type over a well drained clay subsoilEucalyptus radiate Eucalyptus Aromatica Insulance X XX XX Medium tree 20–30 m height 650–1100 mm Warm to cool, humid to subhumid 50–1200 m Wide range of soil types including sands, skeletel soils and volcanic loamsEucalyptus elata Eucalyptus Renantheria Radiatae X XX XX Medium tree 20–30 m height 650–1700 mm Cool to warm, humid to subhumid 0–750 m Moderately fertile alluvial loamsEucalyptus dives Eucalyptus Renantheria Radiatae X XX XX medium tree 12–25 m height 600–1100 mm Cool to warm, subhumid to humid 150–1400 m Rather poor shallow and stony soilsEucalyptus richoliia Eucalyptus Renantheria Piperitae X XX XX Small to medium sized treeb Northern tablelands of NSWb
Eucalyptus saligna Symphyomyrtus Latoangulae Transversae tr X XX Tall to very tall tree 25–55 m height 900–1800 mm Warm humid 0–1100 m Good quality alluvial sandy loamsEucalyptus botryoides Symphyomyrtus Latoangulae Annulares X X XX 30–40 m height 700–1300 mm Warm humid 0–300 m Poors sandy soils of coastal locationsEucalyptus longifolia Symphyomyrtus Similares X X X XX 20–35 m 800–1250 mm Warm humid 0–300 m Heavy soils derived from shales that do not dry outEucalyptus cosmophylia Symphyomyrtus Incognitae tr X XX Bushy shrub or small tree 1–10 m Associate with E. longifolia
Eucalyptus camaldulensis Symphyomyrtus Exsertaria Rostratae X X XX Medium sized to tall tree 25–40 m height 250–1250 mm Warm to hot, subhumid to semi-arid 20–700 m Sandy alluvialEucalyptus aromaphloia Symphyomyrtus Maidenaria Acaciformes X X XX Moderate size 12–20 ma Associated with E. viminalis and E. obliquaa
Eucalyptus ovata Symphyomyrtus Maidenaria Foveolate X X XX Medium sized to tall tree up to 30 m 600–1400 mm Warm to cool subhumid to humid 0–1100 m Soils are generally sands and clays frequently with poor drainageEucalyptus camphora Symphyomyrtus Maidenaria Foveolate X X XX Small to medium sized tree 8–20 m 600–1400 mm Associated with E. ovata
Eucalyptus globulus Symphyomyrtus Maidenaria Globulares X X XX Tall tree 30–40 m height 700–1200 mm Warm subhumid to humid 0–1050 m Heavy soil with good quality loamEucalyptus crenulata Symphyomyrtus Maidenaria Viminales X X XX Small tree 4–12 ma 600–1400 mm Associated with E. ovata
Eucalyptus viminalis Symphyomyrtus Maidenaria Viminales X X XX Tall tree 30–50 m height 500–2000 mm Warm to cool, subhumid to humid 0–1400 m Moist but well drained alluvial or sandy podsolic soils with clay subsoilsEucalyptus cladocalyx Symphyomyrtus Sejunctae XXX X X tr X Small to medium tree 380–650 mm Warm subhumid 0–600 m Mainly skeletal or podsolic frequently shallowEucalyptus leptophyila Symphyomyrtus Bisectae Porantherae XXX X X X X Multistemmed or small tree 2–8 ma 250–500 mm Associated with E. dumosa
Eucalyptus calycogna Symphyomyrtus Bisectae Heterostemones XXX X X X X Multistemmed or small tree 3–9 ma 250–500 mm Associated with E. dumosa
Eucalyptus gracillis Symphyomyrtus Bisectae Heterostemones XXX X X Multistemmed or small tree 3–10 ma 251–500 mm Associated with E. dumosa
Eucalyptus astringens Symphyomyrtus Bisectae Erectae XXX X X X X Medium sized tree 10–25 m 350–750 mm Warm subhumid to semi-arid 200–350 m . . .On sand or clay loams . . .on lateritic flats . . .adaptable to a wide range of soilsEucalyptus dumosa Symphyomyrtus Dumaria Rufispermae XXX X X X X Multistemmed2–10 m 250–500 mm Warm, semi-arid 0–300 m Common on solonized brown soils, red-brown earths, desertloamsEucalyptus behriana Symphyomyrtus Adnataria Buxeales XXX X X tr tr X Multistemmed3–10 ma 250–500 mm Associated with E. dumosa
Eucalyptus largiflorens Symphyomyrtus Adnataria Buxeales XXX X X Medium sized tree10–20 m 200–380 mm Warm semi-arid to arid 30–300 m Grey clay loams . . . self mulching clays . . . less commonly on fine red brown sandsEucalyptus viridis Symphyomyrtus Adnataria Buxeales XXX X X X tr X Multistemmed or small tree to 10 ma around 470 mm Associated with E. polybractea
Eucalyptus polybractea Symphyomyrtus Adnataria Buxeales XXX X X X X Multistemmed 5–10 m Around 470 mm Warm subhumid to semi-arid 250–350 m . . .Red brown loams often with quartz . . .
Eucalyptus frogattii Symphyomyrtus Adnataria Buxeales XXX X X Multistemmed4–10 ma Around 470 mm Associated with E. polybractea
Eucalyptus microcarpa Symphyomyrtus Adnataria Buxeales XXX X X X X 12–25 m height 400–700 mm Warm subhumid to semi-arid 80–400 m . . .Heavy alluvial soils clay loams better quality sandy loamsEucalyptus polyanthemos Symphyomyrtus Adnataria Heterophloiae XXX X X X X Medium sized tree 15–25 m 500–800 mm Warm subhumid 120–800 m . . .Dry stoney or gravelly soils and rather heavy poor soils of sedimentary originEucalyptus leucoxylon Symphyomyrtus Adnataria Melliodorae XXX X X X X 10–16 m height 400–800 mm Warm subhumid 0–800 m . . .Mainly soils of . . . shales, granites and quartzites, basalts and limestones.Eucalyptus sideroxylon Symphyomyrtus Adnataria Melliodorae XXX X X Medium sized . . .10–25 m 450–1000 mm Warm subhumid 0–1000 m . . .Poor, shallow soils including sands, gravels ironstones and claysEucalyptus melliodora Symphyomyrtus Adnataria Melliodorae XXX X X Medium sized to tall tree 15–30 m 500–900 mm Warm subhumid 150–600 m . . .Light to somewhat heavy alluvial soils, loams and sandy loamsEucalyptus paniculata Symphyomyrtus Adnataria Rhodoxylon XXX X X X X X Medium sized tree up to 30 m 750–1500 m Warm humid to subhumid 0–500 m . . .Prefers good soils especially fertile sandy loams . . .ability to grow on poor soils . . .
Species are arranged in a conceptually phylogenetic order from top to bottom as per (Brooker, 2000). Ecological data is compiled from Boland (1992), and footnotes a and b.a See Costermans (1992).b See Brooker and Kleinig (1996).

For eucalypts, semi-quantitative analysis of essential oilshas been the only major non-morphological approach usedby researchers to link taxonomy to physiology and metab-olism e.g. (Dunlop et al., 1998, 1999). This approach (‘che-mometric’ sensu Dunlop et al., 1998) has provided a meansof supporting taxonomic separation of species. Essential oildata has been used as supporting evidence in several revi-sions of series within the genus. Apart from the essentialoils, the only classes of metabolites to have been assessedwithin even a moderate number of Eucalyptus spp. areamino compounds (Adams et al., 1995) and a range of cya-nogenic glycosides (Gleadow and Woodrow, 2002; Good-ger and Woodrow, 2002) and then the analysis has beenconducted largely in relation to herbivory.
More recently, studies of a few eucalypts suggested cleartaxonomic differences between species in their capacity tosynthesise and accumulate a range of sugar alcohols orcyclitols (Adams et al., 2005). These studies have shownthat some mallee eucalypts contain D-quercitol up to30 mg g�1 leaf dry weight in contrast to more mesic speciesthat contain no, or very low amounts. Significantly, cycli-tols have been clearly identified as key osmotica in higherplants (e.g., Hasegawa et al., 2000) and may thus providea putative link between adaptation of eucalypts to aridityand their taxonomy. As Bieleski and Briggs (2005) recentlyconcluded from their study of the presence of cyclitols(polyols) in some 80 members of another southern hemi-sphere genus, the Proteaceae: ‘‘. . .persistence of the polyolpathways in the family is the end product of repeated chal-lenges on the family to accommodate drought-stressconditions’’.
We report here an analysis of some 61 Australian treespecies, collected from their native habitat, with representa-tive samples from Eucalyptus (Myrtaceae), Leptospermum
(Myrtaceae), Melaleuca (Myrtaceae), Acacia (Mimosaceae)Callitris (Cupressaceae) and Heterodendrum (Sapindaceae)for low molecular weight carbohydrate and polyol (includ-ing cyclitol) content. The genus Eucalyptus contains 15 sub-genera and more than 700 species (Brooker, 2000), with themajority lying within Corymbia (�70 spp.), Eucalyptus
(�110 spp.) and Symphyomyrtus (�500 spp.). Corymbia
spp. dominate the savannas of northern Australia whilstEucalyptus spp. dominate most of the coastal and uplandregions of southeast and southwest Australia (Gill et al.,1985). Symphyomyrtus spp. are widely distributed acrossthe continent, but are particularly common in more aridregions. We also provide ecological data compiled fromvarious authoritative sources on the ecology of the ana-lysed species. The species selected here for study reflect,and to a first approximation represent, the known distribu-tion of species among eucalypt subgenera. A mixture ofGC–MS and GC techniques were used for a targeted met-abolic analysis along the lines suggested by Trethewey(2004) and based on our preliminary knowledge of putativetaxonomic differences in cyclitol accumulation. In addition,we adopted one of the more consistent extraction tech-niques (methanol/chloroform/water) to maximise both
reproducibility and cross-study comparability (e.g.,Weckwerth, 2003).
2. Results and discussion
Apart from common plant sugars such as fructose glu-cose, sucrose and raffinose the major water-soluble carbo-hydrates identified using GC–MS in extracts of the rangeof studied species included: the cyclohexanepentolsD-quercitol (Fig. 1a) and L-viburnitol; the cyclohexenetetrolL-leucanthemitol; the O-methylated cyclohexanehexolsD-pinitol (Fig. 1b), L-quebrachitol (Fig. 1c) and D-1-O-methyl-muco-insitol (Fig. 1d) and the cyclohexanehexolsmuco-, chiro-, myo- and scyllo-inositol. Qualitatively, therelatively large abundances of some of these cyclitols wereimmediately obvious from chromatographic output. Usingknown standards, we quantified the abundance of the dom-inant cyclitols.
For eucalypts, all species in all subgenera contained oneor more forms of inositol (Table 1). The ubiquitous myo-inositol was the most widespread form and, in cases witha noted absence, is assumed to be present at concentrationsbelow detection limits.
A most striking result was the complete and consistentabsence of L-leucanthemitol, L-viburnitol and most espe-cially D-quercitol, from the subgenus Eucalyptus. Equallystriking was the abundance of these compounds in somesections of the Symphyomyrtus but absence in others. Forexample, D-quercitol was present in high concentrations(up to 40 mg g�1 dry weight) in Adnataria, Dumaria, Bisec-
tae and Sejunctae but absent in species from the other fiverepresented sections of this subgenus (Table 1). The relativeabundances of cyclitols in the two representatives of thesubgenus Corymbia most resembled patterns establishedfor Eucalyptus although chiro-inositol was absent (seeTable 2).
Fig. 1. Cyclitols isolated in major concentrations from Eucalyptus (a),Acacia (b), Heterodenrum (c) and Callitris (b and d) originating fromcontrasting rainfall regions of Australia. Stereoisomeric conformations areadopted based upon previous suggestions among related tree species.
A. Merchant et al. / Phytochemistry 67 (2006) 402–408 403

Table 2
Quantification of cyclitols among a selection of Australian tree species from low rainfall regions (X = <1 mg g�1, XX = 1–10 mg g�1, XXX = >10 mg g�1 leaf dry weight)
Species Family D1-OMMI D-Pinitol L-Quebrachitol muco-Inositol
chiro-Inositol
scyllo-Inositol
myo-Inositol
Growth habit Ecological distribution Soil type
Acacia baileyana Mimosaceae XXX X X X X Shrub or tree to 10 m Open woodland stoneyundulating country
On granites andporphyries
Acacia elata Mimosaceae XXX X X Tree 7–20 m Coast and tablelands Deep sandy soilsAcacia implexa Mimosaceae XXX X X X Tree 3–15 m Variety of growing
conditionsShallow soilson hills
Acacia mearnsii Mimosaceae XXX X X Erect tree 10–16 m Open forest,woodland ortussock grassland ingullies or on hillsides
Sandy or gravellyclay soils
Acacia melanoxylon Mimosaceae XXX X X Tree 6–45 m Wet sclerophyll forestsand cooler rainforest
Diversity however prefersfertile gullies
Acacia pycnantha Mimosaceae XXX X X Shrub or tree 3–8 m Widespread inland,openscrub and health
Sand or loan
Acacia williamsonii Mimosaceae XXX X X Bushy shrub up to 2 m Open forest and openscrub
Stoney gravel orclay loam
Leptospermum
juniperinum
Myrtaceae X Shrubs or small trees,1–4 mb
Lowland heaths scrubsand forestsb
On poorlydrained soilsb
Leptospermum
laevigatum
Myrtaceae X Shrubs to small tree,2–8 mb
Coastal scrubb Coastal sandsb
Leptospermum
myrsinoides
Myrtaceae X Wiry shrub 0.5–2.5 mb Heath and heathunderstoriesb
On poor,sandy soilsb
Melaleuca
halmaturorum
Myrtaceae X Shrub or small tree,3–8 mb
Coastal and inland saltlakesb
Brackish or muddy salinesitesb
Melaleuca
lanceolata
Myrtaceae X Bushy shrub orsmall tree, 1–8 mb
Closed, coastal scrubsb Sandy, calcareoussoilsb
Melaleuca
uncinata
Myrtaceae X Shrub, sometimes talland multistemmed1–5 mb
Common in scrublandsb Sands and sandyloamsb
Heterodendrum
oleifolium
Sapindaceae XXX X X X Small tree 3–6 mb Widespread on inlandplainsb
Callitris canescens Cupressaceae XXX XXX X X X Small tree orshrub to 6 m
Variety of soils loamy andcalcareous
Callitris columellaris Cupressaceae XXX XXX X X X Tree to 30 m Coastal Deep sandsCallitris drummondii Cupressaceae XXX XXX X X X Shrub to 10 m Coastal Sand over laterite or
subcoastal dunesCallitris endicheri Cupressaceae XXX XXX X X X Tree to 10 m Drier sites and rocky
outcropsbShallow soils androcky sites
Callitris glaucophylla Cupressaceae XXX XXX X X X Tree to 20 m Widespread acrosscontinent
Various substrates,deep sand
Callitris macleayana Cupressaceae XXX XXX X X X Tree to 30 m Subcoastal rainforest andrainforest margins
Poor soils . . . sandy loamsto sandy clay loamsa
Callitris oblonga Cupressaceae XXX XXX X X X Tree or shrub to 5 m Low wet sites SandCallitris presii Cupressaceae XXX XXX X X X Tree or shrub to 20 m Coastal Calcareous sand depositsCallitris rhomboidea Cupressaceae XXX XXX X X X Tree to 15 m Coastal Variety of substrates
Ecological data is compiled from Boland (1992), and from footnotes a and b.a See Costermans (1992).b See Brooker and Kleinig (1996).
404A
.M
ercha
nt
eta
l./
Ph
yto
chem
istry6
7(
20
06
)4
02
–4
08

This is the first time, to our knowledge, that a chemicalor biochemical analysis has been able to simply and clearlyidentify discrete yet taxonomically related groups of euca-lypts on a quantitative basis. Past research using essentialoils has relied on semi-quantitative analysis of many sepa-rate compounds and then has only been able to separategroups of eucalypts on the basis of broad patterns in thecollective presence/absence and abundance of the manyconstituent oils (Li et al., 1995, 1996). In contrast, our evi-dence shows that the species from the subgenus Eucalyptus
Monocalyptus (Pryor and Johnson, 1971) and within sec-tions Maidenaria, Exsertaria, Incognitae, Similares andLatoangulatae differ definitively from those in sections Adn-
ataria, Dumaria and Bisectaria in the presence/absence andabundance of a single compound – D-quercitol. Likewise,within the Symphyomyrtus, species in the section Maidena-
ria differ definitively in the abundance of cyclitols fromthose in the sections Bisectae, Dumaria, Adnataria andSejunctae. These results, whilst still representing less than10% of the total number of eucalypt species, offer a puta-tive but highly significant link among: (1) the evolutionaryresponse of Australian native trees, especially eucalypts, toaridity; (2) the role of metabolites such as D-quercitol asadaptations to aridity; and, (3) taxonomy.
Alternative attempts to delineate taxonomic groups ofthe Eucalyptus genus based upon chemical and biochemicalphysiology have encompassed initial growth rates (Duffet al., 1983), foliar nutrient concentrations (Lambert andTurner, 1983), volatile leaf oils (Li et al., 1995, 1996), respi-ratory metabolism (Anekonda et al., 1999) and combina-tions of these parameters (Noble, 1989). Despite extensiveefforts (see, for example, the more than 20 papers on linksbetween essential oils and eucalypt taxonomy by Dunlopet al. (1999), Li et al. (1995, 1996) and co-workers), thesestudies have failed to identify chemical or biochemicalcharacteristics of eucalypt tissue that adequately explainspecies adaptation to stressful environments. While the dis-tribution of Eucalyptus spp. depends on a variety of fac-tors, the availability of water remains the most likelygeneral predictor for species and specific adaptive traits(e.g., Adams, 1996).
In addition to increased aridity, the genus Eucalyptus
has co-evolved with a general decrease in soil fertility dueto leaching and laterisation and, in places, increased salin-ity (Eldridge et al., 1993). The diversity of Eucalyptus ispartly maintained by restrictions on gene exchange causedby geographic isolation. Intense debate followed the latestclassification of the eucalypt genus, particularly withregard to eucalypt phylogeny. Brooker (2000), based lar-gely on morphological characters, presents a ‘conceptuallyphylogenetic’’ classification of eucalypt species recognisingseven polyphyletic (including the largest subgenera Ango-
phora, Corymbia and Eucalyptus) and five monophyleticsubgenera. On the other hand, molecular analysis (Udovi-cic et al., 1995) based upon nuclear DNA (5s rDNA, spacerregion ITS1, ITS2) and chloroplastic DNA (RFLPs, trnLintron, trnL-F spacer and psbA-trnH spacer) sequence
homologies support the ‘monophyly of eucalypt clades’(Ladiges and Udovicic, 2000) specifically those of Ango-
phora, Corymbia and Eucalyptus. Our chemometric/metab-olite analysis neither accepts nor rejects either classificationbut strongly supports the existence of monophyletic groupsof eucalypts. Our data agrees with the monophyletic cladeproposed by Ladiges (1997) within the subgenus Symphyo-
myrtus. Two mechanistic explanations of the observed pat-terns are worth mentioning. First, the accumulation ofspecific cyclitols in arid-adapted but geographically iso-lated species may be a result of common inheritance froma distant ancestor that gave rise to a monophyletic cladewith the capacity to radiate into more arid regions of thecontinent. Secondly, a viable alternative is that the adapta-tion (quercitol synthesis) arose independently a number oftimes. Bieleski and Briggs (2005) pondered the question asto why cyclitols, that are present at rather large concentra-tions (second only to cellulose in some Proteaceae and, asshown here, in some eucalypts), ‘‘have not been discardedduring evolution’’. We suggest the data presented here lendstrong support to suggestions made by Bieleski and Briggs(2005) and Adams et al. (2005) about the importance ofcyclitols to the ability of native trees to cope with droughtand salinity. The data also support the contention that thepresence and abundance of cyclitols in some eucalypt fam-ilies and sections suggests repeated periods of aridity hadmuch to do with their evolution.
Of the other genera examined, the myrtaceous Melaleuca
and Leptospermum, contained only trace concentrations ofone cyclitol – myo-inositol. In contrast, Acacia species accu-mulated D-pinitol up to 25 mg g�1 dry weight along withdetectable concentrations of chiro-inositol. Equally, all Cal-
litris species contained the O-methylated cyclitols D-pinitol(20 mg g�1dw) and D-1-O-methyl-muco-inositol (15 mg g�1
dry weight). Finally, Heterodendrum oelifolium (Sapinda-
ceae) contained significant concentrations of the methyl-ated cyclitol L-quebrachitol at concentrations up to35 mg g�1 dry weight and chiro-, and myo-inositol at traceconcentrations. In each of the seven species of Acacia, ninespecies of Callitris and Heterodendrum oleifolium the cycli-tols constituted the major portion of extracted water-solu-ble, carbon based osmolytes.
Cyclitol accumulation, and the general abundance inarid environments of species of Acacia, Callitris and Het-
erodendrum, further support the putative link betweencyclitol accumulation and evolutionary adaptation to arid-ity in Australian tree genera. Unlike D-quercitol, cyclitolsfound in these species (D-pinitol, D-1-O-methyl-muco-inosi-tol and L-quebrachitol) are methylated. Methylation ofcyclitols may further increase osmoprotectant capacity by(a) increasing demand for photorespiration products or(b) increasing hydrophobicity and improving plant abilityto stabilise tertiary protein structures (for review see Hareand Cress, 1997). As noted above, concentrations of cycli-tols recorded here have a large influence over cellularosmolarity. Further, D-pinitol and related cyclitols are inert(Paul and Cockburn, 1989; Sheveleva et al., 1997) and do
A. Merchant et al. / Phytochemistry 67 (2006) 402–408 405

not fluctuate greatly in the short-term and the primary roleof cyclitols in these Acacia, Callitris and Heterodendrum
species seems again likely to be that of a stableosmolyte.
Cyclitols have several other demonstrated roles in higherplants apart from being stable osmotica (Nguyen andLamant, 1988; Paul and Cockburn, 1989; Vernon et al.,1993; Popp et al., 1997; Sheveleva et al., 1997; Vera-Estrellaet al., 1999). Cyclitols function in the sequestration ofexcess photochemical energy, in the stabilisation of cellularcomponents (Nguyen and Lamant, 1988; Adams et al.,1998; Klages et al., 1999) and in signalling of stress (Koch,1996; Klages et al., 1999; Nelson et al., 1999). Certainly, theconcentrations of cyclitols found in eucalypts from aridenvironments are sufficient to account for a significant pro-portion of osmotic potential recorded to date in studies ofthe genus (e.g., Clayton-Greene, 1983; Myers and Neales,1986; White et al., 2000).
Unlike previous chemo-taxonomic studies of eucalypts,here we have shown a clear distinction between xeric andmesic eucalypts on the basis of cyclitol concentrations inleaf tissues. The clarity of this distinction is particularlystriking given the background of temporal and environ-mental variation in metabolic processes.
All of the cyclitols identified here have been previouslyidentified in trees. (Plouvier, 1963) first isolated D-quercitolfrom several species including E. obliqua. More recently,Popp et al. (1997) noted accumulation of D-quercitol inQuercus robur and quebrachitol in Acer pseudoplatinus upto 33 mg g�1 dry weight. Crowe et al. (1984) found thatD-pinitol accumulated to up to 30 mg g�1 dry weight inneedles of Pinus sylvestris and L-quebrachitol has beendetected in the family Sapindaceae as well as Hippocastan-
aceae, Myrtaceae, Tiliaceae, Proteaceae and Rutaceae
(Plouvier, 1963; Kindl and Hoffmann-Ostenhof, 1966).There are suggestions in our data that the distribution ofL-quebrachitol within Eucalyptus provides another link toevolution in response to aridity.
Plouviers work suggested common patterns of cyclitolaccumulation in many higher plant species and genera.These are likely related to the presence/absence of spe-cific enzyme systems. The concurrent accumulation ofD-quercitol, viburnitol and leucanthemitol is thought toresult from the direct cyclisation of glucose-6-phosphate.With one known exception in a zannichelliacean seagrass(Drew, 1984), the remainder of the thus far identifiedplant cyclitols arise via the cyclisation of glucose-6-phos-phate to myo-inositol – a process ubiquitous to plant tis-sues. Present knowledge of cyclitol biosynthetic pathwaysin higher plants are largely derived from radioactivelabelling studies (Kindl, 1969; Drew, 1984) and have beencomprehensively reviewed (Anderson and Wolter, 1966;Loewus and Dickinson, 1982; Drew, 1984; Popp et al.,1997). Some cyclitols can be synthesised via multiplepathways (e.g., L-quebrachitol in Acer pseudoplatanus
and Artemisia vulgaris (Schilling et al., 1972)) and thebiosynthetic pathways have been suggested as a basis
for taxonomic division (e.g., Artemisia vulgaris and Arte-
misia dranunculus Drew, 1984).Irrespective of the mechanisms by which cyclitols confer
an adaptation to aridity in Eucalyptus, restricted metabolicprofiling has uncovered a putative link between the accli-mation of trees to arid environments and plant biochemis-try. Elucidation of the physiological roles of cyclitols mayplace them alongside leaf thickness and the regulation ofstomatal aperture as congruent responses of eucalypts toarid environments. In this investigation, we adopted tech-niques that produce accurate, repeatable measurements.This is particularly important in cross-study comparisonsof plant metabolites, given the time- and environment-dependant variability of metabolic processes. Further stud-ies of Australian tree genera using similar approaches willhelp test some of the hypotheses that have been generatedas a result of the present work.
3. Experimental
We selected and sampled a range of Australian tree spe-cies in their natural habitats. In the case of Eucalyptus, weselected species from the differing taxonomic groupsdefined by Brooker (2000) hence we sampled seven speciesfrom the subgenus Eucalyptus (or Monocalyptus), twoCorymbia spp. one Angophora spp. and 28 Symphyomyrtus
spp. We also sampled four Leptospermum spp., two Melal-
euca spp. both of which also belong to the Myrtaceae fam-ily. In addition, we sampled seven Acacia spp. and twoother species of two genera common to arid areas – Calli-
tris and Heterodendrum. At least five replicate trees fromseparate sites were sampled for all sampled species.
3.1. Sample collection
Samples consisted of the first fully expanded (FFE) leafon a terminal branchlet. Due to the intermittent growthspurts that are characteristic of many Australian tree spe-cies, occasionally the samples collected were of growth upto 3 months old. Due to the diversity of growth habit inAustralian tree species, the location within the canopy ofthe collected foliage varied considerably. Similarly, sampleswere collected at different times of the year although pre-dominantly during the spring.
Samples were placed in 15 ml Falconer tubes and trans-ferred immediately to liquid nitrogen. The date and loca-tion of each sample was recorded. Based upon methodsdescribed by Popp et al. (1996) samples were microwaved(30 s, 650 W conventional microwave oven) and then ovendried at 85 �C. Samples were then ground to a powder.
3.2. Extraction procedure
Approximately 40 mg of dried leaf material was weighedinto a 2 ml screw-cap micro-tube. One milliliter of metha-nol/chloroform/water (12:5:3) was added and incubated
406 A. Merchant et al. / Phytochemistry 67 (2006) 402–408

at 80 �C for 30 min. The water fraction of the extractionmixture consisted of a 0.1% solution of internal standard.The internal standard used was 0.1% b-glucopysranosylfor GC–MS analysis and a mixture of 0.1% penta-erythri-tol and 0.1% xylitol for GC analysis.
After cooling, samples were centrifuged (11,400g) and800 ll of the supernatant removed and placed into a clean2 ml round bottomed micro-tube. A further 200 ll chloro-form and 500 ll of deionised water was added to facilitatethe separation of phases. Samples were centrifuged and leftto stand for 15 min to allow phase separation.
Samples were then centrifuged at 11,400g for 3 min and700 ll of the upper phase (the water–methanol soluble frac-tion) transferred to a clean 1.5 ml micro-tube to which300 ll of mixed bed resin (MBR) had already been added.MBR consisted of 1 part Dowex 1 · 8 (50–100 mesh anionexchange resin in the formate form) and 1 part Dowex50 W · 8 (50–100 mesh cation exchange H+ form). Sam-ples were agitated for a period of 2 h at room temperature.Following pulse centrifugation, 400 ll of the supernatantwas transferred to a clean eppendorf tube and stored at�80 �C.
Ion exchange was intensified for GC–MS analysis by theuse of two vertical columns packed with either of the resinsdescribed above. Samples were suspended in approximately50 ml of deionised water and passed through the columnsat a rate of approximately 15 ml per minute. Due to thesubsequent increase in volume, samples were dried andre-suspended in 800 ll of water. The resultant neutral frac-tion was then stored at �86 �C.
3.3. GC and GC–MS analysis
To facilitate phase transition, samples were derivatisedusing a 1:10 mixture of trimethylchlorosilane (TMCS)and bis-trimethylsilyl-triflouroacetamide (BSTFA). Sixtymicroliters of sample solution was dried and resuspendedin 400 ll anhydrous pyridine to which 50 ll of theTMCS/BSTFA (Pierce Chemicals) solution was added.Samples were incubated for 1 h at 75 �C and analysed bygas chromatography within 24 h. To facilitate full peakseparation (hence identification) subsamples were takenfrom original extracts and oxime derivatised with hydrox-ylamine hydrochloride/anhydrous pyridine solution(0.25%). Samples were incubated at 75 �C for 1 h then der-ivatised with 50 ll of TMCS/BSTFA as outlined above.Detection limits for GC analysis were consistently below40 ng which equated to 95 lg in the original extractsolution.
GC–MS analysis was performed using a Varian Saturn 3GC–MS using a DB1 column (0.2 mm id, 50 m, 0.33 lmfilm thickness). Injection was made with an injection porttemperature ramping from 85 to 325 �C in 5 min. Initialoven temperature was at 130 �C for 1.5 min then rampingto 190 �C at 15 �C/min then to 325 �C at 6 �C/min andmaintained for 2 min. MS spectra were compared toknown standards. Non-methylated cyclitol standards were
made from commercially available sources (Sigma). Stan-dards for methylated cyclitols and for D-quercitol, viburn-itol and leucanthemitol were isolated and purified aspreviously described by Wanek and Richter (1995) and Pet-erbauer et al. (1998). GC analysis was performed using aShimadzu 17A Series Gas Chromatograph with a DB1 col-umn (0.25 mm id, 30 m, 0.25 lm film thickness). Split injec-tion was made at 300 �C with an initial oven temperatureprogram of 60 �C for 2 min ramping to 300 �C at 10 �C/min and maintained for 10 min. Column flow rate wasmaintained at 1.5 ml per minute. Peak integration wasmade using Class VP analysis software.
References
Adams, M.A., 1996. Distribution of eucalypts in Australian landscapes:landforms, soils, fire and nutrition. In: Attiwill, P.M., Adams, M.A.(Eds.), Nutrition of Eucalypts. CSIRO, Australia, pp. 61–76.
Adams, M.A., Attiwill, P.M., Wang, L.M., 1995. Effects of phosphorussupply on growth and nitrogen fractions in xylem sap and foliage ofEucalyptus-regnans (Muell, F.), Eucalyptus-nitens (Maiden) and Euca-
lyptus-globulus (Labill) seedlings – implications for herbivory. Trees-Structure and Function 9, 324–331.
Adams, P., Nelson, D.E., Yamada, S., Chmara, W., Jensen, R.G.,Bohnert, H.J., Griffiths, H., 1998. Growth and development ofMesembryanthemum crystallinum (Aizoaceae). New Phytologist 138,171–190.
Adams, M.A., Richter, A., Hill, A.K., Colmer, T.D., 2005. Salt tolerancein Eucalyptus spp.: identity and response of putative osmolytes. Plant,Cell and Environment 28, 772–787.
Anderson, L., Wolter, K.E., 1966. Cyclitols in plants – biochemistry andphysiology. Annual Review of Plant Physiology 17, 209–222.
Anekonda, T.S., Criddle, R.S., Bacca, M., Hansen, L.D., 1999. Contrast-ing adaptation of two Eucalyptus subgenera is related to differences inrespiratory metabolism. Functional Ecology 13, 675–682.
Bieleski, R.L., Briggs, B.G., 2005. Taxonomic patterns in the distributionof polyols within the Proteaceae. Australian Journal of Botany 53,205–217.
Boland, D.J., 1992. Forest Trees of Australia. CSIRO, Melbourne.Brooker, M.I.H., 2000. A new classification of the genus Eucalyptus
L’Her. (Myrtaceae). Australian Systematic Botany 13, 79–148.Brooker, I., Kleinig, D., 1996. Eucalyptus – An Illustrated Guide to
Identification. Reed New Holland, Sydney.Clayton-Greene, K.A., 1983. The tissue water relationships of Callitris
columellaris, Eucalyptus melliodora and Eucalyptus microcarpa inves-tigated using the pressure–volume technique. Oecologia 57, 368–373.
Costermans, L., 1992. Native trees and shrubs of south eastern Australia.Weldon Publishing, Sydney.
Crowe, J.H., Crowe, L.M., Chapman, D., 1984. Preservation of mem-branes in anhydrobiotic organisms – the role of trehalose. Science 223,701–703.
Davidson, N.J., Reid, J.B., 1980. Comparison of the early growthcharacteristics of the Eucalyptus subgenera Monocalyptus and Sym-
phyomyrtus. Australian Journal of Botany 28, 453–461.Drew, D.H., 1984. Physiology and metabolism of cyclitols. In: Lewis,
D.H. (Ed.), Storage Carbohydrates in Vascular Plants. CambridgeUniversity Press, Cambridge, pp. 133–155.
Duff, G.A., Reid, J.B., Jackson, W.D., 1983. The occurrence of mixedstands of the Eucalyptus subgenera Monocalyptus and Symphyomyrtus
in southeastern Tasmania. Australian Journal of Ecology 8, 405–414.Dunlop, P.J., Bignell, C.M., Hibbert, D.B., Brooker, M.I.H., 1998. Use of
gas chromatograms of the essential leaf oils of the genus Eucalyptus fortaxonomic purposes. Part II – species of Eucalyptus series Levispermae,
Curviptera subseries Orbifoliae, Caesiae, Ovulares and subgenusEucalyptus. Australian Journal of Botany 46, 683–696.
A. Merchant et al. / Phytochemistry 67 (2006) 402–408 407

Dunlop, P.J., Bignell, C.M., Brooker, M.I.H., Brophy, J.J., Hibbert, D.B.,1999. Use of gas chromatograms of essential leaf oils to compare eighttaxa of genus Angophora (Myrtaceae): possible relationships to thegenus Eucalyptus. Biochemical Systematics and Ecology 27, 815–830.
Eldridge, K. et al., 1993. Eucalypt Domestication and Breeding. OxfordUniversity Press.
Gill, A.M., Belbin, L., Chippendale, G.M., 1985. Phytogeography ofEucalypts in Australia. Australian Flora and Fauna. Bureau of Floraand Fauna, Canberra.
Gleadow, R.M., Woodrow, I.E., 2002. Defence chemistry of cyanogenicEucalyptus cladocalyx seedlings is affected by water supply. TreePhysiology 22, 939–945.
Goodger, J.Q.D., Woodrow, I.E., 2002. Cyanogenic polymorphism as anindicator of genetic diversity in the rare species Eucalyptus yarraensis
(Myrtaceae). Functional Plant Biology 29, 1445–1452.Hare, P.D., Cress, W.A., 1997. Metabolic implications of stress-induced
proline accumulation in plants. Plant Growth Regulation 21, 79–102.Hasegawa, P.M., Bressan, R.A., Zhu, J.K., Bohnert, H.J., 2000. Plant
cellular and molecular responses to high salinity. Annual Review ofPlant Physiology and Plant Molecular Biology 51, 463–499.
Kindl, H., 1969. Biosynthesis of epimers of myo-inositol, cyclohexane-pentols, cyclohexenetetrols, and C-methyl inositols. Annals of the NewYork Academy of Sciences 165, 615–623.
Kindl, H., Hoffmann-Ostenhof, O., 1966. Cyclite: Biosynthese, Stoffw-echsel und Vorkommen. Fortschritte der Chemie organischer Farbst-offe 24, 313–316.
Klages, K., Boldingh, H., Smith, G.S., 1999. Accumulation of myo-inositol in Actinidia seedlings subjected to salt stress. Annals of Botany84, 521–527.
Koch, K.E., 1996. Carbohydrate modulated gene expression in plants.Annual Review of Plant Physiology and Plant Molecular Biology 47,509–540.
Ladiges, P.Y., 1997. Phylogenetic history and classification of eucalypts.In: Williams, J., Woinarsky, J. (Eds.), Eucalypt Ecology, Individuals toEcosystems. Cambridge University press, Cambridge, pp. 16–29.
Ladiges, P.Y., Udovicic, F., 2000. Comment on a new classification of theeucalypts. Australian Systematic Botany 13, 149–152.
Lambert, M., Turner, J., 1983. Soil nutrient–vegetation relationships inthe Eden area, N.S.W.. Australian Forestry 46, 200–209.
Li, H., Madden, J.L., Potts, B.M., 1995. Variation in volatile leaf oils ofthe Tasmanian Eucalyptus species. 1. Subgenus Monocalyptus. Bio-chemical Systematics and Ecology 23, 299–318.
Li, H., Madden, J.L., Potts, B.M., 1996. Variation in volatile leaf oils ofthe Tasmanian Eucalyptus species. 2. Subgenus Symphyomyrtus.Biochemical Systematics and Ecology 24, 547–569.
Loewus, F.A., Dickinson, D.B., 1982. Cyclitols. In: Loewus, F.A.,Tanner, W. (Eds.), Encyclopaedia of Plant Physiology. Springer-Verlag, Berlin, pp. 193–216.
Myers, B.A., Neales, T.F., 1986. Osmotic adjustment, induced by drought,in seedlings of three Eucalyptus species. Australian Journal of PlantPhysiology 13, 597–603.
Nelson, D.E., Koukoumanos, M., Bohnert, H.J., 1999. Myo-inositol-dependent sodium uptake in ice plant. Plant Physiology 119, 165–172.
Nguyen, A., Lamant, A., 1988. Pinitol and myo-inositol accumulation inwater stressed seedlings of maritime pine. Phytochemistry 27, 3423–3427.
Noble, I.R., 1989. Ecological traits of the Eucalyptus L. herit subgeneraMonocalyptus and Symphyomyrtus. Australian Journal of Botany 37,207–224.
Parsons, R.F., 1969a. Distribution and palaeogeography of 2 Malleespecies of Eucalyptus in southern Australia. Australian Journal ofBotany 17, 323–330.
Parsons, R.F., 1969b. Physiological and ecological tolerances of Eucalyp-
tus incrassata and E. socialis to edaphic factors. Ecology 50, 386–390.Paul, M.J., Cockburn, W., 1989. Pinitol, a compatible solute in Mesem-
bryanthemum crystallinum L? Journal of Experimental Botany 40,1093–1098.
Peterbauer, T., Puschenreiter, M., Richter, A., 1998. Metabolism ofgalactosylononitol in seeds of Vigna umbellata. Plant and CellPhysiology 39, 334–341.
Plouvier, V., 1963. Distribution of aliphatic polyols and cyclitols. In:Swain, T. (Ed.), Chemical Plant Taxonomy. Academic Press, London.
Popp, M., Lied, W., Meyer, A.J., Richter, A., Schiller, P., Schwitte, H.,1996. Sample preservation for determination of organic compounds:microwave vs freeze drying. Journal of Experimental Botany 47, 1469–1473.
Popp, M., Lied, W., Bierbaum, U., Gross, M., Grosse-Schulte, T., Hams,S., Oldenettel, J., Schuler, S., Wiese, J., 1997. Cyclitols – stableosmotica in trees. In: Trees – Contributions to Modern TreePhysiology. Backhuys, Leiden, pp. 257–270.
Pryor, L.D., Johnson, L.A.S., 1971. A Classification of the Eucalypts.Australian National University Press, Canberra.
Schilling, N., Dittrich, P., Kandler, O., 1972. Formation of L-quebrachitolfrom D-bornestiol in leaves of Acer pseudoplatinus. Phytochemistry 11,1401–1404.
Sheveleva, E., Chmara, W., Bohnert, H.J., Jensen, R.G., 1997. Increasedsalt and drought tolerance by D-ononitol production in transgenicNicotiana tabacum L. Plant Physiology 115, 1211–1219.
Trethewey, R.N., 2004. Metabolite profiling as an aid to metabolicengineering in plants. Current Opinion in Plant Biology 7, 196–201.
Tweeddale, H., Notley-McRobb, L., Ferenci, T., 1998. Effect of slowgrowth on metabolism of Escherichia coli, as revealed by globalmetabolite pool (Metabolome) analysis. Journal of Bacteriology 180,5109–5116.
Udovicic, F., McFadden, G.I., Ladiges, P.Y., 1995. Phylogeny ofEucalyptus and Angophora 5S rDNA based on spacer sequence data.Molecular Phylogenetics and Evolution 4, 247–256.
Vera-Estrella, R., Barkla, B.J., Bohnert, H.J., Pantoja, O., 1999. Salt stressin Mesembryanthemum crystallinum L. cell suspensions activatesadaptive mechanisms similar to those observed in the whole plant.Planta 207, 426–435.
Vernon, D.M., Tarczynski, M.C., Jensen, R.G., Bohnert, H.J., 1993.Cyclitol production in transgenic tobacco. Plant Journal 4, 199–205.
Wanek, W., Richter, A., 1995. Purification and characterization of myo-inositol 6-O-methyltransferase from Vigna umbellata Ohwi Et Ohashi.Planta 197, 427–434.
Weckwerth, W., 2003. Metabolomics in systems biology. Annual Reviewof Plant Biology 54, 669–689.
White, D.A., Turner, N.C., Galbraith, J.H., 2000. Leaf water relationsand stomatal behavior of four allopatric Eucalyptus species planted inMediterranean southwestern Australia. Tree Physiology 20, 1157–1165.
408 A. Merchant et al. / Phytochemistry 67 (2006) 402–408

Altitudinal variation of secondary metabolite profiles in floweringheads of Arnica montana cv. ARBO
Renate Spitaler a, P. Daniel Schlorhaufer b, Ernst P. Ellmerer c, Irmgard Merfort d,Sigmar Bortenschlager b, Hermann Stuppner a, Christian Zidorn a,*
a Institut fur Pharmazie, Abteilung Pharmakognosie, Universitat Innsbruck, Innrain 52, A-6020 Innsbruck, Austriab Institut fur Botanik, Universitat Innsbruck, Sternwartestraße 15, A-6020 Innsbruck, Austria
c Institut fur Organische Chemie, Universitat Innsbruck, Innrain 52, A-6020 Innsbruck, Austriad Institut fur Pharmazeutische Wissenschaften, Lehrstuhl fur Pharmazeutische Biologie und Biotechnologie,
Universitat Freiburg, Stefan-Meier-Str. 19, D-79104 Freiburg, Germany
Received 25 July 2005; received in revised form 16 November 2005Available online 6 January 2006
Abstract
The altitudinal variation on the contents of secondary metabolites in flowering heads of Arnica montana was assessed. Plants of A.
montana cultivar ARBO were grown in nine experimental plots at altitudes between 590 and 2230 m at Mount Patscherkofel near Inns-bruck/Austria. The total contents of sesquiterpene lactones and flavonoids were not positively correlated with the altitude of the growingsite. However, the proportion of flavonoids with vicinal free hydroxy groups in ring B to flavonoids lacking this feature significantlyincreased with elevation. Additionally, the level of caffeic acid derivatives also positively correlated with the altitude of the growing site.In particular amounts of 1-methoxyoxaloyl-3,5-dicaffeoylquinic acid significantly increased in higher sites and samples from the summitregion contained 85% more of this compound than samples from valley sites. These results are discussed with regards to chemosystematicstudies comparing samples collected in different altitudes as well as in the light of a UV-B protective and radical scavenging function ofphenolics and their significance for plant life in environments with elevated UV-B radiation.� 2005 Elsevier Ltd. All rights reserved.
Keywords: Arnica montana; Altitudinal effects; Chemical ecology; Phenolics; Caffeic acid esters; Sesquiterpene lactones; Natural products; UV radiation
1. Introduction
Various factors, such as age of the plant, season, micro-bial attack, grazing, radiation, competition, and nutritionalstatus, have been proven to have an impact on the second-ary metabolite profile in higher plants (Harborne, 1982). Afactor rarely assessed is the altitude of the growing site.Many environmental factors like precipitation, mean tem-perature, soil, wind speed, low and high temperatureextremes, duration of snow-cover, length of the vegetation
period, and the intensity of radiation under clear sky con-ditions have been reported to differ between low and highaltitude sites in temperate zones (Korner, 1999). Fromthese variables, the higher solar radiation at higher alti-tudes has been most intensely discussed to have an impacton secondary metabolite profiles in higher plants (Korner,1999). An increase of irradiance under clear sky conditionsin the summer has been demonstrated for the EuropeanAlps. Blumthaler et al. (1997) found an increase of 8%for total irradiance, an increase of 9% for UV-A radiation,and an increase of 18% for erythemal effective radiation per1000 m of altitude. A negative impact of the enhancedUV-B radiation on plant life at higher altitudes is generallyassumed and an increase of the contents of phenolic
0031-9422/$ - see front matter � 2005 Elsevier Ltd. All rights reserved.
doi:10.1016/j.phytochem.2005.11.018
* Corresponding author. Tel.: +43 0 512 5075302; fax: +43 0 5125072939.
E-mail address: [email protected] (C. Zidorn).
www.elsevier.com/locate/phytochem
Phytochemistry 67 (2006) 409–417
PHYTOCHEMISTRY

compounds and carotenoids with rising altitude has beenpostulated as a response to increasing UV radiation(Korner, 1999). In particular, phenolics are considered topossess an UV-B protective function for the plants produc-ing them, because flavonoids as well as caffeic acid deriva-tives are potent UV-B-absorbing compounds. Theinduction of enzymes involved in the biosynthesis of flavo-noids under experimentally enhanced UV radiation is wellestablished (Wellmann, 1975; Jaakola and Maatta-Riihi-nen, 2004). The role of phenolics in protecting plants frompeak UV-B exposure might not be limited to UV-B screen-ing (Markham et al., 1998b). Indeed observed changes inratios between different types of flavonoids (ortho-dihydr-oxylated versus other flavonoids) indicate that the radicalscavenging potential of ortho-dihydroxylated flavonoidslike luteolin is also contributing to the UV-B protectiveactivity (Markham et al., 1998a). For leaves of differentplant species a positive correlation of the total flavonoidcontent with enhanced UV-B radiation is well documentedunder greenhouse conditions (Tevini et al., 1981; Cuadraet al., 1997; Wilson et al., 1998; Wulff et al., 1999), and evenfor plants grown in cell suspension culture (Min-Soo et al.,1998).
However, it remains unclear whether elevated peak UV-radiation under clear sky conditions at higher altitude siteshas an effect on plant secondary metabolism under naturalconditions. Moreover, all studies performed up to nowinvestigating plants at different altitudes were performedon wild populations and are not conclusive whether theobserved variations are a response of individual plants toenvironmental factors related to altitude or a genetic adap-tation of the populations growing at different altitudes totheir specific environment (McDougal and Parks, 1984;Polle et al., 1992; Veit et al., 1996; Bachereau et al., 1998;Ruhland and Day, 2000, 2001; Zidorn and Stuppner,2001a; Zidorn et al., 2005b).
The present study addresses these questions by a phyto-chemical investigation of flowering heads from geneticallyhomogenous populations of Arnica montana cv. ARBO,which have been grown in nine different sites at Mount Pat-scherkofel near Innsbruck/Tyrol/Austria. Previous chemo-systematic investigations in different genera of theAsteraceae (Zidorn and Stuppner, 2001a,b; Zidorn et al.,2002, 2005b) showed that flowering heads are best suitedfor quantitative comparative phytochemical investigations,because flowering heads are least affected by seasonal vari-ations of secondary metabolite contents (Zidorn and Stu-ppner, 2001a).
The HPLC/DAD and HPLC/MS results from floweringheads of A. montana cv. ARBO reported in the followingcommunication are demonstrating a significant increaseof the concentration of phenolic acids (caffeic acid deriva-tives) and of the ratio of ortho-dihydroxylated versus otherflavonoids with elevated altitude. This indicates that bio-syntheses of certain phenolics are indeed induced by ele-vated peak UV-B radiation occurring at higher altitudesites under natural conditions.
2. Results
2.1. Compound identification
Plants of A. montana were successfully cultivated in ninedifferent altitudes in Innsbruck, Gotzens, and at MountPatscherkofel near Innsbruck (Table S1). Flowering headswere collected from all experimental sites in the second yearof the trial and investigated for their contents of sesquiterp-enoids and phenolics (Table 1).
Peaks were characterized by retention times, UV, andMS spectra. Sesquiterpene lactones were numbered fromS1 to S14 with increasing HPLC retention times; fullnames of these and all other compounds investigated aregiven in Table 2. The identity of the sesquiterpene lactoneswas assigned according to Seeber (1996) and Seeber et al.(1997).
Phenolics were grouped into flavonoids (F) and caffeicacid derivatives (phenolic acids, P) based on their charac-teristic UV spectra (F: a broad maximum at 350 nm, P: amaximum at 330 nm with a shoulder at 295 nm). Peaksassignable to flavonoids (F1–F6) and phenolic acids(P1–P9) were also numbered consecutively with increasingHPLC retention times. Compounds F1–F6 as well asminor compounds (<1.00 mg/g in all investigated sam-ples) chrysoeriol (CHR) and pectolinarigenin (PCT) wereidentified with authentic reference compounds isolatedfrom A. montana in previous studies (Merfort, 1984,1985, 1992; Merfort and Wendisch, 1987, 1988, 1992;Ebert et al., 1988). Caffeic acid derivatives P1 (chloro-genic acid, Roth, Karlsruhe, Germany) and P4 [3,5-dica-ffeoylquinic acid, isolated from Leontodon hispidus L.(Zidorn and Stuppner, 2001b)] were also identified usingreference compounds. P5 was isolated and identified as1-methoxyoxaloyl-3,5-dicaffeoylquinic acid as describedbelow. The other caffeic acid derivatives (P2–P3, P6–P9)were characterized by their retention times and MS dataonly (see Section 4).
Table 1Overview about total amounts (mg/g) of flavonoids (F), caffeic acidderivatives (P), and sesquiterpene lactones (S) in flowering heads of A.
montana cv. ARBO grown in different altitudesa
Site RF1–F6 RP1–P9 RS1–S14
x sx x sx x sx
1 19.88 3.51 28.10 1.52 9.81 0.392 22.42 0.82 33.55 2.38 7.96 0.913 17.80 3.23 31.92 0.32 11.04 0.134 21.30 2.34 33.74 4.78 8.81 2.195 23.45 1.21 30.41 0.79 12.95 1.216 20.70 0.27 38.01 5.01 11.37 1.227 21.53 1.58 32.81 4.76 11.75 1.758 18.26 1.48 31.33 2.73 10.53 0.599 17.39 1.40 38.03 3.77 9.81 0.28
a A detailed table with quantification results for each particular com-pound is available in the Supplementary material (Tables S2–S5).
410 R. Spitaler et al. / Phytochemistry 67 (2006) 409–417

2.2. Structure elucidation of 1-methoxyoxaloyl-3,5-
dicaffeoylquinic acid (P5)
Compound P5 was isolated from the methanolic extractof commercially available plant material of A. montana bypartitioning of the methanolic extract, which was re-dis-solved in a mixture of MeOH and H2O (1/1, v/v) withCH2Cl2 and BuOH and successive Sephadex LH-20 columnchromatography (CC) of the BuOH layer. HRFABMS spec-tra of compound P5 in the negative mode yielded a signal atm/z = 601.1245 [M � H]� (m/z calculated for C28H25O15 =601.1188) indicative for a molecular formula of C28H26O15.An ESIMS experiment in the negative mode showed besidesa [M � H]� signal at m/z = 601 the following major frag-ments: m/z = 557 [M � COOH]�, m/z = 515 [M �COCOOCH3]�, m/z = 439 [M � caffeoyl]�, m/z = 395[M � caffeoyl � COOH]�, and m/z = 353 [M � caffeoyl �COCOOCH3]�.
1H NMR, 13C NMR in combination with HHCOSY,HSQC, and HMBC experiments measured in MeOH-d4
showed that compound P5 was a quinic acid derivative,which had two caffeoyl moieties and an additional acylmoiety as substituents. Acylation of the hydroxy group inposition 1 was proven by the pronounced downfield shiftof C-1 of the quinic acid moiety in comparison with the lit-erature data for 1,3,5-triacylquinic acid derivatives (Agataet al., 1993; Zidorn et al., 2005a) and quinic acid deriva-tives lacking an acyl moiety in position 1 (Cheminatet al., 1988). Acylations of positions 3 and 5 of the quinicacid moiety were evidenced by the pronounced downfieldshift of the signals assignable to the protons geminal tothe respective hydroxy groups (dH-3 = 5.52 ppm, dH-5 =5.44 ppm) and by the fact that the signal assignable theproton geminal to the unsubstituted hydroxy group (H-4,dH-4 = 3.96 ppm) showed HHCOSY correlations to boththe signal of H-3 and the signal of H-5. These two acyl moi-eties in positions 3 and 5 were identified as caffeoyl moietiesby HMBC crosspeaks from the signals assignable to H-3and H-5 to the carbonyl groups of the caffeic acid moietiesas well as by HMBC crosspeaks from signals assignableto protons H-700/H-7000 and H-800/H-8000 of the caffeic acidmoieties to these carbonyl signals.
However, the substituent in position 1, which accordingto MS data had a molecular mass of 87 units was only rep-resented by two further carbonyl signals (dC-10 ¼ 168:2 ppm,dC-20 ¼ 168:0 ppm). These data were interpretable only ifan exchange of 1H to 2H from the solvent deuteromethanolor an exchange of an OCH3 moiety against an OCD3 moi-ety were supposed. Experiments to reverse the exchangefailed. Therefore, a small amount of P5 was re-isolatedand analyzed by NMR using the aprotic solvent DMSO-d6. Results obtained from 1H NMR and phase sensitiveHSQC experiments indicated the presence of a methoxygroup (dH = 3.73 ppm, dC = 55.8 ppm), which was missingin the spectra recorded in MeOH-d4. Conclusively, com-pound P5 is 1-methoxyoxaloyl-3,5-dicaffeoylquinic acid(Fig. 1). This compound has formerly been reported onlyas a natural product from Achyrocline satureioides DC.(Asteraceae, Gnaphalieae) (Robinson et al., 1996). Interest-ingly, these authors, who also recorded their NMR spectrain MeOH-d4 obviously also failed to obtain signals for theproposed methoxy moiety (Robinson et al., 1996). Besidesthat NMR data for P5 in MeOH-d4 are reported onlypartially in Robinson et al. (1996). Therefore, NMR datameasured in MeOH-d4 and DMSO-d6 are summarized inthe experimental part (Section 4.6).
2.3. HPLC quantification results
HPLC investigations (Fig. S5) of the total contents ofsesquiterpene lactones showed no significant correlationwith the altitude of the growing site (Fig. 2). Amounts ofparticular sesquiterpene lactones also showed no correla-tion with the altitude of the growing site (Table 2) exceptfor dihydrohelenalin (S1), which showed a highly signifi-
Table 2Correlations of the contents of A. montana secondary metabolites with thealtitude of the growing site
Common name Abbreviation r p
Quercetin 3-O-b-D-glucosid F1 0.247 0.224Patuletin 3-O-b-D-glucosid F2 0.162 0.430Kaempferol 3-O-b-D-glucosid F3 �0.534 0.005Kaempferol 3-O-b-D-glucuronid F4 �0.219 0.2826-Methoxykaempferol
3-O-b-D-glucosidF5 �0.157 0.444
Hispidulin F6 0.113 0.581
Sum of flavonoids F1–F6 RF1–F6 �0.067 0.746
Chlorogenic acid P1 �0.209 0.307Unknown hydroxycinnamate ester P2 �0.017 0.935Unknown hydroxycinnamate ester P3 �0.218 0.2843,5-Dicaffeoylquinic acid P4 0.102 0.6211-Methoxyoxaloyl-3,5-
dicaffeoylquinic acidP5 0.705 0.000
4,5-Dicaffeoylquinic acid P6 0.338 0.091Unknown hydroxycinnamate ester P7 0.544 0.004Unknown hydroxycinnamate ester P8 0.449 0.021Unknown hydroxycinnamate ester P9 0.628 0.001
Sum of caffeic acidderivatives P1–P9
RP1–P9 0.422 0.032
Dihydrohelenalin S1 �0.738 0.000Helenalin S2 0.074 0.721Acetyl-dihydrohelenalin S3 0.067 0.746Acetyl-helenalin S4 0.225 0.268Methacryloyl-dihydrohelenalin S5 0.255 0.210Methacryloyl-helenalin/isobutyryl-
dihydrohelenalinS6/S7a 0.295 0.143
Isobutyryl-helenalin S8 0.082 0.691Tigloyl-dihydrohelenalin S9 0.143 0.485Tigloyl-helenalin S10 0.379 0.0562-Methylbutyryl-dihydrohelenalin S11 0.110 0.593Isovaleryl-dihydrohelenalin S12 0.150 0.4632-Methylbutyryl-helenalin S13 0.105 0.611Isovaleryl-helenalin S14 0.240 0.237
Sum of sesquiterpene lactones S1–S14 RS1–S14 0.298 0.139
a These two compounds were not separable by HPLC using theemployed analytical system.
R. Spitaler et al. / Phytochemistry 67 (2006) 409–417 411

cant decrease with altitude [r = �0.738 (0.000)]. This resultis hard to interpret and might be of limited relevance asdihydrohelenalin is one of the minor sesquiterpene lactonesin flowering heads of A. montana occurring in negligibleamounts only (0.03–0.08 mg/g, Table S4).
HPLC analyses (Fig. S4) of the total contents of flavo-noids also revealed no positive correlation with the altitudeof the growing site (Fig. 3, Table 2). A closer inspection ofthe HPLC data revealed that the ratio of flavonoids with a3 0,4 0-dihydroxylation pattern in ring B to flavonoids lack-ing this feature [(F1 + F2)/(F3 + F4 + F5 + F6)] showed ahighly significant increase with the altitude of the growingsite (Fig. 4; Table 2).
Finally, the correlation of the contents of caffeic acidderivatives was investigated. The total contents of com-pounds P1–P9 showed a significantly positive correlationwith the altitude of the growing site (Fig. 5; Table 2).The regression equation obtained for the content of caffeicacid derivatives in dependence of the altitude of the exper-imental plot was R(P1–P9) (mg/g) = 28.2 + 0.00342 * alti-tude (m). Thus, an increase of approximately 10% of the
total of caffeic acid derivatives is to be expected at an alti-tude of 2000 m above mean sea level (a.m.s.l.) as comparedto 1000 m a.m.s.l. In contrast to the total of compoundsP1–P9, the contents of compounds P1, P2, P3, and P4
showed no significant increase with altitude (p > 0.100).On the other hand, the content of compound P6 showeda weak (r < 0.4) weakly significant (r < 0.100) positive cor-relation and contents of compounds P5, P7, P8, and P9
showed medium (0.4 < r < 0.6) to pronounced (0.6 < r <0.8) significant (p < 0.050) to highly significant (p < 0.010)positive correlations to the altitude of the growing site.The content of 1-methoxyoxaloyl-3,5-dicaffeoylquinic acid(P5) was most pronouncedly correlated to the altitude of
O
OHO
O
O
OHO
O
O
OO
OH
OH
OHOH
Fig. 1. Structure of 1-methoxyoxaloyl-3,5-dicaffeoylquinic acid from A.
montana.
25002000150010005000
18
16
14
12
10
8
6
4
2
0
altitude (m)
S (
mg/
g)
Fig. 2. Correlation of the altitude of the growing site and the total contentof sesquiterpenoids (mg/g) in flowering heads of A. montana. Each dotrepresents one analyzed batch. Correlation r = 0.298 (0.139).
0 500 1000 1500 2000 2500
0
10
20
30
altitude (m)
F (
mg/
g)
Fig. 3. Correlation of the altitude of the growing site and the total contentof flavonoids (mg/g) in flowering heads of A. montana. Each dot representsone analyzed batch. Correlation r = �0.067 (0.746).
25002000150010005000
2
1
0
altitude (m)
Q/K
Fig. 4. Correlation of the altitude of the growing site and the quotient ofortho-dihydroxy-substituted flavonoids to other flavonoids {Q/K =[(F1 + F2)/(F3 + F4 + F5 + F6)]} in flowering heads of A. montana. Eachdot represents one analyzed batch. Correlation r = 0.607 (0.001). Regres-sion equation (3 0,4 0-dihydroxyflavonoids)/(other flavonoids) = 1.03 +0.000291 * altitude (m).
412 R. Spitaler et al. / Phytochemistry 67 (2006) 409–417
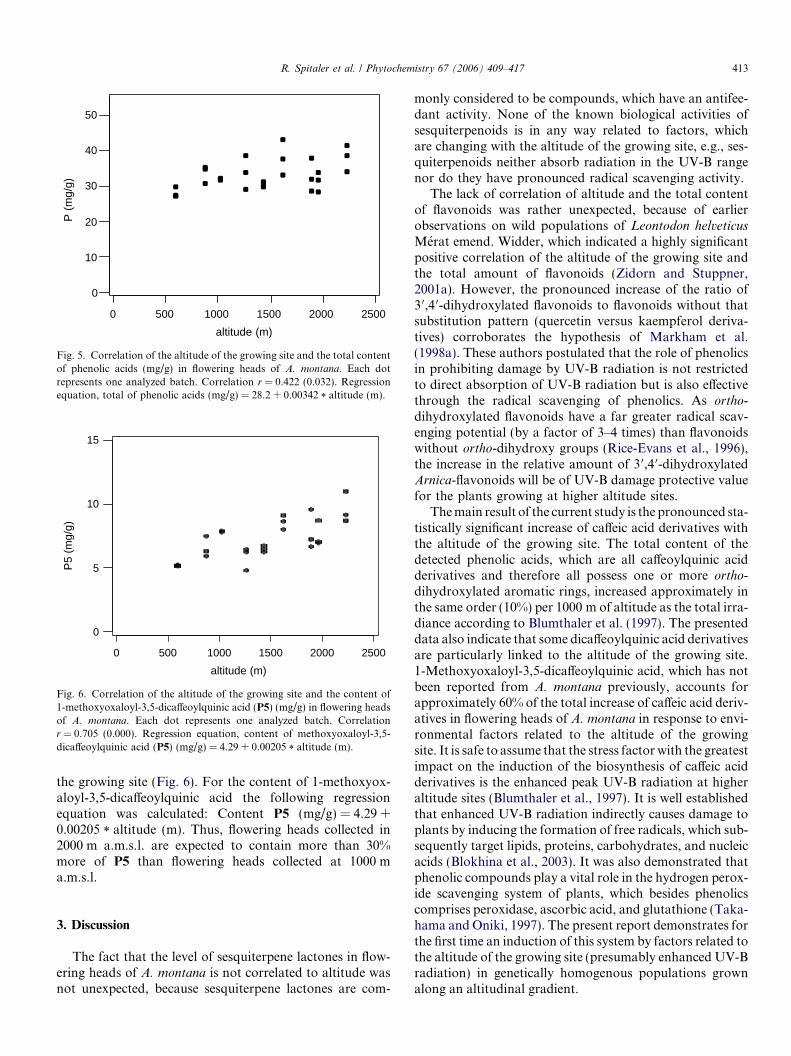
the growing site (Fig. 6). For the content of 1-methoxyox-aloyl-3,5-dicaffeoylquinic acid the following regressionequation was calculated: Content P5 (mg/g) = 4.29 +0.00205 * altitude (m). Thus, flowering heads collected in2000 m a.m.s.l. are expected to contain more than 30%more of P5 than flowering heads collected at 1000 ma.m.s.l.
3. Discussion
The fact that the level of sesquiterpene lactones in flow-ering heads of A. montana is not correlated to altitude wasnot unexpected, because sesquiterpene lactones are com-
monly considered to be compounds, which have an antifee-dant activity. None of the known biological activities ofsesquiterpenoids is in any way related to factors, whichare changing with the altitude of the growing site, e.g., ses-quiterpenoids neither absorb radiation in the UV-B rangenor do they have pronounced radical scavenging activity.
The lack of correlation of altitude and the total contentof flavonoids was rather unexpected, because of earlierobservations on wild populations of Leontodon helveticus
Merat emend. Widder, which indicated a highly significantpositive correlation of the altitude of the growing site andthe total amount of flavonoids (Zidorn and Stuppner,2001a). However, the pronounced increase of the ratio of3 0,4 0-dihydroxylated flavonoids to flavonoids without thatsubstitution pattern (quercetin versus kaempferol deriva-tives) corroborates the hypothesis of Markham et al.(1998a). These authors postulated that the role of phenolicsin prohibiting damage by UV-B radiation is not restrictedto direct absorption of UV-B radiation but is also effectivethrough the radical scavenging of phenolics. As ortho-dihydroxylated flavonoids have a far greater radical scav-enging potential (by a factor of 3–4 times) than flavonoidswithout ortho-dihydroxy groups (Rice-Evans et al., 1996),the increase in the relative amount of 3 0,4 0-dihydroxylatedArnica-flavonoids will be of UV-B damage protective valuefor the plants growing at higher altitude sites.
The main result of the current study is the pronounced sta-tistically significant increase of caffeic acid derivatives withthe altitude of the growing site. The total content of thedetected phenolic acids, which are all caffeoylquinic acidderivatives and therefore all possess one or more ortho-dihydroxylated aromatic rings, increased approximately inthe same order (10%) per 1000 m of altitude as the total irra-diance according to Blumthaler et al. (1997). The presenteddata also indicate that some dicaffeoylquinic acid derivativesare particularly linked to the altitude of the growing site.1-Methoxyoxaloyl-3,5-dicaffeoylquinic acid, which has notbeen reported from A. montana previously, accounts forapproximately 60% of the total increase of caffeic acid deriv-atives in flowering heads of A. montana in response to envi-ronmental factors related to the altitude of the growingsite. It is safe to assume that the stress factor with the greatestimpact on the induction of the biosynthesis of caffeic acidderivatives is the enhanced peak UV-B radiation at higheraltitude sites (Blumthaler et al., 1997). It is well establishedthat enhanced UV-B radiation indirectly causes damage toplants by inducing the formation of free radicals, which sub-sequently target lipids, proteins, carbohydrates, and nucleicacids (Blokhina et al., 2003). It was also demonstrated thatphenolic compounds play a vital role in the hydrogen perox-ide scavenging system of plants, which besides phenolicscomprises peroxidase, ascorbic acid, and glutathione (Taka-hama and Oniki, 1997). The present report demonstrates forthe first time an induction of this system by factors related tothe altitude of the growing site (presumably enhanced UV-Bradiation) in genetically homogenous populations grownalong an altitudinal gradient.
0 500 1000 1500 2000 2500
0
10
20
30
40
50
altitude (m)
P (
mg/
g)
Fig. 5. Correlation of the altitude of the growing site and the total contentof phenolic acids (mg/g) in flowering heads of A. montana. Each dotrepresents one analyzed batch. Correlation r = 0.422 (0.032). Regressionequation, total of phenolic acids (mg/g) = 28.2 + 0.00342 * altitude (m).
0 500 1000 1500 2000 2500
0
5
10
15
altitude (m)
P5
(mg/
g)
Fig. 6. Correlation of the altitude of the growing site and the content of1-methoxyoxaloyl-3,5-dicaffeoylquinic acid (P5) (mg/g) in flowering headsof A. montana. Each dot represents one analyzed batch. Correlationr = 0.705 (0.000). Regression equation, content of methoxyoxaloyl-3,5-dicaffeoylquinic acid (P5) (mg/g) = 4.29 + 0.00205 * altitude (m).
R. Spitaler et al. / Phytochemistry 67 (2006) 409–417 413
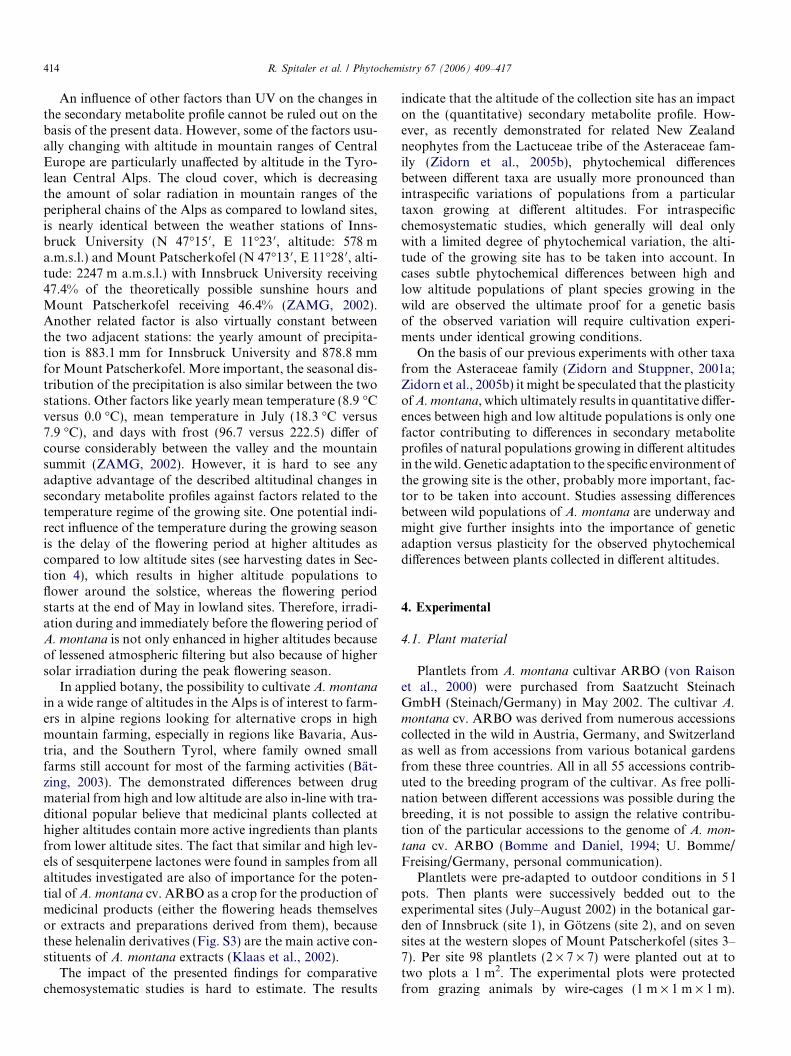
An influence of other factors than UV on the changes inthe secondary metabolite profile cannot be ruled out on thebasis of the present data. However, some of the factors usu-ally changing with altitude in mountain ranges of CentralEurope are particularly unaffected by altitude in the Tyro-lean Central Alps. The cloud cover, which is decreasingthe amount of solar radiation in mountain ranges of theperipheral chains of the Alps as compared to lowland sites,is nearly identical between the weather stations of Inns-bruck University (N 47�15 0, E 11�23 0, altitude: 578 ma.m.s.l.) and Mount Patscherkofel (N 47�13 0, E 11�28 0, alti-tude: 2247 m a.m.s.l.) with Innsbruck University receiving47.4% of the theoretically possible sunshine hours andMount Patscherkofel receiving 46.4% (ZAMG, 2002).Another related factor is also virtually constant betweenthe two adjacent stations: the yearly amount of precipita-tion is 883.1 mm for Innsbruck University and 878.8 mmfor Mount Patscherkofel. More important, the seasonal dis-tribution of the precipitation is also similar between the twostations. Other factors like yearly mean temperature (8.9 �Cversus 0.0 �C), mean temperature in July (18.3 �C versus7.9 �C), and days with frost (96.7 versus 222.5) differ ofcourse considerably between the valley and the mountainsummit (ZAMG, 2002). However, it is hard to see anyadaptive advantage of the described altitudinal changes insecondary metabolite profiles against factors related to thetemperature regime of the growing site. One potential indi-rect influence of the temperature during the growing seasonis the delay of the flowering period at higher altitudes ascompared to low altitude sites (see harvesting dates in Sec-tion 4), which results in higher altitude populations toflower around the solstice, whereas the flowering periodstarts at the end of May in lowland sites. Therefore, irradi-ation during and immediately before the flowering period ofA. montana is not only enhanced in higher altitudes becauseof lessened atmospheric filtering but also because of highersolar irradiation during the peak flowering season.
In applied botany, the possibility to cultivate A. montanain a wide range of altitudes in the Alps is of interest to farm-ers in alpine regions looking for alternative crops in highmountain farming, especially in regions like Bavaria, Aus-tria, and the Southern Tyrol, where family owned smallfarms still account for most of the farming activities (Bat-zing, 2003). The demonstrated differences between drugmaterial from high and low altitude are also in-line with tra-ditional popular believe that medicinal plants collected athigher altitudes contain more active ingredients than plantsfrom lower altitude sites. The fact that similar and high lev-els of sesquiterpene lactones were found in samples from allaltitudes investigated are also of importance for the poten-tial of A. montana cv. ARBO as a crop for the production ofmedicinal products (either the flowering heads themselvesor extracts and preparations derived from them), becausethese helenalin derivatives (Fig. S3) are the main active con-stituents of A. montana extracts (Klaas et al., 2002).
The impact of the presented findings for comparativechemosystematic studies is hard to estimate. The results
indicate that the altitude of the collection site has an impacton the (quantitative) secondary metabolite profile. How-ever, as recently demonstrated for related New Zealandneophytes from the Lactuceae tribe of the Asteraceae fam-ily (Zidorn et al., 2005b), phytochemical differencesbetween different taxa are usually more pronounced thanintraspecific variations of populations from a particulartaxon growing at different altitudes. For intraspecificchemosystematic studies, which generally will deal onlywith a limited degree of phytochemical variation, the alti-tude of the growing site has to be taken into account. Incases subtle phytochemical differences between high andlow altitude populations of plant species growing in thewild are observed the ultimate proof for a genetic basisof the observed variation will require cultivation experi-ments under identical growing conditions.
On the basis of our previous experiments with other taxafrom the Asteraceae family (Zidorn and Stuppner, 2001a;Zidorn et al., 2005b) it might be speculated that the plasticityof A. montana, which ultimately results in quantitative differ-ences between high and low altitude populations is only onefactor contributing to differences in secondary metaboliteprofiles of natural populations growing in different altitudesin the wild. Genetic adaptation to the specific environment ofthe growing site is the other, probably more important, fac-tor to be taken into account. Studies assessing differencesbetween wild populations of A. montana are underway andmight give further insights into the importance of geneticadaption versus plasticity for the observed phytochemicaldifferences between plants collected in different altitudes.
4. Experimental
4.1. Plant material
Plantlets from A. montana cultivar ARBO (von Raisonet al., 2000) were purchased from Saatzucht SteinachGmbH (Steinach/Germany) in May 2002. The cultivar A.
montana cv. ARBO was derived from numerous accessionscollected in the wild in Austria, Germany, and Switzerlandas well as from accessions from various botanical gardensfrom these three countries. All in all 55 accessions contrib-uted to the breeding program of the cultivar. As free polli-nation between different accessions was possible during thebreeding, it is not possible to assign the relative contribu-tion of the particular accessions to the genome of A. mon-
tana cv. ARBO (Bomme and Daniel, 1994; U. Bomme/Freising/Germany, personal communication).
Plantlets were pre-adapted to outdoor conditions in 5 lpots. Then plants were successively bedded out to theexperimental sites (July–August 2002) in the botanical gar-den of Innsbruck (site 1), in Gotzens (site 2), and on sevensites at the western slopes of Mount Patscherkofel (sites 3–7). Per site 98 plantlets (2 · 7 · 7) were planted out at totwo plots a 1 m2. The experimental plots were protectedfrom grazing animals by wire-cages (1 m · 1 m · 1 m).
414 R. Spitaler et al. / Phytochemistry 67 (2006) 409–417

The exact locations of the nine experimental sites are givenin Table S1. Flowering heads were collected during thepeak of the flowering season 2003. In detail, floweringheads were collected on May 26th (sites 1 and 2), June2nd (site 3), June 12th (sites 3 and 4), June 17th (sites 4,6, and 7), June 25th (sites 5, 6, and 8), July 1st (sites 6and 8), July 8th (sites 8 and 9), July 15th (site 9), and July22nd (site 9). To exclude ontogenetic differences, only flow-ering heads with at least two rows of flowering ray floretswere collected (Douglas et al., 2004). Terminal floweringheads of each stem were collected separately from lateralcapitula. For the investigations reported in this communi-cation only terminal flowering heads were analyzed,though analyses of three batches of terminal and lateralflowering heads of site 7 showed no significant differences(data not shown). Flowering heads were collected inbatches of twelve, air-dried and afterwards kept at�20 �C until analysis. For each site three batches of flow-ering heads were collected and analyzed separately.
4.2. Extract preparation
Each batch of twelve air-dried flowering heads wasground and divided into two parts. One was used for thequantification of the sesquiterpene lactones, the other forthe analysis of flavonoids and phenolic acids. Extractionfor the analysis of sesquiterpene lactones was performedusing a modification of the system described by Douglaset al. (2004) but using CH2Cl2 instead of CHCl3 for extrac-tion. In detail, to 500.0 mg ground plant material 5 ml of astock solution containing 0.200 mg/ml of the internal stan-dard santonin and 15 ml CH2Cl2 were added and the mix-ture was sonicated for 10 min. The sample was thenfiltered, rinsed (3 · 2 ml CH2Cl2), evaporated to dryness,re-suspended in MeOH (1 ml), and placed on a C18 solidphase extraction column (Chromabond, Merck, Darms-tadt, Germany) pre-wet with 3/2 MeOH/H2O (3 ml). Thesample flask and column were then rinsed (3/2 MeOH/H2O, 1 ml). The column was allowed to drain dry andthe combined eluants were cooled at �20 �C (30 min), fil-tered ready for analytical HPLC. Comparisons withextracts made with CHCl3 and experiments using a highernumber of ultra sonication cycles and longer times of son-ication showed that the chosen approach resulted in anexhaustive extraction (extraction rate of >98%).
Extraction for the analysis of phenolics was performedusing the procedure described by Zidorn et al. (2005b).After adding 2.5 mg of the internal standard compoundcynarin as a stock solution in MeOH, (CH3)2CO, andH2O (3/1/1, v/v/v), ground flowering heads (500.0 mg)were sonicated twice for 30 min with a mixture of MeOH,(CH3)2CO, and H2O (3/1/1, v/v/v) and once for 30 minwith a mixture of MeOH and H2O (1/1, v/v) (total extrac-tion volume 25 ml for each cycle). The extract were filtered,the remaining plant material rinsed with 20 ml of a mixtureof MeOH, (CH3)2CO, and H2O (3/1/1, v/v/v) and the com-bined extracts were filled up to 100.0 ml with a mixture of
MeOH, (CH3)2CO, and H2O (3/1/1, v/v/v); 10.0 ml of thissolution were brought to dryness in vacuo and re-dissolvedin 2.00 ml of a mixture of MeOH, (CH3)2CO, and H2O(3/1/1, v/v/v). After filtration, this solution was used forHPLC analysis. Comparative investigations using differentextraction media and longer times of sonication, and a lar-ger number of sonication cycles proved that the chosenprocedure led to an exhaustive extraction. All quantitativeanalyses were run in triplicate.
4.3. HPLC analyses
HPLC analyses of sesquiterpene lactones were per-formed using HP-1090 and HP-1100 ChemStations (Agi-lent, Waldbronn, Germany) equipped with DADdetectors and by applying the following parameters: col-umn, Zorbax SB-C18 4.6 · 150 mm (3.5 lm material);guard column, Merck LiChrospher 100 RP-18 (5 lm mate-rial); mobile Phase A, H2O; phase B, MeOH; flow rate,1.00 ml/min; injection volume, 5 ll; detection wavelength,225 nm; oven temperature, 40 �C; linear gradient, 0 min45% B, 15 min 50% B, 30 min 57% B, 35 min 95% B,40 min stop; post time, 12 min.
Phenolics were analyzed using HP-1090 and HP-1100ChemStations equipped with DAD detectors and by apply-ing the following parameters: column, Phenomenex Syn-ergi Hydro-Rp 80A 150 · 4.6 mm (4 lm material); guardcolumn, Phenomenex Security Guard C18 (ODS, Octade-cyl) 4.0 mm · 3.0 mm; mobile phase A, H2O/HCOOH/CH3COOH (99/0.9/0.1, v/v/v); phase B, MeCN/MeOH/HCOOH/CH3COOH (89/10/0.9/0.1, v/v/v/v); flow rate,1.00 ml/min; injection volume, 10 ll; detection wavelength,350 nm; oven temperature, ambient; linear gradient, 0 min5% B, 5 min 15% B, 20 min 16% B, 35 min 18% B, 45 min19% B, 55 min 27.5% B, 60 min 65% B, 65 min 98% B,70 min stop; post time, 12 min.
The amounts of sesquiterpene lactones were estimatedby comparing the peak areas obtained for the particularsesquiterpene lactones S1–S14 with the peak area obtainedfor the internal standard santonin (SAN). The amounts ofphenolics were estimated by comparing the peak areasobtained for the particular flavonoids F1–F6 and caffeicacid derivatives P1–P9 with the peak area obtained forthe internal standard cynarin (CYN). For quantitativeanalyses only phenolics reaching at least the threshold of1.00 mg/g dried plant material in at least one of the inves-tigated samples were taken into account.
4.4. HPLC–MS analyses
Analyses were performed using the HPLC systemdescribed above. The HPLC was coupled to a BrukerEsquire 3000plus iontrap (Bremen, Germany). The followingparameters were employed: Ionization, negative ESI; scan-ning range m/z 50–1200; nebulizer 40 psi; dry gas 10 l/min;dry temperature 300 �C. Flavonoids and caffeic acidderivatives were detected as [M � H]� signals using these
R. Spitaler et al. / Phytochemistry 67 (2006) 409–417 415

parameters. Unidentified caffeic acid derivatives (P2–P3,P6–P9) were characterized as follows: P2 (Rt = 28.7 min,m/z = 516), P3 (Rt = 33.5 min, m/z = 516), P6 (Rt =43.7 min, m/z = 516), P7 (Rt = 48.5 min, m/z = 602), P8
(Rt = 52.5 min, m/z = 688), and P9 (Rt = 59.5 min, m/z =764). Thus, compounds P2, P3, and P6 were identified asisomeric dicaffeoylquinic acids, compound P7 as an isomerof compound P5, and compound P8 as a tricaffeoylquinicacid derivative. According to the molecular mass compoundP9 might represent a hitherto unknown methoxyoxaloyl-tricaffeoylquinic acid derivative.
4.5. Isolation of 1-methoxyoxaloyl-3,5-dicaffeoylquinic acid
(P5)
P5 was isolated from commercially available floweringheads of A. montana [Fl. Arnicae CS., PhE, Mag. KottasHeilkrauter (Vienna, Austria), batch A318268-00]. Fineground flowering heads (984 g) were exhaustively extractedwith MeOH to yield 245 g of crude extract after evapora-tion of the solvent in vacuo. The extract was re-suspendedin a mixture of H2O and MeOH (2/1, v/v) and then succes-sively partitioned with CH2Cl2 and BuOH. The BuOHlayer (57 g) was dissolved in MeOH (100 ml), centrifuged,filtered and separated by Sephadex LH-20 column chroma-tography (CC) using MeOH as an eluant. Fractions rich inP5 were successively re-chromatographed over SephadexLH-20 using a mixture of MeOH, (CH3)2CO, and water(3/1/1, v/v/v) as an eluant to yield 27 mg of P5. Re-isola-tion of P5 (0.5 mg) for NMR spectra recorded inDMSO-d6 was achieved by Sephadex LH-20 CC fromother fractions containing P5.
4.6. NMR data of 1-methoxyoxaloyl-3,5-dicaffeoylquinic
acid (P5)
1H NMR (300 MHz, CD3OD): quinic acid moiety, d2.75 (1H, br d, J = 15.0 Hz, H-2a), 2.48 (1H, dd,J = 15.0; 3.5 Hz, H-2b), 5.52 (1H, ddd, J = 3.5, 3.5,3.5 Hz, H-3), 3.96 (1H, dd, J = 9.5; 3.5 Hz, H-4), 5.44(1H, ddd, J = 9.5; 9.5; 4.0 Hz, H-5), 2.63 (1H, br d,J = 13.5 Hz, H-6a), 2.02 (1H, dd, J = 13.5; 9.5 Hz, H-6b);methoxyoxaloyl moiety, not detectable; caffeoyl moiety I,d 7.11 (1H, d, J = 2.0, H-200), 6.80 (1H, d, J = 8.0 Hz,H-500), 7.01 (1H, dd, J = 8.0; 2.0 Hz, H-600), 7.61 (1H, d,J = 16.0 Hz, H-700), 6.30 (1H, d, J = 16.0 Hz, H-800); caf-feoyl moiety II, d 7.07 (1H, d, J = 2.0, H-2000), 6.79 (1H,d, J = 8.0 Hz, H-5000), 6.97 (1H, dd, J = 8.0; 2.0 Hz,H-6000), 7.62 (1H, d, J = 16.0 Hz, H-7000), 6.35 (1H, d,J = 16.0 Hz, H-8000). 13C NMR (CD3OD, 300 MHz): quinicacid moiety, d 80.7 (C-1), 33.0 (C-2), 73.6 (C-3), 71.8 (C-4),71.2 (C-5), 37.8 (C-6), 174.2 (C-7); methoxyoxaloyl moiety,d 168.2* (C-1 0), 168.0* (C-2 0), not detectable (C-3 0); caf-feoyl moiety I, d 127.8 (C-100), 115.4 (C-200), 146.8 (C-300),149.6 (C-400), 116.5 (C-500), 123.2 (C-600), 147.4 (C-700),115.1 (C-800), 168.7 (C-900); caffeoyl moiety II, d 127.8(C-1000), 115.3 (C-2000), 146.8 (C-3000), 149.8 (C-4000), 116.5
(C-5000), 123.0 (C-6000), 147.9 (C-7000), 115.2 (C-8000), 167.7(C-9000), * signals might be exchangeable. Referenced to sol-vent residual and solvent signals at 3.31 ppm (1H NMR)and 49.0 ppm (13C NMR), respectively.
1H NMR (500 MHz, (CD3)2SO): quinic acid moiety, d2.41 (2H, m, H-2a,b), 5.32 (1H, ddd, J = 3.5, 3.5, 3.5 Hz,H-3), 3.79 (1H, dd, J = 9.5; 3.5 Hz, H-4), 5.19 (1H, ddd,J = 9.5; 9.5; 4.0 Hz, H-5), 2.44 (1H, m, H-6a), 1.92 (1H,m, H-6b); methoxyoxaloyl moiety, d 2.41 (3H, s, H-3 0); caf-feoyl moiety I, d 7.09 (1H, d, J = 2.0, H-200), 6.76 (1H, d,J = 8.0 Hz, H-500), 7.00 (1H, dd, J = 8.0; 2.0 Hz, H-600),7.47 (1H, d, J = 16.0 Hz, H-700), 6.25 (1H, d, J = 16.0 Hz,H-800); caffeoyl moiety II, d 7.06 (1H, d, J = 2.0, H-2000),6.78 (1H, d, J = 8.0 Hz, H-5000), 7.00 (1H, dd, J = 8.0;2.0 Hz, H-6000), 7.50 (1H, d, J = 16.0 Hz, H-7000), 6.25 (1H,d, J = 16.0 Hz, H-8000). 13C NMR (CD3OD, 300 MHz, onlysignals detectable by HSQC): quinic acid moiety, d 31.5(C-2), 71.1 (C-3), 69.9 (C-4), 70.3 (C-5), 35.6 (C-6); meth-oxyoxaloyl moiety, 55.8 (C-3 0); caffeoyl moiety I, d 114.7(C-200), 115.7 (C-500), 120.9 (C-600), 145.0 (C-700), 114.7 (C-800);caffeoyl moiety II, d 115.3 (C-2000), 115.7 (C-5000), 120.9(C-6000), 144.9 (C-7000), 114.5 (C-8000). Referenced to solventresidual and solvent signals at 2.50 ppm (1H NMR) and39.5 ppm (13C NMR), respectively.
4.7. Data analysis
Correlation coefficients and linear regression equationswere calculated using the MINITAB 13.31 softwarepackage.
Acknowledgements
The authors thank Ulrike Arnold, Elisabeth Baier, Mi-chael Dobner, Sandra Grass, Michaela Karmann, SabineKrall, Paul Kranebitter, Peter Schneider, Birthe Schubert,Nadja Schwaiger, and Sonja Sturm for assistance in bed-ding out the plantlets of A. montana. Moreover, we wantto thank Sonja Sturm for HPLC/MS measurements andKarl-Hans Ongania for HRMS measurements. Thanksare due to the Thurn und Taxis family and the Agrarge-meinschaft Patsch for a permit to establish experimentalplots on their land.
Appendix A. Supplementary data
Supplementary data associated with this article can befound, in the online version, at doi:10.1016/j.phytochem.2005.11.018.
References
Agata, I., Goto, S., Hatano, T., Nishibe, S., Okuda, T., 1993. 1,3,5-Tri-O-caffeoylquinic acid from Xanthium strumarium. Phytochemistry 33,508–509.
416 R. Spitaler et al. / Phytochemistry 67 (2006) 409–417

Bachereau, F., Marigo, G., Asta, J., 1998. Effect of solar radiation (UVand visible) at high altitude on CAM-cycling and phenolic compoundbiosynthesis in Sedum album. Physiol. Plant. 104, 203–210.
Batzing, W., 2003. Die Alpen. Geschichte und Zukunft einer europaischenKulturlandschaft. 2. Aufl. C.H. Beck, Munchen.
Blokhina, O., Virolainen, E., Fagerstedt, K.V., 2003. Antioxidants,oxidative damage and oxidative deprivation stress: a review. Ann.Bot. 91, 179–194.
Blumthaler, M., Ambach, W., Ellinger, R., 1997. Increase in solar UVradiation with altitude. J. Photochem. Photobiol. B 39, 130–134.
Bomme, U., Daniel, G., 1994. Erste Untersuchungsergebnisse zurAuslesezuchtung bei Arnica montana L. Gartenbauwissenschaft 59,67–71.
Cheminat, A., Zawatzky, R., Becker, H., Brouillard, R., 1988. Caffeoylconjugates from Echinacea species: structures and biological activity.Phytochemistry 27, 2787–2794.
Cuadra, P., Harborne, J.B., Waterman, P.G., 1997. Increases in surfaceflavonols and photosynthetic pigments in Gnaphalium luteo-album inresponse to UV-B radiation. Phytochemistry 45, 1377–1383.
Douglas, J.A., Smallfield, B.M., Burgess, E.J., Perry, N.B., Anderson,R.E., Douglas, M.H., Glennie, V.L., 2004. Sesquiterpene lactones inArnica montana: a rapid analytical method and the effects of flowermaturity and simulated mechanical harvesting on quality and yield.Planta Med. 70, 166–170.
Ebert, M., Merfort, I., Willuhn, G., 1988. Flavonoid distribution in Arnica
subgenera Montana and Austromontana. Phytochemistry 27, 3849–3851.
Harborne, G., 1982. Introduction to Ecological Biochemistry. AcademicPress, London.
Jaakola, L., Maatta-Riihinen, K., 2004. Activation of flavonoid biosyn-thesis by solar radiation in bilberry (Vaccinium myrtillus L.) leaves.Planta 218, 721–728.
Klaas, C.A., Wagner, G., Laufer, S., Sosa, S., Della Loggia, R., Bomme,U., Pahl, H.L., Merfort, I., 2002. Studies on the anti-inflammatoryactivity of phytopharmaceuticals prepared from Arnica flowers. PlantaMed. 68, 385–391.
Korner, C., 1999. Alpine Plant Life. Functional Plant Ecology of HighMountain Ecosystems. Springer, Berlin.
Markham, K.R., Ryan, K.G., Bloor, S.J., Mitchell, K.A., 1998a. Anincrease in the luteolin: apigenin ratio in Marchantia polymorpha onUV-B enhancement. Phytochemistry 48, 791–794.
Markham, K.R., Tanner, G.J., Caasi-Lit, M., Whitecross, M.I., Nayudu,M., Mitchell, K.A., 1998b. Possible protective role for 30,40-dihydr-oxyflavones induced by enhanced UV-B in a UV-tolerant rice cultivar.Phytochemistry 49, 1913–1919.
McDougal, K.M., Parks, C.R., 1984. Elevational variation in foliarflavonoids of Quercus rubra L. (Fagaceae). Am. J. Bot. 71, 301–308.
Merfort, I., 1984. Methylierte Flavonoide aus Arnica montana und Arnica
chamissonis. Planta Med. 50, 107–108.Merfort, I., 1985. Flavonoide aus Arnica montana und Arnica chamissonis.
Planta Med. 51, 136–138.Merfort, I., 1992. Caffeoylquinic acids from flowers of Arnica montana and
Arnica chamissonis. Phytochemistry 31, 2111–2113.Merfort, I., Wendisch, D., 1987. Flavonoidglycoside aus Arnica montana
und Arnica chamissonis. Planta Med. 53, 434–437.Merfort, I., Wendisch, D., 1988. Flavonolglucuronide aus den Bluten von
Arnica montana. Planta Med. 54, 247–250.Merfort, I., Wendisch, D., 1992. New flavonoid glycosides from Arnicae
Flos DAB 9. Planta Med. 58, 355–357.Min-Soo, K., Lee, W.-K., Kim, H.-Y., Kim, C., Ryu, Y.-W., 1998. Effect
of environmental factors on flavonol glycoside production andphenylalanine ammonia-lyase activity in cell suspension cultures ofGinkgo biloba. J. Microbiol. Biotechnol. 8, 237–244.
Polle, A., Mossnang, M., von Schonborn, A., Sladkovic, R., Rennenberg,H., 1992. Field studies on Norway spruce trees at high altitudes. I.Mineral, pigment and soluble protein contents of needles as affected byclimate and pollution. New Phytol. 121, 89–99.
von Raison, J., Heilmann, J., Merfort, I., Schmidt, T.J., Brock, F.E.,Leven, W., Bomme, U., Bauer, R., 2000. Arnika – Arzneipflanze mitTradition und Zukunft. Zeitschr. Phytother. 21, 39–45.
Rice-Evans, C.A., Miller, N.J., Paganga, G., 1996. Structure-antioxidantactivity relationships of flavonoids and phenolic acids. Free Rad. Biol.Med. 20, 933–956.
Robinson Jr., W.E., Reinecke, M.G., Abdel-Malek, S., Jia, Q., Chow,S.A., 1996. Inhibitors of HIV-1 replication that inhibit HIV integrase.Proc. Natl. Acad. Sci. USA 93, 6326–6331.
Ruhland, T.R., Day, T.A., 2000. Effects of ultraviolet-B radiation on leafelongation, production and phenylpropanoid concentrations of Des-
champsia antarctica and Colobanthus quitensis in Antarctica. Physiol.Plant. 109, 244–251.
Ruhland, T.R., Day, T.A., 2001. Size and longevity of seed banks inAntarctica and the influence of ultraviolet-B radiation on survivorship,growth and pigment concentrations of Colobanthus quitensis seedlings.Environ. Exp. Bot. 45, 143–154.
Seeber, H., 1996. Kultivierung und Analytik der Arnica montana L.Arnika als Sonderkultur in Sudtirol. Diploma Thesis, University ofInnsbruck, Austria.
Seeber, H., Abraham, H., Santer, H., Stuppner, H., 1997. Kulturversuchein Sudtirol mit Arnica montana L. Drogenreport 16, 10–16.
Takahama, U., Oniki, T., 1997. A peroxidase/phenolics/ascorbate systemcan scavenge hydrogen peroxide in plant cells. Physiol. Plant. 101,845–852.
Tevini, M., Iwanzik, W., Thoma, U., 1981. Some effects of enhanced UV-B irradiation on the growth and composition of plants. Planta 153,388–394.
Veit, M., Bilger, W., Muhlbauer, T., Brummet, W., Winter, K., 1996.Diurnal changes in flavonoids. J. Plant. Physiol. 148, 478–482.
Wellmann, E., 1975. UV dose-dependent induction of enzymes related toflavonoid biosynthesis in cell suspension cultures of parsley. FEBSLett. 51, 105–107.
Wilson, K.E., Wilson, M.I., Greenberg, B.M., 1998. Identification of theflavonoid glycosides that accumulate in Brassica napus L. cv. Topasspecifically in response to ultraviolet B radiation. Photochem. Photo-biol. 67, 547–553.
Wulff, A., Anttonen, S., Pellinen, R., Savonen, E.-M., Sutinen, M.-L.,Heller, W., Sandermann Jr., H., Kangasjarvi, J., 1999. Birch (Betula
pendula Roth.) responses to high UV-B radiation. Boreal Environ.Res. 4, 77–88.
ZAMG, 2002. Klimadaten von Osterreich. CD-ROM. Zentralanstalt furMetereologie und Geodynamik Wien.
Zidorn, C., Gottschlich, G., Stuppner, H., 2002. Chemosystematicinvestigations on phenolics from flowerheads of Central Europeantaxa of Hieracium (Asteraceae). Pl. Syst. Evol. 231, 39–58.
Zidorn, C., Petersen, B.O., Udovicic, V., Larsen, T.O., Duus, J.Ø.,Rollinger, J.M., Ongania, K.-H., Ellmerer, E.P., Stuppner, H., 2005a.Podospermic acid, 1,3,5-tri-O-(7,8-dihydrocaffeoyl)quinic acid fromPodospermum laciniatum (Asteraceae). Tetrahedron Lett. 46, 1291–1294.
Zidorn, C., Schubert, B., Stuppner, H., 2005b. Altitudinal differences inthe contents of phenolics in flowering heads of three members of thetribe Lactuceae (Asteraceae) occurring as introduced species in NewZealand. Biochem. Syst. Ecol. 33, 855–872.
Zidorn, C., Stuppner, H., 2001a. Evaluation of chemosystematic charac-ters in the genus Leontodon. Taxon 50, 115–133.
Zidorn, C., Stuppner, H., 2001b. Chemosystematics of taxa from theLeontodon section Oporinia. Biochem. Syst. Ecol. 29, 827–837.
R. Spitaler et al. / Phytochemistry 67 (2006) 409–417 417

Announcement
Phytochemical Society of North Americawww.psna-online.org
The Phytochemical Society of North America (PSNA) is
a nonprofit scientific organization with membership
open to those interested in plant biochemistry, phy-
tochemistry, and the role of plant substances in related
disciplines. Annual meetings featuring symposium topics
of current general interest and contributed papers by
conference participants are held throughout Canada, theUnited States, and Mexico. PSNA meetings provide
participants with exposure to cutting-edge research pre-
sented by prominent international scientists, but remain
intimate enough to allow interaction and collegiality.
The 2005 annual meeting was held in La Jolla, CA, at
the Salk Institute, and the 2006 meeting will be held on
the campus of the University of Mississippi in Oxford,
MS, July 8–12. A biannual Society newsletter keepsmembers informed of new developments, and provides a
forum for the exchange of information and ideas.
Phytochemistry publishes many of the membership’s
papers and members are eligible for a discounted sub-
scription to the journal. If you would like more in-
formation about the PSNA please visit our website, or
contact a member of the PSNA Executive Committee. If
you have material that you would like included in the
newsletter please contact the PSNA Secretary.
2005–2006 PSNA Executive Committee
President––Clint Chapple, Purdue University (chap-
Past-President––Daneel Ferreira, University of Mis-
sissippi ([email protected])
Secretary––Mark Berhow USDA-ARS, Peoria,
IL ([email protected])
Treasurer––Charles L. Cantrell, USDA-ARS, Uni-
versity, MS ([email protected])
Editor-in-Chief (Recent Advances in Phytochemistry),
John T. Romeo, University of South Florida
Membership: Annual membership dues are US$40 for
regular members and US$20 for student members, payable to
the PSNA through the Treasurer. Please visit the PSNA web
site for membership forms or contact the Treasurer.
doi:10.1016/S0031-9422(06)00014-8
www.elsevier.com/locate/phytochem
Phytochemistry 67 (2006) 418
PHYTOCHEMISTRY

Phytochemistry Vol. 67, No. 4, 2006
Author Index
Adams, M., 402Ahn, J.-H., 387
Azzolin, C.M.M., 371
Baiocchi, C., 371
Benedict, C.R., 356
Bertea, C.M., 371
Bortenschlager, S., 410
Bossi, S., 371
Casanova, E., 395
Drager, B., 327
Ellmerer, E.P., 410
Faca, V.M., 362
Greene, L.J., 362
Hur, H.-G., 387
Izumi, C., 362
Jauregui, O., 395
Kai, K., 379
Kim, B.-G., 387
Kitamura, S., 338
Laure, H.J., 362Lee, Y., 387
Leoni, F., 371
Lim, Y., 387
Liu, J., 356
Lombardozzi, M.A., 371
Luciano, P., 371
Maffei, M.E., 371Medana, C., 371
Merchant, A., 402
Merfort, I., 410
Mizutani, M., 379
Padovan, J.C., 362Perez, G., 347
Popp, M., 402
Richter, A., 402
Sakata, K., 379
Schlorhaufer, P.D., 410
Segarra, G., 395Shimizu, B.-i., 379
Spitaler, R., 410
Stipanovic, R.D., 356
Stuppner, H., 410
Suzuki, K., 338
Temporale, G., 371
Trillas, I., 395
Vega, N., 347
Watanabe, K., 338, 379
Zidorn, C., 410
doi:10.1016/S0031-9422(06)00015-X
PHYTOCHEMISTRY
www.elsevier.com/locate/phytochem