characterization of sanguinarine reductases from papaver
TRANSCRIPT

University of Calgary
PRISM: University of Calgary's Digital Repository
Graduate Studies The Vault: Electronic Theses and Dissertations
2015-05-20
Characterization of sanguinarine reductases from
Papaver somniferum
Bross, Crystal
Bross, C. (2015). Characterization of sanguinarine reductases from Papaver somniferum
(Unpublished master's thesis). University of Calgary, Calgary, AB. doi:10.11575/PRISM/25290
http://hdl.handle.net/11023/2260
master thesis
University of Calgary graduate students retain copyright ownership and moral rights for their
thesis. You may use this material in any way that is permitted by the Copyright Act or through
licensing that has been assigned to the document. For uses that are not allowable under
copyright legislation or licensing, you are required to seek permission.
Downloaded from PRISM: https://prism.ucalgary.ca

UNIVERSITY OF CALGARY
Characterization of sanguinarine reductases from Papaver somniferum
by
Crystal Dawn Bross
A THESIS
SUBMITTED TO THE FACULTY OF GRADUATE STUDIES
IN PARTIAL FULFILMENT OF THE REQUIREMENTS FOR THE
DEGREE OF MASTER OF SCIENCE
DEPARTMENT OF BIOLOGICAL SCIENCES
CALGARY, ALBERTA
MAY, 2015
© Crystal Dawn Bross 2015

ii
Abstract
Papaver somniferum (opium poppy) produces several pharmacologically relevant
benzylisoquinoline alkaloids, such as the analgesics codeine and morphine, the muscle
relaxant papaverine, the potential anti-cancer drug noscapine, and the antimicrobial agent
sanguinarine. Sanguinarine is a highly cytotoxic benzophenanthridine alkaloid
synthesized by the plant to defend against herbivory and pathogens. However,
sanguinarine can bind DNA, induce apoptosis, and will inhibit the growth of plant cell
cultures that do not synthesize benzophenanthridine alkaloids. Therefore, it is proposed
that sanguinarine reductase (SanR) exists in plants that synthesize benzophenanthridine
alkaloids to facilitate the detoxification of sanguinarine through its reduction to
dihydrosanguinarine. Three transcripts encoding SanRs were identified in opium poppy
transcriptome databases and were characterized biochemically and physiologically using
enzyme assays, virus-induced gene silencing, and immunolocalization to gain insight into
the role of SanR as an enzyme of detoxification.

iii
Acknowledgements
I would like to thank those who supported me during the completion of my thesis.
Thank you to my lab members, especially Guillaume Beaudoin, Thu-Thuy Dang, Scott
Farrow, Donald Dinsmore, Xue Chen, Eun-Jeong Lee, and Jeremy Morris, for their
guidance and assistance, and willingness to help in any way. And thank you to my
friends, Ramya Singh and Bonnie McNeil, for keeping me grounded, and offering an
outside perspective on my research.
I would also like to thank my committee, Dr. Doug Muench and Dr. Marcus Samuel, for
their guidance. And thank you to Dr. Ed Yeung, Dr. Christoph Sensen, and Ye Zhang for
their expertise in botany and phylogeny.
Lastly, a special thank you to my parents for their unconditional love, support, and
encouragement. You were always there when I needed you, and I am forever grateful.

iv
Table of Contents
Abstract .............................................................................................................................. ii Acknowledgements .......................................................................................................... iii Table of Contents ............................................................................................................. iv List of Tables ................................................................................................................... vii List of Figures and Illustrations ................................................................................... viii List of Symbols, Abbreviations, and Nomenclatures ..................................................... x
1 INTRODUCTION....................................................................................................... 1 1.1 Alkaloids .............................................................................................................. 1 1.2 Benzylisoquinoline alkaloid biosynthesis ............................................................ 2 1.3 Epimerization of reticuline and morphine biosynthesis ....................................... 5 1.4 Sanguinarine biosynthesis .................................................................................... 7 1.5 Sanguinarine is a cytotoxic compound ................................................................ 9 1.6 Localization of alkaloids and biosynthetic enzymes in planta .......................... 11 1.7 Objectives .......................................................................................................... 13
2 MATERIALS AND METHODS ............................................................................. 14 2.1 Media ................................................................................................................. 14
2.1.1 Lysogeny broth (LB) media .................................................................. 14 2.1.2 Antibiotics ............................................................................................. 14 2.1.3 Blue/white selection .............................................................................. 14 2.1.4 Agrobacterium tumefaciens induction medium .................................... 15 2.1.5 Agrobacterium tumefaciens infiltration solution ................................... 15
2.2 Buffers................................................................................................................ 15 2.2.1 Plasmid DNA isolation buffers ............................................................. 15 2.2.2 2X CTAB RNA extraction buffer ......................................................... 15 2.2.3 2X SDS-PAGE sample buffer ............................................................... 16 2.2.4 10X SDS-PAGE electrode buffer ......................................................... 16 2.2.5 10X Western blot transfer buffer .......................................................... 16 2.2.6 1X Transfer buffer for Western blotting ............................................... 16 2.2.7 10X Tris-buffered saline (TBS) buffer .................................................. 16 2.2.8 1X TBS-Tween ..................................................................................... 16 2.2.9 Plant protein extraction buffer ............................................................... 16 2.2.10 Sodium phosphate buffer, pH 7.6 (100 mM) ...................................... 16 2.2.11 Coomassie stain ................................................................................... 17 2.2.12 Solvent A mass spectrometry running buffer ...................................... 17
2.3 Gel electrophoresis............................................................................................. 17 2.3.1 50X TAE buffer .................................................................................... 17 2.3.2 30% Acrylamide solution ...................................................................... 17 2.3.3 Separating gel (12%) ............................................................................. 17 2.3.4 Resolving gel (4%) ................................................................................ 18

v
2.4 Organisms .......................................................................................................... 18 2.4.1 Bacteria .................................................................................................. 18 2.4.2 Plants ..................................................................................................... 18
2.5 Plasmids ............................................................................................................. 19 2.5.1 Subcloning plasmid ............................................................................... 19 2.5.2 Recombinant protein expression plasmid ............................................. 20 2.5.3 Virus-induced gene silencing (VIGS) plasmids .................................... 20
2.6 Cloning and Transformations ............................................................................ 22 2.6.1 Sequence identification and primer design ........................................... 22 2.6.2 PCR amplification of DNA and ligation ............................................... 33 2.6.3 Bacterial transformation ........................................................................ 34 2.6.4 Plant transformation .............................................................................. 35
2.7 Escherichia coli protein induction, purification, and detection ......................... 36 2.8 Plant protein purification, and detection ............................................................ 38 2.9 Alkaloids ............................................................................................................ 38
2.9.1 Isolation of benzophenanthridine alkaloids ........................................... 39 2.10 Enzyme assays ................................................................................................. 40 2.11 Antibody production ........................................................................................ 40
2.11.1 Dot blots .............................................................................................. 41 2.12 Immunolocalization ......................................................................................... 41
2.12.1 Tissue fixation and embedding ........................................................... 41 2.12.2 Immunohistochemistry ........................................................................ 42 2.12.3 Microscopy .......................................................................................... 42
2.13 Virus-induced gene silencing ........................................................................... 43 2.13.1 RNA extraction and cDNA synthesis .................................................. 43 2.13.2 Quantitative real-time PCR ................................................................. 44 2.13.3 Root alkaloid extraction ...................................................................... 45
2.14 Liquid chromatography-mass spectrometry .................................................... 45 2.15 Statistical analysis ............................................................................................ 46
3 RESULTS .................................................................................................................. 47 3.1 Sanguinarine reductase identification, expression, and purification ................. 47 3.2 Biochemical characterization of sanguinarine reductases in vitro ..................... 51
3.2.1 Sanguinarine reductase does not reduce 1,2-dehydroreticuline ............ 51 3.2.2 Purification of benzophenanthridine alkaloids ...................................... 51 3.2.3 Sanguinarine reductases reduce benzophenanthridine alkaloids........... 56 3.2.4 Temperature curves ............................................................................... 56 3.2.5 Michaelis-Menten kinetic analysis ........................................................ 66
3.3 Immunolocalization of sanguinarine reductases ................................................ 66 3.3.1 Antibody production & dot blots .......................................................... 66 3.3.2 Sanguinarine reductase expression in planta ........................................ 70 3.3.3 Epifluorescence microscopy ................................................................. 70
3.4 Virus-induced gene silencing of sanguinarine reductases ................................ 75 3.4.1 Quantitative PCR primer and probe specificity towards SanRs ............ 75 3.4.2 Sanguinarine reductase expression in planta ....................................... 75 3.4.3 Knocking down expression in planta using VIGS ................................ 79

vi
4 DISCUSSION .......................................................................................................... 109 4.1 Sanguinarine reductase identification, expression, and purification ............... 109 4.2 Biochemical characterization of sanguinarine reductases in vitro ................... 111 4.3 Short-chain dehydrogenase/reductases ............................................................ 115 4.4 Protein localization of sanguinarine reductases in planta ................................ 117 4.5 Expression of sanguinarine reductases in planta ............................................ 120 4.6 Biological roles of sanguinarine reductases ..................................................... 127
5 CONCLUSION ....................................................................................................... 134
Bibliography .................................................................................................................. 137 List of Appendix Tables and Figures .......................................................................... 148 Appendix A1: Cloning dehydroreticuline reductase candidates .............................. 149 Appendix A2: Biochemical characterization of SanRs.............................................. 167 Appendix A3: SanR expression in transcriptome libraries ...................................... 170 Appendix A4: Phylogenetic analysis ........................................................................... 174

vii
List of Tables
Table 1. List of primers used for cloning procedures. ..................................................... 23
Table 2. List of VIGS and qPCR primers. ....................................................................... 27
Table 3. Benzylisoquinoline alkaloids tested as potential substrates of SanRs. .............. 52
Table 4. Quantitative PCR primer and probe specificity towards SanR genes. ............... 76

viii
List of Figures and Illustrations
Figure 1. Benzylisoquinoline alkaloid biosynthesis in Papaver somniferum. ................... 2
Figure 2. TRV-based virus-induced gene silencing vectors ............................................ 21
Figure 3. Sequence alignment of sanguinarine reductases .............................................. 23
Figure 4. Constructs designed to silence sanguinarine reductases (SanRs) using
virus-induced gene silencing (VIGS) ............................................................... 32
Figure 5. Expression of recombinant sanguinarine reductases. ....................................... 48
Figure 6. Purification of sanguinarine reductases using TALON metal affinity resin .... 49
Figure 7. Purification of recombinant sanguinarine reductases ....................................... 50
Figure 8. Sanguinarine reductases do not reduce 1,2-dehydroreticuline ......................... 54
Figure 9. TLC separation of benzophenanthridine alkaloids ........................................... 55
Figure 10. Collision-induced dissociation spectra for benzophenanthridines ................. 57
Figure 12. Non-enzymatic reduction of benzophenanthridines ....................................... 59
Figure 13. Sanguinarine reductases reduce benzophenanthridine alkaloids. ................... 60
Figure 14. SanR2 reduces benzophenanthridine alkaloids using NADPH or NADH ..... 64
Figure 15. Temperature curve for SanR2 ......................................................................... 65
Figure 16. Michaelis-Menten enzyme kinetics for SanR1 and SanR3B ......................... 67
Figure 17. Generation of antibodies against sanguinarine reductases ............................. 68
Figure 18. Specificity of antibodies generated against recombinant sanguinarine
reductases ........................................................................................................ 69
Figure 19. Sanguinarine reductases are present in all opium poppy tissues. ................... 71
Figure 20. Sanguinarine reductases localized to the phloem ........................................... 74
Figure 21. Relative gene expression of opium poppy sanguinarine reductases in
different tissues ............................................................................................... 77
Figure 22. Presence of coat protein RNA in plants transformed with VIGS constructs .. 80
Figure 23. Root gene expression profiles of empty vector control opium poppy
plants. .............................................................................................................. 82

ix
Figure 24. Retention times of benzylisoquinoline alkaloid authentic standards .............. 84
Figure 25. Example chromatographs for VIGS metabolite analysis ............................... 86
Figure 26. Gene expression and metabolite profiles of SanR1-silenced opium poppy
roots................................................................................................................. 89
Figure 27. Gene expression and metabolite profiles of SanR2-silenced opium poppy
roots................................................................................................................. 92
Figure 28. Gene expression and metabolite profiles of SanR3-silenced opium poppy
roots................................................................................................................. 96
Figure 29. Gene expression and metabolite profiles of SanR1- and SanR3-silenced
opium poppy roots. ......................................................................................... 99
Figure 30. Gene expression and metabolite profiles of SanR1-silenced opium poppy
roots............................................................................................................... 101
Figure 31. Gene expression and metabolite profiles of SanR-silenced opium poppy
roots............................................................................................................... 103
Figure 32. Gene expression and metabolite profiles of SanR-silenced opium poppy
roots............................................................................................................... 105
Figure 33. Gene expression and metabolite profiles of SanR-silenced opium poppy
roots............................................................................................................... 107
Figure 34. Predicted model for opium poppy SanRs. .................................................... 131

x
List of Symbols, Abbreviations, and Nomenclatures
*Standard SI units not listed
Symbol Definition
[M]+ or [M+H]+ Parent ion
4-HPAA 4-hydroxyphenylacetaldehyde
4’OMT 4’-O-methyltranferase
6xHis tag composed of 6 consecutive histidine residues
6OMT 6-O-methyltransferase
A260 absorbance at 260 nm
APS ammonium persulfate
AhR aryl hydrocarbon receptor
BIA benzylisoquinoline alkaloid
BBE berberine bridge enzyme
bp base pairs
CaMV cauliflower mosaic virus
cDNA complementary DNA
CID collision-induced dissociation
CFS cheilanthifoline synthase
CNMT coclaurine N-methyltransferase
CODM codeine O-demethylase
COR codeinone reductase
CP coat protein
CTAB cetrimonium bromide
cv. cultivar
CYP cytochrome P450 oxidase
DBOX dihydrobenzophenanthridine oxidase (DBOX)
DEPC diethylpyrocarbonate
DMSO dimethyl sulfoxide
DRR dehydroreticuline reductase
DRS dehydroreticuline synthase
ECL enhanced chemiluminescence
EDTA ethylenediaminetetraacetic acid
EIC extracted ion chromatograph
EMS ethyl methanesulfonate
ER endoplasmic reticulum
FADOX FAD-dependent oxidoreductase
FAM fluorescein
GAPDH glyceraldehyde 3-phosphate dehydrogenase
HO heme oxidase
HRP horseradish peroxidase
IPTG isopropyl-beta-D-thiogalactopyranoside
LB lysogeny broth
LC-MS liquid chromatography-mass spectrometry
MCS multiple cloning site

xi
MES 2-(N-morpholino)ethanesulfonic acid
MGB minor groove binder
M-MLV Moloney Murine Leukemia Virus
MLP major latex protein
MP movement protein
MSH (S)-cis-N-methylstylopine 14-hydroxylase
m/z mass-to-charge ratio
NADH Nicotinamide adenine dinucleotide
NADPH Nicotinamide adenine dinucleotide phosphate
NCS norcoclaurine synthase
NFQ non-fluorescent quencher
Ni-NTA nickel-nitrilotriacetic acid
NMCH (S)-N-methylcoclaurine 3’-hydroxylase
NOS noscapine synthase
NQO NAD(P)H quinone oxidoreductase
OD600 optical density at 600 nm
P6H protopine 6-hydroxylase
PAGE polyacrylamide gel electrophoresis
PCR polymerase chain reaction
PDS phytoene desaturase
PFA paraformaldehyde
PHYLIP PHYLogeny Inference Package
PIPES piperazine-N,N′-bis(2-ethanesulfonic acid)
PMSF phenylmethylsulfonyl fluoride
PVP polyvinylpyrrolidone
PVPP polyvinylpolypyrrolidone
qPCR quantitative real-time PCR
RE restriction enzyme
RPM revolutions per minute
RT reverse transcriptase
SalAT salutaridinol 7-O-acetyltransferase
SanR sanguinarine reductase
SalR salutaridine reductase
SalSyn salutaridine synthase
SD standard deviation
SDR short-chain dehydrogenase/reductase
SDS sodium dodecyl sulphate
SEM standard error of the mean
SPD spermidine
SPS stylopine synthase
T6OM thebaine 6-O-demethylase
TAE Tris-acetate-EDTA
TBS Tris-buffered saline
TEMED tetramethylethylenediamine
TIC total ion chromatograph
TLC thin-layer chromatography

xii
TNMT tetrahydroprotoberberine cis-N-methyltransferase
TRV tobacco rattle virus
UTR untranslated region
VIGS virus-induced gene silencing
X-gal 5-bromo-4-chloro-3-indolyl-β-D-galactopyranoside

1
1 INTRODUCTION
1.1 Alkaloids
Alkaloids are naturally occurring, low molecular weight compounds that are
difficult to categorize (Ziegler and Facchini, 2008). Alkaloid are often derived from an
amino acid with the nitrogen atom in a heterocyclic ring, but this definition does not hold
true for all alkaloids. Alkaloids are grouped into different classes based upon their carbon
skeletal structures, including, but not limited to, pyridine alkaloids (e.g. nicotine), purine
alkaloids (e.g. caffeine), tropane alkaloids (e.g. cocaine), indole alkaloids
(e.g. vinblastine), and benzylisoquinoline alkaloids (e.g. morphine).
Alkaloids are a structurally and functionally diverse group of secondary
metabolites found in approximately 20% of plant species (Facchini and De Luca, 2008).
Alkaloids synthesized by plants may serve as defence molecules against herbivores or
pathogens, but alkaloids are often used as pharmaceuticals due to their potent
pharmacological properties. For example, Nicotiana attenuate synthesizes nicotine,
which acts as a deterrent for herbivory (Steppuhn et al., 2004). Nicotine was once used as
an insecticide to control pests in agriculture (Soloway, 1976), but nicotine is also smoked
recreationally for its mood altering effects as both a stimulant and relaxant. Conversely,
the exact role of morphine in planta remains unknown. Morphine may play a defence
role, whereby it is quickly metabolized to bismorphine upon mechanical damage
(Morimoto et al., 2001). Bismorphine accumulates in the cell wall and crosslinks with
pectin to increase resistance to hydrolysis by pectinases. Nonetheless, morphine is an
important analgesic, and to date Papaver somniferum (opium poppy) remains its sole
commercial source.

2
Like morphine, many benzylisoquinoline alkaloids display potent
pharmacological activities, including codeine as a cough suppressant, papaverine as a
muscle relaxant, noscapine as an anti-cancer drug, and sanguinarine as an antimicrobial
agent (Ziegler and Facchini, 2008). Morphine precursors are also used as precursors to
several semi-synthetic drugs. For example, thebaine is used to produce semi-synthetic
drugs, such as the analgesic oxycodone, and naltrexone and naloxone, which are used to
treat opiate addiction (Millgate et al., 2004).
1.2 Benzylisoquinoline alkaloid biosynthesis
All benzylisoquinoline alkaloids (BIAs) are synthesized from two derivatives of
the aromatic amino acid tyrosine, and are produced mainly by plants in the Papaveraceae,
Ranunculaceae, Berberidaceae, and Menispermaceae families (Facchini and De Luca,
2008). Although, BIAs are extensively studied in Papaver somniferum (opium poppy),
Eschscholzia californica (California poppy), Thalictrum species and Coptis japonica,
and, to date, approximately 2,500 BIA structures have been elucidated. In opium poppy,
norcoclaurine synthase (NCS) catalyzes the first committal step in BIA biosynthesis
through the condensation of dopamine and 4-hydroxyphenylacetaldehyde (4-HPAA) to
form (S)-norcoclaurine (Fig. 1) (Lee and Facchini, 2010; Samanani et al., 2004).
(S)-Norcoclaurine undergoes three methylations and a hydroxylation to form
(S)-reticuline. First, (S)-norcoclaurine is methylated by norcoclaurine
6-O-methyltransferase (6OMT) to (S)-coclaurine, which is then N-methylated to
(S)-N-methylcoclaurine by coclaurine N-methyltransferase (CNMT) (Ounaroon et al.,
2003; Choi et al., 2002; Sato et al., 1994). (S)-N-Methylcoclaurine is hydroxylated by

3
Figure 1. Benzylisoquinoline alkaloid biosynthesis in Papaver somniferum.

4
Figure 1 (continued). Benzylisoquinoline alkaloid biosynthesis in Papaver somniferum.
Schematic of the biosynthetic pathways leading to sanguinarine and morphine in opium
poppy. All enzymes that have been identified (bold) except for those responsible for the
epimerization of reticuline. Sanguinarine reductase (SanR, blue) is characterized in this
thesis. Not pictured are the biosynthetic pathways for papaverine, which is derived from
(S)-coclaurine, and noscapine, which is derived from (S)-reticuline. NCS: norcoclaurine
synthase, 6OMT: norcoclaurine 6-O-methyltrans-ferase, CNMT: coclaurine
N-methyltransferase, NMCH: N-methylcoclaurine 3′-hydroxylase, 4′OMT:
(S)-3’-hydroxy N-methylcoclaurine 4’-O-methyltranferase, BBE: berberine bridge
enzyme, CFS: cheilanthifoline synthase, SPS: stylopine synthase, MSH:
N-methylstylopine 14-hydroxylase, P6H: protopine 6-hydroxylase, DBOX:
dihydrosanguinarine oxidase, DRS: dehydroreticuline synthase, DRR: dehydroreticuline
reductase, SalSyn: salutaridine synthase, SalR: salutaridine reductase, SalAT:
salutaridinol 7-O-acetyltransferase, T6ODM: thebaine 6-O-demethylase, CODM: codeine
O-demethylase, COR: codeinone reductase.

5
(S)-N-methylcoclaurine 3’-hydroxylase (NMCH) to form (S)-3’-hydroxy-
N-methylcoclaurine, which undergoes another O-methylation by (S)-3’-hydroxy-
N-methylcoclaurine 4’-O-methyltranferase (4’OMT) to form (S)-reticuline (Ziegler et al.,
2005; Morishige et al., 2000; Pauli and Kutchan, 1998). Many BIAs are derived from
(S)-reticuline, and is considered a major branch-point intermediate (Fig. 1) (Ziegler et al.,
2009). (S)-Reticuline is 7-O-methylated to laudanine, or oxidized by the berberine bridge
enzyme (BBE) to form (S)-scoulerine (Ounaroon et al., 2003; Facchini et al., 1996).
Formation of (S)-scoulerine is the first committal step to several classes of BIAs,
including protoberberines (e.g. berberine) phthalideisoquinolines (e.g. noscapine), and
benzophenanthridines (e.g. sanguinarine) (Chen et al., 2015; Fossati et al., 2014;
Facchini et al., 1996). Alternatively, (S)-reticuline can be epimerized to (R)-reticuline,
which is the first committal step to morphine biosynthesis (Hirata et al., 2004;
De-Eknamkul and Zenk, 1992; Battersby et al., 1965).
1.3 Epimerization of reticuline and morphine biosynthesis
The natural occurrence of morphine has only been confirmed in Papaver
decaisnei, Papaver setigerum, and Papaver somniferum, which are all members of the
family Papaveraceae (Theuns et al., 1986). Interestingly, the production of morphine
from Papaver rhoeas callus culture has also been reported (Sarin, 2003). However,
salutaridine and/or its derivatives have been confirmed in several members of
Papaveraceae (e.g. Papaver bracteatum), and some members of Euphorbiace (e.g. Croton
balsamifera) and Apocynace (e.g. Rauvolfia serpentina) (Theuns et al., 1986).
In opium poppy, morphine biosynthesis begins with the epimerization of
(S)-reticuline to (R)-reticuline. Feeding studies with radiolabeled 1,2-dehydroreticuline

6
and (R)-reticuline showed both were incorporation into thebaine, codeine, and morphine
(Borkowski et al., 1978; Battersby et al., 1965). Therefore, the mechanism for
epimerization was proposed to occur via an intermediate 1,2-dehydroreticulinium ion
(1,2-dehydroreticuline) (Hirata et al., 2004; De-Eknamkul and Zenk, 1992; Borkowski et
al., 1978; Battersby et al., 1965). Both dehydroreticuline synthase (DRS) and
dehydroreticuline reductase (DRR) have been partially purified and characterized, but the
encoding genes have not been identified (Hirata et al., 2004; De-Eknamkul and Zenk,
1992). DRS was shown to accept reticuline in vitro to form dehydroreticuline in absence
of a co-factor, and was predicted to be a FAD-dependent oxidoreductase (FADOX)
(Hirata et al., 2004). Several opium poppy FADOXs were identified, however, they do
not accept (S)-reticuline in vitro, and silencing FADOXs had no apparent effect on
reticuline or thebaine levels in planta (Hagel et al., 2012). Purified DRR was highly
specific, and only accepted 1,2-dehydroreticuline as a substrate to form (R)-reticuline
(De-Eknamkul and Zenk, 1992). The purified DRR was approximately 30 kDa, appeared
to be cytosolic, and was only present in crude enzyme extracts of differentiated
P. somniferum and P. bracteatum plants, which produce morphinan alkaloids
(De-Eknamkul and Zenk, 1992). Following the epimerization of reticuline, (R)-reticuline
is converted to salutaridine by salutaridine synthase (SalSyn), a cytochrome P450
(CYP719B1) (Fig. 1) (Gesell et al., 2009). Salutaridine is reduced to salutaridinol by
salutaridine reductase (SalR), and acetylated by salutaridinol 7-O-acetyltransferase
(SalAT) to salutaridinol 7-O-acetate, which spontaneously rearranges to thebaine (Ziegler
et al., 2006; Grothe et al., 2001; Lenz and Zenk, 1994; Gerardy and Zenk, 1993).
Thebaine is then O-demethylated at position 6 by thebaine 6-O-demethylase (T6ODM) or

7
position 3 by codeine O-demethylase (CODM) to form neopinone or oripavine,
respectively (Hagel and Facchini, 2010). Neopinone spontaneously rearranges to
codeinone, which is then reduced to codeine by codeinone reductase (COR), and CODM
demethylates codeine to form morphine (Hagel and Facchini, 2010). Alternatively,
oripavine can be demethylated by T6ODM to produce morphinone, which is reduced by
COR to form morphine (Hagel and Facchini, 2010).
1.4 Sanguinarine biosynthesis
(S)-Scoulerine is the first committal step to several classes of BIAs, including the
benzophenanthridine alkaloid sanguinarine (Fig. 1). (S)-Scoulerine is formed from
(S)-reticuline by BBE (Fossati et al., 2014; Facchini et al., 1996; Dittrich and Kutchan,
1991). In opium poppy, (S)-scoulerine undergoes two oxidization reactions by
cheilanthifoline synthase (CFS) and stylopine synthase (SPS) to form cheilanthifoline and
stylopine, respectively (Fossati et al., 2014; Hagel and Facchini, 2012). (S)-Stylopine is
then N-methylated by tetrahydroprotoberberine cis-N-methyltransferase (TNMT) to form
(S)-cis-N-methylstylopine, which is converted by (S)-cis-N-methylstylopine
14-hydroxylase (MSH) to form protopine (Beaudoin and Facchini, 2013; Liscombe and
Facchini, 2007). Protopine 6-hydroxylase (P6H) hydroxylates protopine to
6-hydroxyprotopine, which spontaneous rearranges to dihydrosanguinarine (Beaudoin
and Facchini, 2013). Dihydrosanguinarine is oxidized to sanguinarine by the FADOX
dihydrobenzophenanthridine oxidase (DBOX) (Hagel et al., 2012). Additionally,
dihydrosanguinarine can be oxidized and methylated one or two times to form
dihydrochelirubine and dihydromacarpine, respectively. However, these
benzophenanthridine alkaloids have not been detected in opium poppy.

8
Sanguinarine can be reduced to dihydrosanguinarine by a sanguinarine reductase
(SanR). It has been suggested that the role of SanR in planta is to detoxify the cytotoxic
sanguinarine through its reduction to the seemingly non-toxic dihydrosanguinarine. Initial
experiments conducted by Dr. Jill Hagel showed silencing SanRs resulted in an
accumulation of reticuline in the latex (data not shown). Since 1,2-dehydroreticuline and
sanguinarine are both quaternary ammonium compounds, it was proposed that SanR
might also be responsible for catalyzing the reduction of 1,2-dehydroreticuline to form
(R)-reticuline in opium poppy. However, SanR(s) from Papaver somniferum have not
been characterized.
To date, only SanR from Eschscholzia californica has been characterized (Vogel
et al., 2010; Weiss et al., 2006). Sanguinarine reductase was first purified from
E. californica cell cultures treated with a yeast elicitor (Vogel et al., 2010; Weiss et al.,
2006). Upon treatment with the microbial elicitor, total alkaloid content in culture
increases approximately four-fold within 24 hours, with at least a quarter being
benzophenanthridine alkaloids. However, the majority of benzophenanthridine alkaloids
are excreted into the medium, while the corresponding dihydrobenzophenanthridine
alkaloids are retained within the cells. Therefore, only dihydrosanguinarine, not
sanguinarine, is detected in elicited E. californica cells. Furthermore, addition of
sanguinarine to cell suspensions results in the disappearance of sanguinarine from the
medium, and an increase in dihydrosanguinarine within the cell. Therefore, elicited
E. californica cell cultures were used to purify, sanguinarine reductase (SanR), which is a
29.5 kDa short-chain dehydrogenase/reductase (SDR) that reduces sanguinarine to
dihydrosanguinarine. The purified SanR was sequenced using Edman degradation, and its

9
encoding cDNA was identified in an E. californica cDNA library (Vogel et al., 2010).
Recombinant SanR from E. californica reduces the quaternary amine in sanguinarine to
form dihydrosanguinarine using NADPH or NADH as a hydrogen donor (Vogel et al.,
2010; Weiss et al., 2006). However, the catalytic properties of SanR are dependent on the
hydrogen donor and the concentration of substrate. The reaction velocity is about
threefold higher with NADPH than with NADH when the substrate concentration is
below 10 μM, and higher substrate concentrations show reduced reaction velocities with
NADPH, but not NADH. E. californica SanR is also able to reduce chelerythrine to
dihydrochelerythrine. Interestingly, the maximum conversion rates of sanguinarine are
observed using NADPH as the reducing agent, whereas the maximum conversion rates of
chelerythrine are observed with NADH.
1.5 Sanguinarine is a cytotoxic compound
Sanguinarine is a highly cytotoxic compound that can bind DNA, inhibit DNA
synthesis, and induce apoptosis (Basu and Suresh Kumar, 2015; Schmeller et al., 1997).
However, these same properties also make sanguinarine, and its derivatives, potential
anticancer compounds (Cao et al., 2015). Similarly, sanguinarine was once used in
Viadent oral health products as a treatment for oral plaque and gingivitis (Vlachojannis et
al., 2012). However, correlational studies linked the use of sanguinarine-based oral health
products to leukoplakia (Damm et al., 1999). Consequently, sanguinarine was removed
from Viadent products in the early 2000s.
The role of sanguinarine in planta is likely as a defense strategy against pathogens
and/or herbivory. Eschscholtzia californica, Papaver somniferum, and Papaver
bracteatum cell cultures will accumulate sanguinarine in response to treatment with a

10
microbial elicitor (Weiss et al., 2006; Cline and Coscia, 1988; Schumacher et al., 1987;
Eilert and Constabel, 1985). However, due to the cytotoxic nature of sanguinarine it is
detoxified in plants through the action of SanR (Weiss et al., 2006). Addition of
sanguinarine to Eschscholzia californica cell cultures had no effect on growth, and
sanguinarine was converted to dihydrosanguinarine. However, addition of sanguinarine
to Nicotiana tobacum or Arabidopsis thaliana cell cultures resulted in growth inhibition
with no significant conversion of sanguinarine. Therefore, sanguinarine is cytotoxic to
plants that do not synthesize benzophenanthridine alkaloids, and SanR has likely evolved
to prevent self-intoxication of benzophenanthridine-producing species.
Studies have shown insects and mammals are also able to metabolize
sanguinarine to dihydrosanguinarine (Schütz et al., 2014; Wu et al., 2013; Dvorák and
Simánek, 2007). Frankliniella occidentalis (thrips) will metabolize consumed
sanguinarine to dihydrosanguinarine (Schütz et al., 2014). However, thrips will avoid
feeding on leaf discs from plants that accumulate benzophenanthridine alkaloids, such as
Eschscholzia californica and Chelidonium majus, in favour for the non-
benzophenanthridine accumulating Phaseolus vulgaris (common bean). Thrips will also
avoid feeding from sugar solutions containing sanguinarine. However, the mechanism of
sanguinarine detoxification in both insects and mammals remains unclear. In mammals,
sanguinarine detoxification may be mediated by the aryl hydrocarbon receptor
(AhR)/CYP1A pathway (Nguyen et al., 2009; Dvorák and Simánek, 2007). Phase I liver
detoxification is mediated by cytochrome P450 oxidases (CYPs). CYP-expressing cell
lines were tested for sanguinarine reductase activity in vitro, and of 10 tested only
CYP1A1 and CYP1A2 were able to metabolize sanguinarine to dihydrosanguinarine

11
(Deroussent et al., 2010). In addition to dihydrosanguinarine, CYP1A formed several
other sanguinarine metabolites, which likely mediate phase II detoxification reactions
(Deroussent et al., 2010). Phase II detoxification results in activation of Nrf2 and
downstream antioxidant response elements, such as heme oxygenase-1 (HO-1) and
NAD(P)H quinone oxidoreductase 1 (NQO1). Studies have shown that sanguinarine
induces the expression of proteins HO-1 and NQO1 (Park et al., 2014; Wu et al., 2013).
Furthermore, treatment of rat liver preparation with dicoumarol, an inhibitor of NQO1,
resulted in significantly less dihydrosanguinarine production from sanguinarine as
compared to the control (Wu et al., 2013). Together these data support the detoxification
of sanguinarine in mammalian livers via the AhR/CYP1A pathway.
1.6 Localization of alkaloids and biosynthetic enzymes in planta
In addition to detoxification by SanR, sanguinarine is also compartmentalized in
planta. In elicited opium poppy cell cultures, sanguinarine accumulates in the vacuole
(Alcantara et al., 2005). Conversely, sanguinarine accumulates along the cell wall in
elicited E. californica cell cultures (Weiss et al., 2006). Fluorescence microscopy
indicated the addition of exogenous sanguinarine to E. californica cell cultures results in
its localization to the cell wall followed by its reduction to dihydrosanguinarine, which
accumulates in cytosol then enters the vacuole (Weiss et al., 2006). Although cell culture
may not accurately reflect alkaloid subcellular localization in intact plants, vacuole
localization of alkaloids has been observed for terpenoid indole alkaloids in
Catharanthus roseus, berberine in Coptis japonica, and nicotine in Nicotiana tabacum
(Carqueijeiro et al., 2013; Morita et al., 2009; Otani et al., 2005).
12
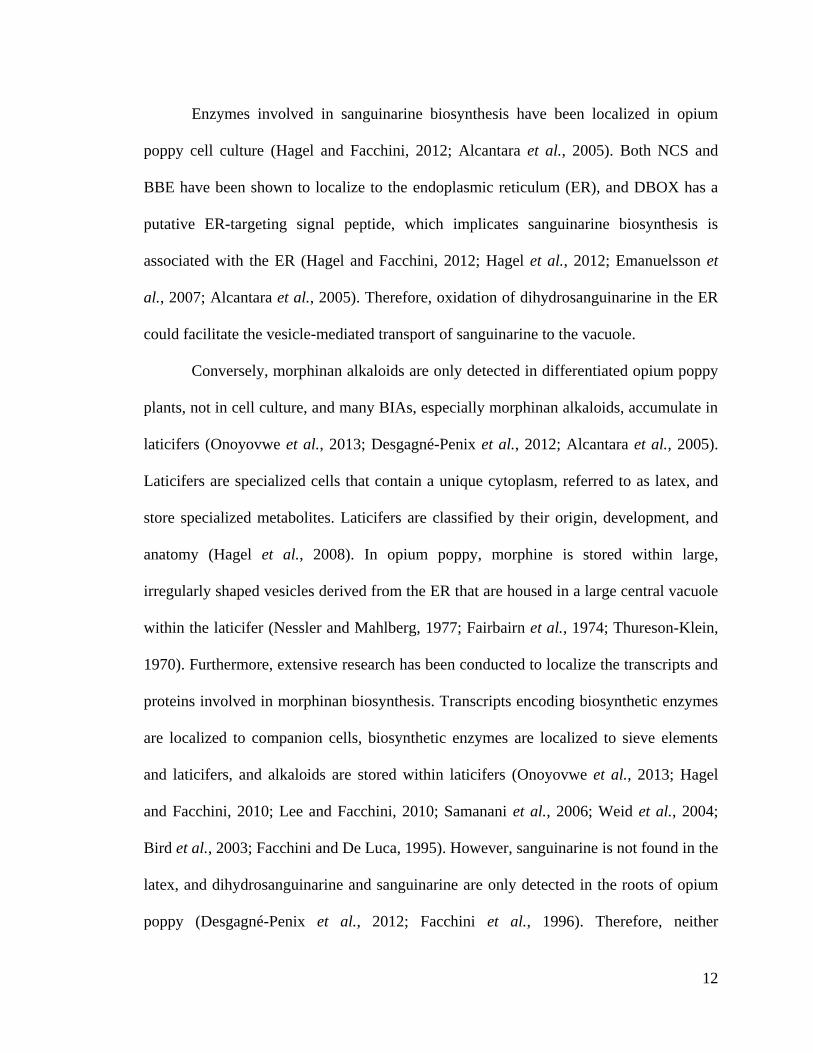
Enzymes involved in sanguinarine biosynthesis have been localized in opium
poppy cell culture (Hagel and Facchini, 2012; Alcantara et al., 2005). Both NCS and
BBE have been shown to localize to the endoplasmic reticulum (ER), and DBOX has a
putative ER-targeting signal peptide, which implicates sanguinarine biosynthesis is
associated with the ER (Hagel and Facchini, 2012; Hagel et al., 2012; Emanuelsson et
al., 2007; Alcantara et al., 2005). Therefore, oxidation of dihydrosanguinarine in the ER
could facilitate the vesicle-mediated transport of sanguinarine to the vacuole.
Conversely, morphinan alkaloids are only detected in differentiated opium poppy
plants, not in cell culture, and many BIAs, especially morphinan alkaloids, accumulate in
laticifers (Onoyovwe et al., 2013; Desgagné-Penix et al., 2012; Alcantara et al., 2005).
Laticifers are specialized cells that contain a unique cytoplasm, referred to as latex, and
store specialized metabolites. Laticifers are classified by their origin, development, and
anatomy (Hagel et al., 2008). In opium poppy, morphine is stored within large,
irregularly shaped vesicles derived from the ER that are housed in a large central vacuole
within the laticifer (Nessler and Mahlberg, 1977; Fairbairn et al., 1974; Thureson-Klein,
1970). Furthermore, extensive research has been conducted to localize the transcripts and
proteins involved in morphinan biosynthesis. Transcripts encoding biosynthetic enzymes
are localized to companion cells, biosynthetic enzymes are localized to sieve elements
and laticifers, and alkaloids are stored within laticifers (Onoyovwe et al., 2013; Hagel
and Facchini, 2010; Lee and Facchini, 2010; Samanani et al., 2006; Weid et al., 2004;
Bird et al., 2003; Facchini and De Luca, 1995). However, sanguinarine is not found in the
latex, and dihydrosanguinarine and sanguinarine are only detected in the roots of opium
poppy (Desgagné-Penix et al., 2012; Facchini et al., 1996). Therefore, neither

13
sanguinarine nor SanR have been localized in intact plants (Desgagné-Penix et al., 2012;
Facchini et al., 1996). However, shotgun proteomics revealed that at least one SanR is
present in opium poppy latex (personal communication; Onoyovwe et al., 2013).
1.7 Objectives
All the cDNAs encoding enzymes in the morphine pathway from norcoclaurine to
morphine have been cloned, except for those encoding DRS and DRR. The original goal
of my thesis was to clone and characterize DRR. It was hypothesized that sanguinarine
reductase (SanR) may catalyze the reduction of 1,2-dehydroreticuline to (R)-reticuline
since both sanguinarine and dehydroreticuline are quaternary ammonium compounds.
However, in this thesis I have shown that SanRs do not accept dehydroreticuline as a
substrate in vitro (Fig. 8). Additional attempts to clone DRR are outlined in Appendix A1.
Although SanR do not exhibit DRR activity it is important to understand the role
of sanguinarine reductases in planta. Therefore, the objective of this work was to
characterize sanguinarine reductases from opium poppy to discern differences between
their activities both in vitro and in vivo. Specifically, (1) opium poppy SanRs were
identified in transcriptome libraries based on homology to the previously characterized
Eschscholzia californica SanR; (2) three opium poppy SanRs were cloned and expressed
as recombinant proteins for biochemical assays and enzyme kinetics, as well as for
antibody production in mice; (3) SanR proteins were localized in various opium poppy
tissues using Western blot analysis immunolocalization; and (4) SanR gene expression
was analyzed in various tissues, but effects of silencing SanR(s) was only analyzed in
root tissue, the site of sanguinarine accumulation. Together these data were used to gain
insight into the role of SanR as an enzyme of detoxification in planta.
14
2 MATERIALS AND METHODS
2.1 Media
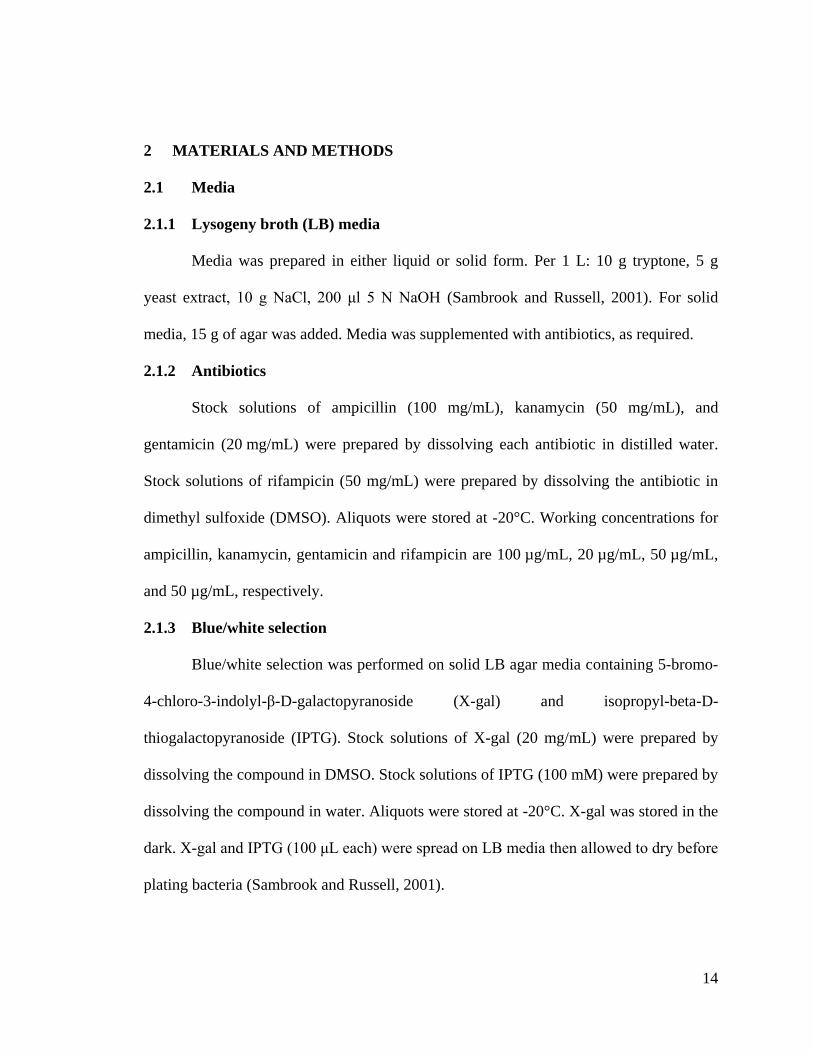
2.1.1 Lysogeny broth (LB) media
Media was prepared in either liquid or solid form. Per 1 L: 10 g tryptone, 5 g
yeast extract, 10 g NaCl, 200 μl 5 N NaOH (Sambrook and Russell, 2001). For solid
media, 15 g of agar was added. Media was supplemented with antibiotics, as required.
2.1.2 Antibiotics
Stock solutions of ampicillin (100 mg/mL), kanamycin (50 mg/mL), and
gentamicin (20 mg/mL) were prepared by dissolving each antibiotic in distilled water.
Stock solutions of rifampicin (50 mg/mL) were prepared by dissolving the antibiotic in
dimethyl sulfoxide (DMSO). Aliquots were stored at -20°C. Working concentrations for
ampicillin, kanamycin, gentamicin and rifampicin are 100 µg/mL, 20 µg/mL, 50 µg/mL,
and 50 µg/mL, respectively.
2.1.3 Blue/white selection
Blue/white selection was performed on solid LB agar media containing 5-bromo-
4-chloro-3-indolyl-β-D-galactopyranoside (X-gal) and isopropyl-beta-D-
thiogalactopyranoside (IPTG). Stock solutions of X-gal (20 mg/mL) were prepared by
dissolving the compound in DMSO. Stock solutions of IPTG (100 mM) were prepared by
dissolving the compound in water. Aliquots were stored at -20°C. X-gal was stored in the
dark. X-gal and IPTG (100 μL each) were spread on LB media then allowed to dry before
plating bacteria (Sambrook and Russell, 2001).

15
2.1.4 Agrobacterium tumefaciens induction medium
Per 100 mL of LB media: 100 µL 50 mg/mL kanamycin, 1 mL 1 M
2-(N-morpholino)ethanesulfonic acid (MES), 20 µL 100 mM acetosyringone (Hileman et
al., 2005).
2.1.5 Agrobacterium tumefaciens infiltration solution
Per 500 mL of infiltration solution: 5 mL 1 M MES, 5 mL 1 M MgCl2, 1 mL
100 mM acetosyringone (Hileman et al., 2005).
2.2 Buffers
2.2.1 Plasmid DNA isolation buffers
Plasmid DNA was extracted through alkaline lysis using resuspension, lysis and
neutralization buffers (modified from Birnboim and Doly, 1979). Per 100 mL of
resuspension buffer: 5 mL 1 M Tris-HCl (pH 8.0), 2 mL 0.5 M EDTA (pH 8.0), 1 mL 10
mg/mL RNase A. Per 100 mL of lysis buffer: 2 mL 10 M NaOH, 10 mL 10% (w/v)
sodium dodecyl sulphate (SDS). Per 100 mL of neutralization buffer: Dissolve 40.8 g
sodium acetate trihydrate in ~70 ml of distilled water. Adjust pH to 5.2 with glacial acetic
acid. Bring up volume to 100 mL with water.
2.2.2 2X CTAB RNA extraction buffer
Per 100 mL: 2 g cetrimonium bromide (CTAB), 10 mL 1 M Tris (pH 8.0), 4 mL
0.5 M EDTA (pH 8.0), 8.18 g NaCl, 1 g polyvinylpyrrolidone (PVP). Adjust volume to
100 mL with diethylpyrocarbonate (DEPC)-treated distilled water, and autoclave. Add
50 µL 100X SPD (0.05g/mL spermidine trihydrochloride), and 10 µL -mercaptoethanol
before use (Meisel et al., 2005).

16
2.2.3 2X SDS-PAGE sample buffer
Per 10 mL: 3.55 mL water, 1.25 mL 0.5 M Tris-HCl (pH 6.8), 2.5 mL glycerol,
2.0 mL 10% (w/v) SDS, 0.2 mL 0.5% (w/v) bromophenol blue, 50 µL -mercaptoethanol
(BioRad Mini-PROTEAN® Tetra Cell Instruction Manual #10007296).
2.2.4 10X SDS-PAGE electrode buffer
Per 1 L: 30.3 g Tris base, 144 g glycine, 10 g SDS. Adjust to pH 8.3 with HCl
(BioRad Mini-PROTEAN® Tetra Cell Instruction Manual #10007296).
2.2.5 10X Western blot transfer buffer
Per 1 L: 30.4 g Tris-HCl, 144 g glycine.
2.2.6 1X Transfer buffer for Western blotting
Per 1 L: 100 mL 10X Western blot transfer buffer, 200 mL methanol. Bring up to
1 L with distilled water (Sambrook and Russell, 2001; Tovey and Baldo, 1987)
2.2.7 10X Tris-buffered saline (TBS) buffer
Per 1 L: 24.2 g Tris, 80.06 g NaCl (Sambrook and Russell, 2001).
2.2.8 1X TBS-Tween
Per 1 L: 100 mL 10X TBS, 1 mL Tween-20 (Sambrook and Russell, 2001).
2.2.9 Plant protein extraction buffer
Per 1 L: 50 mL 1 M Tris-HCl (pH 7.5), 4 mL 0.5 M EDTA (pH 8.0), 10 g
polyvinylpolypyrrolidone (PVPP).
2.2.10 Sodium phosphate buffer, pH 7.6 (100 mM)
Per 1 L: 84.5 mL 1 M Na2HPO4 (141.96 g/L), 15.5 mL 1 M NaH2PO4
(119.98 g/L). Bring volume to 1 L with distilled water (Sambrook and Russell, 2001).

17
2.2.11 Coomassie stain
Per 1 L: 2 g Coomassie Brilliant Blue R250, 500 mL methanol, 100 mL glacial
acetic acid. Bring volume to 1 L with distilled water (Sambrook and Russell, 2001).
2.2.12 Solvent A mass spectrometry running buffer
Per 1 L: Add 0.7708 g ammonium acetate ~800 mL LC-MS grade water. Adjust
pH to 5.5 with glacial acetic acid. Add 50 mL acetonitrile then bring volume to 1 L with
LC-MS grade water (Farrow et al., 2012).
2.3 Gel electrophoresis
Agarose (1-2%) gels made with Tris-acetate-EDTA (TAE) buffer were used to
size separate DNA or RNA (Sambrook and Russell, 2001). SDS-polyacrylamide gel
electrophoresis system (PAGE) was employed to size separate proteins (Laemmli, 1970).
2.3.1 50X TAE buffer
Per 1 L: 242 g Tris base, 57.1 mL glacial acetic acid, 100 mL 0.5 M EDTA
(pH 8.0). The working solution of TAE is 1X (Sambrook and Russell, 2001).
2.3.2 30% Acrylamide solution
Per 100 mL: 29.2 g acrylamide and 0.8 g N’N’-bis-methylene-acrylamide. Store
at 4°C in the dark (BioRad Mini-PROTEAN® Tetra Cell Instruction Manual
#10007296).
2.3.3 Separating gel (12%)
Per 10 mL: 3.4 mL water, 4.0 mL 30% acrylamide solution, 2.5 mL 1.5 M
Tris-HCl (pH 8.8), 0.1 mL 10% (w/v) SDS, 0.1 mL 10% (w/v) ammonium persulfate
(APS), 5 µL tetramethylethylenediamine (TEMED) (BioRad Mini-PROTEAN® Tetra
Cell Instruction Manual #10007296).

18
2.3.4 Resolving gel (4%)
Per 10 mL: 6.1 mL water, 1.3 mL 30% acrylamide solution, 2.5 mL 0.5 M
Tris-HCl (pH 6.8), 0.1 mL 10% (w/v) SDS, 0.1 mL 10% (w/v) APS, 10 µL TEMED
(BioRad Mini-PROTEAN® Tetra Cell Instruction Manual #10007296).
2.4 Organisms
2.4.1 Bacteria
Escherichia coli (E. coli) strain XL1-Blue (Agilent, Cat. No. 200249) was used
for the maintenance, and propagation of plasmid DNA. E. coli strain SG13009 (Qiagen,
Cat. No. 34210) was used for recombinant protein expression. E. coli strain SG13009
harbours the plasmid pREP4, which confers kanamycin resistance. Agrobacterium
tumefaciens (A. tumefaciens) strain GV3101 was used to transform Papaver somniferum.
A. tumefaciens strain GV3101 is resistant to gentamycin and rifampicin, and carries a
disarmed Ti plasmid to facilitate T-DNA transfer. E. coli and A. tumefaciens strains were
maintained at 37°C and 28°C, respectively, in liquid or on solid LB media supplemented
with the appropriate antibiotics. Bacterial cultures grown in liquid media were shaken at
200 RPM.
2.4.2 Plants
Papaver somniferum cv. Bea’s Choice (The Basement Shaman, Woodstock, IL,
http://www.basementshaman.com) was used for VIGS, and expression analysis (qPCR)
experiments; P. somniferum cultivars 40, Veronica, and Marianne were used for
localization experiments; tissues from Bea’s Choice, as well as cultivars Veronica,
Roxanne, Marianne, 40, T, L, and Przemko provided by Dr. Peter Facchini, were
harvested for purification of total soluble proteins (Desgagné-Penix et al., 2012). Papaver

19
somniferum seeds were germinated in growth chambers (Conviron, Winnipeg, MB) under
a 16-hour photoperiod using a combination of fluorescent and incandescent lights. Day
and night temperatures were set to 20°C and 18°C, respectively.
Elicited Eschscholzia californica (E. californica) cell cultures were used to purify
benzophenanthridine alkaloids. E. californica cell cultures (Deutsche Sammlung von
Mikroorganismen und Zellkulturen, Cat. No. PC-1096) were grown by Guillaume
Beaudoin in liquid Gamborg’s B5 media (Phytotechnology Laboratories, Cat. No. G398)
supplemented with 20 g/L sucrose, 1 g/L casein hydrolysate, and 1 mg/L
2,4-dichlorophenoxyacetic acid. Cultures were grown at room temperature on a gyratory
shaker (125 RPM), and elicited with yeast extract. Cell filtrate was collected 96-hours
post elicitation.
2.5 Plasmids
2.5.1 Subcloning plasmid
The TA-cloning vector pGEM-T (Promega, Cat. No. A3600) was used for the
non-directional subcloning of polymerase chain reaction (PCR) products. The pGEM-T
vector is a high-copy number vector that confers ampicillin resistance to E. coli.
Advantages to pGEM-T subcloning include easy PCR cloning via T-overhangs, and
blue/white selection when transformed into E. coli containing a mutant lacZ gene (β-
galactosidase), such as XL1-Blue. The multiple cloning site (MCS) is within the α-
peptide coding region of β-galactosidase. Successful ligation of amplicons into pGEM-T
disrupts β-galactosidase, and can be identified as white colonies on solid LB media
containing X-gal and IPTG. Amplicons in pGEM-T were analyzed prior to downstream
applications (e.g. recombinant protein expression, and VIGS).
20
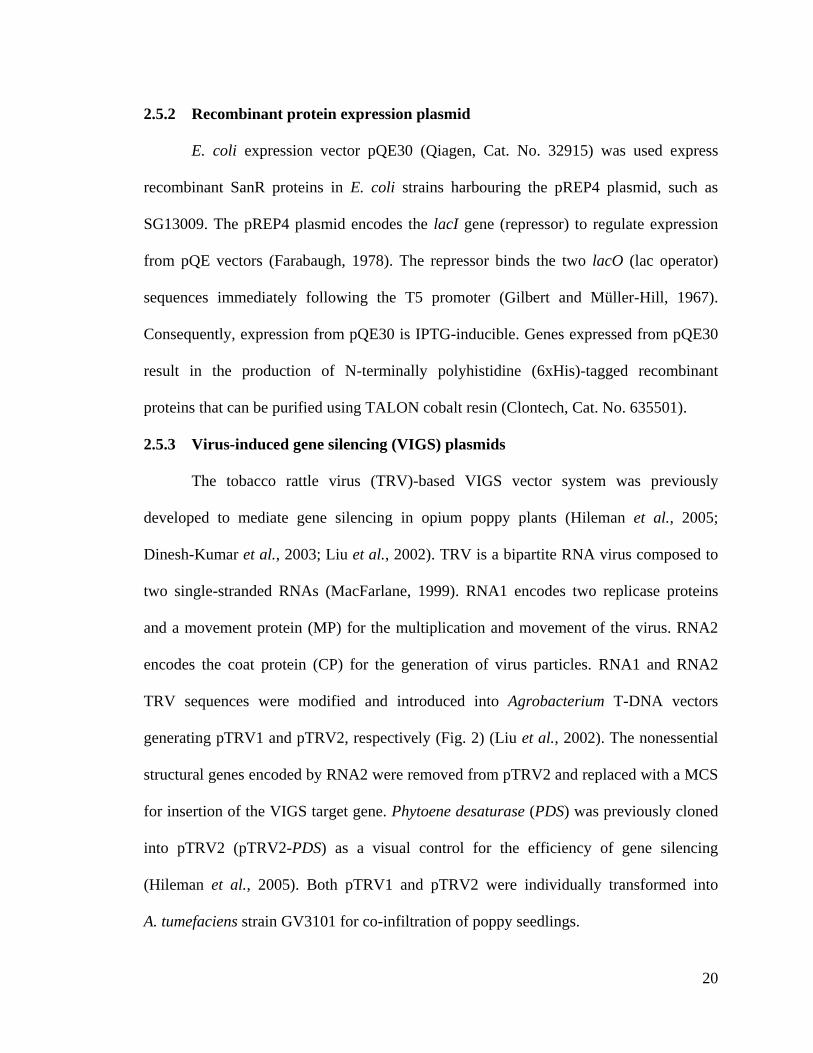
2.5.2 Recombinant protein expression plasmid
E. coli expression vector pQE30 (Qiagen, Cat. No. 32915) was used express
recombinant SanR proteins in E. coli strains harbouring the pREP4 plasmid, such as
SG13009. The pREP4 plasmid encodes the lacI gene (repressor) to regulate expression
from pQE vectors (Farabaugh, 1978). The repressor binds the two lacO (lac operator)
sequences immediately following the T5 promoter (Gilbert and Müller-Hill, 1967).
Consequently, expression from pQE30 is IPTG-inducible. Genes expressed from pQE30
result in the production of N-terminally polyhistidine (6xHis)-tagged recombinant
proteins that can be purified using TALON cobalt resin (Clontech, Cat. No. 635501).
2.5.3 Virus-induced gene silencing (VIGS) plasmids
The tobacco rattle virus (TRV)-based VIGS vector system was previously
developed to mediate gene silencing in opium poppy plants (Hileman et al., 2005;
Dinesh-Kumar et al., 2003; Liu et al., 2002). TRV is a bipartite RNA virus composed to
two single-stranded RNAs (MacFarlane, 1999). RNA1 encodes two replicase proteins
and a movement protein (MP) for the multiplication and movement of the virus. RNA2
encodes the coat protein (CP) for the generation of virus particles. RNA1 and RNA2
TRV sequences were modified and introduced into Agrobacterium T-DNA vectors
generating pTRV1 and pTRV2, respectively (Fig. 2) (Liu et al., 2002). The nonessential
structural genes encoded by RNA2 were removed from pTRV2 and replaced with a MCS
for insertion of the VIGS target gene. Phytoene desaturase (PDS) was previously cloned
into pTRV2 (pTRV2-PDS) as a visual control for the efficiency of gene silencing
(Hileman et al., 2005). Both pTRV1 and pTRV2 were individually transformed into
A. tumefaciens strain GV3101 for co-infiltration of poppy seedlings.

21
Figure 2. TRV-based virus-induced gene silencing vectors. The T-DNA vectors position
TRV cDNA clones between the left and right borders (LB and RB, respectively), and
under the control of the duplicated cauliflower mosaic virus 35S promoter (2x35S) and
nopaline synthase terminator (NOSt). The pTRV1 and pTRV2 encodes two replicase
proteins (134K and 194K), movement protein (MP), 16-kDa cysteine-rich protein (16K),
and coat protein (CP) necessary to propagate viral particles in planta. MCS: multiple
cloning site, Rz: self-cleaving ribozyme. Modified from Hileman et al. (2005).
pTRV1
LB RB Rz NOSt 134K 194K MP 16K 2x35S
pTRV2
SanR VIGS Construct
LB RB 2x35S MCS CP NOSt Rz

22
2.6 Cloning and Transformations
2.6.1 Sequence identification and primer design
Primers were designed to amplify sequences for recombinant protein expression,
gene expression analysis, VIGS, genetic screening, and sequencing. All primers, except
those used for quantitative real-time PCR (qPCR), were tested for self-complementarity,
primer pair complementarity, balanced GC content and similar melting temperature for
primer pairs using DNAMAN (Lynnon BioSoft, Version 8). Primers used for qPCR were
designed in Primer Express (Life Technologies, Version 3).
Papaver somniferum cv. Bea’s Choice transcriptome databases were searched for
sequences with a high degree of amino acid sequence similarity to previously
characterized E. californica SanR (GenBank Accession No. GU338458) (Xiao et al.,
2013; Vogel et al., 2010; Weiss et al., 2006). Four opium poppy SanRs were identified
with greater than 60% amino acid sequence similarity to E. californica SanR (Fig. 3).
Primers were designed to amplify full-length SanRs, as well as a N-terminally truncated
form of SanR3 (SanR3B), from opium poppy cDNA. Primers designed to amplify SanR1-
SanR3 for insertion into the pQE30 expression vector introduced 5’-BamHI and 3’-KpnI
restriction enzyme (RE) cut sites to allow for directional cloning (Table 1). These RE cut
sites were used, if necessary, to also facilitate the directional cloning of SanRs into the
pRSET A expression vector (Invitrogen, Cat. No. V351-20). However, primers used to
amplify SanR4 introduced 5’-SphI and 3’-SalI. Primers complementary to regions
flanking the pQE30 MCS (pQE30-F and pQE30-R) were designed to facilitate
sequencing and/or colony PCR (Table 1). T7 and SP6 primer sequences were used to
sequence pGEM-T inserts and/or for use in colony PCR (Table 1).

23
ECASANR
PSOSANR1
PSOSANR2
PSOSANR3
PSOSANR4
ECASANR
PSOSANR1
PSOSANR2
PSOSANR3
PSOSANR4
ECASANR
PSOSANR1
PSOSANR2
PSOSANR3
PSOSANR4
ECASANR
PSOSANR1
PSOSANR2
PSOSANR3
PSOSANR4
36
36
36
79
63
M - - - - - - - - - - - - - - - - - - - - - - - - - - - A D S S K K - - - - - - - - - - - - - - - - - L T V L L S G A S G L T G S L A F K K L K E R S D K F E V
M - - - - - - - - - - - - - - - - - - - - - - - - - - - A E S N Q K - - - - - - - - - - - - - - - - - IT V L V T G A S G L T G E IA F K K L K E R S D K F V V
M - - - - - - - - - - - - - - - - - - - - - - - - - - - A A LM Q K - - - - - - - - - - - - - - - - - IT V L V T G A S G L T G E IA F K K L K E R S D K F A A
M G L V T R V P L F S S P S S T F S P H K Y S S T T K L F S S S S S S S L S FQ R R T S V V V K A M A S T V IV T G A G G R T G Q IV Y K K L K E R A E - F V A
M R S V SQ IC L S L R N K S K M A C K R C S N K V A M A C S S P K - - - - - - - - - - - - - - - - - K T V L V T G A S G L T G Q F A F K K L K E R S D K L V V
114
113
113
140
139
R G L V R S E A S K Q K L G G G D E I F IG D I S D P K T L E P A M E G ID A L I I L T S A IP R M K P T E E F T A EM I S G G R S E D V ID A S F - - S G P M
R G L V R S E A S K Q R L G G G D E I F L G D V M D K K S L E T A M Q G ID A L I I L T S A V P K V V P G S Y P G A - - - D G K R A E D V F G E S F D F N G P M
R G L V R S E A S K Q K L G G G D E IY L G D IM D K K S L K H A M Q G ID G L V I L T S A V P K IV P G S Y P G A - - - D G K R A E D V F D D S F D Y S G P M
R G L V R T E E S K E K IG G A D D V F V A D IR D A E S IV P A IQ G V D A L V I L T S A V P K M K P G F D P T K - - - - G G R - - - - - - - - - - - - - - -
R G L V R S E G S K K K L G G G N E IY V G D V M K P E S L E P A M K G V D A L I I L T T A IP K M K P G S Y P A N I- - S G A R A E D L ID G S F - - Q G T I
194
193
193
220
219
P E F Y Y D E G Q Y P EQ V D W IG Q K N Q ID T A K K M G V K H IV L V G SM G G C D P D H F L N H M G N G N I L IW K R K A EQ Y L A D S G V P Y T I IR A
P E F Y Y E E G Q F P EQ ID W IG Q K N Q ID T A K S C G V K H IV L V G SM G G T D P N N F L N H M A N G N I L V W K R K A EQ Y L A D S G IP Y T I IR A
P E F F Y A E G Q Y P EQ ID W IG Q K N Q I E T A K A C G V K H IV L V G SM G G T D P N H F L N H M G N G N I L IW K R K A EQ Y L A D S G IP Y T I IR A
P E F F F E D G A N P EQ V D W IG Q K N Q ID A A K A A G V K Q IV L V G SM G G T N L N H P L N S IG N G N I L V W K R K A EQ Y L A D S G IP Y T I IR A
P E F Y F E G G Q Y P EQ V D W IG Q K N Q ID A A K A A G V K H I I L V S T M G S G D P N H P L N S L G N G N I L A W K R K A E E Y L A K S G V P Y T I L R A
273
271
271
299
298
G G L D N K A G G V R E L L V A K D D V L L P T E N G F IA R A D V A E A C V Q A L E I E E V K N K A F D L G S K P E G V G E A T K D F K A L F SQ V T T P F
G G L D N K V G G - R E L L V G K D D E L L S T E N H F IA R A D V A E A C V Q A LQ I E E S K F K A F D L G SM P E G V G E P T K D F K A L F SQ V T T P F
A A L D N K V G G - R E L L V G K D D E L L P T E N G Y IA R A D V A E A C V Q A LQ I E D C K F K A Y D L G S K P E G V G E P T K D F K A L F A L V T T R F
G G LQ D K D G G V R E L V V G K D D E L L E T D IR T IA R A D V A E V C IQ A L L L E E A K F K A L D L A S K P E G T G E P T K D F K T L F SQ I S T R F
G G L D N K Q G G K R Q L L IG K N D E L L P T E K G Y V A R E D V A E A C V Q A V Q L E E V K F K A F D L G SM P E G T G V P T K D F K A L F A P IT T C F
Figure 3. Sequence alignment of sanguinarine reductases. Eschscholzia californica SanR (ECASANR), and Papaver somniferum
SanR (PSOSANR1-PSOSANR4) amino acid sequences were aligned using the M-coffee server (www.tcoffee.org) then colour-coded
in Jalview to visualize percent similarity (Waterhouse et al., 2009; Notredame et al., 2000). Unshaded amino acids share less than
40% sequence similarity. Amino acids shaded with light, medium, and dark gray share 40-59%, 60-79%, and 80-100% sequence
similarity, respectively. Box outlines N-terminal extension of SanR3, compared to SanR1 and SanR2, which is absent in the SanR3B
construct.

24
Table 1. List of primers used for cloning procedures.
Namea
Sequenceb
RE sequence
Direction
Amplicon
size (bp)
Protein size
(kDa)
SanR1-F 5’-GGATCCATGGCAGAATCAAATCAAAAAATC-3’ BamHI Forward 816 29.4
SanR1-R 5’-GGTACCTCAGAAACGAGTGGTGACTAGAGC-3’ KpnI Reverse
SanR2-F 5’-GGATCCATGGCAGCATTAATGCAAAAG-3’ BamHI Forward
816 29.4
SanR2-R 5’-GGTACCTCAGAAAGGAGTAGTGACTTGCG-3’ KpnI Reverse
SanR3-F 5’-GGATCCATGGGTTTAGTGACACGTGTTCC-3’ BamHI Forward
900 or 753 32.1 or 26.8 SanR3B-F 5’-GGATCCATGGCGAGTACTGTGATTGTTACTG-3’ BamHI Forward
SanR3-R 5’-GGTACCTCAGAATCGTGTAGAGATTTGAGAAAAG-3’ KpnI Reverse
SanR4-F 5’-GCATGCATGAGGTCTGTCTCTCAAATTTG-3' SphI Forward
897 32.0
SanR4-R 5’-GTCGACTTAGAAACAAGTAGTGATTGGGG-3’ SalI Reverse
SanR4-F2 5'-GCATGCATGGCATGTTCAAGTCC-3' SphI Forward
897 32.0
SanR4-R2 5'-GTCGACTTAGAAACAAGTAGTGATTGG-3' SalI Reverse

25
Table 1 (continued). List of primers used for cloning procedures.
Namea Sequenceb
RE sequence
Direction
Amplicon
size (bp)
Protein size
(kDa)
T7 5'-AATACGACTCACTATAGG-3' N/A N/A 160 N/A
Sp6 5'-ATTTAGGTGACACTATAG-3' N/A N/A
pQE30-F 5'-GATTCAATTGTGAGCGGATAA-3' N/A Forward
198 N/A
pQE30-R 5'-CCAGATGGAGTTCTGAGG-3' N/A Reverse
aSanR: amplifies SanR coding sequences for expression from pQE30; T7 and Sp6: sequence constructs in pGEM-T vector, or for use in colony PCR (empty
vector amplicon is 160 bp); pQE30: sequence constructs in pQE30 vector, or for use in colony PCR (empty vector amplicon is 198 bp); F: forward primer
complementary to 5’-end of sequence; R: reverse primer complementary to 3’-end of sequence; bItalics: restriction enzyme (RE) recognition sequence;
unformatted: template sequence.

26
Small regions (~150 to 400 bp) of the SanR coding or untranslated region (UTR)
sequences were amplified for insertion into pTRV2 (Table 2; Fig. 4). Primers designed to
amplify these small regions introduced 5’-EcoRI and 3’-XhoI RE cut sites. In order to
silence multiple SanRs, primers were designed to introduce 5’-EcoRI and 3’-KpnI cut
sites in one construct, and 5’-KpnI and 3’-XhoI RE cut sites in another so that they could
be ligated together. Primers were also designed to screen opium poppy plants the
presence of TRV1 (MP, GenBank Accession No. AF166084), and TRV2 (CP, GenBank
Accession No. AF034621) (Table 2). Primers flanking the TRV2 MCS (PYL156F,
PYL156R) were also used to screen poppy plants post-infiltration, as well as to sequence
constructs in the TRV2 vector (Table 2) (Hileman et al., 2005). Primers were also
designed to amplify glyceraldehyde 3-phosphate dehydrogenase (GAPDH) (Table 2).
Primers were designed for conventional and MGB TaqMan qPCR methods
(Table 2). Primers were also designed to analyze the expression of select cytochrome
P450s and reductases, and endogenous reference genes from Papaver somniferum and
Papaver rhoeas (Appendix A1, Table A1.1).
Several Papaver somniferum DRR candidates were also amplified (Appendix A1,
Table A1.1 and Table A1.2). Primers introduced 5’-BamHI and 3’-KpnI RE cut sites to
allow for directional cloning into the pQE30 expression vector. Opium poppy
transcriptome databases were also searched for sequences with a high degree of amino
acid sequence similarity to previously characterized reductases involved in BIA
biosynthesis (Appendix A1, Table A1.1).

27
Table 2. List of VIGS and qPCR primers.
Namea Sequenceb RE Direction Amplicon size (bp)
5UTR-SanR1-F 5'-GAATTCCTAGGCTATATTTTTTCTTATAATATTC-3' EcoRI N/A 210
5UTR-SanR1-R 5'-CTCGAGTTATTTTGTAAGTCTGTAAAAAC-3' XhoI N/A
3UTR-SanR1-F 5'-GAATTCATGTTGAGATCCAAGAACAACTTATCATC-3' EcoRI N/A
215
3UTR-SanR1-R 5'-GAATTCATGTTGAGATCCAAGAACAACTTATCATC-3' XhoI N/A
5UTR-SanR2-F 5'-GAATTCCCTAGAAGAAAGTTTGAATTTTCG-3' EcoRI N/A
167
5UTR-SanR2-R 5'-CTCGAGCTGTGGAAACAAGATGTAATTG-3' XhoI N/A
CDS-SanR2-F 5'-GAATTCTTGGATTGGACAAAAGAAC-3' EcoRI N/A
433
CDS-SanR2-R 5'-CTCGAGTCAGAAAGGAGTAGTGACTTG-3' XhoI N/A
3UTR-SanR2-F 5'-GAATTCAATCTGAGATCCAAGAGCAATTTAG-3' EcoRI N/A
249
3UTR-SanR2-R 5'-CTCGAGCAAAGACCTGACCTCCAAGG-3' XhoI N/A
3UTR-SanR3-F 5'-GAATTCGATTCCATATGCGGTATGTTCTGATTG-3' EcoRI N/A
352
3UTR-SanR3-R 5'-CTCGAGAGTGTTCACAAGCACGATGAAC-3' XhoI N/A

28
Table 2 (continued). List of VIGS and qPCR primers.
Namea Sequenceb RE Direction Amplicon size (bp)
CDS-SanR3-F 5'-GAATTCATGGGTTTAGTGACACGTGTTC-3' EcoRI N/A
133
CDS-SanR3-R 5'-CTCGAGCTGAAGTTCTCCTTTGAAATG-3' XhoI N/A
UTR-SanR1-F 5'-GAATTCATGTTGAGATCCAAGAACAACTTATCATC-3' EcoRI N/A
215 UTR-SanR1-R 5'-GGTACCACTTTAATGCAACTGCAACTATAGG-3' KpnI N/A
UTR-SanR3-F 5'-GGTACCGATTCCATATGCGGTATGTTCTGATTG-3' KpnI N/A
352 UTR-SanR3-R 5'-CTCGAGAGTGTTCACAAGCACGATGAAC-3' XhoI N/A
PYL156F 5'-GGTCAAGGTACGTAGTAGAG-3' N/A Forward
390 PYL156R 5'-CGAGAATGTCAATCTCGTAGG-3' N/A Reverse
OYL195 5'-CTTGAAGAAGAAGACTTTCGAAGTCTC-3' N/A Forward
936 OYL198 5'-GTAAAATCATTGATAACAACACAGACAAAC-3' N/A Reverse
TRV2-CP-F 5'-CTGACTTGATGGACGATTC-3' N/A Forward
305 TRV2-CP-R 5'-TGTGTTTGGATTCGCAG-3' N/A Reverse

29
Table 2 (continued). List of VIGS and qPCR primers.
Namea Sequenceb RE Direction Amplicon size (bp)
TRV1-MP-F 5'-ATGGAAGACAAGTCATTGGTC-3' N/A Forward
759
TRV1-MP-R 5'-TTAAGACGAGTTTTTCTTATTAGACG-3' N/A Reverse
GADPH-F 5'-CTCATTTGAAGGGTGGAGC-3' N/A Forward
216 GADPH-R 5'-GTCATTGCGTGGACAGTGG-3' N/A Reverse
Taqman-SanR1-F 5'-AGATAACAAGGTAGGTGGCAG-3' N/A Forward
106 Taqman-SanR1-R 5'-AACGCAAGCTTCAGCAAC-3' N/A Reverse
Taqman-SanR1-P 5'-GAGAGAAGCTCATCATCCTTCCCGACCA-3' N/A N/A N/A
Taqman-SanR2-F 5'-AAGAGAAAAGCTGAGCAGTATC-3' N/A Forward
109 Taqman-SanR2-R 5'-CCTTTCCAACCAACAACTCC-3' N/A Reverse
Taqman-SanR2-P 5'-CCCACCTTGTTATCTAGAGCAGCAGCTCTTAT-3' N/A N/A N/A

30
Table 2 (continued). List of VIGS and qPCR primers.
Namea Sequenceb RE Direction Amplicon size (bp)
Taqman-SanR3-F 5'-TGAACAGCATTGGAAACGG-3' N/A Forward
140
Taqman-SanR3-R 5'-AACAACAAGCTCTCTCACAC-3' N/A Reverse
Taqman-SanR3-P 5'-ATATTGCTCCGCCTTCCTCTTCCACAC-3' N/A N/A N/A
Taqman-UBI-F 5'-CTCTCGCTGATTACAACATCC-3' N/A Forward
93 Taqman-UBI-R 5'-TGAAACACCATCAACAGACAC-3' N/A Reverse
Taqman-UBI-P 5'-AGACGAAGGACAAGGTGAAGGGTGGA-3' N/A N/A N/A
MGB-SanR1-F 5'-TGGTCGGGAAGGATGATGAG-3' N/A Forward
78 MGB-SanR1-R 5'-GAACGCAAGCTTCAGCAACA-3' N/A Reverse
MGB-SanR1-P 5'-CTCTACTGAAAACCATTT-3' N/A N/A N/A
MGB-SanR2-F 5'-CCTGGTGCTGATGGCAAAA-3' N/A Forward
71 MGB-SanR2-R 5-TCAGGCATTGGACCACTGTAAT-3' N/A Reverse
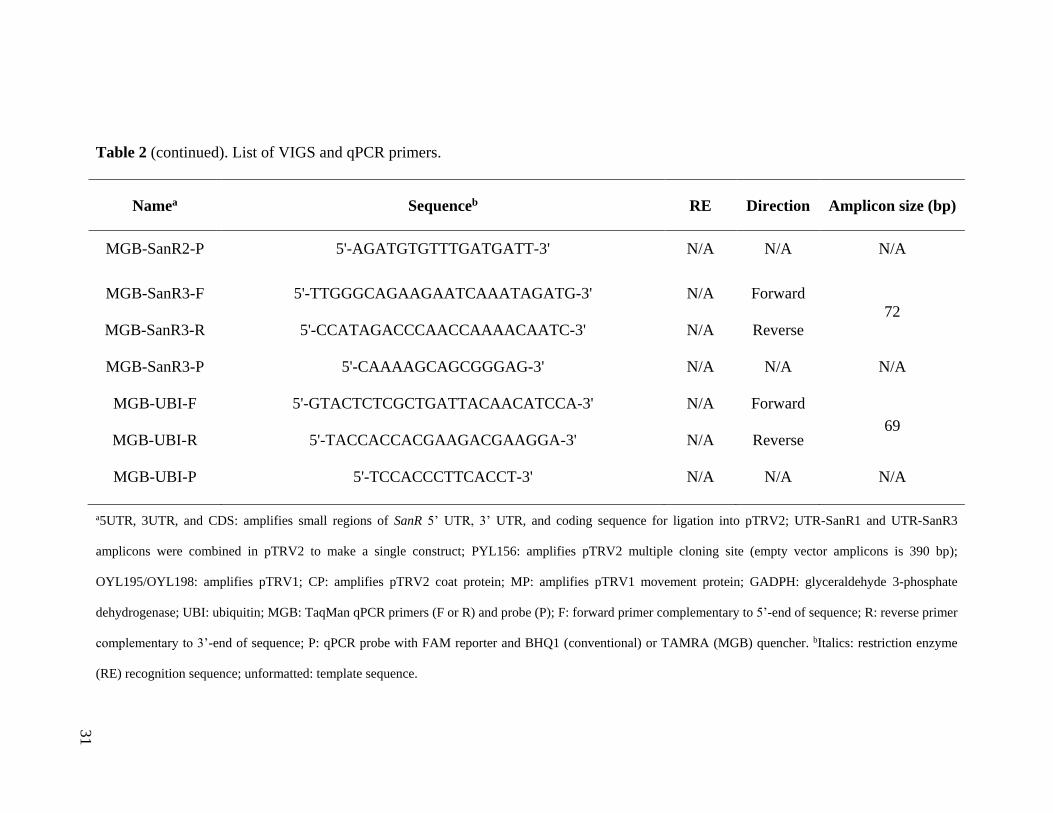
31
Table 2 (continued). List of VIGS and qPCR primers.
Namea Sequenceb RE Direction Amplicon size (bp)
MGB-SanR2-P 5'-AGATGTGTTTGATGATT-3' N/A N/A N/A
MGB-SanR3-F 5'-TTGGGCAGAAGAATCAAATAGATG-3' N/A Forward
72
MGB-SanR3-R 5'-CCATAGACCCAACCAAAACAATC-3' N/A Reverse
MGB-SanR3-P 5'-CAAAAGCAGCGGGAG-3' N/A N/A N/A
MGB-UBI-F 5'-GTACTCTCGCTGATTACAACATCCA-3' N/A Forward
69 MGB-UBI-R 5'-TACCACCACGAAGACGAAGGA-3' N/A Reverse
MGB-UBI-P 5'-TCCACCCTTCACCT-3' N/A N/A N/A
a5UTR, 3UTR, and CDS: amplifies small regions of SanR 5’ UTR, 3’ UTR, and coding sequence for ligation into pTRV2; UTR-SanR1 and UTR-SanR3
amplicons were combined in pTRV2 to make a single construct; PYL156: amplifies pTRV2 multiple cloning site (empty vector amplicons is 390 bp);
OYL195/OYL198: amplifies pTRV1; CP: amplifies pTRV2 coat protein; MP: amplifies pTRV1 movement protein; GADPH: glyceraldehyde 3-phosphate
dehydrogenase; UBI: ubiquitin; MGB: TaqMan qPCR primers (F or R) and probe (P); F: forward primer complementary to 5’-end of sequence; R: reverse primer
complementary to 3’-end of sequence; P: qPCR probe with FAM reporter and BHQ1 (conventional) or TAMRA (MGB) quencher. bItalics: restriction enzyme
(RE) recognition sequence; unformatted: template sequence.

32
Figure 4. Constructs designed to silence sanguinarine reductases (SanRs) using virus-induced gene silencing (VIGS). Double-ended
arrows indicate the small regions (~100-300 bp) of (A) SanR1, (B) SanR2, (C) SanR3, or (D) SanR4 that were cloned into pTRV2.
VIGS constructs are labeled as V1-V8. *Construct V8 was created by combining V2 and V7. **Additional constructs V9-V12
designed by Guillaume Beaudoin. V9 is 100% identical to a region in SanR1 coding sequence (CDS). V10, V11 and V12 share 75 and
34%, 21 and 86%, and 20% and 16% sequence similarity to SanR1 and SanR2, respectively. SanR schematic is to scale. Black and
white boxes indicate UTR and CDS, respectively. Gray box represents predicted transit peptide of SanR3.
V1: SR1-5UTR
218 bp
*V2:
SR1-3UTR
**V9: SR1-CDS
357 bp (100%)
816 bp 215 bp 218 bp
V3: SR2-UTR
167 bp
V5: SR2-3’UTR
249 bp
V4: SR2-CDS
433 bp
816 bp 299 bp 207 bp
*V7: SR3-3’UTR
352 bp
V6: SR3-CDS
133 bp
900 bp 352 bp 144 bp 147 bp
897 bp 174 bp
A
B
C
D

33
Primers were designed to amplify sequences with greater than 50%, 35%, and 50%
amino acid sequence similarity to P. somniferum COR (GenBank Accession No.
AF108432), NOS (GenBank Accession No. JQ659007), and SalR (GenBank Accession
No. DQ316261), respectively (Winzer et al., 2012; Ziegler et al., 2006; Unterlinner et al.,
1999). Primers were designed to introduce 5’-BamHI and 3’-KpnI, or 5’-SphI and 3’-SalI
RE cut sites to allow for directional cloning of reductases into the pQE30 expression
vector.
2.6.2 PCR amplification of DNA and ligation
High-fidelity polymerases were used for amplification from cDNA template when
sequence integrity was necessary (KAPA HiFi HotStart DNA Polymerase, Kapa
Biosystems, Cat. No. KK2501; Platinum Pfx DNA Polymerase, Invitrogen, Cat. No.
11708-013; TaKaRa Ex Taq, Clontech, Cat. No. RR001A; or Phusion high-fidelity DNA
polymerase, NEB, Cat. No. M0530). Green Taq DNA polymerase (GenScript, Cat. No.
E00043) was used for routine PCR reactions, such as screening bacterial colonies for
construct insertion into pGEM-T or pQE30 vectors, or presence of TRV vectors. Green
Taq DNA polymerase was also used to A-tail PCR products amplified by high-fidelity
polymerases with 3’ to 5’ exonuclease activity. PCR reactions and thermocycler
conditions were set according to the manufacturer’s instructions.
A-tailed PCR products were directly ligated into pGEM-T according to
manufacturer’s instructions (Promega, Cat. No. A3600). Constructs to be ligated into
pQE30 or pTRV2 were excised from pGEM-T using the appropriate REs, and digests
were incubated at 37°C for 1 hour. PCR products and RE digests were size separated
using 1% (w/v) agarose gels, containing 0.5 μg/mL ethidium bromide, in TAE buffer.

34
Bands corresponding to DNA of the appropriate size were excised and purified using the
AxyPrep DNA Gel Extraction Kit (Axygen, Cat. No. AP-GX-250) then ligated into
pQE30 or pTRV2 using T4 DNA ligase (NEB, Cat. No. M0202) according to
manufacturer’s instructions, except that reactions were incubated at 4°C overnight.
2.6.3 Bacterial transformation
Chemically competent E. coli were prepared according to the CaCl2 method, and
were transformed with plasmid DNA using the heat shock transformation method
(Sambrook and Russell, 2001). For each transformation reaction, 100 μL competent cells
were thawed on ice then mixed with ~1 μg plasmid DNA or an entire ligation reaction
(10 μL). The cells were incubated on ice 10 minutes then heat shocked for 30 seconds at
42°C, and immediately placed back on ice. Pre-warmed LB media (1 mL) was added to
the transformation reaction, and incubated for one hour at 37°C with shaking. Only
~100 μL of transformation reactions with plasmid DNA was plated on solid LB media
supplemented with the appropriate antibiotics, and X-gal and IPTG, if necessary.
However, entire transformation reactions were plated when E. coli were transformed with
ligation products. Plates were incubated at 37°C overnight or until the formation of single
bacterial colonies. Positive clones were identified using blue-white screening (pGEM-T
only), antibiotic resistance, colony PCR and/or restriction enzyme digestion, and
sequencing methods. For colony PCR, individual clones were spotted onto a solid plate
of LB media for reference, and then added to water in the PCR reaction. The initial
denaturation step (94°C for 10 min) was extended to ensure complete E. coli lysis.
Constructs in pGEM-T and pQE30 were amplified using T7 and SP6, or pQE30-F and
pQE30-R primer pairs, respectively (Table 1). For RE digest, E. coli colonies were grown

35
overnight at 37°C in LB media supplemented with appropriate antibiotics, then cells were
pelleted, and plasmid DNA was isolated using a modified alkaline lysis method
(Birnboim and Doly, 1979). For E. coli clones containing the correct construct of the
correct size, plasmid DNA was extracted with a kit (e.g. AccuPrep Plasmid Mini
Extraction Kit, Molecular Biology Products Inc., Cat. No. K-3030) then sent for
sequencing by Eurofins MWG Operon (Eurofins Genomics, Huntsville, AL.). All
constructs were checked for correct reading frame, and nucleotide sequence using
DNAMAN (Lynnon Biosoft, Version 8).
Electrocompetent A. tumefaciens were prepared (Sambrook and Russell, 2001),
then transformed using the Gene Pulser II System (Bio-Rad) set to 2.0 kV, 25 µF
capacitance, and 400 Ω resistance. Plasmid DNA was ethanol precipitated and
resuspended in double-distilled water to remove excess salt. Immediately following
electroporation, A. tumefaciens recovered in LB for an hour at 28°C with shaking. Cells
were plated on LB media containing gentamycin, rifampicin, and kanamycin. Plates were
incubated 28°C for 2-3 days or until the formation of single colonies. Positive
transformants were identified as colonies that grew on selective media. Bacterial stocks
were frozen in 25% glycerol and stored at -80°C.
2.6.4 Plant transformation
Papaver somniferum were transformed via Agrobacterium infiltration (modified
from Hileman et al., 2005). Seedlings were transplanted to allow for one plant per pot
then allowed to recover a couple days prior to transformation. A. tumefaciens harbouring
pTRV1, pTRV2-SanR constructs, pTRV2-PDS, or empty pTRV2 were grown at 28°C
overnight with shaking in LB media supplemented with gentamycin, rifampicin, and

36
kanamycin. Overnight cultures were used to inoculate induction medium (LB media
containing kanamycin, MES, and acetosyringone), and cultures were grown overnight at
28°C with shaking. A. tumefaciens were pelleted at 3,000 g, and resuspended in
infiltration solution to an absorbance at 260 nm (A260) of 1.5. Agrobacterium were
incubated at room temperature, with shaking, for four hours before poppy infiltration.
P. somniferum seedlings at the 2 to 4 leaf stage were infiltrated at the apical meristem
with a 1:1 mixture of A. tumefaciens harbouring pTRV1 and pTRV2-SanR constructs. As
controls, seedlings were also infiltrated with 1:1 mixtures of A. tumefaciens harbouring
pTRV1 and pTRV2-PDS, or A. tumefaciens harbouring pTRV1 and empty pTRV2.
Plants were grown for 6 weeks post-infiltration then roots were harvested for VIGS
analysis.
2.7 Escherichia coli protein induction, purification, and detection
Recombinant 6xHis-tagged proteins were expressed, and purified using the
QIAexpressionist™ handbook as a guide (5th Ed., Qiagen). E. coli strain SG13009
harbouring pQE30-SanR constructs were grown in 3 mL LB media supplemented with
ampicillin and kanamycin were grown overnight at 37°C with shaking. Overnight
cultures were used to inoculate 1 L LB containing ampicillin and kanamycin. Cultures
were grown at 37°C until optical density at 600 nm (OD600) reached 0.4 to 0.6. Cultures
were induced with 1 mM IPTG then grown at 30°C with shaking for 4 hours. E. coli were
pelleted at 6,000 g, and stored -80°C until purification.
For purification, the E. coli pellet was thawed on ice, and resuspended in 100 mM
sodium phosphate, pH 7.5 containing 1 mM phenylmethylsulfonyl fluoride (PMSF).
Cells were sonicated on ice using the Microson XL2000 Ultrasonic Homogenizer (Fisher

37
Scientific, Cat. No. 15-338-274). Supernatant was collected by centrifugation at
10,000 x g for 15 minutes then added to TALON® metal-affinity resin (Clontech, Cat.
No. 635501), which was pre-equilibrated with 100 mM sodium phosphate, pH 7.5. Resin
and supernatant were shaken on ice for 1 hour. The protein-charged resin was washed
three times with 100 mM sodium phosphate, pH 7.5, and then proteins were eluted
stepwise with 100 mM sodium phosphate supplemented with 25, 50, 75 and 200 mM
imidazole. The 50 mM imidazole fractions were desalted with 100 mM sodium
phosphate using PD-10 desalting columns (GE Healthcare, Cat. No. 17-0851-01).
Protein concentration of imidazole fractions was determined using Bradford
assays (Bradford, 1976), and protein was size-separated on SDS-PAGE then stained with
Coomassie to visualize total protein, or transferred to nitrocellulose membrane (VWR,
Cat. No. CA27376-991) using the conventional wet (tank) transfer method for Western
blot analysis (Tovey and Baldo, 1987). Following protein transfer, nitrocellulose
membrane was blocked with 5% skim milk power in TBS-tween. Recombinant 6xHis-
tagged proteins were detected using 0.2 µg/ml mouse anti-His antibodies (GenScript, Cat.
No. A00186-100), and SanR proteins were detected using a 1:10,000 dilution of the
polyclonal mouse SanR antisera (see section 2.11). Both recombinant and native proteins
were secondarily probed with goat anti-mouse horseradish peroxidase (HRP)-conjugated
antibodies (1:10,000 dilution; BioRad, Cat. No. 170-5047) for visualization using
SuperSignal™ West Pico Chemiluminescent Substrate, an enhanced chemiluminescence
(ECL) detection system (Thermo Scientific, Cat. No. 34077). Western blots were imaged
using X-ray film (VWR Cat. No. IB1651454).

38
2.8 Plant protein purification, and detection
Stem, root, leaf, and capsule/flower bud tissue were flash frozen in liquid
nitrogen, then ground to a fine powder using a TissueLyser II (Qiagen, Cat. No. 85300)
fitted with 35-mL stainless steel grinding jars with 20 mm grinding balls (Retsch, Cat.
Nos. 01.462.0214 and 05.368.0062, respectively) cooled in liquid nitrogen. Plant protein
extraction buffer was added to equal volumes of powdered tissue then centrifuged at
5,000 x g to remove debris. Proteins were precipitated in 90% (NH4)2SO4 overnight at
4°C. Proteins were pelleted by centrifugation at 5,000 x g, supernatant was removed, and
pellet was resuspended in 50 mM Tris, pH 7.5, and 2 mM EDTA. Protein concentration
was determined using Quick Start™ Bradford 1x Dye Reagent according to
manufacturer’s instructions (BioRad, Cat. No. 500-0205) (Bradford, 1976). Plant proteins
were size-separated on SDS-PAGE then stained with Coomassie or transferred to
nitrocellulose membrane for Western blot analysis. SanR proteins were detected with a
1:100 dilution of mouse SanR3B antisera (see section 2.11), and secondarily probed with
goat anti-mouse HRP-conjugated antibody (1:5,000) for visualization using an ECL
detection system. Western blots were imaged using X-ray film.
2.9 Alkaloids
Various alkaloids were used as substrates for SanR enzyme assays, and as
standards for analyzing VIGS results. Sanguinarine, chelerythrine, papaverine, berberine,
noscapine (Sigma-Aldrich, Cat. Nos. S5890, C2932, P3510, B3251, and 363960,
respectively), canadine (ChromaDex, Cat. No. ASB-00020155), cryptopine (MP
Biomedicals, Cat. No. 0520114201), and 1,2-dehydroreticuline (Toronto Research
Chemicals, Cat. No. D230065) were all purchased. Morphine and codeine, and reticuline

39
were gifts from Sanofi-Aventis (Paris, France; http://en.sanofi-aventis.com), and
Tasmanian Alkaloids (Westbury, Australia; http://www.tasalk.com.au), respectively.
Thebaine was prepared by Dr. Jill Hagel from P. somniferum latex (Hagel and Facchini,
2010). Chelirubine and macarpine were purified from elicited E. californica cell culture
filtrate by thin-layer chromatography (TLC) (see section 2.9.1). Dihydrosanguinarine,
dihydrochelerythrine, dihydrochelirubine, and dihydromacarpine were produced by
sodium borohydride reduction of sanguinarine, chelerythrine, chelirubine, and macarpine,
respectively.
2.9.1 Isolation of benzophenanthridine alkaloids
Eschscholzia californica cell cultures treated with yeast extract were harvested
96-hours post-elicitation. Cell filtrate (media) was collected using vacuum filtration,
freeze-dried then resuspended in methanol (300 µL/10mg) to extract alkaloids. Alkaloid
extraction was spotted onto silica gel 60 F254 TLC plates (EMD Millipore, Cat. No.
105735), and allowed to dry before being developed using toluene:methanol (9:1)
(protocol modified from Baerheim-Svendsen and Verpoorte, 1983). Plates were
visualized using long-wave UV light (365 nm) to identify benzophenanthridine alkaloids
by color: chelirubine is a purple-red, sanguinarine is orange, macarpine is red, and
chelerythrine is a yellow-green (Shamma, 1972). Individual spots corresponding to the
benzophenanthridines were scraped off the TLC plate, and incubated in methanol at 65°C
for 30 minutes to extract alkaloids from silica. Extract was filtered using Millex-GV
Syringe Filters, 0.22 µm (EMD Millipore) then speed vacuumed to concentrate sample.
Alkaloid identities were confirmed by LC-MS (see section 2.13), and concentrations
were calculated using extinction coefficients (Krane et al., 1984).

40
2.10 Enzyme assays
In vitro enzyme assays were performed as 50-μL reactions in 100 mM sodium
phosphate, pH 7.5, using 1 μg recombinant SanR (desalted 50 mM-imidazole fraction),
1 mM NADPH or NADH (BioShop Cat. Nos. NAD004 and NAD002), and 0.1 to 10 mM
alkaloid substrate. To determine temperature and pH optima, and substrate range,
alkaloid concentration was 5 μM. For temperature optima, 100 mM sodium phosphate
buffer, pH 7.5, was incubated at 4, 16, 21, 30, 37, 42, 55 and 65°C, prior to the addition
of protein and NAD(P)H. For pH optima, various 100 mM buffers were used to obtain a
pH range of 5-10: citrate (pH 5), sodium phosphate (pH 6, 7, and 8), Tris (pH 8), and
glycine (pH 9 and 10). Assays were incubated at room temperature for pH curves, and
substrate range. Assays were incubated for one hour then reactions were stopped by
adding 950 μL methanol.
To determine the Michaelis constant (Km) of SanRs, 50-μL reactions were
performed in 100 mM sodium phosphate, pH 7.5, with 1 mM NADPH, 1 μg recombinant
SanR, and varying amounts of sanguinarine (0.1 to 10 mM). Reactions were incubated at
room temperature for one hour then quenched with methanol. Michaelis-Menten kinetic
constants (Km, and Vmax) were determined using the Enzyme Kinetics Wizard package
from SigmaPlot 12.0 (Systat Software; San Jose, CA).
2.11 Antibody production
Recombinant SanRs were purified as described in section 2.7. The 50 mM
imidazole fraction resuspended in 0.85% saline solution using dialysis tubing. Proteins
were diluted to 100-300 μg/mL, and stored as 500 μL aliquots at -80°C. Five-week-old
female Swiss Webster mice (Charles River) were injected with 100 μL SanR antigen

41
(100-300 μg/mL in 0.85% saline) (LESARC, Calgary, AB.). Following the initial
injection, mice were injected 3 more times every 3 weeks. Test bleeds were taken at the
first (pre-immune serum), second, third, and forth injection. Mice were exsanguinated
two weeks after the forth injection. Blood was centrifuged at 300 x g for 5 minutes at
4°C, and supernatant (serum) was collected and stored at -20°C.
2.11.1 Dot blots
Dot blots were used to determine specificity of SanR antisera. Recombinant SanR
protein in 0.85% saline solution (100-300 μg/mL) was diluted 1/10, 1/100, and 1/1000.
The four dilutions, for SanR1, SanR2, and SanR3B, were spotted (1 μL) on nitrocellulose
membrane, as well as 0.5 μL of mouse antisera as a positive control, and allowed to dry.
Membranes were blocked with 5% skim milk in TBS-Tween then incubated with SanR
antisera (1:10,000 dilution), and secondarily probed with goat anti-mouse HRP-
conjugated antibodies (1:10,000 dilution). Blots were visualized using ECL to expose
X-ray film.
2.12 Immunolocalization
2.12.1 Tissue fixation and embedding
Large sections of opium poppy stem, root, leaf, and capsule from cultivars
Marianne, Veronica, and 40 were immediately placed into 50 mM piperazine-N,N′-
bis(2-ethanesulfonic acid) (PIPES), pH 7.0, containing 4% paraformaldehyde (PFA)
under vacuum for a couple hours. Tissues were cut into approximately 5 mm sections
then placed into glass vials containing with fresh 4% PFA, and fixed overnight. Tissues
were placed under vacuum, and then rinsed in 50 mM PIPES, pH 7.0 before incubation in
50%, 70%, 90%, and 100% (v/v) ethanol for 2 hours in each solution to facilitate
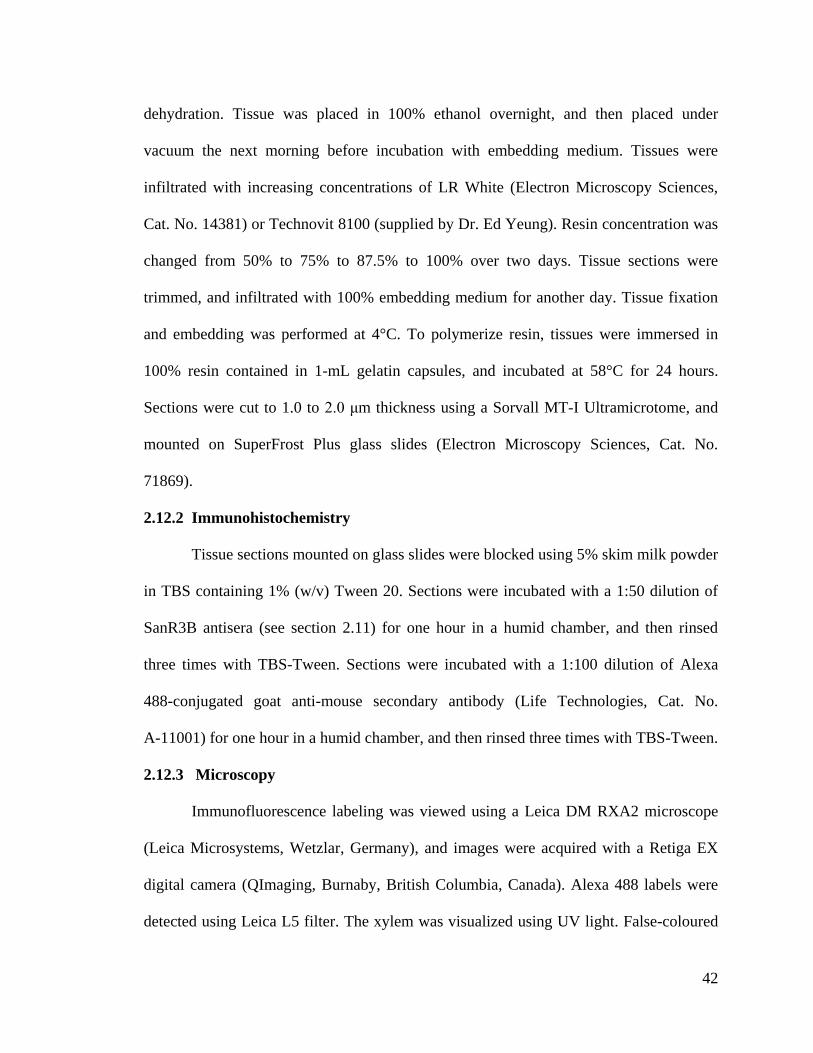
42
dehydration. Tissue was placed in 100% ethanol overnight, and then placed under
vacuum the next morning before incubation with embedding medium. Tissues were
infiltrated with increasing concentrations of LR White (Electron Microscopy Sciences,
Cat. No. 14381) or Technovit 8100 (supplied by Dr. Ed Yeung). Resin concentration was
changed from 50% to 75% to 87.5% to 100% over two days. Tissue sections were
trimmed, and infiltrated with 100% embedding medium for another day. Tissue fixation
and embedding was performed at 4°C. To polymerize resin, tissues were immersed in
100% resin contained in 1-mL gelatin capsules, and incubated at 58°C for 24 hours.
Sections were cut to 1.0 to 2.0 μm thickness using a Sorvall MT-I Ultramicrotome, and
mounted on SuperFrost Plus glass slides (Electron Microscopy Sciences, Cat. No.
71869).
2.12.2 Immunohistochemistry
Tissue sections mounted on glass slides were blocked using 5% skim milk powder
in TBS containing 1% (w/v) Tween 20. Sections were incubated with a 1:50 dilution of
SanR3B antisera (see section 2.11) for one hour in a humid chamber, and then rinsed
three times with TBS-Tween. Sections were incubated with a 1:100 dilution of Alexa
488-conjugated goat anti-mouse secondary antibody (Life Technologies, Cat. No.
A-11001) for one hour in a humid chamber, and then rinsed three times with TBS-Tween.
2.12.3 Microscopy
Immunofluorescence labeling was viewed using a Leica DM RXA2 microscope
(Leica Microsystems, Wetzlar, Germany), and images were acquired with a Retiga EX
digital camera (QImaging, Burnaby, British Columbia, Canada). Alexa 488 labels were
detected using Leica L5 filter. The xylem was visualized using UV light. False-coloured

43
images were generated in Photoshop (Adobe, CS5, Version 12.0). Light microscopy
images were captured using the Leica microscope and the Retiga camera mounted with a
RGB color liquid crystal filter (QImaging).
2.13 Virus-induced gene silencing
Papaver somniferum seedlings, grown to the 2-4 leaf stage, were pressure-
infiltrated with Agrobacterium (see section 2.6.4) at the apical meristem. A. tumefaciens
harbouring pTRV1 were mixed, in equal volumes, with A. tumefaciens harbouring
pTRV2-SanR constructs designed to silence one or multiple SanRs (Table 2; Fig. 4).
Previous pTRV2-SanR constructs cloned by Guillaume Beaudoin were also infiltrated
into opium poppy. Six-weeks post-infiltration, root tissue from individual plants was
harvested. Roots were washed to remove excess soil then flash frozen in liquid nitrogen,
and stored at -80°C until RNA extraction.
2.13.1 RNA extraction and cDNA synthesis
RNA was extracted from opium poppy tissues (stem, root, leaf, and
capsule/flower bud) using CTAB (modified from Meisel et al., 2005). Either TissueLyser
Adapter Sets (2 x 24; Qiagen, Cat. No. 69982), or 35-mL stainless steel grinding jars with
20 mm grinding balls (Retsch, Cat. Nos. 01.462.0214 and 05.368.0062, respectively)
were pre-cooled in liquid nitrogen for use with a TissueLyser II (Qiagen, Cat. No. 85300)
to grind plant tissue to a fine powder. Oscillation frequency was set to 30 Hz for 1-2
minutes. 2X CTAB RNA extraction buffer pre-heated to 65°C then 500 mL was added to
100-200 μL ground tissue, and incubated at 65°C for 10 minutes. Nucleic acids were
extracted with chloroform:isoamyl alcohol (24:1) until the aqueous phase was free of
particulate matter, then the aqueous phase incubated with 0.25X 10 M LiCl overnight at

44
4°C to precipitate RNA (Sambrook and Russell, 2001; Barlow et al., 1963). The
supernatant was discarded, or incubated with 100% ethanol to precipitate DNA, and the
pellet was washed with 70% ethanol then resuspended in DEPC-treated water. RNA was
treated with DNase I according to the manufacturer’s instructions (NEB, Cat. No.
M0303S) then RNA quality and quantity was determined using a NanoDrop ND-1000
UV-Vis Spectrophotometer (Thermo Scientific) (Bustin et al., 2009). Complementary
DNA (cDNA) was synthesized from 1 μg total RNA using the Moloney Murine
Leukemia Virus reverse transcriptase (M-MLV RT; Invitrogen, Cat. No. 28025-013)
according to the manufacturer’s instructions, and was diluted with equal volumes of
DEPC-treated water for use in qPCR.
2.13.2 Quantitative real-time PCR
Primer and TaqMan minor groove binder (MGB) probe pairs were designed to
amplify target gene of interest (e.g. SanR) or ubiquitin as an endogenous reference gene
(Table 2). TaqMan MGB probes were ordered with a 5’ 6-FAM reporter dye, and a 3’
non-fluorescent quencher (NFQ) dye (Life Technologies). Quantitative real-time PCR
(qPCR) reactions were performed in an Applied Biosystems 7300 real-time PCR
system (Life Technologies) using 1 μL diluted cDNA (see section 2.11.1), 250 nM
forward primer, 250 nM reserve primer, 250 nM TaqMan MGB probe, and 0.5X
PerfeCTa qPCR FastMix II with Rox (Quanta Biosciences, Cat. No. 95118). Initial
denaturation occurred at 95°C for 3 minutes, followed by 40 cycles of 10 seconds at 95°C
then 60 seconds at 60°C. Data was collected each cycle at the end of the 60°C incubation.
Relative gene expression was calculated using the comparative CT method (Livak and
Schmittgen, 2001).

45
2.13.3 Root alkaloid extraction
Opium poppy roots were flash-frozen in liquid nitrogen, and ground to a fine
powder with a TissueLyser II (Qiagen), fitted with 2 x 24 TissueLyser Adapter Sets
pre-cooled at -80°C, at 30 Hz for 2 minutes. Alkaloids were extracted in methanol
(20 mL/g dry weight) (modified from Farrow and Facchini, 2013). Extracts were
sonicated then incubated overnight at -20°C. Extracts were centrifuged at 14,000 g for 10
minutes at 4 °C to remove debris. A 1:20 dilution was prepared LC-MS analysis.
2.14 Liquid chromatography-mass spectrometry
Enzyme assays, VIGS samples, and TLC-purified alkaloids were analyzed by
liquid chromatography-mass spectrometry (LC-MS) using a 1200 Liquid Chromatograph
and a 6410 Triple Quadruple Mass Spectrometer (Agilent Technologies, Santa Clara,
CA) (protocol modified from (Dang and Facchini, 2014; Farrow et al., 2012). Samples (1
to 10 μL) were injected onto a Poroshell 120 SB C18 column (2.1 mm × 50 mm, 2.7 μm
particle size, Agilent Technologies), and eluted at a flow rate of 0.7 mL/min over a
gradient of solvent A (95:5 10mM ammonium acetate, pH 5.5:acetonitrile) and solvent B
(100% acetonitrile) as follows: 0-30% solvent B from 0 to 6 minutes, 30-60% solvent B
from 6 to 7 minutes, 60-99% solvent B from 7 to 10 minutes, 99% solvent B from 10 to
14 minutes, 99-0% solvent B from 14 to 14.1 minutes, and 0% solvent B from 14.1 to
19.1 minutes. Eluent from the HPLC column was introduced to the electrospray
ionization source (ESI) operating in positive ion mode, and full-scan mass spectrometry
data was acquired in the range of m/z 200-700. For collision-induced dissociation (CID)
analysis, the precursor m/z was selected, and collision energy of 25 eV was applied.
Retention times and fragmentation spectra were compared to those of authentic BIA

46
standards and published reference spectra for the identification (Farrow et al., 2012). The
concentration of an alkaloid, except for sanguinarine and dihydrosanguinarine, was
estimated by integrating the extracted ion chromatogram (EIC) for the alkaloid of interest
based on their m/z and retention time. The concentration of sanguinarine and
dihydrosanguinarine was determined using a standard curve.
2.15 Statistical analysis
Statistical analyses were performed using unpaired, two-tailed Student’s t-test in
GraphPad Prism 5 (GraphPad Software, San Diego, California, USA) to determine if two
sets of data are significantly different from each other. If variance between the two
groups were unequal, then Welch’s correction was applied.

47
3 RESULTS
3.1 Sanguinarine reductase identification, expression, and purification
Four SanRs (SanR1, SanR2, SanR3, and SanR4) were identified in the
Papaver somniferum cv. Bea’s Choice transcriptomes when queried with E. californica
SanR (GenBank Accession No. GU338458) (Fig. 3). SanR1, SanR2, SanR3, and SanR4
share 79.2, 77.3, 62.7, and 71.2% amino acid sequence similarity to E. californica SanR
(DNAMAN). SanR3 was predicted to localize to chloroplasts, therefore a truncated form
of SanR3, SanR3B, was PCR amplified to remove the sequence corresponding to the 48
amino acids predicted to encode the putative transit peptide (Table 1) (Horton et al.,
2007; Emanuelsson et al., 2007). SanR1, SanR2, SanR3, SanR3B, and SanR4 were all
successfully cloned into the pQE30 expression vector, and transformed into E. coli strains
M15 and SG13009. Initial attempts to amplify SanR4 were unsuccessful; consequently,
SanR4 was never heterologously expressed as a recombinant protein. Expression of
N-terminally 6xHis-tagged SanRs was IPTG-inducible in E. coli SG13009 cultures
harbouring pQE30-SanR constructs (Fig. 5), but no recombinant protein expression was
observed for induced E. coli M15 harbouring pQE30-SanR constructs (data not shown).
N-terminally 6xHis-tagged SanRs were purified using TALON metal affinity resin, and
predominantly eluted with buffer containing 50 mM imidazole (Fig. 6). Therefore, SanRs
were eluted with 0.1 M sodium phosphate buffer containing 50 mM imidazole (Fig. 7)
then desalted for use in enzyme assays and to produce antibodies in mice.

48
M
1
U I
SanR
2
U I
3
U I U I
3B
27.0 kDa
34.6 kDa
66.4 kDa
Figure 5. Expression of recombinant sanguinarine reductases. Three full-length
sanguinarine reductases (SanR1, SanR2, and SanR3) and a N-terminally truncated form
of SanR3 (SanR3B) were cloned into the pQE30 vector then transformed into E. coli
strain SG13009. Soluble proteins from uninduced (U) and IPTG-induced (I) E. coli were
size-separated using 12% SDS-PAGE, and proteins were visualized by Coomassie
staining. Only E. coli induced with 1 mM IPTG expressed recombinant SanRs. The
predicted sizes of SanR1, SanR2, SanR3, and SanR3B are 29.4, 29.4, 32.1, and 26.8 kDa,
respectively. M: protein marker, broad range (NEB, Cat. No. P7702).

49
A
27
34
M 1 2 3 4 5 6 8 7 9 10 11 12 M S F 1 10 11 12
27
34
S F 1 10 11 12 M S F 1 10 11 12 S F 1 10 11 12
SanR1 SanR2 SanR3 SanR3B
23
30
46
B Imidazole concentration (mM)
27
34
Sa
nR
1
27
34
Sa
nR
2
27
34
Sa
nR
3
Sa
nR
3B
Figure 6. Purification of sanguinarine reductases using TALON metal affinity resin. IPTG-induced E. coli expressing P. somniferum
sanguinarine reductases (SanRs) were lysed, and supernatant (S) was applied to a gravity column containing TALON resin. Flow
through (F) was collected then proteins were eluted with sodium phosphate buffer containing various concentrations of imidazole.
Proteins were size-separated on 12% SDS-PAGE, and total proteins were stained with Coomassie (A, B: top row). His-tagged proteins
were detected using a mouse anti-His antibody, and secondarily probed with a horseradish-peroxidase conjugated goat anti-mouse
antibody. Western blots were visualized using an enhanced chemiluminescent system (B: bottom row). M: protein marker (NEB, Cat.
Nos. P7702 and P7709) with approximate molecular weights (kDa) indicated on left-hand side of gel or blot; 1-10: 5 mM stepwise
increase in imidazole concentration from 5 to 50 mM; 11 and 12: 75 and 100 mM imidazole, respectively.

50
Figure 7. Purification of recombinant sanguinarine reductases. Sanguinarine reductases (SanRs) were purified using TALON metal
affinity resin eluted with sodium phosphate buffer containing 50 mM imidazole, desalted then quantified using Bradford reagent.
Purified proteins (5 µg) were size-separated on 12% SDS-PAGE then stained with Coomassie (A), or transferred to nitrocellulose
membrane for Western blot analysis (B). Recombinant proteins were detected with an anti-His antibody then secondarily probed with
a horseradish-peroxidase conjugated goat anti-mouse antibody, and visualized using an enhanced chemiluminescent system.
1 2 3 3B M
SanR
27.0 kDa
34.6 kDa
A
1 2 3 3B M
SanR
23 kDa
30 kDa
B

51
3.2 Biochemical characterization of sanguinarine reductases in vitro
Several benzylisoquinoline alkaloids were tested as potential substrates for opium
poppy SanRs, including 1-benzylisoquinoline, phthalideisoquinoline, protoberberine,
protopine, morphinan, and benzophenanthridine alkaloids (Table 3).
3.2.1 Sanguinarine reductase does not reduce 1,2-dehydroreticuline
SanR1, SanR2, or SanR3B did not reduce 1,2-dehydroreticuline to reticuline
(Table 3; Fig. 8). Neither assays with cell lysate (data not shown), nor assays with
purified proteins resulted in the enzymatic reduction of 1,2-dehydroreticuline (Fig. 8).
3.2.2 Purification of benzophenanthridine alkaloids
E. californica root and cell culture filtrate alkaloid extract was separated by TLC
then alkaloid composition of individual bands, as visualized by long-wave UV light, was
analyzed by mass spectrometry (Fig. 9 and 10). Several TLC solvent systems were used
in an attempt to separate benzophenanthridine alkaloids within the root alkaloid extract,
such as toluene:acetone:ethyl acetate (7:2:1), toluene:methanol (9:1), and
chloroform:ethyl acetate:methanol (2:2:1) (Schumacher et al., 1987; Baerheim-Svendsen
and Verpoorte, 1983). Mass spectrometry analysis indicated that benzophenanthridine
alkaloids were present, in high abundance relative to other compounds, only in a single
band when separated using chloroform:ethyl acetate:methanol (2:2:1). Therefore,
alkaloids within this band were further separated by TLC using toluene:methanol (9:1),
which was able to resolve sanguinarine, chelerythrine, chelirubine, and macarpine as
individual bands on the TLC plate (Fig. 9). On the other hand, the cell filtrate alkaloid
extract only separated by TLC using toluene:methanol (9:1) was able to resolve
sanguinarine, chelerythrine, chelirubine, and macarpine (Fig. 9).

52
Table 3. Benzylisoquinoline alkaloids tested as potential substrates of SanRs.
Compound Structure [M]+ or
[M+H]+ Type
1,2-Dehydroreticuline
328 1-Benzylisoquinoline
Papaverine
340 1-Benzylisoquinoline
Noscapine
414 Phthalideisoquinoline
Berberine
336 Protoberberine
Cryptopine
370 Protopine
Thebaine
312 Morphinan

53
Table 3 (continued). Benzylisoquinoline alkaloids tested as potential substrates of SanRs.
Compound Structure [M]+ or
[M+H]+ Type
Sanguinarine
332 Benzophenanthridine
Chelirubine
362 Benzophenanthridine
Macarpine
392 Benzophenanthridine
Chelerythrine
348 Benzophenanthridine
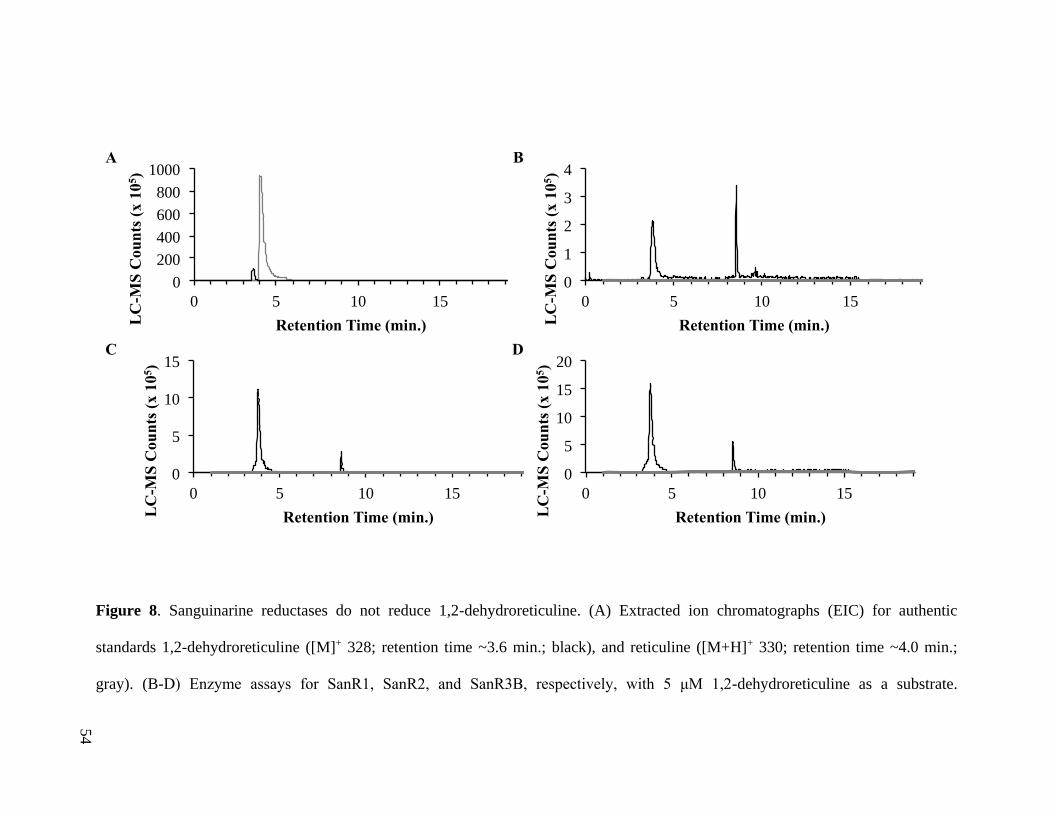
54
0
200
400
600
800
1000
0 5 10 15
LC
-MS
Cou
nts
(x 1
05)
Retention Time (min.)
0
1
2
3
4
0 5 10 15
LC
-MS
Cou
nts
(x 1
05)
Retention Time (min.)
0
5
10
15
0 5 10 15
LC
-MS
Cou
nts
(x
10
5)
Retention Time (min.)
0
5
10
15
20
0 5 10 15
LC
-MS
Cou
nts
(x
10
5)
Retention Time (min.)
A B
C D
Figure 8. Sanguinarine reductases do not reduce 1,2-dehydroreticuline. (A) Extracted ion chromatographs (EIC) for authentic
standards 1,2-dehydroreticuline ([M]+ 328; retention time ~3.6 min.; black), and reticuline ([M+H]+ 330; retention time ~4.0 min.;
gray). (B-D) Enzyme assays for SanR1, SanR2, and SanR3B, respectively, with 5 μM 1,2-dehydroreticuline as a substrate.

55
Origin
1
2
3
4
Origin
1 2
3
4
Origin
Figure 9. TLC separation of benzophenanthridine alkaloids. E. californica root alkaloid
extract was spotted onto silica gel 60 F254 plates then separated using the solvent system
chloroform:ethyl acetate:methanol (2:2:1). Benzophenanthridine alkaloids were present
in the single, orange band indicated by the arrow (left), and were further separated using
toluene:methanol (9:1) (middle). E. californica cell filtrate alkaloid extract was separated
only by the toluene:methanol (9:1) solvent system to separate benzophenanthridine
alkaloids (right). TLC plates were visualized with long-wave UV light (365 nm).
1: Chelirubine, 2: sanguinarine, 3: macarpine, 4: chelerythrine.

56
CID analysis confirmed the identities of sanguinarine (m/z 332.2), chelerythrine
(m/z 348.2), chelirubine (m/z 362.2), and macarpine (m/z 392.2) (Fig. 10). Standard
curves were generated to correlate LC-MS counts to concentration of
benzophenanthridines as determined using extinction coefficients (Krane et al., 1984)
(Fig. 11). Benzophenanthridine alkaloids were treated with sodium borohydride to reduce
sanguinarine, chelerythrine, chelirubine, and macarpine to dihydrosanguinarine,
dihydrochelerythrine, dihydrochelirubine, and dihydromacarpine, respectively (Fig. 12).
3.2.3 Sanguinarine reductases reduce benzophenanthridine alkaloids
SanR1, SanR2, and SanR3B reduce the benzophenanthridine alkaloids
sanguinarine (m/z 332.2), chelerythrine (m/z 348.2), chelirubine (m/z 362.2), and
macarpine (m/z 392.2) to dihydrosanguinarine (m/z 333.4), dihydrochelerythrine
(m/z 349.4), dihydrochelirubine (m/z 363.4), and dihydromacarpine (m/z 393.4),
respectively, using either NADPH or NADH as a co-factor (Table 3; Fig. 13). However,
SanRs produce more dihydrobenzophenanthridine when NADPH is used a co-factor
(Fig. 14). No activity was observed for SanR1, SanR2, or SanR3B with other
benzylisoquinoline alkaloids papaverine (m/z 339.4), noscapine (m/z 413), berberine (m/z
336.4), cryptopine (m/z 369.4), or thebaine (m/z 312.1) (Table 3; data not shown).
3.2.4 Temperature curves
SanRs were assayed with sanguinarine over a range of temperatures and pHs to
determine optimal conditions. A standard curve (Fig. 11) was used to convert
dihydrosanguinarine LC-MS counts to concentration. Only SanR2 assays with 5 μM
sanguinarine at various temperatures were analyzed by LC-MS. The temperature
optimum of SanR2 is approximately 18°C (Fig. 15).
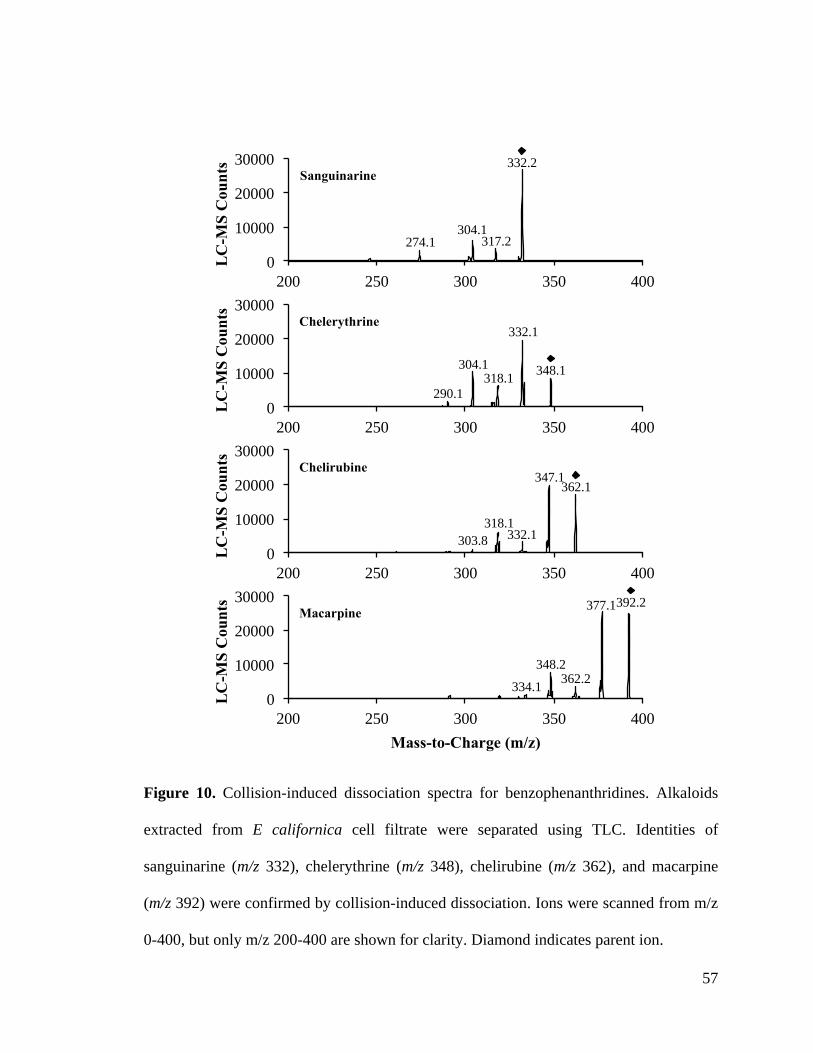
57
Figure 10. Collision-induced dissociation spectra for benzophenanthridines. Alkaloids
extracted from E californica cell filtrate were separated using TLC. Identities of
sanguinarine (m/z 332), chelerythrine (m/z 348), chelirubine (m/z 362), and macarpine
(m/z 392) were confirmed by collision-induced dissociation. Ions were scanned from m/z
0-400, but only m/z 200-400 are shown for clarity. Diamond indicates parent ion.
0
10000
20000
30000
200 250 300 350 400
LC
-MS
Co
un
ts 332.2
317.2 304.1
274.1
Sanguinarine
0
10000
20000
30000
200 250 300 350 400
LC
-MS
Co
un
ts
Mass-to-Charge (m/z)
392.2
362.2
377.1
348.2
334.1
Macarpine
0
10000
20000
30000
200 250 300 350 400
LC
-MS
Co
un
ts
348.1 318.1
332.1
304.1
290.1
Chelerythrine
0
10000
20000
30000
200 250 300 350 400
LC
-MS
Co
un
ts
362.1
332.1
347.1
318.1
303.8
Chelirubine
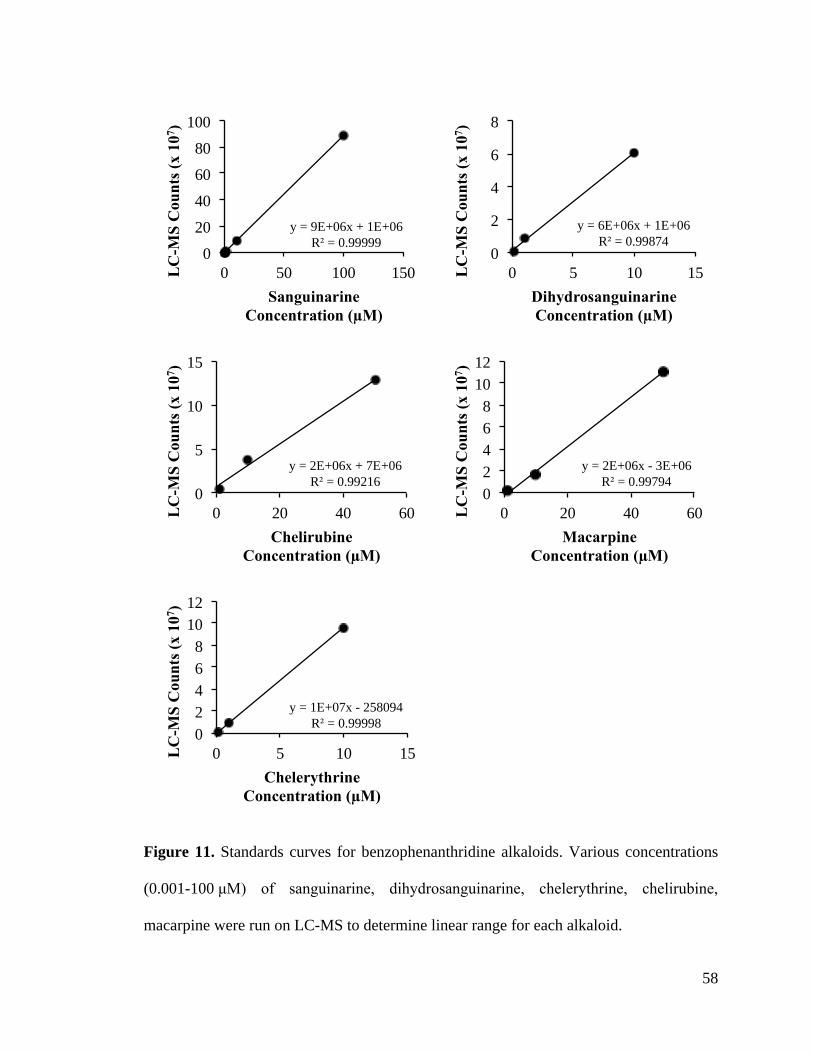
58
y = 9E+06x + 1E+06
R² = 0.99999 0
20
40
60
80
100
0 50 100 150 LC
-MS
Co
un
ts (
x 1
07)
Sanguinarine
Concentration (µM)
y = 6E+06x + 1E+06
R² = 0.99874 0
2
4
6
8
0 5 10 15 LC
-MS
Co
un
ts (
x 1
07)
Dihydrosanguinarine
Concentration (µM)
y = 1E+07x - 258094
R² = 0.99998 0
2
4
6
8
10
12
0 5 10 15 LC
-MS
Cou
nts
(x
10
7)
Chelerythrine
Concentration (µM)
y = 2E+06x + 7E+06
R² = 0.99216 0
5
10
15
0 20 40 60 LC
-MS
Cou
nts
(x
10
7)
Chelirubine
Concentration (µM)
y = 2E+06x - 3E+06
R² = 0.99794 0
2
4
6
8
10
12
0 20 40 60 LC
-MS
Cou
nts
(x
10
7)
Macarpine
Concentration (µM)
Figure 11. Standards curves for benzophenanthridine alkaloids. Various concentrations
(0.001-100 μM) of sanguinarine, dihydrosanguinarine, chelerythrine, chelirubine,
macarpine were run on LC-MS to determine linear range for each alkaloid.

59
0
1
2
3
6.5 7.5 8.5 9.5
Cou
nts
(x
10
6)
Retention Time (minutes)
Retention Time (minutes)
0
2
4
6
6.5 7.5 8.5 9.5
Cou
nts
(x
10
6)
0
2
4
6
8
6.5 7.5 8.5 9.5
Cou
nts
(x
10
6)
DCHR DMAC
SAN CHE CHR MAC
DSAN
0
1
2
6.5 7.5 8.5 9.5
Co
un
ts (
x 1
06)
DCHE
0
2
4
6
6.5 7.5 8.5 9.5
Co
un
ts (
x 1
06)
0
1
2
3
4
6.5 7.5 8.5 9.5
Co
un
ts (
x 1
06)
0
2
4
6
8
6.5 7.5 8.5 9.5
Co
un
ts (
x 1
06)
0
5
10
15
6.5 7.5 8.5 9.5
Cou
nts
(x
10
6)
Figure 12. Non-enzymatic reduction of benzophenanthridines. Benzophenanthridine alkaloids purified from E. californica cell filtrate
(top row) were reduced to dihydrobenzophenathridine alkaloids (bottom row) using sodium borohydride. Samples were analyzed by
LC-MS, and all compounds eluted between 7 and 9 minutes. Extracted-ion chromatographs are shown for sanguinarine (SAN, [M]+
332), dihydrosanguinarine (DSAN, [M+H]+ 334), chelerythrine (CHE, [M]+ 348), dihydrochelerythrine (DCHE, [M+H]+ 350),
chelirubine (CHR, [M]+ 362), dihydrochelirubine (DCHR, [M+H]+ 364), macarpine (MAC, [M]+ 392), and dihydromacarpine
(DMAC, [M+H]+ 394).

60
0
5
10
15
20
25
30
0 5 10 15
Co
un
ts (
x 1
04)
Retention Time (min)
G
0
5
10
15
20
25
30
0 5 10 15
Co
un
ts (
x 1
04)
Retention Time (min)
H
A
0
10
20
30
40
0 5 10 15
Co
un
ts (
x 1
04)
Retention Time (min)
B
0
10
20
30
40
0 5 10 15
Co
un
ts (
x 1
04)
Retention Time (min)
D
0
5
10
15
20
25
30
0 5 10 15
Co
un
ts (
x 1
04)
Retention Time (min)
C
0
50
100
150
200
0 5 10 15
Co
un
ts (
x 1
04)
Retention Time (min)
E
0
10
20
30
40
50
60
0 5 10 15
Co
un
ts (
x 1
04)
Retention Time (min)
F
0
10
20
30
40
0 5 10 15
Co
un
ts (
x 1
04)
Retention Time (min)
+SanR1
+SAN
+NADPH
+SanR2
+SAN
+NADPH
+SanR3B
+SAN
+NADPH
No enzyme
+SAN
+NADPH
+SanR1
+SAN
+NADH
+SanR2
+SAN
+NADH
+SanR3B
+SAN
+NADH
No enzyme
+SAN
+NADH
Figure 13. Sanguinarine reductases reduce benzophenanthridine alkaloids.

61
I J
K L
N M
O P
0
5
10
15
20
0 5 10 15
Co
un
ts (
x 1
04)
Retention Time (min)
0
5
10
15
20
0 5 10 15
Co
un
ts (
x 1
04)
Retention Time (min)
0
20
40
60
80
100
0 5 10 15
Co
un
ts (
x 1
04)
Retention Time (min)
0
20
40
60
80
100
0 5 10 15
Co
un
ts (
x 1
04)
Retention Time (min)
0
50
100
150
0 5 10 15
Co
un
ts (
x 1
04)
Retention Time (min)
0
10
20
30
40
50
0 5 10 15 C
ou
nts
(x 1
04)
Retention Time (min)
0
20
40
60
80
0 5 10 15
Co
un
ts (
x 1
04)
Retention Time (min)
0
50
100
150
0 5 10 15
Co
un
ts (
x 1
04)
Retention Time (min)
+SanR1
+CHE
+NADPH
+SanR2
+CHE
+NADPH
+SanR3B
+CHE
+NADPH
+SanR1
+CHE
+NADH
+SanR2
+CHE
+NADH
+SanR3B
+CHE
+NADH
+SanR1
+CHR
+NADPH
+SanR1
+CHR
+NADH
Figure 13 (continued). Sanguinarine reductases reduce benzophenanthridine alkaloids.

62
Q R
S T
V U
W X
0
50
100
150
200
0 5 10 15
Co
un
ts (
x 1
04)
Retention Time (min)
0
50
100
150
200
0 5 10 15
Co
un
ts (
x 1
04)
Retention Time (min)
0
100
200
300
400
0 5 10 15
Co
un
ts (
x 1
04)
Retention Time (min)
0
50
100
150
200
0 5 10 15
Co
un
ts (
x 1
04)
Retention Time (min)
0
10
20
30
40
0 5 10 15
Co
un
ts (
x 1
04)
Retention Time (min)
0
10
20
30
40
50
0 5 10 15
Co
un
ts (
x 1
04)
Retention Time (min)
0
200
400
600
800
1000
0 5 10 15
Co
un
ts (
x 1
04)
Retention Time (min)
0
100
200
300
400
500
600
0 5 10 15
Co
un
ts (
x 1
04)
Retention Time (min)
+SanR2
+CHR
+NADPH
+SanR3B
+CHR
+NADPH
+SanR1
+MAC
+NADPH
+SanR2
+CHR
+NADH
+SanR3B
+CHR
+NADH
+SanR1
+MAC
+NADH
+SanR2
+MAC
+NADPH
+SanR2
+MAC
+NADH
Figure 13 (continued). Sanguinarine reductases reduce benzophenanthridine alkaloids.

63
Y Z
0
200
400
600
800
1000
1200
0 5 10 15
Cou
nts
(x 1
04)
Retention Time (min)
0
500
1000
1500
0 5 10 15
Cou
nts
(x 1
04)
Retention Time (min)
+SanR3B
+MAC
+NADPH
+SanR3B
+MAC
+NADH
Figure 13 (continued). Sanguinarine reductases reduce benzophenanthridine alkaloids.
Purified SanRs (1 μg) were incubated with benzophenanthridines (5 μM) and 1 mM
NAD(P)H co-factor for one hour at room temperature, quenched with methanol then
analyzed by LC-MS. Extracted-ion chromatograms for benzophenanthridine substrates
(coloured) and dihydrobenzophenathridine products (black) are shown. SanRs reduce
benzophenanthridines using NADPH (left column) or NADH (right column). SanR1
(A-B), SanR2 (C-D), and SanR3B (E-F) reduce sanguinarine to dihydrosanguinarine
(arrow). Without enzyme, sanguinarine (5 μM) incubated with NADPH (G) or NADH
(H) is not converted to dihydrosanguinarine. SanR1 (I-J), SanR2 (K-L), and SanR3B
(M-N) reduce chelerythrine to dihydrochelerythrine (arrow). SanR1 (O-P), SanR2 (Q-R),
and SanR3B (S-T) reduce chelirubine to dihydrochelirubine (arrow). SanR1 (U-V),
SanR2 (W-X), and SanR3B (Y-Z) reduce macarpine to dihydromacarpine (arrow).
Approximate retention times are 7.0 min. for sanguinarine (SAN, [M]+ 332), 8.9 min. for
dihydrosanguinarine ([M+H]+ 334), 7.6 min. for chelerythrine (CHE, [M]+ 348), 8.9 min.
for dihydrochelerythrine ([M+H]+ 350), 8.0 min. for chelirubine (CHR, [M]+ 362), 8.9
min. for dihydrochelirubine ([M+H]+ 364), 8.3 min. for macarpine (MAC, [M]+ 392), and
9.0 min for dihydromacarpine ([M+H]+ 394).

64
0
2
4
6
8
10
12
14
16
18
20
Sanguinarine Chelerythrine Chelirubine Macarpine
Am
ou
nt
of
dih
yd
rob
enzo
ph
ena
nth
rid
ine
pro
du
ct f
orm
ed (
Co
un
ts,
x 1
06)
Substrate
Figure 14. SanR2 reduces benzophenanthridine alkaloids using NADPH or NADH as a
co-factor. SanR2 reduces sanguinarine, chelerythrine, chelirubine, and macarpine to their
corresponding dihydrobenzophenanthridine products dihydrosanguinarine,
dihydrochelerythrine, dihydrochelirubine, and dihydromacarpine, respectively, using
NADPH (black) or NADH (gray) as a co-factor. More product is formed when NADPH,
as compared to NADH, is used a co-factor. Errors bars indicate SD for three technical
replicates.

65
0
1
2
3
4
5
6
7
0 10 20 30 40 50 60 70
Dih
yd
rosa
ng
uin
ari
ne
Cou
nts
(x
10
6)
Temperature (°C)
0.0
0.2
0.4
0.6
0.8
1.0
0 5 10 15 20 25 30
Am
ou
nt
of
pro
du
ct f
orm
ed
(µ
M d
ihy
dro
san
gu
ina
rin
e)
Temperature (°C)
Figure 15. Temperature curve for SanR2. The temperature optimum of SanR2 is
approximately 18°C. Purified SanR2 (1 μg) was incubated with 5 μM sanguinarine and 1
mM NADPH for one hour at 7, 16, 21, 28.5, 37, 42, 55, and 65°C. Assays were analyzed
by LC-MS for amount of dihydrosanguinarine produced. Counts of dihydrosanguinarine
(top) were converted to concentration (bottom) using s standard curve (y=6E+06x +
1E+06). Dihydrosanguinarine counts for assays incubated at 37, 42, 55, and 65°C were
below the linear range, and were omitted from the bottom graph. Error bars indicate SD
for three technical replicates.

66
3.2.5 Michaelis-Menten kinetic analysis
Michaelis–Menten model was used to analyze enzyme kinetics of SanR1 and
SanR3B with sanguinarine as the substrate (Fig. 16). Using LC-MS count values for
dihydrosanguinarine, the Michaelis constant, Km, for SanR1 or SanR3B was calculated as
1.6 and 19.9 μM sanguinarine, respectively (Fig. 16A,B). The concentration of
dihydrosanguinarine was determined using a standard curve (Fig. 11). However, the
majority of count values for dihydrosanguinarine produced by SanR3B were below linear
range. Omitting data points outside linear range for SanR1, resulted in a Michaelis
constant, Km, of 7.3 μM sanguinarine (Fig. 16C). Similarly, the Vmax for SanR1 was
calculated as 4.450 x 10⁻⁶ counts hour-1 μg-1 or 0.6955 μmol hour-1 μg-1 using
dihydrosanguinarine counts or concentration, respectively (Fig. 16A,C). SanR3B Vmax,
5.831 x 10⁻⁶ counts hour-1 μg-1, could only be calculated based using counts (Fig. 16B).
3.3 Immunolocalization of sanguinarine reductases
3.3.1 Antibody production & dot blots
Antisera from test bleeds collected from mice at the time of booster injection with
purified recombinant SanRs showed little to no antigen specificity (Fig. 17). Therefore,
antisera were subjected to antibody scrubbing (Fig. 18). For example, a 1:10,000 dilution
of SanR3B antiserum was non-specific and could detect all SanRs. SanR3B antiserum
was incubated with high concentrations of recombinant SanR1 and SanR2 on
nitrocellulose membrane to remove non-specific antibodies. As a result, SanR3B
antiserum specificity was increased towards recombinant SanR3B. Overall, antibody
scrubbing with excess recombinant enzyme was success in increasing antigen specificity
of SanR1, SanR2, and SanR3B antisera (Fig. 18).

67
Michaelis-Menten
Sanguinarine Concentration (μM)
0 20 40 60 80 100 120
Rat
e
0.0
0.2
0.4
0.6
0.8
Vmax = 0.6955 Km = 7.3
Ra
te (
µm
ol
ho
ur-1
µg
-1)
Sanguinarine Concentration (µM)
Michaelis-Menten
Sanguinarine Concentration (μM)
0 20 40 60 80 100 120
Rat
e (M
S C
ou
nts
ho
ur-
1 μ
g-1
)
0
1e+6
2e+6
3e+6
4e+6
5e+6
6e+6
Vmax = 4.450e+6 Km = 1.6
Ra
te (
LC
-MS
co
un
ts h
ou
r-1 µ
g-1
)
Sanguinarine Concentration (µM)
Michaelis-Menten
Sanguinarine Concentration (μM)
0 20 40 60 80 100 120
Rat
e
0
1e+6
2e+6
3e+6
4e+6
5e+6
6e+6
Vmax = 5.831e+6 Km = 19.9
Rate
(L
C-M
S c
ou
nts
ho
ur-1
µg
-1)
Sanguinarine Concentration (µM)
A
B
C
Figure 16. Michaelis-Menten enzyme kinetics for SanR1 and SanR3B. LC-MS counts of
dihydrosanguinarine produced from sanguinarine by (A) SanR1 and (B) SanR3B were
used to calculate Km and Vmax values. (C) Dihydrosanguinarine counts for SanR1 were
converted to concentration using a standard curve. Graphs were made in SigmaPlot 12.0.

68
Antiserum
Tes
t
ble
ed #
1
Tes
t
ble
ed #
2
Tes
t
ble
ed #
3
SanR1 SanR2 SanR3B
Fin
al
ble
ed
+
SanR1 SanR2
SanR3B
2 3 1 2 3 1
2 3 1
A
B
Figure 17. Generation of antibodies against sanguinarine reductases. (A) Legend
outlining pattern used to spot 1 μL recombinant SanRs on nitrocellulose membrane
(1: 100 ng, 2: 10 ng, 3: 1 ng), and positive (+) control (mouse antiserum). (B) Test bleeds
were obtained 3 weeks after an injection, and the final bleed was obtained by
exsanguination. SanRs were detected using antisera (1:10,000) secondarily probed with a
HRP-conjugated goat anti-mouse antibody. Blots were visualized using an ECL system
and X-ray film. Only representative dot blots are shown to demonstrate immunogenicity
of mouse antisera.

69
46
23
30
46
23
30
46
23
30
Before After
Sa
nR
1
An
tise
rum
Sa
nR
2
An
tise
rum
Sa
nR
3B
An
tise
rum
1 2 3B 1 2 3B
SanR SanR
A B
46
23
30
An
ti-H
is
1 2 3B
SanR C
oom
ass
ie
Sta
in
27
34
M M M
Figure 18. Specificity of antibodies generated against recombinant sanguinarine
reductases. (A) Coomassie stain showing equal loading of 200 ng of recombinant SanR
proteins (top). All recombinant 6xHis-tagged SanRs are recognized by the anti-His
antibody (bottom). (B) Antibodies generated against recombinant SanRs show cross-
reactivity towards other SanRs (left), and specificity is increased after scrubbing (right).
Anti-His antibody was diluted to 0.2 μg/mL, and SanR antisera were diluted 1:10,000 to
detect recombinant SanR proteins. Blots were secondarily probed with a horseradish
peroxidases-conjugated goat anti-mouse antibody (1:10,000), then visualized using an
enhanced chemiluminescence system and X-ray film. . M: marker indicating approximate
molecular weight (kDa).

70
3.3.2 Sanguinarine reductase expression in planta
Antibodies generated against recombinant SanR3B (see section 3.3.1) were used
to detect SanRs in plant protein extracts. SanRs are present in stem, root, leaf, capsule,
and latex of Papaver somniferum cultivars (Fig. 19). SanRs present in root tissue of
opium poppy appear to be larger in size than those found in other tissues (Fig. 19). The
molecular weight of SanRs in root tissue is approximately 30 kDa (Fig. 19), whereas the
molecular weight of SanRs present in stem, leaf, and capsule/bud is a less than 30 kDa
(Fig. 19). The size of SanR in opium poppy latex is smaller than those found in other
tissues, and is between 23 and 30 kDa, and were only detected in the latex of cultivars
Veronica, Marianne, and Bea’s Choice (Fig. 19E). Soluble proteins were only extracted
from aerial organs (stem and leaf combined), and root tissue of Eschscholzia californica.
Opium poppy SanR antibodies only detected protein in the aerial organs, not the root
tissue, and the molecular weight of SanRs in E. californica aerial organs is greater than
30 kDa (Fig. 19A,B).
3.3.3 Epifluorescence microscopy
Antibodies raised against recombinant SanR3B were used to detect sanguinarine
reductases in planta, and localization was visualized using epifluorescence microscopy.
Opium poppy SanRs appear to be localized to phloem in stem, root, and capsule (Fig.
20). No reliable signal was obtained for leaf tissue (data not shown). SanRs were also
detected in seeds within in the capsule (Fig. 20D).

71
A
Ma
Cultivar
R M 40 T L P B V Eca
B
C
D
27
34
27
34 46
30
23
46
30
23
27
34 46
30
23
27
34
Ma
Cultivar
R M 40 T L P B V Eca
E
27
34
46
23
30
30
23
46
Figure 19. Sanguinarine reductases are present in all opium poppy tissues.
72
Figure 19 (continued). Sanguinarine reductases are present in all opium poppy tissues.
Soluble proteins were extracted from different tissues of various cultivars of Papaver
somniferum (Veronica (V), Roxanne (R), Marianne (M), 40, T, L, Przemko (P), and
Bea’s Choice) and Eschscholzia californica (A: root, B: stem, C: leaf, D: capsule,
E: latex). Approximately 5 μg of protein was size-separated on 12% SDS-PAGE then
stained with Coomassie to visualize total proteins (left) or transferred to nitrocellulose
membrane for Western blot analysis (right). SanRs were detected using SanR3B antisera
diluted 1:100. Blots were probed with a HRP-conjugated goat anti-mouse secondary
antibody (1:5,000), then visualized using a ECL system and X-ray film. Ma: marker
indicating approximate molecular weight (kDa).

73

74
A B C D
E F G H
Figure 20. Sanguinarine reductases localized to the phloem. SanRs are present in the stem (A), root (B), and capsule (C), and seeds
(D). (A-D) Xylem was visualized with UV light, and is false-coloured blue. SanRs were detected with a polyclonal antibody generated
against recombinant SanRs, and an Alexa Fluor 488-labeled secondary antibody. Signal was visualized using the L5 filter on a Leica
DM RXA2 microscope, and are false-coloured yellow. Corresponding light microscope images are shown below (E-H).

75
3.4 Virus-induced gene silencing of sanguinarine reductases
3.4.1 Quantitative PCR primer and probe specificity towards SanRs
To study sanguinarine reductase (SanR) expression in planta, primers and
TaqMan MGB probes were designed to specifically amplify an individual gene (see
section 2.6.1; Table 2). Primer and probe set specificity was tested using purified plasmid
(pQE30) containing SanR1, SanR2, or SanR3 as a template for qPCR (Table 4). Plasmid
template was diluted approximately to 1 μg, 1 ng, 0.1 ng, and 0.01 ng. As template
concentration decreased, the CT value increased for a given primer and probe set. With
sufficient template DNA, primer and probe sets specifically amplified the SanR gene they
were designed against (Table 4). For example, amplification using the SanR3 primer and
probe set resulted in average CT values of 26.6, 28.6, and 16.3 when using 1 ng of
pQE30-SanR1, pQE30-SanR2, and pQE30-SanR3 as a template, respectively.
3.4.2 Sanguinarine reductase expression in planta
To determine relative expression of SanRs, expression level was compared to
ubiquitin as an endogenous control. A primer and probe set was designed against
ubiquitin (Table 2), and stem and root cDNA was used as a template. The CT values
obtained using stem and root were 15.4 and 15.7, 16.4 and 17.0, and 17.4 and 18.1 for
templates diluted to 1, 0.5, and 0.25 μg, respectively. Therefore, the average CT values
obtained from qPCR reactions were consistent between stem and root tissues.
To determine SanR expression within four different tissues, stem, root, leaf, and
flower bud/capsule cDNA was diluted to 1, 0.5, and 0.1 μg. Relative gene expression was
determined using the comparative ΔΔCT method (Fig. 21). SanR1 and SanR2 are more
highly expressed in root tissue, as compared to stem, leaf, or flower bud/capsule.

76
Table 4. Quantitative PCR primer and probe specificity towards SanR genes.
SanR1 primer & probe set SanR2 primer & probe set SanR3 primer & probe set
Template
Concentration Template Average Ct Template Average Ct Template Average Ct
1 μg
SanR1 12.9 SanR1 No signal SanR1 23.3
SanR2 21.3 SanR2 14.1 SanR2 23.7
SanR3 22.9 SanR3 23.1 SanR3 13.5
1 ng
SanR1 17.5 SanR1 26.7 SanR1 26.6
SanR2 27.2 SanR2 18.8 SanR2 28.6
SanR3 26.3 SanR3 26.7 SanR3 16.3
0.1 ng
SanR1 21.1 SanR1 26.5 SanR1 30.1
SanR2 23.0 SanR2 22.4 SanR2 30.4
SanR3 23.0 SanR3 26.7 SanR3 20.2
0.01 ng
SanR1 22.9 SanR1 26.6 SanR1 30.4
SanR2 23.0 SanR2 26.4 SanR2 30.6
SanR3 22.8 SanR3 27.1 SanR3 23.6

77
0.000
0.005
0.010
0.015
0.020
0.025
Stem Root Leaf Bud
Rel
ati
ve
Ex
pre
ssio
n L
evel
Opium Poppy Tissue
SanR1
SanR2
SanR3
0.000
0.200
0.400
0.600
0.800
1.000
1.200
Stem Root Leaf Bud
Rel
ati
ve
Ex
pre
ssio
n L
evel
Opium Poppy Tissue
SanR1
SanR2
SanR3
A B
Figure 21. Relative gene expression of opium poppy sanguinarine reductases in different tissues. Total RNA was extracted from
stem, root, leaf, and flower bud/capsule, and was used as a template for cDNA synthesis. Gene expression was analyzed by TaqMan
qPCR using MGB probes. Relative gene expression was calculated using ubiquitin as an endogenous control (A: ΔCT plotted) and the
comparative ΔΔCT method (B: gene expression to the highest expressed gene). Error bars indicate SEM for three technical replicates.

78

79
Conversely, SanR3 is more highly expressed in leaf, as compared to stem tissue, and is
expressed at low levels or not at all in root and flower bud/capsule. Alternatively, it
appears that only SanR1 and SanR3 are expressed in the stem; all SanRs are expressed in
root tissue, but SanR1 is expressed approximately 4 times more than SanR2 or SanR3;
only SanR1 and SanR3 are expressed in leaf tissue; and only SanR1 is expressed in the
flower bud/capsule (Fig. 21).
3.4.3 Knocking down expression in planta using VIGS
VIGS constructs were designed complementary to the 5’- or 3’-untranslated
regions (UTR) or coding sequences of SanRs in order to silence one or multiple genes in
planta (Fig. 4). Approximately 200 poppies were infiltrated with VIGS constructs. RNA
was isolated from transformed plants, reverse-transcribed into cDNA, and analyzed for
presence of coat protein (CP) by PCR. Root gene expression and metabolite composition
were further analyzed for approximately 130 plants CP positive plants (Fig. 22). As a
control, poppies were infiltrated with empty pTRV2 vector (EV) to establish baseline
SanR expression and root metabolite profiles. All SanRs are expressed in root tissue with
SanR1 expression levels approximately four times greater than that of SanR2 or SanR3
(Fig. 23). Metabolite identities of root alkaloids were determined by extracting the
appropriate ion mass and comparing retention times to authentic standards (Fig. 24).
Alkaloids extracted from root samples (20 mL methanol per gram dry weight) were
diluted in methanol (1/20) for LC-MS analysis. Levels of sanguinarine and
dihydrosanguinarine from root samples were in linear range according to the standards
curves (Fig. 11).
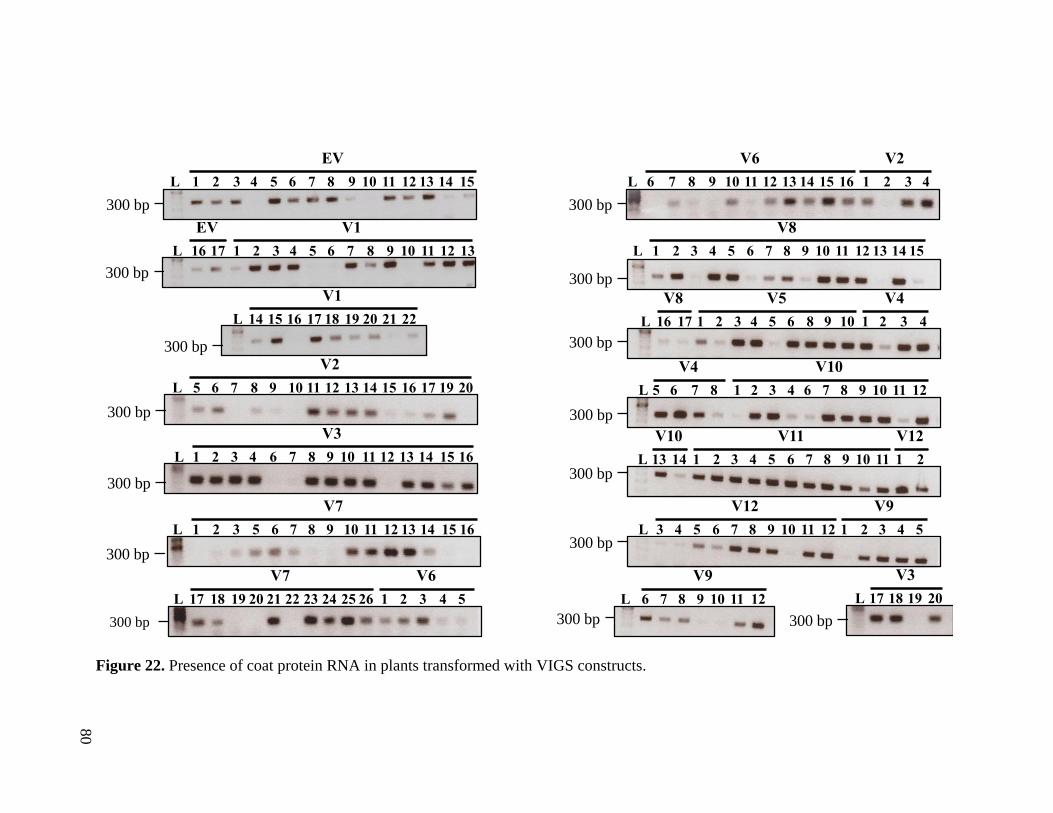
80
300 bp
1 2 3 4 5 6 7 8 9 10 11 12 13 14 15
EV
L
16 17 1 2 3 4 5 6 7 8 9 10 11 12 13
V1
L
EV
300 bp
14 15 16 17 18 19 20 21 22
V1
L
300 bp
300 bp
5 6 7 8 9 10 11 12 13 14 15 16 17 19 20
V2
L
300 bp
V3
1 2 3 4 16 6 7 8 9 10 11 12 13 14 15 L
1 2 3 5 6 7 8 9 10 11 12 13 14 15 16
V7
300 bp
L
6 7 8 9 10 11 12 13 14 15 16 1 2 3
V6
4
V2
300 bp
L
1 2 3 4 5 6 7 8 9 10 11 12 13 14 15
V8
300 bp
L
17 18 19 20 21 22 23 24 25 26 1 2 3 4 5
V7 V6
300 bp
L
16 17 1 2 3 4 5 6 8 9 10 1 2 3 4
V5 V4 V8
300 bp
L
5 6 7 8
V4
1 2 3 4 6 7 8 9 10 11 12
V10
300 bp
L
13 14 1 2 3 4 5 6 7 8 9 10 11 1 2
V11 V10 V12
300 bp L
3 4 5 6 7 8 9 10 11 12
V12
1 2 3 4 5
V9
300 bp L
V3
17 18 19 20
300 bp
L 6 7 8 9 10 11 12
V9
300 bp
L
Figure 22. Presence of coat protein RNA in plants transformed with VIGS constructs.

81
Figure 22 (continued). Presence of coat protein RNA in plants transformed with VIGS constructs. RNA was extracted from root
tissue of plants transformed with pTRV2-VIGS constructs. RNA was reverse transcribed into cDNA and was amplified with primers
designed to amplify coat protein (CP), encoded by the pTRV2 vector. PCR amplicons were size-separated on a 2% agarose gel. DNA
was stained with ethidium bromide and visualized with UV light. Expected CP amplicon size is 305 bp. L: 100 bp ladder; EV: empty
vector; V1 through V12: pTRV2-SanR VIGS constructs #1-12 designed to silence one or multiple SanR genes.

82
A B
C D
0
0.005
0.01
0.015
0.02
SanR1 SanR2 SanR3
Rel
ati
ve
Gen
e E
xp
ress
ion
Gene
0
0.005
0.01
0.015
0.02
0.025
0.03
0.035
EV
1
EV
2
EV
3
EV
4
EV
5
EV
6
EV
7
EV
8
EV
9
EV
10
EV
11
EV
12
EV
13
Rel
ati
ve SanR1
Exp
ress
ion
VIGS Construct
0
0.002
0.004
0.006
0.008
0.01
0.012
0.014
EV
1
EV
2
EV
3
EV
4
EV
5
EV
6
EV
7
EV
8
EV
9
EV
10
EV
11
EV
12
EV
13
Rel
ati
ve SanR2
Exp
ress
ion
VIGS Construct
0
0.005
0.01
0.015
0.02
EV
1
EV
2
EV
3
EV
4
EV
5
EV
6
EV
7
EV
8
EV
9
EV
10
EV
11
EV
12
EV
13
Rel
ati
ve SanR3 E
xp
ress
ion
VIGS Construct
Figure 23. Root gene expression profiles of empty vector control opium poppy plants.

83
Figure 23 (continued). Root gene expression profiles of empty vector control opium poppy plants. Expression of SanR1, SanR2, and
SanR3 in the roots of poppies transformed with an empty pTRV2 vector (EV). Expression levels of (A) SanR1, (B) SanR2, and (C)
SanR3 in the roots of 13 different EV control plants. Error bars represent the SEM of three technical replicates. (D) Average root
expression levels SanR1, SanR2, and SanR3 in control (EV) plants. Error bars represent SEM (n=13).

84
0
50
100
150
0 1 2 3 4 5 6 7 8 9 10
LC
-MS
Co
un
ts x
10
6
Retention Time (min)
0
20
40
60
0 1 2 3 4 5 6 7 8 9 10
LC
-MS
Co
un
ts x
10
6
Retention Time (min)
0
50
100
1 2 3 4 5 6 7 8 9 10
LC
-MS
Co
un
ts x
10
6
Retention Time (min)
0
5
10
15
20
0 1 2 3 4 5 6 7 8 9 10
LC
-MS
Co
un
ts x
10
6
Retention Time (min)
0
20
40
60
0 1 2 3 4 5 6 7 8 9 10
LC
-MS
Cou
nts
x1
06
Retention Time (min)
A B
E
C D
Figure 24. Retention times of benzylisoquinoline alkaloid authentic standards. Extracted
ion chromatographs showing retention times (RT) of (A) noscapine ([M+H]+ 414,
RT=8.0 min), (B) papaverine ([M+H]+ 340, RT=6.9 min), (C) reticuline ([M+H]+ 330,
RT=3.9 min), (D) thebaine ([M+H]+ 312, RT=4.9 min), and (E) cryptopine ([M+H]+
370, RT=5.2). Method time is 19.1 minutes, but only results for time 0-10 minutes are
shown for clarity.

85
Levels of the alkaloids noscapine, papaverine, reticuline, thebaine, morphine, and
cryptopine were determined to be in linear range using the standard curves previously
generated by Guillaume Beaudoin (data not shown). Examples of a total ion
chromatograph (TIC) and extracted ion chromatographs (EICs) used to analyze root
metabolite data are shown for one plant transformed with an empty pTRV2 vector (EV1;
Fig. 25).
Two constructs that were designed to specifically silence SanR1 were
complementary to the 5’ UTR (V1) and 3’ UTR (V2) (Fig. 26). Both constructs resulted
in a significant reduction in SanR1 expression compared to the EV control according to
Student’s t-test (p<0.05; V1, p=0.01; V2, p=0.0004) (Fig. 26B,F). However, no
significant changes in metabolite composition were observed (Fig. 26C,G).
Three constructs that were designed to silence SanR2, and they were
complementary to the 5’ UTR (V3), coding sequence (V4) and 3’ UTR (V5) (Fig. 27).
All constructs resulted in a significant reduction in SanR2 expression compared to the EV
control according to Student’s t-test (p<0.05; V3, p=0.0000001; V4; p=0.004; V5,
p=0.00003) (Fig. 27B,F,J). The V4 construct resulted in an increase in sanguinarine, but
using Student’s t-test with Welch’s correction resulted in p>0.05. Therefore, the increase
in sanguinarine is not significant. However, the V5 construct did result in a significant
increase in morphine levels (p=0.005).
Two constructs that were designed to specifically silence SanR3 were
complementary to the 5’ UTR (V6) and 3’ UTR (V7) (Fig. 28). Both constructs resulted
in a significant reduction in SanR3 expression compared to the EV control according to
Student’s t-test (p<0.05; V6 and V7, p=0.00005) (Fig. 28B,F).

86
0
10
20
30
40
50
60
0 1 2 3 4 5 6 7 8 9 10 11 12 13 14 15 16 17 18 19
LC
-MS
Cou
nts
x1
06
Retention Time (min)
0
0.5
1
1.5
2
2.5
3
3.5
4
4.5
5
0 1 2 3 4 5 6 7 8 9 10 11 12 13 14 15 16 17 18 19
LC
-MS
Co
un
ts x
10
6
Retention Time (min)
EIC312
EIC330
EIC332
EIC334
EIC340
EIC370
EIC414
A
B
Figure 25. Example chromatographs for VIGS metabolite analysis. Root alkaloids from a
plant transformed with an empty pTRV2 vector (EV1) were extracted in methanol (20
mL methanol per gram dry weight), then diluted 1 in 20 for LC-MS analysis. (A) Total
ion chromatograph. (B) Extracted ion chromatographs for thebaine ([M+H]+ 312),
reticuline ([M+H]+ 330), sanguinarine ([M]+ 332), dihydrosanguinarine ([M+H]+ 334),
papaverine ([M+H]+ 340), cryptopine ([M+H]+ 370), and noscapine ([M+H]+ 414).

87
Both constructs resulted in a significant increase in sanguinarine (V6 and V7, p=0.02).
V6 plants also exhibited a significant increase in cryptopine (p=0.04), and a decrease in
noscapine (p=0.04). In addition, V7 plants showed a significant increase reticuline
(p=0.009). In addition, V7 plants showed a significant increase reticuline (p=0.009).
One construct was designed to silence SanR1 and SanR3 (V8) (Fig. 29). The
construct was designed by combining V2 and V5, which are complementary to the
3’ UTRs of SanR1 and SanR3, respectively. Interestingly, only SanR2 and SanR3
expression levels are significantly decreased relative to the EV control according to
Student’s t-test (p-values are 0.0005 and 0.004, respectively; Fig. 29D). SanR1
expression levels do not differ from the EV control (p=0.8). A significant decrease in
noscapine (p=0.01) and papaverine (p=0.04) levels was observed (Fig. 29E).
Guillaume Beaudoin designed constructs V9 through V12 (Fig. 30-33). V9 was
100% complementary to a small region of Bea’s choice SanR1 coding sequence, but
constructs V10-V12 were not entirely identical to regions of Bea’s choice SanRs. V10
shares 75 and 34% sequence similarity to SanR1 and SanR2, respectively; V11 shares 21
and 86%, sequence similarity to SanR1 and SanR2, respectively; and V12 shares 20%
and 16% sequence similarity to SanR1 and SanR2, respectively. Although, construct V9
was designed to silence SanR1, SanR1 expression levels were significantly increased
compared to the EV control (p=0.0001 (Fig. 30). As well, SanR2 expression levels were
significantly decreased (p=0.000007) (Fig. 30D). Increasing expression levels of SanR1,
and decreasing expression levels of SanR2 resulted in a significant increase in the levels
of reticuline (p=0.00009), thebaine (p=0.01), and sanguinarine (p=0.008) compared to the
EV control (Fig. 20E). Both V10 and V11 constructs resulted in a significant reduction in
88
SanR1, SanR2, and SanR3 expression levels (Fig. 31 and 32). However, no significant
changes in metabolite levels were observed in plants transformed with V10 or V11
constructs (Fig. 31 and 32). Lastly, V12 resulted in a significant reduction in SanR2
(p=0.00004) and SanR3 (p=0.009) expression levels compared to the control (Fig. 33).
However, Student’s t-test with Welch’s correction indicated no significant changes in
metabolite levels between plants transformed with V12 constructs or an EV (Fig. 33).

89
0
0.005
0.01
0.015
0.02
0.025
0.03
V1
-1
V1
-2
V1
-3
V1
-4
V1
-5
V1
-6
V1
-7
V1
-8
V1
-9
V1
-10
V1
-11
V1
-12
V1
-13
V1
-14
V1
-15
Rel
ati
ve
Gen
e E
xp
ress
ion
VIGS Construct
0
0.005
0.01
0.015
0.02
EV V1
Rel
ati
ve SanR1
Exp
ress
ion
VIGS Construct
0
10
20
30
40
50
N P R T M C S DHS Am
ou
nt
of
Alk
alo
id (
LC
-MS
Inte
gra
ted
Pea
k A
rea,
Arb
itary
Un
its,
Mil
lio
ns)
Metabolite
EV
V1
A B
C D
0
5
10
15
20
25
30
35
40
S DHS
Co
nce
ntr
ati
on
(µ
M)
Metabolite
EV
V1
*
Figure 26. Gene expression and metabolite profiles of SanR1-silenced opium poppy roots.

90
E F
G H
*
0
0.005
0.01
0.015
0.02
0.025
V2
-1
V2
-2
V2
-3
V2
-4
V2
-5
V2
-6
V2
-7
V2
-8
V2
-9
V2
-10
V2
-11
V2
-12
V2
-13
Rel
ati
ve SanR1
Exp
ress
ion
VIGS Construct
0
0.005
0.01
0.015
0.02
EV V2
Rel
ati
ve SanR1
Exp
ress
ion
VIGS Construct
0
20
40
60
80
100
S DHS
Co
nce
ntr
ati
on
(µ
M)
Metabolite
EV
V2
0
10
20
30
40
50
60
N P R T M C S DHS Am
ou
nt
of
Alk
alo
id (
LC
-MS
Inte
gra
ted
Pea
k A
rea,
Arb
itary
Un
its,
Mil
lio
ns)
Metabolite
EV
V2
Figure 26 (continued). Gene expression and metabolite profiles of SanR1-silenced opium poppy roots.

91
Figure 26 (continued). Gene expression and metabolite profiles of SanR1-silenced opium poppy roots. Relative SanR1 gene
expression in the roots of poppy plants transformed with a VIGS construct designed against the (A) 5’ UTR (V1, n=15) or (E) 3’ UTR
(V2, n=10) of SanR1. Error bars represent the SEM of three technical replicates. Average relative SanR1 expression in EV control
(n=13) versus (B) V1 (p=0.01) or (F) V2 (p=0.0004). Error bars represent SEM. Root alkaloid metabolite profile of EV control versus
(C) V1 or (G) V2. (D, H) LC-MS counts of sanguinarine and dihydrosanguinarine were converted to concentration (μM) using a
standard curve. Significance was calculated using Student’s two-tailed t-test, and asterisk (*) indicates p<0.05. N: noscapine,
P: papaverine, R: reticuline, T: thebaine, M: morphine, C: cryptopine, S: sanguinarine, DHS: dihydrosanguinarine.

92
*
0
10
20
30
40
50
60
70
80
N P R T M C S DHS Am
ou
nt
of
Alk
alo
id (
LC
-MS
Inte
gra
ted
Pea
k A
rea,
Arb
itary
Un
its,
Mil
lio
ns)
Metabolite
EV
V3
A B
C D
0
0.0002
0.0004
0.0006
0.0008
0.001
0.0012
0.0014
V3
-1
V3
-2
V3
-3
V3
-4
V3
-5
V3
-6
V3
-7
V3
-8
V3
-9
V3
-10
V3
-11
V3
-12
V3
-13
V3
-14
Rel
ati
ve SanR2
Exp
ress
ion
VIGS Construct
0
5
10
15
20
25
S DHS
Co
nce
ntr
ati
on
(µ
M)
Metabolite
EV
V3
0
0.001
0.002
0.003
0.004
0.005
0.006
0.007
EV V3
Rel
ati
ve SanR2
Exp
ress
ion
VIGS Construct
Figure 27. Gene expression and metabolite profiles of SanR2-silenced opium poppy roots.

93
E F
G H
0
0.001
0.002
0.003
0.004
0.005
0.006
0.007
EV V4
Rel
ati
ve SanR2
Exp
ress
ion
VIGS Construct
*
0
10
20
30
40
50
N P R T M C S DHS Am
ou
nt
of
Alk
alo
id (
LC
-MS
Inte
gra
ted
Pea
k A
rea,
Arb
itary
Un
its,
Mil
lio
ns)
Metabolite
EV
V4
0
0.001
0.002
0.003
0.004
0.005
0.006
V4-1 V4-2 V4-3 V4-4 V4-5
Rel
ati
ve SanR2
Exp
ress
ion
VIGS Construct
0
10
20
30
40
50
S DHS
Co
nce
ntr
ati
on
(µ
M)
Metabolite
EV
V4
Figure 27 (continued). Gene expression and metabolite profiles of SanR2-silenced opium poppy roots.
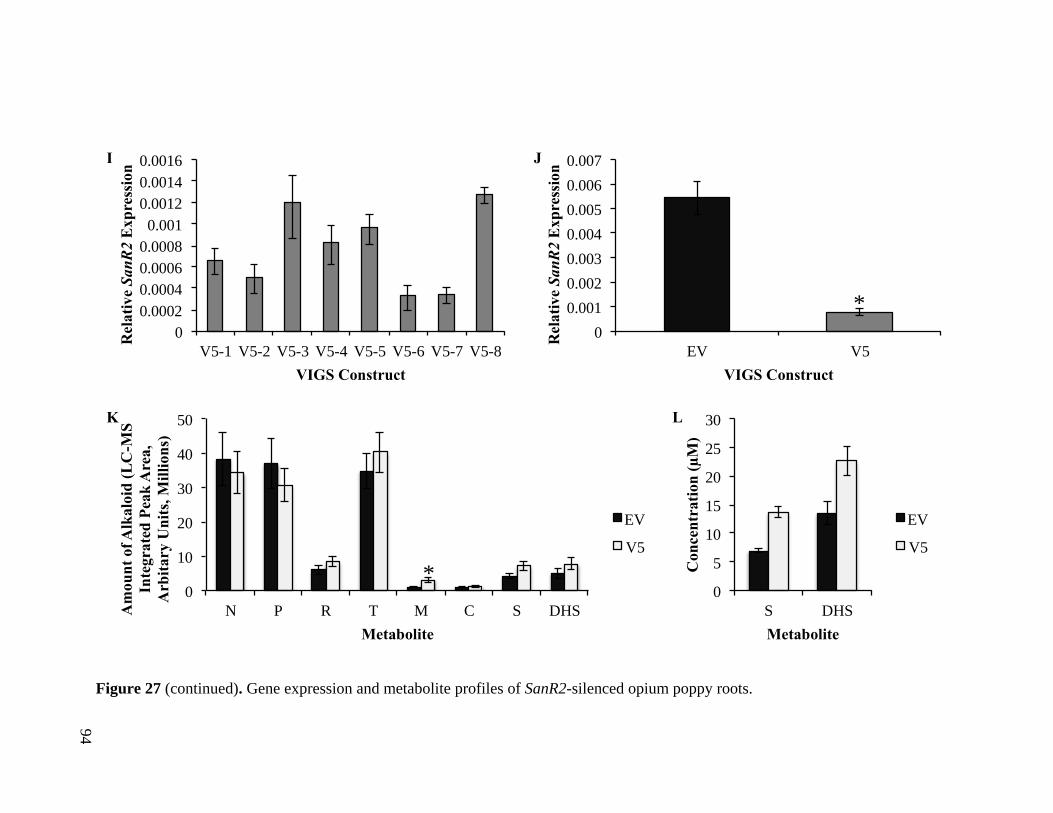
94
I J
K L
0
0.0002
0.0004
0.0006
0.0008
0.001
0.0012
0.0014
0.0016
V5-1 V5-2 V5-3 V5-4 V5-5 V5-6 V5-7 V5-8
Rel
ati
ve SanR2
Exp
ress
ion
VIGS Construct
0
0.001
0.002
0.003
0.004
0.005
0.006
0.007
EV V5
Rel
ati
ve SanR2
Exp
ress
ion
VIGS Construct
*
0
10
20
30
40
50
N P R T M C S DHS Am
ou
nt
of
Alk
alo
id (
LC
-MS
Inte
gra
ted
Pea
k A
rea,
Arb
itary
Un
its,
Mil
lio
ns)
Metabolite
EV
V5
0
5
10
15
20
25
30
S DHS
Co
nce
ntr
ati
on
(µ
M)
Metabolite
EV
V5
*
Figure 27 (continued). Gene expression and metabolite profiles of SanR2-silenced opium poppy roots.

95
Figure 27 (continued). Gene expression and metabolite profiles of SanR2-silenced opium poppy roots. Relative SanR2 gene
expression in the roots of poppy plants transformed with a VIGS construct designed against the (A) 5’ UTR (V3, n=14), coding
sequence (E) (V4, n=5), or (I) 3’ UTR (V5, n=8) of SanR2. Error bars represent the SEM of three technical replicates. Average
relative SanR2 expression in EV control (n=13) versus (B) V3 (p=0.0000001), (F) V4 (p=0.004), or (J) V5 (p=0.00003). Error bars
represent SEM. Root alkaloid metabolite profile of EV control versus (C) V3, (G) V4, or (K) V5. Silencing SanR2 in V4 plants
resulted in an increase in sanguinarine (p=0.0005). However, due to unequal variance between EV and V4, Welch’s correction was
applied resulting in a p-value of 0.052. Therefore, the increase in sanguinarine is insignificant. Silencing SanR2 in V5 resulted in an
increase in morphine (p=0.005). (D, H, L) LC-MS counts of sanguinarine and dihydrosanguinarine were converted to concentration
(μM) using a standard curve. Significance was calculated using Student’s two-tailed t-test, and asterisk (*) indicates p<0.05.
N: noscapine, P: papaverine, R: reticuline, T: thebaine, M: morphine, C: cryptopine, S: sanguinarine, DHS: dihydrosanguinarine.

96
A B
C D
0
0.0005
0.001
0.0015
0.002
0.0025
0.003
0.0035
0.004
V6
-1
V6
-2
V6
-3
V6
-4
V6
-5
V6
-6
V6
-7
V6
-8
V6
-9
V6
-10
V6
-11
V6
-12
V6
-13
Rel
ati
ve SanR3
Exp
ress
ion
VIGS Construct
0
0.002
0.004
0.006
0.008
0.01
EV V6
Rel
ati
ve SanR3
Exp
ress
ion
VIGS Construct
*
0
10
20
30
40
50
60
N P R T M C S DHS Am
ou
nt
of
Alk
alo
id (
LC
-MS
Inte
gra
ted
Pea
k A
rea,
Arb
itary
Un
its,
Mil
lio
ns)
Metabolite
EV
V6
0
5
10
15
20
25
30
S DHS
Co
nce
ntr
ati
on
(µ
M)
Metabolite
EV
V6
*
* *
*
Figure 28. Gene expression and metabolite profiles of SanR3-silenced opium poppy roots.

97
E F
G H
0
0.0005
0.001
0.0015
0.002
0.0025
0.003
0.0035
V7
-1
V7
-2
V7
-3
V7
-4
V7
-5
V7
-6
V7
-7
V7
-8
V7
-9
V7
-10
V7
-11
V7
-12
V7
-13
V7
-14
Rel
ati
ve SanR3
Exp
ress
ion
VIGS Construct
0
0.002
0.004
0.006
0.008
0.01
EV V7
Rel
ati
ve SanR3
Exp
ress
ion
VIGS Construct
*
0
5
10
15
20
S DHS
Co
nce
ntr
ati
on
(µ
M)
Metabolite
EV
V7
0
10
20
30
40
50
60
70
80
N P R T M C S DHS Am
ou
nt
of
Alk
alo
id (
LC
-MS
Inte
gra
ted
Pea
k A
rea,
Arb
itary
Un
its,
Mil
lio
ns)
Metabolite
EV
V7
*
* *
Figure 28 (continued). Gene expression and metabolite profiles of SanR3-silenced opium poppy roots.

98
Figure 28 (continued). Gene expression and metabolite profiles of SanR3-silenced opium poppy roots. Relative SanR3 gene
expression in the roots of poppy plants transformed with a VIGS construct designed against the (A) 5’ UTR (V6, n=13), or
(E) 3’ UTR (V7, n=14) of SanR3. Error bars represent the SEM of three technical replicates. Average relative SanR3 expression in EV
control (n=13) versus (B) V6 (p=0.00005), or (F) V7 (p=0.00005). Error bars represent SEM. Root alkaloid metabolite profile of EV
control versus (C) V6, or (G) V7. Silencing SanR3 in V6 plants resulted in an increase in sanguinarine (p=0.02) and cryptopine
(p=0.04), and a decrease in noscapine (p=0.04). Silencing SanR3 in V7 plants resulted in an increase in sanguinarine (p=0.02) and
reticuline (p=0.009). (D, H) LC-MS counts of sanguinarine and dihydrosanguinarine were converted to concentration (μM) using a
standard curve. Significance was calculated using Student’s two-tailed t-test, and asterisk (*) indicates p<0.05. N: noscapine,
P: papaverine, R: reticuline, T: thebaine, M: morphine, C: cryptopine, S: sanguinarine, DHS: dihydrosanguinarine.

99
A B
C D
0
0.01
0.02
0.03
0.04
0.05
V8-
1
V8-
2
V8-
3
V8-
4
V8-
5
V8-
6
V8-
7
V8-
8
V8-
9
V8-
10
V8-
11
Rel
ati
ve SanR1
Exp
ress
ion
VIGS Construct
0
0.001
0.002
0.003
0.004
0.005
0.006
V8-
1
V8-
2
V8-
3
V8-
4
V8-
5
V8-
6
V8-
7
V8-
8
V8-
9
V8-
10
V8-
11
Rel
ati
ve SanR2
Exp
ress
ion
VIGS Construct
0
0.002
0.004
0.006
0.008
0.01
0.012
V8-
1
V8-
2
V8-
3
V8-
4
V8-
5
V8-
6
V8-
7
V8-
8
V8-
9
V8-
10
V8-
11
Rel
ati
ve SanR3 E
xp
ress
ion
VIGS Construct
* * 0
0.005
0.01
0.015
0.02
0.025
EV V8
Rel
ati
ve
Gen
e E
xp
ress
ion
VIGS Construct
SanR1
SanR2
SanR3
Figure 29. Gene expression and metabolite profiles of SanR1- and SanR3-silenced opium poppy roots.

100
E F
0
5
10
15
20
S DHS
Co
nce
ntr
ati
on
(µ
M)
Metabolite
EV
V8
0
10
20
30
40
50
N P R T M C S DHS Am
ou
nt
of
Alk
alo
id (
LC
-MS
Inte
gra
ted
Pea
k A
rea
,
Arb
ita
ry U
nit
s, M
illi
on
s)
Metabolite
EV
V8 *
*
Figure 29 (continued). Gene expression and metabolite profiles of SanR1- and SanR3-silenced opium poppy roots. Relative
expression of (A) SanR1, (B), SanR2, and (C) SanR3 in the roots of poppy plants transformed with a VIGS construct designed against
the 3’ UTRs of SanR1 and SanR3 (V8, n=11). Error bars represent the SEM of three technical replicates. (D) Average relative SanR
expression in EV control (n=13) versus V8. SanR2 (p=0.0005) and SanR3 (0.004), but not SanR1 (p=0.8), were silenced as compared
to the control. Error bars represent SEM. (E) Root alkaloid metabolite profile of EV control versus V8. Both noscapine (p=0.01) and
papaverine (p=0.04) levels were decreased compared to the control. (F) LC-MS counts of sanguinarine and dihydrosanguinarine were
converted to concentration (μM) using a standard curve. Significance was calculated using Student’s two-tailed t-test, and asterisk (*)
indicates p<0.05. N: noscapine, P: papaverine, R: reticuline, T: thebaine, M: morphine, C: cryptopine, S: sanguinarine,
DHS: dihydrosanguinarine.

101
A B
C D
0
0.02
0.04
0.06
0.08
0.1
0.12
0.14
V9-1 V9-2 V9-3 V9-4 V9-5 V9-6 V9-7 V9-8 V9-9
Rel
ati
ve SanR1
Exp
ress
ion
VIGS Construct
0
0.0002
0.0004
0.0006
0.0008
0.001
0.0012
0.0014
V9-1 V9-2 V9-3 V9-4 V9-5 V9-6 V9-7 V9-8 V9-9
Rel
ati
ve SanR2
Exp
ress
ion
VIGS Construct
0
0.005
0.01
0.015
0.02
0.025
V9-1 V9-2 V9-3 V9-4 V9-5 V9-6 V9-7 V9-8 V9-9
Rel
ati
ve SanR3 E
xp
ress
ion
VIGS Construct
*
* 0
0.01
0.02
0.03
0.04
0.05
0.06
0.07
0.08
EV V9
Rel
ati
ve
Gen
e E
xp
ress
ion
VIGS Construct
SanR1
SanR2
SanR3
Figure 30. Gene expression and metabolite profiles of SanR1-silenced opium poppy roots.

102
E F
0
10
20
30
40
50
S DHS
Co
nce
ntr
ati
on
(µ
M)
Metabolite
EV
V9
0
20
40
60
80
100
N P R T M C S DHS Am
ou
nt
of
Alk
alo
id (
LC
-MS
Inte
gra
ted
Pea
k A
rea
,
Arb
ita
ry U
nit
s, M
illi
on
s)
Metabolite
EV
V9
*
* *
*
Figure 30 (continued). Gene expression and metabolite profiles of SanR1-silenced opium poppy roots. Relative expression of
(A) SanR1, (B), SanR2, and (C) SanR3 in the roots of poppy plants transformed with a VIGS construct designed against the coding
sequence of SanR1 (V9, n=9). Error bars represent the SEM of three technical replicates. (D) Average relative SanR expression in EV
control (n=13) versus V9. SanR1 expression was increased (p=0.00001), and SanR2 expression was decreased (p=0.000007)
compared to the control. No change in expression was observed for SanR3 (p=0.7). Error bars represent SEM. (E) Root alkaloid
metabolite profile of EV control versus V9. Reticuline (p=0.00009), thebaine (p=0.01), and sanguinarine (p=0.008) levels were all
increased compared to EV. (F) LC-MS counts of sanguinarine and dihydrosanguinarine were converted to concentration (μM) using a
standard curve. Significance was calculated using Student’s two-tailed t-test, and asterisk (*) indicates p<0.05. N: noscapine,
P: papaverine, R: reticuline, T: thebaine, M: morphine, C: cryptopine, S: sanguinarine, DHS: dihydrosanguinarine.

103
A B
C D
0
0.002
0.004
0.006
0.008
0.01
0.012
V10
-1
V10
-2
V10
-3
V10
-4
V10
-5
V10
-6
V10
-7
V10
-8
V10
-9
V10
-10
Rel
ati
ve SanR1
Exp
ress
ion
VIGS Construct
0
0.0005
0.001
0.0015
0.002
0.0025
0.003
0.0035
V10
-1
V10
-2
V10
-3
V10
-4
V10
-5
V10
-6
V10
-7
V10
-8
V10
-9
V10
-10
Rel
ati
ve SanR2
Exp
ress
ion
VIGS Construct
0
0.0002
0.0004
0.0006
0.0008
0.001
0.0012
V10
-1
V10
-2
V10
-3
V10
-4
V10
-5
V10
-6
V10
-7
V10
-8
V10
-9
V10
-10
Rel
ati
ve SanR3 E
xp
ress
ion
VIGS Construct
0
0.005
0.01
0.015
0.02
EV V10
Rel
ati
ve
Gen
e E
xp
ress
ion
VIGS Construct
SanR1
SanR2
SanR3 *
* *
Figure 31. Gene expression and metabolite profiles of SanR-silenced opium poppy roots.
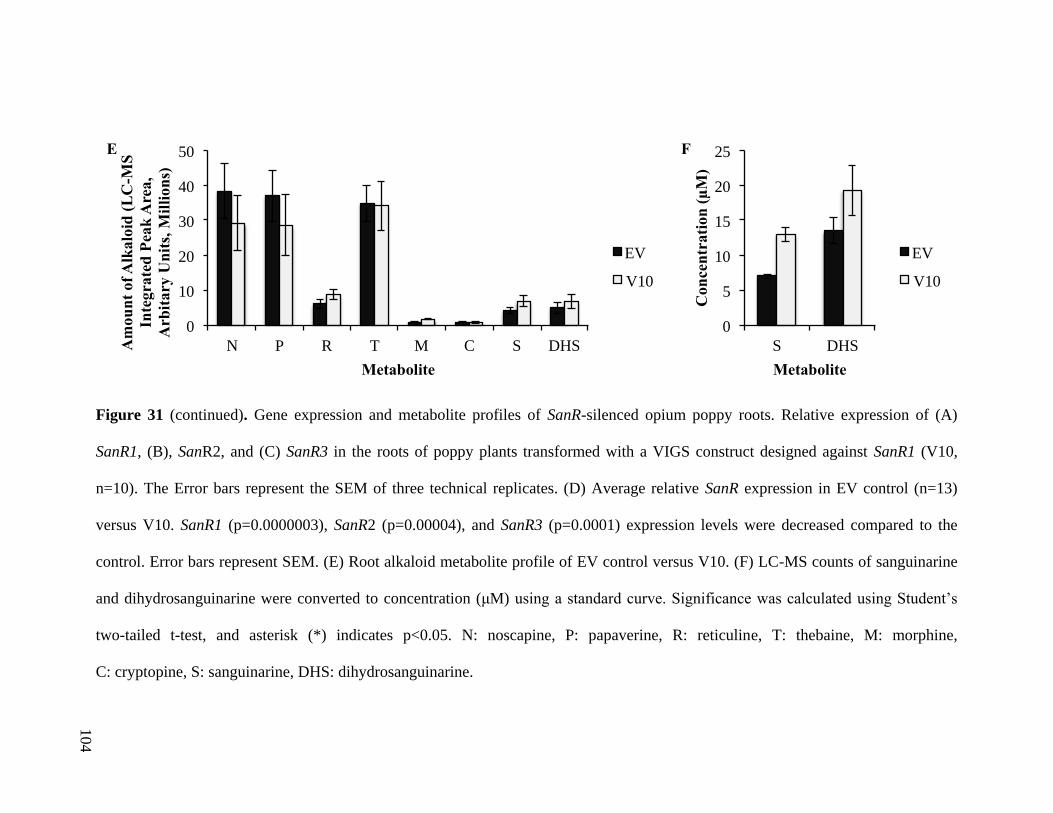
104
E F
0
5
10
15
20
25
S DHS
Co
nce
ntr
ati
on
(µ
M)
Metabolite
EV
V10
0
10
20
30
40
50
N P R T M C S DHS Am
ou
nt
of
Alk
alo
id (
LC
-MS
Inte
gra
ted
Pea
k A
rea
,
Arb
ita
ry U
nit
s, M
illi
on
s)
Metabolite
EV
V10
Figure 31 (continued). Gene expression and metabolite profiles of SanR-silenced opium poppy roots. Relative expression of (A)
SanR1, (B), SanR2, and (C) SanR3 in the roots of poppy plants transformed with a VIGS construct designed against SanR1 (V10,
n=10). The Error bars represent the SEM of three technical replicates. (D) Average relative SanR expression in EV control (n=13)
versus V10. SanR1 (p=0.0000003), SanR2 (p=0.00004), and SanR3 (p=0.0001) expression levels were decreased compared to the
control. Error bars represent SEM. (E) Root alkaloid metabolite profile of EV control versus V10. (F) LC-MS counts of sanguinarine
and dihydrosanguinarine were converted to concentration (μM) using a standard curve. Significance was calculated using Student’s
two-tailed t-test, and asterisk (*) indicates p<0.05. N: noscapine, P: papaverine, R: reticuline, T: thebaine, M: morphine,
C: cryptopine, S: sanguinarine, DHS: dihydrosanguinarine.

105
A B
C D
0
0.005
0.01
0.015
0.02
0.025
V11
-1
V11
-2
V11
-3
V11
-4
V11
-5
V11
-6
V11
-7
V11
-8
V11
-9
V11
-10
V11
-11
Rel
ati
ve SanR1
Exp
ress
ion
VIGS Construct
0
0.0005
0.001
0.0015
0.002
0.0025
0.003
V11
-1
V11
-2
V11
-3
V11
-4
V11
-5
V11
-6
V11
-7
V11
-8
V11
-9
V11
-10
V11
-11
Rel
ati
ve SanR2
Exp
ress
ion
VIGS Construct
0
0.0005
0.001
0.0015
0.002
0.0025
0.003
V11
-1
V11
-2
V11
-3
V11
-4
V11
-5
V11
-6
V11
-7
V11
-8
V11
-9
V11
-10
V11
-11
Rel
ati
ve SanR3 E
xp
ress
ion
VIGS Construct
0
0.005
0.01
0.015
0.02
EV V11
Rel
ati
ve
Gen
e E
xp
ress
ion
VIGS Construct
SanR1
SanR2
SanR3
*
* *
Figure 32. Gene expression and metabolite profiles of SanR-silenced opium poppy roots.

106
E F
0
5
10
15
20
25
30
S DHS
Co
nce
ntr
ati
on
(µ
M)
Metabolite
EV
V11
0
10
20
30
40
50
N P R T M C S DHS Am
ou
nt
of
Alk
alo
id (
LC
-MS
Inte
gra
ted
Pea
k A
rea
,
Arb
ita
ry U
nit
s, M
illi
on
s)
Metabolite
EV
V11
Figure 32 (continued). Gene expression and metabolite profiles of SanR2-silenced opium poppy roots. Relative expression of
(A) SanR1, (B), SanR2, and (C) SanR3 in the roots of poppy plants transformed with a VIGS construct designed against the coding
sequence of SanR2 (V11, n=11). Error bars represent the SEM of three technical replicates. (D) Average relative SanR expression in
EV control (n=13) versus V11. SanR1 (p=0.002), SanR2 (p=0.00002), and SanR3 (p=0.00007) expressed decreased relative to the
control. Error bars represent SEM. (E) Root alkaloid metabolite profile of EV control versus V11. (F) LC-MS counts of sanguinarine
and dihydrosanguinarine were converted to concentration (μM) using a standard curve. Significance was calculated using Student’s
two-tailed t-test, and asterisk (*) indicates p<0.05. N: noscapine, P: papaverine, R: reticuline, T: thebaine, M: morphine,
C: cryptopine, S: sanguinarine, DHS: dihydrosanguinarine.

107
A B
C D
0
0.01
0.02
0.03
0.04
0.05
0.06
V12-1 V12-2 V12-3 V12-4 V12-5 V12-6 V12-7 V12-8
Rel
ati
ve SanR1
Exp
ress
ion
VIGS Construct
0
0.0005
0.001
0.0015
0.002
0.0025
V12
-1
V12
-2
V12
-3
V12
-4
V12
-5
V12
-6
V12
-7
V12
-8
Rel
ati
ve SanR2
Exp
ress
ion
VIGS Construct
0
0.001
0.002
0.003
0.004
0.005
0.006
0.007
0.008
V12-1 V12-2 V12-3 V12-4 V12-5 V12-6 V12-7 V12-8
Rel
ati
ve SanR3 E
xp
ress
ion
VIGS Construct
0
0.005
0.01
0.015
0.02
0.025
0.03
EV V12
Rel
ati
ve
Gen
e E
xp
ress
ion
VIGS Construct
SanR1
SanR2
SanR3
* *
Figure 33. Gene expression and metabolite profiles of SanR-silenced opium poppy roots.

108
E F
0
10
20
30
40
50
60
70
80
S DHS
Co
nce
ntr
ati
on
(µ
M)
Metabolite
EV
V12
0
10
20
30
40
50
60
70
N P R T M C S DHS Am
ou
nt
of
Alk
alo
id (
LC
-MS
Inte
gra
ted
Pea
k A
rea
,
Arb
ita
ry U
nit
s, M
illi
on
s)
Metabolite
EV
V12
Figure 33 (continued). Gene expression and metabolite profiles of SanR-silenced opium poppy roots. Relative expression of
(A) SanR1, (B) SanR2, and (C) SanR3 in the roots of poppy plants transformed with a VIGS construct designed by Guillaume
Beaudoin (V12, n=8). Error bars represent the SEM of three technical replicates. (D) Average relative expression in EV control (n=13)
versus V12. SanR2 (p=0.00004) and SanR3 (p=0.009) expression levels were decreased compared to EV. Error bars represent SEM.
(E) Root alkaloid metabolite profile of EV control versus V12. Welch’s correction was applied indicating no significant increase in
sanguinarine (p=0.07) and cryptopine (p=0.08). (F) LC-MS counts of sanguinarine and DHS were converted to concentration (μM)
using a standard curve. Significance was calculated using Student’s two-tailed t-test, and asterisk (*) indicates p<0.05. N: noscapine,
P: papaverine, R: reticuline, T: thebaine, M: morphine, C: cryptopine, S: sanguinarine, DHS: dihydrosanguinarine.

109
4 DISCUSSION
4.1 Sanguinarine reductase identification, expression, and purification
The Illumina stem and root transcriptomes for Papaver somniferum cultivar Bea’s
Choice encodes four sequences that share more than 60% amino acid sequence identity to
the previously characterized E. californica SanR (Fig. 3) (Vogel et al., 2010; Weiss et al.,
2006), and have been named SanR1 through SanR4. Sequences encoding SanR1
(comp9568) were only found in the stem transcriptome, SanR2 (comp73923) was only
found in the root transcriptome, and both SanR3 (comp1703 and comp80098) and SanR4
(comp26502 and comp72201) were found in the stem and root transcriptomes. However,
the contig encoding SanR4 was incomplete in the root transcriptome. Primers were
designed to amplify individual SanRs (Table 1). However, amplification of SanR4 was
not successful. This suggested that the SanR4 contig might not be a real transcript, but the
result of transcriptome misassembly. However, a second set of primers (SanR4-F2/R2;
Table 1) successfully amplified a product of expected size (data not shown), and
sequencing confirmed its identity as SanR4. Therefore, SanR4 is expressed in planta, but
was not further analyzed.
SanR coding sequences were successfully cloned into pQE30 expression vectors,
but no recombinant protein expression was observed when constructs were transformed
into E. coli strain M15 (data not shown). Recombinant SanR expression was only
observed in cultures of induced E. coli strain SG13009 harbouring pQE30-SanR
constructs (Fig. 5). However, E. coli strains M15 and SG13009 are very similar. Both
strains are derived from E. coli strain K12, have the phenotype NalS, StrS, RifS, Thi-, Lac-,
Ara+, Gal+, Mtl-, F-, RecA+, Uvr+, Lon+, and harbor the pREP4 plasmid (Qiagen Manual,

110
Genotype analysis of E. coli strains SG13009 and M15). Interestingly, previous reports
indicate proteins poorly expressed in M15 are produced to higher levels in SG13009, and
proteins expressed in M15 are overproduced in SG13009 to a level that inhibits cell
growth (Stüber, D., Matile, H., and Garotta, 1990).
To confirm the identity of overexpressed proteins in IPTG-induced cultures of
E. coli strain SG13009 harbouring pQE30-SanR constructs, soluble and purified proteins
were extracted and size-separated on polyacrylamide gels (Fig. 5 and 7). Gels were
stained with Coomassie, or transferred to nitrocellulose membrane for Western blot
analysis. Coomassie stains proteins through its affinity for basic amino acids, such as
arginine and lysine (Congdon et al., 1993). Recombinant 6xHis-tagged proteins were
purified using the TALON cobalt resin instead of nickel-nitrilotriacetic acid (Ni-NTA)
resin because cobalt ions are more selective for histidine tags than nickel ions to improve
purity, and proteins can be eluted with lower imidazole concentrations (Chaga et al.,
1999). Interestingly, SanR1, SanR2, and SanR3 size-separate at approximately the same
molecular weight, despite having predicted molecular weights of 29.4, 29.4, and 32.1
kDa respectively (Fig. 7). Overall, the size of the recombinant proteins stained with
Coomassie and detected with an anti-His antibody are consistent with the predicted size
of SanRs: 29.4, 29.4, 32.1, and 26.8 kDa for SanR1, SanR2, SanR3, and SanR3B,
respectively (Fig. 7). Together this data suggests that SanRs were successfully expressed
in E. coli strain SG13009 from the pQE30, and were specifically purified using TALON
metal affinity resin.

111
4.2 Biochemical characterization of sanguinarine reductases in vitro
Although both SanR and DRR accept quaternary alkaloids as substrates, opium
poppy SanRs do not accept 1,2-dehydroreticuline as a substrate (Fig. 8; De-Eknamkul
and Zenk, 1992; Weiss et al., 2006). However, consistent with previous reports of
E. californica SanR, all opium poppy SanRs reduce sanguinarine and chelerythrine to
dihydrosanguinarine and dihydrochelerythrine, respectively (Fig. 13). To test if SanRs
will reduce other benzophenanthridine alkaloids, chelirubine and macarpine were isolated
from elicited E. californica cell culture filtrate extracts (Fig. 9 and 10) because they do
not accumulate in opium poppy nor are they commercially available (Schumacher et al.,
1987). Initial attempts to isolate benzophenanthridines were performed using
E. californica root extract. However, fewer purification steps and increased purity was
obtained using elicited E. californica cell culture, presumably due to fewer contaminates,
such as chlorophyll. Benzophenanthridine alkaloids separated into four distinct bands
when cell filtrate alkaloid extract was separated by TLC using 2:2:1 chloroform:ethyl
acetate:methanol (Fig. 9). CID dissociation spectra for the TLC-isolated
benzophenanthridines are consistent with previously reported CID spectra (Fig. 10) (Son
et al., 2014; Liscombe et al., 2009). Consequently, chelirubine and macarpine could be
used as substrates for SanR assays. As a control for the enzymatic assays, all
benzophenanthridines (sanguinarine, chelerythrine, chelirubine, and macarpine) were
converted to the corresponding dihydrobenzophenanthridines through treatment with
sodium borohydride (Fig. 12). Treatment with excess sodium borohydride resulted in
almost 100% conversion of sanguinarine, chelerythrine, and chelirubine to
dihydrosanguinarine, dihydrochelerythrine, and dihydrochelirubine, respectively

112
(Fig. 12). However, not all macarpine (retention time approximately 8.4 minutes) was
converted to dihydromacarpine (retention time approximately 9.0 minutes; Fig. 12).
There is a peak present in chromatographs (EIC m/z 394) before and after sodium
borohydride treatment with a retention time of approximate 8.0 minutes (Fig. 12), but
CID analysis indicated that this peak is neither macarpine (m/z 392) nor
dihydromacarpine (m/z 394) (data not shown).
In addition to sanguinarine and chelerythrine, SanRs from opium poppy also
reduce chelirubine and macarpine to dihydrochelirubine and dihydromacarpine,
respectively (Fig. 13). However, chelerythrine, chelirubine and macarpine are not known
to accumulate in Papaver somniferum. Only dihydrochelirubine and dihydromacarpine
are detected in E. californica cell cultures (Weiss et al., 2006). However, upon elicitation
E. californica cultures produce both chelirubine and macarpine. Furthermore, exogenous
sanguinarine added to E. californica cells is immediately reduced to dihydrosanguinarine,
then derivatized to dihydrochelirubine and dihydromacarpine (Weiss et al., 2006). Weiss
et al. (2006) hypothesized elicited sanguinarine and chelerythrine only accumulates
transiently before being converted to macarpine and chelilutine, respectively, as
sanguinarine was reported to have a greater effect on growth inhibition of Candida
albicans and Staphylococcus aureus as compared to chelerythrine or chelirubine.
However, recent studies have shown that both chelirubine and macarpine also inhibit
growth and induce apoptosis in vitro (Slaninová et al., 2007). Macarpine inhibited human
tumor cell line growth 5- to 10-times more than the other benzophenanthridine alkaloids,
with chelerythrine and sanguinarine being the least effective. Chelirubine had the greatest
proapoptotic effect and induced up to 90% apoptosis at concentrations as low as 1 μg/mL,

113
while sanguinarine was essentially non-toxic until concentrations were greater than
10 μg/mL. Interestingly, sanguinarine was detected in the roots of Macleaya cordata,
Macleaya microcarpa, Chelidonium majus, Sanguinaria canadensis, and Dicranostigma
lactucoides at higher concentrations than chelirubine or macarpine using HPLC
(Suchomelová et al., 2007). Macarpine was only detected in the roots of Macleaya
microcarpa, and Stylophorum lasiocarpum. Therefore, opium poppy SanRs may have
evolved from an ancestral enzyme found in a plant that accumulates the more cytotoxic
macarpine resulting in a wider benzophenanthridine substrate range (Fig. 13). However,
macarpine was detected in 15 cell cultures that produce benzophenanthridines, including
Chelidonium majus and Sanguinaria canadensis, using LC-MS using a triple-quadrupole
mass analyzer (Farrow et al., 2012). Thus, more sensitive detection methods may reveal a
wider occurrence of macarpine in benzophenanthridine producing species. Enzymes
involved in secondary metabolism are often promiscuous and less catalytically efficient,
but have broader specificities to facilitate chemical diversity (Weng et al., 2012).
Consequently, SanRs may reduce chelerythrine, chelirubine and macarpine, though not
detected in opium poppy, due to an accommodating conformation of the active site.
Additional experiments are required to determine the exact benzophenanthridine
substrate preference of opium poppy SanRs.
Preliminary experiments using an unknown, but consistent concentration of
substrate demonstrated that all opium poppy SanRs reduce benzophenanthridine alkaloids
to the corresponding dihydrobenzophenanthridines using either NADPH or NADH as a
co-factor (Appendix A2, Fig. A2.1). To gain further insight into co-factor preference,
SanR2 was incubated with 5 μM sanguinarine, chelerythrine, chelirubine or macarpine

114
and 1mM NADPH or NADH (Fig. 14). SanR2 produces more
dihydrobenzophenanthridine compounds using NADPH, as compared to NADH, as a
co-factor. These data mimic the trends observed for SanR1 and SanR3B in preliminary
experiments (Fig. A2.1). Furthermore, these data are consistent with the results for
E. californica SanR, which catalyzes the reduction of sanguinarine and chelerythrine
using either NADPH or NADH as a hydrogen donor (Weiss et al., 2006). Furthermore,
no activity was observed for papaverine, noscapine, berberine, cryptopine, or thebaine
(data not shown). Similarly, E. californica SanR also does not reduce berberine (Weiss et
al., 2006). Like benzophenanthridines, berberine is derived from (S)-scoulerine
(Beaudoin and Facchini, 2014). The inability of SanRs to reduce the quaternary
ammonium ion in berberine, a protoberberine alkaloid, further supports its preference for
the benzophenanthridine backbone. It would be interesting to test if SanRs are able to
reduce (S)-cis-N-methylstylopine, an intermediate in sanguinarine biosynthesis, and
structurally similar to berberine except for the presence of two methylenedioxy bridges
(Fig. 1; Table 4).
The temperature optima of SanRs were determined by incubating the enzyme
with sanguinarine and NADPH for one hour at various temperatures. Preliminary
experiments indicated that the temperature optimum for SanR1 and SanR3B as 21°C
(Appendix A2, Fig. A2.2). Similarly, the temperature optimum for SanR2 is 18°C
(Fig. 15). Temperature optimum of E. californica SanR was never explicitly stated,
however, assays were incubated at 22°C (Weiss et al., 2006). Preliminary experiments to
determine pH optima were inconclusive (data not shown). However, the pH optimum of
E. californica SanRs is 6.5 to 7.5 (Weiss et al., 2006). Therefore, sanguinarine reductase

115
assays were performed at pH 7.5, and typically in sodium phosphate buffer, instead of
Tris-HCl, as to not have temperature affect pH (Sambrook and Russell, 2001). The Km of
SanR1 and SanR3B were calculated as 1.6 and 19.9 μM sanguinarine, respectively
(Fig. 16). However, the LC-MS counts for amount of dihydrosanguinarine produced was
below the linear range for most of the enzymatic reactions. Therefore, omitting these
values, the Km for SanR1 was re-calculated as 7.3 μM (Fig. 16). The Km of E. californica
SanR was 9.5 μM sanguinarine (Weiss et al., 2006). However, the Km of E. californica
SanR was determined using 40 µM NADH, and may not have been saturating. The Km
for E. californica SanR was calculated as 19 μM, when using NADPH and glutathione,
and corrected for spontaneous product formation in the absence of enzyme (Vogel et al.,
2010). I have also observed the reduction of sanguinarine to dihydrosanguinarine in the
presence of high concentrations of NAD(P)H, in absence of SanR (data not shown).
However, no conversion of sanguinarine to dihydrosanguinarine was observed in the
presence of 1 mM NAD(P)H (Fig. 13G-H). Vogel et al. (2010) observed E. californica
SanR is irreversibly inhibited by its product, dihydrosanguinarine. Therefore, conversion
of sanguinarine to dihydrosanguinarine is never saturated. Adding glutathione to the
reaction allows a constant supply of sanguinarine in complex to prevent
dihydrosanguinarine inhibition, and achieve saturation kinetics. Consequently, the
affinity of opium poppy SanRs for sanguinarine may be higher than calculated (Fig. 16).
4.3 Short-chain dehydrogenase/reductases
To date, four reductases have been identified in opium poppy benzylisoquinoline
biosynthesis. An aldo-keto reductase, codeinone reductase (COR), and three short-chain
dehydrogenase/reductases (SDRs), noscapine synthase (NOS), salutaridine reductase

116
(SalR), and sanguinarine reductase (Marchler-Bauer et al., 2015; Chen and Facchini,
2014; Ziegler et al., 2006; Unterlinner et al., 1999). SDRs are a superfamily of
NAD(P)(H)-dependent oxidoreductases typically share three conserved features, a
Rossmann-fold motif, an N-terminal dinucleotide co-factor binding motif, and an active
site with a catalytical YXXXK motif (Moummou et al., 2012). Furthermore, plant SDRs
are classified into three major subgroups, classical, extended, and divergent. However, it
is estimated that approximately 10% of predicted SDRs do not fall into one of these
general categories, and are referred to as “atypical” SDRs, which typically include
enzymes involved in secondary metabolism or developmental processes. Opium poppy
SanRs are defined as atypical SDRs, whereas NOS and SalR belong to the extended and
classical subgroups, respectively (Marchler-Bauer et al., 2015; Chen and Facchini, 2014;
Ziegler et al., 2006). Both NOS and SalR exhibit high substrate specificity towards
narcotinehemiacetal and salutaridine, respectively (Chen and Facchini, 2014; Ziegler et
al., 2006). However, SanRs will reduce benzophenanthridines sanguinarine,
chelerythrine, chelirubine, and macarpine (Fig. 13). Therefore, SanRs may have
undergone more functional diversification compared to NOS or SalR, and could explain
the ability of SanRs to reduce chelerythrine, chelirubine and macarpine, which are not
known to accumulate in Papaver somniferum.
The N-terminal dinucleotide co-factor binding motif of SanRs (TGASGLTG or
TGAGGRTG) is very similar to the NADP-binding motif, [TS]GXXGXXG, of extended
SDRs (Marchler-Bauer et al., 2015; Kavanagh et al., 2008). However, SanRs will reduce
benzophenanthridines using either NADPH or NADH as a co-factor (Fig. 13), and end-

117
point assays indicate SanRs may prefer NADPH to NADH (Fig. 14). Additional assays
are required, including Km determination, to accurately conclude co-factor preference.
4.4 Protein localization of sanguinarine reductases in planta
Antibodies (antisera) were generated against recombinant 6xHis-tagged SanRs in
mice. After four booster injections the mice antisera were not specific for a given SanR
(Fig. 17 and 18). This is expected due to the high degree of sequence similarity between
opium poppy SanRs. To increase antisera specificity, antibodies could have been raised
against a small region specific to a given SanR. However, pre-exposing antiserum to a
high concentration of the non-target antigens (“antibody scrubbing”) was successful in
increasing specificity towards a given SanR (Fig. 18). To increase specificity of the
antisera towards a given SanRs in planta, a much higher concentration (1:50 or 1:100) of
“scrubbed” antiserum is needed compared to the concentration required to detect SanRs
on a Western blot (1:10,000).
Soluble proteins were isolated from stem, root, leaf, and capsule/bud tissues, as
well as latex, from 8 different Papaver somniferum cultivars. SanRs were detected in all
tissue types using SanR3B antiserum, which is able to detect all three SanRs (Fig. 17 and
18). Although SanR3B antiserum is non-specific to a given SanR, the SanR found within
a tissue type can be inferred based on molecular weight. The molecular weight of
SanR(s) detected in root tissue is consistent with that of SanR3 (32.1 kDa) than SanR1
and SanR2 (29.4 kDa) (Fig. 19), however SanR1, SanR2, and SanR3 separate at similar
molecular weights in SDS-PAGE (Fig. 7). The molecular weight of SanR(s) present in
stem, leaf, and capsule/bud are consistent with the size of SanR3B (26.8 kDa) (Fig. 7 and
19). The SanR(s) detected in latex is smaller than those found in all tissues, and its size is

118
not consistent with SanR1, Sanr2, or SanR3(B) (Fig. 7 and 19). Also, SanRs were only
detected in the latex of poppy Veronica, Marianne, and Bea’s Choice (Fig. 19). However,
latex signal was inconsistent, and difficult to reproduce. The smaller band observed in the
latex Western blots with SanR antiserum may correspond to splice variants or cleaved
SanR1 or SanR2 proteins, and the larger band, greater than the 46 kDa molecular marker,
in the latex Western blots, which may correspond to a post-translationally modified
SanRs. However, if these signals were representative of SanRs in the latex, it is expected
that similar sized proteins would be detected in the Western blot for each of the tissues,
as they all contained laticifers. Interestingly, shotgun proteomics implicated SanR1
and/or SanR2 in the latex (personal communication) (Onoyovwe et al., 2013).
Consistent with Western blot analysis, immunolocalization indicated SanRs are
present in stem, root, and capsule tissues (Fig. 20). No reliable signal was obtained for
leaf tissue, but absence of signal does not indicate absence of protein. Furthermore,
multiple cultivars (40, Veronica, and Marianne) were used for immunolocalization, but
all show similar results when probed with SanR3 antiserum (data not shown). Therefore,
representative images using poppy cultivar 40 are shown (Fig. 20). Specifically, SanRs
appear to localize to the phloem, which is consistent with the localization of other
enzymes involved in BIA biosynthesis (Onoyovwe et al., 2013). Enzymes involved in
morphinan biosynthesis (downstream of (R)-reticuline) predominantly localize to
laticifers, whereas other BIA enzymes (upstream of (S)-reticuline) predominantly localize
to sieve elements (Fig. 1) (Onoyovwe et al., 2013). In cell culture, DBOX (Accession
JX390714), the enzyme responsible for synthesizing sanguinarine from
dihydrosanguinarine, is predicted to localize to secretory pathway, because it contains a

119
signal peptide targeting it to the ER (Hagel and Facchini, 2012; Emanuelsson et al.,
2007). Therefore, SanR, the enzyme responsible for the reverse reaction, reducing
sanguinarine to dihydrosanguinarine, might also be targeted to the ER. During laticifer
development, the ER differentiate in to alkaloid containing vesicles, which could indicate
a potential route for SanR laticifer localization (Nessler and Mahlberg, 1977). However,
SanRs are not predicted to localize to the ER. Both SanR1 and SanR2 are predicted to
localized to the cytosol, while SanR3 and SanR4 are predicted to localize to the
chloroplast (Horton et al., 2007; Emanuelsson et al., 2007). Therefore, to definitively
determine the phloem cell type SanRs are localized to sections need to be stained with
aniline blue to detect sieve tubes (callose), and/or probed with a latex-specific protein,
such as major latex protein (MLP) (Nessler et al., 1985; Currier, 1957). Furthermore, the
SanR3B antiserum was used to detect SanRs for immunolocalization experiments. Due to
the cross-reactivity of this antiserum the identity of SanR(s) detected in the different
tissues in unknown. A lower antiserum dilution (1:100) would need to be scrubbed to
increase antisera specificity toward a given SanR.
Interestingly, the opium poppy SanR3B antiserum only detected proteins in the
aerial tissues of E. californica, not root tissues, and has a molecule weight greater than 30
kDa (Fig. 19). This is surprising as sanguinarine is only predominantly found in the roots
of California poppy. Therefore, the E. californica SanR(s) detected in aerial organs may
have similar roles in planta to opium poppy SanR(s) found within the latex. Perhaps,
aerial E. californica, and latex P. somniferum SanRs are responsible for reducing
sanguinarine to dihydrosanguinarine for its transport throughout the plant. The
characterized E. californica SanR shares 77%, 78%, and 59% sequence similarity to

120
SanR1, SanR2, and SanR3, respectively. The molecular weight of the characterized
E. californica SanR isolated from cell culture is 29.5 kDa (Weiss et al., 2006). Analyzing
our E. californica root transcriptome database identified 5 transcripts that encode proteins
with more than 60% sequence similarity to the characterized SanR, and all encoded
proteins ranging from 29.0 to 30.6 kDa. But we do not have any data on the expression of
SanRs in aerial tissue of E. californica. Therefore, the SanR(s) detected in the aerial
organs is likely tissue-specific, and may be more similar to opium poppy SanRs than the
characterized root-specific SanR, which could explain why SanR(s) were not detected in
the root tissue of E. californica.
4.5 Expression of sanguinarine reductases in planta
Primers were originally designed to amplifying SanRs using the SYBR Green
method of qPCR. However, primers sets were not specific for a given SanR, and would
amplify all SanR templates (purified pQE30-SanR plasmids) (data not shown).
Furthermore, no silencing of SanRs in VIGS-treated plants was observed using these
primers (data not shown). Presumably, the primers were able to amplify the non-silenced
SanRs to mask the reduced expression of SanRs targeted by VIGS constructs. Therefore,
primers and MGB probes were designed for TaqMan qPCR to increase specificity
(Table 4). In addition, ubiquitin (GenBank Accession: JN402989) was used an
endogenous reference gene because its expression level (CT value) was consistent
between tissues. The relative expression level of each SanR in four tissue types was
determined using the comparative ΔΔCT method, whereby the average CT value for
ubiquitin is subtracted from the average CT value for SanR1, SanR2, or SanR3 (ΔCT).
ΔCT values can be directly converted to relative expression level using the equation

121
2^(-ΔCT), or compared to control samples to obtain a ΔΔCT value (Fig. 21). Overall,
SanR1 is expressed in all tissue, SanR2 is expressed predominantly in root tissue, and
SanR3 is expressed in all tissues except capsule/flower bud (Fig. 21). The expression
profiles of SanR2 and SanR3 are consistent with the Illumina transcriptomes: SanR2 was
only present in the root transcriptome, and SanR3 was present in both the stem and root
transcriptomes. On the other hand, SanR1 is expressed in both stem and root tissue, but
was only present in the stem transcriptome. However, since there is evidence that one
contig representing SanR2 in the root transcriptome is poorly assembled (personal
communication), and SanR1 and SanR2 share 88% sequence similarity at the nucleotide
level that the absence of SanR1 in the root transcriptome is the result of assembly error.
For simplicity, I have chosen to represent gene expression data relative to the
endogenous gene only. Papaver somniferum cultivar Bea’s Choice does not have an
isogenic background, and exhibits natural variation in gene expression. For example,
SanR3 expression levels for control, non-silenced plants are highly variable, and
expression is three-times higher in some plants than the average (Fig. 23). Therefore, it is
difficult to choose a single reference to compare all VIGS plants. As well, the natural
variation in SanR expression in Bea’s Choice likely contributes to the variation in the
silenced phenotypes observed. VIGS is designed to knock down, not knock out, gene
expression, therefore, silencing effects may be masked in plant that naturally display
higher baseline expression levels.
VIGS constructs were designed complementary to the 5’- or 3’-untranslated
region (UTR) or coding sequence of SanRs (Fig. 4). However, there were discrepancies
in the UTRs of SanR1 and SanR2 in the Illumina transcriptome (Appendix A3). The two

122
contigs representing SanR1 or SanR2 had different 3’ UTR sequences. Therefore, the
Roche-454 stem transcriptome was consulted to clarify assembly error. Constructs
designed to silence SanRs were cloned into the pTRV2 and transformed into
Agrobacterium. Cultures of Agrobacterium harbouring pTRV2-SanR VIGS constructs
mixed with equal volumes of Agrobacterium harbouring pTRV1 were infiltrated into
opium poppy seedlings. To confirm poppies were successfully infiltrated and transformed
with pTRV2, RNA was isolated from poppy root tissue, synthesized into cDNA, and
PCR amplified with primers designed to amplify viral coat protein (CP) (Table 2;
Fig. 22). Approximately 200 poppies were infiltrated with VIGS constructs, and 130
plants tested positive CP, which is an approximately 65% success rate. Poppy cDNA
should have also been checked for the presence of transcripts encoded by pTRV1, and
PCR amplified using primers designed against the movement protein (Fig. 2; Table 2).
However, plant RNA isolated from previous VIGS experiments always displayed co-
expression of genes encoded by pTRV1 and pTRV2 together (data not shown).
To analyze root metabolites in VIGS-treated plants, retention times from
extracted-ion chromatographs of alkaloid authentic standards were compared to authentic
standards to identify unknown alkaloids in the roots of SanR-silenced plants (Fig. 24 and
25). Electrospray ionisation mass spectrometry readily detects the alkaloids noscapine,
papaverine, reticuline, thebaine, sanguinarine, and dihydrosanguinarine (Hagel et al.,
2012). However, a more targeted search for less abundant alkaloids, such as stylopine, an
intermediate in sanguinarine biosynthesis, and oripavine, an intermediate in morphine
biosynthesis, is required for detection (Hagel et al., 2012; Hagel and Facchini, 2010;
Ikezawa et al., 2007). Therefore, root alkaloids extracted from VIGS plants either need to

123
be re-analyzed at a lower dilution, or re-analyzed using selected ion monitoring, in order
to assess changes in the accumulation of these low-abundance alkaloids. Consequently, a
caveat of my analysis is that I may be seeing little to no effect in metabolite levels as a
result of VIGS treatment, perhaps because I did not investigated changes in lower
abundance alkaloids. As well, dihydrosanguinarine spontaneously converts to
sanguinarine in the presence of heat. Therefore, changes in dihydrosanguinarine and
sanguinarine may have been lost during analysis, because the LC-MS does not have a
sample-cooling chamber. Furthermore, Student’s t-test was used to determine if two data
sets were significantly different from each other, but this test can only be used when the
two distributions have the same variance. In some cases, the variation within the empty
vector control samples and SanR-silenced treatment groups was not equal, and Welch’s
correction was applied in attempt to correct for unequal variance (GraphPad Prism).
Consequently, unequal variance between groups abolished the significance implicated
with Student’s t-test.
Silencing SanR1 resulted in no significant changes in metabolite profile (Fig. 26).
Similarly, silencing SanR2 using VIGS constructs complementary to the 5’ UTR (V3)
and coding sequence (V4) did not affect root metabolite profile (Fig. 27). However,
silencing SanR2 using VIGS constructs complementary the 3’ UTR (V5) resulted a
significant increase in morphine, even though the knocked down expression level is
comparable to that of V3-treated plants (Fig. 27). Interestingly, silencing T6ODM and/or
CODM, which encode enzymes involved in morphine biosynthesis, in opium poppy roots
resulted in reduced levels of sanguinarine (Farrow and Facchini, 2013). Together, these
124
data may indicate an indirect relationship between morphine and sanguinarine
biosynthesis.
Silencing SanR3 resulted in a significant increase in sanguinarine, but in some
cases cryptopine or reticuline levels were increased, while noscapine levels were
decreased (Fig. 28). This supports the role of SanR3 as sanguinarine reductase in planta.
It is expected that knocking down the expression of SanR3 would result in less translated
protein, and an accumulation of sanguinarine, because it cannot be effectively reduced to
dihydrosanguinarine. Furthermore, sanguinarine biosynthesis begins with the formation
of scoulerine from reticuline by BBE, and cryptopine is a protopine derivative also
originating from scoulerine (Beaudoin and Facchini, 2014). Therefore, silencing SanR3
resulted in a build up of upstream metabolites in the sanguinarine biosynthetic pathway.
Surprisingly, the VIGS construct designed to silence SanR1 and SanR3 (V8)
resulted in reduced expression levels of SanR2 and SanR3, but no change in the
expression level of SanR1 (Fig. 29). The V8 construct was designed to target the 3’ UTRs
of SanR1 and SanR3, and it has been noted that as little as seven perfect matches between
siRNA and 3' UTR is sufficient to facilitate off-targeting silencing effects (Birmingham
et al., 2006). I assumed that 3’ UTR sequence similarity of SanR1 contig
comp9568_c0_seq1 and SanR2 contig comp73923_c0_seq1, and SanR1 contig
comp9568_c0_seq2 and SanR2 contig comp73923_c0_seq2 was an assembly error in the
Illumina transcriptome through comparison with the transcripts in the Roche-454
transcriptome (Appendix A3). Therefore, if the Illumina library is accurate then the
construct designed to silence SanR1 is 100% complementary to 3’ UTR of both SanR1
and SanR2, and reduced expression levels of SanR2 is not unexpected. Furthermore, the

125
expression level of SanR2 was not determined in V1 or V2 plants, and may have also
been silenced in addition to SanR1 (Fig. 26). Therefore, another caveat of my VIGS
analysis is that only expression levels of targeted SanR were checked, and it is clear that
expression of non-targeted SanRs may be affected. Nevertheless, silencing SanR2 and
SanR3 resulted in decreased noscapine, and papaverine levels (Fig. 29), and the
decreased noscapine levels are consistent with SanR3-silencing in V6-treated plants
(Fig. 28). Reduced noscapine and papaverine levels were also observed in T6ODM and/or
CODM silenced plants (Farrow and Facchini, 2013).
Guillaume Beaudoin (V9-V12) designed four VIGS constructs, but only V9
showed 100% sequence similarity to Bea’s Choice SanR1. Therefore, expression levels
of all SanRs were analyzed. Interestingly, the V9 construct, which shared 100% sequence
similarity to SanR1 coding sequence, resulted in an increase in SanR1 expression, and a
decrease in SanR2 expression (Fig. 30). Although silencing SanR1 did not alter
metabolite levels in the roots, increasing the expression of SanR1 increased reticuline,
thebaine, and sanguinarine levels (Fig. 26 and 30). However, no change in morphine
levels was observed as seen in other SanR2-silenced plants (Fig. 27). Both V12 and V8
plants showed decreased levels in both SanR2 and SanR3 expression (Fig. 33). However,
silencing in V8 plants was correlated to a decrease in noscapine and papaverine levels,
while no significant change in metabolite levels was observed in V12 plants (Fig. 33).
The only difference between the V8 and V12 construct is that they target the 3’ UTR and
coding sequence, respectively. Lastly, both V10 and V11 plants resulted in a significant
reduction of all SanR expression levels (Fig. 31 and 32). Yet no significant changes in
metabolite levels were observed (Fig. 31 and 32).

126
Interestingly, in few cases did silencing one or more SanRs result in increased
sanguinarine levels compared to the empty vector control. Due to the highly cytotoxic
nature of sanguinarine, pests, such as Frankliniella occidentalis (Western Flower thrips),
will preferentially feed on Phaseolus vulgaris (common bean) instead of the
benzophenanthridine-producing Chelidonium majus, and will also avoid sugar solutions
containing sanguinarine (Schütz et al., 2014). However, when forced to feed on leaves
from Chelidonium majus or Eschscholzia californica, two members of the Papaveraceae
family, thrips induced enhanced alkaloid production in the plants. After feeding for three
days, the leaves of C. majus and E. californica showed a marked increase in
benzophenanthridine alkaloid content, specifically sanguinarine (Schütz et al., 2014).
Induction and/or increase in sanguinarine production as a result of herbivory is consistent
with the responses evoked by microbial elicitors in cell culture (Schumacher et al., 1987).
Opium poppy plants used for VIGS analysis were often severely infested with aphids. As
thrips and aphids are both small, soft-bodied insects that feed on plant phloem, it likely
that aphid infection would also induce an enhanced production of sanguinarine.
Therefore, pest herbivory may have induced alternative regulatory mechanisms to mask
the decrease in sanguinarine levels expected from silencing SanRs in planta.
In addition to observing metabolite changes in root tissues of VIGS-treated plants,
changes in metabolite levels of other tissues, or at least latex, should have been
investigated. SanRs are also expressed in stem, leaf, and capsule/flower bud (Fig. 21);
therefore, silencing SanRs in planta would likely affect the metabolite profile in other
tissues as well. My initial VIGS experiments only analyzed latex, not root, metabolites
when checking if SanRs may be responsible for DRR activity in planta (data not shown).

127
However, initial VIGS analyses were performed with non-specific qPCR primers to
analyze gene expression. The SYBR Green method of qPCR was not specific enough to
identify individual SanRs, and, presumably is the cause for lack of gene silencing
observed (data not shown). Therefore, samples could have been re-analyzed using primer
and probe sets for TaqMan qPCR. As well, it is clear that little to no changes in
sanguinarine or dihydrosanguinarine levels are observed in roots. This could be attributed
to the constant aphid infestation problems seen in both the growth chambers and
greenhouse, or it may be an accurate reflection of SanR silencing. Nevertheless, root
extracts from VIGS plants should have been re-analyzed for changes in other alkaloids,
using both full ion scanning and multiple reaction monitoring methods on the LC-MS.
Combined with the 130 plants analyzed here, a more detailed, and controlled analysis of
previous VIGS experiments would help to gain further insight into the role of
sanguinarine in planta.
4.6 Biological roles of sanguinarine reductases
To gain insight into the role of SanRs, both substrate and enzyme need to be
localized in planta. SanR cellular localization has been described in this thesis, but
sanguinarine has yet to be localized. Localization of sanguinarine in C. majus and
E. californica can be inferred in unstained root sections as cells containing sanguinarine
will appear yellow in colour. However, sanguinarine in P. somniferum does not
accumulate to such levels, and opium poppy roots do not exhibit any visible yellow
coloration. Therefore, sanguinarine in opium poppy can only be detected using more
sensitive methods, such as TLC or LC-MS. Laser microdissection could be used to

128
isolate individual cell types for LC-MS analysis in order to gain further insight into
sanguinarine cellular localization (Abbott et al., 2010).
As sanguinarine is a highly cytotoxic compound, compartmentalization is also
important in planta, in addition to possessing an enzyme capable of reducing this
metabolite. Both Chelidonium majus and Eschscholzia californica accumulate
benzophenanthridine alkaloids. C. majus sequesters benzophenanthridine alkaloids into
laticifers, specifically latex vesicles, whereas E. californica accumulates the alkaloids in
idioblasts of the root cortex and/or laticifers (personal communication; Hauser and Wink,
1990; Schütz et al., 2014). In opium poppy plants, sanguinarine and dihydrosanguinarine
are the major alkaloids detected in the roots, and account for 20% and 80% of the
benzophenanthridine alkaloid content in the roots of opium poppy cultivar Marianne,
respectively (Frick et al., 2005; Facchini et al., 1996). Neither sanguinarine, nor
dihydrosanguinarine, are detected in the latex of opium poppy, but trace amount of both
alkaloids have been detected in the stems and leaves of a narcotic cultivar, C048-6-14-64,
in which morphine, codeine, and thebaine account for 91.2% of the latex alkaloids (Frick
et al., 2005). Only trace amounts of dihydrosanguinarine were detected in the leaves of
Marianne, a low morphine cultivar. However, it is still unclear as to the presence of
sanguinarine in the capsule.
In Papaver somniferum cell cultures, sanguinarine localizes to the central vacuole
and ER-derived vesicles (Alcantara et al., 2005). However, sanguinarine only
accumulates in elicited microbial cells, whereas sanguinarine is abundant in the roots of
opium poppy plants (Alcantara et al., 2005). Moreover, sanguinarine is mostly excreted
into the media of elicited E. californica cell cultures, while small quantities are retained

129
around the cell wall (Weiss et al., 2006). Also, exogenous sanguinarine taken up
E. californica cell cultures localizes to the cell wall, which is converted to
dihydrosanguinarine and targeted to the vacuole (Weiss et al., 2006). Similarly, elicited
P. bracteatum cell cultures secrete sanguinarine into the medium, and cells exhibit a
yellow fluorescence within the peripheral regions of the cell (Cline and Coscia, 1989;
Cline and Coscia, 1988). Unlike control cells, elicited cells display an extensive network
of elongated and dilated ER, and electron-dense aggregates associated with the tonoplast.
The aggregates appeared to migrate to and enter the tonoplast forming vesicles within the
vacuole (Cline and Coscia, 1989). Therefore, it is difficult to use cell cultures to predict
the cellular localization of sanguinarine in opium poppy plants, specifically root tissue, as
sanguinarine is not detected in the latex of opium poppy. However, the alkaloid-
containing vesicles in opium poppy laticifers are formed from ER dilations (Nessler and
Mahlberg, 1977). Perhaps in absence of different cell types in culture, sanguinarine is
targeted to the vacuole for storage via ER-derived vesicles, while sanguinarine is targeted
to laticifers for storage in planta.
As both BBE, which catalyzes the first committal step in sanguinarine
biosynthesis, and SanRs, which catalyzes the reduction sanguinarine, are detected in all
tissues (Fig. 19, 20, and 21) (Bird et al., 2003), sanguinarine biosynthesis may occur
throughout the plant, but, due to its cytotoxicity, sanguinarine is reduced to
dihydrosanguinarine in the aerial organs for transport, via the phloem, to the roots for
storage. Based on previous cell culture experiments, sanguinarine and
dihydrosanguinarine transport is likely mediated by the ER, and is stored within vacuoles
(Weiss et al., 2006; Alcantara et al., 2005).

130
Together, gene expression and Western blot analyses indicates SanR1 and/or
SanR3 is mediating the reduction of sanguinarine in aerial organs (stem and leaf).
Western blot analysis suggests the predominantly expressed SanR is less than 30 kDa,
which correlates to the predicted size of SanR3B (Fig. 19), but previous shotgun
proteomics data indicated SanR1 and/or SanR2 are present in the latex (personal
communication) (Onoyovwe et al., 2013). The gene expression profile of SanR2 is
consistent with other sanguinarine reductase biosynthetic enzymes, where DBOX is only
expressed in roots, but not stem, leaf, or capsule (Fig. 21) (Hagel et al., 2012). Therefore,
I hypothesize that SanR1 is restricted to laticifers of all tissues, SanR3 is present in
another phloem cell type, such as companion cells, in all tissues except the
capsule/flower bud, and SanR2 is restricted to the root (Fig. 34). Co-localization with
cell-type specific antibodies, such as major latex protein (MLP), and using SanR-specific
antibodies is necessary to determine the precise tissue and cellular localization of SanR.
As sanguinarine and dihydrosanguinarine are both found to some extent in stem, leaf, and
root tissue, but not the capsule, I predict that SanR2 plays a direct role in sanguinarine
detoxification in the roots, while SanR1 and SanR3 may have additional, uncharacterized
roles.

131
A B
SanR1
SanR2
SanR3
SanR1
SanR3
SanR1
SanR3
SanR1
Sanguinarine DHS
Phloem cells
Laticifer Sieve
element
Companion
cell
Vacuole
ER SanR1
SanR2 SanR3
Figure 34. Predicted model for opium poppy SanRs.

132
Figure 34 (continued). Predicted model for opium poppy SanRs. Schematic outlining the putative roles of sanguinarine reductase
(SanR) through gene expression and protein localization studies in planta. (A) SanRs are expressed in all tissues, and (B) the encoded
proteins are localized to the phloem. SanR3 is expressed in all tissues, except the capsule and/or flower bud, which are not known to
contain sanguinarine or dihydrosanguinarine (orange). SanR3 also contains a putative transit peptide, which may signal it to the
endoplasmic reticulum (ER), the site of sanguinarine biosynthesis. Therefore, sanguinarine biosynthesis may occur in stem, leaf, and
root tissues, and SanR3 reduces sanguinarine to dihydrosanguinarine for transport shoot-to-root via the phloem (sieve element), or
storage in the vacuole. SanR1 and SanR2 are found in the laticifers, which accumulate morphinan alkaloids (blue), and may have an
additional role outside sanguinarine detoxification.

133
There is a clear segregation between benzophenanthridine and morphine
biosynthetic pathways in planta. Sanguinarine accumulates in the roots, but is not
detected in the latex, whereas morphinan alkaloids accumulate to high levels in laticifers,
but are only detected at low levels in the roots (Frick et al., 2005; Facchini and De Luca,
1995). As well, dedifferentiated opium poppy cell cultures do not constitutively
accumulate alkaloids, such as morphine, but will produce sanguinarine in response to
treatment with a fungal elicitor (Alcantara et al., 2005). Interestingly, silencing the genes
encode T6ODM and/or CODM, which convert thebaine to codeinone and oripavine,
respectively (Fig. 1), results in increased thebaine levels in latex, and reduced levels of
sanguinarine in the roots, despite increased protopine levels (Farrow and Facchini, 2013).
It would be interesting to test the expression levels of all three SanRs to determine if
silencing T6ODM and/or CODM had an effect on expression. In addition, an ethyl
methanesulfonate (EMS)-induced mutant displaying an unusual accumulation of
sanguinarine in the latex also exhibited lower thebaine levels compared to the untreated
control (Desgagné-Penix et al., 2009). Together these data suggest a currently unstudied
relationship between benzophenanthridine and morphine biosynthesis. Perhaps the
presence of sanguinarine in latex excludes the biosynthesis of morphinan alkaloids, such
as thebaine, and SanRs, particularly SanR1, are required to mediate morphinan
biosynthesis in planta, as well as cellular detoxification of sanguinarine.

134
5 CONCLUSION
Sanguinarine is able to intercalate DNA, inhibit DNA synthesis, and affects
membrane permeability (Schmeller et al., 1997), which also makes sanguinarine, and its
derivatives, a potential anticancer compound (Cao et al., 2015). Therefore, sanguinarine
reductase (SanR) is considered an enzyme of detoxification due to its substrate’s highly
cytotoxic nature. Thrips will avoid feeding on leaf discs from plants that accumulate
benzophenanthridine alkaloids, and avoid feeding from sugar solutions containing
sanguinarine (Schütz et al., 2014). However, if consumed, thrips will metabolize
sanguinarine to dihydrosanguinarine (Schütz et al., 2014). Furthermore, addition of
exogenous sanguinarine will inhibit growth of plant cell cultures that do not produce
benzophenanthridines (Weiss et al., 2006). Microbial elicited E. californica cells will
accumulate sanguinarine along the cell wall, secrete it into the medium, then re-absorb it
for reduction to dihydrosanguinarine (Weiss et al., 2006). Therefore, dihydrosanguinarine
appears to be less toxic than sanguinarine, and SanR may have evolved to prevent self-
intoxication by benzophenanthridine producing species.
In cell culture, the sanguinarine biosynthetic pathway is associated with the ER
(Hagel and Facchini, 2012). BBE, the enzyme that converts reticuline to scoulerine, is
associated with the ER, and is transported to the central vacuole (Bird and Facchini,
2001), and membrane-bound P450s, CFS and SPS, are associated with the
endomembrane (Hagel and Facchini, 2012). However, MSH, P6H, DBOX, and SanR
have not been localized at the cellular level (Beaudoin and Facchini, 2013; Hagel et al.,
2012). It is likely that MSH and P6H, which are the P450s, and DBOX, which has a
putative ER signal peptide, will also be targeted to the ER (Beaudoin and Facchini, 2013;

135
Emanuelsson et al., 2007). Only two of the four opium poppy SanRs are predicted to
localize to the cytosol (Emanuelsson et al., 2007; Horton et al., 2007). Therefore,
sanguinarine biosynthesis likely occurs in the ER, and ER-derived vesicles transport
sanguinarine to the vacuole for storage, and/or become the precursors to alkaloid-
containing vesicles in laticifers, and/or are targeted to the cell wall for exocytosis as a
defense mechanism. SanRs localized in the cytosol may act against self-cytotoxicity upon
reabsorption of secreted sanguinarine. For example, upon herbivory sanguinarine
contained within the vacuoles and/or laticifers is released and transported across the
membrane of intact, undamaged cells. Perhaps SanRs have evolved to reduce the “free”
sanguinarine in undamaged cell to prevent self-cytotoxicity.
The roles of all four opium poppy SanRs in planta are unclear. Many questions
remain, such as do the four SanRs have unique roles, or are they functionally redundant?
Characterization of opium poppy SanRs have revealed both similarities and differences
between them. I have also shown SanRs are expressed in, and the encoding proteins are
localized to the phloem of all tissues (Fig. 20 and 21). However, co-localization with
cellular markers, and antibody scrubbing is required to discern the specific details
regarding SanR localization (Fig. 20). Since sanguinarine only accumulates in opium
poppy roots, seedlings, and fungal elicitor-treated cell cultures, it is expected that SanRs
responsible for reducing sanguinarine in planta would be expressed in the roots (Facchini
et al., 1996). Genes encoding other enzymes involved in the biosynthesis of sanguinarine,
such as BBE, MSH, CFS, SPS and DBOX, expressed predominantly in roots, with little to
no expression in stem, leaf, or flower bud (Fossati et al., 2014; Beaudoin and Facchini,
2013; Hagel et al., 2012). The only opium poppy SanR to mimic this expression profile is

136
SanR2 (Fig. 21). Therefore, SanR2 likely plays a direct role in sanguinarine biosynthesis
in the roots of opium poppy.
Sanguinarine, chelirubine, and macarpine are most abundant in members of the
Papaveraceae, but also present at low levels in most of the BIA-producing cell cultures
(Farrow et al., 2012). However, the reduced forms (dihydrobenzophenanthridines) of
these alkaloids are detected almost exclusively in members of the Papaveraceae (Farrow
et al., 2012). Phylogenetic analysis revealed the characterized SanR from E. californica
clustered with SanR homologs from other Papaveraceae family members that accumulate
benzophenanthridine alkaloids, such as Sanguinaria canadensis, Chelidonium majus,
Corydalis chelianthifolia, but did not cluster with SanR homologs from Ranunculaceae,
Berberidaceae, or Menispermaceae family members (Appendix A4). Interestingly,
P. somniferum SanR1, SanR2, and SanR4 cluster with E. californica SanR, whereas
P. somniferum SanR3 clusters with homologs from Ranunculaceae, Berberidaceae, and
Menispermaceae families (data not shown). I have shown that P. somniferum SanRs are
capable of reducing sanguinarine, as well as chelerythrine, chelirubine, and macarpine, to
the corresponding dihydrobenzophenanthridines alkaloids in vitro (Fig. 13), which is
consistent with the ability of E. californica SanR to reduce both sanguinarine and
chelerythrine (Weiss et al., 2006).
Although silencing SanR in planta rarely resulted in an increase in sanguinarine,
this is likely due to aphid infestation. Together, biochemical characterization of SanRs,
gene expression analysis, and immunolocalization data support SanRs as a detoxifying
enzyme in planta. However, additional experiments are required to differentiate, and
characterize the individual roles of four SanRs from Papaver somniferum.

137
Bibliography
Abbott, E., Hall, D., Hamberger, B. and Bohlmann, J. (2010) Laser microdissection of
conifer stem tissues: isolation and analysis of high quality RNA, terpene synthase
enzyme activity and terpenoid metabolites from resin ducts and cambial zone tissue
of white spruce (Picea glauca). BMC Plant Biol., 10, 106.
Alcantara, J., Bird, D.A., Franceschi, V.R. and Facchini, P.J. (2005) Sanguinarine
biosynthesis is associated with the endoplasmic reticulum in cultured opium poppy
cells after elicitor treatment. Plant Physiol., 138, 173–183.
Baerheim-Svendsen, A. and Verpoorte, R. (1983) Chromatrography of alkaloids, Part
A: thin-layer chromatography, Amsterdam: Elsevier.
Barlow, J.J., Mathias, A.P., Williamson, R. and Gammack, D.B. (1963) A simple
method for the quantitative isolation of undegraded high molecular weight
ribonucleic acid. Biochem. Biophys. Res. Commun., 13, 61–66.
Basu, P. and Suresh Kumar, G. (2015) A comparative study on the interaction of the
putative anticancer alkaloids, sanguinarine and chelerythrine, with single- and
double-stranded, and heat-denatured DNAs. J. Biomol. Struct. Dyn., Epub.
Battersby, A.R., Foulkes, D.M. and Binks, R. (1965) Alkaloid biosynthesis. Part VIII.
Use of the optically active precursors for investigations on the biosynthesis of
morphine alkaloids. J. Chem. Soc., 33, 3323–3332.
Beaudoin, G. a W. and Facchini, P.J. (2014) Benzylisoquinoline alkaloid biosynthesis
in opium poppy. Planta, 240, 19–32.
Beaudoin, G. a W. and Facchini, P.J. (2013) Isolation and characterization of a cDNA
encoding (S)-cis-N-methylstylopine 14-hydroxylase from opium poppy, a key
enzyme in sanguinarine biosynthesis. Biochem. Biophys. Res. Commun., 431, 597–
603.
Bird, D.A. and Facchini, P.J. (2001) Berberine bridge enzyme, a key branch-point
enzyme in benzylisoquinoline alkaloid biosynthesis, contains a vacuolar sorting
determinant. Planta, 213, 888–897.
Bird, D.A., Franceschi, V.R. and Facchini, P.J. (2003) A tale of three cell types:
alkaloid biosynthesis is localized to sieve elements in opium poppy. Plant Cell, 15,
2626–2635.

138
Birmingham, A., Anderson, E.M., Reynolds, A., et al. (2006) 3’ UTR seed matches,
but not overall identity, are associated with RNAi off-targets. Nat. Methods, 3, 199–
204.
Birnboim, H.C. and Doly, J. (1979) A rapid alkaline extraction procedure for screening
recombinant plasmid DNA. Nucleic Acid Res., 7, 1513–1523.
Borkowski, P.R., Horn, J.S. and Rapoport, H. (1978) Role of 1,2-dehydroreticulinium
ion in the biosynthesis conversion of reticuline to thebaine. J. Am. Chem. Soc., 100,
276–281.
Bradford, M.M. (1976) A rapid and sensitive method for the quantitation of microgram
quantities of protein utilizing the principle of protein-dye binding. Anal. Biochem.,
72, 248–254.
Bustin, S.A., Benes, V., Garson, J.A., et al. (2009) The MIQE guidelines: minimum
information for publication of quantitative real-time PCR experiments. Clin. Chem.,
55, 611–622.
Cao, F.-J., Yang, R., Lv, C., Ma, Q., Lei, M., Geng, H. and Zhou, L. (2015)
Pseudocyanides of sanguinarine and chelerythrine and their series of structurally
simple analogues as new anticancer lead compounds : Cytotoxic activity , structure–
activity relationship and apoptosis inductio. Eur. J. Pharm. Sci., 67, 45–54.
Carqueijeiro, I., Noronha, H., Duarte, P., Gerós, H. and Sottomayor, M. (2013)
Vacuolar transport of the medicinal alkaloids from Catharanthus roseus is mediated
by a proton-driven antiport. Plant Physiol., 162, 1486–1496.
Chaga, G., Hopp, J. and Nelson, P. (1999) Immobilized metal ion affinity
chromatography on Co2+-carboxymethylaspartate-agarose Superflow, as
demonstrated by one-step purification of lactate dehydrogenase from chicken breast
muscle. Biotechnol. Appl. Biochem., 29, 19–24.
Chen, X., Dang, T.T. and Facchini, P.J. (2015) Noscapine comes of age.
Phytochemistry, Epub.
Chen, X. and Facchini, P.J. (2014) Short-chain dehydrogenase/reductase catalyzing the
final step of noscapine biosynthesis is localized to laticifers in opium poppy. Plant
J., 77, 173–184.
Choi, K.-B., Morishige, T., Shitan, N., Yazaki, K. and Sato, F. (2002) Molecular
cloning and characterization of coclaurine N-methyltransferase from cultured cells
of Coptis japonica. J. Biol. Chem., 277, 830–835.

139
Cline, S.D. and Coscia, C.J. (1988) Stimulation of Sanguinarine Production by
Combined Fungal Elicitation and Hormonal Deprivation in Cell Suspension
Cultures of Papaver bracteatum. Plant Physiol., 86, 161–5.
Cline, S.D. and Coscia, C.J. (1989) Ultrastructural changes associated with the
accumulation and secretion of sanguinarine in Papaver bracteatum suspension
cultures treated with fungal elicitor. Planta, 178, 303–314.
Congdon, R.W., Muth, G.W. and Splittgerber, A.G. (1993) The binding interaction of
Coomassie Blue with proteins. Anal. Biochem., 213, 407–413.
Currier, H.B. (1957) Callose substance in plant cell. Am. J. Bot., 44, 478–488.
Damm, D.D., Curran, A., White, D.K. and Drummon, J.F. (1999) Leukoplakia of the
maxillary vestibule — an association with Viadent? Oral Surg Oral Med Oral
Pathol Oral Radiol Endod., 87, 61–66.
Dang, T.-T.T. and Facchini, P.J. (2014) CYP82Y1 is N-methylcanadine 1-hydroxylase,
a key noscapine biosynthetic enzyme in opium poppy. J. Biol. Chem., 289, 2013–
2026.
De-Eknamkul, W. and Zenk, M.H. (1992) Purification and properties of 1,2-
dehydroreticuline reductase from Papaver somniferum seedlings. Phytochemistry,
31, 813–821.
Deroussent, A., Ré, M., Hoellinger, H. and Cresteil, T. (2010) Metabolism of
sanguinarine in human and in rat: Characterization of oxidative metabolites
produced by human CYP1A1 and CYP1A2 and rat liver microsomes using liquid
chromatography-tandem mass spectrometry. J. Pharm. Biomed. Anal., 52, 391–397.
Desgagné-Penix, I., Farrow, S.C., Cram, D., Nowak, J. and Facchini, P.J. (2012)
Integration of deep transcript and targeted metabolite profiles for eight cultivars of
opium poppy. Plant Mol. Biol., 79, 295–313.
Desgagné-Penix, I., Hagel, J.M. and Facchini, P.J. (2009) Mutagenesis as a functional
genomics platform for pharmaceutical alkaloid biosynthetic gene discovery in
opium poppy. In Q. Y. Shu, ed. Induced plant mutation in the genomics era. Rome:
Food and Agriculture Organization of the United Nations, pp. 410–418.
Dinesh-Kumar, S.P., Anandalakshmi, R., Marathe, R., Schiff, M. and Liu, Y. (2003)
Virus-induced gene silencing. In Methods in Molecular Biology, Volume 236: Plant
Functional Genomics. pp. 287–293.
Dittrich, H. and Kutchan, T.M. (1991) Molecular cloning, expression, and induction of
berberine bridge enzyme, an enzyme essential to the formation of

140
benzophenanthridine alkaloids in the response of plants to pathogenic attack. Proc.
Nat. Acad. Sci. USA, 88, 9969–9973.
Dvorák, Z. and Simánek, V. (2007) Metabolism of sanguinarine: the facts and the
myths. Curr. Drug Metab., 8, 173–176.
Eilert, U. and Constabel, F. (1985) Ultrastructure of Papaver somniferum cells cultured
in vitro and treated with fungal homogenate eliciting alkaloid production.
Protoplasma, 128, 38–42.
Emanuelsson, O., Brunak, S., Heijne, G. von and Nielsen, H. (2007) Locating proteins
in the cell using TargetP, SignalP and related tools. Nat. Protoc., 2, 953–971.
Facchini, P.J. and Luca, V. De (2008) Opium poppy and Madagascar periwinkle: model
non-model systems to investigate alkaloid biosynthesis in plants. Plant J., 54, 763–
784.
Facchini, P.J. and Luca, V. De (1995) Phloem-specific expression of tyrosine/dopa
decarboxylase genes and the biosynthesis of isoquinoline alkaloids in opium poppy.
Plant Cell, 7, 1811–1821.
Facchini, P.J., Penzes, C., Johnson, A.G. and Bull, D. (1996) Molcular
characterization of berberine bridge enzyme genes from opium poppy. Plant
Physiol., 112, 1669–1677.
Fairbairn, J.W., Hakim, F. and Kheir, Y. El (1974) Alkaloid storage, metabolism and
translocation in the vesicles of Papaver somniferum. Phytochemistry, 13, 1133–
1139.
Farabaugh, P.J. (1978) Sequence of the lacI gene. Nature, 274, 765–769.
Farrow, S.C. and Facchini, P.J. (2013) Dioxygenases catalyze O-demethylation and
O,O-demethylenation with widespread roles in benzylisoquinoline alkaloid
metabolism in opium poppy. J. Biol. Chem., 288, 28997–29012.
Farrow, S.C., Hagel, J.M. and Facchini, P.J. (2012) Transcript and metabolite
profiling in cell cultures of 18 plant species that produce benzylisoquinoline
alkaloids. Phytochem., 77, 79–88.
Felsenstein, J. (1985) Confidence limits on phylogenetics: an approach using the
bootstrap. Evolution (N. Y)., 39, 783–791.
Fossati, E., Ekins, A., Narcross, L., Zhu, Y., Falgueyret, J.-P., Beaudoin, G. a W.,
Facchini, P.J. and Martin, V.J.J. (2014) Reconstitution of a 10-gene pathway for
synthesis of the plant alkaloid dihydrosanguinarine in Saccharomyces cerevisiae.
Nat. Commun., 5, 1–11.

141
Frick, S., Kramell, R., Schmidt, J., Fist, A.J. and Kutchan, T.M. (2005) Comparative
qualitative and quantitative determination of alkaloids in narcotic and condiment
Papaver somniferum cultivars. J. Nat. Prod., 68, 666–673.
Gerardy, R. and Zenk, M.H. (1993) Purification and characterization of salutaridine:
NADPH 7-oxidoreductase from Papaver somniferum. Phytochem., 34, 125–132.
Gesell, A., Rolf, M., Ziegler, J., Díaz Chávez, M.L., Huang, F.-C. and Kutchan, T.M.
(2009) CYP719B1 is salutaridine synthase, the C-C phenol-coupling enzyme of
morphine biosynthesis in opium poppy. J. Biol. Chem., 284, 24432–24442.
Gilbert, W. and Müller-Hill, B. (1967) The lac operator is DNA. Proc. Nat. Acad. Sci.
USA, 58, 2415–2421.
Grothe, T., Lenz, R. and Kutchan, T.M. (2001) Molecular characterization of the
salutaridinol 7-O-acetyltransferase involved in morphine biosynthesis in opium
poppy Papaver somniferum. J. Biol. Chem., 276, 30717–30723.
Hagel, J.M., Beaudoin, G., Fossati, E., Ekins, A., Martin, V.J.J. and Facchini, P.J.
(2012) Characterization of a flavoprotein oxidase from opium poppy catalyzing the
final steps in sanguinarine and papaverine biosynthesis. J. Biol. Chem.
Hagel, J.M. and Facchini, P.J. (2010) Dioxygenases catalyze the O-demethylation steps
of morphine biosynthesis in opium poppy. Nat. Chem. Biol., 6, 273–275.
Hagel, J.M. and Facchini, P.J. (2012) Subcellular localization of sanguinarine
biosynthetic enzymes in cultured opium poppy cells. Vitr. Cell. Dev. Biol. - Plant,
48, 233–240.
Hagel, J.M., Yeung, E.C. and Facchini, P.J. (2008) Got milk? The secret life of
laticifers. Trends Plant Sci., 13, 631–639.
Hauser, M.-T. and Wink, M. (1990) Uptake of alkaloids by latex vesicles and isolated
mesophyll vacuoles of Chelidonium majus (Papaveraceae). Z. Naturforsch, 45c,
949–957.
Hileman, L.C., Drea, S., Martino, G., Litt, A. and Irish, V.F. (2005) Virus-induced
gene silencing is an effective tool for assaying gene function in the basal eudicot
species Papaver somniferum (opium poppy). Plant J., 44, 334–341.
Hirata, K., Poeaknapo, C., Schmidt, J. and Zenk, M.H. (2004) 1,2-Dehydroreticuline
synthase, the branch point enzyme opening the morphinan biosynthetic pathway.
Phytochem., 65, 1039–1046.

142
Horton, P., Park, K.-J., Obayashi, T., Fujita, N., Harada, H., Adams-Collier, C.J.
and Nakai, K. (2007) WoLF PSORT: protein localization predictor. Nucleic Acids
Res., 35, W585–W587.
Ikezawa, N., Iwasa, K. and Sato, F. (2007) Molecular cloning and characterization of
methylenedioxy bridge-forming enzymes involved in stylopine biosynthesis in
Eschscholzia californica. FEBS J., 274, 1019–1035.
Jones, D.T., Taylor, W.R. and Thornton, J.M. (1992) The rapid generation of mutation
data matrices from protein sequences. Comput. Appl. Biosci., 8, 275–282.
Kavanagh, K.L., Jörnvall, H., Persson, B. and Oppermann, U. (2008) The SDR
superfamily: functional and structural diversity within a family of metabolic and
regulatory enzymes. Cell. Mol. Life Sci., 65, 3895–3906.
Krane, B.D., Fagbule, M.O. and Shamma, M. (1984) The benzophenanthridine
alkaloids. J. Nat. Prod., 47, 1–43.
Laemmli, U.K. (1970) Cleavage of structural proteins during the assembly of the head of
bacteriophage T4. Nature, 227, 680–685.
Lee, E.-J. and Facchini, P. (2010) Norcoclaurine synthase is a member of the
pathogenesis-related 10/Bet v1 protein family. Plant Cell, 22, 3489–3503.
Lenz, R. and Zenk, M.H. (1994) Closure of the oxide bridge in morphine biosynthesis.
Tetrahedron Lett., 35, 3897–3900.
Liscombe, D.K. and Facchini, P.J. (2007) Molecular cloning and characterization of
tetrahydroprotoberberine cis-N-methyltransferase, an enzyme involved in alkaloid
biosynthesis in opium poppy. J. Biol. Chem., 282, 14741–14751.
Liscombe, D.K., Ziegler, J., Schmidt, J., Ammer, C. and Facchini, P.J. (2009)
Targeted metabolite and transcript profiling for elucidating enzyme function:
Isolation of novel N-methyltransferases from three benzylisoquinoline alkaloid-
producing species. Plant J., 60, 729–743.
Liu, Y., Schiff, M., Marathe, R. and Dinesh-Kumar, S.P. (2002) Tobacco Rar1, EDS1
and NPR1/NIM1 like genes are required for N-mediated resistance to tobacco
mosaic virus. Plant J., 30, 415–429.
Livak, K.J. and Schmittgen, T.D. (2001) Analysis of relative gene expression data
using real-time quantitative PCR and the 2(-Delta Delta C(T)) Method. Methods, 25,
402–408.
MacFarlane, S.A. (1999) Molecular biology of the tobraviruses. J. Gen. Virol., 80,
2799–2807.

143
Marchler-Bauer, A., Derbyshire, M.K., Gonzales, N.R., et al. (2015) CDD: NCBI’s
conserved domain database. Nucleic Acids Res., 43, D222–D226.
Meisel, L., Fonseca, B., González, S., et al. (2005) A rapid and efficient method for
purifying high quality total RNA from peaches (Prunus persica) for functional
genomics analyses. Biol. Res., 38, 83–88.
Millgate, A.G., Pogson, B.J., Wilson, I.W., Kutchan, T.M., Zenk, M.H., Gerlach,
W.I., Fist, A.J. and Larkin, P.J. (2004) Morphine-pathway block in top1 poppies.
Nature, 431, 413–414.
Morimoto, S., Suemori, K., Moriwaki, J., et al. (2001) Morphine metabolism in the
opium poppy and its possible physiological function. Biochemical characterization
of the morphine metabolite, bismorphine. J. Biol. Chem., 276, 38179–38184.
Morishige, T., Tsujita, T., Yamada, Y. and Sato, F. (2000) Molecular characterization
of the S-adenosyl-L-methionine:3’-hydroxy-N-methylcoclaurine 4'-O-
methyltransferase involved in isoquinoline alkaloid biosynthesis in Coptis japonica.
J. Biol. Chem., 275, 23398–23405.
Morita, M., Shitan, N., Sawada, K., et al. (2009) Vacuolar transport of nicotine is
mediated by a multidrug and toxic compound extrusion (MATE) transporter in
Nicotiana tabacum. Proc. Natl. Acad. Sci. U. S. A., 106, 2447–2452.
Moummou, H., Kallberg, Y., Tonfack, L.B., Persson, B. and Rest, B. van der (2012)
The plant short-chain dehydrogenase (SDR) superfamily: genome-wide inventory
and diversification patterns. BMC Plant Biol., 12, 219.
Nessler, C.L., Allen, R.D. and Galewsky, S. (1985) Identification and characterization
of latex-specific proteins in opium poppy. Plant Physiol., 79, 499–504.
Nessler, C.L. and Mahlberg, P.G. (1977) Ontogeny and cytochemistry of alkaloidal
vesicles in laticifers of Papaver somniferum (Papaveraceae). Am. J. Bot., 64, 541–
551.
Nguyen, T., Nioi, P. and Pickett, C.B. (2009) The Nrf2-antioxidant response element
signaling pathway and its activation by oxidative stress. J. Biol. Chem., 284, 13291–
13295.
Notredame, C., Higgins, D.G. and Heringa, J. (2000) T-Coffee: A novel method for
fast and accurate multiple sequence alignment. J. Mol. Biol., 302, 205–217.
Onoyovwe, A., Hagel, J.M., Chen, X., Khan, M.F., Schriemer, D.C. and Facchini,
P.J. (2013) Morphine biosynthesis in opium poppy involves two cell types: sieve
elements and laticifers. Plant Cell, 25, 4110–4122.

144
Otani, M., Shitan, N., Sakai, K., Martinoia, E., Sato, F. and Yazaki, K. (2005)
Characterization of vacuolar transport of the endogenous alkaloid berberine in
Coptis japonica. Plant Physiol., 138, 1939–1946.
Ounaroon, A., Decker, G., Schmidt, J., Lottspeich, F. and Kutchan, T.M. (2003)
(R,S)-Reticuline 7-O-methyltransferase and (R,S)-norcoclaurine 6-O-
methyltransferase of Papaver somniferum - cDNA cloning and characterization of
methyl transfer enzymes of alkaloid biosynthesis in opium poppy. Plant J., 36, 808–
819.
Park, S.Y., Jin, M.L., Kim, Y.H., Kim, C.-M., Lee, S.J. and Park, G. (2014)
Involvement of heme oxygenase-1 in neuroprotection by sanguinarine against
glutamate-triggered apoptosis in HT22 neuronal cells. Environ. Toxicol.
Pharmacol., 38, 701–710.
Pauli, H.H. and Kutchan, T.M. (1998) Molecular cloning and functional heterologous
expression of two alleles encoding (S)-N-methylcoclaurine 3’-hydroxylase
(CYP80B1), a new methyl jasmonate-inducible cytochrome P-450-dependent mono-
oxygenase of benzylisoquinoline alkaloid biosynthesis. Plant J., 13, 793–801.
Saitou, N. and Nei, M. (1987) The Neighbor-joining method: a new method for
reconstructing phylogenetic trees. Mol. Biol. Evol., 4, 406–425.
Samanani, N., Alcantara, J., Bourgault, R., Zulak, K.G. and Facchini, P.J. (2006)
The role of phloem sieve elements and laticifers in the biosynthesis and
accumulation of alkaloids in opium poppy. Plant J., 47, 547–563.
Samanani, N., Liscombe, D.K. and Facchini, P.J. (2004) Molecular cloning and
characterization of norcoclaurine synthase, an enzyme catalyzing the first committed
step in benzylisoquinoline alkaloid biosynthesis. Plant J., 40, 302–313.
Sambrook, J. and Russell, D. eds. (2001) Molecular cloning: a laboratory manual 3rd
ed., Cold Spring Harbor, New York: Cold Spring Harbor Laboratory Press.
Sarin, R. (2003) Enhancement of opium alkaloids production in callus culture of Papaver
rhoeas Linn . Indian J. Biotechnol., 2, 271–272.
Sato, F., Tsujita, T., Katagiri, Y., Yoshida, S. and Yamada, Y. (1994) Purification and
characterization of S-adenosyl-L-methionine: norcoclaurine 6-O-methyltransferase
from cultured Coptis japonica cells. Eur. J. Biochem., 225, 125–131.
Schmeller, T., Latz-Brüning, B. and Wink, M. (1997) Biochemical activities of
berberine, palmatine and sanguinarine mediating chemical defence against
microorganisms and herbivores. Phytochem., 44, 257–266.

145
Schumacher, H.-M., Gundlach, H., Fiedler, F. and Zenk, M.H. (1987) Elicitation of
benzophenathridine alkaloid synthesis in Eschscholtzia cell cultures. Plant Cell
Rep., 6, 410–413.
Schütz, I., Moritz, G.B. and Roos, W. (2014) Alkaloid metabolism in thrips-
Papaveraceae interaction: recognition and mutual response. J. Plant Physiol., 171,
119–126.
Shamma, M. (1972) The isoquinoline alkaloids: chemistry and pharmacology,
Amsterdam: Elsevier.
Slaninová, I., Slunská, Z., Šinkora, J., Vlková, M. and Táborská, E. (2007) Screening
benzo(c)phenanthridine alkaloids for antiproliferative and apoptotic activities.
Pharm. Biol., 45, 131–139.
Soloway, S.B. (1976) Naturally occurring insecticides. Environ. Health Perspect., 14,
109–117.
Son, S.Y., Rhee, H.S., Lee, M.W. and Park, J.M. (2014) Analysis of
benzo[c]phenanthridine alkaloids in Eschscholtzia californica cell culture using
HPLC-DAD and HPLC-ESI-MS/MS. Biosci. Biotechnol. Biochem., 78, 1103–1111.
Steppuhn, A., Gase, K., Krock, B., Halitschke, R. and Baldwin, I.T. (2004) Nicotine’s
defensive function in nature. PLoS Biol., 2, e217.
Stüber, D., Matile, H., and Garotta, G. (1990) System for high level production in E.
coli and rapid purification of recombinant proteins: application to epitope mapping,
preparation of antibodies and structure-function analysis. In I. Lefkovits and B.
Pernis, eds. Immunological Methods, Volume 4. San Diego: Academic Press, pp.
121–152.
Suchomelová, J., Bochořáková, H., Paulová, H., Musil, P. and Táborská, E. (2007)
HPLC quantification of seven quaternary benzo[c]phenanthridine alkaloids in six
species of the family Papaveraceae. J. Pharm. Biomed. Anal., 44, 283–287.
Tamura, K., Peterson, D., Peterson, N., Stecher, G., Nei, M. and Kumar, S. (2011)
MEGA5: molecular evolutionary genetics analysis using maximum likelihood,
evolutionary distance, and maximum parsimony methods. Mol. Biol. Evol., 28,
2731–2739.
Theuns, H.G., Theuns, H.L. and Lousberg, R.J.J.C. (1986) Search for new natural
sources of morphinans. Econ. Bot., 40, 485–497.
Thureson-Klein, A.S.A. (1970) Observations on the development and fine structure of
the articulated laticifers of Papaver somniferum. Annu. Bot., 34, 751–759.

146
Tovey, E.R. and Baldo, B.A. (1987) Comparison of semi-dry and conventional tank-
buffer electrotransfer of proteins from polyacrylamide gels to nitrocellulose
membranes. Electrophoresis, 8, 384–387.
Unterlinner, B., Lenz, R. and Kutchan, T.M. (1999) Molecular cloning and functional
expression of codeinone reductase: the penultimate enzyme in morphine
biosynthesis in the opium poppy Papaver somniferum. Plant J., 18, 465–475.
Vlachojannis, C., Magora, F. and Chrubasik, S. (2012) Rise and fall of oral health
products with Canadian bloodroot extract. Phyther. Res., 26, 1423–1426.
Vogel, M., Lawson, M., Sippl, W., Conrad, U. and Roos, W. (2010) Structure and
mechanism of sanguinarine reductase, an enzyme of alkaloid detoxification. J. Biol.
Chem., 285, 18397–406.
Waterhouse, A.M., Procter, J.B., Martin, D.M. a, Clamp, M. and Barton, G.J.
(2009) Jalview Version 2--a multiple sequence alignment editor and analysis
workbench. Bioinformatics, 25, 1189–1191.
Weid, M., Ziegler, J. and Kutchan, T.M. (2004) The roles of latex and the vascular
bundle in morphine biosynthesis in the opium poppy, Papaver somniferum. Proc.
Natl. Acad. Sci. U. S. A., 101, 13957–62.
Weiss, D., Baumert, A., Vogel, M. and Roos, W. (2006) Sanguinarine reductase, a key
enzyme of benzophenanthridine detoxification. Plant. Cell Environ., 29, 291–302.
Weng, J.-K., Philippe, R.N. and Noel, J.P. (2012) The Rise of chemodiversity in plants.
Science (80-. )., 336, 1667–1670.
Winzer, T., Gazda, V., He, Z., et al. (2012) A Papaver somniferum 10-gene cluster for
synthesis of the anticancer alkaloid noscapine. Science (80-. )., 336, 1704–1708.
Wu, Y., Liu, Z., Cao, Y., Chen, X., Zeng, J. and Sun, Z. (2013) Reductive metabolism
of the sanguinarine iminium bond by rat liver preparations. Pharmacol. reports, 65,
1391–1400.
Xiao, M., Zhang, Y., Chen, X., et al. (2013) Transcriptome analysis based on next-
generation sequencing of non-model plants producing specialized metabolites of
biotechnological interest. J. Biotechnol., 166, 122–134.
Ziegler, J., Diaz-Chávez, M.L., Kramell, R., Ammer, C. and Kutchan, T.M. (2005)
Comparative macroarray analysis of morphine containing Papaver somniferum and
eight morphine free Papaver species identifies an O-methyltransferase involved in
benzylisoquinoline biosynthesis. Planta, 222, 458–471.

147
Ziegler, J. and Facchini, P.J. (2008) Alkaloid biosynthesis: metabolism and trafficking.
Annu. Rev. Plant Biol., 59, 735–769.
Ziegler, J., Facchini, P.J., Geißler, R., et al. (2009) Evolution of morphine biosynthesis
in opium poppy. Phytochemistry, 70, 1696–1707.
Ziegler, J., Voigtländer, S., Schmidt, J., Kramell, R., Miersch, O., Ammer, C.,
Gesell, A. and Kutchan, T.M. (2006) Comparative transcript and alkaloid profiling
in Papaver species identifies a short chain dehydrogenase/reductase involved in
morphine biosynthesis. Plant J., 48, 177–192.

148
List of Appendix Tables and Figures
Table A1.1. List of primers designed to amplify Papaver somniferum reductases ....... 151
Table A1.2. Predicted open reading frame of P. somniferum dehydroreticuline
reductase candidates ................................................................................... 163
Figure A1.1. Expression of dehydroreticuline reductase (DRR) candidates in vivo ..... 166
Figure A2.1. Preliminary SanR assays using NADPH or NADH as a co-factor ........... 168
Figure A2.2. Preliminary temperature curves for San1 and SanR3B ............................ 169
Figure A4.1. Multiple sequence alignment of sanguinarine reductase candidates from
20 BIA-producing species. ....................................................................... 176
Figure A4.2. Phylogenetic trees for enzymes involved in BIA biosynthesis. ............... 178

149
Appendix A1: Cloning dehydroreticuline reductase candidates
Primers were designed to analyze the expression of select cytochrome P450s and
reductases from P. somniferum using the SYBR Green method of qPCR (Table A1.1).
Primers were also designed to amplify putative endogenous reference genes from
P. somniferum and P. rhoeas using the SYBR Green method of qPCR (Table A1.1).
Several primer pairs were tested, but melting curves were analyzed to determine best set
for downstream applications.
Primers were designed to amplify several P. somniferum DRR candidates
(Table A1.1 and A1.2). Using microarray data, DRR candidates were chosen as
transcripts predicted to encode reductases or epimerases, and were upregulated in
morphinan-producing cultivars, T, 40 or Marianne (M), versus a low alkaloid cultivar,
Przemko (P) (Desgagné-Penix et al., 2012). Cultivar T contains high levels of thebaine
and oripavine, but low levels of codeine and morphine; cultivar 40 contains high codeine
and morphine levels; and cultivar Marianne contains codeine and morphine along with
high noscapine levels (Desgagné-Penix et al., 2012). As the partially purified
dehydroreticuline reductase had an apparent molecular weight of 30 kDa, twelve
candidates (DRR1-DRR12) unregulated in M, 40 or T with predicted molecular weights
ranging from 28 to 34 kDa were cloned into the pGEM-T subcloning vector (De-
Eknamkul and Zenk, 1992). DDR2, DRR3, DRR5, DRR7-DDR12 amplicons were 100%
identical to sequences in the transcriptome, but mutations in the restriction enzyme
sequence of DDR9 prevented downstream cloning into pQE30. DRR1 and DDR4 were
not identical to sequences in the transcriptome, and DDR6 could not be amplified.
Therefore, nine of the twelve DDR candidates were cloned into the pQE30 expression
150
vector. However, only six candidates were expressed when cultures were induced with
IPTG (Fig. A1.1). Crude extracts were used to assay dehydroreticuline activity. None of
the six DDR candidates were able to reduce dehydroreticuline to reticuline (data not
shown).
Alternatively, genes encoding proteins that share a high degree of sequence
similarity to previously characterized reductases, noscapine synthase (NOS), SalR, COR,
and SanR, were to be cloned from Papaver somniferum and tested for DRR activity
(Table A1.1). Sixteen sequences were identified in the stem and/or root transcriptomes
with more than 50, 50, and 35% amino acid sequence similarity to COR (GenBank
Accession No. AF108432), SalR (GenBank Accession No. DQ316261), and NOS
(GenBank Accession No. Q659007), respectively. Many of the sequences were cloned
into pGEM-T or pQE30 with the ultimate goal to express and characterize each of these
enzymes, and compare activity to the previously characterized enzymes (Winzer et al.,
2012; Ziegler et al., 2006; Unterlinner et al., 1999).

151
Table A1.1. List of primers designed to amplify Papaver somniferum reductases.
Namea Sequenceb RE Direction Amplicon
size (bp)
Protein size
(kDa)
PsoCOR2-qPCR-F1 5'-ATCCCTCCAGCTGTGAATCAA-3' N/A Forward 74
N/A
N/A PsoCOR2-qPCR-R1 5'-GCGTTGCAATACTCTCTCAGCTT -3' N/A Reverse
PsoCOR2-qPCR-F2 5'-TGCAATCTCTGTACTGGGATCAA-3' N/A Forward
66
N/A
N/A PsoCOR2-qPCR-R2 5'-ACCTCAGAACCCAAAACTGCAT-3' N/A Reverse
PsoCOR2-qPCR-F3 5'-CCATGCTCTGGTGCACTGAT-3' N/A Forward
69
N/A
N/A PsoCOR2-qPCR-R3 5'-GATTCCTCAGCGAATTCTGAAGA-3' N/A Reverse
PsoCOR2-qPCR-F4 5'-TGCTCTGGTGCACTGATGCT-3' N/A Forward
74
N/A
N/A PsoCOR2-qPCR-R4 5'-CAATTTAAGATTCCTCAGCGAATTC-3' N/A Reverse
PsoCYP82-qPCR-F1 5'-GACCACCATCTGGACCCTTTC-3' N/A Forward
72
N/A
N/A PsoCYP82-qPCR-R1 5'-TCCACTTCTTGTTTTGCCTTGTC-3' N/A Reverse
PsoCYP82-qPCR-F2 5'-GACACCACAAAACTGACCACCAT-3' N/A Forward
61
N/A
N/A PsoCYP82-qPCR-R2 5'-TTTTGCCTTGTCCAACACATG-3 N/A Reverse

152
Table A1.1 (continued). List of primers designed to amplify Papaver somniferum reductases.
Namea Sequenceb RE Direction Amplicon
size (bp)
Protein size
(kDa)
PsoCYP82-qPCR-F3 5'-CCAGGCAATCATCAAAGAATCA-3' N/A Forward
77
N/A
N/A PsoCYP82-qPCR-R3 5'-CACAATCTTCGCCGCTCAGT-3' N/A Reverse
PsoCYP82-qPCR-F4 5'-TCGCCGAATTATCGTTCAATG-3' N/A Forward
80
N/A
N/A PsoCYP82-qPCR-R4 5'-CCTGCTTGGAGCACCTGTCT-3' N/A Reverse
Pso-qPCR-ELF-F1 5'-TTTGAGGCCGGTATCTCTAAGG-3' N/A Forward
74
N/A
N/A Pso-qPCR-ELF-R1 5'-TGCTTGACACCAAGGGTGAA-3' N/A Reverse
Pso-qPCR-ELF-F2 5'-CCTCCCAGGTCATCATCATGA-3' N/A Forward
84
N/A
N/A Pso-qPCR-ELF-R2 5'-CAATGTGAGATGTGTGACAGTCAAG-3' N/A Reverse
Pso-qPCR-ELF-F3 5'-TGAGCCTAAGAGACCCACAGACA-3' N/A Forward
87
N/A
N/A Pso-qPCR-ELF-R3 5'-CCCACTGGCACAGTTCCAA-3' N/A Reverse
Pso-qPCR-UBC-F1 5'-CAGCTTCTGGATGAGCCATCA-3' N/A Forward
69
N/A
N/A Pso-qPCR-UBC-R1 5'-GGAGCCCTGCTTGGACTCT-3' N/A Reverse

153
Table A1.1 (continued). List of primers designed to amplify Papaver somniferum reductases.
Namea Sequenceb RE Direction Amplicon
size (bp)
Protein size
(kDa)
Pso-qPCR-UBC-F2 5'-TCGTCGCACACAAGTTGGA-3' N/A Forward 77
N/A
N/A Pso-qPCR-UBC-R2 5'-GCTAGGCTCTTCAAGGAATACAAAGA-3' N/A Reverse
Pso-qPCR-ACT-F1 5'-GTCTGGATTGGTGGGTCCAT-3' N/A Forward
68
N/A
N/A Pso-qPCR-ACT-R1 5'-TCAGCCTTGGAGATCCACATC-3' N/A Reverse
Pso-qPCR-ACT-F2 5'-GTGCCAATCTATGAGGGTTATGC-3' N/A Forward
70
N/A
N/A Pso-qPCR-ACT-R2 5'-TCAGATCACGGCCAGCAA-3' N/A Reverse
Pso-qPCR-ACT-F3 5'-GGGATCGCAGACCGTATGA-3' N/A Forward
74
N/A
N/A Pso-qPCR-ACT-R3 5'-GGTGCAACCACTTTGATTTTCA-3' N/A Reverse
Pso-qPCR-UBQ10-F1 5'-TGGATGTTGTAATCAGCGAGAGTAC-3' N/A Forward
74
N/A
N/A Pso-qPCR-UBQ10-R1 5'-CCAGACCAGCAACGTTTGATTT-3' N/A Reverse
Pso-qPCR-UBQ10-F2 5'-GGTGGACTCCTTCTGGATGTTG-3' N/A Forward
75
N/A
N/A Pso-qPCR-UBQ10-R2 5'-CGTTTGATTTTCGCAGGAAAG-3' N/A Reverse

154
Table A1.1 (continued). List of primers designed to amplify Papaver somniferum reductases.
Namea Sequenceb RE Direction Amplicon
size (bp)
Protein size
(kDa)
Pso-qPCR-UBQ10-F3 5'-GGGAACACAAACGACACCAAA-3' N/A Forward 80
N/A
N/A Pso-qPCR-UBQ10-R3 5'-TCGTCTTCGTGGTGGTAACTAGAG-3' N/A Reverse
Pso-qPCR-GAPC-F 5'-CCCAGCACTTAATGGAAAATTGAC-3' N/A Forward
80
N/A
N/A Pso-qPCR-GAPC-R 5'-TCACAGTAAGATCAACCACTGAAACA-3’ N/A Reverse
PrhCYP82-qPCR-F1 5'-GGGTCTCGTTGAACCTTCCAT-3’ N/A Forward
76
N/A
N/A PrhCYP82-qPCR-R1 5'-ATTGTGTGGTTGGTGGGTTTC-3' N/A Reverse
PrhCYP82-qPCR-F2 5'-CGATGCTTCATCAATTGCTACTG-3' N/A Forward
77
N/A
N/A PrhCYP82-qPCR-R2 5'-GCGGATTCCGATCAGACACT-3' N/A Reverse
PrhCYP82-qPCR-F3 5'-CCTGGATGTAGACAAGGCTACGA-3' N/A Forward
77
N/A
N/A PrhCYP82-qPCR-R3 5'-TGGAAAGAAAAGGAGTTCAACCA-3' N/A Reverse
PrhCOR-qPCR-F1 5'-TGATTCACAGCTGGTGGGATAT-3' N/A Forward
72
N/A
N/A PrhCOR-qPCR-R1 5'-TGTCAGCAATTTCTCCTGCAA-3 N/A Reverse

155
Table A1.1 (continued). List of primers designed to amplify Papaver somniferum reductases.
Namea Sequenceb RE Direction Amplicon
size (bp)
Protein size
(kDa)
PrhCOR-qPCR-F2 5'-CCTGAAGCTTTTTGCAGGAGAA-3 N/A Forward 79
N/A
N/A PrhCOR-qPCR-R2 5'-GCAGCCATGGAAGAGTGTCA-3' N/A Reverse
Prh-qPCR-ELF-F 5'-GCAGCCTCCTTCTCGAACCT-3' N/A Forward
75
N/A
N/A Prh-qPCR-ELF-R 5'-CACCACTGGTCACTTGATCTACAAG-3' N/A Reverse
Prh-qPCR-TUB-F1 5'-CTCATTCCCTTCCCTCGTCTT-3' N/A Forward
69
N/A
N/A Prh-qPCR-TUB-R1 5'-CTGGGAACCCCGAGATGTG-3' N/A Reverse
Prh-qPCR-TUB-F2 5'-GCAGATGTGGGACACCAAGAA-3' N/A Forward
74
N/A
N/A Prh-qPCR-TUB-R2 5'- TGGCTGAGGCAGTGAGGTATC-3' N/A Reverse
Prh-qPCR-UBC-F1 5'-TGTCATCGCACACAAGTTGGA-3' N/A Forward
80
N/A
N/A Prh-qPCR-UBC-R1 5'-GGCTAGGCTCTTCAAGGAATACAA-3' N/A Reverse
Prh-qPCR-UBC-F2 5'-GTTAGTGTCATCGCACACAAGTTG-3' N/A Forward
84
N/A
N/A Prh-qPCR-UBC-R2 5'-GCTAGGCTCTTCAAGGAATACAAAGA-3' N/A Reverse
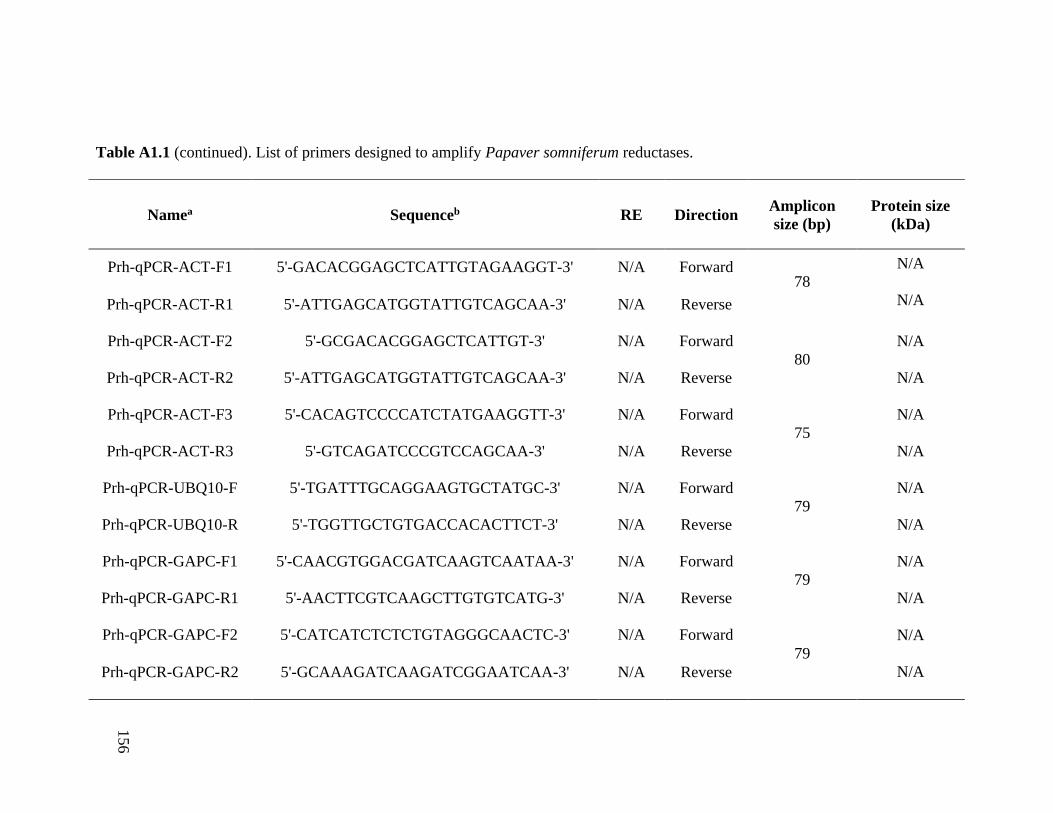
156
Table A1.1 (continued). List of primers designed to amplify Papaver somniferum reductases.
Namea Sequenceb RE Direction Amplicon
size (bp)
Protein size
(kDa)
Prh-qPCR-ACT-F1 5'-GACACGGAGCTCATTGTAGAAGGT-3' N/A Forward 78
N/A
N/A Prh-qPCR-ACT-R1 5'-ATTGAGCATGGTATTGTCAGCAA-3' N/A Reverse
Prh-qPCR-ACT-F2 5'-GCGACACGGAGCTCATTGT-3' N/A Forward
80
N/A
N/A Prh-qPCR-ACT-R2 5'-ATTGAGCATGGTATTGTCAGCAA-3' N/A Reverse
Prh-qPCR-ACT-F3 5'-CACAGTCCCCATCTATGAAGGTT-3' N/A Forward
75
N/A
N/A Prh-qPCR-ACT-R3 5'-GTCAGATCCCGTCCAGCAA-3' N/A Reverse
Prh-qPCR-UBQ10-F 5'-TGATTTGCAGGAAGTGCTATGC-3' N/A Forward
79
N/A
N/A Prh-qPCR-UBQ10-R 5'-TGGTTGCTGTGACCACACTTCT-3' N/A Reverse
Prh-qPCR-GAPC-F1 5'-CAACGTGGACGATCAAGTCAATAA-3' N/A Forward
79
N/A
N/A Prh-qPCR-GAPC-R1 5'-AACTTCGTCAAGCTTGTGTCATG-3' N/A Reverse
Prh-qPCR-GAPC-F2 5'-CATCATCTCTCTGTAGGGCAACTC-3' N/A Forward
79
N/A
N/A Prh-qPCR-GAPC-R2 5'-GCAAAGATCAAGATCGGAATCAA-3' N/A Reverse

157
Table A1.1 (continued). List of primers designed to amplify Papaver somniferum reductases.
Namea Sequenceb RE Direction Amplicon
size (bp)
Protein
size (kDa)
DRR1-F 5'-GGATCCATGAATTATGCACAAAGTAGTAGTG-3' BamHI Forward 816 29.2
DRR2-R 5'-GGTACCTCAATCTTGTGTAGGGAAGAAAG-3' KpnI Reverse
DRR2-F 5'-GGATCCATGGAGGTTGAGAAAGTAGAGAG-3' BamHI Forward
840 30.0
DRR2-R 5'-GGTACCCTAGTCATGAGTTGGAAAAAACC-3' KpnI Reverse
DRR3-F 5'-GGATCCATGGAGTCTCCATTCAAGG-3' BamHI Forward
912 32.2
DRR3-R 5'-GGTACCCTACATTTTACTGCGGCTTG-3' KpnI Reverse
DRR4-F 5'-GGATCCATGGCTACAATCCAATGC-3' BamHI Forward
849 30.3
DRR4-R 5'-GGTACCTCAATTTCTCACCGGAGATC-3' KpnI Reverse
DRR5-F 5'-GGATCCATGGTATTCCTCCAAACTCATTC-3' BamHI Forward
888 31.7
DRR5-R 5'-GGTACCTTAGCGTTGTTTGATAGAGCC-3' KpnI Reverse
DRR6-F 5'-GGATCCATGGCAGAAGCACTCCTC-3' BamHI Forward
915 33.5
DRR6-R 5'-GGTACCTCAAAATGACGATACCTCTTC-3' KpnI Reverse

158
Table A1.1 (continued). List of primers designed to amplify Papaver somniferum reductases.
Namea Sequenceb RE Direction Amplicon
size (bp)
Protein
size (kDa)
DRR7-F 5'-GGATCCATGGAAGAAACCATCTCTACAAC-3' BamHI Forward 921 33.8
DRR7-R 5'-GGTACCTCAAAAGGTTGAAATCTGCATC-3' KpnI Reverse
DRR8-F 5'-GGATCCATGGCATTAAAAGAAGTTAACG-3' BamHI Forward
885 32.6
DRR8-R 5'-GGTACCTTATATCTTCGAGTACAAGAATGG-3' KpnI Reverse
DRR9-F 5'-GGATCCATGCCTGCACCAGTAATG-3' BamHI Forward
921 32.5
DRR9-R 5'-GGTACCCTACAATCCTACACAGTTTCTTG-3' KpnI Reverse
DRR10-F 5'-GGATCCATGTCTAAACTAAGATTAGAAGGTAAAGTAGC-3' BamHI Forward
807 27.9
DRR10-R 5'-GGTACCTCATGAAGTAGCAGAACTAACATTAATG-3' KpnI Reverse
DRR11-F 5'-GGATCCATGGCGCTGGATAATGC-3' BamHI Forward
810 27.9
DRR11-R 5'-GGTACCCTAAACATATCCGCCATTAACAC-3' KpnI Reverse
DRR12-F 5'-GGATCCATGGCAGAAGCCATAGTTG-3' BamHI Forward
804 27.7
DRR12-R 5'-GGTACCTTATCCATGAAGAGAGCCAC-3' KpnI Reverse

159
Table A1.1 (continued). List of primers designed to amplify Papaver somniferum reductases.
Namea Sequenceb RE Direction Amplicon
size (bp)
Protein size
(kDa)
COR-F* 5'-GGATCCATGGAGAGTAATGGTGTTCCTATG-3' BamHI Forward 966 35.8
COR-R* 5'-GGTACCTCAATCCTTCTCATCCCAGAAC-3' KpnI Reverse
COR2-F 5'-GGATCCATGGAGAGTAGTGGTGTACC-3' BamHI Forward
966 35.7
COR2-R 5'-GGTACCTCAAGCTTCATCATCCCAC-3' KpnI Reverse
COR3-F 5'-GGATCCATGGAGAGTAATGGTGTTCC-3' BamHI Forward
969 36.2
COR3-R 5'-GGTACCTCAAACTTCTCCGTCCCAG-3' KpnI Reverse
COR4-F 5'-GGATCCATGGTGAACACTGGTGTACC-3' BamHI Forward
972 35.9
COR4-R 5'-GGTACCTCAAGCAGCTTTTTCATCC-3' KpnI Reverse
COR5-F 5'-GGATCCATGGAGAATGTAATACCTGCAG-3' BamHI Forward
966 36.0
COR5-R 5'-GGTACCTCAAACTTCTCCGTCCCAG-3' KpnI Reverse
COR6-R 5'-GGATCCATGCCTATTTTAGGTATGGGAAC-3' BamHI Forward
961 35.6
COR6-R 5'-GGTACCTCAGACTTCGTCATCCCAG-3' KpnI Reverse

160
Table A1.1 (continued). List of primers designed to amplify Papaver somniferum reductases.
Namea Sequenceb RE Direction Amplicon
size (bp)
Protein size
(kDa)
COR7-F 5'-GGATCCATGGAGGCAATTACCATGG-3' BamHI Forward 969 35.6
COR7-R 5'-GGTACCTCAGAGCTCAGCTTCCATC-3' KpnI Reverse
SALR2-F 5'-GCATGCATGCCTGAAACATGTCC-3' SphI Forward
936 34.2
SALR2-R 5'-GTCGACTCAAAATGCAGATAGTTCTGAAC-3' SalI Reverse
SALR3-F 5'-GGATCCATGGGATTTCAGTTGCG-3' BamHI Forward
820 33.2
SALR3-R 5'-GGTACCTCAAAATGGTGTTATTTCTCC-3' KpnI Reverse
SALR4-F 5'-GGATCCATGGATTCAAAAACTGAAAC-3' BamHI Forward
915 33.0
SALR4-R 5'-GGTACCTCAAAATGCAGATAGTTCTG-3' KpnI Reverse
SALR5-F 5'-GGATCCATGAATATGACAGAAACACTCC-3' BamHI Forward
921 33.8
SALR5-R 5'-GGTACCTCAAAATGACGATACCTCTTC-3' KpnI Reverse
SALR6-F 5'-GGATCCATGGAAGAAACCATCTCTACAAC-3' BamHI Reverse
921 33.8
SALR6-R 5'-GGTACCTCAAAAGGTTGAAATCTCCATC-3' KpnI Reverse

161
Table A1.1 (continued). List of primers designed to amplify Papaver somniferum reductases.
Namea Sequenceb RE Direction Amplicon
size (bp)
Protein size
(kDa)
NOS2-F 5'-GGATCCATGGAAGGTGGCGGAAATG-3' BamHI Forward 993 36.0
NOS2-R 5'-GGTACCCTACAAGAAACCCTTTTCTTTACAGC-3' KpnI Reverse
NOS3-F 5'-GCATGCATGGCCGATTCAAAGAAG-3' SphI Forward
1020 36.9
NOS3-R 5'-GTCGACTCATTTCTGCAGAAGTCCTAC-3' SalI Reverse
NOS4-F 5'-GGATCCATGGGTTCTATTGGCATTATTG-3' BamHI Forward
1119 41.7
NOS4-R 5'-GGTACCTTATTCCAAAACGGCAGG-3' KpnI Reverse
NOS5-F 5'-GGATCCATGCCTGAATACTGTGTAACG-3' BamHI Forward
963 35.2
NOS5-R 5'-GGTACCTCAGAGAAACCCCTTGTCTTG-3' KpnI Reverse
NOS6-F 5'-GGATCCATGGAGAAACAAAGGGTTTG-3' BamHI Forward
951 34.8
NOS6-R 5'-GGTACCTCAAAGCAAGATACCCTTCTC-3 KpnI Reverse

162
aPrimers were designed to amplify P. somniferum (Pso) or P. rhoeas (Phr) codeinone reductases (CORs) or cytochrome P450s (CYP82) for expression analysis
using the SYBR Green method of qPCR. Several endogenous reference genes were tested: elongation factor (ELF), ubiquitin C (UBC), actin (ACT),
polyubiqutin10 (UBQ10), glyceraldehyde-3-phosphate (GAPC), or tubulin (TUB). Coding sequences of dehydroreticuline reductase (DRR) candidates,
codeinone reductases (COR), salutaridine reductases (SALR), and noscapine synthase (NOS) from P. somniferum were amplified for downstream cloning into
pQE30 or pRSET expression vectors. F: forward primer complementary to 5’-end of sequence; R: reverse primer complementary to 3’-end of sequence; forward
and reverse primer pairs are labeled with the same number; *primers designed to amplified previously characterized COR. bItalics: restriction enzyme (RE)
recognition sequence; unformatted: template sequence.

163
Table A1.2. Predicted open reading frame of P. somniferum dehydroreticuline reductase candidates.
Candidate Sequence (5’ to 3’)
DRR1
ATGAATTATGCACAAAGTAGTAGTGATCCAAGTCTTAGATGGTCTCTTAAGGGAAAGACTGCACTTGTCACTGGCGGAACCAAAGGGATTGGACACGCTATC
GTCGAGGAGTTGGCTGGATTTGGTGCAGCTGTTCATATCACTTCTCGACATGAAAATGAAATCGAGGAGTGCTTGCGAAATTGGAGAGAAAAAGGCTATACA
GTGACTGGGTCGGTCAGTGATGCTTCAGTTCCGGTTGATAGAGAGAAATTAATCAAGACTATTTCATCTGTTTTTGGGGGCAAACTAAACATCCTTGTTAACA
ACGTTGGGGGAGCTGTGTTCAAAGACACCGTGGATTACACAGATGAGGACCATGCGAAAGTTATGTCTACTAACTTCGACTCTAGCTACTATTTATCAAAACT
AGCACACCCTCTCTTGAAAGCCTCTGGCTCAGGAAGCATTGTGTTCATTACATCTGTTGCGGGCATTGTTGCTGCACCGAAGGTGTCCAGTTATGCGGCATGT
AATGGAGCTATTAATCAAGTCACAAAGAACTTTGCTTGTGAATGGGCGAAAGATAAGATACGGGTCAATAGCGTAGCACCATGGTATATTAGAACCAGGCTT
GCAGAACATGATCTGCTATTATTTGAAGGGCTTGAAGACTCTATCGTAGCTAGAACTCCTATGAGGCGTCTTGGGAACCCAAATGAAGTTTCATCTCTTGTGG
CATTCTTGTCCCTACCTTGTGCTTCGTACATCACTGGCCAAGTCATTTGTGTCGATGGTGGATTTGCAGTAAATGGTTTCTTCCCTACACAAGATTGA
DRR2*
ATGGAGGTTGAGAAAGTAGAGAGTAGTAGCAGTAAGAAGATTACAGTTGCTGGAGGAAATGGAAGATGGTCTCTCAATGGAATGACTGCTCTAGTCACTGGT
GGTACTAGAGGAATCGGATATGCTGTTGTGGAGGAATTGGCTGGATTTGGGGCAAAAGTACATACTTGTTCAAGAAATGAAATTGAACTTAATCGATGTTTA
CAAGAATGGAAGCAAAAGGGTTTTCAAGTTACTGGCTCTGTTTGTGATGTTTCGTCTTCAGAGGGTCGTGTCAAGCTCATGGATTCTGTGTCTGGTCTTTATAA
CACCAAGCTCAATATCCTTGTTAATAATGTTGGCACAAATATAAGAAAACCGTCGGTGGAGTACACTGCTGAAGAATACTCGAAACTGATGTCTACCAACTTG
GAATCCTGTTACCACCTATGCCAACTTGCACACCCGCTTCTGAAATCTTCAGGGATGGGAAGTATTGTGTTTATCTCTTCTGTCGCTGGTGTGGCGGCATTGGC
TACTGGGAGTATTTATGGAGCAACTAAAGGAGCAATGAATCAACTCGCAAAAAGTTTGGCATGTGAATGGGCGAAAGACCACATTAGGTGTAACTCTGTTGC
ACCTTGGTACATCAAAACCTCGCTTGTCGAACATTTGCTTGAAGACAAAGAATTTGTAGATAGAGTAATCGCCCGTACTCCTCTTCGACGAGTTGGAGAACCG
CAGGAGGTTGCATCACTGGTTGCCTATCTTTGCTTACCTGCTTCCTCTTACATCACGGGGCAGACTATCTCTGTTGATGGAGGGATGACTGTCAATGGGTTTTT
TCCAACTCATGACTAG
DRR3
ATGGAGTCTCCATTCAAGGCTGATATAGTGAAAGGGAAAGTAGCTTTGATTACTGGAGGAGGATCAGGAATTGGGTTTGAGATTACTAAAGAATTTGGTAGA
CATGGAGCTTCTGTTGCTATCATGGGCAGACGCAAATCTGTTCTTGATTCTGCTGTCTCCTCTCTTCGCTCTCTCGGTATCCAGGCAATTGGATTAGAGGGAGA
TGTGCGGAAGAAAGAAGACGCGGCTAGAGTTGTCGATTCAACATTTGAGCATTTTGGGAGGATAGACATTCTTGTTAATGCTGCTGCTGGAAATTTTCTTGTG
ACTGCTGAGGATTTGTCCCCAAATGGATTTAAAACAGTTATGGATATTGATTCCGTTGGCACATTTACAATGTGCCACACAGCGTTGAAGTATATAAAGAAAG
GGGGTCTTGGGAGGGGTATGTCTGGTGGTGGAACCATAATGAACATAAGCGCTACGCTACATTATACAGCAGCTTGGTATCAAATCCATGTATCTGCCGCTAA
GGCAGCTGTTGATGCCATTACAAGGTCGTTGGCGTTAGAGTGGGGTACGGATTATGATATAAGAGTCAACGGGATTGCACCAGGACCAATTGGTGACACTCC
TGGCTTGAGTAAGCTTGCTCCCGATGAAATGAAAATCAACCATTCTGAAGACGCCAGGCCTCTGTATAAAGCAGGAGAGAAATGGGATATTGCTATGGCTGC
TCTCTACCTAGCTTCAGATGCAGCCAAGTACATCAACGGTATGACACTTGTGGTCGATGGAGGAAACTGGTTGAGCCGGCCCCGCCACATTTCAAAAGAGGC
AGTGAAGGAATTGTCTCGGGTTGTGGAAAAGAGATCCAGATCAGGTGCACCAGCACCTGCCAGGGGAGTTCCAAGCCGCAGTAAAATGTAG
DRR4
ATGGCTACAATCCAATGCATCAAGGCTCGTCAGATCTTTGATAGTCGTGGTAACCCAACCGTTGAGGTTGATATTAAACTATCCAATGGAACTTTCGCCAGAG
CCGCTGTTCCAAGTGGTGCATCTACTGGTGTTTACGAAGCTCTTGAACTACGTGATGGAGGTTCAGAATACCTAGGAAAGGGAGTTTCCAAGGCTGTTGACAA
TGTTAACTCCATCATTGGGCCTGCATTGATCGGAAAGGACCCAACACAACAAACCGAAATTGATAACTTCATGGTGCGAGAACTTGACGGAACTACCAACGA
GTGGGGTTGGTGCAAGCAAAAGCTTGGAGCCAATGCTATCCTAGCAGTGTCTCTTGCCGTTTGCAAAGCTGGAGCCAGTGTTTTGGACATTCCCCTTTACAAG
CATATTGCCAACCTTGCTGGTAACAAGAACTTGGTACTTCCAGTTCCTGCTTTCAATGTTATTAATGGAGGATCGCACGCAGGAAACAAGCTTGCAATGCAAG
AGTTCATGATCCTTCCCGTTGGAGCCAAATCCTTCAAGGAGGCAATGAAAATGGGAGTTGAAGTATACCACAATTTGAAGTCCGTCATCAAGAAGAAGTACG
GTCAAGATGCAACCAATGTTGGTGATGAAGGTGGCTTTGCTCCCAACATCCAAGAGAACAAGGAAGGACTTGAGTTGCTTAAGACTGCTATTGCTAAAGCTG
GCTACACTAAAGAAGTTGTCATCGGAATGGATGTTGCTGCCTCAGAGTTTTACGGATCAGACAAAACCTATGACTTGAACTTCAAGAAGAGAACAACAACGG
AGCAGCAAAGATCTCCGGTGAGAAATTGA

164
Table A1.2 (continued). Predicted open reading frame of P. somniferum dehydroreticuline reductase candidates.
Candidate Sequence (5’ to 3’)
DRR5
ATGGTATTCCTCCAAACTCATTCTCTCACAAGAAACATCAAATCCCCCTTTACTTCATCTTCATCAGCATCACCAATTGTTAACCACTCCAAACCTTTCTCTTCT
GCTAACACATCTATTAGAGCTACAACAACAAAGATGGAAAACACAGGAATTGAGGGTTCAAATGTAAATGACAATAAAAGGAAAATATTTGTGGCTGGGGC
TACTGGAAGTACTGGTAAAAGAATCGTTGAACAACTTTTAGCCAAGGGTTTTGCAGTTAAGGCTGGTGTTCGTGATGTTGACAAAGCTAAGACTACTTTTTCA
GATAACCCATTTCTCCAAATCGTGAAGGCTGATGTAACTGAGGGTTCAGCTAAGTTAGCTGAAGCTATTGGTAATGATGCTGAGGCTGTTATTTGTGCTACCG
GATTTCGTCCTTCATTGGATTTGTTTACTCCTTGGAAGGTCGATAATTTTGGCACAGTAAACCTTGTAGATGCATGCAAGAAAAGTAATGTGAATAGATTTATT
CTCATCAGTTCCATTCTAGTCAATGGTGCTGCAATGGGACAAATCTTTAATCCAGCTTACCTATTCCTAAACGTATTTGGACTAACGTTGATAGCCAAACTACA
AGCGGAGAATTATATCAGGAAATCGGGTATAAACTACACAATTATAAGGCCTGGTGGATTGAAAAATGACCCCCCAAGTGGAAATTTAGTCATGGAACCTGA
GGATACTCTGTCTACAGGTTCTGTATCTAGAGATCTGGTTGCAGAAGTAGCTGTTGAGGCATTAGGCCACTCTGAATCTTCTTACAAGGTAGTGGAGATAGTT
TCCCGTCCTGAAGCTCCAAAACGCTCATTTGAAGATCTCTTTGGCTCTATCAAACAACGCTAA
DRR6
ATGGCAGAAGCACTCCTCAATTCTGAAGTAAAGAGGTGTGCAGTAGTTACAGGTGCCAACAAGGGGATTGGTTTGGAGATTTGTAGGCAATTAGTTTTTAAT
GGAATCTTTGTTGTATTGACATCTAGAGATAGAAACAAGGGTCTTGAAGCTGTTGAAAATCTCAAAAAATCTGGACTCCCAAATGTGATTTTTCATCAATTAG
ATGTTATGAATCTAACTTCTGTCTCATCCTTGGCTGAATTCATCAAAACCCACTTTGGAAAACTTGATATCTTGGTGAATAATGCAGGCATTGGTGGGGTGAG
AATAGTAGACAAGGATCAATTAAAGGTTCTGATGCTTGAGGATGAAAAGTATTTGGAGAACCCAAAGTTGAAACAGATATGGACAGAACCGTATGACGACG
CAGAAAAATGTCTTAAAACAAATTACTACGGCGTCAAGGCGGTGACTGAAGCCTTTATTCCTTTACTTGAACTATCTGATTCAAGAATAATTGTCAATGTTTCT
TCTGCCATGGGGATGCTGAAGAATGTTGGCAATGAAAAGGCTTTCGAAGTGCTCAGCGATGCTGATTGTTTAACGGAAGAAAGAATAGATGTGGTGGTGAAT
ACATTTCTAAACGATCTTAAAGAGGGTTGCTTAGAAGCAAAAGGTTGGCCAACATTACTTTCTGCTTATACAATCTCAAAAGCATCAGTTAATGCGTACACTA
GGATTTTGGCAAAAAAATTCCCTACTTTTCGCATAAACTGTGTTTGTCCTGGTTTTGTCAAAACCGATATAAACTTTAACAGTGGGGTCTTGACTGTTGAACAA
GGTGCTAAAAGTCCTGTAAGATTAGCTCTTTTACCAGATAACATAACTTCTTCTGGGCTCTTCTTTGTTCGTGAAGAGGTATCGTCATTTTGA
DRR7*
ATGGAAGAAACCATCTCTACAACAGCAGAAAAGAGGTGTGCGGTTGTTACAGGAGCTAATAAAGGAATAGGACTAGAGATATGTCGTCAGCTCGCTATTAAT
GGTATCACCGTTATACTAACCGCAAGAGATGAGACCAGGGGAACTCGATCTGTTGAAGCTCTTAAAGGGTCAGGACTTGCTGGTGTGATTTTTCATCAGCTTG
ATGTAAACGATGCAACTAGTGTTACTTCATTGGCTGGTTTCATCAGAACTCGATACGGGAAACTTGACATCTTGGTAAACAATGCAGGGGACAACGGAGTAA
GACTACAAATTACTGAGGAGGCTATGAAAGACATGAACTTTCGATATGGTGATGAGAATGATGAGATTGCCAAGTTGTTGGAGGAATCCATTGAGGAGACAT
ACGAGAGGGCAAAACAATCCATAGAAACAAATTACTATGGAACCATAAGAATAACTGAAGCACTGCTTCCACTTCTTCAACTCTCCAATTCAGCAAGAATTG
TGAATGTTTCCTCCGTATATGGTCAACTAAAGTTTATCTCGAGTGAGACGATTAAAGAGGAGCTAAGAAATGTTGATTGCTTAACGGTAGAGAAACTGGACG
AGCTTATGCAGAAGTTCTTAAAGGATTTTAAGGATGGGATGTTGGAGACTAATGGATGGCCTGTATTAGTTTCTGCGTATAAAGTCTCGAAAGCTGCTATCAA
TGCCTACACTCGAATTCTTGCGAGGAAGTTCCCAACTTTTCGTGTTAATGTTGTTCATCCTGGTTTGGTTAAAACAGATATTGCATTCCAACAAGGTAACTTAA
CACCGGATGAAGGAGCTAAAGCACCGGTTATGGTGGCATTGTTGCCTTCTGATGGCCCTTCTGGTTTCTACTTTGACCAGATGCAGATTTCAACCTTTTGA
DRR8*
ATGGCATTAAAAGAAGTTAACGAGCCCTCTGCTTCCTTAACTAGGTGGTGGTCGGGAAACACCGTAGCGGTTGTGACCGGAGGAAATAGAGGGATCGGATTC
TCTCTAGTTAAGAAACTCGCCGAGCTTGGATTAACTGTAGTCCTAACTTGTAGAGATGATTCTAAAGGTCAAGAAGCAATTGAATCACTCAAATCTCAAGGAC
TCAATAATGTTCGATTCTTCCGATTAGATGTTATGGACACTGCTTGCATCAATGAGCTGGTTTCATGGTTGAAGGAAGCATTTGGAGGTCTTGATATTCTTGTG
AATAATGCTGCTGTGTCGTTCAACGAGATCAACGAGAACTCGATGCAACACGCCGAAACCACCATCAAGACAAACTACTATGGACCGAAGTTGTTAACCGAA
GCTCTGCTACCACTGTTTCGGCGTTCGGAATCCGTAAGCAGGATTTTGAATGTTAGCTCGCGTCTTGGCTTGTTGAACAAGGTGAGTAATCCTGTTGTAAGGG
AGTTATTAGAAGACGAAGACAGATTATGCGAAGAACGTATAGATTTTGTTGTAAATCGATTTCTTGAAGATGTTACTACTGGTACTTGGGAAAGAGAAGGAT
GGCCAAAGGTATGGACAGATTACGCAGTCTCGAAAGTAGGATTGAATGCGTACTCTCGAGTTTTAGCTAAGCGTTATGATGGGTTGGGATTATCTGTCAATTG
TTTATGCCCCGGGTTTACACAGACAGACATGACCGCCGGAAAAGGAAATCACTCGGCGGATTCAGCTGCGGAAATGGCTGCACAAATTGTCTTACTACCACC
TGAGAAACTTCCCACTGGCAAGTTTTATATAAAAAACAAACCATTCTTGTACTCGAAGATATAA
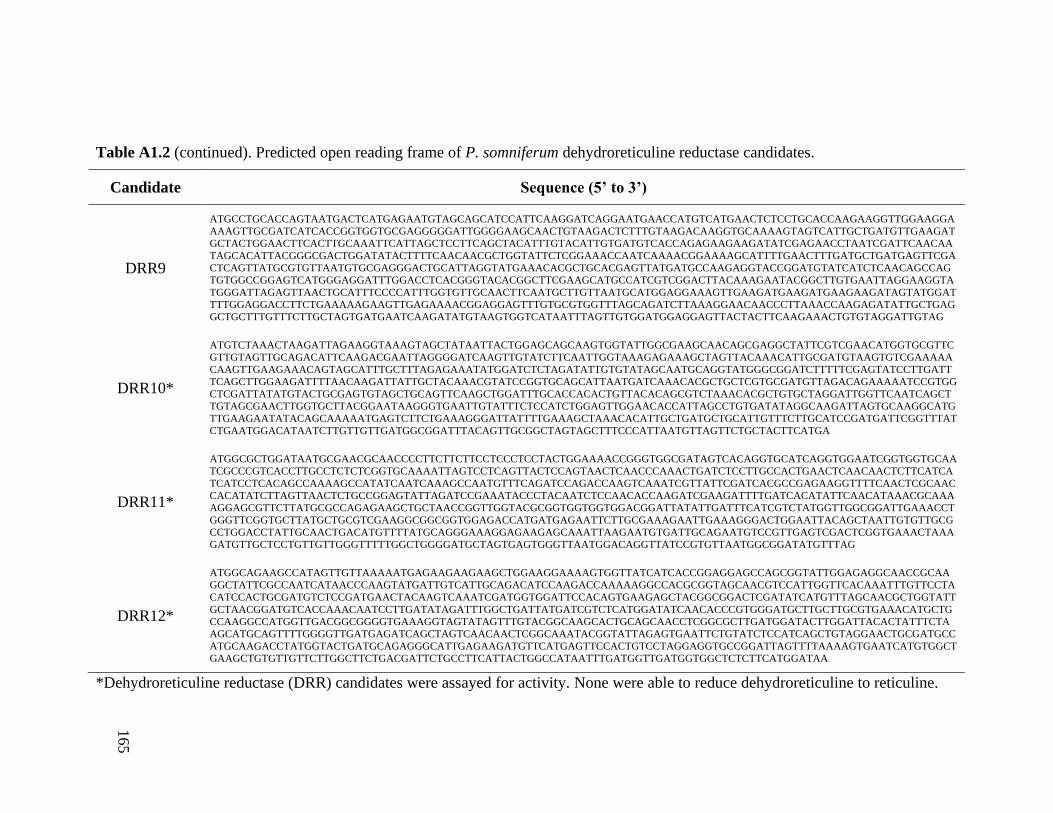
165
Table A1.2 (continued). Predicted open reading frame of P. somniferum dehydroreticuline reductase candidates.
Candidate Sequence (5’ to 3’)
DRR9
ATGCCTGCACCAGTAATGACTCATGAGAATGTAGCAGCATCCATTCAAGGATCAGGAATGAACCATGTCATGAACTCTCCTGCACCAAGAAGGTTGGAAGGA
AAAGTTGCGATCATCACCGGTGGTGCGAGGGGGATTGGGGAAGCAACTGTAAGACTCTTTGTAAGACAAGGTGCAAAAGTAGTCATTGCTGATGTTGAAGAT
GCTACTGGAACTTCACTTGCAAATTCATTAGCTCCTTCAGCTACATTTGTACATTGTGATGTCACCAGAGAAGAAGATATCGAGAACCTAATCGATTCAACAA
TAGCACATTACGGGCGACTGGATATACTTTTCAACAACGCTGGTATTCTCGGAAACCAATCAAAACGGAAAAGCATTTTGAACTTTGATGCTGATGAGTTCGA
CTCAGTTATGCGTGTTAATGTGCGAGGGACTGCATTAGGTATGAAACACGCTGCACGAGTTATGATGCCAAGAGGTACCGGATGTATCATCTCAACAGCCAG
TGTGGCCGGAGTCATGGGAGGATTTGGACCTCACGGGTACACGGCTTCGAAGCATGCCATCGTCGGACTTACAAAGAATACGGCTTGTGAATTAGGAAGGTA
TGGGATTAGAGTTAACTGCATTTCCCCATTTGGTGTTGCAACTTCAATGCTTGTTAATGCATGGAGGAAAGTTGAAGATGAAGATGAAGAAGATAGTATGGAT
TTTGGAGGACCTTCTGAAAAAGAAGTTGAGAAAACGGAGGAGTTTGTGCGTGGTTTAGCAGATCTTAAAGGAACAACCCTTAAACCAAGAGATATTGCTGAG
GCTGCTTTGTTTCTTGCTAGTGATGAATCAAGATATGTAAGTGGTCATAATTTAGTTGTGGATGGAGGAGTTACTACTTCAAGAAACTGTGTAGGATTGTAG
DRR10*
ATGTCTAAACTAAGATTAGAAGGTAAAGTAGCTATAATTACTGGAGCAGCAAGTGGTATTGGCGAAGCAACAGCGAGGCTATTCGTCGAACATGGTGCGTTC
GTTGTAGTTGCAGACATTCAAGACGAATTAGGGGATCAAGTTGTATCTTCAATTGGTAAAGAGAAAGCTAGTTACAAACATTGCGATGTAAGTGTCGAAAAA
CAAGTTGAAGAAACAGTAGCATTTGCTTTAGAGAAATATGGATCTCTAGATATTGTGTATAGCAATGCAGGTATGGGCGGATCTTTTTCGAGTATCCTTGATT
TCAGCTTGGAAGATTTTAACAAGATTATTGCTACAAACGTATCCGGTGCAGCATTAATGATCAAACACGCTGCTCGTGCGATGTTAGACAGAAAAATCCGTGG
CTCGATTATATGTACTGCGAGTGTAGCTGCAGTTCAAGCTGGATTTGCACCACACTGTTACACAGCGTCTAAACACGCTGTGCTAGGATTGGTTCAATCAGCT
TGTAGCGAACTTGGTGCTTACGGAATAAGGGTGAATTGTATTTCTCCATCTGGAGTTGGAACACCATTAGCCTGTGATATAGGCAAGATTAGTGCAAGGCATG
TTGAAGAATATACAGCAAAAATGAGTCTTCTGAAAGGGATTATTTTGAAAGCTAAACACATTGCTGATGCTGCATTGTTTCTTGCATCCGATGATTCGGTTTAT
CTGAATGGACATAATCTTGTTGTTGATGGCGGATTTACAGTTGCGGCTAGTAGCTTTCCCATTAATGTTAGTTCTGCTACTTCATGA
DRR11*
ATGGCGCTGGATAATGCGAACGCAACCCCTTCTTCTTCCTCCCTCCTACTGGAAAACCGGGTGGCGATAGTCACAGGTGCATCAGGTGGAATCGGTGGTGCAA
TCGCCCGTCACCTTGCCTCTCTCGGTGCAAAATTAGTCCTCAGTTACTCCAGTAACTCAACCCAAACTGATCTCCTTGCCACTGAACTCAACAACTCTTCATCA
TCATCCTCACAGCCAAAAGCCATATCAATCAAAGCCAATGTTTCAGATCCAGACCAAGTCAAATCGTTATTCGATCACGCCGAGAAGGTTTTCAACTCGCAAC
CACATATCTTAGTTAACTCTGCCGGAGTATTAGATCCGAAATACCCTACAATCTCCAACACCAAGATCGAAGATTTTGATCACATATTCAACATAAACGCAAA
AGGAGCGTTCTTATGCGCCAGAGAAGCTGCTAACCGGTTGGTACGCGGTGGTGGTGGACGGATTATATTGATTTCATCGTCTATGGTTGGCGGATTGAAACCT
GGGTTCGGTGCTTATGCTGCGTCGAAGGCGGCGGTGGAGACCATGATGAGAATTCTTGCGAAAGAATTGAAAGGGACTGGAATTACAGCTAATTGTGTTGCG
CCTGGACCTATTGCAACTGACATGTTTTATGCAGGGAAAGGAGAAGAGCAAATTAAGAATGTGATTGCAGAATGTCCGTTGAGTCGACTCGGTGAAACTAAA
GATGTTGCTCCTGTTGTTGGGTTTTTGGCTGGGGATGCTAGTGAGTGGGTTAATGGACAGGTTATCCGTGTTAATGGCGGATATGTTTAG
DRR12*
ATGGCAGAAGCCATAGTTGTTAAAAATGAGAAGAAGAAGCTGGAAGGAAAAGTGGTTATCATCACCGGAGGAGCCAGCGGTATTGGAGAGGCAACCGCAA
GGCTATTCGCCAATCATAACCCAAGTATGATTGTCATTGCAGACATCCAAGACCAAAAAGGCCACGCGGTAGCAACGTCCATTGGTTCACAAATTTGTTCCTA
CATCCACTGCGATGTCTCCGATGAACTACAAGTCAAATCGATGGTGGATTCCACAGTGAAGAGCTACGGCGGACTCGATATCATGTTTAGCAACGCTGGTATT
GCTAACGGATGTCACCAAACAATCCTTGATATAGATTTGGCTGATTATGATCGTCTCATGGATATCAACACCCGTGGGATGCTTGCTTGCGTGAAACATGCTG
CCAAGGCCATGGTTGACGGCGGGGTGAAAGGTAGTATAGTTTGTACGGCAAGCACTGCAGCAACCTCGGCGCTTGATGGATACTTGGATTACACTATTTCTA
AGCATGCAGTTTTGGGGTTGATGAGATCAGCTAGTCAACAACTCGGCAAATACGGTATTAGAGTGAATTCTGTATCTCCATCAGCTGTAGGAACTGCGATGCC
ATGCAAGACCTATGGTACTGATGCAGAGGGCATTGAGAAGATGTTCATGAGTTCCACTGTCCTAGGAGGTGCCGGATTAGTTTTAAAAGTGAATCATGTGGCT
GAAGCTGTGTTGTTCTTGGCTTCTGACGATTCTGCCTTCATTACTGGCCATAATTTGATGGTTGATGGTGGCTCTCTTCATGGATAA
*Dehydroreticuline reductase (DRR) candidates were assayed for activity. None were able to reduce dehydroreticuline to reticuline.

166
DRR11 DRR2 DRR8 DRR12 DRR7 DRR10
M
27.0
34.6
42.7
U I S U I S U I S U I S U I S U I S
A
B
11 2 8 12 7 10 M
DRR Candidate
27.0
34.6
23
30
46
11 2 8 12 7 10 M
DRR Candidate
Figure A1.1. Expression of dehydroreticuline reductase (DRR) candidates in vivo.
(A) No expression was observed in uninduced (U) cell cultures. DRR candidates were
expressed from the pQE30 vector only upon induction (I) with IPTG, and were present in
the soluble fraction (S). (B) Recombinant DRR candidates are expressed upon induced
with IPTG (left), and are detected on a Western blot using an anti-His antibody (right).
Expected sizes of DDR11, DRR2, DRR8, DRR12, DRR7, and DDR10 are 27.9, 30.0,
32.6, 27.7, 33.8, and 27.9 kDa, respectively.

167
Appendix A2: Biochemical characterization of SanRs
Preliminary data outlining the ability of SanRs to reduce benzophenanthridine
alkaloids using NADPH or NADH as a hydrogen donor (Fig. A2.1). At the time, alkaloid
concentration had not been determined spectrophotometrically. Only a constant volume
was used in each assay for a given alkaloid. Assays were to be repeated using the same
concentration of alkaloid for all assays in order to gain insight into substrate preference,
and the perform enzyme kinetics (Km) for all substrates.
First time performing temperature curves, the reaction buffer was not pre-cooled
or pre-heated to the appropriate temperature. Therefore, the majority of the reaction likely
proceeded at room temperature, as assays were set up on the bench top. This would
account for the little variation in dihydrosanguinarine production by SanR1 at 6, 16, 21,
31, and 38°C (Fig. A2.2).

168
0
10
20
30
40
50
60
70
80
90
100
No
Enzyme
SanR1 SanR2 SanR3B
Am
ou
nt
of
Su
bst
rate
Co
nv
ersi
on
(%
) Chelirubine+NADPH
Chelirubine+NADH
Macarpine+NADPH
Macarpine+NADH
Chelerythrine+NADPH
Chelerythrine+NADH
0
5
10
15
20
25
30
35
40
SanR1 SanR2 SanR3B
Co
nv
ersi
on
of
Sa
ngu
ina
rin
e
to D
HS
(%
)
NADPH
NADH
A
B
Figure A2.1. Preliminary SanR assays using NADPH or NADH as a co-factor.
(A) Alkaloids were incubated without or with SanRs (500 ng) in 10 mM Tris buffer, pH
8.0, using 50 mM NADPH or NADH. Reactions were 100 μL each with no technical
replicates. (B) SanRs were incubated with sanguinarine (2 μM) in 100 mM sodium
phosphate with 100 μM NADPH or NADH for one hour. 50 μL reactions were quenched
with 950 μL methanol, and 10 μL was injected into MS for analysis. 500 ng of SanR1
was used, versus 250 ng of SanR2 and SanR3B. Errors bars represent SD for three
technical replicates.

169
0
1000000
2000000
3000000
4000000
5000000
6000000
0 10 20 30 40 50 60 70 80
Am
ou
nt
of
DH
S F
orm
ed
(LC
-MS
Co
un
ts)
Temperature (°C)
0
500000
1000000
1500000
2000000
2500000
3000000
3500000
0 10 20 30 40 50 60 70 80
Am
ou
nt
of
DH
S
(LC
-MS
Cou
nts
)
Temperature (°C)
A
B
SanR1
SanR3B
Figure A2.2. Preliminary temperature curves for San1 and SanR3B. (A) SanR1 or
(B) SanR3B was incubated with sanguinarine at 6, 16, 21, 31, 38, 42, 54, and 67°C. Error
bars represent SD for two technical replicates. DHS: dihydrosanguinarine. Extrapolated
temperature optimum for SanR1 and SanR3B is 21°C.

170
Appendix A3: SanR expression in transcriptome libraries
SanR1 is represented by two contigs in the stem Illumina library:
comp9568_c0_seq1 (expression level 2.98) and comp9568_c0_seq2 (expression level
13.99). Coding sequences (no formatting) and 5’ UTR (double underline) are identical
but differ in 3’ UTR region (single underline). Illumina data was compared to the Roche-
454 library (bold) to suggest that the 3’ UTR of SanR1 is more likely represented by
comp9568_c0_seq2.
SanR2 is represented by two contigs in the root Illumina library:
comp73923_c0_seq1 (expression level 17.19) and comp73923_c0_seq2 (expression level
80.05). Coding sequences (no formatting) and 5’ UTR (underline) are identical but differ
in 3’ UTR region (double underline). Illumina data was compared to the Roche-454
library (bold) to suggest that the 3’ UTR of SanR2 is more likely represented by
comp73923_c0_seq1.
SanR3 is represents by four contigs: comp1703_c0_seq1 (expression level 95.05)
and comp1703_c0_seq3 (expression level 68.74) in the stem Illumina library, and
comp80098_c0_seq1 (expression level 2.81) and comp80098_c2_seq1 (expression level
3.52) in the root Illumina library. The root contigs are identical in coding (no formatting)
and 3’ UTR (single underline) sequences, but contig comp80098_c2_seq1 has a slightly
extended 5’ UTR (double underline; extension is italicized). There is no 454 data for
genes expressed in root tissue. Contigs comp1703_c0_seq1 and comp1703_c0_seq3 are
partial, and are combined to form the complete SanR3 sequence. The 5’ UTR of SanR3 is
consistent with the contig found in the 454 library (bold), except with a small extension at
the 5’ end. Also, the 3’ UTR of SanR3 is consistent with the 454 database (bold).

171
>comp9568_c0_seq1
CTAGGCTATATTTTTTCTTATAATATTCTCTCTTCTAGAAGAAATTCGAATTTGGAGAAAAAACCCTTTGAT
CAAAGGGTTTCTTTATAAAATCATACTCATCTCTTCACTTTCTTCTGCAAATTCATTTCACCACTAAATATA
ATCAAAAAAGAAAAAAGGGTTCCTATATTTTCAATTAGATCTTGTTTTTACAGACTTACAAAATAAAAATAA
AAATGGCAGAATCAAATCAAAAAATCACAGTCCTTGTCACTGGAGCTTCAGGCTTAACTGGTGAAATTGCAT
TCAAGAAGCTGAAAGAAAGATCAGACAAATTTGTGGTTCGGGGTTTAGTAAGATCAGAAGCAAGTAAACAAA
GACTTGGTGGAGGTGATGAAATTTTTCTAGGTGATGTCATGGATAAGAAAAGCCTTGAAACTGCTATGCAAG
GAATTGATGCGTTGATTATACTAACAAGTGCTGTGCCAAAGGTAGTACCTGGTTCATATCCTGGTGCTGATG
GCAAAAGAGCTGAGGATGTATTCGGTGAATCATTTGATTTCAATGGTCCAATGCCTGAATTCTATTACGAGG
AAGGGCAATTCCCTGAACAGATTGATTGGATTGGACAAAAGAATCAGATCGATACTGCGAAATCTTGTGGTG
TGAAACATATTGTTTTGGTTGGATCAATGGGTGGAACTGACCCTAATAATTTCTTGAATCACATGGCTAATG
GAAACATACTTGTTTGGAAGAGAAAGGCTGAGCAATATTTGGCTGATTCTGGAATCCCATACACAATTATAA
GGGCTGGTGGTTTAGATAACAAGGTAGGTGGCAGGGAATTGTTGGTCGGGAAGGATGATGAGCTTCTCTCTA
CTGAAAACCATTTCATTGCTAGGGCTGATGTTGCTGAAGCTTGCGTTCAGGCTCTGCAGATTGAGGAAAGTA
AATTCAAAGCGTTTGATTTGGGATCAATGCCAGAGGGAGTTGGTGAGCCAACAAAGGATTTCAAGGCTCTTT
TTTCGCAAGTCACTACTCCTTTCTGAAATCTGAGATCCAAGAGCAATTTAGTACACGTTATGGTTGCTTGTG
CTTGTTTGCATTTTTCGCTTCTTAAATATACATAACAGGATTGCACCGAAATAATGTATTACCTATTTAATG
GTTGCTTGAATTAATGAAATCGCATTCTAATATATGGGGCAGACAGATTTGCGATGCCGGCTTATAGGTTTA
GATGATCTCTTCTTGTAATTTTTCTTCTTTCCTTTCTTTCCTTGGAGGTCAGGTCTTTGCCCCGCTCCCTTT
TTGTTTTCTTTTCTTTGATTAATA
>comp9568_c0_seq2
CTAGGCTATATTTTTTCTTATAATATTCTCTCTTCTAGAAGAAATTCGAATTTGGAGAAAAAACCCTTTGAT
CAAAGGGTTTCTTTATAAAATCATACTCATCTCTTCACTTTCTTCTGCAAATTCATTTCACCACTAAATATA
ATCAAAAAAGAAAAAAGGGTTCCTATATTTTCAATTAGATCTTGTTTTTACAGACTTACAAAATAAAAATAA
AAATGGCAGAATCAAATCAAAAAATCACAGTCCTTGTCACTGGAGCTTCAGGCTTAACTGGTGAAATTGCAT
TCAAGAAGCTGAAAGAAAGATCAGACAAATTTGTGGTTCGGGGTTTAGTAAGATCAGAAGCAAGTAAACAAA
GACTTGGTGGAGGTGATGAAATTTTTCTAGGTGATGTCATGGATAAGAAAAGCCTTGAAACTGCTATGCAAG
GAATTGATGCGTTGATTATACTAACAAGTGCTGTGCCAAAGGTAGTACCTGGTTCATATCCTGGTGCTGATG
GCAAAAGAGCTGAGGATGTATTCGGTGAATCATTTGATTTCAATGGTCCAATGCCTGAATTCTATTACGAGG
AAGGGCAATTCCCTGAACAGATTGATTGGATTGGACAAAAGAATCAGATCGATACTGCGAAATCTTGTGGTG
TGAAACATATTGTTTTGGTTGGATCAATGGGTGGAACTGACCCTAATAATTTCTTGAATCACATGGCTAATG
GAAACATACTTGTTTGGAAGAGAAAGGCTGAGCAATATTTGGCTGATTCTGGAATCCCATACACAATTATAA
GGGCTGGTGGTTTAGATAACAAGGTAGGTGGCAGGGAATTGTTGGTCGGGAAGGATGATGAGCTTCTCTCTA
CTGAAAACCATTTCATTGCTAGGGCTGATGTTGCTGAAGCTTGCGTTCAGGCTCTGCAGATTGAGGAAAGTA
AATTCAAAGCGTTTGATTTGGGATCAATGCCAGAGGGAGTTGGTGAGCCAACAAAGGATTTCAAGGCTCTTT
TTGCTCTAGTCACCACTCGTTTCTGAATGTTGAGATCCAAGAACAACTTATCATCTGCTATGGATTCTTGAGCTTGTTTGTACTTTATGCTTCTTAAATTTACAGAATTACACAGAAATAATGTATTGCCTGTTTAAAATGACACTTTGCCACTATTCCTCATCCAAAACAATTCCAGGTGCTGTGCTAGACATGTAAACAGATCGTGACCAGTTACCTATAGTTGCAGTTGCATTAAAGT
>comp73923_c0_seq1
CTTTCTTTCCTTATTTCTTATATTCTTCTCTTCTAGAAGAAAGTTTGAATTTTCGGTGAAGAAAACTTCCGA
TCAGCGGTTTCTTTATAAATATTACTCATATCATCACTTTCTTCTGCAATTCATTTCACTATCATATCTAAA
TCTTTAAAGGAAAAAAAAAAGTTTCGTCAATTTCAATTACATCTTGTTTCCACAGATTTTAAAATGGCAGCA
TTAATGCAAAAGATTACAGTTCTTGTTACCGGGGCTTCAGGTTTAACTGGTGAGATTGCATTCAAGAAACTG
AAAGAAAGATCAGACAAATTTGCAGCAAGGGGTTTAGTAAGATCGGAAGCAAGTAAGCAAAAACTTGGGGGA
GGTGATGAAATTTATCTTGGTGATATAATGGATAAGAAAAGTCTAAAACATGCTATGCAAGGAATTGATGGC
TTAGTTATACTGACAAGCGCTGTACCGAAGATAGTACCTGGATCATATCCTGGTGCTGATGGCAAAAGAGCT
GAAGATGTGTTTGATGATTCATTTGATTACAGTGGTCCAATGCCTGAATTCTTTTATGCGGAAGGACAATAC
CCAGAACAGATTGATTGGATTGGACAAAAGAACCAGATCGAAACTGCTAAAGCTTGTGGCGTCAAACATATT
GTTTTGGTTGGATCAATGGGTGGAACAGACCCTAATCATTTCTTGAATCATATGGGCAATGGAAATATACTT
ATTTGGAAGAGAAAAGCTGAGCAGTATCTGGCTGATTCTGGAATCCCGTACACAATTATAAGAGCTGCTGCT
CTAGATAACAAGGTGGGTGGCAGGGAGTTGTTGGTTGGAAAGGATGATGAGCTTCTCCCTACTGAAAATGGA
TACATTGCTAGGGCAGATGTTGCTGAAGCTTGCGTTCAGGCTCTGCAAATCGAGGATTGCAAATTCAAAGCG
TATGATTTGGGATCAAAGCCAGAGGGAGTTGGTGAGCCAACAAAGGATTTCAAGGCTCTTTTTTCGCAAGTC
ACTACTCCTTTCTGAAATCTGAGATCCAAGAGCAATTTAGTACACGTTATGGTTGCTTGTGCTTGTTTGCATTTTTCGCTTCTTAAATATACATAACAGGATTGCACCGAAATAATGTATTACCTATTTAATGGTTGCTTGAATTAATGAAATCGCATTCTAATATATGGGGCAGACAGATTTGCGATGCCGGCTTATAGGTTTAGATGATCTCTTCTTGTAATTTTTCTTCTTTCCTTTCTTTCCTTGGAGGTCAGGTCTTTGCCCCGCTCCCTTTTTGTTTTCTTTTCTTTGATTAATAAAGCGTCCTTGTGAGTTTTTTTTTCTTTTTTTAAATCTTAGTTATGGCTCTTATATGTTTTAGATACTTTTGGTTGGATGCAACATATCGGATATGAAACAGTCCAGTCTTTTACAGAGTCCTAGAACTGT
TTTTTGTCTGACTCTTTCATTTACCGAGATGAATCTCTTGCTAAAATTGTTTTTAACAATACTTTCCTTTCC
ATTCTTGCAGAAGGGATTTGTTTCTTTAGCCGGAATGCGCTTCTGATAAGTATTCGTTTCTCAAGCACGAGT
ATGATCGAAGGTGGAGTAGAACACTTGAGTGCAGTTCCAATCCAGGGTTGAACTGAGATCAAAGTGTGGAAG
CTCAATTTTTCTAACGACTGACATACCAGTTTAGTGCTAAAGGAAATCTTATCTGAAGAATAATGTCATTTT

172
CATTGCTTTTGATTGAGAAGAGAGATTAGGCATGGCTACTGTTTGGACATGGAAGTCACCAGGACAGATGGA
CTGAGCGAGAATCAAATAAAGTAGCAACTAAACAATAACAGACAACACTAGTAGGACACCTTTTTATTTGCT
GTAGGAACATAAAACATGAAATGTATAGATAATATCCAACTTCAGACAAAGTGTGCCTCTGTCCACCGGATA
CAGAATAATCTTGCATTGGCTTGCTTGGATTGCATAGTTGAATAGTTGAGCTTCCAGAAGCTCAGATTCTGA
ACCACTTGCCAAACTTTCTAGAAATATGAAATGACGTGTTTTATAGGTCTATATTTTGGTATCAGGTTCTTT
ATCAAAAGCAGTGACT
>comp73923_c0_seq2
CTTTCTTTCCTTATTTCTTATATTCTTCTCTTCTAGAAGAAAGTTTGAATTTTCGGTGAAGAAAACTTCCGA
TCAGCGGTTTCTTTATAAATATTACTCATATCATCACTTTCTTCTGCAATTCATTTCACTATCATATCTAAA
TCTTTAAAGGAAAAAAAAAAGTTTCGTCAATTTCAATTACATCTTGTTTCCACAGATTTTAAAATGGCAGCA
TTAATGCAAAAGATTACAGTTCTTGTTACCGGGGCTTCAGGTTTAACTGGTGAGATTGCATTCAAGAAACTG
AAAGAAAGATCAGACAAATTTGCAGCAAGGGGTTTAGTAAGATCGGAAGCAAGTAAGCAAAAACTTGGGGGA
GGTGATGAAATTTATCTTGGTGATATAATGGATAAGAAAAGTCTAAAACATGCTATGCAAGGAATTGATGGC
TTAGTTATACTGACAAGCGCTGTACCGAAGATAGTACCTGGATCATATCCTGGTGCTGATGGCAAAAGAGCT
GAAGATGTGTTTGATGATTCATTTGATTACAGTGGTCCAATGCCTGAATTCTTTTATGCGGAAGGACAATAC
CCAGAACAGATTGATTGGATTGGACAAAAGAACCAGATCGAAACTGCTAAAGCTTGTGGCGTCAAACATATT
GTTTTGGTTGGATCAATGGGTGGAACAGACCCTAATCATTTCTTGAATCATATGGGCAATGGAAATATACTT
ATTTGGAAGAGAAAAGCTGAGCAGTATCTGGCTGATTCTGGAATCCCGTACACAATTATAAGAGCTGCTGCT
CTAGATAACAAGGTGGGTGGCAGGGAGTTGTTGGTTGGAAAGGATGATGAGCTTCTCCCTACTGAAAATGGA
TACATTGCTAGGGCAGATGTTGCTGAAGCTTGCGTTCAGGCTCTGCAAATCGAGGATTGCAAATTCAAAGCG
TATGATTTGGGATCAAAGCCAGAGGGAGTTGGTGAGCCAACAAAGGATTTCAAGGCTCTTTTTGCTCTAGTC
ACCACTCGTTTCTGAATGTTGAGATCCAAGAACAACTTATCATCTGCTATGGATTCTTGAGCTTGTTTGTAC
TTTATGCTTCTTAAATTTACAGAATTACACAGAAATAATGTATTGCCTGTTTAAAATGACACTTTGCCACTA
TTCCTCATCCAAAACAATTCCAGGTGCTGTGCTAGACATGTAAACAGATCGTGACCAGTTACCTATAGTTGC
AGTTGCATTAAAGTCATGGTACTATTGCTCATTGATGTTGTAGATTTTGGCGCATTTCTTAGATAAGATCCA
AAACTATCCGACATAGA
>comp1703_c0_seq1
GGGTTTGATCCTACTAAAGGTGGAAGACCTGAGTTCTTTTTCGAAGATGGAGCTAATCCTGAACAGGTTGAT
TGGATTGGGCAGAAGAATCAAATAGATGCTGCAAAAGCAGCGGGAGTGAAGCAGATTGTTTTGGTTGGGTCT
ATGGGTGGAACGAACCTCAATCATCCCTTGAACAGCATTGGAAACGGAAACATATTGGTGTGGAAGAGGAAG
GCGGAGCAATATCTGGCCGACTCTGGTATACCATACACAATTATTAGAGCTGGAGGCTTACAAGACAAAGAT
GGGGGTGTGAGAGAGCTTGTTGTTGGCAAAGATGACGAGCTTCTCGAGACTGACATAAGGACTATTGCTAGA
GCCGATGTTGCAGAAGTCTGCATTCAGGCATTGCTGTTGGAAGAGGCTAAGTTTAAAGCATTGGATCTCGCT
TCAAAACCAGAAGGAACTGGCGAGCCAACAAAAGATTTCAAGACTCTCTTTTCTCAAATCTCTACACGATTC
TGAGATTCCATATGCGGTATGTTCTGATTGAATTTTTGGTTGATGCCTAGCGATTTGTAATGCCACTGGCTATTAGCAAGAGGGAAACTAGTATTCTTTTTCCTCATTAGAAAACCAATGAGAGGCCATGAATAACGATGATAGTGTATTTTACATTTTGTGTTCCGTCTAACGTTGTTTGAGTTATGAGTGATTGCTTATCATGCCTAGTTAGGCTGAAGCATAGTCGCGTGATGTCTTCATTCAAATGCTGCGAAGAATATGACGGGGCTGGCAATACCCTTATCTCATTCCCCTCTGCGAGATTCGAGTTTCTAGTCCTACTGGTTGCGAGTTCATCGTGCTTGTGAACACTCAGTTCGTCGAAAAGGCTTATCTAATTCTAATCTAACATATGAACCATCAACCCCATTCAGGGATCAAATT >comp1703_c0_seq3
TAGATGAAACGGTTTTTGCAGAAAGGGAAGAGGATAAGAATAAGATCATCATCATCTTCAATACTTCCCGTACTGTTGGAATATCTTTTTCTCTCTGAATTACAGTCTCAGTCACAGAGTCAAGAGACCTTACCGACCTAAGTTTAGTTAGCAAATCCATCCATTAAAATCAGGGCAATGGGTTTAGTGACACGTGTTCCGTTATTCTCTTCACCTTCTTCAACTTTCTCTCCTCATAAATACTCTTCCACCACCAAACTATTCTCTTCTTCATCTTCATCTTCCCTT
TCATTTCAAAGGAGAACTTCAGTTGTAGTGAAAGCAATGGCGAGTACTGTGATTGTTACTGGTGCCGGTGGT
AGAACTGGGCAAATTGTTTACAAGAAACTGAAAGAGAGAGCTGAGTTTGTAGCAAGGGGGTTAGTAAGAACG
GAAGAAAGCAAAGAGAAAATTGGAGGAGCTGACGATGTTTTCGTTGCTGATATTAGGGATGCTGAGAGTATT
GTACCTGCAATCCAAGGAGTTGATGCTCTTGTCATTCTTACCAGTGCTGTCCCCAAAATGAAACCGGGGTTT
GATCCTACTAAAGGTGGAAGACCTGAGTTCTTTTTCGAAGATGGAGCTAATCCTGAACAGGTTGATTGGATT
GGGCAGAAGAATCAAATAGATGCTGCAAAAGC
>comp1703_combined
TAGATGAAACGGTTTTTGCAGAAAGGGAAGAGGATAAGAATAAGATCATCATCATCTTCAATACTTCCCGTA
CTGTTGGAATATCTTTTTCTCTCTGAATTACAGTCTCAGTCACAGAGTCAAGAGACCTTACCGACCTAAGTTTAGTTAGCAAATCCATCCATTAAAATCAGGGCAATGGGTTTAGTGACACGTGTTCCGTTATTCTCTTCACCTTCTTCAACTTTCTCTCCTCATAAATACTCTTCCACCACCAAACTATTCTCTTCTTCATCTTCATCTTCCCTT
TCATTTCAAAGGAGAACTTCAGTTGTAGTGAAAGCAATGGCGAGTACTGTGATTGTTACTGGTGCCGGTGGT
AGAACTGGGCAAATTGTTTACAAGAAACTGAAAGAGAGAGCTGAGTTTGTAGCAAGGGGGTTAGTAAGAACG
GAAGAAAGCAAAGAGAAAATTGGAGGAGCTGACGATGTTTTCGTTGCTGATATTAGGGATGCTGAGAGTATT
GTACCTGCAATCCAAGGAGTTGATGCTCTTGTCATTCTTACCAGTGCTGTCCCCAAAATGAAACCGGGGTTT
GATCCTACTAAAGGTGGAAGACCTGAGTTCTTTTTCGAAGATGGAGCTAATCCTGAACAGGTTGATTGGATT
GGGCAGAAGAATCAAATAGATGCTGCAAAAGCAGCGGGAGTGAAGCAGATTGTTTTGGTTGGGTCTATGGGT
GGAACGAACCTCAATCATCCCTTGAACAGCATTGGAAACGGAAACATATTGGTGTGGAAGAGGAAGGCGGAG
CAATATCTGGCCGACTCTGGTATACCATACACAATTATTAGAGCTGGAGGCTTACAAGACAAAGATGGGGGT
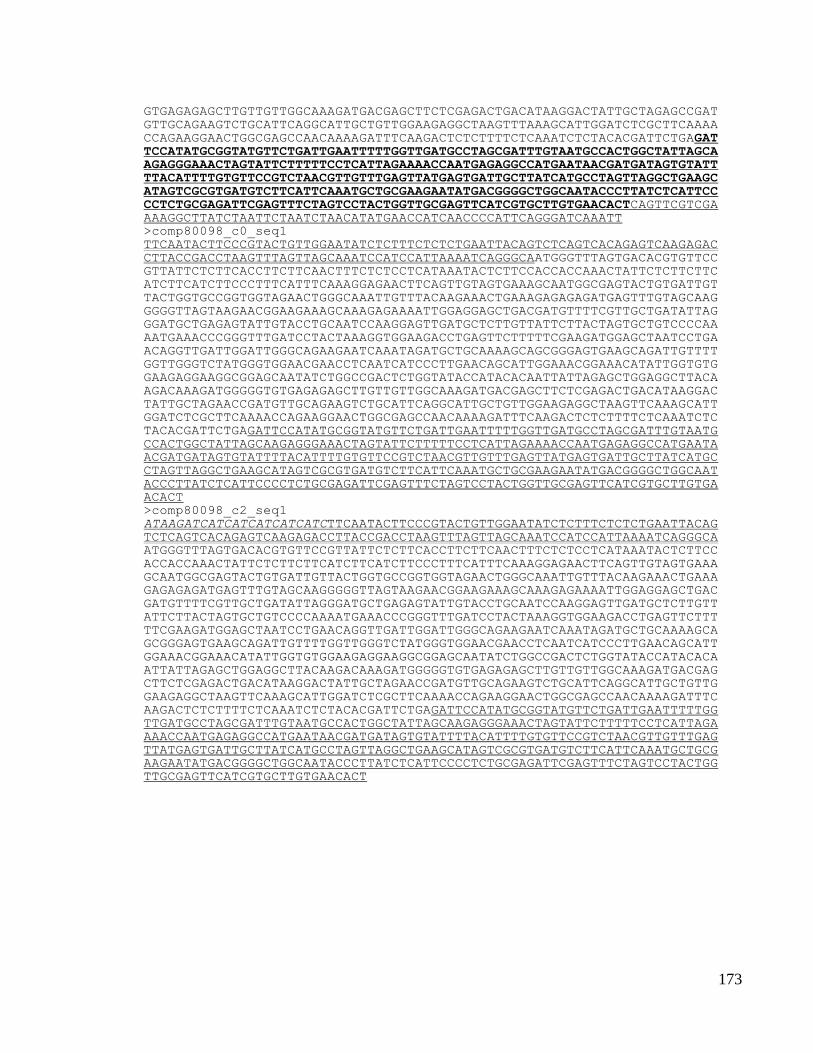
173
GTGAGAGAGCTTGTTGTTGGCAAAGATGACGAGCTTCTCGAGACTGACATAAGGACTATTGCTAGAGCCGAT
GTTGCAGAAGTCTGCATTCAGGCATTGCTGTTGGAAGAGGCTAAGTTTAAAGCATTGGATCTCGCTTCAAAA
CCAGAAGGAACTGGCGAGCCAACAAAAGATTTCAAGACTCTCTTTTCTCAAATCTCTACACGATTCTGAGATTCCATATGCGGTATGTTCTGATTGAATTTTTGGTTGATGCCTAGCGATTTGTAATGCCACTGGCTATTAGCAAGAGGGAAACTAGTATTCTTTTTCCTCATTAGAAAACCAATGAGAGGCCATGAATAACGATGATAGTGTATTTTACATTTTGTGTTCCGTCTAACGTTGTTTGAGTTATGAGTGATTGCTTATCATGCCTAGTTAGGCTGAAGCATAGTCGCGTGATGTCTTCATTCAAATGCTGCGAAGAATATGACGGGGCTGGCAATACCCTTATCTCATTCCCCTCTGCGAGATTCGAGTTTCTAGTCCTACTGGTTGCGAGTTCATCGTGCTTGTGAACACTCAGTTCGTCGAAAAGGCTTATCTAATTCTAATCTAACATATGAACCATCAACCCCATTCAGGGATCAAATT
>comp80098_c0_seq1
TTCAATACTTCCCGTACTGTTGGAATATCTCTTTCTCTCTGAATTACAGTCTCAGTCACAGAGTCAAGAGAC
CTTACCGACCTAAGTTTAGTTAGCAAATCCATCCATTAAAATCAGGGCAATGGGTTTAGTGACACGTGTTCC
GTTATTCTCTTCACCTTCTTCAACTTTCTCTCCTCATAAATACTCTTCCACCACCAAACTATTCTCTTCTTC
ATCTTCATCTTCCCTTTCATTTCAAAGGAGAACTTCAGTTGTAGTGAAAGCAATGGCGAGTACTGTGATTGT
TACTGGTGCCGGTGGTAGAACTGGGCAAATTGTTTACAAGAAACTGAAAGAGAGAGATGAGTTTGTAGCAAG
GGGGTTAGTAAGAACGGAAGAAAGCAAAGAGAAAATTGGAGGAGCTGACGATGTTTTCGTTGCTGATATTAG
GGATGCTGAGAGTATTGTACCTGCAATCCAAGGAGTTGATGCTCTTGTTATTCTTACTAGTGCTGTCCCCAA
AATGAAACCCGGGTTTGATCCTACTAAAGGTGGAAGACCTGAGTTCTTTTTCGAAGATGGAGCTAATCCTGA
ACAGGTTGATTGGATTGGGCAGAAGAATCAAATAGATGCTGCAAAAGCAGCGGGAGTGAAGCAGATTGTTTT
GGTTGGGTCTATGGGTGGAACGAACCTCAATCATCCCTTGAACAGCATTGGAAACGGAAACATATTGGTGTG
GAAGAGGAAGGCGGAGCAATATCTGGCCGACTCTGGTATACCATACACAATTATTAGAGCTGGAGGCTTACA
AGACAAAGATGGGGGTGTGAGAGAGCTTGTTGTTGGCAAAGATGACGAGCTTCTCGAGACTGACATAAGGAC
TATTGCTAGAACCGATGTTGCAGAAGTCTGCATTCAGGCATTGCTGTTGGAAGAGGCTAAGTTCAAAGCATT
GGATCTCGCTTCAAAACCAGAAGGAACTGGCGAGCCAACAAAAGATTTCAAGACTCTCTTTTCTCAAATCTC
TACACGATTCTGAGATTCCATATGCGGTATGTTCTGATTGAATTTTTGGTTGATGCCTAGCGATTTGTAATG
CCACTGGCTATTAGCAAGAGGGAAACTAGTATTCTTTTTCCTCATTAGAAAACCAATGAGAGGCCATGAATA
ACGATGATAGTGTATTTTACATTTTGTGTTCCGTCTAACGTTGTTTGAGTTATGAGTGATTGCTTATCATGC
CTAGTTAGGCTGAAGCATAGTCGCGTGATGTCTTCATTCAAATGCTGCGAAGAATATGACGGGGCTGGCAAT
ACCCTTATCTCATTCCCCTCTGCGAGATTCGAGTTTCTAGTCCTACTGGTTGCGAGTTCATCGTGCTTGTGA
ACACT
>comp80098_c2_seq1
ATAAGATCATCATCATCATCATCTTCAATACTTCCCGTACTGTTGGAATATCTCTTTCTCTCTGAATTACAG
TCTCAGTCACAGAGTCAAGAGACCTTACCGACCTAAGTTTAGTTAGCAAATCCATCCATTAAAATCAGGGCA
ATGGGTTTAGTGACACGTGTTCCGTTATTCTCTTCACCTTCTTCAACTTTCTCTCCTCATAAATACTCTTCC
ACCACCAAACTATTCTCTTCTTCATCTTCATCTTCCCTTTCATTTCAAAGGAGAACTTCAGTTGTAGTGAAA
GCAATGGCGAGTACTGTGATTGTTACTGGTGCCGGTGGTAGAACTGGGCAAATTGTTTACAAGAAACTGAAA
GAGAGAGATGAGTTTGTAGCAAGGGGGTTAGTAAGAACGGAAGAAAGCAAAGAGAAAATTGGAGGAGCTGAC
GATGTTTTCGTTGCTGATATTAGGGATGCTGAGAGTATTGTACCTGCAATCCAAGGAGTTGATGCTCTTGTT
ATTCTTACTAGTGCTGTCCCCAAAATGAAACCCGGGTTTGATCCTACTAAAGGTGGAAGACCTGAGTTCTTT
TTCGAAGATGGAGCTAATCCTGAACAGGTTGATTGGATTGGGCAGAAGAATCAAATAGATGCTGCAAAAGCA
GCGGGAGTGAAGCAGATTGTTTTGGTTGGGTCTATGGGTGGAACGAACCTCAATCATCCCTTGAACAGCATT
GGAAACGGAAACATATTGGTGTGGAAGAGGAAGGCGGAGCAATATCTGGCCGACTCTGGTATACCATACACA
ATTATTAGAGCTGGAGGCTTACAAGACAAAGATGGGGGTGTGAGAGAGCTTGTTGTTGGCAAAGATGACGAG
CTTCTCGAGACTGACATAAGGACTATTGCTAGAACCGATGTTGCAGAAGTCTGCATTCAGGCATTGCTGTTG
GAAGAGGCTAAGTTCAAAGCATTGGATCTCGCTTCAAAACCAGAAGGAACTGGCGAGCCAACAAAAGATTTC
AAGACTCTCTTTTCTCAAATCTCTACACGATTCTGAGATTCCATATGCGGTATGTTCTGATTGAATTTTTGG
TTGATGCCTAGCGATTTGTAATGCCACTGGCTATTAGCAAGAGGGAAACTAGTATTCTTTTTCCTCATTAGA
AAACCAATGAGAGGCCATGAATAACGATGATAGTGTATTTTACATTTTGTGTTCCGTCTAACGTTGTTTGAG
TTATGAGTGATTGCTTATCATGCCTAGTTAGGCTGAAGCATAGTCGCGTGATGTCTTCATTCAAATGCTGCG
AAGAATATGACGGGGCTGGCAATACCCTTATCTCATTCCCCTCTGCGAGATTCGAGTTTCTAGTCCTACTGG
TTGCGAGTTCATCGTGCTTGTGAACACT

174
Appendix A4: Phylogenetic analysis
Phylogenetic analysis was performed for all biosynthetic enzyme families
involved in benzylisoquinoline alkaloid biosynthesis for 20 different BIA-producing
species. Both the 454 and Illumina transcriptomes of 20 BIA-producing species
(Argemone mexicana, Chelidonium majus, Corydalis chelianthifolia, Eschscholzia
californica, Glaucium flavum, Papaver bracteatum, Sanguinaria canadensis,
Stylophorum diphyllum, Hydrastis canadensis, Nigella sativa, Thalictrum flavum,
Xanthorhiza simplicissima, Berberis thunbergii, Jeffersonia diphylla, Mahonia
aquifolium, Nandina domestica, Cissampelos muscronata, Cocculus trilobus,
Menispermum canadense, and Tinospora cordifolia) were mined for potential candidates
involved in BIA biosynthesis (Xiao et al., 2013). Transcriptomes were searched using the
amino acid sequence of previously characterized enzymes, COR (GenBank Accession
No. AF108432), NOS (GenBank Accession No. JQ659007), SalR (GenBank Accession
No. DQ316261), and SanR (GenBank Accession No. GU338458) (Winzer et al., 2012;
Weiss et al., 2006; Ziegler et al., 2006; Unterlinner et al., 1999), and candidates were
selected based on percent sequence similarity to the query sequence. Candidates with
greater than 50, 35%, 50, and 60% amino acid sequence similarity to COR, NOS, SalR,
and SanR, respectively, were used for phylogenetic analysis. As well, only putative
full-length sequences were selected, and duplicated entries between the two
transcriptomes were removed. Other members of the Facchini laboratory selected the
candidates for BBE, FADOX, CXE, CYP80, CYP82, CYP719, DIOX, NCS, NMT,
OAT, and OMT enzymes families from the 20 BIA-producing species, but I selected the
appropriate outgroup for each enzyme type, and generated the alignment used to build a

175
phylogenetic tree with the assistance of Ye Zhang (Department of Biochemistry and
Molecular Biology, University of Calgary, AB.). Sequences were aligned using the
M-Coffee server (www.tcoffee.org) then manually edited in Jalview (see Fig. A4.1 for an
example alignment; (Waterhouse et al., 2009; Notredame et al., 2000). M-coffee was
used to align amino acid sequences because it combines multiple alignment methods,
including ClustalW, into a single result (Notredame et al., 2000). Evolutionary
relationships were analyzed using the Neighbor-Joining method in the Phylogeny
Inference Package (PHYLIP, Version 3.69; distributed by Joe Felsenstein, University of
Washington, WA), which was hosted on the coe03 bioinformatics server at the University
of Calgary (Saitou and Nei, 1987), except for BBE, whose phylogeny was analyzed using
MEGA5 (Tamura et al., 2011). Bootstrapped consensus distance trees were generated
with 1000 replicates, and evolutionary distance was computed using the Jones-Taylor-
Thornton (JTT) matrix-based method ((Jones et al., 1992; Felsenstein, 1985).
Phylogenetic trees were visualized using TreeGraph (Version 2.0.47 Beta) (Fig. A4.2).

176
Figure A4.1. Multiple sequence alignment of sanguinarine reductase candidates from 20 BIA-producing species.

177
Figure A4.1 (continued). Multiple sequence alignment of sanguinarine reductase candidates from 20 BIA-producing species.
Sequences were aligned using the M-Coffee server, and manually edited in Jalview (Version 14.0). Amino acids are coloured
according to the Clustalx scheme in Jalview. Outgroup is a Zea mays NAD-Dependent Epimerase/Dehydratase (ZMASDR, Accession
ACG33645).

178
BBE
OAT
FADX
SALR
Figure A4.2. Phylogenetic trees for enzymes involved in BIA biosynthesis.

179
Figure A4.2 (continued). Phylogenetic trees for enzymes involved in BIA biosynthesis.
COR SANR

180
Figure A4.2 (continued). Phylogenetic trees for enzymes involved in BIA biosynthesis.
NOS CYP80

181
Figure A4.2 (continued). Phylogenetic trees for enzymes involved in BIA biosynthesis.
CYP82 CYP719

182
Figure A4.2 (continued). Phylogenetic trees for enzymes involved in BIA biosynthesis.
CXE NCS

183
Figure A4.2 (continued). Phylogenetic trees for enzymes involved in BIA
DIOX NMT

184
biosynthesis.
OMT
Figure A4.2 (continued). Phylogenetic trees for enzymes involved in BIA biosynthesis.

185
Figure A4.2 (continued). Phylogenetic trees for enzymes involved in benzylisoquinoline
alkaloid (BIA) biosynthesis. Candidates for biosynthetic enzymes were collected from 20
BIA-producing species (AME: Argemone mexicana, CMA: Chelidonium majus, CCH:
Corydalis chelianthifolia, ECA: Eschscholzia californica, GFL: Glaucium flavum, PBR:
Papaver bracteatum, SCA: Sanguinaria canadensis, SDI: Stylophorum diphyllum, HCA:
Hydrastis canadensis, NSA: Nigella sativa, TFL: Thalictrum flavum, XSI: Xanthorhiza
simplicissima, BTH: Berberis thunbergii, JDI: Jeffersonia diphylla, MAQ: Mahonia
aquifolium, NDA: Nandina domestica, CMU: Cissampelos muscronata, CTR: Cocculus
trilobus, MCA: Menispermum canadense, TCO: Tinospora cordifolia). Bootstrapped
consensus distance trees were generated with 1000 replicates, and evolutionary distance
was computed using the Jones-Taylor-Thornton (JTT) matrix-based method. Outgroups:
Cannabis sativa tetrahydrocannabinolic acid synthase (CSATHCAS, Accession
Q8GTB6) for berberine bridge enzyme (BBE); Zea mays deoxymugineic acid synthase 1
(ZMADMAS1, Accession NP_001105931) for codeinone reductase (COR); Actinidia
eriantha carboxylesterase 1 (AERCXE, Accession Q0ZPV7) for carboxylesterase (CXE);
Homo sapiens Cytochrome P450 1B1 (HSACYP1B1, Accession NP_000095), Homo
sapiens Cytochrome P450 1A2 (HSACYP1A2, Accession P05177), and Homo sapiens
Cytochrome P450 17A1 (HSACYP17A1, Accession AAA59984) for three cytochrome
P450 families CYP80, CYP82, and CYP719, respectively; Arabidopsis thaliana
LEUCOANTHOCYANIDIN DIOXYGENASE (ATHDIOX, Accession 2BRT_A) for
dioxygenase (DIOX);Cannabis sativa tetrahydrocannabinolic acid synthase
(CSATHCAS, Accession Q8GTB6) for FAD-dependent oxidoreductase (FADX); Betula
pendula major pollen allergen Bet V1 (BPEBETV1, Accession P43185) for

186
norcoclaurine synthase (NCS); Mycobacterium tuberculosis mycolic acid synthase
(MTUMMA2, Accession AAC44617) for N-methyltransferase (NMT); Arabidopsis
thaliana BRI1-5 ENHANCED 1 (ATHBEN1, Accession NP_182064) for noscapine
synthase (NOS); Rauvolfia serpentine vinorine synthase (RSEVS, Accession Q70PR7)
for salutaridinol 7-O-acetyltransferase (OAT); Medicago sativa Isoflavone
O-methyltransferase (MSAOMT, Accession O24529) for O-methyltransferase (OMT);
Sus scrofa porcine testicular carbonyl reductase (SSCPTCR, Accession 1N5D_A) for
salutaridine reductase (SALR); and Zea mays NAD-dependent epimerase/dehydratase
(ZMASDR, Accession ACG33645) for sanguinarine reductase (SANR). The
phylogenetic tree for OMT was split in half for clarity.