biocompatibility testing of polymers: in vivo implantation studies
TRANSCRIPT
Biocompatibility Testing of Polymers: In vivo Implantation Studies*
STUART J. GOURLAY,** ROBERT M. RICE,? ANDREW F. HEGYEL1,t CLARENCE W. R. WADE, JAMES G. DILLON,§
HOWARD JAFFEY and R. K. KULKARNI, U.S. Army Medical Bioengineering Research & Development Laboratory, Fort
Detrick, Detrick, Maryland 21 701
Summary
An in uiuo method is described for screening polymeric materials for biocompatibility. The test is based on grading acute and subacute tissue reactions a t 7 and 28 days, re- spectively, following implantation in rats. The method is reproducible and reliable. It is designed to provide uniform test criteria for biocompatibility assessment in the early phases of the development of surgical implant materials.
INTRODUCTION
The development of new surgical biomaterials is a long and complex process, a most important aspect of which is the biocompatibility testing of the final product. If reliable methods could be devised to predict accurately the ultimate biocompatibility of candidate mate- rials tested in the early phases of development, time and money could be concentrated on those materials which were nontoxic in these screening tests rather than wasted on the further development of
* All reprint requests should be addressed to Librarian, USAMBRDL. ** Present address: LAIR, Department of Surgery, Presidio, San Francisco, Cali-
t Present address: USAMRIID, Fort Detrick, Detrick, Maryland 21701. Present address: NCI/NIH, Division of Cancer Control and Rehabilitation, Silver
Spring, Maryland 20910. § Present address: FDA, Bureau of Medical Devices and Diagnostic Products, Silver
Spring, Maryland 20910. 7 Present address: USDA, ARS, CBCO, BARC-East, Beltsville, Maryland
20705.
fornia 94129.
Journal of Biomedical Materials Research, Vol. 12,219-232 (1978) 0 1978 John Wiley & Sons, Inc. 0021-9304/78/0012-0219$01.00
220 GOURLAY ET AL.
materials that might later be proven unacceptable for implantation in the body.
The purpose of the present study was to develop a screening method for biocompatibility with wide applicability and to assess its reliability by testing a series of polymers. The investigators have taken into account the basic guidelines described by Coleman et al.,l which in- clude 1) standardization of variables in tissue reaction, 2) utilization of readily available implantation sites, 3) adherence to proper sterile technique, and 4) use of testing methods which are quantitative and reproducible.
Different physical forms of the same material can cause different tissue reaction^.^-^ To eliminate this variable from the study, all polymers were obtained in or rendered into a finely particulate or powdered form. Polymers studied included commercially produced materials and material synthesized in this laboratory. Many of these polymers have been evaluated for toxicity in a cell culture ~ y s t e m , ~ to compare the results of in uiuo and in uitro biocompatibility test- ing.
MATERIALS AND METHODS
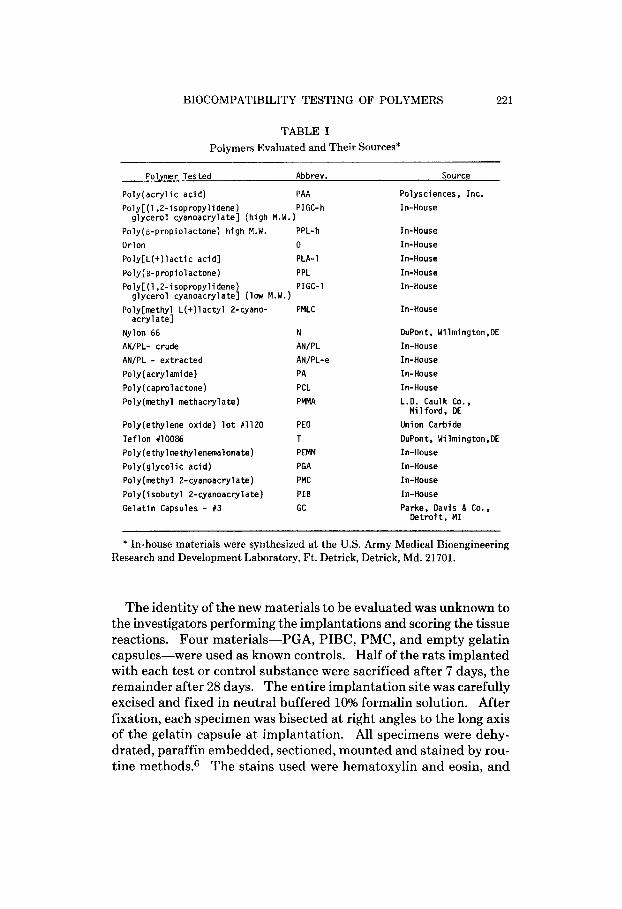
Table I lists the polymers, with their sources, that were studied. A 10 mg sample of each polymer powder was placed into an empty # 3 gelatin capsule (Parke, Davis & Co., Detroit, Mich.), and each capsule was individually sealed in a plastic envelope. Ten replicates were prepared for each material and were sterilized by exposure to 1.5 Mrad of y-radiation from a 60Co source. Male rats of Sprague-Dawley derivation and weighing between 200 and 275 g were anesthetized with an intramuscular dose of 0.1 ml Innovar-Vet (Pitman-Moore, Ft. Washington, Pa.). Dorsal hair was clipped and the skin was prepped with Betadine solution (Purdue Frederick Co., Norwalk, Conn.). Following ,a midline lumbar incision, the skin and panniculus were reflected from the right gluteal muscles. A 5 mm incision, in the di- rection of the fibers, was made in the middle of the belly of the gluteus maximus muscle proximally, and a space was bluntly created between this muscle and the underlying gluteus medius muscle. A test capsule was then moistened with sterile normal saline and inserted into the space. The skin was closed with 9 mm stainless steel surgical clips. Aseptic surgical technique was used throughout the procedure, and a total of 10 rats were implanted with each material tested. In this experiment there was a total of 240 rats implanted.
BIOCOMPATIBILITY TESTING OF POLYMERS 221
TABLE I Polymers Evaluated and Their Sources*
Polymer Tested Abbrev.
Poly(acry1 i c acid) PAA
g lycero l cyanoacrylate] (h igh M.W.) Poly(8-propiolactone) high M.W. PPL-h Orlon 0
Poly[L(+) 1 a c t i c acid]
Po ly [ ( l ,Z-isopropyl idene) PIGC-h
PLA-1 Poly( 6-propiolactone) P PL Poly[ (1.2-isopropyl idene) PIGC-1
g lycero l cyanoacrylatel (low M.W.)
Source
Polysciences, Inc. In-House
In-House In-House In-House In-House In-House
Poly[methyl L (+ ) lac ty l 2-cyano- PMLC In-House acry l ate]
Nylon 66 ANIPL- crude AN/PL - extracted Poly( acrylamide) Poly(capro1actone)
N ANIPL ANIPL-e PA PCL
Poly(methy1 methacrylate) PMMA
Poly(ethy1ene oxide) l o t #1120 PEO Tef lon #lo086 T Poly(ethylmethylenema1onate) PEMM
Poly(glyco1 i c acid) PGA Poly(methy1 2-cyanoacryl ate) PMC Poly(isobuty1 2-cyanoacrylate) PIB Gelat in Capsules - #3 GC
OuPont, W i lmington .OE In-House In-House In-House In-House L.D. Caulk Co..
M i l fo rd , DE Union Carbide DuPon t , Hi 1 m i ng ton, DE In-House In-House In-House In-House Parke. Davis 8 Co..
Det ro i t , M I
* In-house materials were synthesized a t the U.S. Army Medical Bioengineering Research and Development Laboratory, Ft. Detrick, Detrick, Md. 21701.
The identity of the new materials to be evaluated was unknown to the investigators performing the implantations and scoring the tissue reactions. Four materials-PGA, PIBC, PMC, and empty gelatin capsules-were used as known controls. Half of the rats implanted with each test or control substance were sacrificed after 7 days, the remainder after 28 days. The entire implantation site was carefully excised and fixed in neutral buffered 10% formalin solution. After fixation, each specimen was bisected at right angles to the long axis of the gelatin capsule at implantation. All specimens were dehy- drated, paraffin embedded, sectioned, mounted and stained by rou- tine methods.6 The stains used were hematoxylin and eosin, and
222 GOURLAY ET AL.
Masson’s trichrome. Microscopic sections from half-specimens were analyzed independently by two investigators (S.J.G. and R.M.R.) and graded for the amount of tissue reaction. Sections from 10 rats for each test and control substance were graded.
Tissue reaction was assessed by a modification of the method de- veloped by Sewell et al.7 to grade the response to gut sutures. Dif- ferentially weighted scores were used to grade different indicators of tissue response to the implanted polymers, approximating the original method. In all cases, observations were made of the tissue reaction confined to the space between the gluteus maximus and gluteus me- dius muscles, ignoring any subcutaneous reaction to material which had strayed from the implantation site. Muscle cell damage was al- ways graded only in the gluteus medius muscle adjacent to the im- planted material. The six tissue response indicators used in this method were as follows: 1) degree of muscle cell damage; 2) total thickness of reaction; 3) overall cell density; 4) number of polymor- phonuclear leukocytes and erythrocytes; 5) number of eosinophils, lymphocytes, and foreign-body giant cells; and 6) number of fibrocytes and monouclear phagocytes. The reference standard of Sewell et aL7 of a “high power field diameter” was modified to a fixed standard circular field with a diameter of 0.32 mm.
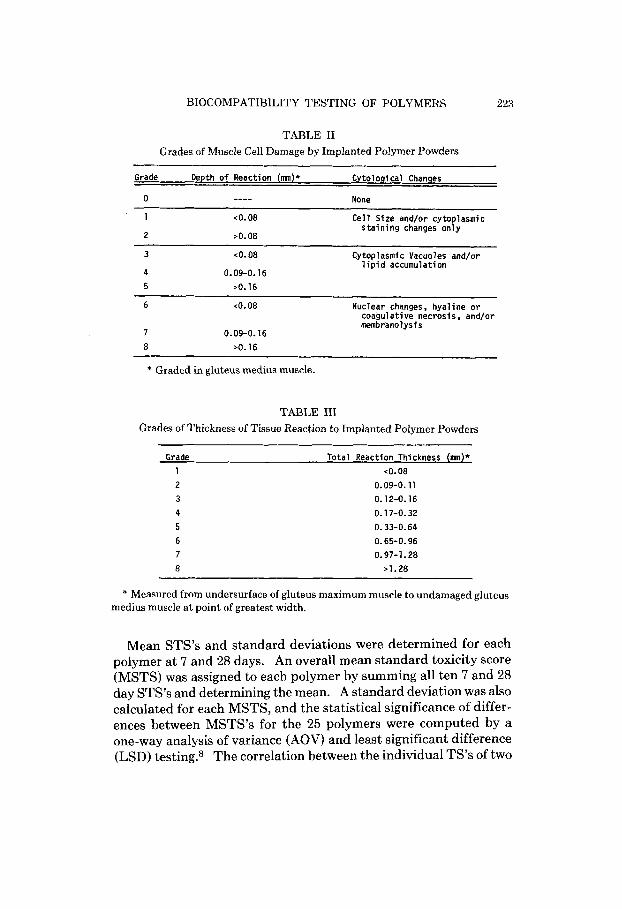
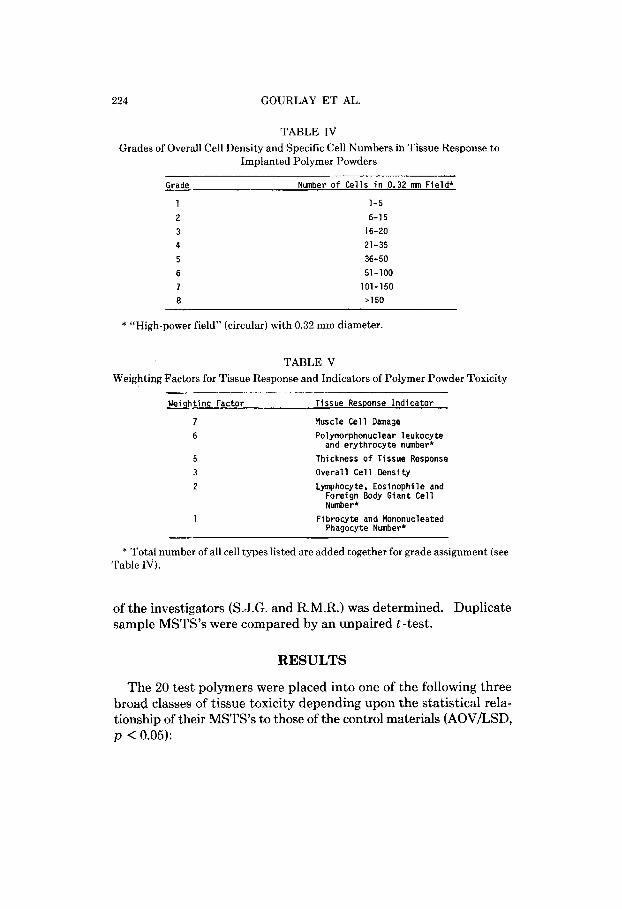
In Tables 11,111, and IV are found the grades assigned for the degree of muscle cell damage, the total thickness of reaction, and the overall cell density and numbers of specific cell types. The grade for each of the six indicators was multiplied by the empiric weighting factor listed for it in Table V to derive a score; the sum of the scores of the six tissue response indicators was the tissue reaction score (TS) for that material. In each case, the higher the TS, the more toxic the response in the tissue examined. Mean tissue reaction scores, with standard deviations, were determined for each of the 21 test and four control polymers at 7 and 28 days. To allow comparison of the 7 and 28 day scores with an equal emphasis placed on each, a standard tissue reaction score (STS) was derived for each TS by converting it on a scale of zero to 100 using the following formula:
TS - Lowest observed TS X 100 Highest observed TS - Lowest observed TS
STS =
The highest and lowest observed TS’s were from the 125 rats im- planted with control and test polymers for the same time period as the material for which the STS was being derived.
BIOCOMPATIBILITY TESTING OF POLYMERS
TABLE I1 Grades of Muscle Cell Damage by Implanted Polymer Powders
Grade Depth o f Reaction (m)* Cytological Chanqes
None 0 ---- 1
2
<O.D8
>0.08
Cel l Size and/or cytoplasmic staining changes only
c0.08
0.09-0.16 >0.16
Cytoplasmic Vacuoles and/or l i p i d accumulation
6 <O. 08 Nuclear changes, hyaline o r coagulative necrosis, and/or membranolysf s
I 0.09-0.16 8 >0.16
* Graded in gluteus medius muscle.
TABLE 111 Grades of Thickness of Tissue Reaction to Implanted Polymer Powders
Grade Total Reaction Thickness (m)* 1 cO.08 2 0.09-0.11 3 0.12-0.16 4 0.17-0.32 5 0.33-0.64 6 0.65-0.96 7 0.97-1.28 8 >1.28
223
* Measured from undersurface of gluteus maximum muscle to undamaged gluteus medius muscle a t point of greatest width.
Mean STS’s and standard deviations were determined for each polymer at 7 and 28 days. An overall mean standard toxicity score (MSTS) was assigned to each polymer by summing all ten 7 and 28 day STS’s and determining the mean. A standard deviation was also calculated for each MSTS, and the statistical significance of differ- ences between MSTS’s for the 25 polymers were computed by a one-way analysis of variance (AOV) and least significant difference (LSD) testing.8 The correlation between the individual TS’s of two
224 GOURLAY E T AL.
TABLE IV Grades of Overall Cell Density and Specific Cell Numbers in Tissue Response to
Implanted Polymer Powders
Grade Number o f Cel ls i n 0.32 mn Fie ld*
1 1-5 2 6-15 3 16-20 4 21-35 5 36-50 6 51-100 7 101-150 8 >150
* “High-power field” (circular) with 0.32 mm diameter.
TABLE V Weighting Factors for Tissue Response and Indicators of Polymer Powder Toxicity
Weighting Factor Tissue Response I n d i c a t o r
7 Muscle Cell Damage 6 Polymorphonutlear leukocyte
and erythrocyte number* 5 Thickness o f Tissue Response 3
2
1
Overa l l C e l l Oensi t y Lymphocyte, Eosinophi le and
Foreign Body Giant C e l l Number*
Fibrocyte and Mononucleated Phagocyte Number*
~~~ ~
* Total number of all cell types listed are added together for grade assignment (see Table IV).
of the investigators (S.J.G. and R.M.R.) was determined. Duplicate sample MSTS’s were compared by an unpaired t -test.
RESULTS
The 20 test polymers were placed into one of the following three broad classes of tissue toxicity depending upon the statistical rela- tionship of their MSTS’s to those of the control materials (AOV/LSD, p < 0.05):
BIOCOMPATIBILITY TESTING OF POLYMERS 225
I. Nontoxic: those polymers with MSTS’s equal to or signifi- cantly greater than that of PGA, but significantly less than that of PIBC.
11. Moderately toxic: those polymers with MSTS’s not signifi- cantly different than that of PIBC.
111. Toxic: those polymers with MSTS’s significantly greater than that of PIBC and equal to or greater than the value of PMC.
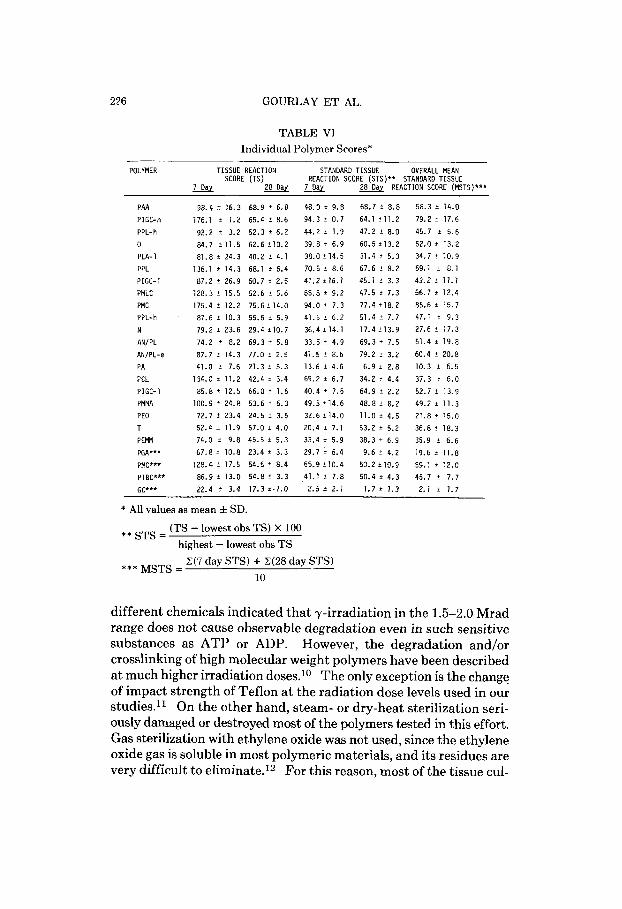
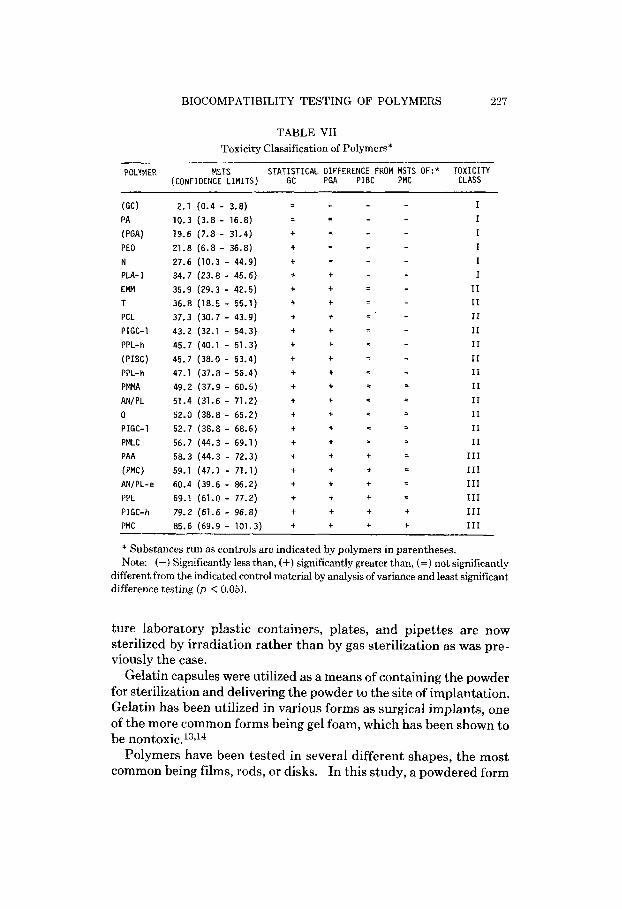
Table VI lists the TS’s and the STS’s for 7 and 28 days and the MSTS for each polymer tested. In Table VII, the MSTS’s are used to rank the polymers by degree of toxicity, and each has been placed into one of the toxicity classes listed above. A statistically significant difference ( p < 0.05) was present between the MSTS’s of each of the four control materials. The only material with a MSTS significantly lower than that of the PGA control was the empty gelatin capsule (GC) control (Table VII). The correlation between the TS’s assigned by two of the investigators (S.J.G. and R.M.R.) was highly significant (p < 0.001) with an r value of 0.894. The two duplicate samples which were run (PPL-h and PIGC-1) had MSTS’s which were not signifi- cantly different ( p < 0.05).
The grading of the tissue response histologically was, in general, facilitated by the marked differences in the inflammatory response generated by toxic and nontoxic materials. This was particularly noted in the degree and extent of muscle cell damage and the total width of reaction. The nontoxic materials consistently induced a thin layer of inflammation with no muscle cell damage, and the toxic materials routinely were surrounded by a thick capsule of inflam- mation with dead or injured muscle cells. The grading of the response to materials in the moderately toxic group was more difficult, as muscle cell damage was often of a lower grade (Table 11) though usually present.
DISCUSSION
Williams and Roap3 list methods of sterilization of surgical implants in order of preference: moist heat, dry heat, radiation sterilization and chemical sterilization. Sterilization by y-irradiation was chosen for this study because earlier experiments in this laboratoryg with
226 GOURLAY E T AL.
TABLE VI Individual Polymer Scores*
POLYMER TISSUE REACTION STANDARD TISSUE OVERALL MEAN SCORE (TS) REACTION SCORE (STS)** STANDARD TISSUE
7Day REACTION SCORE (MSTS)***
PAA PIGC-h
PPL-h
0
PLA- 1 PPL
PIGC-1
PMLC
PMC
PPL-h
N ANIPL
ANIPL-e
PA
PCL
PIGC-1 PMMA
PEO
T PEMM
PGA***
PMC*** PIBC***
GC***
98.4 i 16.3 176.1 t 1.2 92.2 f 3.2 84.7 211.5 81.8 t 24.3 136.1 t 14.3 87.2 f 26.9 126.3 f 15.5 175.4 f 12.2 87.6 2 10.3 79.2 t 23.6 74.2 t 8.2 87.7 t 14.3 41.0 f 7.6 134.0 f 11.2 85.8 f 12.5 100.9 f 24.8 72.7 f 23.4 52.4 f 11.9 74.0 t 9.8 67.8 2 10.8 128.4 f 17.5 86.9 f 13.0 22.4 C 3.4
68.9 t 6.8 65.4 f 8.6 52.3 f 6.2 62.6 i10.2 40.2 f 4.1 68.1 f 6.4 50.7 t 2.5 52.6 f 5.6 75.6f 14.0 55.6 f 5.9 29.4 t10.7 69.3 f 5.8 77.0 f 2.5 21.3 f 5.3 42.4 i 3.4 66.0 f 1.6 53.6 f 6.3 24.5 t 3.5 57.0 t 4.0 45.5 f 5.3 23.4 t 3.3 54.6 f 8.4 54.8 t 3.3 17.3 f-1.0
48.0 t 9.8
94.3 f 0.7 44.2 t 1.9 39.8 t 6.9 38.0 '14.5 70.5 f 8.6 41.2 $16.1 65.8 t 9.2 94.0 f 7.3 41.5 t 6.2 36.4f14.1 33.5 * 4.9 41.5 t 8.6 13.6 f 4.6 69.2 f 6.7 40.4 f 7.5 49.5 t14.6 32.6 f14.0 20.4 t 7.1 33.4 f 5.9 29.7 f 6.4 65.9 f10.4 41.1 t 7.8 2.5 f 2.1
68.7 f 8.8 64.1 f11.2 47.2 f 8.0 60.5 f13.2 31.4 t 5.3 67.6 f 8.2 45.1 f 3.3 47.5 t 7.3 77.4 t18.2 51.4 f 7.7 17.4 f 13.9 69.3 t 7.5 79.2 f 3.2 6.9 t 2.8 34.2 t 4.4 64.9 f 2.2 48.8 f 8.2 11.0 t 4.5 53.2 t 5.2 38.3 t 6.9 9.6 f 4.2 50.2 510.9 50.4 f 4.3
1 . 7 ? 1.3
58.3 t 14.0 79.2 f 17.6 45.7 f 5.6 52.0 f 13.2 34.7 f 10.9 69.1 i 8.1 43.2 t 11.1 56.7 t 12.4 85.6 t 15.7 47.1 f 9.3 27.6 f 17.3 51.4 t 19.8 60.4 f 20.8 10.3 f 6.5 37.3 i 6.0 52.7 t 13.9 49.2 f 11.3 21.8 t 15.0 36.8 f 18.3 35.9 f 6.6 19.6 t 11.8 59.1 t 1z.a 45.7 t 7.7 2.1 f 1.7
* All values as mean f SD.
** STS = (TS - lowest obs TS) X 100
highest - lowest obs TS Z(7 day STS) + Z(28 day STS)
10 *** MSTS =
different chemicals indicated that y-irradiation in the 1.5-2.0 Mrad range does not cause observable degradation even in such sensitive substances as ATP or ADP. However, the degradation and/or crosslinking of high molecular weight polymers have been described at much higher irradiation doses.1° The only exception is the change of impact strength of Teflon at the radiation dose levels used in our studies.ll On the other hand, steam- or dry-heat sterilization seri- ously damaged or destroyed most of the polymers tested in this effort. Gas sterilization with ethylene oxide was not used, since the ethylene oxide gas is soluble in most polymeric materials, and its residues are very difficult to eliminate.12 For this reason, most of the tissue cul-
BIOCOMPATIBILITY TESTING OF POLYMERS 227
TABLE VII Toxicity Classification of Polymers*
POLYMER MSTS STATISTICAL OIFFERENCE FROM MSTS OF:* TOXICITY (CONFIDENCE LIMITS) GC PGA PIBC PMC CLASS
(GC) PA
(PGA) PEO N PLA- 1 EMM T PCL PIGC-1
PPL-h (PIBC) PPL-h PMMA ANIPL 0 P IGC- 1 PMLC PAA
(PMC) AN/ P L- e
PPL PIGC-h PMC
2.1 (0.4 - 3.8) 10.3 (3.8 - 16.8) 19.6 (7.8 - 31.4) t
21.8 (6.8 - 36.8) t
27.6 (10.3 - 44.9) t
34.7 (23.8 - 45.6) t
35.9 (29.3 - 42.5) t
36.8 (18.5 - 55.1) + 37.3 (30.7 - 43.9) t
43.2 (32.1 - 54.3) t
45.7 (40.1 - 51.3) t
45.7 (38.0 - 53.4) t
47.1 (37.8 - 56.4) t
49.2 (37.9 - 60.5) t
51.4 (31.6 - 71.2) t
52.0 (38.8 - 65.2) t
52.7 (38.8 - 68.6) t
56.7 (44.3 - 69.1) t
58.3 (44.3 - 72.3) t
59.1 (47.1 - 71.1) + 60.4 (39.6 - 86.2) t
69.1 (61.0 - 77.2) + 79.2 (61.6 - 96.8) + 85.6 (69.9 - 101.3) t
I
t
t
t
t
t
t
t
t
t
t
t
t
+ t
t
t
t
+ t
I I I I I I
I1 I1 I 1 I1 I1 I1 XI I1 I1 I1 I 1 I1
111 111 111 111
t 111 t 111
* Substances run as controls are indicated by polymers in parentheses. Note: (-) Significantly less than, (+) significantly greater than, (=) not significantly
different from the indicated control material by analysis of variance and least significant difference testing ( p < 0.05).
ture laboratory plastic containers, plates, and pipettes are now sterilized by irradiation rather than by gas sterilization as was pre- viously the case.
Gelatin capsules were utilized as a means of containing the powder for sterilization and delivering the powder to the site of implantation. Gelatin has been utilized in various forms as surgical implants, one of the more common forms being gel foam, which has been shown to be nontoxic.13J4
Polymers have been tested in several different shapes, the most common being films, rods, or disks. In this study, a powdered form

228 GOURLAY ET AL.
TABLE VIII Reported Toxicity Compared to Experimental Toxicity
Toxicity From Experimental Polymer L i terature References C1 a s s i f icat ion
GC
PA PGA PEO N PLA- 1 T PIBC PMMA
0 PAA PMC
N N
N N N-M N N-M
M
N-M M
N T
9 , 34 10, 26 7. 11 1 2 12.13.14.15 6, 25 7,12,15
5,16,17 14, 18 13 19. 24 5,7,17,20.21
Note: N = slight or no tissue reaction; M = moderate tissue reaction; T = severe tissue reaction.
was utilized because for many of the polymers developed at this lab- oratory, the methodology for making films, rods, or disks had not been developed; therefore, since all the polymers in question could be rendered into a powdered form, this physical format was utilized. Surface area of exposure to the tissue is greatly increased when a polymer is in powdered form; this would be expected to increase the tissue reaction for a given material over a solid form as described by Cohenf5 and Stinson.lG This is advantageous for a screening test because it enhances the sensitivity of the method. Unfortunately, particle size of the polymer powders used in this study was not con- trolled. It is known that both the particle size3 and the shape of im- plants24 can cause variations in the tissue reaction. It would have been advantageous to use homogeneous powders, but this was not possible in this study due to the widely varying physical properties of the polymers tested.
The 7 day postimplantation sample represents an acute, and the 28 day sample a subacute tissue, reaction to the implant. The sam- pling times were chosen after examination of the tissue reaction to several of the control materials at 1,3,7,14, and 28 days indicated that the 7 and 28 day samples were most representative of acute and subacute reactions, re~pective1y.l~ We observed, in accordance with
BIOCOMPATIBILITY TESTING OF POLYMERS 229
Autian,lsJ9 that the reaction to the mechanical injury of implantation was no longer evident by day 7 and that by day 28 the signs of the acute reaction to the implanted materials disappeared. Although the selection of two sampling times for grading the tissue response and the equal weighting of each reaction may seem arbitrary, the evaluation at two different times takes into account the dynamic nature of the response of the body to implanted materials. It is rea- sonable to assume that a material which produces only a small degree of acute and subacute tissue reaction will induce little chronic reac- tion; in contrast, a material with marked acute and subacute tissue reaction is expected to cause chronic tissue reaction as well. The use of only two time periods for implantation decreased the number of animals and although the implantation periods were not longer than 1 month, by noting the 7-28 day trend in tissue reaction, some pre- diction could be made about the chronic toxicity of the polymer as well.
As indicated by the correlation coefficient for the independent scoring of the tissue reaction by two of the investigators, this testing method should allow an accurate intercomparison of test results from different observers. Differences of opinion arose most commonly when the response to moderately toxic materials was being graded, and these differences of opinion usually centered on the grading of muscle cell damage. The 7 day samples were more difficult to score than the 28 day samples due to a greater degree of vascularity and the presence of a greater array and number of cells.
The reproducibility of this method is indicated by the lack of sig- nificant differences in MSTS’s for the two duplicated materials (PPL-h and PIGC-1). In each case, the duplicates fell within the same toxicity class (Table VII); however, this does not imply that the duplicate samples could not have been in adjacent groups and still not be significantly different. As can be seen from Table VII, there is not much difference in the confidence limits between the polymer with the highest score in one group and the polymer with the lowest score in the next highest group. The assigned toxicity classes are not meant to have rigid boundaries eliminating further testing, but are to be used as aids in assigning priorities for further development.
The reliability of the method was assessed by comparing the results obtained for each polymer in this system with any published bio- compatibility data for the same material. Table VIII lists the relative toxicity of 12 polymers tested by this method for which toxicity data
230 GOURLAY ET AL.
were available. Out of the 12 polymers tested, the results are in agreement with published data for 11 samples; the only exception was PAA which was tested “toxic” in our test but found “nontoxic” by other investigators. Peters et aL20J’ reported that PAA is nontoxic and is biostable when implanted subcutaneously in rats and used as a bone implant in rabbits. The sampling was performed every 2 months for up to 1 year and there was no indication in the report that acute and subacute tissue reaction was determined in their studies. Furthermore, they did not test powdered implant material.
The overall reliability and reproducibility of this test method and its quantitative aspects indicate to us that it is a valuable adjunct to a biomaterials program. The variance of the results of this method from that obtained by other investigators of the materials tested would indicate that reliance on any single method of biocompatibility testing for accepting or rejecting candidate materials might be mis- leading. We employ this method as part of an i n uiuolin uitro screening test p r ~ g r a m . ~ J ~ We feel that the prediction of the long- term performance of a polymer is more accurate if based on such combination testing. Details of the comparative evaluation of the two methods and the conclusions drawn from these studies have been summed up in a paper published this J ~ u r n a l . ~
The authors recognize that there are several implantation methods described in the literature for biocompatibility testing of polymers. The end point of evaluation, the site of the implant, the animal species used, and the shape of the implant vary in each of these tests. Our approach was dictated by the need to develop a test system which can be used in the development of biomaterials.
In conducting the research described in this report, the investigators adhered to the “Guide for Laboratory Animal Facilities and Care,” as promulgated by the Committee on the Guide for Laboratory Animal Facilities and Care of the Institute of Laboratory Animal Resources, National Academy of Sciences-National Research Council.
The opinions or assertions contained herein are the private views of the authors and are not to be construed as official or as reflecting the views of the Department of the Army or Department of Defense.
References 1. D. L. Coleman, R. N. King, and J. D. Andrade, J. Biomed. Muter. Res. Symp., 5,
2. N. K. Wood, E. J. Kaminski, and R. J. Oglesby, J. Biomed. Muter. Res., 4, 1 65 (1974).
(1970).
BIOCOMPATIBILITY TESTING OF POLYMERS 231
3. D. F. Williams and R. Roap, Implants in Surgery, W. B. Saunders, Philadelphia,
4. B. F. Matlaga, L. P. Yasenchak, and T. N. Salthouse, J . Biomed. Mater. Res., 10,
5. R. M. Rice, A. F. Hegyeli, S. J . Gourlay, C. W. R. Wade, J. G. Dillon, H. Jaffe, and
6. L. G. Luna, Manual of Histologic Staining Methods of the Armed Forces Institute
7. W. R. Sewell, J. Wiland, and N. C. Bradford, Surg. Gynecol. Obstet., 100, 483
8. G. W. Snedecor and W. G. Cochran, Statistical Methods (6 ed.), Iowa State Uni-
9. F. Leonard, C. W. R. Wade, and A. F. Hegyeli, Clin. Orthop. Rel. Res., 78, 168
1973, pp. 203-297.
391 (1976).
R. K. Kulkarni, J . Biomed. Mater. Res., 12,43 (1978).
of Pathology (3rd ed.), McGraw-Hill, New York, 1968.
(1955).
versity Press, Ames, Iowa, 1967, pp. 258-298.
( 197 1). 10. S. D. Bruck, J . Biomed. Muter. Res., 5,139 (1971). 11. A. Chapiro, Radiation Chemistry of Polymeric Systems, Wiley-Interscience, New
12. R. K. Kulkarni, D. Bartek, D. K. Ousterhout, and F. Leonard, J. Biomed. Muter.
13. L. S . Goodman and A. Gilman, The Pharmacological Basis of Therapeutics, The
14. S. Daniele, H. N. Jacklin, C. L. Schepens, and H. Freeman, Arch. Ophthal., 80,
15. J . Cohen, J . Bone J . Surg., 4,152 (1959). 16. N. E. Stinson, Br. J . Exp. Pathol., 46 (2), 135 (1965). 17. R. M. Rice, S. J. Gourlay, C. W. R. Wade, J. Dillon, and A. F. Hegyeli, Fed. Proc.,
18. J . Autian, CRC Crit. Reu. Tozicol., 2, l(1973). 19. J. Autian, Znt. Dent. J., 20,481 (1970). 20. W. J. Peters, R. W. Jackson, and D. C. Smith, J . Biomed. Muter. Res., 8, 53
21. W. J. Peters, R. W. Jackson, K. Swano, and D. C. Smith, Clin. Orthop. Rel. Res.,
22. F. Leonard, R. K. Kulkarni, G. Brandes, J. Nelson, and P. J . Cameron, J. Appl.
23. R. K. Kuklkarni, E. G. Moore, A. F. Hegyeli, and F. Leonard, J . Biomed. Muter.
24. J. Hopecek, L. Spring, H. Bazilova, and J. Vauk, J. Biomed. Mater. Res., 7, 111
25. C. A. Homsy, J . Biomed. Mater. Res., 4,341 (1970). 26. R. I. Leininger, CRC Crit. Reu. Bioeng., 1,333 (1972). 27. W. L. Guess and S. Haberman, J . Biomed. Muter. Res., 2,313 (1968). 28. R. A. W. Lehman, G. J . Hayes, and F. Leonard, Arch. Surg. 93,441 (1970). 29. F. Bischoff, Clin. Chem., 18,869 (1972). 30. L. Tronstad and L. Spangberg, Scand. J . Dent. Res., 82,93 (1974). 31. S. Houston, J. W. Hodge, Jr., D. K. Ousterhout, and F. Leonard, J. Biomed. Mater.
York, 1962.
Res., 3,165 (1968).
Fourth Ed., The MacMillan Go., Toronto, 1970, p. 991.
115 (1968).
34,56 Abs (1975).
(1974).
88,220 (1972).
Polym. Sci., 10,259 (1966).
Res., 5,169 (1971).
(1973).
Res., 3,281 (1969).

232 GOURLAY ET AL.
32. K. C. Woodward, 3. B. Herman, J. L. Cameron, G. Brandes, E. J. Pulaski, and F.
33. R. K. Kulkarni, K. C. Pani, C. Neuman, and F. Leonard, Arch. Surg., 93,839
34. G. S. Beagrie, J. H. P. Main, and D. C. Smith, Br. Dent. J., 132,351 (1972).
Leonard, Anal. Surg., 162,113 (1965).
(1966).
Received March 18,1977 Revised July 2,1977