bill gunderson’s weekly “best stocks now”...
TRANSCRIPT

1
Bill Gunderson’s Weekly “Best Stocks Now” Newsletter
Straightforward, honest research for successful people…
http://www.pwstreet.com
@BillGunderson on Twitter
[email protected] Let me hear from you!
April 13, 2012
Bill Gunderson- President and Founder of Gunderson Capital Mgt. Inc.
SIX MONTH TREND-LINE HAS BEEN BROKEN

2
The chart above clearly shows a violation or a break below the 6 month uptrend this past week. In fact, the Dow Jones Industrial Average is now back below 13,000, and is currently trading below its 50 day moving average.
It is now time to panic, sell everything, and run for the exits, right? Wrong! It depends on the individual stock in question. I don’t see Starbucks (SBUX) breaking its trend-line:
I don’t see Tractor Supply (TSCO) rolling over yet:

3
In fact, I see some stocks like Titan Machinery (TITN) just beginning to emerge:
Some leadership stocks are starting to break down, however. I mentioned that I sold my Clean Harbors (CLH) last week:
4
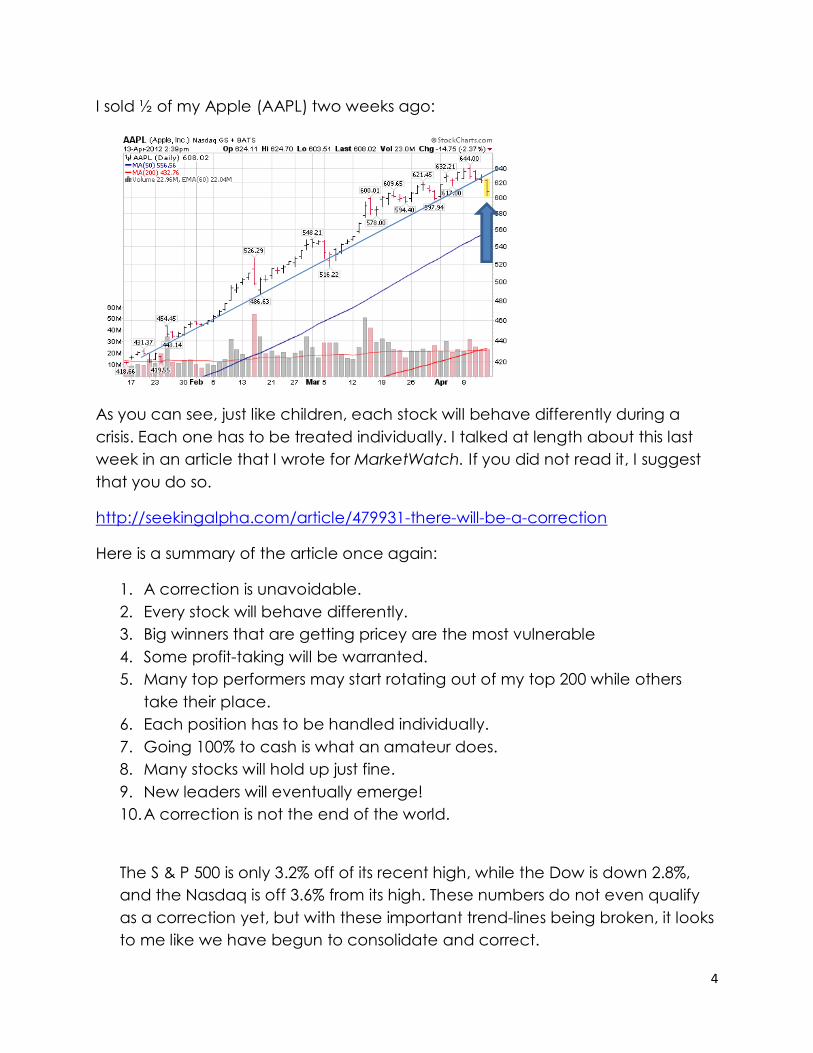
I sold ½ of my Apple (AAPL) two weeks ago:
As you can see, just like children, each stock will behave differently during a crisis. Each one has to be treated individually. I talked at length about this last week in an article that I wrote for MarketWatch. If you did not read it, I suggest that you do so.
http://seekingalpha.com/article/479931-there-will-be-a-correction
Here is a summary of the article once again:
1. A correction is unavoidable. 2. Every stock will behave differently. 3. Big winners that are getting pricey are the most vulnerable 4. Some profit-taking will be warranted. 5. Many top performers may start rotating out of my top 200 while others
take their place. 6. Each position has to be handled individually. 7. Going 100% to cash is what an amateur does. 8. Many stocks will hold up just fine. 9. New leaders will eventually emerge! 10. A correction is not the end of the world.
The S & P 500 is only 3.2% off of its recent high, while the Dow is down 2.8%, and the Nasdaq is off 3.6% from its high. These numbers do not even qualify as a correction yet, but with these important trend-lines being broken, it looks to me like we have begun to consolidate and correct.

5
How deep will a correction be? Nobody knows for sure, but as things stand right now, I would expect a shallow correction of 5-8%. I base that on the current support levels of the S & P 500 and the Dow. Many individual stocks will correct much more than that, however.
The stocks that have gone the furthest during this 30-35% run in the market will be the most vulnerable. Forty-three stocks (see list below) have more than doubled during this recent run, they obviously are the most vulnerable.
6 mo 6 mo
It will also be very IMPORTANT to watch the market rotation and see which new stocks begin to enter into my Top 200. This current cycle is now 6 months old, and it is not unusual at all for some consolidation and rotation begin to take place.
It is important to remember that in a relative grading and ranking system like mine, there will always be members of the top 200. We need to now start trimming some positions that have gone up a long ways and are starting to drop in rank and break their trend-lines. Meanwhile, we need to keep an eye out for new leaders to begin to emerge.
1 MDVN Medivation 328.5% 22 CRYP CryptoLogic Inc 121.9%2 AE Adams Res & Energy Inc. 248.8% 23 VOXX Audiovox Corp 121.5%3 CIE Cobalt Intl. Energy 221.8% 24 PKT Procera Networks 121.2%4 KTCC Key Tronic Corp 195.1% 25 MHO MI Homes Inc 117.3%5 SWHC Smith & Wesson Hldg. 180.1% 26 FSII FSI Intl Inc 117.1%6 LCAV LCA Vision Inc 170.5% 27 USG USG Grp 116.9%7 BLDR Building First Source 168.6% 28 CONN Conns Inc 116.7%8 HW Headwaters Inc 167.3% 29 AVD American Vanguard Corp 116.4%9 MNTG MTR Gaming Grp 165.0% 30 CX Cemex Sa De Cv Ads 113.3%
10 VVUS Vivus Inc 164.8% 31 PCYC Pharmacyclics Inc 113.2%11 ACAT Arctic Cat Inc 161.8% 32 CKEC Carmike Cinemas Inc 112.8%12 STX Seagate Technology 146.3% 33 SCSS Select Comfort Corp 112.7%13 ZOLL Zoll Medical 146.2% 34 ABD A C C O Brands 112.0%14 ANIK Anika Therapeutics Inc 143.7% 35 MGAM Multimedia Games Inc 111.9%15 CPWM Cost Plus Inc 142.5% 36 CTHR Charles & Colvard Ltd 109.7%16 MEG Media General Inc Cl A 139.1% 37 SALM Salem Communications A 109.4%17 AMLN Amylin Pharmaceuticals Inc 137.8% 38 ACFN Acorn Energy Inc. 108.7%18 LF LeapFrog Enterprises Inc 130.1% 39 CHRS Charming Shoppes inc 106.1%19 RVSN Radvision Ltd 128.2% 40 ADGF Adams Golf 105.9%20 AFFY Affymax Inc. 127.8% 41 FFCH First Financial Hldgs 105.7%21 GRH Greenhunter Energy Inc. 127.7% 42 DXPE DXP Enterprises Inc 103.4%
43 ASGN On Assignment 100.7%

6
Here is how the markets fared this past week:
As you can see, all minus signs for the second straight week. We are also entering into that Sell in May and Go Away time-frame. In addition to this, Spain continues to teeter on the brink, and America’s job situation has started to reverse again. The market would love to see QE3, but I would not count on it.
Earnings season is now under way. We have a good start so far, with Alcoa, J P Morgan, Wells Fargo, and Google all exceeding expectations. Next week will be a very important week for the market as many leading companies like Citigroup, Goldman Sachs, IBM, Intel, Qualcomm, Bank of America, Microsoft, and General Electric will be reporting earnings.
Here is where the markets stand year-to-date:
.
Fri. 4/6/12 Fri. 4/13/12 Week Week Pct.
Close Close Change ChangeS&P500 1398.08 1377.00 -21.08 -1.51%
DJIA 13,060.14 12,918.00 -142.14 -1.09%
NASD 3080.50 3022.00 -58.50 -1.90%
S&P600 (Small) 457.74 446.60 -11.14 -2.43%
Emg. Mkts (ADRE) 41.64 41.31 -0.33 -0.79%
10yr Bd. 2.17% 1.99% -0.18% -8.29%
Oil 103.25 103.36 0.11 0.11%
Gold 1630.80 1671.20 40.40 2.48%
12/31/11 Fri. 4/13/12 2012 YTD Pct.
Value Close YTD Change
S&P500 1260.37 1377.00 116.63 9.25%
DJIA 12,239.74 12,918.00 678.26 5.54%
NASD 2610.68 3022.00 411.32 15.76%
S&P600 (Small) 415.07 446.60 31.53 7.60%
Emg. Mkts (ADRE) 39.89 41.31 1.42 3.56%
10yr Bd. 1.87% 1.99% 0.12% 6.42%
Oil 98.87 103.36 4.49 4.54%
Gold 1565.90 1671.20 105.30 6.72%

7
The market is beginning to correct. It is time to lock in some profits and start looking for some new leaders to emerge.
@billgunderson. Please follow me on Twitter, Facebook, or LinkedIn throughout the week for any changes in my current stance on the market or individual stocks. My tweets are also found on my BEST STOCKS NOW app every day and on the homepage of my website: http://www.pwstreet.com
8
Bill Gunderson’s Model Portfolio for Conservative Growth Investors:
This model is made up of mostly mid-cap and large cap companies that I consider to be suitable for investors who have a conservative risk profile, but still want growth.
This portfolio is up 16.9 year-to-date, while the S & P 500 is up 9.6%. The portfolio currently has a 4.6% cash position and no hedges. The portfolio is currently heavily weighted in the consumer sector.
THIS SECTION IS FOR CLIENTS AND SUBSCRIBERS ONLY
Bill Gunderson’s Model Portfolio for Investors seeking AGGRESSIVE Growth
This is my most aggressive portfolio. It is designed for investors with long-term time horizons seeking maximum growth. This portfolio is mainly made up of small and mid-cap stocks with superior growth potential. This portfolio is much more volatile than the Conservative Portfolio and the Income Portfolio. This portfolio also carries more risk than the CONSERVATIVE GROWTH and the INCOME & GROWTH portfolios.
Aggressive growth stocks continue to perform best this year, but they are also the MOST vulnerable at the current time. This portfolio is up 14.0% YTD, while the S & P 500 is up 9.3%. I am selling….
THIS SECTION IS FOR CLIENTS AND SUBSCRIBERS ONLY
Aggressive stocks continue to be the place to be in 2012, but they will also be the most VULNERABLE during a correction.
Bill Gunderson’s Model Portfolio for investors seeking Income along with the possibility of Growth.
This model is my most conservative model. It is designed for risk-adverse investors that want income first and growth second. Income producing investments have proven themselves over time to be much less volatile than pure growth investments. If you look back at the year 2008, when the overall market was down 38.5%, income producers held up much better.
I am very pleased with the results that my model portfolio has achieved thus far. It is designed as a bond or CD alternative, albeit with more risk.

9
This portfolio currently has an average yield of 6.0%. Compare this with the current U.S. Treasury yield of 2.2% and current CD yields.
This portfolio is up 13.3% since its August 2011 inception. It is currently running at an annualized rate 19.0%. Keep in mind that dividend stocks ruled the roost for much of 2011, however.
I am selling …
THIS SECTION FOR CLIENTS AND SUBSCRIBERS ONLY
Dividend stocks continue to underperform the market so far in 2012, but will outperform during a correction.
THE FULL SUBSCRIPTION VERSION OF BEST STOCKS NOW IS NOW AVAILABLE FOR ANDROID PHONES AND TABLETS! PC VERSION COMING SOON…
Bill Gunderson’s Featured Stock of the Week 4/13/2012
I currently have 2,821 stocks in my database. Every day when I am done doing my radio show, I spend several hours looking at them. I especially focus in on the ones I own and the “A” rated stocks.
My proprietary grading system consists of Value, Performance, and Safety. I like stocks that have performed much better than the rest and still offer good value. I spent years developing this grading system and I am thrilled with the results!
This week’s pick:
THIS SECTION FOR CLIENTS AND SUBSCRIBERS ONLY

10
Previously featured stocks: (As of 4/13/2012)
I have been featuring stocks in my newsletter for over five years now. The average featured stock of the week has beaten the S & P 500 by 23.0%. The list below is the current active list. The stocks that have been deleted from this list are listed later in the newsletter.
THIS SECTION IS FOR CLIENTS AND SUBSCRIBERS ONLY
11
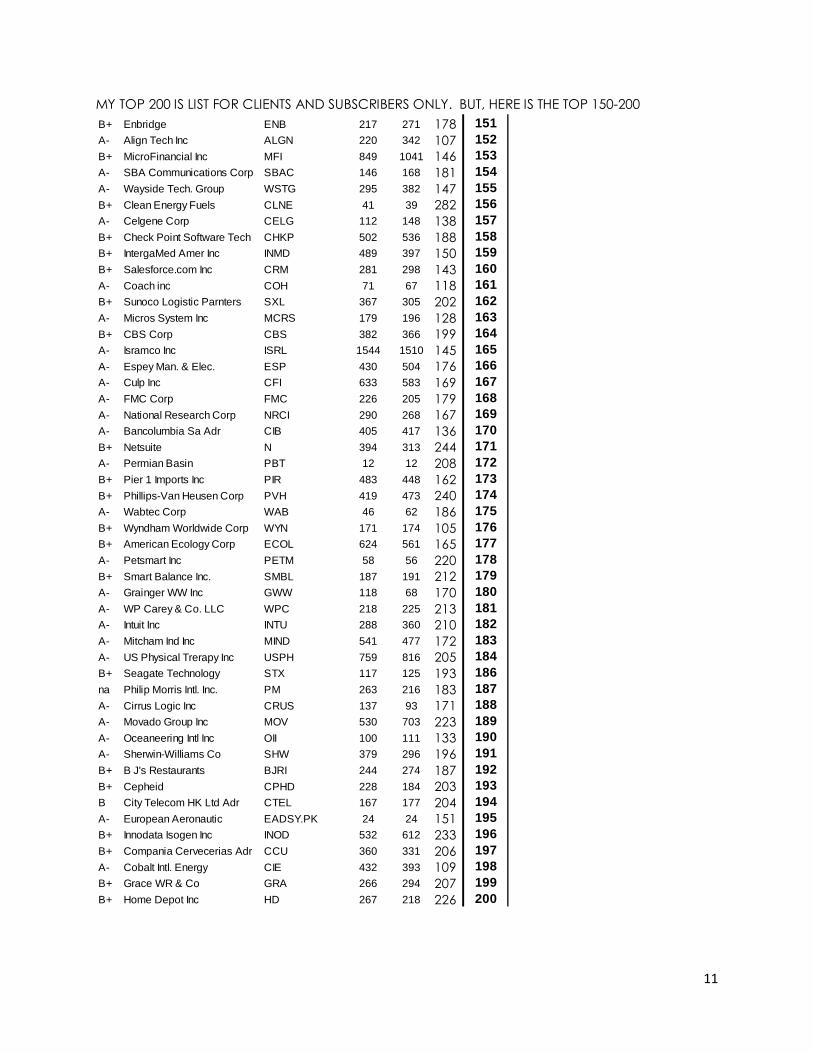
MY TOP 200 IS LIST FOR CLIENTS AND SUBSCRIBERS ONLY. BUT, HERE IS THE TOP 150-200
B+ Enbridge ENB 217 271 178 151A- Align Tech Inc ALGN 220 342 107 152B+ MicroFinancial Inc MFI 849 1041 146 153A- SBA Communications Corp SBAC 146 168 181 154A- Wayside Tech. Group WSTG 295 382 147 155B+ Clean Energy Fuels CLNE 41 39 282 156A- Celgene Corp CELG 112 148 138 157B+ Check Point Software Tech CHKP 502 536 188 158B+ IntergaMed Amer Inc INMD 489 397 150 159B+ Salesforce.com Inc CRM 281 298 143 160A- Coach inc COH 71 67 118 161B+ Sunoco Logistic Parnters SXL 367 305 202 162A- Micros System Inc MCRS 179 196 128 163B+ CBS Corp CBS 382 366 199 164A- Isramco Inc ISRL 1544 1510 145 165A- Espey Man. & Elec. ESP 430 504 176 166A- Culp Inc CFI 633 583 169 167A- FMC Corp FMC 226 205 179 168A- National Research Corp NRCI 290 268 167 169A- Bancolumbia Sa Adr CIB 405 417 136 170B+ Netsuite N 394 313 244 171A- Permian Basin PBT 12 12 208 172B+ Pier 1 Imports Inc PIR 483 448 162 173B+ Phillips-Van Heusen Corp PVH 419 473 240 174A- Wabtec Corp WAB 46 62 186 175B+ Wyndham Worldwide Corp WYN 171 174 105 176B+ American Ecology Corp ECOL 624 561 165 177A- Petsmart Inc PETM 58 56 220 178B+ Smart Balance Inc. SMBL 187 191 212 179A- Grainger WW Inc GWW 118 68 170 180A- WP Carey & Co. LLC WPC 218 225 213 181A- Intuit Inc INTU 288 360 210 182A- Mitcham Ind Inc MIND 541 477 172 183A- US Physical Trerapy Inc USPH 759 816 205 184B+ Seagate Technology STX 117 125 193 186na Philip Morris Intl. Inc. PM 263 216 183 187A- Cirrus Logic Inc CRUS 137 93 171 188A- Movado Group Inc MOV 530 703 223 189A- Oceaneering Intl Inc OII 100 111 133 190A- Sherwin-Williams Co SHW 379 296 196 191B+ B J's Restaurants BJRI 244 274 187 192B+ Cepheid CPHD 228 184 203 193B City Telecom HK Ltd Adr CTEL 167 177 204 194A- European Aeronautic EADSY.PK 24 24 151 195B+ Innodata Isogen Inc INOD 532 612 233 196B+ Compania Cervecerias Adr CCU 360 331 206 197A- Cobalt Intl. Energy CIE 432 393 109 198B+ Grace WR & Co GRA 266 294 207 199B+ Home Depot Inc HD 267 218 226 200

12
Bill Gunderson’s Top 200 is a new feature in the newsletter. I can tell you from experience that it is very powerful. The Top 200 is a reflection of the market and the economy. These trends can remain in place for a long time. Sometimes bonds are at the top, sometimes cash is at the top, and there are even times when inverse funds rule the roost. Study this list carefully each week.
AS THE MARKET NOW BEGINS TO ROTATE-IT IS IMPORANT TO WATCH FOR NEW STOCKS TO FILTER INTO THE TOP 200. IT IS BEST TO WAIT FOR THINGS TO SETTLE A BIT, HOWEVER AS THE ROTATION IS JUST STARTING TO BEGIN.
SPECIAL NOTE: AM1000 KCEO HAS BEEN SOLD. WE HAVE MOVED TO AM1450 AND AM1510. You can also tune in on your smartphone or the internet.
Global Markets as of 4/13/2012
Many of the global markets continue to outpace the U.S. markets right now. Spain in a major concern however. They do not have a very good economic model to follow.

13
Commodities as of 4/13/2012
COMMODITIES-No real reason to own commoditiesright now.
2012 YTDSilver SLV 13.4%
Steel SLX 9.3%
Gold GLD 5.8%
Copper JJC 5.2%
Grains JJG 3.7%
Oil USO 2.7%
Cotton BAL -1.2%
Coal KOL -2.5%
401(k) Current Basic AllocationLong way till retNearing
Retirement Retirement
Best Bond Fund Choices that you have: 10.0% 30.0%Best Large Cap Choices that you have: 0.0% 20.0%Best Mid Cap Choices that you have: 25.0% 20.0%Best Small Cap Choices that you have 35.0% 20.0%Best Nat. Resource (GOLD) Choices that you have: 0.0% 0.0%Best Technology Choices that you have: 15.0% 0.0%Best International Choices that you have: 15.0% 10.0%Cash 0.0% 0.0%
TOTAL 100.0% 100.0%

14
WORST STOCKS NOW! Short Ideas
http://www.youtube.com/watch?v=bOwWvEBkTxA Here are snippets on all of the stocks I have talked about on my radio show, and articles that I have written over the last few months. They are in alphabetical order.
http://pwstreet.com/good-bad-stocks/
Scott Voak, our show’s Real Estate expert continues to find double-digit returns on income properties all throughout San Diego. You can reach Scott at (888)311-6311. Scott’s website is
http://www.voakhomes.com
Not a good environment for short positions right now
CLOSEDSprint Nextel S October 7, 2011 $2.45 $2.30 6.1%
Salesforce CRM November 11, 2011 $129.87 $123.94 4.6%
Sears Holding SHLD December 16, 2011 $46.16 $45.10 2.3%
First Solar FSLR May 27, 2011 $121.37 $45.54 62.5%
Frontline FRO June 10, 2011 $15.84 $11.81 25.4%
Sunpower SPWR November 4, 2011 $8.76 $7.25 17.2%
Yingli Gr. Energy YGE October 21, 2011 $3.58 $4.54 -26.8%
Amazon.com AMZN December 30, 2011 $173.10 $190.93 -10.3%
Goldman Sachs GS September 9, 2011 $102.57 $102.09 0.5%
UBS UBS September 30, 2011 $11.43 $12.45 -8.9%
Daimler DDAIF September 9, 2011 $43.96 $51.10 -16.2%
Toll Brothers TOL September 9, 2011 $15.65 $18.09 -15.6%
Amer. Int. Gr. AIG August 5, 2011 $25.10 $26.34 -4.9%
AVERAGE AVG. 2.8%
15
I covered a lot of interesting topics on my daily radio this past week. To listen to the archives, you can visit http://www.pwstreet.com/radio-show-archives
To order my book, Best Stocks Now, click the link below:
http://pwstreet.com/book/
To set up and appointment with me, click the link below:
http://pwstreet.com/contact-us/
If you are looking for a good CPA to do some tax-planning or financial planning, give Randy Goodsell a call. Randy has been my CPA for many years. Randy is a frequent guest on my daily radio show. Randy can be reached at (619)238-4343. His website is http://www.goodsellcpa.com
Subscriptions to this weekly newsletter are $195 per year or $60 per quarter. To subscribe call us at (760)736-8258 or visit our website at http://pwstreet.com. You can also mail a check to Gunderson Capital Mgt. 550 Seagaze Dr. #16 Oceanside, CA 92054.THIS REPORT PROVIDES GENERAL INFORMATION AND IS NOT AN OFFER TO BUY OR SELL ANY SECURITY. IT IS THE SOLE OPINION OF THE WRITER, BILL GUNDERSON. BILL GUNDERSON IS PRESIDENT
OF GUNDERSON CAPITAL MANAGEMENT INC. A REGISTERED INVESTMENT ADVISORY FIRM LOCATED AT 550 SEAGAZE DR. #16 OCEANSIDE, CALIFORNIA 92054 PHONE NO. (760)736-8258. BILL
GUNDERSON EDITS THE WEEKLY NEWSLETTER. INFORMATION IN THIS NEWSLETTER COMES FROM INDEPENDENT SOURCES BELIEVED TO BE RELIABLE, BUT ACCURACY IS NOT GUARANTEED.
BILL GUNDERSON OR GUNDERSON CAPITAL MGT. INC. HAS NOT VERIFIED THE ACCURACY OF THE INFORMATION PUBLISHED BY THE INDEPENDENT SOURCES. SELECTIONS IN THIS NEWSLETTER ARE
THE SOLE OPINIONS OF BILL GUNDERSON AND ARE SUBJECT TO RISKS AND UNCERTAINTIES BEYOND THE CONTROL OF BILL GUNDERSON AND GUNDERSON CAPITAL MGT. INC. SUCH RISKS AND UN-
CERTAINTIES INCLUDE NATIONAL, INTERNATIONAL, ECONOMIC CONDITIONS AND FLUCTUATIONS; ECONOMIC CONDITIONS OF SPECIFIC SECTORS AND GROUPS AND COMPANIES; MANAGEMENT
CAPABILITIES OF COMPANIES SELECTED. SELECTIONS IN THIS NEWSLETTER MAY NOT YIELD PROFITABLE RESULTS AND MAY ACTUALLY RESULT IN A LOSS OF INVESTMENT CAPITAL. AS AN INVEST-
MENT ADVISORS, BILL GUNDERSON, OR CLIENTS OF GUNDERSON CAPITAL MGT. INC. MAY PURCHASE AND SELL SECURITIES IDENTIFIED EITHER IN THEIR OWN ACCOUNTS OR ACCOUNTS THAT THEY
MANAGE. THEY MAY ALSO BUY OR SELL SECURITIES MENTIONED WITHOUT NOTICE TO NEWSLETTER SUBSCRIBERS. IF YOU HAVE ANY QUESTONS, YOU CAN CONTACT BILL GUNDERSON AT (760)736-8258

�����������������������������������������������������������������������������������������������������������������������������������������������������������������������������������������������������������������