weekly report - amazon s3 · weekly report find leading stocks: weekly market outlook disclaimer:...
TRANSCRIPT

Weekly Report
Find Leading Stocks: Weekly Market Outlook
Disclaimer: This analysis contains information from resources believed to be reliable but are not guaranteed as to accuracy or wholeness as of the date of this publication. Past performance is not necessarily indicative of future results. There is always a risk of loss in trading capital markets. Opinions articulated are subject to change without notice. This analysis and any opinions expressed are intended for educational purposes only and should NOT BE interpreted as a call for engagement in any transaction involving the purchase or sale of any security or investment product or service. The risk of loss in investing and or trading can be substantial, and traders/investors should carefully consider the inherent risks of such an investment in light of their financial condition. The author, firm, associates, or the firm’s clients may be long or short any of the investments mentioned and their positions are subject to change without notice. Any reproduction or retransmission of any portion of this report without the express written consent of The Sarhan Analysis, LLC. is strictly prohibited.
FLS Playbook 06.15.15
Market Update: Stocks End Mixed Ahead of Fed Meeting
Stocks ended mixed last week as investors look forward to next week's Fed meeting (Tues/Wed) and the on-going drama with Greece. The latest round of incoming economic "data" failed to "impress" which means the Fed will likely not raise rates in the near future. It is important to note that the Fed has a dual mandate: help the economy and keep inflation near its 2% target. Right now, neither objective is being met which is why we do not think the Fed will raise rates until the "data" improves. We do not expect the Fed to do anything substantial next week - if anything, just change its rhetoric. The simple fact is that they remain "data-dependent" which means, by definition, no one in the world (including the Fed) knows when they will raise rates. Conversely, if the "data" weakens, we would not be surprised to see the Fed announce QE 4 (print more money). Interestingly, the small-cap Russell 2000 index led its peers and closed with decent gains last week. Looking forward, the bulls remain in control as long as the major indices remain perched below their 2015/record highs and we see any material selling/damage occur.
Portfolio Update: Every position in the FLS portfolio is profitable ahead of the Fed meeting. Our stops were moved up
recently (where possible) and we are comfortable with our exposure at this juncture. Here is a snapshot of
the FLS portfolio as of Friday's close,
Positions: A. The service owns: TSLA +22.47%, NFLX +14.72%,
REGN +1.27%, XLF +0.68%, HACK +5.51%, DPZ +0.77%
B. The service will exit: TSLA @ 234.87, NFLX @ 576.13, REGN @ 486.10, XLF @24.03, HACK @ 28.69, DPZ @ 105.14
Working Orders:

Weekly Report
Find Leading Stocks: Weekly Market Outlook
Disclaimer: This analysis contains information from resources believed to be reliable but are not guaranteed as to accuracy or wholeness as of the date of this publication. Past performance is not necessarily indicative of future results. There is always a risk of loss in trading capital markets. Opinions articulated are subject to change without notice. This analysis and any opinions expressed are intended for educational purposes only and should NOT BE interpreted as a call for engagement in any transaction involving the purchase or sale of any security or investment product or service. The risk of loss in investing and or trading can be substantial, and traders/investors should carefully consider the inherent risks of such an investment in light of their financial condition. The author, firm, associates, or the firm’s clients may be long or short any of the investments mentioned and their positions are subject to change without notice. Any reproduction or retransmission of any portion of this report without the express written consent of The Sarhan Analysis, LLC. is strictly prohibited.
Analyzing The S&P 500's Latest Moves (Up & Down)
Nearly every pullback has been shallow in both size (small percent decline) and scope (short in duration) which is bullish for this ongoing and very powerful rally.
Chart Of The Week: Shopify $SHOP - Breaks out of a new bullish IPO Base
Weekly Report
Find Leading Stocks: Weekly Market Outlook
Disclaimer: This analysis contains information from resources believed to be reliable but are not guaranteed as to accuracy or wholeness as of the date of this publication. Past performance is not necessarily indicative of future results. There is always a risk of loss in trading capital markets. Opinions articulated are subject to change without notice. This analysis and any opinions expressed are intended for educational purposes only and should NOT BE interpreted as a call for engagement in any transaction involving the purchase or sale of any security or investment product or service. The risk of loss in investing and or trading can be substantial, and traders/investors should carefully consider the inherent risks of such an investment in light of their financial condition. The author, firm, associates, or the firm’s clients may be long or short any of the investments mentioned and their positions are subject to change without notice. Any reproduction or retransmission of any portion of this report without the express written consent of The Sarhan Analysis, LLC. is strictly prohibited.
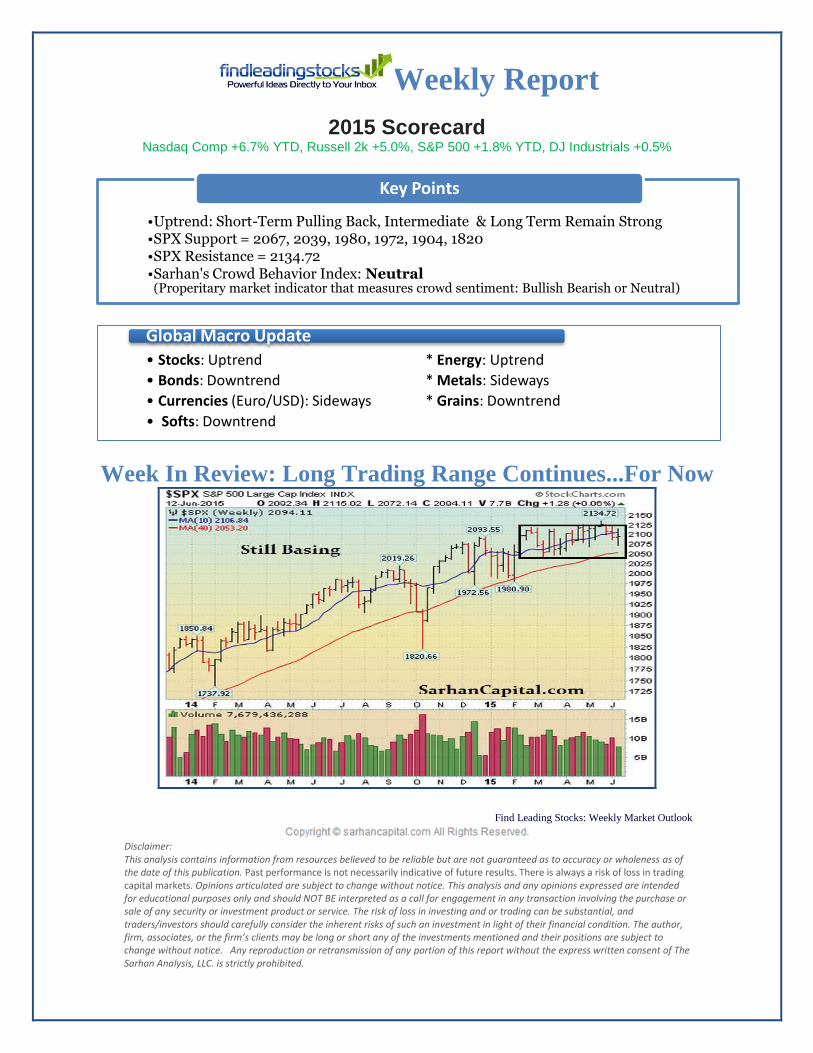
2015 Scorecard Nasdaq Comp +6.7% YTD, Russell 2k +5.0%, S&P 500 +1.8% YTD, DJ Industrials +0.5%
Week In Review: Long Trading Range Continues...For Now
•Uptrend: Short-Term Pulling Back, Intermediate & Long Term Remain Strong •SPX Support = 2067, 2039, 1980, 1972, 1904, 1820 •SPX Resistance = 2134.72 •Sarhan's Crowd Behavior Index: Neutral (Properitary market indicator that measures crowd sentiment: Bullish Bearish or Neutral)
Key Points
• Stocks: Uptrend * Energy: Uptrend
• Bonds: Downtrend * Metals: Sideways
• Currencies (Euro/USD): Sideways * Grains: Downtrend
• Softs: Downtrend
Global Macro Update

Weekly Report
Find Leading Stocks: Weekly Market Outlook
Disclaimer: This analysis contains information from resources believed to be reliable but are not guaranteed as to accuracy or wholeness as of the date of this publication. Past performance is not necessarily indicative of future results. There is always a risk of loss in trading capital markets. Opinions articulated are subject to change without notice. This analysis and any opinions expressed are intended for educational purposes only and should NOT BE interpreted as a call for engagement in any transaction involving the purchase or sale of any security or investment product or service. The risk of loss in investing and or trading can be substantial, and traders/investors should carefully consider the inherent risks of such an investment in light of their financial condition. The author, firm, associates, or the firm’s clients may be long or short any of the investments mentioned and their positions are subject to change without notice. Any reproduction or retransmission of any portion of this report without the express written consent of The Sarhan Analysis, LLC. is strictly prohibited.
Monday-Wednesday's Action: Buyers Showed Up On Wed
Stocks slid on Monday as investors waited for Apple's latest developer conference. The tech giant announced a few new changes and items to their roster, namely Apple Music which allows people to stream their music. U.S. stocks edged lower after Friday's jobs report topped estimates which increased the odds of a Fed rate hike in the near future. The DAX, Germany's stock market, fell into correction territory defined by a decline of 10% or more from a recent high. Chinese imports and exports fell which is a drag on the global economy. China’s exports slid by -2.5% in May from a year earlier in dollar terms, while imports tanked by a whopping -17.6%, leaving a trade surplus of $59.49 billion. The report showed that the U.S. contributed +18.8% to total exports which is the most since August 2010. The DJIA turned negative for the year which is not ideal. Stocks fell on Tuesday after weak economic data was announced from China. China said consumer inflation fell by 1.2% year on year in May which was below the Street's estimate and increases concerns that deflation is more of a threat than inflation as their economy softens. China said producer prices fell for the 38th consecutive month which is not ideal. Wholesale inventories rose by +0.4% in April, above expectations of a +0.2% rise. The National Federation of Independent Business said U.S. small business confidence rose to a five-month high in May of 98.3, the highest since December. The S&P 500 fell to its 150 DMA line. Stocks surged on Wednesday helping the Dow Industrials, S&P 500, and the Nasdaq 100 all jump back above their respective 50 DMA lines as a slew of stocks bounced from oversold levels. The market rallied all morning and extended their gains after Bloomberg reported that Germany will offer Greek Prime Minister Alexis Tsipras aid in return for his commitment to one economic reform. A government spokesman told Reuters that Germany will only accept a deal between Athens and its creditors if all three major lending operations approved the deal. Latest headlines aside, the bulls showed up and bought the "dip." Weekly mortgage applications jumped 8.4% as buyers continue to do what they can to lock in low rates ahead of a potential rate hike later this year.
Thursday-Friday’s Action: Stocks Slide Ahead of Wkend
Stocks were quiet on Thursday after the IMF put more pressure on the ongoing Greek drama. Retail sales rose +1.2%, beating estimates for a 1.1% gain. Ex-autos, retail sales rose 1%, beating estimates for a gain of 0.7%. Weekly jobless claims came in at 279k, slightly above expectations. April business inventories rose 0.4%, the largest gain in nearly a year. Retail inventories excluding autos, which go into the calculation of GDP, rose a solid +0.6% in April. Separately, the Atlanta Fed raised its GDP model forecast for real GDP growth in the second quarter to 1.9%, up from its earlier estimates of 1.1%. Separately, New Zealand's Central Bank surprised the world and cut rates to help stimulate their economy. In 2014, they began raising rates but were forced to cut them because their economy is not strong enough to stand on its own two feet. This serves as an important example for the U.S. Fed who is contemplating raising rates later this year. Stocks opened lower on Friday after the ongoing saga continued in Greece and U.S. producer prices topped estimates. The Producer Price Index rose +0.5% in May, topping estimates for a 0.4% gain. The gain was the largest since May 2012. Core prices, which excludes food and energy, rose 0.1%, beating estimates for a -0.2%.
Market Outlook: The Central Bank Put Is Alive And Well
Remember, in bull markets surprises happen to the upside. This has been our primary thesis since the end of 2012. We would be remiss not to note that this very strong bull market is aging (celebrated its 6th anniversary in March 2015) and the last two major bull markets ended shortly after their 5th anniversary; 1994-2000 & 2002-Oct 2007). To be clear, the central bank put is very strong and until material damage occurs, the stock market deserves the longer-term bullish benefit of the doubt. As always, keep your losses small and never argue with the tape.

Weekly Report
Find Leading Stocks: Weekly Market Outlook
Disclaimer: This analysis contains information from resources believed to be reliable but are not guaranteed as to accuracy or wholeness as of the date of this publication. Past performance is not necessarily indicative of future results. There is always a risk of loss in trading capital markets. Opinions articulated are subject to change without notice. This analysis and any opinions expressed are intended for educational purposes only and should NOT BE interpreted as a call for engagement in any transaction involving the purchase or sale of any security or investment product or service. The risk of loss in investing and or trading can be substantial, and traders/investors should carefully consider the inherent risks of such an investment in light of their financial condition. The author, firm, associates, or the firm’s clients may be long or short any of the investments mentioned and their positions are subject to change without notice. Any reproduction or retransmission of any portion of this report without the express written consent of The Sarhan Analysis, LLC. is strictly prohibited.
41.8% Of Stocks in the S&P 500 Are Above Their Respective 50 DMA
(Market Tends To Turn When This Reading Gets Above 70% or Below 40%)
Observation: Readings above 70% usually (not always) correspond with a short term pullback
Conversely, reads below 40% usually (not always) correspond with a short term bounce
FLS Big Stock List
AAPL - Fell for 3rd straight week and broke below its 50 DMA line
AMZN - Rallied last week after bouncing off its 50 DMA line. Continues forming BULLISH 8-wk base
EA - Near perfect pullback and subsequent bounce off its 10 week moving average (~50 DMA)
FB - Relatively unchanged for the week but closed above 50 DMA line
FLT - STRONG rally last week as it jumped back above its 50 MDA line
GOOGL - Fell last week as it continues to trade just below its 50 and 200 DMA lines
ILMN - Nice rally for 7th straight week as it jumps to a fresh record high
NFLX - 7th straight weekly gain. Very extended and way overdue for a pullback
SBUX - Big positive reversal on a weekly basis and jumped to new high last week
TSLA - Closed in lower half of its range last week
UA - Closed in upper half of the range for the week and above its 50 DMA line
V - Strong rally last week after bulls showed up and defended 50 DMA line

Weekly Report
Find Leading Stocks: Weekly Market Outlook
Disclaimer: This analysis contains information from resources believed to be reliable but are not guaranteed as to accuracy or wholeness as of the date of this publication. Past performance is not necessarily indicative of future results. There is always a risk of loss in trading capital markets. Opinions articulated are subject to change without notice. This analysis and any opinions expressed are intended for educational purposes only and should NOT BE interpreted as a call for engagement in any transaction involving the purchase or sale of any security or investment product or service. The risk of loss in investing and or trading can be substantial, and traders/investors should carefully consider the inherent risks of such an investment in light of their financial condition. The author, firm, associates, or the firm’s clients may be long or short any of the investments mentioned and their positions are subject to change without notice. Any reproduction or retransmission of any portion of this report without the express written consent of The Sarhan Analysis, LLC. is strictly prohibited.
17 Setups These hand-picked stocks are carefully selected to help with your idea generation and offer you additional setups each week. The setups are based on our proprietary criteria and offer advanced (dotted line) & classic long and
short entry points (solid line). Short patterns are typically mirror images of long patterns.
Note: Please Verify All Earnings Dates/Data From Multiple Sources For Every Stock in all our report(s). Charts Courtesy of FreeStockCharts.com and/or Stockcharts.com
AMZN Working Order & Setup:
Weekly Report
Find Leading Stocks: Weekly Market Outlook
Disclaimer: This analysis contains information from resources believed to be reliable but are not guaranteed as to accuracy or wholeness as of the date of this publication. Past performance is not necessarily indicative of future results. There is always a risk of loss in trading capital markets. Opinions articulated are subject to change without notice. This analysis and any opinions expressed are intended for educational purposes only and should NOT BE interpreted as a call for engagement in any transaction involving the purchase or sale of any security or investment product or service. The risk of loss in investing and or trading can be substantial, and traders/investors should carefully consider the inherent risks of such an investment in light of their financial condition. The author, firm, associates, or the firm’s clients may be long or short any of the investments mentioned and their positions are subject to change without notice. Any reproduction or retransmission of any portion of this report without the express written consent of The Sarhan Analysis, LLC. is strictly prohibited.
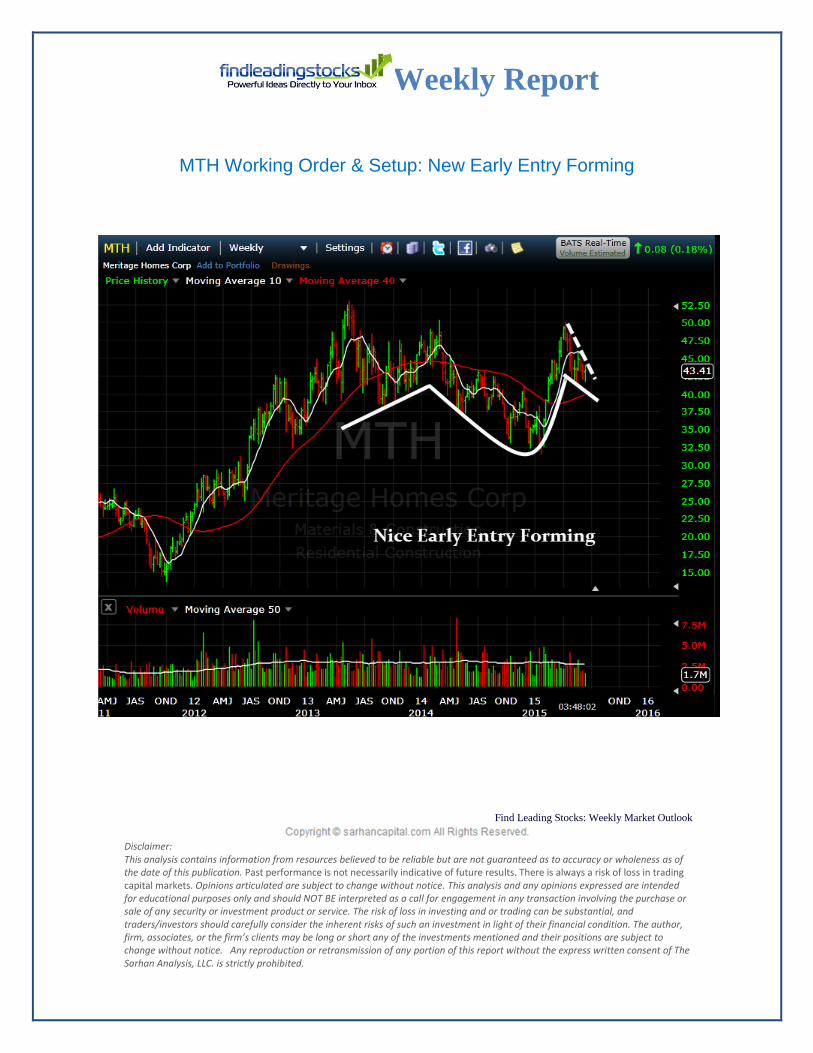
MTH Working Order & Setup: New Early Entry Forming

Weekly Report
Find Leading Stocks: Weekly Market Outlook
Disclaimer: This analysis contains information from resources believed to be reliable but are not guaranteed as to accuracy or wholeness as of the date of this publication. Past performance is not necessarily indicative of future results. There is always a risk of loss in trading capital markets. Opinions articulated are subject to change without notice. This analysis and any opinions expressed are intended for educational purposes only and should NOT BE interpreted as a call for engagement in any transaction involving the purchase or sale of any security or investment product or service. The risk of loss in investing and or trading can be substantial, and traders/investors should carefully consider the inherent risks of such an investment in light of their financial condition. The author, firm, associates, or the firm’s clients may be long or short any of the investments mentioned and their positions are subject to change without notice. Any reproduction or retransmission of any portion of this report without the express written consent of The Sarhan Analysis, LLC. is strictly prohibited.
IBB Setup: Continues Flirting Resistance
Weekly Report
Find Leading Stocks: Weekly Market Outlook
Disclaimer: This analysis contains information from resources believed to be reliable but are not guaranteed as to accuracy or wholeness as of the date of this publication. Past performance is not necessarily indicative of future results. There is always a risk of loss in trading capital markets. Opinions articulated are subject to change without notice. This analysis and any opinions expressed are intended for educational purposes only and should NOT BE interpreted as a call for engagement in any transaction involving the purchase or sale of any security or investment product or service. The risk of loss in investing and or trading can be substantial, and traders/investors should carefully consider the inherent risks of such an investment in light of their financial condition. The author, firm, associates, or the firm’s clients may be long or short any of the investments mentioned and their positions are subject to change without notice. Any reproduction or retransmission of any portion of this report without the express written consent of The Sarhan Analysis, LLC. is strictly prohibited.
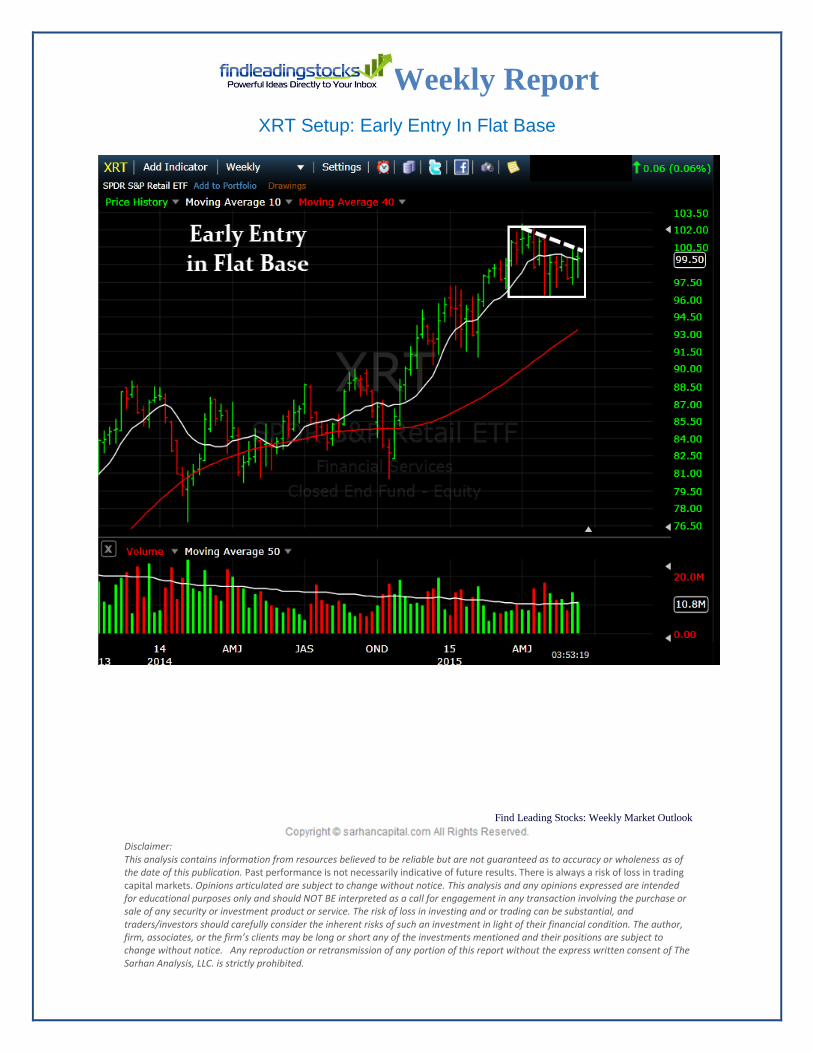
XRT Setup: Early Entry In Flat Base

Weekly Report
Find Leading Stocks: Weekly Market Outlook
Disclaimer: This analysis contains information from resources believed to be reliable but are not guaranteed as to accuracy or wholeness as of the date of this publication. Past performance is not necessarily indicative of future results. There is always a risk of loss in trading capital markets. Opinions articulated are subject to change without notice. This analysis and any opinions expressed are intended for educational purposes only and should NOT BE interpreted as a call for engagement in any transaction involving the purchase or sale of any security or investment product or service. The risk of loss in investing and or trading can be substantial, and traders/investors should carefully consider the inherent risks of such an investment in light of their financial condition. The author, firm, associates, or the firm’s clients may be long or short any of the investments mentioned and their positions are subject to change without notice. Any reproduction or retransmission of any portion of this report without the express written consent of The Sarhan Analysis, LLC. is strictly prohibited.
M Setup: Flirting With Resistance
Weekly Report
Find Leading Stocks: Weekly Market Outlook
Disclaimer: This analysis contains information from resources believed to be reliable but are not guaranteed as to accuracy or wholeness as of the date of this publication. Past performance is not necessarily indicative of future results. There is always a risk of loss in trading capital markets. Opinions articulated are subject to change without notice. This analysis and any opinions expressed are intended for educational purposes only and should NOT BE interpreted as a call for engagement in any transaction involving the purchase or sale of any security or investment product or service. The risk of loss in investing and or trading can be substantial, and traders/investors should carefully consider the inherent risks of such an investment in light of their financial condition. The author, firm, associates, or the firm’s clients may be long or short any of the investments mentioned and their positions are subject to change without notice. Any reproduction or retransmission of any portion of this report without the express written consent of The Sarhan Analysis, LLC. is strictly prohibited.
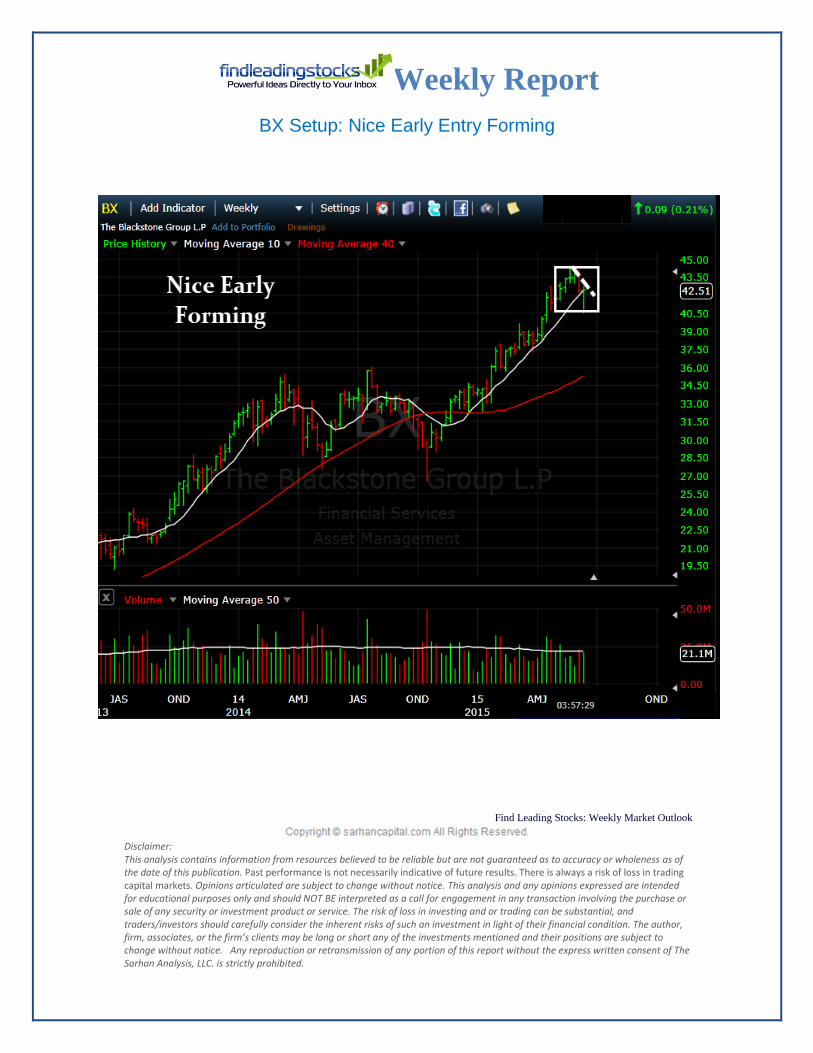
BX Setup: Nice Early Entry Forming

Weekly Report
Find Leading Stocks: Weekly Market Outlook
Disclaimer: This analysis contains information from resources believed to be reliable but are not guaranteed as to accuracy or wholeness as of the date of this publication. Past performance is not necessarily indicative of future results. There is always a risk of loss in trading capital markets. Opinions articulated are subject to change without notice. This analysis and any opinions expressed are intended for educational purposes only and should NOT BE interpreted as a call for engagement in any transaction involving the purchase or sale of any security or investment product or service. The risk of loss in investing and or trading can be substantial, and traders/investors should carefully consider the inherent risks of such an investment in light of their financial condition. The author, firm, associates, or the firm’s clients may be long or short any of the investments mentioned and their positions are subject to change without notice. Any reproduction or retransmission of any portion of this report without the express written consent of The Sarhan Analysis, LLC. is strictly prohibited.
XLF Setup: Getting Ready To Breakout
Weekly Report
Find Leading Stocks: Weekly Market Outlook
Disclaimer: This analysis contains information from resources believed to be reliable but are not guaranteed as to accuracy or wholeness as of the date of this publication. Past performance is not necessarily indicative of future results. There is always a risk of loss in trading capital markets. Opinions articulated are subject to change without notice. This analysis and any opinions expressed are intended for educational purposes only and should NOT BE interpreted as a call for engagement in any transaction involving the purchase or sale of any security or investment product or service. The risk of loss in investing and or trading can be substantial, and traders/investors should carefully consider the inherent risks of such an investment in light of their financial condition. The author, firm, associates, or the firm’s clients may be long or short any of the investments mentioned and their positions are subject to change without notice. Any reproduction or retransmission of any portion of this report without the express written consent of The Sarhan Analysis, LLC. is strictly prohibited.
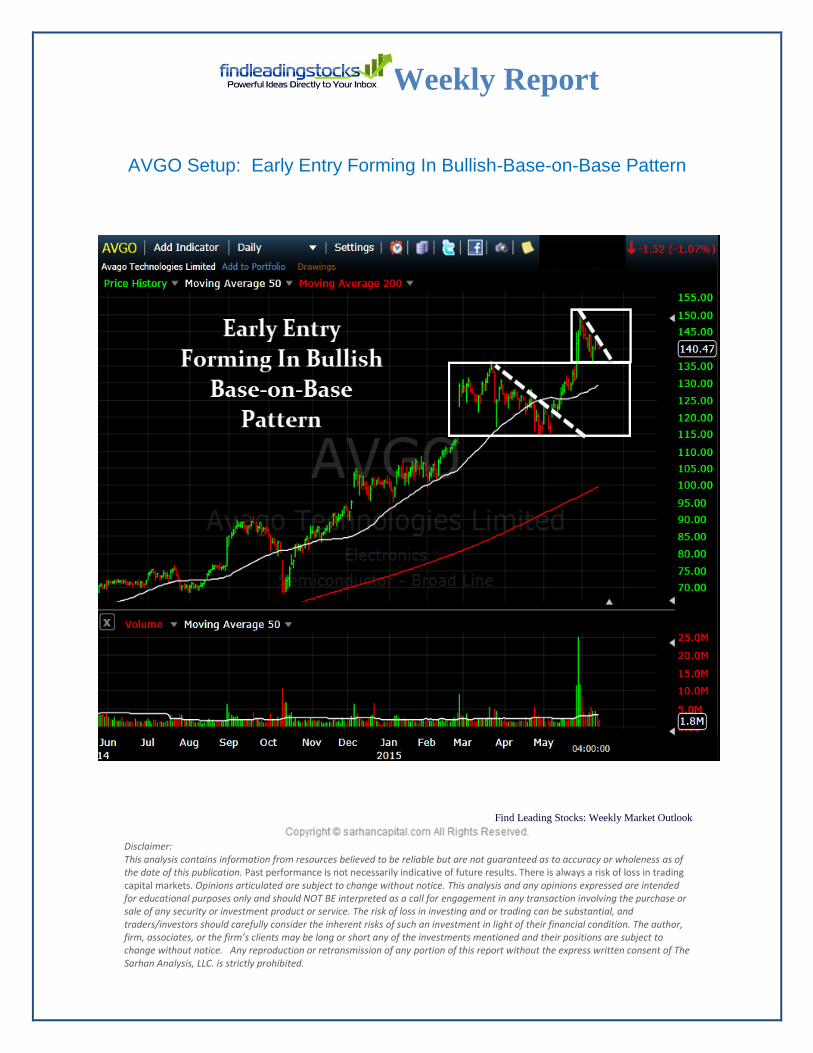
AVGO Setup: Early Entry Forming In Bullish-Base-on-Base Pattern
Weekly Report
Find Leading Stocks: Weekly Market Outlook
Disclaimer: This analysis contains information from resources believed to be reliable but are not guaranteed as to accuracy or wholeness as of the date of this publication. Past performance is not necessarily indicative of future results. There is always a risk of loss in trading capital markets. Opinions articulated are subject to change without notice. This analysis and any opinions expressed are intended for educational purposes only and should NOT BE interpreted as a call for engagement in any transaction involving the purchase or sale of any security or investment product or service. The risk of loss in investing and or trading can be substantial, and traders/investors should carefully consider the inherent risks of such an investment in light of their financial condition. The author, firm, associates, or the firm’s clients may be long or short any of the investments mentioned and their positions are subject to change without notice. Any reproduction or retransmission of any portion of this report without the express written consent of The Sarhan Analysis, LLC. is strictly prohibited.
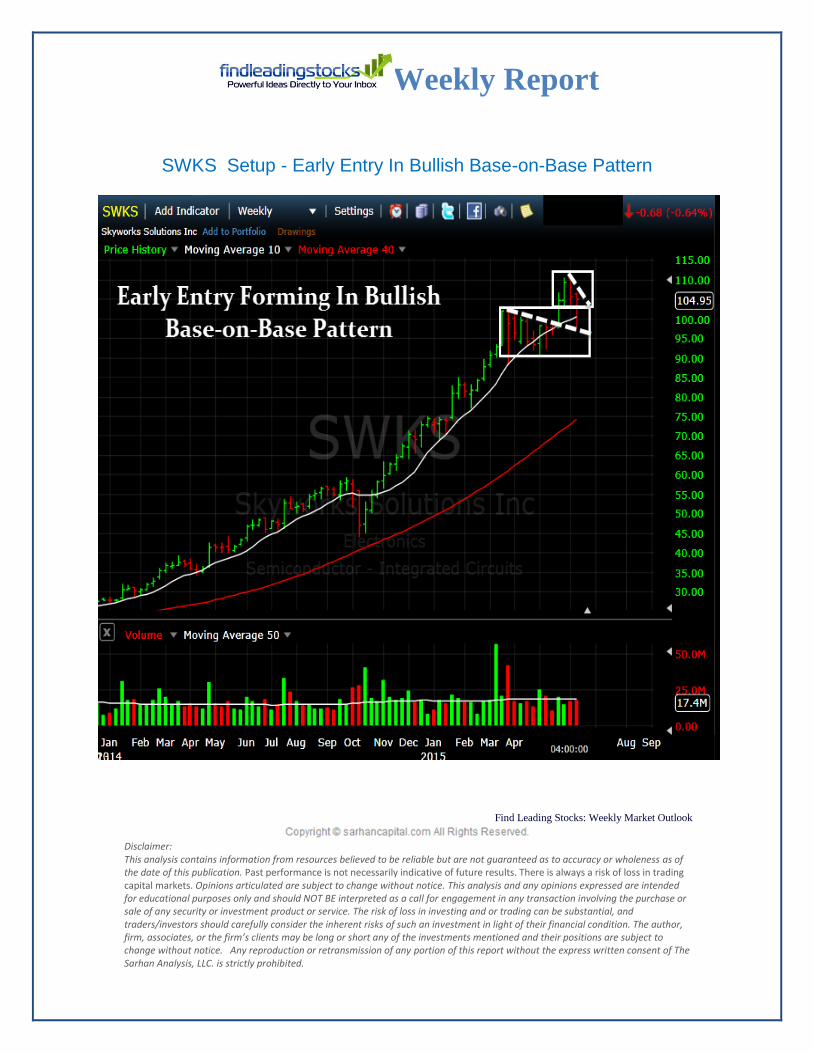
SWKS Setup - Early Entry In Bullish Base-on-Base Pattern

Weekly Report
Find Leading Stocks: Weekly Market Outlook
Disclaimer: This analysis contains information from resources believed to be reliable but are not guaranteed as to accuracy or wholeness as of the date of this publication. Past performance is not necessarily indicative of future results. There is always a risk of loss in trading capital markets. Opinions articulated are subject to change without notice. This analysis and any opinions expressed are intended for educational purposes only and should NOT BE interpreted as a call for engagement in any transaction involving the purchase or sale of any security or investment product or service. The risk of loss in investing and or trading can be substantial, and traders/investors should carefully consider the inherent risks of such an investment in light of their financial condition. The author, firm, associates, or the firm’s clients may be long or short any of the investments mentioned and their positions are subject to change without notice. Any reproduction or retransmission of any portion of this report without the express written consent of The Sarhan Analysis, LLC. is strictly prohibited.
TSCO: Trading Just Below Resistance of New Flat Base

Weekly Report
Find Leading Stocks: Weekly Market Outlook
Disclaimer: This analysis contains information from resources believed to be reliable but are not guaranteed as to accuracy or wholeness as of the date of this publication. Past performance is not necessarily indicative of future results. There is always a risk of loss in trading capital markets. Opinions articulated are subject to change without notice. This analysis and any opinions expressed are intended for educational purposes only and should NOT BE interpreted as a call for engagement in any transaction involving the purchase or sale of any security or investment product or service. The risk of loss in investing and or trading can be substantial, and traders/investors should carefully consider the inherent risks of such an investment in light of their financial condition. The author, firm, associates, or the firm’s clients may be long or short any of the investments mentioned and their positions are subject to change without notice. Any reproduction or retransmission of any portion of this report without the express written consent of The Sarhan Analysis, LLC. is strictly prohibited.
BLDR Setup - Early Entry Forming In Bullish High Tight Flag Pattern
Weekly Report
Find Leading Stocks: Weekly Market Outlook
Disclaimer: This analysis contains information from resources believed to be reliable but are not guaranteed as to accuracy or wholeness as of the date of this publication. Past performance is not necessarily indicative of future results. There is always a risk of loss in trading capital markets. Opinions articulated are subject to change without notice. This analysis and any opinions expressed are intended for educational purposes only and should NOT BE interpreted as a call for engagement in any transaction involving the purchase or sale of any security or investment product or service. The risk of loss in investing and or trading can be substantial, and traders/investors should carefully consider the inherent risks of such an investment in light of their financial condition. The author, firm, associates, or the firm’s clients may be long or short any of the investments mentioned and their positions are subject to change without notice. Any reproduction or retransmission of any portion of this report without the express written consent of The Sarhan Analysis, LLC. is strictly prohibited.
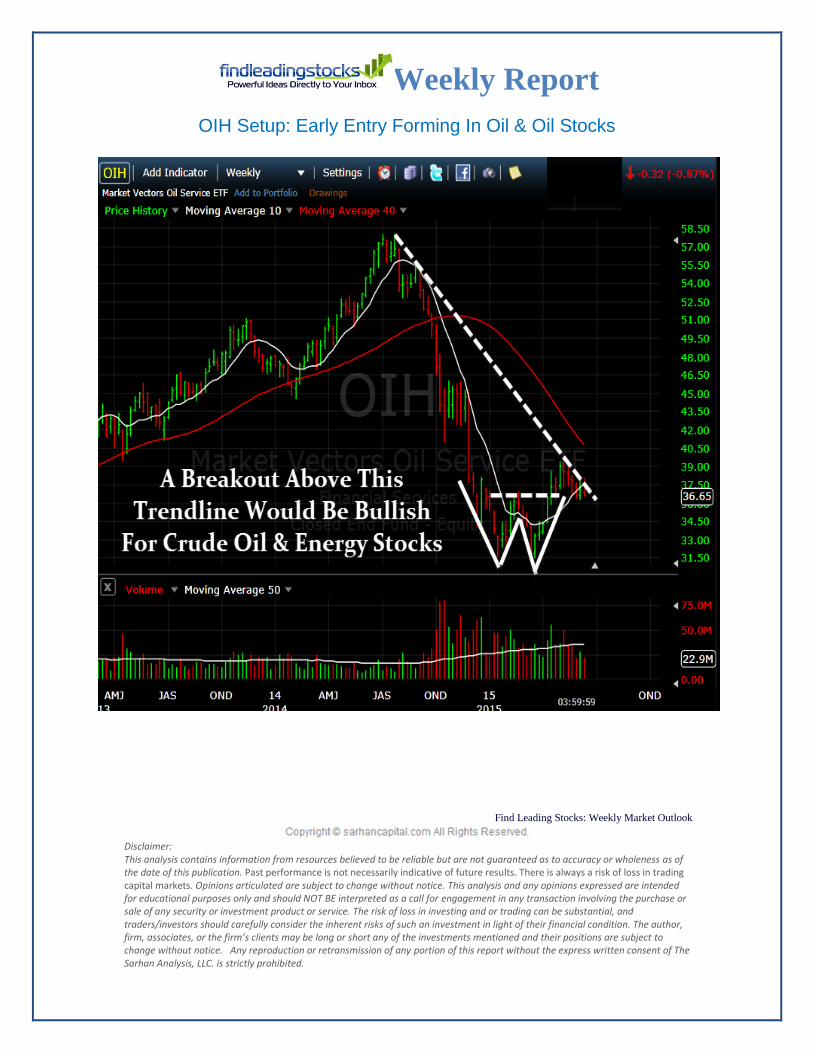
OIH Setup: Early Entry Forming In Oil & Oil Stocks
Weekly Report
Find Leading Stocks: Weekly Market Outlook
Disclaimer: This analysis contains information from resources believed to be reliable but are not guaranteed as to accuracy or wholeness as of the date of this publication. Past performance is not necessarily indicative of future results. There is always a risk of loss in trading capital markets. Opinions articulated are subject to change without notice. This analysis and any opinions expressed are intended for educational purposes only and should NOT BE interpreted as a call for engagement in any transaction involving the purchase or sale of any security or investment product or service. The risk of loss in investing and or trading can be substantial, and traders/investors should carefully consider the inherent risks of such an investment in light of their financial condition. The author, firm, associates, or the firm’s clients may be long or short any of the investments mentioned and their positions are subject to change without notice. Any reproduction or retransmission of any portion of this report without the express written consent of The Sarhan Analysis, LLC. is strictly prohibited.
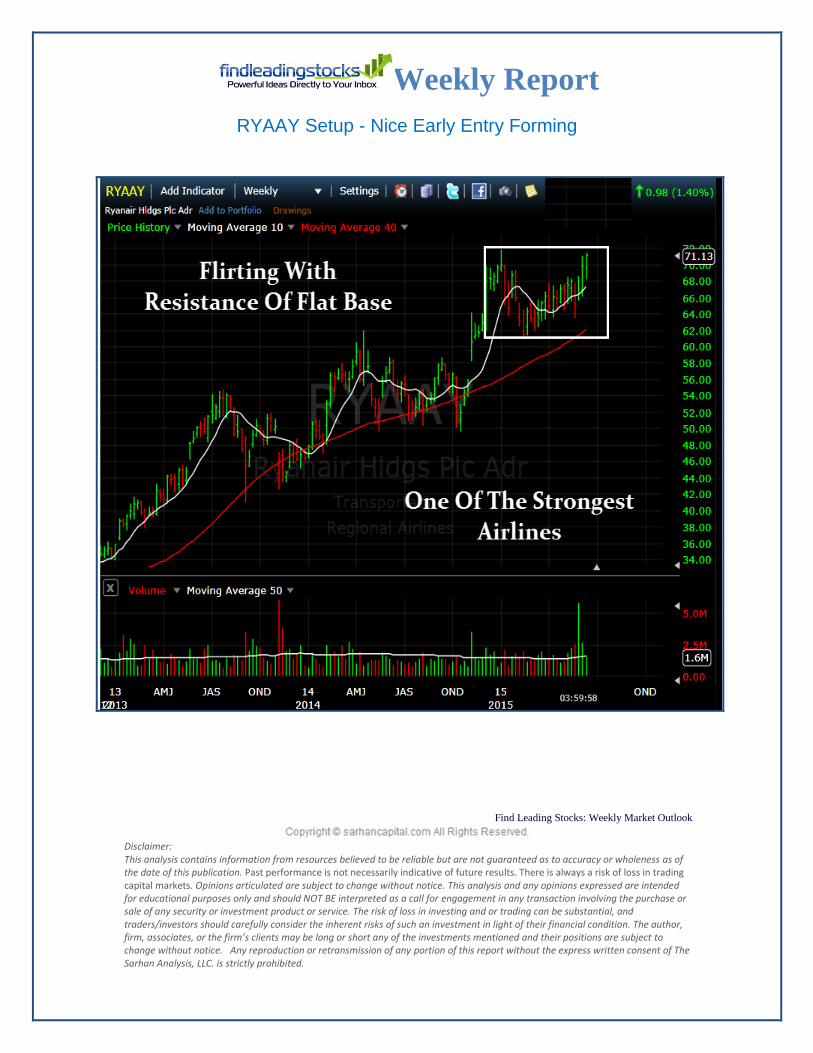
RYAAY Setup - Nice Early Entry Forming

Weekly Report
Find Leading Stocks: Weekly Market Outlook
Disclaimer: This analysis contains information from resources believed to be reliable but are not guaranteed as to accuracy or wholeness as of the date of this publication. Past performance is not necessarily indicative of future results. There is always a risk of loss in trading capital markets. Opinions articulated are subject to change without notice. This analysis and any opinions expressed are intended for educational purposes only and should NOT BE interpreted as a call for engagement in any transaction involving the purchase or sale of any security or investment product or service. The risk of loss in investing and or trading can be substantial, and traders/investors should carefully consider the inherent risks of such an investment in light of their financial condition. The author, firm, associates, or the firm’s clients may be long or short any of the investments mentioned and their positions are subject to change without notice. Any reproduction or retransmission of any portion of this report without the express written consent of The Sarhan Analysis, LLC. is strictly prohibited.
BYD: Big Base Breakout...First Gaming Stock To Breakout
Weekly Report
Find Leading Stocks: Weekly Market Outlook
Disclaimer: This analysis contains information from resources believed to be reliable but are not guaranteed as to accuracy or wholeness as of the date of this publication. Past performance is not necessarily indicative of future results. There is always a risk of loss in trading capital markets. Opinions articulated are subject to change without notice. This analysis and any opinions expressed are intended for educational purposes only and should NOT BE interpreted as a call for engagement in any transaction involving the purchase or sale of any security or investment product or service. The risk of loss in investing and or trading can be substantial, and traders/investors should carefully consider the inherent risks of such an investment in light of their financial condition. The author, firm, associates, or the firm’s clients may be long or short any of the investments mentioned and their positions are subject to change without notice. Any reproduction or retransmission of any portion of this report without the express written consent of The Sarhan Analysis, LLC. is strictly prohibited.
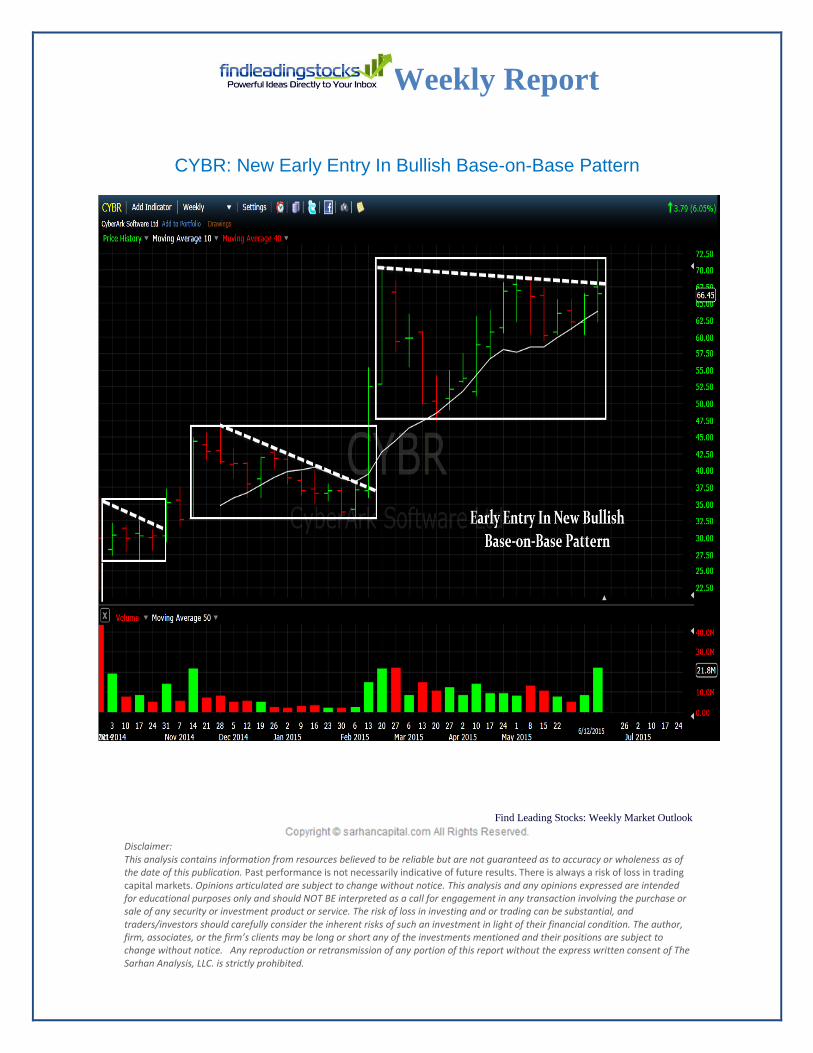
CYBR: New Early Entry In Bullish Base-on-Base Pattern
Weekly Report
Find Leading Stocks: Weekly Market Outlook
Disclaimer: This analysis contains information from resources believed to be reliable but are not guaranteed as to accuracy or wholeness as of the date of this publication. Past performance is not necessarily indicative of future results. There is always a risk of loss in trading capital markets. Opinions articulated are subject to change without notice. This analysis and any opinions expressed are intended for educational purposes only and should NOT BE interpreted as a call for engagement in any transaction involving the purchase or sale of any security or investment product or service. The risk of loss in investing and or trading can be substantial, and traders/investors should carefully consider the inherent risks of such an investment in light of their financial condition. The author, firm, associates, or the firm’s clients may be long or short any of the investments mentioned and their positions are subject to change without notice. Any reproduction or retransmission of any portion of this report without the express written consent of The Sarhan Analysis, LLC. is strictly prohibited.
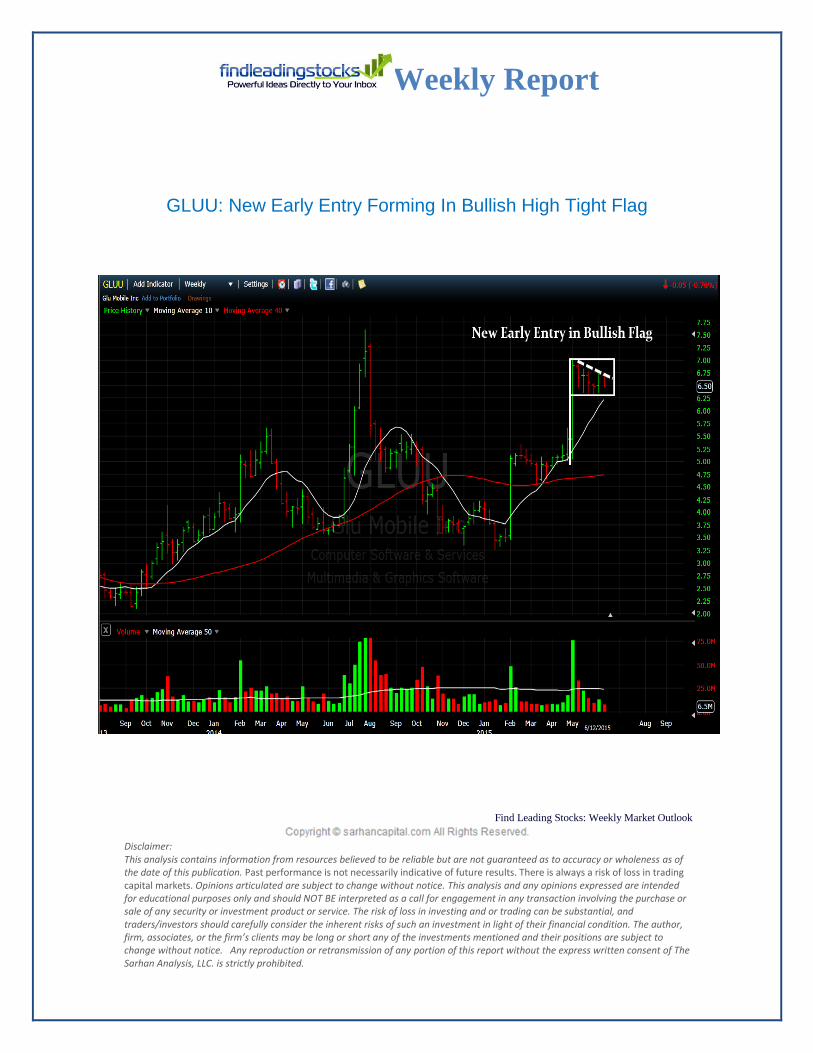
GLUU: New Early Entry Forming In Bullish High Tight Flag
Weekly Report
Find Leading Stocks: Weekly Market Outlook
Disclaimer: This analysis contains information from resources believed to be reliable but are not guaranteed as to accuracy or wholeness as of the date of this publication. Past performance is not necessarily indicative of future results. There is always a risk of loss in trading capital markets. Opinions articulated are subject to change without notice. This analysis and any opinions expressed are intended for educational purposes only and should NOT BE interpreted as a call for engagement in any transaction involving the purchase or sale of any security or investment product or service. The risk of loss in investing and or trading can be substantial, and traders/investors should carefully consider the inherent risks of such an investment in light of their financial condition. The author, firm, associates, or the firm’s clients may be long or short any of the investments mentioned and their positions are subject to change without notice. Any reproduction or retransmission of any portion of this report without the express written consent of The Sarhan Analysis, LLC. is strictly prohibited.
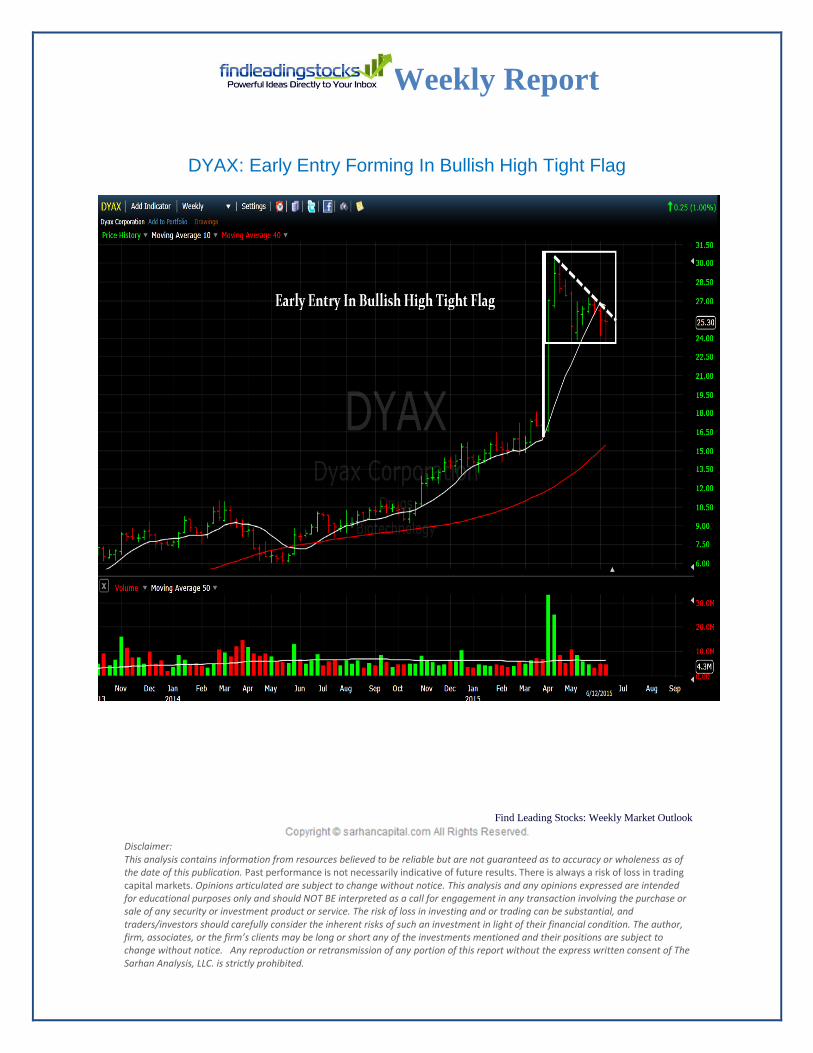
DYAX: Early Entry Forming In Bullish High Tight Flag

Weekly Report
Find Leading Stocks: Weekly Market Outlook
Disclaimer: This analysis contains information from resources believed to be reliable but are not guaranteed as to accuracy or wholeness as of the date of this publication. Past performance is not necessarily indicative of future results. There is always a risk of loss in trading capital markets. Opinions articulated are subject to change without notice. This analysis and any opinions expressed are intended for educational purposes only and should NOT BE interpreted as a call for engagement in any transaction involving the purchase or sale of any security or investment product or service. The risk of loss in investing and or trading can be substantial, and traders/investors should carefully consider the inherent risks of such an investment in light of their financial condition. The author, firm, associates, or the firm’s clients may be long or short any of the investments mentioned and their positions are subject to change without notice. Any reproduction or retransmission of any portion of this report without the express written consent of The Sarhan Analysis, LLC. is strictly prohibited.
Strong Sectors
Strong Groups
Weekly Report
Find Leading Stocks: Weekly Market Outlook
Disclaimer: This analysis contains information from resources believed to be reliable but are not guaranteed as to accuracy or wholeness as of the date of this publication. Past performance is not necessarily indicative of future results. There is always a risk of loss in trading capital markets. Opinions articulated are subject to change without notice. This analysis and any opinions expressed are intended for educational purposes only and should NOT BE interpreted as a call for engagement in any transaction involving the purchase or sale of any security or investment product or service. The risk of loss in investing and or trading can be substantial, and traders/investors should carefully consider the inherent risks of such an investment in light of their financial condition. The author, firm, associates, or the firm’s clients may be long or short any of the investments mentioned and their positions are subject to change without notice. Any reproduction or retransmission of any portion of this report without the express written consent of The Sarhan Analysis, LLC. is strictly prohibited.
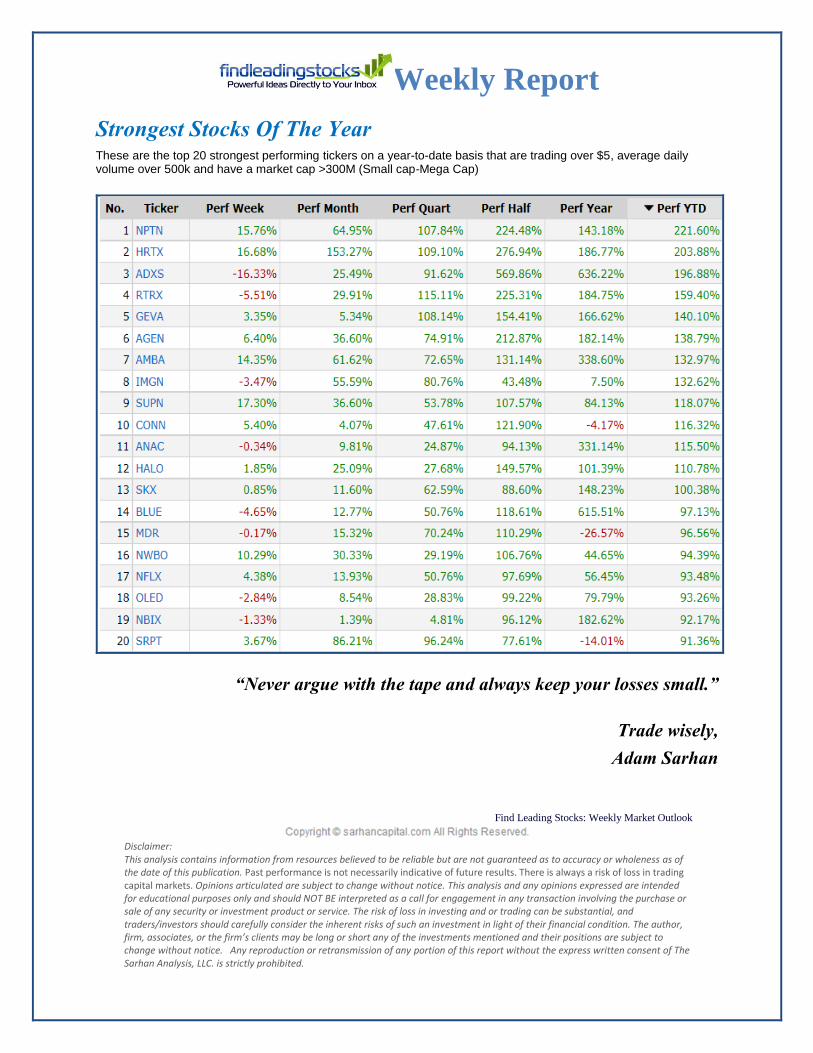
Strongest Stocks Of The Year
These are the top 20 strongest performing tickers on a year-to-date basis that are trading over $5, average daily volume over 500k and have a market cap >300M (Small cap-Mega Cap)
“Never argue with the tape and always keep your losses small.”
Trade wisely,
Adam Sarhan

Weekly Report
Find Leading Stocks: Weekly Market Outlook
Disclaimer: This analysis contains information from resources believed to be reliable but are not guaranteed as to accuracy or wholeness as of the date of this publication. Past performance is not necessarily indicative of future results. There is always a risk of loss in trading capital markets. Opinions articulated are subject to change without notice. This analysis and any opinions expressed are intended for educational purposes only and should NOT BE interpreted as a call for engagement in any transaction involving the purchase or sale of any security or investment product or service. The risk of loss in investing and or trading can be substantial, and traders/investors should carefully consider the inherent risks of such an investment in light of their financial condition. The author, firm, associates, or the firm’s clients may be long or short any of the investments mentioned and their positions are subject to change without notice. Any reproduction or retransmission of any portion of this report without the express written consent of The Sarhan Analysis, LLC. is strictly prohibited.
FLS Approach:
Rules-Based Discretionary Approach
The actionable items for the week are at the very top of this report. The rest of the report is available for those of you who want more information, new ideas, trade setups, and a deeper analysis on the market.
Please know that FLS employs a rules-based discretionary approach to trading/investing in capital markets. FLS employs a tactical long/short intermediate term trading strategy. FLS views
trading/investing as an art, not an exact science.
Capture The Bulk Of The Move, Not The Top or Bottom
FLS strives to capture the bulk of the move in bull and bear markets, not pick an exact top or bottom. That is why FLS does not use the same rules and/or definitions (for patterns, entry/exits, pyramiding etc) as
other people and instead looks for the essence of the concept/pattern. FLS has conducted its own private study of every major prior market and economic cycle (economic cycles go back to the 3rd century & are available on the Market History tab on FindLeadingStocks.com). This process has led FLS to develop its own proprietary trading/investing strategy (D.A.M.P- available on the Strategy page) to navigate capital
markets for you each week in real-time.
Advanced Entry/Exit Points & Type of Orders
Two critical points of difference: FLS uses advanced entry/exit points to enter/exit ahead of the crowd and always looks to define/reduce its risk in the market. Before a trade is entered, the service will tell you
the exact entry and exit price before the market opens each week. All the FLS orders (buy and sell) are entered as GTC stop orders that remain open and are resting at all times. Once the first order is entered
the protective GTC exit begins working and is also resting at all times. This is the best way that allows for full transparency and accountability with our members. In addition, throughout the report there are
several more trade ideas & setups that readers can use (if they want more ideas). The dotted line (advanced entry point) is designed to provide an earlier entry point (ahead of the crowd). Typically, the crowd is only buying on a traditional breakout (classic) pivot/buy point. Each person is free to use the
ideas anyway they like. One buy, two/three buys (pyramid), or wait for the classic entry point.
Position Sizing & Risk Management
Typically, the maximum risk is 1% of a portfolio on any one idea from entry to exit. Alternatively, you can use the 10% rule. Meaning, you divide your portfolio into 10 tranches and every time you buy a stock you buy with 10% of your capital and place a stop 10% below your entry price. This way, if wrong, you will still
lose 1% of your overall portfolio per idea. Protective stops are always advertised in advance and only tightened, never widened. In uptrends, FLS prefers buying in a base (near support, downward trendline,
or classic breakout) not only above resistance. This approach helps you get in ahead of the crowd, buy leaders on weakness, not just on strength, and allows for fewer stop outs. If at any time you have any
additional questions, please send us an email.
Weekly Report
Find Leading Stocks: Weekly Market Outlook
Disclaimer: This analysis contains information from resources believed to be reliable but are not guaranteed as to accuracy or wholeness as of the date of this publication. Past performance is not necessarily indicative of future results. There is always a risk of loss in trading capital markets. Opinions articulated are subject to change without notice. This analysis and any opinions expressed are intended for educational purposes only and should NOT BE interpreted as a call for engagement in any transaction involving the purchase or sale of any security or investment product or service. The risk of loss in investing and or trading can be substantial, and traders/investors should carefully consider the inherent risks of such an investment in light of their financial condition. The author, firm, associates, or the firm’s clients may be long or short any of the investments mentioned and their positions are subject to change without notice. Any reproduction or retransmission of any portion of this report without the express written consent of The Sarhan Analysis, LLC. is strictly prohibited.
Our Job & General Info
Our job is to provide our members with a steady flow of good ideas in all market environments. We know that we work for you and that is why we do our best to go above and beyond - all time. You are free to use
the ideas anyway you like and discard the ones that do not appeal to you. Keep in mind that investing and trading involves risk. The value of your investment will fluctuate over time and you may gain or lose
money. Since each person has different objectives, time-frames, goals, etc, please note that everything we provide is for informational, educational and/or illustrative purposes only and we DO NOT provide
specific advice of any sort (investing, trading, tax, etc). Please read our disclaimer below and on our website for more. Charts are courtesy of FreeStockCharts.com, ThinkorSwim, and StockCharts.com. If
you haven't already done so, please watch our free educational webinars by visiting FindLeadingStocks.com- then click on the Webinars page.
A Closer Look At Reversals:
Positive/Negative Reversals A negative reversal occurs when an underlying investment (market, stock, currency, bond, commodity,
ETF, etc) opens higher and turns/closes lower in the same bar- on any time frame (daily, weekly, monthly, etc basis). This action typically suggests downward price action will follow. The basic concept is that the current bar you are looking at opened higher and closed lower. A positive reversal is the exact opposite
(occurs when the underlying investment opens lower and turns/closes higher- and has bullish ramifications).
Upward/Downward Outside Reversals
An outside reversal occurs when the highs and lows of the current bar (any time frame you choose) are higher and lower than the previous bar (same time frame). Typically, the outside reversal is more
meaningful than a normal reversal and the same applies (upward outside reversals tend to be bullish while a downward outside reversals are bearish).
Refer A Friend:
If you like our service, please help spread the word by telling your friends and colleagues. Word of mouth (from happy members like you) is one of the best
compliments we can receive.