bharti airtel limited - s3-ap-southeast-1. · pdf filethe information shall not be distributed...
TRANSCRIPT

Investor Presentation
Bharti airtel limitedFebruary 2012

Disclaimer
The information contained in this presentation is only current as of its date. All actions and statements made herein or otherwise shall be subject to theapplicable laws and regulations as amended from time to time. There is no representation that all information relating to the context has been takencare off in the presentation and neither we undertake any obligation as to the regular updating of the information as a result of new information, futureevents or otherwise. We will accept no liability whatsoever for any loss arising directly or indirectly from the use of, reliance of any informationcontained in this presentation or for any omission of the information. The information shall not be distributed or used by any person or entity in anyjurisdiction or countries were such distribution or use would be contrary to the applicable laws or Regulations. It is advised that prior to acting upon thispresentation independent consultation / advise may be obtained and necessary due diligence, investigation etc may be done at your end. You mayalso contact us directly for any questions or clarifications at our end.
This presentation contain certain statements of future expectations and other forward-looking statements, including those relating to our generalbusiness plans and strategy, our future financial condition and growth prospects, and future developments in our industry and our competitive andregulatory environment In addition to statements which are forward looking by reason of context the words ‘may will should expects plans intendsregulatory environment. In addition to statements which are forward looking by reason of context, the words may, will, should, expects, plans, intends,anticipates, believes, estimates, predicts, potential or continue’ and similar expressions identify forward looking statements.
Actual results, performances or events may differ materially from these forward-looking statements including the plans, objectives, expectations,estimates and intentions expressed in forward looking statements due to a number of factors, including without limitation future changes ordevelopments in our business, our competitive environment, telecommunications technology and application, and political, economic, legal and socialconditions in India. It is cautioned that the foregoing list is not exhaustiveg g
“The information contained herein does not constitute an offer of securities for sale in the United States. Securities may not be sold inthe United States absent registration or an exemption from registration under the U S Securities Act of 1933 as amended Any publicthe United States absent registration or an exemption from registration under the U.S. Securities Act of 1933, as amended. Any publicoffering of securities to be made in the United States will be made by means of a prospectus and will contain detailed information aboutthe Company and its management, as well as financial statements. No money, securities or other consideration is being solicited, and,if sent in response to the information contained herein, will not be accepted.”
Investor Relations :- http://www.airtel.inFor any queries, write to: [email protected]

The Company...Bharti airtel – An Integrated Telco
Wireless Services2G
Enterprise ServicesCarriers
3GRural Market
Corporates
Passive Infrastructure Services
Telemedia ServicesFixed LineB db d
InfratelIndus
DTHBroadbandIPTV
DTHPay per view / HDInteractive Services including
GamingGaming
Fully integrated telecom player offering end to end solutions and entering new geographiesand entering new geographies

The Company…Bharti airtel
No. of circles (India) Today Countries1 5 15 22 19
‘
1996 2001 2003 2004 2010
Fully integrated telecom player offering end to end solutions and entering new geographies

Growth trajectory reflected in the numbers
Single Circle Operator Company Profile Largest integrated private telecom
1996 2011Single Circle Operator Company Profile Largest integrated private telecom
operator
< 25k Customers ~ 221 mn
USD 17 mn R USD 13 b~ USD 17 mn Revenue ~ USD 13 bn
~ USD 2.5 mn EBITDA ~ USD 4 bn
~ USD 1.4 mn Cash Profit ~ USD 4 bn
~ USD 16 mn Market Capitalization ~ USD 30 bn
Continuing on our journey of Value Creation
Note: 1) 2011 financials are as per FY 2011 results. 2) Exchange rate: Financials as of 31st Mar 11 : Rs 44.65

Financials & Positioning
Positioning in the world & in India3rd LARGEST in country wireless operator in the
Key financial metrics
FY 11 (in Mn)
Customers 220.9
3rd LARGEST in ‐country wireless operator in the
world (1)
LARGEST private INTEGRATED telecom company in Revenue $ 13,319
EBITDA $ 4,472
Cash Profit $ 3 983
India
5th LARGEST Mobile telecom operator in the world
Cash Profit $ 3,983
Net Income $ 1,354
EBITDA Margin (%) 34.6
Amongst the largest providers of Passive
infrastructure (by towers) (2)
ROCE (%) 10.8
Note: FY11 numbers are as per IFRS as per March11 quarterly report. Exchange rate for Re to $ conversion: 44.65. (1) 3rd largest wireless operator in the world refers to in‐country (single country) operator based on the number of subscribers. 5th largest mobile operator on basis of number of subscribers.(2) Through its subsidiary Bharti Infratel & Indus Towers in which Bharti Infratel owns 42% stake.

Latest Results – 2Q’12
Key operating and financial metrics Continued Strong Performance
Q3 FY 12* Y‐on‐Y
Customers 243.3 mn 17%
Wireless CMS 19.7%
Wireless RMS 30.0%
Total MOU carried in Qtr 253 bnRevenue $ 3,649 mn 17%
EBITDA $ 1,177 mn 19%
Total MOU carried in Qtr 253 bn
Balance sheet strength:
Assets $ 31.9 bn
Cash Profit $ 1,021 mn 21%
Net Income $ 200 mn ‐22%
Net debt $ 12.7 bn
Net debt to EBITDA 2.6 Times
(annualized)EBITDA Margin 32.2%
ROCE 7.3%
Continues to be FCF positive on at South Asia
Level.
•Includes full quarter numbers for Africa• (a) Closing Exchange rate as of 31sr Dec 2011: 53.27 . (b) Average Exchange rate as on 31sr Dec 2011 : 50.63 •**RMS as per Sept quarter released by TRAI (IIFL report dated 24th Nov’11)

Performance dashboard - 3 line graph
184,767 70.8%69.9% 68.6%
70 0%
80.0%
180 000
190,000
157 721162,930 169,749
172,698
71.2% 70.9%
60.0%
70.0%
170,000
180,000
157,721
46.9%44.8% 44.6% 44.5% 45.4%
40.0%
50.0%
150,000
160,000
30.0%140,000
Q3
FY11
Q4
FY11
Q1
FY12
Q2
FY12
Q3
FY12
Productivity Indicators = growing revenues + cost efficiencies + capital productivity
Total Revenue (Rs mn) LHS Opex to Total Rev (RHS) Capex Productivity (RHS)
The above chart is for Airtel Consolidated including Africa

Wireless Services
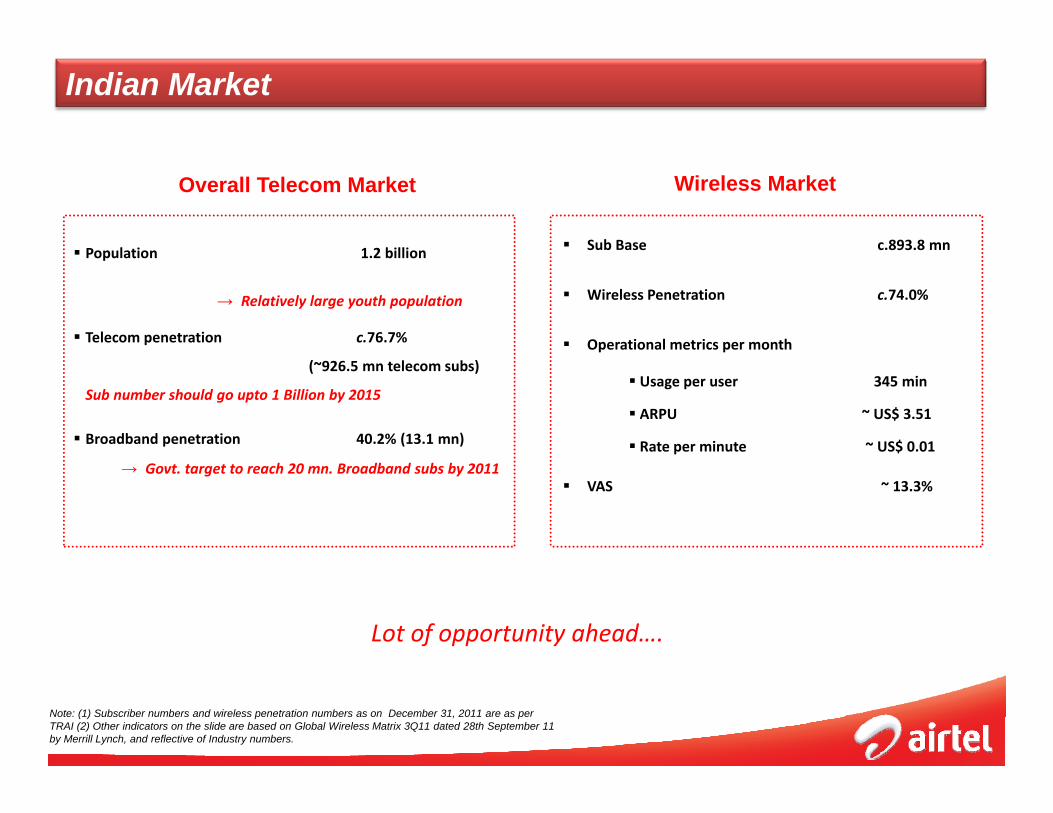
Indian Market
Overall Telecom Market Wireless Market
Population 1 2 billion Sub Base c.893.8 mn Population 1.2 billion
→ Relatively large youth population
Telecom penetration c.76.7%
Wireless Penetration c.74.0%
Operational metrics per month(~926.5 mn telecom subs)
Sub number should go upto 1 Billion by 2015
Broadband penetration 40.2% (13.1 mn)
Usage per user 345 min
ARPU ~ US$ 3.51
Rate per minute ~ US$ 0.01→ Govt. target to reach 20 mn. Broadband subs by 2011
VAS ~ 13.3%
Lot of opportunity ahead….
Note: (1) Subscriber numbers and wireless penetration numbers as on December 31, 2011 are as per TRAI (2) Other indicators on the slide are based on Global Wireless Matrix 3Q11 dated 28th September 11 by Merrill Lynch, and reflective of Industry numbers.
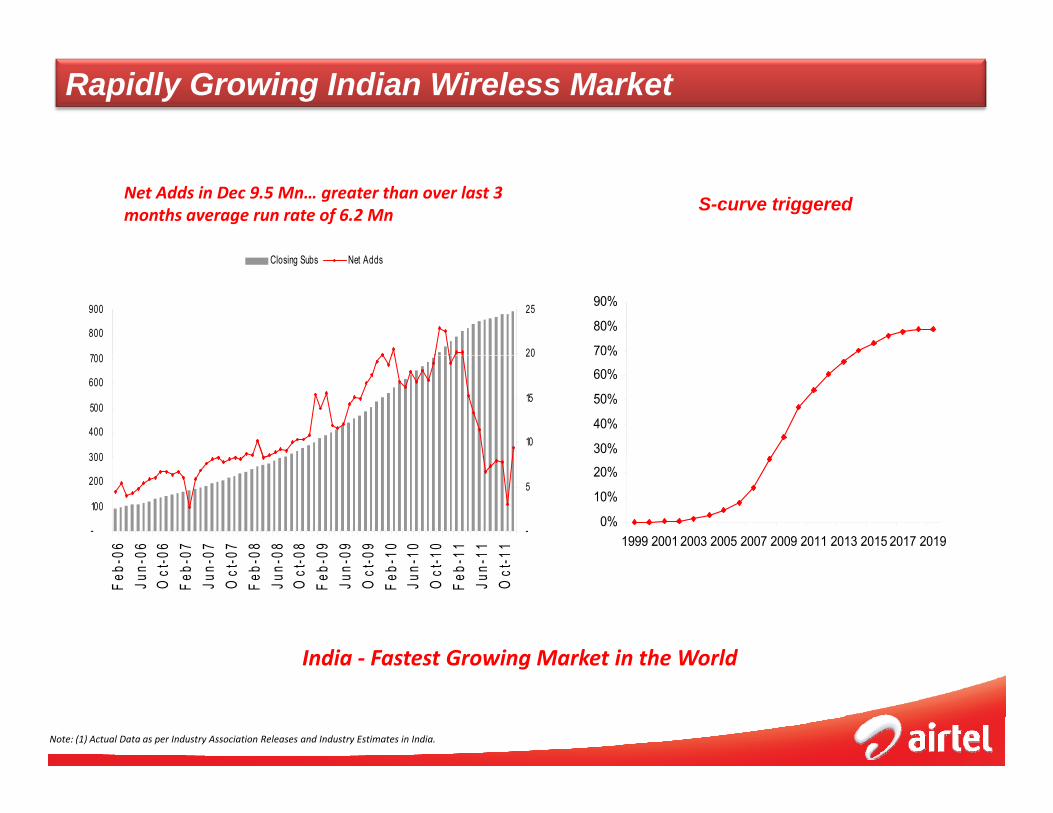
Rapidly Growing Indian Wireless Market
Net Adds in Dec 9.5 Mn… greater than over last 3months average run rate of 6.2 Mn S-curve triggered
70%
80%
90%
700
800
900
20
25
Closing Subs Net Adds
30%
40%
50%
60%
%
300
400
500
600
700
10
15
20
0%
10%
20%
1999 2001 2003 2005 2007 2009 2011 2013 2015 2017 2019-
100
200
300
-06
-06
-06
-07
-07
-07
-08
-08
-08
-09
-09
-09
-10
-10
-10
-11
-11
-11
-
5
India ‐ Fastest Growing Market in the World
Feb-
Jun-
Oct
-Fe
b-Ju
n-O
ct-
Feb-
Jun-
Oct
-Fe
b-Ju
n-O
ct-
Feb-
Jun-
Oct
-Fe
b-Ju
n-O
ct-
India Fastest Growing Market in the World
Note: (1) Actual Data as per Industry Association Releases and Industry Estimates in India.

Wireless Market Structure in India
Subscriber Trends Customer Market Share – CMS (%)
176
150152180
200
19.7%20.3%21%
23%
25%
150 148
102 106
83
128
152
126 124
9282 84 92
60
80
100
120
140160
(mn)
11.5%
9 3%
19.7%
16.8% 16.5%
11.9%
14.3%
16.7%16.5%
12.2%
10.9% 11.2%12.2%
11%
13%
15%
17%
19%
23 24 2310
2536
-
20
4060
Airte
l
elia
nce
dafo
ne
L+M
TNL
Idea
Tata
Oth
ers
9.3%
5%
7%
9%
Airte
l
Rel
ianc
e
dafo
ne
L+M
TNL
Idea
Tata
Oth
ers
• Ai l i l lid i i k l d hi i i d i i i i
R Vod
BSN
L
Dec-11D 10
R Vo
BSN
L
CMS(Dec'11) CMS(Dec'10)
• Airtel continuously consolidating its market leadership position despite intense competition• Airtel current monthly net adds at 0.96 million vs. 3.1 million a year ago• Airtel ranks 1& 2 in 16 circles in terms of number of subscribers• Over 65% of net adds coming from B&C circles (rural India)
Airtel Continues to lead on Revenue Market Share
Note: Based on subscriber data for India as on December31 2011 as per TRAI press release.

Airtel…Performance Indicators (Operational)
Customers & Market Share Prepaid/PostpaidCustomers & Market Share Prepaid/Postpaid
98.2% 98.1% 97.3%
93.7%96.2%
94%
98%
102%
20.3% 20.0% 19.9% 19.8% 19.8%
120
180
18%
22%
96.2% 96.3% 96.3% 96.3% 96.3%
78%
82%
86%
90%
152.5 162.2 169.2 172.8 175.7
0
60
6%
10%
14%
ARPU & RPM MoU/Sub/Month & MON
Q311 Q411 Q112 Q212 Q312
Prepaid Subs Prepaid Net Adds
0Q311 Q411 Q112 Q212 Q312
6%
Customers (mn) CM S (%)
198 194 190 183 187
40
50
60
200
250
300449 449 445 423 419
205,018
218,190 228,331 242,683
227,115440
450
200,000
250,000
44.19 43.13 42.76 43.18 44.56
-
10
20
30
Q311 Q411 Q112 Q212 Q3120
50
100
150
400
410
420
430
Q311 Q411 Q112 Q212 Q3120
50,000
100,000
150,000
RPM (Paise) ARPU (INR)
M oU/Sub (M in) Total minutes on Network (M n M in)
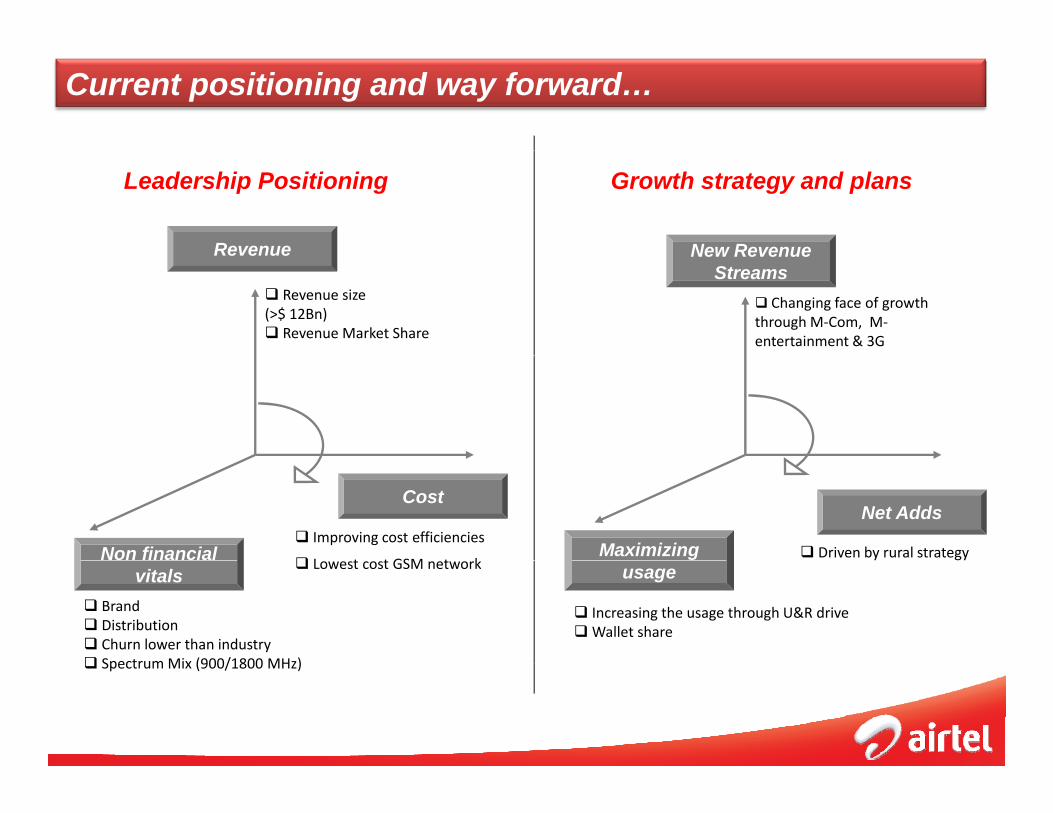
Current positioning and way forward…
Leadership Positioning Growth strategy and plans
RevenueRevenue New RevenueRevenueRevenue New Revenue Streams
Revenue size (>$ 12Bn)
Revenue Market Share
Changing face of growth through M‐Com, M‐entertainment & 3G
Cost
Non financial Maximizing
Net AddsImproving cost efficiencies
L t t GSM t kDriven by rural strategy
vitals usage
BrandDistribution Churn lower than industrySpectrumMix (900/1800 MHz)
Lowest cost GSM network
Increasing the usage through U&R driveWallet share
Spectrum Mix (900/1800 MHz)

Telemedia Services

A Snapshot
Largest private operator having presence in the voice , broadband , IPTV and data.
Focus on SMB segment & Broadband at Homes
Key Performance Indicators
1. Voice (wire‐line) and Data (DSL) Presence in 87 top cities of India.
2. Target Segment : Retail and Small and Medium Enterprises.
3. Customer base: 3.3 million (end Dec 2011)
4. Broadband (DSL with speeds>256 kbps) penetration at 40.2% of customer base.
5. Average ARPU for Quarter ended Dec’11 $ 18.1 per month.
6. Segment contributing to 7% of overall revenues of the company.
7 EBITDA i f 38 8%7. EBITDA margin of over 38.8%.
Broadband revolution to follow wireless revolution in India
SMB opportunity across ICT stream
E i S iEnterprise Services

A Snapshot
Enterprise Services provides a broad portfolio of services to large Enterprise and Carrier customers
Corporates: Single point of contact for all telecommunication needs for Top 2500 corporate customers,
providing full suite of voice, data, and managed communications solutions p g f f g
Carriers: Wholesale voice and data services to over 130 domestic and 450 international
telecommunications carriers, as well as ILD and NLD carriage for Airtel’s own customers
E t i ti l d i t ti l i f t tExtensive national and international infrastructure
Pan‐India network with 154,744 Route kms of optical fiber, over 4,150 MPLS and SDH POPs
Access network (terrestrial) in 87 cities, Wimax network in 143 cities, and over 1,500 local POIs
International network with 225,000 Route Kms, connecting over 50 countries and 5 Continents.
Key Performance Indicators (Q3‘12)
NLD Minutes Carried: 20.6 Billion ; ILD Minutes Carried: 3.5 Billion
Revenue: Rs.11,881 Million (9% Segment Contribution Share)
EBITDA: Rs. 2,008 Million (16.9% EBITA Margin) IT A: Rs. ,008 Million ( 6.9% ITA Margin)
Emerging Growth EnginesEmerging Growth Engines
Passive InfraAfricaAfrica
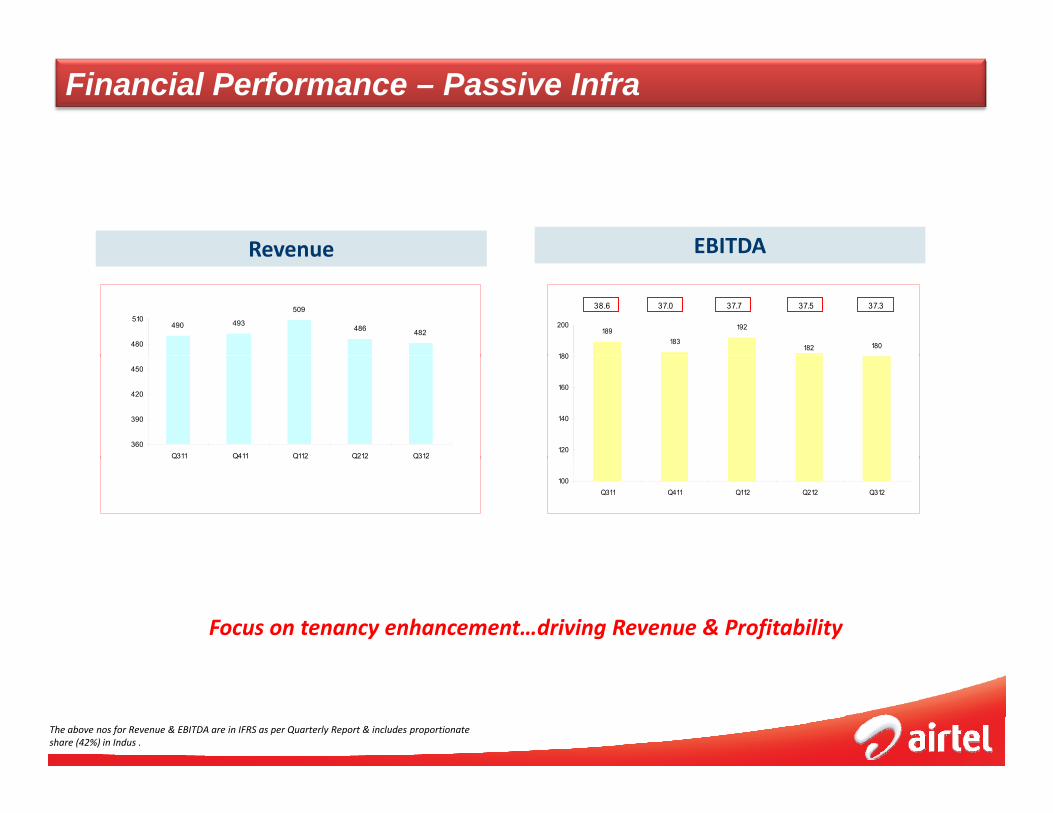
Financial Performance – Passive Infra
Revenue EBITDARevenue EBITDA
490 493
509
486 482480
510
180182
192
183189
180
200
38.6 37.0 37.7 37.5 37.3
360
390
420
450
Q311 Q411 Q112 Q212 Q312120
140
160
180
Q311 Q411 Q112 Q212 Q312
100Q311 Q411 Q112 Q212 Q312
Focus on tenancy enhancement…driving Revenue & Profitability
The above nos for Revenue & EBITDA are in IFRS as per Quarterly Report & includes proportionate share (42%) in Indus .

Operational Performance – Passive Infra
Infratel Indus
Towers (nos) & Sharing Factor Towers (nos) & Sharing Factor
34,000 1.901.911.891.871.83
1.80109,000 2.00
33,20333,05632,94232,79232,424
1.811.791.77
1.731.68
32 000
33,000
1 40
1.50
1.60
1.70
1.80
109,101108,998108,922108,586107,789
97 000
99,000
101,000
103,000
105,000
107,000
1 20
1.30
1.40
1.50
1.60
1.70
1.80
1.90
Sharing Revenue per Sharing Operator per Month (Rs) Sharing Revenue per Sharing Operator per Month (Rs)
32,000Q311 Q411 Q112 Q212 Q312
1.40
No of t owers Shar ing Fact or
97,000Q311 Q411 Q112 Q212 Q312
1.20
No of t owers Sharing Fact or
30,847 30,50131963
3111232,272
25,000
30,000
35,00037,859
36,599 36203 37,11737,623
33,000
37,000
41,000
15,000
20,000
Q311 Q411 Q112 Q212 Q312
Sharing Revenue per Sharing Operat or per mont h
25,000
29,000
Q311 Q411 Q112 Q212 Q312
Sharing Revenue per Sharing Operat or per mont h
Aims to enhance the tenancy ratio & be the preferred choice of vendor for all existing and new operators

Transaction Rationale
Shareholding and Management Control
Brand – ‘Airtel’
100% Cash Transaction
Focus on CoreMiddle EastGlobal
Clean / certaintyof transaction
Brand Airtel Middle East Operators
Global Stature
Emerging Market Characteristics
St Pl tf
ManageableDeal Size
Strong Platformfor Future Expansion
Low Competitive Intensity
Diversification of India Risk
Avoid Greenfield
Speed inTransaction
Repayment of Debt
Significant Synergies
Avoid Greenfield Debt
The transaction meets the objectives of Airtel with long term strategic benefits and creates tremendous shareholder value

Differences between the two markets
Mobile Penetration 40%77%
India Africa(1)
Average Number of Competitors 3‐510‐12
Business Model
Minutes of Usage
Low usage, high pricing model
~125
High usage, low pricing model
~419Minutes of Usage
ARPU (US$)
125
~$7.1
419
~$3.7
ARPM (US cents ¢) 5.7¢0.9¢
A d th f h t itAnd therefore huge opportunity space
Source: Global Insight, annual / quarterly reports.1. Data pertaining to the 16African countries where Zain Africa has operations.

Another Growth Engine - Africa
Customer Base : 50.9 Mn
Performance Indicators (CY 2011):
Revenue: $ 2,878 Mn
EBITDA: $ 6,30 Mn
Prepaid Base: 99.3%
→one of the highest in the→one of the highest in the world
Usage per sub per month: 125 Minutes
→one of the lowest o e of e o es
ARPU: ~ US$ 7.1
Rate per minute: ~ US¢ 5.7
→ one of the highest
VAS: ~ 8.0%
→One of the lowest
Note: Above numbers based on Quarterly report ended 31 Dec ,2011.

Recent Honors

Bharti airtel – Leadership in business Recent HonoursEconomic Times Telecom Awards 2011
Innovative Product Value Added Service
Customer Experience Enhancement
Frost & Sullivan 2011 Asia Pacific ICT Awards
Enterprise Telecom Service Provider of the Year
Wholesale Data Service Provider of the year
Mobile VAS Provider of the Year
India’s Most Innovative company ‐Wall Street Journal
Telecom Operator award 2011 ‐Won in 5 categories.
Most Admired companyBest VAS provider
Best National Mobile operator
Operator with Rural performanceBest Enterprise services
DSCI Excellence Award 2011 for Security in Telecom‐ ‘Security Leader of the Year'
Bharti Airtel rated as India’s Best Enterprise Connectivity Provider‐ Users choice award Instituted by PC Quest
Sunil Bharti Mittal : – Global Game changer at Economic Times Telecom Awards 2011
– Global Telecom Leader ‐ Voice & Data magazine
Akhil Gupta, Deputy Group CEO and MD ‐ CFO India Hall of Fame by CFO India
Manoj Kohli, CEO( International) & Joint MD ‐ Telecom Man of the year ‐ Tele.net
Star News Brand Excellence Award in the Telecom Sector 2011

thank youthank you