beverley sparks cooperative research centre for sustainable … · 2018-10-29 · beverley sparks...
TRANSCRIPT
Beverley Sparks
VISITOR SATISFACTION SURVEY ON THE GOLD COAST
Gold Coast Tourism Visioning Project 2.3
The Gold Coast Tourism Visioning project articulates a set of core values and principles that underpin a
preferred future for the sustainable prosperity of Australia’s leading tourism destination in the medium to
longer term (10 to 20 years). It challenges destination Gold Coast to move from a past ad hoc approach to
tourism to one that integrates economic, social and environmental dimensions to evolve new patterns of
managing and growing tourism in a more systematic and dynamic way in this new century. Tourism is a key
component of the inevitable transition to sustainable development strategies in advanced western
democracies such as Australia.
Through this Gold Coast Tourism Visioning project, the local tourism industry has an opportunity to confirm
itself as part of the solution, rather than as a contributor, to the economic, social and environmental challenges
of the future.
With the assistance and support of numerous public and private sector organisations and individuals, a team
of interdisciplinary researchers built the knowledge foundation for the leading-edge Gold Coast Tourism
Visioning Project. The project has created a more strategic perspective towards tourism policy, planning,
development and marketing involving the process of visioning – a technique combining the setting of a ‘vision’
and ‘planning’.
It had its origins in the late 1990s, when a number of Gold Coast tourism’s key stakeholders recognised that
the relationships between business, government and community, which had enabled the Gold Coast to flourish
in the past, were changing and the destination was confronted by a new range of challenges. Many of these
challenges are shared with maturing destinations the world over.
The tourism visioning project has provided a vehicle for advocating long-term change in the overall approach
to tourism by all stakeholders concerned with the creation of a sustainable, prosperous tourism industry for
the Gold Coast. Cooperation and collaboration at all levels between various stakeholder groups must override
fragmentation, confrontation, internal competition and a lack of an agreed common long-term focus. A new
vision for tourism is required in what has been – and can continue to be – Australia’s most successful tourism
destination.
If the Gold Coast is to continue to provide us and our visitors with the lifestyle experience
for which we are known, then we must aim high, plan long and settle for nothing but
sustainable excellence in all facets of OUR GOLD COAST.
The vision is in our hands, but can we see it?
Grant. R. Bowie, Chair, Gold Coast Tourism Bureau, 2002
Common Ground Publishingwww.CommonGroundPublishing.com
The Gold Coast Tourism Visioning ProjectCooperative Research Centre for Sustainable Tourism
CRC cover 2.3_V02 3/7/02 3:44 PM Page 1


Visitor Satisfaction Surveyon the Gold Coast
ACKNOWLEDGEMENTSThe author wishes to acknowledge the contribution of a range of people and organisations that assisted with thisreport.
Reference group working party for the service quality audit project The author acknowledges the valuable
contributions made by the reference group for the project:� Mr Steven Noakes (CRC for Sustainable Tourism)
� Mr Bob Brett (General Manager, Gold Coast Tourism Bureau)� Ms Belinda Thompson (Conrad Jupiters)
� Ms Fran William (Restaurant and Caters’ Association, GC)
� Mr Noel Scott (formerly Tourism Queensland)� Professor Bill Faulkner (Griffith University)
Research AssistantsThe author wishes to acknowledge all the research assistants who helped with this project. In particular, the assistance
of three individuals warrants a special mention:
� Ms Tess Collie, Senior Research Assistant, for her assistance in the questionnaire development phase� Ms Tracey Hunter, Research Assistant, for her assistance with the analysis and report compilation
� Ms Karen Rowe, Research Assistant, for her assistance with the questionnaire distribution process.
Donation of prizeA special thank you to Ms Jo Anne Smith, Australian Manager of Interval International Australia/New Zealand, who
contributed the first prize as an incentive to complete the questionnaire. This prize was for one week’saccommodation at an Interval International affiliate resort in Australia or New Zealand.
Distribution of questionnairesThe author would like to recognise the valuable contribution made by many accommodation properties (from hotel
and apartments through to caravan parks) for the distribution of questionnaires. Thanks also to staff at the Visitor
Information Centres who assisted with distributing questionnaires. In addition, the great work of our research datacollection officers who distributed questionnaires at Coolangatta Airport.
Finally, thank you to Mr Brian Gleeson, Adjunct Lecturer (Griffith University) for his assistance in the deliveryof questionnaires to accommodation properties and Visitor Information Centres.
Research Report Series
The primary aim of CRC Tourism's research report series is technology transfer. The reports are targetedtoward both industry and government users and tourism researchers. The content of this technical report series
primarily focuses on applications, but may also advance research methodology and tourism theory. The report
series titles relate to CRC Tourism's research program areas. All research reports are peer reviewed by atleast two external reviewers. For further information on the report series, access the CRC website
[www.crctourism.com.au].
Editors
Prof Chris Cooper University of Queensland Editor-in-ChiefProf Terry De Lacy CRC for Sustainable Tourism Chief Executive
Prof Leo Jago CRC for Sustainable Tourism Director of ResearchBrad Cox CRC for Sustainable Tourism Director of Publications
Trish O’Connor CRC for Sustainable Tourism Publications Manager

Visitor Satisfaction Surveyon the Gold Coast
Gold Coast Tourism Visioning Project 2.3
Beverley Sparks
This book is published at http://SustainableTourism.Publisher-Site.coma series imprint of theUniversityPress.com
First published in Australia in 2002
by Common Ground Publishing Pty Ltd
PO Box 463Altona Vic 3018
ABN 66 074 822 629
in association with
Cooperative Research Centre for Sustainable Tourism
http://www.crctourism.com.au
Copyright © CRC for Sustainable Tourism Pty Ltd, 2002
All rights reserved. Apart from fair dealing for the purposes of study, research,
criticism or review as permitted under the Copyright Act, no part of this book maybe reproduced by any process without written permission from the publisher. Any
enquiries should be directed to Brad Cox, Director of Publications or
Trish O’Connor, Publications Manager at [email protected].
National Library of Australia Cataloguing in Publication Data
Sparks, Beverley.
Visitor satisfaction survey on the Gold Coast.
Bibliography.
ISBN 1 87668 523 9 (pbk)
ISBN 1 86335 486 7 (PDF)
I. Tourism – Queensland – Gold Coast. I. Cooperative Research Centre for
Sustainable Tourism. II. Gold Coast Tourism Visioning Project. III. Title. (Series :Project report (Gold Coast Tourism Visioning Project) ; 2.3).
338.47919432
ContentsList of Figures and Tables ix
Executive Summary xv
1. Introduction 1
1.1 Aims 1
1.2 General Information Collected 1
1.3 Tourism Dimensions 2
1.4 Tourism Objects 3
1.5 Data Collection 4
1.5.1 Questionnaire 4
1.5.2 Sample 4
1.5.3 Data Collection Process 4
2. Results 7
2.1 Sample Description 7
2.1.1 Location of Accommodation 8
2.1.2 State of Residence 9
2.1.3 Method of Transport 10
2.1.4 Age 11
2.1.5 Summary 12
2.2 Satisfaction with Tourism Objects 12
2.2.1 Restaurant and Café Satisfaction 14
2.2.2 Shopping Satisfaction 14
2.2.3 Theme Parks/Wildlife Satisfaction 15
2.2.4 Accommodation Satisfaction 16
2.2.5 5-star Hotel Satisfaction 18
2.2.6 4-star Hotel Satisfaction 19
2.2.7 High-Rise Apartment Satisfaction 19
2.2.8 Low-Rise Apartment Satisfaction 20
2.2.9 Timeshare Property Satisfaction 21
2.2.10 Gold Coast Beaches Satisfaction 22
2.2.11 Differences in Assessment of Tourism
Objects by Selected Demographics 23
2.2.12 Predicting Satisfaction with the Tourism Objects 24
Contents
vi
2.2.13 Does Satisfaction with Objects/Dimensions
Predict Overall Satisfaction with The Gold Coast? 27
2.3 Satisfaction and Importance 28
2.3.1 Activities and Services 28
2.3.2 Memorable Aspects of Stay 30
2.3.3 Possible Improvements to Holiday Experience 32
2.3.4 Choosing the Gold Coast Over the
Sunshine Coast as a Destination 34
2.3.5 Importance versus Satisfaction of Tourism Objects 35
2.4 Recommending and/or Returning to the Gold Coast 36
2.4.1 Recommending the Gold Coast as a Tourist
Destination to Others 36
2.4.2 Likelihood of Returning to the Gold Coast
within 12 Months 38
2.4.3 Opinion of Gold Coast in Comparison to
First Impression 39
2.4.4 Match Between Promotional Material and Experience 40
2.4.5 Visitors’ Emotional Responses to the Gold Coast 40
3. Conclusions 43
3.1 Restaurants and Cafes 43
3.2 Shopping 43
3.3 Theme Parks and Wildlife 44
3.4 Accommodation 44
3.5 Beaches 44
3.6 Overall Satisfaction with the Gold Coast 45
3.7 Other 45
3.8 Further Research 46
Contents
vii
Appendix 1: Gold Coast Tourism Satisfaction Questionnaire 47
Appendix 2: Letter of Instructions to Participants 59
Appendix 3: Letter of Introduction to Distributors 61
Appendix 4: Satisfaction with Tourism Objects and
Their Dimensions 63
Appendix 5: Satisfaction with Accommodation Types 65
Appendix 6: Differences in Satisfaction Level According
to Gender and Weather 67
Appendix 7: Predicting Satisfaction with the
Tourism Objects 69
Appendix 8: Predicting Overall Satisfaction
with the Gold Coast 73
Appendix 9: Discrepancies between Respondents’
Satisfaction and Importance Ratings for each Tourism Object 75
Appendix 10: Likelihood of Respondents Recommending
the Gold Coast as a Holiday Destination 77
Contributor 79

List of Figures and TablesFigure 1
Model of Dimensions used for Measuring Satisfaction
with each Tourism Object 3
Figure 2
Demographic Profile of Respondents 8
Figure 3
Location of Accommodation on the Gold Coast 9
Figure 4
State of Residence 10
Figure 5
Method of Transport to the Gold Coast 11
Figure 6
Level of Satisfaction with Restaurants and Cafes (n=812) 14
Figure 7
Level of Satisfaction with Shopping (n=791) 15
Figure 8
Level of Satisfaction with Wildlife and
Amusement Parks (n=631) 16
Figure 9
Level of Satisfaction with Accommodation (n=755) 17
Figure 10
Level of Satisfaction with 5-star Hotels (n=129) 18
Figure 11
Level of Satisfaction with 4-star Hotels (n=101) 19
Figure 12
Level of Satisfaction with High-rise Apartments (n=246) 20
List of Figures and Tables
x
Figure 13
Level of Satisfaction with Low-rise Apartments (n=147) 21
Figure 14
Level of Satisfaction with Timeshare Properties (n=61) 22
Figure 15
Level of Satisfaction with Beaches (n=640) 23
Figure 16
Satisfaction with Activities and Services Available
on the Gold Coast 30
Figure 17
Level of Satisfaction versus Level of Importance Assigned
to Each Object (n=803) 36
Figure 18
Likelihood of Recommending the Gold Coast
as a Tourist Destination to Others 37
Figure 19
Likelihood of Return to the Gold Coast within the
next 12 Months 38
Figure 20
Change in Opinion of the Gold Coast Compared to
Opinion at Arrival 39
Figure 21
Rate of Positive Emotions Expressed by Visitors to
the Gold Coast 41
Figure 22
Rate of Negative Emotions Expressed by Visitors to the
Gold Coast 42
Table 1
Age of Participants 11

List of Figures and Tables
xi
Table 2
Sample Items used to Create Dimension Scales 13
Table 3
Accommodation Type chosen by Visitors to the Gold Coast 17
Table 4
Most frequently reported activities and services 29
Table 5
Most Memorable Aspect of Gold Coast Visit and
Example Quotes 31
Table 6
Aspects that Participants Would Like to See Changed in Order
to Increase Satisfaction Levels Plus Example Quotes 33
Table 7
Reason for Choosing Gold Coast over Sunshine Coast
as a Destination 35
Table 8
Percentage of Respondents Reporting Various Levels
of Satisfaction with Restaurant and Cafe Dimensions 63
Table 9
Percentage of Respondents Reporting Various Levels
of Satisfaction with Shopping Dimensions 63
Table 10
Percentage of Respondents Reporting Various Levels of
Satisfaction with Theme Park/Wildlife Dimensions 64
Table 11
Percentage of Respondents Reporting Various Levels of
Satisfaction with Accommodation Dimensions 64
Table 12
Percentage of Respondents Reporting Various Levels of
Satisfaction with Beaches Dimensions 64

List of Figures and Tables
xii
Table 13
Percentage of Respondents Reporting Various Levels of
Satisfaction with Accommodation Dimensions
According to Type of Accommodation Used 65
Table 14
Satisfaction Levels with Tourism Objects According to Gender 67
Table 15
Satisfaction Levels with Tourism Objects According to
Weather whilst Visiting Gold Coast 68
Table 16
Satisfaction with Each of the Five Dimensions as Predictors
of Overall Satisfaction with Each Tourism Object 70
Table 17
Weighting of Dimensions in the Prediction of
Overall Satisfaction with Tourism Objects 70
Table 18
Prediction of Overall Satisfaction with Gold Coast
According to Satisfaction with Objects 73
Table 19
Weighting of Various Tourism Objects in the Prediction
of Overall Satisfaction with the Gold Coast 73
Table 20
Prediction of Overall Satisfaction with Gold Coast
According to Satisfaction with Dimensions 73
Table 21
Weighting of Various Dimensions in the Prediction
of Overall Satisfaction with the Gold Coast 74
Table 22
Mean Difference between Overall Satisfaction and
Importance for Each Tourism Object 75

List of Figures and Tables
xiii
Table 23
Prediction of Likelihood to Recommend the Gold Coast
According to Satisfaction with Objects and Dimensions 77
Table 24
Strength of Objects and Dimensions in the Prediction
of Likelihood of Recommending the Gold Coast 77

Executive SummaryA survey of visitors to the Gold Coast was conducted by the Centre
for Tourism and Hotel Management Research (Griffith University), in
conjunction with the Cooperative Research Council for Sustainable
Tourism. The project is part of the broader ‘Gold Coast Tourism
Visioning Project’, which seeks to provide research for long-term
sustainability of tourism on the Gold Coast.
Section One of this report describes the demographic composition
of the Gold Coast sample, including information pertaining to
different aspects of their holiday such as length of time stayed and
purpose of visit.
The sample comprised 285 males and 575 females (n=881). The
demographic information collected for this survey suggests that the
sample primarily visited the Gold Coast for a holiday of less than 8
nights (modal response 5–7 nights). For many (90%), this was a repeat
visit to the Gold Coast. The sample was more heavily weighted
toward female visitors.
In general, the sample was educated and professional. The sample
included responses from all regions other than the Northern Territory,
with most respondents originating from New South Wales or Victoria.
The sample comprised a range of age groups with 36–45 years being
the most dominant. A cross-section of Gold Coast suburbs were
chosen for accommodation by respondents. The primary mode of
travel to and from the Gold Coast for this sample was the aeroplane,
followed by private car.
Section Two presents the satisfaction data with regards to each
tourism object (that is, restaurants, shopping, theme parks,
accommodation and beaches). The results presented in this section
detail the level of satisfaction with each individual tourism object
based on five dimensions: value for money, accessibility, service,
physical environment and communication style used by industry staff
in each object.
For restaurants and cafes the most popular areas for eating out for
this sample were Surfers Paradise (48%), Broadbeach (34%), and
Coolangatta (15%). More than 90% of participants were somewhat
satisfied to very satisfied with all dimensions concerning the Gold
Coast restaurant/cafes, excepting the value dimension, whereby

Executive Summary
xvi
approximately 80% indicated a similar level of satisfaction. Ten
percent indicated a level of dissatisfaction with the value dimension.
A total of 791 respondents indicated they had visited one or more
shopping outlets during their stay on the Gold Coast. The most
frequently visited shopping centres were located in Broadbeach
(53%), Surfers Paradise (34%), and Southport/Labrador (20%).
Approximately 90% of participants indicated they were somewhat
to very satisfied with all dimensions of their shopping experience on
the Gold Coast, excepting the value dimension. Again, ten percent
indicated they were dissatisfied with the value for money dimension
with regards to shopping.
A total of 634 respondents indicated that they had visited one or
more theme parks or wildlife sanctuaries during their visit to the Gold
Coast. Of these respondents, 62% reported visiting Seaworld, 62%
visited Movieworld, 42% visited Dreamworld, 36% visited Wet &
Wild, and 14% visited Currumbin Bird Sanctuary. The majority of
respondents were either satisfied or very satisfied with all dimensions
of theme parks/wildlife excepting value for money. Approximately
20% of participants were dissatisfied with the value for money of
theme parks and wildlife venues on the Gold Coast. The
physical/environmental aspects as well as staff communication were
the strongest area of satisfaction for theme parks.
The most frequently cited type of accommodation chosen by
visitors to the Gold Coast in this sample was a high-rise apartment
(31.7%), followed by low-rise apartments (17.7%) and 5-star hotels
(15.3%). Approximately 12% of participants chose a 4-star hotel or
timeshare properties as their accommodation. More than 65%
indicated they were satisfied to very satisfied with all five dimensions
regarding accommodation on the Gold Coast. Approximately five to
eight percent expressed some dissatisfaction with the value, service
and communication within the accommodation element.
A total of 645 respondents indicated they had visited a Gold Coast
beach during their stay. The most frequently reported beach was
Surfers Paradise (249), followed by Broadbeach/Kurrawa (134),
Coolangatta (128), and Main Beach (103). More than 70% indicated
they were satisfied to very satisfied with all five dimensions with the
beaches on the Gold Coast.
Approximately 40% of the variance in overall satisfaction with the
Gold Coast as a tourist destination was explained by overall
satisfaction with the five tourism objects. In particular, the objects that
Executive Summary
xvii
made a significant contribution to respondents’ overall satisfaction in
order of importance were accommodation, restaurants, beaches
and shopping.
Section Three details the results pertaining to participation and
satisfaction with a range of activities visitors may have engaged in
during their stay. This section also reports on the memorable aspects
of the visitors’ stay. Also, the satisfaction and the level of importance
that respondents attach to different aspects of their holiday
are reported.
Participation and satisfaction with a range of activities or services
was assessed. Results indicated high levels of participation in a range
of activities including swimming (n=694), getting a suntan (n=550),
meeting local people (n=531) and sampling local food/wine (n=511).
The service receiving the highest rate of extreme satisfaction was
limousine services, with 65% of respondents participating in this
service reporting they were very satisfied. Other activities/services
where a large number of respondents reported a high level of
satisfaction (approximately 60%) included participating in water
sports other than surfing or swimming, visiting a National Park, and
visiting the hinterland area.
Respondents indicated that one of the most memorable aspects of
their holiday was related to visiting a theme park, followed by the
overall Gold Coast lifestyle, then the beach experience. Typical
comments regarding participants’ positive experiences of the theme
parks included: “No other state has the theme parks, which are a
highlight for the children”, “Taking our 3 year old to Movie World.
He loved it”.
Participants were also asked to record things they would like to see
changed on the Gold Coast that would improve their satisfaction with
their holiday. A change in accommodation was the most frequent
response from participants, followed by changes to roads and transport
on the Gold Coast.
For each tourism object, respondents were asked to indicate their
overall satisfaction with each object, as well as how important each
object was to them as a component of their entire holiday. For all
objects except accommodation, the level of satisfaction experienced
by participants exceeded the level of importance they placed on
the object.

Executive Summary
xviii
Section Four reports on whether respondents are more likely to
return to the Gold Coast or recommend the Gold Coast as a tourist
destination to others.
One-third of participants expressed they were very likely to return
to the Gold Coast for a holiday within the next 12 months, followed
by 17% who suggested it was likely they would return. In comparison,
approximately one third chose somewhat unlikely to very unlikely
with regards to the likelihood of return within the next 12 months.
Eight percent of participants remained neutral on the subject.
The majority of participants indicated they were either likely or
very likely to recommend the Gold Coast as a holiday destination to
other potential visitors (75%), with a very strong response (43%)
suggesting they are very likely to recommend the Gold Coast.
Fourteen percent indicated they were somewhat likely to make a
recommendation. Less than four percent suggested they were
somewhat to very unlikely to recommend the Gold Coast as a tourist
destination, whilst eight percent remained neutral on the subject.
The majority of participants (59%) suggested that their opinion of
the Gold Coast as a holiday destination remained unchanged
compared to when they first arrived for their holiday. Approximately
35% indicated a positive improvement in their opinion, in contrast to
approximately seven percent who suggested deterioration in opinion
The questionnaire also asked whether promotional material
(advertising) seen prior to a visit to the Gold Coast actually matched
the visitors’ experience of the Gold Coast. Of the 615 respondents
who reported seeing materials, 47% felt it matched up, 42% felt it
somewhat matched up, and 11% felt it did not match up.
1. IntroductionA survey of visitors to the Gold Coast was conducted by the Centre
for Tourism and Hotel Management Research (Griffith University), in
conjunction with the Cooperative Research Council for Sustainable
Tourism. The project is part of the broader ‘Gold Coast Visioning
Project’, which seeks to provide research for long-term sustainability
of tourism on the Gold Coast. The objective of the survey was to
obtain detailed information about tourist satisfaction with the Gold
Coast as a destination. The survey questionnaire (see Appendix 1) was
designed in conjunction with a Gold Coast Visioning Steering
Committee nominated working party.
1.1 Aims� To develop an in-depth understanding of consumer
satisfaction with the Gold Coast tourism experience.
� To test the value of dimensions (e.g., aspects of the service
experience such as communication style of service personnel)
and objects (e.g., those tourism products like accommodation
and beaches that make up a destination’s overall tourism
offering) as measures of the Gold Coast tourism system.
� To investigate differential effects of customer satisfaction
levels. For instance, to see whether satisfaction levels vary
between different age groups or other market segments.
1.2 General Information CollectedThis project aimed to clearly identify how customers perceive existing
tourism products (referred to as objects) on the Gold Coast, and as
such, the project provides input into marketing the destination in the
future. Importantly, the research provides a snapshot of tourist
perceptions of the Gold Coast as a tourist destination. The tourism
product is multi-faceted, comprising many different elements. As a
result, the satisfaction of visitors to a destination can be impacted by a
range of tourism experiences, which may derive from many sources
(e.g., accommodation, use of natural attractions, restaurants and so
forth). Similarly, when using any one tourism product there are many
Visitor Satisfaction Survey on the Gold Coast
2
aspects that influence satisfaction. For instance, the treatment
provided by service personnel, the physical environment, or the ease
with which a visitor can access the product. Thus, the research project
took an approach, which investigated both satisfaction with tourism
objects as well as dimensions of tourism experience.
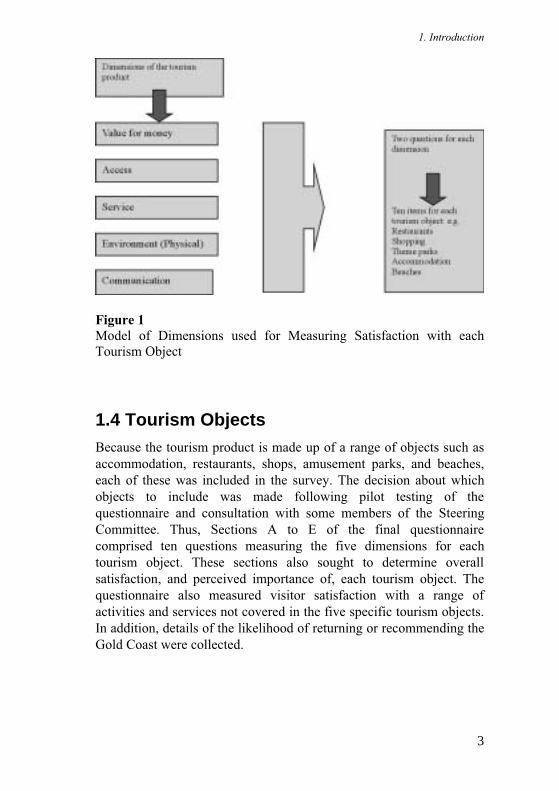
1.3 Tourism DimensionsBased upon a review of existing satisfaction literature it was decided
to focus on measuring tourist satisfaction with five key dimensions for
a range of tourism objects (products). Figure 1 provides an overview
of these. Each dimension was measured using two items (questions)
that were deemed to be indicators1 of the dimension under
consideration. Value for money was measured using visitors’
perceived value of a product and assessment of the prices paid for that
product. Access was designed to measure views on how accessible a
tourism object was, as well as its hours of operations. Service was
measured using two questions which sought information on visitors’
perceptions of overall service levels and consistency of service
delivery. The physical environment dimension sought information
about the actual physical set-up (or environment) of the tourism
object, as well as the visitors’ perceived level of safety. Finally,
communication was primarily concerned with seeking feedback on
visitors’ assessment of service personnel’s communication style and
helpfulness. This final dimension may overlap somewhat in the
service dimension, but here the emphasis is on personability and
empathy, whereas the service dimension emphasises reliability
and consistency.
1 This was determined through previous research conducted and pilot testing procedures.
1. Introduction
3
Figure 1
Model of Dimensions used for Measuring Satisfaction with each
Tourism Object
1.4 Tourism ObjectsBecause the tourism product is made up of a range of objects such as
accommodation, restaurants, shops, amusement parks, and beaches,
each of these was included in the survey. The decision about which
objects to include was made following pilot testing of the
questionnaire and consultation with some members of the Steering
Committee. Thus, Sections A to E of the final questionnaire
comprised ten questions measuring the five dimensions for each
tourism object. These sections also sought to determine overall
satisfaction, and perceived importance of, each tourism object. The
questionnaire also measured visitor satisfaction with a range of
activities and services not covered in the five specific tourism objects.
In addition, details of the likelihood of returning or recommending the
Gold Coast were collected.
Visitor Satisfaction Survey on the Gold Coast
4
1.5 Data Collection
1.5.1 Questionnaire
As discussed, the self-administered questionnaire (see Appendix 1)
consisted of a range of items segregated into nine sections, and was
designed to collect information about satisfaction with restaurants,
shopping, theme parks, accommodation, beaches, and activities and
services in the Gold Coast region. In addition, demographic details,
recommendation and return intentions were collected. Each
questionnaire was packaged with a letter of instructions (see
Appendix 2), a reply paid envelope and coupon for optional entry in a
prize draw.
To enter the draw, participants were required to complete a special
coupon (including their contact details), which they returned in a
sealed, pocketsize envelope along with the completed questionnaire.
Respondents were assured of the confidentiality of their responses, by
highlighting that (a) all individual responses would only be viewed by
researchers from Griffith University, (b) that responses would be
destroyed upon entry of the questionnaire data into the university’s
computer system, and, (c) the pocket-size envelopes would be
disassociated from the completed questionnaires by Griffith
University staff and no names would be kept.
1.5.2 Sample
The population of interest was any domestic (Australian resident)
tourist who had spent at least two nights on the Gold Coast at the time
of contact. Wherever possible, tourists were sought as they completed
their stay on the Gold Coast. This approach was taken in order to
optimise ‘top of mind’ experiences with the tourism product.
1.5.3 Data Collection Process
Questionnaires (3,500) were distributed through three channels:
accommodation properties, visitor information centres and the
Coolangatta (Gold Coast) airport departure lounges. A letter of
instruction for the distribution for accommodation properties and
visitor information centres is included in Appendix 3. True response
1. Introduction
5
rates cannot be estimated precisely as it is not accurately known
whether all accommodation properties and visitor information centres
assisting with questionnaire distribution actually handed out all copies.
However, as an estimate, it is reasonable to expect that around 75%
(2,625) were distributed to possible respondents. The questionnaires
were distributed between 24 September and 5 November 1999. As a
result, the period covered a time when school holidays were
scheduled. The closing date for data used in this report was end of
business on 9 November 1999. This date was selected due to the need
to draw the incentive prize.
A total of 881 valid2 questionnaires were obtained and form the
basis of the data reported herein. This represents a response rate of
approximately 33%, which is quite reasonable for this type of survey.
The profile of respondents is detailed in the results section.
2 An additional 24 questionnaires were received, however, these were from international
tourists and excluded from the analysis reported here.

2. ResultsThis section of the report describes the results of the questionnaire. It
is divided into four sections. Section I outlines the demographic
composition of the sample, including information pertaining to
different aspects of their holiday such as length of time stayed and
purpose of visit. Section II presents the satisfaction data with regards
to each tourism object. The possibility that satisfaction levels differ
according to a number of demographic variables is also explored.
Section III details the results pertaining to satisfaction with a range of
activities visitors may have engaged in during their stay. This section
also reports on the memorable aspects of the visitors’ stay. Also
reported are the levels of satisfaction and the importance that
respondents attach to different aspects of their holiday. Finally,
Section IV reports on whether respondents are likely to return to the
Gold Coast, recommend the Gold Coast as a tourist destination to
others, and so on.
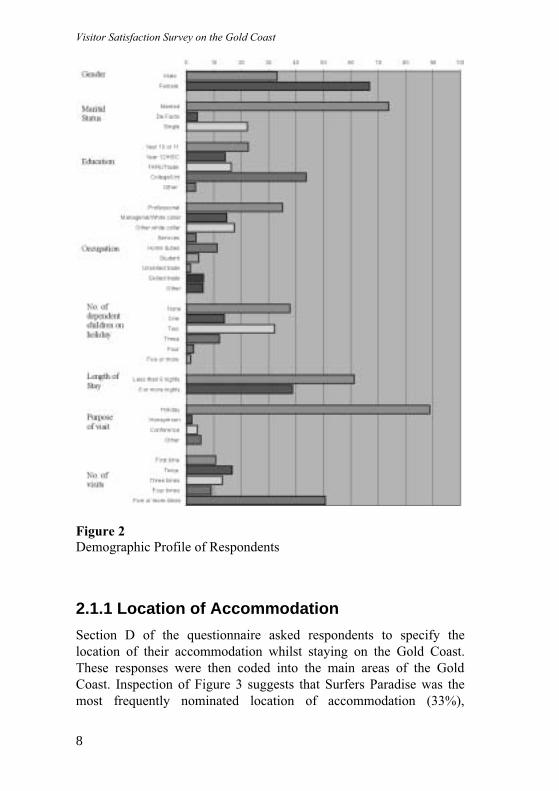
2.1 Sample DescriptionFigure 2 provides an outline of the demographic composition of the
sample. The sample comprised 285 males and 575 females, with 21
respondents not specifying their sex (n=881). Participants varied on
level of education and occupation, with most respondents indicating a
high level of educational background and professional status. The
majority of participants cited a holiday as the main purpose of their
visit to the Gold Coast, with 61% reporting a stay of less than eight
nights (in comparison to 39% staying eight or more nights). Almost
half of all respondents reported having visited the Gold Coast five or
more times in the past. Indeed only 10% of respondents were first time
visitors to the Gold Coast. A high proportion of respondents indicated
they were married and approximately 60% indicated they had bought
one or more children on the holiday.
Visitor Satisfaction Survey on the Gold Coast
8
Figure 2
Demographic Profile of Respondents
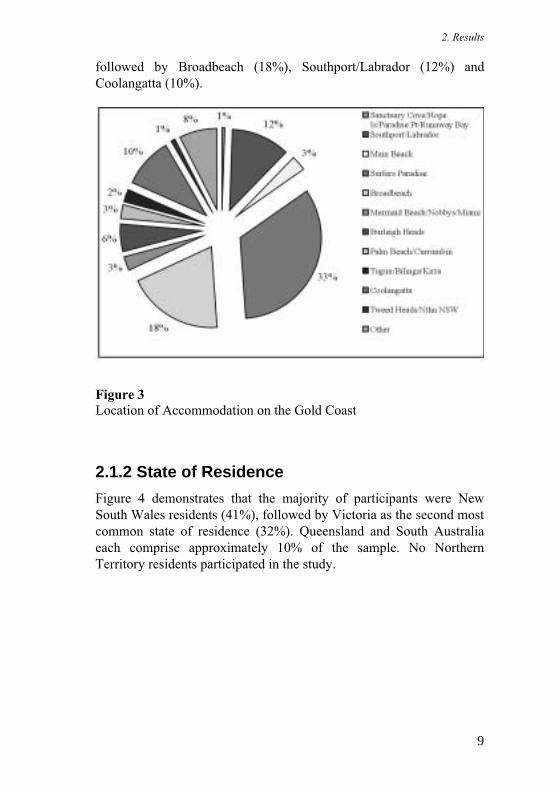
2.1.1 Location of Accommodation
Section D of the questionnaire asked respondents to specify the
location of their accommodation whilst staying on the Gold Coast.
These responses were then coded into the main areas of the Gold
Coast. Inspection of Figure 3 suggests that Surfers Paradise was the
most frequently nominated location of accommodation (33%),
2. Results
9
followed by Broadbeach (18%), Southport/Labrador (12%) and
Coolangatta (10%).
Figure 3
Location of Accommodation on the Gold Coast
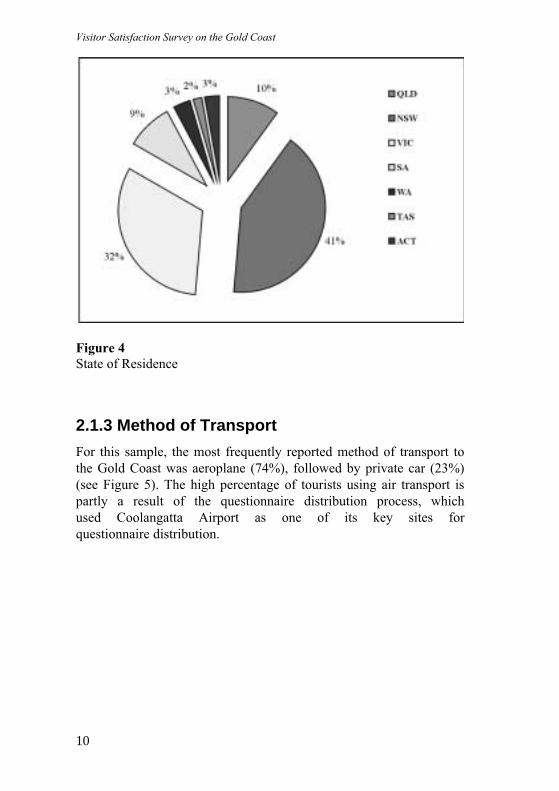
2.1.2 State of Residence
Figure 4 demonstrates that the majority of participants were New
South Wales residents (41%), followed by Victoria as the second most
common state of residence (32%). Queensland and South Australia
each comprise approximately 10% of the sample. No Northern
Territory residents participated in the study.
Visitor Satisfaction Survey on the Gold Coast
10
Figure 4
State of Residence
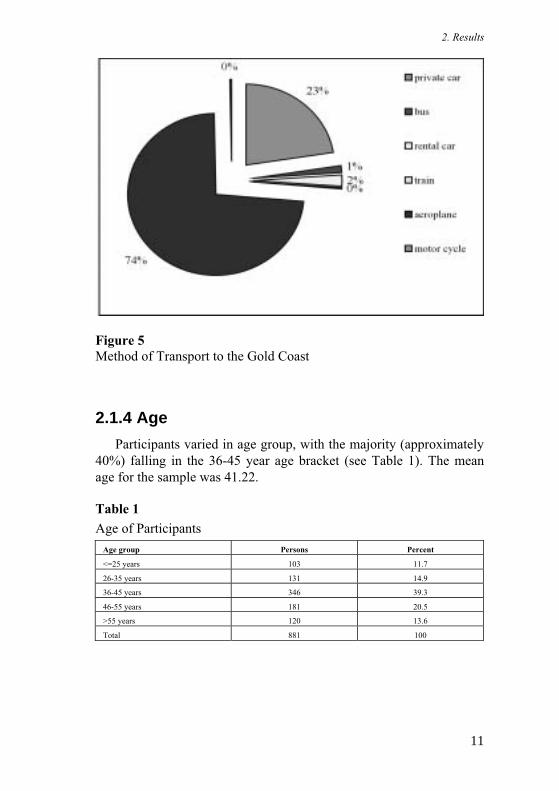
2.1.3 Method of Transport
For this sample, the most frequently reported method of transport to
the Gold Coast was aeroplane (74%), followed by private car (23%)
(see Figure 5). The high percentage of tourists using air transport is
partly a result of the questionnaire distribution process, which
used Coolangatta Airport as one of its key sites for
questionnaire distribution.
2. Results
11
Figure 5
Method of Transport to the Gold Coast
2.1.4 Age
Participants varied in age group, with the majority (approximately
40%) falling in the 36-45 year age bracket (see Table 1). The mean
age for the sample was 41.22.
Table 1
Age of Participants
Age group Persons Percent
<=25 years 103 11.7
26-35 years 131 14.9
36-45 years 346 39.3
46-55 years 181 20.5
>55 years 120 13.6
Total 881 100

Visitor Satisfaction Survey on the Gold Coast
12
2.1.5 Summary
The demographic information collected for this survey suggests that
the sample primarily visited the Gold Coast for a holiday of less than 8
nights (modal response 5–7 nights). For many (90%), this was a repeat
visit to the Gold Coast. The sample was more heavily weighted
toward female visitors. In general, the sample was educated and
professional. The sample included responses from all regions other
than the Northern Territory, with most respondents originating from
New South Wales or Victoria. The sample comprised a range of age
groups with 36-45 years being the most dominant. Respondents chose
a cross-section of mainly beachside Gold Coast suburbs for
accommodation. The primary mode of travel to and from the Gold
Coast for this sample was the aeroplane, followed by private car.
The next section presents the results of visitor satisfaction with
specific tourism objects.
2.2 Satisfaction with Tourism ObjectsIn this section, the level of satisfaction experienced within each
tourism object (restaurants, shops, theme parks, accommodation, and
beaches) is explored. Graphs are presented to detail the level of
satisfaction with each individual tourism object based on five
dimensions: value for money, accessibility, service, physical
environment, and communication style used by industry staff.
The five dimensions were each measured using two questions per
tourism object. Table 2 illustrates the types of questions asked for
each dimension (note: in this example the questions used are those for
restaurant and cafes – see Appendix 1 for the full questionnaire used
in this study). For example, one question regarding satisfaction with
the value for money dimension within the restaurants/cafes object
asked the respondent to report how satisfied they were with the prices
they had to pay for meals on the Gold Coast. For each dimension, the
ratings on the two questions were summed together to make a new
score, which was deemed to represent the particular construct
under consideration.
The three responses that indicated a level of dissatisfaction (very
dissatisfied, dissatisfied and somewhat dissatisfied) were collapsed
into one category for the following analyses, due to the small number

2. Results
13
of participants selecting each of these response alternatives. However,
each level of satisfaction is reported in full (somewhat satisfied,
satisfied, very satisfied). Tables showing the full breakdown across the
seven response options are also included in Appendix 4.
Table 2
Sample Items used to Create Dimension Scales
Sample item
How satisfied were you with:
Dimension
The value for money of Gold Coast restaurants and cafes?
Value for money
The prices you had to pay when eating out at Gold Coast restaurants andcafes?
The accessibility of Gold Coast restaurant and cafes?
Accessibility
The hours of opening of Gold Coast restaurants and cafes?
The level of service at Gold Coast restaurants and cafes?
Service
The consistency of the service in Gold Coast restaurants and cafes?
The physical set-up of Gold Coast restaurants and cafes?
Physical environment
The level of personal safety you experienced at Gold Coast restaurantsand cafes?
The communication style used by staff at Gold Coast restaurants and
cafes?
Communication
The willingness of Gold Coast restaurants and cafes service personnel to
help you?
Visitor Satisfaction Survey on the Gold Coast
14
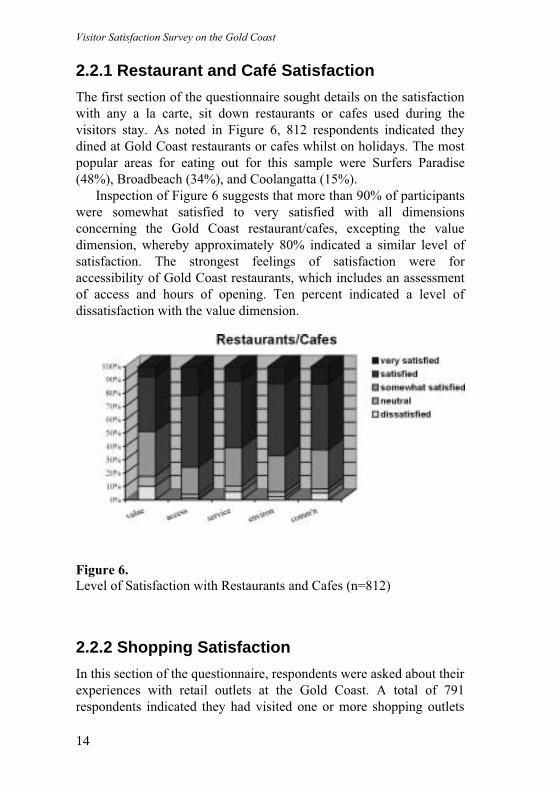
2.2.1 Restaurant and Café Satisfaction
The first section of the questionnaire sought details on the satisfaction
with any a la carte, sit down restaurants or cafes used during the
visitors stay. As noted in Figure 6, 812 respondents indicated they
dined at Gold Coast restaurants or cafes whilst on holidays. The most
popular areas for eating out for this sample were Surfers Paradise
(48%), Broadbeach (34%), and Coolangatta (15%).
Inspection of Figure 6 suggests that more than 90% of participants
were somewhat satisfied to very satisfied with all dimensions
concerning the Gold Coast restaurant/cafes, excepting the value
dimension, whereby approximately 80% indicated a similar level of
satisfaction. The strongest feelings of satisfaction were for
accessibility of Gold Coast restaurants, which includes an assessment
of access and hours of opening. Ten percent indicated a level of
dissatisfaction with the value dimension.
Figure 6.
Level of Satisfaction with Restaurants and Cafes (n=812)
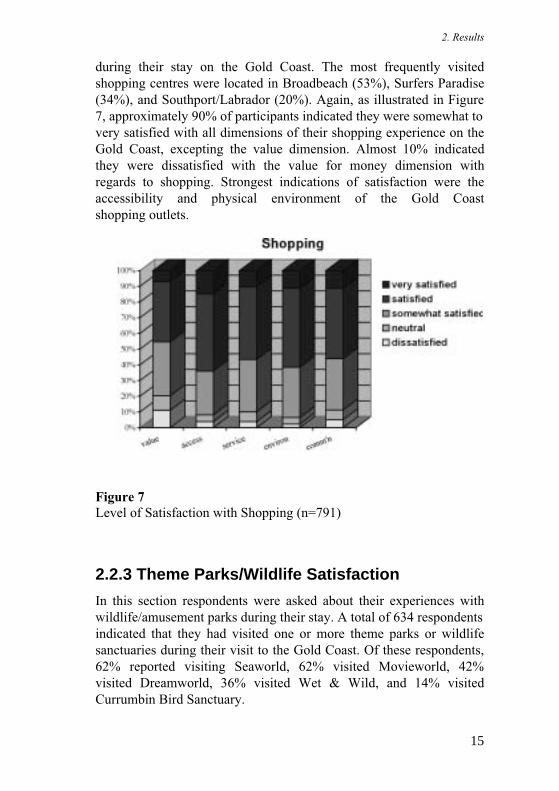
2.2.2 Shopping Satisfaction
In this section of the questionnaire, respondents were asked about their
experiences with retail outlets at the Gold Coast. A total of 791
respondents indicated they had visited one or more shopping outlets
2. Results
15
during their stay on the Gold Coast. The most frequently visited
shopping centres were located in Broadbeach (53%), Surfers Paradise
(34%), and Southport/Labrador (20%). Again, as illustrated in Figure
7, approximately 90% of participants indicated they were somewhat to
very satisfied with all dimensions of their shopping experience on the
Gold Coast, excepting the value dimension. Almost 10% indicated
they were dissatisfied with the value for money dimension with
regards to shopping. Strongest indications of satisfaction were the
accessibility and physical environment of the Gold Coast
shopping outlets.
Figure 7
Level of Satisfaction with Shopping (n=791)
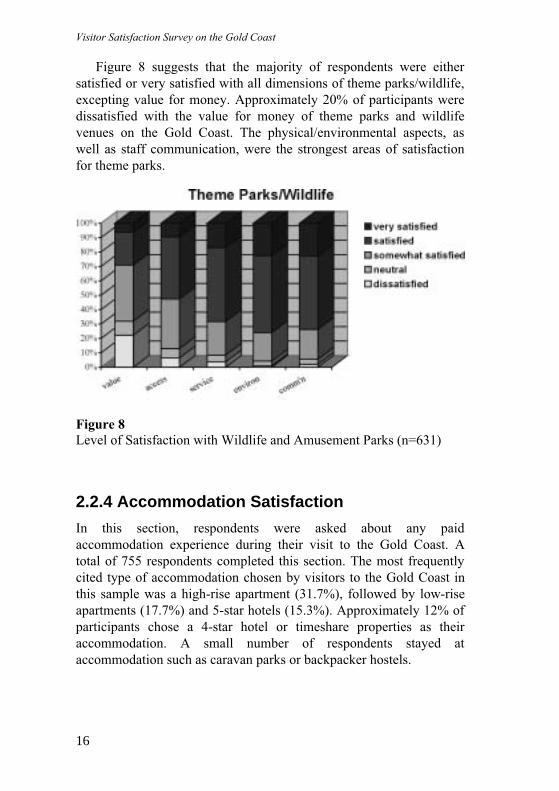
2.2.3 Theme Parks/Wildlife Satisfaction
In this section respondents were asked about their experiences with
wildlife/amusement parks during their stay. A total of 634 respondents
indicated that they had visited one or more theme parks or wildlife
sanctuaries during their visit to the Gold Coast. Of these respondents,
62% reported visiting Seaworld, 62% visited Movieworld, 42%
visited Dreamworld, 36% visited Wet & Wild, and 14% visited
Currumbin Bird Sanctuary.
Visitor Satisfaction Survey on the Gold Coast
16
Figure 8 suggests that the majority of respondents were either
satisfied or very satisfied with all dimensions of theme parks/wildlife,
excepting value for money. Approximately 20% of participants were
dissatisfied with the value for money of theme parks and wildlife
venues on the Gold Coast. The physical/environmental aspects, as
well as staff communication, were the strongest areas of satisfaction
for theme parks.
Figure 8
Level of Satisfaction with Wildlife and Amusement Parks (n=631)
2.2.4 Accommodation Satisfaction
In this section, respondents were asked about any paid
accommodation experience during their visit to the Gold Coast. A
total of 755 respondents completed this section. The most frequently
cited type of accommodation chosen by visitors to the Gold Coast in
this sample was a high-rise apartment (31.7%), followed by low-rise
apartments (17.7%) and 5-star hotels (15.3%). Approximately 12% of
participants chose a 4-star hotel or timeshare properties as their
accommodation. A small number of respondents stayed at
accommodation such as caravan parks or backpacker hostels.

2. Results
17
Table 3
Accommodation Type chosen by Visitors to the Gold Coast
Accommodation type Persons Percent
High rise apartment 277 31.7
Low rise apartment 155 17.7
5-star hotel 134 15.3
4-star hotel 104 11.9
Timeshare property 98 11.2
Friends/family 38 4.3
Camping/caravan park 34 3.9
Other 17 1.9
Budget hotel/motel 16 1.8
Hostel/backpackers 1 .1
Total 874 100
More than 60% of the people responding to this section indicated
they were satisfied to very satisfied with all five dimensions regarding
accommodation on the Gold Coast. Approximately five to eight
percent expressed some dissatisfaction with the value, service and
communication within the accommodation element.
Figure 9
Level of Satisfaction with Accommodation (n=755)
The following series of graphs illustrates respondents’ satisfaction
with the five dimensions according to the type of accommodation
(apartment, 4-star or 5-star hotel, timeshare) they stayed in during
their stay. (Note: these analyses are also shown in table form for all
accommodation types in Appendix 5).
Visitor Satisfaction Survey on the Gold Coast
18
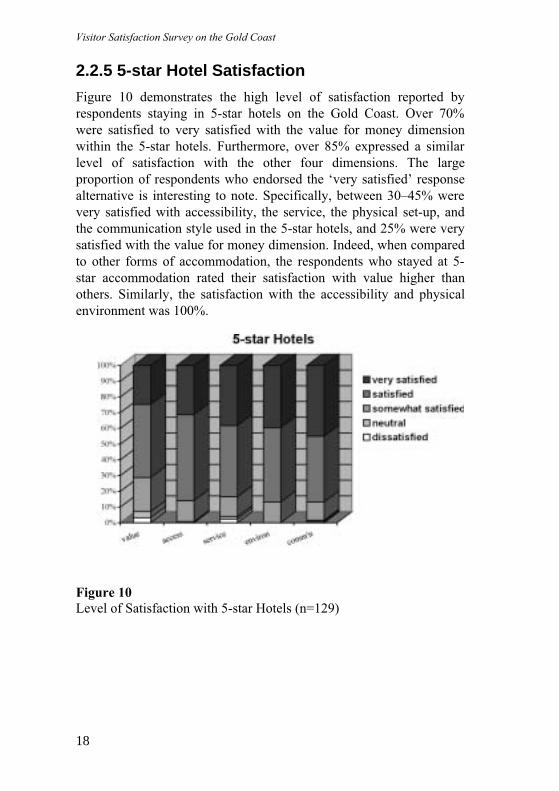
2.2.5 5-star Hotel Satisfaction
Figure 10 demonstrates the high level of satisfaction reported by
respondents staying in 5-star hotels on the Gold Coast. Over 70%
were satisfied to very satisfied with the value for money dimension
within the 5-star hotels. Furthermore, over 85% expressed a similar
level of satisfaction with the other four dimensions. The large
proportion of respondents who endorsed the ‘very satisfied’ response
alternative is interesting to note. Specifically, between 30–45% were
very satisfied with accessibility, the service, the physical set-up, and
the communication style used in the 5-star hotels, and 25% were very
satisfied with the value for money dimension. Indeed, when compared
to other forms of accommodation, the respondents who stayed at 5-
star accommodation rated their satisfaction with value higher than
others. Similarly, the satisfaction with the accessibility and physical
environment was 100%.
Figure 10
Level of Satisfaction with 5-star Hotels (n=129)
2. Results
19
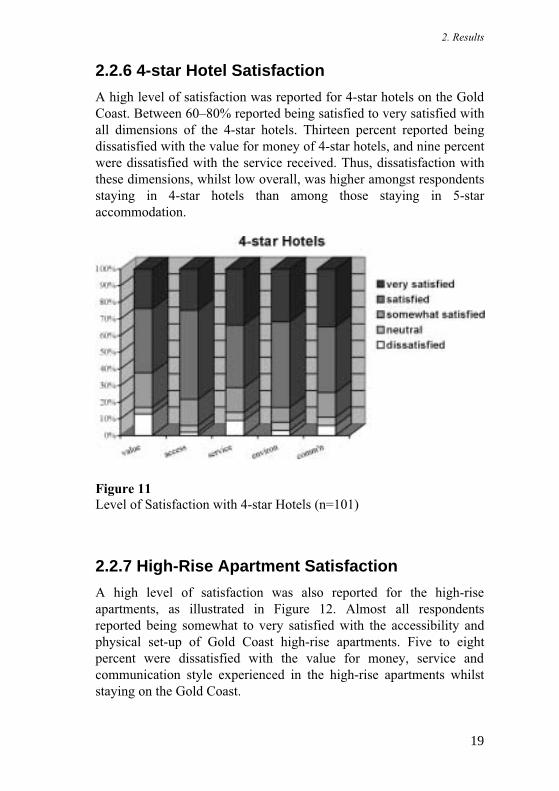
2.2.6 4-star Hotel Satisfaction
A high level of satisfaction was reported for 4-star hotels on the Gold
Coast. Between 60–80% reported being satisfied to very satisfied with
all dimensions of the 4-star hotels. Thirteen percent reported being
dissatisfied with the value for money of 4-star hotels, and nine percent
were dissatisfied with the service received. Thus, dissatisfaction with
these dimensions, whilst low overall, was higher amongst respondents
staying in 4-star hotels than among those staying in 5-star
accommodation.
Figure 11
Level of Satisfaction with 4-star Hotels (n=101)
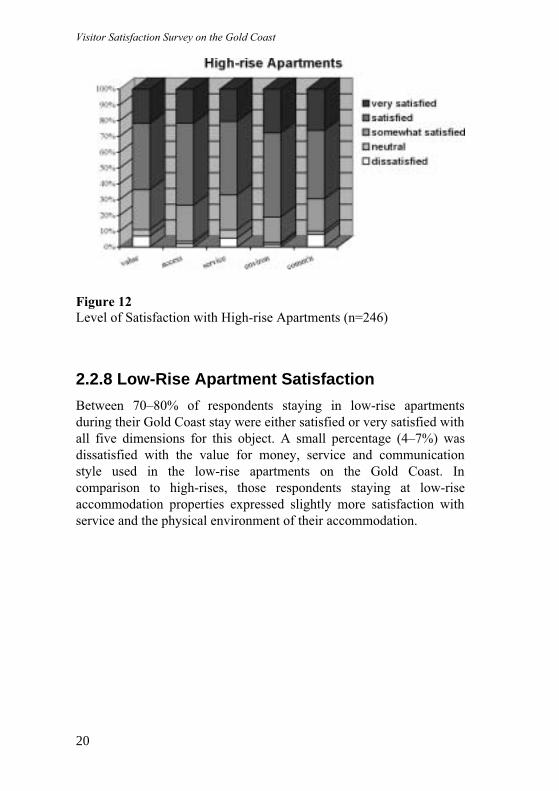
2.2.7 High-Rise Apartment Satisfaction
A high level of satisfaction was also reported for the high-rise
apartments, as illustrated in Figure 12. Almost all respondents
reported being somewhat to very satisfied with the accessibility and
physical set-up of Gold Coast high-rise apartments. Five to eight
percent were dissatisfied with the value for money, service and
communication style experienced in the high-rise apartments whilst
staying on the Gold Coast.
Visitor Satisfaction Survey on the Gold Coast
20
Figure 12
Level of Satisfaction with High-rise Apartments (n=246)
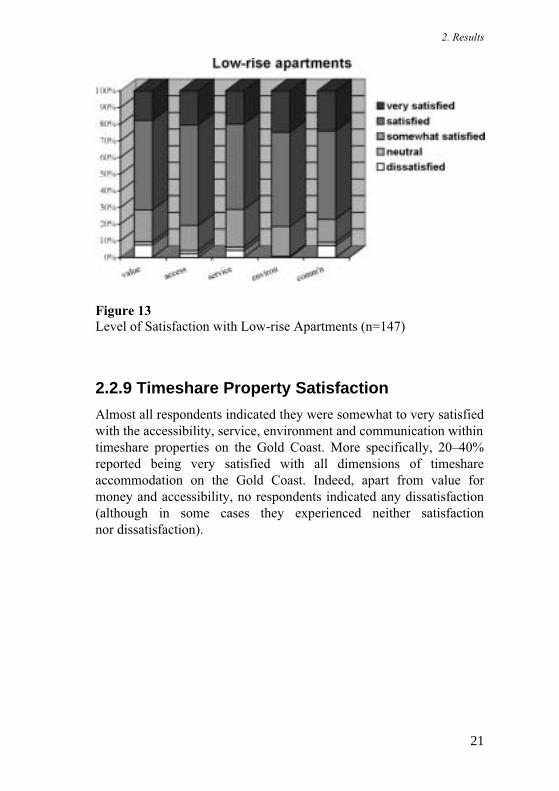
2.2.8 Low-Rise Apartment Satisfaction
Between 70–80% of respondents staying in low-rise apartments
during their Gold Coast stay were either satisfied or very satisfied with
all five dimensions for this object. A small percentage (4–7%) was
dissatisfied with the value for money, service and communication
style used in the low-rise apartments on the Gold Coast. In
comparison to high-rises, those respondents staying at low-rise
accommodation properties expressed slightly more satisfaction with
service and the physical environment of their accommodation.
2. Results
21
Figure 13
Level of Satisfaction with Low-rise Apartments (n=147)
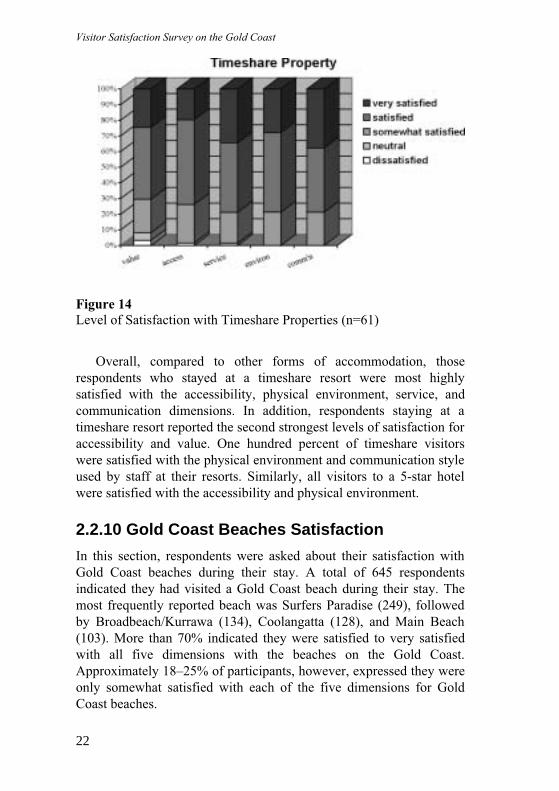
2.2.9 Timeshare Property Satisfaction
Almost all respondents indicated they were somewhat to very satisfied
with the accessibility, service, environment and communication within
timeshare properties on the Gold Coast. More specifically, 20–40%
reported being very satisfied with all dimensions of timeshare
accommodation on the Gold Coast. Indeed, apart from value for
money and accessibility, no respondents indicated any dissatisfaction
(although in some cases they experienced neither satisfaction
nor dissatisfaction).
Visitor Satisfaction Survey on the Gold Coast
22
Figure 14
Level of Satisfaction with Timeshare Properties (n=61)
Overall, compared to other forms of accommodation, those
respondents who stayed at a timeshare resort were most highly
satisfied with the accessibility, physical environment, service, and
communication dimensions. In addition, respondents staying at a
timeshare resort reported the second strongest levels of satisfaction for
accessibility and value. One hundred percent of timeshare visitors
were satisfied with the physical environment and communication style
used by staff at their resorts. Similarly, all visitors to a 5-star hotel
were satisfied with the accessibility and physical environment.
2.2.10 Gold Coast Beaches Satisfaction
In this section, respondents were asked about their satisfaction with
Gold Coast beaches during their stay. A total of 645 respondents
indicated they had visited a Gold Coast beach during their stay. The
most frequently reported beach was Surfers Paradise (249), followed
by Broadbeach/Kurrawa (134), Coolangatta (128), and Main Beach
(103). More than 70% indicated they were satisfied to very satisfied
with all five dimensions with the beaches on the Gold Coast.
Approximately 18–25% of participants, however, expressed they were
only somewhat satisfied with each of the five dimensions for Gold
Coast beaches.

2. Results
23
Figure 15
Level of Satisfaction with Beaches (n=640)
2.2.11 Differences in Assessment of TourismObjects by Selected Demographics
Using a statistical procedure (see Appendix 6), the researcher was able
to determine whether any statistically significant differences existed in
satisfaction levels according to demographic variables such as gender,
age, marital status, and the type of weather experienced whilst staying
on the Gold Coast. No significant differences were found for age and
marital status on the level of satisfaction experienced within each
tourism object.
Gender Differences
Gender differences were observed for satisfaction levels with beaches,
cafes/restaurants, shopping and theme parks, with females indicating a
greater level of satisfaction for these four tourism objects (see
Appendix 6). Gender differences for satisfaction with accommodation
approached statistical significance with a similar trend (i.e., females
reporting higher satisfaction).

Visitor Satisfaction Survey on the Gold Coast
24
W eather
Similarly, significant differences were observed in satisfaction levels
according to the type of weather experienced by participants (see
Appendix 6). The analysis suggested that those who reported good
weather during their Gold Coast stay were significantly more satisfied
with all five tourism objects.
2.2.12 Predicting Satisfaction with the TourismObjects
Using a statistical procedure (see Appendix 7), we attempted to
identify which dimensions best predicted satisfaction with each object
(i.e., accommodation, beaches, etc.). The five dimensions used to
predict overall satisfaction with each object were value, accessibility,
2. Results
25
service, physical environment, and communication. All dimensions
together predicted between approximately 60–75% of the variability
in satisfaction levels of each object (see Appendix 7).
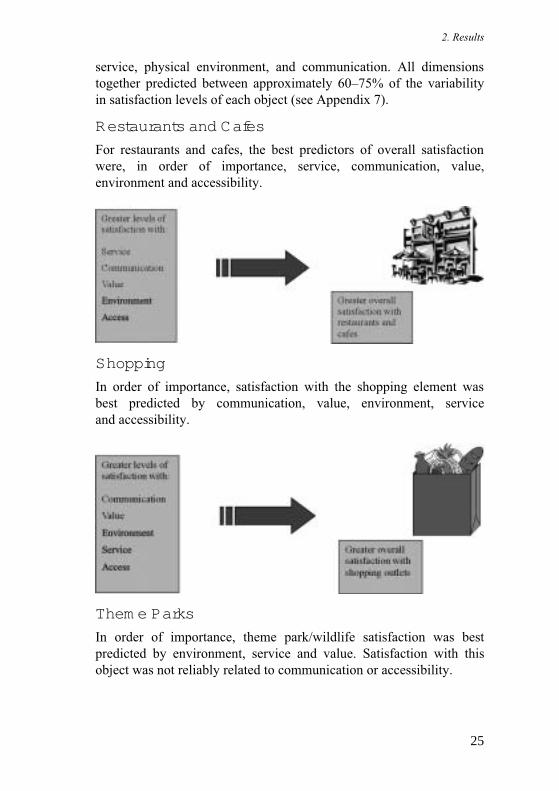
Restaurants and Cafes
For restaurants and cafes, the best predictors of overall satisfaction
were, in order of importance, service, communication, value,
environment and accessibility.
Shopping
In order of importance, satisfaction with the shopping element was
best predicted by communication, value, environment, service
and accessibility.
Them e Parks
In order of importance, theme park/wildlife satisfaction was best
predicted by environment, service and value. Satisfaction with this
object was not reliably related to communication or accessibility.

Visitor Satisfaction Survey on the Gold Coast
26
Accom m odation
For the accommodation element, the best predictors of satisfaction
were, in order, service, communication, environment, value,
and accessibility.
Beaches
Finally, the environment, service and value dimensions, respectively,
were the best predictors of satisfaction with Gold Coast beaches.
Satisfaction with beaches was not related to the respondents’ ratings
of access and communication.

2. Results
27
2.2.13 Does Satisfaction with Objects/DimensionsPredict Overall Satisfaction with TheGold Coast?
In order to predict the level of overall satisfaction with the Gold Coast
as a tourist destination, statistical procedures were conducted using as
predictors the respondents’ satisfaction with (a) the tourism objects
(e.g., restaurants, theme parks, etc.), and (b) the dimensions (e.g.,
service, value, etc.). Table 18 and 20 in Appendix 8 suggests that both
variables listed above (i.e., a & b), were able to account for a
significant amount of participants’ overall satisfaction with their Gold
Coast visit. Specifically, approximately 40% of the variance in overall
satisfaction with the Gold Coast as a tourist destination was explained
by overall satisfaction with the five tourism objects. In particular, the
objects that made a significant contribution to respondents’ overall
satisfaction were, in order of importance, accommodation, restaurants,
beaches and shopping. Further, 26% of the variability in overall
satisfaction was explained by participants’ overall satisfaction with the
five dimensions collapsed across the tourism objects. The dimensions
that made a significant contribution to this prediction were, in order,
the physical environment, value for money, and communication style.
Thus, it seems that overall satisfaction is more closely related to
tourists’ ratings of the five objects than their ratings of the five
dimensions, although both are of value in understanding tourists’
reactions to the Gold Coast.
Visitor Satisfaction Survey on the Gold Coast
28
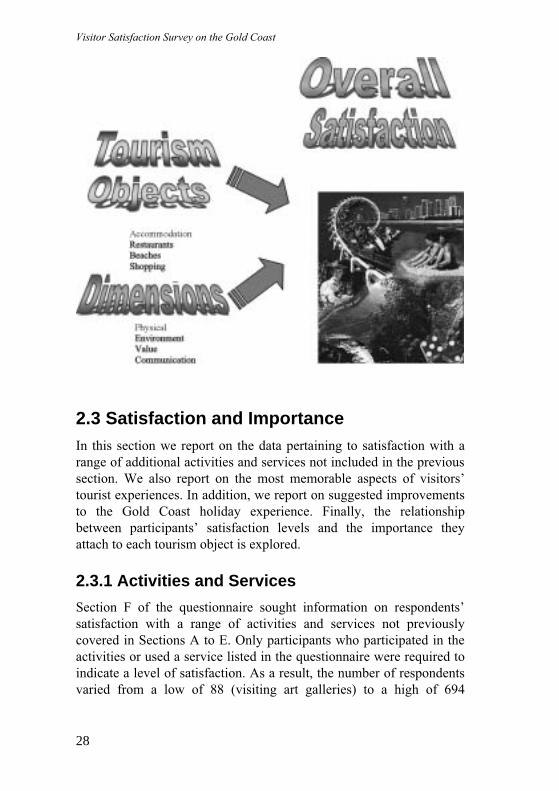
2.3 Satisfaction and ImportanceIn this section we report on the data pertaining to satisfaction with a
range of additional activities and services not included in the previous
section. We also report on the most memorable aspects of visitors’
tourist experiences. In addition, we report on suggested improvements
to the Gold Coast holiday experience. Finally, the relationship
between participants’ satisfaction levels and the importance they
attach to each tourism object is explored.
2.3.1 Activities and Services
Section F of the questionnaire sought information on respondents’
satisfaction with a range of activities and services not previously
covered in Sections A to E. Only participants who participated in the
activities or used a service listed in the questionnaire were required to
indicate a level of satisfaction. As a result, the number of respondents
varied from a low of 88 (visiting art galleries) to a high of 694
2. Results
29
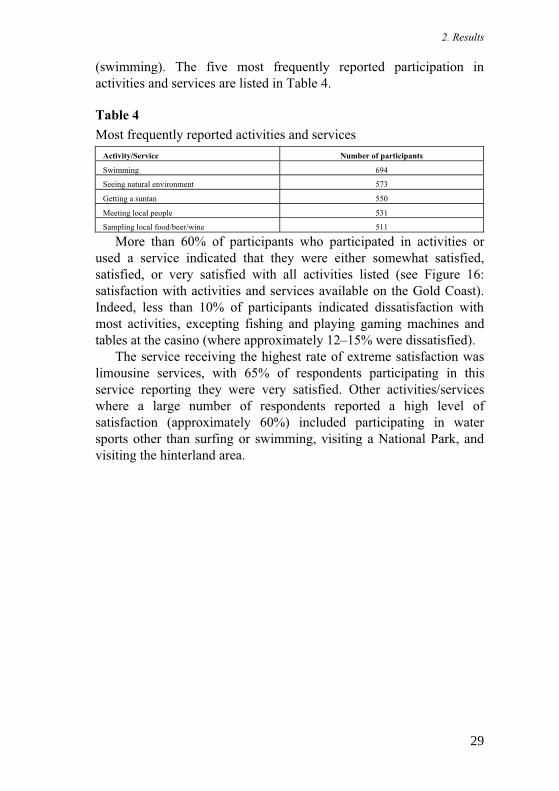
(swimming). The five most frequently reported participation in
activities and services are listed in Table 4.
Table 4
Most frequently reported activities and services
Activity/Service Number of participants
Swimming 694
Seeing natural environment 573
Getting a suntan 550
Meeting local people 531
Sampling local food/beer/wine 511
More than 60% of participants who participated in activities or
used a service indicated that they were either somewhat satisfied,
satisfied, or very satisfied with all activities listed (see Figure 16:
satisfaction with activities and services available on the Gold Coast).
Indeed, less than 10% of participants indicated dissatisfaction with
most activities, excepting fishing and playing gaming machines and
tables at the casino (where approximately 12–15% were dissatisfied).
The service receiving the highest rate of extreme satisfaction was
limousine services, with 65% of respondents participating in this
service reporting they were very satisfied. Other activities/services
where a large number of respondents reported a high level of
satisfaction (approximately 60%) included participating in water
sports other than surfing or swimming, visiting a National Park, and
visiting the hinterland area.

Visitor Satisfaction Survey on the Gold Coast
30
[Note: numbers in parentheses indicate number of respondents participating in each
activity]
Figure 16
Satisfaction with Activities and Services Available on the Gold Coast
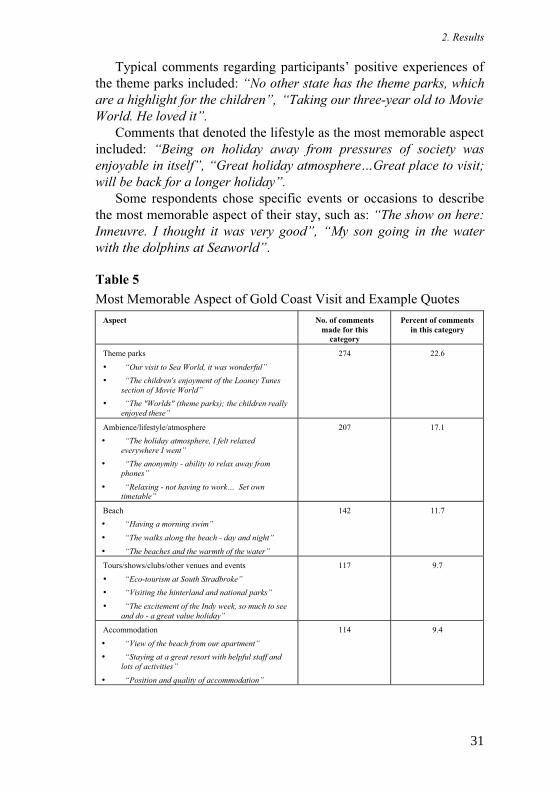
2.3.2 Memorable Aspects of StayParticipants were asked to report the most memorable aspect of their
visit to the Gold Coast. The ranges of responses were coded into the
11 broader categories listed in Table 5. A total of 797 respondents
listed at least one memorable aspect, generating a total of 1210
comments. The most popular response categories, in order, were:
� theme parks experience,
� overall Gold Coast lifestyle, and
� beach experience.
2. Results
31
Typical comments regarding participants’ positive experiences of
the theme parks included: “No other state has the theme parks, which
are a highlight for the children”, “Taking our three-year old to Movie
World. He loved it”.
Comments that denoted the lifestyle as the most memorable aspect
included: “Being on holiday away from pressures of society was
enjoyable in itself”, “Great holiday atmosphere…Great place to visit;
will be back for a longer holiday”.
Some respondents chose specific events or occasions to describe
the most memorable aspect of their stay, such as: “The show on here:
Inneuvre. I thought it was very good”, “My son going in the water
with the dolphins at Seaworld”.
Table 5
Most Memorable Aspect of Gold Coast Visit and Example Quotes
Aspect No. of comments
made for this
category
Percent of comments
in this category
Theme parks
� “Our visit to Sea World, it was wonderful”
� “The children's enjoyment of the Looney Tunes
section of Movie World”
� “The "Worlds" (theme parks); the children really
enjoyed these”
274 22.6
Ambience/lifestyle/atmosphere
� “The holiday atmosphere, I felt relaxed
everywhere I went”
� “The anonymity - ability to relax away from
phones”
� “Relaxing - not having to work… Set owntimetable”
207 17.1
Beach
� “Having a morning swim”
� “The walks along the beach - day and night”
� “The beaches and the warmth of the water”
142 11.7
Tours/shows/clubs/other venues and events
� “Eco-tourism at South Stradbroke”
� “Visiting the hinterland and national parks”
� “The excitement of the Indy week, so much to see
and do - a great value holiday”
117 9.7
Accommodation
� “View of the beach from our apartment”
� “Staying at a great resort with helpful staff and
lots of activities”
� “Position and quality of accommodation”
114 9.4

Visitor Satisfaction Survey on the Gold Coast
32
Positive social experience
� “Catching up with family members & all having alovely holiday together”
� “Seeing people at the resorts that you met the
year before”
� “Great family experience; reminded me of family
holidays with my parents years ago”
87 7.2
Weather
� “Climate and tropical setting”
� “Sun, cool breeze”
� “Last six days weather-wise”
81 6.7
Positive emotional experience
� “Visit to Binna Burra where we honeymooned 20
years ago”
� “Catching a fish off my grandparents jetty”
� “Finding our great-grandfather's land at
Cudgen”
74 6.1
Food/restaurants/wine
� “Dining at the Paragon Restaurant (birthday
dinner) and Pizza Hut Kirra Beach”
� “Inexpensive meals available at clubs”
� “Going out to dinner each night”
59 4.9
Shopping
� “Shopping at Pacific Fair and Carrara Markets”
� “The great changes over last 10 years in theshopping hours”
� “Exploring shopping centres”
31 2.6
Other
� “Getting lost in Broadbeach on the last day”
� “Purchasing a rental property”
� “Special package available for honeymooners”
24 2.0
Total 1210 100
Note. Based on a multi-response item whereby respondents could indicate more thanone memorable aspect.
2.3.3 Possible Improvements to HolidayExperience
Participants were also asked to record things they would like to see
changed on the Gold Coast that would improve their satisfaction with
their holiday. A total of 488 respondents listed at least one memorable
aspect, generating a total of 564 comments. The wide ranges of
responses were coded into 11 broader categories. Table 6 lists the
most frequent response categories for this item. Changes in
accommodation were the most frequent response from participants,
followed by changes to roads and transport on the Gold Coast.
2. Results
33
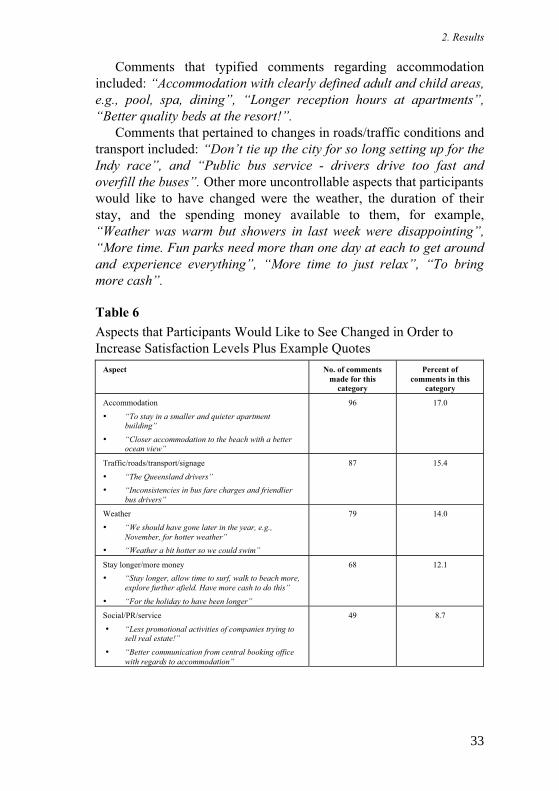
Comments that typified comments regarding accommodation
included: “Accommodation with clearly defined adult and child areas,
e.g., pool, spa, dining”, “Longer reception hours at apartments”,
“Better quality beds at the resort!”.
Comments that pertained to changes in roads/traffic conditions and
transport included: “Don’t tie up the city for so long setting up for the
Indy race”, and “Public bus service - drivers drive too fast and
overfill the buses”. Other more uncontrollable aspects that participants
would like to have changed were the weather, the duration of their
stay, and the spending money available to them, for example,
“Weather was warm but showers in last week were disappointing”,
“More time. Fun parks need more than one day at each to get around
and experience everything”, “More time to just relax”, “To bring
more cash”.
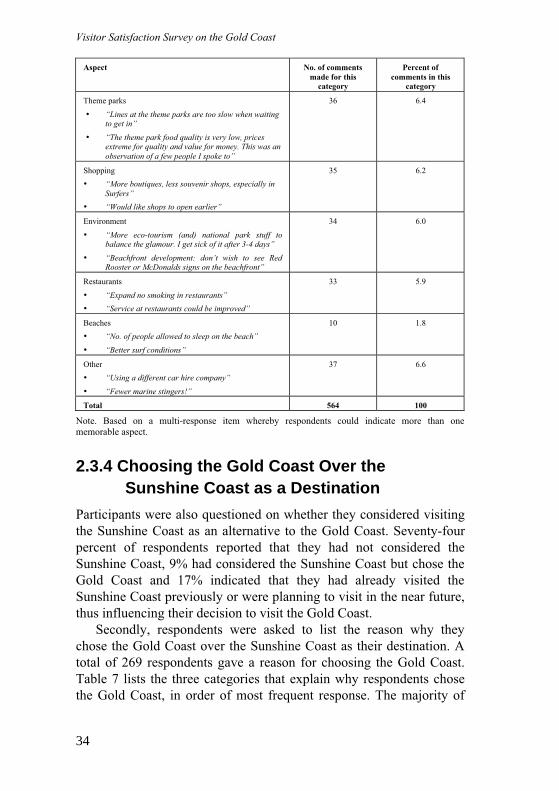
Table 6
Aspects that Participants Would Like to See Changed in Order to
Increase Satisfaction Levels Plus Example Quotes
Aspect No. of comments
made for this
category
Percent of
comments in this
category
Accommodation
� “To stay in a smaller and quieter apartmentbuilding”
� “Closer accommodation to the beach with a betterocean view”
96 17.0
Traffic/roads/transport/signage
� “The Queensland drivers”
� “Inconsistencies in bus fare charges and friendlier
bus drivers”
87 15.4
Weather
� “We should have gone later in the year, e.g.,
November, for hotter weather”
� “Weather a bit hotter so we could swim”
79 14.0
Stay longer/more money
� “Stay longer, allow time to surf, walk to beach more,
explore further afield. Have more cash to do this”
� “For the holiday to have been longer”
68 12.1
Social/PR/service
� “Less promotional activities of companies trying tosell real estate!”
� “Better communication from central booking office
with regards to accommodation”
49 8.7
Visitor Satisfaction Survey on the Gold Coast
34
Aspect No. of comments
made for this
category
Percent of
comments in this
category
Theme parks
� “Lines at the theme parks are too slow when waitingto get in”
� “The theme park food quality is very low, pricesextreme for quality and value for money. This was an
observation of a few people I spoke to”
36 6.4
Shopping
� “More boutiques, less souvenir shops, especially in
Surfers”
� “Would like shops to open earlier”
35 6.2
Environment
� “More eco-tourism (and) national park stuff tobalance the glamour. I get sick of it after 3-4 days”
� “Beachfront development: don’t wish to see RedRooster or McDonalds signs on the beachfront”
34 6.0
Restaurants
� “Expand no smoking in restaurants”
� “Service at restaurants could be improved”
33 5.9
Beaches
� “No. of people allowed to sleep on the beach”
� “Better surf conditions”
10 1.8
Other
� “Using a different car hire company”
� “Fewer marine stingers!”
37 6.6
Total 564 100
Note. Based on a multi-response item whereby respondents could indicate more than one
memorable aspect.
2.3.4 Choosing the Gold Coast Over theSunshine Coast as a Destination
Participants were also questioned on whether they considered visiting
the Sunshine Coast as an alternative to the Gold Coast. Seventy-four
percent of respondents reported that they had not considered the
Sunshine Coast, 9% had considered the Sunshine Coast but chose the
Gold Coast and 17% indicated that they had already visited the
Sunshine Coast previously or were planning to visit in the near future,
thus influencing their decision to visit the Gold Coast.
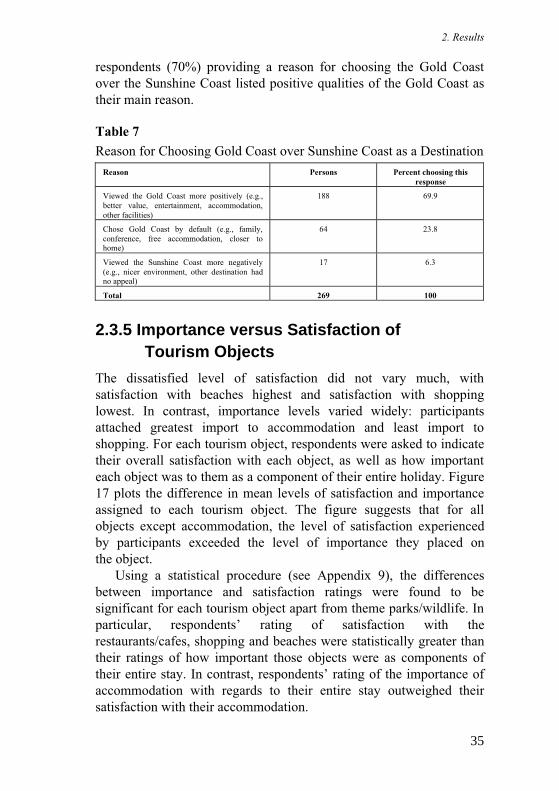
Secondly, respondents were asked to list the reason why they
chose the Gold Coast over the Sunshine Coast as their destination. A
total of 269 respondents gave a reason for choosing the Gold Coast.
Table 7 lists the three categories that explain why respondents chose
the Gold Coast, in order of most frequent response. The majority of
2. Results
35
respondents (70%) providing a reason for choosing the Gold Coast
over the Sunshine Coast listed positive qualities of the Gold Coast as
their main reason.
Table 7
Reason for Choosing Gold Coast over Sunshine Coast as a Destination
Reason Persons Percent choosing this
response
Viewed the Gold Coast more positively (e.g.,
better value, entertainment, accommodation,
other facilities)
188 69.9
Chose Gold Coast by default (e.g., family,
conference, free accommodation, closer tohome)
64 23.8
Viewed the Sunshine Coast more negatively
(e.g., nicer environment, other destination hadno appeal)
17 6.3
Total 269 100
2.3.5 Importance versus Satisfaction ofTourism Objects
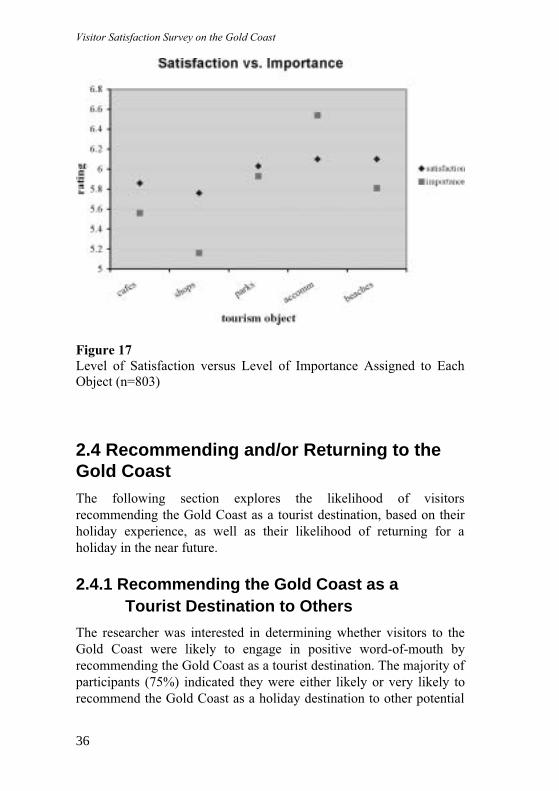
The dissatisfied level of satisfaction did not vary much, with
satisfaction with beaches highest and satisfaction with shopping
lowest. In contrast, importance levels varied widely: participants
attached greatest import to accommodation and least import to
shopping. For each tourism object, respondents were asked to indicate
their overall satisfaction with each object, as well as how important
each object was to them as a component of their entire holiday. Figure
17 plots the difference in mean levels of satisfaction and importance
assigned to each tourism object. The figure suggests that for all
objects except accommodation, the level of satisfaction experienced
by participants exceeded the level of importance they placed on
the object.
Using a statistical procedure (see Appendix 9), the differences
between importance and satisfaction ratings were found to be
significant for each tourism object apart from theme parks/wildlife. In
particular, respondents’ rating of satisfaction with the
restaurants/cafes, shopping and beaches were statistically greater than
their ratings of how important those objects were as components of
their entire stay. In contrast, respondents’ rating of the importance of
accommodation with regards to their entire stay outweighed their
satisfaction with their accommodation.
Visitor Satisfaction Survey on the Gold Coast
36
Figure 17
Level of Satisfaction versus Level of Importance Assigned to Each
Object (n=803)
2.4 Recommending and/or Returning to theGold CoastThe following section explores the likelihood of visitors
recommending the Gold Coast as a tourist destination, based on their
holiday experience, as well as their likelihood of returning for a
holiday in the near future.
2.4.1 Recommending the Gold Coast as aTourist Destination to Others
The researcher was interested in determining whether visitors to the
Gold Coast were likely to engage in positive word-of-mouth by
recommending the Gold Coast as a tourist destination. The majority of
participants (75%) indicated they were either likely or very likely to
recommend the Gold Coast as a holiday destination to other potential

2. Results
37
visitors, with a large proportion (43%) suggesting they are very likely
to recommend the Gold Coast. Fourteen percent indicated they were
somewhat likely to make a recommendation. Less than 4% suggested
they were unlikely to recommend the Gold Coast as a tourist
destination, whilst 8% remained neutral on the subject.
Figure 18
Likelihood of Recommending the Gold Coast as a Tourist Destination
to Others
Using a statistical procedure (see Appendix 10), we attempted to
predict the likelihood of respondents recommending the Gold Coast as
a holiday based on their satisfaction levels with the tourism objects
and dimensions. Overall satisfaction with the five objects accounted
for 33% of the variability in likelihood to recommend the Gold Coast.
Individually, all tourism objects apart from theme parks made a large
contribution to this likelihood, with accommodation and shopping
being the strongest predictors. Satisfaction with dimensions across
objects accounted for 25% of the variability on respondents’
likelihood to recommend the Gold Coast. Only the value for money
Visitor Satisfaction Survey on the Gold Coast
38
dimension and the communication dimension made significant
contributions to this likelihood, with the physical environment
dimension and accessibility dimensions failing to add to the
prediction. In other words, the more highly the respondents rated the
Gold Coast accommodation, shopping, value for money and
communication, the more likely they were to recommend it as a
holiday destination.
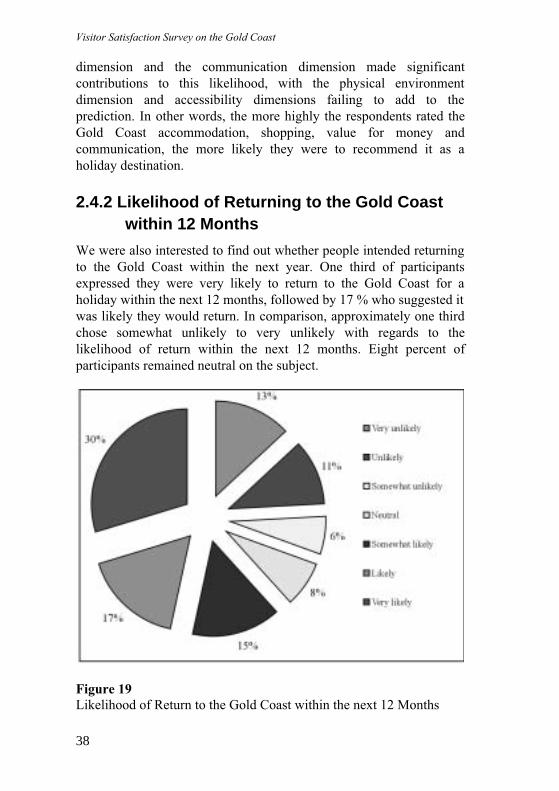
2.4.2 Likelihood of Returning to the Gold Coastwithin 12 Months
We were also interested to find out whether people intended returning
to the Gold Coast within the next year. One third of participants
expressed they were very likely to return to the Gold Coast for a
holiday within the next 12 months, followed by 17 % who suggested it
was likely they would return. In comparison, approximately one third
chose somewhat unlikely to very unlikely with regards to the
likelihood of return within the next 12 months. Eight percent of
participants remained neutral on the subject.
Figure 19
Likelihood of Return to the Gold Coast within the next 12 Months
2. Results
39
Again, a statistical procedure was conducted to predict the
likelihood of returning to the Gold Coast within 12 months based on
satisfaction with the tourism objects and dimensions. These variables
were unable to predict respondents’ likelihood of return, suggesting
that factors other than those tested are responsible for respondents’
decision to return for a holiday in the near future.
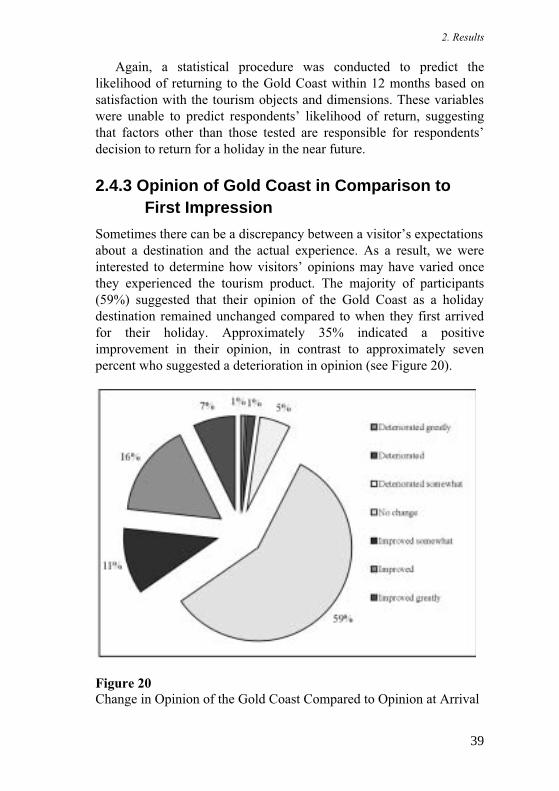
2.4.3 Opinion of Gold Coast in Comparison toFirst Impression
Sometimes there can be a discrepancy between a visitor’s expectations
about a destination and the actual experience. As a result, we were
interested to determine how visitors’ opinions may have varied once
they experienced the tourism product. The majority of participants
(59%) suggested that their opinion of the Gold Coast as a holiday
destination remained unchanged compared to when they first arrived
for their holiday. Approximately 35% indicated a positive
improvement in their opinion, in contrast to approximately seven
percent who suggested a deterioration in opinion (see Figure 20).
Figure 20
Change in Opinion of the Gold Coast Compared to Opinion at Arrival
Visitor Satisfaction Survey on the Gold Coast
40
2.4.4 Match Between Promotional Materialand Experience
The questionnaire also asked whether promotional material
(advertising) seen prior to a visit to the Gold Coast actually matched
the visitors’ experience of the Gold Coast. Of the 615 respondents
who reported seeing materials, 47% felt it matched up, 42% felt it
somewhat matched up, and 11% felt it did not match up. These
findings suggest that the Gold Coast is being marketed to tourists in a
realistic way.
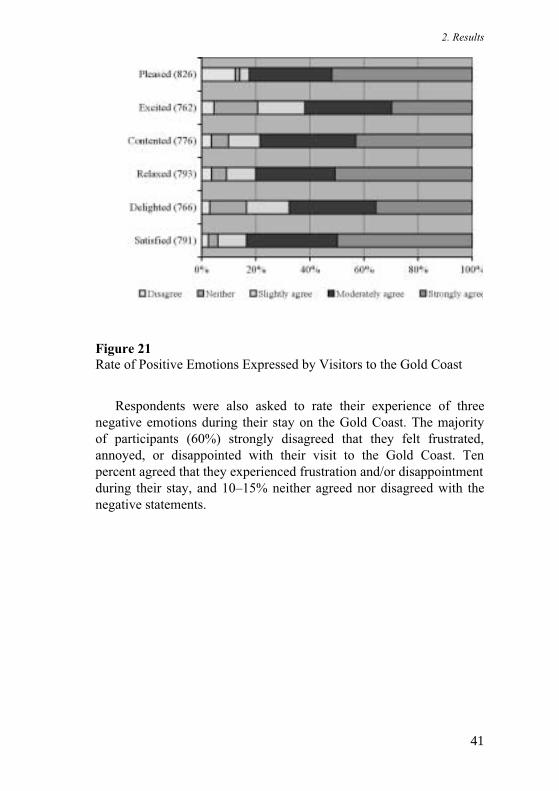
2.4.5 Visitors’ Emotional Responses to theGold Coast
Figure 21 details a list of positive emotions that participants may have
experienced in varying degrees during their visit to the Gold Coast.
Respondents were asked to rate six positive emotions according to
how strongly they agree or disagree to experiencing each adjective on
a seven-point scale. The variation in number of respondents on each
item may be due to the order effects in which the items were presented
(i.e., ‘pleased’ was the first item listed, and respondents may have
chosen to answer only the first item). Approximately 50% strongly
agreed that they felt pleased, relaxed, and satisfied with their stay on
the Gold Coast, with a further 30% indicating they moderately agree
with those statements. Less than 5% disagreed that they experienced
any of the above positive emotions excepting ‘pleased’, whereby
approximately 15% disagreed with the statement.
2. Results
41
Figure 21
Rate of Positive Emotions Expressed by Visitors to the Gold Coast
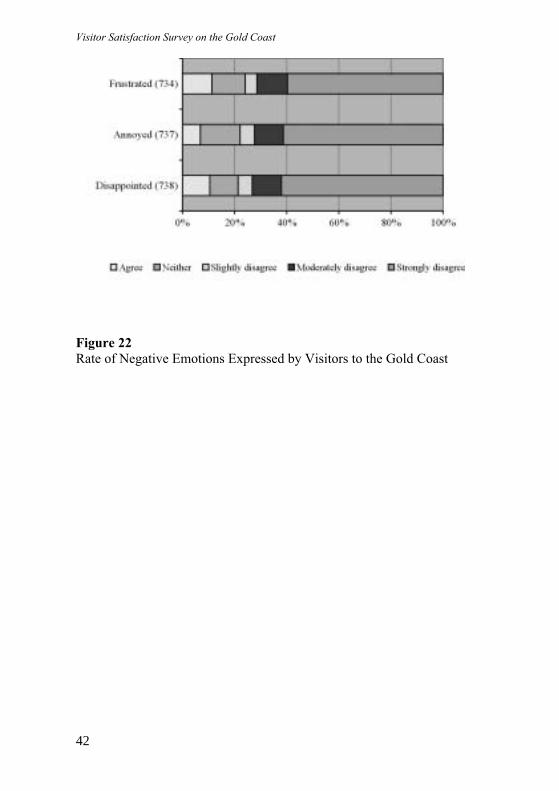
Respondents were also asked to rate their experience of three
negative emotions during their stay on the Gold Coast. The majority
of participants (60%) strongly disagreed that they felt frustrated,
annoyed, or disappointed with their visit to the Gold Coast. Ten
percent agreed that they experienced frustration and/or disappointment
during their stay, and 10–15% neither agreed nor disagreed with the
negative statements.
Visitor Satisfaction Survey on the Gold Coast
42
Figure 22
Rate of Negative Emotions Expressed by Visitors to the Gold Coast
3. ConclusionsThis study sought to collect a range of information about visitor
satisfaction with the Gold Coast region as a tourist destination. As
such, it provides vital baseline data for the ongoing monitoring of the
quality of Gold Coast tourism services, from the tourists’ perspective.
The overall satisfaction with the Gold Coast as a tourist destination
was high, with a large proportion of visitors indicating that they would
recommend the destination to others. This section briefly comments
on each of the tourist objects investigated and makes some
suggestions for future research.
3.1 Restaurants and CafesIn general, respondents were satisfied with the quality of Gold Coast
restaurants and cafes. In particular, the accessibility was highly
satisfying. Although dissatisfaction was minimal the three areas
receiving most poor ratings were: value for money, service and
communication style of staff. While all the dimensions were shown to
be significant predictors of satisfaction with restaurants and cafes,
most increases in satisfaction are likely to arise through attention to
service and staff communication. Here the focus is on moving people
from satisfied to very satisfied. Thus excelling in service delivery.
3.2 ShoppingOverall, respondents were satisfied with the shopping experience on
the Gold Coast. Accessibility of shopping outlets was rated highly.
Most dissatisfaction appears to arise with value for money and
communication style of staff, although the percentages are quite low.
Once again, all dimensions contribute to overall satisfaction with
shopping on the Gold Coast. In particular, attention to issues of staff
communication and value for money are likely to increase satisfaction
with shopping outlets.
Visitor Satisfaction Survey on the Gold Coast
44
3.3 Theme Parks and WildlifeThe strongest levels of satisfaction for theme parks were associated
with the park’s physical environment and communication style of
staff. Theme parks were a memorable experience for visitors to the
Gold Coast and it appears the maintenance and evolution of this sector
is important for the longer-term attractiveness of the destination.
Three dimensions (the physical environment, service and value for
money) were shown to be important predictors of overall satisfaction
with theme parks. In particular, increases in satisfaction with the
environment and value for money are likely to result in enhancing
overall satisfaction with theme parks.
3.4 AccommodationThe accommodation sector of the Gold Coast was rated positively.
Strong ratings of satisfaction were noted for all dimensions. The
communication style of staff stood out as especially positive, although
some visitors also experienced dissatisfaction with this dimension.
Accommodation was especially important as a component of the
overall holiday experience. Interestingly, this object showed the
biggest “gap” between levels of satisfaction achieved and importance.
As a result, it is recommended that accommodation proprietors
continue to work on customer satisfaction. All of the dimensions were
important predictors of overall satisfaction with accommodation.
However, the physical environment, service and value for money
made the most unique contribution to achieved satisfaction levels.
3.5 BeachesThe Gold Coast beaches were positively evaluated by visitors, as
demonstrated by strong levels of satisfaction for all dimensions. Three
of the dimensions were significant predictors of overall satisfaction
with beaches: the environment; service; and value. The most
important of these is the environment, which included the conditions
experienced at the beaches, as well as the physical environment. As
satisfaction with this dimension increases so does overall satisfaction
with the Gold Coast beaches.
3. Conclusions
45
3.6 Overall Satisfaction with the Gold CoastAs part of their satisfaction with the overall experience of the Gold
Coast, participants rated accommodation as the most important object.
Similarly, the results of the statistical analysis supported that any
increases in levels of satisfaction with accommodation would result in
overall satisfaction with the Gold Coast as a destination increasing.
Other tourism objects to contribute to overall satisfaction with the
Gold Coast included the beaches and restaurants.
Based on qualitative remarks made by participants, the three most
memorable aspects of a visit to the Gold Coast were the theme parks,
the lifestyle offered and the beaches. The theme parks offered many a
chance to watch family members enjoy themselves, whereas the
lifestyle and beach provided a sense of peace and relaxation. The Gold
Coast appears as a highly satisfying tourist destination with a good
range of tourist activities and services on offer. Swimming, seeing the
natural environment and getting a suntan were common activities
among respondents. Respondents viewed visits to the hinterland and
national parks very positively.
In general, the impression of the Gold Coast that visitors held after
arriving either improved or remained as previously held, thus showing
a good match between expectations and perceptions. Similarly,
visitors felt the marketing material for the Gold Coast matched what
they had experienced on their visit. Some 60% of visitors indicated
they would return to the Gold Coast within the next 12 months and
almost 90% indicated a likelihood of recommending the destination to
others.
3.7 OtherWeather seems to directly influence how visitors perceive satisfaction
with various objects. Not surprisingly poor weather led to lower levels
of satisfaction. As a result, it is an area where some attention may be
possible. For instance, it may be possible to devise a ‘Guide to
Enjoying the Gold Coast in Wet Weather’.

Visitor Satisfaction Survey on the Gold Coast
46
3.8 Further ResearchAlthough the information received from the participants is generally
favourable, there are some areas where further investigation may be
warranted:
1. This study provides important baseline data, which needs to
be replicated periodically for full value to be realised. Thus, it is
recommended replicating this study using the same questionnaire
and method on a biannual basis in order to monitor and track
satisfaction. Such an approach will make possible the monitoring
of improvements and deficiencies in service quality, as reflected
in visitor satisfaction measures.
2. The value for money at some of the tourism objects resulted
in expressions of dissatisfaction. Some attention to increasing
perceptions of value for money may be useful. Further, some
additional research into how perceptions of value are formed
may be warranted.
3. Some concerns over the public transport system were
expressed in open-ended questions. For instance, some
respondents mentioned concerns over consistency of fares and
friendliness of drivers. Further research into satisfaction with the
transport system may be helpful, as the information received was
primarily qualitative.
In conclusion, this study has found a high level of satisfaction with
the Gold Coast as a tourist destination. Nevertheless, the maintenance
of service quality at current levels (no matter how good they are) is
not enough in an increasingly competitive environment where
benchmarks are constantly rising. Similarly, tourists are becoming
more critical and demanding, always seeking higher standards and
better value for their money. Thus, studies such as this need to be
complemented by audits of procedures adopted by organisations to
improve the quality of service and by reference to industry best
practice in these areas.

Appendix 1: Gold Coast TourismSatisfaction Questionnaire
THANK YOU FOR AGREEING TO COMPLETE THIS
QUESTIONNAIRE. PLEASE READ THE FOLLOWING
INSTRUCTIONS BEFORE COMPLETING THE QUESTIONNAIRE:
This questionnaire seeks to obtain information about your holiday experience while on
the Gold Coast. The questionnaire is being conducted by Griffith University and the
Cooperative Research Council (CRC) for Sustainable Tourism. Your answers are
entirely confidential and anonymous – please do not write your name on the
questionnaire. Most questions can be answered by circling the number that corresponds
to your satisfaction with a particular aspect of your tourist experience. For example, if
you were satisfied with the hours of opening of restaurants and cafes, you would circle
number ‘6’:

Appendix 1
48
Section A. Restaurants And Cafes
Did you eat out at any a la carte, sit down restaurants or cafes during
your visit to the Gold Coast? If you did not, please go directly to
Section B. If you did, please answer the following questions.
13. Where were the restaurants and cafes that you used most
during your holiday? (For example, Surfers Paradise, Main
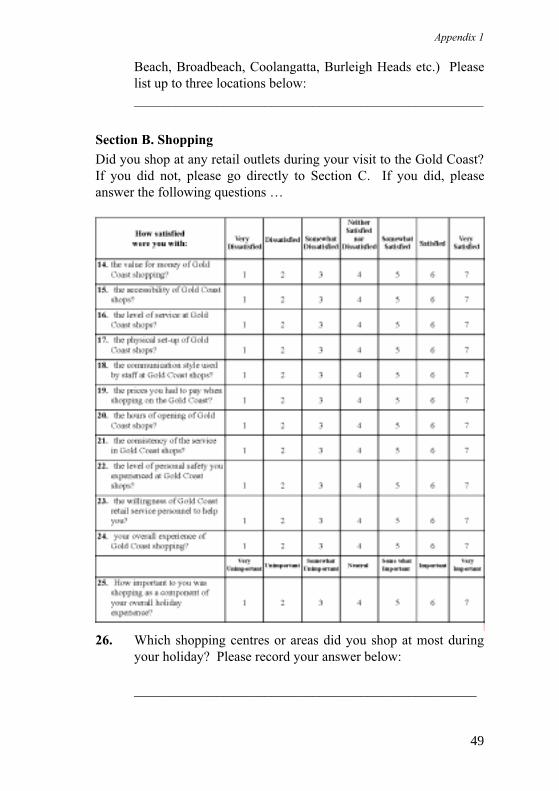
Appendix 1
49
Beach, Broadbeach, Coolangatta, Burleigh Heads etc.) Please
list up to three locations below:
___________________________________________________
Section B. Shopping
Did you shop at any retail outlets during your visit to the Gold Coast?
If you did not, please go directly to Section C. If you did, please
answer the following questions …
26. Which shopping centres or areas did you shop at most during
your holiday? Please record your answer below:
__________________________________________________
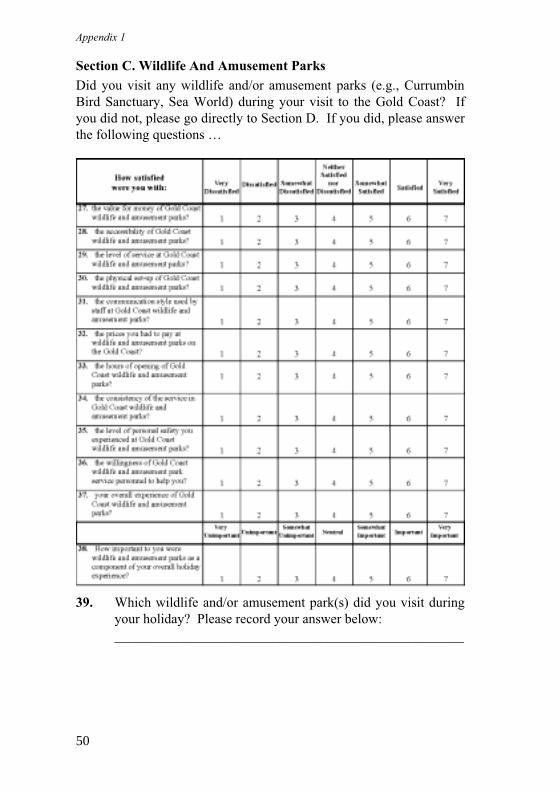
Appendix 1
50
Section C. Wildlife And Amusement Parks
Did you visit any wildlife and/or amusement parks (e.g., Currumbin
Bird Sanctuary, Sea World) during your visit to the Gold Coast? If
you did not, please go directly to Section D. If you did, please answer
the following questions …
39. Which wildlife and/or amusement park(s) did you visit during
your holiday? Please record your answer below:
___________________________________________________
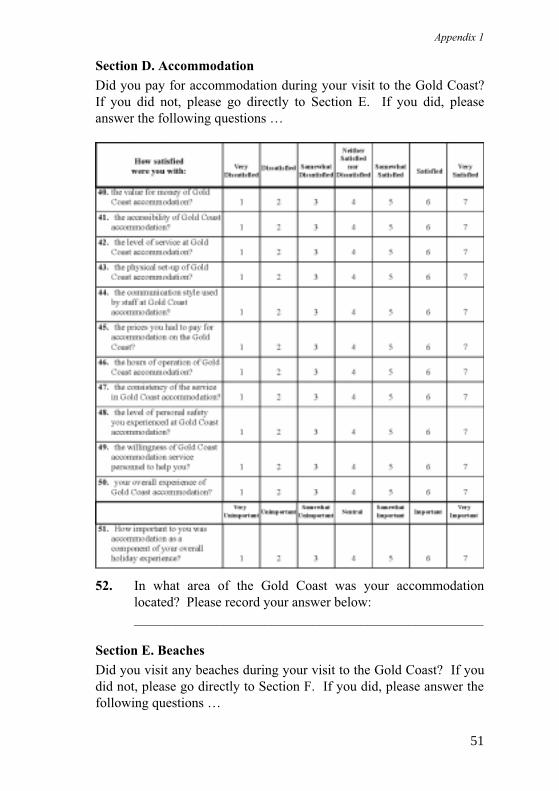
Appendix 1
51
Section D. Accommodation
Did you pay for accommodation during your visit to the Gold Coast?
If you did not, please go directly to Section E. If you did, please
answer the following questions …
52. In what area of the Gold Coast was your accommodation
located? Please record your answer below:
___________________________________________________
Section E. Beaches
Did you visit any beaches during your visit to the Gold Coast? If you
did not, please go directly to Section F. If you did, please answer the
following questions …
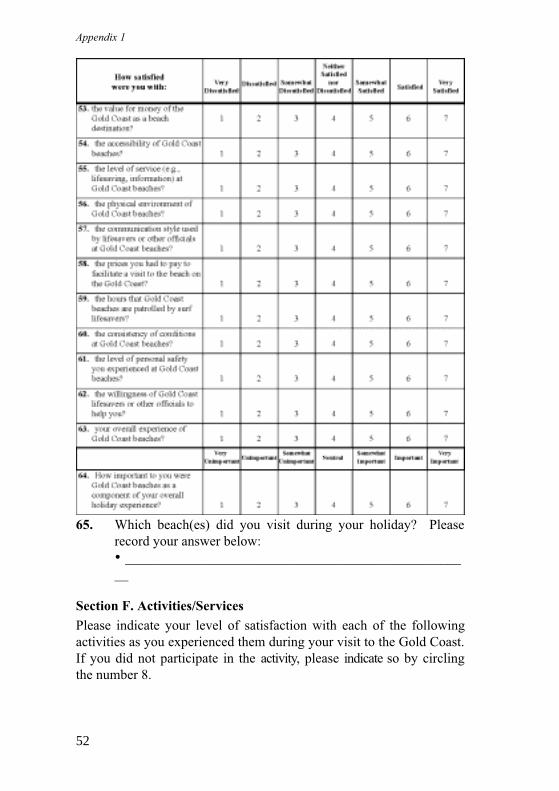
Appendix 1
52
65. Which beach(es) did you visit during your holiday? Please
record your answer below:
� _________________________________________________
__
Section F. Activities/Services
Please indicate your level of satisfaction with each of the following
activities as you experienced them during your visit to the Gold Coast.
If you did not participate in the activity, please indicate so by circling
the number 8.
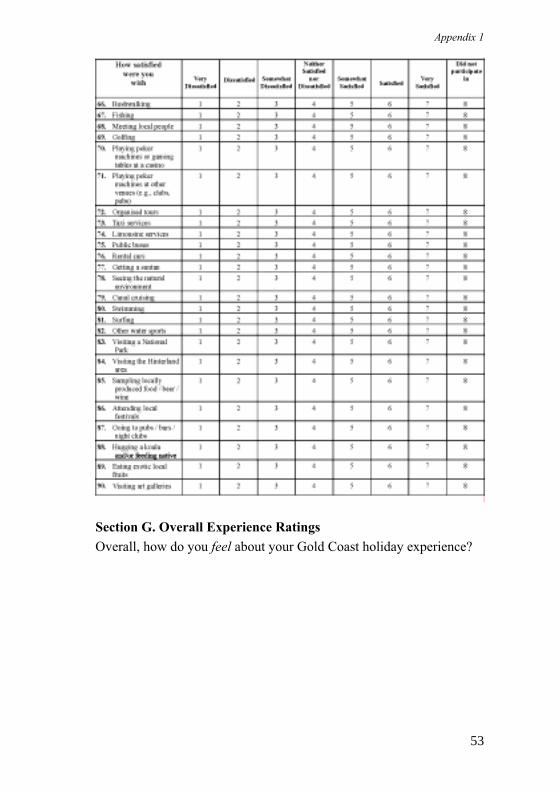
Appendix 1
53
Section G. Overall Experience Ratings
Overall, how do you feel about your Gold Coast holiday experience?
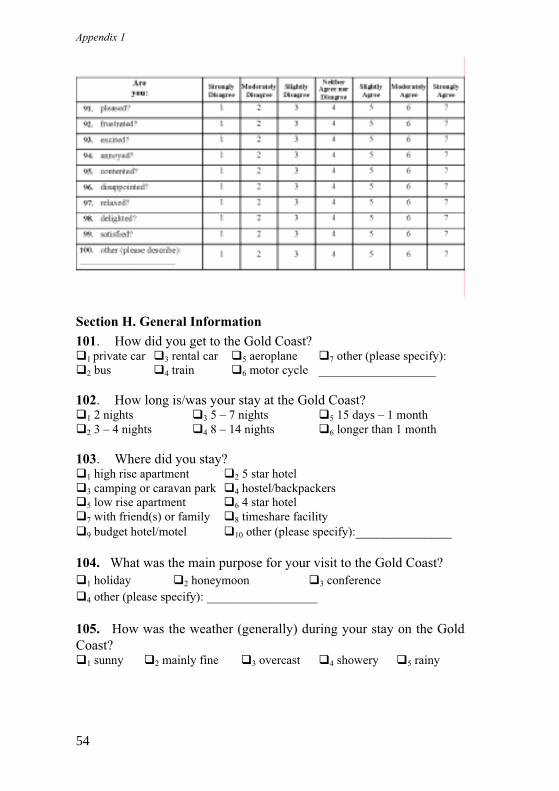
Appendix 1
54
Section H. General Information
101. How did you get to the Gold Coast?�1 private car �3 rental car �5 aeroplane �7 other (please specify):
�2 bus �4 train �6 motor cycle ___________________
102. How long is/was your stay at the Gold Coast?�1 2 nights �3 5 – 7 nights �5 15 days – 1 month
�2 3 – 4 nights �4 8 – 14 nights �6 longer than 1 month
103. Where did you stay?�1 high rise apartment �2 5 star hotel
�3 camping or caravan park �4 hostel/backpackers
�5 low rise apartment �6 4 star hotel
�7 with friend(s) or family �8 timeshare facility
�9 budget hotel/motel �10 other (please specify):______________
104. What was the main purpose for your visit to the Gold Coast?
�1 holiday �2 honeymoon �3 conference
�4 other (please specify): __________________
105. How was the weather (generally) during your stay on the Gold
Coast?�1 sunny �2 mainly fine �3 overcast �4 showery �5 rainy
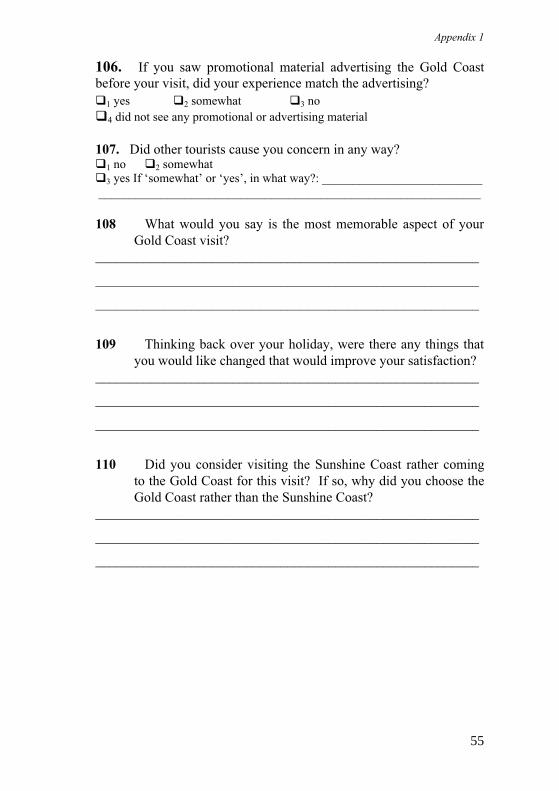
Appendix 1
55
106. If you saw promotional material advertising the Gold Coast
before your visit, did your experience match the advertising?
�1 yes �2 somewhat �3 no
�4 did not see any promotional or advertising material
107. Did other tourists cause you concern in any way?�1 no �2 somewhat
�3 yes If ‘somewhat’ or ‘yes’, in what way?: __________________________
______________________________________________________________
108 What would you say is the most memorable aspect of your
Gold Coast visit?________________________________________________________
________________________________________________________
________________________________________________________
109 Thinking back over your holiday, were there any things that
you would like changed that would improve your satisfaction?________________________________________________________
________________________________________________________
________________________________________________________
110 Did you consider visiting the Sunshine Coast rather coming
to the Gold Coast for this visit? If so, why did you choose the
Gold Coast rather than the Sunshine Coast?________________________________________________________
________________________________________________________
________________________________________________________
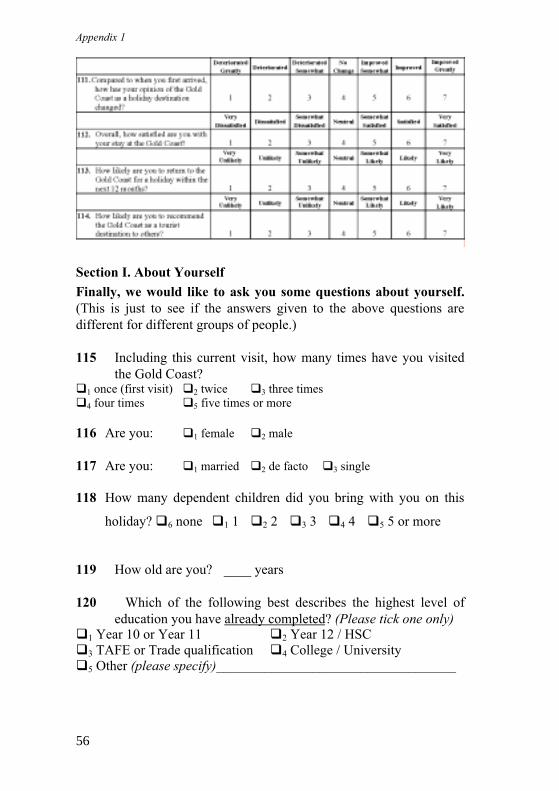
Appendix 1
56
Section I. About Yourself
Finally, we would like to ask you some questions about yourself.
(This is just to see if the answers given to the above questions are
different for different groups of people.)
115 Including this current visit, how many times have you visited
the Gold Coast?�1 once (first visit) �2 twice �3 three times
�4 four times �5 five times or more
116 Are you: �1 female �2 male
117 Are you: �1 married �2 de facto �3 single
118 How many dependent children did you bring with you on this
holiday? �6 none �1 1 �2 2 �3 3 �4 4 �5 5 or more
119 How old are you? ____ years
120 Which of the following best describes the highest level of
education you have already completed? (Please tick one only)�1 Year 10 or Year 11 �2 Year 12 / HSC
�3 TAFE or Trade qualification �4 College / University
�5 Other (please specify)___________________________________
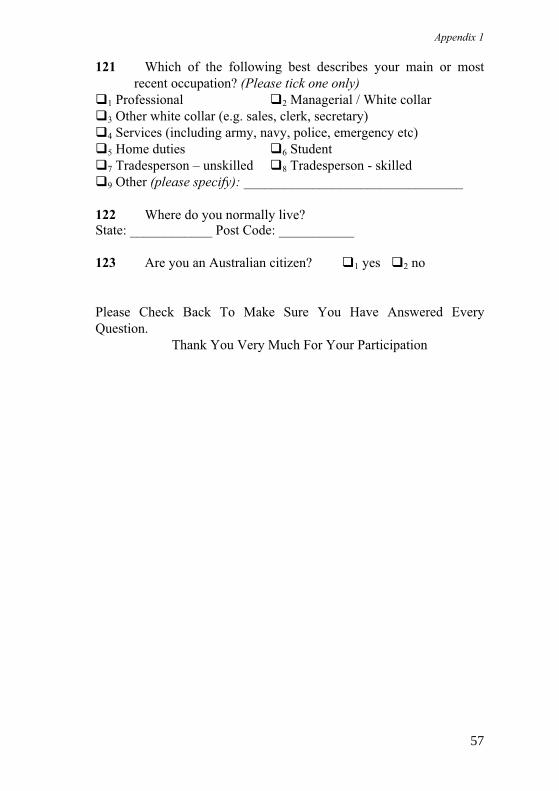
Appendix 1
57
121 Which of the following best describes your main or most
recent occupation? (Please tick one only)
�1 Professional �2 Managerial / White collar
�3 Other white collar (e.g. sales, clerk, secretary)
�4 Services (including army, navy, police, emergency etc)
�5 Home duties �6 Student
�7 Tradesperson – unskilled �8 Tradesperson - skilled
�9 Other (please specify): ________________________________
122 Where do you normally live?State: ____________ Post Code: ___________
123 Are you an Australian citizen? �1 yes �2 no
Please Check Back To Make Sure You Have Answered Every
Question.
Thank You Very Much For Your Participation

Appendix 2: Letter of Instructions toParticipants1999 Gold Coast Tourism Satisfaction Questionnaire
September – October 1999
Dear Visitor to the Gold Coast
How satisfied were you with your Gold Coastexperience?
As someone visiting, or who has just visited, the Gold Coast, we are
seeking your help in completing the enclosed questionnaire. We are
interested in Your views concerning your trip to the Gold Coast, and
anticipate that it will take you around 10 minutes to complete the
questionnaire.
Simply by sharing your views on your Gold Coast visit, you can
Win A Fabulous First Prize Of One Week’s Holiday At An Interval
International Affiliated Resort!! These resorts are located throughout
Australia and New Zealand in areas such as the Gold Coast, Coffs
Harbour and Port Macquarie (NSW), Rosebud (Vic), Port Sorell
(Tas), and Mt Maunganui, Taupo and Queenstown (NZ). Second prize
is a $250 Myer/Grace Bros Shopping Voucher . (Please see the prize
coupon for further details and conditions of entry.)
� To enter the prize draw, all you need to do is:
� Fill in the questionnaire
� To go into the prize draw, fill in your details on the enclosed prize
coupon
� Place the prize coupon in the Small envelope and seal
� Place the Small envelope and the questionnaire into the ‘reply
paid’ envelope
� Pop the ‘reply paid’ envelope in the post!
All information gathered is completely confidential, and will be
analysed and reported in an aggregated format. You will remain
completely anonymous at all times (we ask that you do not write your

Appendix 2
60
name or any other identifying information on the questionnaire).
Questionnaires will be separated from the small sealed envelopes
containing the prize coupon information by university staff, so you
will not be associated with the questionnaire in any way. Names will
not be kept other than the two prize winners (for purpose of prize
disbursement only). Names will not be provided to any other parties.
If you wish to complete the questionnaire, but do not wish to enter the
prize draw, please just return the questionnaire.
Many thanks for your (anticipated) participation in this project!
Dr Beverley Sparks
Associate Professor in Hotel Management

Appendix 3: Letter of Introduction toDistributors
1999 Gold Coast Tourism Satisfaction Questionnaire
September 1999
Dear Sir or Madam
Re: 1999 Gold Coast Tourism Satisfaction Survey
Thank you for agreeing to facilitate the above survey by
distributing questionnaires to potential respondents. By gathering
information about domestic tourists’ satisfaction levels with different
aspects of their holiday, the survey aims to compile information,
which may assist in maintaining and enhancing a quality holiday
experience for Gold Coast visitors. The project, supported by Griffith
University and the Gold Coast Tourism Bureau, is funded by the
Cooperative Research Centre for Sustainable Tourism, Gold Coast
City Council, and industry.
As we require responses from domestic tourists towards the end
of their stay, we ask that you distribute one survey package to each
applicable unit/room on the day before your guests are scheduled to
depart. Each survey package comprises one A4 envelope containing:
� the questionnaire,
� an introductory letter, including a tear-off coupon to enter the prize
draw,
� a small envelope to seal their prize coupon in, and
� a ‘reply paid’ envelope to return the completed questionnaire and
prize coupon.
The introductory letter will encourage each guest to complete the
questionnaire, and place it, together with their prize draw coupon, in
the reply paid envelope provided. Should guests leave the reply paid
envelope containing the questionnaire with your staff, we would

Appendix 3
62
appreciate your assistance in arranging for its postage back to the
University.
Should you have any queries regarding any component of the
survey, please do not hesitate to contact my senior research assistant,
Tess Collie (phone 55 948 298). Many thanks again for your kind
assistance with this research project.
Yours faithfully
Dr Beverley Sparks
Associate Professor in Hotel Management
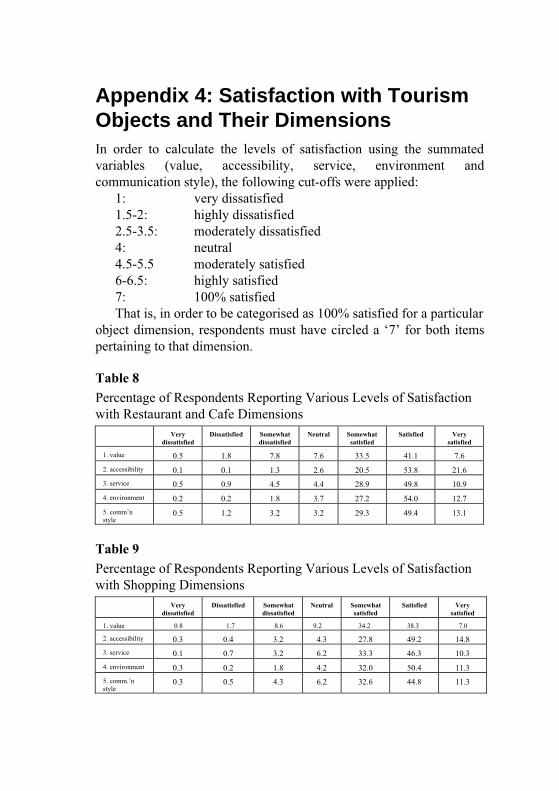
Appendix 4: Satisfaction with TourismObjects and Their DimensionsIn order to calculate the levels of satisfaction using the summated
variables (value, accessibility, service, environment and
communication style), the following cut-offs were applied:
1: very dissatisfied
1.5-2: highly dissatisfied
2.5-3.5: moderately dissatisfied
4: neutral
4.5-5.5 moderately satisfied
6-6.5: highly satisfied
7: 100% satisfied
That is, in order to be categorised as 100% satisfied for a particular
object dimension, respondents must have circled a ‘7’ for both items
pertaining to that dimension.
Table 8
Percentage of Respondents Reporting Various Levels of Satisfaction
with Restaurant and Cafe Dimensions
Very
dissatisfied
Dissatisfied Somewhat
dissatisfied
Neutral Somewhat
satisfied
Satisfied Very
satisfied
1. value 0.5 1.8 7.8 7.6 33.5 41.1 7.6
2. accessibility 0.1 0.1 1.3 2.6 20.5 53.8 21.6
3. service 0.5 0.9 4.5 4.4 28.9 49.8 10.9
4. environment 0.2 0.2 1.8 3.7 27.2 54.0 12.7
5. comm’n
style0.5 1.2 3.2 3.2 29.3 49.4 13.1
Table 9
Percentage of Respondents Reporting Various Levels of Satisfaction
with Shopping Dimensions
Very
dissatisfied
Dissatisfied Somewhat
dissatisfied
Neutral Somewhat
satisfied
Satisfied Very
satisfied
1. value 0.8 1.7 8.6 9.2 34.2 38.3 7.0
2. accessibility 0.3 0.4 3.2 4.3 27.8 49.2 14.8
3. service 0.1 0.7 3.2 6.2 33.3 46.3 10.3
4. environment 0.3 0.2 1.8 4.2 32.0 50.4 11.3
5. comm.’n
style0.3 0.5 4.3 6.2 32.6 44.8 11.3
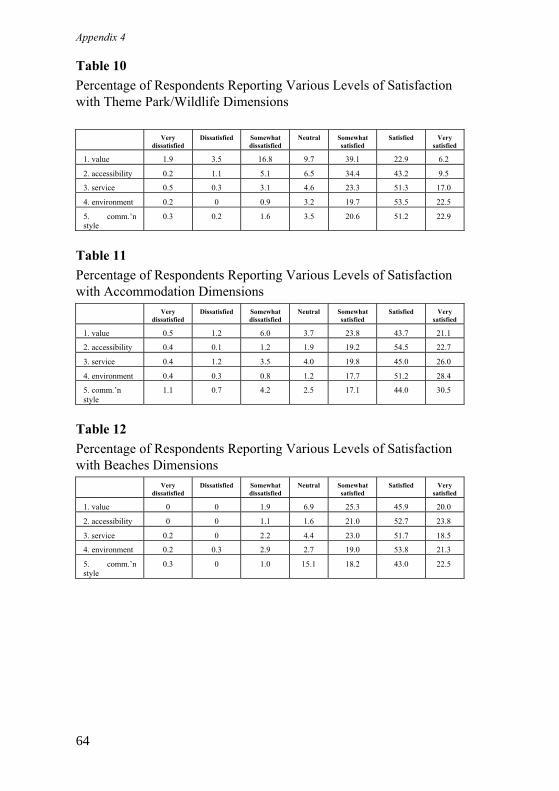
Appendix 4
64
Table 10
Percentage of Respondents Reporting Various Levels of Satisfaction
with Theme Park/Wildlife Dimensions
Very
dissatisfied
Dissatisfied Somewhat
dissatisfied
Neutral Somewhat
satisfied
Satisfied Very
satisfied
1. value 1.9 3.5 16.8 9.7 39.1 22.9 6.2
2. accessibility 0.2 1.1 5.1 6.5 34.4 43.2 9.5
3. service 0.5 0.3 3.1 4.6 23.3 51.3 17.0
4. environment 0.2 0 0.9 3.2 19.7 53.5 22.5
5. comm.’nstyle
0.3 0.2 1.6 3.5 20.6 51.2 22.9
Table 11
Percentage of Respondents Reporting Various Levels of Satisfaction
with Accommodation Dimensions
Very
dissatisfied
Dissatisfied Somewhat
dissatisfied
Neutral Somewhat
satisfied
Satisfied Very
satisfied
1. value 0.5 1.2 6.0 3.7 23.8 43.7 21.1
2. accessibility 0.4 0.1 1.2 1.9 19.2 54.5 22.7
3. service 0.4 1.2 3.5 4.0 19.8 45.0 26.0
4. environment 0.4 0.3 0.8 1.2 17.7 51.2 28.4
5. comm.’n
style
1.1 0.7 4.2 2.5 17.1 44.0 30.5
Table 12
Percentage of Respondents Reporting Various Levels of Satisfaction
with Beaches Dimensions
Very
dissatisfied
Dissatisfied Somewhat
dissatisfied
Neutral Somewhat
satisfied
Satisfied Very
satisfied
1. value 0 0 1.9 6.9 25.3 45.9 20.0
2. accessibility 0 0 1.1 1.6 21.0 52.7 23.8
3. service 0.2 0 2.2 4.4 23.0 51.7 18.5
4. environment 0.2 0.3 2.9 2.7 19.0 53.8 21.3
5. comm.’nstyle
0.3 0 1.0 15.1 18.2 43.0 22.5
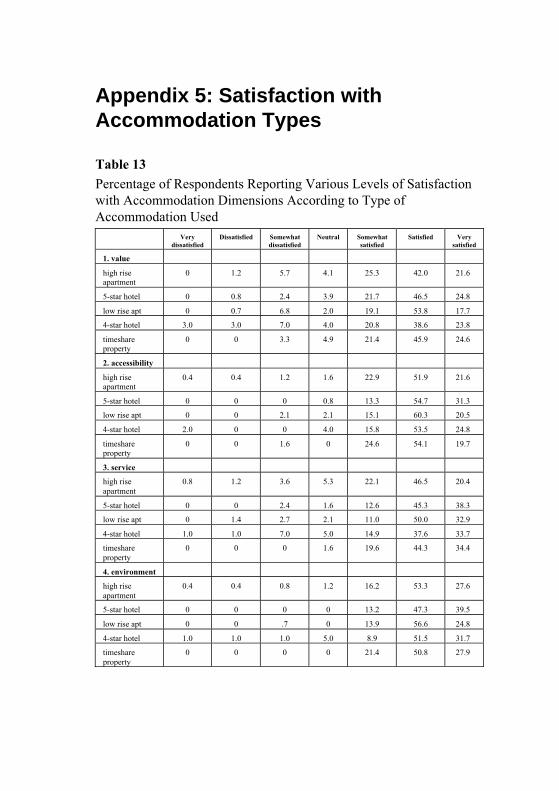
Appendix 5: Satisfaction withAccommodation Types
Table 13
Percentage of Respondents Reporting Various Levels of Satisfaction
with Accommodation Dimensions According to Type of
Accommodation Used
Very
dissatisfied
Dissatisfied Somewhat
dissatisfied
Neutral Somewhat
satisfied
Satisfied Very
satisfied
1. value
high riseapartment
0 1.2 5.7 4.1 25.3 42.0 21.6
5-star hotel 0 0.8 2.4 3.9 21.7 46.5 24.8
low rise apt 0 0.7 6.8 2.0 19.1 53.8 17.7
4-star hotel 3.0 3.0 7.0 4.0 20.8 38.6 23.8
timeshareproperty
0 0 3.3 4.9 21.4 45.9 24.6
2. accessibility
high riseapartment
0.4 0.4 1.2 1.6 22.9 51.9 21.6
5-star hotel 0 0 0 0.8 13.3 54.7 31.3
low rise apt 0 0 2.1 2.1 15.1 60.3 20.5
4-star hotel 2.0 0 0 4.0 15.8 53.5 24.8
timeshareproperty
0 0 1.6 0 24.6 54.1 19.7
3. service
high rise
apartment
0.8 1.2 3.6 5.3 22.1 46.5 20.4
5-star hotel 0 0 2.4 1.6 12.6 45.3 38.3
low rise apt 0 1.4 2.7 2.1 11.0 50.0 32.9
4-star hotel 1.0 1.0 7.0 5.0 14.9 37.6 33.7
timeshare
property
0 0 0 1.6 19.6 44.3 34.4
4. environment
high rise
apartment
0.4 0.4 0.8 1.2 16.2 53.3 27.6
5-star hotel 0 0 0 0 13.2 47.3 39.5
low rise apt 0 0 .7 0 13.9 56.6 24.8
4-star hotel 1.0 1.0 1.0 5.0 8.9 51.5 31.7
timeshare
property
0 0 0 0 21.4 50.8 27.9
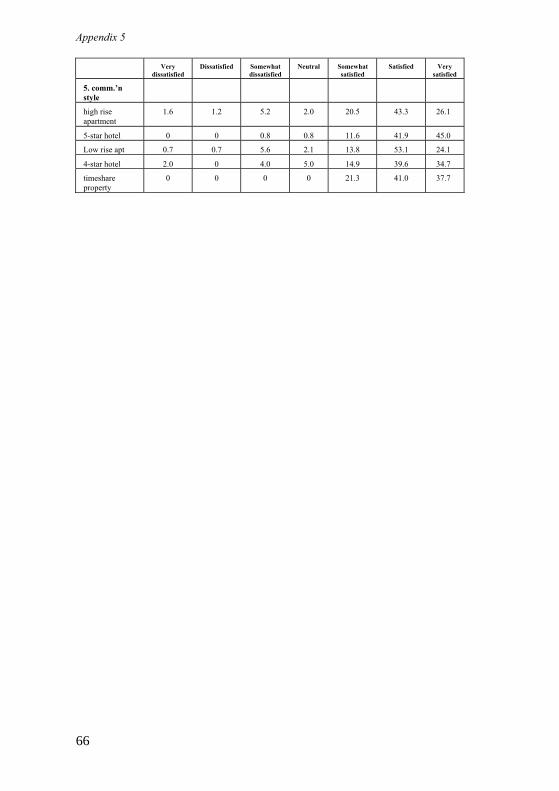
Appendix 5
66
Very
dissatisfied
Dissatisfied Somewhat
dissatisfied
Neutral Somewhat
satisfied
Satisfied Very
satisfied
5. comm.’n
style
high rise
apartment
1.6 1.2 5.2 2.0 20.5 43.3 26.1
5-star hotel 0 0 0.8 0.8 11.6 41.9 45.0
Low rise apt 0.7 0.7 5.6 2.1 13.8 53.1 24.1
4-star hotel 2.0 0 4.0 5.0 14.9 39.6 34.7
timeshare
property
0 0 0 0 21.3 41.0 37.7
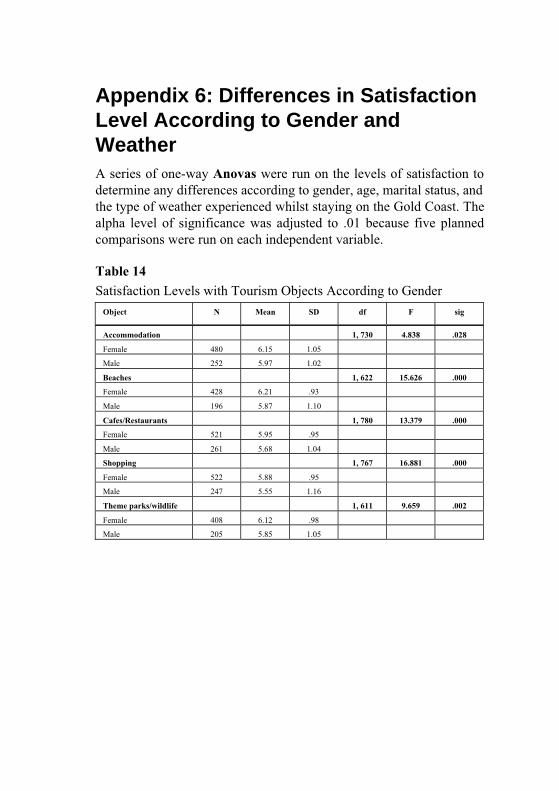
Appendix 6: Differences in SatisfactionLevel According to Gender andWeatherA series of one-way Anovas were run on the levels of satisfaction to
determine any differences according to gender, age, marital status, and
the type of weather experienced whilst staying on the Gold Coast. The
alpha level of significance was adjusted to .01 because five planned
comparisons were run on each independent variable.
Table 14
Satisfaction Levels with Tourism Objects According to Gender
Object N Mean SD df F sig
Accommodation 1, 730 4.838 .028
Female 480 6.15 1.05
Male 252 5.97 1.02
Beaches 1, 622 15.626 .000
Female 428 6.21 .93
Male 196 5.87 1.10
Cafes/Restaurants 1, 780 13.379 .000
Female 521 5.95 .95
Male 261 5.68 1.04
Shopping 1, 767 16.881 .000
Female 522 5.88 .95
Male 247 5.55 1.16
Theme parks/wildlife 1, 611 9.659 .002
Female 408 6.12 .98
Male 205 5.85 1.05

Appendix 6
68
Table 15
Satisfaction Levels with Tourism Objects According to Weather
whilst Visiting Gold Coast
Object N Mean SD df F sig
Accommodation 1, 745 6.846 .009
Good weather 580 6.15 1.00
Bad weather 167 5.91 1.18
Beaches 1, 633 20.873 .000
Good weather 479 6.20 .90
Bad weather 156 5.79 1.22
Cafes/Restaurants 1, 796 13.751 .000
Good weather 607 5.93 .95
Bad weather 191 5.62 1.10
Shopping 1, 782 9.615 .002
Good weather 597 5.83 1.02
Bad weather 187 5.56 1.10
Theme
parks/wildlife
1, 623 21.063 .000
Good weather 474 6.13 .89
Bad weather 151 5.71 1.25
Appendix 7: Predicting Satisfactionwith the Tourism ObjectsA series of multiple regression analyses were conducted in an attempt
to predict satisfaction with each tourism object. Correlation matrices
were inspected to determine whether multicollinearity existed amongst
predictor variables. Whilst the majority of correlation coefficients
were relatively high, none exceeded the .90 cut-off point for
multicollinearity. Further inspection of tolerance values confirmed
that the correlations were not problematic as all fell above the 0.10
cut-off value for excessive overlap.
Inspection of beta coefficients and t-values indicated the weighting
of each dimension in the prediction of overall satisfaction with each
object (see Table 17).
The majority of dimensions contributed significantly to the
prediction of overall satisfaction with each object.
When inspecting the information in the regression tables, the three
key bits of information are the R2, the beta coefficient and the t-
statistic. The R2 provides information about how well the regression
model fits the data. The R2 tells us how much of the variance is
explained. For instance, in Table 16, the five dimensions explain 72%
of the variance in response to overall satisfaction with restaurants and
cafes. An R2 of 1 would be perfect predictive capacity. In the second
part of the information for this regression, Table 17 shows the beta
coefficient (β), which tells us how overall satisfaction with an object
will change as a result of change in the various dimensions.
The beta coefficient informs us of the relative importance of each
variable in predicting satisfaction. The t statistic informs us about the
significance of the effect.
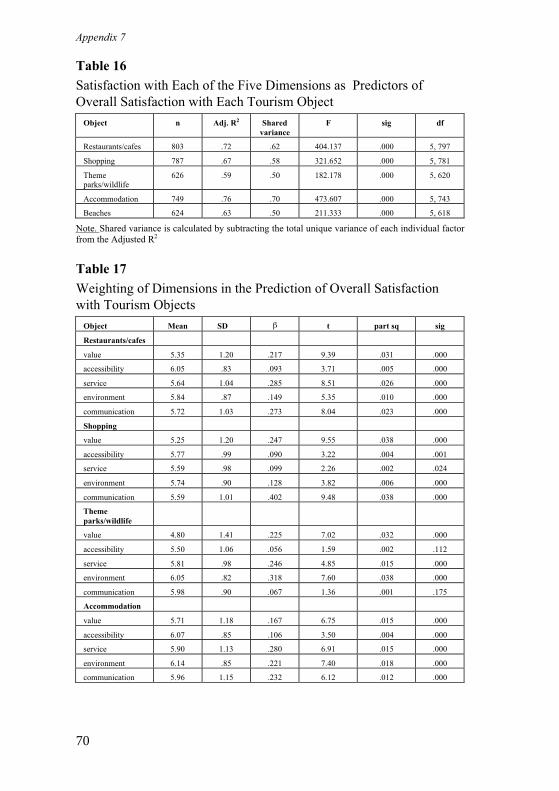
Appendix 7
70
Table 16
Satisfaction with Each of the Five Dimensions as Predictors of
Overall Satisfaction with Each Tourism Object
Object n Adj. R2 Shared
variance
F sig df
Restaurants/cafes 803 .72 .62 404.137 .000 5, 797
Shopping 787 .67 .58 321.652 .000 5, 781
Themeparks/wildlife
626 .59 .50 182.178 .000 5, 620
Accommodation 749 .76 .70 473.607 .000 5, 743
Beaches 624 .63 .50 211.333 .000 5, 618
Note. Shared variance is calculated by subtracting the total unique variance of each individual factor
from the Adjusted R2
Table 17
Weighting of Dimensions in the Prediction of Overall Satisfaction
with Tourism Objects
Object Mean SD t part sq sig
Restaurants/cafes
value 5.35 1.20 .217 9.39 .031 .000
accessibility 6.05 .83 .093 3.71 .005 .000
service 5.64 1.04 .285 8.51 .026 .000
environment 5.84 .87 .149 5.35 .010 .000
communication 5.72 1.03 .273 8.04 .023 .000
Shopping
value 5.25 1.20 .247 9.55 .038 .000
accessibility 5.77 .99 .090 3.22 .004 .001
service 5.59 .98 .099 2.26 .002 .024
environment 5.74 .90 .128 3.82 .006 .000
communication 5.59 1.01 .402 9.48 .038 .000
Theme
parks/wildlife
value 4.80 1.41 .225 7.02 .032 .000
accessibility 5.50 1.06 .056 1.59 .002 .112
service 5.81 .98 .246 4.85 .015 .000
environment 6.05 .82 .318 7.60 .038 .000
communication 5.98 .90 .067 1.36 .001 .175
Accommodation
value 5.71 1.18 .167 6.75 .015 .000
accessibility 6.07 .85 .106 3.50 .004 .000
service 5.90 1.13 .280 6.91 .015 .000
environment 6.14 .85 .221 7.40 .018 .000
communication 5.96 1.15 .232 6.12 .012 .000
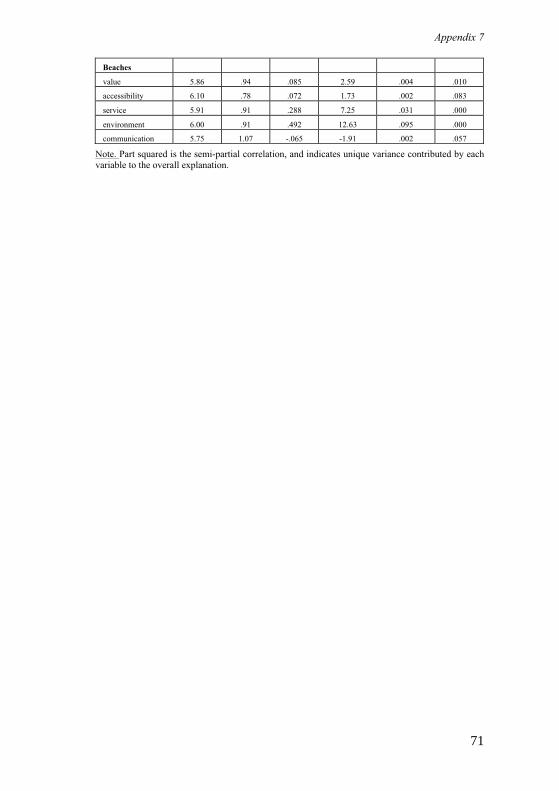
Appendix 7
71
Beaches
value 5.86 .94 .085 2.59 .004 .010
accessibility 6.10 .78 .072 1.73 .002 .083
service 5.91 .91 .288 7.25 .031 .000
environment 6.00 .91 .492 12.63 .095 .000
communication 5.75 1.07 -.065 -1.91 .002 .057
Note. Part squared is the semi-partial correlation, and indicates unique variance contributed by each
variable to the overall explanation.

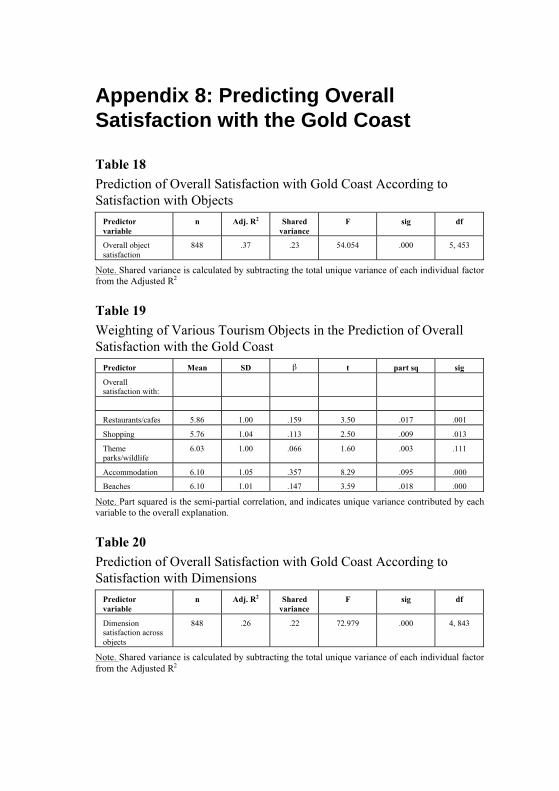
Appendix 8: Predicting OverallSatisfaction with the Gold Coast
Table 18
Prediction of Overall Satisfaction with Gold Coast According to
Satisfaction with Objects
Predictor
variable
n Adj. R2 Shared
variance
F sig df
Overall object
satisfaction
848 .37 .23 54.054 .000 5, 453
Note. Shared variance is calculated by subtracting the total unique variance of each individual factor
from the Adjusted R2
Table 19
Weighting of Various Tourism Objects in the Prediction of Overall
Satisfaction with the Gold Coast
Predictor Mean SD t part sq sig
Overallsatisfaction with:
Restaurants/cafes 5.86 1.00 .159 3.50 .017 .001
Shopping 5.76 1.04 .113 2.50 .009 .013
Themeparks/wildlife
6.03 1.00 .066 1.60 .003 .111
Accommodation 6.10 1.05 .357 8.29 .095 .000
Beaches 6.10 1.01 .147 3.59 .018 .000
Note. Part squared is the semi-partial correlation, and indicates unique variance contributed by each
variable to the overall explanation.
Table 20
Prediction of Overall Satisfaction with Gold Coast According to
Satisfaction with Dimensions
Predictor
variable
n Adj. R2 Shared
variance
F sig df
Dimensionsatisfaction across
objects
848 .26 .22 72.979 .000 4, 843
Note. Shared variance is calculated by subtracting the total unique variance of each individual factor
from the Adjusted R2
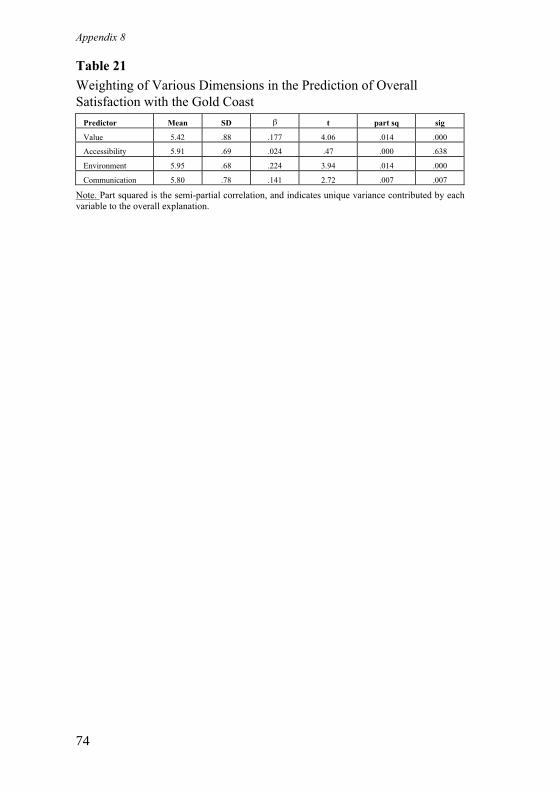
Appendix 8
74
Table 21
Weighting of Various Dimensions in the Prediction of Overall
Satisfaction with the Gold Coast
Predictor Mean SD t part sq sig
Value 5.42 .88 .177 4.06 .014 .000
Accessibility 5.91 .69 .024 .47 .000 .638
Environment 5.95 .68 .224 3.94 .014 .000
Communication 5.80 .78 .141 2.72 .007 .007
Note. Part squared is the semi-partial correlation, and indicates unique variance contributed by each
variable to the overall explanation.

Appendix 9: Discrepancies betweenRespondents’ Satisfaction andImportance Ratings for each TourismObject
Table 22
Mean Difference between Overall Satisfaction and Importance for
Each Tourism Object
Object n Mean SD t df sig
Restaurants/cafes 801 5.731 800 .000
Overallsatisfaction
5.86 .98
Importance 5.58 1.26
Shopping 774 11.455 773 .000
Overall
satisfaction
5.76 1.05
Importance 5.19 1.30
Theme
parks/wildlife
616 1.493 615 .136
Overall
satisfaction
6.02 1.01
Importance 5.95 1.14
Accommodation 735 -11.400 734 .000
Overall
satisfaction
6.09 1.05
Importance 6.54 .80
Beaches 626 5.098 625 .000
Overallsatisfaction
6.10 1.01
Importance 5.84 1.21
Note. Paired-samples t-test used in analysis

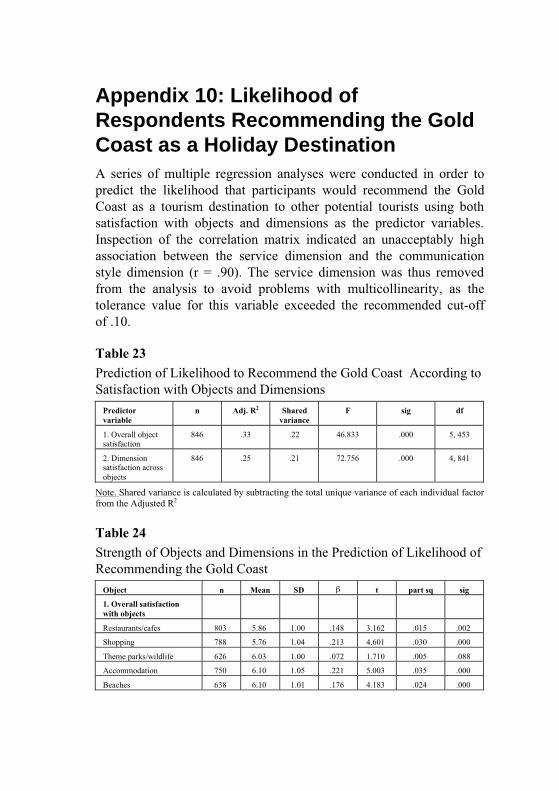
Appendix 10: Likelihood ofRespondents Recommending the GoldCoast as a Holiday DestinationA series of multiple regression analyses were conducted in order to
predict the likelihood that participants would recommend the Gold
Coast as a tourism destination to other potential tourists using both
satisfaction with objects and dimensions as the predictor variables.
Inspection of the correlation matrix indicated an unacceptably high
association between the service dimension and the communication
style dimension (r = .90). The service dimension was thus removed
from the analysis to avoid problems with multicollinearity, as the
tolerance value for this variable exceeded the recommended cut-off
of .10.
Table 23
Prediction of Likelihood to Recommend the Gold Coast According to
Satisfaction with Objects and Dimensions
Predictor
variable
n Adj. R2 Shared
variance
F sig df
1. Overall objectsatisfaction
846 .33 .22 46.833 .000 5, 453
2. Dimensionsatisfaction across
objects
846 .25 .21 72.756 .000 4, 841
Note. Shared variance is calculated by subtracting the total unique variance of each individual factor
from the Adjusted R2
Table 24
Strength of Objects and Dimensions in the Prediction of Likelihood of
Recommending the Gold Coast
Object n Mean SD t part sq sig
1. Overall satisfaction
with objects
Restaurants/cafes 803 5.86 1.00 .148 3.162 .015 .002
Shopping 788 5.76 1.04 .213 4.601 .030 .000
Theme parks/wildlife 626 6.03 1.00 .072 1.710 .005 .088
Accommodation 750 6.10 1.05 .221 5.003 .035 .000
Beaches 638 6.10 1.01 .176 4.183 .024 .000
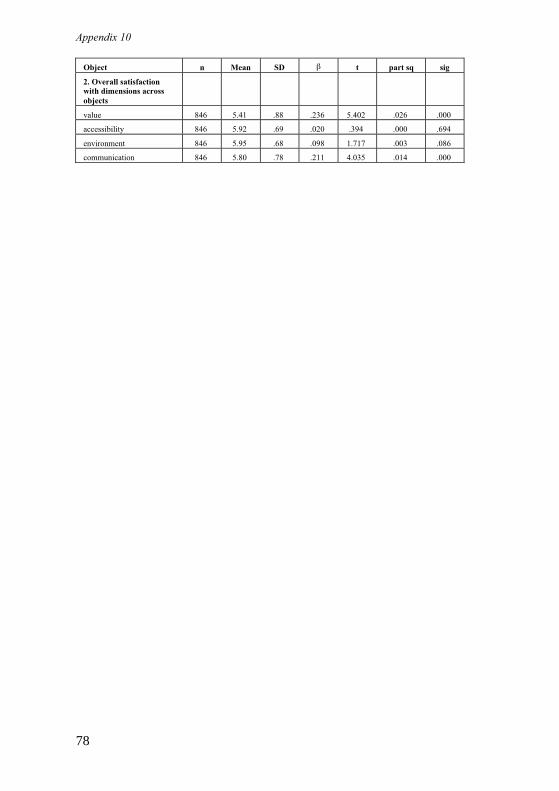
Appendix 10
78
Object n Mean SD t part sq sig
2. Overall satisfaction
with dimensions across
objects
value 846 5.41 .88 .236 5.402 .026 .000
accessibility 846 5.92 .69 .020 .394 .000 .694
environment 846 5.95 .68 .098 1.717 .003 .086
communication 846 5.80 .78 .211 4.035 .014 .000

ContributorDr Beverley Sparks
Beverley Sparks is a Professor at Griffith University’s School of
Tourism and Hotel Management, which is based on Queensland’s
Gold Coast in Australia. Beverley holds a Bachelor of Arts degree, a
Graduate Diploma of Tourism and Hospitality Management and a
Doctor of Philosophy in Management specialising in service
marketing within the hospitality industry. Her research interests
include service quality, customer satisfaction and service recovery.
The majority of her research has focused upon customer-service
provider interactions in the hospitality industry. She has received
several grants to support her work in the customer satisfaction area.
She has publications in international hospitality and marketing
journals including Psychology and Marketing, Advances in Consumer
Research, Hospitality Research Journal, Journal of Hospitality and
Leisure Management, and the International Journal of Hospitality
Management. Beverley is also active in presenting seminars and
conference papers both nationally and internationally.
Contact: [email protected]


Beverley Sparks
VISITOR SATISFACTION SURVEY ON THE GOLD COAST
Gold Coast Tourism Visioning Project 2.3
The Gold Coast Tourism Visioning project articulates a set of core values and principles that underpin a
preferred future for the sustainable prosperity of Australia’s leading tourism destination in the medium to
longer term (10 to 20 years). It challenges destination Gold Coast to move from a past ad hoc approach to
tourism to one that integrates economic, social and environmental dimensions to evolve new patterns of
managing and growing tourism in a more systematic and dynamic way in this new century. Tourism is a key
component of the inevitable transition to sustainable development strategies in advanced western
democracies such as Australia.
Through this Gold Coast Tourism Visioning project, the local tourism industry has an opportunity to confirm
itself as part of the solution, rather than as a contributor, to the economic, social and environmental challenges
of the future.
With the assistance and support of numerous public and private sector organisations and individuals, a team
of interdisciplinary researchers built the knowledge foundation for the leading-edge Gold Coast Tourism
Visioning Project. The project has created a more strategic perspective towards tourism policy, planning,
development and marketing involving the process of visioning – a technique combining the setting of a ‘vision’
and ‘planning’.
It had its origins in the late 1990s, when a number of Gold Coast tourism’s key stakeholders recognised that
the relationships between business, government and community, which had enabled the Gold Coast to flourish
in the past, were changing and the destination was confronted by a new range of challenges. Many of these
challenges are shared with maturing destinations the world over.
The tourism visioning project has provided a vehicle for advocating long-term change in the overall approach
to tourism by all stakeholders concerned with the creation of a sustainable, prosperous tourism industry for
the Gold Coast. Cooperation and collaboration at all levels between various stakeholder groups must override
fragmentation, confrontation, internal competition and a lack of an agreed common long-term focus. A new
vision for tourism is required in what has been – and can continue to be – Australia’s most successful tourism
destination.
If the Gold Coast is to continue to provide us and our visitors with the lifestyle experience
for which we are known, then we must aim high, plan long and settle for nothing but
sustainable excellence in all facets of OUR GOLD COAST.
The vision is in our hands, but can we see it?
Grant. R. Bowie, Chair, Gold Coast Tourism Bureau, 2002
Common Ground Publishingwww.CommonGroundPublishing.com
The Gold Coast Tourism Visioning ProjectCooperative Research Centre for Sustainable Tourism
CRC cover 2.3_V02 3/7/02 3:44 PM Page 1