benson koh 90915000bensonkoh.com/wp-content/uploads/2011/06/propertyguru_analytics_report... ·...
TRANSCRIPT

Benson
Koh
90915000
Page 1 of 30
Information contained within this report does not constitute investment advice and should be used for guidance purposes only
PROPERTY ANALYSIS REPORT - SUMMARY
#13-09, Pebble Bay, 132 Tanjong Rhu Road, (S) 436919This report is designed to help buyers, sellers and industry experts to make better informed property decisions. It includes detailedanalysis of the property, sales prices, rental prices, investment potential and current asking prices - for #13-09,Pebble Bay,132Tanjong Rhu Road
3 bedrooms2,336 sqft / 217 sqmsTOP: 199799-year Leasehold
Benson KohSenior Group District Partner (SRI5000) (+65) 90915000Report produced for Mr. Ke by Benson Koh on Jun 15,2011
Key Figures
Estimated sales price for this unit based on current askingprices
$2,699,755 - $3,299,701 ($1,284 psf) 1
Previous transaction for the same unit (21 Apr 2011) $3,100,000 ($1,327 psf)
Latest price for a similar unit in Pebble Bay (21 Apr 2011) $3,100,000 ($1,327 psf)
Estimated rental for the unit based on current asking prices $8,899 / month ($3.8 psf)1
Historic annualized average Capital Gains for this project +4.1%Estimated gross rental yield based on current asking prices +3.6%*psf=Price per Square Foot. 1) Comparable price based on unit size of 2,336 sqft
PSF Trend at Pebble Bay since 1995
psf
($)
400600800
100012001400
1995
1996
1997
1998
1999
2000
2001
2002
2003
2004
2005
2006
2007
2008
2009
2010
2011
Latest Transactions at Pebble BayDate Block / Unit Price Size PSF
21/04/11 132 / #13-09 $3,100,000 2,336 sqft $1,327
14/04/11 136 / #05-09 $1,098,000 850 sqft $1,291
04/04/11 130 / #06-18 $1,136,400 947 sqft $1,200
21/03/11 130 / #03-26 $1,730,000 1,367 sqft $1,266
09/03/11 130 / #02-07 $1,700,000 1,378 sqft $1,234
07/03/11 132 / #06-04 $1,367,100 1,302 sqft $1,050
Summary of comparable projectsProject Name PSF Capital Gains Rental Yield
Pebble Bay $1,327 +4.1% +3.6%
Costa Rhu $1,107 +3.5% +3.1%
Citylights $1,388 +17.5% +4.0%
Sanctuary Green $1,016 +5.6% +5.3%
Kerrisdale $897 +9.4% +4.7%
Water Place $1,143 +6.5% +3.9%

Benson
Koh
90915000
PROPERTY ANALYSIS REPORT #13-09, Pebble Bay,132 Tanjong Rhu Road, (S) 436919Report produced for Mr. Ke by Benson Koh on Jun 15, 2011
Benson KohSLP REAL ESTATE EMPIRE PTE.
LTD. Call: 90915000
www.bensonkoh.com
Page 2 of 30
Information contained within this report does not constitute investment advice and should be used for guidance purposes only
Contents1. Property Details ................................................................................................................................................... 4
1.1 Pebble Bay Property Details............................................................................................................................... 4
1.2 Location and Nearby Amenities......................................................................................................................... 5
1.3 Nearby Construction Activity ............................................................................................................................. 6
2. Sales Price Analysis ............................................................................................................................................. 7
2.1 Singapore Private Market Index ......................................................................................................................... 7
2.2 Average Sale Price in District ............................................................................................................................. 8
2.3 Latest 20 Transactions in similar units for Project ................................................................................................ 9
2.4 Property Market Index Summary........................................................................................................................ 10
2.5 Summary of Transactions in the last 12 Months.................................................................................................. 10
2.6 Summary of Transactions in the last 10 years..................................................................................................... 11
2.7 Sales History for Specific Unit ............................................................................................................................ 11
2.8 Mortgage Analysis............................................................................................................................................ 11
2.9 Minimum Cash Requirements ........................................................................................................................... 12
2.10 Nearby Projects similar to Project .................................................................................................................... 13
2.11 Sales Summary of Comparative Projects in the last 12 months .......................................................................... 14
2.12 Recent Sales of Similar Units in Comparative Projects ....................................................................................... 14
2.13 Market Activity - Units for Sale......................................................................................................................... 15
2.14 Search Analysis .............................................................................................................................................. 16
3. Rental Price Analysis ........................................................................................................................................... 17
3.1 Median Private Residential Rental Price in Singapore .......................................................................................... 17
3.2 Recent Rental Prices for Project .......................................................................................................................... 17
3.3 Estimated Rental for Unit in Project .................................................................................................................... 18
3.4 Rental Comparison........................................................................................................................................... 18
3.5 Market Activity - Units for Rent........................................................................................................................... 19
4. Investment Analysis............................................................................................................................................. 20
4.1 Investment Analysis - Capital Gains................................................................................................................... 20
4.2 Investment Analysis - Rental Yield ...................................................................................................................... 21
4.3 Combined Investment Returns Analysis .............................................................................................................. 22
4.4 Investment Comparison .................................................................................................................................... 23
5. Appendix ............................................................................................................................................................. 24
5.1 Appendix - Listings for Sale ............................................................................................................................... 24
5.2 Appendix - Listings for Rent............................................................................................................................... 24
5.3 Appendix - Listings for Sale in Nearby Projects ................................................................................................... 24
5.4 Appendix - Listings for Rent in Nearby Projects ................................................................................................... 25

Benson
Koh
90915000
PROPERTY ANALYSIS REPORT #13-09, Pebble Bay,132 Tanjong Rhu Road, (S) 436919Report produced for Mr. Ke by Benson Koh on Jun 15, 2011
Benson KohSLP REAL ESTATE EMPIRE PTE.
LTD. Call: 90915000
www.bensonkoh.com
Page 3 of 30
Information contained within this report does not constitute investment advice and should be used for guidance purposes only
6. Glossary............................................................................................................................................................... 27
6.1 Glossary .......................................................................................................................................................... 27

Benson
Koh
90915000
PROPERTY ANALYSIS REPORT #13-09, Pebble Bay,132 Tanjong Rhu Road, (S) 436919Report produced for Mr. Ke by Benson Koh on Jun 15, 2011
Benson KohSLP REAL ESTATE EMPIRE PTE.
LTD. Call: 90915000
www.bensonkoh.com
Page 4 of 30
Information contained within this report does not constitute investment advice and should be used for guidance purposes only
1.1 Property Details
Floors: 17# of Units: 510Property Type: CondominiumDeveloper: CapitaLandTOP: 1997Tenure: 99-year LeaseholdThis unit is bigger in size and on a high floor compared to the average units inPebble Bay. Buyers and sellers should note that higher floor and smaller unitsgenerally fetch a higher PSF.
Property FacilitiesBasement car park Driving range Function room
Gymnasium room Playground Putting Green
24 hours security Squash court Swimming pool
Tennis courts
Property DescriptionPebble Bay is a 99-years leasehold development located at 130 Tanjong Rhu Road inDistrict 15. Completed in 1998, it comprises 510 units.
Condo Facilities at Pebble bay
Facilities at Pebble Bay include 24 hours security, basement car park, swimming pool, gym,tennis and squash courts, putting green, driving range, function room, and playground.
Condo Amenities near Pebble Bay
Pebble Bay is located minutes walk from the upcoming Stadium MRT station and there is abus service available nearby. Schools are mostly located within driving distance, whereasseveral restaurants are sprawled across the area.
Residents can take short drive to Kallang Leisure Park to for more than just daily necessities.Recreational facilities include the Marina Bay Golf Course and the water sports facilitiesavailable at the nearby Kallang basin.
For vehicle owners, it takes 15-20 minutes to drive to the business hub and the OrchardRoad shopping belt, via East Coast Parkway.

Benson
Koh
90915000
PROPERTY ANALYSIS REPORT #13-09, Pebble Bay,132 Tanjong Rhu Road, (S) 436919Report produced for Mr. Ke by Benson Koh on Jun 15, 2011
Benson KohSLP REAL ESTATE EMPIRE PTE.
LTD. Call: 90915000
www.bensonkoh.com
Page 5 of 30
Information contained within this report does not constitute investment advice and should be used for guidance purposes only
1.2 Location and Nearby Amenities
- Pebble Bay
Distances to:Raffles Place: 2.7 kmOrchard Road: 4.4 kmChangi Airport: 15.0 kmNearest MRT: 0.7 kmNearest School: 1.4 kmNearest Supermarket: 0.7 km
Category Place Distance
- MRT / LRT Stadium MRT Station 0.72 km
- MRT / LRT Nicoll Highway MRT Station 0.87 km
- MRT / LRT Promenade MRT Station 1.24 km
- MRT / LRT Lavender MRT Station 1.4 km
- MRT / LRT Kallang MRT Station 1.52 km
- Schools Hong Wen School 1.37 km
- Schools Stamford Primary School 1.69 km
- Schools Broadrick Secondary School 1.99 km
- Schools Manjusri Secondary School 2.05 km
- Schools Kong Hwa School 2.4 km
- Supermarkets Cold Storage @ Kallang Leisure park 0.74 km
- Supermarkets Carrefour @ Suntec City 1.47 km
- Supermarkets Fairprice @ Mountbatten 1.58 km
- Supermarkets Cold Storage @ Bugis Junction 1.73 km
- Supermarkets Shop and Save @ Upper Boon Keng 1.81 km
Benson
Koh
90915000
PROPERTY ANALYSIS REPORT #13-09, Pebble Bay,132 Tanjong Rhu Road, (S) 436919Report produced for Mr. Ke by Benson Koh on Jun 15, 2011
Benson KohSLP REAL ESTATE EMPIRE PTE.
LTD. Call: 90915000
www.bensonkoh.com
Page 6 of 30
Information contained within this report does not constitute investment advice and should be used for guidance purposes only
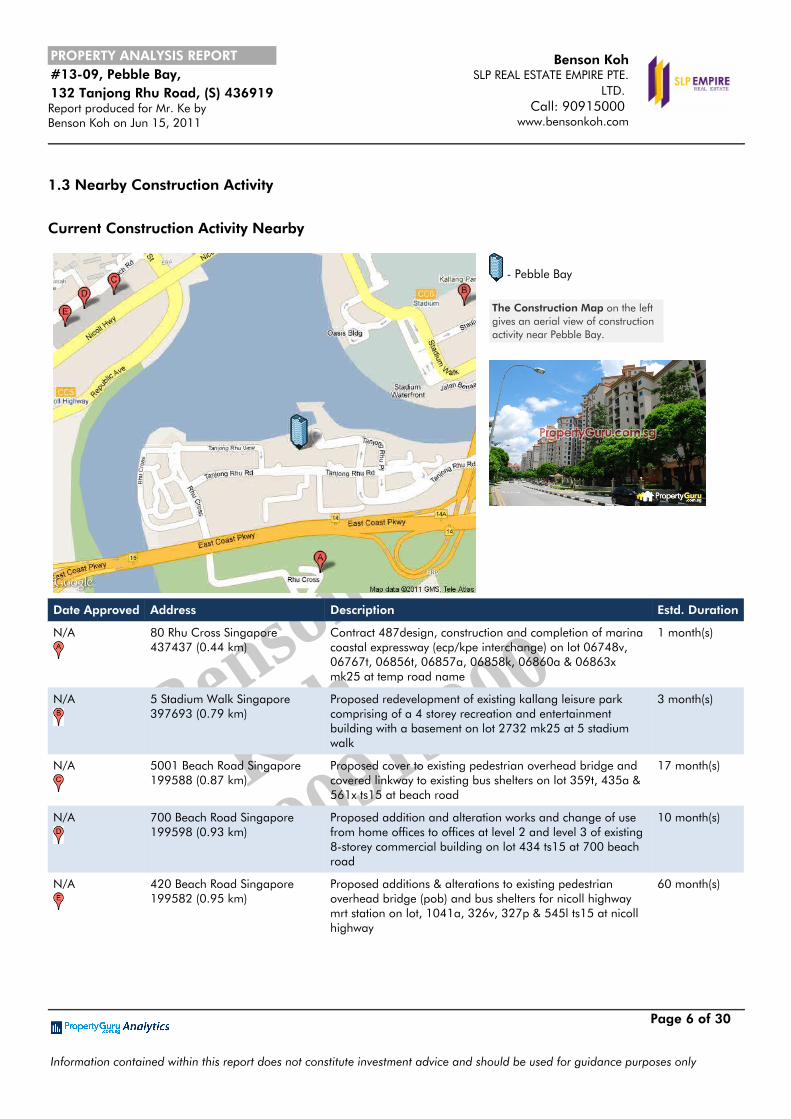
1.3 Nearby Construction Activity
Current Construction Activity Nearby
- Pebble Bay
The Construction Map on the leftgives an aerial view of constructionactivity near Pebble Bay.
Date Approved Address Description Estd. Duration
N/A 80 Rhu Cross Singapore437437 (0.44 km)
Contract 487design, construction and completion of marinacoastal expressway (ecp/kpe interchange) on lot 06748v,06767t, 06856t, 06857a, 06858k, 06860a & 06863xmk25 at temp road name
1 month(s)
N/A 5 Stadium Walk Singapore397693 (0.79 km)
Proposed redevelopment of existing kallang leisure parkcomprising of a 4 storey recreation and entertainmentbuilding with a basement on lot 2732 mk25 at 5 stadiumwalk
3 month(s)
N/A 5001 Beach Road Singapore199588 (0.87 km)
Proposed cover to existing pedestrian overhead bridge andcovered linkway to existing bus shelters on lot 359t, 435a &561x ts15 at beach road
17 month(s)
N/A 700 Beach Road Singapore199598 (0.93 km)
Proposed addition and alteration works and change of usefrom home offices to offices at level 2 and level 3 of existing8-storey commercial building on lot 434 ts15 at 700 beachroad
10 month(s)
N/A 420 Beach Road Singapore199582 (0.95 km)
Proposed additions & alterations to existing pedestrianoverhead bridge (pob) and bus shelters for nicoll highwaymrt station on lot, 1041a, 326v, 327p & 545l ts15 at nicollhighway
60 month(s)

Benson
Koh
90915000
PROPERTY ANALYSIS REPORT #13-09, Pebble Bay,132 Tanjong Rhu Road, (S) 436919Report produced for Mr. Ke by Benson Koh on Jun 15, 2011
Benson KohSLP REAL ESTATE EMPIRE PTE.
LTD. Call: 90915000
www.bensonkoh.com
Page 7 of 30
Information contained within this report does not constitute investment advice and should be used for guidance purposes only
2. Sales Price Analysis
This section compares average sales and rental prices for condos in district 15 (where Pebble Bay is located) against all condos andthe Singapore private residential market as a whole.This will help you to get an overview how the market has performed morerecently and over the past years.
Sales Price Analysis - Summary
Estimated sales price for this unit based on current askingprices
$2,699,755 - $3,299,701 ($1,284 psf)1
Previous Transaction for the same Unit (21 Apr 2011) $3,100,000 ($1,327 psf)1
Latest Transaction for a similar Unit in the Project (21 Apr2011)
$3,100,000 ($1,327 psf)1
Recent Prices for Units in comparable Projects $953-$1,660 psfAverage sales price of Condos in District 5 this month $1,273 psf
Change in Singapore Property Market Index in last 12months
+10.5%
1) Comparable price based on floor area of 2335.788 sqft
2.1 Singapore Private Market Index
Ind
ex
100
120
140
160
180
200
2001
2002
2003
2004
2005
2006
2007
2008
2009
2010
2011
The index has growth from 189.7 in Q4 2010 to 192.9 in Q1 2011. An overall growth of +1.7%over the period. In the last year the index increased by +10.5%.
Singapore PrivateResidential PropertyIndex is published quarterlyby the UrbanRedevelopment Authority(URA). It is based onproperty transaction caveatslodged in the specificquarter. As a result, theremay be a lag between thebooking of the unittransaction and whencaveat is officially lodged.En-bloc (collective) sales areexcluded from the marketindex.

Benson
Koh
90915000
PROPERTY ANALYSIS REPORT #13-09, Pebble Bay,132 Tanjong Rhu Road, (S) 436919Report produced for Mr. Ke by Benson Koh on Jun 15, 2011
Benson KohSLP REAL ESTATE EMPIRE PTE.
LTD. Call: 90915000
www.bensonkoh.com
Page 8 of 30
Information contained within this report does not constitute investment advice and should be used for guidance purposes only
2.2 Average Sale Price of Condominiums in District 15 (Condo)
psf
($)
500600700800900
100011001200
2000
2001
2002
2003
2004
2005
2006
2007
2008
2009
2010
2011
Average Sale Price of Condos in District 15 Average Sale Price of Condos in all Districts
The average sale price of condominiums in District 15 has increased from $566 in 2000 to $1,196in 2011. Over the same period, the average sale price of condos in Singapore has increased from$539 in 2000 to $1,136 in 2011, an average increase of +7.7% per annum. As such, sales pricesfor condos in district 15 performed better than the average for all of Singapore's condos
Average Sale Price ofCondominiums in District15 is the average price persquare foot for alltransactions in the quarterfor properties in this district.It gives you a view of levelof prices people aregenerally paying in thedistrict, but it should not beused for comparinglike-for-like prices as it canbe distorted by higher pricespaid for new launches.

Benson
Koh
90915000
PROPERTY ANALYSIS REPORT #13-09, Pebble Bay,132 Tanjong Rhu Road, (S) 436919Report produced for Mr. Ke by Benson Koh on Jun 15, 2011
Benson KohSLP REAL ESTATE EMPIRE PTE.
LTD. Call: 90915000
www.bensonkoh.com
Page 9 of 30
Information contained within this report does not constitute investment advice and should be used for guidance purposes only
2.3 Latest 20 transactions at Pebble BayThese are recent transactions of similar sized units in the property.
psf
($)
99010001050110011501200125013001350140014501460
2010
2011
2012
Address Size Date Price PSF Sale Type
132 Tanjong Rhu Road #13-09 2,336sqft 21/04/2011 $3,100,000 $1,327 Resale
132 Tanjong Rhu Road #08-06 2,336sqft 09/11/2010 $2,830,000 $1,212 Resale
130 Tanjong Rhu Road #04-05 2,174sqft 05/10/2010 $2,608,800 $1,200 Resale
130 Tanjong Rhu Road #02-05 2,174sqft 13/09/2010 $2,620,000 $1,205 Resale
130 Tanjong Rhu Road #10-10 2,336sqft 17/05/2010 $2,920,000 $1,250 Resale
130 Tanjong Rhu Road #08-02 2,336sqft 11/05/2010 $2,768,100 $1,185 Resale
130 Tanjong Rhu Road #11-10 2,336sqft 01/04/2010 $2,780,000 $1,190 Resale
130 Tanjong Rhu Road #07-02 2,336sqft 01/04/2010 $2,451,750 $1,050 Resale
130 Tanjong Rhu Road #03-02 2,336sqft 08/02/2010 $2,569,600 $1,100 Resale
132 Tanjong Rhu Road #10-06 2,336sqft 08/02/2010 $2,610,000 $1,117 Resale
132 Tanjong Rhu Road #09-09 2,336sqft 05/02/2010 $2,570,000 $1,100 Resale
130 Tanjong Rhu Road #01-16 2,314sqft 25/01/2010 $2,010,880 $869 Resale
130 Tanjong Rhu Road #06-05 2,174sqft 28/12/2009 $2,460,000 $1,131 Resale
130 Tanjong Rhu Road #05-05 2,174sqft 08/09/2009 $2,434,880 $1,120 Resale
130 Tanjong Rhu Road #08-23 2,282sqft 14/08/2009 $2,750,000 $1,205 Resale
130 Tanjong Rhu Road #04-02 2,336sqft 05/08/2009 $2,430,000 $1,040 Resale
130 Tanjong Rhu Road #03-05 2,174sqft 17/06/2009 $1,960,000 $901 Resale
130 Tanjong Rhu Road #03-10 2,336sqft 29/05/2009 $1,900,000 $813 Resale
132 Tanjong Rhu Road #11-09 2,336sqft 20/05/2009 $1,980,000 $848 Resale
132 Tanjong Rhu Road #11-06 2,336sqft 07/05/2009 $2,005,000 $858 Resale
The row highlighted yellow above represents the selected unit.
Between 1996 and 2011 there were 535 transactions for similar sized units at Pebble Bay and thesales PSF ranged from $415.0 to $1,493.0.
Prices of similar size unitseven within the sameproject can vary based onvarious other factors. Someof the common factorsaffecting individual pricesare: high vs. low floor,facing of the unit, conditionof the unit, and/or anyspecial renovation / interiordesign done
New Sale means the firstsale of the particular unit.This is usually before theproperty receives TOP(Temporary OccupationPermit)
Sub Sale - As long as theproperty sellers do not havethe property title and do notneed to notify thedevelopers to issue a freshSale and Purchase (S&P)Agreement to thesubsequent purchaser, thesale is considered asub-sale
Resale - When the propertyseller has the title in handand is able to sign theTransfer Document andrelease the Title to the buyerupon legal completion, thesale is called Resale.

Benson
Koh
90915000
PROPERTY ANALYSIS REPORT #13-09, Pebble Bay,132 Tanjong Rhu Road, (S) 436919Report produced for Mr. Ke by Benson Koh on Jun 15, 2011
Benson KohSLP REAL ESTATE EMPIRE PTE.
LTD. Call: 90915000
www.bensonkoh.com
Page 10 of 30
Information contained within this report does not constitute investment advice and should be used for guidance purposes only
2.4 Property Market Index Summary Last 12 months Last quarter
Q1/2010 Q1/2011 Q4/2010 Q1/2011
All Residential (Index) 174.6 192.9(10.5%)
189.7 192.9(1.7%)
District 15 $1,053 $1,111(5.5%)
$1,082 $1,111(2.7%)
Rental Median (Index) 11.9 13.9(17.4%)
12.0 13.9(15.8%)
2.5 Summary of transactions in Pebble Bay in the last 12 months# of transactions: 33
Average sales price: $1,273psf
Price range: $1,034psf - $1,493psf
The PSF values indicated in the graph represent the average PSF of transactions made in the PebbleBay for the last 12 months.
psf
($)
1150
1200
1250
1300
1350
1400
Volu
me
123456
Jul-2
010
Aug-2
010
Sep-
2010
Oct-
2010
Nov-2
010
Dec-2
010
Jan-
2011
Feb-
2011
Mar
-201
1
Apr-2
011
May
-201
1
Jun-
2011
31
46
32
43
43
Over the past 12 months, there were 33 transactions in Pebble Bay. The sales prices ranged from$1,034 PSF to $1,493 PSF

Benson
Koh
90915000
PROPERTY ANALYSIS REPORT #13-09, Pebble Bay,132 Tanjong Rhu Road, (S) 436919Report produced for Mr. Ke by Benson Koh on Jun 15, 2011
Benson KohSLP REAL ESTATE EMPIRE PTE.
LTD. Call: 90915000
www.bensonkoh.com
Page 11 of 30
Information contained within this report does not constitute investment advice and should be used for guidance purposes only
2.6 Summary of transactions in Pebble Bay since 1995
psf
($)
400
600
800
1000
1200
1400
Volu
me
020406080
100
1995
1996
1997
1998
1999
2000
2001
2002
2003
2004
2005
2006
2007
2008
2009
2010
2011
320 11 22
94
326 17 8 19 22
55
91
20
53 48
14
The average sales price was $819 PSF in 1995 and $1,291 PSF in 2011 an average change of+2.9% per annum over the same period.
The sales history shows transactions for the specific unit since 1995, where a caveat has been lodged.Note that lodging caveats is not mandatory, but is common in Singapore and carried out to protect theinterests of the buyer.
2.7 Sales History for Unit #13-09, Pebble BayDate Price PSF Sale Type Profit
21/04/2011 $3,100,000 $1,327 Resale N/A
Sales History: In yournegotiations it is useful tounderstand whether the presentowner is selling at profit or loss asit may be one of the factors onhow flexible the owner is with theprice.
2.8 Monthly Mortgage Payments
Assuming a 1.50% interest capital repayment based mortgage with 30 years repayment period and a80% loan taken on the $2,999,728 purchase price then the monthly installments would be N/A
Type Of Loan 20 years 30 years Interest Only
0.50% $10,509 $7,180 $1,000
1.00% $11,036 $7,719 $2,000
1.50% $11,580 $8,282 $3,000
2.00% $12,140 $8,870 $4,000
2.50% $12,717 $9,482 $5,000
The row highlighted yellow above represents the selected mortgage rate.

Benson
Koh
90915000
PROPERTY ANALYSIS REPORT #13-09, Pebble Bay,132 Tanjong Rhu Road, (S) 436919Report produced for Mr. Ke by Benson Koh on Jun 15, 2011
Benson KohSLP REAL ESTATE EMPIRE PTE.
LTD. Call: 90915000
www.bensonkoh.com
Page 12 of 30
Information contained within this report does not constitute investment advice and should be used for guidance purposes only
2.9 Minimum Cash Requirements
The following table shows the minimum cash needed to complete the purchase based on different levels of borrowing.We have excluded legal fees as many banks offer legal subsidies as part of the mortgage.
70% loan 80% loan
Purchase Price $2,999,728 $2,999,728
Down payment $899,918 $599,946
Stamp duty $84,592 $84,592
Total Cash Required $984,510 $684,537
Assuming a 80% loan, approximately $684,537 cash would be required to fund the $2,999,728property purchase.
Cash payment can becombination of money fromCPF account and cash savings.You should check how muchyou have in your CPF account,so you know how much cashyou exactly need to purchasethe property.
If you are taking a HDBconcessionary loan, you canuse up to 100% of your CPFOrdinary Account savings topay the initial 10% deposit aswell as the balance of thepurchase price.
If you are taking a bankloan, you can use yourOrdinary Account savings, andthe future monthly CPFcontributions in your OrdinaryAccount to buy the flat and/orto pay the monthly instalmentson the housing loan up to100% of the Valuation Limit(VL). The VL is the lower of thepurchase price or the value ofthe property at the time ofpurchase.

Benson
Koh
90915000
PROPERTY ANALYSIS REPORT #13-09, Pebble Bay,132 Tanjong Rhu Road, (S) 436919Report produced for Mr. Ke by Benson Koh on Jun 15, 2011
Benson KohSLP REAL ESTATE EMPIRE PTE.
LTD. Call: 90915000
www.bensonkoh.com
Page 13 of 30
Information contained within this report does not constitute investment advice and should be used for guidance purposes only
2.10 Comparative Analysis
Nearby Projects similar to Pebble Bay
The table below compares Pebble Bay with five other nearby and similar age and size properties
Name Address District Tenure TOP Units Distance
Pebble Bay 132 Tanjong Rhu Road East Coast / Marine... 99-year Leasehold 1997 510 -
Costa Rhu 1 Rhu Cross East Coast / Marine... 99-year Leasehold 1998 737 0.49km
Citylights 80 Jellicoe Road Farrer Park /... 99-year Leasehold 2007 600 1.48km
Sanctuary Green 181 Tanjong Rhu Road East Coast / Marine... 99-year Leasehold 2003 522 0.12km
Kerrisdale 30 Sturdee Road Farrer Park /... 99-year Leasehold 2006 481 2.26km
Water Place 171 Tanjong Rhu Road East Coast / Marine... 99-year Leasehold 2004 437 0.11km
The row highlighted yellow above represents the selected project.
Condos with green markers on the map represent Positive Capital Gains value.
Map Legend
- Pebble Bay
- Costa Rhu
- Citylights
- Sanctuary Green
- Kerrisdale
- Water Place
Benson
Koh
90915000
PROPERTY ANALYSIS REPORT #13-09, Pebble Bay,132 Tanjong Rhu Road, (S) 436919Report produced for Mr. Ke by Benson Koh on Jun 15, 2011
Benson KohSLP REAL ESTATE EMPIRE PTE.
LTD. Call: 90915000
www.bensonkoh.com
Page 14 of 30
Information contained within this report does not constitute investment advice and should be used for guidance purposes only
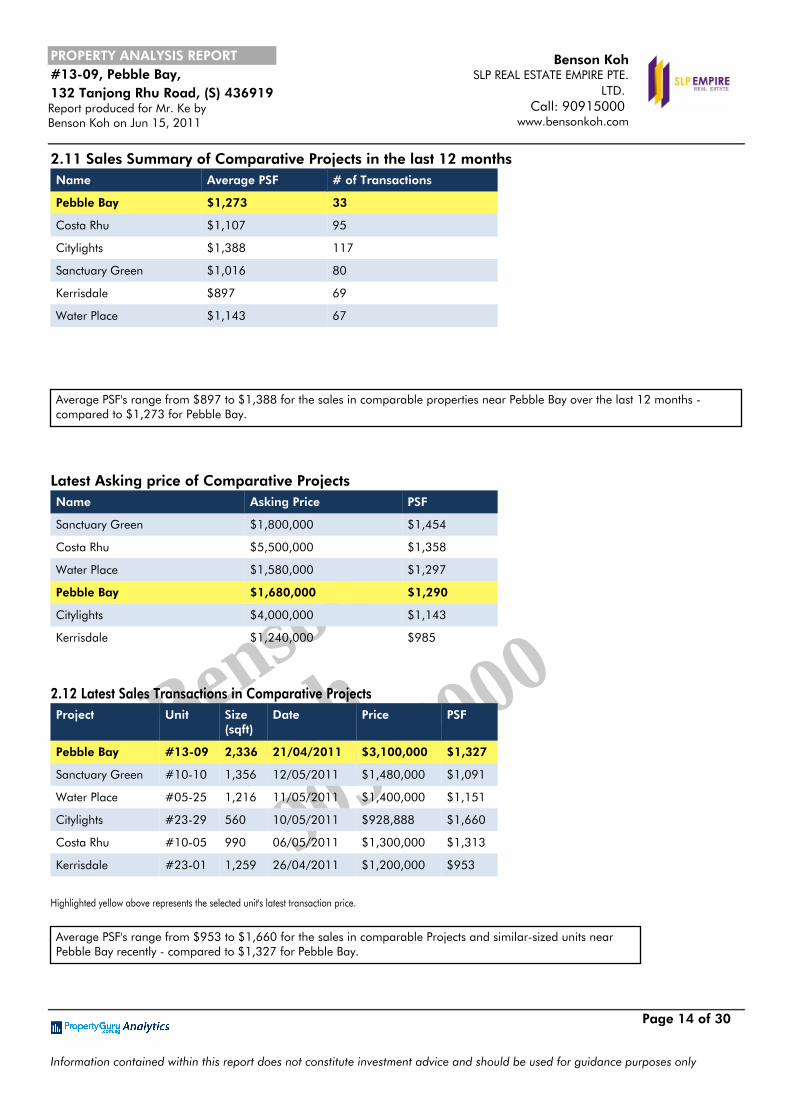
2.11 Sales Summary of Comparative Projects in the last 12 monthsName Average PSF # of Transactions
Pebble Bay $1,273 33
Costa Rhu $1,107 95
Citylights $1,388 117
Sanctuary Green $1,016 80
Kerrisdale $897 69
Water Place $1,143 67
Average PSF's range from $897 to $1,388 for the sales in comparable properties near Pebble Bay over the last 12 months -compared to $1,273 for Pebble Bay.
Latest Asking price of Comparative ProjectsName Asking Price PSF
Sanctuary Green $1,800,000 $1,454
Costa Rhu $5,500,000 $1,358
Water Place $1,580,000 $1,297
Pebble Bay $1,680,000 $1,290
Citylights $4,000,000 $1,143
Kerrisdale $1,240,000 $985
2.12 Latest Sales Transactions in Comparative ProjectsProject Unit Size
(sqft)Date Price PSF
Pebble Bay #13-09 2,336 21/04/2011 $3,100,000 $1,327
Sanctuary Green #10-10 1,356 12/05/2011 $1,480,000 $1,091
Water Place #05-25 1,216 11/05/2011 $1,400,000 $1,151
Citylights #23-29 560 10/05/2011 $928,888 $1,660
Costa Rhu #10-05 990 06/05/2011 $1,300,000 $1,313
Kerrisdale #23-01 1,259 26/04/2011 $1,200,000 $953
Highlighted yellow above represents the selected unit's latest transaction price.
Average PSF's range from $953 to $1,660 for the sales in comparable Projects and similar-sized units nearPebble Bay recently - compared to $1,327 for Pebble Bay.

Benson
Koh
90915000
PROPERTY ANALYSIS REPORT #13-09, Pebble Bay,132 Tanjong Rhu Road, (S) 436919Report produced for Mr. Ke by Benson Koh on Jun 15, 2011
Benson KohSLP REAL ESTATE EMPIRE PTE.
LTD. Call: 90915000
www.bensonkoh.com
Page 15 of 30
Information contained within this report does not constitute investment advice and should be used for guidance purposes only
2.13 Market Activity - Units Advertised for Sale
This market activity section is based on properties listed and searched on PropertyGuru.com.sg.
# of listings advertised for sale within last 30 days:
Average asking price: $1,284psf
Latest 10 listings for sale for similar* Units:
Date Listed Size Asking Price (psf)
15/06/2011 2,336sqft - 3 bedrooms $3,000,000 ($1,284.2)
14/06/2011 2,336sqft - 3 bedrooms $3,100,000 ($1,327.1)
07/06/2011 2,336sqft - 3 bedrooms $2,930,000 ($1,254.3)
07/06/2011 2,174sqft - 3 bedrooms $3,060,000 ($1,407.5)
03/06/2011 2,336sqft - 3 bedrooms $2,880,000 ($1,232.9)
03/06/2011 2,336sqft - 3 bedrooms $3,200,000 ($1,369.9)
15/06/2011 2,336sqft - 3 bedrooms $3,000,000 ($1,284.2)
14/06/2011 2,336sqft - 3 bedrooms $3,100,000 ($1,327.1)
07/06/2011 2,336sqft - 3 bedrooms $2,930,000 ($1,254.3)
07/06/2011 2,174sqft - 3 bedrooms $3,060,000 ($1,407.5)
* - Similarity is based on the number of bedrooms of the unit posted in the listing. If no listings are matched, units that are similarly sized are listedabove.
Property Market vs ListingsThis section determines the duration of listings on the Property Market, indicating (approximately) the demand of Pebble Bay in theProperty Market.
Days Listed Min. PSF Median PSF Max. PSF Number of Listings
Less than 30 days $1,175.6 $1,329.0 $2,800.2 58
Between 30 and 90 days $1,284.2 $1,344.6 $2,154.5 10
More than 90 days $1,121.8 $1,314.6 $1,609.4 18

Benson
Koh
90915000
PROPERTY ANALYSIS REPORT #13-09, Pebble Bay,132 Tanjong Rhu Road, (S) 436919Report produced for Mr. Ke by Benson Koh on Jun 15, 2011
Benson KohSLP REAL ESTATE EMPIRE PTE.
LTD. Call: 90915000
www.bensonkoh.com
Page 16 of 30
Information contained within this report does not constitute investment advice and should be used for guidance purposes only
2.14 Search Analysis
The search analysis below compares the demand for Pebble Bay compared to all other properties for sale in Singapore as well as forthose in East Coast / Marine Parade.
Item Value
Search Ranking of Project1 72 of 4137
Search volume vs number of listings (ratio)2 High
Search volume vs number of transactions (ratio)3 High
1) Popularity of Pebble Bay compared to all other condos, based on the volume of searches by PropertyGuru users.
2) 'High' means that the property has more people searching relative to the number of units being advertised and may lead to prices increasing.The opposite applies.
3) 'High' means that the property has more people searching relative to the number of transactions closed and may lead to prices increasing. Theopposite applies.

Benson
Koh
90915000
PROPERTY ANALYSIS REPORT #13-09, Pebble Bay,132 Tanjong Rhu Road, (S) 436919Report produced for Mr. Ke by Benson Koh on Jun 15, 2011
Benson KohSLP REAL ESTATE EMPIRE PTE.
LTD. Call: 90915000
www.bensonkoh.com
Page 17 of 30
Information contained within this report does not constitute investment advice and should be used for guidance purposes only
3. Rental Price Analysis
Rental Price Analysis - Summary
Estimated Monthly Rental for the Unit $8,899 / month ($3.8 psf)
*Current Asking Prices for Comparable Units in Pebble Bay $8,603 - $9,347 ($3.7 - $4.0 psf)
Rental Prices for Units in Comparable Projects $7,238-$12,359Change in Singapore Median Rental Price in the last 12 months +15.8%
* - The Current Asking price range is derived from listings on the property market in the last 30 days.
3.1 Median Private Residential Rental Price in Singapore
Ind
ex
80
100
120
140
160
180
2001
2002
2003
2004
2005
2006
2007
2008
2009
2010
Median Private ResidentialRental Price is median per squarefoot price paid for rentals inSingapore for private properties. Itis useful for understanding generalmarket trends for rentals. Theindex is published by URA fromIRAS data every quarter.
Rental analysis gives you an overview of what kind of rental the unit is likely to achieve based oncurrent market conditions.
3.2 Recent Rental Prices in Pebble Bay
These are the rental ranges for Pebble Bay in recent quarters. For projects less than 10 rentals in aquarter, we estimate the rental level based on our analysis on asking prices and actual prices.
Period Lowest 25% Median Highest 75%
01 / 2011 $3.6 psf ($8,385)
$3.8 psf ($8,879)
$4.0 psf ($9,343)
12 / 2010 $3.5 psf ($8,243)
$3.7 psf ($8,618)
$3.9 psf ($9,218)
11 / 2010 $3.6 psf ($8,414)
$3.9 psf ($9,167)
$4.0 psf ($9,397)
Rental prices within the sameproject can vary based on variousother factors. Some of thecommon factors affecting rentalprices are:level of furnishing, highvs. low floor, facing of the unit,condition of the unit, and/or anyspecial renovation / interior designdone

Benson
Koh
90915000
PROPERTY ANALYSIS REPORT #13-09, Pebble Bay,132 Tanjong Rhu Road, (S) 436919Report produced for Mr. Ke by Benson Koh on Jun 15, 2011
Benson KohSLP REAL ESTATE EMPIRE PTE.
LTD. Call: 90915000
www.bensonkoh.com
Page 18 of 30
Information contained within this report does not constitute investment advice and should be used for guidance purposes only
3.3 Estimated Rental for #13-09 Pebble Bay
Based on recent rental prices estimated rental for the unit is $8,899 / month. The following tablesummarizes the possible ranges for the rental based on past prices and current asking prices.
Period Lowest 25% Median Highest 25%
3-Bedrooms Jan / 2011 $8,385 ($3.6 psf) $8,879 ($3.8 psf) $9,343 ($4.0 psf)
3-Bedrooms Dec / 2010 $8,243 ($3.5 psf) $8,618 ($3.7 psf) $9,218 ($3.9 psf)
3-Bedrooms Nov / 2010 $8,414 ($3.6 psf) $9,167 ($3.9 psf) $9,397 ($4.0 psf)
3-Bedrooms Oct / 2010 $8,587 ($3.7 psf) $9,003 ($3.9 psf) $9,277 ($4.0 psf)
3-Bedrooms Sep / 2010 $8,599 ($3.7 psf) $8,999 ($3.9 psf) $9,242 ($4.0 psf)
3-Bedrooms Aug / 2010 $7,410 ($3.2 psf) $7,833 ($3.4 psf) $8,346 ($3.6 psf)
3-Bedrooms Jul / 2010 $8,486 ($3.6 psf) $8,759 ($3.7 psf) $9,304 ($4.0 psf)
3-Bedrooms Jun / 2010 $8,406 ($3.6 psf) $8,752 ($3.7 psf) $10,104 ($4.3 psf)
3-Bedrooms May / 2010 $8,259 ($3.5 psf) $8,882 ($3.8 psf) $9,404 ($4.0 psf)
3-Bedrooms Apr / 2010 $7,662 ($3.3 psf) $8,566 ($3.7 psf) $9,186 ($3.9 psf)
3-Bedrooms Mar / 2010 $7,400 ($3.2 psf) $8,205 ($3.5 psf) $9,025 ($3.9 psf)
3.4 Rental Comparison - Estimated rental for a similar sized unit incomparative projectsProject Lowest 25% Median Highest 25%
Pebble Bay $8,652 $8,899 $9,063
Costa Rhu $7,238($3.1 psf)
$7,998($3.4 psf)
$8,726($3.7 psf)
Citylights $12,359($5.3 psf)
$13,085($5.6 psf)
$14,098($6.0 psf)
Sanctuary Green $8,771($3.8 psf)
$11,221($4.8 psf)
$13,386($5.7 psf)
Kerrisdale $8,163($3.5 psf)
$8,720($3.7 psf)
$9,053($3.9 psf)
Water Place $8,260($3.5 psf)
$8,644($3.7 psf)
$9,202($3.9 psf)

Benson
Koh
90915000
PROPERTY ANALYSIS REPORT #13-09, Pebble Bay,132 Tanjong Rhu Road, (S) 436919Report produced for Mr. Ke by Benson Koh on Jun 15, 2011
Benson KohSLP REAL ESTATE EMPIRE PTE.
LTD. Call: 90915000
www.bensonkoh.com
Page 19 of 30
Information contained within this report does not constitute investment advice and should be used for guidance purposes only
3.5 Market Activity - Units for Rent
This market activity section is based on properties listed and searched on PropertyGuru.com.sg.
# of listings advertised for rent within last 30 days: 6
Average asking price: $4psf
Latest 6 listings for rent for similar* units:
Date Listed Size Asking Price (psf)
15/06/2011 2,335sqft - 3 bedrooms $8,600 ($3.7)
15/06/2011 2,336sqft - 3 bedrooms $8,800 ($3.8)
14/06/2011 2,174sqft - 3 bedrooms $8,700 ($4.0)
14/06/2011 2,336sqft - 3 bedrooms $9,000 ($3.9)
03/06/2011 2,314sqft - 3 bedrooms $9,000 ($3.9)
15/06/2011 2,335sqft - 3 bedrooms $8,600 ($3.7)
15/06/2011 2,336sqft - 3 bedrooms $8,800 ($3.8)
14/06/2011 2,174sqft - 3 bedrooms $8,700 ($4.0)
14/06/2011 2,336sqft - 3 bedrooms $9,000 ($3.9)
03/06/2011 2,314sqft - 3 bedrooms $9,000 ($3.9)
* - Similarity is based on the number of bedrooms of the unit posted in the listing. If no listings are matched, units that are similarly sized are listedabove.
Property Market vs ListingsThis section determines the duration of listings on the Property Market, indicating (approximately) the demand of Pebble Bay in theProperty Market.
Days Listed Min. PSF Median PSF Max. PSF Number of Listings
Less than 30 days $3.1 $4.0 $5.8 90
Between 30 and 90 days $3.3 $4.0 $5.4 23
More than 90 days $2.8 $3.9 $4.7 12

Benson
Koh
90915000
PROPERTY ANALYSIS REPORT #13-09, Pebble Bay,132 Tanjong Rhu Road, (S) 436919Report produced for Mr. Ke by Benson Koh on Jun 15, 2011
Benson KohSLP REAL ESTATE EMPIRE PTE.
LTD. Call: 90915000
www.bensonkoh.com
Page 20 of 30
Information contained within this report does not constitute investment advice and should be used for guidance purposes only
4. Investment Analysis
4.1 Capital Gains Analysis
Average capital gains for transactions in Pebble Bay is +4.1%. This compares with average inflationrate of +1.6% in the last 10 years
Capital Gains Trend for Pebble Bay
Cap
ital G
ain
s (%
)
-20-10
0102030405060708090
2001
2002
2003
2004
2005
2006
2007
2008
2009
2010
2011
2012
Capital Gains Trend for East Coast / Marine Parade
Cap
ital G
ain
s (%
)
-10
0
10
20
2001
2002
2003
2004
2005
2006
2007
2008
2009
2010
2011
Average Capital Gains for aspecific project can be misleadingas a lot of it depends what part ofthe market cycle the project waslaunched. It is therefore notnecessarily a good predictor offuture price appreciation. Overtime, one would assume propertyprices rise with inflation andincome.
Average Annual Capital Gains in Comparative ProjectsProject Capital Gains
Pebble Bay +4.1%
Costa Rhu +3.5%
Citylights +17.5%
Sanctuary Green +5.6%
Kerrisdale +9.4%
Water Place +6.5%
The row highlighted yellow above represents the selected unit.
Benson
Koh
90915000
PROPERTY ANALYSIS REPORT #13-09, Pebble Bay,132 Tanjong Rhu Road, (S) 436919Report produced for Mr. Ke by Benson Koh on Jun 15, 2011
Benson KohSLP REAL ESTATE EMPIRE PTE.
LTD. Call: 90915000
www.bensonkoh.com
Page 21 of 30
Information contained within this report does not constitute investment advice and should be used for guidance purposes only
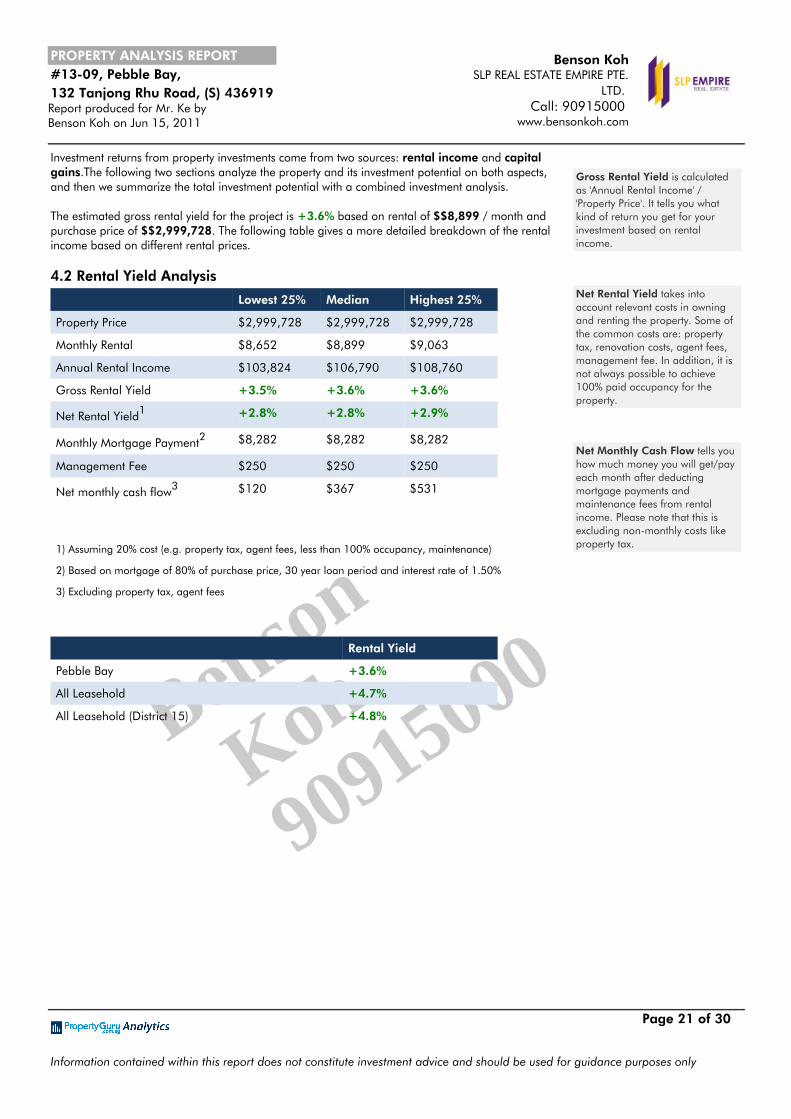
Investment returns from property investments come from two sources: rental income and capitalgains.The following two sections analyze the property and its investment potential on both aspects,and then we summarize the total investment potential with a combined investment analysis.
The estimated gross rental yield for the project is +3.6% based on rental of $$8,899 / month andpurchase price of $$2,999,728. The following table gives a more detailed breakdown of the rentalincome based on different rental prices.
4.2 Rental Yield Analysis
Lowest 25% Median Highest 25%
Property Price $2,999,728 $2,999,728 $2,999,728
Monthly Rental $8,652 $8,899 $9,063
Annual Rental Income $103,824 $106,790 $108,760
Gross Rental Yield +3.5% +3.6% +3.6%
Net Rental Yield1 +2.8% +2.8% +2.9%
Monthly Mortgage Payment2 $8,282 $8,282 $8,282
Management Fee $250 $250 $250
Net monthly cash flow3 $120 $367 $531
1) Assuming 20% cost (e.g. property tax, agent fees, less than 100% occupancy, maintenance)
2) Based on mortgage of 80% of purchase price, 30 year loan period and interest rate of 1.50%
3) Excluding property tax, agent fees
Rental Yield
Pebble Bay +3.6%
All Leasehold +4.7%
All Leasehold (District 15) +4.8%
Gross Rental Yield is calculatedas 'Annual Rental Income' /'Property Price'. It tells you whatkind of return you get for yourinvestment based on rentalincome.
Net Rental Yield takes intoaccount relevant costs in owningand renting the property. Some ofthe common costs are: propertytax, renovation costs, agent fees,management fee. In addition, it isnot always possible to achieve100% paid occupancy for theproperty.
Net Monthly Cash Flow tells youhow much money you will get/payeach month after deductingmortgage payments andmaintenance fees from rentalincome. Please note that this isexcluding non-monthly costs likeproperty tax.

Benson
Koh
90915000
PROPERTY ANALYSIS REPORT #13-09, Pebble Bay,132 Tanjong Rhu Road, (S) 436919Report produced for Mr. Ke by Benson Koh on Jun 15, 2011
Benson KohSLP REAL ESTATE EMPIRE PTE.
LTD. Call: 90915000
www.bensonkoh.com
Page 22 of 30
Information contained within this report does not constitute investment advice and should be used for guidance purposes only
4.3 Combined Investment Returns Analysis
Combined investment returns analysis shows full calculation for investment returns based on bothrental income and capital gains. The following calculation is based on estimated gross rental yield of+3.6% and average annual property price appreciation of +3.9%
Holding Period 2 years 5 years 10 years 15 years
Purchase Price $2,999,728 $2,999,728 $2,999,728 $2,999,728
Stamp Duty $84,592 N/A N/A N/A
Down Payment 1 $684,537 $684,537 $684,537 $684,537
Rental Income $217,745 $577,256 $1,276,206 $2,122,505
Running Costs 2 $43,549 $115,451 $255,241 $424,501
Mortgage Amount 3 $2,399,782 $2,399,782 $2,399,782 $2,399,782
Mortgage Payments 3 $198,771 $496,928 $993,856 $1,490,784
Mortgage Remaining 3 $2,271,165 $2,070,863 $1,716,343 $1,334,229
Sale Price $3,238,269 $3,632,115 $4,397,819 $5,324,944
Net Proceeds fromsale
$967,104 $1,561,252 $2,681,476 $3,990,715
Net Rental Cash Flows -$24,575 -$35,123 $27,109 $207,220
Total Cash Flow $942,529 $1,526,129 $2,708,585 $4,197,935
Total AnnualizedReturn on Investment
+17.3% +17.4% +14.7% +12.9%
1)20% of purchase price + Stamp Duty
2) Assuming 20% cost (e.g. property tax, agent fees, less than 100% occupancy, maintenance, insurance).
3) Based on mortgage of 80% of purchase price, 30 year loan period and interest rate of 1.50%.
4) Net Rental Cash Flow = (Rental Income minus Running Costs) minus Mortgage payments.
Return on Investment iscalculated against the downpayment you put into the property,not the whole purchase price. Thatis effectively the investment you aremaking from your savings. Youcan increase your returns bylowering your investment amount(i.e. down payment) and havinghigher mortgage, but it will at thesame time increase your risk.
Stamp Duty is calculated on thePurchase Price as 1% of First$180k, 2% on the Next $180k and3% thereafter. Note: In Feb 2010,the seller of a residential propertymust pay Seller's Stamp Duty (SSD)if the property was acquired (orpurchased) on or after 20 Feb2010 and disposed of (or sold)within one year from theacquisition date. Propertiesacquired before 20 Feb 2010 willnot be subject to SSD whendisposed of. On 30 Aug 2010, theGovernment further announcedthat SSD will be payable onresidential properties which arebought or acquired on or after 30Aug 2010 and sold or disposed ofwithin 3 years of acquisition. On13 January 2011, the Governmentannounced the extension of theholding period for imposition ofSSD on residential properties from3 years to 4 years based on newrates. The new SSD rates will beimposed on residential propertieswhich are acquired (or purchased)on or after 14 January 2011 anddisposed of (or sold) within 4 yearsof acquisition, as follows :
•Holding period of 1 year : 16% ofprice or market value, whichever ishigher •Holding period of 2 years : 12% ofprice or market value, whichever ishigher •Holding period of 3 years : 8% ofprice or market value, whichever ishigher•Holding period of 4 years : 4% ofprice or market value, whichever ishigher

Benson
Koh
90915000
PROPERTY ANALYSIS REPORT #13-09, Pebble Bay,132 Tanjong Rhu Road, (S) 436919Report produced for Mr. Ke by Benson Koh on Jun 15, 2011
Benson KohSLP REAL ESTATE EMPIRE PTE.
LTD. Call: 90915000
www.bensonkoh.com
Page 23 of 30
Information contained within this report does not constitute investment advice and should be used for guidance purposes only
4.4 Estimated Rental Yield in Comparative Projects
Project Rental Yield
Pebble Bay +3.6%
Costa Rhu +3.1%
Citylights +4.0%
Sanctuary Green +5.3%
Kerrisdale +4.7%
Water Place +3.9%
The row highlighted yellow above represents the rental yield of the selected project.
Benson
Koh
90915000
PROPERTY ANALYSIS REPORT #13-09, Pebble Bay,132 Tanjong Rhu Road, (S) 436919Report produced for Mr. Ke by Benson Koh on Jun 15, 2011
Benson KohSLP REAL ESTATE EMPIRE PTE.
LTD. Call: 90915000
www.bensonkoh.com
Page 24 of 30
Information contained within this report does not constitute investment advice and should be used for guidance purposes only
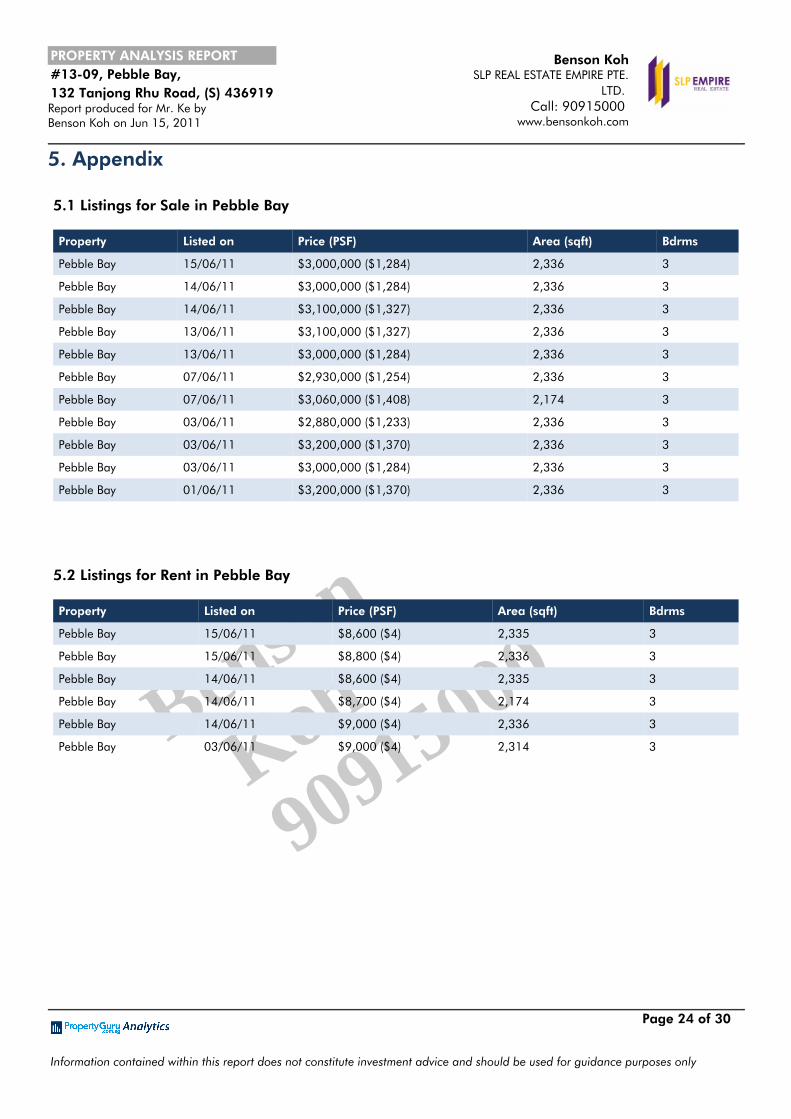
5. Appendix
5.1 Listings for Sale in Pebble Bay
Property Listed on Price (PSF) Area (sqft) Bdrms
Pebble Bay 15/06/11 $3,000,000 ($1,284) 2,336 3
Pebble Bay 14/06/11 $3,000,000 ($1,284) 2,336 3
Pebble Bay 14/06/11 $3,100,000 ($1,327) 2,336 3
Pebble Bay 13/06/11 $3,100,000 ($1,327) 2,336 3
Pebble Bay 13/06/11 $3,000,000 ($1,284) 2,336 3
Pebble Bay 07/06/11 $2,930,000 ($1,254) 2,336 3
Pebble Bay 07/06/11 $3,060,000 ($1,408) 2,174 3
Pebble Bay 03/06/11 $2,880,000 ($1,233) 2,336 3
Pebble Bay 03/06/11 $3,200,000 ($1,370) 2,336 3
Pebble Bay 03/06/11 $3,000,000 ($1,284) 2,336 3
Pebble Bay 01/06/11 $3,200,000 ($1,370) 2,336 3
5.2 Listings for Rent in Pebble Bay
Property Listed on Price (PSF) Area (sqft) Bdrms
Pebble Bay 15/06/11 $8,600 ($4) 2,335 3
Pebble Bay 15/06/11 $8,800 ($4) 2,336 3
Pebble Bay 14/06/11 $8,600 ($4) 2,335 3
Pebble Bay 14/06/11 $8,700 ($4) 2,174 3
Pebble Bay 14/06/11 $9,000 ($4) 2,336 3
Pebble Bay 03/06/11 $9,000 ($4) 2,314 3

Benson
Koh
90915000
PROPERTY ANALYSIS REPORT #13-09, Pebble Bay,132 Tanjong Rhu Road, (S) 436919Report produced for Mr. Ke by Benson Koh on Jun 15, 2011
Benson KohSLP REAL ESTATE EMPIRE PTE.
LTD. Call: 90915000
www.bensonkoh.com
Page 25 of 30
Information contained within this report does not constitute investment advice and should be used for guidance purposes only
5.3 Listings for Sale in Nearby Properties
Property Listed on Price (PSF) Area (sqft) Bdrms
Water Place 15/06/11 $1,400,000 ($1,151) 1,216 3
Sanctuary Green 15/06/11 $1,600,000 ($1,144) 1,399 3
Water Place 15/06/11 $1,700,000 ($1,161) 1,464 3
Citylights 15/06/11 $3,795,000 ($1,500) 2,530 4
Kerrisdale 15/06/11 $1,300,000 ($1,024) 1,270 3
Citylights 15/06/11 $1,680,000 ($1,239) 1,356 3
Water Place 15/06/11 $1,450,000 ($1,192) 1,216 3
Citylights 15/06/11 $1,350,000 ($1,548) 872 2
Kerrisdale 15/06/11 $1,288,888 ($1,024) 1,259 3
Costa Rhu 15/06/11 $1,569,600 ($900) 1,744 2
Costa Rhu 15/06/11 $1,300,000 ($902) 1,442 2
Costa Rhu 15/06/11 $1,214,400 ($1,200) 1,012 2
Costa Rhu 15/06/11 $1,550,000 ($1,108) 1,399 2
Citylights 15/06/11 $2,150,000 ($1,586) 1,356 3
Citylights 15/06/11 $1,680,000 ($1,239) 1,356 3
Kerrisdale 15/06/11 $1,280,000 ($1,017) 1,259 3
Kerrisdale 15/06/11 $1,270,000 ($1,009) 1,259 3
Costa Rhu 15/06/11 $2,350,000 ($1,143) 2,056 4
Costa Rhu 15/06/11 $1,750,000 ($1,003) 1,744 2
Costa Rhu 15/06/11 $3,000,000 ($1,364) 2,200 4

Benson
Koh
90915000
PROPERTY ANALYSIS REPORT #13-09, Pebble Bay,132 Tanjong Rhu Road, (S) 436919Report produced for Mr. Ke by Benson Koh on Jun 15, 2011
Benson KohSLP REAL ESTATE EMPIRE PTE.
LTD. Call: 90915000
www.bensonkoh.com
Page 26 of 30
Information contained within this report does not constitute investment advice and should be used for guidance purposes only
5.4 Listings for Rent in Nearby Properties
Property Listed on Price (PSF) Area (sqft) Bdrms
Citylights 15/06/11 $5,500 ($4) 1,442 3
Costa Rhu 15/06/11 $5,700 ($3) 1,647 3
Costa Rhu 15/06/11 $7,100 ($4) 1,970 4
Water Place 15/06/11 $5,000 ($3) 1,464 3
Costa Rhu 15/06/11 $6,999 ($4) 1,970 4
Costa Rhu 15/06/11 $4,099 ($4) 990 2
Costa Rhu 15/06/11 $3,790 ($4) 990 2
Costa Rhu 15/06/11 $3,590 ($4) 990 2
Water Place 15/06/11 $5,300 ($4) 1,357 3
Costa Rhu 15/06/11 $6,510 ($3) 2,056 4
Costa Rhu 15/06/11 $5,500 ($3) 1,647 3
Costa Rhu 15/06/11 $7,000 ($4) 1,970 4
Costa Rhu 15/06/11 $4,000 ($4) 990 2
Costa Rhu 15/06/11 $6,000 ($3) 1,776 3
Citylights 15/06/11 $3,800 ($7) 560 1
Water Place 15/06/11 $4,500 ($4) 1,216 3
Water Place 15/06/11 $5,000 ($3) 1,464 3
Costa Rhu 15/06/11 $6,900 ($4) 1,970 4
Costa Rhu 15/06/11 $4,100 ($4) 990 2
Costa Rhu 15/06/11 $3,700 ($4) 990 2

Benson
Koh
90915000
PROPERTY ANALYSIS REPORT #13-09, Pebble Bay,132 Tanjong Rhu Road, (S) 436919Report produced for Mr. Ke by Benson Koh on Jun 15, 2011
Benson KohSLP REAL ESTATE EMPIRE PTE.
LTD. Call: 90915000
www.bensonkoh.com
Page 27 of 30
Information contained within this report does not constitute investment advice and should be used for guidance purposes only
6. GlossaryAnnual rental income: Income annually received from rental properties.
Average Sale Price: The average price per square foot for all transactions in the quarter for properties in aparticular district. It gives you a view of level of prices people are generally paying inthe district, but it should not be used for comparing like-for-like prices as it can bedistorted by higher prices paid for new launches.
Capital gain: The amount by which an asset's selling price exceeds its initial purchase price. Arealized capital gain is an investment that has been sold at a profit. Capital gain isoften used to mean realized capital gain. For most investments sold at a profit,including mutual funds, bonds,options, collectibles, homes, and businesses, theInland Revenue Authority of Singapore (IRAS) is owed money called capital gains tax.
Cash Payment: Can be combination of money from CPF account and cash savings. You should checkhow much you have in your CPF account, so you know how much cash you exactlyneed to purchase the property.
Down-payment: Used in the context of the purchase of a house, whereby the payment is the initialupfront portion of the total amount due and it is usually given in cash at the time offinalizing the transaction.
Freehold: The exclusive ownership of a property for an indefinite period of time. A freeholdproperty lies with the title holder unless he transfers it on his own.
Leasehold: Leasehold is the property which was held by a person by virtue of a lease agreementbetween him and the owner, permitting him to hold the property for such a period assaid in the lease agreement for a consideration payable to the owner of the property.It differs from the freehold property to the extent that it is returnable after the expiry ofthe period.
Gross Rental Yield: Calculated as 'Annual Rental Income' / 'Property Price'. It tells you what kind of returnyou get for your investment based on rental income.
Management Fee: The cost of professional property management, with a fee typically set at a fixedpercentage of total rental income generated by the managed property.
Median Private Residential Rental Price: The median per square foot price paid for rentals in Singapore for private properties.It is useful for understanding general market trends for rentals. The index is publishedby URA from IRAS data every quarter.
Monthly mortgage payment: The mortgage payment made each month.
Monthly rental: monthly payment, usually of an amount fixed by contract, made by a tenant atspecified intervals in return for the right to occupy or use the property of another.
Mortgage amount: The quantity of the mortgage, a transfer of interest of a property or real estate fromthe borrower to the lender as security for a loan.
Mortgage payment: A long-term loan paid to help the borrower purchase a property. In addition torepaying the principal, the borrower is obligated to make interest payments to thelender, and the property and the land around it serves as collateral.
Mortgage: A transfer of interest of a property or real estate from the borrower to the lender assecurity for a loan. Should the borrower be unable to repay the loan, the lender canforeclose the property and sell it off to pay off the debt.
Mortgage remaining: The remaining amount of the principal at a time specified in the contract.
Net Monthly Cash Flow: Tells you how much money you will get/pay each month after deducting mortgagepayments and maintenance fees from rental income. Please note that this is excludingnon-monthly costs like property tax.

Benson
Koh
90915000
PROPERTY ANALYSIS REPORT #13-09, Pebble Bay,132 Tanjong Rhu Road, (S) 436919Report produced for Mr. Ke by Benson Koh on Jun 15, 2011
Benson KohSLP REAL ESTATE EMPIRE PTE.
LTD. Call: 90915000
www.bensonkoh.com
Page 28 of 30
Information contained within this report does not constitute investment advice and should be used for guidance purposes only
Net proceeds from sale: For a property, net proceeds are the price of the house minus commissions, closingcosts, costs of any repairs and inspections that may need to be undertaken, and realestate agent's charges.
Net rent: The total rent paid by a tenant to a landowner minus the amount paid by thelandowner for land taxes or any maintenance expenses incurred solely as aconsequence of owning the land.
Net Rental Yield: Takes into account relevant costs in owning and renting the property. Some of thecommon costs are: property tax, renovation costs, agent fees, management fee. Inaddition, it is not always possible to achieve 100% paid occupancy for the property.
New sale: Refers to a new home sale.
Property price: Market value, or agreed exchange value, that will purchase a definite quantity,weight, or other measure of a property.
PSF: Per Square Foot, an area measurement unit.
Purchase price: the price at which the property is actually purchased.
Rental income: Monthly income received from rental properties.
Rental yield: the amount of money that a landlord can expect to receive in rent, expressed as apercentage of the purchase price of the property.
Resale: Re-sale is the sale of a property which someone has bought with an intention to sell itto another person.
Return on Investment: The investment you are making from your savings. You can increase your returns bylowering your investment amount (i.e. down payment) and having higher mortgage,but it will at the same time increase your risk.
Running cost: Day to day cost incurred in operating a firm or facility.
Sale price: The price at which the property is actually sold.
Sales History: In your negotiations it is useful to understand whether the present owner is selling atprofit or loss as it may be one of the factors on how flexible the owner is with theprice.
Singapore Private Property Index: A published quarterly by the Urban Redevelopment Authority (URA). It is based onproperty transaction caveats lodged in the specific quarter. As a result, there may bea lag between the booking of the unit transaction and when caveat is officiallylodged. En-bloc (collective) sales are excluded from the market index.

Benson
Koh
90915000
PROPERTY ANALYSIS REPORT #13-09, Pebble Bay,132 Tanjong Rhu Road, (S) 436919Report produced for Mr. Ke by Benson Koh on Jun 15, 2011
Benson KohSLP REAL ESTATE EMPIRE PTE.
LTD. Call: 90915000
www.bensonkoh.com
Page 29 of 30
Information contained within this report does not constitute investment advice and should be used for guidance purposes only
Stamp duty: A tax on executed documents relating to properties or interest in properties andshares or interest in shares. It is calculated on the Purchase Price as 1% of First$180k, 2% on the Next $180k and 3% thereafter. Note: In Feb 2010, the seller of aresidential property must pay Seller's Stamp Duty (SSD) if the property was acquired(or purchased) on or after 20 Feb 2010 and disposed of (or sold) within one yearfrom the acquisition date. Properties acquired before 20 Feb 2010 will not be subjectto SSD when disposed of. On 30 Aug 2010, the Government further announced thatSSD will be payable on residential properties which are bought or acquired on orafter 30 Aug 2010 and sold or disposed of within 3 years of acquisition. On 13January 2011, the Government announced the extension of the holding period forimposition of SSD on residential properties from 3 years to 4 years based on newrates. The new SSD rates will be imposed on residential properties which are acquired(or purchased) on or after 14 January 2011 and disposed of (or sold) within 4 yearsof acquisition, as follows :
•Holding period of 1 year : 16% of price or market value, whichever is higher •Holding period of 2 years : 12% of price or market value, whichever is higher •Holding period of 3 years : 8% of price or market value, whichever is higher•Holding period of 4 years : 4% of price or market value, whichever is higher
Temporary Occupancy Permit (TOP): A building can only be occupied once it receives the Temporary Occupancy Permit(TOP) or the Certificate of Statutory Completion (CSC). Both are granted by TheCommissioner of Building Control. Unlike a CSC, a TOP is not compulsory and therequirements to obtain a TOP are less stringent.
Total cashflow: The amount of cash derived over a certain period of time from an income-producingproperty. The cash flow should be large enough to pay the expenses of the incomeproducing property (mortgage payment, maintenance, utilities, etc.)
Valuation Limit: The Valuation Limit (VL) is the lower of the purchase price or the value of the propertyat the time of purchase.

Benson
Koh
90915000
PROPERTY ANALYSIS REPORT #13-09, Pebble Bay,132 Tanjong Rhu Road, (S) 436919Report produced for Mr. Ke by Benson Koh on Jun 15, 2011
Benson KohSLP REAL ESTATE EMPIRE PTE.
LTD. Call: 90915000
www.bensonkoh.com
Page 30 of 30
Information contained within this report does not constitute investment advice and should be used for guidance purposes only
Using This PropertyGuru Analytics Report
This PropertyGuru Analytics Report for Unit #13-09, Pebble Bay was produced on Jun 15, 2011 by Benson Koh using the"PropertyGuru Analytics" service. It includes transaction data up to May 30, 2011 and current asking prices taken fromwww.PropertyGuru.com.sg on Jun 15, 2011. PropertyGuru Analytics is a service created by AllProperty Media Pte Ltd, the owners ofwww.PropertyGuru.com.sg. It is designed to help buyers, sellers and industry experts to make better informed property decisionsfaster.It enables you to analyze Pebble Bay and compare with similar nearby projects to help decide whether to buy, sell or rentunits in the project, as well as to calculate potential capital gains and rental yields you might expect. PropertyGuru uses andanalyzes data real time from a large number of sources including historical transaction data, inflation, average capitalappreciation, changes in price indices, average current asking prices to produce this report. Whilst every effort has been made toensure the accuracy of the data in this report as it is impossible to calculate the exact value of a property as each transaction drivenby individual buyer and sellers needs at the time of the transaction.
This report has been prepared without any specific objectives, or consideration of the reader’s specific financial status andgoals. As such, it and the data included within it, shall not be construed as investment advice. No investment decision should bemade solely on the basis of the numbers in the report and AllProperty Media Pte Ltd takes no responsibility for any decisions madeas a result of it. Investors should at all times fully research all relevant information and seek advice from property, legal andfinancial advisors before buying, selling or renting a specific property.
© AllProperty Media Pte Ltd 2011
Feedback
If you have any questions, feedback or suggestions on improving this PropertyGuru Analytics report please [email protected] or call +65 6238 5971. You can also visit www.propertyguru.com.sg for moreinformation.