benefits of in-vehicle consolidation in less than truckload freight transportation operations
TRANSCRIPT

Procedia - Social and Behavioral Sciences 80 ( 2013 ) 576 – 590
1877-0428 © 2013 The Authors. Published by Elsevier Ltd.Selection and peer-review under responsibility of Delft University of Technologydoi: 10.1016/j.sbspro.2013.05.031
_________ * Corresponding author. Tel.: +1-765-494-2296; fax: +1-765-494-0395.
E-mail address: [email protected]
20th International Symposium of Transportation and Traffic Theory
Benefits of in-vehicle consolidation in less than Truckload freight transportation
operations Rodrigo Mesa-Arangoa, Satish V. Ukkusuri a,*
a Purdue University, 550 Stadium Mall Drive, West Lafayette IN 47907, USA
Abstract Researchers and public agencies have proposed consolidation policies as an alternative to increase truck payload utilization and mitigate externalities produced by freight transportation. Understanding and enhancing the economic mechanisms that lead to freight consolidation can ease the implementation of these strategies, increase profits for shippers and carriers, and reduce freight-related negative externalities. An important mechanism that has recently been studied for cost reduction in the freight industry is combinatorial auctions. In these auctions, a shipper invites a set of carriers to submit bids for freight lane contracts. Carriers can bid for individual lanes or bundles of them according to their operational characteristics. These bids are constructed considering direct shipments (Truckload operations) and several biding advisory models have been proposed for this purpose. However, there are economies of scale that can be achieved if shipments are consolidated inside vehicles, which have not been explored in the construction of competitive bids. This paper investigates such benefits and provides insights on the competitiveness and challenges associated to the development of consolidated bids (suitable for Less-than-Truckload operations). Consolidated bids are constructed using a multi-commodity one-to-one pickup-and-delivery vehicle routing problem that is solved using a branch-and-price algorithm. The numerical experiment shows that non-consolidated bids are dominated by consolidated bids, which implies that this type of operation can increase the likelihood of a carrier to win auctioned lanes, while increasing its profits margins over truckload companies (non-consolidated bids), and keeping the reported benefits that combinatorial auctions represent for shippers. © 2013 The Authors. Published by Elsevier Ltd. Selection and peer-review under responsibility of Delft University of Technology. Keywords: Freight transportation; combinatorial auctions; trucking; less than truckload; logistics; branch-and-price; consolidation; vehicle routing problem; multi-commodity; pickup and delivery
1. Introduction
Freight transportation is an important economic indicator of a nation. In 2010, the demand of transportation related goods and services represent 9.1% ($1,316 billion dollars) of the United States (US) Gross Domestic Product (GDP) ($14,499 billion dollars). In the same year, for-hire transportation services represent 2.8% of the US GDP ($402.5 billion dollars), where trucking contributed to 28.8%, followed by air transportation 15.7%, and rail 8.0%, i.e. $116, $63.3, and $14.7 billion dollars respectively [1]. Despite the economic importance of trucking operations, there are several externalities associated to trucking, e.g., congestion, pollution, noise and accidents. One strategy to mitigate these externalities is to utilize unused capacity inside the trucks ([2], [3], [4], [5]). Understanding and promoting economic mechanisms that improve truck utilization while enhancing shippers and carriers profits can accelerate the acceptance and implementation of such strategies.
An evolving market mechanism used to assign freight contracts to carriers is combinatorial auctions, which has shown costs savings for both shippers and carriers. These auctions have been successfully implemented by several firms, e.g., Home Depot Inc., Wal-Mart Stores Inc., Compaq Computer Corporation, Staples Inc., The Limited, K-Mart
Available online at www.sciencedirect.com
© 2013 The Authors. Published by Elsevier Ltd.Selection and peer-review under responsibility of Delft University of Technology
577 Rodrigo Mesa-Arango and Satish V. Ukkusuri / Procedia - Social and Behavioral Sciences 80 ( 2013 ) 576 – 590
Corporation, Ford Motor company, Reynolds Metal Company, Sears Logistics Services, among others ([6], [7], [8], [9], [10]).
A freight transportation combinatorial auction is a reverse auction, i.e., auctioneers are buyers and bidders are sellers. Thus, a shipper auctions freight lanes, i.e., shipments to be transported between geographically distributed origins and destinations, and a group of carriers bid for them. The main characteristic of a combinatorial auction is that, rather than bidding for individual lanes, carriers can bid for bundles of lanes. This is attractive to the shippers because the price of a shipment served as part of a bundle is usually lower than or equal to the price of serving it individually. Once all the bids are collected, the shipper solves the Winner Determination Problem (WDP) to match lanes with the most appropriate carriers. Extensive research has been conducted to formulate and solve the WDP in combinatorial auctions ([11], [12], [13], [14]). On the other hand, carriers are responsible for building and submitting bids that are attractive to the shipper. Competitive prices are usually achieved when the quoted lanes are complementary to the routes operated by the carrier. Previous researchers propose bidding advisory models to solve this problem ([15], [16], [17], [18], [19]).
Defining appropriate routes is important for the carriers to distribute the variable cost among their clients, achieving different levels of economy, and quoting competitive shipping prices. To understand how this has been done previously, we briefly review the microeconomic operation of trucking firms. The total income perceived by a carrier is the sum of the prices charged to each shipment transported in a time period. Likewise, the total cost is the summation of costs associated with the delivering routes plus fixed costs. The total profit is defined by the difference between these two. For example, for a carrier serving the shipment charged with a price following the route , the total profit associated with this shipment is , where is the total cost related to the operation of route , and are fixed costs. To observe how route definition affects the value of the prices, assume that there is another shipper that needs transportation for a shipment and requests a quote from the carrier. If the carrier decides to charge a price for that shipment, the corresponding total profit would be , where is the route serving both shipments and . For a rational carrier it is expected that , and therefore,
, where is an upper bound determining the maximum price that the shipper is willing to pay for this service. Notice that if the carrier can serve both shipments following the same route, then where is a small cost increment and, therefore, . Furthermore, might be reduced down to without affecting the carrier profits. But, if the new shipper accepts to pay a price that would imply more profits for the carrier. This shows that bidding for lanes complementary to the routes currently operated by the carrier has the potential of reducing the prices charged to these lanes and increasing the probability of getting the contracts. The variable costs for these routes depend on operational characteristics of the carrier, e.g., the number of vehicles operated, total distance traveled, repositioning of vehicles, geographical location of the pickups and deliveries, current commitments, location of the depot, among others. Considering all these elements in the construction of a bid is not easy and potentially leads to suboptimal solutions.
The complexity of building competitive bids has been studied by several researchers. In their seminal work, Song and Regan ([15], [16]), investigate the benefits perceived by carriers that participate in combinatorial auctions. They conclude that these auctions are more beneficial than simple sequential sealed-bid auctions and present methods for bid valuation and bid construction that require the solution of a NP-hard problem. The models presented by Song and Regan assume that the carrier has availability of vehicles at each node in the network, unlimited vehicle capacity and Truckload (TL) operation. In this context, Wang and Xia [17] clarify the bidder’s optimality criterion and present heuristic methodologies to solve this problem. They consider a central depot, which relaxes one of the previous assumptions. Additionally, Lee, et al, [18] approach this problem based on a vehicle routing methodology. Their formulation constructs routes by optimally trading off repositioning costs of vehicles and the rewards associated with servicing lanes. Likewise, this formulation relaxes some of the previous assumptions and is solved using a suitable methodology based on column generation. Once again, their formulation is only appropriate for carriers with TL operations. Finally, Chang [19] develops a bidding advisory model for TL carriers using a minimum cost network flow problem.
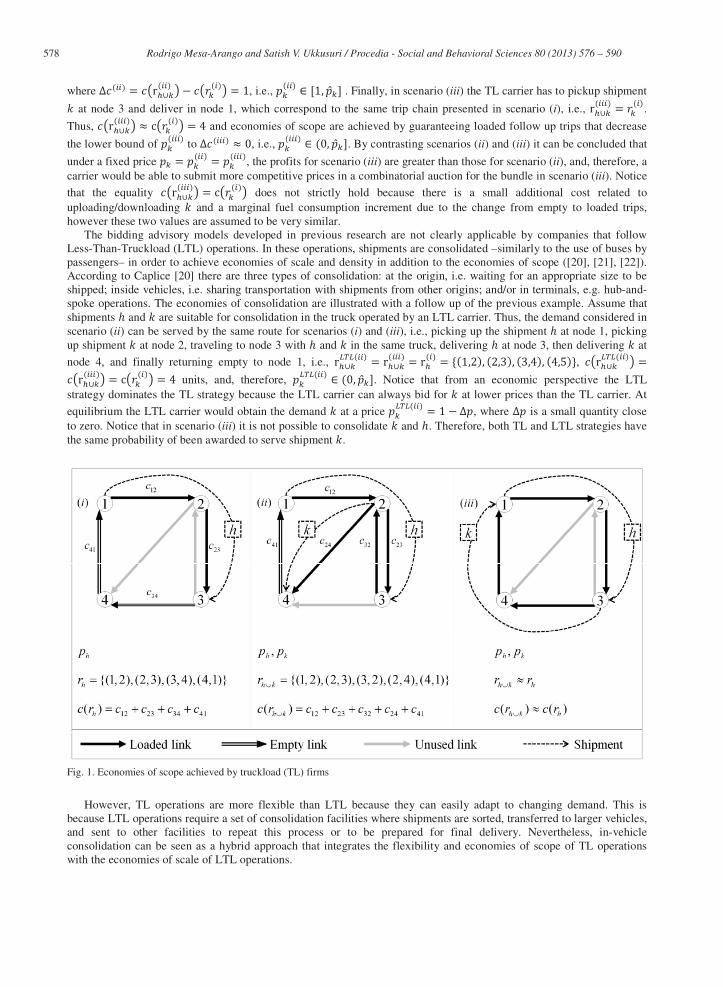
Previous biding advisory models focus primarily on carriers with TL operations, where shipments are sent directly from origin to destination using an exclusive truck –similar to the use of taxis by passengers. This type of operation is mainly driven by economies of scope. These economies are achieved when there are follow-up loads that reduce the number of empty trips in a given trip chain/route ([20], [21], [22]). This concept is illustrated with the following case based on the previous example, as well as the directed network and demand scenarios shown in Fig. 1 (i, ii, and iii). Without loss of generality, let us assume unitary traversing costs for each link in the network. For a TL carrier in
Scenario (i) (Fig. 1), the route involves picking up the shipment at node 1, traveling to node 2, delivering at node 3
and returning empty to node 1 via node 4, i.e., trip chain , and total cost units (notice that the superscript in parenthesis indicates the referred scenario). In scenario (ii), the TL carrier has to
pickup at node 2 and deliver it at node 4. This implies a new trip chain with
total cost units. Thus, the price charged to the new shipment has to be defined in the range ,
578 Rodrigo Mesa-Arango and Satish V. Ukkusuri / Procedia - Social and Behavioral Sciences 80 ( 2013 ) 576 – 590
where , i.e., . Finally, in scenario (iii) the TL carrier has to pickup shipment
at node 3 and deliver in node 1, which correspond to the same trip chain presented in scenario (i), i.e., .
Thus, and economies of scope are achieved by guaranteeing loaded follow up trips that decrease
the lower bound of to , i.e., . By contrasting scenarios (ii) and (iii) it can be concluded that
under a fixed price , the profits for scenario (iii) are greater than those for scenario (ii), and, therefore, a carrier would be able to submit more competitive prices in a combinatorial auction for the bundle in scenario (iii). Notice
that the equality does not strictly hold because there is a small additional cost related to uploading/downloading and a marginal fuel consumption increment due to the change from empty to loaded trips, however these two values are assumed to be very similar.
The bidding advisory models developed in previous research are not clearly applicable by companies that follow Less-Than-Truckload (LTL) operations. In these operations, shipments are consolidated –similarly to the use of buses by passengers– in order to achieve economies of scale and density in addition to the economies of scope ([20], [21], [22]). According to Caplice [20] there are three types of consolidation: at the origin, i.e. waiting for an appropriate size to be shipped; inside vehicles, i.e. sharing transportation with shipments from other origins; and/or in terminals, e.g. hub-and-spoke operations. The economies of consolidation are illustrated with a follow up of the previous example. Assume that shipments and are suitable for consolidation in the truck operated by an LTL carrier. Thus, the demand considered in scenario (ii) can be served by the same route for scenarios (i) and (iii), i.e., picking up the shipment at node 1, picking up shipment at node 2, traveling to node 3 with and in the same truck, delivering at node 3, then delivering at
node 4, and finally returning empty to node 1, i.e., ,
units, and, therefore, . Notice that from an economic perspective the LTL strategy dominates the TL strategy because the LTL carrier can always bid for at lower prices than the TL carrier. At
equilibrium the LTL carrier would obtain the demand at a price , where is a small quantity close to zero. Notice that in scenario (iii) it is not possible to consolidate and . Therefore, both TL and LTL strategies have the same probability of been awarded to serve shipment .
Fig. 1. Economies of scope achieved by truckload (TL) firms
However, TL operations are more flexible than LTL because they can easily adapt to changing demand. This is
because LTL operations require a set of consolidation facilities where shipments are sorted, transferred to larger vehicles, and sent to other facilities to repeat this process or to be prepared for final delivery. Nevertheless, in-vehicle consolidation can be seen as a hybrid approach that integrates the flexibility and economies of scope of TL operations with the economies of scale of LTL operations.

579 Rodrigo Mesa-Arango and Satish V. Ukkusuri / Procedia - Social and Behavioral Sciences 80 ( 2013 ) 576 – 590
The objective of this paper is to quantify the benefits to carriers of in-vehicle consolidation in the bidding
construction process in a freight transportation combinatorial auction. The focus is not on the design of the auction per se but in demonstrating that in-vehicle consolidation in LTL framework can offer substantial gains to carriers. A multi-commodity one-to-one pickup-and-delivery vehicle routing problem (m-PDVRP) is used to determine partitions of the network (bundles) that minimize operational costs. Minimizing costs is important because a bundle with a fixed price can be served by different combinations of trucks/routes but only the one with minimum cost maximizes the profits of the carrier. Similarly, if several carriers bid for the same bundle but have different operational costs, the one with lower costs can always price lower obtaining profits that are greater than or equal to those perceived by the others. Consequently, low costs propitiate low prices which increases the probability of wining lanes that are part of a bundle and do not deteriorate profits when competing against other carriers that have higher costs. The m-PDVRP formulation explicitly incorporates the following carrier characteristics: a single depot where all routes start and end, a fleet of vehicles with specific capacity, and a consolidation policy where a single vehicle can carry shipments from different origin-destination OD pairs. In addition to the economies of scope considered in previous research, this formulation takes advantages of economies of density and scale to identify low cost routes. The m-PDVRP is a mixed-integer program (MIP) where binary variables determine the assignment of vehicles to road segments in the transportation network and continuous decision variables determine the amount of freight inside a vehicle at each segment of the network. Since using commercial software to solve this NP-hard problem is not practical - real world applications involve 1800 lanes on average [11] - a solution algorithm based on the branch-and-price methodology ([23], [24]) is proposed. The theoretical framework is problem specific, which means that no standard software exists to implement it. To the best of our knowledge, this is the first attempt to incorporate LTL features in the assessment of bids in combinatorial auctions for freight transportation. Then, a numerical experiment is conducted to contrast consolidated bids against non-consolidated bids. The results show that, from the pure economic perspective, consolidated (LTL) bids are more profitable and have higher probability of being selected than non-consolidated (TL) bids.
This paper is organized as follows: Section 1 presents the problem motivation and a review of previous work. Section 2 presents the problem definition, mathematical notation, and the MIP formulation. Section 3 presents the branch-and-price solution algorithm. Section 4 presents examples and computational experiments from the proposed methodology. Finally, Section 5 presents conclusions and future research directions. 2. Problem notation, definition, and formulation.
This section presents the mathematical formulation to identify the most valuable set of lanes (bundle) that can be submitted by a carrier in the freight market assuming that in-vehicle consolidation (LTL carrier) is allowed. Each auctioned lane presents the amount of demand that goes from a specific origin to a specific destination. Likewise, the set of lanes can be partitioned into subsets, where each of them is served by a truck and represents a bundle that can be submitted to the combinatorial auction. Thus, the maximum number of partitions corresponds to the maximum number of trucks available by the carrier. This idea for bundle definition is akin to the bidding advisory model proposed by Lee, et al [18], where a vehicle routing problem is used to determine optimal routes serving direct shipments (TL operation) and each route determines the lanes covered by a bundle. Furthermore, the problem approached in this paper corresponds to a multi-commodity one-to-one pickup-and-delivery vehicle routing problem (m-PDVHR), which has not been widely studied in previous literature. Although the formulation below is similar to the one presented by Hernández-Pérez, and Salazar-González [25] for the multi-commodity one-to-one traveling salesman problem (m-PDTSP), it considers multiple vehicles (a distinctive difference between the TSP and the VRP). To the best of our knowledge the only previous work related to m-PDVHR correspond to the one by Psaraftis [26], who uses dynamic programming to solve the problem but presents results that are limited to networks with low number of nodes (up to 4) and vehicles (up to 2). On the other hand, several works have been presented for LTL network design and vehicle routing ([27], [28], [29], [30]). However, these works are based on the consolidation and coordination of shipments trough facilities (hubs and spokes) that are strategically located in the transportation network, which is a rigid assumption that is associated to high investments in infrastructure, and do not consider the flexibility of in-vehicle consolidation for combinatorial auctions discussed in the introduction section. The mathematical notation followed throughout the paper is presented in Table 1. Subsequent subsections present a clear definition of the problem, modeling assumptions, and problem formulation. Table 1. Mathematical notation Notation Definition
Transportation network (complete directed graph) Set of all nodes in the transportation network. . Where 0 identifies the depot. Subset of nodes where loads have to be picked up or delivered.
Set of all directed arcs in the transportation network. Binary coefficient equal to one if arc is covered by the deployment or zero otherwise
580 Rodrigo Mesa-Arango and Satish V. Ukkusuri / Procedia - Social and Behavioral Sciences 80 ( 2013 ) 576 – 590
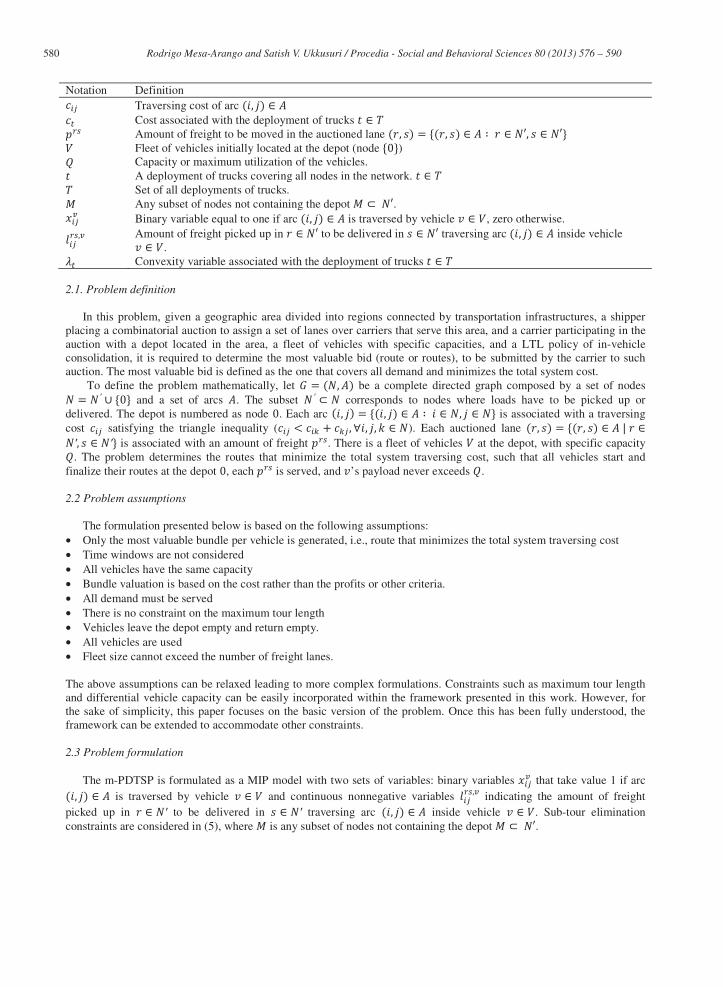
Notation Definition Traversing cost of arc
Cost associated with the deployment of trucks Amount of freight to be moved in the auctioned lane
Fleet of vehicles initially located at the depot (node ) Capacity or maximum utilization of the vehicles.
A deployment of trucks covering all nodes in the network. Set of all deployments of trucks.
Any subset of nodes not containing the depot . Binary variable equal to one if arc is traversed by vehicle , zero otherwise.
Amount of freight picked up in to be delivered in traversing arc inside vehicle .
Convexity variable associated with the deployment of trucks 2.1. Problem definition
In this problem, given a geographic area divided into regions connected by transportation infrastructures, a shipper placing a combinatorial auction to assign a set of lanes over carriers that serve this area, and a carrier participating in the auction with a depot located in the area, a fleet of vehicles with specific capacities, and a LTL policy of in-vehicle consolidation, it is required to determine the most valuable bid (route or routes), to be submitted by the carrier to such auction. The most valuable bid is defined as the one that covers all demand and minimizes the total system cost.
To define the problem mathematically, let be a complete directed graph composed by a set of nodes and a set of arcs . The subset corresponds to nodes where loads have to be picked up or
delivered. The depot is numbered as node . Each arc is associated with a traversing cost satisfying the triangle inequality ( ). Each auctioned lane
is associated with an amount of freight . There is a fleet of vehicles at the depot, with specific capacity . The problem determines the routes that minimize the total system traversing cost, such that all vehicles start and
finalize their routes at the depot , each is served, and ’s payload never exceeds . 2.2 Problem assumptions
The formulation presented below is based on the following assumptions: • Only the most valuable bundle per vehicle is generated, i.e., route that minimizes the total system traversing cost • Time windows are not considered • All vehicles have the same capacity • Bundle valuation is based on the cost rather than the profits or other criteria. • All demand must be served • There is no constraint on the maximum tour length • Vehicles leave the depot empty and return empty. • All vehicles are used • Fleet size cannot exceed the number of freight lanes. The above assumptions can be relaxed leading to more complex formulations. Constraints such as maximum tour length and differential vehicle capacity can be easily incorporated within the framework presented in this work. However, for the sake of simplicity, this paper focuses on the basic version of the problem. Once this has been fully understood, the framework can be extended to accommodate other constraints. 2.3 Problem formulation
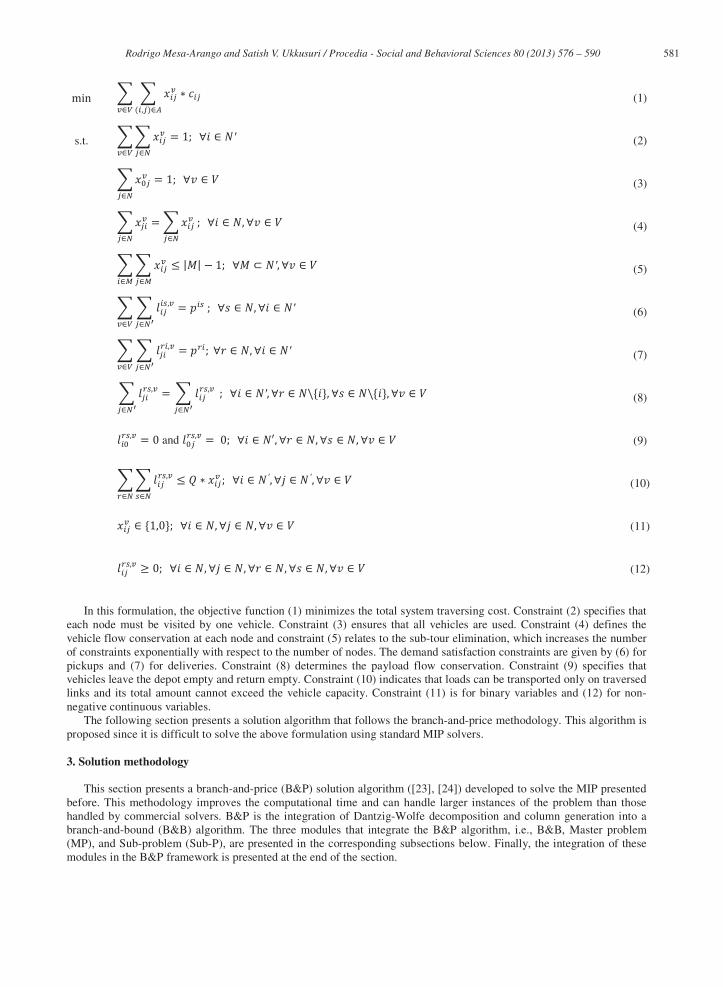
The m-PDTSP is formulated as a MIP model with two sets of variables: binary variables that take value 1 if arc is traversed by vehicle and continuous nonnegative variables indicating the amount of freight
picked up in to be delivered in traversing arc inside vehicle . Sub-tour elimination constraints are considered in (5), where is any subset of nodes not containing the depot .
581 Rodrigo Mesa-Arango and Satish V. Ukkusuri / Procedia - Social and Behavioral Sciences 80 ( 2013 ) 576 – 590
(1)
s.t. (2)
(3)
(4)
(5)
(6)
(7)
(8)
and (9)
(10)
(11)
(12)
In this formulation, the objective function (1) minimizes the total system traversing cost. Constraint (2) specifies that
each node must be visited by one vehicle. Constraint (3) ensures that all vehicles are used. Constraint (4) defines the vehicle flow conservation at each node and constraint (5) relates to the sub-tour elimination, which increases the number of constraints exponentially with respect to the number of nodes. The demand satisfaction constraints are given by (6) for pickups and (7) for deliveries. Constraint (8) determines the payload flow conservation. Constraint (9) specifies that vehicles leave the depot empty and return empty. Constraint (10) indicates that loads can be transported only on traversed links and its total amount cannot exceed the vehicle capacity. Constraint (11) is for binary variables and (12) for non-negative continuous variables.
The following section presents a solution algorithm that follows the branch-and-price methodology. This algorithm is proposed since it is difficult to solve the above formulation using standard MIP solvers. 3. Solution methodology
This section presents a branch-and-price (B&P) solution algorithm ([23], [24]) developed to solve the MIP presented before. This methodology improves the computational time and can handle larger instances of the problem than those handled by commercial solvers. B&P is the integration of Dantzig-Wolfe decomposition and column generation into a branch-and-bound (B&B) algorithm. The three modules that integrate the B&P algorithm, i.e., B&B, Master problem (MP), and Sub-problem (Sub-P), are presented in the corresponding subsections below. Finally, the integration of these modules in the B&P framework is presented at the end of the section.
582 Rodrigo Mesa-Arango and Satish V. Ukkusuri / Procedia - Social and Behavioral Sciences 80 ( 2013 ) 576 – 590
3.1. Branch-and-bound (B&B)
In general, B&B is a built-in procedure used to solve integer programs (IPs) and MIPs by commercial software. This algorithm constructs a tree of feasible solutions while searching for an optimal integer solution.
In the B&B algorithm, a search tree is built based on the solution of sequential linear programs (LPs), a relaxation of the original IP problem, where each node represents one of these solutions. To accelerate the process, nodes can be terminated, or fathomed, if the node solution is: greater than the incumbent solution (in the case of a minimization problem), infeasible, or lesser than the incumbent solution and integer. In the later case the node solution updates the incumbent solution. If none of these cases hold, i.e., the solution of the LP at the node is lesser than the incumbent solution but not integer, a non integer variable (or set of variables) is selected and branched, i.e., two new branches are added to the current node where each branch corresponds to an integer constraint of the branched variable (or set of variables). For example, if after solving the LP relaxation of a problem it turns out that the optimal solution is lesser than the incumbent solution and there exists a variable such that is a non-integer number, two new instances (branches) of the LP are generated, i.e. one where the constraint is added to the LP and another where is added. and are the nearest lower and higher integers to respectively. There are different searching strategies to find an optimal solution (e.g., depth-first-, or breath-first-search).
The special characteristic that differentiates B&B from B&P is that a column generation procedure based on Dantzin-Wolfe decomposition [31] is implemented at each node of the tree rather than solving the LP relaxation of the original problem. In order to apply these concepts, the original MIP has to be decomposed into a Master Problem and a Sub-Problem. 3.2 Master problem (MP)
This section presents the Master Problem (MP) used in the B&P algorithm. The MP is the LP solved at each node of the B&B tree embedded in the B&P algorithm.
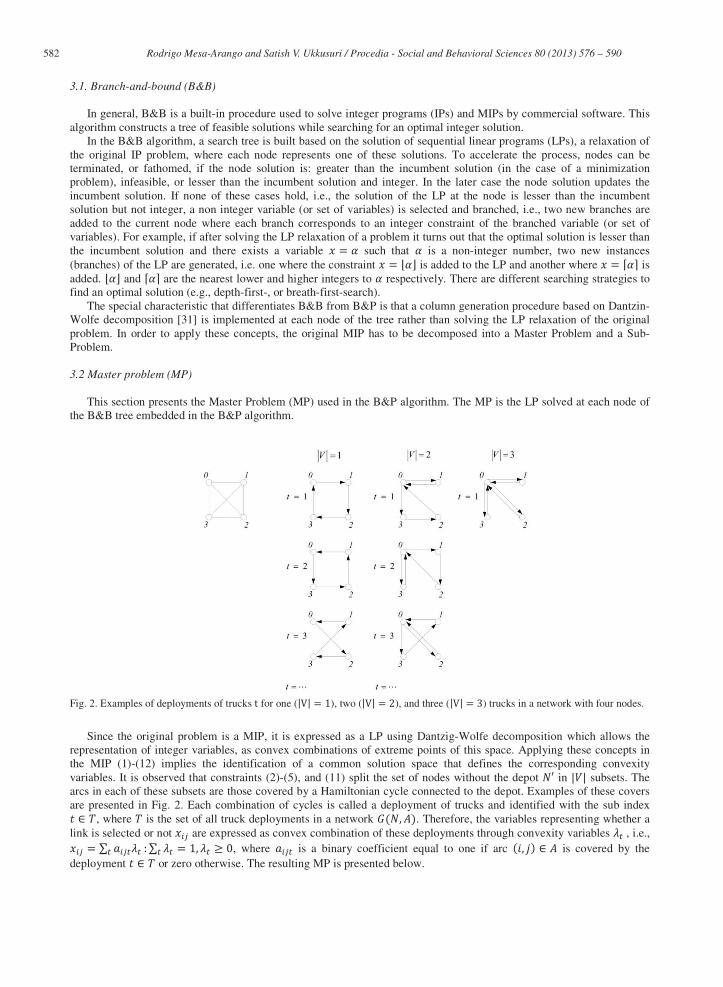
Fig. 2. Examples of deployments of trucks for one ( ), two ( ), and three ( ) trucks in a network with four nodes.
Since the original problem is a MIP, it is expressed as a LP using Dantzig-Wolfe decomposition which allows the
representation of integer variables, as convex combinations of extreme points of this space. Applying these concepts in the MIP (1)-(12) implies the identification of a common solution space that defines the corresponding convexity variables. It is observed that constraints (2)-(5), and (11) split the set of nodes without the depot in subsets. The arcs in each of these subsets are those covered by a Hamiltonian cycle connected to the depot. Examples of these covers are presented in Fig. 2. Each combination of cycles is called a deployment of trucks and identified with the sub index
, where is the set of all truck deployments in a network . Therefore, the variables representing whether a link is selected or not are expressed as convex combination of these deployments through convexity variables , i.e.,
, where is a binary coefficient equal to one if arc is covered by the deployment or zero otherwise. The resulting MP is presented below.
583 Rodrigo Mesa-Arango and Satish V. Ukkusuri / Procedia - Social and Behavioral Sciences 80 ( 2013 ) 576 – 590
(13)
s.t. (14)
(15)
(16)
and (17)
(18)
(19)
(20)
(21)
In this program the variables are and . The first one is defined as in MIP (1)-(12). The second one, , is a
continuous non-negative variable associated with each deployment of trucks as previously defined. Constraints (14)-(17) and (20) have the same meaning as in MIP (1)-(12). Constraint (18) relates to the deployments of trucks with the flow of commodities on each truck. Constraints (19) and (21) are the convexity constraints required to use convex combinations to obtain each .
Notice that the MP presented above is a LP. However, generating the complete set of deployments is not practical. Therefore, column generation is used to work with a restricted number of variables. Hence, rather that working with the complete MP a restricted MP (RMP) is used. Variables (or columns) are generated iteratively by a sub-problem (Sub-P) and controlled by reduced cost of the RMP. The exact procedure is presented in the following subsection. 3.3 Sub problem (Sub-P)
As presented above, the use of all the variables in the MP is avoided by using a restricted master problem. Variables associated with columns of this LP are generated as needed through column generation. In column generation, the RMP is solved with an initial set of variable that might include costly dummy columns. Then, the reduced cost associated with this solution is checked. If there exists a column such that , this column is added to the RMP –which is solved again. Otherwise, the solution of the RMP is equivalent to the solution of the MP. Recall that this is valid only for the MP that is a linear relaxation of the original problem and not a solution of the original MIP. Notice that the reduced cost of the MP is given by
(22)
Where are the dual variable associated with the set of constraints (18) –each of them associated with an arc
– and is the dual variable associated with the convexity constraint (19). Hence, a negative value of can be found minimizing the following IP.

584 Rodrigo Mesa-Arango and Satish V. Ukkusuri / Procedia - Social and Behavioral Sciences 80 ( 2013 ) 576 – 590
(23)
s.t. (24)
(25)
(26)
(27)
(28)
IP (23)-(28) is a vehicle routing problem (VRP), which is notoriously a NP-Hard problem. Although solving to
optimality is not critical for the size of the instances considered in this work, the amount of resources required to solve slightly larger instances is cumbersome. Therefore, the development and implementation of heuristics to efficiently approximate the Sub-P is suggested as a future improvement of the algorithm. 3.4 Branch-and-price (B&P)
A summary of the B&P algorithm is presented in Fig. 3.
Fig. 3. Branch-and-Price (B&P) Framework
585 Rodrigo Mesa-Arango and Satish V. Ukkusuri / Procedia - Social and Behavioral Sciences 80 ( 2013 ) 576 – 590
In this figure, first a B&B node is generated and denominated as root of the tree. This node is initialized with an
initial costly dummy variable that initializes the generation of columns. As presented in the previous subsections, the column generation procedure solves the RMP, constructs the reduced cost function with the duals of the MP ( and
), and solves the Sub-P. If there exists a deployment such that the minimum of , , is lesser than zero, then this deployment is added to the pool of columns and the previous RMP is modified to consider the new generated column, with its corresponding costs and scope, and the RMP is solved again. The procedure continues until a reduced cost that is greater than or equal to zero is found. Once the column generation procedure stops in a B&B node the solution is analyzed. If it is not possible to find a feasible solution for that instance of the problem, then the node is terminated. If the node solution is greater than the incumbent solution, the node is terminated. If the node solution is lesser than the incumbent solution and integer the node is terminated but the incumbent solution is replaced by this one. Finally, if the node solution does not hold any of these conditions, the node is branched and two new instances of the RMP are generated as two new nodes in the B&B tree. In one node, one arc or deployment variable is set to zero. In the other one, the same variable is set equal to one. Then the column generation is solved in each of these nodes again and the algorithm continues checking whether these nodes are terminated or branched. The algorithm stops when there are no more nodes to terminate or branch and the optimal solution is returned. 3.5 Acceleration strategies
Originally a depth-first search is implemented to explore solutions in the B&B tree. However, the computational time with this procedure is high because finding an initial incumbent solution (feasible and integer), that represents an upper bound to the optimal solution, takes a reasonable amount of time. Then, fathoming other nodes to increase the lower bound before finding the optimal solution consumes the remaining time.
To save time in the initial search Strategy 1 is proposed. Here, the algorithm is initialized with two initial solutions: the costly initial solution used before , and an initial feasible solution to the problem associated to a feasible deployment . This deployment is found connecting the depot with any node that is a demand origin, then connecting to its corresponding destination, then connecting to another origin not previously selected, and so on. Once all demand is covered, the deployment returns to the depot. This procedure is easily extended to multiple vehicles. After column generation in the root B&B node, if this node is branched, the search proceeds to a branch associated to a link covered by . Then, if the next B&B node is also branched, the search continues to a branch associated to a link covered by , and so on up to finding . After this, the depth first search continues normally.
Although Strategy 1 accelerates solution times, there are middle and large size instances in which computational time increases considerably and one wants to obtain the current solution and evaluate the optimality gap. However, the procedure so far rarely increases the lower bound of the solution at early stages of the algorithm. Therefore, the optimality gap is not small which is undesirable. Thus, Strategy 2 is proposed to mitigate this issue. Strategy 2 is run after is found (from Strategy 1). Then, the node with lowest current solution is selected and fathomed. This procedure continues up to finding the optimal solution.
The numerical experiments shown in the next section demonstrate the acceleration properties of these strategies. In essence, Strategy 1 reduces computational times as compared to the deep-first search, and results from Strategy 2 are sometimes faster than those obtained merely from Strategy 1. 4. Numerical Results
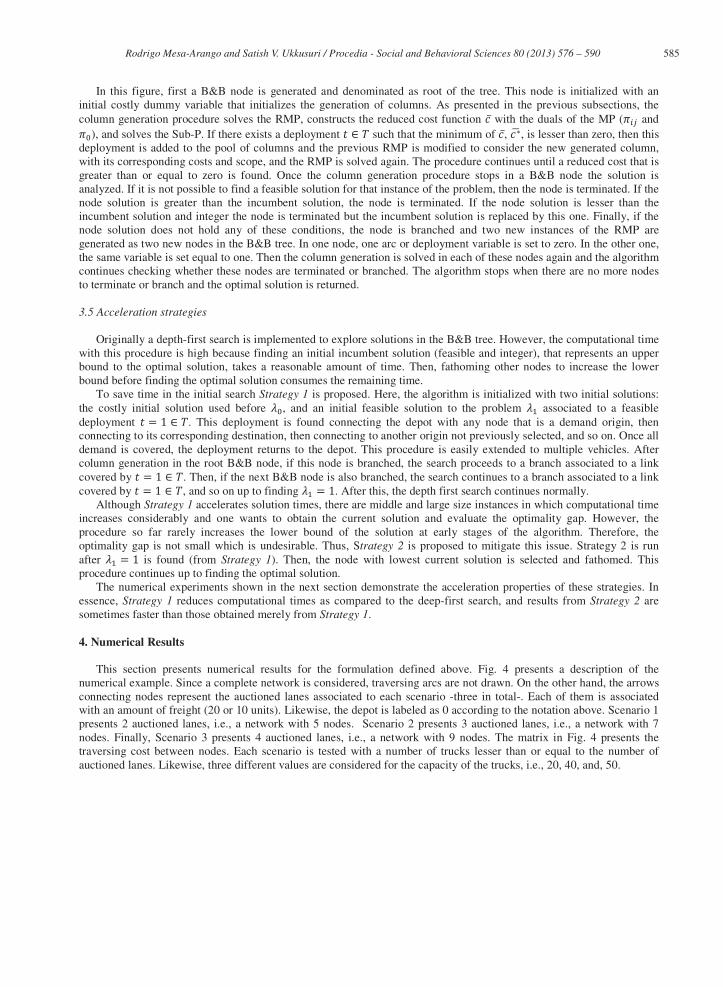
This section presents numerical results for the formulation defined above. Fig. 4 presents a description of the numerical example. Since a complete network is considered, traversing arcs are not drawn. On the other hand, the arrows connecting nodes represent the auctioned lanes associated to each scenario -three in total-. Each of them is associated with an amount of freight (20 or 10 units). Likewise, the depot is labeled as 0 according to the notation above. Scenario 1 presents 2 auctioned lanes, i.e., a network with 5 nodes. Scenario 2 presents 3 auctioned lanes, i.e., a network with 7 nodes. Finally, Scenario 3 presents 4 auctioned lanes, i.e., a network with 9 nodes. The matrix in Fig. 4 presents the traversing cost between nodes. Each scenario is tested with a number of trucks lesser than or equal to the number of auctioned lanes. Likewise, three different values are considered for the capacity of the trucks, i.e., 20, 40, and, 50.
586 Rodrigo Mesa-Arango and Satish V. Ukkusuri / Procedia - Social and Behavioral Sciences 80 ( 2013 ) 576 – 590
Fig. 4. Numerical Example
The B&P algorithm is coded in Java. Several classes are created to set up the problem, manipulate the deployments in
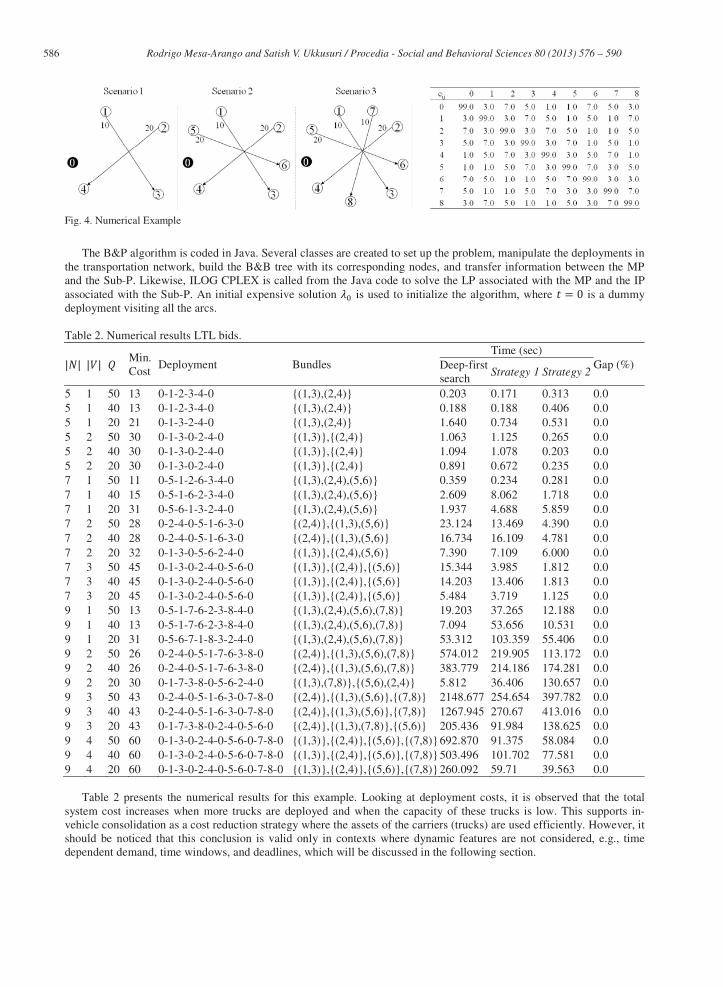
the transportation network, build the B&B tree with its corresponding nodes, and transfer information between the MP and the Sub-P. Likewise, ILOG CPLEX is called from the Java code to solve the LP associated with the MP and the IP associated with the Sub-P. An initial expensive solution is used to initialize the algorithm, where is a dummy deployment visiting all the arcs. Table 2. Numerical results LTL bids.
Min. Cost
Deployment Bundles Time (sec)
Gap (%) Deep-firstsearch
Strategy 1 Strategy 2
5 1 50 13 0-1-2-3-4-0 {(1,3),(2,4)} 0.203 0.171 0.313 0.0 5 1 40 13 0-1-2-3-4-0 {(1,3),(2,4)} 0.188 0.188 0.406 0.0 5 1 20 21 0-1-3-2-4-0 {(1,3),(2,4)} 1.640 0.734 0.531 0.0 5 2 50 30 0-1-3-0-2-4-0 {(1,3)},{(2,4)} 1.063 1.125 0.265 0.0 5 2 40 30 0-1-3-0-2-4-0 {(1,3)},{(2,4)} 1.094 1.078 0.203 0.0 5 2 20 30 0-1-3-0-2-4-0 {(1,3)},{(2,4)} 0.891 0.672 0.235 0.0 7 1 50 11 0-5-1-2-6-3-4-0 {(1,3),(2,4),(5,6)} 0.359 0.234 0.281 0.07 1 40 15 0-5-1-6-2-3-4-0 {(1,3),(2,4),(5,6)} 2.609 8.062 1.718 0.07 1 20 31 0-5-6-1-3-2-4-0 {(1,3),(2,4),(5,6)} 1.937 4.688 5.859 0.07 2 50 28 0-2-4-0-5-1-6-3-0 {(2,4)},{(1,3),(5,6)} 23.124 13.469 4.390 0.07 2 40 28 0-2-4-0-5-1-6-3-0 {(2,4)},{(1,3),(5,6)} 16.734 16.109 4.781 0.0 7 2 20 32 0-1-3-0-5-6-2-4-0 {(1,3)},{(2,4),(5,6)} 7.390 7.109 6.000 0.0 7 3 50 45 0-1-3-0-2-4-0-5-6-0 {(1,3)},{(2,4)},{(5,6)} 15.344 3.985 1.812 0.0 7 3 40 45 0-1-3-0-2-4-0-5-6-0 {(1,3)},{(2,4)},{(5,6)} 14.203 13.406 1.813 0.0 7 3 20 45 0-1-3-0-2-4-0-5-6-0 {(1,3)},{(2,4)},{(5,6)} 5.484 3.719 1.125 0.0 9 1 50 13 0-5-1-7-6-2-3-8-4-0 {(1,3),(2,4),(5,6),(7,8)} 19.203 37.265 12.188 0.0 9 1 40 13 0-5-1-7-6-2-3-8-4-0 {(1,3),(2,4),(5,6),(7,8)} 7.094 53.656 10.531 0.0 9 1 20 31 0-5-6-7-1-8-3-2-4-0 {(1,3),(2,4),(5,6),(7,8)} 53.312 103.359 55.406 0.0 9 2 50 26 0-2-4-0-5-1-7-6-3-8-0 {(2,4)},{(1,3),(5,6),(7,8)} 574.012 219.905 113.172 0.09 2 40 26 0-2-4-0-5-1-7-6-3-8-0 {(2,4)},{(1,3),(5,6),(7,8)} 383.779 214.186 174.281 0.09 2 20 30 0-1-7-3-8-0-5-6-2-4-0 {(1,3),(7,8)},{(5,6),(2,4)} 5.812 36.406 130.657 0.09 3 50 43 0-2-4-0-5-1-6-3-0-7-8-0 {(2,4)},{(1,3),(5,6)},{(7,8)} 2148.677 254.654 397.782 0.09 3 40 43 0-2-4-0-5-1-6-3-0-7-8-0 {(2,4)},{(1,3),(5,6)},{(7,8)} 1267.945 270.67 413.016 0.0 9 3 20 43 0-1-7-3-8-0-2-4-0-5-6-0 {(2,4)},{(1,3),(7,8)},{(5,6)} 205.436 91.984 138.625 0.0 9 4 50 60 0-1-3-0-2-4-0-5-6-0-7-8-0 {(1,3)},{(2,4)},{(5,6)},{(7,8)} 692.870 91.375 58.084 0.0 9 4 40 60 0-1-3-0-2-4-0-5-6-0-7-8-0 {(1,3)},{(2,4)},{(5,6)},{(7,8)} 503.496 101.702 77.581 0.0 9 4 20 60 0-1-3-0-2-4-0-5-6-0-7-8-0 {(1,3)},{(2,4)},{(5,6)},{(7,8)} 260.092 59.71 39.563 0.0
Table 2 presents the numerical results for this example. Looking at deployment costs, it is observed that the total system cost increases when more trucks are deployed and when the capacity of these trucks is low. This supports in-vehicle consolidation as a cost reduction strategy where the assets of the carriers (trucks) are used efficiently. However, it should be noticed that this conclusion is valid only in contexts where dynamic features are not considered, e.g., time dependent demand, time windows, and deadlines, which will be discussed in the following section.
587 Rodrigo Mesa-Arango and Satish V. Ukkusuri / Procedia - Social and Behavioral Sciences 80 ( 2013 ) 576 – 590
From the algorithmic efficiency perspective, computational time increases with the number of nodes in the network as
expected. Additionally, by comparing instances with high and low truck capacities it is observed that the former tend to require higher computational effort than the second one. This is expected because high capacities are related to more consolidation options that have to be systematically fathomed in the B&B tree. Likewise, it shows how incorporating consolidation is computationally more challenging than considering just TL operations. On the other hand, it is observed that Strategies 1 and 2 accelerate the algorithm as compared to a merely deep-first search strategy. For this particular example it is observed that Strategy 1 is slightly faster than Strategy 2. However, the value of Strategy 2 is higher in large instances where no optimal solution can be reached but a good approximation with low optimality gap is acceptable.
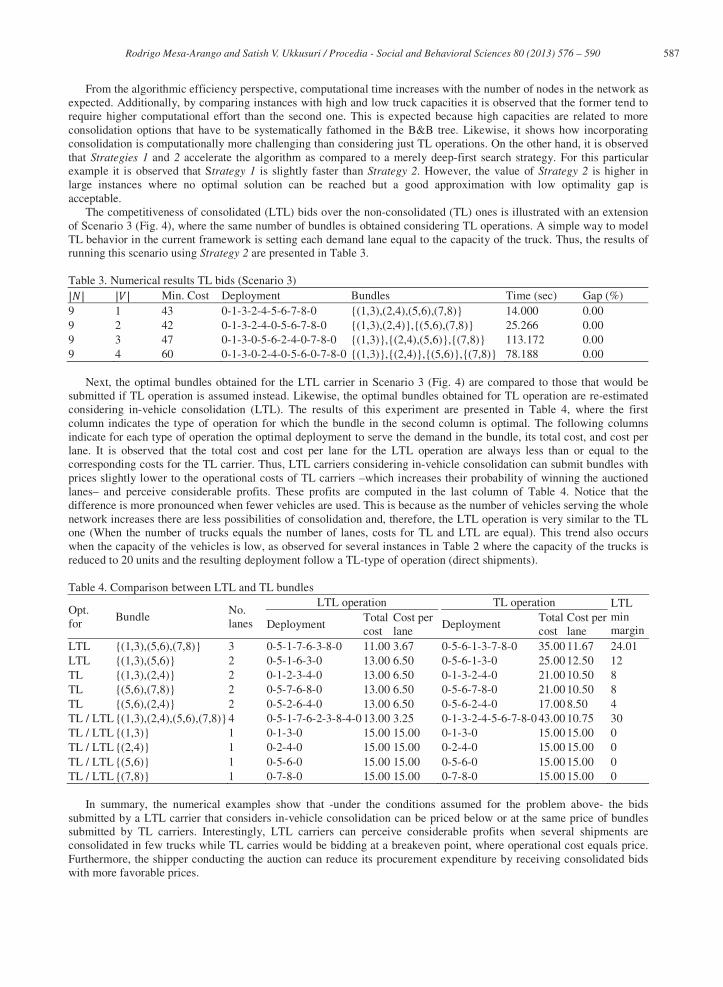
The competitiveness of consolidated (LTL) bids over the non-consolidated (TL) ones is illustrated with an extension of Scenario 3 (Fig. 4), where the same number of bundles is obtained considering TL operations. A simple way to model TL behavior in the current framework is setting each demand lane equal to the capacity of the truck. Thus, the results of running this scenario using Strategy 2 are presented in Table 3.
Table 3. Numerical results TL bids (Scenario 3)
Min. Cost Deployment Bundles Time (sec) Gap (%) 9 1 43 0-1-3-2-4-5-6-7-8-0 {(1,3),(2,4),(5,6),(7,8)} 14.000 0.00 9 2 42 0-1-3-2-4-0-5-6-7-8-0 {(1,3),(2,4)},{(5,6),(7,8)} 25.266 0.00 9 3 47 0-1-3-0-5-6-2-4-0-7-8-0 {(1,3)},{(2,4),(5,6)},{(7,8)} 113.172 0.00 9 4 60 0-1-3-0-2-4-0-5-6-0-7-8-0 {(1,3)},{(2,4)},{(5,6)},{(7,8)} 78.188 0.00
Next, the optimal bundles obtained for the LTL carrier in Scenario 3 (Fig. 4) are compared to those that would be submitted if TL operation is assumed instead. Likewise, the optimal bundles obtained for TL operation are re-estimated considering in-vehicle consolidation (LTL). The results of this experiment are presented in Table 4, where the first column indicates the type of operation for which the bundle in the second column is optimal. The following columns indicate for each type of operation the optimal deployment to serve the demand in the bundle, its total cost, and cost per lane. It is observed that the total cost and cost per lane for the LTL operation are always less than or equal to the corresponding costs for the TL carrier. Thus, LTL carriers considering in-vehicle consolidation can submit bundles with prices slightly lower to the operational costs of TL carriers –which increases their probability of winning the auctioned lanes– and perceive considerable profits. These profits are computed in the last column of Table 4. Notice that the difference is more pronounced when fewer vehicles are used. This is because as the number of vehicles serving the whole network increases there are less possibilities of consolidation and, therefore, the LTL operation is very similar to the TL one (When the number of trucks equals the number of lanes, costs for TL and LTL are equal). This trend also occurs when the capacity of the vehicles is low, as observed for several instances in Table 2 where the capacity of the trucks is reduced to 20 units and the resulting deployment follow a TL-type of operation (direct shipments). Table 4. Comparison between LTL and TL bundles
Opt. for
Bundle No. lanes
LTL operation TL operation LTL min marginDeployment
Totalcost
Cost perlane
Deployment Totalcost
Cost perlane
LTL {(1,3),(5,6),(7,8)} 3 0-5-1-7-6-3-8-0 11.00 3.67 0-5-6-1-3-7-8-0 35.00 11.67 24.01 LTL {(1,3),(5,6)} 2 0-5-1-6-3-0 13.00 6.50 0-5-6-1-3-0 25.00 12.50 12 TL {(1,3),(2,4)} 2 0-1-2-3-4-0 13.00 6.50 0-1-3-2-4-0 21.00 10.50 8 TL {(5,6),(7,8)} 2 0-5-7-6-8-0 13.00 6.50 0-5-6-7-8-0 21.00 10.50 8 TL {(5,6),(2,4)} 2 0-5-2-6-4-0 13.00 6.50 0-5-6-2-4-0 17.00 8.50 4 TL / LTL {(1,3),(2,4),(5,6),(7,8)} 4 0-5-1-7-6-2-3-8-4-0 13.00 3.25 0-1-3-2-4-5-6-7-8-0 43.00 10.75 30TL / LTL {(1,3)} 1 0-1-3-0 15.00 15.00 0-1-3-0 15.00 15.00 0TL / LTL {(2,4)} 1 0-2-4-0 15.00 15.00 0-2-4-0 15.00 15.00 0TL / LTL {(5,6)} 1 0-5-6-0 15.00 15.00 0-5-6-0 15.00 15.00 0 TL / LTL {(7,8)} 1 0-7-8-0 15.00 15.00 0-7-8-0 15.00 15.00 0
In summary, the numerical examples show that -under the conditions assumed for the problem above- the bids submitted by a LTL carrier that considers in-vehicle consolidation can be priced below or at the same price of bundles submitted by TL carriers. Interestingly, LTL carriers can perceive considerable profits when several shipments are consolidated in few trucks while TL carries would be bidding at a breakeven point, where operational cost equals price. Furthermore, the shipper conducting the auction can reduce its procurement expenditure by receiving consolidated bids with more favorable prices.
588 Rodrigo Mesa-Arango and Satish V. Ukkusuri / Procedia - Social and Behavioral Sciences 80 ( 2013 ) 576 – 590
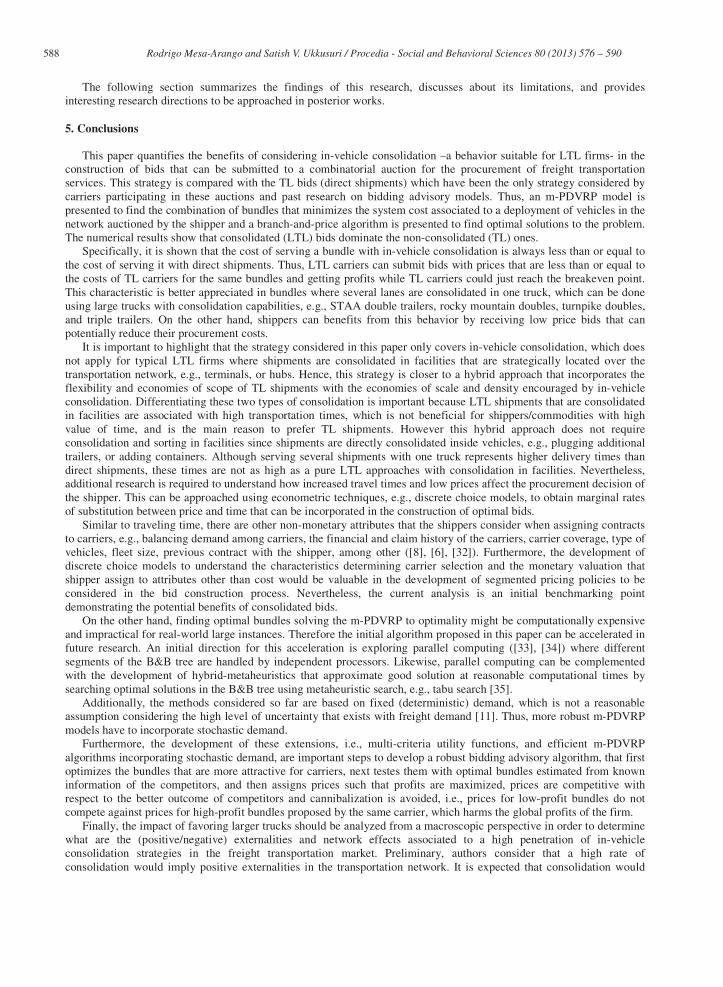
The following section summarizes the findings of this research, discusses about its limitations, and provides
interesting research directions to be approached in posterior works. 5. Conclusions
This paper quantifies the benefits of considering in-vehicle consolidation –a behavior suitable for LTL firms- in the construction of bids that can be submitted to a combinatorial auction for the procurement of freight transportation services. This strategy is compared with the TL bids (direct shipments) which have been the only strategy considered by carriers participating in these auctions and past research on bidding advisory models. Thus, an m-PDVRP model is presented to find the combination of bundles that minimizes the system cost associated to a deployment of vehicles in the network auctioned by the shipper and a branch-and-price algorithm is presented to find optimal solutions to the problem. The numerical results show that consolidated (LTL) bids dominate the non-consolidated (TL) ones.
Specifically, it is shown that the cost of serving a bundle with in-vehicle consolidation is always less than or equal to the cost of serving it with direct shipments. Thus, LTL carriers can submit bids with prices that are less than or equal to the costs of TL carriers for the same bundles and getting profits while TL carriers could just reach the breakeven point. This characteristic is better appreciated in bundles where several lanes are consolidated in one truck, which can be done using large trucks with consolidation capabilities, e.g., STAA double trailers, rocky mountain doubles, turnpike doubles, and triple trailers. On the other hand, shippers can benefits from this behavior by receiving low price bids that can potentially reduce their procurement costs.
It is important to highlight that the strategy considered in this paper only covers in-vehicle consolidation, which does not apply for typical LTL firms where shipments are consolidated in facilities that are strategically located over the transportation network, e.g., terminals, or hubs. Hence, this strategy is closer to a hybrid approach that incorporates the flexibility and economies of scope of TL shipments with the economies of scale and density encouraged by in-vehicle consolidation. Differentiating these two types of consolidation is important because LTL shipments that are consolidated in facilities are associated with high transportation times, which is not beneficial for shippers/commodities with high value of time, and is the main reason to prefer TL shipments. However this hybrid approach does not require consolidation and sorting in facilities since shipments are directly consolidated inside vehicles, e.g., plugging additional trailers, or adding containers. Although serving several shipments with one truck represents higher delivery times than direct shipments, these times are not as high as a pure LTL approaches with consolidation in facilities. Nevertheless, additional research is required to understand how increased travel times and low prices affect the procurement decision of the shipper. This can be approached using econometric techniques, e.g., discrete choice models, to obtain marginal rates of substitution between price and time that can be incorporated in the construction of optimal bids.
Similar to traveling time, there are other non-monetary attributes that the shippers consider when assigning contracts to carriers, e.g., balancing demand among carriers, the financial and claim history of the carriers, carrier coverage, type of vehicles, fleet size, previous contract with the shipper, among other ([8], [6], [32]). Furthermore, the development of discrete choice models to understand the characteristics determining carrier selection and the monetary valuation that shipper assign to attributes other than cost would be valuable in the development of segmented pricing policies to be considered in the bid construction process. Nevertheless, the current analysis is an initial benchmarking point demonstrating the potential benefits of consolidated bids.
On the other hand, finding optimal bundles solving the m-PDVRP to optimality might be computationally expensive and impractical for real-world large instances. Therefore the initial algorithm proposed in this paper can be accelerated in future research. An initial direction for this acceleration is exploring parallel computing ([33], [34]) where different segments of the B&B tree are handled by independent processors. Likewise, parallel computing can be complemented with the development of hybrid-metaheuristics that approximate good solution at reasonable computational times by searching optimal solutions in the B&B tree using metaheuristic search, e.g., tabu search [35].
Additionally, the methods considered so far are based on fixed (deterministic) demand, which is not a reasonable assumption considering the high level of uncertainty that exists with freight demand [11]. Thus, more robust m-PDVRP models have to incorporate stochastic demand.
Furthermore, the development of these extensions, i.e., multi-criteria utility functions, and efficient m-PDVRP algorithms incorporating stochastic demand, are important steps to develop a robust bidding advisory algorithm, that first optimizes the bundles that are more attractive for carriers, next testes them with optimal bundles estimated from known information of the competitors, and then assigns prices such that profits are maximized, prices are competitive with respect to the better outcome of competitors and cannibalization is avoided, i.e., prices for low-profit bundles do not compete against prices for high-profit bundles proposed by the same carrier, which harms the global profits of the firm.
Finally, the impact of favoring larger trucks should be analyzed from a macroscopic perspective in order to determine what are the (positive/negative) externalities and network effects associated to a high penetration of in-vehicle consolidation strategies in the freight transportation market. Preliminary, authors consider that a high rate of consolidation would imply positive externalities in the transportation network. It is expected that consolidation would
589 Rodrigo Mesa-Arango and Satish V. Ukkusuri / Procedia - Social and Behavioral Sciences 80 ( 2013 ) 576 – 590
reduce the number of truck-miles because vehicles will be efficiently used and, hence, this would reduce a number of other externalities such as emissions, traffic congestion, accidents, and pavement deterioration. However, this has to be validated with appropriate performance measures, models and data. References
[1] USDOT, U.S. Department of Transportation (2012). National transportation statistics. Research and Innovative
Technology Administration. Bureau of Transportation Statistics. Washington, DC. http://www.rita.dot.gov/bts/sites/rita.dot.gov.bts/files/publications/national_transportation_statistics/index.html. Accessed January 10, 2013.
[2] Sathaye, N., Y. Li, A. Horvath, and S. Madanat (2006). The environmental impacts of logistics systems and options for mitigation. Working Paper VWP-2006-4. U.C. Berkeley Center for Future Urban Transport, A Volvo Center of Excellence.
[3] OECD, Organisation for Economic Co-Operation and Development. (2003). Delivering the goods. 21st century challenges to urban goods transport. http://www.internationaltransportforum.org/Pub/pdf/03DeliveringGoods.pdf. Accessed August 10, 2012.
[4] EC-DGET, European Commission, Directorate-General for Energy and Transport (2006). Urban freight transport and logistics. European Communities. http://www.transport-research.info/Upload/Documents/200608/20060831_105348_30339_Urban_freight.pdf. Accessed August 10, 2012.
[5] TFL, Transport for London (2007). London freight plan – Sustainable freight distribution: A plan for London. http://www.tfl.gov.uk/microsites/freight/documents/London-Freight-Plan.pdf. Accessed August 10, 2012.
[6] Elmaghraby, W., Keskinocak, P. (2004). Combinatorial auctions in procurement. In Harrison, T.P., Lee, H.L., Neale, J.J. (Eds.), The practice of supply chain management: Where theory and application converge. International Series in Operations Research & Management Science, 62(3), 245-258. Springer US.
[7] De Vries, S., Vohra, R. V. (2003). Combinatorial auctions: A survey. INFORMS Journal of Computing, 15(3), 284–309.
[8] Moore, E. W., Warmke, J. M., Gorban, L. R. (1991). The indispensable role of management science in centralizing freight operations at Reynolds Metals Company. Interfaces, 21(1), 107–129.
[9] Porter, D., Torma, D. P., Ledyard, J. O., Swanson, J. A., Olson, M. (2002). The first use of a combined-value auction for transportation services. Interfaces, 32(5), 4–12.
[10] Sheffi, Y., (2004). Combinatorial auctions in the procurement of transportation services. Interfaces, 34(4), 245–252.
[11] Caplice, C., Sheffi, Y. (2006). Combinatorial auctions for truckload transportation. In Cramton, P. et al (Eds.), Combinatorial Auctions. The MIT Press, Boston.
[12] Sandholm, T., (2002). Algorithm for optimal winner determination in combinatorial auctions. Artificial Intelligence, 135, 1-54.
[13] Abrache, J., Crainic, T. G., Gendreau, M., Rekik, M. (2007). Combinatorial auctions. Annals of Operations Research, 153(1), 131-164.
[14] Ma, Z., Kwon, R. H., Lee, C. (2010). A stochastic programming winner determination model for truckload procurement under shipment uncertainty. Transportation Research Part E: Logistics and Transportation Review, 46(1), 49-60.
[15] Song, J., Regan, A. (2003). combinatorial auctions for transportation service procurement, the carrier perspective. In Transportation Research Record: Journal of the Transportation Research Board, 1833, 40 – 46.
[16] Song, J., Regan, A. (2005). Approximation algorithms for the bid construction problem in combinatorial auctions for the procurement of freight transportation contracts. Transportation Research Part B: Methodological, 39(10), 914-933.
[17] Wang, X. Xia, M. (2005). Combinatorial bid generation problem for transportation service procurement. In Transportation Research Record: Journal of the Transportation Research Board, 1923, 189-198.
[18] Lee, C. G., Kwon, R. H., Ma, Z. (2007). A carrier’s optimal bid generation problem in combinatorial auctions for transportation procurement. Transportation Research Part E: Logistics and Transportation Review, 43(2), 173-191.
[19] Chang, T. S., (2009). Decision support for truckload carriers in one-shot combinatorial auctions. Transportation Research Part B: Methodological, 43(10), 914-933.
[20] Caplice, C. (1996) An optimization based bidding process: a new framework for shipper-carrier relationship. Ph.D. Dissertation. Massachusetts Institute of Technology. Cambridge, MA.
[21] Jara-Diaz, S. R. (1981). Transportation cost functions: a multiproducts approach. Ph.D. Dissertation. Massachusetts Institute of Technology. Cambridge, MA.
[22] Jara-Diaz, S. R. (1983). Freight transportation multioutput analysis. Transportation Research, Vol. 17A(6), 429-438.

590 Rodrigo Mesa-Arango and Satish V. Ukkusuri / Procedia - Social and Behavioral Sciences 80 ( 2013 ) 576 – 590
[23] Barnhart, C., Johnson, E.L., Nemhauser, G.L., Savelsbergh, M.W.P., Vance, P.H. (1998). Branch-and-price:
Column generation for solving huge integer programs. Operations Research, 46(3), 316-329. [24] Desaulniers, G., Desrosiers, J. Ioachim, I., Solomon, M.M., Soumis, F., Villeneuve, D. (1998). A unified
framework for deterministic time constrained vehicle routing and crew scheduling problems. In Crainic, T.G., Laporte, G. (Eds.), Fleet Management and Logistics. Kluwer, Boston. pp. 57–93.
[25] Hernández-Pérez, H., Salazar-González, J. J. (2009). The multi-commodity one-to-one pickup-and-delivery traveling salesman problem. European Journal of Operational Research, 196, 987–995.
[26] Psaraftis, H. N. (2011). A multi-commodity, capacitated pickup and delivery problem: The single and two-vehicle cases. European Journal of Operational Research, 215, 572–580.
[27] Andersem, J., Christiansen, M., Crainic, G. T., Grønhaug, R. (2011). Branch and price for service network design with asset management constraints. Transportation Science, 45(1), 33-49.
[28] Baykasoglu, A., Kaplanoglu, V. (2011). A multi-agent approach to load consolidation in transportation. Advances in Engineering Software, 42, 477–490.
[29] Crainic, T. G., Ricciardi, N., Storchi, G. Models for evaluating and planning city logistics systems. Transportation Science, 43(4), 432-454.
[30] Smilowitz, K. R., Atamtürk, A., Daganzo, C. F. (2003). Deferred item and vehicle routing within integrated networks. Transportation Research Part E, 39, 305-323.
[31] Desrosiers, J., Lübbecke, M.E. (2005). A primer in column generation. In G. Desaulniers, J. Desroriers, M. Solomon (Eds.), Column Generation, New York: Springer Science + Business Media, (Chapter 1).
[32] Caplice, C., Sheffi, Y. (2003). Optimization based procurement for transportation services.Journal of Business Logistics, 24(2), 109-128.
[33] Bader, D. A., Hart, W. E., Philips, C. A. (2004). Parallel algorithm design for branch and bound. In H.J. Greenberg (Eds.), Tutorials on Emerging Methodologies and Applications in Operations Research, Kluwer Academic Press, (Chapter 5), 1-44.
[34] Melab, N., Chakron, I., Mohand, M., Tuyttens, D. A GPU-accelerated branch-and-bound algorithm for the flow-shop scheduling problem. 14th IEEE International Conference on Cluster Computing. http://arxiv.org/abs/1208.3933. Accessed February 15, 2013.
[35] Hung, Y. F., Chen, W. C. (2011). A heterogeneous cooperative parallel search of branch-and-bound method and tabu search algorithm. Journal of Global Optimization, 51(1),
133-148.