belize marine conservation and diving programme caye ... · belize marine conservation and diving...
TRANSCRIPT

BELIZE MARINE CONSERVATION AND
DIVING PROGRAMME
Caye Caulker, Belize
BZM Phase 144 Science Report
September - December 2014
Clio Maggi (Principal Investigator), Sophie Burns (Research Officer) &
Robyn Samuel (Assistant Research Officer)

Staff Members
Name Position
Clio Maggi (CM) Principal Investigator (PI)
Sophie Burns (SB) Research Officer (RO)
Robyn Samuel (RS) Assistant Research Officer (ARO)

Contents
1.0 Introduction............................................................................................................................. 5
1.1 Project Background and Location ....................................................................................... 5
1.2 Aims of the Project .............................................................................................................. 7
1.3 Phase 144 Achievements ..................................................................................................... 8
2.0 Field Training ........................................................................................................................... 8
2.1. Science Training and Volunteer Briefings ......................................................................... 8
2.2 Dive Training ...................................................................................................................... 9
2.3 BTEC................................................................................................................................. 10
3.0 SMP Benthic, Fish & Invertebrate Surveys ............................................................................ 10
3.1 Introduction ....................................................................................................................... 10
3.2 Survey Sites ....................................................................................................................... 11
3.3 Methodology ..................................................................................................................... 12
3.4 Results and Discussion ...................................................................................................... 13
3.4.1. Physical surveys: Coral colony characterization ........................................................ 13
3.4.2 Fish surveys ................................................................................................................ 14
3.4.3. Benthic surveys ......................................................................................................... 16
4.0 Queen Conch Surveys ....................................................................................................... 17
4.1 Introduction ....................................................................................................................... 17
4.2 Methodology ...................................................................................................................... 19
4.3 Results and Discussion ...................................................................................................... 19
5.0 Caribbean Spiny Lobster Surveys .......................................................................................... 22
5.1 Introduction ....................................................................................................................... 22
5.2 Methodology ..................................................................................................................... 23
5.3 Results and Discussion ...................................................................................................... 24
6.0 Seagrass Monitoring .............................................................................................................. 24
6.1Introduction ........................................................................................................................ 24
6.2 Aims and Objectives ......................................................................................................... 25
6.3 Methodology ..................................................................................................................... 25
7.0 Mangrove Monitoring ........................................................................................................... 26
6.1 Introduction ....................................................................................................................... 26
6.2 Aims and Objectives ......................................................................................................... 26
6.3 Methodology ..................................................................................................................... 26
8.0 Marine Debris Monitoring ..................................................................................................... 27
8.1Introduction ........................................................................................................................ 27

8.2 Aims and Objectives ......................................................................................................... 28
8.3 Methodology ..................................................................................................................... 28
9.0 Community Work and Public Awareness .............................................................................. 28
10.0 References ........................................................................................................................... 31
11.0 Appendices .......................................................................................................................... 36
11.1 Appendix 1 ...................................................................................................................... 36
11.2 Appendix ......................................................................................................................... 41
11.3 Appendix ......................................................................................................................... 42
11.4 Appendix ......................................................................................................................... 43
11.5 Appendix ......................................................................................................................... 43
11.6 Appendix ......................................................................................................................... 43

1.0 Introduction
1.1 Project Background and Location
The Frontier Belize Marine Conservation and Diving (BZM) Project was established in April
2014 within the Caye Caulker Forest and Marine Reserve. The Frontier Belize camp hosts
Marine Conserv
0 W ast of Belize in the
Caribbean Sea (Figure 1).
Figure 1. Location of Frontier Belize Marine Conservation base camp on the north island of Caye
Caulker (marked in red).
The project aims to conduct long term monitoring of key habitats and species, using
international volunteers as a workforce, and to work in collaboration with the Fisheries
Department of Belize (FD) and the Forest and Marine Reserve Association of Caye Caulker
(FAMRACC), the two local organisations that currently co-manage the reserve.
Belize is a small, tropical, Caribbean country, located at the northeast end of Central America,
bordering Mexico to the north and Guatemala to the west and south. The country has one of the
most extensive and diverse reef ecosystems in the Western hemisphere, including the second
largest barrier reef in the world, three atolls and a complex network of inshore patch reefs and
fringing reefs (Gibson et al, 1998).
Caye Caulker is a small limestone coral island, approximately five miles from north to south
and less than one mile east to west at its widest part. A very narrow waterway, referred to as the
'split’, separates the island in two. The population of Caye Caulker is approximately 1500, with
the much smaller south island holding the majority of residents. The island lies just 21 miles

east of the mainland and is a busy tourist destination; this is mostly due to its abundant marine
flora and fauna, which provide excellent snorkeling and diving opportunities. As with much of
our natural world local marine life is under threat and includes species of international concern:
staghorn and elkhorn corals (Acropora cervicornis and A. palmata), and hawksbill turtle
(Eretmochelys imbricata), ‘ green (Chelonia mydas) and
loggerhead (Caretta caretta) turtles ‘ ( U 20 ). The marine reserve is
also home to West Indian manatees (Trichechus manatus) ‘vulnerable , and
common bottlenose dolphins (Tursiops aduncus), ‘ b
species is understudied and threatened by many anthropogenic(Belize Fisheries Department,
2010; IUCN, 2014). In addition to this, the reserve, and Belize in general, also provide
residence for two of the most commercially important invertebrate species in the Caribbean; the
Caribbean spiny lobster (Panulirus argus) and the queen conch (Strombus gigas). Currently
there is a strict management regime regarding the harvesting of these species which includes
regulated fishing seasons for each species and size and gear restrictions, in order to maintain
healthy and sustainable populations within the area. Size is a useful parameter to control and
manage the overfishing of conch or lobster populations since the shell of the queen conch and
the carapace of the spiny lobster provide an important function for estimating sexual maturity
(Huitric, 2005).
The Caye Caulker Marine Reserve (CCMR) is part of the 9,000 acre Mesoamerican Barrier
Reef System (MBRS), which runs parallel to the entire caye and it is11km long, extending to
the Belize barrier reef from the northern tip of Caye Caulker. The CCMR was established in the
early 1990s but did not become completely recognized as a marine reserve until 1998, at which
point it was included alongside the Caye Caulker Forest Reserve (CCFR), as part of a single
management unit. This unit was set up with the aim of ensuring protection of the littoral forest,
reef lagoon, reef crest and fore reef areas. Today, both reserves are co-managed by FAMRACC
and the FD.
This management unit encompasses five habitats; mangrove and littoral forests, lagoon marsh-
lands, seagrass beds and coral reefs. The marine reserve is managed through the use of three
regulated zones allowing differing levels of use and protection; the General Use Zone, the
Conservation Zone and the Preservation Zone. The General Use Zone comprises 6,199 acres,
the Conservation Zone 2,029 acres, and the Preservation Zone 1,442 acres (Belize Fisheries
Department, 2010). Both the Conservation and Preservation Zones are non-extractive and do
not allow fishing, however the Conservation Zone allows for recreational use, which primarily
includes snorkeling and diving. The Preservation Zone does not allow recreational use and is
principally set aside for the recovery of overexploited populations of marine life. The General
Use Zone permits commercial and sports fishing alongside other recreational use, such as
T m mp m b m
it generates through tourism: residents of Caye Caulker are mostly dependent upon tourism as a
source of income. The reserve also provides essential environmental services, through helping
maintain local populations of important commercial species and the overall health of the reef,
whilst at the same time protecting Caye Caulker from storm damage and erosive influences
(Belize Fisheries Department, 2010). Consequently, research into the sustainability and
effectiveness m ment plan is essential for stakeholders involved,
and is something that is relatively understudied. Management of the Belize barrier reef was
originally envisioned through the creation of marine protected areas, however, the influence of
land-based activities was not accounted for within these programs. As a result the focus was
shifted towards the previously described integrated, multi-sectoral approach currently used in
Belize's marine reserves (Cho, 2005), including Caye Caulker Marine Reserve.
The research conducted by Frontier within the CCMR lies within the MBRS and therefore
involves methods adapted from the MBRS Regional Synoptic Monitoring Program (SMP), a
multi-level methodology designed to monitor changes in ecosystem health for research and
management purposes. Standard Frontier methodology is also incorporated to provide an
effective and yet reliable way of utilizing volunteers as a resource for data collection during
surveys. With the described volunteer workforce, Frontier aims to assist the Fisheries
Department and FAMRACC with data collection and analysis, survey techniques, marine and
forest reserve maintenance and community education and awareness through the projects
discussed below.
1.2 Aims of the Project
1. Establish fixed survey sites in addition to the sites currently used by the FD and FAMRACC
for each survey type. From this, formulate a schedule on the frequency of visits required per
phase at each location. The establishment of fixed survey sites will allow the monitoring of
changes over time and for extended data collection within the reserve from areas with different
management levels, therefore providing insight into the effect of anthropogenic impacts,
particularly fishing, and thereby assessing the effectiveness of the marine reserve and its multi-
sectored structure.
2. Collect baseline data on the health of the coral reefs, water quality and the various key fish
and invertebrate species associated with such ecosystems around the Caye Caulker MBRS,
using modified methods used by the FD and FAMRACC. This will supplement the existing
long term, but currently limited, ongoing data collection and contribute to the collection of
pollution data under the MBRS SMP.
3. Collect data on commercially important invertebrate species including the queen conch and
the Caribbean spiny lobster consistently throughout the year to expand on the current biannual
data collection, during open and closed fishing season, using tailored methods used by the FD
and FAMRACC.
4. Initiate a seagrass project comprised of seagrass mapping and species composition analysis
within the 'home' sea grass meadows by camp and in the future potentially extend this to include
long term monitoring which requires sample analysis and the use of more specialised
equipment.
5. Initiate a mangrove restoration project within the forest reserve and use this to assess the
feasibility of devising a methodology to provide regular data collection and long term
monitoring on the mangrove habitat and implement more terrestrially focused surveys.
6. Instigate and build on solid local relations necessary for developing an education project
within the town of Caye Caulker and organizing regular environmental awareness days and
activities.
7. Continue with the recording of any opportunistic manatee sightings during training dives and
potentially use this data in the future to map the local manatee population.

8. Continue to add further protocols outlined in the research proposal (Owen, 2013) including
habitat mapping, terrestrial species surveys and performing Rapid Assessments within one week
of the disturbance.
1.3 Phase 144 Achievements
1. The SMP, fish and benthic surveys have continued during this phase, with three out of the
four sites (previously defined by the Caye Caulker Fisheries department) being surveyed
regularly. For the next phase, regular surveys to the fourth site will take place and additional
sites will be established to increase survey area and to decrease the frequency of visits per site
and thus decrease the level of any human disturbance created.
2. Seven queen conch surveys have now been completed across the differently managed zones
within Caye Caulker Marine Reserve, this project will continue with the bimonthly conch
surveys during the next phase at the three established sites, every other week, on a rotation
basis.
3. Seven Caribbean Spiny Lobster surveys have been conducted at each of the two defined sites
that were previously established by the Caye Caulker Fisheries Department. During the next
phase of the project these surveys will continue with their bi-monthly schedule, rotating
between each site surveyed every two weeks.
4. For the seagrass monitoring project, methodology development and preliminary surveys have
been conducted during a four week BTEC. During the next phase of the project, regular
conduction of these surveys will be initiated after the establishment of permanent sites for these
surveys that do not require the use of a boat for access.
5. Methodologies for mangrove habitat monitoring have been finalised during this phase and
will be implemented at the start of the next phase with the first beach conservation RAs. This
will include species identification and distribution, assessment of mangrove health, and an
evaluation of the success of the mangrove restoration programme which was initiated by
FAMRACC.
6. One beach cleanup involving school children has been organised in collaboration with
FAMRACC. Involvement with the school will continue during the next phase, including an
Environmental Awareness Day.
7. Opportunistic manatee and cetacean sightings have been recorded during this phase. During
the next phase there is a plan to involve local dive and snorkel shops as well as local fishermen
in the recording of opportunistic sightings in order to gain an understanding of their populations
at a wider spatial scale and on a more frequent basis.
2.0 Field Training
2.1. Science Training and Volunteer Briefings
To achieve the above aims, all volunteers and staff members receive a combination of briefings,
science presentations and lectures and practical field training (Table 1) before conducting any
marine surveys. For all tests a 95% pass mark is required and in case of any failures, multiple

tests have been produced. All marine conservation and diving volunteers are also PADI scuba
trained to at least Advanced Open Water level.
Table 1. Science Lectures, Field Training Lectures and Tests and Briefings.
Lecture/Presentation/Test Lecturer
Health and safety and medical presentations
and tests
SB, CM
Dangers of the reef presentation SB, CM, RS
Introductory science presentation for Frontier
Belize Project
SB, CM, RS
Introduction to Coral Reefs Presentation SB, CM, RS
Benthic identification and survey methodology
presentation
SB, CM, RS
Coral health presentation SB, CM, RS
Coral flash, revision slides SB,CM, RS or independently
Benthic test SB, CM, RS
In water, practical benthic test SB, CM, RS
Fish identification presentation SB, CM, RS
Fish flash, revision slides SB, CM, RS or independently
Fish families test SB, CM, RS
Fish ID test SB, CM, RS
Juveniles and recruits fish ID test SB, CM, RS
In water, practical fish test SB, CM, RS
Practice mock survey SB, CM, RS
Queen Conch Presentation SB, CM, RS
Caribbean Spiny Lobster Presentation SB, CM, RS
Mangrove Presentation RS
Seagrass Presentation RS
Beach Clean Presentation RS
Invertebrate Presentation RS
Invertebrate Test RS
2.2 Dive Training
All volunteers are trained up to at least PADI Open Water Advanced. PADI dive training is
currently being outsourced to a local dive company, 'Frenchies Diving Services' and this will
continue until Fro b ‘ -

2.3 BTEC
No BTECs were conducted during this phase (Table 2).
Table.2 BTEC projects conducted during BZM144
Name BTEC Project Duration
N/A N/A N/A
3.0 SMP Benthic, Fish & Invertebrate Surveys
3.1 Introduction
Coral reefs are often argued to be one of world's mostly heavily impacted marine ecosystems,
with the most widely accepted causes being overfishing, increased ocean temperatures, coral
disease and predator outbreaks and poor land-use practices. As a result reef ecology is altered,
sedimentation and nutrient pollution occurs as well as direct and indirect impacts that result
from climate change and human activities (Schutte et al, 2010). Coral reefs are among the most
threatened global ecosystems, as well as the most vital, contributing to human survival,
especially in developing countries (Bryant et al, 1998; Costanza et al, 2007).
Caribbean coral reefs have experienced numerous, recent ecological changes, which are
frequently associated with the death of corals through disease, bleaching and other
environmental and anthropogenic disturbances. The region was also rampaged by hurricanes in
2000, 2001 and 2002, destroying many coral formations with recorded losses of up 75% in
Belize (Almada-Villela et al, 2002); additionally these impacts all followed closely after
Hurricane Mitch and an extreme bleaching event in 1998. A region-wide survey found evidence
suggesting that three years after the event, coral cover had still not increased in many of the
areas affected (Mumby, 1999). Many observations of widespread bleaching within reefs of the
tropics were documented in summer and autumn of 1998, resulting from unprecedented
elevations in sea surface temperatures due primarily to a severe El Nino Southern oscillation
and possibly augmented by global warming (Goreau et al, 2001). Corals in all habitats along the
Belizean area of the Mesoamerican Barrier Reef bleached as a result of these thermal anomalies
(Mumby, 1999). By 1999, some fore-reef habitats demonstrated signs of recovery; in contrast,
coral populations amongst the sheltered lagoons of the back reef still displayed reduced coral
cover, low coral recruitment and little indication of recovery. Aronson et al (2002) determined
that during this prolonged period of elevated sea surface temperatures, anomalies peaked at
4.0°C above the local hotspot threshold, which is an extraordinary increase compared to
previous years' sea surface temperatures.
Traditionally, coastal and marine activities in the area have been relatively minor, however, this
is changing with a rapidly growing tourism industry, especially increases in the number of
cruise ships, particularly in Caye Caulker (Almada-Villela et al, 2002). Increases in activity
have resulted in increased algal cover dominating the reefs (McClanahan et al, 2001) and
therefore a decline in coral cover, especially in the Caribbean (Schutte et al, 2010). This is

concerning as fish assemblage is often directly associated with coral reef health. Promisingly,
Belize boasts the highest fish diversity in the MBRS region, with over 320 recognised fish
species, but with fishing in the region intensifying this diversity is under threat. This presents
threats particularly towards spawning aggregations, as spawning location depends on the
recognisable characteristics of cayes and reefs, something which may be lost with overfishing.
A documented example of this is the Nassau grouper (Epinephalus striatus) which forms
spawning aggregations annually in the same location, during the full moons of December and
January, allowing fishermen to become very familiar with these cycles. This species is currently
on the IUCN Red List of Threatened Animals and is now seldom observed within the reefs of
Caye Caulker Marine Reserve (Almada-Villela et al, 2002), despite its protected status in
Belize. Worryingly, a study conducted by Hughes et al (2007) established that the exclusion of
large predatory and herbivorous fish led to a dramatic explosion of macro-algae, suppressing the
fecundity, recruitment and survival of coral, ultimately reducing total coral cover within reef
systems. Consequently, the coordination and control of fish stocks is one of the primary
components in preventing phase shifts and managing reef resilience.
Disturbances to the invertebrate community have also profoundly influenced reef health in the
area; disease has dramatically reduced populations of the herbivorous sea urchin Diadema
antillarum, contributing to the increased abundance of macro-algae and reduced coral cover
(Harbone et al, 2009). Many other macro-invertebrate species also play an important role in
reducing macro algae cover, by grazing on the biofilms on substrate suitable for hard coral
cover (Klumpp & Pulfrich, 1989). Furthermore, it is important to monitor the abundance and
diversity of macro-invertebrates such as the commercially important Queen Conch (Strombus
gigas), the Spiny Lobster (Panulirus argus) and the Donkey Dung Sea Cucumber (Holothuria
mexicana), which are prone to overfishing (Theile, 2002; Pollock, 1993; Perez & Garcia, 2012).
The Mesoamerican Barrier Reef System (MBRS) is approximately 1000 km long and extends
through Mexico, Belize, Guatemala and Honduras. This system includes the largest, continuous
barrier reef in the Western Hemisphere, the Belize Barrier Reef Complex; a 250 km long reef
running parallel to the coast of Belize. The MBRS project was designed and implemented to
improve the protection of this vulnerable marine ecosystem and to promote sustainable
utilisation of its resources (Gomez, 2004). This is of particular importance in Belize since the
fishing industry is the third largest foreign exchange income, meaning the country is heavily
dependent on the health and productivity of the reef (Belize Fisheries department, 2007).
Fishing within Caribbean reefs such as Belize has been occurring long before the arrival of
European settlers in the 16th century, but over the last 200 years, as human populations in the
area have escalated, the yields being returned are diminishing progressively (Stallings, 2009).
With the establishment of the MBRS Synoptic Monitoring Program (SMP), the MBRS Protocol
was designed to standardise data collection and management for ecosystem monitoring. It aims
to monitor changes in ecosystem health within priority protected areas, enabling quicker and
more effective responses to changes in reef health (Gomez, 2004). Ultimately the utilisation of
this protocol and the work conducted by Frontier will provide much needed comparable
baseline data on the state and associations of marine ecosystems through continuous long-term
monitoring.
3.2 Survey Sites

Site 1; North Back-reef: (16Q 0393822 UTM 1966284) A shallow patch reef on the inside of
the MBRS which is located between the reef crest and a lagoon, with a maximum depth of
approximately 5m and within the General Use Zone of CCMR. Current flow and wave energy
are generally moderate to high on days with greater wind force.
Site 2; North Fore-reef: (16Q 0394839 UTM 1966980) A barrier reef on the inside of the
MBRS with a maximum depth of approximately 15m in the General Use Zone of CCMR. This
site is only accessible on moderately calm days, when the wind force and sea state is relatively
low.
Site 3; South Back-reef: (16Q 0392922 UTM 1959724) A shallow patch reef on the inside of
the MBRS which is situated between the reef crest and the lagoon, with a maximum depth of
approximately 5m and located in the Conservation Zone of CCMR. This reef is subject to many
regular, touristic activities, including PADI Open Water training and snorkeling tours. Current
flow remains moderately low.
Site 4; South Fore-reef: (16Q 03993628 UTM 193628) A relatively deep reef on the outside of
the MBRS with a maximum depth of approximately 20m in the General Use Zone of CCMR.
This reef is subject to moderate levels of touristic activities, predominantly in the form of PADI
dive training and recreational scuba diving. This site is only accessible on moderately calm
days, when the wind force and sea state is relatively low.
3.3 Methodology
The protocol for this survey has been adopted by the MBRS Synoptic Monitoring Program as
the standard methodology that is used to monitor the coral reefs at established sites (Almada-
Villela et al, 2003). Survey methods have been adapted for the Belize Fisheries Department,
FAMRACC and Frontier. For each survey a minimum of three divers are required and each has
a very specific role for which they have undergone the required training for. In the next project
phase, an additional diver will be required as invertebrate surveys will be included as part of the
SMP surveys.
Diver 1:Physical surveyor: characterization of the coral community below the transect.
For each transect the following information will be recorded; name, date, start and
end time, start and end depth and GPS coordinates for the site. A 30m transect line is laid down
by first placing the weighted (2lbs) end of the line on the sea bottom, at a randomly selected
location within the general confines of the site. Using an underwater compass, the diver swims
parallel to the reef in a straight line, while releasing the tape from the reel until the 30m has
been completed. On the return journey the diver swims back along the transect, stopping at the
first coral colony that is located directly beneath the transect line and is at least 10cm in
diameter. For each colony surveyed the following is recorded; the species of coral, the measured
(to the nearest mm) diameter and maximum height (measure from the base of the substratum) of
the colony. The percentage of recently dead or long dead coral is estimated and recorded along
with the presence of any diseases and/or bleached tissues. The surveyor then moves on to the
next appropriate coral and repeats the above measurements until at least 10 coral colonies are
sampled from each site.
Diver 2: Fish surveyor: belt transect counts for defined fish species list.

The fish surveyor swims alongside the physical surveyor whilst the transect is reeled out, trying
to minimise any changes in depth. Whilst swimming out the full 30m transect line the surveyor
counts and records the defined fish species observed within a 2m wide visually estimated belt
transect (1m either side of the line). The size of each fish recorded is estimated by assigning
them to the following size categories (<5cm, 5-15, 16-30, 31-40, >40cm). A two minute pause
is taken once the surveyor has reached the end of the transect before commencing the survey for
recruits on the return journey (Almada-Villela et al, 2003). On the return journey, the surveyor
swims along the 30m transect recording only selected juvenile fish, fish species <5cm and
Diadema sea urchins. The latter is recorded as part of the fish survey whenever an Invertebrate
Surveyor is not present.
Diver 3:
Benthic Surveyor: point intercept for percentage cover of corals, algae and other sessile
organisms.
The surveyor swims along the 30m transect to approximate the percentage cover of sessile
organisms by recording the organism directly below every 25cm point along the line. The
substrate underneath every 25cm point is recorded even if it is rock, sand or dead coral. This
yields 120 records per 30m transect. On the return journey the surveyor reels the 30m transect
back in and then joins the other two divers at the weighted end of the reel once all parts of the
survey have been completed.
Diver 4:
Invertebrate Surveyor: Belt transect counts for defined invertebrate species.
The surveyor swims along the 30m transect to count and record all defined invertebrate species
within a 2m wide visually estimated belt transect (1m either side of the line). The surveyor
takes time to check under overhangs and inside crevices.
3.4 Results and Discussion
There has not yet been enough data collected between the four sites to allow effective data
analysis. Fifty recordings are needed for the coral colony characterisation aspect of the site to be
completed, therefore each site needs to be surveyed a minimum of five times for all the required
data. To date, only one survey site (North Back-reef) has been surveyed five times and thus has
completed one cycle of data collection. Furthermore, because sites at the fore-reef can only be
surveyed on very calm days, each SMP site has not been surveyed an equal number of times to
allow for any accurately representative comparisons of coral and algal cover amongst the
different sites and what this may suggest about reef health within CCMR. However by
summarizing the data collected so far, it was possible to identify some trends.
3.4.1. Physical surveys: Coral colony characterization

From the limited data available for the coral characterisation surveys some trends in coral
mortality at the different sites can be identified. The mean percentage of dead coral was variable
for the different coral species at the four survey sites. At North Back Reef, mortality was found
to be particularly high for Staghorn coral (ACER – Acropora cervicornis), Lettuce Coral
(AAGA – Agaricia agaricites) and Rose Coral (MARE – Manicina areolata) (Figure 2). In
South Back Reef, on the other hand, a higher percentage of Clubtip finger Coral (PPOR- Porites
porites) and Symmetrical Brain Coral (PSTR-Pseudo-diploria strigosa) were recorded as dead.
The coral colonies at North Fore Reef did not exhibit a high percentage of dead coral, however,
22.5% of Mustard hill coral (PAST- Porites astreoides) and 25% of Clubtip Finger Coral
(PPOR- Porites porites) were dead at this site. There was no available data for South Fore Reef,
as surveys have not yet been conducted at this site.
Figure 2. Mean percentage dead coral for each of the species found at the four SMP sites
3.4.2 Fish surveys
Herbivorous fish found in these reefs include the Parrotfishes and Surgeonfishes. The important
commercial fish in the CCMR are mainly the Grouper and Snapper species (Gibson et al, 1998).
0
10
20
30
40
50
60
70
80
A. a
ga
rici
a
A. c
ervi
corn
is
A. h
um
ilus
A. t
enu
ifo
la
C. n
at
D. c
ylin
dru
s
D. l
ab
yrin
thif
orm
is
D. s
toke
si
E. f
ast
igia
ta
Go
rgo
nia
n
I. r
igid
a
M. a
lcic
orn
is
M. a
reo
lata
M. c
ave
rno
sa
M. c
om
lan
ata
M. l
am
arc
kia
na
M. m
ean
dri
tes
O. a
nn
ula
ris
O. f
ave
ola
ta
P. a
stre
oid
es
P. c
livo
sa
P. p
ori
tes
P. s
trig
osa
S. in
ters
epta
S. r
ad
ian
s
S. s
ider
ea
Pe
rce
nta
ge D
ead
Species
North Back
North Fore
South Back

Figure 3. The average number of fish present in each size category within the four defined
survey sites in CCMR .
The south back reef appears to have more fish in each size category except >40 cm. This
appears to be indicating a successful reserve. However, as the reserve is still relatively new,
being established in 1998, without enforced regulations until 2004 (APAMO, 2015); the lack of
large fish could be a result of the slow recovery rates often seen in larger species, which are
most targeted by fishing practices (Russ & Alcala, 1996).
Figure 4. The Average number of commercially important and herbivorous fish present within
the defied sites of CCMR.
The South back reef appears to have on average far more herbivorous fish (61.00) than both
north fore reef and north back reef (13.33 & 15.43). Having a lot of herbivorous fish is good
the coral health as they keep algal cover low exposing more suitable substrate for hard coral
0.00
5.00
10.00
15.00
20.00
25.00
30.00
35.00
40.00
45.00
50.00
6-10 cm 11-20 cm 21-30 cm 31-40 cm >40cm
Ave
rage
Pre
sen
t
Size
North Fore
North Back
South Back
0.00
10.00
20.00
30.00
40.00
50.00
60.00
70.00
Herbivores Commercial
Ave
rage
Pre
sen
t
North Fore
North Back
South Back

cover (Chong-seng et al, 2012) Due to the lack of data on south fore reef and only one survey
at South Back Reef results should be interpreted with caution.
Figure 5. Average number of juveniles present within the four defined survey sites in CCMR.
The most abundant species at North Fore Reef were Striped Parrotfish (Scarus iseri), Bluehead
Wrasse (Thalassoma bifasciatum) and, to a lesser extent, Slippery Dick (Halichoeres bivittatus)
(Figure 4). Striped Parrotfish (Scarus iseri) was also the most abundant species at North Back
Reef. The most abundant species at South Back Reef were Bicolor damselfish (Stegastes
partitus), Striped Parrotfish (Scarus iseri), Princess Parrotfish (Scarus taeniopterus), Stoplight
Parrotfish and Bluehead Wrasse (Thalassoma bifasciatum). Surveys have not yet been
conducted on the South Fore Reef, therefore no data was available for this site. Due to the
limited number of surveys conducted, as well the lack of data for one of the sites, it was not
possible to conduct statistical analysis to compare juvenile fish abundance at the different sites.
3.4.3. Benthic surveys
The species identified by the benthic surveyor were grouped into Hard Corals (HC), suitable
substrate for hard coral growth (SS), Gorgonians (GG), Sponges (SPN), Fleshy Algae suitable
for herbivorous grazing (FA), Critically endangered Elkhorn and Staghorn species (Acropora
sp.) and Fire Corals (Millepora sp.). These groupings were based on a classification method
used by FAMRACC for their surveys.
0.00
2.00
4.00
6.00
8.00
10.00
12.00
14.00
16.00
18.00
20.00
Lon
gfin
Dam
self
ish
Du
sky
Dam
self
ish
Thre
esp
ot
Dam
self
ish
Co
coa
Dam
self
ish
Bic
olo
r D
amse
lfis
h
Yello
wta
il D
amse
lfis
h
Blu
e C
hro
mis
Bro
wn
Ch
rom
is
Blu
e Ta
ng
Oce
an S
urg
eon
fish
Ban
ded
Bu
tter
flyf
ish
Fou
r-ey
e B
utt
erfl
yfis
h
Stri
ped
Par
rotf
ish
Pri
nce
ss P
arro
tfis
h
Red
ban
d P
arro
tfis
h
Gre
enb
lotc
h P
arro
tfis
h
Sto
plig
ht
Par
rotf
ish
Span
ish
Ho
gfis
h
Slip
per
y D
ick
Clo
wn
Wra
sse
Rai
nb
ow
Wra
sse
Yello
wh
ead
Wra
sses
Blu
ehea
d W
rass
e
Fair
y B
assl
et
Ave
rage
no
. Pre
sen
t
Species
North Fore
North Back
South Back

Figure 6. Average percentage cover of sessile organisms and substrate within the four defined
survey sites in CCMR.
From the limited data available it appears the South Back Reef has more hard coral cover and
less fleshy algae cover. This is likely because the south back reef is within the conservation area
where no fishing is allowed meaning herbivorous species, such as Surgeonfish and Parrotfish,
may be more abundant, reducing the amount of fleshy algae through grazing. Reduced fleshy
algae subsequently allows for greater hard coral growth. Interestingly, in the south back reef
there was no suitable substrate for coral growth this is likely to a good indicator for a healthy
reef, as all suitable substrate has been colonized due to its high percentage of hard coral cover
(40.8%). There has been no data collected for the south fore reef due to the additional costs
involved in collecting data there.
4.0 Queen Conch Surveys
4.1 Introduction
The queen conch is one of the largest gastropods found in the Caribbean (up to 30cm shell
length) and one of the most extensively fished marine invertebrates throughout the region (Chan
et al, 2013). This species is highly economically valuable within Caribbean countries, including
Belize. In particular, queen conch fishing has significantly contributed to Belize's economy,
being recorded as the second largest export from Belize (King and Petruny, 2012). Increasing
fishing pressures caused population declines in the 1980's. As a consequence of chronic, long-
term overexploitation, in 1992 the queen conch was added to Appendix II of the Convention on
International Trade in Endangered Species of Wild Fauna and Flora (CITES, 2003). CITES is
an international agreement which regulates international trade using permits to ensure all trade
is legal and will not have negative consequences for the species in the wild (CITES, 2014).
Appendix II includes species that are not yet threatened with extinction, but which may become
threatened if trade is not appropriately managed and monitored (US Fish and Wildlife Service,
2012).
0.00%
5.00%
10.00%
15.00%
20.00%
25.00%
30.00%
35.00%
40.00%
45.00% C
ove
r
North Fore
North Back
South Back

As previously discussed, the CCMR includes designated zones, each with different imposed
governmental rules and regulations, the purpose being to protect and conserve marine
ecosystems and the wildlife found there, including the commercially important queen conch.
Conservation and Preservation zones (no-take zones) should allow commercial species, such as
the queen conch, and other species linked to their ecology, to recover, as these zones protect the
populations within them and can also contribute to stocks in the surrounding areas, such as the
General Use Zone, that permits local fishing, through either spill-over of larger individuals or
export of larvae from egg production within the reserve, thereby enhancing recruitment and
increasing the productivity of sustainable fisheries in the future (Chan et al, 2013). Ultimately,
stochastic processes such as larval transport, recruitment and the anthropogenic impacts of
fisheries make the development and management of protected areas especially complex (Stoner
et al, 2012).
In Belize there is a strict management agenda regarding the harvesting of queen conch. This
includes a regulated conch fishing season, open for nine months of the year from the 1st of
October to the 30th of June (the non-reproductive season), ensuring that harvesting does not take
place during the reproductive season. There are also restrictions on fishing with SCUBA gear
and conch size, whereby individuals with a shell length of less than 7 inches (17.8cm) or a
market clean weight of less than 3 ounces and fillet weight of less than 2.75 ounces are
prohibited from being fished (Chan et al, 2013).
Size is a useful parameter used to control and manage the overfishing of conch populations as
the shell of the queen conch provides an important function for estimating sexual maturity
(Avila-Poveda and Baqueiro-Cardenas, 2006). The thickness of the shell lips also increases with
age and thus lip thickness is commonly used in assessing age and growth rate (Horsford, 2011).
Conservation and management regime of the queen conch requires biological and ecological
knowledge of the species, including population density, structure, maturity status distribution
and shell morphology (Peel and Aranda, 2012). Due to the usefulness of shell length and lip
thickness these parameters are measured and recorded during the conch surveys conducted at
BZM.
In addition to size, it has been suggested that certain ecological characteristics of the queen
conchs amplify their vulnerability to over-fishing. In particular, juvenile conchs have been
documented aggregating in dense vegetation to reduce predation risk and thereby increase
survival probabilities (Peel and Aranda, 2012). This useful tactic has become known to local
fishermen, reducing the sustainability of their practices and leading to exploitation (Aiken et al,
2006). The basic principle associated with sustainable fishing is to capture only population
surpluses, thereby avoiding damage to the overall reproductive capacity. When overexploitation
disrupts this balance, the ecology of the population is altered, modifying mean conch size and
sex proportions and altering the age of sexual maturity (Navarrete and Valencia-Hernandez,
2013). This highlights the necessity for protected areas, managed access fishing regulations,
restrictions on size, weight and other parameters and a regular, long-term monitoring regime, for
the maintenance of healthy and sustainable queen conch populations.
This project aims to identify differences in conch density, size, and maturity status between
three sites with different levels of protection within the CCMR, specifically the General Use
Zone and the Conservation Zone. Long-term monitoring of these variables will provide insights
on the sustainability of local conch fishing practices and on the effectiveness of the multi-zone
management and closed fishing season which is currently in place in the CCMR.

4.2 Methodology
The protocol for this method has been adapted from the current method used by Belize Fisheries
Department. Since one of the aims of the project was to identify the sustainability of local queen
conch fishing practices, which involve the fishermen snorkeling and then free-diving to collect
conchs, surveys were carried out as snorkel surveys to simulate these practices. There were
three sites utilised for conch surveys, each to be surveyed every six weeks. Below is a
description of each of these conch survey sites.
Conch Site 1: (16Q 00392750 UTM 1960314) A shallow (approximately 2m deep maximum)
seagrass bed within the Conservation Zone of CCMR at the southern end of the reef. This site is
not very close to the reef, is seldom visited by tourists and is only exposed to a moderate to low
level of boat traffic.
Conch Site 2: (16Q 00392912 UTM 1960400) A shallow (approximately 2m deep maximum)
seagrass bed in the Conservation Zone within CCMR at the southern end of the reef system.
This site is also known locally as Shark and Ray Alley. As the name suggests this area has a
very large population of southern stingrays and nurse sharks and therefore is a very popular
destination for snorkel tours. This site is also relatively close to the barrier reef and a few small
patch reefs.
Conch Site 3: (16Q UTM) A shallow (approximately 2m deep maximum) seagrass bed within
the General use Zone of CCMR. This site is not very close to the reef, is seldom visited by
tourists and is exposed to a moderate level of boat traffic.
For each survey one individual was responsible for laying down the 30m transect line. Once the
transect was laid, the surveyor(s) surveyed a 2m wide belt transect (1m either side of the line)
searching for queen conchs. Each conch found inside the belt transect was collected and carried
to the boat, to avoid recording and measuring the same individual twice. Once every conch had
been collected the transect line was reeled back in and the survey team measured the total length
of each conch shell and the thickness of the lip if present, using callipers. At each site, a total of
six transects were completed, spaced approximately 10m apart. Once all the conchs had been
measured, they were placed carefully back on the sea floor at the same site where they were
found.
Once the data had been collected, conchs were divided into three maturity status categories
according to the measured lip thickness. Queen conchs with lip thickness >5mm were classified
as adults, those with a <5mm lip were classified as sub-adults, and those where the lip was
absent were classified as juveniles (Horsford, 2011).
Data regarding queen conch densities and shell length at the different study sites was analysed
using one-w A OVA w b T P H w
value of p = 0.05.
4.3 Results and Discussion
Average conch population density was highest in Site1 (26.8/100m2), followed by the popular
tourist site within the Site 2 (21.3/100m2) and lowest in Site 3(10.7/100m
2).

Table 3. Average queen conch population density at the three established sites within CCMR.
Site Average Conch Population Density/100m2
No. of Surveys Completed
Site 1 26.80556 2
Site 2 21.2963 3
Site 3 10.69444 2
Analysis of the results from each individual transect using one-way ANOVA indicated that
there is a significant difference between the three sites (F2,39 = 5 26 p = 0 0 ) T P H
test indicated that Site 3 is significantly different to Site 2 (T= 2.66, p=0.03) and Site 1 (T=-
3.01, p=0.012). In contrast, there was no significant difference between Site 2 and Site 1 (T=-
0.63, p=0.802).
Figure 7. The average Queen Conch population density/100m2 with SE bars
Average conch population density was understandably significantly higher at the two sites
within the conservation zone (Site 1 and 2), where extraction is not permitted, comparative to
the General Use Zone (Site 3), where the fishing of queen conch is legalized during open
season. This result indicates that the Conservation Zone is effective at maintaining higher
densities of queen conchs compared to the General Use Zone, where fishermen are allowed to
take conchs. It is important to maintain this level of management as the populations in the
conservation and preservation zones will help to repopulate Site 3 and rest of the General Use
Zone. Once a full year of data has been collected it will be possible to identify variations in
queen conch population density throughout the year and, in particular, to explore the differences
between conch densities before and during the closed season (July 1st to September 30
th). This
would be particularly interesting for the General Use Zone, where data on the changes in density
0
5
10
15
20
25
30
35
3 2 1
De
nsi
ty/1
00
m2
Site

during the closed season could reveal the rate at which queen conchs can repopulate the area
and reproduce.
The maturity status composition of queen conch in the surveyed sites so far showed Site1 as
having the largest proportion of Juveniles (89.6%), with the lowest percentage found in Site 3
(General Use Zone) (23.4%). A low percentage of Sub-Adults were found at all three sites (Site
1 - 2.1%, Site 2 - 7.4% and Site 3 - 0%). The largest proportions of adults were found in Site 3
(76.6%) and smallest proportion in Site 1 (8.3%).
Figure 8. Distribution of the maturity status of queen conch populations within established survey sites at
differently managed zones inside CCMR.
The limited data obtained so far suggests that very few sub-adult conchs are present, however,
Stoner et al (2012) also found low sub-adult conch populations in ecologically similar sites.
Within the two sites in the Conservation Zone (Site 1 and 2), there is a much larger proportion
of juvenile conchs compared to the General Use zone, which holds a predominantly adult conch
population (Site 3- 23.4%, Site 2- 71.5% & Site 3- 89.6%). Stoner and Ray (1993) suggested
that the juveniles aggregate together during migrations which could explain the large proportion
of juveniles in the conservation zone (sites 1 &2), which are within 100m of each other. It will
be interesting to monitor this throughout the year to understand if it is due to one juvenile
aggregation passing through or whether this is the case all year round.
0%
10%
20%
30%
40%
50%
60%
70%
80%
90%
100%
Juveniles Sub-Adults Adults
Pe
rce
nta
ge o
f P
op
ula
tio
n
Maturity Status
Site 3
Site 2
Site 1

Figure 9. The average length of adult Queen Conch within established survey sites at differently
managed zones inside CCMR.
Using one-way ANOVA to compare the average adult length within the different management
zones has shown there is no significant difference between the adult lengths at different sites
(F2,80=2.66, p=0.076). However an interesting trend, for adults in Site 1 to be smaller than those
in both Site 3 (T=2.14, p=0.09) and Site 2 (T=2.14, p=0.1), has been highlighted. This trend
could reflect the fisheries department practice of releasing illegally caught, undersized conch
in the Conservation Zone rather than where they were originally harvested. Once more data
becomes available in the next phase, it will be possible to interpret these results more
confidently.
5.0 Caribbean Spiny Lobster Surveys
5.1 Introduction
The Caribbean Spiny Lobster (Panulirus argus) is the most commercially important species in
the Caribbean due to its economic value, both as a source of income and employment for the
local population, as well as foreign exchange for national government (Acosta and Robertson,
2003). Furthermore, due to the high unit prices, the international trade of lobster provides
improvements to the livelihoods of fisheries-dependent populations (Monnereau and Pollnac,
2012). In addition to their economic benefits, Caribbean spiny lobsters are also keystone
species, serving as prey for a wide range of marine animals, including; sharks, rays, turtles and
moray eels (Seudeal, 2013). In turn, they are also important predators themselves, their primary
diet consisting of molluscs (especially gastropods, chitons and bivalves) and arthropods (Cox et
al, 1997). Caribbean spiny lobsters are found in a wide range of habitats including sand,
seagrass, coral reefs and coral rubble, but has been assessed as ‘Data Deficient in the IUCN
Red List of Threatened Species, as there are gaps in the data relating to its abundance (Butler et
al, 2013). Unsustainable fishing of this species could lead to population declines and ultimately
collapse of the industry, particularly in Belize, where a decline in catch per unit effort has
150
155
160
165
170
175
180
3 2 1
Len
gth
(m
m)
Site

already been documented in the past (~1.2 kg/trap in 1965 to 0.6 kg/trap in 1997) (Butler et al,
2013).
The gregarious nature of the spiny lobsters coupled with access to abundant prey allows for
particularly high population densities, when not threatened by human overexploitation
(Behringer and Butler, 2006), suggesting that local, healthy and sustainable lobster populations
can be maintained when effective management is in place. Protected areas, similar to the
Conservation Zones found within CCMR, can function as an effective harvest refuge that ha the
potential to increase local population size, mean individual size, and consequently, reproductive
success (Acosta and Robertson, 2003).These protections should result in increased regional
larval supply and net movements of adult individuals from the reserve to adjacent fishing
grounds. In addition to the protection granted by marine reserves, lobster fishing in Belize is
currently regulated by a managed access fishing season (June 15th to February 14
th of the
following year, which is the peak of the reproductive cycle) when fishing of lobsters is not
permitted. In addition, a size limit of carapace length of 3 inches (7.6 cm) and tail weight of 4
ounces (113 g) is applied throughout the year. There is also a ban on the use of SCUBA for
catching lobsters, other gear restrictions and license limitation. Despite this, there is no current
total allowable catch quota for lobsters (Babcock, 2012).
Given the importance of the Caribbean spiny lobster at both an economic and ecosystem level,
it is essential to assess the effectiveness of the conservation efforts mentioned above, in order to
gain an insight into the sustainability of the lobster fishery. The aim of the lobster surveys
conducted by Frontier is to carry out long-term monitoring and assessment of the local
population size and structure, with regards to sex ratios and maturity status within two
differently regulated zones of CCMR; the General Use Zone, where fishing is allowed, and the
Conservation Zone, where fishing is prohibited. By comparing differences in lobster
distribution, abundance, sex and maturity status between these two areas, conclusions can be
made on the effectiveness of current conservation measures and alternative management options
can be suggested according to the findings.
In addition to vital information on the sustainability of the lobster fishery, data on lobster
distribution could potentially provide insight into the level of complexity and structure of the
local coral reef systems. This is because higher densities of Caribbean spiny lobster have shown
to be associated with areas of higher habitat complexity, where the reef is intricate and creates
crevices and hidden sites for lobsters (Rios-Lara et al, 2007). Higher lobster densities could
therefore be a used as an indicator of complex and healthy coral reefs, a feature that can also be
compared between the two different survey sites.
5.2 Methodology
For comparison purposes, in line with the aim of this study, surveys were carried out at two
different sites, one in the General Use Zone and one in the Conservation Zone. GPS location of
the survey sites were recorded in order to ensure the same sites were surveyed each time.
Surveys were carried out using an active search approach, consisting of a team of snorkelers
actively searching for lobsters without the use of fixed transects. The rationale behind this
method was to simulate local fishing practices and get an estimate of Catch Per Unit Effort

(CPUE). In other words, surveyors would find the same number of lobsters that a fisherman
would find and catch in the same area, giving an indirect indication of lobster abundance.
The survey team initially distributed sections of the survey area amongst themselves. This
minimised the overlapping of terrain and double-counting of individual lobsters whilst
surveying. All information was recorded on dive slates. Each individual snorkeled for 30
minutes looking for lobsters. Each individual lobster found was measured using a ruler to
approximate its total carapace length. Sex was also recorded, which was carried out by
determining if two extra claws were present on the back legs, or if there was an extra pair of
swimming legs underneath the tail in females. Despite best efforts it was often not possible to
m b x b ock crevices,
with their abdomen not visible to the surveyor. Lobster were not handled in order to minimize
disturbance. If lobsters escaped before measurements could be made, these were estimated by
sight.
As there were differences in the number of snorkelers participating in each survey, each
individual active search carried out at the same site was counted as a separate survey in order to
avoid bias.
5.3 Results and Discussion
Table 4. Data collected from lobster surveys conducted from the two established and differently regulated
sites within Caye Caulker Marine Reserve.
General Use Zone Conservation Zone
Date Number of
individuals
sighted
Carapace
length
(cm)
Sex Date Number of
individuals
sighted
Carapace
length
(cm)
Sex
13/09/2014 2 10 Unknown 13/09/2014 2 12 M
7 F 9 F
28/09/2014 0 NA NA
31/09/2014 1 17 Unknown 05/09/2014 0 NA NA
31/09/2014 0 NA NA
31/09/2014 0 NA NA
Seven lobster surveys have been completed up to date (five in the General Use Zone and two in
the Conservation Zone), therefore the data is still too limited to make any inferences about the
current status, maturity and sexual distribution of the populations within CCMR. A maximum
number of two lobsters were found during the surveys, so it is yet to be determined if this results
from the ability to locate these elusive species, or if these results are a normal representation of
lobster populations at the sites. Bi-monthly lobster surveys will continue during the next phase
and should produce enough data to formulate statistically supported observations and trends in
lobster populations.
6.0 Seagrass Monitoring
6.1Introduction
As BZM is still within its first six months, more time is needed to solidify methodology and
perform preliminary surveys for other projects, such as, the Seagrass monitoring project, which
will be properly initiated during the next phase.
Seagrasses act as ecosystem engineers, profoundly influencing the physical, chemical and
biological environments within coastal waters. Seagrasses alter water flow, nutrient cycling and
food web dynamics and stabilise sediments (Orth, et al., 2006). They are also a vital food source
for mega-herbivores in the Caribbean, including the green, loggerhead and hawksbill sea turtles
(Chelonia mydas, Caretta caretta and Eretmochelys imbricata respectively) and West Indian
Manatees (Trichechus manatus), all being of international conservation concern (Beck et al,
2001). They provide a critical habitat; nursery and refuge area for juvenile fish and other
commercially and recreationally important fishery species and allow trophic transfers to
adjacent habitats in tropical and temperate regions (Heck et al, 2003).
Seagrasses are currently threatened from rapid environmental changes, as a consequence of
increasing coastal human population pressures and climate change (Lotze, 2006). The most
widely accepted disturbances include sediment and nutrient runoff, physical damage, invasive
species, disease, commercial fishing practices, aquaculture, overgrazing, algal blooms, and
global warming associated impacts (Orth, et al., 2006). Such disturbances have resulted in the
recent decline of seagrass meadows in the region and ultimately increase the necessity for the
protection, monitoring and management of this relatively understudied ecosystem.
6.2 Aims and Objectives
The implementation of monthly seagrass surveys in this area will allow monitoring of the health
of the Seagrass throughout the development of Caye Colony, a new site for residential
development alongside the forest reserve on the northern island of Caye Caulker. By surveying
one site alongside the developing area and another adjacent to the forest reserve, data can be
compared between the two sites, as well as monitored over time. It is expected to see a change
in the density of Seagrass at the site alongside Caye Colony development.
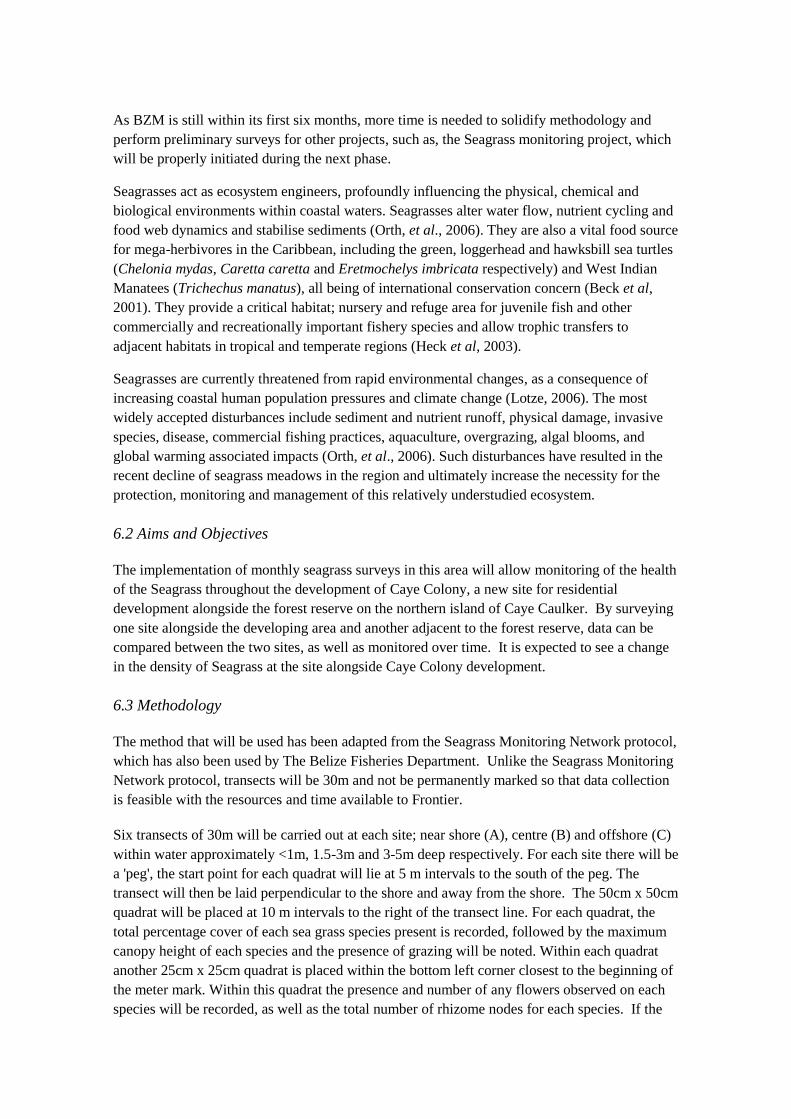
6.3 Methodology
The method that will be used has been adapted from the Seagrass Monitoring Network protocol,
which has also been used by The Belize Fisheries Department. Unlike the Seagrass Monitoring
Network protocol, transects will be 30m and not be permanently marked so that data collection
is feasible with the resources and time available to Frontier.
Six transects of 30m will be carried out at each site; near shore (A), centre (B) and offshore (C)
within water approximately <1m, 1.5-3m and 3-5m deep respectively. For each site there will be
a 'peg', the start point for each quadrat will lie at 5 m intervals to the south of the peg. The
transect will then be laid perpendicular to the shore and away from the shore. The 50cm x 50cm
quadrat will be placed at 10 m intervals to the right of the transect line. For each quadrat, the
total percentage cover of each sea grass species present is recorded, followed by the maximum
canopy height of each species and the presence of grazing will be noted. Within each quadrat
another 25cm x 25cm quadrat is placed within the bottom left corner closest to the beginning of
the meter mark. Within this quadrat the presence and number of any flowers observed on each
species will be recorded, as well as the total number of rhizome nodes for each species. If the

rhizome node is beneath the surface individual blades will be counted. Each site should be
surveyed every 6 weeks (Short et al, 2006).
In addition to this, one trained individual will be responsible for counting and recording the fish
and invertebrate species present within a 1m band of the transect. The size of each fish recorded
is estimated by assigning them to the following size categories (<5cm, 5-15, 16-30, 31-40, >40)
and number observed will be recorded. Such data collection could be used to supplement the
information on the health of the seagrass beds in the area and will allow for comparisons to be
made between the undeveloped and the developing site.
7.0 Mangrove Monitoring
6.1 Introduction
There are three mangrove species found in Belize; Red mangrove (Rhizophora mangle), Black
mangrove (Avicennia germinans) and the White mangrove (Laguncularia racemosa).
Buttonwood (Conocarpus erectus) is also a species associated with the mangrove community,
although its lack of aerial roots means it is not classed as a mangrove. The mangrove ecosystem
has great ecological and socio-ecological value. The structural complexity of the above ground
roots provide shelter from predation for many juvenile fish species, which depend on shallow
water biotopes as a nursery (Nagelkerken et al, 2000). Mangroves act as a filtering system,
removing harmful heavy metals, nutrients and sediment before they can reach the open ocean,
where they can cover and harm the coral reefs. This can buffer some of the damage from
anthropogenic activities, such as, mining and the use of fertilizers (Ellison & Farnsworth, 1996).
Furthermore, they protect the land from soil erosion and act as a defense against the damage
caused by storms and hurricanes (Badola & Hussain, 2005). Despite socio-ecological values,
this habitat is facing many anthropogenic disturbances, such as, extraction, pollution,
reclamation and climate change (Ellison & Farnsworth, 1996).
Caye Caulker forest reserve is surrounded by mangroves, however, this site has suffered from
the impact of Hurricane Keith (Cat.4- 2000), removal for agricultural purposes (coconut
production) and more recently, removal for housing and resort building at the new development
site, Caye Colony. Despite these negative effects, there were two large sites of mangrove
restoration implemented by FAMRACC after Hurricane Kieth (McRae, 2010). Therefore, the
mangroves in this area are in various stages of recovery and decline.
6.2 Aims and Objectives
The monitoring of mangroves in the Caye Caulker Forest Reserve aims to understand the
impact of development alongside the forest reserve, as well as the impacts of restoration efforts.
To do this the above ground biomass at the restoration area and area adjacent to the
development site will be monitored over time. If the restoration sites are successful an increase
in above ground biomass will be recorded. Furthermore, if there is successful management of
the new development site, Caye Colony, no change in the adjacent mangroves above ground
biomass will be recorded.
6.3 Methodology

Transect lines, from the seaward margin of the mangrove forest perpendicular to the shore and
up to the terrestrial edge of the mangrove forest will be conducted. The transect will then be
divided into zones corresponding to the level of tidal inundation i.e. Low (always below water),
Mid (intertidal) & High (only submerged at spring tides). Within each zone two to three 5m x
5m rope quadrats are taken. Within each quadrat the surveyor will record salinity, leaf litter
depth, number of adults (girth greater than 4cm and greater than 1m tall) of each species
present, number of saplings (girth less than 4cm and greater than 1m tall) of each species
present and number of seedlings (height less than 1m) of each species present. For the adults of
each species present, the girth at breast height will be measured according to the procedure by
English et al (1994);
When a tree forks below breast height, or sprouts from a single base close to the ground
or above it, measure each branch as a separate stem.
When the stem forks at breast height or slightly above it measure the girth at breast
height or just below the swelling caused by the fork.
When the stem has prop roots or a fluted lower trunk, measure the girth 20cm above the
root collar.
When the stem has swelling, branches or abnormalities at the point of measurement,
take the diameter slightly above or below the irregularity, where it stops affecting
normal form.
The girth measurement can then be converted into the diameter measurement at breast
( H) b b π (3.14). English et al, (1994) outlines an allometric
relationship between DBH and the individual plants above ground biomass, which can then
be used to calculate the above ground biomass for each species (Frontier Madagascar,
2005).
8.0 Marine Debris Monitoring
8.1Introduction
M b “ m terials of human origin; that are discarded at sea, reach the
w w m ( A m S
1975). The source of marine debris is normally classified as either land or ocean and waterway
based (Sheavly & Register, 2007). Land-based sources of marine debris include dumpsites in
coastal areas or river banks, industrial outfalls, material manufacturers, processors or
transporters, sewage treatment and drain overflows, tourism and recreational use of coastal
areas. These land-based sources of debris account for 80% of the global marine pollution
(Sheavly & Register, 2007). Ocean and waterway-based sources include shipping (merchant,
public transport, naval and research vessels) and fishing vessels, angling, fish farming,
discarded and lost fishing gear, oil and gas platforms, undersea exploration, legal and illegal
dumping at sea and natural disasters. The growing use of synthetic polymers means that debris
is building up faster than it can degrade; many of which are buoyant and can negatively impact
even the remotest areas (Moore, 2008). Coral reefs suffer from abrasion and smothering from
marine debris, many faunal species accidentally ingest debris, discarded and lost fishing gear
can entangle wildlife, and medicinal waste can carry diseases (Gregory, 2009).

8.2 Aims and Objectives
Identifying the source of marine debris locally and globally through project AWARE beach
clean surveys, will help to make appropriate decisions on how to mitigate and manage this
threat. The results from these surveys can then be used to contact local businesses that may be a
source of the marine debris e.g. fishing tours, if there is a significant amount of angling debris is
recorded.
8.3 Methodology
Marine debris monitoring in the form of Beach cleanups will be conducted using an existing
Data Card produced by Project AWARE (Barnett, 2015). Preliminary information recorded in
the Data Card are divided into three main sections presented in Table 5.
Table 5. Sections of the Data Card used during beach cleanups (Barnett, 2015).
Section Contents
1. Cleanup site information Location, Date, Number of people involved,
Distance cleaned, Number of trash bags filled,
Estimated weight collected, Estimated time
spent on cleanup
2. Contact information Names and email addresses of team members
3. Entangled animals List of all entangled animals found during the
cleanup, if they were alive or dead and the
nature of the entanglement debris
The following section in the Data Card contains information on the source of marine debris and
it is divided in five categories: Shoreline and recreational activities, Ocean and waterway
activities, Smoking-related activities, Dumping activities and Medical and personal hygiene.
Survey participants walk along the coastline and collect all debris they find. Every item
collected is assigned to one of the above categories and a count of the items belonging to each
of the categories is kept using tally marks.
9.0 Community Work and Public Awareness
Contributions to community work have recently begun, with the BZM team taking part in
weekly beach and trail clean ups both around the base camp and on the Woodrail Trail (the
public trail within the forest reserve) co-managed by FAMRACC.
The local high school is starting a variety of lesson to help the students to decide on a career
path, one of the career paths they have chosen is Marine Biology and they have asked the
fisheries biologist to conduct weekly lessons, both practical and in-class. A Frontier staff
member will assist with the pitch to the school year on the 9th January 2015. Once the students
have decided on which career lesson they will be participating in the classes will commence late

January on either Tuesdays or Thursdays. BZM volunteers will able to assist these classes and
help the children with fish, coral and invertebrate ID.


10.0 References
Acosta, C. A. and Robertson, D. N. (2003) 'Comparative Spatial Ecology of Fished Spiny
lobster Panulirus argus and an Unfished Coneger P. guttatus in an Isolated Marine Reserve at
Glover's Reef Atoll, Belize.' Coral Reefs. 22. Pages 1-9.
Aiken, K., Kong, A., Smikle, S., Appeldoorn, R. and Warner, G. (2006). ‘Managing Jamaica's
queen conch resources Ocean & Coastal Management, 49(5-6), Pages 332-341.
Almada-Villela, P., Mcfield, M., Kramer, P., Kramer, P. R. and Arias-Gonzalez, E. (2002)
'Status of Coral Reefs of Mesoamerica- Mexico, Belize, Guatemala, Honduras, Nicaragua and
El Salvador.' Status of Coral Reefs of the World. 16.
Almada-Villela, P.C., Sale, P.F., Gold-Bouchot, G., and Kjerfve, B. (2003). ‘Manual of
methods for p m p m Mesoamerican Barrier Reef Systems Program,
Belize City, Belize.
APAMO, (2015). Forest & Marine Reserves Association of Caye Caulker (FAMRACC).
[online] Apamo.net. Available at: http://apamo.net/index.php/forest-a-marine-reserve-
association-of-caye-caulker-fmracc [Accessed 5 Jan. 2015].
Aronson, R., Precht, W., Toscano, M. and Koltes, K. (2002) 'The 1998 Bleaching Event and its
Aftermath on a Coral Reef in Belize.' Marine Biology. 141(3). Pages 435-447.
Avila-Poveda, O.H. & Baqueiro-Cardenas E.R. (2006). ‘Size at sexual maturity in the queen
conch Strombus gigas from Colombia. Boletin de Investigaciones Marinas y Costeras, 35,
Pages 223-233.
Babcock, E. A. (2012) 'Toward Catch Quotas for Spiny Lobster (Panulirus argus) at Glover's
Reef Marine Reserve. Wildlife Conservation Society, Belize.
Badola, R.; Hussain, S.A (2005) ‘Valuing ecosystem functions: An empirical study on the storm
protection function of Bhitarkanika mangrove ecosystem Environ. Conserv., 32, Pages
85–92.
Barnett, A. (2015). [online] Available at:
http://www.projectaware.org/sites/default/files/DiveAgainstDebrisSurveyGuide_Vs2.1.pdf
[Accessed 4 Jan. 2015].
Beck, M., Heck, K., Able, K., Childers, D., Eggleston, D., Gillanders, B., Halpern, B., Hays, C.,
Hoshino, K., Minello, T., Orth, R., Sheridan, P. And Weinstein, M. (2001). ‘The Identification,
Conservation, and Management of Estuarine and Marine Nurseries for Fish and
Invertebrates. BioScience, 51(8), Pages 633.
Behringer, D. C. and Butler, M. J. (2006) 'Density-Dependent Population Dynamics in Juvenile
Panulirus argus (Latreille): The Impact of Artificial Density Enhancement.' Journal of
Experimental marine Biology and Ecology. 334(1). Pages 84-95.
Belize Fisheries Department (2010). Directory of Protected Areas in Belize. Online at:
http://www.fisheries.gov.bz/Caye%20Caulker.pdf

Belize Fisheries Department (2007) ‘Catch report for lobster, conch and finfish for Area 5
within 2000-2002 P 10.
Bryant, D., L. Burke, J. McManus, and M. Spalding (1998) ‘Reefs at risk: a map-based
w World Resources Institute, Washington, D.C.
Butler, M., Cockcroft, A., MacDiarmid, A. & Wahle, R. (2013). Panulirus argus. The IUCN
Red List of Threatened Species. Version 2014.3. <www.iucnredlist.org>. Downloaded on 29
December 2014
Chan, I., Tseng, L., Dahms, H. and Hwang, J. (2013) 'Population and Growth of Queen Conch
(lobatus gigas 1758) in the Sapodilla Cayes Marine Reserve of Belize.' Zoological Studies.
52(46)
Cho, L. (2005) Marine Protected Areas: 'A tool for integrated coastal management in Belize'.
Ocean and Coastal Management. 48(11-12). Pages 932-947
Chong-Seng, K., Mannering, T., Pratchett, M., Bellwood, D. and Graham, N. (2012). ‘The
Influence of Coral Reef Benthic Condition on Associated Fish Assemblages. PLoS ONE, 7(8),
page 42167.
CITES (2003). CITES suspends trade in queen conch shellfish. [Online]. Available at:
http://cites.org/eng/news/pr/2003/031001_queen_conch.shtml. Accessed on: 04/01/2015.
CITES (2014). What is CITES? [Online] Available at: http://www.cites.org/eng/disc/what.php.
Accessed on: 04/01/15.
Costanza, R., et al ( 99 ) ‘T w m p
Nature, 387: Pages 253–260.
Cox, C., Hunt, J.H., Lyons, W.G., and Davis, G E ( 99 ) ‘Nocturnal foraging of the Caribbean
spiny lobster (Panulirus argus) on offshore reefs of Florida, USA. Marine and Freshwater
Research, 48 (8), Pages 671-680.Ellison A F w E ( 996) ‘Anthropogenic
Disturbance of Caribbean Mangrove Ecosystems: Past Impacts, Present Trends, and Future
Predictions. Biotropica, 28(4), pages 549.
English, S., Wilkinson. C. & Baker. V. (1994) (eds.) Survey manual for Tropical Resources.
Austrailian Institute for Marine Science, Townsville
Frontier Madagascar (2005) Biddick K, Brown L. F., Markham K, Mayhew E.M., Robertson
A., & Smith V. (eds.) A field manual for survey methods in tropical marine ecosystems.
Frontier Madagascar Environmental Research Report 17. Society for Environmental
Exploration, UK
Gibson, J., Mcfield, M. and Wells, S. (1998) 'Coral Reef Managment in Belize: An Approach
Through Integrated Coastal Zone Management.' Ocean and Coastal Management. 39. Pages
229-244.
Gomez, G.M. (2004) 'A Rapid Ecological Assessment (REA) of Coral Reefs and Reef Fishes of
Barrier Islands within central Belize Barrier Reef Complex utilising the Mesoamerican Barrier
Reef Systems (MBRS) Protocol.' Belize Coastal Zone Management Authority.

Goreau, T., McClananhan, T., Hayes, R. and Strong, A. L. (2001) 'Conservation of Coral Reefs
after the 1998 Global Bleaching Event. Conservation Biology. 14(1). Pages 5-15.
G M R (2009) ‘Environmental implications of plastic debris in marine settings—
entanglement, ingestion, smothering, hangers-on, hitch-hiking and alien invasions.
Philosophical Transactions of the Royal Society. 364(1526). Pages 2013-2025. Harborne, A. R.,
Renaud, P.G., Tyler, E. H. M. and Mumby, P. J. (2009) 'Reduced density of the Herbivorous
Urchin Diadema antillarum inside a Caribbean Marine Reserve Linked to Increased Predation
Pressure by Fishes.' Coral Reefs. 28(3). Pages 783-79.
Heck Hay, K. H G O R (200 ) ‘Critical evaluation of the nursery role hypothesis
for seagrass meadows. Marine Ecology Progress Series, 253. Pages 123-136.
Horsford, I., Ishida, M., Looby, G., Archibald, M., Simon, M., Edwards, T., Lovell, T., James,
P W bb J & App (20 ) ‘The Morphology of the Queen Conch (Strombus gigas)
from the Antigua and Barbuda Shelf – Implications for Fisheries Management. [Online]
Available at:
http://www.strombusgigas.com/Panama%202014%20para%20QCweb/Antigua/GCFI_64%282
012%29%20Horsford%20et%20al%20Morphology%20of%20the%20Queen%20Conch%20fro
m%20the%20Antigua%20&%20Barbuda%20Shelf.pdf
Hughes, T.P., Rodrigues, M.J., Bellwood, D.R., Ceccarelli, D., Hoegh-Guldberg, O., McCook,
L., Moltschaniwskyi, N., Pratchett, M.S., Steneck, R.S. and Willis, B. (2007) 'Phase Shifts,
Herbivory, and the Resilience of Coral Reefs to Climate Change.' Current Biology. 17(4). Pages
360-365.
Huitric, M. (2005) 'Lobster and Conch Fisheries of Belize: a History of Sequential Exploitation'.
Ecology and Society. 10(1).
IUCN Red List (2014) [Online] Available at: http://www.iucnredlist.org/
King, D.T. and Petruny, L. (2012) 'Belize Onshore Petroleum Exploration Activity North of the
17th Parallel' Belize Petroleum Office Ministry of Natural Resources, Belmopan. Pages 104-
116.
Klumpp P A ( 9 9) ‘Trophic significance of herbivorous macroinvertebrates on
the central Great Barr R Coral Reefs, 8(3), Pages135-144.
McClanahan, T.R., McField, M., Huitric, M., Bergman, K., Sala, E., Nystrom, M., Nordemar, I.,
Elfwing, T. and Muthiga, N.A. (2001) 'Responses of algae, corals and fish to the reduction of
macroalgae in fished and unfished patch reefs of Glover Reef Atoll, Belize.' Coral Reefs. 19.
Pages 367-379.
McRae, E., (2010) ‘ F : A -R H b R Reef Currents,
March, 2(1), page 3.
Monnereau, I. and Pollnac, R. (2012) 'Which Fishers are satisfied in the Caribbean? A
Comparative analysis of Job Satisfaction Among Caribbean Lobster Fishers.' Social Indicators
Research. 109(1). Pages 95-118.
M J (200 ) ‘Synthetic polymers in the marine environment: A rapidly increasing, long-
term threat. Environmental Research, 108 (2), Pages 131-139.

Nagelkerken, I., van der Velde, G., Gorissen, M., Meijer, G., Van't Hof, T. and den Hartog, C.
(2000) ‘Importance of Mangroves, Seagrass Beds and the Shallow Coral Reef as a Nursery for
Important Coral Reef Fishes, Using a Visual Census Technique. Estuarine, Coastal and Shelf
Science, 51(1), pages 31-44.
Navarrete, A. D. J. and Valencia-Hernandez, A. (2013) 'Declining Densities and Reproductive
Activities of the Queen Conch Strombus gigas (Mesogastropoda: Strombidae) in Banco
Chinchorro, Eastern caribbean, Mexico.' Rev. Biol. Trop. 61(4). Pages 1671-1679.
Orth, R. J., Carruthers, T. J. B., Dennison, W. C., Duarte, C. M., Fourqurean, J. W., Heck, K. L.,
Hughes, A. R., Kendrick, G. A. and kenworthy, W. J. (2006) 'A Global Crisis for seagrass
Ecosystems.' Bioscience. 56(12). Pages 987-996.
Peel, J.R. and Aranda, D.A. (2012) 'Growth and Population Assessment of the Queen Conch
Strombus giga (Mesogastropoda: Strombidae) by Capture Mark-Recapture Sampling in a
Natural Protected Area of the Mexican Caribbean.' Rev. Biol. Trop. 60(1). Pages 127-137.
Perez, A.A & Garcia, O. (2012) Socioeconomic Assessment of the Sea Cucumber Fishery in
Belize. Technical Report.
P ( 99 ) ‘Recruitment overfishing and resilience in spiny lobster populations. ICES
Journal of Marine Science, 50(1), Pages 9-14.
Rios-Lara, V., Salas, S., Javier, B.P. and Ayora, P. I. (2007) 'Distribution Patterns of Spiny
lobster (Panulirus argus) at Alacranes Reef, Yucatan: Spatial Analysis and Inference of
Preferential Habitat.' Fisheries Research. 87(1). Pages 35-45.
Russ, G. and Alcala, A. ( 996) ‘Marine Reserves: Rates and Patterns of Recovery and Decline
of Large Predatory Fish. Ecological Applications, 6(3), Pages 947
Schutte, V. G., Selig, E. R. and Bruno, J. F. (2010) 'Regional spatio-temporal trends in
Caribbean coral reef benthic communities.' Marine Ecology Progress Series. 402. Pages 115-
122.
Seudeal, (20 ) ‘P [O ], Animal Diversity Web. Available at:
http://animaldiversity.org/accounts/Panulirus_argus. Accessed January 3rd
, 2015.
Sheavly, S R K M (200 ) ‘Marine debris & plastics: Environmental concerns,
impacts and solutions. Journal of Polymers and the Environment. 15 (4), Pages 301-305.
Short, F.T., McKenzie, L.J., Coles, R.G., Vidler, K.P., Gaeckle, J.L. (2006) SeagrassNet
Manual for Scientific Monitoring of Seagrass Habitat, Worldwide edition. University of New
Hampshire Publication. Page 75.
Stallings, C.D. (2009) 'Fishery-Independent Data Reveal Negative Effect of Human population
Density on Caribbean Predatory Fish Communities.' Plos one. 4(5).
S A R M ( 99 ) ‘Aggregation dynamics in juvenile queen conch (Strombus
gigas): population structure, mortality, growth, and migration. Marine Biology, 116(4), Pages
571-582.
Stoner, A.W., Davis, M. H. and Booker, C.J. (2012) 'Abundance and Population Structure of
Queen Conch Inside and Outside a Marine Protected Area: Repeat Surveys Show significant
Declines'. Marine Ecology Progress Series. 460. Pages 101-114.
Theile, S. (2002) ‘Queen conch and the review of significant trade. CITES World Official
Newsletter of the Parties 10: 3-4. [Online] Available at: www.cites.org/eng/news/world/10.pdf.
Accessed December 2014.
U.S. Fi W S (20 2) ‘Importing Queen Conch. What you need to know.
[Online] Available at: http://www.fws.gov/international/pdf/factsheet-import-queen-conch-
2013.pdf. Accessed on: 04/01/2015.

11.0 Appendices
11.1 Appendix 1.
Species Lists
Fish Species List
Angelfish- Pomacanthidae
Queen Angelfish Holacanthus ciliaris
Blue Angelfish Holacanthus bermudensis
French Angelfish Pomacanthus paru
Gray Angelfish Pomacanthus arcuatus
Rock Beauty Holacanthus tricolor
Butterflyfish- Chaetodontidea
Banded Butterflyfish Chaetodon striatus
Foureye Butterflyfish Chaetodon capistratus
Spotfin Butterflyfish Chaetodon ocellatus
Reef Butterflyfish Chaetodon sedentarius
Longsnout Butterflyfish Prognathodes aculeatus
Surgeonfish- Acanthuridae
Blue Tang Acanthurus coeruleus
Ocean Surgeonfish Acanthurus tractus
Doctorfish Acanthurus chirurgus
Jacks- Carangidae
Bar Jack Caranx ruber
Permit Trachinotus falcatus
Grunts- Haemulidae
French Grunt Haemulon flavolineatum
Bluestriped grunt Haemulon sciurus
Smallmouth Grunt Haemulon chrysargyreum
White Grunt Haemulon plumierii

Caesar Grunt Haemulon carbonarium
Spanish Grunt Haemulon macrostomatum
Tomtate Haemulon aurolineatum
Cottonwick Haemulon melanurum
Striped Grunt Haemulon striatum
Sailors Choice Haemulon parra
Porkfish Anisotremus virginicus
Black Margate Anisotremus surinamensis
White Margate Haemulon album
Snappers- Lutjanidae
Red Snapper Lutjanus campechanus
Mutton Snapper Lutjanus analis
Cubera Snapper Lutjanus cyanopterus
Gray Snapper Lutjanus griseus
Dog Snapper Lutjanus jocu
Mahogany Snapper Lutjanus mahogoni
Lane Snapper Lutjanus synagris
Yellowtail Snapper Ocyurus chrysurus
Schoolmaster Lutjanus apodus
Groupers-Serranidae
Goliath Grouper Epinephelus itajara
Nassau Grouper Epinephelus striatus
Red Grouper Epinephelus morio
Graysby Cephalopholis cruentata,
Red Hind Epinephelus guttatus
Rock Hind Epinephelus adscensionis
Coney Epinephelus fulvus
Black Grouper Mycteroperca bonaci
Tiger Grouper Mycteroperca tigris

Yellowmouth Grouper Mycteroperca interstitialis
Yellowfin Grouper Mycteroperca venenosa
Parrotfish- Scaridae
Blue Parrotfish Scarus coeruleus
Midnight Parrotfish Scarus coelestinus
Rainbow Parrotfish Scarus guacamaia
Queen Parrotfish Scarus vetula
Stoplight Parrotfish Sparisoma viride
Princess Parrotfish Scarus taeniopterus
Striped Parrotfish Scarus iseri
Redband Parrotfish Sparisoma aurofrenatum
Redtail Parrotfish Sparisome chrysopterum
Yellowtail Parrotfish Sparisoma rubripinne
Greenblotch Parrotfish Sparisoma atomarium
Trunkfish- Ostraciidae
Spotted Trunkfish Lactophrys bicaudalis
Triggerfish & Filefish- Balistidae
Queen Triggerfish Balistes vetula
Ocean Triggerfish Canthidermis sufflamen
Black Durgon Melicthys niger
Scrawled Filefish Aluterus scriptus
Whitespotted Filefish Cantherhines macrocerus
Orangespotted Filefish Cantherhines pullus
Miscellaneous
Hogfish Lachnolaimus maximus
Spanish Hogfish Bodianus rufus
Chub Kyphosus sectatrix/incisor
Great Barracuda Sphyraena barracuda
Yellowtail Damselfish Microspathodon chrysurus

Lionfish Pterois volitans
Juveniles and Recruits Fish Species List
Damselfish (<3.5cm)
Longfin Damselfish Stegastes diencaues
Dusky Damselfish Stegastes adustus
Threespot Damselfish Stegastes planifrons
Cocoa Damselfish Stegastes variabilis
Bicolor Damselfish Stegastes partitus
Blue Chromis Chromis cyanea
Brown Chromis Chromis multilineata
Surgeonfish (<5cm)
Blue Tang Acanthurus coeruleus
Ocean Surgeonfish Acanthurus tractus
Butterflyfish (<2.5cm)
Banded Butterflyfish Chaetodon striatus
Foureye Butterflyfish Chaetodon capistratus
Parrotfish
Princess Parrotfish Scarus taeniopterus
Striped Parrotfish Scarus iseri
Redband Parrotfish Sparisoma aurofrenatum
Greenblotch Parrotfish Sparisoma atomarium
Stoplight Parrotfish Sparisoma viride
Others (<3.5cm)
Spanish Hogfish Bodianus rufus
Slippery Dick Halichoeres bivittatus
Clown Wrasse Halichoeres maculipinna
Rainbow Wrasse Halichoeres pictus
Yellowhead Wrasses Halichoeres garnoti
Bluehead Wrasse Thalassoma bifasciatum
Fairy Basslet Gramma loreto
Benthic Species List and Their Corresponding Codes
Corals
Branching Fire Coral- MALC
Blade Fire Coral- MCOM
Gorgonian- GG
Staghorn Coral- ACER
Fused Staghorn Coral- APRO
Elkhorn Coral- APAL
Clubtip Finger Coral- PPOR
Pillar Coral- DCYL
Blushing Star Coral- SINT
Lobed Star Coral- OANN
Mountainous Star Coral- OFAV
Great Star Coral- MCAV
Elliptical Star Coral- DSTO
Mustard Hill Coral- PAST
Massive Starlet Coral- SSID
Lesser Starlet Coral- SRAD
Symmetrical Brain Coral- PSTR
Knobby Brain Coral- PCLI
Grooved Brain Coral- DLAB
Maze Coral- MMEA
Rose Coral- MARE
Boulder Brain Coral- CNAT
Whitestar Sheet Coral- ALAM
Lettuce Coral- AAGA
Low Relief Lettuce Coral- AHUM
Thin Relief Lettuce Coral- ATEN

Ridged Cactus Coral- MLAM
Sinuous Cactus Coral- ISIN
Spiny Flower Coral- MANG
Smooth Flower Coral- EFAS
Sponges- SPN
Marine Plants and Algae
Thalassia sp.- TH
Dictyota sp. - DT
Lobophora sp.- LOB
Halimeda sp. HA
Blue/Green Algae- BGA
Turf Algae- TURF
Macro Algae- MAC
Coralline Algae- ACOR
Other Substrates
Sand- SN
Bare Rock- BR
11.2 Appendix
Table 6. Average percentage cover of benthic species and substrate
North Fore North Back South Fore South Back
HC 11.67% 16.07% 0.00% 40.83%
SS 25.42% 13.57% 0.00% 0.00%
GG 18.33% 13.57% 0.00% 8.33%
SPN 1.67% 4.05% 0.00% 7.50%
FA 28.33% 23.81% 0.00% 20.00%
Acropora sp.
0.00% 0.00% 0.00% 0.83%
Millepora sp
1.46% 4.29% 0.00% 7.50%
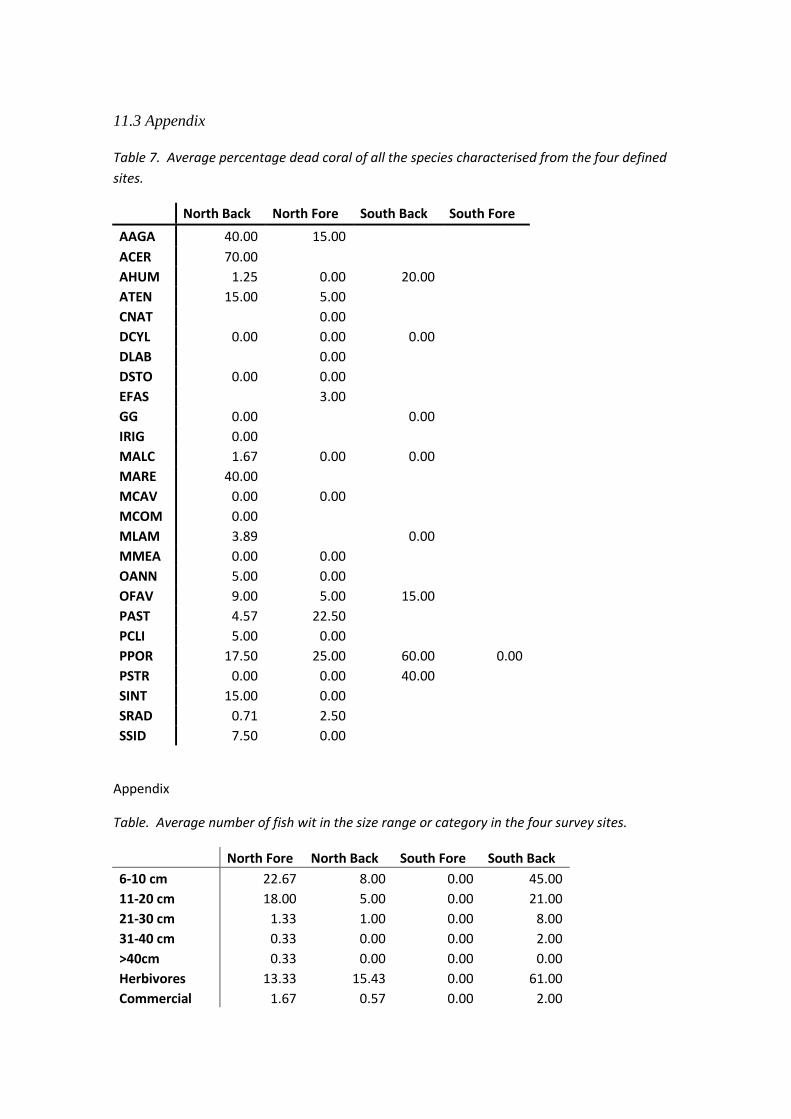
11.3 Appendix
Table 7. Average percentage dead coral of all the species characterised from the four defined
sites.
North Back North Fore South Back South Fore
AAGA 40.00 15.00
ACER 70.00
AHUM 1.25 0.00 20.00
ATEN 15.00 5.00
CNAT 0.00
DCYL 0.00 0.00 0.00
DLAB 0.00
DSTO 0.00 0.00
EFAS 3.00
GG 0.00 0.00
IRIG 0.00
MALC 1.67 0.00 0.00
MARE 40.00
MCAV 0.00 0.00
MCOM 0.00
MLAM 3.89 0.00
MMEA 0.00 0.00
OANN 5.00 0.00
OFAV 9.00 5.00 15.00
PAST 4.57 22.50
PCLI 5.00 0.00
PPOR 17.50 25.00 60.00 0.00
PSTR 0.00 0.00 40.00
SINT 15.00 0.00
SRAD 0.71 2.50
SSID 7.50 0.00
Appendix
Table. Average number of fish wit in the size range or category in the four survey sites.
North Fore North Back South Fore South Back
6-10 cm 22.67 8.00 0.00 45.00
11-20 cm 18.00 5.00 0.00 21.00
21-30 cm 1.33 1.00 0.00 8.00
31-40 cm 0.33 0.00 0.00 2.00
>40cm 0.33 0.00 0.00 0.00
Herbivores 13.33 15.43 0.00 61.00
Commercial 1.67 0.57 0.00 2.00

11.4 Appendix
Table 8. Average number of each juvenile fish species present in the four survey sites.
North Fore North Back South Fore South Back
Longfin Damselfish 1.00 0.00 0.00 0.00
Dusky Damselfish 2.00 1.50 0.00 0.00
Threespot Damselfish 1.00 0.50 0.00 0.00
Cocoa Damselfish 0.00 0.33 0.00 0.00
Bicolor Damselfish 4.50 3.17 0.00 19.00
Yellowtail Damselfish 2.00 2.00 0.00 0.00
Blue Chromis 4.00 0.00 0.00 2.00
Brown Chromis 0.00 0.00 0.00 0.00
Blue Tang 1.00 0.17 0.00 0.00
Ocean Surgeonfish 0.00 0.00 0.00 1.00
Banded Butterflyfish 0.00 0.00 0.00 0.00
Four-eye Butterflyfish 0.00 0.33 0.00 0.00
Striped Parrotfish 13.00 8.67 0.00 17.00
Princess Parrotfish 4.00 4.17 0.00 16.00
Redband Parrotfish 0.00 0.00 0.00 3.00
Greenblotch Parrotfish 0.00 1.00 0.00 0.00
Stoplight Parrotfish 0.00 0.50 0.00 8.00
Spanish Hogfish 1.00 0.50 0.00 0.00
Slippery Dick 6.50 2.50 0.00 0.00
Clown Wrasse 0.00 0.33 0.00 2.00
Rainbow Wrasse 0.00 0.17 0.00 0.00
Yellowhead Wrasses 1.00 0.33 0.00 4.00
Bluehead Wrasse 12.67 4.67 0.00 9.00
Fairy Basslet 0.00 0.00 0.00 0.00
11.5 Appendix
Table 9. Density/100m2 form each Queen Conch survey
Date Site Total Density/100m2
24.10.14 GUZ 37 10.27777778
31.10.14 SRA 97 26.94444444
16.08.14 SRA 75 20.83333333
26.07.14 CZ 76 21.11111111
30.08.14 GUZ 40 11.11111111
20.09.14 CZ 117 32.5
27.09.14 SRA 58 16.11111111
11.6 Appendix
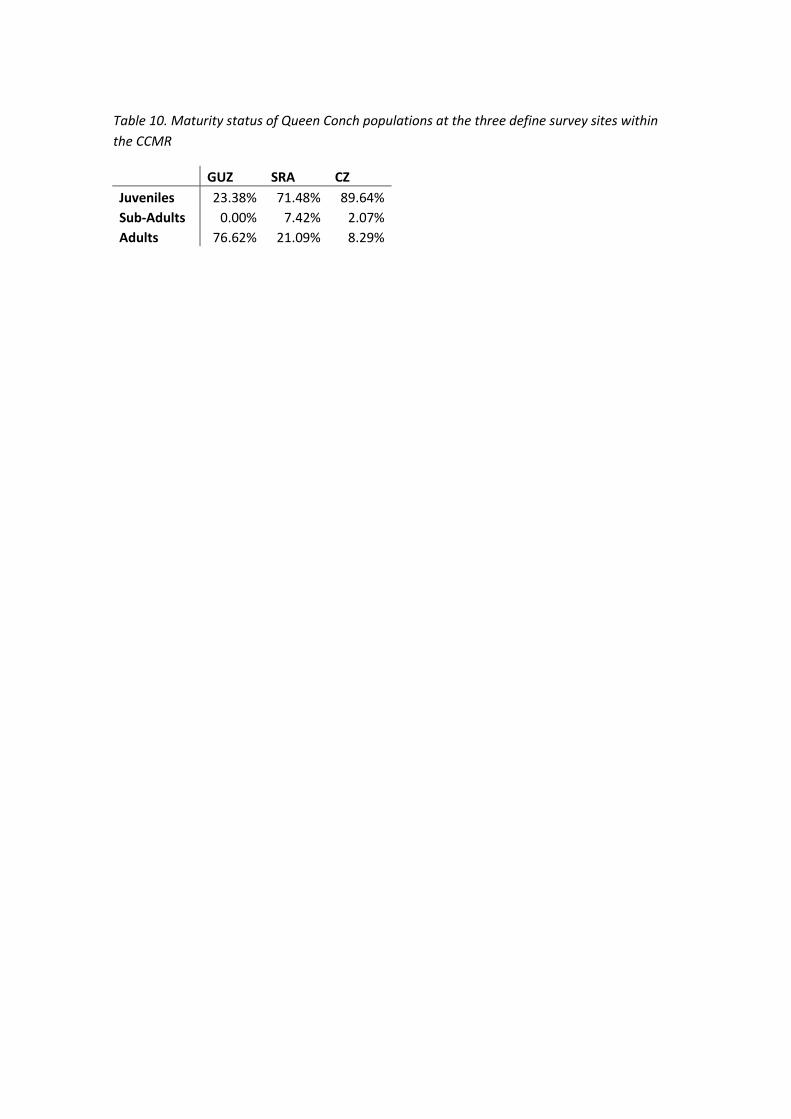
Table 10. Maturity status of Queen Conch populations at the three define survey sites within
the CCMR
GUZ SRA CZ
Juveniles 23.38% 71.48% 89.64%
Sub-Adults 0.00% 7.42% 2.07%
Adults 76.62% 21.09% 8.29%