behavioural ecology and population genetics of the african
TRANSCRIPT
Behavioural ecology and population genetics of the African wild
cat, Felis silvestris Forster 1870, in the southern Kalahari
by
Marna Herbst
Submitted in partial fulfillment of the requirements for the degree of
Doctor of Philosophy (Zoology)
in the Faculty of Natural and Agricultural Sciences
University of Pretoria
Pretoria
August 2009
©© UUnniivveerrssiittyy ooff PPrreettoorriiaa
To my parents and my brother, for their love and support
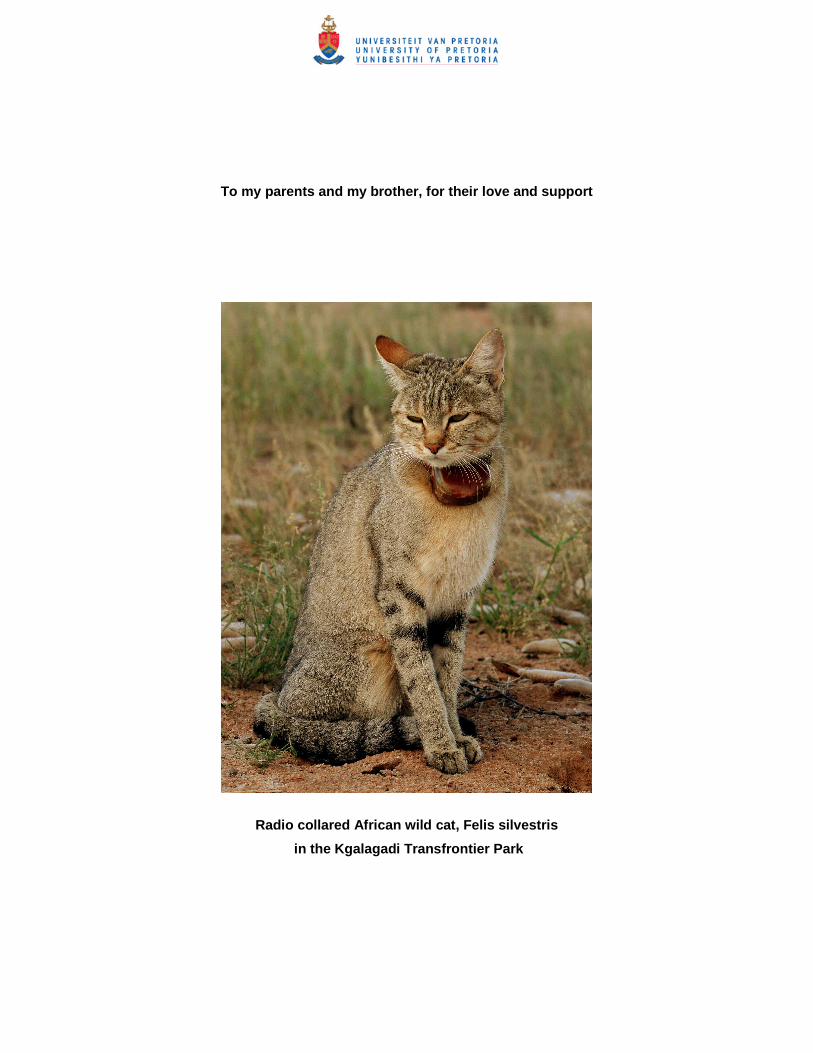
Radio collared African wild cat, Felis silvestris
in the Kgalagadi Transfrontier Park
iii
Behavioural ecology and population genetics of the African wild cat, Felis silvestris
Forster 1870, in the southern Kalahari
Marna Herbst
Supervisors: Prof. M.G.L. Mills
Tony and Lisette Lewis Foundation
Prof. P. Bloomer
Head Department of Genetics
Molecular Ecology and Evolution Program
University of Pretoria
Submitted for the degree of Doctor of Philosophy (Zoology) in the Faculty of Natural and
Agricultural Sciences
Summary
The motivation for this study was to increase our knowledge on the natural history of the
African wild cat and to investigate the genetic status of the Kalahari population. Hybridisation
with the domestic cat is a global threat to the genetic integrity of the species. The Kalahari
population was selected due to the isolation of the area and the slight possibility of contact
with domestic cats. Radio telemetry and direct visual observations (1,538 hours) of eight
habituated African wild cats (five male and three female) were used to address the feeding
habits, foraging behaviour, spatial organisation and reproduction in wild cats. Throughout the
study small skin biopsies were collected from both African wild cats and domestic cats from
surrounding communities in order to address the potential of hybridisation and population
genetic structure.
The Kalahari ecosystem not only experience annual dry and wet seasons but also longer
lean and abundant periods that in turn influence rodent abundances and hence prey
availability for the cats. This plays an important role in nearly all aspects of African wild cat
behavioural ecology. The feeding habits of the African wild cat were discussed in the view of
the optimal foraging theory. The lean season were characterised by a high species richness
and high dietary diversity. African wild cats adapt their diet and foraging behaviour to
seasonal prey abundances and availability. Male African wild cats were significantly larger
than female cats and both sexes predominantly fed on smaller rodents, although there were
iv
differences is diet composition with males hunting larger mammals and females favouring
birds and reptiles.
Despite sexual dimorphism male and female cats show little differences in time budgets and
both exhibit a two peak activity period with a strong seasonal shift from predominantly
nocturnal during the hotter seasons to more diurnal activity in the colder seasons. The major
factors influencing activity patterns and habitat use appears to be prey abundances and
temperature extremes.
As predicted male African wild cats had significantly larger annual home ranges than female
cats (MCP 95%, ♂ = 7.7 ± 3.5 km2 and ♂ = 3.5 ± 1.0 km2). Female cats shows extensive
overlap of home ranges, however the core areas were mostly exclusive while male-male
overlap were limited and show no overlap of core areas. There were no differences in
seasonal ranges between male and female cats and thus reproduction seems to be
aseasonal and depending on food availability. Urine spray marking in males were prominent
with territorial behaviour and aggression observed, while female spray marking seems to be
related to their reproductive status.
In our study we report the genetic variation and admixture analysis of 57 wild living African
wild cats and 46 domestic cats using 18 microsatellite loci. Bayesian cluster analysis support
the classification of African wild cats and domestic cats as two distinct entities and identified
four cryptic hybrids among the wild cats. Although all hybrids were outside or on the
periphery of the KTP, suggesting that levels of introgression are low, this is still a concern to
the genetic integrity of African wild cats as a species.

Acknowledgements
v
Acknowledgements
I would like to express my sincere appreciation to my supervisors, Prof. Gus Mills and Prof.
Paulette Bloomer, for all their encouragement, advice and guidance during my project.
Especially Gus who visited and guided me while doing fieldwork and shared his Kalahari
expertise and helped interpreted behavioural aspects of the wild cats. A special thanks to
Paulette who skilfully directed me in understanding the different genetic perspectives as well
as her support during my fieldwork. It was a privilege to conduct this project under the
guidance of two supervisors who both share my fondness for the Kalahari.
I am most grateful to South African National Parks and Department of Wildlife and National
Parks in Botswana for permission to work in the Kgalagadi Transfrontier Park. To all the
SANParks staff in the KTP who supported the project and the Technical Department who
assisted with numerous vehicle repairs. A special thanks to the Section Ranger, Nardus du
Plessis and Christine du Plessis for all their assistance and true Kalahari hospitality.
I thank the SANParks veterinarians who assisted in the darting operations of the wild cats, Dr
Peter Buss and Dr Danny Govender for working throughout the night in Kalahari temperature
extremes. Martin Haupt, Paul Odendaal, Dr Lindie Jansen van Rensburg and Nicola Read
are thanked for their assistance during the darting operations. The volunteers assisting with
rodent surveys, Dr Marietjie Oosthuizen, Cassie Hughes, Jane Walker and Claire Warner are
thanked for al the long hours and hard work in the field.
The project was initiated and supported by the Carnivore Conservation Group of the
Endangered Wildlife Trust. In particular Pat Fletcher who dealt with numerous administrative
issues and urgent requests from the Kalahari. I am grateful to all our sponsors, the Elizabeth
Wakeman Henderson Charitable Foundation, the Skukuza Marathon Club, the Wildlife
Conservation Society for the Kaplan Award, the National Research Foundation, the
Wilderness Foundation, Maxiprest Tyres and the Eco Challenge for keeping me funded and
equipped in the field.
Many thanks to the Mammal Research Institute under Prof. Elissa Cameron and the MRI
Development Fund for making it possible for me to attend the Felid Biology and Conservation
Conference in Oxford during 2007. Thanks to the Molecular Ecology and Evolution
Program’s students (MEEP’ers) for all their support and assistance while I was writing up in
Pretoria.

Acknowledgements
vi
A special thanks to all the people assisting with proof reading and positive critique during the
write up, Dr Lindie Jansen van Rensburg, Dr Marie Warren, Dr Marietjie Oosthuizen, Dr Sam
Ferreira and Paul Odendaal. Phozisa Mamfengu and Sandra MacFadyen, thanks for all the
help with GIS images and analyses. Thanks to all my SANParks colleagues, who supported
and encouraged me when the writing up became a part time endeavour.
Most importantly, I thank my parents for their unconditional support, encouragement and for
believing in me when I followed my heart to the Kalahari. Their patience when stress levels
were high and their understanding kept me going. I could not have finished this without your
prayers and love.
To the Kalahari and the African wild cats – it was though but a remarkable journey! Words
can not do justice to describe my experiences in the Kalahari.
God is in the details
∼ Unknown ∼
Table of Contents
vii
TABLE OF CONTENTS
Summary............................................................................................................................... iii
Acknowledgements ................................................................................................................v
TABLE OF CONTENTS ............................................................................................................. vii
LIST OF FIGURES.....................................................................................................................xi
LIST OF TABLES .....................................................................................................................xv
CHAPTER 1 GENERAL INTRODUCTION ..................................................................................... 1
1. The African wild cat, Felis silvestris (Forster, 1780) and synonym Felis silvestris cafra
(Desmarest, 1822): an overview..................................................................................... 1
1.1 Phylogenetic relations and taxonomic classification ............................................... 1
1.2 Geographical range ............................................................................................... 3
1.3 Domestication of wild cats...................................................................................... 3
1.4 Conservation status of the African wild cat............................................................. 4
2. This study: The African Wild Cat Project ........................................................................ 4
2.1 The study site ........................................................................................................ 6
2.2 Rationale................................................................................................................ 9
2.3 Objective................................................................................................................ 9
2.4 Key questions .......................................................................................................10
2.5 The broader scientific framework of this study ......................................................10
2.6 Overview of thesis.................................................................................................12
3. References....................................................................................................................13
CHAPTER 2 THE FEEDING HABITS OF THE AFRICAN WILD CAT (FELIS SILVESTRIS CAFRA), A
FACULTATIVE TROPHIC SPECIALIST, IN THE SOUTHERN KALAHARI (KGALAGADI
TRANSFRONTIER PARK, SOUTH AFRICA/BOTSWANA..........................................................19
1. Abstract.........................................................................................................................19
2. Introduction ...................................................................................................................19
3. Materials and methods ..................................................................................................21
3.1 Study area ............................................................................................................21
3.2 Climate and rainfall ...............................................................................................21
3.3 Data collection ......................................................................................................23
3.4 Scat analysis.........................................................................................................26
3.5 Statistical analysis.................................................................................................26
4. Results ..........................................................................................................................26
4.1 Overall diet and prey composition .........................................................................26
Table of Contents
viii
4.2 Seasonal variation in the diet ................................................................................28
4.3 Influence of changes in prey availability in the diet................................................31
4.4 Sexual differences in body size and diet of African wild cats .................................31
5. Discussion.....................................................................................................................35
6. References....................................................................................................................37
CHAPTER 3 FORAGING BEHAVIOUR AND HABITAT USE OF THE AFRICAN WILD CAT, FELIS
SILVESTRIS CAFRA IN THE KGALAGADI TRANSFRONTIER PARK............................................43
1. Abstract.........................................................................................................................43
2. Introduction ...................................................................................................................43
3. Material and Methods....................................................................................................45
3.1 Study area ............................................................................................................45
3.2 Climate and rainfall ...............................................................................................47
3.3 Data collection ......................................................................................................49
3.4 Definition of terms .................................................................................................50
3.5 Data analysis ........................................................................................................51
4. Results ..........................................................................................................................52
4.1.1 Feeding and foraging behaviour............................................................................52
4.1.2 Descriptions of hunting behaviour .........................................................................53
4.2.1 Activity periods and distances travelled.................................................................56
4.2.2 Time budgets ........................................................................................................59
4.2.3 Consumption rate..................................................................................................61
4.3 Habitat utilisation...................................................................................................61
4.4 Social and other behaviours..................................................................................64
5. Discussion.....................................................................................................................64
6. References....................................................................................................................67
CHAPTER 4 ASPECTS OF THE SOCIAL ORGANISATION OF THE AFRICAN WILD CAT, FELIS
SILVESTRIS CAFRA IN THE SOUTHERN KALAHARI: FACTORS AFFECTING HOME RANGE SIZE AND
MOVEMENT PATTERNS, AND A BASIC DESCRIPTION OF SCENT MARKING BEHAVIOUR AND
REPRODUCTIVE BIOLOGY .................................................................................................74
1. Abstract.........................................................................................................................74
2. Introduction ...................................................................................................................74
3. Materials and Methods ..................................................................................................77
3.1 Study area ............................................................................................................77
3.2 Data collection ......................................................................................................78
3.3 Data analysis ........................................................................................................81
Table of Contents
ix
4. Results ..........................................................................................................................82
4.1 Study population ...................................................................................................82
4.2 Annual and seasonal home range sizes................................................................82
4.3 Social organisation and spatial system .................................................................82
4.4 Scent marking behaviour ......................................................................................86
4.5 Breeding system and social interactions in the African wild cat .............................92
5. Discussion.....................................................................................................................97
6. References..................................................................................................................101
CHAPTER 5 MICROSATELLITES REVEAL PATTERNS OF RELATEDNESS IN A LOCAL AFRICAN WILD
CAT (FELIS SILVESTRIS CAFRA) POPULATION FROM THE SOUTHERN KALAHARI, WITH LIMITED
EVIDENCE OF HYBRIDISATION WITH THE DOMESTIC CAT (F. S. CATUS) ...............................112
1. Abstract.......................................................................................................................112
2. Introduction .................................................................................................................112
3. Materials and Methods ................................................................................................115
3.1 Sample collection and DNA extraction ................................................................115
3.2 Analyses of genetic variation...............................................................................119
3.3 Population structure and admixture analyses using Bayesian cluster analysis and
Principal Component Analysis .........................................................................119
3.4 Relatedness estimates within the African wild cat population ..............................120
4. Results ........................................................................................................................120
4.1 Genetic diversity in wild and domestic cats .........................................................120
4.2 Admixture analyses and identification of hybrid individuals .................................123
4.3 Genetic diversity within the African wild cat population........................................125
4.4 Relatedness between Kgalagadi Transfrontier Park African wild cats .................125
5. Discussion...................................................................................................................128
6. References..................................................................................................................129
CHAPTER 6 SYNTHESIS.......................................................................................................136
References.........................................................................................................................139
APPENDIX 1 TECHNIQUES USED IN THE STUDY OF AFRICAN WILD CAT, FELIS SILVESTRIS CAFRA, IN
THE KGALAGADI TRANSFRONTIER PARK (SOUTH AFRICA/BOTSWANA)..............................140
APPENDIX 2 PREY ITEMS CAPTURED BY AFRICAN WILD CATS IN THE KGALAGADI TRANSFRONTIER
PARK ...........................................................................................................................154
Table of Contents
x
APPENDIX 3 THE NUMBER OF HOURS OF OBSERVATIONS ON EIGHT AFRICAN WILD CATS (MALE =
5, FEMALE = 3) FOR EACH HOUR OF THE DAY IN EACH SEASON IN THE KGALAGADI
TRANSFRONTIER PARK FROM APRIL 2003 TO DECEMBER 2006 (HW = HOT-WET, CD = COLD-
DRY, HD = HOT-DRY).....................................................................................................156
APPENDIX 4 THE ALLELIC FREQUENCIES AT 18 POLYMORPHIC MICROSATELLITES AMONG AFRICAN
WILD CATS (AWC), KALAHARI DOMESTIC CAT POPULATION (KDC) AND A REFERENCE
COLLECTION OF DOMESTIC CATS (DCREF) .....................................................................157
APPENDIX 5 Chapter 26: BLACK-FOOTED CATS (FELIS NIGRIPES) AND AFRICAN WILD CATS (FELIS
SILVESTRIS): A COMPARISON OF TWO SMALL FELIDS FROM SOUTH AFRICAN ARID LANDS....160
List of Figures
xi
LIST OF FIGURES
Chapter 1
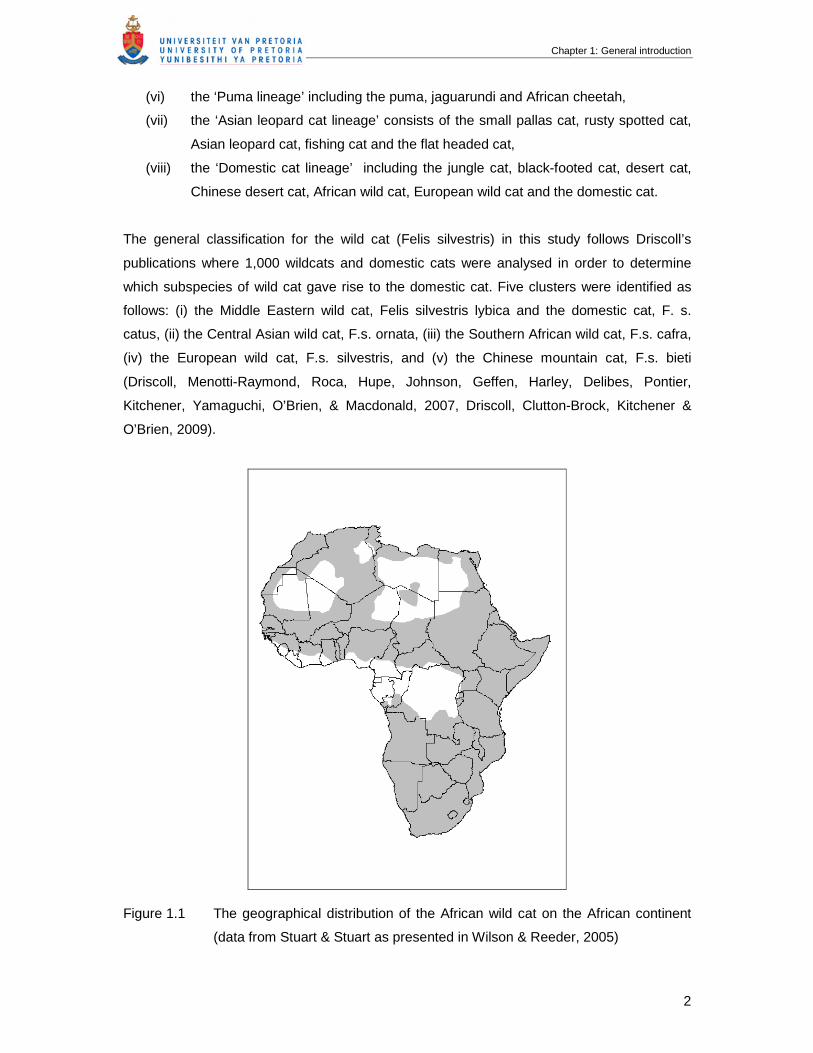
Figure 1.1 The geographical distribution of the African wild cat on the African
continent (data from Stuart & Stuart as presented in Wilson & Reeder,
2005) ……………………………………………………………………………..
2
Figure 1.2 Satellite image of the study site indicating the different habitats ………….. 7
Figure 1.3a Monthly averages of the minimum (○) and maximum (●) temperatures
(ºC) at the Twee Rivieren rest camp for the years 2003 to 2006 ………….
7
Figure 1.3b Average hourly changes in temperature in the hot-wet (HW), cold-dry
(CD) and hot-dry (HD) seasons calculated from the nearest weather
station in Upington ……………………………………………………………...
8
Chapter 2
Figure 2.1 Map of the study area in the Kgalagadi Transfrontier Park indicating the
different habitat types …………………………………………………………..
22
Figure 2.2 Total counts for small rodents, reptiles and birds on transect lines in all
habitats pooled together for each season (HD = hot-dry, HW = hot-wet,
CD = cold-dry) in the KTP from 2003 to 2006 ……………………………….
29
Figure 2.3 The relationship between percentage frequency of small mammals
consumed by African wild cats, rainfall and the relative abundance of
small mammals estimated from rodent trapping from the hot-wet season
2004 to the hot-dry season 2006 ……………………………………………..
32
Figure 2.4 Annual and seasonal changes in the proportions of small mammals,
insects, reptiles and birds in the diet of African wild cats in the KTP based
on visual observations (CD = cold-dry, HD = hot-dry, HW = hot-wet) …….
33
Chapter 3
Figure 3.1 Map of the study area in the Kgalagadi Transfrontier Park indicating the
different habitat types …………………………………………………………..
46
Figure 3.2a Monthly averages of the minimum (○) and maximum (●) temperatures
(ºC) at the Twee Rivieren rest camp for the years 2003 to 2006 ………….
48
Figure 3.2b Average hourly changes in temperature in the hot-wet (HW), cold-dry
(CD) and hot-dry (HD) seasons calculated from the nearest weather
station in Upington ……………………………………………………………...
49
List of Figures
xii
Figure 3.3 Daily activity schedules of male and female African wild cats in the (a)
cold-dry, (b) hot-dry and (c) hot-wet seasons. Data were calculated as
the mean percentage of observation time that individual African wild cats
were active for each hour of the day. The two arrows indicate sunrise and
sunset for midpoints of the season ……………………………………………
56
Figure 3.4 The distance travelled (m) and the percentage active per each hour of
observation for male and female African wild cats during the study in the
KTP. Observation periods = 8 hours or more (males: n = 42 observation
periods; females: n = 49 observation periods) ………………………………
58
Figure 3.5 Percentage activity of a single African wild cat female over a twenty four
hour period, indicating the change from the lean period (●) (cold-dry
2003 to hot-wet 2004) in comparison to the abundant period (○) (cold-dry
2004 to hot-wet 2006) ………………………………………………………….
59
Figure 3.6 Overall time budget of African wild cats calculated from the first
continuous eight hours of an observation period of habituated individuals
(♂ = 53 observation periods, ♀ = 54 observation periods) in the KTP ……
60
Figure 3.7 The percentage time that male, female and both sexes combined spent
active in the different habitats in the KTP. The percentage that each
habitat comprised in the study site is included ………………………………
62
Figure 3.8 The percentage of prey caught in each of the habitats for male and
female African wild cats (data pooled) ………………………………………..
63
Chapter 4
Figure 4.1 Map of the study area in the Kgalagadi Transfrontier Park ………………... 79
Figure 4.2 Core home range outlines (50% Kernel analyses) and 100% MCPs of
three radio collared African wild cat females during 2004 in the Kgalagadi
Transfrontier Park. The outline represents overall study site ………………
85
Figure 4.3 Core home range outlines (50% Kernel analyses) and annual 100%
MCPs of five radio collared African wild cat males during 2006 in the
Kgalagadi Transfrontier Park. Broken line show the home range of a sub-
adult male cat and solid lines represent adult African wild cats. The
outline represents the overall study site ……………………………………...
87
Figure 4.4 Resident home ranges of adult male cats VLO1662 and VLO1665 during
2006. The urine spray marks of VLO1665 as a roaming sub-adult cat
from 2005 and 2006 are indicated by (●) and the capture position with a
cross (X) …………………………………………………………………………
88
List of Figures
xiii
Figure 4.5 100% MCP home ranges calculated for African wild cats tracked during
2004 and 2005 on a 1 km2 grid. The outline represents the overall study
site, with males indicated by the solid lines and females indicated with
broken lines. The cross (X) represents the den of an uncollared female in
the study site …………………………………………………………………….
89
Figure 4.6 Two examples of the daily tracks, of five male African wild cats in relation
to their 100% MCP home range boundaries. Tracks were generated from
continuous visual observations where GPS points were taken at five
minute intervals …………………………………………………………………
90
Figure 4.7 Two examples of daily tracks, of three female African wild cats in relation
to their 100% MCP home range boundaries. Tracks were generated from
continuous visual observations where GPS points were taken at five
minute intervals …………………………………………………………………
91
Figure 4.8 Urine spray marking activity of four adult male African wild cats in their
100% MCP home ranges. The 50% core areas in each home range are
indicated and the outline represents the study site …………………………
93
Figure 4.9 Seasonal rodent abundance estimated from rodent trapping (CD = cold-
dry season; HD = hot-dry season; and HW = hot-wet season) (Chapter 2)
and the percentage frequency with which rodents was consumed by
African Wild Cats (AWC) from 2003 to 2006. Arrows indicate seasons
when litters were observed in the study site. During CD 2004 no rodent
abundance data were available ……………………………………………….
94
Chapter 5
Figure 5.1 (a) Map of South Africa with locations of all samples collected, DC =
domestic cat populations, AWC = African wild cat population (b and c)
the core study site, indicating 38 African wild cats that were sampled and
analised for relatedness and population structure from March 2003 to
December 2006 …………………………………………………………………
117
Figure 5.2 (a) Probability of the data LnK and, (b) ∆K against the number of K
clusters in the wild and domestic cat populations …………………………...
123
Figure 5.3 Individual assignment of domestic cats (DC1 and DC2) and wild living
African wild cats (AWC) in the southern Kalahari performed using
Structure 2.2 with K = 2. Each individual is represented as a vertical bar
partitioned into K = 2 segments indicating the estimated membership to
the two clusters. The horizontal black lines indicate values of individual
proportion of membership q ≥ 0.80 …………………………………………...
124
List of Figures
xiv
Figure 5.4 PCA of all three populations, African wild cats (AWC, solid triangle ▲),
Kalahari domestic cats (DC1, open square □) and reference collection of
domestic cats (DC2, solid circles ●). The four hybrids are indicated with
crosses …………………………………………………………………………..
124
Figure 5.5 PCA of African wild cats without hybrids (solid circles ●), indicating
samples collected outside the Transfrontier Park (open circle ○); related
individuals from the main study site in the KTP are also indicated
(crosses X) ………………………………………………………………………
125
Figure 5.6 Relatedness values for known relationships among African wild cats in
the Kalahari study site with the standard deviation included ………………
126
List of Tables
xv
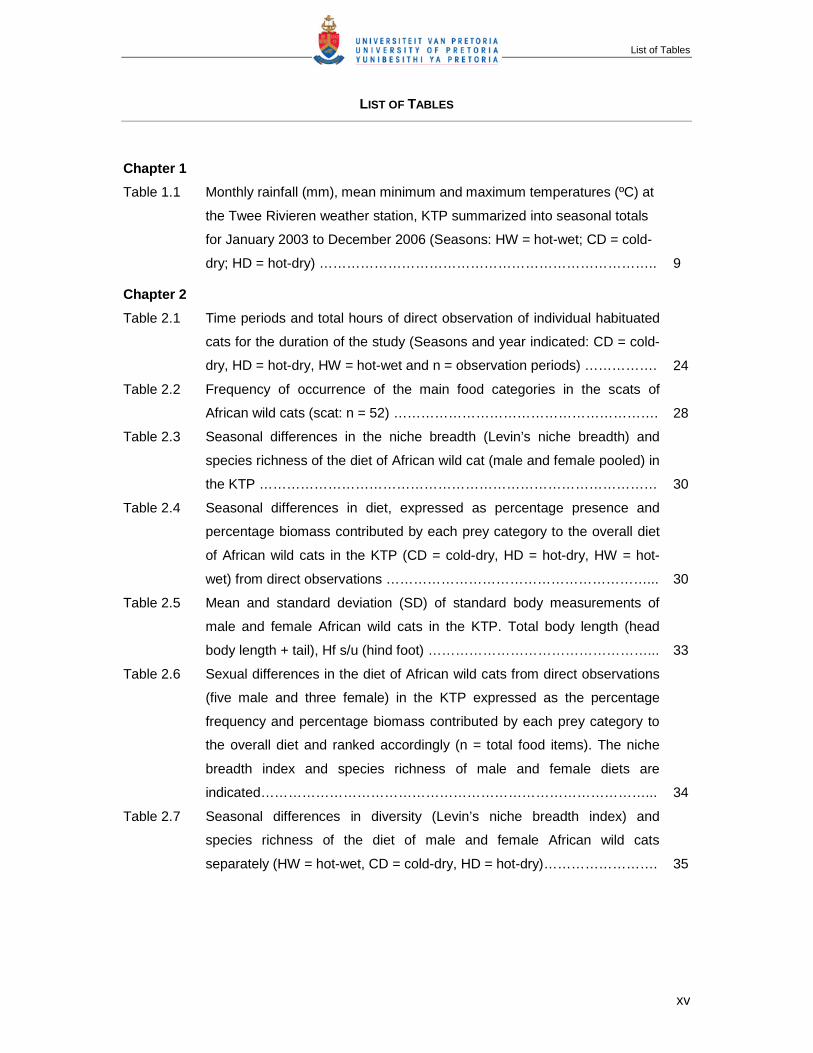
LIST OF TABLES
Chapter 1
Table 1.1 Monthly rainfall (mm), mean minimum and maximum temperatures (ºC) at
the Twee Rivieren weather station, KTP summarized into seasonal totals
for January 2003 to December 2006 (Seasons: HW = hot-wet; CD = cold-
dry; HD = hot-dry) ………………………………………………………………..
9
Chapter 2
Table 2.1 Time periods and total hours of direct observation of individual habituated
cats for the duration of the study (Seasons and year indicated: CD = cold-
dry, HD = hot-dry, HW = hot-wet and n = observation periods) …………….
24
Table 2.2 Frequency of occurrence of the main food categories in the scats of
African wild cats (scat: n = 52) ………………………………………………….
28
Table 2.3 Seasonal differences in the niche breadth (Levin’s niche breadth) and
species richness of the diet of African wild cat (male and female pooled) in
the KTP ……………………………………………………………………………
30
Table 2.4 Seasonal differences in diet, expressed as percentage presence and
percentage biomass contributed by each prey category to the overall diet
of African wild cats in the KTP (CD = cold-dry, HD = hot-dry, HW = hot-
wet) from direct observations …………………………………………………...
30
Table 2.5 Mean and standard deviation (SD) of standard body measurements of
male and female African wild cats in the KTP. Total body length (head
body length + tail), Hf s/u (hind foot) …………………………………………...
33
Table 2.6 Sexual differences in the diet of African wild cats from direct observations
(five male and three female) in the KTP expressed as the percentage
frequency and percentage biomass contributed by each prey category to
the overall diet and ranked accordingly (n = total food items). The niche
breadth index and species richness of male and female diets are
indicated…………………………………………………………………………...
34
Table 2.7 Seasonal differences in diversity (Levin’s niche breadth index) and
species richness of the diet of male and female African wild cats
separately (HW = hot-wet, CD = cold-dry, HD = hot-dry)…………………….
35
List of Tables
xvi
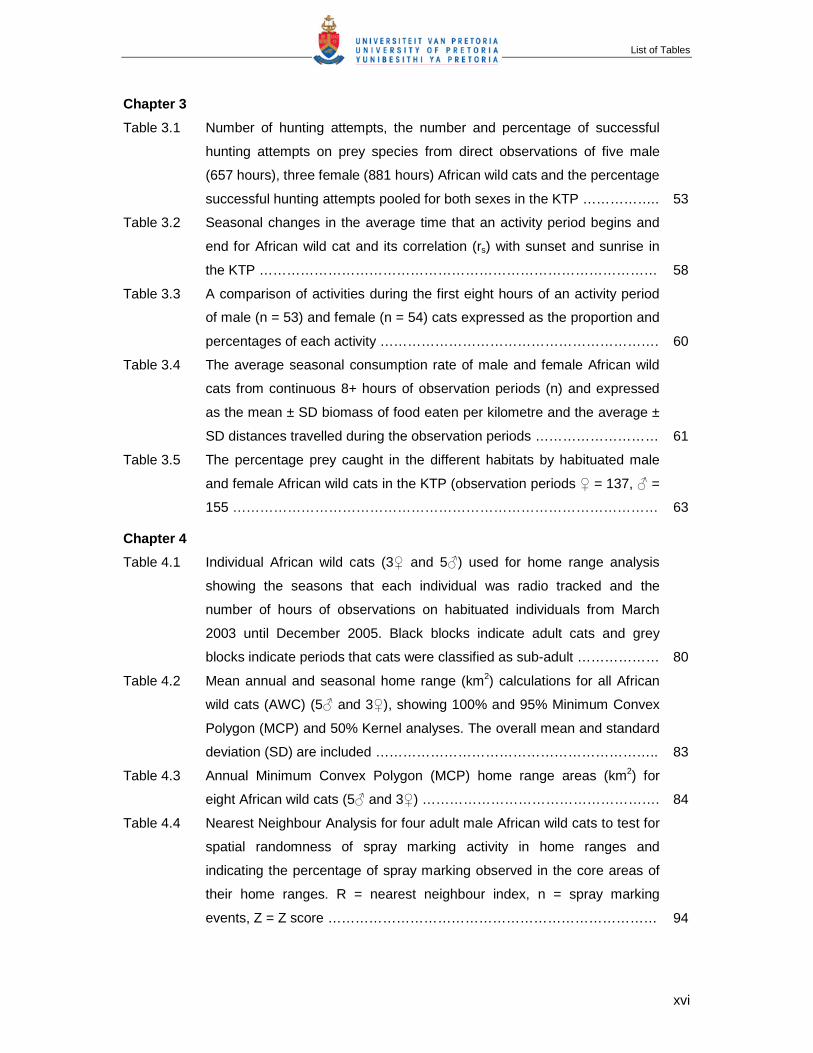
Chapter 3
Table 3.1 Number of hunting attempts, the number and percentage of successful
hunting attempts on prey species from direct observations of five male
(657 hours), three female (881 hours) African wild cats and the percentage
successful hunting attempts pooled for both sexes in the KTP ……………..
53
Table 3.2 Seasonal changes in the average time that an activity period begins and
end for African wild cat and its correlation (rs) with sunset and sunrise in
the KTP ……………………………………………………………………………
58
Table 3.3 A comparison of activities during the first eight hours of an activity period
of male (n = 53) and female (n = 54) cats expressed as the proportion and
percentages of each activity …………………………………………………….
60
Table 3.4 The average seasonal consumption rate of male and female African wild
cats from continuous 8+ hours of observation periods (n) and expressed
as the mean ± SD biomass of food eaten per kilometre and the average ±
SD distances travelled during the observation periods ………………………
61
Table 3.5 The percentage prey caught in the different habitats by habituated male
and female African wild cats in the KTP (observation periods ♀ = 137, ♂ =
155 …………………………………………………………………………………
63
Chapter 4
Table 4.1 Individual African wild cats (3♀ and 5♂) used for home range analysis
showing the seasons that each individual was radio tracked and the
number of hours of observations on habituated individuals from March
2003 until December 2005. Black blocks indicate adult cats and grey
blocks indicate periods that cats were classified as sub-adult ………………
80
Table 4.2 Mean annual and seasonal home range (km2) calculations for all African
wild cats (AWC) (5♂ and 3♀), showing 100% and 95% Minimum Convex
Polygon (MCP) and 50% Kernel analyses. The overall mean and standard
deviation (SD) are included ……………………………………………………..
83
Table 4.3 Annual Minimum Convex Polygon (MCP) home range areas (km2) for
eight African wild cats (5♂ and 3♀) …………………………………………….
84
Table 4.4 Nearest Neighbour Analysis for four adult male African wild cats to test for
spatial randomness of spray marking activity in home ranges and
indicating the percentage of spray marking observed in the core areas of
their home ranges. R = nearest neighbour index, n = spray marking
events, Z = Z score ………………………………………………………………
94
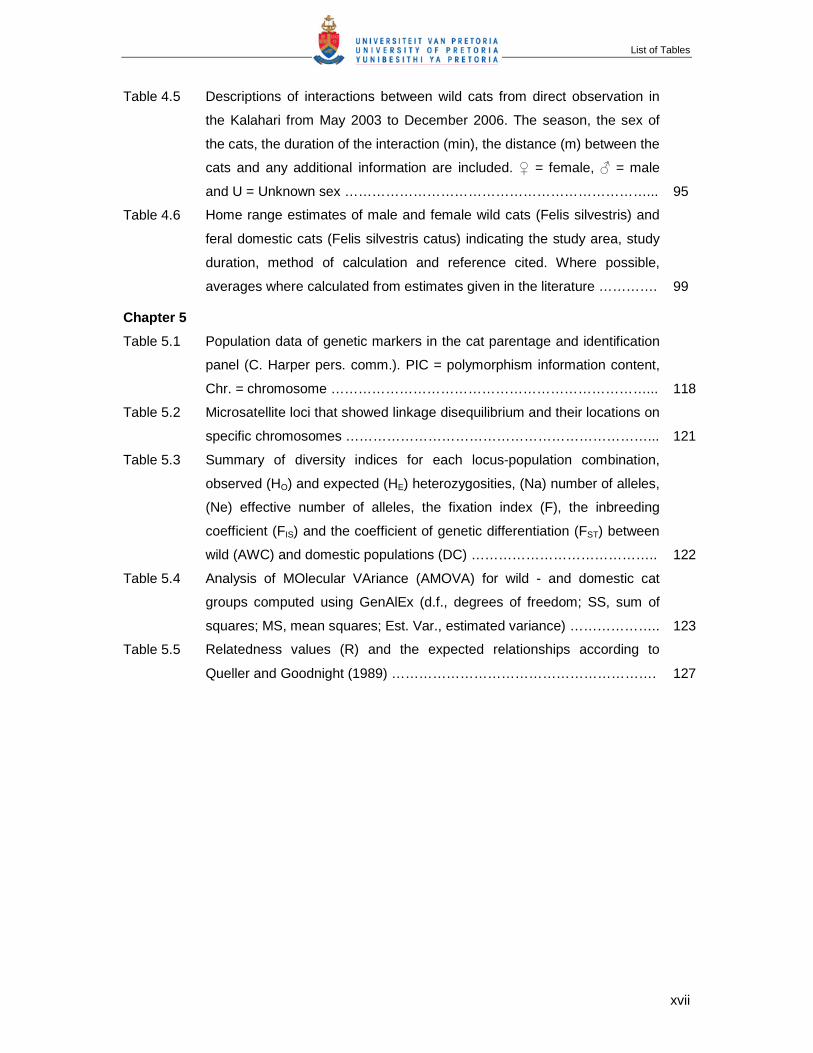
List of Tables
xvii
Table 4.5 Descriptions of interactions between wild cats from direct observation in
the Kalahari from May 2003 to December 2006. The season, the sex of
the cats, the duration of the interaction (min), the distance (m) between the
cats and any additional information are included. ♀ = female, ♂ = male
and U = Unknown sex …………………………………………………………...
95
Table 4.6 Home range estimates of male and female wild cats (Felis silvestris) and
feral domestic cats (Felis silvestris catus) indicating the study area, study
duration, method of calculation and reference cited. Where possible,
averages where calculated from estimates given in the literature ………….
99
Chapter 5
Table 5.1 Population data of genetic markers in the cat parentage and identification
panel (C. Harper pers. comm.). PIC = polymorphism information content,
Chr. = chromosome ……………………………………………………………...
118
Table 5.2 Microsatellite loci that showed linkage disequilibrium and their locations on
specific chromosomes …………………………………………………………...
121
Table 5.3 Summary of diversity indices for each locus-population combination,
observed (HO) and expected (HE) heterozygosities, (Na) number of alleles,
(Ne) effective number of alleles, the fixation index (F), the inbreeding
coefficient (FIS) and the coefficient of genetic differentiation (FST) between
wild (AWC) and domestic populations (DC) …………………………………..
122
Table 5.4 Analysis of MOlecular VAriance (AMOVA) for wild - and domestic cat
groups computed using GenAlEx (d.f., degrees of freedom; SS, sum of
squares; MS, mean squares; Est. Var., estimated variance) ………………..
123
Table 5.5 Relatedness values (R) and the expected relationships according to
Queller and Goodnight (1989) ………………………………………………….
127
Chapter 1: General introduction
1
CHAPTER 1
General introduction
1. The African wild cat, Felis silvestris (Forster, 1780) and synonym Felis silvestris
cafra (Desmarest, 1822): an overview
The African wild cat (Felis silvestris) has a wide distributional range (Fig. 1.1). However there
is a paucity of information on all aspects of its biology. Since the wild cat is the ancestor of
the domestic cat and they can interbreed and produce fertile offspring, hybridisation with the
domestic form may be the biggest threat to the survival of wild cats today (Nowell & Jackson,
1996).
1.1 Phylogenetic relations and taxonomic classification
Felid classification has a long and complex history fluctuating between extremes of “splitting”
and “lumping” of the species (see historical review by Werdelin in Nowell & Jackson, 1996).
Even on the subspecies level there has been considerable debate between the traditional
taxonomic approach and the more contemporary approach using knowledge from population
biology and genetics (Nowell & Jackson, 1996).
The recent revolution in sequencing of genomes and new technologies to probe DNA has
lead to the development of valuable new tools and methods for investigating phylogenetic
relationships. Consequently, the first clearly resolved Feliday family tree has only recently
been constructed (Johnson, Eizirik, Pecon-Slattery, Murphy, Antunes, Teeling & O’Brien,
2006, O’Brien & Johnson, 2007). The 37 felid species were grouped into eight lineages by
molecular analysis, consistent with observations that lineages shared morphological,
biological, physiological characteristics found only in their group. The recent findings suggest
that all modern cats are descended from one of several Pseudaelurus species that lived in
Asia around 11 million years ago (O’Brien & Johnson, 2007). The eight lineages that are
recognised are:
(i) the ‘Panthera lineage’ that give rise to the medium and large cats such as lion,
tiger, jaguar, leopard and snow leopards,
(ii) the ‘Bay cat lineage’ including the Bay cat, Asian golden cat and the Marbled cat,
(iii) the ‘Caracal lineage’ including the caracal, African golden cat and the serval,
(iv) the ‘Ocelot lineage’ including the ocelot, margay, Andean mountain cat, Pampas
cat, Geoffroy’s cat, kodkod and the tigrina,
(v) the ‘Lynx lineage’ consisting of the Iberian, Eurasian and Canada lynx and
bobcat,
Chapter 1: General introduction
2
(vi) the ‘Puma lineage’ including the puma, jaguarundi and African cheetah,
(vii) the ‘Asian leopard cat lineage’ consists of the small pallas cat, rusty spotted cat,
Asian leopard cat, fishing cat and the flat headed cat,
(viii) the ‘Domestic cat lineage’ including the jungle cat, black-footed cat, desert cat,
Chinese desert cat, African wild cat, European wild cat and the domestic cat.
The general classification for the wild cat (Felis silvestris) in this study follows Driscoll’s
publications where 1,000 wildcats and domestic cats were analysed in order to determine
which subspecies of wild cat gave rise to the domestic cat. Five clusters were identified as
follows: (i) the Middle Eastern wild cat, Felis silvestris lybica and the domestic cat, F. s.
catus, (ii) the Central Asian wild cat, F.s. ornata, (iii) the Southern African wild cat, F.s. cafra,
(iv) the European wild cat, F.s. silvestris, and (v) the Chinese mountain cat, F.s. bieti
(Driscoll, Menotti-Raymond, Roca, Hupe, Johnson, Geffen, Harley, Delibes, Pontier,
Kitchener, Yamaguchi, O’Brien, & Macdonald, 2007, Driscoll, Clutton-Brock, Kitchener &
O’Brien, 2009).
Figure 1.1 The geographical distribution of the African wild cat on the African continent
(data from Stuart & Stuart as presented in Wilson & Reeder, 2005)
Chapter 1: General introduction
3
1.2 Geographical range
The African wild cat has a large geographic distribution throughout the African continent and
is only absent in the tropical forests and true deserts (Nowell & Jackson, 1996) (Figure 1.1).
It is described as the most common small felid in many parts of its range (Kingdon, 1977;
Smithers, 1983; Stuart, 1981) and has a very wide habitat tolerance (Nowell & Jackson,
1996). Throughout its range it requires cover and protection such as rocky hillsides, bushes,
dwarf shrubs and tall grasses in which to hide during the day (Smithers, 1983). In the semi
desert and open areas such as the Kalahari they use isolated stands of Acacia scrub,
Galenia africana and dense vegetation or the branches of camelthorn (Acacia erioloba)
trees. If adequate cover is not available they will use holes in the ground (aardvark holes),
roots of trees, piles of rocks, crevices and riverine under bush. Wild cat density is expected
to vary widely with prey availability and home ranges may vary between individuals and
regions (Nowell & Jackson, 1996).
1.3 Domestication of wild cats
The domestic cat is perhaps the best known and most numerous pet around the world
(Kitchener, 1991; Clutton-Brock, 1999; Vigne, Guilaine, Debue, Haye & Gérard, 2004;
O’Brien & Johnson, 2007; Driscoll et al. 2009). Scientists believed that domestication
originated in Egypt around 3,600 years ago (Randi & Randi 1991; Nowell & Jackson, 1996;
Clutton-Brock, 1999) and some researchers had even proposed that domestication occurred
at a number of different locations (Driscoll et al. 2009). Genetic and archaeological
discoveries over the last five years generated fresh insites into the ancestory of the domestic
house cat and how their relationship with humans has evolved (Johnson et al. 2006; Driscoll
et al. 2007; O’Brien & Johnson, 2007). Results revealed five clusters of wildcats and grouped
the domestic cat with only one of these clusters which meant that domestic cats arose from a
single location in the Middle East (Driscoll et al. 2007). The earliest evidence of cats
associated with humans comes from deposits in Cyprus determined to be 9,500 years old
(Vigne et al. 2004). It appears that cats were being tamed just as humankind was
establishing the first settlements in part of the Middle East known as the Fertile Crescent.
Propbably the most interesting question is why cats became domesticated in the first place?
Cats in general are unlikely candidates from domestication, since they are solitary hunters
that defend their home ranges from other cats of the same sex and they are obligate
carnivores. However the early settlements in the Fertile Crescent during the Neolithic period
(9,000 – 10,000 years ago) created a completely new environment with the first grain stores
from Israel. These new environments, as well as the increase in trash heaps around villages
attracted rodents and consequently lured the cats closers to human settlements. Over time

Chapter 1: General introduction
4
these cats became tolerant of living in a human dominated environment. However the
competition among cats would also influence their evolution and limit how tame they
become. Until today most domesticated cats remain excellent hunters and can fend for
themselves.
Since these wildcats were small people certainly didn’t fear them and they might even have
encouraged cats to stay around and keep rodent pests low. Today there are more than 600
million cats around the world. The Cat Fancier’s Assocciation and the International Cat
Association recognise nearly 60 breeds of domestic cats. There are just a few genes that
account for the differences in coat color, fur length and texture; therefore the genetic
variation between the domestic cat breeds is very slight. Domestic cats can still interbreed
with wildcats and this might prove the biggest threat to the wildcat today (Nowell & Jackson,
1996).
1.4 Conservation status of the African wild cat
According to IUCN classification wild cats are listed as Least Concern, with the exception of
the Scottish wild cat, F. s. grampia, which is classified as vulnerable and restricted to
Scotland. African wild cats (F. silvestris) are not protected over most of their range (CITES
Appendix II). Indeed, they are the most abundant of the felid species; however, no density
estimates are available. Threats such as habitat destruction, persecution and road kills are
widespread for all felids (Nowell & Jackson, 1996), however, the major concern regarding
wild cats is their ability to freely interbreed with domestic cats and produce fertile offspring.
Hybridisation, especially in the north of their range where the domestication process of cats
started, has been recorded for a long period (Nowell & Jackson, 1996) and the presence of
feral domestic cats throughout their range is enhancing the risk of admixture events. Feral
male cats may have a competitive advantage over male wild cats due to their larger size and
higher densities (Mendelssohn, 1989). Smithers (1983) recorded that the distinctive
characteristics of African wild cats, such as the long legs and reddish-backed ears, are lost in
captive bred hybrids and that it is becoming more difficult to find pure-bred African wild cats
near human settlements.
2. This study: The African Wild Cat Project
This study was initiated by the Carnivore Conservation Group of the Endangered Wildlife
Trust and involved an intensive field-based research study focussed on the conservation
genetics, behavioural ecology and ecological role of the African wild cat in the southern
Kalahari. Three broad research topics were investigated:
Chapter 1: General introduction
5
1. The Behavioural Ecology of the African wild cat
Academici with focussed and spesialised research topics as well as the difficulty in studying
the behaviour of small, nocturnal and elusive animals lead to a paucity of information on the
natural history of many small felids (Nowell & Jackson, 1996). Knowledge of its natural
history is imperative for the conservation of the species. First, should management initiatives
be required (such as control of feral cats in or close to conservation areas), it is important to
understand the basic ecological role and social system of the wild cat in a natural ecosystem
(Caro & Durant, 1994; Komdeur & Deerenberg, 1997). As this study is the first field study on
the species the results could, in the absence of more specific studies, be applied across its
distribution range and be of considerable value to conservation of the species as a whole.
Secondly, natural history is a subject that fascinates many people and therefore information
on the life history patterns of the ancestor of the domestic cat has wide interest and appeal.
2. Social Evolution in the African wild cat
The evolution of social systems in carnivores is an interesting topic. With the exception of the
lion (Panthera leo) and cheetah (Acinonyx jubatus), the members of the cat family (Felidae)
are solitary creatures (Poole, 1985; Packer, 1986; Sunquist & Sunquist, 2002). Feral
domestic cats have been found to form colonies in the presence of clumped, rich food
resources, while remaining solitary where prey is more evenly and thinly distributed (Dards,
1983; Fitzgerald & Karl, 1986; Weber & Dailly, 1998). In captivity female African wild cats
have been observed to assist mothers in provisioning of young with food (Smithers, 1983), a
behaviour also seen in feral domestic cat colonies, but not in any other cat species. The
African wild cat is a solitary felid (Smithers, 1983; Sunquist & Sunquist, 2002), however, any
social interactions would be fascinating to discover.
Solitary behaviour in carnivores indicates that factors are present that select against
cooperative behaviour (i.e. when two or more animals cooperate to rear young, forage,
achieve matings and defend against predators) and thus promote solitary living. The main
factors are: prey characteristics and hunting mode (Sandell, 1989). Predators that take
smaller prey than themselves (such as wildcats) can almost always subdue the prey alone
and consume the whole prey quickly. Thus the presence of conspecifics in the immediate
surroundings will almost always have a negative effect on foraging efficiency through
disturbance or the depletion of the local food resource. However, domestic cats in
environments where food and shelter are in abundance show strong evidence of sociality
(Macdonald, 1983; Fitzgerald & Karl, 1986). It is suggested that domestication of cats
increased selection for grouping and this characteristic has been retained in populations of
feral cats (Liberg, 1980). Any social behaviour in wildcats would indicate that certain natural
Chapter 1: General introduction
6
conditions, such as high prey abundances, may favour the development of cooperative
behaviour in the wild.
Solitary species are reported to show signs of ‘kin-clustering’ in dispersion patterns (Clarke,
1978; Jones, 1984) and daughters may frequently demonstrate natal philopatry (Waser &
Jones, 1983). In solitary carnivores male-biased dispersal has been demonstrated for
example in black bears, Ursus americanes (Rogers, 1987; Schenk, 1994), tiger, Panthera
tigris (Smith, McDougal & Sunquist, 1987), raccoons, Procyon lotor (Ratnayeke, Tuskan &
Pelton, 2002) and female natal philopatry has been demonstrated in bobcats, Lynx rufus
(Janečka, Blankenship, Hirth, Tewes, Kilpatrick & Grassman, 2004), swift fox, Vulpes velox
(Kitchen, Gese, Waits, Karki & Schauster, 2005) and desert puma, Puma concolor (Logan &
Sweanor, 2001). As the southern Kalahari has a high wild cat density and conditions are very
favourable for the species, it presented an excellent opportunity to investigate this interesting
and important topic of sociality and social evolution in the ancestor of the domestic cat.
3. The Conservation Genetics of the African wild cat
The southern Kalahari is one of the most isolated and undeveloped regions in southern
Africa and African wild cats are known to be abundant in the area. The Kgalagadi
Transfrontier Park (KTP) is also one of the largest conservation areas in the region and
therefore the area was identified as important for the maintenance of a genetically pure wild
cat population. However the genetic status of this population had to be established to
determine the genetic purity, so that, if required, a management strategy can be drawn up
and implemented to ensure the long-term integrity of this population. The identification of a
genetically pure wild cat population is imperative for future assessments of the extent of
hybridisation and introgression, especially for areas where African wild cats occur in close
proximity to domestic and feral cats.
2.1 The study site
The study was conducted in the Kgalagadi Transfrontier Park (KTP), including the Kalahari
Gemsbok National Park, South Africa and the Gemsbok National Park in Botswana. The
main study area was along the dry Nossob Riverbed in the vicinity of the Leeudril waterhole
(26º28’17.7 S, 20º36’45.2 E) (Figure 1.2).
The KTP is a 37,000 km2 area in the semi arid southern Kalahari system, which forms part of
the Kalahari dune veld Bioregion, Savanna Biome (Mucina & Rutherford, 2006). Rainfall is
unpredictable and irregular with summer and autumn rainfall and dry winters. Large
temperature fluctuations, both daily and seasonal, are characteristics of a semi-desert area.
Chapter 1: General introduction
7
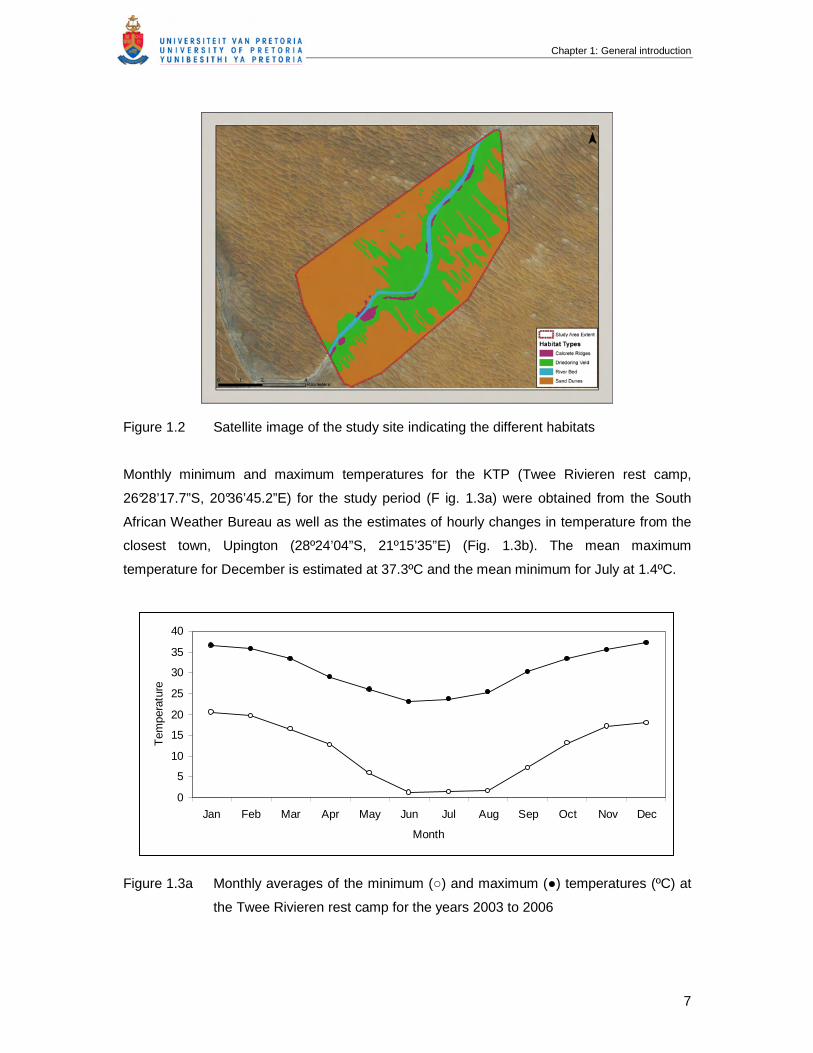
Figure 1.2 Satellite image of the study site indicating the different habitats
Monthly minimum and maximum temperatures for the KTP (Twee Rivieren rest camp,
26°28’17.7”S, 20°36’45.2”E) for the study period (F ig. 1.3a) were obtained from the South
African Weather Bureau as well as the estimates of hourly changes in temperature from the
closest town, Upington (28º24’04”S, 21º15’35”E) (Fig. 1.3b). The mean maximum
temperature for December is estimated at 37.3ºC and the mean minimum for July at 1.4ºC.
0
5
10
15
20
25
30
35
40
Jan Feb Mar Apr May Jun Jul Aug Sep Oct Nov Dec
Month
Tem
pera
ture
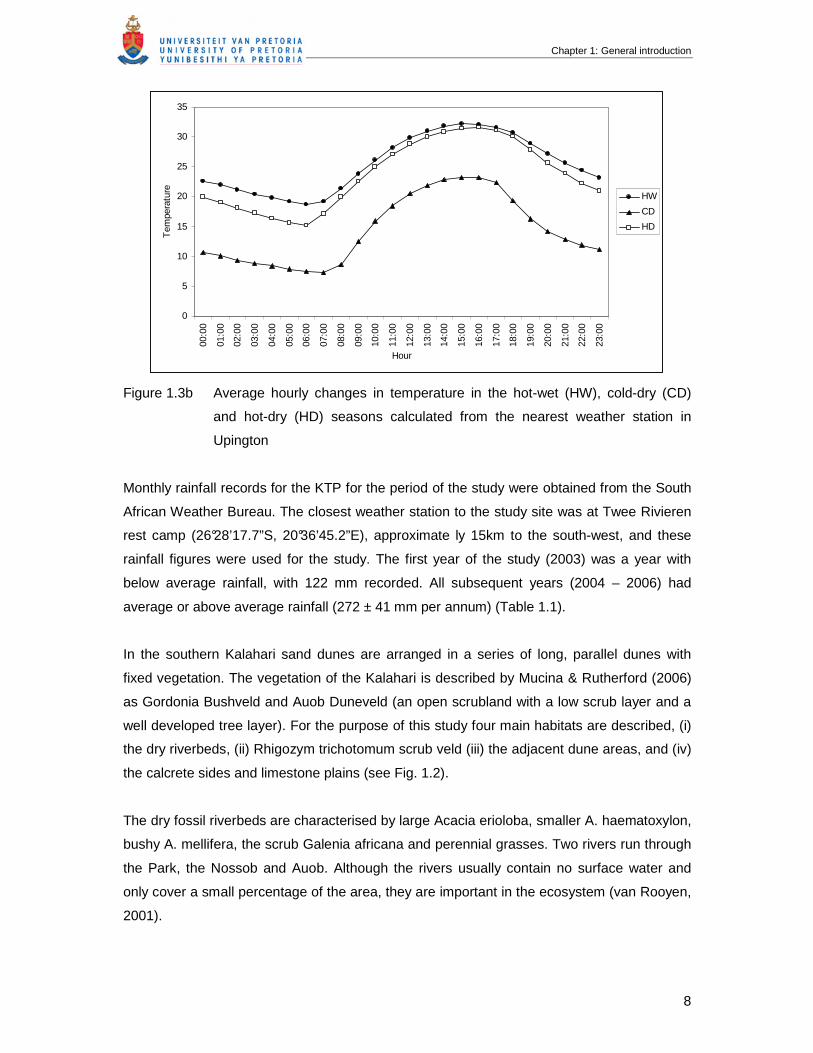
Figure 1.3a Monthly averages of the minimum (○) and maximum (●) temperatures (ºC) at
the Twee Rivieren rest camp for the years 2003 to 2006
Chapter 1: General introduction
8
0
5
10
15
20
25
30
35
00:0
0
01:0
0
02:0
0
03:0
0
04:0
0
05:0
0
06:0
0
07:0
0
08:0
0
09:0
0
10:0
0
11:0
0
12:0
0
13:0
0
14:0
0
15:0
0
16:0
0
17:0
0
18:0
0
19:0
0
20:0
0
21:0
0
22:0
0
23:0
0
Hour
Tem
pera
ture
HW
CD
HD
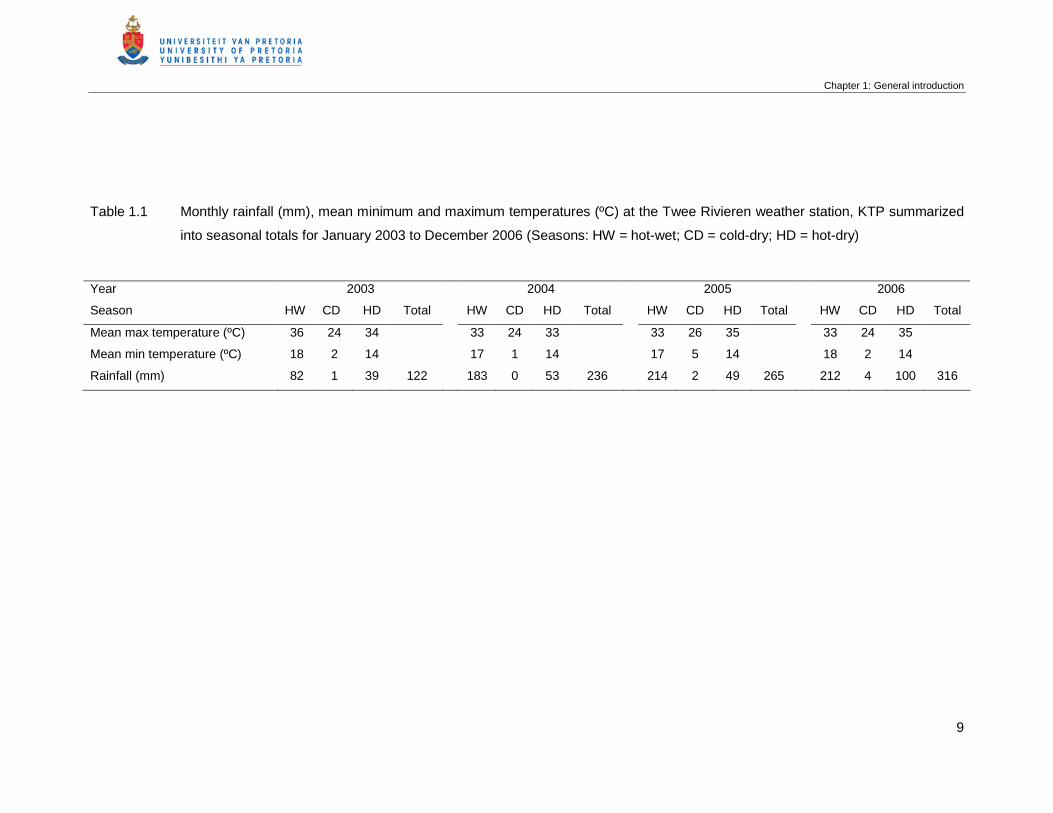
Figure 1.3b Average hourly changes in temperature in the hot-wet (HW), cold-dry (CD)
and hot-dry (HD) seasons calculated from the nearest weather station in
Upington
Monthly rainfall records for the KTP for the period of the study were obtained from the South
African Weather Bureau. The closest weather station to the study site was at Twee Rivieren
rest camp (26°28’17.7”S, 20°36’45.2”E), approximate ly 15km to the south-west, and these
rainfall figures were used for the study. The first year of the study (2003) was a year with
below average rainfall, with 122 mm recorded. All subsequent years (2004 – 2006) had
average or above average rainfall (272 ± 41 mm per annum) (Table 1.1).
In the southern Kalahari sand dunes are arranged in a series of long, parallel dunes with
fixed vegetation. The vegetation of the Kalahari is described by Mucina & Rutherford (2006)
as Gordonia Bushveld and Auob Duneveld (an open scrubland with a low scrub layer and a
well developed tree layer). For the purpose of this study four main habitats are described, (i)
the dry riverbeds, (ii) Rhigozym trichotomum scrub veld (iii) the adjacent dune areas, and (iv)
the calcrete sides and limestone plains (see Fig. 1.2).
The dry fossil riverbeds are characterised by large Acacia erioloba, smaller A. haematoxylon,
bushy A. mellifera, the scrub Galenia africana and perennial grasses. Two rivers run through
the Park, the Nossob and Auob. Although the rivers usually contain no surface water and
only cover a small percentage of the area, they are important in the ecosystem (van Rooyen,
2001).
Chapter 1: General introduction
9
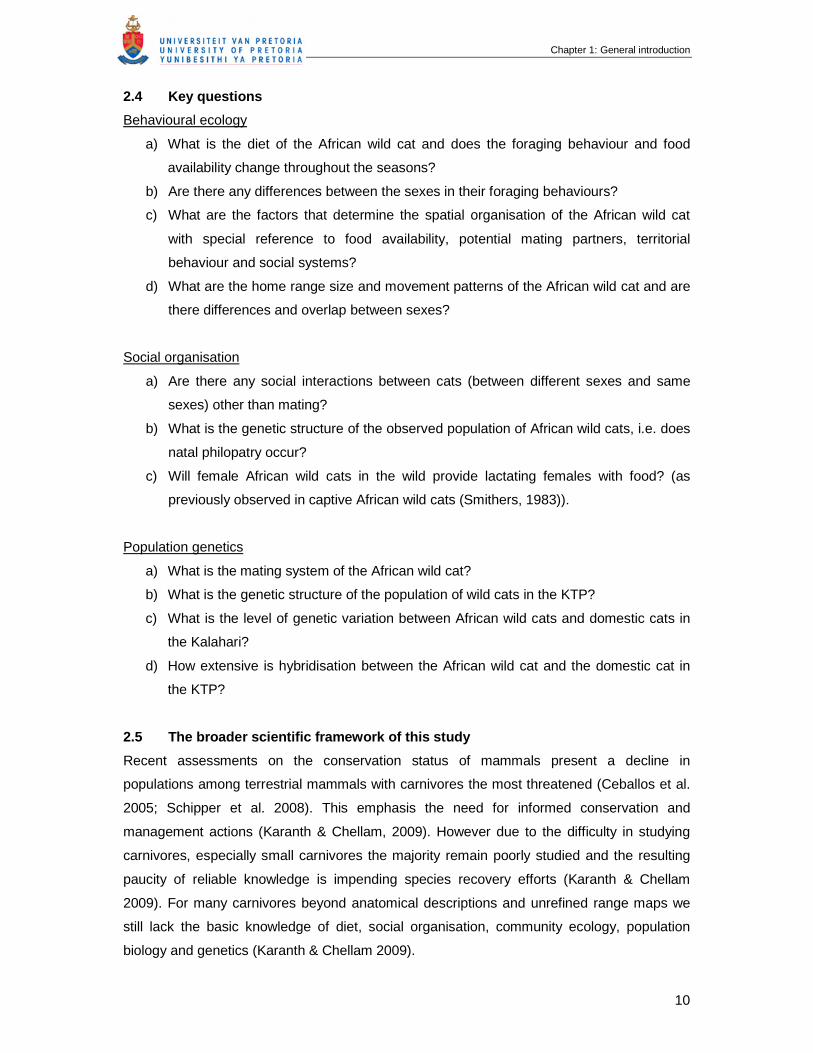
Table 1.1 Monthly rainfall (mm), mean minimum and maximum temperatures (ºC) at the Twee Rivieren weather station, KTP summarized
into seasonal totals for January 2003 to December 2006 (Seasons: HW = hot-wet; CD = cold-dry; HD = hot-dry)
Year 2003 2004 2005 2006
Season HW CD HD Total HW CD HD Total HW CD HD Total HW CD HD Total
Mean max temperature (ºC) 36 24 34 33 24 33 33 26 35 33 24 35
Mean min temperature (ºC) 18 2 14 17 1 14 17 5 14 18 2 14
Rainfall (mm) 82 1 39 122 183 0 53 236 214 2 49 265 212 4 100 316

Chapter 1: General introduction
9
Adjacent to the riverbeds, large limestone plains compacted with pink to white sands are
found. This is a scrub savanna, characterised by scattered camel thorn (A. erioloba) trees
and dominated by dense dwarf shrubs of Rhigozum trichotomum (driedoring), Monechma
incanum (blouganna), Aptosimum albomarginatum and dominant grass species such as the
perennial short bushman grass (Stipagrostis obtusa), Kalahari sour grass (Schmidtia
kalahariensis), tall bushman grass (Stipagrostis ciliata) and silky bushman grass
(Stipagrostis uniplumis). The calcrete ridges are sloping sides next to the riverbed.
The dune habitat consists of loose sand and is dominated by tall perennial grasses such as
Stipagrostis amabilis, Eragrostis trichophora, and E. lehmanniana. Scrub species such as the
dune bush (Crotalaria spartioides), lucern bush (Hermannia tomentosa) and the gemsbok
cucumber (Acanthosicyos naudinianus) dominate the dune areas. Occasional smaller
camelthorn and grey camelthorn trees, as well as shepherd’s trees (Boscia albitrunca) are
present. For more detailed descriptions of the vegetation see Mucina & Rutherford (2006).
2.2 Rationale
In spite of its wide range and popular profile no field study on the African wild cat has been
published and there is at paucity of knowledge on the ecology and behaviour of the species.
There is a need to understand its basic biology and ecology, both from the conservation and
scientific viewpoints. Although not endangered, the African wild cat is generally recognized
as the ancestor of the domestic cat and hybridisation is thought to be sufficiently extensive
between these two forms as to severely threaten its status (Nowell & Jackson, 1996). A
recent study in southern Africa found that the African wild cat and the domestic cat are
indeed genetically distinct, although the level of genetic introgression appears lower than
previously thought (samples were collected from cats in captivity and road kills, however,
possible hybrids were excluded) (Wiseman, O’Ryan & Harley, 2000). This enhances the
conservation status of the African wild cat and emphasises the need to minimise potential
contact with feral and domestic cats. The Kalahari population was not included in the
Wiseman et al. (2000) study, yet in the early 1980’s in an area more than 75 km from the
nearest domestic cat population, a black and white specimen believed to be a hybrid was
seen (G. Mills, pers. obs.). Therefore, a study combining both field and behavioural
observations with molecular genetics presented the ideal research opportunity to increase
our knowledge and conservation attempts on the African wild cat in the southern Kalahari.
2.3 Objective
Broadly speaking, the study focused on the conservation genetics, behavioural ecology and
ecological role of the African wild cat in the southern Kalahari.
Chapter 1: General introduction
10
2.4 Key questions
Behavioural ecology
a) What is the diet of the African wild cat and does the foraging behaviour and food
availability change throughout the seasons?
b) Are there any differences between the sexes in their foraging behaviours?
c) What are the factors that determine the spatial organisation of the African wild cat
with special reference to food availability, potential mating partners, territorial
behaviour and social systems?
d) What are the home range size and movement patterns of the African wild cat and are
there differences and overlap between sexes?
Social organisation
a) Are there any social interactions between cats (between different sexes and same
sexes) other than mating?
b) What is the genetic structure of the observed population of African wild cats, i.e. does
natal philopatry occur?
c) Will female African wild cats in the wild provide lactating females with food? (as
previously observed in captive African wild cats (Smithers, 1983)).
Population genetics
a) What is the mating system of the African wild cat?
b) What is the genetic structure of the population of wild cats in the KTP?
c) What is the level of genetic variation between African wild cats and domestic cats in
the Kalahari?
d) How extensive is hybridisation between the African wild cat and the domestic cat in
the KTP?
2.5 The broader scientific framework of this study
Recent assessments on the conservation status of mammals present a decline in
populations among terrestrial mammals with carnivores the most threatened (Ceballos et al.
2005; Schipper et al. 2008). This emphasis the need for informed conservation and
management actions (Karanth & Chellam, 2009). However due to the difficulty in studying
carnivores, especially small carnivores the majority remain poorly studied and the resulting
paucity of reliable knowledge is impending species recovery efforts (Karanth & Chellam
2009). For many carnivores beyond anatomical descriptions and unrefined range maps we
still lack the basic knowledge of diet, social organisation, community ecology, population
biology and genetics (Karanth & Chellam 2009).
Chapter 1: General introduction
11
The African wild cat study was the first field study on the behavioural ecology of wildcats in
southern Africa. The study aimed to address the areas of behavioural ecology where data
were previously lacking. The results could in the absence of other studies be applied across
distributional ranges and in different scales. Firstly, a thorough description of natural wild cat
feeding habits, foraging behaviour, spatial organisation and reproduction are important for
wild cat conservation in general. The understanding of African wild cat behaviour can assist
in conservation actions for the species across distributional ranges.
Secondly, the ecological role of small or mesopredators in communities has received
considerable attention in recent years (Estes, Crooks & Holt, 2001; Roemer, Gompper & Van
Valkenburgh, 2009; Prugh, Stoner, Epps, Bean, Ripple, Laliberte & Brashares, 2009).
Studies of more complex communities show that mesocarnivores have strong effects on their
prey species, however their impact on other aspects of the community is less obvious, and
bottom-up control of prey abundance may limit the potential for strong top-down indirect
effects (Roemer et al. 2009). The results from this study in terms of predator-prey
interactions, the effect of seasonal changes on foraging and reproductive behaviour can aid
in the understanding of the role of the African wild cat as a small mesopredator in
ecosystems.
Thirdly, the majority of natural history studies have been done in protected areas (including
this study) and results can be compared with a large body of data on all aspects of the
ecosystem. However it is important to recognise that many areas of cat distribution are in
disturbed and unprotected habitats. Therefore studies outside protected areas are also
important and needed. In the Kalahari several larger predators (lions, leopards, cheetahs and
hyenas) are present however the role of wild cats can change in the absence of an apex
predator. In many cases mesopredators increase in abundance in the absence of larger
predators and often leads to a negative cascading effect on prey species (Berger, Gese &
Berger, 2008). The ways in which wild cats adjust to different forms of habitat modification
and disturbances are important to understand wild cat behaviour outside conservation areas.
This could be very important in the African wild cat where they are perceived as “problem
animals” to farmers with small stock. Information and results from this study could serve as
benchmark data and assist in understanding general wild cat behaviour outside protected
areas. In these areas behaviour such as activity patterns and predation, are likely to differ
substantially from inside protected areas and understanding these differences is the key to
appreciating the scope of species adaptability and evaluates probability of future survival of
wildcats.
Chapter 1: General introduction
12
Wild cat genetic analyses has recently enhanced our understanding of wild cat phylogeny
and the ancestry of the domestic cat (Johnson et al. 2006; Driscoll et al. 2007; Driscoll et al.
2009a; Driscoll et al. 2009b; O’Brien & Johnson 2009). The domestic cat is probably the
biggest threat to wild cats through hybridisation (Nowell & Johnson, 1996). In our study we
determined the genetic status of the Kalahari wild cat population and we concluded that the
population are genetically pure and admixture with neighbouring feral domestic cats is low.
Results from our study can be used as a reference collection to test samples from other
southern African wild cat populations.
The role of small carnivores in ecosystems may be far more important than previously
considered (Roemer et al. 2009). Available theoretical and empirical data suggest that in
many cases, mesocarnivores may be fundamentally important drivers of ecosystem
functions, structure or dynamics. Results from our study do not only describe the behaviour
of a small and elusive carnivore and therefore increase our knowledge and improve our
management actions for the conservation of a species, but also aid in the understanding of
the interactions and role they may play in ecosystems.
2.6 Overview of thesis
This thesis has been written in the form of separate papers for publication, following the
format of a publication in the Journal of Zoology (London). Therefore each chapter forms an
independent section with the study area and material and methods that might repeat and
overlap in consecutive chapters. The four data chapters are presented in the same
chronological order to answer the key questions as presented above. Appendix 1 is a
detailed description of the mark and capturing techniques and is also presented in a paper
format for publication (Herbst & Mills submitted). Appendix 5 is a copy of a comparative book
chapter that is currently in press.
This study can be divided into two parts: (i) The behavioural ecology of the African wild cat
(Chapters 2, 3 and 4) and (ii) the conservation genetics of the African wild cat (Chapter 5).
The collection of wild cat samples to extract DNA for the molecular analysis was an ongoing
process from the onset of the study until the end. Chapter 2 investigates the feeding ecology
of wild cats from the view of optimal foraging theory (Perry & Pianka, 1997). The diet was
determined through direct visual observations on eight habituated cats (three female and five
male) and the biomass and frequency of prey items were calculated. Seasonal variability as
well as sexual differences was recorded. The importance of food and prey availability was
investigated through seasonal surveys of prey abundances and scat analyses and compared
to our visual observations on the diet of the wild cats.

Chapter 1: General introduction
13
The foraging behaviour and activity patterns in male and female cats during the three
seasons (hot-wet, cold-dry and hot-dry) are described in detail in Chapter 3. What entails a
successful hunt, the hunting technique and the differences between sexes and their ability to
catch different prey sizes are discussed. African wild cat activity patterns, the distances
travelled, their time budgets and consumption rates are assessed. Differences in habitat
utilisation between male and female wild cats are investigated.
Chapter 4 assemble the ranging behaviour and social organisation between male and female
cats. Home range sizes and overlap are discussed in view of spacing patterns between male
and female cats to increase their fitness and reproductive output (Sandell, 1989). The
importance of prey abundances on the reproductive success and inter- and intraspecific
interactions are also discussed. Observations on reproductive behaviour and scent marking
activities are described.
In Chapter 5 we determined the genetic structure of our study population and compare that
with domestic cats close to our study site as well as a reference collection from the
Veterinary Genetics Laboratory at the University of Pretoria (Onderstepoort). We also
address the question of hybridisation and the conservation status of African wild cats in the
southern Kalahari. We combine behavioural observation of reproduction in Chapter 4 with
genetic data on relatedness and briefly discuss mating strategies in the African wild cat.
Finally Chapter 6 is included to give an overall synthesis of all the results and a general
conclusion of the study on the African wild cat in the southern Kalahari.
3. References
Berger, K.M., Gese, E.M. & Berger, J. (2008). Indirect effects and traditional trophic
cascades: A test involving wolves, coyotes and pronghorn. Ecology 89: 818-828.
Caro, T.M. & Durant, S.M. (1994). The importance of behavioural ecology for conservation
biology: examples from Serengeti carnivores. In Serengeti II: dynamics, management and
conservation of an ecosystem. Sinclair, A.R.E. & Arcese, P. (Eds.). University of Chicago
Press, Chicago.
Ceballos, G., Erlich, P.B., Soberon, J., Salazar, I. & Fay, J.P. (2005). Global mammal
conservation: What must we manage? Science 309: 603-607.
Chapter 1: General introduction
14
Clarke, A.B. (1978). Sex ratio and local resource competition in a prosimian primate. Science
201: 163-165.
Clutton-Brock, J.A. (1993). The animal that walks by itself. 1994 Yearbook of Science and
the Future. Chicago: Encyclopaedia Britannica.
Clutton-Brock, J.A. (1996). Competitors, Companions, Status Symbols, or Pests: A Review
of Human Associations with Other Carnivores. In Carnivore Behavior, Ecology, and
Evolution. Vol. 2. Gittleman, G.L. (Ed.). Comstock Publishing Associates, Cornell University
Press, New York.
Clutton-Brock, J.A. (1999). Natural History of Domesticated Mammals. Cambridge University
press, Cambridge.
Dards, (1983). The behaviour of dockyard cats: interactions of adult males. Appl. Anim.
Ethol. 10: 133-153.
Driscoll, C.A., Menotti-Raymond, M., Roca, A.L., Hupe, K., Johnson, W.E., Geffen, E.,
Harley, E., Delibes, M., Pontier, D, Kitchener, A.C., Yamaguchi, N., O’Brien, S.J. &
Macdonald, D. (2007). The Near Eastern Origin of Cat Domestication. Science 317: 519-523.
Driscoll, C.A., Clutton-Brock, J., Kitchener, A. & O’Brien, S.J. (2009a). The Taming of the
Cat. Sci. Am. 300: 68-75.
Driscoll, C.A., Macdonald, D.W. & O’Brien, S.J. (2009b). From wild animals to domestic pets,
an evolutionary view of domestication. PNAS 106: 9971-9978.
Estes, J., Crooks, K. & Holt, R. (2001). Ecological role of predators. S.A. Levin (Ed.)
Encyclopedia of Biodiversity. Vol. 4. Academic Press. USA.
Fitzgerald, B.M. & Karl, B.J. (1986). Home range of feral house cats (Felis catus L.) in forest
of the Orongorongo valley, Wellington, New Zealand. New Zeal. J Ecol. 9:71-81.
Hemmer, H. (1978). The evolutionary systematics of living Felidae: present status and
current problems. Carnivore 1: 71-79.
Chapter 1: General introduction
15
Janečka, J.E., Blankenship, T.L., Hirth, D.H., Tewes, M.E., Kilpatrick, C.W. & Grassman L.I.
(2004). Kinship and social structure of bobcats (Lynx rufus) inferred from microsatellite and
radio-telemetry data. J. Zool. (Lond). 269: 494-501.
Johnson, W.E., Eizirik, E., Pecon-Slattery, J., Murphy, W.J., Antunes, A., Teeling, E. O’Brien,
J.O. (2006). The Late Miocene Radiation of Modern Felidae: A Genetic Assessment. Science
311: 73-77.
Johnson, W.E. & O’Brien, S.J. (1997). Phylogenetic reconstruction of the Felidae using 16S
rRNA and NADH-5 mitochondrial genes. J. Mol. Evol. (Suppl. 1) 44: S98-S116.
Jones, T.W. (1984). Natal philopatry in bannertailed kangaroo rats. Behav. Ecol. Sociobiol.
15: 151-155.
Karanth, U.K. & Chellam, R. (2009). Carnivore conservation at the crossroads. Oryx 43: 1-2.
Kingdon, J. (1977). East African mammals: An atlas of evolution in Africa. Vol. 3(A).
Carnivores. Academic Press, New York.
Kitchen, A.M., Gese, E.M., Waits, L.P., Karki, S.M. & Schauster, E.R. (2005). Genetic and
spatial structure within a swift fox population. J. Anim. Ecol. 74: 1173-1181.
Kitchener, A. (1991). The Natural Historyof the Wild Cats. Comstock Associates, Ithaca, NY.
Komdeur, J. & Deerenberg, C. (1997). The importance of social behaviour studies for
conservation. In Behavioural approaches to conservation in the wild. Clemmons, J.R. &
Buchholz, R. (Eds.). Cambridge University Press, Cambridge.
Logan, K.A. & Sweanor, L.L. (2001). Desert puma: evolutionary ecology and conservation of
an enduring carnivore. Island Press, Washington, D.C.
Martin, L.D. (1989). Fossil history of the terrestrial Carnivora. In Carnivore behaviour,
ecology and evolution. Gittleman, J.L. (Ed.). Cornell University Press, NY.
Mendelssohn, H. (1989). Felids in Israel. Cat News 10: 2-4.
Chapter 1: General introduction
16
Mucina, L. & Rutherford, M.C. (2006). The vegetation of South Africa, Lesotho and
Swaziland. Strelitzia 19. South African National Biodiversity Institute, Pretoria.
Nowell, K. & Jackson, P. (1996). Wild cats. Status survey and conservation action plan.
IUCN, Gland.
O’Brien, J.O. & Johnson, S.J. (2007). The Evolution of CATS. Sci. Am. 297: 65-75.
Parcker, C. (1986). The ecology of sociality in felids. In Ecological aspects of social
evolution. Rubenstein, D.I. & Wrangham, R.W. (Eds.). Princeton University Press.
Perry, G. & Pianka, E.R. (1997). Animal foraging: past, present and future. Trends Ecol.
Evol. 12: 360-364.
Poole, T. (1985). Social behaviour in mammals. East Kilbride: Thomson Litho Ltd.
Prugh, L.R., Stoner, C.J., Epps, C.W., Bean, W.T., Ripple, W.J., Laliberte, A.S. & Brashares,
J.S. (2009). The Rise of the Mesopredator. Bioscience 59: 779-791.
Randi, E. & Ragni, B. (1991). Genetic variability and biochemical systematics of domestic
and wild cat populations (Felis silvestris: Felidae). J. Mammal. 72: 79-88.
Ratnayeke, S., Tuskan, G.A. & Pelton, M.R. (2002). Genetic relatedness and female spatial
organisation in a solitary carnivore, the raccoon, Procyon lotor. Mol. Ecol. 11: 1115-1124.
Roemer, G.W., Gompper, M.E. & Van Valkenberg, B. (2009). The Ecological Role of the
Mammalian Mesocarnivore. BioScience 59: 165-173.
Rogers, L.L. (1987). Effects of food supply and kinship on social behavior, movements, and
population growth of black bears in northeastern Minnesota. Wildlife Monogr. 97: 1-72.
Sandell, M. (1989). The mating tactics and spacing patterns of solitary carnivores. In
Carnivore behaviour, ecology and evolution (Vol. 1). Gittleman, J.L. (Ed). Chapman & Hall.
Schenk, A. (1994). Genetic relatedness, home range characteristics and mating patterns of
black bears (Ursus americanus) in northern Ontario, Canada. DPhil Thesis, University of
Waterloo, Waterloo, Ont.
Chapter 1: General introduction
17
Schipper, J., Chanson, J.S., Chiozza, F., Cox, N.A., Hoffmann, M., Katariya, V. et al. (2008).
The status of the world’s land and marine mammals: diversity, threat and knowledge.
Science 322: 225-230.
Smith, J.L.D., McDougal, C.W. & Sunquist, M.E. (1987). Female land tenure system in tigers.
In Tigers of the World. Tilson, R.L. & Seal, U.S. (Eds.). Noyes Publications, Park Ridge, NJ.
Smithers, R.H.N. (1983). The mammals of the southern African subregion. 1st edn. University
of Pretoria, Pretoria, South Africa.
Stuart, C.T. (1981). Notes on the mammalian carnivores of the Cape Province, South Africa.
Bontebok 1: 1-58.
Sunquist, M. & Sunquist, F. (2002). Wild cats of the World. Chicago: University of Chicago
Press.
Turner, D.C. & Bateson, P. (1988). The Domestic Cat: the Biology of its Behaviour.
Cambridge: Cambridge University Press.
Van Rooyen, N. (2001). Flowering plants of the Kalahari dunes. Business Print Centre,
Ecotrust, Pretoria.
Vigne, J.-D., Guilaine, J., Debue, K., Haye, l. & Gérard, P. (2004). Early Taming of the Cat in
Cyprus. Science 304: 259.
Vila, C. Maldonado, J.E. & Wayne, K. (1999). Phylogenetic Relationships, Evolution and
Genetic Diversity of the Domestic Dog. J. Hered. 90: 71-77.
Waser, P.M. & Jones, W.T. (1983). Natal philopatry among solitary mammals. Q. Rev. Biol.
53: 355-390.
Wayne, R.K., Van Valkenburgh, B. & O’Brien, S.J. (1991). Molecular distance and
divergence time in Carnivores and Primates. Mol. Biol. Evol. 8: 297-319.
Weber, J.M. & Dailly, L. (1998). Food habits and ranging behaviour of a group of farm cats
(Felis catus) in a Swiss mountainous area. J. Zool. (Lond.) 245: 234-237.
Chapter 1: General introduction
18
Weigel, I. (1961). The pelage patterns of wild-living cat species and domestic cats compared
with aspects of phylogenetic history. Säugetierk. Mitt. (Suppl.) 9: 1-120.
Wilson, D.E. & Reeder, D.M. (2005). Mammals Species of the World: A Taxonomic and
Geographic Reference. (3rd edn.). John Hopkins University Press.
Wiseman, R., O’Ryan, C. & Harley, E.H. (2000). Microsatellite analysis reveals that domestic
cat (Felis catus) and southern African wild cat (F. lybica) are genetically distinct. Anim.
Conserv. 3: 221-228.

Chapter 2: Feeding habits
19
CHAPTER 2
The feeding habits of the African wild cat (Felis silvestris), a facultative trophic
specialist, in the southern Kalahari (Kgalagadi Transfrontier Park, South
Africa/Botswana)
Journal of Zoology (London) (2010). 280: 403-413
1. Abstract
The seasonal feeding habits of the African wild cat Felis silvestris in the riverbed
ecotone of the Kgalagadi Transfrontier Park were investigated over a period of 46
months. The diet was analysed through visual observations on eight habituated (three
females and five males) radio-collared wild cats, supplemented with scat analysis.
Murids formed the bulk of the biomass in the diet (73%), followed by birds (10%) and
large mammals (4500 g) (9%). Although reptiles (6%) and invertebrates (2%) were
frequently caught, they contributed less to the overall biomass of the diet. There were
significant seasonal differences in the consumption of five food categories that related
to changes in availability. Fluctuations in prey abundances could be the result of
seasonal rainfall and temperature fluctuations or long-term variability in rainfall resulting
in wet and dry cycles. As predicted, the lean season (hot-dry) was characterized by a
high food-niche breadth and a high species richness. Despite sexual dimorphism in
size in the African wild cat, both sexes predominantly fed on smaller rodents, although
there were differences in the diet composition, with males taking more large mammals
and females favouring birds and reptiles. These results indicate that African wild cats
are adaptable predators that prefer to hunt small rodents, but can change their diet
according to seasonal and longer-term prey abundances and availability.
Keywords: African wild cats, Felis silvestris, feeding habits, diet, prey abundances,
southern Kalahari
2. Introduction
In Africa, the wild cat Felis silvestris Schreber, 1777, is represented by two subspecies,
Felis silvestris lybica Forster, 1780, in northern Africa and Felis silvestris cafra
Desmarest, 1822, in southern Africa (Driscoll et al., 2007), both of which have
substantial geographical ranges, stretching throughout the African continent, excluding
tropical forests and true deserts (Nowell & Jackson, 1996). In many parts of its range, it
is a common small predator (Stuart, 1981) with a very broad habitat tolerance (Skinner,
Chimimba & Smithers, 2005). Despite their wide distribution, African wild cats, like
Chapter 2: Feeding habits
20
most small felid species (Nowell & Jackson, 1996), have not been well studied.
Understanding the natural history of a species in its natural environment is important
when formulating conservation and management strategies. This study provides a
detailed description of the seasonal food habits of the African wild cat, based on direct
observations in the southern Kalahari.
Discussions on whether to classify predators as generalists or specialists are
widespread in the ecological literature (Futuyama & Moreno, 1988). Predators tend to
be generalist hunters when the abundance of profitable prey is low, becoming more
specialized when prey abundance increases (Pyke, Pulliam & Charnov, 1977). An
obligatory trophic specialist, for example the aardwolf (Richardson, 1987), almost
exclusively feeds on one species, regardless of abundance or whether other alternative
prey is available, whereas a facultative specialist may be more opportunistic and
changes its primary prey item when other profitable prey is available (Glasser, 1982).
The prey composition in the diet of a generalist hunter would be expected to show a
seasonal variation, depending on the abundance and availability of the prey species
(Pyke et al., 1977).
Classical optimum foraging theory predicts that the diet of a facultative specialist will be
more diverse during lean seasons than during abundant seasons, in response to the
decreased availability of preferred food types (Perry & Pianka, 1997). This may lead to
seasonal modifications in activity and foraging behaviour to satisfy their nutritional
needs (Gittleman & Thompson, 1988; Gedir & Hudson, 2000). In addition, several
predatory animals show sex-specific preferences for prey size. This is particularly
apparent in felids, such as bobcat Lynx rufus (Fritts & Sealander, 1978; Litvaitis, Clark
& Hunt, 1986), Eurasian lynx Lynx lynx (Molinari-Jobin et al., 2002) and cheetah
Acinonyx jubatus (Mills, du Toit & Broomhall, 2004).
Numerous studies have investigated the feeding habits of the European wild cat F.
silvestris. These include populations occurring in Scotland (Hewson, 1983), France
(Condé et al., 1972), the Apennines (Ragni, 1978), the Iberian Peninsula in Portugal
(Sarmento, 1996; Carvalho & Gomes, 2004), Spain (Gil-Sánchez, Valenzuela &
Sánchez, 1999; Moleón & Gil-Sánchez, 2003; Malo et al., 2004), Hungary (Biró et al.,
2005) and in the Carpathians (Kozena, 1990; Tryjanowski et al., 2002). Most of these
studies concluded that the preferred prey for wild cats are murids and that they may be
classified as facultative specialists on different prey items depending on prey
availability (Malo et al., 2004; Lozano, Moleón & Virgós, 2006). In contrast, limited

Chapter 2: Feeding habits
21
information is available on the feeding habits of the African wild cat, although it is
reported that murids resemble the major component of their diet (Smithers, 1971;
Stuart, 1977; Smithers & Wilson, 1979; Palmer & Fairall, 1988).
The feeding habits of the African wild cat are analysed by examining (1) the prey
composition and overall diet; (2) the seasonal and/or annual variation in the overall
prey composition and potential increase in diet variety in response to seasonal
changes in food availability; (3) sexual size dimorphism and differences in relation to
prey type, foraging strategies and consequently niche partitioning between wildcat
sexes. Finally, a general comparison is drawn between feeding habits of the African
wild cat and the European wild cat.
3. Materials and methods
Study area
The study was conducted from March 2003 to December 2006 (46 months) in the
Kgalagadi Transfrontier Park (KTP). The main study area (53 km2) was along the
southern part of the Nossob riverbed and surrounding dune areas (Fig. 2.1). The KTP,
shared between South Africa and Botswana, is a 37 000km2 area in the semi arid
southern Kalahari system, although our study area only included cats in the riverbed
ecotone.
The vegetation of the Kalahari is described as the western form of the Kalahari
Duneveld comprising an extremely open scrub savanna (Mucina & Rutherford, 2006).
For the purpose of this study, four main habitat types were identified: (1) the dry
riverbed; (2) the calcrete ridges; (3) the adjacent Rhigozum veld; (4) the sandy dune
areas. For more detailed descriptions of the vegetation, see Bothma & De Graaff
(1973) and Van Rooyen et al. (1984).
Climate and rainfall
The study site is characterized by low, irregular annual rainfall (Mills & Retief, 1984)
and receives between 200 and 250mm annually. The irregularity of the rainfall plays a
major role in the vegetation of the KTP (Leistner, 1967), and these cycles influence the
availability of food and animal movement patterns (Van Rooyen, 1984). According to
Nel et al. (1984), rodent numbers in the Kalahari fluctuate between seasons, with a
slow buildup as rainfall increases, followed by sudden decreases. Variations in
seasonal temperatures and factors such as rainfall, seed production and vegetation
cover are involved in the fluctuations of rodent species and numbers.
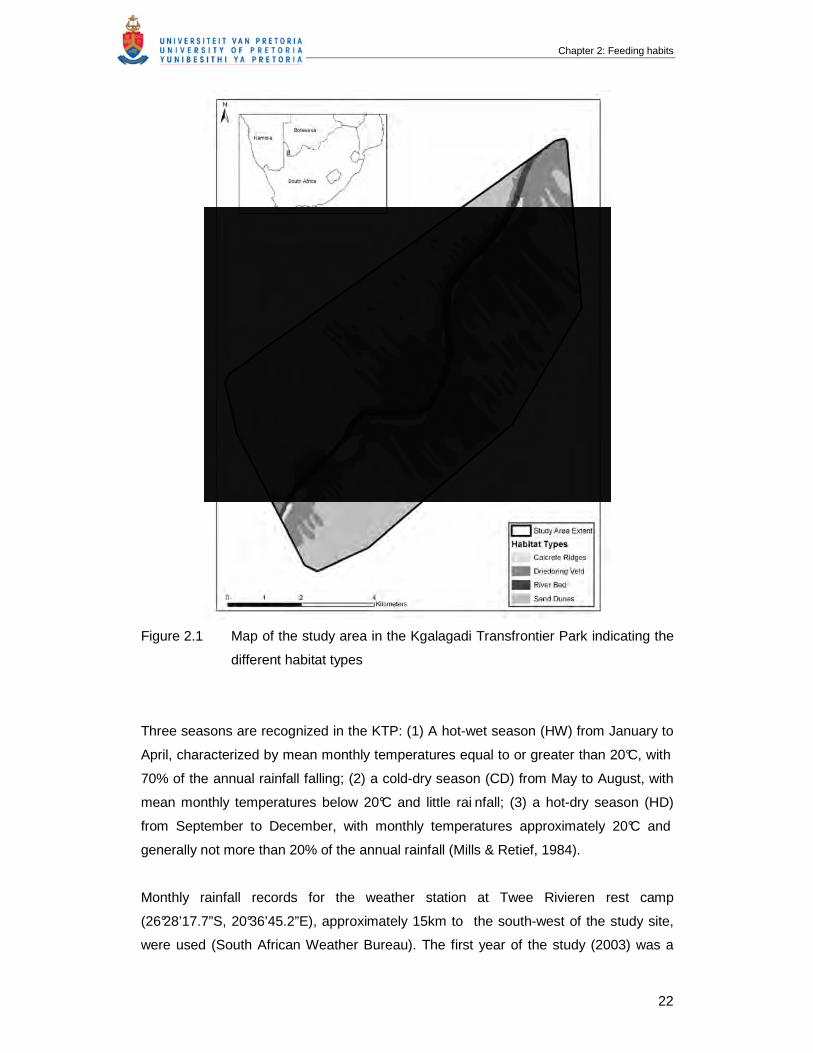
Chapter 2: Feeding habits
22
Figure 2.1 Map of the study area in the Kgalagadi Transfrontier Park indicating the
different habitat types
Three seasons are recognized in the KTP: (1) A hot-wet season (HW) from January to
April, characterized by mean monthly temperatures equal to or greater than 20°C, with
70% of the annual rainfall falling; (2) a cold-dry season (CD) from May to August, with
mean monthly temperatures below 20°C and little rai nfall; (3) a hot-dry season (HD)
from September to December, with monthly temperatures approximately 20°C and
generally not more than 20% of the annual rainfall (Mills & Retief, 1984).
Monthly rainfall records for the weather station at Twee Rivieren rest camp
(26°28’17.7”S, 20°36’45.2”E), approximately 15km to the south-west of the study site,
were used (South African Weather Bureau). The first year of the study (2003) was a
Chapter 2: Feeding habits
23
year with below average rainfall with 122 mm recorded. All subsequent years (2004 –
2006) had average or above-average rainfall (272 ± 41 mm per annum).
Data collection
Behavioural observations
African wild cats were either caught in cage traps or by the use of a dart gun (Appendix
1). After a radio collar was fitted, the cats were followed from a vehicle at a distance of
50 to 100 meters using the radio signal while they were being habituated to the vehicle.
Visual contact was re-established until the cats could be followed from 10 to 30 meters
without any obvious influence on their behaviour. During the course of the study 1,538
hours were spent observing habituated cats (Table 2.1). Cats were selected on a
rotational system and followed for an average of 6.0 ± 3.2 hours of observation periods
(range 1 - 14 hours). Thick vegetation and long grass sometimes precluded direct
visual contact with the cats for short periods.
All hunting and feeding activities were recorded and timed to the nearest minute. The
term hunting attempt is subjectively defined as any interaction between an African wild
cat and a potential prey animal, where the cat moved towards the prey with
considerable interest, caution and/or increased speed. A 1,000,000 candle power
spotlight was occasionally used during night observations, although the vehicle’s lights
were usually sufficient to allow observations and record prey type. The beam of the
spotlight was aimed slightly behind the cat to avoid illuminating the cat or prey item.
An observational study on a predominantly nocturnal animal, like the African wild cat,
unavoidably has certain limitations (Sliwa, 2006). The disturbance caused by vehicle
noise and light may have influenced the outcome of some hunts, particularly where
larger prey species for example hare (Lepus sp.), springhare (Pedetes capensis) and
spotted thick-knee (Burhinus capensis) were involved. Hunts could have been affected
both positively for the cats where prey were blinded by lights and caught more easily,
or negatively where prey were startled into fleeing, disrupting a stalking approach by a
cat. Such effects are difficult to quantify, but we believe that our results show a slight
bias against larger prey and that smaller prey such as mice was unaffected since cats
often waited at a hole for a mouse to emerge without the spotlight being used.
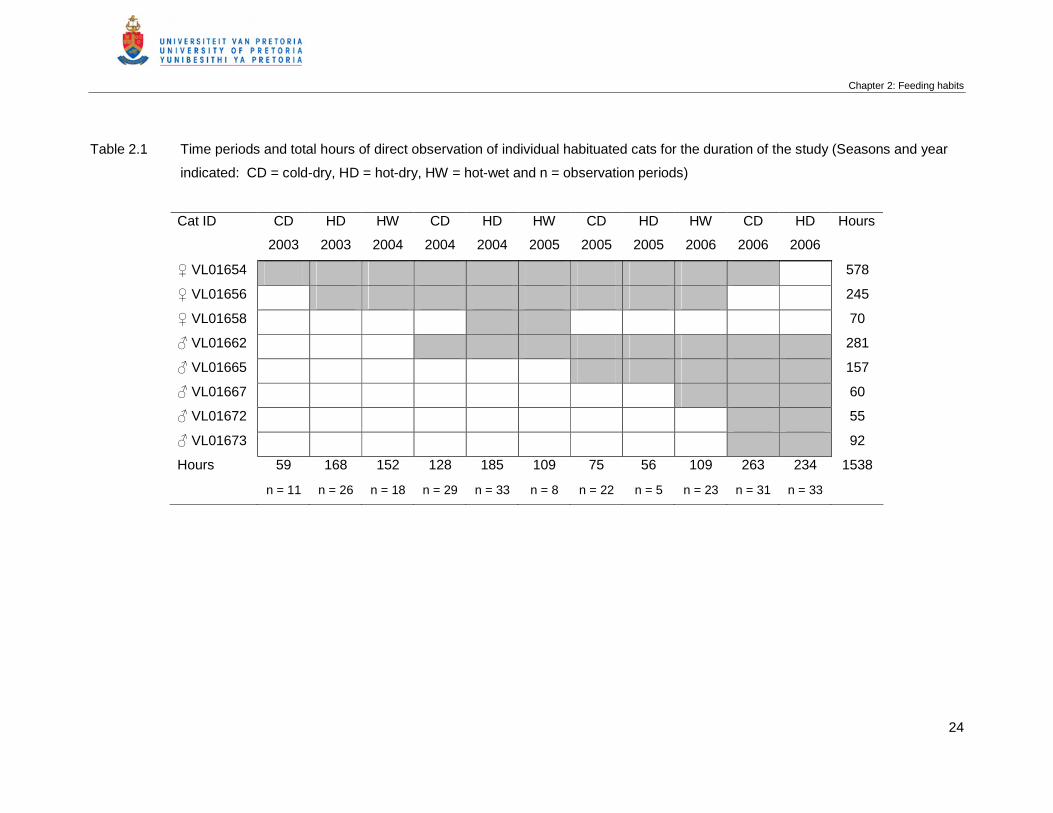
Chapter 2: Feeding habits
24
Table 2.1 Time periods and total hours of direct observation of individual habituated cats for the duration of the study (Seasons and year
indicated: CD = cold-dry, HD = hot-dry, HW = hot-wet and n = observation periods)
Cat ID CD
2003
HD
2003
HW
2004
CD
2004
HD
2004
HW
2005
CD
2005
HD
2005
HW
2006
CD
2006
HD
2006
Hours
♀ VL01654 578
♀ VL01656 245
♀ VL01658 70
♂ VL01662 281
♂ VL01665 157
♂ VL01667 60
♂ VL01672 55
♂ VL01673 92
Hours 59 168 152 128 185 109 75 56 109 263 234 1538
n = 11 n = 26 n = 18 n = 29 n = 33 n = 8 n = 22 n = 5 n = 23 n = 31 n = 33
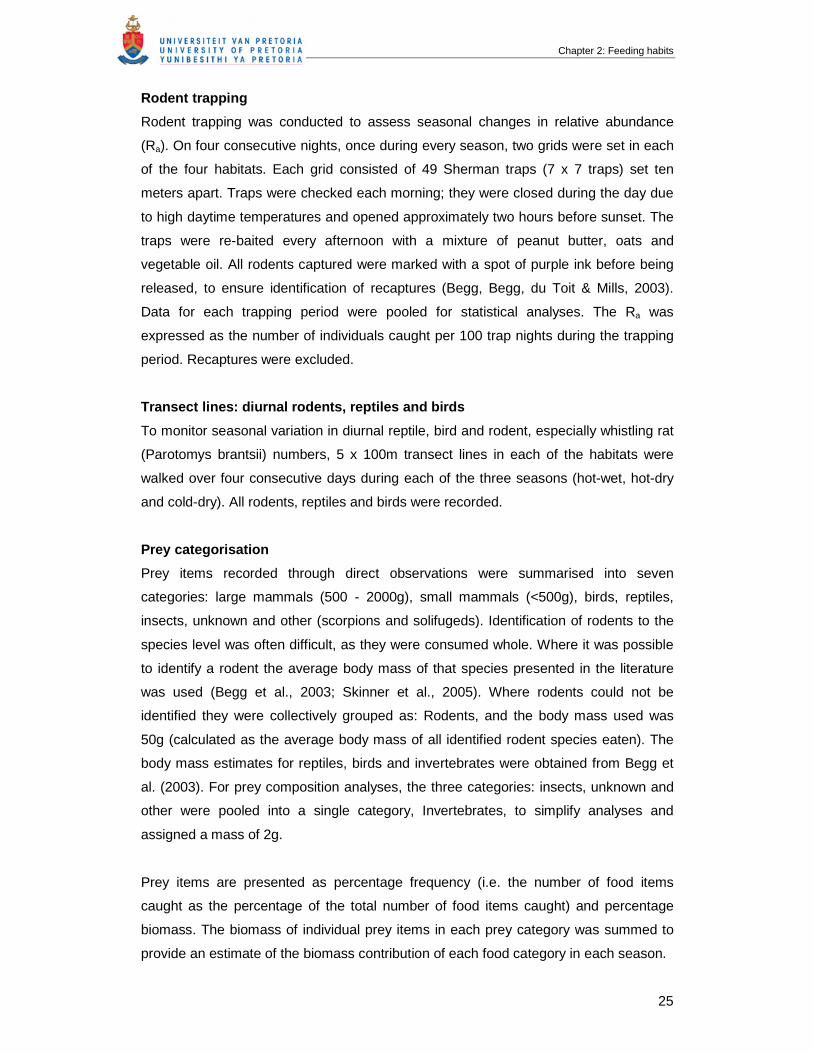
Chapter 2: Feeding habits
25
Rodent trapping
Rodent trapping was conducted to assess seasonal changes in relative abundance
(Ra). On four consecutive nights, once during every season, two grids were set in each
of the four habitats. Each grid consisted of 49 Sherman traps (7 x 7 traps) set ten
meters apart. Traps were checked each morning; they were closed during the day due
to high daytime temperatures and opened approximately two hours before sunset. The
traps were re-baited every afternoon with a mixture of peanut butter, oats and
vegetable oil. All rodents captured were marked with a spot of purple ink before being
released, to ensure identification of recaptures (Begg, Begg, du Toit & Mills, 2003).
Data for each trapping period were pooled for statistical analyses. The Ra was
expressed as the number of individuals caught per 100 trap nights during the trapping
period. Recaptures were excluded.
Transect lines: diurnal rodents, reptiles and birds
To monitor seasonal variation in diurnal reptile, bird and rodent, especially whistling rat
(Parotomys brantsii) numbers, 5 x 100m transect lines in each of the habitats were
walked over four consecutive days during each of the three seasons (hot-wet, hot-dry
and cold-dry). All rodents, reptiles and birds were recorded.
Prey categorisation
Prey items recorded through direct observations were summarised into seven
categories: large mammals (500 - 2000g), small mammals (<500g), birds, reptiles,
insects, unknown and other (scorpions and solifugeds). Identification of rodents to the
species level was often difficult, as they were consumed whole. Where it was possible
to identify a rodent the average body mass of that species presented in the literature
was used (Begg et al., 2003; Skinner et al., 2005). Where rodents could not be
identified they were collectively grouped as: Rodents, and the body mass used was
50g (calculated as the average body mass of all identified rodent species eaten). The
body mass estimates for reptiles, birds and invertebrates were obtained from Begg et
al. (2003). For prey composition analyses, the three categories: insects, unknown and
other were pooled into a single category, Invertebrates, to simplify analyses and
assigned a mass of 2g.
Prey items are presented as percentage frequency (i.e. the number of food items
caught as the percentage of the total number of food items caught) and percentage
biomass. The biomass of individual prey items in each prey category was summed to
provide an estimate of the biomass contribution of each food category in each season.
Chapter 2: Feeding habits
26
Scat analysis
Scat analyses of 52 samples were used to supplement observational feeding data in an
attempt to determine unidentifiable prey items. Scats were collected opportunistically
while following a focal animal, placed in a brown paper bag, numbered and air dried.
Scat analyses followed the methodology of Putman (1984) and Reynolds & Aebischer
(1991). The scat was washed in water over a sieve to separate undigested remains
and dried for two days in an oven at 30°C. The undi gested remains were separated
into a Petri dish and teeth, jaw fragments, bones, feathers, non-digestible plant material
and other identifiable remains were separated from the remainder of the scat, which
was predominately hair. No attempt was made to identify hair remains. To study the
variation in diet composition, the remains were pooled into sub-categories of: large
mammal remains, small mammal remains, bird, reptile, invertebrates and plant
material. The data were analysed as percentage frequency of occurrence (number of
times food category is present in sample/total number of scats analysed x 100) and
percentage of occurrence (number of times food category is present/total number of
occurrences of all food items x 100) (Manfredi, Lucherini, Canepuccia & Casanave,
2004).
Statistical analysis
An index of dietary diversity for each season from observational data was calculated
using Levin’s formula for niche breadth (Erlinge, 1981; Lode, 1994): NB = 1 / Σ pi2
where pi = the proportion of observations in food category i of the diet. Results for
males and females are presented combined as well as separately. Differences
between sexes were tested using the Chi Square test of statistical significance for
bivariate tabular analysis (χ2) (Siegel, 1956). The Spearman Rank correlation
coefficient (rs) was used to investigate relationships between prey abundance and their
percentage contribution to diet and small mammal, insect and reptile consumption. The
statistical package Statistica 7.1 (Statsoft, Inc. 1984-2006) was used for all tests, with
significance set at P < 0.05 for the two-tailed tests.
4. Results
4.1 Overall diet and prey composition
During the study 2,553 prey items were observed to be caught by African wild cats, of
which 81% could be identified to one of the five food categories and comprising 26
species (Appendix 2). Nineteen percent of the food items were classified as unknown
as they were too small and consumed too quickly to be identified. Rodents, reptiles and
invertebrates had the highest percentage occurrence in the scats of African wild cats
Chapter 2: Feeding habits
27
(Table 2.2) and confirm visual observations where rodents, insects and reptiles had the
highest percentage occurrences.
Vertebrates
Mammals made up 82% of the cumulative prey biomass consumed (73% small
mammals and 9% large mammals), followed by 10% birds and 6% reptiles. The
remaining 2% consisted of invertebrates (Appendix 2). The most common prey items
captured were small mammals (44%) followed by reptiles (23%) (Appendix 2). Small
mammals almost exclusively consisted of murids with only one recorded insectivore, a
Bushveld elephant shrew (Elephantulus intufi).
Invertebrates
Invertebrate prey was difficult to identify from visual observations. Scat analyses
suggest that the majority of unidentifiable prey items may be included in the
invertebrate category (Table 2.2). If insects, other and unknown prey items are pooled
into the single category Invertebrates, they contribute 30% to the total number of prey
items caught. However, only 2% of the total biomass of the diet of African wild cats
comprised invertebrates (Appendix 2).
Plant material
On two occasions cats were observed to consume vegetal material, grass (Eragrostis
sp.) and leaves of the unpalatable Radyera urens. Plant material was not included in
the analysis although it was frequently found in the scats of African wild cats (42.3%
frequency of occurrence) (Table 2.2). The nutritional value of plants is very low
(Kozena, 1990; Moleón & Gil-Sánchez, 2003) and ingestion could have been both
incidental (plants sticking to the prey or content of the digestive tract of prey) and
intentional, either to supplement micronutrients, or to aid digestion and regurgitation of
indigestible parts, particularly fur (see Sladek (1972) in Kozena (1990)).
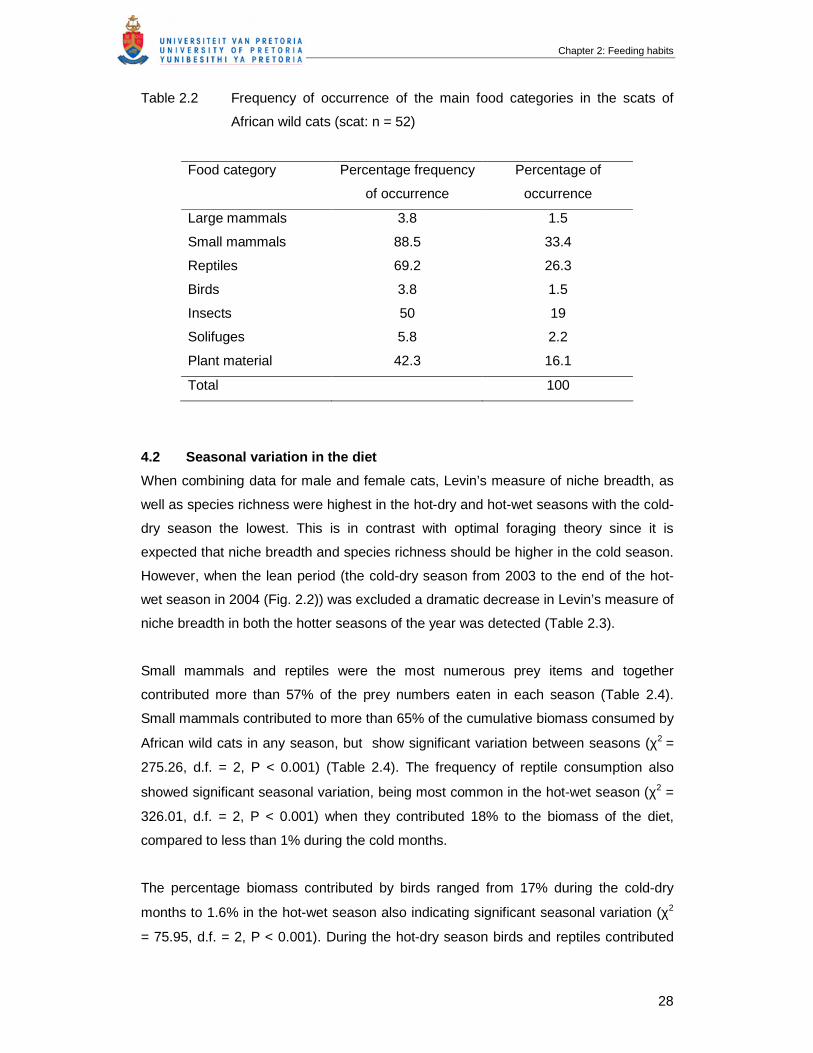
Chapter 2: Feeding habits
28
Table 2.2 Frequency of occurrence of the main food categories in the scats of
African wild cats (scat: n = 52)
Food category Percentage frequency
of occurrence
Percentage of
occurrence
Large mammals 3.8 1.5
Small mammals 88.5 33.4
Reptiles 69.2 26.3
Birds 3.8 1.5
Insects 50 19
Solifuges 5.8 2.2
Plant material 42.3 16.1
Total 100
4.2 Seasonal variation in the diet
When combining data for male and female cats, Levin’s measure of niche breadth, as
well as species richness were highest in the hot-dry and hot-wet seasons with the cold-
dry season the lowest. This is in contrast with optimal foraging theory since it is
expected that niche breadth and species richness should be higher in the cold season.
However, when the lean period (the cold-dry season from 2003 to the end of the hot-
wet season in 2004 (Fig. 2.2)) was excluded a dramatic decrease in Levin’s measure of
niche breadth in both the hotter seasons of the year was detected (Table 2.3).
Small mammals and reptiles were the most numerous prey items and together
contributed more than 57% of the prey numbers eaten in each season (Table 2.4).
Small mammals contributed to more than 65% of the cumulative biomass consumed by
African wild cats in any season, but show significant variation between seasons (χ2 =
275.26, d.f. = 2, P < 0.001) (Table 2.4). The frequency of reptile consumption also
showed significant seasonal variation, being most common in the hot-wet season (χ2 =
326.01, d.f. = 2, P < 0.001) when they contributed 18% to the biomass of the diet,
compared to less than 1% during the cold months.
The percentage biomass contributed by birds ranged from 17% during the cold-dry
months to 1.6% in the hot-wet season also indicating significant seasonal variation (χ2
= 75.95, d.f. = 2, P < 0.001). During the hot-dry season birds and reptiles contributed
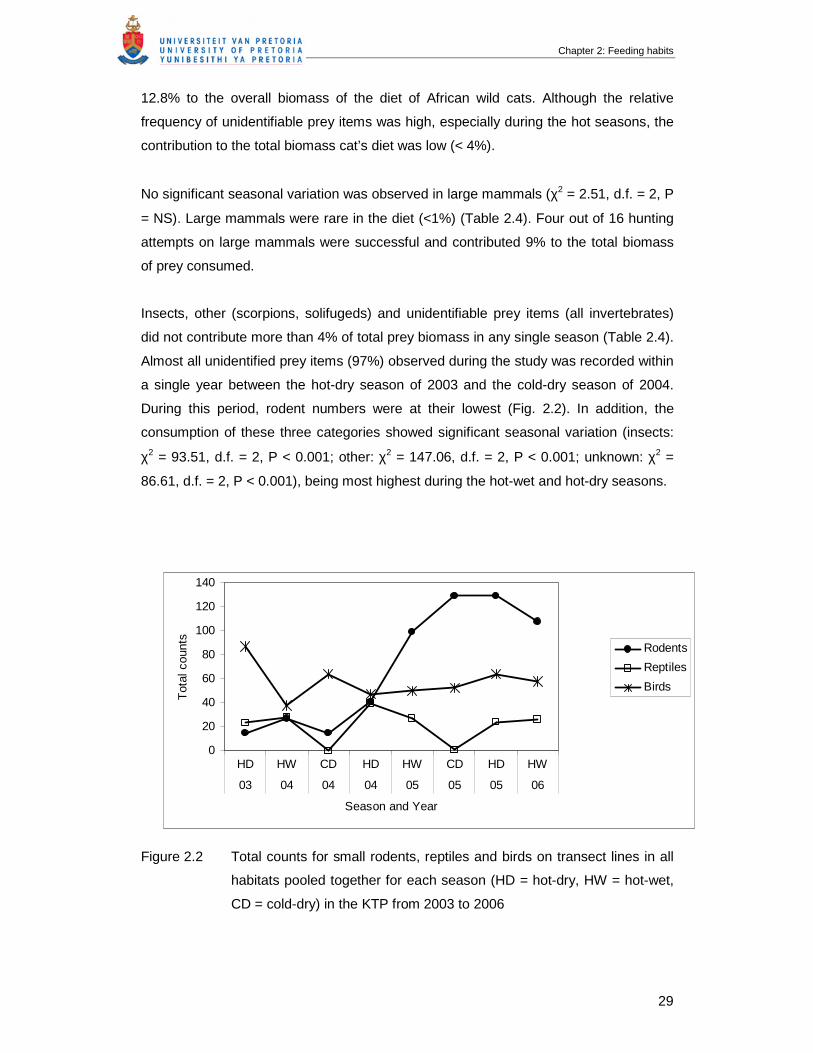
Chapter 2: Feeding habits
29
12.8% to the overall biomass of the diet of African wild cats. Although the relative
frequency of unidentifiable prey items was high, especially during the hot seasons, the
contribution to the total biomass cat’s diet was low (< 4%).
No significant seasonal variation was observed in large mammals (χ2 = 2.51, d.f. = 2, P
= NS). Large mammals were rare in the diet (<1%) (Table 2.4). Four out of 16 hunting
attempts on large mammals were successful and contributed 9% to the total biomass
of prey consumed.
Insects, other (scorpions, solifugeds) and unidentifiable prey items (all invertebrates)
did not contribute more than 4% of total prey biomass in any single season (Table 2.4).
Almost all unidentified prey items (97%) observed during the study was recorded within
a single year between the hot-dry season of 2003 and the cold-dry season of 2004.
During this period, rodent numbers were at their lowest (Fig. 2.2). In addition, the
consumption of these three categories showed significant seasonal variation (insects:
χ2 = 93.51, d.f. = 2, P < 0.001; other: χ2 = 147.06, d.f. = 2, P < 0.001; unknown: χ2 =
86.61, d.f. = 2, P < 0.001), being most highest during the hot-wet and hot-dry seasons.
0
20
40
60
80
100
120
140
HD HW CD HD HW CD HD HW
03 04 04 04 05 05 05 06
Season and Year
Tot
al c
ount
s
Rodents
Reptiles
Birds
Figure 2.2 Total counts for small rodents, reptiles and birds on transect lines in all
habitats pooled together for each season (HD = hot-dry, HW = hot-wet,
CD = cold-dry) in the KTP from 2003 to 2006
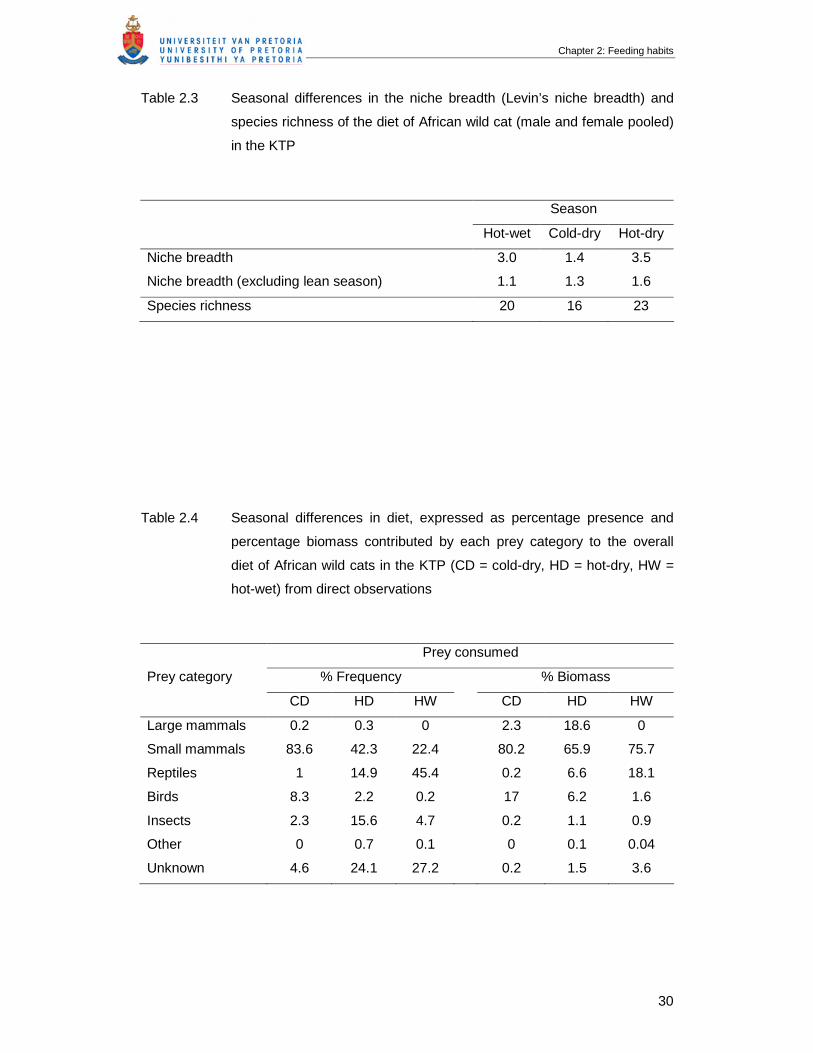
Chapter 2: Feeding habits
30
Table 2.3 Seasonal differences in the niche breadth (Levin’s niche breadth) and
species richness of the diet of African wild cat (male and female pooled)
in the KTP
Season
Hot-wet Cold-dry Hot-dry
Niche breadth 3.0 1.4 3.5
Niche breadth (excluding lean season) 1.1 1.3 1.6
Species richness 20 16 23
Table 2.4 Seasonal differences in diet, expressed as percentage presence and
percentage biomass contributed by each prey category to the overall
diet of African wild cats in the KTP (CD = cold-dry, HD = hot-dry, HW =
hot-wet) from direct observations
Prey consumed
Prey category % Frequency % Biomass
CD HD HW CD HD HW
Large mammals 0.2 0.3 0 2.3 18.6 0
Small mammals 83.6 42.3 22.4 80.2 65.9 75.7
Reptiles 1 14.9 45.4 0.2 6.6 18.1
Birds 8.3 2.2 0.2 17 6.2 1.6
Insects 2.3 15.6 4.7 0.2 1.1 0.9
Other 0 0.7 0.1 0 0.1 0.04
Unknown 4.6 24.1 27.2 0.2 1.5 3.6
Chapter 2: Feeding habits
31
4.3 Influence of changes in prey availability in the diet
Although the consumption of small mammals varied markedly during the course of the
study, no clear seasonal pattern was evident. The study period (2003 – 2006) was
characterised by initial low rodent densities followed by an increase in numbers when
rainfall was higher and a slight decline in numbers towards the end (Fig. 2.3).
Reptile, insect and bird consumption were significantly negatively correlated with the
consumption of small mammals during each season of the study (insects: n = 11, rs = -
0.69, P < 0.05; reptiles: n = 11, rs = -0.73, P < 0.05; birds: n = 11, rs = -0.64, P < 0.05;
Fig. 4). However, the cold-dry season of 2003 showed a different trend in bird
consumption. At that time the only radio-collared cat spent most of her time hunting
close to a waterhole, where she caught birds perching on the side of the reservoir or
birds sitting around the waterhole. Once the rains came, she remained around the
water hole but changed her diet to rodents (Chapter 3). For all radio collared cats the
consumption of birds was negatively correlated with rainfall (n = 11, rs = -0.67, P <
0.05), however, none of the other food categories were.
Between the cold-dry season of 2003 and the hot-wet season of 2004, rodent numbers
were low and small mammals contributed less than 10% of the percentage prey
caught. During this time reptiles and insects increased in importance as prey items
(Fig. 2.4). From the cold-dry season of 2004 until the end of the hot-dry season in
2006, small mammals made up more than 64% of the total diet of African wild cats and
contributed more than 68% of the biomass in each season, with a dramatic reduction in
other prey selected.
4.4 Sexual differences in body size and diet of African wild cats
Body size
African wild cats show distinct differences in the body mass of sexes, with males being
31% heavier than females. In addition, males exhibit significantly longer head body
length and Hf s/u (hind foot, sine unguis) than females (Table 2.5).
Diet
Small mammals and reptiles were the two most important prey items for both sexes
and when combined contributed more than 55% of the prey items in both males and
females (Table 2.6). Small mammals were also the largest contributors to cumulative
biomass consumed (males 85%; females 63%). Larger mammals were the second-

Chapter 2: Feeding habits
32
most important contributor to total prey biomass in the males’ diets (11%) but were
unimportant for females (only one of the 16 hunting attempts on large mammals was by
a female). Birds were the second-most important contributor to total prey biomass in
females (15%) (Table 2.6).
In all seasons, the prey diversity was higher for females than males (Table 2.7). For
both sexes the highest prey diversity was in the hot dry season (males = 1.73 and
females = 3.86). Females exhibited the lowest niche breadth index in the cold dry
season, whereas for males the niche breadth index in the hot wet and cold dry seasons
was similar.
0
500
1000
1500
2000
2500
3000
3500
4000
4500
HW04 HD 04 HW 05 CD 05 HD 05 HW 06 CD 06 HD 06
Season and year
Rod
ent
dens
ity
(cap
ture
s/10
0 tr
ap n
ight
s
0
20
40
60
80
100
120
Per
cent
age
occu
renc
eRodent density Rainfall (mm) Rodent frequency of occurence (%)
Figure 2.3 The relationship between percentage frequency of small mammals
consumed by African wild cats, rainfall and the relative abundance of
small mammals estimated from rodent trapping from the hot-wet season
2004 to the hot-dry season 2006
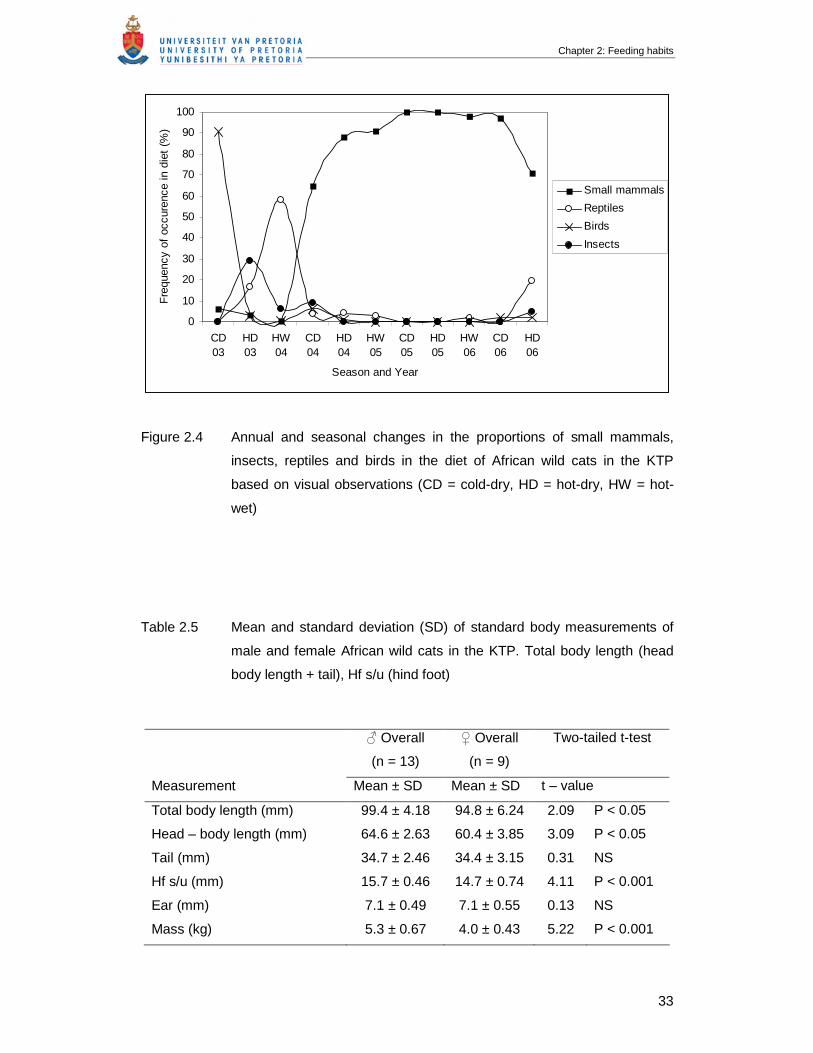
Chapter 2: Feeding habits
33
0
10
20
30
40
50
60
70
80
90
100
CD03
HD03
HW04
CD04
HD04
HW05
CD05
HD05
HW06
CD06
HD06
Season and Year
Fre
quen
cy o
f oc
cure
nce
in d
iet
(%)
Small mammals
Reptiles
Birds
Insects
Figure 2.4 Annual and seasonal changes in the proportions of small mammals,
insects, reptiles and birds in the diet of African wild cats in the KTP
based on visual observations (CD = cold-dry, HD = hot-dry, HW = hot-
wet)
Table 2.5 Mean and standard deviation (SD) of standard body measurements of
male and female African wild cats in the KTP. Total body length (head
body length + tail), Hf s/u (hind foot)
♂ Overall
(n = 13)
♀ Overall
(n = 9)
Two-tailed t-test
Measurement Mean ± SD Mean ± SD t – value
Total body length (mm) 99.4 ± 4.18 94.8 ± 6.24 2.09 P < 0.05
Head – body length (mm) 64.6 ± 2.63 60.4 ± 3.85 3.09 P < 0.05
Tail (mm) 34.7 ± 2.46 34.4 ± 3.15 0.31 NS
Hf s/u (mm) 15.7 ± 0.46 14.7 ± 0.74 4.11 P < 0.001
Ear (mm) 7.1 ± 0.49 7.1 ± 0.55 0.13 NS
Mass (kg) 5.3 ± 0.67 4.0 ± 0.43 5.22 P < 0.001

Chapter 2: Feeding habits
34
Table 2.6 Sexual differences in the diet of African wild cats from direct observations (five male and three female) in the KTP expressed as
the percentage frequency and percentage biomass contributed by each prey category to the overall diet and ranked accordingly
(n = total food items). The niche breadth index and species richness of male and female diets are indicated
Female diet (n = 1649) Male diet (n = 712) χ2 (d.f. = 5) χ2 (d.f. = 5) Prey category
% Frequency Rank % Biomass Rank % Frequency Rank % Biomass Rank % Frequency % Biomass
Large mammals 0.12 6 6.97 4 0.28 6 11.45 2 - -
Small mammals 26.32 3 63.46 1 85.53 1 83.45 1 P < 0.001 P < 0.01
Reptiles 28.87 2 10.41 3 8.85 2 1.64 4 P < 0.001 P < 0.01
Birds 3.34 5 15.30 2 1.69 4 3.26 3 NS P < 0.01
Insects 12.07 4 1.30 6 2.11 3 0.15 5 P < 0.001 P < 0.01
Unknown 29.29 1 2.58 5 1.54 5 0.05 6 P < 0.001 P < 0.01
Niche breadth 2.91 1.35
Species richness 26 18
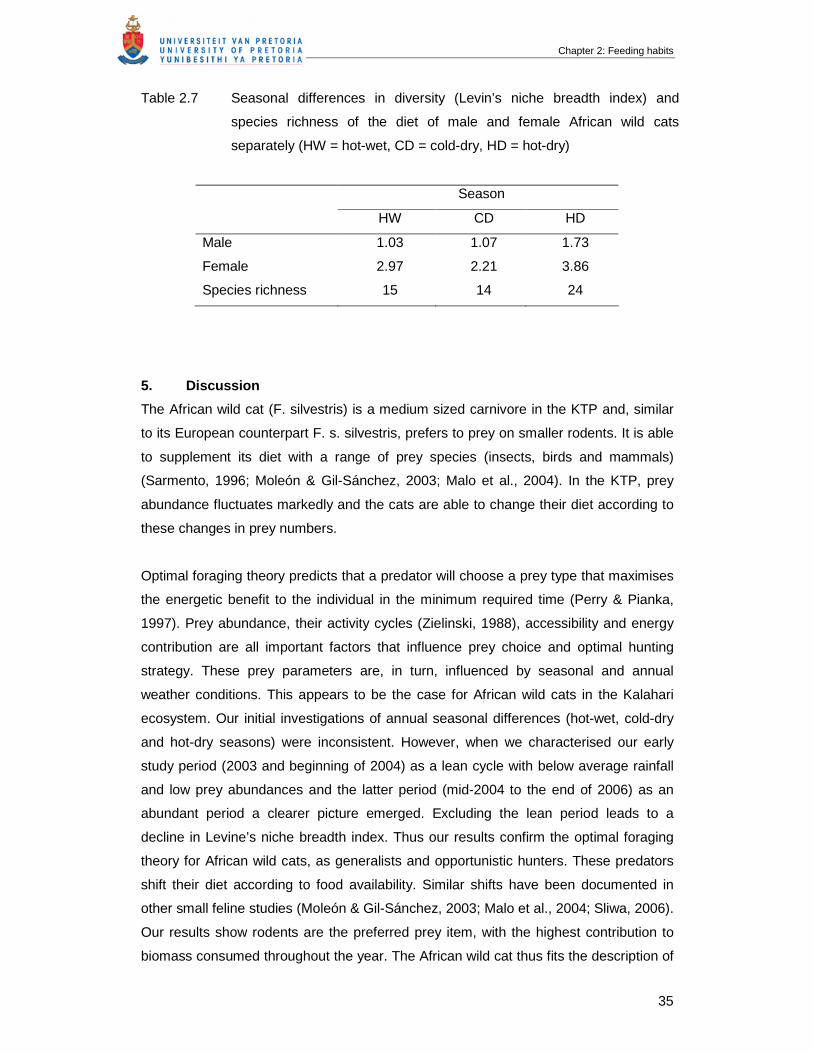
Chapter 2: Feeding habits
35
Table 2.7 Seasonal differences in diversity (Levin’s niche breadth index) and
species richness of the diet of male and female African wild cats
separately (HW = hot-wet, CD = cold-dry, HD = hot-dry)
Season
HW CD HD
Male 1.03 1.07 1.73
Female 2.97 2.21 3.86
Species richness 15 14 24
5. Discussion
The African wild cat (F. silvestris) is a medium sized carnivore in the KTP and, similar
to its European counterpart F. s. silvestris, prefers to prey on smaller rodents. It is able
to supplement its diet with a range of prey species (insects, birds and mammals)
(Sarmento, 1996; Moleón & Gil-Sánchez, 2003; Malo et al., 2004). In the KTP, prey
abundance fluctuates markedly and the cats are able to change their diet according to
these changes in prey numbers.
Optimal foraging theory predicts that a predator will choose a prey type that maximises
the energetic benefit to the individual in the minimum required time (Perry & Pianka,
1997). Prey abundance, their activity cycles (Zielinski, 1988), accessibility and energy
contribution are all important factors that influence prey choice and optimal hunting
strategy. These prey parameters are, in turn, influenced by seasonal and annual
weather conditions. This appears to be the case for African wild cats in the Kalahari
ecosystem. Our initial investigations of annual seasonal differences (hot-wet, cold-dry
and hot-dry seasons) were inconsistent. However, when we characterised our early
study period (2003 and beginning of 2004) as a lean cycle with below average rainfall
and low prey abundances and the latter period (mid-2004 to the end of 2006) as an
abundant period a clearer picture emerged. Excluding the lean period leads to a
decline in Levine’s niche breadth index. Thus our results confirm the optimal foraging
theory for African wild cats, as generalists and opportunistic hunters. These predators
shift their diet according to food availability. Similar shifts have been documented in
other small feline studies (Moleón & Gil-Sánchez, 2003; Malo et al., 2004; Sliwa, 2006).
Our results show rodents are the preferred prey item, with the highest contribution to
biomass consumed throughout the year. The African wild cat thus fits the description of
Chapter 2: Feeding habits
36
an intermediate specialist carnivore with a likely facultative trophic strategy (Glasser,
1984). Alternative prey items, especially reptiles and birds, change in importance
depending on temperature, rainfall variability and consequently rodent abundance.
When rodent densities were low, they were eaten less frequently and the wild cats
shifted to less profitable (Konecny, 1987) prey items, in particular reptiles, invertebrates
and birds. This switch is apparently not due to a change in the abundance of the less
profitable prey item but rather resulting from a decrease in the abundance of the
preferred prey. This was evident at the start of the study when small rodent numbers
were low and consumption of alternative prey was accordingly high. Following a wet
period (2004) and a consequent increase in the abundance of rodents, there was a
dramatic shift in the diet to small mammals (cold-dry season of 2004) despite reptiles
still being readily available.
An increase in reptile and invertebrate consumption during the warmer months of the
year coincides with increased activity of ectotherms and hence, greater availability of
alternative prey (Branch, 1988; Begg et al., 2003). Of interest is the seasonal shift
between bird and reptile consumption. Reptiles contribute greatly to overall biomass
consumed by African wild cats, while during cold seasons, cats seem to increase bird
consumption. It appears that birds are a substitute prey in colder months when reptile
activity is low.
Although large mammals represent a low frequency (<1%) in the diet of wild cats, they
contributed 9% to the total biomass of prey consumed, ranking them third after small
mammals and birds. Therefore, from an energetic perspective, larger prey might be
profitable to hunt. It has been estimated that a wild cat weighing 4 – 5kg needs a daily
food intake of 1000g (Carbone, Mace, Roberts & Macdonald, 1999; Malo et al., 2004).
One hare (ca. 1500g) is the energetic equivalent of nearly 20 rodents, and exceeds a
cat’s daily energetic requirement. Rabbits are an important component of the diet of
European wild cats in France and central Spain (Corbett, 1979; Sunquist & Sunquist,
2002; Malo et al., 2004).
However, other factors such as catching effort is important (Stephens & Krebs, 1986)
and catching rodents may be, proportionate to their smaller size, less energetically
demanding than capturing a hare. While rodents can be captured by pouncing, fleeing
hares have to be chased, and upon capture, bitten at the nape of the neck and violently
Chapter 2: Feeding habits
37
shaken until dead. There is also the increased risk of losing the kill of a larger mammal
to competitors as two of the six kills were lost to jackals.
Male African wild cats are significantly larger than females and although small rodents
were the dominant prey item for both sexes, sexual differences in diet composition
were found, both in the frequency of species taken, as well as in the ranking of prey
categories. Large mammals were ranked second in male cats’ diets, whereas smaller
prey items such as birds and reptiles contributed more to the females’ diets. It seems
that females concentrate on smaller prey, and therefore have a more diverse diet,
whereas the larger males can hunt larger prey. This has been explained as a possible
means of reducing intra-specific competition between sexes (Fritts & Sealander, 1978;
Litvaitis et al., 1986; Sliwa, 2006). Females, burdened with the high energy demands
resulting from pregnancy, lactation, and provisioning for kittens may well benefit from
more profitable, larger prey, but may lack the ability and strength to do so. A more
diverse diet of smaller prey species may thus be a more optimal feeding strategy for
them.
In conclusion, African wild cats are generalist and opportunistic predators that exhibit a
wide dietary niche breadth. They also show evidence of sexual separation in diet
composition reflected in the selection of larger prey by the larger males, and greater
utilization of more numerous prey items by the smaller females. Southern African wild
cats adapt their hunting strategies according to annual and seasonal changes in prey
abundances and availability. Small mammals, especially rodents, comprised the bulk of
the diet, while birds, reptiles and invertebrates increased in importance when rodent
numbers were low. The understanding of these changes is important for the
interpretation of multiple predator–prey interactions.
6. References
Begg, C.M., Begg, K.S., Du Toit, J.T. & Mills, M.G.L. (2003). Sexual and seasonal
variation in the diet and foraging behaviour of a sexually dimorphic carnivore, the
honey badger (Mellivora capensis). J. Zool. (Lond.) 260: 301-316.
Biró, Z.S., Lanszki, J., Szemethy, L., Heltai, M. & Randi, E. (2005). Feeding habits of
feral domestic cats (Felis catus), wild cats (Felis silvestris) and their hybrids: trophic
niche overlap among cat groups in Hungary. J. Zool. (Lond.) 266: 187-196.

Chapter 2: Feeding habits
38
Bothma, J. Du P. & De Graaff, G. (1973). A habitat map of the Kalahari Gemsbok
National Park. Koedoe 16: 181-188.
Branch, B. (1998). Field Guide to Snakes and other Reptiles of southern Africa. 3rd edn.
Struik Publishers (Pty) Ltd. South Africa.
Carbone, C., Mace, G.M., Roberts, S.C. & Macdonald, D.W. (1999). Energetic
constraints on the diet of terrestrial carnivores. Nature (Lond.) 402: 286-288.
Carvalho, J.C. & Gomes, P. (2004). Feeding resource partitioning among four
sympatric carnivores in the Peneda-Gerês National Park (Portugal). J. Zool. (Lond.)
263: 275-283.
Condé, B., Nguyen-Thi-Thu-Cuc, Valliant, F. & Schauenberg, P. (1972). Le régime
alimentaire du Chat forestier (Felis silvestris Schreber) en France. Mammalia 36: 112-
119.
Corbett, L.K. (1979). Feeding ecology and social organization of wildcats (Felis
silvestris) and domestic cats (Felis catus) in Scotland. PhD thesis, University of
Aberdeen.
Driscoll, C.A., Menotti-Raymond, M., Roca, A.L., Hupe, K., Johnson, W.E., Geffen, E.,
Harley, E., Delibes, M., Pontier, D, Kitchener, A.C., Yamaguchi, N., O’Brien, S.J. &
Macdonald, D. (2007). The Near Eastern Origin of Cat Domestication. Science 317:
519-523.
Erlinge, S. (1981). Food preference, optimal diet and reproductive output in stoats
Mustela erminea in Sweden. Oikos 36: 303-315.
Fritts, S.H. & Sealander, J.A. (1978). Diets of bobcats in Arkansas with special
reference to age and sex differences. J. Wildl. Manage. 42: 533-539.
Futuyama, D.J. & Moreno, G. (1988). The evolution of ecological specialization. Annu.
Rev. Ecol. Syst. 19: 207-233.
Chapter 2: Feeding habits
39
Gedir, J.V. & Hudson, R.J. (2000). Seasonal foraging and behavioural compensation in
reproductive wapiti hinds (Cervus elaphus canadensis). Appl. Animal Behav. Sci. 67:
137-150.
Gil-Sánchez, J.M., Valenzuela, G. & Sánchez, J.F. (1999). Iberian wild cat Felis
silvestris tartessia predation on rabbit Oryctolagus cuniculus: functional response and
age selection. Acta Theriol. 44: 421-428.
Gittleman, J.L. & Thompson, S.D. (1988). Energy allocation in mammalian
reproduction. Am. Zool. 28: 863-875.
Glasser, J.W. (1982). A theory of trophic strategies: the evolution of facultative
specialists. Ecology 63: 250-262.
Glasser, J.W. (1984). Evolution of efficiencies and strategies of resource exploitation.
Ecology 65: 1570-1578.
Hewson, R. (1983). The food of wild cats (Felis silvestris) and red foxes (Vulpes
vulpes) in west and north-east Scotland. J. Zool. (Lond.) 200: 283-289.
Konecny, M.J. (1987). Food habits and energetics of feral house cats in the Galápagos
Islands. Oikos 50: 24-32.
Kozena, I. (1990). Contribution to the food of wildcats (Felis silvestris). Folia Zool. 39:
207-212.
Leistner, O.A. (1967). The plant ecology of the southern Kalahari. Mem. Bot. Surv. S.
Afr. 38: 1-172.
Litvaitis, J.A., Clark, A.G. & Hunt, J.H. (1986). Prey selection and fat deposits of
bobcats (Felis rufus) during autumn in Maine. J. Mammal. 66: 389-392.
Lode, T. (1994). Environmental factors influencing habitat exploitation by the polecat
Mustela putorius in western France. J. Zool. (Lond.) 234: 75-88.
Chapter 2: Feeding habits
40
Lozano, J., Moleón, M. & Virgós, E. (2006). Biogeograpical patterns in the diet of the
wildcat, Felis silvestris Schreber, in Eurasia: factors affecting the trophic diversity. J.
Biogeogr. 33: 1076-1085.
Malo, A.F., Lozano, J., Huertas, D.L. & Virgós, E. (2004). A change of diet from rodents
to rabbits (Oryctolagus cuniculus). Is the wildcat (Felis silvestris) a specialist predator?
J. Zool. (Lond.) 263: 401-407.
Manfredi, C., Lucherini, M., Canepuccia, A.D. & Casanave, E.B. (2004). Geographical
variation in the diet of Geoffroy’s cat (Oncifelis geoffroyi) in pampas grassland of
Argentina. J. Mammal. 85: 1111-1115.
Mills, M.G.L. & Retief, P.F. (1984). The response of ungulates to rainfall along
riverbeds of the southern Kalahari, 1972-1982. Koedoe (Suppl.) 1984: 129-142.
Mills, M.G.L., Du Toit, J.T. & Broomhall, L.S. (2004). Cheetah Acinonyx jubatus feeding
ecology in the Kruger National Park and a comparison across African savanna
habitats: is the cheetah only a successful hunter on open grassland plains? Wildlife
Biol. 10: 177-186.
Moleón, M & Gil-Sánchez, J.M. (2003). Food habits of the wildcat (Felis silvestris) in a
peculiar habitat: the Mediterranean high mountains. J. Zool. (Lond.) 260: 17-22.
Molinari-Jobin, A., Molinari, P., Breitenmoser-Würsten, C. & Breitenmoser, U. (2002).
Significance of lynx Lynx lynx predation for roe deer Capreolus capreolus and chamois
Rupicapra rupicapra mortality in the Swiss Jura mountains. Wildlife Biol. 8: 109-115.
Mucina, L. & Rutherford, M.C. (2006). The vegetation of South Africa, Lesotho and
Swaziland. Strelitzia 19. South African National Biodiversity Institute, Pretoria.
Nel, J.A.J., Rautenbach, I.L., Els, D.A. & De Graaf, G. (1984). The rodents and other
small mammals of the Kalahari Gemsbok National Park. Koedoe (Suppl.) 1984: 195-
220.
Nowell, K. & Jackson, P. (1996). Wild cats. Status survey and conservation action plan.
IUCN, Gland.
Chapter 2: Feeding habits
41
Palmer, R. & Fairall, N. (1988). Caracal and African wild cat diet in the Karoo National
Park and the implications thereof for hyrax. S. Afr. J. Wildl. Res. 18: 30-34.
Perry, G. & Pianka, E.R. (1997). Animal foraging: past, present and future. Trends
Ecol. Evol. 12: 360-364.
Putman, R. Y. (1984). Facts from faeces. Mammal Rev. 14: 79-97.
Pyke, G.H., Pulliam, H.R. & Charnov, E.L. (1977). Optimal foraging: a selective review
of theory and tests. Q. Rev. Biol. 52: 137-154.
Ragni, B. (1978). Observations on the ecology and behaviour of the wild cat (Felis
silvestris Schreber, 1777) in Italy. Carniv. Genet. Newsl. 3: 270-274.
Reynolds, J.C. & Aebischer, N.J. (1991). Comparison and quantification of carnivore
diet by faecal analysis: a critique, with recommendations, based on a study of the fox
Vulpes vulpes. Mammal Rev. 21: 95-122.
Richardson, P.R.K. (1987). Aardwolf: The most specialized myrmecophagous
mammal? S. Afr. J. Sci. 83: 643-646.
Sarmento, P. (1996). Feeding ecology of the European wildcat Felis silvestris in
Portugal. Acta Theriol. 41: 409-414.
Siegel, S. (1956). Nonparametric Statistics for the Behavioural Sciences. New York:
McGraw Hill.
Skinner, J.D., Chimimba, C.T. & Smithers, R.H.N. (2005). The mammals of the
southern African subregion. 3rd edn. Cambridge University Press.
Sliwa, A. (2006). Seasonal and sex-specific composition of black-footed cats Felis
nigripes. Acta Theriol. 51: 195-204.
Smithers, R.H.N. (1971). The Mammals of Botswana. Mus. mem. natl. Monum. Rhod.
4: 1-340.
Chapter 2: Feeding habits
42
Smithers, R.H.N. & Wilson, V.J. (1979). Checklist and atlas of the mammals of
Zimbabwe-Rhodesia. Salisbury: Trustees, National Museums and Monuments,
Zimbabwe-Rhodesia.
Stephens, D.W. & Krebs, J.R. (1986). Foraging theory. Princeton, NJ: Princeton
University Press.
Stuart, C.T. (1977). The distribution, status, feeding and reproduction of carnivores of
the Cape Province. Research Report, Dept Nat. & Environ. Cons. Mammals: 91-174.
Stuart, C.T. (1981). Notes on the mammalian carnivores of the Cape Province, South
Africa. Bontebok 1: 1-58.
Sunquist, M. & Sunquist, F. (2002). Wild cats of the World. Chicago: University of
Chicago Press.
Tryjanowski, P., Antczak, M., Hromada, M., Kuczynski, L. & Skoracki, M. (2002).
Winter feeding ecology of male and female European wild cats Felis silvestris in
Slovakia. Z. Jagdwiss. 48: 49-54.
Van Rooyen, N., Van Rensburg, D.J., Theron, G.K. & Bothma, J Du P. (1984). A
preliminary report on the dynamics of the vegetation of the Kalahari Gemsbok National
Park. Koedoe (Suppl.) 1984: 83-102.
Van Rooyen, T.H. (1984). The soils of the Kalahari Gemsbok National Park. Koedoe
(Suppl.) 1984: 45-63.
Zielinski, W.J. (1988). The influence of daily variation in foraging cost on the activity of
small carnivores. Anim. Behav. 36: 239-249.
Chapter 3: Foraging behaviour and habitat use
43
CHAPTER 3
Foraging behaviour and habitat use of the African wild cat, Felis silvestris in the
Kgalagadi Transfrontier Park
1. Abstract
The foraging behaviour and habitat use of eight habituated African wild cats (Felis silvestris)
were investigated over 46 months in the Kgalagadi Transfrontier Park through direct
observations. Hunting was typically felid with three distinct hunting behaviours identified: (i) a
slow winding walk while inspecting holes and scent trails, (ii) sitting and looking around for
prey, or (iii) fast walking while spray marking with opportunistic killing of prey, typical of male
cats. Both sexes show two daily peaks of activity, in the early morning and the evenings. The
timing of the two active periods shows strong seasonal shifts from predominantly nocturnal
during the hotter seasons to more diurnal during the colder seasons. A longer period of
activity during the day was observed during the cold-dry season with corresponding low food
availability, apparently a behavioural response to low prey abundances. Male and female
African wild cats differed very little in their activity budgets, with hunting taking up most of
their time. African wild cats are solitary and socialising between individuals is minimal. Cats
show gender-specific preferences for specific habitat types, with the number of prey captured
corresponding closely to the time spent in each habitat. It appears that the major factors
influencing the activity patterns and habitat use of the African wild cat in the southern
Kalahari are prey abundance and temperature extremes.
Key words: foraging behaviour, activity patterns, time budgets, African wild cat, Felis
silvestris, southern Kalahari
2. Introduction
Time and energy budgets vary widely between mammals and the time allocated to foraging
is important (Bekoff & Wells, 1981; Armitage, Salsbury, Barthelmess, Gray & Kovaach,
1996), although sufficient time is also necessary for other activities for example, mating,
defence of resources and predator avoidance (Bekoff & Wells, 1981; Armitage et al., 1996).
Even periods of inactivity may be adaptive (Herbers, 1981) and essential for digestion
(Diamond, Karasov, Phan & Carpenter, 1986), energy conservation and avoidance of
potentially dangerous situations (Meddis, 1983). Time allocated to specific activities may be
influenced by environmental conditions (Armitage et al., 1996). For example, raccoon dogs
(Nyctereutes procyonoides) may hibernate where they occur in habitats with harsh winters
like Finland and Russia, but remain active during milder winter conditions in Japan (Kauhala
& Saeki, 2004). Animals may also synchronize their predatory activities with the activity
Chapter 3: Foraging behaviour and habitat use
44
periods of their primary prey (Curio, 1976), for example pine marten (Martes americana)
activity appears to follow that of their primary prey rather than ambient temperature (Zielinski,
Spencer & Barrett, 1983).
All animals show some form of regularity in their daily behavioural patterns and habits
(Manning & Dawkins, 1995). Wild cats are described as either strictly nocturnal (Smithers,
1983; Sunquist & Sunquist, 2002) or arrhythmic (Gittleman, 1989). However, despite their
wide distribution very little is known about their free-ranging activities and time budgets in the
wild. By contrast, detailed studies on the foraging behaviour of larger felids exist, for
example: lion, Panthera leo (Eloff, 1984; Stander, 1992), leopards, Panthera pardus (Bailey,
1993) and cheetah, Acinonyx jubatus (Caro, 1994) and even for some smaller cats like feral
domestic cats, Felis silvestris catus (Panaman, 1981; Dards, 1983); black-footed cats, Felis
nigripes (Sliwa, 1994) and bobcats, Lynx rufus (Rollings, 1945; Beasom & Moore, 1977).
The African wild cat (Felis silvestris cafra) is an opportunistic predator and although rodents
are the preferred prey, a variety of other prey may be taken, depending on prey availability
(Chapter 2). African wild cats are sexually dimorphic, with male cats approximately 31%
larger than females (Chapter 2). In carnivores, the limiting resource for females is usually
food, while the limiting resource for males is receptive females (Sandell, 1989). Therefore, it
may be expected that males and females will partition their time differently, especially as a
result of different energetic demands of reproduction and parental care. This has been
shown to be the case in the domestic cat (F. s. catus) (Turner & Meister, 1988); the black-
footed cat (F. nigripes) (Sliwa, 2006) and leopards (P. pardus) (Bothma & Coertze, 2004).
By shifting the timing of a specific activity period, animals might also influence the costs and
benefits of that particular activity (Begg, 2001). If foraging costs change as a function of the
time of day of an activity, the predators should distribute their activity periods to maximise the
net foraging benefits (Pyke, Pulliam & Charnov, 1977). Prey may exhibit a daily cycle of
activity (nocturnal, diurnal and crepuscular) (Zielinski, 1986) and carnivores that are able to
anticipate circadian peaks in prey activity can be expected to be more successful at foraging
than carnivores that forage randomly (Zielinski, 1986). Numerous studies have shown
predators to synchronize their activity with prey activity, for example, in American marten,
Martes martes (Zielinski et al., 1983; Clevenger, 1993); American kestrel, Falco tinnunculus
(Rijnsdorp, Daan & Dijkstra, 1981); Ethiopean wolf, Canis simensis (Sillero-Zubiri & Gotelli,
1995); pangolin, Manis temminckii (Swart, Richardson & Ferguson, 1999) and leopard, P.
pardus (Jenny & Zuberbühler, 2005).
Chapter 3: Foraging behaviour and habitat use
45
On a seasonal scale, the daily routine of animals and the time spent on different activities
may be seen as strategies for coping with changes in the environment, for example changes
in prey numbers or habits, variation in temperature, vegetative cover, and activities of
predators (Gittleman & Thompson, 1988; Manning & Dawkins, 1995). In a multi-prey system,
predators select different kinds of prey according to their availability where availability is a
function of both prey abundance and anti-predator behaviour or vulnerability. Prey availability
is likely to fluctuate as a result of seasonal changes in abundance, through reproduction or
migration, but also through temporal or seasonal changes in behaviour that make prey more
vulnerable, for instance during the mating season (Caro & FitzGibbon, 1992). Prey
preferences are expected to mirror these fluctuations.
Habitat selection by animals can be described on three different spatial scales (Johnson
1980): (i) the geographic distribution of the species, (ii) the habitat selection within home
ranges, and (iii) the habitat choice or preference for the individual (Neu, Byers & Peek, 1974;
Dunstone, Durbin, Wyllie, Freer, Jamett, Mazzolli & Rose, 2002). In our study we focussed
on the habitat selection within the study site and the individual animal and sexual differences
in habitat choice and utilisation. It is widely accepted that habitat preferences and utilisation
by predators are predominantly determined by their primary prey abundances (McNab, 1963;
Bailey, 1979; Knick, 1990; Morrison, 2001) and climatic conditions as well as the availability
of protective cover (Bushkirk, 1984; Johnson & Franklin, 1991; Fernandez & Palomares,
2000; Palomares, 2001). In general, movement patterns between genders differ, with males
moving further and at greater rates than females for example, the bobcat, Lynx rufus (Bailey,
1974; Chamberlain, Leopold & Conner, 2003); Geoffroy’s cat, Felis geoffroyi (Johnson &
Franklin, 1991) and the African wild cat F. s. cafra, (Chapter 4). Therefore, we would expect
that in the African wild cat, sexual differences in habitat use will be evident.
The aim of this chapter is to analyse: (i) the foraging behaviour of free-ranging African wild
cats in their natural habitat, (ii) their activity patterns, particularly pertaining to changes in
prey abundance, seasonal climatic influences and differences between male and female cats
and (iii) habitat utilisation in their natural surroundings.
3. Material and Methods
3.1 Study area
The study was conducted in the Kgalagadi Transfrontier Park (KTP) from March 2003 to
December 2006 (46 months). The study area was along the southern part of the Nossob
riverbed and surrounding dune areas (26°28’17.7”S, 20°36’45.2”E) (Fig. 3.1). The KTP,
incorporating the Kalahari Gemsbok National Park (South Africa) and the neighbouring
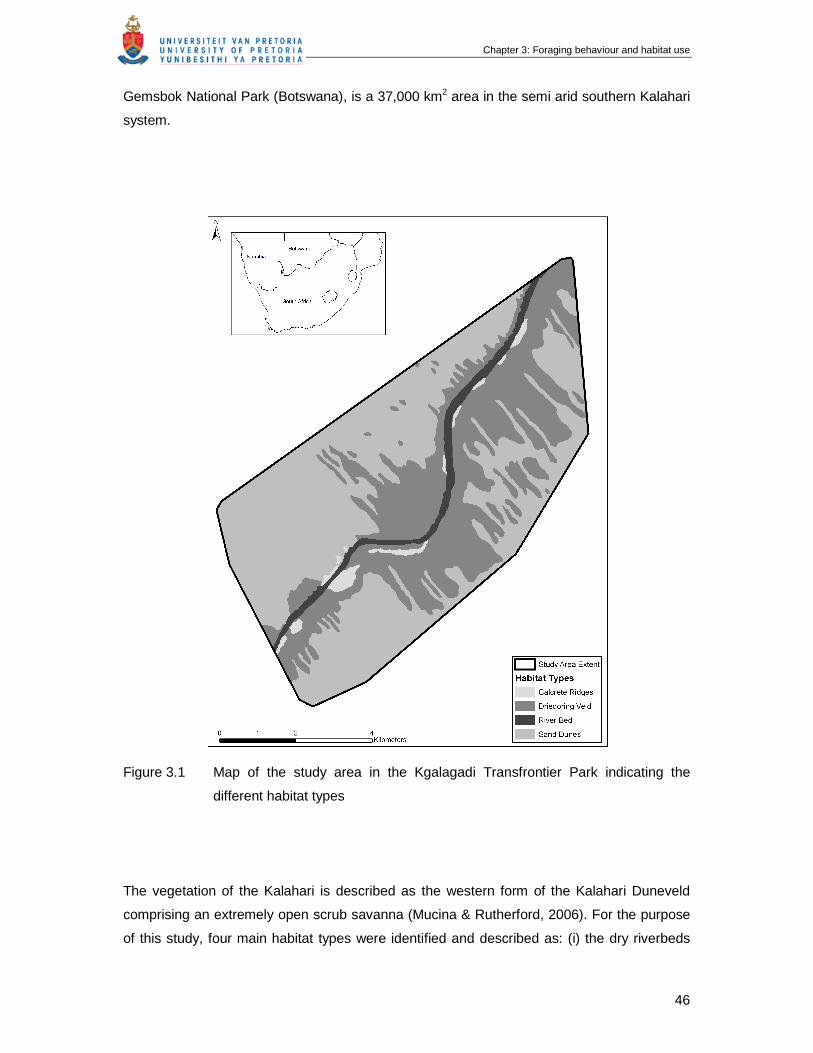
Chapter 3: Foraging behaviour and habitat use
46
Gemsbok National Park (Botswana), is a 37,000 km2 area in the semi arid southern Kalahari
system.
Figure 3.1 Map of the study area in the Kgalagadi Transfrontier Park indicating the
different habitat types
The vegetation of the Kalahari is described as the western form of the Kalahari Duneveld
comprising an extremely open scrub savanna (Mucina & Rutherford, 2006). For the purpose
of this study, four main habitat types were identified and described as: (i) the dry riverbeds
Chapter 3: Foraging behaviour and habitat use
47
and immediate riparian surroundings, (ii) the adjacent Rhigozum veld, (iii) calcrete ridges and
limestone plains and (iv) sandy dune areas (Fig 3.1).
The dry fossil riverbeds are dominated by large camelthorn trees Acacia erioloba, smaller A.
haematoxylon, bushy A. mellifera, the scrub Galenia africana and perennial grasses.
Although the rivers usually contain no surface water and only cover a small percentage of the
area, they are very important in the ecosystem. They sustain a diverse animal life in the
Kalahari by providing suitable grazing, water and habitat diversity (Van Rooyen, 2001).
Located adjacent to the riverbeds, are thick stands of Rhigozum trichotomum and large
limestone plains compacted with pink to white sands. These plains are characterised by a
scrub savanna cover, it is dominated by dense dwarf scrubs of Rhigozum trichotomum
(driedoring), Monechma incanum (blouganna), Aptosimum albomarginatum as well as
dominant grass species such as the perennial small bushman grass (Stipagrostis obtusa),
Kalahari sour grass (Schmidtia kalihariensis), tall bushman grass (Stipagrostis ciliata) and
silky bushman grass (Stipagrostis uniplumis), interspersed with scattered camel thorn (A.
erioloba) trees. The calcrete ridges were sloping slides adjacent the riverbed with rocky
stretches into the Rhigozum veld.
The dune habitat consists of loose sand and tall perennial grasses, such as, Stipagrostis
amabilis, Eragrostis trichophora, and E. lehmanniana. Dominant scrub species in the dune
areas are the dune bush (Crotalaria spartioides), lusern bush (Hermannia tomentosa) and
the gemsbok cucumber (Acanthosicyos naudinianus). Occasional smaller camelthorn and
grey camelthorn trees, as well as shepherd’s trees (Boscia albitrunca) are present. For more
detailed descriptions of the vegetation see Bothma & De Graaf (1973) and van Rooyen, van
Rensburg, Theron & Bothma (1984).
3.2 Climate and rainfall
The study site is characterised by low, irregular annual rainfall (Mills & Retief, 1984),
receiving between 200mm and 250mm annually. The irregularity of the rainfall plays a major
role in the vegetation of the KTP (Leistner, 1967) and these cycles influence the availability
of food and animal movement patterns (Van Rooyen, 1984). Rodent numbers in the Kalahari
fluctuate seasonally, slowly increasing as rainfall increases, followed by rapid declines (Nel,
Rautenbach, Els & De Graaf, 1984). These rodent fluctuations are driven by indirect effects
of rainfall, primarily on seed production and vegetation cover (Nel et al., 1984).
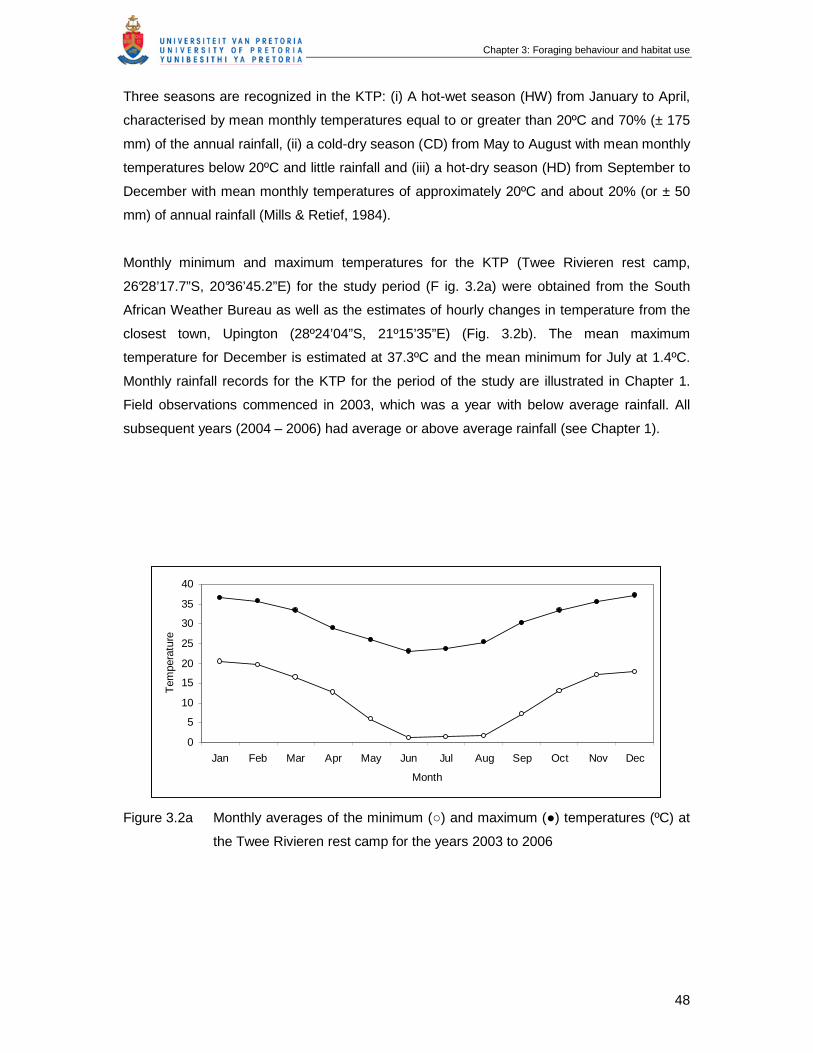
Chapter 3: Foraging behaviour and habitat use
48
Three seasons are recognized in the KTP: (i) A hot-wet season (HW) from January to April,
characterised by mean monthly temperatures equal to or greater than 20ºC and 70% (± 175
mm) of the annual rainfall, (ii) a cold-dry season (CD) from May to August with mean monthly
temperatures below 20ºC and little rainfall and (iii) a hot-dry season (HD) from September to
December with mean monthly temperatures of approximately 20ºC and about 20% (or ± 50
mm) of annual rainfall (Mills & Retief, 1984).
Monthly minimum and maximum temperatures for the KTP (Twee Rivieren rest camp,
26°28’17.7”S, 20°36’45.2”E) for the study period (F ig. 3.2a) were obtained from the South
African Weather Bureau as well as the estimates of hourly changes in temperature from the
closest town, Upington (28º24’04”S, 21º15’35”E) (Fig. 3.2b). The mean maximum
temperature for December is estimated at 37.3ºC and the mean minimum for July at 1.4ºC.
Monthly rainfall records for the KTP for the period of the study are illustrated in Chapter 1.
Field observations commenced in 2003, which was a year with below average rainfall. All
subsequent years (2004 – 2006) had average or above average rainfall (see Chapter 1).
0
5
10
15
20
25
30
35
40
Jan Feb Mar Apr May Jun Jul Aug Sep Oct Nov Dec
Month
Tem
pera
ture
Figure 3.2a Monthly averages of the minimum (○) and maximum (●) temperatures (ºC) at
the Twee Rivieren rest camp for the years 2003 to 2006
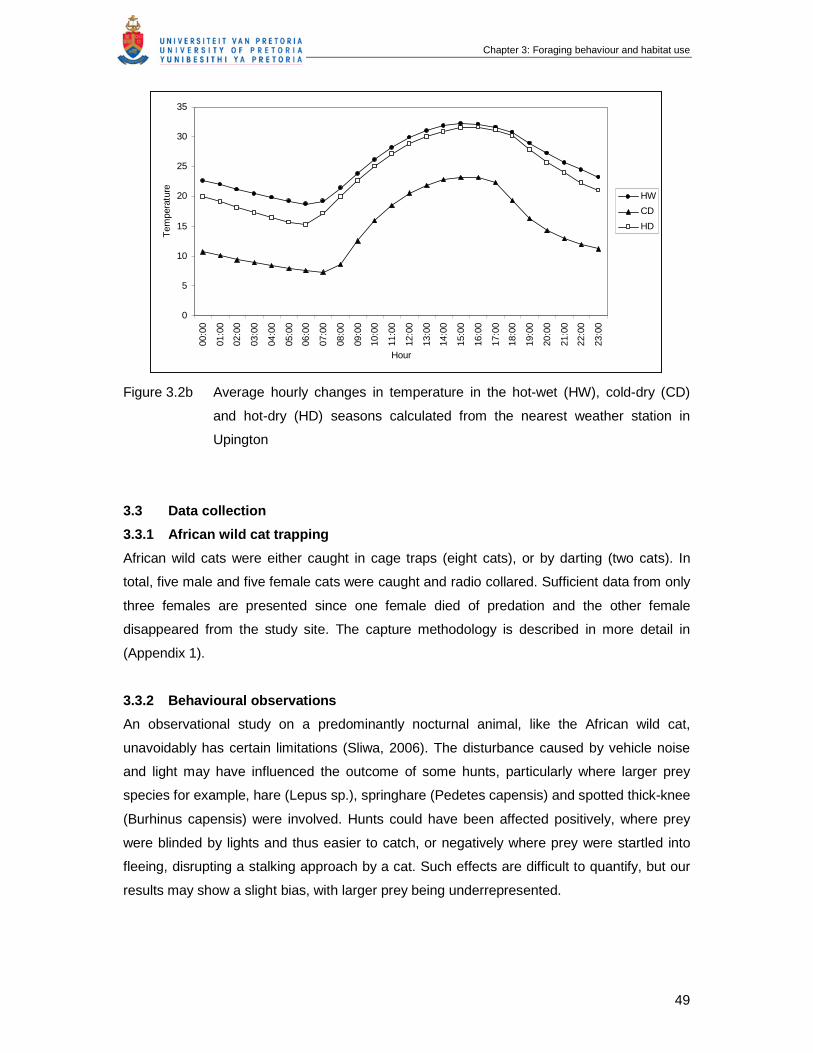
Chapter 3: Foraging behaviour and habitat use
49
0
5
10
15
20
25
30
35
00:0
0
01:0
0
02:0
0
03:0
0
04:0
0
05:0
0
06:0
0
07:0
0
08:0
0
09:0
0
10:0
0
11:0
0
12:0
0
13:0
0
14:0
0
15:0
0
16:0
0
17:0
0
18:0
0
19:0
0
20:0
0
21:0
0
22:0
0
23:0
0
Hour
Tem
pera
ture
HW
CD
HD
Figure 3.2b Average hourly changes in temperature in the hot-wet (HW), cold-dry (CD)
and hot-dry (HD) seasons calculated from the nearest weather station in
Upington
3.3 Data collection
3.3.1 African wild cat trapping
African wild cats were either caught in cage traps (eight cats), or by darting (two cats). In
total, five male and five female cats were caught and radio collared. Sufficient data from only
three females are presented since one female died of predation and the other female
disappeared from the study site. The capture methodology is described in more detail in
(Appendix 1).
3.3.2 Behavioural observations
An observational study on a predominantly nocturnal animal, like the African wild cat,
unavoidably has certain limitations (Sliwa, 2006). The disturbance caused by vehicle noise
and light may have influenced the outcome of some hunts, particularly where larger prey
species for example, hare (Lepus sp.), springhare (Pedetes capensis) and spotted thick-knee
(Burhinus capensis) were involved. Hunts could have been affected positively, where prey
were blinded by lights and thus easier to catch, or negatively where prey were startled into
fleeing, disrupting a stalking approach by a cat. Such effects are difficult to quantify, but our
results may show a slight bias, with larger prey being underrepresented.
Chapter 3: Foraging behaviour and habitat use
50
After an initial habituation period of approximately a week, during which the cats were
followed in a vehicle using radio telemetry at a distance of 50 to 100m, visual contact was
gradually established until the cats could be followed at 10 – 30m depending on visibility
without any obvious influence on their behaviour. During the course of the study 1,538 hours
were spent observing habituated cats (499 hours of diurnal and 1,039 hours of nocturnal
observations). Different cats were observed on successive nights on a rotating system and
followed for 6.0 ± 3.2 hours of direct observation per observation period (n = 382 observation
periods). Thick vegetation and long grass sometimes precluded direct visual contact with the
cats for short periods.
A 1,000,000 candle power spotlight was used occasionally during night observations,
although the light provided by the vehicle was generally sufficient to allow observations and
recording of the prey type. When used, the beam of the spotlight was directed slightly behind
the cat to avoid illuminating the cat or prey item.
3.4 Definition of terms
A cat was considered to be active when engaged in actions requiring physical action, i.e. not
sleeping or resting. All behaviours were divided into five categories (resting, foraging, eating,
social and other) and were recorded to the nearest minute. These activities are described as
follows:
3.4.1 Resting: Resting or sleeping or out of sight, inactive.
The cat lying on its side with head resting on body, or head up with eyes closed or
out of sight in thick vegetation or a hole in the ground without emitting a sound or
sign of movement.
3.4.2 Foraging: Moving stealthily through its territory while watching and listening for
signs of prey activity, or obviously waiting in ambush (Sunquist & Sunquist, 2002).
(i) Searching/travelling: Actively looking for prey, walking fast or slowly winding around
with frequent investigation of holes and scent trails.
(ii) Sitting: Sitting down and scanning its surroundings for movement.
(iii) Stalking: A stealthy approach of a visible prey item, generally with its body close to
the ground.
3.4.3 Eating: Obviously chewing or ingesting a food item or actively engaged in subduing
a prey item.

Chapter 3: Foraging behaviour and habitat use
51
3.4.4 Social activities: Intraspecific activities and scent marking.
(i) Intraspecific interactions: any activity where two adult African wild cats responded
to each other’s actions directly or staring over a distance. This includes male-male,
male-female and female-female interactions and may be hostile or friendly.
(ii) Scent marking: Specific behaviour associated with depositing scent marks on
objects in the environment. This includes rubbing of face and cheek on objects,
urinating and defecation.
3.4.5 Other activities: Grooming, playing, rolling in sand, predator avoidance and
interspecific interactions.
(i) Grooming: Periods spent licking and cleaning fur. Grooming events of less than
one minute were not included.
(ii) Playing: Actively playing and hitting a prey item, throwing it into the air but not
eating the prey item.
(iii) Rolling in sand: Rolling in sand several times before standing up, shaking the
sand off and continuing.
(iv) Predator avoidance: When a cat hides in thick vegetation or runs away from a
potential dangerous situation or approaching predator.
(v) Interspecific interactions: any interaction between cats and other small predators
such as, black-backed jackals (Canis mesomelas), Cape foxes (Vulpes vulpes) and
small spotted genet (Genetta genetta).
A hunting attempt is defined as one or all of the following events: moving towards a prey item
either with increased speed and attentiveness or at a slow, stealthy stalk; and the settling of
the back feet and pouncing or chasing of a prey item. A hunting attempt may be either
successful or unsuccessful.
3.5 Data analysis
Unequal periods spent observing different cats were standardised by converting each activity
type to a percentage time spent on that activity per hour and deriving mutually comparable
activity schedules from this. Appendix 3 shows the overall amount of time spent observing
habituated African wild cats for each hour of the day in each season. The average time of
sunset and sunrise for each season was calculated from a GPS location (Leeudril waterhole)
in the centre of the study area and activities were denoted as nocturnal and diurnal
depending whether they took place after or before sunset, respectively. A Spearman rank (rs)
correlation was used to assess if the time an activity started or ended correlated with the time
of sunset or sunrise. Throughout the analyses differences between sexes were evaluated
Chapter 3: Foraging behaviour and habitat use
52
and where no differences were found (significance set at P ≤ 0.05) data for the sexes were
pooled.
For the analysis of time budgets and active periods only data from observation periods
lasting at least eight continuous hours or more were used (female: n = 54 observation
periods and male: n = 53 observation periods). The time spent engaged in each category
(minutes) is represented as a proportion of the cumulative observation period. The total
number of minutes active (log10) were normally distributed but the variances were not
homogenous. Thus, to compare differences in seasonal activity for both sexes a general
linear factorial ANOVA was used (Zar, 1999) and analysed statistically with two sided t-tests
(here time spent (minutes) were used instead of proportions) (Statistica 7.1 StatSoft, Inc.
2006). The means were back transformed for presentation (Zar, 1999). The difference in
habitat utilisation between male and female cats was tested with a general linear analysis of
covariance (Zar 1999). The time spent in the different habitats (minutes) were normally
distributed (Statistica 7.1 StatSoft, Inc. 2006).
A 2.5m resolution satellite SPOT5 image (from CSIR, 2005 series) was used to map the
vegetation boundaries and features of the terrain. Habitat patches were categorised and
areas (m2) calculated on the satellite image, which was digitised on-screen with ArcGIS 9.0,
projection WGS84 (ESRI software). Non-parametric tests (Kruskal Wallis test and Mann
Whitney U-test) were used to test seasonal and sexual differences in hunting behaviour
(Siegel, 1956). Consumption rate was determined as the total biomass consumed per night
in grams, expressed as the total distance travelled that night to allow comparisons with other
studies.
4. Results
4.1.1 Feeding and foraging behaviour
Results on the diet and feeding habits of African wild cats are described in Chapter 2. During
the 1,538 hours of direct observation of eight African wild cats (three females and five
males), 3,676 hunting attempts on prey ranging from invertebrates to mammals were
recorded, of which 2,553 (80%) were successful. In all, 2,050 hunting attempts by female
cats were recorded of which 87% were successful, while 1,123 were recorded for males of
which 69% were successful (Table 3.1). After a successful hunt the prey was either
consumed on the spot or carried away into cover and then eaten. The remains of larger prey
such as hares were cached and returned to later.
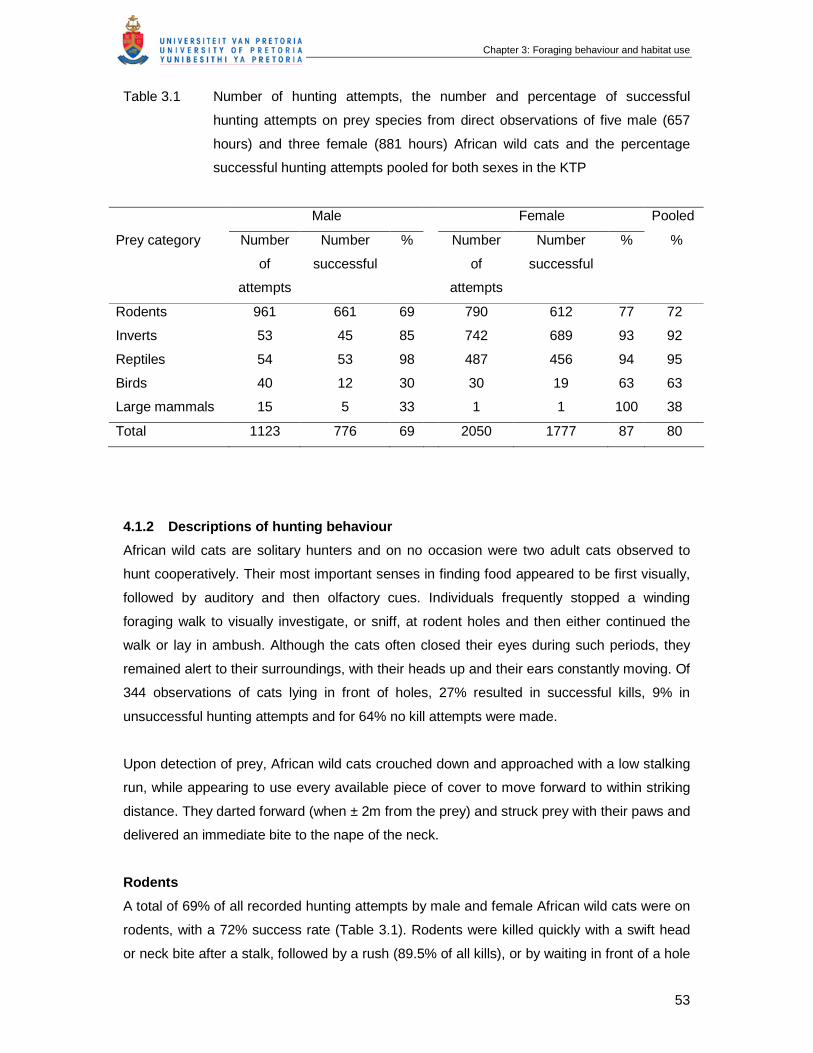
Chapter 3: Foraging behaviour and habitat use
53
Table 3.1 Number of hunting attempts, the number and percentage of successful
hunting attempts on prey species from direct observations of five male (657
hours) and three female (881 hours) African wild cats and the percentage
successful hunting attempts pooled for both sexes in the KTP
Male Female Pooled
Prey category Number
of
attempts
Number
successful
% Number
of
attempts
Number
successful
% %
Rodents 961 661 69 790 612 77 72
Inverts 53 45 85 742 689 93 92
Reptiles 54 53 98 487 456 94 95
Birds 40 12 30 30 19 63 63
Large mammals 15 5 33 1 1 100 38
Total 1123 776 69 2050 1777 87 80
4.1.2 Descriptions of hunting behaviour
African wild cats are solitary hunters and on no occasion were two adult cats observed to
hunt cooperatively. Their most important senses in finding food appeared to be first visually,
followed by auditory and then olfactory cues. Individuals frequently stopped a winding
foraging walk to visually investigate, or sniff, at rodent holes and then either continued the
walk or lay in ambush. Although the cats often closed their eyes during such periods, they
remained alert to their surroundings, with their heads up and their ears constantly moving. Of
344 observations of cats lying in front of holes, 27% resulted in successful kills, 9% in
unsuccessful hunting attempts and for 64% no kill attempts were made.
Upon detection of prey, African wild cats crouched down and approached with a low stalking
run, while appearing to use every available piece of cover to move forward to within striking
distance. They darted forward (when ± 2m from the prey) and struck prey with their paws and
delivered an immediate bite to the nape of the neck.
Rodents
A total of 69% of all recorded hunting attempts by male and female African wild cats were on
rodents, with a 72% success rate (Table 3.1). Rodents were killed quickly with a swift head
or neck bite after a stalk, followed by a rush (89.5% of all kills), or by waiting in front of a hole
Chapter 3: Foraging behaviour and habitat use
54
for up to 30 minutes (10% of all kills). Cats were observed to hunt opportunistically when they
were resting and would rush over when rodents venture too close to the resting cat (0.5%).
Rodents were eaten whole within 10 seconds to three minutes, depending on size. The
heads were eaten first and tails swallowed at the end. Larger rodents were sometimes
eviscerated, the stomach and intestines not being eaten. In <1% of all rodent prey the
entrails and stomach were buried: females in the presence of kittens always buried the
remains. Females with dependant kittens (2 – 3 months old) had a 78% success rate in
catching prey, of which 54% of their kills were carried to the kittens (number of kills n = 168).
Damaraland mole-rats (Fukomys damarensis) were caught on three occasions. Mole-rats
seldom venture above ground and are easy prey when they do, having poor vision and
responding to perceived threats by remaining stationary and making threatening displays
with their large incisors (Bennett & Faulkes, 2000). Mole-rats were simply picked up and
eaten from the tail end forwards, leaving the heads with large incisors behind. This is in
contrast with the feeding behaviour on other rodents and probably due to the incisors of
mole-rats being too large to digest.
Invertebrates
Invertebrates were primarily consumed when rodent numbers were low and consisted of lace
wings (Neuroptera), locusts (Orthoptera), moths (Lepidoptera) and scorpions (Scorpionidae)
(see Chapter 2). Insects were caught by being pinned to the ground or removed from grass
stalks with paws and then grabbed with the mouth. On three occasions a large scarab beetle
(Coleoptera) was encountered and left after some handling. The beetles were not killed but
investigated, sniffed and picked up and then left behind. Scorpions (n = 5) were caught by
repeated paw strikes alternated with jumping retreats until they could be pinned to the
ground. Our data might indicate that females were catching more invertebrates than male
cats, however, with the onset of the study in 2003 when rodent numbers were low, only
female cats were radio collared and observed.
Reptiles
African wild cats had a 95% success rate in catching reptiles. Reptiles were spotted when
they moved, cats rushed at them and smaller reptiles like barking geckos, Ptenopus
garrulous (n = 488) were simply picked up and consumed whole. Larger geckos and agamas
(ground gecko, Chondrodactylus angulifer (n = 34), ground agama, Agama aculeate (n = 13)
and Kalahari tree skink, Mabuya occidentalis (n = 5)) were chased, pinned to the ground and
then eaten alive. Sand snakes (Psammophis sp.) (n = 5) were chased and grabbed in the
middle of the body and bitten in two. Snakes were consumed whole, although they were
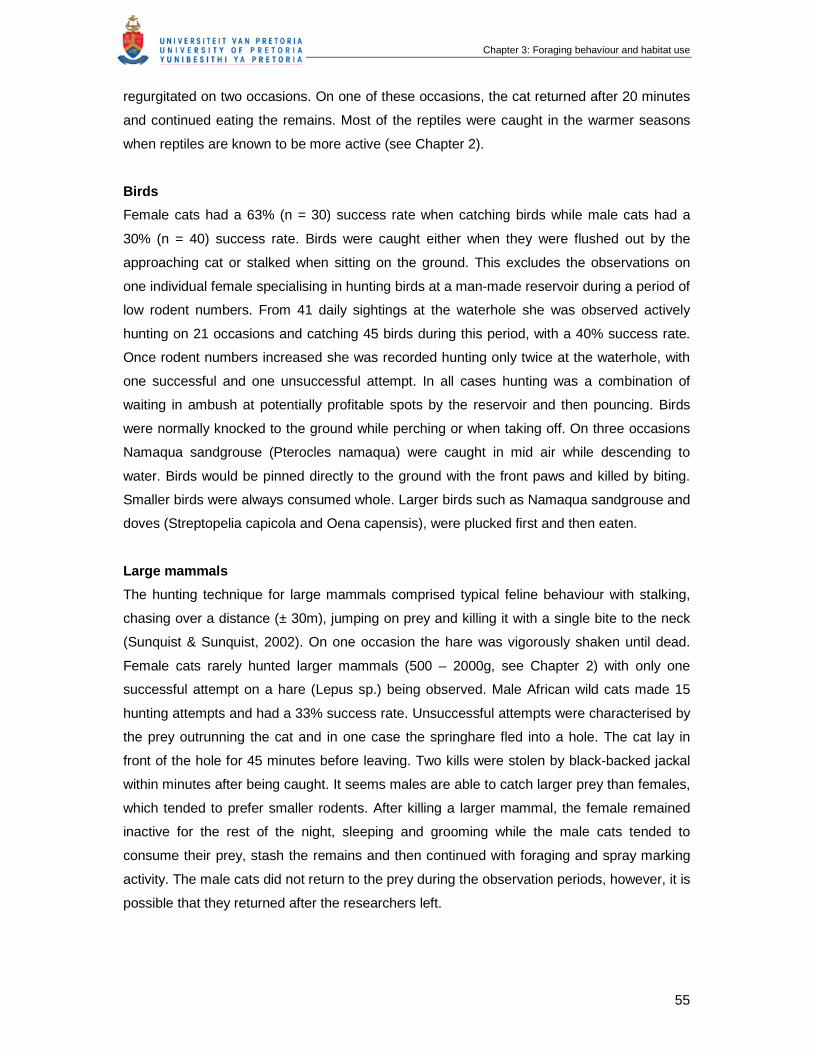
Chapter 3: Foraging behaviour and habitat use
55
regurgitated on two occasions. On one of these occasions, the cat returned after 20 minutes
and continued eating the remains. Most of the reptiles were caught in the warmer seasons
when reptiles are known to be more active (see Chapter 2).
Birds
Female cats had a 63% (n = 30) success rate when catching birds while male cats had a
30% (n = 40) success rate. Birds were caught either when they were flushed out by the
approaching cat or stalked when sitting on the ground. This excludes the observations on
one individual female specialising in hunting birds at a man-made reservoir during a period of
low rodent numbers. From 41 daily sightings at the waterhole she was observed actively
hunting on 21 occasions and catching 45 birds during this period, with a 40% success rate.
Once rodent numbers increased she was recorded hunting only twice at the waterhole, with
one successful and one unsuccessful attempt. In all cases hunting was a combination of
waiting in ambush at potentially profitable spots by the reservoir and then pouncing. Birds
were normally knocked to the ground while perching or when taking off. On three occasions
Namaqua sandgrouse (Pterocles namaqua) were caught in mid air while descending to
water. Birds would be pinned directly to the ground with the front paws and killed by biting.
Smaller birds were always consumed whole. Larger birds such as Namaqua sandgrouse and
doves (Streptopelia capicola and Oena capensis), were plucked first and then eaten.
Large mammals
The hunting technique for large mammals comprised typical feline behaviour with stalking,
chasing over a distance (± 30m), jumping on prey and killing it with a single bite to the neck
(Sunquist & Sunquist, 2002). On one occasion the hare was vigorously shaken until dead.
Female cats rarely hunted larger mammals (500 – 2000g, see Chapter 2) with only one
successful attempt on a hare (Lepus sp.) being observed. Male African wild cats made 15
hunting attempts and had a 33% success rate. Unsuccessful attempts were characterised by
the prey outrunning the cat and in one case the springhare fled into a hole. The cat lay in
front of the hole for 45 minutes before leaving. Two kills were stolen by black-backed jackal
within minutes after being caught. It seems males are able to catch larger prey than females,
which tended to prefer smaller rodents. After killing a larger mammal, the female remained
inactive for the rest of the night, sleeping and grooming while the male cats tended to
consume their prey, stash the remains and then continued with foraging and spray marking
activity. The male cats did not return to the prey during the observation periods, however, it is
possible that they returned after the researchers left.
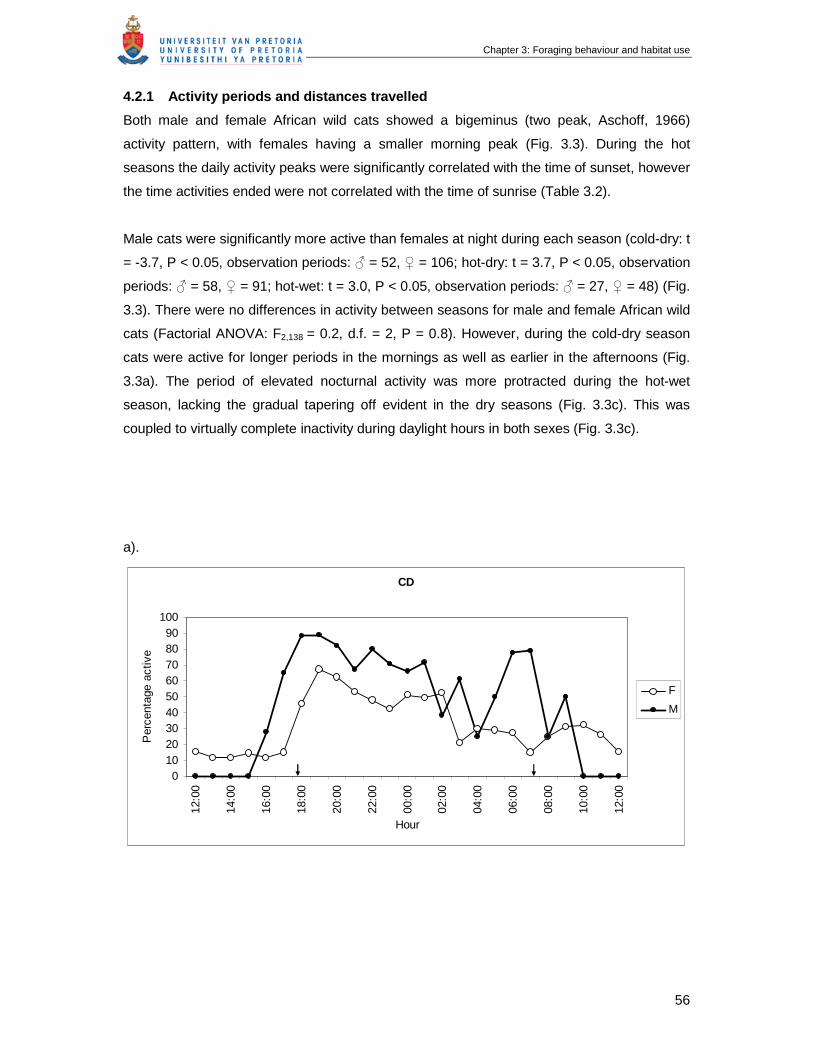
Chapter 3: Foraging behaviour and habitat use
56
4.2.1 Activity periods and distances travelled
Both male and female African wild cats showed a bigeminus (two peak, Aschoff, 1966)
activity pattern, with females having a smaller morning peak (Fig. 3.3). During the hot
seasons the daily activity peaks were significantly correlated with the time of sunset, however
the time activities ended were not correlated with the time of sunrise (Table 3.2).
Male cats were significantly more active than females at night during each season (cold-dry: t
= -3.7, P < 0.05, observation periods: ♂ = 52, ♀ = 106; hot-dry: t = 3.7, P < 0.05, observation
periods: ♂ = 58, ♀ = 91; hot-wet: t = 3.0, P < 0.05, observation periods: ♂ = 27, ♀ = 48) (Fig.
3.3). There were no differences in activity between seasons for male and female African wild
cats (Factorial ANOVA: F2,138 = 0.2, d.f. = 2, P = 0.8). However, during the cold-dry season
cats were active for longer periods in the mornings as well as earlier in the afternoons (Fig.
3.3a). The period of elevated nocturnal activity was more protracted during the hot-wet
season, lacking the gradual tapering off evident in the dry seasons (Fig. 3.3c). This was
coupled to virtually complete inactivity during daylight hours in both sexes (Fig. 3.3c).
a).
CD
0102030405060708090
100
12:0
0
14:0
0
16:0
0
18:0
0
20:0
0
22:0
0
00:0
0
02:0
0
04:0
0
06:0
0
08:0
0
10:0
0
12:0
0
Hour
Per
cent
age
activ
e
F
M
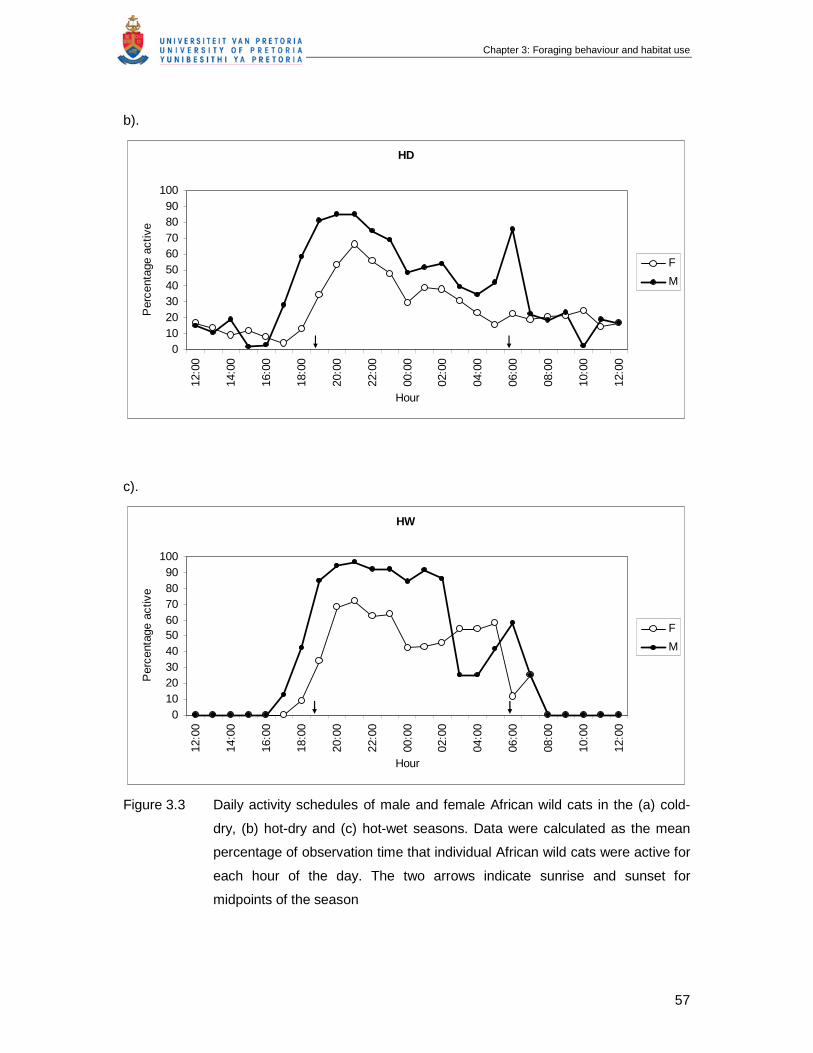
Chapter 3: Foraging behaviour and habitat use
57
b).
HD
0102030405060708090
10012
:00
14:0
0
16:0
0
18:0
0
20:0
0
22:0
0
00:0
0
02:0
0
04:0
0
06:0
0
08:0
0
10:0
0
12:0
0
Hour
Per
cent
age
activ
e
F
M
c).
HW
0102030405060708090
100
12:0
0
14:0
0
16:0
0
18:0
0
20:0
0
22:0
0
00:0
0
02:0
0
04:0
0
06:0
0
08:0
0
10:0
0
12:0
0
Hour
Per
cent
age
activ
e
F
M
Figure 3.3 Daily activity schedules of male and female African wild cats in the (a) cold-
dry, (b) hot-dry and (c) hot-wet seasons. Data were calculated as the mean
percentage of observation time that individual African wild cats were active for
each hour of the day. The two arrows indicate sunrise and sunset for
midpoints of the season
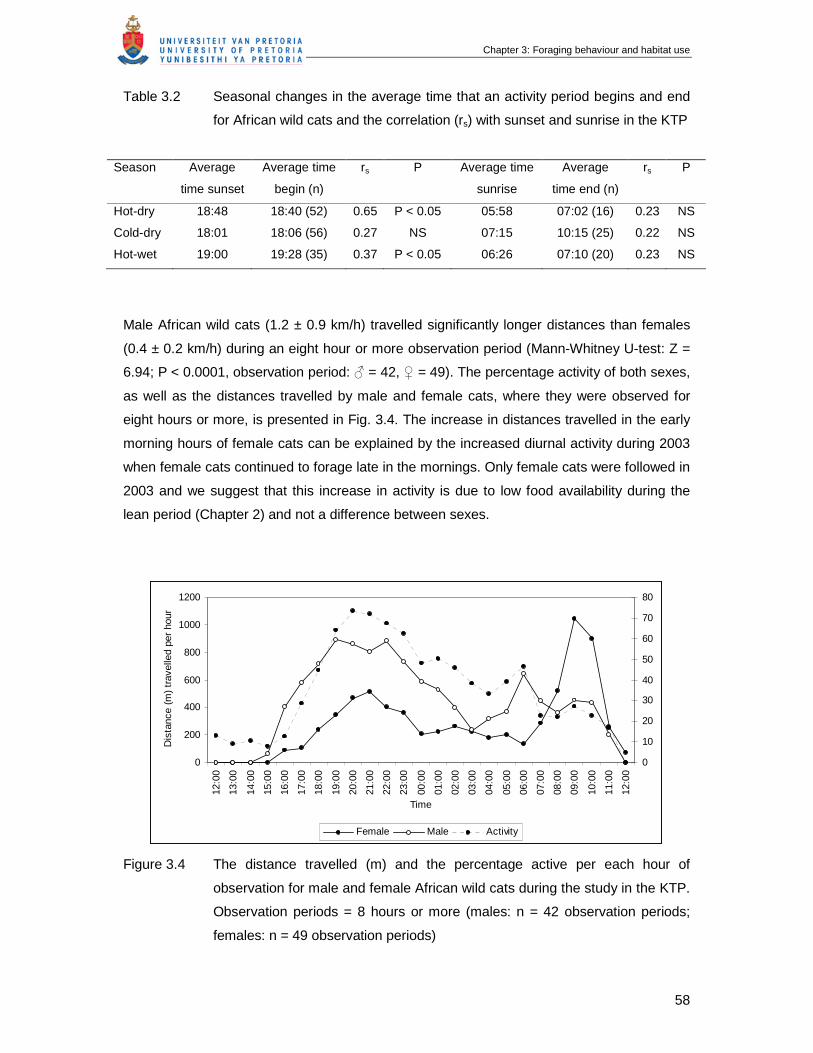
Chapter 3: Foraging behaviour and habitat use
58
Table 3.2 Seasonal changes in the average time that an activity period begins and end
for African wild cats and the correlation (rs) with sunset and sunrise in the KTP
Season Average
time sunset
Average time
begin (n)
rs P Average time
sunrise
Average
time end (n)
rs P
Hot-dry 18:48 18:40 (52) 0.65 P < 0.05 05:58 07:02 (16) 0.23 NS
Cold-dry 18:01 18:06 (56) 0.27 NS 07:15 10:15 (25) 0.22 NS
Hot-wet 19:00 19:28 (35) 0.37 P < 0.05 06:26 07:10 (20) 0.23 NS
Male African wild cats (1.2 ± 0.9 km/h) travelled significantly longer distances than females
(0.4 ± 0.2 km/h) during an eight hour or more observation period (Mann-Whitney U-test: Z =
6.94; P < 0.0001, observation period: ♂ = 42, ♀ = 49). The percentage activity of both sexes,
as well as the distances travelled by male and female cats, where they were observed for
eight hours or more, is presented in Fig. 3.4. The increase in distances travelled in the early
morning hours of female cats can be explained by the increased diurnal activity during 2003
when female cats continued to forage late in the mornings. Only female cats were followed in
2003 and we suggest that this increase in activity is due to low food availability during the
lean period (Chapter 2) and not a difference between sexes.
0
200
400
600
800
1000
1200
12:0
0
13:0
0
14:0
0
15:0
0
16:0
0
17:0
0
18:0
0
19:0
0
20:0
0
21:0
0
22:0
0
23:0
0
00:0
0
01:0
0
02:0
0
03:0
0
04:0
0
05:0
0
06:0
0
07:0
0
08:0
0
09:0
0
10:0
0
11:0
0
12:0
0
Time
Dis
tanc
e (m
) tr
avel
led
per
hour
0
10
20
30
40
50
60
70
80
Female Male Activity
Figure 3.4 The distance travelled (m) and the percentage active per each hour of
observation for male and female African wild cats during the study in the KTP.
Observation periods = 8 hours or more (males: n = 42 observation periods;
females: n = 49 observation periods)
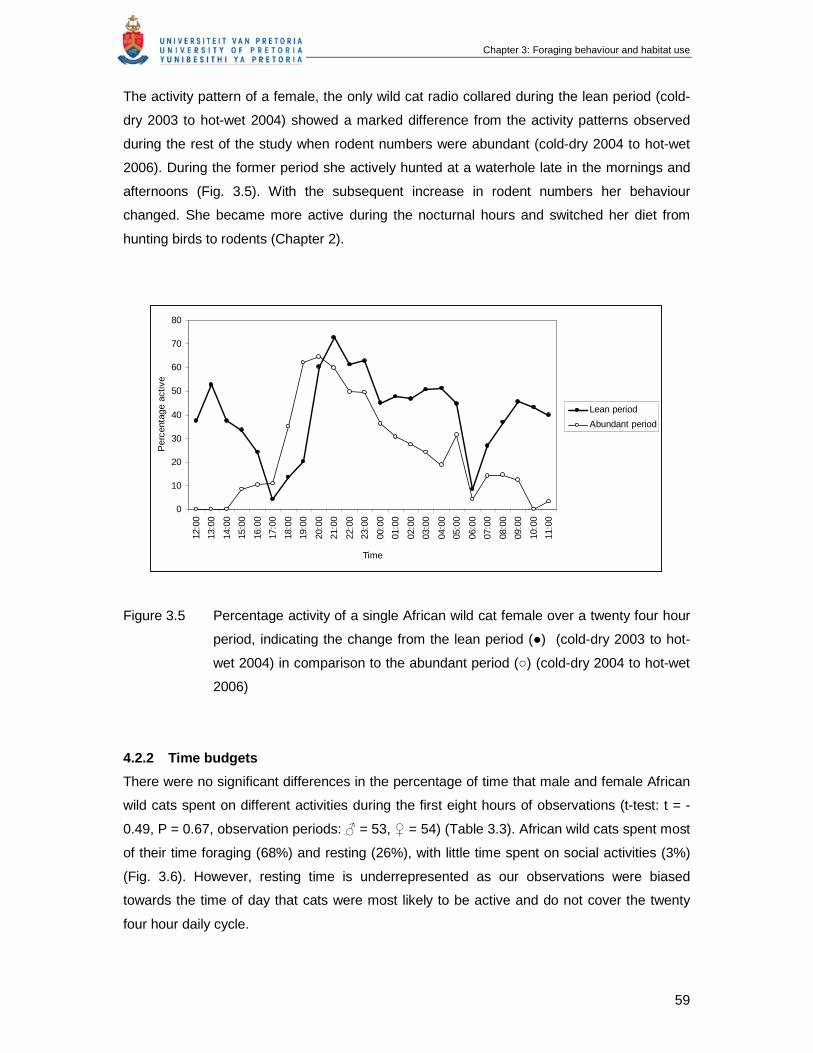
Chapter 3: Foraging behaviour and habitat use
59
The activity pattern of a female, the only wild cat radio collared during the lean period (cold-
dry 2003 to hot-wet 2004) showed a marked difference from the activity patterns observed
during the rest of the study when rodent numbers were abundant (cold-dry 2004 to hot-wet
2006). During the former period she actively hunted at a waterhole late in the mornings and
afternoons (Fig. 3.5). With the subsequent increase in rodent numbers her behaviour
changed. She became more active during the nocturnal hours and switched her diet from
hunting birds to rodents (Chapter 2).
0
10
20
30
40
50
60
70
80
12:0
0
13:0
0
14:0
0
15:0
0
16:0
0
17:0
0
18:0
0
19:0
0
20:0
0
21:0
0
22:0
0
23:0
0
00:0
0
01:0
0
02:0
0
03:0
0
04:0
0
05:0
0
06:0
0
07:0
0
08:0
0
09:0
0
10:0
0
11:0
0Time
Per
cent
age
activ
e
Lean period
Abundant period
Figure 3.5 Percentage activity of a single African wild cat female over a twenty four hour
period, indicating the change from the lean period (●) (cold-dry 2003 to hot-
wet 2004) in comparison to the abundant period (○) (cold-dry 2004 to hot-wet
2006)
4.2.2 Time budgets
There were no significant differences in the percentage of time that male and female African
wild cats spent on different activities during the first eight hours of observations (t-test: t = -
0.49, P = 0.67, observation periods: ♂ = 53, ♀ = 54) (Table 3.3). African wild cats spent most
of their time foraging (68%) and resting (26%), with little time spent on social activities (3%)
(Fig. 3.6). However, resting time is underrepresented as our observations were biased
towards the time of day that cats were most likely to be active and do not cover the twenty
four hour daily cycle.
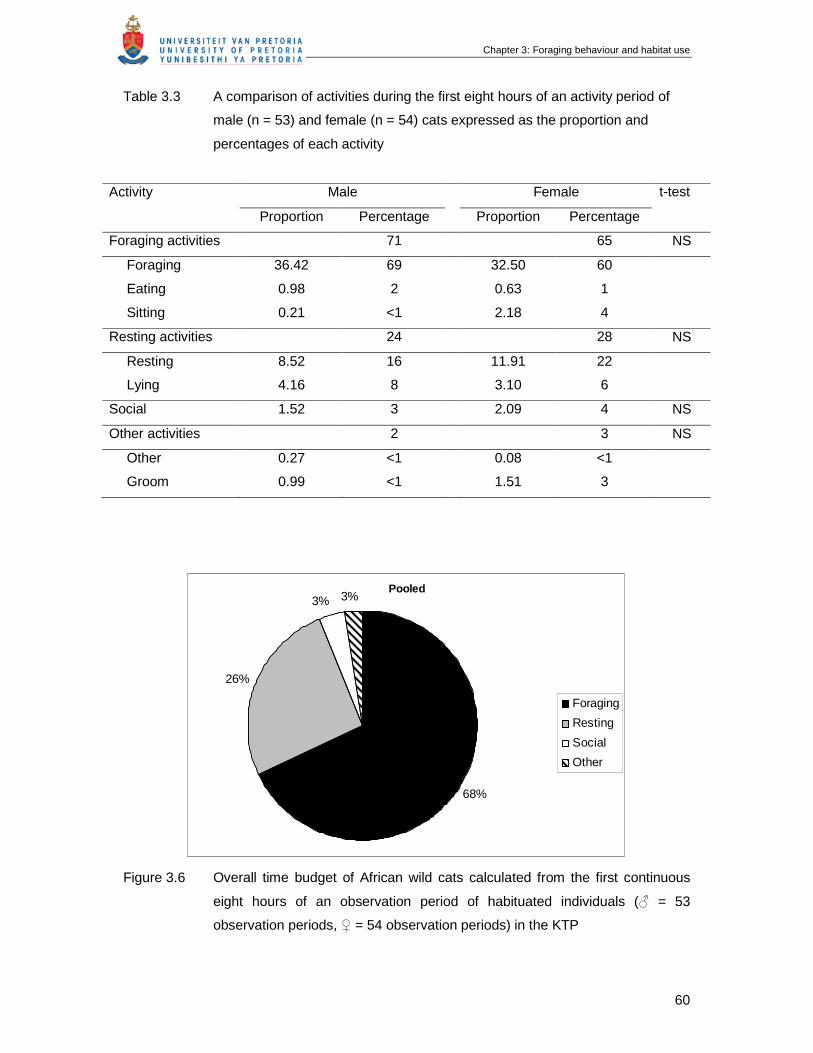
Chapter 3: Foraging behaviour and habitat use
60
Table 3.3 A comparison of activities during the first eight hours of an activity period of
male (n = 53) and female (n = 54) cats expressed as the proportion and
percentages of each activity
Activity Male Female t-test
Proportion Percentage Proportion Percentage
Foraging activities 71 65 NS
Foraging 36.42 69 32.50 60
Eating 0.98 2 0.63 1
Sitting 0.21 <1 2.18 4
Resting activities 24 28 NS
Resting 8.52 16 11.91 22
Lying 4.16 8 3.10 6
Social 1.52 3 2.09 4 NS
Other activities 2 3 NS
Other 0.27 <1 0.08 <1
Groom 0.99 <1 1.51 3
Pooled
68%
26%
3% 3%
Foraging
Resting
Social
Other
Figure 3.6 Overall time budget of African wild cats calculated from the first continuous
eight hours of an observation period of habituated individuals (♂ = 53
observation periods, ♀ = 54 observation periods) in the KTP
Chapter 3: Foraging behaviour and habitat use
61
4.2.3 Consumption rate
Male and female African wild cats show no significant seasonal differences in consumption
rate (g/km) (General linear model: F = 1.65, d.f. = 2, P = 0.20) and there is no significant
difference between seasonal consumption rates (g/km) (Kruskal Wallis: H2,39 = 2.3, P = 0.32)
when male and female data were pooled (Table 3.4). On average male African wild cats
consumed more food than females (male = 473 ± 389 g, female = 339 ± 320 g) (Mann-
Whitney U-test: Z = 2.10; P < 0.05), however, in biomass eaten per kilometre moved,
females consumed significantly more than males (male = 85. ± 146.4 g/km, female = 127 ±
120.1 g/km) (Mann-Whitney U-test: Z = 3.15, P < 0.01).
The consumption rate of lactating females was 152.0 ± 79.0 g/km (observation periods: n =
5), an increase of 19.6% compared to when they foraged alone. Occasionally cats played
with prey items by hitting them with their paws, chasing or throwing them into the air until
they escaped or died, in which case the prey was not eaten. Male cats played with prey on
39 occasions after consuming an average of 8.6 ± 6.1 prey items (observation periods: n =
12) and females played with prey on six occasions after consuming an average of 6.5 ± 3.8
prey items (observation periods: n = 6).
Table 3.4 The average seasonal consumption rate of male and female African wild cats
from continuous 8+ hours of observation periods (n) and expressed as the
mean ± SD biomass of food eaten per kilometre and the average ± SD
distances travelled during the observation periods
Season
Observation
periods (n)
Consumption
(g/km)
Distance travelled
(km)
Hot-dry 43 130.3 ± 177.0 4.2 ± 2.5
Hot-wet 20 107.8 ± 105.6 4.8 ± 4.2
Cold-dry 30 75.8 ± 48.4 6.5 ± 3.4
All seasons 93 107.9 ± 133.8 5.1 ± 3.4
4.3 Habitat utilisation
The study area comprised of 61% sand dunes, 37% Rhigozum veld, 1.8% calcrete ridges
and 0.2% riverbed habitat (Fig. 3.1). There was no correlation between the time spent in
each habitat and the availability of the habitat in the study site (r = 0.9 p = 0.1) (Fig. 3.7),
although the riverbed was utilised far more by both sexes than would be expected given its
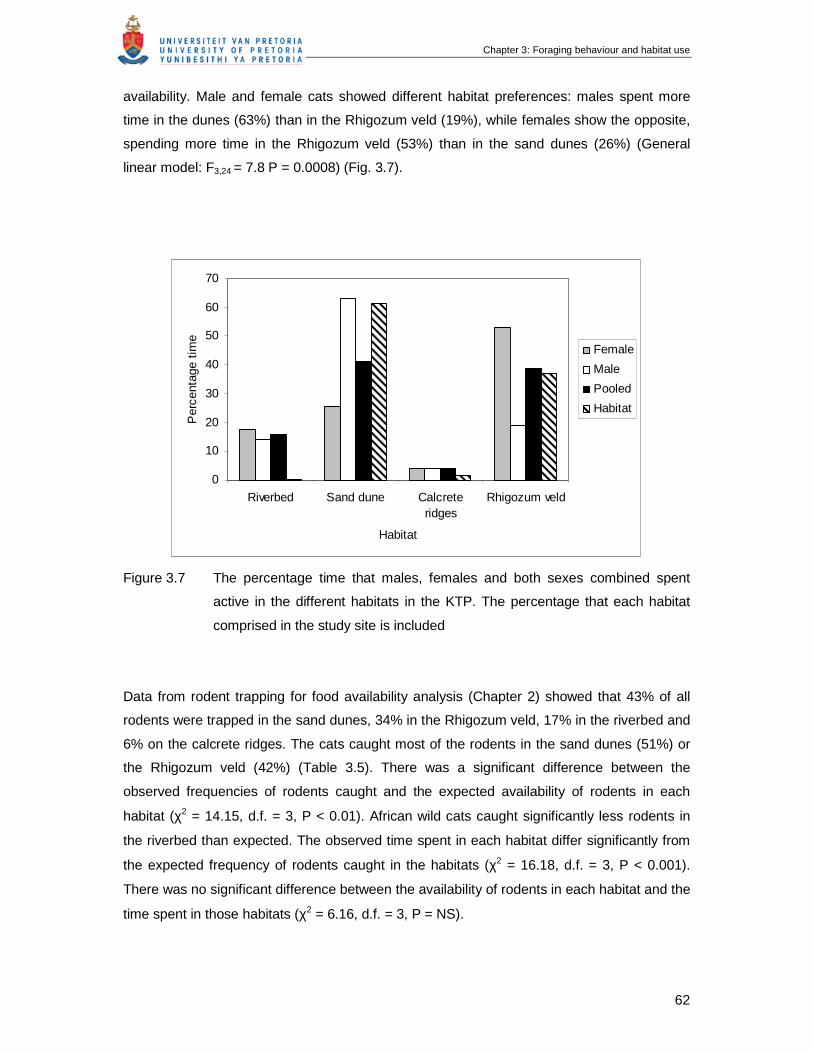
Chapter 3: Foraging behaviour and habitat use
62
availability. Male and female cats showed different habitat preferences: males spent more
time in the dunes (63%) than in the Rhigozum veld (19%), while females show the opposite,
spending more time in the Rhigozum veld (53%) than in the sand dunes (26%) (General
linear model: F3,24 = 7.8 P = 0.0008) (Fig. 3.7).
0
10
20
30
40
50
60
70
Riverbed Sand dune Calcreteridges
Rhigozum veld
Habitat
Per
cent
age
time
Female
Male
Pooled
Habitat
Figure 3.7 The percentage time that males, females and both sexes combined spent
active in the different habitats in the KTP. The percentage that each habitat
comprised in the study site is included
Data from rodent trapping for food availability analysis (Chapter 2) showed that 43% of all
rodents were trapped in the sand dunes, 34% in the Rhigozum veld, 17% in the riverbed and
6% on the calcrete ridges. The cats caught most of the rodents in the sand dunes (51%) or
the Rhigozum veld (42%) (Table 3.5). There was a significant difference between the
observed frequencies of rodents caught and the expected availability of rodents in each
habitat (χ2 = 14.15, d.f. = 3, P < 0.01). African wild cats caught significantly less rodents in
the riverbed than expected. The observed time spent in each habitat differ significantly from
the expected frequency of rodents caught in the habitats (χ2 = 16.18, d.f. = 3, P < 0.001).
There was no significant difference between the availability of rodents in each habitat and the
time spent in those habitats (χ2 = 6.16, d.f. = 3, P = NS).
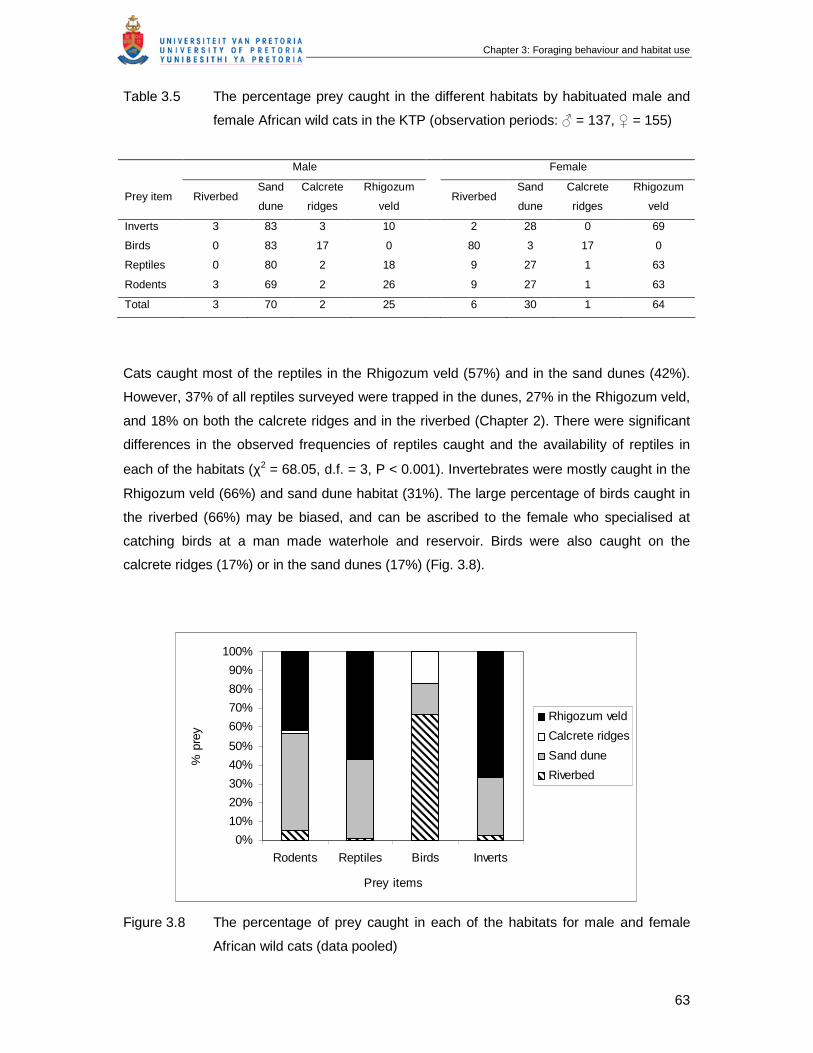
Chapter 3: Foraging behaviour and habitat use
63
Table 3.5 The percentage prey caught in the different habitats by habituated male and
female African wild cats in the KTP (observation periods: ♂ = 137, ♀ = 155)
Male Female
Prey item Riverbed Sand
dune
Calcrete
ridges
Rhigozum
veld Riverbed
Sand
dune
Calcrete
ridges
Rhigozum
veld
Inverts 3 83 3 10 2 28 0 69
Birds 0 83 17 0 80 3 17 0
Reptiles 0 80 2 18 9 27 1 63
Rodents 3 69 2 26 9 27 1 63
Total 3 70 2 25 6 30 1 64
Cats caught most of the reptiles in the Rhigozum veld (57%) and in the sand dunes (42%).
However, 37% of all reptiles surveyed were trapped in the dunes, 27% in the Rhigozum veld,
and 18% on both the calcrete ridges and in the riverbed (Chapter 2). There were significant
differences in the observed frequencies of reptiles caught and the availability of reptiles in
each of the habitats (χ2 = 68.05, d.f. = 3, P < 0.001). Invertebrates were mostly caught in the
Rhigozum veld (66%) and sand dune habitat (31%). The large percentage of birds caught in
the riverbed (66%) may be biased, and can be ascribed to the female who specialised at
catching birds at a man made waterhole and reservoir. Birds were also caught on the
calcrete ridges (17%) or in the sand dunes (17%) (Fig. 3.8).
0%
10%
20%
30%
40%
50%
60%
70%
80%
90%
100%
Rodents Reptiles Birds Inverts
Prey items
% p
rey
Rhigozum veld
Calcrete ridges
Sand dune
Riverbed
Figure 3.8 The percentage of prey caught in each of the habitats for male and female
African wild cats (data pooled)
Chapter 3: Foraging behaviour and habitat use
64
4.4 Social and other behaviours
Very little social behaviour by both sexes was observed, except for the short periods (2 – 4
months) that females cared for kittens or during the brief mating periods when males trailed
receptive females (1 – 2 days). In all cases where females increased urine spray marking
kittens were born within 3 months. Therefore we argue that urine spray marking in females
was related to their reproductive status. Male cats marked more regularly with an average of
13.6 ± 23.5 sprays per kilometre moved (Chapter 4).
Extensive grooming was usually observed before (15.6 ± 11.4 minutes) and after (20.4 ±
12.9 minutes) a nightly activity period. Shorter grooming periods of less than one minute
between hunting activities were often seen. Grooming bouts lasted between 1 – 40 minutes.
Rolling in sand was observed in both sexes. Leyhausen (1979) describes rolling as a sexual
behaviour in females as they came into oestrus as well as during the courting period. We
observed both male and female cats rolling to and fro with snakelike twists (see description
in Leyhausen 1979) followed by continued foraging.
5. Discussion
Feeding and foraging behaviour
Like most cats (Sunquist & Sunquist, 2002), the African wild cat is a solitary hunter and no
cooperative hunting between adults was observed. The species has an extensive geographic
range (Nowell & Jackson, 1996) and is able to live and hunt in a wide variety of habitats
(Sunquist & Sunquist, 2002). Throughout its range it requires cover for hunting and resting
sites, from rocks to scrubby undergrowth, holes in the ground and thick vegetation (Sunquist
& Sunquist, 2002). The most important senses in finding food appear to be mostly visual and
auditory followed by olfactory cues. Although it is an excellent tree climber it mostly hunts on
the ground. Its hunting techniques are typical feline; moving slowly and quietly, watching and
listening for signs of prey activity and investigating scent trails. Like most other cats it also
sits and waits in ambush (Sunquist & Sunquist, 2002) before a surprise attack on its prey.
The African wild cat is highly adaptable and although it prefers rodents, it is capable of
hunting a wide range of prey species (Chapter 2; Sarmento, 1996; Moleón & Gil-Sanchez,
2003; Malo, Lozano, Huertas & Virgós, 2004). Playing with a prey item was often seen,
especially after a few successful hunting attempts.
Activity periods
The effect of human interference on the behaviour of the wild cats in our study is thought to
be minimal as the cats were completely habituated to the research vehicle and the study site
was far from the activities of tourist camps. The African wild cat is considered to be strictly
Chapter 3: Foraging behaviour and habitat use
65
nocturnal (Smithers, 1983), however our results clearly showed that a decrease in rodent
densities and availability lead to increased hunting during late mornings and early
afternoons, as well as opportunistic hunts during the middle of the day on rodents close to
their resting sites. However temperature also has an influence and the cats showed a
seasonal shift from predominantly nocturnal activity in the hot seasons to increased diurnal
activity in the cold seasons. Therefore, the African wild cat shows an activity pattern that
could describe it as predominantly nocturnal, however, depending on food availability and
temperature the species also shows crepuscular characteristics. Both male and female cats
showed an increase in activity during the early evenings and again in the early mornings.
Two peak activity patterns are common in many carnivores (Aschoff 1966) for example, the
Cape fox, Vulpes vulpes (Smithers, 1983), spotted hyaena, Crocuta crocuta (Kruuk, 1972),
honey badger, Mellivora capensis (Begg, 2001), ocelot, Leopardus pardalis (Weller &
Bennett, 2001) and leopard, Panthera pardus (Jenny & Zuberbühler, 2005).
The time of emergence from resting sites was significantly correlated with the time of sunset
during the hot seasons, however, the time an activity ended was not correlated with the time
of sunrise. It is probable that physiological state (such as hunger), ambient temperature, rain
and wind (sand storms) are the important variables determining activity. In addition predators
may synchronize their foraging behaviour with the activity of their main prey (Schuh, Tietze &
Schmidt, 1971; Curio, 1976; Armitage et al., 1996) and for the African wild cat seasonal food
availability and daily prey activity might also play a role in determining their activity patterns.
Foraging theory predicts that predators should distribute their activity patterns to maximize
the net foraging benefits (Pyke et al., 1977). This theory is supported by bat-eared fox
foraging behaviour on termites (Nel, 1990) and the seasonal prey preferences in the pine
marten (Zielinski et al., 1983). Our results support a shift in activity patterns in relation to
increases or decreases of prey numbers. This is illustrated by the behaviour of a female cat
at a water hole that specialised in hunting diurnal birds during a lean period in 2003. Birds
may become an important food resource for cats when mammalian prey numbers are low
(Fitzgerald & Veitch, 1985; Kirkpatrick & Rauzon, 1986), and individual cats may also
become particularly skilled at hunting birds (Molsher, 1999). With the increase in rodent
numbers, this female changed her foraging behaviour and diet accordingly and became more
nocturnal. Samson & Raymond (1995) hypothesized that when prey are active they could
easily be detected by predators and foraging time can be minimized if the predator hunts
during prey activity bouts. On a seasonal basis the lower numbers of reptiles caught in the
cold dry season when reptiles are inactive with an increase in the warmer months suggest
that this is the case (Chapter 2). Zielinski (1988) reported that small carnivores can be

Chapter 3: Foraging behaviour and habitat use
66
sensitive to within day variation in foraging costs, however that is not the only criteria that
influence seasonal foraging patterns in predators. It is thus unlikely in the African wild cat that
prey activity is the only driving force in their activity patterns.
A decrease in activity in the middle of the day in the hot seasons as well as a decreased
activity from midnight and early mornings suggest that temperature might also be an
important factor in the activity schedule of the African wild cat. This is expected given the
temperature extremes in the southern Kalahari. African wild cats appear to avoid extreme
day time temperatures by sleeping and resting in thick vegetation and consequently shift
their active periods to strict nocturnal hours in the hot seasons and include more diurnal
hours in the cold seasons in order to satisfy their energy requirements. This has also been
described in other small carnivores, i.e. the honey badger (Begg, 2001) and the black-
backed jackal, Canis mesomelas (Ferguson, Galpin & De Wet, 1988). Although one would
expect that night time activity would decrease in the cold seasons due to the cold
temperatures there were no significant seasonal differences in activity. However there was a
clear decrease in the distances travelled in the early cold mornings (around 02:00) since cats
moved more slowly in the cold (Fig. 3.5).
There were no significant differences between time budgets of male and female cats during
the first eight hours of observations. Foraging was the most important activity and since
African wild cats are solitary, little time would be expected to be devoted to socialising. For
females the time available for foraging is likely to be critical to meet the high energy demands
when they are pregnant, lactating and raising their young. Males would be expected to
forage for longer periods than females since they are significantly larger than females
(Chapter 2), also they need to patrol and advertise their presence in their territory. However,
increased cost of reproduction in females and rearing kittens on their own may increase their
energetic demand to similar levels of that of male cats. Indeed, female consumption rate
(g/km) is higher than male cats indicating that the raising of young is more energetically
costly for females than the covering of long distances and marking of territories by male
African wild cats.
Habitat utilisation
Male and female wild cats show different habitat preferences, with males mostly using the
dune habitat and females the Rhigozum veld. The use of specific habitats is associated with
the availability of the key prey resources, for example as shown in studies on the kodkod,
Oncifelis guigna, (Dunstone et al., 2002) and their preference for rodents in specific habitat
types (Fernandez, Evans & Dunstone, 1994, 1996; Fernandez, Dunstone & Evans, 1999).
Chapter 3: Foraging behaviour and habitat use
67
Like many small felids, rodents are the major prey resource for African wild cats (Chapter 2).
Our study clearly showed that the habitats where the cats spent most of their time are the
habitats where they catch most of their prey. Seasonal prey surveys confirmed that rodents
had high densities in the sand dune and Rhigozum veld habitats.
The difference in habitat preferences between male and female cats suggest that females
use denser habitats (Rhigozum veld) when active, especially when they have kittens. Male
cats cover larger areas and longer distances and therefore spend more time in the sand
dunes since the dune area covers a large part of the study site. Thus our results confirm that
during active periods cats prefer habitats with high prey abundances and that resting sites
might be chosen for their vegetation cover and shelter. Sexual differences in habitat use are
well recorded in felid literature (Sandell, 1989; Broomhall, Mills & Du Toit, 2003; Chamberlain
et al., 2003).
In conclusion the African wild cat is a successful predator with a hunting style typical of a
solitary felid. They are able to change their foraging behaviour according to seasonal prey
availability, density and environmental conditions. It is mainly nocturnal but exhibits some
crepuscular and diurnal activity when needed. Although sexual dimorphism is evident
(Chapter 2), male and female wild cats show little differences in time budgets, however, male
cats travel over longer distances and have a higher consumption rate than females. Habitat
utilisation between sexes differs and habitat preferences appear to be based on suitable
shelter and cover, as well as prey abundances in these habitats.
6. References
Armitage, K.B., Salsbury, C.M., Barthelmess, R.C., Gray, R.C. & Kovaach, A. (1996).
Population time budget for the yellow-bellied marmot. Ethol. Ecol & Evol. 8: 67-95.
Aschoff, J. (1966). Circadian activity patterns with two peaks. Ecology 47: 657-662.
Bailey, T.N. (1974). Social organization in a bobcat population. J. Wildl. Manage. 38: 435-
446.
Bailey, T.N. (1979). Den ecology, population parameters, and diet of eastern Idaho bobcats.
Natl. Wildl. Fed. Sci. and Tech. Serv. 6: 62-69.
Bailey, T.N. (1993). The African Leopard: Ecology and Behavior of a Solitary Felid. Columbia
University Press.

Chapter 3: Foraging behaviour and habitat use
68
Beasom, S.L. & Moore, R.A. (1977). Bobcat food habit response to a change in prey
abundance. Southwest. Nat. 21: 451-457.
Begg, C.M. (2001). Feeding ecology and social organisation of honey badgers (Mellivora
capensis) in the southern Kalahari. PhD thesis, University of Pretoria, South Africa.
Bekoff, M. & Wells, M.C. (1981). Behavioural budgeting by wild coyotes: the influence of food
resources and social organization. Anim. Behav. 29: 794-801.
Bennett, N.C. & Faulkes, C.G. (2000). African mole-rats: Ecology and Eusociality. Cambridge
University Press.
Bothma, J. Du P. & Coertze, R.J. (2004). Motherhood increase hunting success in southern
Kalahari leopards. J. Mammal. 85: 756-760.
Bothma, J. Du P. & De Graaff, G. (1973). A habitat map of the Kalahari Gemsbok National
Park. Koedoe 16: 181-188.
Broomhall, L.S., Mills, M.G.L. & Du Toit, J.T. (2003). Home range and habitat use by
cheetahs (Acinonyx jubatus) in the Kruger National Park. J Zool. (Lond.) 261: 119-128.
Chamberlain, M.J., Leopold, B.D. & Conner, L.M. (2003). Space Use, Movements and
Habitat Selection of Adult Bobcats (Lynx rufus) in Central Mississippi. Am. Midl. Nat. 149:
395-405.
Clevenger, A.P. (1993). Pine marten (Martes martes L.) home ranges and activity patterns
on the island of Minorca, Spain. Z. Säugetierk. 58: 137-143.
Caro, T.M. (1994). Cheetahs of the Serengeti plains. Chicago: University of Chicago Press.
Caro, T.M. & FitzGibbon, C.D. (1992). Large carnivores and their prey: the quick and the
dead. In Natural Enemies. Crawley, M.J. (Ed.). Oxford: Blackwell Scientific Publications.
Curio, E. (1976). The Ethology of Predation. New York: Springer-Verlag.
Dards, J.L. (1983). The behaviour of dockyard cats: interactions of adult males. Appl. Anim.
Ethol. 10: 133-153.
Chapter 3: Foraging behaviour and habitat use
69
Diamond, J.N., Karasov, W.H., Phan, D. & Carpenter, F.L. (1986). Digestive physiology is a
determinant of foraging bout frequency in hummingbirds. Nature (Lond.) 320: 62-63.
Dunstone, N., Durbin, L., Wyllie, I., Freer, R., Jamett, G.A., Mazzolli, M. & Rose, S. (2002).
Spatial organization, ranging behaviour and habitat use of the kodkod (Oncifelis guigna) in
southern Chile. J. Zool. (Lond.) 257: 1-11.
Eloff, F.C. (1984). Food ecology of the Kalahari lion Panthera leo. Koedoe (Suppl.) 27: 249-
258.
Fernandez, F.A.D., Evans, P.R. & Dunstone, N. (1994). Local variation in rodent
communities of Sitka spruce plantations: the interplay of successional change and site-
specific parameters. Ecography 17: 305-313.
Fernandez, F.A.D., Evans, P.R. & Dunstone, N. (1996). Population dynamics of the
Woodmouse Apodemus sylvaticus (Rodentia: Muridae) in a Sitka spruce successional
mosaic. J. Zool. (Lond.) 239: 717-730.
Fernandez, F.A.D., Dunstone, N. & Evans, P.R. (1999). Density-dependence in habitat
selection by woodmice in a Sitka spruce successional mosaic: the roles of immigration,
emigration, and variation among local demographies. Can. J. Zool. 77: 397-405.
Fernandez, N. & Palomares, F. (2000). The selection of breeding dens by the endangered
Iberian lynx (Lynx pardinus): implications for its conservation. Biol. Conserv. 94: 51-61.
Ferguson, J.W.H., Galpin, J.S. & De Wet, M.J. (1988). Factors affecting the activity patterns
of black-backed jackals Canis mesomelas. J. Zool. (Lond.) 214: 55-69.
Fitzgerald, B.M. & Veitch, C.R. (1985). The cats of Herekopare Island, New Zealand: their
history, ecology and effects on birdlife. New Zeal. J. Zool. 12: 319-330.
Gittleman, J.L. (1989). Carnivore behaviour, ecology and evolution. (Vol. 1). Comstock
Publishing Associates, Cornell University Press, Ithaca, New York.
Gittleman, J.L. & Thompson, S.D. (1988). Energy allocation in mammalian reproduction. Am.
Zool. 28: 863-875.

Chapter 3: Foraging behaviour and habitat use
70
Herbers, J.M. (1981). Time resources and laziness in animals. Oecologia 49: 252-262.
Jenny, D. & Zuberbühler, K. (2005). Hunting behaviour in West African leopards. Afr. J. Ecol.
43: 197-200.
Johnson, D.H. (1980). The comparison of usage and availability measurements for
evaluating resource preference. Ecology 61: 65-71.
Johnson, W.E. & Franklin, W.L. (1991). Feeding and spatial ecology of Felis geoffroyi on
southern Patagonia. J. Mammal. 72: 815-820.
Kauhala, K. & Saeki, M. (2004). Raccoon dogs. Finnish and Japanese raccoon dogs – on the
road to speciation? In Biology and conservation of Wild Canids. Macdonald, D.W. & Sillero-
Zubriri, C. (Eds.). Oxford University Press Inc., New York.
Kirkpatrick, J.R. & Rauzon, M.J. (1986). Food of feral cats Felis catus on Jarvis and Howland
Islands, Central Pacific Ocean. Biotropica 18: 72-75.
Knick, S.T. (1990). Ecology of bobcats relative to exploitation and prey decline in southern
Idaho. Wildlife Monogr. 108: 3-42.
Kruuk, H. (1972). The spotted hyaena: a study of predation and social behaviour. University
of Chicago Press, Chicago & London.
Leistner, O.A. (1967). The plant ecology of the southern Kalahari. Mem. Bot. Surv. S. Afr. 38:
1-172.
Malo, A.F., Lozano, J., Huertas, D.L. & Virgós, E. (2004). A change of diet from rodents to
rabbits (Oryctolagus cuniculus). Is the wildcat (Felis silvestris) a specialist predator? J. Zool.
(Lond.) 263: 401-407.
Manning, A.M. & Dawkins, M.S. (1995). An introduction to Animal behaviour (4th edn.).
Cambridge University Press.
McNab, B.K. (1963). Bioenergetics and the determination of home range size. Am. Nat. 97:
133-139.
Chapter 3: Foraging behaviour and habitat use
71
Meddis, R. (1983). The evolution of sleep. In Sleep Mechanisms and Functions. Mayes, A.
(Ed.). Van Nostrand, London.
Mills, M.G.L. & Retief, P.F. (1984). The response of ungulates to rainfall along riverbeds of
the southern Kalahari, 1972-1982. Koedoe (Suppl.) 1984: 129-142.
Moleón, M & Gil-Sánchez, J.M. (2003). Food habits of the wildcat (Felis silvestris) in a
peculiar habitat: the Mediterranean high mountains. J. Zool. (Lond.) 260: 17-22.
Molsher, R.L. (1999). The ecology of feral cats, Felis catus, in open forest in New South
Wales: interactions with food resources and foxes. PhD thesis, University of Sydney,
Australia.
Morrison, M.L. (2001). A proposed research emphasis to overcome the limits of wildlife-
habitat relationship studies. J. Wildl. Manage. 65: 613-623.
Mucina, L. & Rutherford, M.C. (2006). The vegetation of South Africa, Lesotho and
Swaziland. Strelitzia 19. South African National Biodiversity Institute, Pretoria.
Nel, J.A.J. (1990). Foraging and feeding by bat-eared foxes Otocyon megalotis in the
southwestern Kalahari. Koedoe 33: 9-15.
Nel, J.A.J., Rautenbach, I.L., Els, D.A. & De Graaf, G. (1984). The rodents and other small
mammals of the Kalahari Gemsbok National Park. Koedoe (Suppl.) 1984: 195-220.
Neu, C.W., Byers, C.R. & Peek, J.M. (1974). A technique for analysis of utilization –
availability data. J. Wildl. Manage. 38: 541-545.
Nowell, K. & Jackson, P. (1996). Wild cats. Status survey and conservation action plan.
IUCN, Gland.
Palomares, F. (2001). Vegetation structure and prey abundance requirements of the Iberian
lynx: implications for the design of reserves and corridors. J. Appl. Ecol. 38: 9-18.
Panaman, R. (1981). Behaviour and ecology of free-ranging female farm cats (Felis catus
L.). Z. Tierpsychol. 56: 59-73.
Chapter 3: Foraging behaviour and habitat use
72
Pyke, G.H., Pulliam, H.R. & Charnov, E.L. (1977). Optimal foraging: a selective review of
theory and tests. Q. Rev. Biol. 52: 137-154.
Rijnsdorp, A., Daan, S. & Dijkstra, C. (1981). Hunting in the kestrel Falco tinnunculus and the
adaptive significance of daily habits. Oecologia 50: 391-406.
Rollings, C.T. (1945). Habits, foods and parasites of the bobcat in Minnesota. J. Wildl.
Manage. 9: 131-145.
Samson, C. & Raymond, M. (1995). Daily activity pattern and time budget of stoats (Mustela
erminea) during summer in southern Quebec. Mammalia 59: 501-510.
Sandell, M. (1989). The mating tactics and spacing patterns of solitary carnivores. In
Carnivore, behaviour, ecology and evolution (Vol. 1). Gitttleman, J.L. (Ed.). Cornell University
Press, Ithaca.
Sarmento, P. (1996). Feeding ecology of the European wildcat Felis silvestris in Portugal.
Acta Theriol. 41: 409-414.
Schuh, J., Tietze, F. & Schmidt, P. (1971). Beobachtungen zum Aktivitatsverhalten der
Wildkatze (Felis silvestris Schreber). Hercynia 8: 102-107.
Siegel, A. (1956). Nonparametric Statistics for the Behavioural Sciences. McGraw-Hill, New
York.
Sillero-Zubiri, C. & Gotelli, D. (1995). Diet and feeding behaviour of Ethiopian wolves (Canis
simensis). J. Mammal. 76: 531-541.
Smithers, R.H.N. (1983). The mammals of the southern African subregion. University of
Pretoria, Pretoria, South Africa.
Sliwa, A. (1994). Diet and feeding behaviour of the black-footed cat (Felis nigripes Burchell,
1824) in the Kimberley Region, South Africa. Zool. Garten (n.f) 64: 83-96.
Sliwa, A. (2006). Seasonal and sex-specific prey composition of black-footed cats Felis
nigripes. Acta Theriol. 51: 195-204.
Chapter 3: Foraging behaviour and habitat use
73
Stander, P.E. (1992). Foraging dynamics of lions in a semi-arid environment. Can. J. Zool.
70: 8-21.
Sunquist, M. & Sunquist, F. (2002). Wild cats of the World. Chicago: University of Chicago
Press.
Swart, J.M., Richardson, P.R.K. & Ferguson, J.W.H. (1999). Ecological factors affecting the
feeding behaviour of pangolins (Manis temminckii). J. Zool. (Lond.) 247: 281-292.
Turner, D.C. & Meister, O. (1988). Hunting behaviour in the domestic cat. In The domestic
cat: the biology of its behaviour. D.C. Turner & P. Bateson. (Eds). Cambridge University
Press, Cambridge, United Kingdom.
Van Rooyen, N. (2001). Flowering plants of the Kalahari dunes. Business Print Centre,
Ecotrust, Pretoria.
Van Rooyen, T.H. (1984). The soils of the Kalahari Gemsbok National Park. Koedoe (Suppl.)
1984: 45-63.
Van Rooyen, T.H., Van Rensburg, D.J., Theron, G.K. & Bothma, J. Du P. (1984). A
preliminary report on the dynamics of the vegetation of the Kalahari Gemsbok National Park.
Koedoe (Suppl.) 1984: 83-102.
Weller, S.H. & Bennett, C.L. (2001). Twenty-four hour activity patterns of behavior in captive
ocelots (Leopardus pardalis). Appl. Anim. Behav. Sci. 71: 67-79.
Zar, J.H. (1999). Biostatistical Analysis. Prentice Hall, New Jersey.
Zielinski, W.J. (1986). Circadian rhythms of small carnivores and the effect of restricted
feeding on daily activity. Physiol. Behav. 38: 613-620.
Zielinski, W.J. (1988). The influence of daily variation in foraging cost on the activity of small
carnivores. Anim. Behav. 36: 239-249.
Zielinski, W. J., Spencer, W.D. & Barrett, R.H. (1983). Relationship between food habits and
activity patterns of pine martens. J. Mammal. 64: 387-396.
Chapter 4: Spatial organisation
74
CHAPTER 4
Aspects of the social organisation of the African wild cat, Felis silvestris in the
southern Kalahari: Factors affecting home range size and movement patterns, and a
basic description of scent marking behaviour and reproductive biology
1. Abstract
Eight African wild cats, Felis silvestris (three female and five male) were radio collared from
2003 to 2006 (46 months) in the Kgalagadi Transfrontier Park. Minimum convex polygon
(95% MCP) estimates show male cats had larger annual home ranges (7.7 ± 3.5 km2) than
female cats (3.5 ± 1.0 km2). No differences were detected in seasonal home ranges. Female
home ranges overlapped extensively, whereas male home ranges indicated smaller overlap
with exclusive core areas, but extensive overlap with the ranges of several females. Male
cats travelled significantly further than female cats during an observation period. Male cats
scent marked frequently to mark their home ranges, while female spray marking appeared to
be related to their reproductive status. The cats displayed an aseasonal breeding strategy
related to food abundance.
Key words: African wild cat, Felis silvestris, home range, overlap, scent marking,
reproduction
2. Introduction
Spatial organisation in a population is the result of conspecifics distributing themselves in a
manner which maximises individual survival and reproductive success (Sandell, 1989).
Spacing patterns and mating systems are closely interrelated (Clutton-Brock & Harvey, 1987;
Sandell, 1989; de Azevedo & Murray, 2007; Schmidt, 2008). Social spacing includes the
maintenance of core areas, home ranges and territories (Mares & Lacher, 1987). A home
range is defined without reference to defence, advertisement or reaction to intrusion by
neighbouring individuals, only the presence of the individual is required (Brown & Orians,
1970; Börger et al., 2008). In the contrary, a territory arises when individuals exhibit spatially
orientated aggressive behaviour towards competitors and prevents intrusion to the defended
area (Brown & Orians, 1970; Maher & Lott, 1995). For most animals, spatial requirements,
movement patterns and distribution are mainly influenced by the abundance and distribution
of food and other key resources such as reproductive requirements, intra- and interspecific
relations and habitat requirements (Macdonald, 1983; Litvaitis, Clark & Hunt, 1986; Sandell,
1989; Ranta, Lundberg & Kaitala, 2006).
Chapter 4: Spatial organisation
75
With the exception of the African lion, Panthera leo (Schaller, 1972) and cheetah, Acinonyx
jubatus (Caro & Collins, 1987), all wild felids are solitary hunters. However, studies on feral
domestic cats, Felis silvestris catus, show variation in their use of space (Liberg & Sandell,
1988), from strict territoriality (Davies & Houston, 1984) and active defence of borders
(Leyhausen, 1965; Liberg, 1980, 1984; Langham & Porter, 1991), to limited mutual tolerance
(Apps, 1986). Females might be either solitary or group living and may or may not tolerate
dominant males in their territories (Liberg & Sandell, 1988). The African wild cat, F. s. cafra,
ancestor of the domestic cat, has been described as a solitary hunter (Smithers, 1983;
Chapter 3), however, there is a paucity of information about its spatial requirements,
movement patterns and reproductive biology.
The general explanations and mechanisms of animal home range behaviour is still lacking
and research is split into three areas of investigation: (i) the movement models based on
random walks, (ii) individual home range models based on optimal foraging theory, and (iii) a
statistically modelling approach (see review by Börger, Dalziel & Fryxell, 2008). However, the
distribution and abundance of food resources are among the most important factors
influencing animal distribution,spatial requirements, movement patterns (Macdonald, 1983;
Ranta et al. 2006) and prey densities (Hayward, O’Brien & Kerley, 2007). Animals may use
different strategies in exploiting available resources to satisfy their survival or reproductive
requirements, but the quality and quantity of resources should chiefly determine their home
ranges (Mitchell & Powell, 2004).
Animals may select home range sizes to meet their metabolic requirements over a critical
biological time period (Lindstedt, Miller & Buskirk, 1986). Several studies on carnivores have
investigated the relationship between home range sizes and different functions of body
weight. These studies have postulated that body weight differences, and specifically
metabolic differences, account for much of the difference between male and female home
range size (McNab, 1963; Harestad & Bunnell, 1979; Gittleman & Harvey, 1982; Lindstedt et
al., 1986; Litvaitis et al., 1986; Swihart, Slade & Bergstorm, 1988; Jetz, Carbone, Fulford &
Brown, 2004; Ferguson, Currit & Weckerly, 2009). In the African wild cat, males are 31%
larger than females (Chapter 2), and based purely on the above, it is expected that males will
have larger home ranges than females.
Metabolic differences between sexes may only be relevant during specific periods. In solitary
carnivores, female spatial organisation is generally determined by the abundance and
distribution of food resources and habitat quality, but male spatial organisation, at least
during the breeding season, may be determined instead by the distribution and availability of
Chapter 4: Spatial organisation
76
receptive females (Erlinge & Sandell, 1986; Sandell, 1989; Johnson, Macdonald & Dickman,
2000).
Furthermore, theory predicts that home range size should increase with decrease in quantity
and density of food resources, showing a seasonal, possibly cyclical contraction and
expansion (Mitchell & Powell, 2004; Herfindal, Linnell, Odden, Nilsen & Andersen, 2005). In
carnivores, spatial dispersion patterns of prey animals may affect foraging patterns and
hence, home range (Andersson, 1981; Stephens & Krebs, 1986; Brandt & Lambin 2007).
However, studies on carnivores provide inconsistent results on the relationship between
home range size, prey abundance and density. A negative relationship between home range
size and prey availability was found in the European lynx, L. lynx (Herfindal et al., 2005),
wolves, Canis lupus (Fuller, 2003; Jedrzejewski, Schmidt, Theuerkauf, Jedrzejewska &
Kowalczyk, 2007) and bobcats, L. rufus (Litvaitis et al., 1986), while no relationship was
found in puma, Puma concolor (Logan & Sweanor, 2001) and Iberian lynx, L. pardinus
(Palomares, Delibes, Revilla, Calzada & Fedriani, 2001).
If the key resource is predictable in space and time and is concentrated within a restricted
area it can be defended and therefore development of territorial behaviour and aggression is
favoured (Brown & Orians, 1970; Hixon, 1980; Lindzey, van Sickle, Ackerman, Barnhurst,
Hemker & Laing, 1994; Pierce, Bleich & Bowyer, 1999; Adams, 2001). A system of
overlapping ranges is possible when the availability and spatial distribution of resources vary
(Erlinge & Sandell, 1986; Sandell, 1989), resulting in less competition for food (Mech, 1977).
The spatial distribution of many felids is related to this, for example the European lynx
(Poole, 1995), puma (Pierce, Bleich & Bowyer, 2000) and bobcat (Benson, Chamberlain &
Leopold, 2004, 2006).
It is predicted that in the Kalahari, African wild cat female home ranges should be large
enough to include sufficient food resources to meet energetic requirements (Goodrich &
Buskirk, 1998; Sandell, 1989), and may fluctuate seasonally according to food availability. If
available females are the limiting resource for adult male African wild cats, their home ranges
should be larger than predicted purely on metabolic requirements (Sandell, 1989).
Furthermore, if available females are the limiting resource for adult male African wild cats
and since breeding in the southern Kalahari seems to be aseasonal, there should be no
seasonal variation in home range size, since receptive females should be available
throughout the year (Goodrich & Buskirk, 1998).
Chapter 4: Spatial organisation
77
With most solitary felids, adults of the same sex exhibit a spatially and temporally dispersed
social organisation (Beckoff, Daniels & Gittleman, 1984). However, all felids still posses a
rich repertoire of communication signals (Leyhausen, 1965; Seidensticker, Hornocker, Wiles
& Messick, 1973). Although information on communication is limited in small cats due to their
mostly nocturnal activity patterns, the densely vegetated habitat that many of them inhabit,
their wide ranging movement patterns and their extreme wariness to observers (Mellen,
1993; Nowell & Jackson, 1996), it seems that all felids possess very similar behavioural
mechanisms and communication patterns (Mellen, 1993). Transmission of information by
individuals can be visual, through sound and odour (Gorman & Trowbridge, 1989). Odours
are deposited in the environment as scent marks and therefore provide a spatial and
historical record of the animal’s movement and behaviour patterns (Gorman & Trowbridge,
1989).
The aim of this chapter is to describe the spatial organisation of free-living African wild cats in
the southern Kalahari and to investigate factors affecting the home range size and movement
patterns of males and females such as dispersion of resources. Specific questions about
spatial organisation include: (i) How large is the home ranges of male and female African
wild cats in the Kalahari and do they differ between sexes? (ii) What level of overlap exists
between neighbouring ranges and is core areas exclusive? (iii) Is there spatial or temporal
avoidance among wild cats? We also describe aspects of the reproductive biology of the
species and some basic communication and behavioural patterns.
3. Materials and Methods
3.1 Study area
The study was conducted from March 2003 to December 2006 (46 months) in the Kgalagadi
Transfrontier Park (KTP). The main study area included the southern part of the Nossob
riverbed and surrounding dune areas centred around Leeudril waterhole (26º28’17.7 S,
20º36’45.2 E) (Fig. 4.1). The KTP, shared between South Africa and Botswana, is a 37,000
km2 area in the semi arid southern Kalahari system. The study area is characterised by low
rainfall (between 200 - 250mm annually). Three seasons are recognised, the hot-wet season
(January to April) the cold-dry season (May to August) and a hot-dry season (September to
December). However, for the purpose of home range analyses two seasons were
distinguished, the hot-wet season (September to April) when the majority of the rainfall
occurs and a cold-dry season (May to August) characterised by limited rainfall and low
temperatures (Begg, Begg, Du Toit & Mills, 2005). The main study area comprised four
broad habitat types: (i) the dry riverbed, (ii) the adjacent Rhigozum veld, (iii) calcrete ridges,
Chapter 4: Spatial organisation
78
and (iv) the surrounding dune areas. See detailed description of the study area in Chapters 1
and 3.
3.2 Data collection
Details of the capture, radio collaring and habituation techniques on African wild cats are
described in (Appendix 1). A total of eight cats (three female and five male) were fitted with
radio collars (African Wildlife Tracking CC) with a battery life of approximately 18 months.
The radio collars were replaced in three cats before the battery life expired, to ensure
continuous visual observations. All radio collars were removed at the conclusion of the study.
All individuals were weighed, measured and a small skin sample was collected for DNA
analyses (Appendix 1, Chapter 5).
Radio collared animals were located by ground based tracking using a two or three element
antenna. As soon as the wild cat was sighted the geographic co-ordinates (using a Garmin
GPS), time, activity and habitat were recorded. Two types of data were collected: (i) radio-
location observations, when only a radio-fix of the animal was recorded; and (ii) continuous
observations, when radio collared wild cats were followed by a vehicle for varying periods of
1 – 14 hours (an average of, male: 6.0 ± 3.4 hours and female: 4.7 ± 3.7 hours). A rotation
system was followed in order to obtain equal observation records for all cats (Appendix 3).
Over the course of the study 1,538 hours were spent with habituated wild cats (females =
881 hours (n = 3) and males = 657 hours (n = 5)). One sub-adult male (VLO1665) became
an adult with an established home range and was then included in the calculations for adult
cats (Table 4.1). At the start and end of each activity period the GPS position of the individual
were noted. The first GPS position was noted when the cat was less than 30m from the
vehicle. Since all cats were habituated (Appendix 1), the approaching research vehicle had
no influence on their behaviour and they were not disturbed from their resting position. GPS
positions were also taken at certain behavioural actions such as spray marking or at 5 minute
intervals if the behaviour did not change and distances covered by the cats were determined
from these GPS positions.

Chapter 4: Spatial organisation
79
Figure 4.1 Map of the study area in the Kgalagadi Transfrontier Park
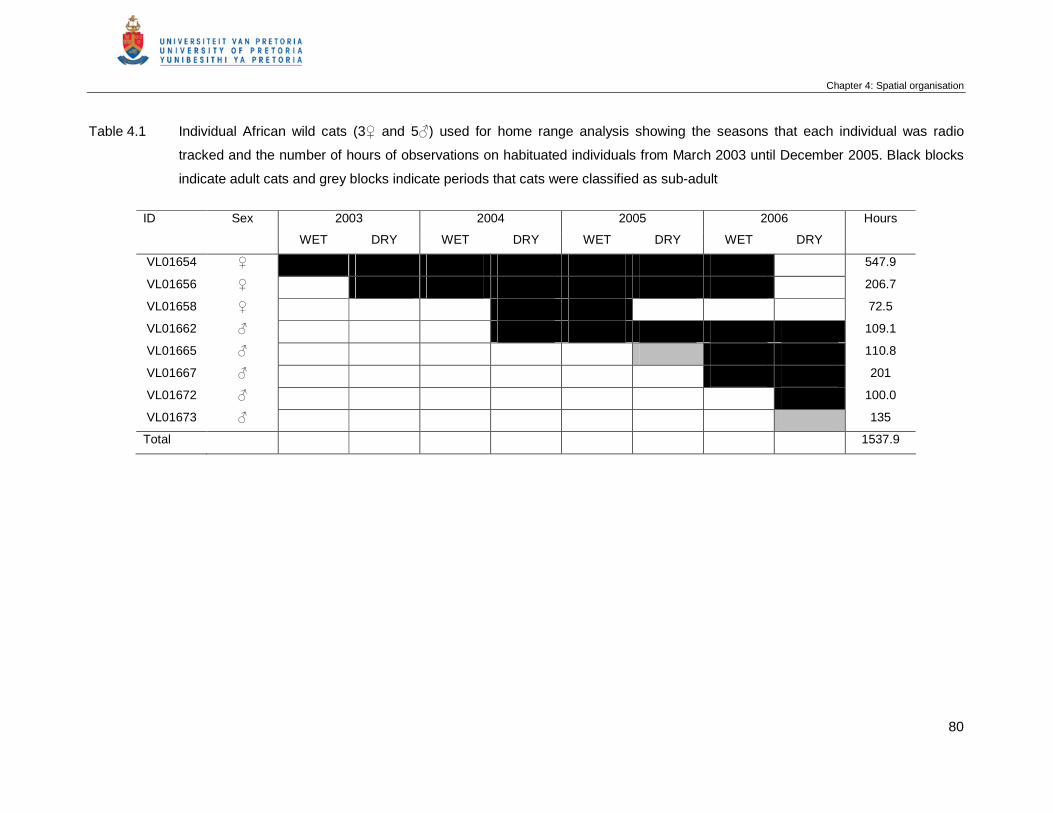
Chapter 4: Spatial organisation
80
Table 4.1 Individual African wild cats (3♀ and 5♂) used for home range analysis showing the seasons that each individual was radio
tracked and the number of hours of observations on habituated individuals from March 2003 until December 2005. Black blocks
indicate adult cats and grey blocks indicate periods that cats were classified as sub-adult
ID Sex 2003 2004 2005 2006 Hours
WET DRY WET DRY WET DRY WET DRY
VL01654 ♀ 547.9
VL01656 ♀ 206.7
VL01658 ♀ 72.5
VL01662 ♂ 109.1
VL01665 ♂ 110.8
VL01667 ♂ 201
VL01672 ♂ 100.0
VL01673 ♂ 135
Total 1537.9
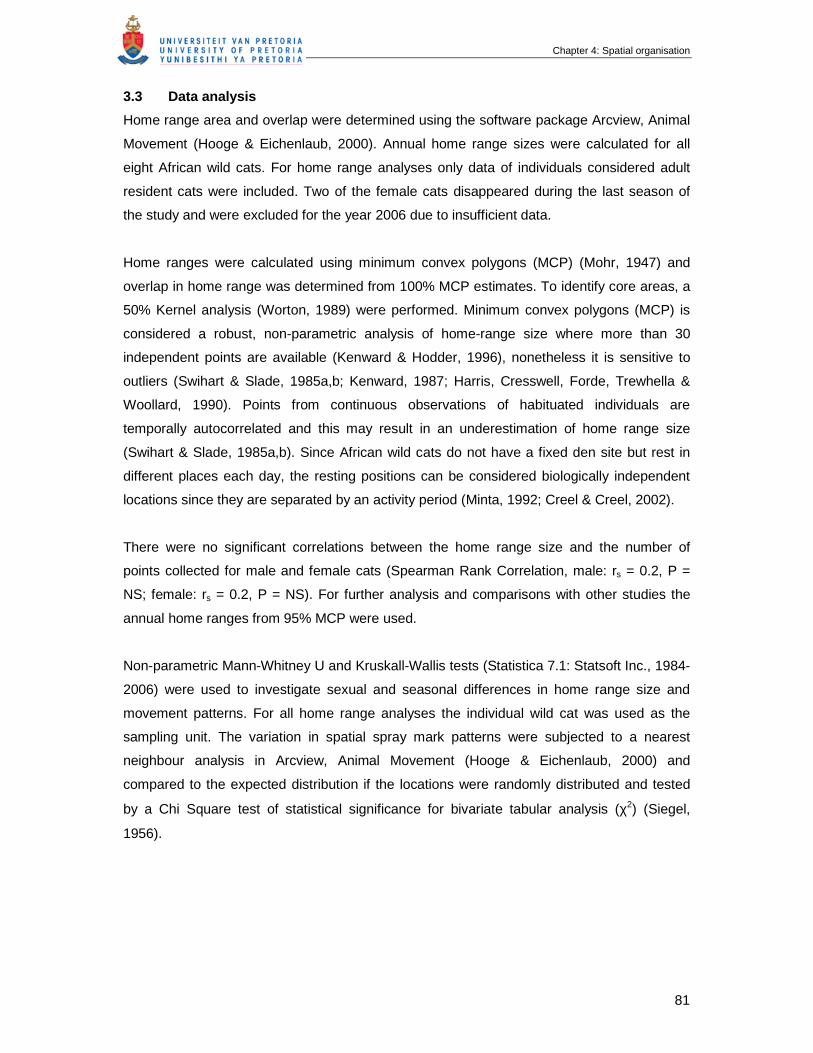
Chapter 4: Spatial organisation
81
3.3 Data analysis
Home range area and overlap were determined using the software package Arcview, Animal
Movement (Hooge & Eichenlaub, 2000). Annual home range sizes were calculated for all
eight African wild cats. For home range analyses only data of individuals considered adult
resident cats were included. Two of the female cats disappeared during the last season of
the study and were excluded for the year 2006 due to insufficient data.
Home ranges were calculated using minimum convex polygons (MCP) (Mohr, 1947) and
overlap in home range was determined from 100% MCP estimates. To identify core areas, a
50% Kernel analysis (Worton, 1989) were performed. Minimum convex polygons (MCP) is
considered a robust, non-parametric analysis of home-range size where more than 30
independent points are available (Kenward & Hodder, 1996), nonetheless it is sensitive to
outliers (Swihart & Slade, 1985a,b; Kenward, 1987; Harris, Cresswell, Forde, Trewhella &
Woollard, 1990). Points from continuous observations of habituated individuals are
temporally autocorrelated and this may result in an underestimation of home range size
(Swihart & Slade, 1985a,b). Since African wild cats do not have a fixed den site but rest in
different places each day, the resting positions can be considered biologically independent
locations since they are separated by an activity period (Minta, 1992; Creel & Creel, 2002).
There were no significant correlations between the home range size and the number of
points collected for male and female cats (Spearman Rank Correlation, male: rs = 0.2, P =
NS; female: rs = 0.2, P = NS). For further analysis and comparisons with other studies the
annual home ranges from 95% MCP were used.
Non-parametric Mann-Whitney U and Kruskall-Wallis tests (Statistica 7.1: Statsoft Inc., 1984-
2006) were used to investigate sexual and seasonal differences in home range size and
movement patterns. For all home range analyses the individual wild cat was used as the
sampling unit. The variation in spatial spray mark patterns were subjected to a nearest
neighbour analysis in Arcview, Animal Movement (Hooge & Eichenlaub, 2000) and
compared to the expected distribution if the locations were randomly distributed and tested
by a Chi Square test of statistical significance for bivariate tabular analysis (χ2) (Siegel,
1956).

Chapter 4: Spatial organisation
82
4. Results
4.1 Study population
Mean body mass for the three adult females and three adult males when they were radio
collared were significantly different at 4.4 ± 0.3 kg and 5.9 ± 0.2 kg respectively (t-test t-value
= 7.3, d.f. = 4, P < 0.01).
4.2 Annual and seasonal home range sizes
The annual home range data are presented in Table 4.2 with the 100% MCP and the 95%
MCP estimates. Annual home range estimates (MCP 95%) in adult males (n = 4) were 7.7 ±
3.5 km2 and in adult female cats (n = 3) 3.5 ± 1.0 km2. As predicted the annual home range
sizes (95% MCP) of adult male cats were significantly larger than female African wild cats
(Mann Whitney U-test, Z = 2.3, P < 0.02). Adult male African wild cats exhibited annual home
ranges of between 1.6 – 2.2 times larger than adult female cats.
Lindstedt et al. (1986) suggested that female home ranges are set by their metabolic
demands (HRfemale), therefore male home ranges could be predicted as HRfemale x
Mmale/Mfemale, where M is defined as average mass. Sandell (1989) used a similar equation to
estimate male home ranges (HRmale) based on the energy requirements to sustain
themselves: HRmale = (HRfemale) x (Mmale)0.75 / (Mfemale)
0.75. The measured annual home ranges
(MCP 95%) of male African wild cats were larger (1.6 and 1.8 times) than the predicted home
ranges for energy requirements alone using both formulae respectively. However, for
females the annual home ranges were 1.6 times smaller than the predicted home ranges.
Seasonal home ranges did not differ significantly in either male (Mann Whitney U-test, Z = -
1.0, P = 0.3) and female cats (Mann Whitney U-test, Z = -1.3, P = 0.2). The average home
ranges for males in the wet season were 4.7 ± 3.0 km2 and dry season were 7.4 ± 2.6 km2;
for females were: wet season = 3.0 ± 1.7 km2 and dry season = 4.0 ± 1.1 km2 (Table 4.2).
4.3 Social organisation and spatial system
An adequate dataset for all three females enabled the calculation of overlapping ranges for
females in 2004 (Table 4.3). Individual home ranges varied largely, from 5.7 km2 to 13 km2
(average = 9.3 ± 3.7 km2, n = 3 (MCP 100%)). This large variation might be due to low rodent
abundances recorded during 2004 (Chapter 2). However, we found no significant differences
in home range sizes of 2004 in comparison to the other years. The three females showed an
average of 33.4 ± 13.4% overlap (ranges from 20.6% to 47.3%), however, comparing the
50% core area (Kernel analysis), only two females show a slight overlap (Fig. 4.2).
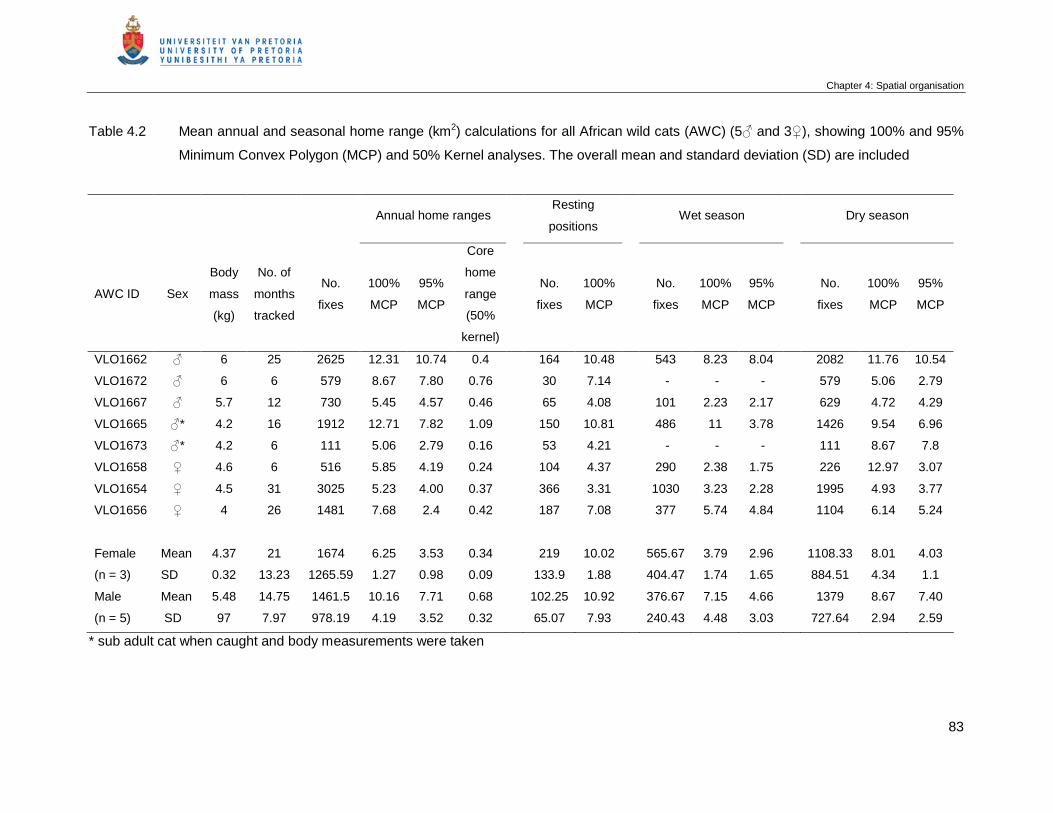
Chapter 4: Spatial organisation
83
Table 4.2 Mean annual and seasonal home range (km2) calculations for all African wild cats (AWC) (5♂ and 3♀), showing 100% and 95%
Minimum Convex Polygon (MCP) and 50% Kernel analyses. The overall mean and standard deviation (SD) are included
Annual home ranges Resting
positions Wet season Dry season
AWC ID Sex
Body
mass
(kg)
No. of
months
tracked
No.
fixes
100%
MCP
95%
MCP
Core
home
range
(50%
kernel)
No.
fixes
100%
MCP
No.
fixes
100%
MCP
95%
MCP
No.
fixes
100%
MCP
95%
MCP
VLO1662 ♂ 6 25 2625 12.31 10.74 0.4 164 10.48 543 8.23 8.04 2082 11.76 10.54
VLO1672 ♂ 6 6 579 8.67 7.80 0.76 30 7.14 - - - 579 5.06 2.79
VLO1667 ♂ 5.7 12 730 5.45 4.57 0.46 65 4.08 101 2.23 2.17 629 4.72 4.29
VLO1665 ♂* 4.2 16 1912 12.71 7.82 1.09 150 10.81 486 11 3.78 1426 9.54 6.96
VLO1673 ♂* 4.2 6 111 5.06 2.79 0.16 53 4.21 - - - 111 8.67 7.8
VLO1658 ♀ 4.6 6 516 5.85 4.19 0.24 104 4.37 290 2.38 1.75 226 12.97 3.07
VLO1654 ♀ 4.5 31 3025 5.23 4.00 0.37 366 3.31 1030 3.23 2.28 1995 4.93 3.77
VLO1656 ♀ 4 26 1481 7.68 2.4 0.42 187 7.08 377 5.74 4.84 1104 6.14 5.24
Female Mean 4.37 21 1674 6.25 3.53 0.34 219 10.02 565.67 3.79 2.96 1108.33 8.01 4.03
(n = 3) SD 0.32 13.23 1265.59 1.27 0.98 0.09 133.9 1.88 404.47 1.74 1.65 884.51 4.34 1.1
Male Mean 5.48 14.75 1461.5 10.16 7.71 0.68 102.25 10.92 376.67 7.15 4.66 1379 8.67 7.40
(n = 5) SD 97 7.97 978.19 4.19 3.52 0.32 65.07 7.93 240.43 4.48 3.03 727.64 2.94 2.59
* sub adult cat when caught and body measurements were taken
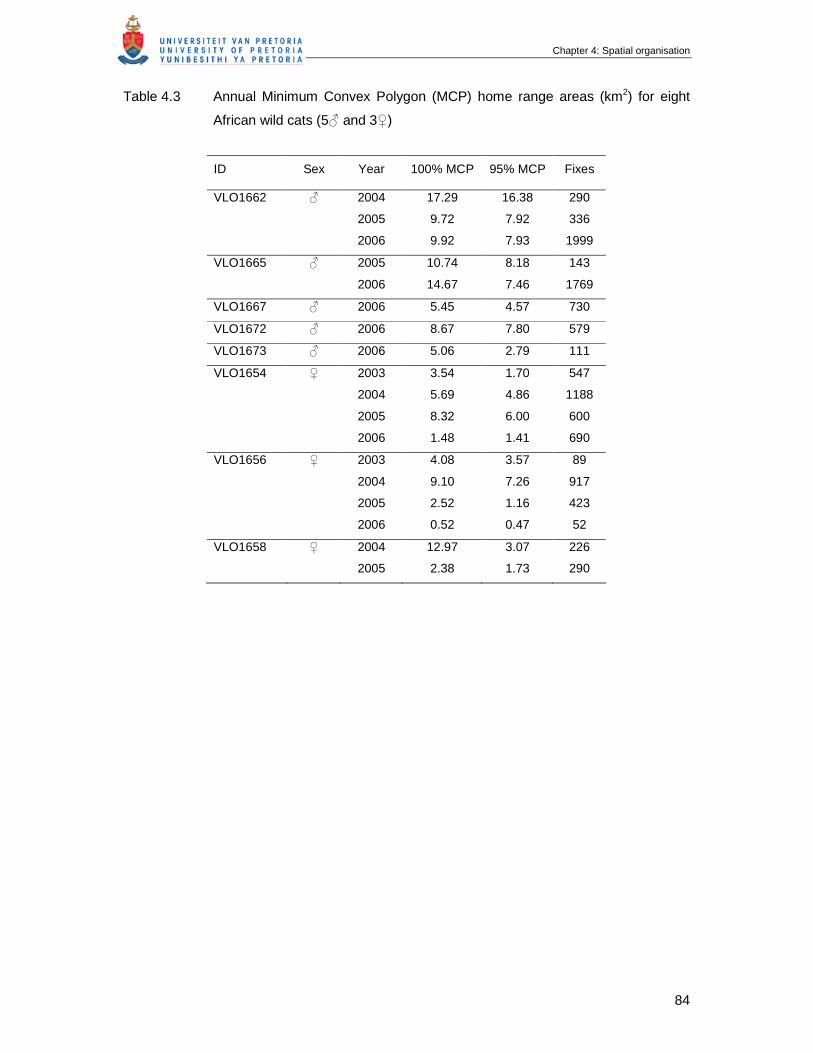
Chapter 4: Spatial organisation
84
Table 4.3 Annual Minimum Convex Polygon (MCP) home range areas (km2) for eight
African wild cats (5♂ and 3♀)
ID Sex Year 100% MCP 95% MCP Fixes
VLO1662 ♂ 2004 17.29 16.38 290
2005 9.72 7.92 336
2006 9.92 7.93 1999
VLO1665 ♂ 2005 10.74 8.18 143
2006 14.67 7.46 1769
VLO1667 ♂ 2006 5.45 4.57 730
VLO1672 ♂ 2006 8.67 7.80 579
VLO1673 ♂ 2006 5.06 2.79 111
VLO1654 ♀ 2003 3.54 1.70 547
2004 5.69 4.86 1188
2005 8.32 6.00 600
2006 1.48 1.41 690
VLO1656 ♀ 2003 4.08 3.57 89
2004 9.10 7.26 917
2005 2.52 1.16 423
2006 0.52 0.47 52
VLO1658 ♀ 2004 12.97 3.07 226
2005 2.38 1.73 290
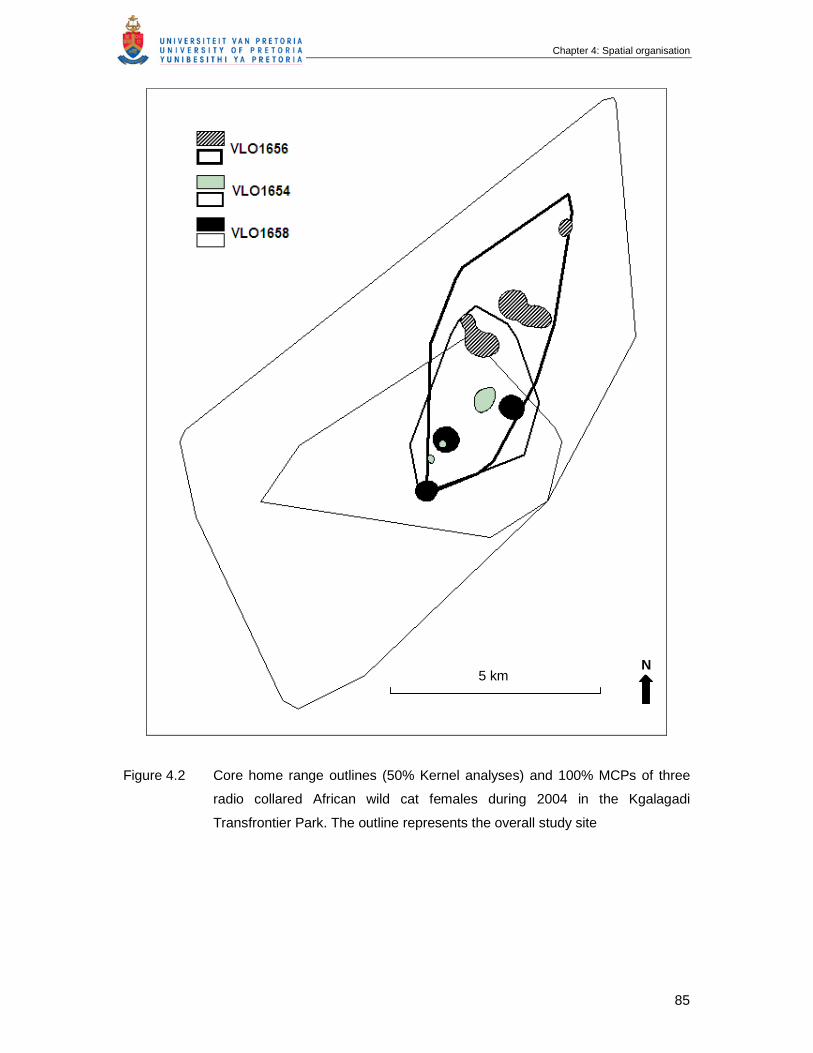
Chapter 4: Spatial organisation
85
Figure 4.2 Core home range outlines (50% Kernel analyses) and 100% MCPs of three
radio collared African wild cat females during 2004 in the Kgalagadi
Transfrontier Park. The outline represents the overall study site
N 5 km
Chapter 4: Spatial organisation
86
Adult male home range overlap was calculated for the year 2006 where home ranges varied
from 5.5 to 9.9 km2 (average = 7.4 ± 2.2 km2, n = 4) Three adult males showed an average of
7.0 ± 6.0% overlap (ranges from 2.0% to 13.7%) and there were no overlap in the 50% core
area of a Kernel analysis (Fig. 4.3). The home range of male VLO1672 did not overlap with
any other male cats and were excluded in the analysis of home range overlap. The large
variation can be explained by the movement patterns of male (VLO1665) that was in the
process of establishing his new home range in the year 2006.
Male cat (VLO1665) was a sub-adult cat when caught and moved in a small 2.0 km2 area
where no spray marking activity was evident for the first two months after collaring. Then he
started to roam and spray mark over a larger area, including spray marking in the home
range of male VLO1662. His movements covered 14.7 km2 (100% MCP). He became a
resident adult male after 5 months with a small annual home range of 5.6 km2 that did not
overlap with his initial area as sub-adult cat, 3.4 km away (straight line measurement from
were he was initially caught to the centre of core area of established home range in 2006).
The overlap between the roaming cat (VLO1665) and an adult male (VLO1662) decreased
from 29.4% to 13.7% when he became resident (Fig. 4.4).
The ranges of resident adult male cats overlapped with up to four different females. The
overlapping ranges of three habituated adult females, the location of a den of an uncollared
female and two adult males from 2004 to 2005 are presented in Fig. 4.5. During 2004 - 2006
a total of 10 African wild cats were radio collared in the 53 km2 study area and three non
radio collared adult cats were regularly sighted, giving a minimum density estimate of 0.25
cats/km2.
The patterns of home range use during a single observation period (male: 6.0 ± 3.4 hours
and female: 4.7 ± 3.7 hours (range 1 - 14 hours)) are presented in Fig. 4.6 and 4.7
respectively, showing how female cats used a smaller and more concentrated area of their
home ranges during an observation period. There was a significant difference between the
actual distances moved, measured from GPS recordings, and between the sexes per hour of
each observation period (t-test: t = 2.4, P = 0.03) with males: 0.6 ± 0.2 km/h and females: 0.4
± 0.1 km/h.
4.4 Scent marking behaviour
Females were observed to scent mark in 9.4% of the observation periods of more than 8
hours, either when they had kittens (n = 5) or when they were in oestrus, when courting and
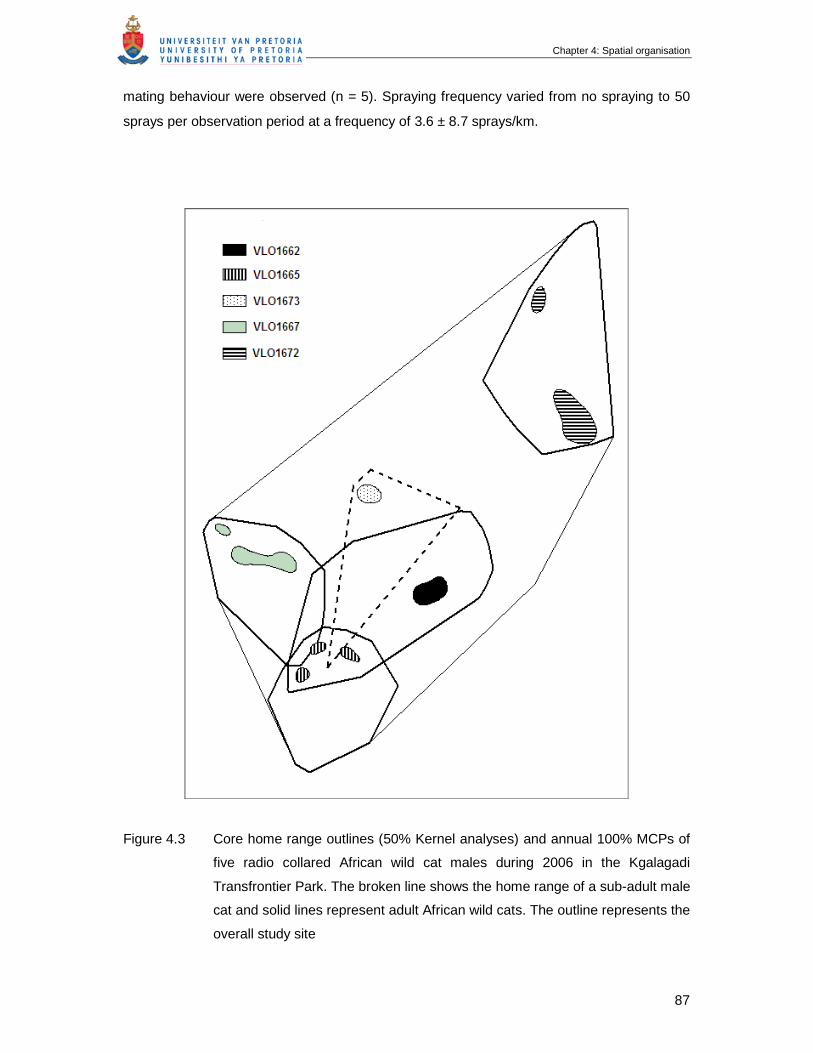
Chapter 4: Spatial organisation
87
mating behaviour were observed (n = 5). Spraying frequency varied from no spraying to 50
sprays per observation period at a frequency of 3.6 ± 8.7 sprays/km.
Figure 4.3 Core home range outlines (50% Kernel analyses) and annual 100% MCPs of
five radio collared African wild cat males during 2006 in the Kgalagadi
Transfrontier Park. The broken line shows the home range of a sub-adult male
cat and solid lines represent adult African wild cats. The outline represents the
overall study site
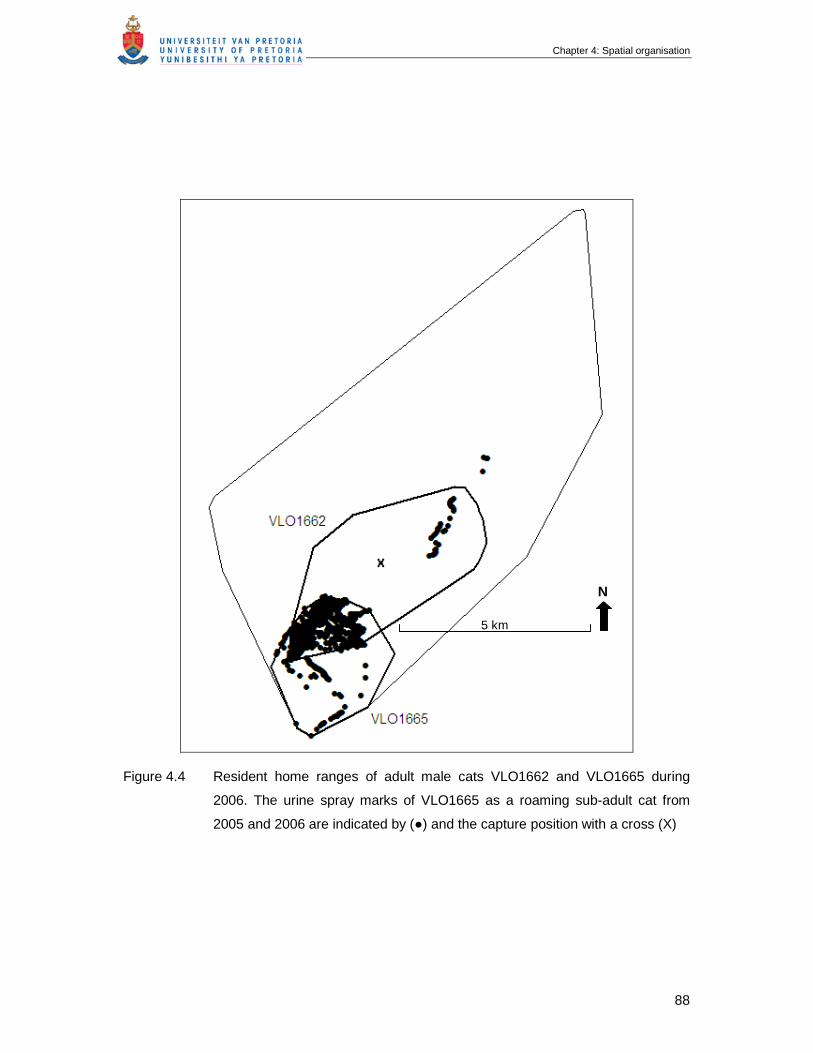
Chapter 4: Spatial organisation
88
Figure 4.4 Resident home ranges of adult male cats VLO1662 and VLO1665 during
2006. The urine spray marks of VLO1665 as a roaming sub-adult cat from
2005 and 2006 are indicated by (●) and the capture position with a cross (X)
N
5 km

Chapter 4: Spatial organisation
89
Figure 4.5 100% MCP home ranges calculated for African wild cats tracked during 2004
and 2005 on a 1 km2 grid. The outline represents the overall study site, with
males indicated by the solid lines and females indicated with broken lines. The
cross (X) represents the den of an uncollared female in the study site
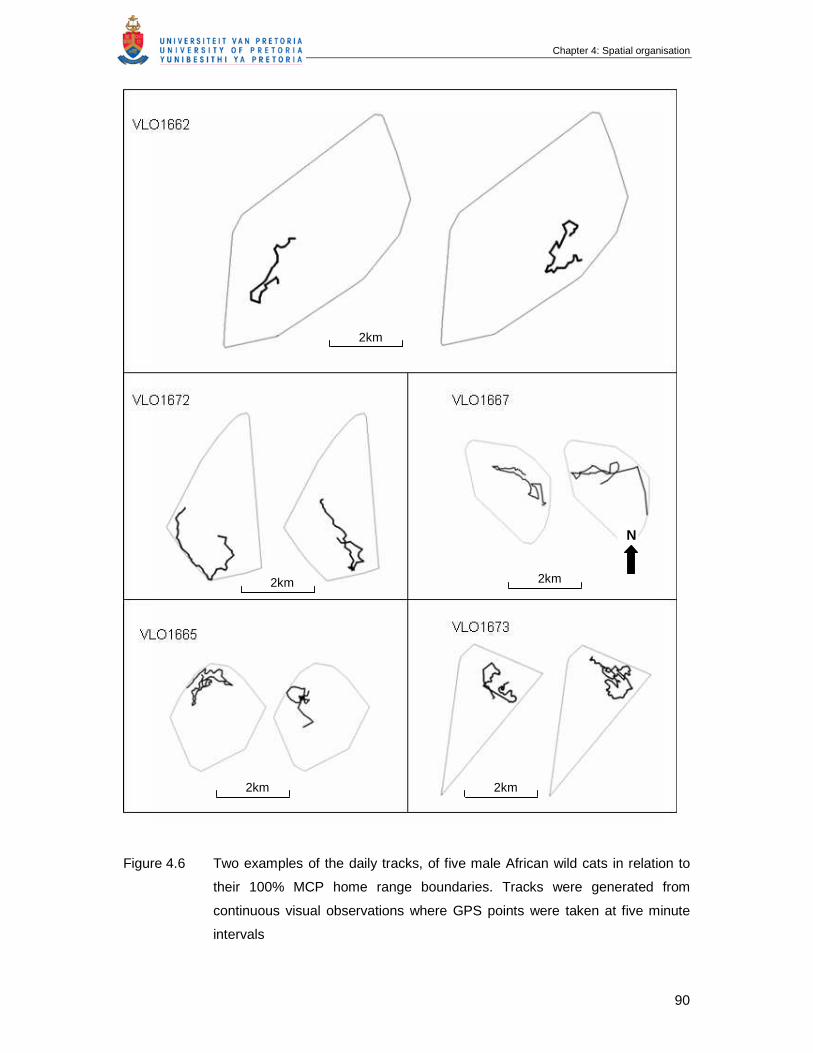
Chapter 4: Spatial organisation
90
Figure 4.6 Two examples of the daily tracks, of five male African wild cats in relation to
their 100% MCP home range boundaries. Tracks were generated from
continuous visual observations where GPS points were taken at five minute
intervals
N
2km 2km
2km 2km
2km
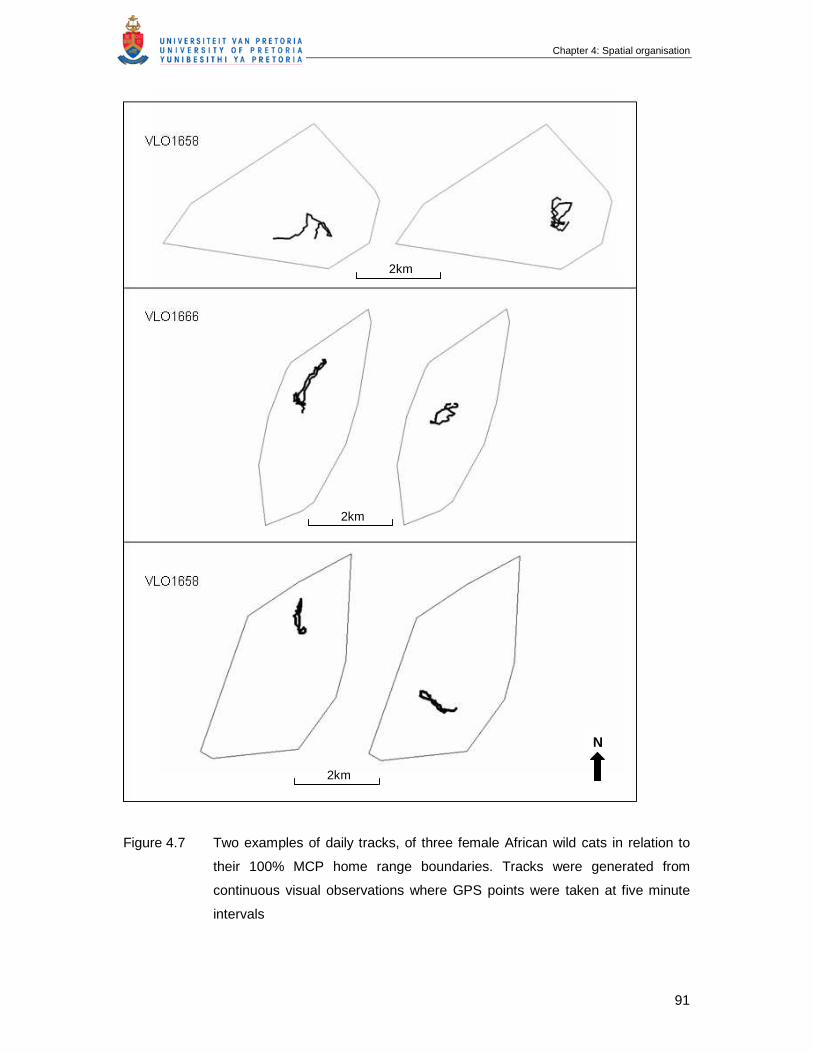
Chapter 4: Spatial organisation
91
Figure 4.7 Two examples of daily tracks, of three female African wild cats in relation to
their 100% MCP home range boundaries. Tracks were generated from
continuous visual observations where GPS points were taken at five minute
intervals
N
2km
2km
2km
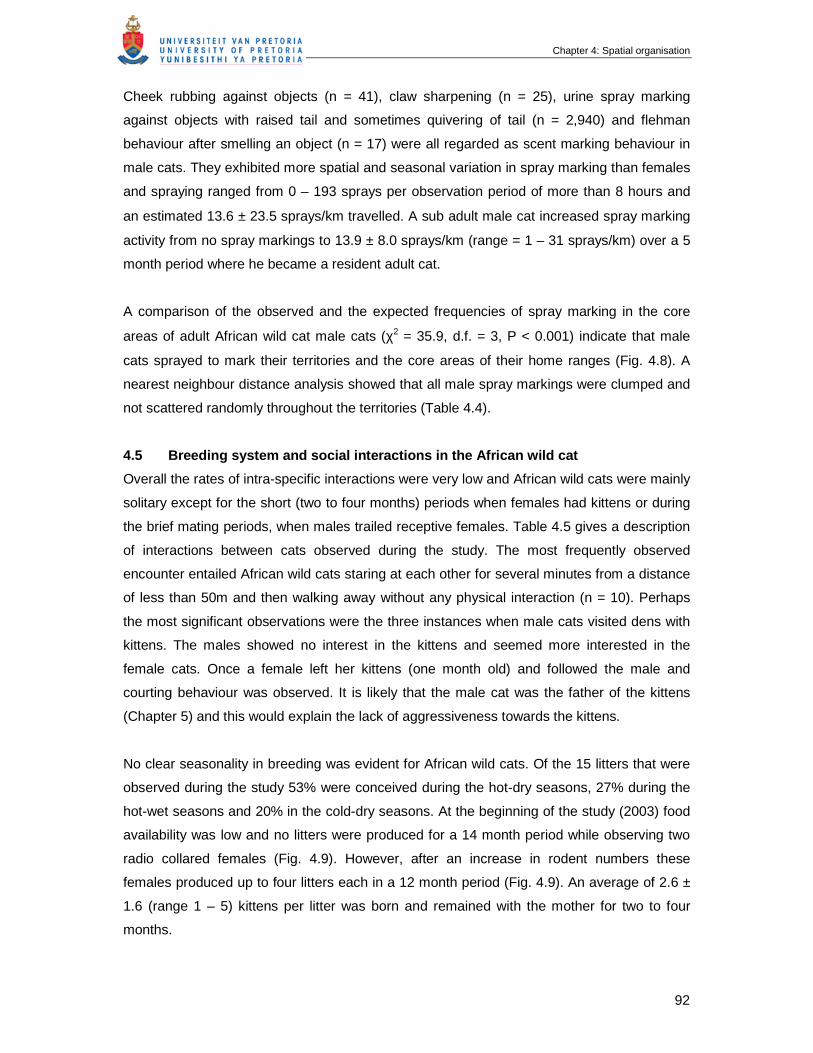
Chapter 4: Spatial organisation
92
Cheek rubbing against objects (n = 41), claw sharpening (n = 25), urine spray marking
against objects with raised tail and sometimes quivering of tail (n = 2,940) and flehman
behaviour after smelling an object (n = 17) were all regarded as scent marking behaviour in
male cats. They exhibited more spatial and seasonal variation in spray marking than females
and spraying ranged from 0 – 193 sprays per observation period of more than 8 hours and
an estimated 13.6 ± 23.5 sprays/km travelled. A sub adult male cat increased spray marking
activity from no spray markings to 13.9 ± 8.0 sprays/km (range = 1 – 31 sprays/km) over a 5
month period where he became a resident adult cat.
A comparison of the observed and the expected frequencies of spray marking in the core
areas of adult African wild cat male cats (χ2 = 35.9, d.f. = 3, P < 0.001) indicate that male
cats sprayed to mark their territories and the core areas of their home ranges (Fig. 4.8). A
nearest neighbour distance analysis showed that all male spray markings were clumped and
not scattered randomly throughout the territories (Table 4.4).
4.5 Breeding system and social interactions in the African wild cat
Overall the rates of intra-specific interactions were very low and African wild cats were mainly
solitary except for the short (two to four months) periods when females had kittens or during
the brief mating periods, when males trailed receptive females. Table 4.5 gives a description
of interactions between cats observed during the study. The most frequently observed
encounter entailed African wild cats staring at each other for several minutes from a distance
of less than 50m and then walking away without any physical interaction (n = 10). Perhaps
the most significant observations were the three instances when male cats visited dens with
kittens. The males showed no interest in the kittens and seemed more interested in the
female cats. Once a female left her kittens (one month old) and followed the male and
courting behaviour was observed. It is likely that the male cat was the father of the kittens
(Chapter 5) and this would explain the lack of aggressiveness towards the kittens.
No clear seasonality in breeding was evident for African wild cats. Of the 15 litters that were
observed during the study 53% were conceived during the hot-dry seasons, 27% during the
hot-wet seasons and 20% in the cold-dry seasons. At the beginning of the study (2003) food
availability was low and no litters were produced for a 14 month period while observing two
radio collared females (Fig. 4.9). However, after an increase in rodent numbers these
females produced up to four litters each in a 12 month period (Fig. 4.9). An average of 2.6 ±
1.6 (range 1 – 5) kittens per litter was born and remained with the mother for two to four
months.
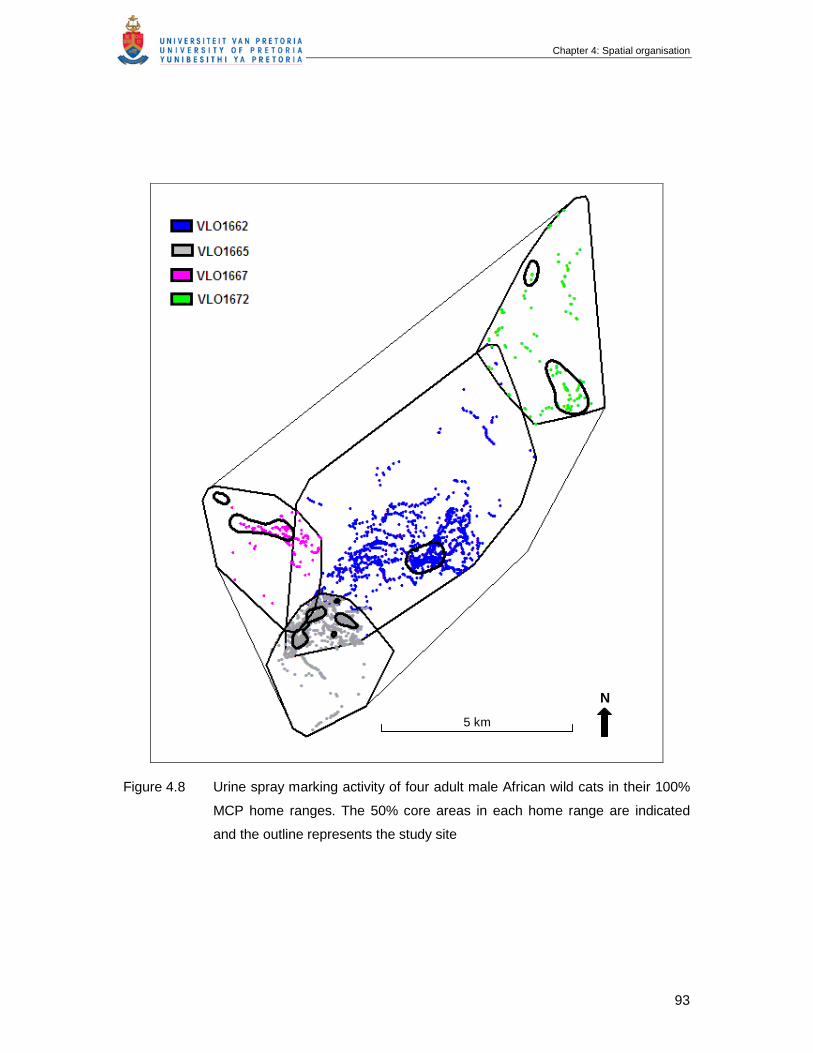
Chapter 4: Spatial organisation
93
Figure 4.8 Urine spray marking activity of four adult male African wild cats in their 100%
MCP home ranges. The 50% core areas in each home range are indicated
and the outline represents the study site
N
5 km
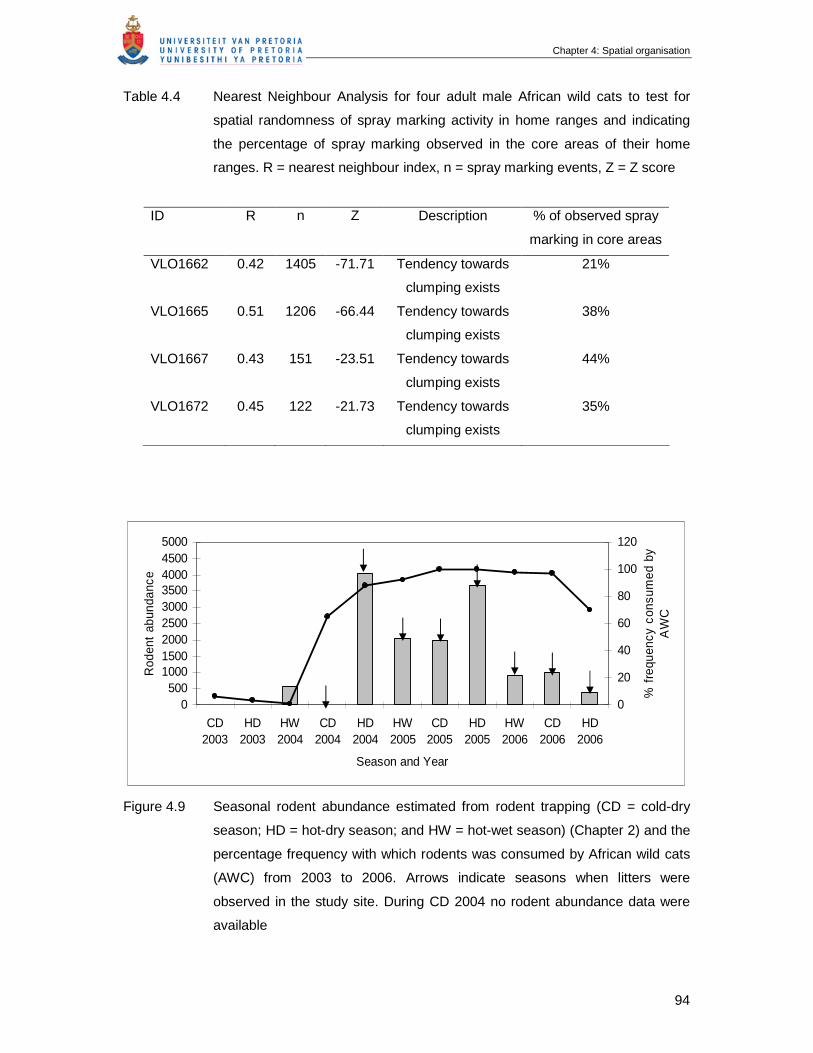
Chapter 4: Spatial organisation
94
Table 4.4 Nearest Neighbour Analysis for four adult male African wild cats to test for
spatial randomness of spray marking activity in home ranges and indicating
the percentage of spray marking observed in the core areas of their home
ranges. R = nearest neighbour index, n = spray marking events, Z = Z score
ID R n Z Description % of observed spray
marking in core areas
VLO1662 0.42 1405 -71.71 Tendency towards
clumping exists
21%
VLO1665 0.51 1206 -66.44 Tendency towards
clumping exists
38%
VLO1667 0.43 151 -23.51 Tendency towards
clumping exists
44%
VLO1672 0.45 122 -21.73 Tendency towards
clumping exists
35%
Figure 4.9 Seasonal rodent abundance estimated from rodent trapping (CD = cold-dry
season; HD = hot-dry season; and HW = hot-wet season) (Chapter 2) and the
percentage frequency with which rodents was consumed by African wild cats
(AWC) from 2003 to 2006. Arrows indicate seasons when litters were
observed in the study site. During CD 2004 no rodent abundance data were
available
0500
100015002000250030003500400045005000
CD2003
HD2003
HW2004
CD2004
HD2004
HW2005
CD2005
HD2005
HW2006
CD2006
HD2006
Season and Year
Rod
ent
abun
danc
e
0
20
40
60
80
100
120
% f
requ
ency
con
sum
ed b
y A
WC
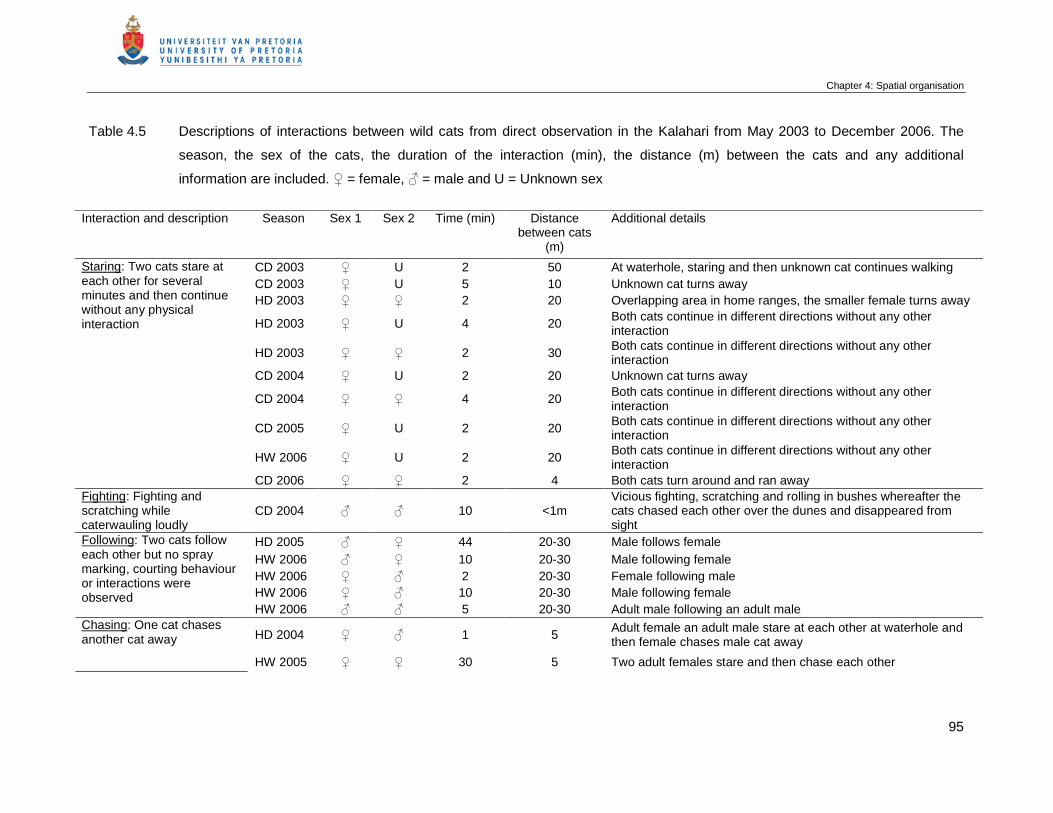
Chapter 4: Spatial organisation
95
Table 4.5 Descriptions of interactions between wild cats from direct observation in the Kalahari from May 2003 to December 2006. The
season, the sex of the cats, the duration of the interaction (min), the distance (m) between the cats and any additional
information are included. ♀ = female, ♂ = male and U = Unknown sex
Interaction and description Season Sex 1 Sex 2 Time (min) Distance
between cats (m)
Additional details
CD 2003 ♀ U 2 50 At waterhole, staring and then unknown cat continues walking CD 2003 ♀ U 5 10 Unknown cat turns away HD 2003 ♀ ♀ 2 20 Overlapping area in home ranges, the smaller female turns away
HD 2003 ♀ U 4 20 Both cats continue in different directions without any other interaction
HD 2003 ♀ ♀ 2 30 Both cats continue in different directions without any other interaction
CD 2004 ♀ U 2 20 Unknown cat turns away
CD 2004 ♀ ♀ 4 20 Both cats continue in different directions without any other interaction
CD 2005 ♀ U 2 20 Both cats continue in different directions without any other interaction
HW 2006 ♀ U 2 20 Both cats continue in different directions without any other interaction
Staring: Two cats stare at each other for several minutes and then continue without any physical interaction
CD 2006 ♀ ♀ 2 4 Both cats turn around and ran away Fighting: Fighting and scratching while caterwauling loudly
CD 2004 ♂ ♂ 10 <1m Vicious fighting, scratching and rolling in bushes whereafter the cats chased each other over the dunes and disappeared from sight
HD 2005 ♂ ♀ 44 20-30 Male follows female HW 2006 ♂ ♀ 10 20-30 Male following female HW 2006 ♀ ♂ 2 20-30 Female following male HW 2006 ♀ ♂ 10 20-30 Male following female
Following: Two cats follow each other but no spray marking, courting behaviour or interactions were observed
HW 2006 ♂ ♂ 5 20-30 Adult male following an adult male
HD 2004 ♀ ♂ 1 5 Adult female an adult male stare at each other at waterhole and then female chases male cat away
Chasing: One cat chases another cat away
HW 2005 ♀ ♀ 30 5 Two adult females stare and then chase each other
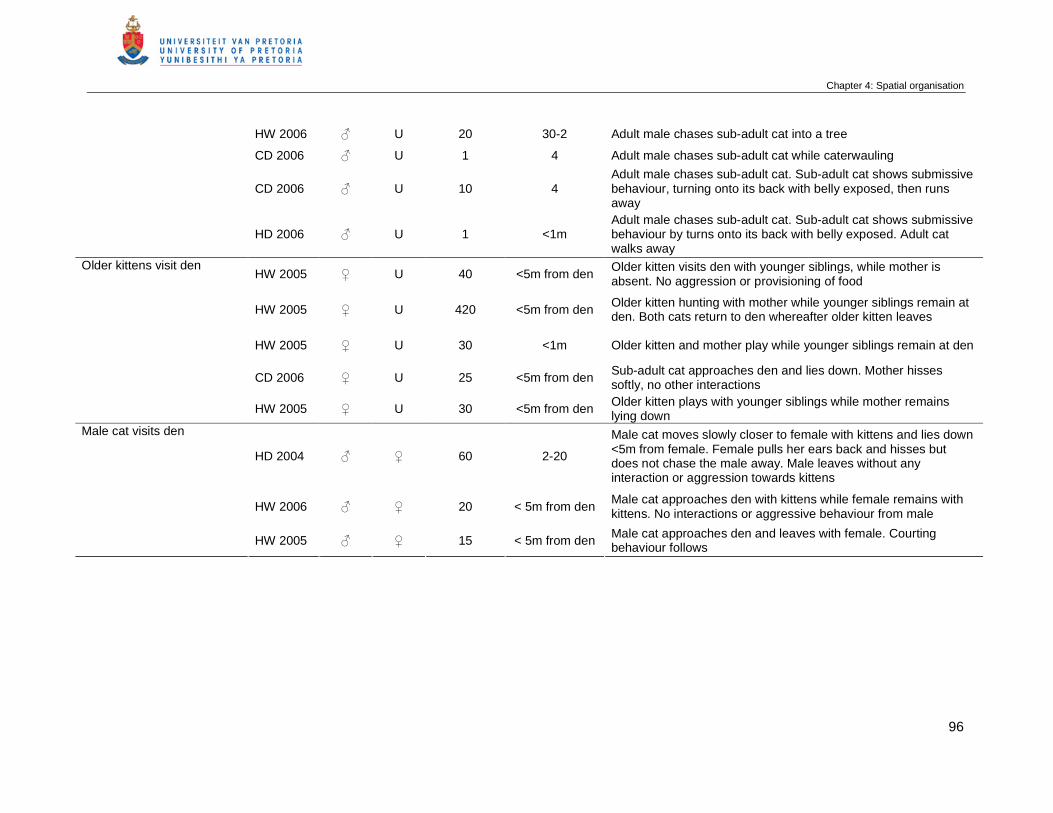
Chapter 4: Spatial organisation
96
HW 2006 ♂ U 20 30-2 Adult male chases sub-adult cat into a tree
CD 2006 ♂ U 1 4 Adult male chases sub-adult cat while caterwauling
CD 2006 ♂ U 10 4 Adult male chases sub-adult cat. Sub-adult cat shows submissive behaviour, turning onto its back with belly exposed, then runs away
HD 2006 ♂ U 1 <1m Adult male chases sub-adult cat. Sub-adult cat shows submissive behaviour by turns onto its back with belly exposed. Adult cat walks away
HW 2005 ♀ U 40 <5m from den Older kitten visits den with younger siblings, while mother is absent. No aggression or provisioning of food
HW 2005 ♀ U 420 <5m from den Older kitten hunting with mother while younger siblings remain at den. Both cats return to den whereafter older kitten leaves
HW 2005 ♀ U 30 <1m Older kitten and mother play while younger siblings remain at den
CD 2006 ♀ U 25 <5m from den Sub-adult cat approaches den and lies down. Mother hisses softly, no other interactions
Older kittens visit den
HW 2005 ♀ U 30 <5m from den Older kitten plays with younger siblings while mother remains lying down
HD 2004 ♂ ♀ 60 2-20
Male cat moves slowly closer to female with kittens and lies down <5m from female. Female pulls her ears back and hisses but does not chase the male away. Male leaves without any interaction or aggression towards kittens
HW 2006 ♂ ♀ 20 < 5m from den Male cat approaches den with kittens while female remains with kittens. No interactions or aggressive behaviour from male
Male cat visits den
HW 2005 ♂ ♀ 15 < 5m from den Male cat approaches den and leaves with female. Courting behaviour follows
Chapter 4: Spatial organisation
97
Males spent on average 1.7 ± 0.5 days (n = 6) with a receptive female while chasing, playing
and courting. Mating involves grabbing the female by the scruff of the neck and the female
lunging after successful stimulation. Vocalisation was typically felid, with calling observed in
both sexes. At first receptive females hiss at males followed by gurgling sounds (Smithers,
1983; Sunquist & Sunquist, 2002). Although males were observed to visit dens they were not
observed to assist in the rearing of kittens (Table 4.5).
5. Discussion
Although data on home ranges and spatial organisation in wild cats (Felis silvestris) are
limited to short term studies, small samples sizes and opportunistic observations (Nowell &
Jackson, 1996), home range sizes show large variability (Table 4.6). This could be due to
varying densities and distribution of prey (Liberg & Sandell, 1988), caused by the large range
of environmental conditions that wild cats occur in (Nowell & Jackson, 1996). The annual
home range estimates concluded from our study (female = 3.5 ± 1.0 km2 and male = 7.7 ±
3.5 km2) fall within the ranges of previous studies (Table 4.6). An exception is the study by
Phelan & Sliwa (2005) on Gordon’s wild cat (F. s. gordoni) in the Sharjah desert which
reported much larger home range sizes for wild cats than in any other study. Larger home
ranges in this desert area may be as a result of lower prey availability, exaggerated by an
unusually dry period during their study.
The resource dispersion hypothesis predicts that resources have a patchy distribution and
that the minimum number of patches required to sustain a breeding pair will sometimes
support additional individuals (Carr & Macdonald, 1986). Althought this was developed to
explain carnivore social behaviour and the presence of group living it may also explain
patterns in spacing behaviour of solitary carnivores (Carr & Macdonald, 1986). The
hypothesis does not consider resource predictability which might be important factor affecting
animal spatial organisation (Maher & Lott, 2000).The Kalahari is a semi desert habitat
exhibiting variable prey densities and at the onset of our study a lean period in the Kalahari
was identified (Chapter 2). Although we do not have sufficient home range data to test these
observations, three of the four cats revealed larger home ranges in 2004 than in the following
years. The exception was female, VLO1654 that showed a smaller home range during this
period. This female was hunting around the waterhole where she spesialised in catching
birds (Chapter 3). As rodent numbers increased she changed her behaviour, increased her
home range and switched from hunting birds to rodents. Nonetheless, wild cats that lack a
rich food resource, such as associated with a waterhole in their home range could potentially
increase their home ranges during dry periods in the Kalahari.
Chapter 4: Spatial organisation
98
All kittens born and raised in our study site disappeared after four months, however, it was
not possible to determine how far they travelled from their natal home range. A single
sighting of a radio collared cat 80 kilometres north of our study site is suggestive of large
dispersal abilities. Young cats may disperse over vast distances and roam until they find a
suitable home range or take up residency (Edwards, De Preu, Shakeshaft, Crealy &
Paltridge, 2001).
Male home range sizes may not only be determined by food requirements but also by female
distribution (Liberg & Sandell, 1988, Altmann, 1990). Therefore, Sandell (1989) predicted that
solitary male carnivores should have home ranges 1.2 ± 0.1 times larger than females. In the
African wild cat male annual home ranges were 1.8 times larger than the predicted home
range estimates. Since females are not evenly distributed males cover large home ranges to
increase their reproductive output. Female home ranges were smaller and suggest that food
abundances and habitat requirements are sufficient and readily available. Sandell’s (1989)
prediction is supported by our study as well as by most other wild cat studies, for example
the European wild cat, F. s. silvestris (Fuller, Biknevicius & Kat, 1988; Stahl, Artois & Aubert,
1988; Biro et al., 2004; Phelan & Sliwa, 2005), feral domestic cats, F. s. catus (Barratt, 1997;
Daniels, Beaumont, Johnson, Balharry, Macdonald & Barratt, 2001; Edwards et al., 2001;
Molsher et al., 2005), bobcat, L. rufus (Bailey, 1974; Chamberlain, Leopold & Conner, 2003;
Cochrane, Kirby, Jones, Conner & Warren, 2006), black-footed cat, F. nigripes (Sliwa, 2004),
European lynx, L. lynx (Mech, 1980; Breitenmoser & Haller, 1993; Herfindal et al., 2005),
Canadian lynx, L. canadensis (Vashon, Meehan, Jakubas, Organ, Vashon, McLaughlin,
Matula & Crowley, 2007), Geoffrey’s cat, Felis geoffroyi (Johnson & Franklin, 1991) and
ocelot, Leopardus pardalis (Ludlow & Sunquist, 1987).
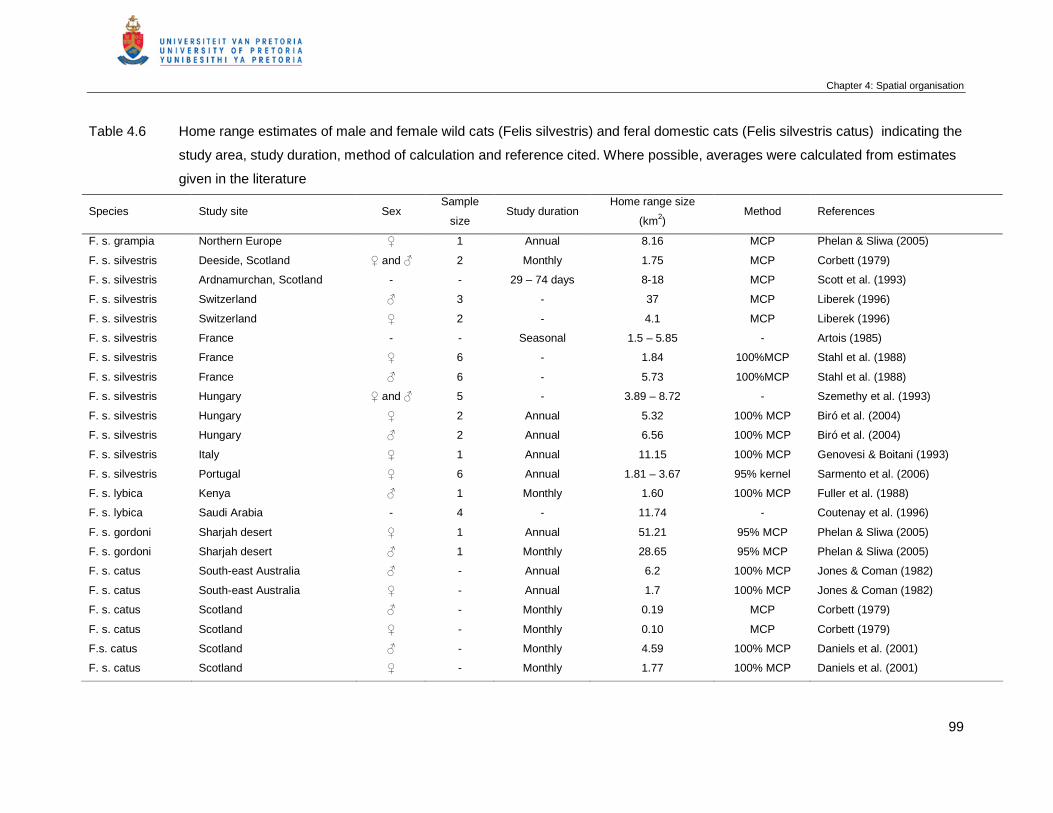
Chapter 4: Spatial organisation
99
Table 4.6 Home range estimates of male and female wild cats (Felis silvestris) and feral domestic cats (Felis silvestris catus) indicating the
study area, study duration, method of calculation and reference cited. Where possible, averages were calculated from estimates
given in the literature
Species Study site Sex Sample
size Study duration
Home range size
(km2) Method References
F. s. grampia Northern Europe ♀ 1 Annual 8.16 MCP Phelan & Sliwa (2005)
F. s. silvestris Deeside, Scotland ♀ and ♂ 2 Monthly 1.75 MCP Corbett (1979)
F. s. silvestris Ardnamurchan, Scotland - - 29 – 74 days 8-18 MCP Scott et al. (1993)
F. s. silvestris Switzerland ♂ 3 - 37 MCP Liberek (1996)
F. s. silvestris Switzerland ♀ 2 - 4.1 MCP Liberek (1996)
F. s. silvestris France - - Seasonal 1.5 – 5.85 - Artois (1985)
F. s. silvestris France ♀ 6 - 1.84 100%MCP Stahl et al. (1988)
F. s. silvestris France ♂ 6 - 5.73 100%MCP Stahl et al. (1988)
F. s. silvestris Hungary ♀ and ♂ 5 - 3.89 – 8.72 - Szemethy et al. (1993)
F. s. silvestris Hungary ♀ 2 Annual 5.32 100% MCP Biró et al. (2004)
F. s. silvestris Hungary ♂ 2 Annual 6.56 100% MCP Biró et al. (2004)
F. s. silvestris Italy ♀ 1 Annual 11.15 100% MCP Genovesi & Boitani (1993)
F. s. silvestris Portugal ♀ 6 Annual 1.81 – 3.67 95% kernel Sarmento et al. (2006)
F. s. lybica Kenya ♂ 1 Monthly 1.60 100% MCP Fuller et al. (1988)
F. s. lybica Saudi Arabia - 4 - 11.74 - Coutenay et al. (1996)
F. s. gordoni Sharjah desert ♀ 1 Annual 51.21 95% MCP Phelan & Sliwa (2005)
F. s. gordoni Sharjah desert ♂ 1 Monthly 28.65 95% MCP Phelan & Sliwa (2005)
F. s. catus South-east Australia ♂ - Annual 6.2 100% MCP Jones & Coman (1982)
F. s. catus South-east Australia ♀ - Annual 1.7 100% MCP Jones & Coman (1982)
F. s. catus Scotland ♂ - Monthly 0.19 MCP Corbett (1979)
F. s. catus Scotland ♀ - Monthly 0.10 MCP Corbett (1979)
F.s. catus Scotland ♂ - Monthly 4.59 100% MCP Daniels et al. (2001)
F. s. catus Scotland ♀ - Monthly 1.77 100% MCP Daniels et al. (2001)
Chapter 4: Spatial organisation
100
Few interactions between African wild cats were observed and were mostly between females
with kittens or receptive females with males. Extensive female-female home range overlap
indicates that food availability is variable in time and space (Sandell, 1989) and related
females clustering together have been described in many carnivores (Smith, McDougal &
Sunquist, 1987; Logan & Sweanor, 2001; Janečka, Blankenship, Hirth, Tewes, Kilpatrick &
Grassman, 2004; Kitchen, Gese, Waits, Karki & Schauster, 2005). Home range overlap in
females is common in solitary carnivores e.g. bobcat, L. rufus (Zezulak & Schwab, 1979);
ocelot, L. pardalis (Ludlow & Sunquist, 1987) and kodkod, Oncifelis guigna (Dunstone,
Durbin, Wyllie, Freer, Jamett, Mazolli & Rose, 2002). Although female wild cat home ranges
overlap extensively, the core areas were mostly exclusive and the females were not related
(Chapter 5). Territorial behaviour of females could not be determined by direct observations
such as scent marking since scent marking activity appeared to be dependent on the
reproductive status of females, however, data from multiple seasons as well as breeding and
den sites confirmed the residency of the females in our study site. A single observation
where one female chased another may be suggestive of territorial behaviour.
Adult male home range overlap was limited and core areas showed no overlap between
male cats. Studies on wild cat species confirm the exclusive use of home ranges by male
cats, for example black-footed cats, F. nigripes (Sliwa, 2004), Geoffroyi cat, F. geoffroyi
(Johnson & Franklin, 1991), bobcat, L. rufus (Cochrane et al., 2006) and European lynx, L.
lynx (Breitenmoser & Haller, 1993). We suggest that spatial exclusivity is due to the high
abundance of prey species (Sandell, 1989). This is in contrast with studies of feral domestic
cats where large overlap among home ranges of male cats and smaller overlap between
females were found (Corbett, 1979; Jones & Coman, 1982; Fitzgerald & Karl, 1986; Daniels
et al., 2001; Biró et al., 2004). Further evidence for male territoriality are substantiated by
aggressive behaviour between male cats and a roaming sub-adult male that became
resident, with a concomitant increase in spray marking activity and decrease in home range
overlap with the resident male. It appears that a pattern of intrasexual territory is displayed
that corresponds with other asocial felids (Ferreras, Beltrán, Aldama & Delibes, 1997;
Stander, Haden, Kaqece & Ghau, 1997).
Seasonal prey abundance was highly variable and no clear breeding season was identified,
therefore, the lack of seasonal differences in male home range sizes is expected. However,
receptive females are unpredictable in time and space, therefore, male cat ranges should
overlap with several females (Imms, 1987) or they should move over larger areas, covering
greater distances than females to maximise their reproductive output (Sandell, 1989). In the
Kalahari home ranges of male African wild cats do overlap with those of several females and
Chapter 4: Spatial organisation
101
they have significantly larger home range sizes than female cats. Distances covered by male
African wild cats are larger and they travel faster than female African wild cats (Chapter 3).
African wild cats shows several ways of scent marking, however, urine spray marking is the
most prominent way of communication. Male cats spray mark frequently to advertise their
home ranges and aggressive behaviour between male cats was observed. The overall
spatial pattern of urine spray marking in male cats is not randomly distributed and shows an
increase in spray marking in the core areas of the cats. Female spray marking is related to
their reproductive status (Sliwa, Herbst & Mills in press).
The African wild cat seems to be solitary and no evidence of sociality as reported in feral
colonies of domestic cats was observed (Laundré, 1977; Macdonald & Apps, 1978; Dards,
1978; Corbett, 1979; Macdonald, 1983; Fitzgerald & Karl, 1986). However it is interesting to
note that older siblings did occasionally visit the mother and younger kittens at den sites,
although no provisioning of food by older siblings was observed. Furthermore, on three
occasions male cats visited females with kittens without any suggestion of infanticide. These
observations could be interpreted as a weak form of sociality in wild cats that could manifest
itself more strongly under different ecological conditions.
Conclusion
Prey abundance plays an important role in social and spatial organisation of the African wild
cat in the southern Kalahari. Food availability influences the reproductive activity of female
cats, therefore no clear breeding season was evident. This explains the lack of variability in
seasonal home range sizes of both male and female cats. Food resources in the semi desert
area vary in time and space, thus females exhibit large overlap in their home ranges,
although core areas were exclusive. Since receptive females seem to be the limiting
resource for male cats, overlap between males is restricted to small areas. African wild cats
were solitary for the majority of the time and communication between cats were via a range
of scent marking behaviours that increase in females to advertise their reproductive status.
Males scent marked continuously during the study period probably to mark their home range
extent to neighbouring and roaming male cats. This study provides a meaningful contribution
to our knowledge of African wild cat ranging behaviour as well as the importance of prey
abundances on their reproductive ecology.
6. References
Adams, E.S. (2001). Approaches to the study of territory size and shape. Annu. Rev. Ecol.
Syst. 32: 277-303.
Chapter 4: Spatial organisation
102
Altmann, J. (1990). Primate males go where the females are. Anim. Behav. 39: 193-195.
Andersson, M. (1981). On optimal predator research. Theor. Popul. Biol. 19: 58-86.
Apps, P.J. (1986). Home ranges of feral cats on Dassen Island. J. Mammal. 67: 199-200.
Artois, M. (1985). Utilisation de l’espace et du temps chex le renard (Vulpes vulpes) et le
chat forestier (Felis silvestris) en Lorraine. Gibier Faune Sauvage 3: 33-57.
Bailey, T. N. (1974). Social Organization in a Bobcat Population. J. Wildl. Manage. 38: 435-
446.
Barratt, D.G. (1997). Home range size, habitat utilisation and movement patterns of
suburban and farm cats, Felis catus. Ecography 20: 271-280.
Beckoff, M., Daniels, T.J. & Gittleman, J.L. (1984). Life history patterns and the comparative
social ecology of carnivores. Annu. Rev. Ecol. Syst. 15: 191-232.
Benson, J.F., Chamberlain, M.J. & Leopold, B.D. (2004). Land tenure and occupation of
vacant home ranges by bobcat (Lynx rufus). J. Mammal. 85: 983-988.
Benson, J.F., Chamberlain, M.J. & Leopold, B.D. (2006). Regulation of space in a solitary
felid: population density or prey availability. Anim. Behav. 71: 685-693.
Begg, C.M., Begg, K.S., Du Toit, J.T. & Mills, M.G.L. (2005). Spatial organization of the
honey badgers Mellivora capensis in the southern Kalahari: home-range size and movement
patterns. J. Zool. (Lond.) 265: 23-35.
Biró, Z., Szemethy, L. & Heltai, M. (2004). Home range sizes of wildcats (Felis silvestris) and
feral domestic cats (Felis silvestris f. catus) in a hilly region of Hungary. Mamm. Biol. 69: 302-
310.
Börger, L., Dalziel, B.D. & Fryxell, J.M. (2008). Are there general mechanisms of animal
home range behaviour? A review and prospects for future research. Ecology Letters 11: 637-
650.
Chapter 4: Spatial organisation
103
Brandt, M.J. & Lambin, X. (2007). Movement patterns of a specialist predator, the weasel
Mustela nivalis exploiting asynchronous cyclic field vole Microtus agrestis populations. Acta
Theriol. 52: 13-25.
Breitenmoser, U. & Haller, H. (1993). Patterns of predation by reintroduced European lynx in
the Swiss Alps. J. Wildl. Manage. 57: 135-144.
Brown, J.L. & Orians, G.H. (1970). Spacing patterns in mobile animals. Annu. Rev. Ecol.
Syst. 1: 239-262.
Caro, T.M. & Collins, D.A. (1987). Male cheetah social organization and territoriality.
Ethology 74: 52-64.
Carr, G.M. & Macdonald, D.W. (1986). The sociality of solitary foragers: a model based on
resource dispersion. Anim. Behav. 34: 1540-1549.
Chamberlain, M. J., Leopold, B.D. & Conner, L.M. (2003). Space Use, Movements and
Habitat Selection of Adult Bobcats (Lynx rufus) in Central Mississippi. Am. Midl. Nat. 149:
395-405.
Clutton-Brock, T.H. & Harvey, P.H. (1987). Mammals, resources and reproductive strategies.
Nature (Lond.) 273: 191-195.
Cochrane, J. C., Kirby, J.D., Jones, I.G., Conner, L.M. & Warren, R.J. (2006). Spatial
Organization of Adult Bobcats in a Longleaf Pine-Wiregrass Ecosystem in Southwestern
Georgia. Southeast. Nat. 5: 711-724.
Corbett, L.K. (1979). Feeding ecology and social organization of wildcats (Felis silvestris)
and domestic cats (Felis catus) in Scotland. PhD thesis, University of Aberdeen.
Coutenay, O., Forbes, S., Honess, P. (1996). African Wildcats in Saudi Arabia. In The
WildCru Review. MacDonald, D.M (Ed.). University of Oxford, Oxford, UK.
Creel, S. & Creel, N.M. (2002). The African wild dog: behaviour, ecology and conservation.
Princeton: Princeton University Press.
Chapter 4: Spatial organisation
104
Daniels, M.J., Beaumont, M.A., Johnson, P.J., Balharry, D., Macdonald, D.W. & Barratt, E.
(2001). Ecology and genetics of wild-living cats in the north-east of Scotland and the
implications for the conservation of the wildcat. J. Appl. Ecol. 38: 146-161.
Dards, J.L. (1978). Home ranges of feral cats in Portsmouth dockyard. Carniv. Genet. Newsl.
3: 242-255.
Davies, N.B. & Houston, A.I. (1984). Territory economics. In Behavioural Ecology. An
Evolutionary Approach. Krebs, J.R. & Davies, N.B. (Eds.). Blackwell Science, Oxford.
De Azevedo, F.C.C. & Murray, D.L. (2007). Spatial organization and food habits of jaguars
(Panthera onca) in a floodplain forest. Biol. Conserv. 137: 391-402.
Dunstone, N., Durbin, L., Wyllie, I., Freer, R., Jamett, G.A., Mazolli, M. & Rose, S. (2002).
Spatial organization, ranging behaviour and habitat use of the kodkod (Oncifelis guigna) in
southern Chili. J. Zool. (Lond). 257: 1-11.
Edwards, G. P., De Preu, N., Shakeshaft, B.J., Crealy, I.V. & Paltridge, R.M. (2001). Home
range and movement of male feral cats (Felis catus) in a semi arid woodland environment in
central Australia. Austral. Ecol. 26: 93-101.
Erlinge, S. & Sandell, M. (1986). Seasonal changes in the social organization of male stoats,
Mustela erminea: an effect of shifts between two decisive resources. Oikos 47: 57-62.
Ferguson, A.W., Currit, N.A. & Weckerly, F.W. (2009). Isometric scaling in home-range size
of male and female bobcats (Lynx rufus). Can. J. Zool. 87: 1052-1060.
Ferreras, P., Beltrán, J.F., Aldama, J.J. & Delibes, M. (1997). Spatial organization and land
tenure system of the endangered Iberian lynx (Lynx pardinus). J. Zool. (Lond.) 243: 163-189.
Fitzgerald, B.M. & Karl, B.J. (1986). Home range of feral house cats (Felis catus L.) in forests
of the Orongorongo Valley, Wellington, New Zealand. New Zeal. J. Ecol. 9: 72-81.
Fuller, T.K., Biknevicius, A.R. & Kat, P.W. (1988). Home range of an African wildcat, Felis
silvestris (Schreber), near Elmenteita, Kenya. Z. Säugetierk. 53: 380-381.
Chapter 4: Spatial organisation
105
Fuller, T.K. (2003). Wolf population dynamics. In Wolves: behavior, ecology and
conservation. Mech, L.D. & Boitani, L. (Eds.). The University of Chicago Press, Chicago.
Genovesi, P. & Boitani, L. (1993). Spacing patterns and activity rhythms of a wildcat (Felis
silvestris) in Italy. In Proceedings of a Seminar on the Biology and Conservation of the
wildcat (Felis silvestris). Nancy, France, Council of Europe, Strasburg.
Gittleman, J.L. & Harvey, P.H. (1982). Carnivore home range size, metabolic needs and
ecology. Behav. Ecol. Sociobiol. 10: 57-63.
Goodrich, J.M. & Buskirk, S.W. (1998). Spacing and ecology of North American Badgers
(Taxidea taxus) in a prairie-dog (Cynomys leucurus) complex. J. Mammal. 79: 171-179.
Gorman, M.L. & Trowbridge, B.J. (1989). The role of Odor in the Social Lives of Carnivores.
In Carnivore behaviour, ecology and evolution. Vol. 1 Gittleman, J.L. (Ed). Chapman & Hall.
Harestad, A.D. & Bunnell, F. (1979). Home range and body weight – a re-evaluation. Ecology
60: 389-402.
Harris, S., Cresswell, W.J., Forde, P.G., Trewhella, W.J., Woollard, T. & Wray, S. (1990).
Home range analysis using radio-tracking data – a review of problems and techniques
particularly as applied to the study of mammals. Mammal. Rev. 20: 97-123.
Hayward, M.W., O’Brien, J. & Kerley, G.I.H. (2007). Carrying capacity of large African
predators: Predictions and tests. Biol. Conserv. 139: 219-229.
Herfindal, I., Linnell, J.D.C., Odden, J., Nilsen, E.B. & Andersen, R. (2005). Prey density,
environmental productivity and home-range size in the Eurasian lynx (Lynx lynx). J. Zool.
(Lond.) 265: 63-71.
Hixon, M.A. (1980). Food production and competitor density as the determinants of feeding
territory size. Am. Nat. 115: 510-530.
Hooge, P.N. & Eichenlaub, B. (2000). Animal movement extension to Arcview version 2.0.
U.S. Geological Survey, Alaska Science Centre – Biological Science Office, U.S. Geological
Survey, Anchorage, AK, USA.
Chapter 4: Spatial organisation
106
Imms, R.A. (1987). Male spacing patterns in microtine rodents. Am. Nat. 130: 475-484.
Janečka, J.E., Blankenship, T.L., Hirth, D.H., Tewes, M.E., Kilpatrick, C.W. & Grassman, L.I.
(2004). Kinship and social structure of bobcats (Lynx rufus) inferred from microsatellite and
radio-telemetry data, J. Zool. (Lond.) 269: 494-501.
Jedrzejewski, W., Schmidt, K., Theuerkauf, J., Jedrzejewska, B. & Kowalczyk, R. (2007).
Territory size of wolves Canis lupus: linking local (Bialowieza Primeval Forest, Poland) and
Holarctic-scale patterns. Ecography 30: 66-76.
Jetz, W., Carbone, C., Fulford, J. & Brown, J.H. (2004). The scaling of animal space use.
Science 306: 266-268.
Johnson, W.E. & Franklin, W.L. (1991). Feeding and spatial ecology of Felis geoffroyi in
southern Patagonia. J. Mammal. 72: 815-820.
Johnson, D.S.P., Macdonald, D.W. & Dickman, A.J. (2000). An anaysis and review of models
of the sociobiology of the Mustelidae. Mammal. Rev. 30: 171-196.
Jones, E. & Coman, B.J. (1982). Ecology of the feral cat, Felis catus (L) in South Eastern
Australia III. Home ranges and population ecology in semi-arid North West Victoria. Aust.
Wildl. Res. 9: 409-420.
Kenward, R.E. & Hodder, K.H. (1996). Ranges V: an analysis system for biological location
data. Wareham: Institute of Terrestrial Ecology.
Kenward, R.E. (1987). Wildlife Radio Tagging Equipment, Field Techniques and Data
Analysis. Academic Press, London.
Kitchen, A.M., Gese, E.M., Waits, L.P., Karki, S.M. & Schauster, E.R. (2005). Genetic and
spatial structure within a swift fox population. J. Animal. Ecol. 74: 1173-1181.
Langham, N.P.E. & Porter, R.E.R. (1991). Feral cats (Felis catus L.) on New Zealand
farmland. I. Home range. Wildlife Res. 18: 741-760.
Laundré, J. (1977). The daytime behaviour of domestic cats in a free-roaming population.
Animal Behav. 25: 990-998.
Chapter 4: Spatial organisation
107
Leyhausen, P. (1965). The communal organization of solitary mammals. Symp. Zool. Soc.,
Lond. 14: 249-263.
Liberek, M. (1996). Radiotracking on the wildcat in Switzerland. Cat News 25: 18-19.
Liberg, O. & Sandell, M. (1988). Spatial organisation and reproductive tactics in the domestic
cat and other felids. In The Domestic Cat: the biology of its behaviour. Turner, D.C. &
Bateson, P. (Eds.). Cambridge University Press, Cambridge.
Liberg, O. (1980). Spacing patterns in a population of rural free roaming domestic cats. Oikos
35: 336-349.
Liberg, O. (1984). Home range and territoriality in free ranging house cats. Acta Zool. Fenn.
171: 283-285.
Lindzey, F.G., Van Sickle, W.D., Ackerman, B.B., Barnhurst, D., Hemker, T.P. & Laing, S.P.
(1994). Cougar population dynamics in southern Utah. J. Wildl. Manage. 58: 619-624.
Lindstedt, S.L. Miller, B.J. & Buskirk, S.W. (1986). Home range, time and body size of
mammals. Ecology 67: 413-418.
Litvaitis, J.A., Clark, A.G. & Hunt, J.H. (1986). Prey selection and fat deposits of bobcats
(Felis rufus) during autumn in Maine. J. Mammal. 66: 389-392.
Logan, K.A. & Sweanor, L.L. (2001). Desert puma. Evolutionary ecology and conservation of
an enduring carnivore. Island Press, Washington.
Ludlow, M.E. & Sunquist, M.E. (1987). Ecology and behaviour of ocelots in Venezuela. Nat.
Geo. Res. 3: 447-461.
Macdonald, D.W. (1983). The ecology of carnivore social behaviour. Nature (Lond.) 301:
379-384.
Macdonald, D.W. & Apps, P.J. (1978). The social behaviour of a group of semi-dependant
farm cats, Felis catus: a progress report. Carniv. Genet. Newsl. 3: 256-268.
Chapter 4: Spatial organisation
108
Maher, C.R. & Lott, D.F. (1995). Definitions of territoriality used in the study of variation in
vertebrate spacing systems. Anim. Behav. 49: 1581-1597.
Maher, C.R. & Lott, D.F. (2000). A review of ecological determinants of territoriality within
vertebrate species. Am. Midl. Nat. 143: 1-29.
Mares, M.A. & Lacher, T.E. (1987). Social spacing in small mammals: Patterns of individual
variation. Am. Zool. 27: 293-306.
McNab, B.K. (1963). Bioenergetics and the determination of home range size. Am. Nat. 97:
133-140.
Mech, L.D. (1977). Record movement of a Canadian lynx. J. Mammal. 58: 676-677.
Mech, L.D. (1980). Age, Sex, Reproduction and Spatial Organization of lynxes Colonizing
North-eastern Minnesota. J. Mammal. 61: 261-267.
Mellen, J.D. (1993). A Comparative Analysis of Scent-Marking, Social and Reproductive
Behavior in 20 Species of Small Cats (Felis). Am. Zool. 33: 151-166.
Minta, S.C. (1992). Tests of spatial and temporal interaction among mammals. Ecol. Appl. 2:
178-188.
Mitchell, M.S. & Powell, R.A. (2004). A mechanistic home range model for optimal use of
spatially distributed resources. Ecol. Model. 177: 209-232.
Mohr, C.O. (1947). Table of equivalent populations of North American small mammals. Am.
Midl. Nat. 37: 223-249.
Molsher, R., Dickman, C., Newsome, A. & Müller, W. (2005). Home ranges of feral cats
(Felis catus) in central-western New South Wales, Australia. Wildlife Res. 32: 587-595.
Nowell, K. & Jackson, P. (1996). Wild cats. Status survey and conservation action plan.
IUCN, Gland.
Chapter 4: Spatial organisation
109
Palomares, F., Delibes, M., Revilla, E., Calzada, J. & Fedriani, J.M. (2001). Spatial ecology
of the Iberian lynx and abundance of European rabbits in southern Spain. Wildlife Monogr.
148: 1-36.
Phelan, P. & Sliwa, A. (2005). Range size and den use of Gordon's wildcats Felis silvestris
gordoni in the Emirate of Sharjah, United Arab Emirates. J. Arid Environ. 60: 15-25.
Pierce, B.M., Bleich, V.C., Wehausen, J.D. & Bowyer, R.T. (1999). Migratory patterns of
mountain lions: implications for social regulation and conservation. J. Mammal. 80: 986-992.
Pierce, B.M., Bleich, V.C. & Bowyer, R.T. (2000). Social organisation of mountain lions: Does
a Land-Tenure system regulate population size? Ecology 91: 1533-1543.
Poole, K.G. (1995). Spatial organization of a lynx population. Can. J. Zool. 73: 632-641.
Sandell, M. (1989). The mating tactics and spacing patterns of solitary carnivores. In
Carnivore behaviour, ecology and evolution. Vol. 1. Gittleman, J.L. (Ed). Chapman & Hall.
Sarmento, P., Cruz, J., Tarraso, P. & Fonseca, C. (2006). Space and Habitat Selection by
Female European Wild Cats (Felis silvestris silvestris). Wildl. Biol. Prac. 2: 79-89.
Scott, R., Easterbee, N. & Jefferies, D. (1993). A radio-tracking study of wildcats in western
Scotland. In Proc. Seminar on the biology and conservation of the wildcat (Felis silvestris),
Nancy, France, September 1992. Council of Europe, Strasbourg.
Schaller, G.B. (1972). The Serengeti lion: a study of predator-prey relations. University of
Chicago Press, Chicago.
Schmidt, K. (2008). Behavioural and spatial adaptation of the Eurasian lynx to a decline in
prey availability. Acta Theriol. 53: 1-16.
Seidensticker, J.C., Hornocker, M.G., Wiles, W.V. & Messick, J.P. (1973). Mountain Lion
Social Organization in the Idaho Primitive Area. Wildlife Monogr. 35: 3-60.
Siegel, A. (1956). Nonparametric Statistics for the Behavioural Sciences. McGraw-Hill, New
York.
Chapter 4: Spatial organisation
110
Sliwa, A. (2004). Home range size and social organisation of black-footed cats (Felis
nigripes). Mamm. Biol. 69: 96-107.
Smith, J.D.L., MacDougal, C.W. & Sunquist, M.E. (1987). Female land tenure system in
tigers. In Tigers of the World. Tilson, R.L. & Seal, U.S. (Eds). Noyes Publications, Park
Ridge, NJ.
Smithers, R.H.N. (1983). The mammals of the southern African subregion. University of
Pretoria, Pretoria, South Africa.
Stahl, P., Artois, M. & Aubert, M.F.A. (1988). The use of space and the activity pattern of
adult European wild cats (Felis silvestris) in Lorraine. Rev. Ecol. 43: 113-131.
Stander, P.E., Haden, P.J., Kaqece, I.I. & Ghau, I.I. (1997). The ecology of asociality in
Namibian leopards. J. Zool. (Lond.) 242: 343-364.
Stephens, D.W. & Krebs, J.R. (1986). Foraging theory. Princeton, NJ: Princeton University
Press.
Sunquist, M. & Sunquist, F. (2002). Wild cats of the World. Chicago: University of Chicago
Press.
Swihart, R.K. & Slade, N.A. (1985a). Influencing of sampling interval on estimates of home
range size. J. Wildl. Manage. 49: 1019-1025.
Swihart, R.K. & Slade, N.A. (1985b). Testing for independence of observation in animal
movements. Ecology 6: 1176-1184.
Swihart, R.K., Slade, N.A. & Bergstorm, B.J. (1988). Relating body size to the rate of home
range use in mammals. Ecology 69: 393-399.
Szemethy, L., Barcza, Z., Lucas, M. & Szerényi, V. (1993). Preliminary study on home
ranges of co-existing wild and feral domestic cat populations in Hungary. Unpublished report
in IUCN Cat Specialist Group Library. www.catsg.org/catsglib/index.php.
Ranta, E., Lundberg, P. & Kaitala, V. (2006). Ecology of populations. Cambridge University
Press, Cambridge.
Chapter 4: Spatial organisation
111
Vashon, J.H., Meehan, A.L., Jakubas, W.J., Organ, J.F., Vashon, A.D., McLaughlin, C.R.,
Matula, G.J. (Jr.) & Crowley, S.M. (2007). Spatial Ecology of a Canada Lynx Population in
Northern Maine. J. Wildl. Manage. 72: 1479-1487.
Worton, B.J. (1989). Kernel methods for estimating the utilization distribution in home-range
studies. Ecology 70: 164-168.
Zezulak, D.S. & Schwab, R.G. (1979). Bobcat biology in a Mojave desert community. Report:
1-25. Department of Interior, Bureau of Land Management, California Desert Planning
Program. State of California, The Resources Agency, Department of Fish and Game.
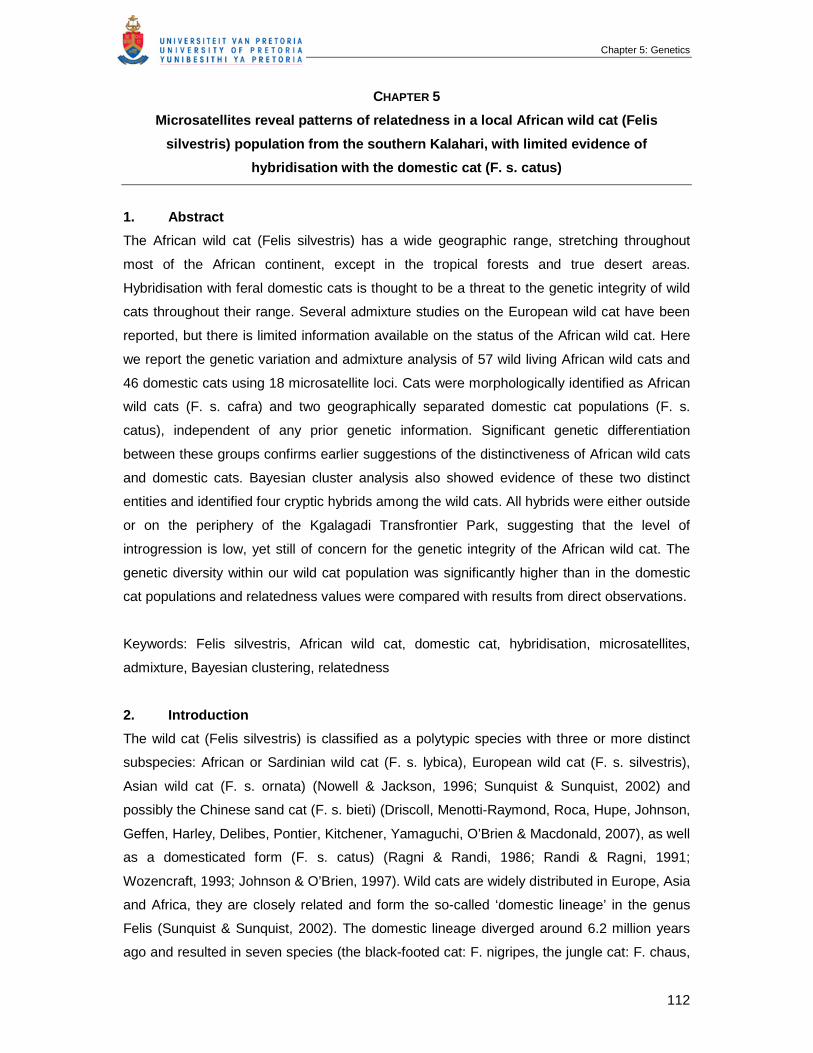
Chapter 5: Genetics
112
CHAPTER 5
Microsatellites reveal patterns of relatedness in a local African wild cat (Felis
silvestris) population from the southern Kalahari, with limited evidence of
hybridisation with the domestic cat (F. s. catus)
1. Abstract
The African wild cat (Felis silvestris) has a wide geographic range, stretching throughout
most of the African continent, except in the tropical forests and true desert areas.
Hybridisation with feral domestic cats is thought to be a threat to the genetic integrity of wild
cats throughout their range. Several admixture studies on the European wild cat have been
reported, but there is limited information available on the status of the African wild cat. Here
we report the genetic variation and admixture analysis of 57 wild living African wild cats and
46 domestic cats using 18 microsatellite loci. Cats were morphologically identified as African
wild cats (F. s. cafra) and two geographically separated domestic cat populations (F. s.
catus), independent of any prior genetic information. Significant genetic differentiation
between these groups confirms earlier suggestions of the distinctiveness of African wild cats
and domestic cats. Bayesian cluster analysis also showed evidence of these two distinct
entities and identified four cryptic hybrids among the wild cats. All hybrids were either outside
or on the periphery of the Kgalagadi Transfrontier Park, suggesting that the level of
introgression is low, yet still of concern for the genetic integrity of the African wild cat. The
genetic diversity within our wild cat population was significantly higher than in the domestic
cat populations and relatedness values were compared with results from direct observations.
Keywords: Felis silvestris, African wild cat, domestic cat, hybridisation, microsatellites,
admixture, Bayesian clustering, relatedness
2. Introduction
The wild cat (Felis silvestris) is classified as a polytypic species with three or more distinct
subspecies: African or Sardinian wild cat (F. s. lybica), European wild cat (F. s. silvestris),
Asian wild cat (F. s. ornata) (Nowell & Jackson, 1996; Sunquist & Sunquist, 2002) and
possibly the Chinese sand cat (F. s. bieti) (Driscoll, Menotti-Raymond, Roca, Hupe, Johnson,
Geffen, Harley, Delibes, Pontier, Kitchener, Yamaguchi, O’Brien & Macdonald, 2007), as well
as a domesticated form (F. s. catus) (Ragni & Randi, 1986; Randi & Ragni, 1991;
Wozencraft, 1993; Johnson & O’Brien, 1997). Wild cats are widely distributed in Europe, Asia
and Africa, they are closely related and form the so-called ‘domestic lineage’ in the genus
Felis (Sunquist & Sunquist, 2002). The domestic lineage diverged around 6.2 million years
ago and resulted in seven species (the black-footed cat: F. nigripes, the jungle cat: F. chaus,
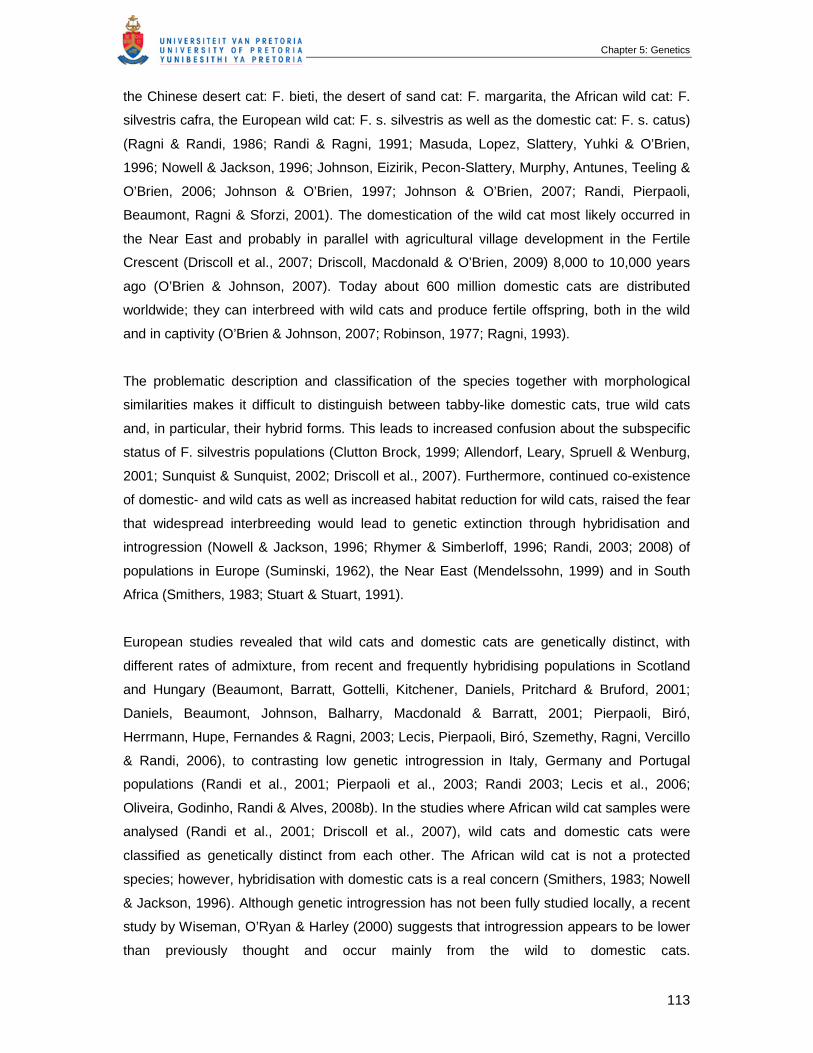
Chapter 5: Genetics
113
the Chinese desert cat: F. bieti, the desert of sand cat: F. margarita, the African wild cat: F.
silvestris cafra, the European wild cat: F. s. silvestris as well as the domestic cat: F. s. catus)
(Ragni & Randi, 1986; Randi & Ragni, 1991; Masuda, Lopez, Slattery, Yuhki & O’Brien,
1996; Nowell & Jackson, 1996; Johnson, Eizirik, Pecon-Slattery, Murphy, Antunes, Teeling &
O’Brien, 2006; Johnson & O’Brien, 1997; Johnson & O’Brien, 2007; Randi, Pierpaoli,
Beaumont, Ragni & Sforzi, 2001). The domestication of the wild cat most likely occurred in
the Near East and probably in parallel with agricultural village development in the Fertile
Crescent (Driscoll et al., 2007; Driscoll, Macdonald & O’Brien, 2009) 8,000 to 10,000 years
ago (O’Brien & Johnson, 2007). Today about 600 million domestic cats are distributed
worldwide; they can interbreed with wild cats and produce fertile offspring, both in the wild
and in captivity (O’Brien & Johnson, 2007; Robinson, 1977; Ragni, 1993).
The problematic description and classification of the species together with morphological
similarities makes it difficult to distinguish between tabby-like domestic cats, true wild cats
and, in particular, their hybrid forms. This leads to increased confusion about the subspecific
status of F. silvestris populations (Clutton Brock, 1999; Allendorf, Leary, Spruell & Wenburg,
2001; Sunquist & Sunquist, 2002; Driscoll et al., 2007). Furthermore, continued co-existence
of domestic- and wild cats as well as increased habitat reduction for wild cats, raised the fear
that widespread interbreeding would lead to genetic extinction through hybridisation and
introgression (Nowell & Jackson, 1996; Rhymer & Simberloff, 1996; Randi, 2003; 2008) of
populations in Europe (Suminski, 1962), the Near East (Mendelssohn, 1999) and in South
Africa (Smithers, 1983; Stuart & Stuart, 1991).
European studies revealed that wild cats and domestic cats are genetically distinct, with
different rates of admixture, from recent and frequently hybridising populations in Scotland
and Hungary (Beaumont, Barratt, Gottelli, Kitchener, Daniels, Pritchard & Bruford, 2001;
Daniels, Beaumont, Johnson, Balharry, Macdonald & Barratt, 2001; Pierpaoli, Biró,
Herrmann, Hupe, Fernandes & Ragni, 2003; Lecis, Pierpaoli, Biró, Szemethy, Ragni, Vercillo
& Randi, 2006), to contrasting low genetic introgression in Italy, Germany and Portugal
populations (Randi et al., 2001; Pierpaoli et al., 2003; Randi 2003; Lecis et al., 2006;
Oliveira, Godinho, Randi & Alves, 2008b). In the studies where African wild cat samples were
analysed (Randi et al., 2001; Driscoll et al., 2007), wild cats and domestic cats were
classified as genetically distinct from each other. The African wild cat is not a protected
species; however, hybridisation with domestic cats is a real concern (Smithers, 1983; Nowell
& Jackson, 1996). Although genetic introgression has not been fully studied locally, a recent
study by Wiseman, O’Ryan & Harley (2000) suggests that introgression appears to be lower
than previously thought and occur mainly from the wild to domestic cats.
Chapter 5: Genetics
114
Apart from concerns regarding the genetic purity of African wild cat populations, especially in
and near urbanised areas, very little is known about the biology of this widespread small
predator. The southern Kalahari population was selected as the model study population, not
only because the open dune habitat is ideal for radio tracking and observing individual cats,
but also the remoteness of the area that has been declared a national park since 1931 made
the possibility of identifying a genetically pure African wild cat population likely.
Hybrid zones are regions where two genetically differentiated taxa overlap and admixture
events occur and have received substantial attention in recent years (Barton & Hewitt, 1989).
Hybridisation occurs more frequently than originally believed (Mallet, 2005; Meyer, 2006) and
may be due to human induced, such as between domestic and wild species, or domestic and
captive species (Nijman, Otsen, Verkaar, de Ruiter, Hanekamp, Ochieng, Shamshad, Rege,
Hanotte, Barwegen, Sulawati & Lenstra, 2003; Lecis et al. 2006), or between introduced and
native species (Goodman, Barton, Swanson, Abernethy & Pemberton, 1999; Riley, Shaffer,
Voss & Fitzpatrick, 2003). Natural hybridisation has been described across the zootaxa,
including in insects (Beltran, Jiggins, Bull, Linares, Mallet, McMillan & Bermingham, 2002),
fish (Saltzburger, Baric & Sturmbauer, 2002), amphibians (Szymura & Barton, 1991), birds
(Grant, Grant, Markert, Keller & Petren, 2005) and carnivores (Lehman, Eisenhawer,
Hansen, Mech, Peterson, Gogan & Wayne, 1991). In particular the question of hybridisation
in domestic and wild cat populations has been extensively studied (Hubbard, McOrist, Jones,
Biod, Scott & Easterbee, 1992; Daniels, Balharry, Hirst, Kitchener & Aspinall, 1998; Randi et
al., 2001; Beaumont et al., 2001; Pierpaoli et al., 2003; Lecis et al., 2006; Oliveira et al.,
2008b). The methods and procedures to identify cryptic population structure and admixture
have advanced from mitochondrial DNA and allozyme analysis (Randi & Ragni, 1991;
Hubbard et al., 1992) to improved accuracy through the use of microsatellites, especially
when combining highly polymorphic markers with recently developed Bayesian clustering
models (Lecis et al., 2006).
Possible evolutionary outcomes of hybridisation could include (i) that two hybrid taxa may
merge, (ii) reproductive barriers may be reinforced between parental taxa, (iii) the transfer of
genetic material into both parental taxa (this may facilitate adaptive evolution) (iv) a new
species of hybrid origin may evolve or, (v) the hybrid zone may become established without
any major impact on the parental taxa (Arnold, 1992; Seehausen, 2004). Therefore the
studies of hybrids can give important insights into evolutionary processes and adaptation of
species (Pastorini, Zaramody, Curtis, Nievergelt & Mundy, 2009).

Chapter 5: Genetics
115
Knowledge of relatedness and relationships between individuals is important to describe the
behaviour and social structure of a species (Ralls, Pilgrim, White, Paxinos, Schwartz &
Fleischer, 2001). Social structures are characterised by territoriality, social behaviour,
tolerance, dispersal patterns, mating systems and the relatedness of the individuals
(Gompper, Gittleman & Wayne, 1998). The African wild cat is described as a solitary felid
(Smithers, 1983; Nowell & Jackson, 1996; Sunquist & Sunquist, 2002). Its social organisation
shows large home range overlap between females but little overlap between males, although
the home ranges of males typically overlap with several females in their home ranges
(Chapter 4).
Molecular techniques have been applied widely to investigate social organisation in social
carnivores, for example in African lions, Panthera leo (Packer, Gilbert, Pusey & O’Brien,
1991); African wild dogs, Lycaon pictus (Girman, Mills, Geffen & Wayne, 1997); gray wolves,
Canis lupus (Smith, Meier, Geffen, Mech, Burch, Adams & Wayne, 1997); swift foxes, Vulpes
velox (Kitchen, Gese, Waits, Karki & Schauster, 2005); kit foxes, Vulpes macrotis (Ralls et
al., 2001) and raccoons, Procyon lotor (Nielsen & Nielsen, 2007) but only very recently in
solitary felids e.g. bobcats, Lynx rufus (Janečka, Blankenship, Hirth, Tewes, Kilpatrick &
Grassman, 2004) and cougars, Puma concolor (Biek, Akamine, Schwartz, Ruth, Murphy &
Poss, 2006). In our study we used 18 microsatellite loci to analyse: (i) The extent of genetic
variation among African wild cats in the southern Kalahari, (ii) the genetic purity of African
wild cats, mostly sampled from the KTP, (iii) genetic structure in the wild cat population, and
(iv) relatedness between African wild cat individuals of which the spatial organisation were
recorded through intense behavioural observations.
3. Materials and Methods
3.1 Sample collection and DNA extraction
We analysed a total of 103 tissue and hair samples, including 57 African wild cats (AWC), 25
Kalahari domestic cat (DC1) and a reference collection of 21 domestic cat (DC2; Veterinary
Genetics Laboratory, University of Pretoria; C. Harper pers. comm.) samples (Figure 5.1a).
Of the wild cat samples 47 were collected from April 2003 – December 2006 in the KTP
(Figure 5.1b and Figure 5.1c), South Africa and Botswana and ten were collected from road
kills outside the Transfrontier Park and stored in 95% ethanol. Wild cats were
morphologically identified by coat-patterns, long legs and the characteristic reddish tint at the
back of their ears (Smithers, 1983). Tissue samples were preserved in 95% ethanol and hair
samples in plastic bags. All hair samples consisted of cat whiskers with the root visible at the
tip.
Chapter 5: Genetics
116
(a)
(b)
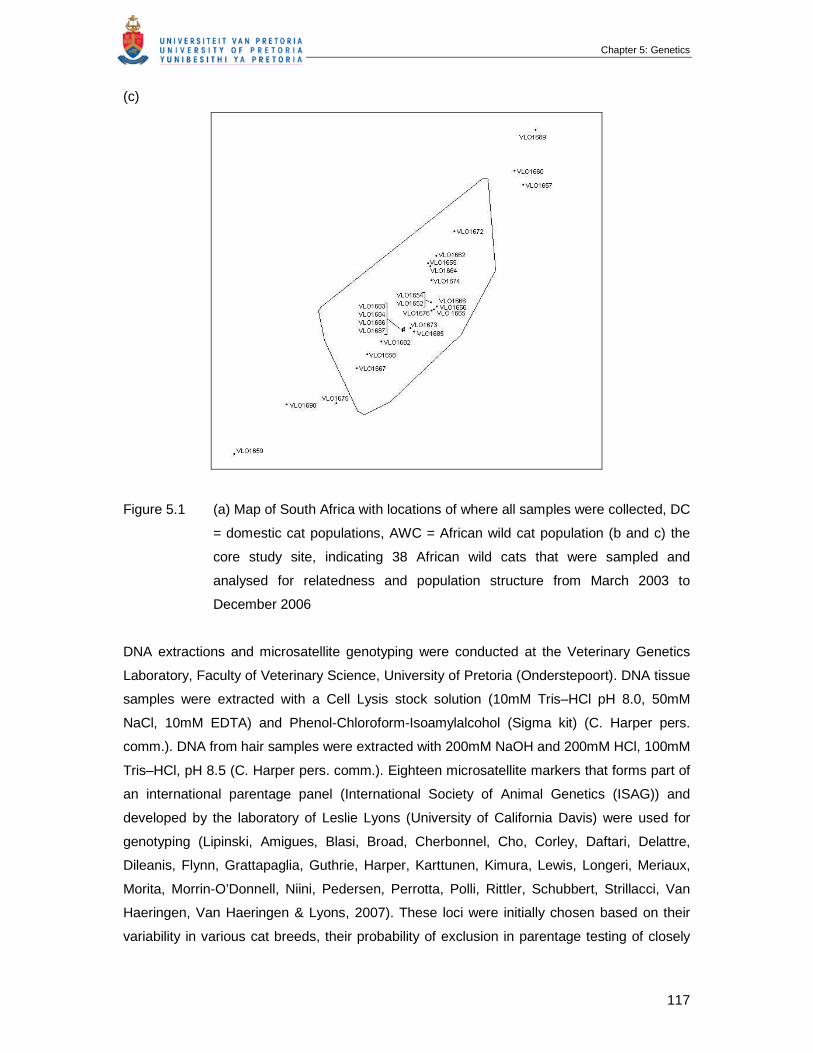
Chapter 5: Genetics
117
(c)
Figure 5.1 (a) Map of South Africa with locations of where all samples were collected, DC
= domestic cat populations, AWC = African wild cat population (b and c) the
core study site, indicating 38 African wild cats that were sampled and
analysed for relatedness and population structure from March 2003 to
December 2006
DNA extractions and microsatellite genotyping were conducted at the Veterinary Genetics
Laboratory, Faculty of Veterinary Science, University of Pretoria (Onderstepoort). DNA tissue
samples were extracted with a Cell Lysis stock solution (10mM Tris–HCl pH 8.0, 50mM
NaCl, 10mM EDTA) and Phenol-Chloroform-Isoamylalcohol (Sigma kit) (C. Harper pers.
comm.). DNA from hair samples were extracted with 200mM NaOH and 200mM HCl, 100mM
Tris–HCl, pH 8.5 (C. Harper pers. comm.). Eighteen microsatellite markers that forms part of
an international parentage panel (International Society of Animal Genetics (ISAG)) and
developed by the laboratory of Leslie Lyons (University of California Davis) were used for
genotyping (Lipinski, Amigues, Blasi, Broad, Cherbonnel, Cho, Corley, Daftari, Delattre,
Dileanis, Flynn, Grattapaglia, Guthrie, Harper, Karttunen, Kimura, Lewis, Longeri, Meriaux,
Morita, Morrin-O’Donnell, Niini, Pedersen, Perrotta, Polli, Rittler, Schubbert, Strillacci, Van
Haeringen, Van Haeringen & Lyons, 2007). These loci were initially chosen based on their
variability in various cat breeds, their probability of exclusion in parentage testing of closely
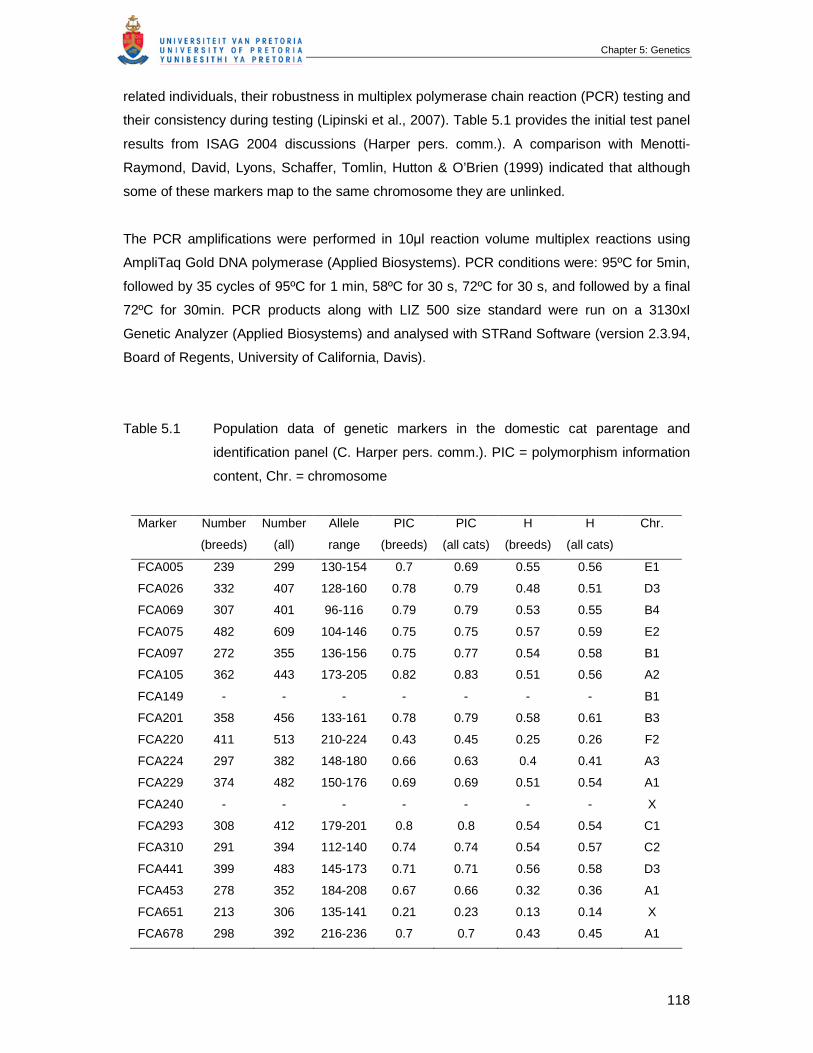
Chapter 5: Genetics
118
related individuals, their robustness in multiplex polymerase chain reaction (PCR) testing and
their consistency during testing (Lipinski et al., 2007). Table 5.1 provides the initial test panel
results from ISAG 2004 discussions (Harper pers. comm.). A comparison with Menotti-
Raymond, David, Lyons, Schaffer, Tomlin, Hutton & O’Brien (1999) indicated that although
some of these markers map to the same chromosome they are unlinked.
The PCR amplifications were performed in 10µl reaction volume multiplex reactions using
AmpliTaq Gold DNA polymerase (Applied Biosystems). PCR conditions were: 95ºC for 5min,
followed by 35 cycles of 95ºC for 1 min, 58ºC for 30 s, 72ºC for 30 s, and followed by a final
72ºC for 30min. PCR products along with LIZ 500 size standard were run on a 3130xI
Genetic Analyzer (Applied Biosystems) and analysed with STRand Software (version 2.3.94,
Board of Regents, University of California, Davis).
Table 5.1 Population data of genetic markers in the domestic cat parentage and
identification panel (C. Harper pers. comm.). PIC = polymorphism information
content, Chr. = chromosome
Marker Number
(breeds)
Number
(all)
Allele
range
PIC
(breeds)
PIC
(all cats)
H
(breeds)
H
(all cats)
Chr.
FCA005 239 299 130-154 0.7 0.69 0.55 0.56 E1
FCA026 332 407 128-160 0.78 0.79 0.48 0.51 D3
FCA069 307 401 96-116 0.79 0.79 0.53 0.55 B4
FCA075 482 609 104-146 0.75 0.75 0.57 0.59 E2
FCA097 272 355 136-156 0.75 0.77 0.54 0.58 B1
FCA105 362 443 173-205 0.82 0.83 0.51 0.56 A2
FCA149 - - - - - - - B1
FCA201 358 456 133-161 0.78 0.79 0.58 0.61 B3
FCA220 411 513 210-224 0.43 0.45 0.25 0.26 F2
FCA224 297 382 148-180 0.66 0.63 0.4 0.41 A3
FCA229 374 482 150-176 0.69 0.69 0.51 0.54 A1
FCA240 - - - - - - - X
FCA293 308 412 179-201 0.8 0.8 0.54 0.54 C1
FCA310 291 394 112-140 0.74 0.74 0.54 0.57 C2
FCA441 399 483 145-173 0.71 0.71 0.56 0.58 D3
FCA453 278 352 184-208 0.67 0.66 0.32 0.36 A1
FCA651 213 306 135-141 0.21 0.23 0.13 0.14 X
FCA678 298 392 216-236 0.7 0.7 0.43 0.45 A1
Chapter 5: Genetics
119
3.2 Analyses of genetic variation
Allele frequencies, observed (HO) and expected (HE) heterozygosity for each locus and for
each population were calculated using Genepop 3.4 (Raymond & Rouset, 1995) to
determine significant deviations from Hardy-Weinberg Equilibrium (HWE) for all locus-
population combinations and to statistically infer Linkage Equilibrium (LE) among loci.
Significance levels were adjusted using sequential Bonferroni corrections for multiple
comparisons in the same data set (Rice, 1989). We estimated the genetic variation between
wild and domestic populations through a hierarchical Analysis of Molecular Variance
(AMOVA) with the software GenAlEx (Peakall & Smouse, 2006) using FST and RST. The
significance of genetic differentiation was tested by random permutation, under the null
hypothesis that all individuals belong to a single population. Wilcoxon signed rank tests were
used to evaluate the differences in allelic diversity (number of alleles: Na), the allelic richness
(effective number of alleles: Ne) and HE between pairs of geographical groups (Statistica
7.0).
3.3 Population structure and admixture analyses using Bayesian cluster analysis
and Principal Component Analysis
Population structure, individual assignments and admixture proportions were estimated
through a Bayesian approach implemented in Structure 2.2 (Falush, Stephans & Pritchard,
2007). The number of putative populations, K, was determined by comparing the log-
likelihood values and ∆K (Evanno, Regnout & Goudet, 2005; Waples & Gaggiotti, 2006) over
multiple runs (20 iterations each with a 10,000 chain burn-in and 100,000 MCMC chains) for
values of K ranging from 1 to 8. An admixed model with correlated allele frequencies was
used (other model parameters yielded the same results). For assignment of individuals to the
inferred clusters, chains of 1 x 10⁶, following a burn-in of 100,000, were run three times to
ensure convergence. Following Lecis et al. (2006) individuals assigned with a probability of
membership of qi ≥ 0.8 were regarded as belonging to a single cluster, while values of < 0.8
were inferred as an indication of admixture.
Allele frequencies from known or unknown source populations are modelled to assign
individuals to one or more populations (Lecis et al., 2006), with the assumption that
admixture leads to Hardy-Weinberg- and linkage disequilibrium (Pritchard, Stephens &
Donnelly, 2000). The programme Structure 2.2 model correlations between loci in an
admixed population, to detect more ancient admixture events and identifies population
structure where populations are connected by gene flow or has diverged recently (Falush,
Stephens & Pritchard, 2003).
Chapter 5: Genetics
120
A Principal Component Analysis (PCA) was performed using GenAlEx 6 software (Peakall &
Smouse, 2006) which is a multivariate technique that plots the major patterns within a
multivariate dataset and indicate the relationship between distance matrix elements based on
their first two principal coordinates.
3.4 Relatedness estimates within the African wild cat population
Relatedness between individuals in the wild cat population was calculated using the
programme GenAlEx (Peakall & Smouse, 2006). The software uses genetic distances from
codominant data for a single population. The level of relatedness (R) described in Queller &
Goodnight (1989) was used: for first order relatives (full sibs and parent-offspring) R-values
~0.5 are expected, second order relatives should on average show values of 0.25, while
values below 0.125 indicate unrelated individuals. Individual inbreeding coefficients, kinship
and relatedness coefficients were also compared in SPAGeDi version 1.2 (Hardy &
Vekemans, 2002). Known relationships, obtained from behavioural observations done on the
study population, were used to evaluate these results.
4. Results
4.1 Genetic diversity in wild and domestic cats
We determined individual genotypes for 57 morphologically classified African wild cats, 25
Kalahari domestic cats and the reference collection of 21 domestic cats. All microsatellite loci
were polymorphic in both the 57 genotyped wild- and 46 domestic cats with six (FCA453 and
FCA651) to 17 (FCA075) alleles per locus (average: 11.61 ± 3.13) (Appendix 4). The number
of private alleles (alleles unique to a single population) within the wild cat population was
4.06 ± 0.59, the Kalahari domestic population 0.11 ± 0.08 and the domestic cat reference
collection 0.44 ± 0.17. Twelve combinations between pairs of loci disclosed a significant
deviation from linkage disequilibrium after Bonferroni correction for 18 independent
replications (P < 0.0028). The microsatellite loci in this study map on different cat
chromosomes (Menotti-Raymond et al., 1999) except as shown in Table 5.2. These loci
should be distant enough to allow for independent allele assortment. Pairwise allelic
combinations were in linkage equilibrium at all loci over the wild cat genotypes except in one
case (significance probability level p < 0.05 Bonferroni corrected for 14 comparisons). A
significant departure from HWE (Table 5.3) was observed at two wild cat loci: FCA240 (FIS =
0.69, p = 1.00) and FCA651 (FIS 0.77, p = 1.00) and one domestic cat locus FCA240
(Kalahari population FIS = 0.63, p = 1.00 and reference collection FIS = 0.65, p = 1.00).
However, both these loci are on the X-chromosome and the large number of male individuals
in our study skewed the overall level of homozygosity. Subsequent analyses were conducted
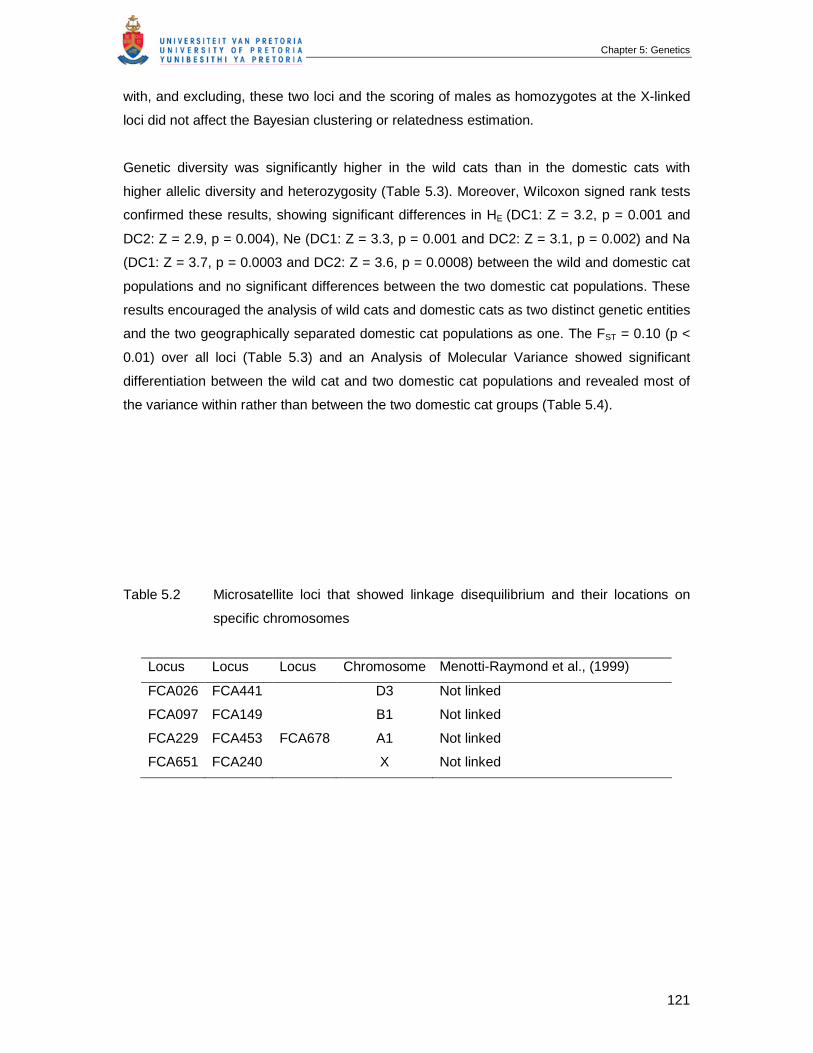
Chapter 5: Genetics
121
with, and excluding, these two loci and the scoring of males as homozygotes at the X-linked
loci did not affect the Bayesian clustering or relatedness estimation.
Genetic diversity was significantly higher in the wild cats than in the domestic cats with
higher allelic diversity and heterozygosity (Table 5.3). Moreover, Wilcoxon signed rank tests
confirmed these results, showing significant differences in HE (DC1: Z = 3.2, p = 0.001 and
DC2: Z = 2.9, p = 0.004), Ne (DC1: Z = 3.3, p = 0.001 and DC2: Z = 3.1, p = 0.002) and Na
(DC1: Z = 3.7, p = 0.0003 and DC2: Z = 3.6, p = 0.0008) between the wild and domestic cat
populations and no significant differences between the two domestic cat populations. These
results encouraged the analysis of wild cats and domestic cats as two distinct genetic entities
and the two geographically separated domestic cat populations as one. The FST = 0.10 (p <
0.01) over all loci (Table 5.3) and an Analysis of Molecular Variance showed significant
differentiation between the wild cat and two domestic cat populations and revealed most of
the variance within rather than between the two domestic cat groups (Table 5.4).
Table 5.2 Microsatellite loci that showed linkage disequilibrium and their locations on
specific chromosomes
Locus Locus Locus Chromosome Menotti-Raymond et al., (1999)
FCA026 FCA441 D3 Not linked
FCA097 FCA149 B1 Not linked
FCA229 FCA453 FCA678 A1 Not linked
FCA651 FCA240 X Not linked
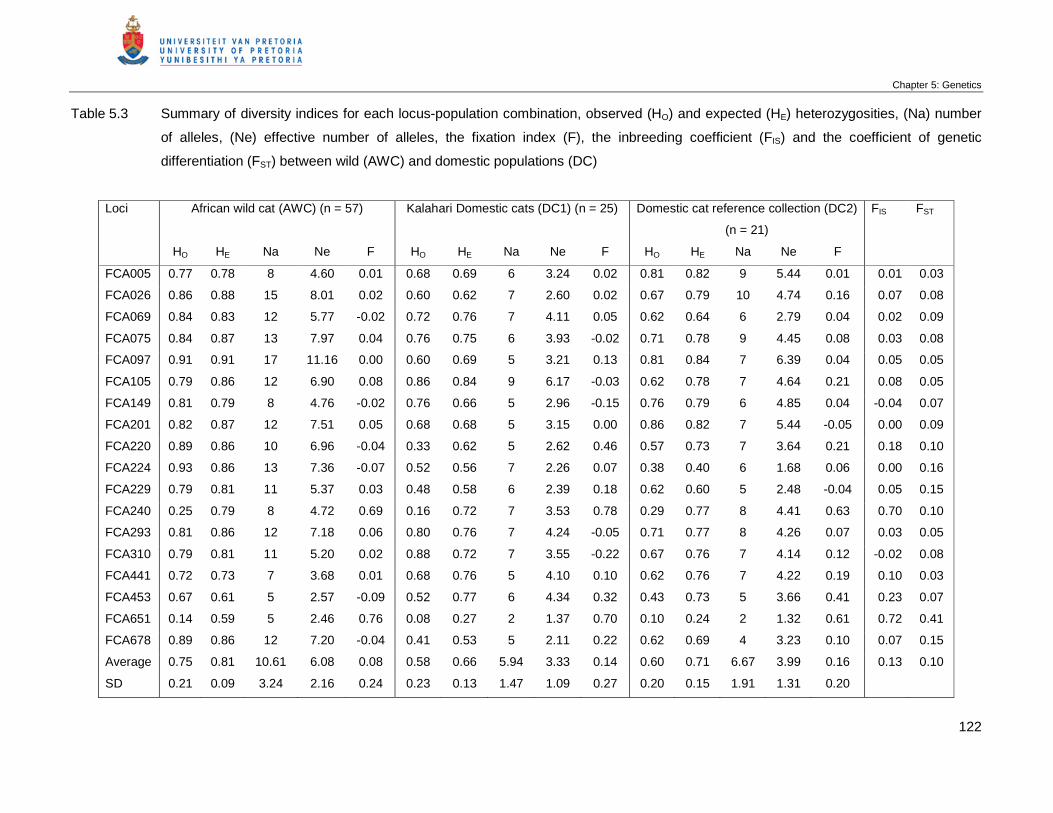
Chapter 5: Genetics
122
Table 5.3 Summary of diversity indices for each locus-population combination, observed (HO) and expected (HE) heterozygosities, (Na) number
of alleles, (Ne) effective number of alleles, the fixation index (F), the inbreeding coefficient (FIS) and the coefficient of genetic
differentiation (FST) between wild (AWC) and domestic populations (DC)
Loci
African wild cat (AWC) (n = 57)
Kalahari Domestic cats (DC1) (n = 25)
Domestic cat reference collection (DC2)
(n = 21)
FIS
FST
HO HE Na Ne F HO HE Na Ne F HO HE Na Ne F
FCA005 0.77 0.78 8 4.60 0.01 0.68 0.69 6 3.24 0.02 0.81 0.82 9 5.44 0.01 0.01 0.03
FCA026 0.86 0.88 15 8.01 0.02 0.60 0.62 7 2.60 0.02 0.67 0.79 10 4.74 0.16 0.07 0.08
FCA069 0.84 0.83 12 5.77 -0.02 0.72 0.76 7 4.11 0.05 0.62 0.64 6 2.79 0.04 0.02 0.09
FCA075 0.84 0.87 13 7.97 0.04 0.76 0.75 6 3.93 -0.02 0.71 0.78 9 4.45 0.08 0.03 0.08
FCA097 0.91 0.91 17 11.16 0.00 0.60 0.69 5 3.21 0.13 0.81 0.84 7 6.39 0.04 0.05 0.05
FCA105 0.79 0.86 12 6.90 0.08 0.86 0.84 9 6.17 -0.03 0.62 0.78 7 4.64 0.21 0.08 0.05
FCA149 0.81 0.79 8 4.76 -0.02 0.76 0.66 5 2.96 -0.15 0.76 0.79 6 4.85 0.04 -0.04 0.07
FCA201 0.82 0.87 12 7.51 0.05 0.68 0.68 5 3.15 0.00 0.86 0.82 7 5.44 -0.05 0.00 0.09
FCA220 0.89 0.86 10 6.96 -0.04 0.33 0.62 5 2.62 0.46 0.57 0.73 7 3.64 0.21 0.18 0.10
FCA224 0.93 0.86 13 7.36 -0.07 0.52 0.56 7 2.26 0.07 0.38 0.40 6 1.68 0.06 0.00 0.16
FCA229 0.79 0.81 11 5.37 0.03 0.48 0.58 6 2.39 0.18 0.62 0.60 5 2.48 -0.04 0.05 0.15
FCA240 0.25 0.79 8 4.72 0.69 0.16 0.72 7 3.53 0.78 0.29 0.77 8 4.41 0.63 0.70 0.10
FCA293 0.81 0.86 12 7.18 0.06 0.80 0.76 7 4.24 -0.05 0.71 0.77 8 4.26 0.07 0.03 0.05
FCA310 0.79 0.81 11 5.20 0.02 0.88 0.72 7 3.55 -0.22 0.67 0.76 7 4.14 0.12 -0.02 0.08
FCA441 0.72 0.73 7 3.68 0.01 0.68 0.76 5 4.10 0.10 0.62 0.76 7 4.22 0.19 0.10 0.03
FCA453 0.67 0.61 5 2.57 -0.09 0.52 0.77 6 4.34 0.32 0.43 0.73 5 3.66 0.41 0.23 0.07
FCA651 0.14 0.59 5 2.46 0.76 0.08 0.27 2 1.37 0.70 0.10 0.24 2 1.32 0.61 0.72 0.41
FCA678 0.89 0.86 12 7.20 -0.04 0.41 0.53 5 2.11 0.22 0.62 0.69 4 3.23 0.10 0.07 0.15
Average 0.75 0.81 10.61 6.08 0.08 0.58 0.66 5.94 3.33 0.14 0.60 0.71 6.67 3.99 0.16 0.13 0.10
SD 0.21 0.09 3.24 2.16 0.24 0.23 0.13 1.47 1.09 0.27 0.20 0.15 1.91 1.31 0.20
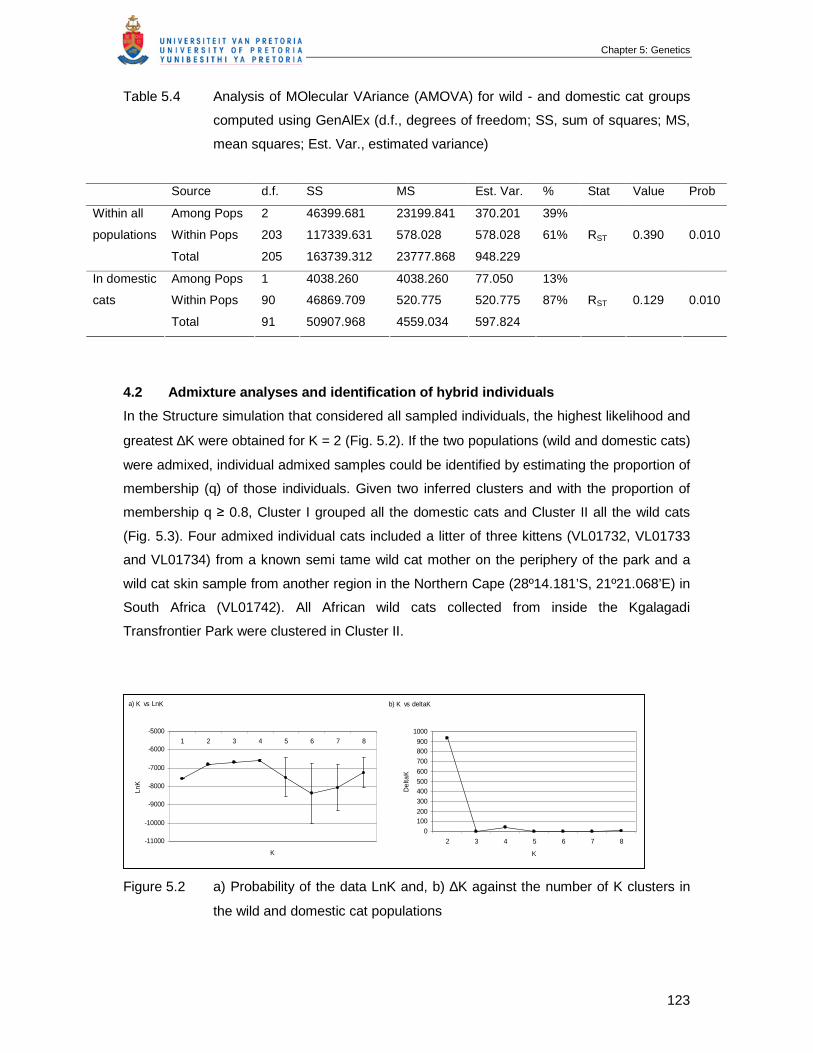
Chapter 5: Genetics
123
Table 5.4 Analysis of MOlecular VAriance (AMOVA) for wild - and domestic cat groups
computed using GenAlEx (d.f., degrees of freedom; SS, sum of squares; MS,
mean squares; Est. Var., estimated variance)
Source d.f. SS MS Est. Var. % Stat Value Prob
Among Pops 2 46399.681 23199.841 370.201 39%
Within Pops 203 117339.631 578.028 578.028 61% RST 0.390 0.010
Within all
populations
Total 205 163739.312 23777.868 948.229
Among Pops 1 4038.260 4038.260 77.050 13%
Within Pops 90 46869.709 520.775 520.775 87% RST 0.129 0.010
In domestic
cats
Total 91 50907.968 4559.034 597.824
4.2 Admixture analyses and identification of hybrid individuals
In the Structure simulation that considered all sampled individuals, the highest likelihood and
greatest ∆K were obtained for K = 2 (Fig. 5.2). If the two populations (wild and domestic cats)
were admixed, individual admixed samples could be identified by estimating the proportion of
membership (q) of those individuals. Given two inferred clusters and with the proportion of
membership q ≥ 0.8, Cluster I grouped all the domestic cats and Cluster II all the wild cats
(Fig. 5.3). Four admixed individual cats included a litter of three kittens (VL01732, VL01733
and VL01734) from a known semi tame wild cat mother on the periphery of the park and a
wild cat skin sample from another region in the Northern Cape (28º14.181’S, 21º21.068’E) in
South Africa (VL01742). All African wild cats collected from inside the Kgalagadi
Transfrontier Park were clustered in Cluster II.
Figure 5.2 a) Probability of the data LnK and, b) ∆K against the number of K clusters in
the wild and domestic cat populations
a) K vs LnK
-11000
-10000
-9000
-8000
-7000
-6000
-5000
1 2 3 4 5 6 7 8
K
LnK
b) K vs deltaK
0
100200
300
400500
600
700
800900
1000
2 3 4 5 6 7 8
K
Del
taK
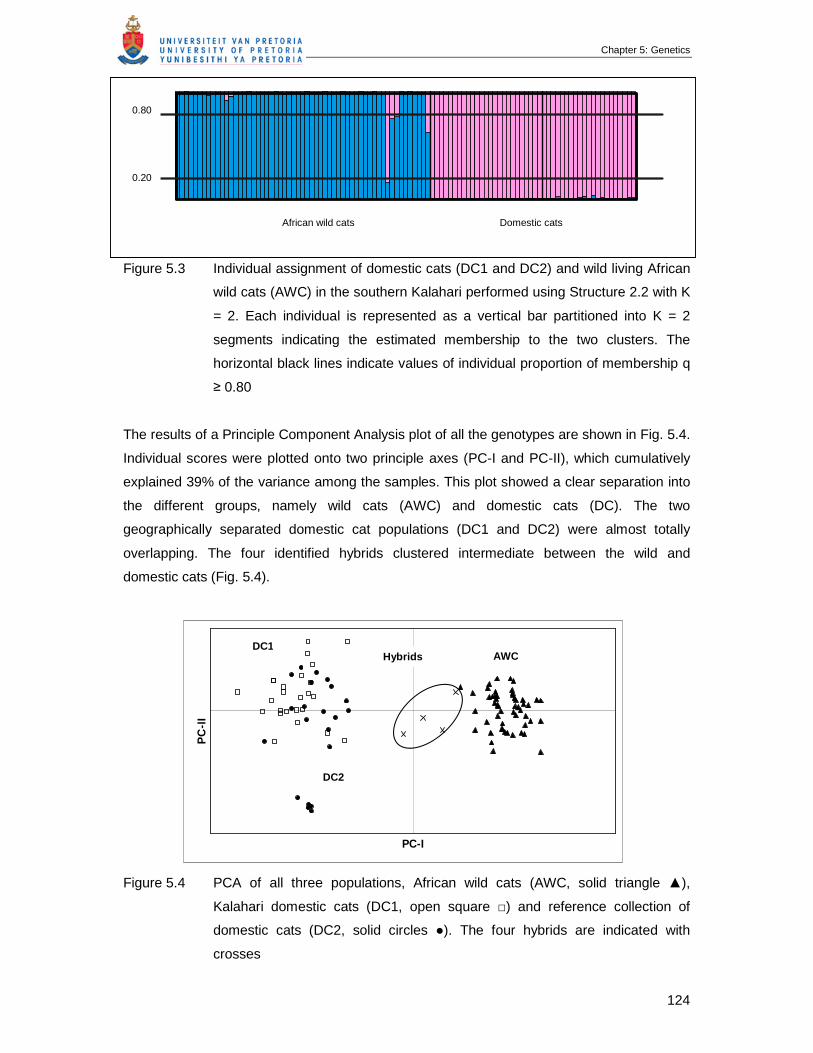
Chapter 5: Genetics
124
Figure 5.3 Individual assignment of domestic cats (DC1 and DC2) and wild living African
wild cats (AWC) in the southern Kalahari performed using Structure 2.2 with K
= 2. Each individual is represented as a vertical bar partitioned into K = 2
segments indicating the estimated membership to the two clusters. The
horizontal black lines indicate values of individual proportion of membership q
≥ 0.80
The results of a Principle Component Analysis plot of all the genotypes are shown in Fig. 5.4.
Individual scores were plotted onto two principle axes (PC-I and PC-II), which cumulatively
explained 39% of the variance among the samples. This plot showed a clear separation into
the different groups, namely wild cats (AWC) and domestic cats (DC). The two
geographically separated domestic cat populations (DC1 and DC2) were almost totally
overlapping. The four identified hybrids clustered intermediate between the wild and
domestic cats (Fig. 5.4).
Figure 5.4 PCA of all three populations, African wild cats (AWC, solid triangle ▲),
Kalahari domestic cats (DC1, open square □) and reference collection of
domestic cats (DC2, solid circles ●). The four hybrids are indicated with
crosses
PC-I
PC
-II
AWC
DC2
Hybrids DC1
African wild cats
0.20
Domestic cats
0.80
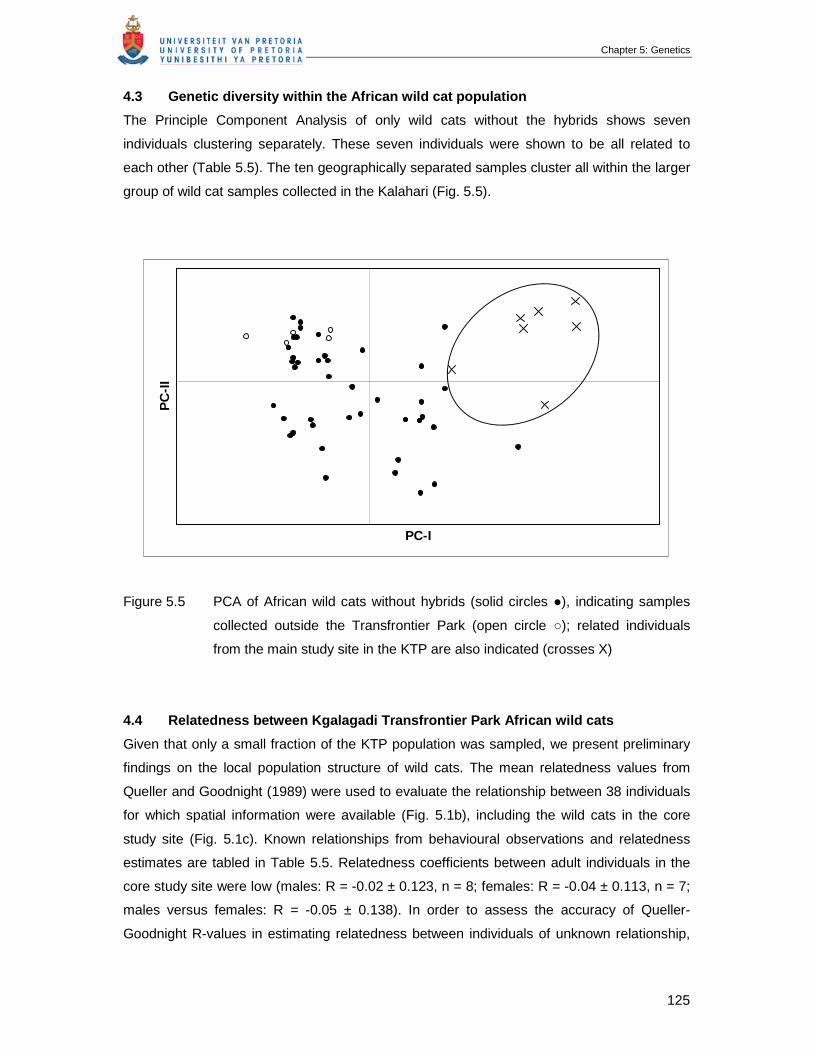
Chapter 5: Genetics
125
4.3 Genetic diversity within the African wild cat population
The Principle Component Analysis of only wild cats without the hybrids shows seven
individuals clustering separately. These seven individuals were shown to be all related to
each other (Table 5.5). The ten geographically separated samples cluster all within the larger
group of wild cat samples collected in the Kalahari (Fig. 5.5).
PC-I
PC
-II
Figure 5.5 PCA of African wild cats without hybrids (solid circles ●), indicating samples
collected outside the Transfrontier Park (open circle ○); related individuals
from the main study site in the KTP are also indicated (crosses X)
4.4 Relatedness between Kgalagadi Transfrontier Park African wild cats
Given that only a small fraction of the KTP population was sampled, we present preliminary
findings on the local population structure of wild cats. The mean relatedness values from
Queller and Goodnight (1989) were used to evaluate the relationship between 38 individuals
for which spatial information were available (Fig. 5.1b), including the wild cats in the core
study site (Fig. 5.1c). Known relationships from behavioural observations and relatedness
estimates are tabled in Table 5.5. Relatedness coefficients between adult individuals in the
core study site were low (males: R = -0.02 ± 0.123, n = 8; females: R = -0.04 ± 0.113, n = 7;
males versus females: R = -0.05 ± 0.138). In order to assess the accuracy of Queller-
Goodnight R-values in estimating relatedness between individuals of unknown relationship,

Chapter 5: Genetics
126
we calculated the average R-values of known pairs of relationships (Fig. 5.6). The mother-
offspring pairs had an average relatedness value (R) of 0.47 ± 0.04 and full sibling pairs had
an average relatedness (R) of 0.42 ± 0.12.
Interestingly, many of the close relationships involved one of the males (VLO1662) that was
studied over a three year period (2004-2006, Chapter 4). He is the father of at least five
kittens with three different females, of which one (VLO1658) appears to be his mother or
sister (R = 0.63). On two occasions these cats where observed mating and courting. There
was also an observation where the male visited the female while she had kittens. VLO1673,
a sub-adult male whom we identified through visual observations as an offspring of female
VLO1658 and male VLO1662, were confirmed as such despite allelic mismatches at locus
FCA005 and FCA220. This individual showed a very high inbreeding coefficient (0.412). A
small kitten VLO1675 caught in the home ranges of the female VLO1654 and male VLO1662
were positively identified as an offspring of these two cats. VLO1662 also sired a litter of
three kittens with female VLO1684.
0
0.1
0.2
0.3
0.4
0.5
0.6
0 1 2 3
Rel
ated
ness
(R
)
Mother - offspring
Full siblings
Figure 5.6 Relatedness values for known relationships among African wild cats in the
Kalahari study site with the standard deviation included
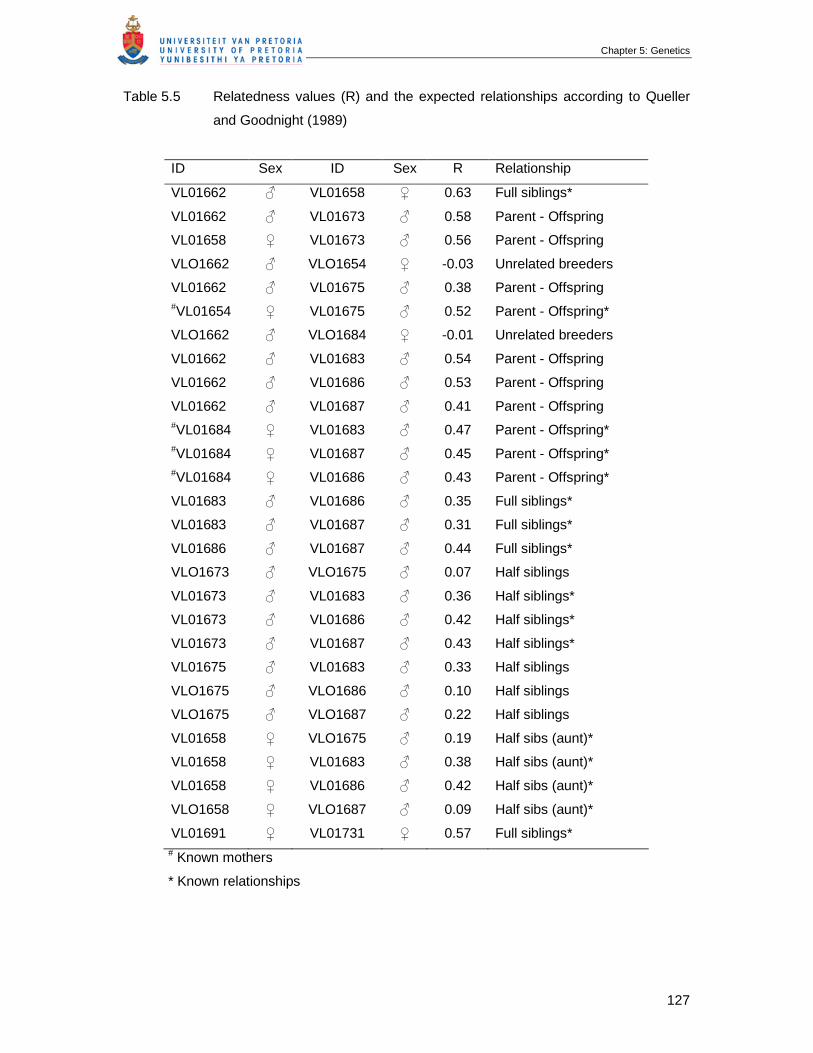
Chapter 5: Genetics
127
Table 5.5 Relatedness values (R) and the expected relationships according to Queller
and Goodnight (1989)
ID Sex ID Sex R Relationship
VL01662 ♂ VL01658 ♀ 0.63 Full siblings*
VL01662 ♂ VL01673 ♂ 0.58 Parent - Offspring
VL01658 ♀ VL01673 ♂ 0.56 Parent - Offspring
VLO1662 ♂ VLO1654 ♀ -0.03 Unrelated breeders
VL01662 ♂ VL01675 ♂ 0.38 Parent - Offspring #VL01654 ♀ VL01675 ♂ 0.52 Parent - Offspring*
VLO1662 ♂ VLO1684 ♀ -0.01 Unrelated breeders
VL01662 ♂ VL01683 ♂ 0.54 Parent - Offspring
VL01662 ♂ VL01686 ♂ 0.53 Parent - Offspring
VL01662 ♂ VL01687 ♂ 0.41 Parent - Offspring #VL01684 ♀ VL01683 ♂ 0.47 Parent - Offspring* #VL01684 ♀ VL01687 ♂ 0.45 Parent - Offspring* #VL01684 ♀ VL01686 ♂ 0.43 Parent - Offspring*
VL01683 ♂ VL01686 ♂ 0.35 Full siblings*
VL01683 ♂ VL01687 ♂ 0.31 Full siblings*
VL01686 ♂ VL01687 ♂ 0.44 Full siblings*
VLO1673 ♂ VLO1675 ♂ 0.07 Half siblings
VL01673 ♂ VL01683 ♂ 0.36 Half siblings*
VL01673 ♂ VL01686 ♂ 0.42 Half siblings*
VL01673 ♂ VL01687 ♂ 0.43 Half siblings*
VL01675 ♂ VL01683 ♂ 0.33 Half siblings
VLO1675 ♂ VLO1686 ♂ 0.10 Half siblings
VLO1675 ♂ VLO1687 ♂ 0.22 Half siblings
VL01658 ♀ VLO1675 ♂ 0.19 Half sibs (aunt)*
VL01658 ♀ VL01683 ♂ 0.38 Half sibs (aunt)*
VL01658 ♀ VL01686 ♂ 0.42 Half sibs (aunt)*
VLO1658 ♀ VLO1687 ♂ 0.09 Half sibs (aunt)*
VL01691 ♀ VL01731 ♀ 0.57 Full siblings* # Known mothers
* Known relationships
Chapter 5: Genetics
128
5. Discussion
There is considerable controversy over what constitutes a wild cat and whether wild cats can
be defined purely by morphological criteria (Daniels et al., 1998; Kitchener, 1998). Extensive
molecular studies on the European wild cat have been published (Beaumont et al., 2001;
Randi et al., 2001; Lecis et al., 2006; Oliveira et al., 2008b) and the phenomenon where an
introduced population hybridise with a native population is not uncommon (Rhymer &
Simberloff, 1996). Especially in wild cats it is difficult to estimate degrees of admixture when
the gene frequencies in the native population prior to admixture are unknown (Beaumont et
al., 2001). If an a priori known “pure” wild cat population do not exist there will be no
reference wild cat population to be used for estimating the rate of crossbreeding between
wild and domestic cats (Daniels et al., 1998). Domestication produced obvious changes in
the domestic cat of which coat coloration is probably the most noticeable one. Coat
colouration is controlled by a few genes and wild cats that are homogenous for domestic
colour patterns could be classified as domestic on morphological identification alone.
Alternatively natural selection against coat colour phenotypes in domestic cats may lead to a
selection of wild tabby markings in feral domestic cats (Randi et al., 2001). Therefore it is
difficult to classify cats purely on a morphological basis as wild and domestic cats (Balharry &
Daniels, 1998; Daniels et al., 1998). We identified wild cats morphologically by their tabby
markings, longer legs and reddish colour behind the ears. We studied their ecology by radio
telemetry; however, we compliment our behavioural observations with molecular data from
microsatellite analyses.
The genetic variability of African wild cats in the southern Kalahari was examined (HE = 0.81)
and although different loci were used the results were comparable to that found in other wild
felid studies e.g. cougar, Puma concolor HE = 0.66 (Sinclair, Swenson, Wolfe, Choate, Gates
& Cranall, 2001); bobcat, Lynx rufus HE = 0.77 (Janečka et al., 2004); African wild cat, F. s.
lybica HE = 0.80 (Wiseman et al., 2000) and European wild cat, F. s. silvestris: Portugal HE =
0.76 (Oliveira et al., 2008b); Italy HE = 0.72 and Hungary HE = 0.81 (Lecis et al., 2006).
Our results confirm that wild and domestic cats are genetically distinct (FST = 0.14, RST =
0.39) and Structure analysis clearly group our wild cat samples separately from the two
domestic cat populations, with a clear indication of admixed individuals. Despite the
widespread occurrence of domestic cats on the periphery of the KTP, the genetic distinction
between wild and domestic cats was high and the existence of private alleles clearly suggest
that gene flow between these populations is low and that hybridisation between Kalahari wild
cats and domestic cats is limited. The hybrid individuals were offspring from a semi tame wild
cat mother, nonetheless, this emphasises that admixture events on the border of the KTP

Chapter 5: Genetics
129
could have serious implications for conservation efforts to protect the African wild cat.
Hybridisation in a species can be widespread although it might be locally rare (Oliveira,
Godinho, Randi, Ferrand & Alves, 2008a). Reports in southern Africa predict that
hybridisation is widespread (Smithers, 1983), although at low levels (Wiseman et al., 2000).
Our data highlights that the general mapping of levels of introgression are important to
identify areas, such as the southern Kalahari, as focal areas for efficient conservation
management strategies. In future studies, the KTP wild cats can be used as an a priori pure
population, but it will be important also to assess natural levels of variation and gene flow
among wild cats across their distribution range.
In general adult wild cat ranging patterns showed slight male-male overlap but extensive
female-female overlap, although female core areas tend to be exclusive. The home ranges of
male wild cats typically overlap with several females (Chapter 4). The grouping of closely
related females has been described in many carnivores (Smith, McDougal & Sunquist, 1987;
Logan & Sweanor, 2001; Janečka et al., 2004; Kitchen et al., 2005). However the lack of
relatedness among our core study site females might be explained by: (i) a regular local
turnover of maternal lineages that would tend to disrupt local clusters of related individuals
(Biek et al., 2006), (ii) the frequent introductions of new alleles by immigrating males
(Goudet, Perrin & Wasser, 2002), or that (iii) female dispersal might be distant enough to
prevent spatial clustering of individuals (Biek et al., 2006).
Future more intensive sampling will be required to fully characterize local population
structure and patterns of relatedness in wild cats. However, observations from our core study
site suggest that a dominant male may monopolize paternity.
To conclude, admixture analyses indicate that hybridisation is not frequent in the southern
Kalahari. The main threats such as persecution, accidental road killings, habitat loss and
fragmentation still persists for the African wild cat in southern Africa. Habitat modification and
animal translocation will increase the rate of hybridisation and introgression. The fact that
evidence of admixed individuals is already present raises the conservation concerns for the
protection of wild cats in southern Africa.
6. References
Allendorf, F.W., Leary, R.F., Spruell, P. & Wenburg, J.K. (2001). The problems with hybrids:
setting conservation guidelines. Trends Ecol. Evol. 18: 613-622.
Chapter 5: Genetics
130
Balharry, D. & Daniels, M.J. (1998). Wild living cats in Scotland. Scottish Natural History
Research, Survey and Monitoring Report, no. 23.
Barton, N.H. & Hewitt, G.M. (1989). Adaptations, speciation and hybrid zones. Nature (Lond.)
341: 497-503.
Beaumont, M., Barratt, E.M., Gottelli, D., Kitchener, A.C., Daniels, M.J., Pritchard, J.K. &
Bruford, M.W. (2001). Genetic diversity and introgression in the Scottish wildcat. Mol. Ecol.
10: 319-336.
Biek, R., Akamine, N., Schwartz, M.K., Ruth, T.K., Murphy, K.M. & Poss, M. (2006). Genetic
consequences of sex-biased dispersal in a solitary carnivore: Yellowstone cougars. Biol. Lett.
2: 312-315.
Daniels, M.J., Balharry, D., Hirst, D., Kitchener, A.C. & Aspinall, R.J. (1998). Morphological
and pelage characteristics of wild living cats in Scotland: implications for defining the
‘wildcat’. J. Zool. (Lond.) 244: 231-247.
Daniels, M.J., Beaumont, M.A., Johnson, P.J., Balharry, D., Macdonald, D.W. & Barratt, E.
(2001). Ecology and genetics of wild living cats in the north-east of Scotland and the
implications for the conservation of the wildcat. J. Appl. Ecol. 38: 146-161.
Driscoll, C.A., Menotti-Raymond, M., Roca, A.L., Hupe, K., Johnson, W.E., Geffen, E.,
Harley, E., Delibes, M., Pontier, D., Kitchener, A.C., Yamaguchi, N., O’Brien, S.J. &
Macdonald, D. (2007). the Near Eastern Origin of Cat Domestication. Science 317: 519-523.
Driscoll, C.A., Clutton-Brock, J., Kitchener, A.C. & O’Brien, S.J. (2009). The Taming of the
Cat. Sci. Am. 300: 68-75
Evanno, G., Regnout, S. & Goudet, J. (2005). Detecting the number of clusters of individuals
using the software structure: a simulation study. Mol. Ecol. 14: 2611-2620.
Falush, D., Stephens, M. & Pritchard, j.k. (2003). Inference op population structure using
multilocus genotype data: linked loci and correlated allele frequencies. Genetics 164: 1567-
1587.
Chapter 5: Genetics
131
Falush, D., Stephans, M. & Pritchard, J.K. (2007). Inference of population structure using
multilocus genotype data: dominant markers and null alleles. Mol. Ecol. 7: 574-578.
Girman, D.J., Mills, M.G., Geffen, E. & Wayne, R.K. (1997). A molecular genetic analysis of
social structure, dispersal, and interpack relationships of the African wild dog (Lycaon pictus).
Behav. Ecol. Sociobiol. 40: 187-198.
Gompper, M.E., Gittleman, J.L. & Wayne, R.K. (1998). Dispersal, philopatry, and genetic
relatedness in a social carnivore: comparing males and females. Mol. Ecol. 7: 157-163.
Goudet, J., Perrin, N. & Wasser, P. (2002). Tests for sex-biased dispersal using bi-parentally
inherited genetic markers. Mol. Ecol. 11: 1103-1114.
Hardy, O.J. & Vekemans, X. (2002). SPAGeDi: a versatile computer program to analyse
spatial genetic structure at the individual or population level. Mol. Ecol. Notes 2: 618-620.
Hubbard, A.L., McOrist, S., Jones, T.W., Biod, R., Scott, R. & Easterbee, N. (1992). Is
survival of European wildcats in Britain threatened by interbreeding with domestic cats? Biol.
Conserv. 61: 203-208.
Janečka, J.E., Blankenship, T.L., Hirth, D.H., Tewes, M.E., Kilpatrick, C.W. & Grassman, L.I.
(2004). Kinship and social structure of bobcats (Lynx rufus) inferred from microsatellite and
radio-telemetry data. J. Zool. (Lond.) 269: 494-501.
Johnson, W. E. & O’Brien, S.J. (1997). Phylogenetic Reconstruction of the Felidae Using
16S rRNA and NADH-5 Mitochondrial Genes. J. Mol. Evol. (Suppl. 1) 44: S98-S116.
Johnson, W.E., Eizirik, E., Peco-Slattery, J., Murphy, W.J., Antunes, A., Teeling, E. &
O’Brien, J.O. (2006). The late Miocene Radiation of Modern Felidae: A Genetic Assessment.
Science 311: 73-77.
Kitchen, A.M., Gese, E.M., Waits, L.P., Karki, S.M. & Schauster, E.R. (2005). Genetic and
spatial structure within a swift fox population. J. Anim. Ecol. 74: 1173-1181.
Kitchener, A.C. (1998). The Scottish Wildcat – a cat with an identity crisis? British Wildlife 9:
232-242.
Chapter 5: Genetics
132
Lecis, R., Pierpaoli, M., Biró, Z.S., Szemethy, L., Ragni, B., Vercillo, F. & Randi, E. (2006).
Bayesian analyses of admixture in wild and domestic cats (Felis silvestris) using linked
microsatellite loci. Mol. Ecol. 15: 119-131.
Lipinski, M.J., Amigues, Y., Blasi, M., Broad, T.E., Cherbonnel, C., Cho, G.J., Corley, S.,
Daftari, P., Delattre, D.R., Dileanis, S., Flynn, J.M., Grattapaglia, D., Guthrie, A., Harper, C.,
Karttunen, P.L., Kimura, H., Lewis, G.M., Longeri, M., Meriaux, J.-C., Morita, M., Morrin-
O’Donnell, R.C., Niini, T., Pedersen, N.C., Perrotta, G., Polli, M., Rittler, S., Schubbert, R.,
Strillacci, M.G., Van Haeringen, H., Van Haeringen, W. & Lyons, L.A. (2007). An international
parentage and identification panel for the domestic cat (Felis catus). Anim. Genet. 38: 371-
377.
Logan, K.A. & Sweanor, L.L. (2001). Desert puma: evolutionary ecology and conservation of
an enduring carnivore. Island Press, Washington, D.C.
Masuda, R., Lopez, J.V., Slattery, J.P., Yuhki, N. & O’Brien, S.J. (1996). Molecular
phylogeny of mitochondrial cytochrome b and 125rRNA sequences in the Felidae: ocelot and
domestic cat lineages. Mol. Phylogenet. Evol. 6: 351-365.
Mendelssohn, H. (1999). The wildcat in Israel. Cat News 31: 21-22.
Menotti-Raymond, M., David, V.A., Lyons, L.A., Schaffer, A.A., Tomlin, J.F., Hutton, M.K. &
O’Brien, S.J. (1999). A genetic linkage map of microsatellites in the domestic cat (Felis
catus). Genomics 57: 9-23.
Nielsen, C.L.R. & Nielsen, C.K. (2007). Multiple paternity and relatedness in the southern
Illinios raccoons (Procyon lotor). J. Mammal. 88: 441-447.
Nowell, K. & Jackson, P. (1996). Status survey and conservation action plan. Wild Cats.
IUCN / SSC Cat Specialist Group. IUCN, Gland, Switzerland and Cambridge, UK.
O’Brien, S.J. & Johnson, W.E. (2007). The Evolution of Cats. Sci. Am. 297: 68-75.
Oliveira, R., Godinho, R., Randi, E., Ferrand, N. & Alves, P.C. (2008a). Hybridization versus
conservation: are domestic cats threatening the genetic integrity of wildcats (Felis silvestris
silvestris) in Iberian Peninsula? Phil. Trans. R. Soc. B 363: 2953-2961.
Chapter 5: Genetics
133
Oliveira, R., Godinho, R., Randi, E. & Alves, P.C. (2008b). Molecular analysis of hybridization
between wild and domestic cats (Felis silvestris) in Portugal: implications for conservation.
Conserv. Genet. 9: 1-11.
Packer, C., Gilbert, D.A., Pusey, A.E. & O’Brien, S.J. (1991). A molecular genetic analysis of
kinship and cooperation in African lions. Nature (Lond.) 351: 562-565.
Peakall, R. & Smouse, P.E. (2006). Genalex 6: genetic analysis in Excel. Population genetic
software for teaching and research. Mol. Ecol. Notes 6: 288-295.
Pierpaoli, M., Biró, Z.S., Herrmann, M., Hupe, K., Fernandes, M. & Ragni, B. (2003). Genetic
distinction of wildcat (Felis silvestris) populations in Europe, and hybridization with domestic
cats in Hungary. Mol. Ecol. 12: 2585-2598.
Pritchard, J., Stephens, M. & Donnelly, P. (2000). Inference of population structure using
multilocus genotype data. Genetics 155: 945-959.
Queller, D.C. & Goodnight, K.F. (1989). Estimating relatedness using genetic markers.
Evolution 43: 258-275.
Ralls, K., Pilgrim, K.L., White, P.J., Paxinos, E.E., Schwartz, M.K. & Fleischer, R.C. (2001).
Kinship, social relationships, and den sharing in kit foxes. J. Mammal. 82: 858-866.
Ragni, B. (1993). Status and conservation of the wildcat in Italy. In Seminar on the Biology
and Conservation of the Wildcat (Felis silvestris), Nancy, France, 23-25 September 1992,
Council of Europe, Environmental Encounters, no. 16, pp. 40-41. Council of Europe Press,
Strasbourg.
Ragni, B. & Randi, E. (1986). Multivariate analysis of chraniometric characters in European
wildcat, domestic cat and African wildcat (genus Felis). Z. Säugetierk. 51: 243-251.
Randi, E. (2003). Conservation genetics of carnivores in Italy. C.R. Biologies 326: S54-S60
Randi, E. (2008). Detecting hybridization between wild species and their domestic relatives.
Mol. Ecol. 17: 285-293.
Chapter 5: Genetics
134
Randi, E., Pierpaoli, M., Beaumont, M., Ragni, B. & Sforzi, A. (2001). Genetic Identification of
Wild and Domestic Cats (Felis silvestris) and Their Hybrids Using Bayesian Clustering
Methods. Mol. Biol. Evol. 18: 1679-1693.
Randi, E. & Ragni, B. (1991). Genetic variability and biochemical systematics of domestic
and wild cat populations (Felis silvestris: Felidae). J. Mammal. 72: 79-88.
Raymond, M. & Rousett, F. (1995). GENEPOP (version 1.2): population genetics software
for exact tests and ecumenicism. J. Hered. 86: 248-249.
Rhymer, J.M. & Simberloff, D. (1996). Extinction by hybridization and introgression. Annu.
Rev. Ecol. Syst. 27: 83-109.
Rice, W.R. (1989). Analysing tables of statistical tests. Evolution 43: 223-225.
Robinson, R. (1977). Genetics for Cat Breeders. 2nd edn. Pergamon Press, Oxford.
Sinclair, E.A, Swenson, E.L., Wolfe, M.L., Choate, D.C., Gates, B. & Cranall, K.A. (2001).
Gene flow estimates in Utah’s cougars imply management beyond Utah. Anim. Conserv. 4:
257-264.
Smith, D.L., Meier, T., Geffen, E., Mech, L., Burch, J., Adams, L. & Wayne, R. (1997). Is
incest common in gray wolf packs? Behav. Ecol. 8: 384-391.
Smith, J.L.D., MacDougal, C.W. & Sunquist, M.E. (1987). Female land tenure system in
tigers. In Tigers of the World. Tilson, R.L. & Seal, U.S. (Eds.). Noyes Publications, Park
Ridge, NJ.
Smithers, R.H.N. (1983). The mammals of the southern African subregion. Pretoria:
University of Pretoria.
Stuart, C. & Stuart, T. (1991). The feral cat problem in southern Africa. African Wildlife 45:
13-15.
Suminski, P. (1962). Research in the native form of wild cat (Felis silvestris Schreber) on the
back-ground of its geographical distribution. Folia Forestalia Polonica Ser. A 8: 5-81.
Chapter 5: Genetics
135
Sunquist, M. & Sunquist, F. (2002). Wild Cats of the World. Chicago and London, The
University of Chicago Press.
Waples, R.S. & Gaggiotti, O. (2006). What is a population? An empirical evaluation of some
genetic methods for identifying the number of gene pools and their degree of connectivity.
Mol. Ecol. 15: 1419-1439.
Wiseman, R., O’Ryan, C. & Harley, E.H. (2000). Microsatellite analysis reveals that domestic
cat (Felis catus) and southern African wild cat (Felis lybica) are genetically distinct. Anim.
Conserv. 3: 221-228.
Wozencraft, W.C. (1993). Felidae. In Mammal Species of the World: a Taxonomic and
Geographic Reference. Wilson, D.E. & Reeder, D.M. (Eds.). Smithsonian Institution Press,
Washington and London.
Chapter 6: Synthesis
136
CHAPTER 6
Synthesis
The African wild cat, Felis silvestris cafra, is one of the most widespread small predators on
the African continent (Nowell & Jackson, 1996). However there is a paucity of information on
virtually all aspects of its behavioural ecology. Since wild cats are the ancestor of the
domestic cat, Felis s. catus, and the two species can freely interbreed, one of the biggest
threats to wild cats over the globe is hybridisation with the domestic cat. The objective of this
study was therefore to describe the feeding ecology, the spatial organisation and the
population genetics of African wild cats in the southern Kalahari. This was achieved through
radio telemetry and direct observations of habituated individuals that were closely followed
and monitored over a period of 46 months. Throughout the study period an assertive effort
was made to collect genetic material from wild cats to address the question of hybridisation
as well as to supplement our understanding of population structure with molecular
techniques. This chapter summarises the key aspects of every chapter and provides an
overview of the behavioural ecology and population genetics of the African wild cat in the
southern Kalahari.
6.1 What are the feeding habits of the African wild cat and are there sexual and seasonal
differences in the diet and foraging behaviour?
African wild cats consume a large spectrum of food and prey resources depending on prey
abundance and availability. This study showed that murids formed the bulk of the biomass in
the diet, followed by birds and large mammals (> 500 g). Although reptiles and invertebrates
were frequently caught they contributed less to the overall biomass of the diet. Fluctuations
in prey abundances could be the result of seasonal rainfall and temperature fluctuations, or
long term variability in rainfall resulting in wet and dry cycles. The lean season (hot-dry) was
characterised by a high food-niche breadth and high species richness. Despite sexual
dimorphism in size in the African wild cat, both sexes predominantly fed on smaller rodents,
although there were differences in diet composition with males taking more large mammals
and females favouring birds and reptiles. In support of the optimal foraging theory our results
indicated that African wild cats are adaptable predators that preferred to hunt small rodents,
but can change their diet according to seasonal and longer term prey abundances and
availability.
Chapter 6: Synthesis
137
6.2 What is the foraging behaviour of the Arican wild cat and does it shows sexual and
seasonal differences?
The African wild cat is a successful predator with a hunting style typical of a solitary felid.
Three distinct hunting behaviours were identified: (i) a slow winding walk while inspecting
holes and scent trails, (ii) sitting and looking around for prey, or (iii) fast walking while spray
marking with opportunistic killing of prey, typical of male cats. Both sexes show two daily
peaks of activity: in the early morning and the evenings. The timing of the two active periods
showed strong seasonal shifts from predominantly nocturnal during the hotter seasons to
more diurnal during the colder seasons. A longer period of activity during the day was
observed during the cold-dry season with corresponding low food availability, apparently a
behavioural response to low prey abundances. In this wilderness area male and female
African wild cats differed very little in their activity budgets, with hunting taking up most of
their time. African wild cats are solitary and socialising between individuals is minimal. Cats
showed gender-specific preferences for specific habitat types, with the number of prey
captured corresponding closely to the time spent in each habitat. The major factors
influencing the activity patterns and habitat use of the African wild cat are prey abundance
and temperature extremes.
6.3 What are the spacial organisation and movement patterns of the African wild cat?
It is generally believed in carnivores that female space use is limited by resource distribution
and abundance, whereas males should be strongly influenced by female spatial dyamics.
Our results revealed that prey abundance plays an important role in social and spatial
organisation of the African wild cat in the southern Kalahari. This also explained the lack of
variability in seasonal home range sizes of both male and female cats. Minimum convex
polygon (95% MCP) estimates showed male cats had larger annual home ranges (7.7 ± 3.5
km2) than female cats (3.5 ± 1.0 km2). Food resources in the semi desert area vary in time
and space, thus females exhibited a large overlap in their home ranges, although core areas
were exclusive. It seems that female cats avoid each other temporally and spacially,
although only one observation of aggressive behaviour were observed it may be through
scent marking and therefore female spacing pattern resembles a form of intrasexual
territoriality, although ranges are not actively defended.
Since receptive females seemed to be the limiting resource for male cats, overlap between
male home ranges was restricted to small areas. Male home ranges are larger than
predicted from body size and metabolic considerations alone and adult males appear to be
limited by receptive females as has been found in most carnivores.
Chapter 6: Synthesis
138
6.4 What is the scent marking behaviour in African wild cats?
As predicted for a solitary carnivore, in the African wild cat scent marking is an important
form of communication. For the majority of the time communication between cats occurred
via a range of scent marking behaviours that increased in females to advertise their
reproductive status. Males scent marked continuously during the study period to mark their
home range extent to neighbouring and roaming male cats, whereas female spray marking
appeared to be related to their reproductive status.
6.5 What is the reproductive bahviour of the Afican wild cat?
The African wild cat shows a polygenous mating system as suggested by the spacing
patterns, sexual dimorphism and lack of parental care. In contrast to feral domestic cats that
shows cooperative care of young in colonies of rich resources, this was not the case in our
study, although older siblings did visit dens with smaller kittens. Food availability influenced
the reproductive activity of female cats, and during a lean period no kittens were observed or
reported in the Kalahari. However, as food abundances increased there was a drastic
increase in kittens and two females produced up to four litters in a twelve month period.
Therefore no clear breeding season was evident.
6.6 Was the African wild cat genetically distinct from the domestic cat and what were the
levels of introgression in the southern Kalahari?
Molecular analyses indicate that African wild cats and domestic cats were genetically distinct.
Four cryptic hybrids were identified among the wild cat samples. These hybrids were either
outside or on the periphery of the park, indicating that the level of introgression was low, yet
still of concern to the genetic integrity of the African wild cat. Preliminary findings on the
genetic structure of our wild cat population indicated that related individuals did not cluster
together. A more intense sampling of wild cats in a small area over a longer time period will
be valuable to address questions of relationships between individuals and reproductive
strategies in African wild cats.
6.7 What is the way forward in African wild cat conservation?
Although African wild cats are widely distributed and not protected over most of their range,
little information has been available until now about their behaviour in the wild. This study
provide detailed abservations on feeding habits, foraging behaviour, spatial organisation,
reproduction and the genetic status of the African wild cat in the southern Kalahari. These
results can, in the absence of other studies, assist in understanding wild cat behaviour
across distributional ranges.
Chapter 6: Synthesis
139
Future studies shoud focus on the genetic status of African wild cats in other regions so that
more genetically pure populations can be identified and the needed conservation actions
implemented. Regions with a high probability of hybridisation should be identified and tested.
Hybridisation is a natural process that may be very difficult to prevent, however education
and public information on the role of small mesocarnivores and the threat of feral domestic
cats to wild cats is important to increase awareness. Therefore reduce the risk of
hybridisation events. Monitoring and research, a deeper knowledge of wild cat behaviour,
abundance, population dynamics and other aspects of their ecology in other areas is
essential.
It is hoped that this study will provide a basis for comparison for future studies on the African
wild cat in other habitats and that it provides baseline data that can be used in comparison to
other felids. Natural history knowledge of a species behaviour is the key to successful
conservation efforts while ignorance of behaviour can lead to conservation failures.
References
Nowell, K. & Jackson, P. (1996). Wild cats. Status survey and conservation action plan.
IUCN, Gland.
Appendix 1
140
APPENDIX 1
Techniques used in the study of African wild cat, Felis silvestris cafra, in the
Kgalagadi Transfrontier Park (South Africa/Botswana)
Paper accepted Koedoe, SANParks Scientific Journal
Abstract
The techniques used for the capture, marking and habituation of African wild cats (Felis
silvestris cafra) in the Kalahari are described and evaluated in this paper. African wild cats
were captured, with either baited cage traps or chemical immobilisation through darting.
Darting proved to be a more efficient and less stressful way of capturing cats. Very high
frequency (VHF) radio collars fitted with activity monitors were especially effective in the
open habitat of the Kalahari for locating and maintaining contact with cats; they also aided in
determining if the cats were active or resting in dense vegetation. The habituation of
individual cats to a 4×4 vehicle proved to be time consuming, but it provided a unique
opportunity to investigate the feeding ecology and spatial organisation of cats through direct
visual observations.
Keywords: Kalahari, capture techniques, chemical immobilisation, habituation
Introduction
The African wild cat (Felis silvestris cafra), is widely distributed throughout the African
continent and listed by the International Union for Conservation of Nature (IUCN) as least
concern (Nowell, 2008). However, status and density estimates of African wild cats are
poorly known throughout most of its range. Therefore, the ecological status of wild cat
populations is frequently determined from incomplete or unverified data (Nowell & Jackson,
1996). Previous research efforts on African wild cats have focused on scat analyses and
opportunistic sightings of cats in their natural environment (Palmer & Fairall, 1988; Smithers,
1971; Smithers & Wilson, 1979; Stuart, 1977; Stuart, 1982). The aim of this study was to gain
insight into the population genetics and behavioural ecology of African wild cats in the
southern Kalahari. This required the capture of cats for the fitting of radio collars, taking
morphometric measurements and obtaining DNA samples. Radio telemetry was crucial for
locating individual cats for the collection of data on feeding behaviour, home range and
movement patterns. Investigating the foraging and social behaviour relied on the habituation
of certain individuals for direct observations.

Appendix 1
141
Steel, wire, mesh and Tomahawk cage traps are widely used in the live trapping of small
mammals, for example in the European wild cat and domestic cats (Biró, Szemethy & Heitai,
2005), lynx (Breitnemoser & Haller, 1993), kodkod (Dunstone et al. 2002), Blanford’s foxes
(Geffen et al. 1992; Geffen & MacDonald, 1993), leopard cat (Grassman & Tewes, 2005),
caracal (Marker & Dickman, 2005; Melville, 2004), black-footed cats (Sliwa, 2004, 2006),
dhole (Grassman et al. 2005), ferrets (Norbury, Norbury & Heyward, 1998) and civits
(Jennings, Seymour & Dunston, 2006).
The successful capture and release of an animal is not only determined by the capture of the
animal, but also by how the animals are handled, transported and kept after capture
(Ebedes, Du Toit & Van Rooyen, 1996). This paper provides detailed information on the
methodology involved in capturing, immobilising and habituating of African wild cats in the
southern Kalahari.
Study area
Kgalagadi Transfrontier Park
This study was initiated in March 2003 and continued until December 2006 (46 consecutive
months) in the Kgalagadi Transfrontier Park (KTP), which comprises the Kalahari Gemsbok
National Park (South Africa) and the adjacent Gemsbok National Park in Botswana. The KTP
is a 37,000 km2 semi-arid wilderness area in the southern Kalahari, described as the western
form of the Kalahari Duneveld (Mucina & Rutherford, 2006), consisting of extreme open
savannah of Acacia erioloba, Acacia haemotoxylon and desert grasses. The study was
primarily conducted in a 53 km2 area surrounding the Leeudril waterhole (26º28’17.7” S,
20º36’45.2” E), in the south of the park, and included the Nossob riverbed together with
adjacent calcrete ridges, Rhigozum veld and dune areas (Fig. 1).
Methods
All capture, darting and handling of African wild cats were approved by the ethics committee,
University of Pretoria, (EC 030305-007) and SANParks Animal Use and Care Committee
(SANParks AUCC). Approval to conduct research in the Botswana side of the KTP was
obtained from the Office of the President: OP 46/1 CVII (48) with a supplementary permit
from the Department Wildlife and National Parks (9 July 2006).
1. Capture techniques
1.1 Cage traps/Drop door traps
Cage traps (50cm x 50cm x 150cm) were constructed from welded mesh, with a single
sliding door. A stepping plate mechanism towards the rear end of the cage activated the trap
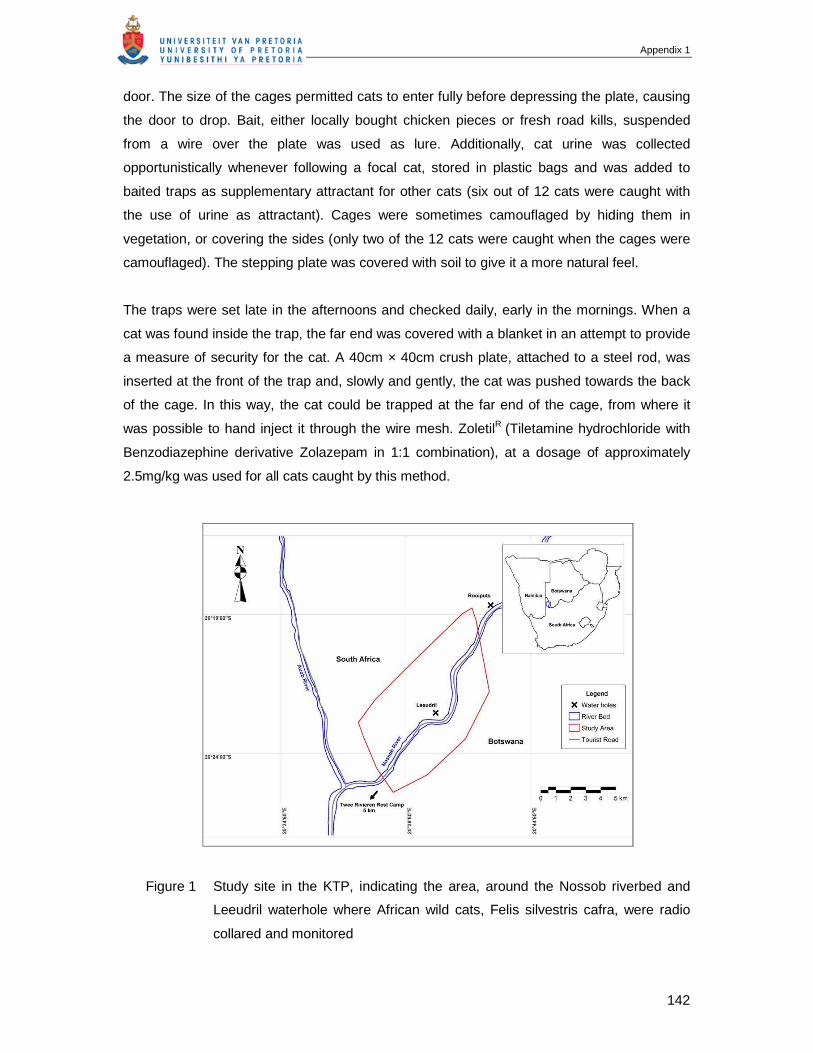
Appendix 1
142
door. The size of the cages permitted cats to enter fully before depressing the plate, causing
the door to drop. Bait, either locally bought chicken pieces or fresh road kills, suspended
from a wire over the plate was used as lure. Additionally, cat urine was collected
opportunistically whenever following a focal cat, stored in plastic bags and was added to
baited traps as supplementary attractant for other cats (six out of 12 cats were caught with
the use of urine as attractant). Cages were sometimes camouflaged by hiding them in
vegetation, or covering the sides (only two of the 12 cats were caught when the cages were
camouflaged). The stepping plate was covered with soil to give it a more natural feel.
The traps were set late in the afternoons and checked daily, early in the mornings. When a
cat was found inside the trap, the far end was covered with a blanket in an attempt to provide
a measure of security for the cat. A 40cm × 40cm crush plate, attached to a steel rod, was
inserted at the front of the trap and, slowly and gently, the cat was pushed towards the back
of the cage. In this way, the cat could be trapped at the far end of the cage, from where it
was possible to hand inject it through the wire mesh. ZoletilR (Tiletamine hydrochloride with
Benzodiazephine derivative Zolazepam in 1:1 combination), at a dosage of approximately
2.5mg/kg was used for all cats caught by this method.
Figure 1 Study site in the KTP, indicating the area, around the Nossob riverbed and
Leeudril waterhole where African wild cats, Felis silvestris cafra, were radio
collared and monitored
Appendix 1
143
Once anaesthetised, cats could be removed from the cages without difficulty, whereupon
standard body measurements were taken (Table 1). A small skin sample was collected for
molecular analysis and, if relevant, a radio collar was fitted. All procedures were conducted
as quickly as possible, and in the immediate vicinity of the trap. On completion of the
necessary procedures, the cat was returned to the shaded cage and left to recover from
anaesthesia. It was released when it had fully recovered.
1.2 Darting
A CO2 rifle (Dan-inject JM Standard model) was used to propel a standard dart syringe
(10.5mm, 1.5 mL capacity) and fitted with a small rubber stopper to reduce penetration.
Owing to the small size of the cats, it was necessary to lower the CO2 pressure in the rifle as
much as possible to reduce the projectile velocity and, in so doing, lessen the impact and
therefore the chances of injury to an animal. As a trade-off, the range over which the dart
could be propelled had to be reduced. Cats were thus always stalked to within 10m.
Cats caught by darting were immobilised with a combination of drugs and an appropriate
antidote as follows (P. Buss and D. Govender, pers. comm.): either Butorphanol (1.38 mg/kg)
and Medetomidine (0.4 mg/kg), with the antidote of Antipamezole administered at five times
the Medetomidine dose (mg) intramuscularly and Naltrexone administered at 10 times the
Butorphanol dose (mg) intramuscularly, or Zoletil (1.58 mg/kg) and Medetomidine (0.07
mg/kg), with the antidote of Antipamezole administered at 6.25–12.5 times the Medetomidine
dose (mg) intramuscularly. Zoletil does not have an antidote.
2. Radio collars
African wild cats were fitted with radio collars from Africa Wildlife Tracking CC, weighing 80g
– 85g, with external antennae of 20cm and a battery life of up to 18 months. Radio collars
were each fitted with an activity monitor to assist in the remote detection of cat activity. Cats
were detected with a two or three element handheld Yagi antenna by traversing the home
range of the individual study animal and using the dune crests as high vantage points, using
a Telonics handheld receiver.
3. Habituation
The open, clear spaces of the Kalahari provide ideal conditions for visual observation of
animals (Begg, 2001; Mills, 2003), although the stealthy nature of cats, especially at night,
required close proximity to the focal animal at all times. All radio collared cats were
habituated to the presence of the research vehicle, allowing the researchers to closely follow
individual cats without any obvious influence on their behaviour. This was achieved by
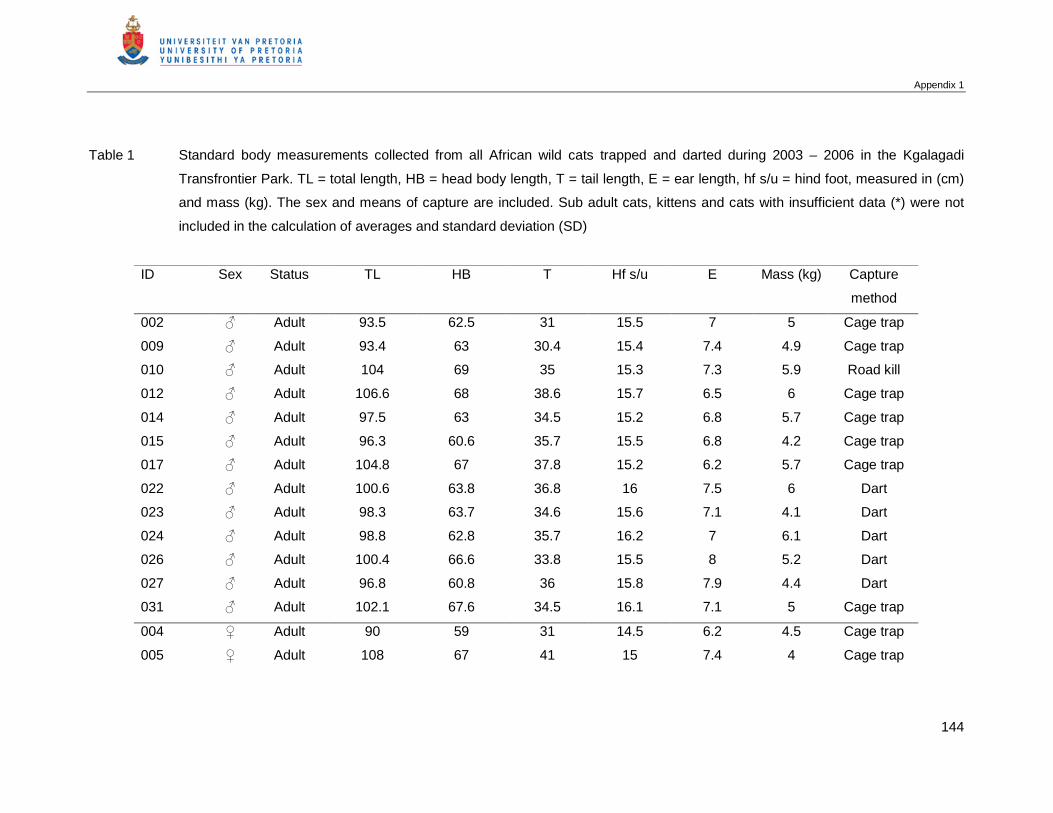
Appendix 1
144
Table 1 Standard body measurements collected from all African wild cats trapped and darted during 2003 – 2006 in the Kgalagadi
Transfrontier Park. TL = total length, HB = head body length, T = tail length, E = ear length, hf s/u = hind foot, measured in (cm)
and mass (kg). The sex and means of capture are included. Sub adult cats, kittens and cats with insufficient data (*) were not
included in the calculation of averages and standard deviation (SD)
ID Sex Status TL HB T Hf s/u E Mass (kg) Capture
method
002 ♂ Adult 93.5 62.5 31 15.5 7 5 Cage trap
009 ♂ Adult 93.4 63 30.4 15.4 7.4 4.9 Cage trap
010 ♂ Adult 104 69 35 15.3 7.3 5.9 Road kill
012 ♂ Adult 106.6 68 38.6 15.7 6.5 6 Cage trap
014 ♂ Adult 97.5 63 34.5 15.2 6.8 5.7 Cage trap
015 ♂ Adult 96.3 60.6 35.7 15.5 6.8 4.2 Cage trap
017 ♂ Adult 104.8 67 37.8 15.2 6.2 5.7 Cage trap
022 ♂ Adult 100.6 63.8 36.8 16 7.5 6 Dart
023 ♂ Adult 98.3 63.7 34.6 15.6 7.1 4.1 Dart
024 ♂ Adult 98.8 62.8 35.7 16.2 7 6.1 Dart
026 ♂ Adult 100.4 66.6 33.8 15.5 8 5.2 Dart
027 ♂ Adult 96.8 60.8 36 15.8 7.9 4.4 Dart
031 ♂ Adult 102.1 67.6 34.5 16.1 7.1 5 Cage trap
004 ♀ Adult 90 59 31 14.5 6.2 4.5 Cage trap
005 ♀ Adult 108 67 41 15 7.4 4 Cage trap
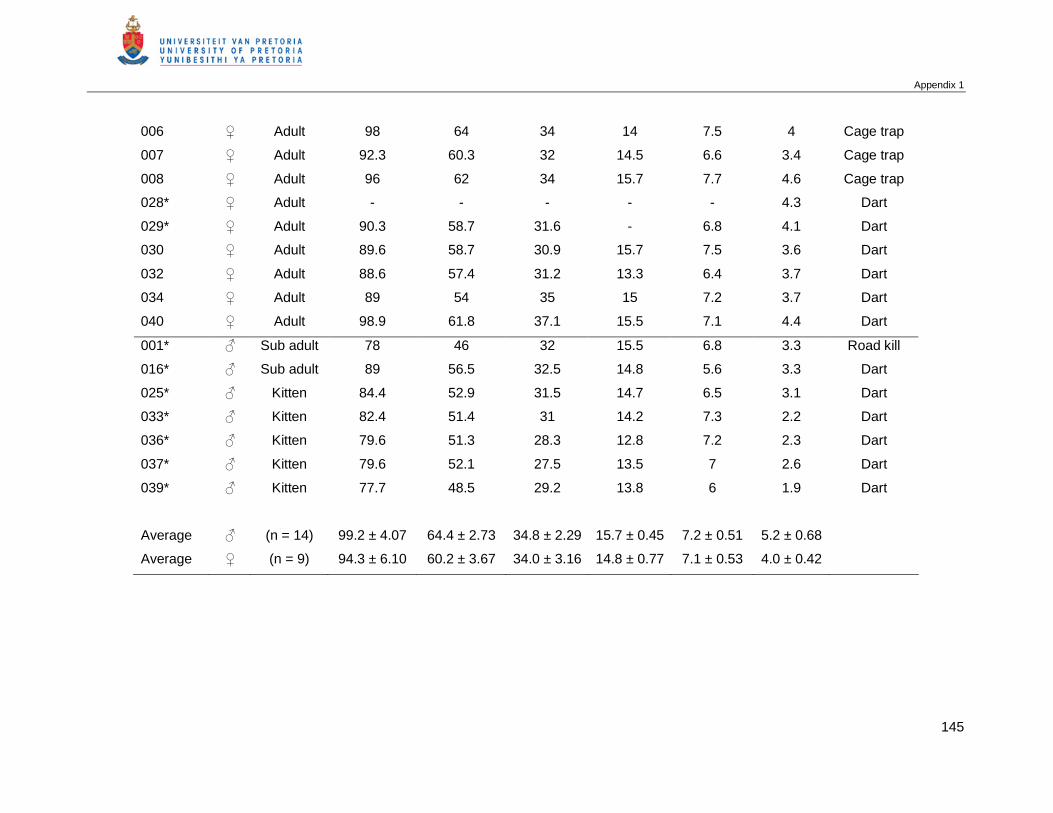
Appendix 1
145
006 ♀ Adult 98 64 34 14 7.5 4 Cage trap
007 ♀ Adult 92.3 60.3 32 14.5 6.6 3.4 Cage trap
008 ♀ Adult 96 62 34 15.7 7.7 4.6 Cage trap
028* ♀ Adult - - - - - 4.3 Dart
029* ♀ Adult 90.3 58.7 31.6 - 6.8 4.1 Dart
030 ♀ Adult 89.6 58.7 30.9 15.7 7.5 3.6 Dart
032 ♀ Adult 88.6 57.4 31.2 13.3 6.4 3.7 Dart
034 ♀ Adult 89 54 35 15 7.2 3.7 Dart
040 ♀ Adult 98.9 61.8 37.1 15.5 7.1 4.4 Dart
001* ♂ Sub adult 78 46 32 15.5 6.8 3.3 Road kill
016* ♂ Sub adult 89 56.5 32.5 14.8 5.6 3.3 Dart
025* ♂ Kitten 84.4 52.9 31.5 14.7 6.5 3.1 Dart
033* ♂ Kitten 82.4 51.4 31 14.2 7.3 2.2 Dart
036* ♂ Kitten 79.6 51.3 28.3 12.8 7.2 2.3 Dart
037* ♂ Kitten 79.6 52.1 27.5 13.5 7 2.6 Dart
039* ♂ Kitten 77.7 48.5 29.2 13.8 6 1.9 Dart
Average ♂ (n = 14) 99.2 ± 4.07 64.4 ± 2.73 34.8 ± 2.29 15.7 ± 0.45 7.2 ± 0.51 5.2 ± 0.68
Average ♀ (n = 9) 94.3 ± 6.10 60.2 ± 3.67 34.0 ± 3.16 14.8 ± 0.77 7.1 ± 0.53 4.0 ± 0.42
Appendix 1
146
patiently following cats daily for the first week after initial capture and collaring, at a distance
of 50m – 100m, while keeping the engine running. Habituation appeared to be facilitated by
keeping the engine running in the beginning and slowly moving closer to the cats. After one
week, the following distance was gradually decreased, until the cats could be followed from a
distance of 10m – 30m without them looking back at the vehicle. Wild cats were followed on
a rotational system, allowing continuous monitoring of a focal animal every night. Cats were
located at night by radio tracking, with the initial visual contact being made with a 1,000,000-
candle spotlight. Once a cat was located, the headlights of the research vehicle were usually
sufficient to follow cats, with the spotlight used only periodically to re-establish contact when
lost in patches of denser vegetation, or when cresting sand dunes. Care was taken to keep
the spotlight trained behind the cat – to neither influence their hunting success negatively by
blinding them, nor positively, by dazzling prey animals.
Results
1. Capture success
1.1 Cage traps
African wild cats were frequently spotted during opportunistic searches and cage traps were
placed in close vicinity to these spots. Seven of the ten cats caught in the study site were
trapped after being spotted in a specific area. Only three cats were caught by randomly
placing the traps in the study site. Trapping success for African wild cats in the Kalahari was
1.4 cats per 100 trap nights. The trapping frequency between wild cats is highly variable and
for African wild cats it was estimated at 73 trap nights per new cat, compared to the results of
the European wild cat (Felis s. silvestris) (Biró et al. 2004; Corbett, 1979), at 860 and 299
trap nights per new cat, respectively. Trapping of feral domestic cats (Felis s. catus) ranged
between 75 and 823 trap nights per new cat (Barratt, 1997; Biró et al. 2004; Bromley, 1986;
Corbett, 1979; Daniels et al. 2001; Molsher, 2001, 2006), for lynx (Lynx canadensis) it was
67 trap nights per new cat (Mech, 1980), ocelot (Leopardus pardalis) was 116 trap nights per
new cat (Dillon & Kelly, 2008) and leopard cat (Prionailurus bengalensis) 405 trap nights per
new cat (Grassman et al. 2005). The main drawback of cage traps appeared to be the
reluctance of wild cats to enter, as well as their non-selective nature (Table 1). Loss of bait
could possibly have been attributed to the ineffective setting of cages. Bait was stolen on
numerous occasions, by smaller mammals such as the yellow mongoose (Cynictis
penicillata) and rodents; in some instances it was consumed by ants.
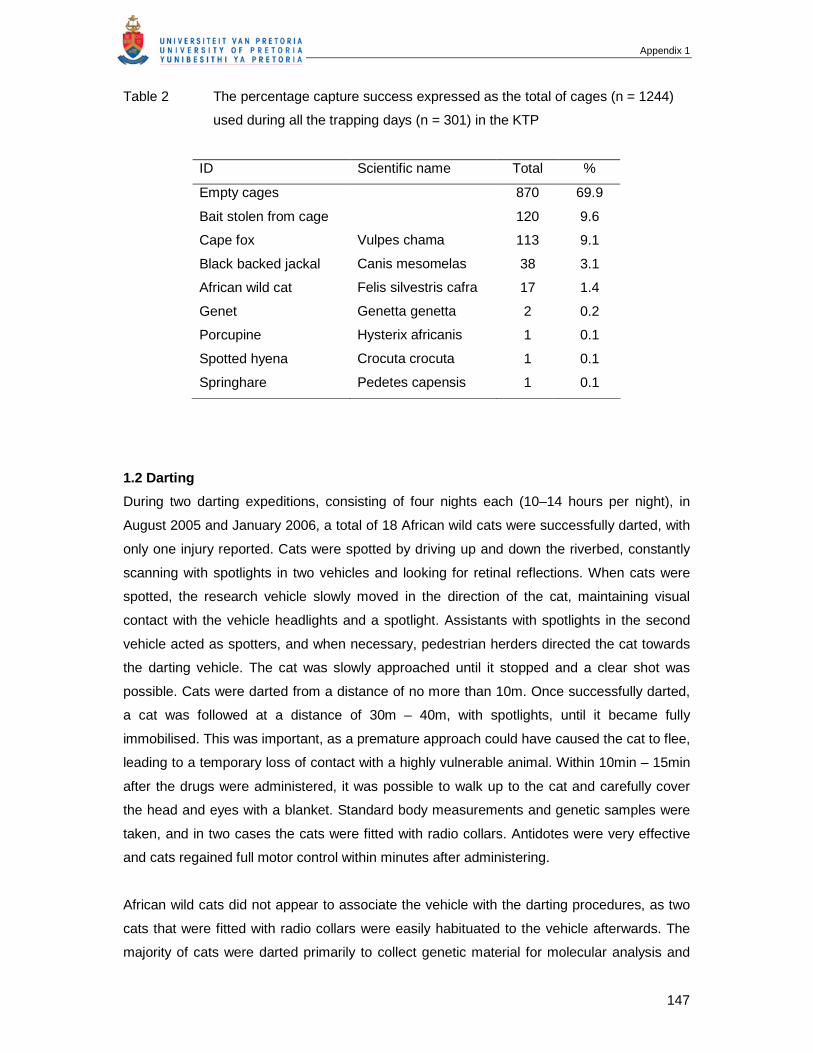
Appendix 1
147
Table 2 The percentage capture success expressed as the total of cages (n = 1244)
used during all the trapping days (n = 301) in the KTP
ID Scientific name Total %
Empty cages 870 69.9
Bait stolen from cage 120 9.6
Cape fox Vulpes chama 113 9.1
Black backed jackal Canis mesomelas 38 3.1
African wild cat Felis silvestris cafra 17 1.4
Genet Genetta genetta 2 0.2
Porcupine Hysterix africanis 1 0.1
Spotted hyena Crocuta crocuta 1 0.1
Springhare Pedetes capensis 1 0.1
1.2 Darting
During two darting expeditions, consisting of four nights each (10–14 hours per night), in
August 2005 and January 2006, a total of 18 African wild cats were successfully darted, with
only one injury reported. Cats were spotted by driving up and down the riverbed, constantly
scanning with spotlights in two vehicles and looking for retinal reflections. When cats were
spotted, the research vehicle slowly moved in the direction of the cat, maintaining visual
contact with the vehicle headlights and a spotlight. Assistants with spotlights in the second
vehicle acted as spotters, and when necessary, pedestrian herders directed the cat towards
the darting vehicle. The cat was slowly approached until it stopped and a clear shot was
possible. Cats were darted from a distance of no more than 10m. Once successfully darted,
a cat was followed at a distance of 30m – 40m, with spotlights, until it became fully
immobilised. This was important, as a premature approach could have caused the cat to flee,
leading to a temporary loss of contact with a highly vulnerable animal. Within 10min – 15min
after the drugs were administered, it was possible to walk up to the cat and carefully cover
the head and eyes with a blanket. Standard body measurements and genetic samples were
taken, and in two cases the cats were fitted with radio collars. Antidotes were very effective
and cats regained full motor control within minutes after administering.
African wild cats did not appear to associate the vehicle with the darting procedures, as two
cats that were fitted with radio collars were easily habituated to the vehicle afterwards. The
majority of cats were darted primarily to collect genetic material for molecular analysis and
Appendix 1
148
were not approached again afterwards. Owing to the risk of missing the small target area on
the thigh of a cat and potentially injuring it, only qualified, experienced wildlife veterinarians
were employed in darting.
African wild cats were immobilised on 31 occasions (13 cats were hand injected and 18 cats
were darted). No fatalities were recorded, although the fate of the injured one is not known.
2. Radio collaring
Radio collaring proved to be invaluable for finding and following cats, as they do not return to
a fixed den site and are difficult to find at night. The estimated total home range sizes (100%
Minimum Convex Polygon) were: adult male = 13.17km² ± 7.32km² (n = 5) and adult female
= 11.75km² ± 2.01km² (n = 3) (Chapter 4). In total, 12 African wild cats were radio collared.
Only one female cat showed a slight irritation to the radio collar, symptomised by localised
hair loss ten days after been collared. Symptoms lasted for four weeks, with hair growing
back gradually. The cat was monitored daily until all symptoms had disappeared. On two
occasions, damaged radio collars were retrieved, (three weeks and two months after being
fitted) suggesting that the cats had fallen prey to a larger predator (one unknown and one
confirmed from tracks as a caracal, Caracal caracal). Two radio-collared cats disappeared (a
young female, two months after being fitted and a young male, two days after), either as a
result of malfunctioning radio collars or emigration to an area outside the range searched.
External antenna of radio collars broke off within 2–6 months, however, this did not seem to
make a difference in the detection of cats, because the cats had known home ranges
(Chapter 4) and searching for a signal from high dunes was almost always successful.
3. Habituation
On average, the habituation period took 73.8 h ± 63.9 h (n = 8), although large individual
differences occurred (Table 2). In general, females were easier to habituate (average 36.7 h
± 5.8 h; n = 3). Three radio-collared and habituated females had litters during the study
period and dens and kittens could be approached without difficulty. Kittens were extremely
curious and would investigate the research vehicle of their own accord. Male cats were more
difficult to habituate (96 h ± 74 h; n = 5), as they move faster and over a much larger area
than females, making observations of males more difficult. Habituation was lost quickly and
maintaining the maximum degree of habituation required that weekly contact with each cat
was maintained.
Habituated African wild cats were visually observed for 1,538 hours (males for 657 hours,
females for 881 hours) on a rotational basis. Continued observations of selected individuals
Appendix 1
149
provided detailed information on sexual and seasonal differences in diet, foraging behaviour,
movement patterns, reproduction and inter-specific interactions.
Discussion
Long-term and intensive field studies on smaller cats are still exceptional and even the
common species have not been well studied (Macdonald & Loveridge, in press; Nowell &
Jackson, 1996). The reason for this is the relative difficulty associated with studying small
felids. Previous research on African wild cats was based on opportunistic sightings, scat and
stomach analysis (Palmer & Fairall, 1988; Smithers, 1971; Smithers & Wilson, 1979; Stuart,
1977). Their nocturnal behaviour and general shy and elusive nature, make it practically
impossible to study cats in their natural environment without the aid of radio telemetry. Radio
telemetry has become more reliable and efficient since the 1980s (Nowell & Jackson, 1996);
recently, radio collars have been designed smaller, lighter and reliable enough for the use on
smaller cats. However, in spite of the advances in technology, the time required to catch
smaller cats for radio collaring purposes poses a challenge. The trapping frequency of
African wild cats is comparable with frequencies of the trapping of feral domestic cats (F. s.
catus) (Barratt, 1997; Molsher, 1999, 2001). This is much lower than the results on European
wild cats (F.s. silvestris) (Biró et al. 2004; Corbett, 1979), which are difficult to catch, the
reason possibly being that these populations in Europe have declined, are fragmented and,
in many places, are already extinct (Nowell, 2008). For black-footed cats (Felis nigripes), the
trapping frequency was one cat for 100–200 trap nights (including recaptures) (A. Sliwa,
pers. comm.). African wild cats in the Kalahari were regularly spotted during our study period,
therefore it is believed that densities are much higher in the Kalahari than in Europe.
The results in this study not only confirm the difficulty of catching African wild cats, but also
emphasise the general low success rate of trapping small carnivores in the southern
Kalahari. Mainly trap door cages, with various combinations of bait and urine to attract cats
were used. Positioning cages in areas of high animal activity should increase the selectivity
of the trapping efforts (Boddicker, 1999). Our results suggest that, after an extensive search
in the riverbed with a spotlight and placing of traps close to sightings of cats, the success of
trapping increased in comparison with randomly placed traps.
The use of a CO2 Dan inject dart gun proved to be the best method in the capture of free
range African wild cats. The time and cost effectiveness of this capture method was
enhanced with the use of drugs combined with antidotes. Once all the data and
measurements were collected from the cats, they could be revived with the antidote and the
darting operation could continue. Special care and qualified personnel (two wildlife
Appendix 1
150
veterinarians and four assistants in two vehicles) were needed to assist with darting
operations, because the target animal was so small. The cost of qualified veterinarians and
personnel needed in a darting operation is high; however, to obtain a representative sample
size using only conventional trapping methods might have taken the researcher another few
years of intensive fieldwork.
It was relatively easy to habituate African wild cats to a research vehicle (590 hours were
needed to habituate eight cats). The Kalahari is the ideal location to study small carnivores,
such as African wild cats, because the openness of the environment makes it possible to
follow them, even at night (Begg 2001; Mills 2003). Although there were large individual
differences between the times needed to habituate individuals (Table 2), it was possible to
collect data on feeding, hunting, reproduction and mating behaviour of African wild cats
(Herbst & Mills, 2010). To achieve this, radio telemetry was essential and because African
wild cats do not travel to the same extent than larger felids, it was feasible to traverse the
whole study area in a few hours in search of a signal. This was enhanced by using high
dunes as a vantage point.
Conclusion
For dispersed and elusive animals, radio collaring might be the key to obtaining appropriate
data (Kenward, 2001). Despite the advances in the use of satellites for radio tracking –
platform transmitter terminals and global positioning system collars – they remain relatively
expensive in comparison with the VHF transmitters (Kenward, 2001). In this study visual
observations of habituated cats fitted with VHF transmitters enabled us to record valuable
behavioural information on a nocturnal and secretive animal that more sophisticated and
expensive tracking devices could not. This is the first report on the methodology of darting of
wildcats (F. silvestris), and it proved to be a more efficient and less stressful method than
cage trapping of African wild cats in the KTP.
References
Barratt, D.G. (1997). Home range size, habitat utilisation and movement patterns of
suburban and farm cats Felis catus. Ecography 20: 271-280.
Begg, C.M. (2001). Feeding ecology and social organization of the honey badgers (Mellivora
capensis) in the southern Kalahari. PhD. University of Pretoria, South Africa.
Appendix 1
151
Biró, Z., Szemethy, L. & Heitai. (2004). Home range size of wildcats (Felis silvestris) and
feral domestic cats (Felis silvestris f. catus) in a hilly region of Hungary. Mammal. Biol. 69:
302-310.
Boddicker, M.L. (1999). Catch’N coyotes & other crit’rs. Rocky Mountain Wildlife Products:
Colorado. USA.
Breitenmoser, U. & Haller, H. (1993). Patterns of predation by reintroduced European lynx in
the Swiss Alps. J. Wildlife Managem. 57: 135−144.
Corbett, L.K. (1979). Feeding ecology and social organization of wildcats (Felis silvestris)
and domestic cats (Felis catus) in Scotland. PhD. University of Aberdeen.
Daniels, M.J., Beaumont, M.A., Johnson, P.J., Balharry, D., Macdonald, D.W. & Barratt, E.
2001. Ecology and genetics of wild-living cats in the north-east of Scotland and the
implications for the conservation of the wildcat. J. Appl. Ecol. 38: 146-161.
Dillon, A. & Kelly, M.J. 2008. Ocelot home range, overlap and density: comparing radio
telemetry with camera trapping. J. Zool. (Lond.) 275: 391-398.
Ebedes, H., Du Toit, J.G. & van Rooyen, J. 2000. Capturing wild animals. In: J. du P (ed.).
Game Ranch Management. 4th ed. Pretoria.
Geffen, E., Degen, A.A., Kam, M., Hefner, R. & Nagy, K.A. (1992). Daily Energy Expenditure
and Water Flux of Free-Living Blanford's Foxes (Vulpes cana), a small Desert Carnivore. J.
Anim. Ecol. 61: 611−617.
Geffen, E. & MacDonald, D.W. (1993). Activity and Movement Patterns of Blanford’s Foxes.
J. Mammal. 74: 455−463.
Grassman, L.I. & Tewes, M.E. (2005). Spatial ecology and diet of the dhole Cuon alpinus
(Canidae, Carnivora) in north central Thailand. J. Mammal., 85: 29−38.
Grassman, L.I., Tewes, M.E., Silvey, N.J. & Kreetiyutanont, K. 2005. Ecology of three
sympatric felids in a mixed evergreen forest in North-central Thailand. J. Mammal. 86: 29-38.
Appendix 1
152
Jennings, A.P., Seymour, A.S. & Dunstone, N. (2006). Ranging behaviour, spatial
organization and activity of the Malay civit (Viverra tangalunga) on Buton Island, Sulawesi. J.
Zool (Lond.) 268: 63−71.
Kenward, R.E. (2001). A manual for wildlife radio tagging. Academic Press, London,
England.
Macdonald, D. & Loveridge, A. (in press). The biology and conservation of wild felids. Oxford
University Press, Oxford.
Marker, L. & Dickman, A. (2005). Notes on the spatial ecology of caracals (Felis caracal),
with particular reference to Namibian farmlands. Afr. J. Ecol. 43: 73−76.
Mech, L.D. (1980). Age, sex, reproduction, and spatial organization of lynxes colonizing
north-eastern Minnesota. J. Mammal. 61: 261-267.
Melville, H. (2004). Behavioural ecology of caracal in the Kgalagadi Transfrontier Park, and
its impact on adjacent small stock production units. MSc thesis. Department of Wildlife
Management, Univerisity of Pretoria.
Mills, M. G. L. (2003). Kalahari Hyenas: Comparative Behavioural Ecology of Two Species.
New Jersey, The Blackburn Press.
Molsher, R.L. (1999). The ecology of feral cats, Felis catus, in open forests in New South
Wales: interactions with food resources and foxes. PhD thesis. University of Sydney,
Australia.
Molsher, R.L. (2001). Trapping and demographics of feral cats (Felis catus) in central New
South Wales. Wildl. Res. 28: 631-636.
Mucina, L. & Rutherford, M.C. (2006). The vegetation of South Africa, Lesotho and
Swaziland. Strelitzia 19. South African National Biodiversity Institute, Pretoria.
Norbury, G.L., Norbury, D.C. & Heyward, R.P. (1998). Space use and denning behaviour of
wild ferrets (Mustela furo) and cats (Felis catus). NZ J. Ecol. 22: 149−159.
Appendix 1
153
Nowell, K. (2008). Felis silvestris. In: IUCN 2008. 2008 IUCN Red List of Threatened
Species, viewed 20 April 2010, from http://www.iucnredlist.org
Nowell, K. & Jackson, P. (1996). Wild cats. Status survey and conservation action plan.
IUCN, Gland.
Palmer, R. & Fairall, N. (1988). Caracal and African wild cat diet in the Karoo National Park
and the implications thereof for hyrax. S.A. J. Wildl. Res. 18: 30-34.
Sliwa, A. (2004). Home range size and social organisation of black-footed cats (Felis
nigripes). Mammal. Biol. 69: 96−107.
Sliwa, A. (2006). Seasonal and sex-specific prey-composition of black-footed cats Felis
nigripes. Acta Theriol. 51: 195−206.
Smithers, R.H.N. (1971). The Mammals of Botswana. Museum memoirs of the national
Monument Rhodes. 4: 1-340.
Smithers, R.H.N. & Wilson, V.J. (1979). Checklist and atlas of the mammals of Zimbabwe-
Rhodesia. (Salisbury: Trustees, National Museums and Monuments, Zimbabwe-Rhodesia).
Stuart, C.T. (1977). The distribution, status, feeding and reproduction of carnivores of the
Cape Province, research report, Dept Nat. & Environ. Cons. Mammals: 91-174.
Stuart, C.T. (1982). Aspects of the biology of the caracal (Felis caracal) Schreber 1776, in
the Cape Province of South Africa. M.Sc. University of Pretoria, South Africa.
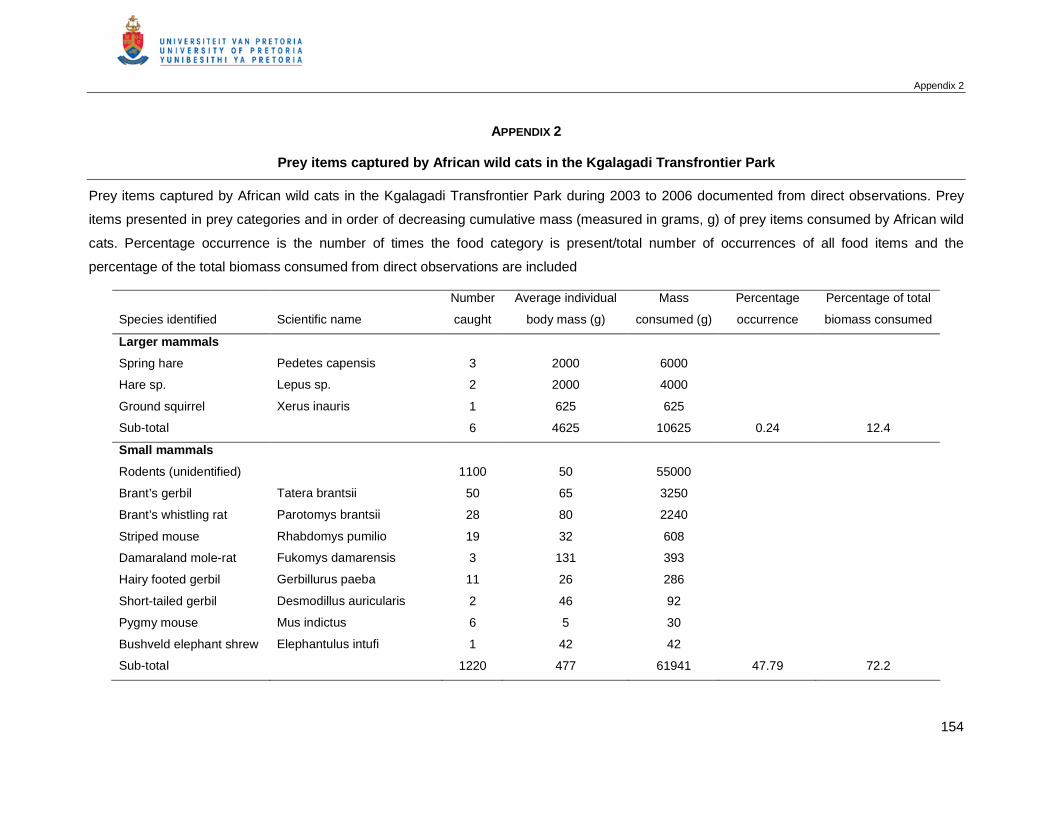
Appendix 2
154
APPENDIX 2
Prey items captured by African wild cats in the Kgalagadi Transfrontier Park
Prey items captured by African wild cats in the Kgalagadi Transfrontier Park during 2003 to 2006 documented from direct observations. Prey
items presented in prey categories and in order of decreasing cumulative mass (measured in grams, g) of prey items consumed by African wild
cats. Percentage occurrence is the number of times the food category is present/total number of occurrences of all food items and the
percentage of the total biomass consumed from direct observations are included
Species identified
Scientific name
Number
caught
Average individual
body mass (g)
Mass
consumed (g)
Percentage
occurrence
Percentage of total
biomass consumed
Larger mammals
Spring hare Pedetes capensis 3 2000 6000
Hare sp. Lepus sp. 2 2000 4000
Ground squirrel Xerus inauris 1 625 625
Sub-total 6 4625 10625 0.24 12.4
Small mammals
Rodents (unidentified) 1100 50 55000
Brant’s gerbil Tatera brantsii 50 65 3250
Brant’s whistling rat Parotomys brantsii 28 80 2240
Striped mouse Rhabdomys pumilio 19 32 608
Damaraland mole-rat Fukomys damarensis 3 131 393
Hairy footed gerbil Gerbillurus paeba 11 26 286
Short-tailed gerbil Desmodillus auricularis 2 46 92
Pygmy mouse Mus indictus 6 5 30
Bushveld elephant shrew Elephantulus intufi 1 42 42
Sub-total 1220 477 61941 47.79 72.2
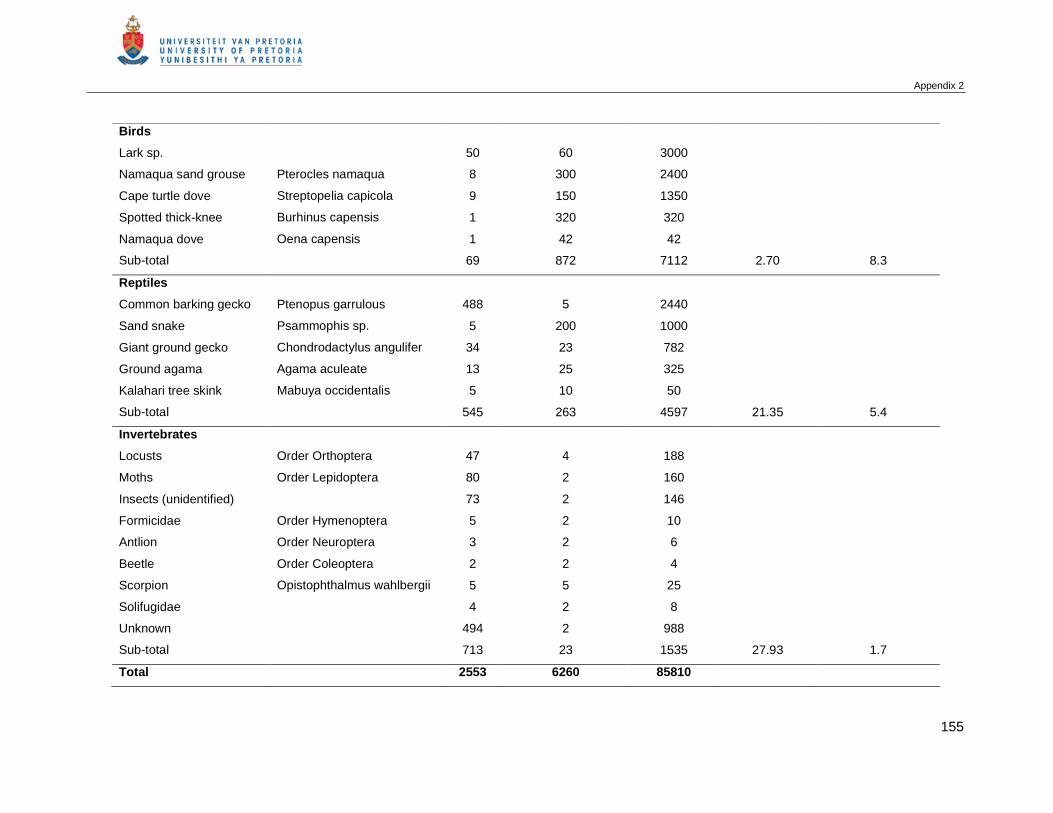
Appendix 2
155
Birds
Lark sp. 50 60 3000
Namaqua sand grouse Pterocles namaqua 8 300 2400
Cape turtle dove Streptopelia capicola 9 150 1350
Spotted thick-knee Burhinus capensis 1 320 320
Namaqua dove Oena capensis 1 42 42
Sub-total 69 872 7112 2.70 8.3
Reptiles
Common barking gecko Ptenopus garrulous 488 5 2440
Sand snake Psammophis sp. 5 200 1000
Giant ground gecko Chondrodactylus angulifer 34 23 782
Ground agama Agama aculeate 13 25 325
Kalahari tree skink Mabuya occidentalis 5 10 50
Sub-total 545 263 4597 21.35 5.4
Invertebrates
Locusts Order Orthoptera 47 4 188
Moths Order Lepidoptera 80 2 160
Insects (unidentified) 73 2 146
Formicidae Order Hymenoptera 5 2 10
Antlion Order Neuroptera 3 2 6
Beetle Order Coleoptera 2 2 4
Scorpion Opistophthalmus wahlbergii 5 5 25
Solifugidae 4 2 8
Unknown 494 2 988
Sub-total 713 23 1535 27.93 1.7
Total 2553 6260 85810
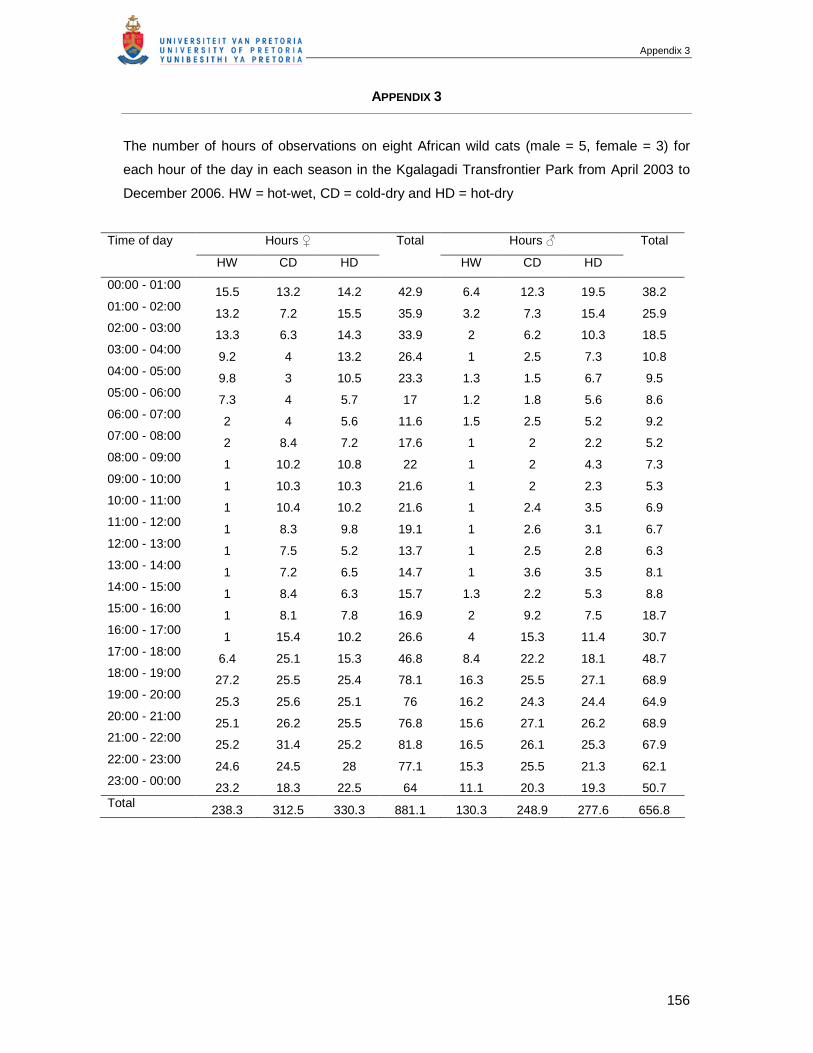
Appendix 3
156
APPENDIX 3
The number of hours of observations on eight African wild cats (male = 5, female = 3) for
each hour of the day in each season in the Kgalagadi Transfrontier Park from April 2003 to
December 2006. HW = hot-wet, CD = cold-dry and HD = hot-dry
Time of day Hours ♀ Total Hours ♂ Total
HW CD HD HW CD HD
00:00 - 01:00 15.5 13.2 14.2 42.9 6.4 12.3 19.5 38.2 01:00 - 02:00 13.2 7.2 15.5 35.9 3.2 7.3 15.4 25.9 02:00 - 03:00 13.3 6.3 14.3 33.9 2 6.2 10.3 18.5 03:00 - 04:00
9.2 4 13.2 26.4 1 2.5 7.3 10.8 04:00 - 05:00 9.8 3 10.5 23.3 1.3 1.5 6.7 9.5 05:00 - 06:00 7.3 4 5.7 17 1.2 1.8 5.6 8.6 06:00 - 07:00 2 4 5.6 11.6 1.5 2.5 5.2 9.2 07:00 - 08:00 2 8.4 7.2 17.6 1 2 2.2 5.2 08:00 - 09:00 1 10.2 10.8 22 1 2 4.3 7.3 09:00 - 10:00 1 10.3 10.3 21.6 1 2 2.3 5.3 10:00 - 11:00 1 10.4 10.2 21.6 1 2.4 3.5 6.9 11:00 - 12:00
1 8.3 9.8 19.1 1 2.6 3.1 6.7 12:00 - 13:00 1 7.5 5.2 13.7 1 2.5 2.8 6.3 13:00 - 14:00 1 7.2 6.5 14.7 1 3.6 3.5 8.1 14:00 - 15:00 1 8.4 6.3 15.7 1.3 2.2 5.3 8.8 15:00 - 16:00 1 8.1 7.8 16.9 2 9.2 7.5 18.7 16:00 - 17:00 1 15.4 10.2 26.6 4 15.3 11.4 30.7 17:00 - 18:00 6.4 25.1 15.3 46.8 8.4 22.2 18.1 48.7 18:00 - 19:00 27.2 25.5 25.4 78.1 16.3 25.5 27.1 68.9 19:00 - 20:00
25.3 25.6 25.1 76 16.2 24.3 24.4 64.9 20:00 - 21:00 25.1 26.2 25.5 76.8 15.6 27.1 26.2 68.9 21:00 - 22:00 25.2 31.4 25.2 81.8 16.5 26.1 25.3 67.9 22:00 - 23:00 24.6 24.5 28 77.1 15.3 25.5 21.3 62.1 23:00 - 00:00 23.2 18.3 22.5 64 11.1 20.3 19.3 50.7 Total 238.3 312.5 330.3 881.1 130.3 248.9 277.6 656.8
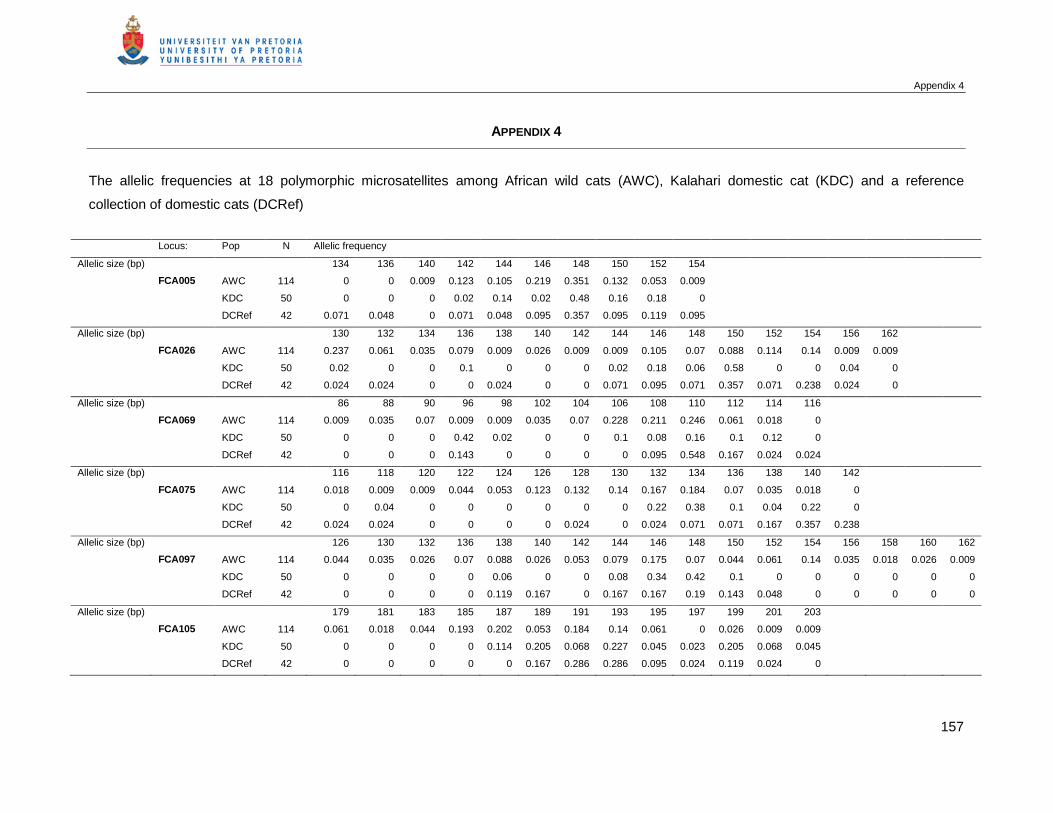
Appendix 4
157
APPENDIX 4
The allelic frequencies at 18 polymorphic microsatellites among African wild cats (AWC), Kalahari domestic cat (KDC) and a reference
collection of domestic cats (DCRef)
Locus: Pop N Allelic frequency
Allelic size (bp) 134 136 140 142 144 146 148 150 152 154
FCA005 AWC 114 0 0 0.009 0.123 0.105 0.219 0.351 0.132 0.053 0.009
KDC 50 0 0 0 0.02 0.14 0.02 0.48 0.16 0.18 0
DCRef 42 0.071 0.048 0 0.071 0.048 0.095 0.357 0.095 0.119 0.095
Allelic size (bp) 130 132 134 136 138 140 142 144 146 148 150 152 154 156 162
FCA026 AWC 114 0.237 0.061 0.035 0.079 0.009 0.026 0.009 0.009 0.105 0.07 0.088 0.114 0.14 0.009 0.009
KDC 50 0.02 0 0 0.1 0 0 0 0.02 0.18 0.06 0.58 0 0 0.04 0
DCRef 42 0.024 0.024 0 0 0.024 0 0 0.071 0.095 0.071 0.357 0.071 0.238 0.024 0
Allelic size (bp) 86 88 90 96 98 102 104 106 108 110 112 114 116
FCA069 AWC 114 0.009 0.035 0.07 0.009 0.009 0.035 0.07 0.228 0.211 0.246 0.061 0.018 0
KDC 50 0 0 0 0.42 0.02 0 0 0.1 0.08 0.16 0.1 0.12 0
DCRef 42 0 0 0 0.143 0 0 0 0 0.095 0.548 0.167 0.024 0.024
Allelic size (bp) 116 118 120 122 124 126 128 130 132 134 136 138 140 142
FCA075 AWC 114 0.018 0.009 0.009 0.044 0.053 0.123 0.132 0.14 0.167 0.184 0.07 0.035 0.018 0
KDC 50 0 0.04 0 0 0 0 0 0 0.22 0.38 0.1 0.04 0.22 0
DCRef 42 0.024 0.024 0 0 0 0 0.024 0 0.024 0.071 0.071 0.167 0.357 0.238
Allelic size (bp) 126 130 132 136 138 140 142 144 146 148 150 152 154 156 158 160 162
FCA097 AWC 114 0.044 0.035 0.026 0.07 0.088 0.026 0.053 0.079 0.175 0.07 0.044 0.061 0.14 0.035 0.018 0.026 0.009
KDC 50 0 0 0 0 0.06 0 0 0.08 0.34 0.42 0.1 0 0 0 0 0 0
DCRef 42 0 0 0 0 0.119 0.167 0 0.167 0.167 0.19 0.143 0.048 0 0 0 0 0
Allelic size (bp) 179 181 183 185 187 189 191 193 195 197 199 201 203
FCA105 AWC 114 0.061 0.018 0.044 0.193 0.202 0.053 0.184 0.14 0.061 0 0.026 0.009 0.009
KDC 50 0 0 0 0 0.114 0.205 0.068 0.227 0.045 0.023 0.205 0.068 0.045
DCRef 42 0 0 0 0 0 0.167 0.286 0.286 0.095 0.024 0.119 0.024 0
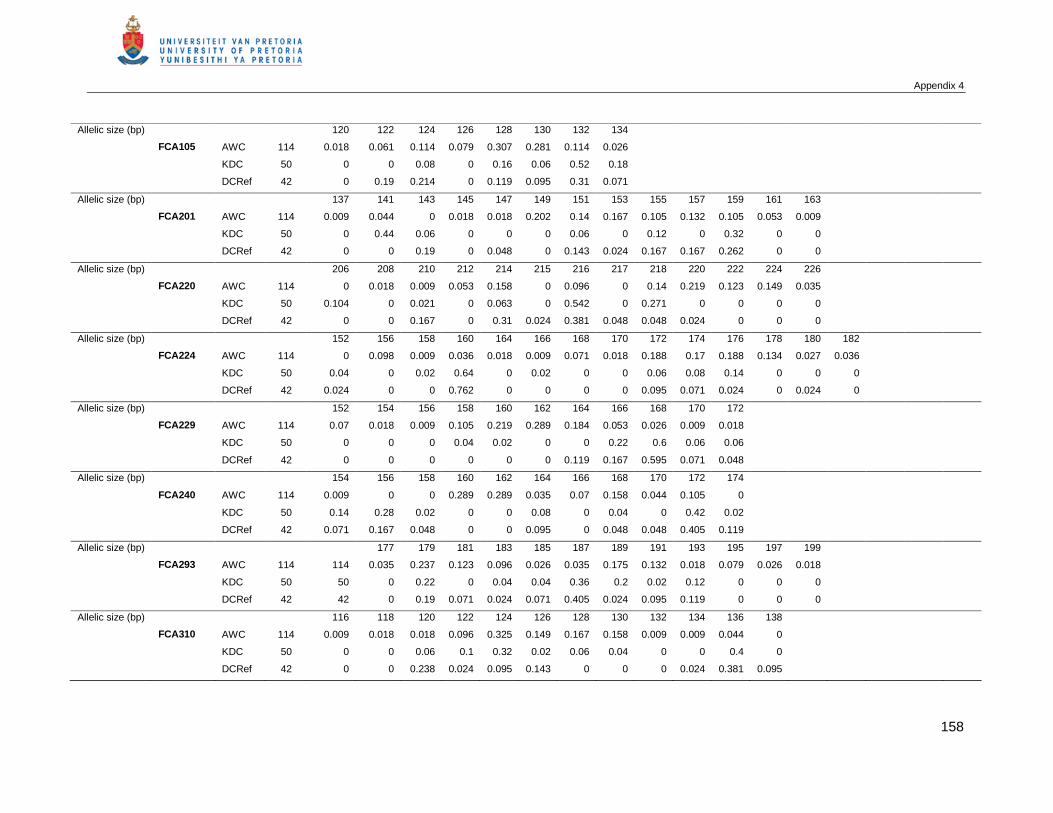
Appendix 4
158
Allelic size (bp) 120 122 124 126 128 130 132 134
FCA105 AWC 114 0.018 0.061 0.114 0.079 0.307 0.281 0.114 0.026
KDC 50 0 0 0.08 0 0.16 0.06 0.52 0.18
DCRef 42 0 0.19 0.214 0 0.119 0.095 0.31 0.071
Allelic size (bp) 137 141 143 145 147 149 151 153 155 157 159 161 163
FCA201 AWC 114 0.009 0.044 0 0.018 0.018 0.202 0.14 0.167 0.105 0.132 0.105 0.053 0.009
KDC 50 0 0.44 0.06 0 0 0 0.06 0 0.12 0 0.32 0 0
DCRef 42 0 0 0.19 0 0.048 0 0.143 0.024 0.167 0.167 0.262 0 0
Allelic size (bp) 206 208 210 212 214 215 216 217 218 220 222 224 226
FCA220 AWC 114 0 0.018 0.009 0.053 0.158 0 0.096 0 0.14 0.219 0.123 0.149 0.035
KDC 50 0.104 0 0.021 0 0.063 0 0.542 0 0.271 0 0 0 0
DCRef 42 0 0 0.167 0 0.31 0.024 0.381 0.048 0.048 0.024 0 0 0
Allelic size (bp) 152 156 158 160 164 166 168 170 172 174 176 178 180 182
FCA224 AWC 114 0 0.098 0.009 0.036 0.018 0.009 0.071 0.018 0.188 0.17 0.188 0.134 0.027 0.036
KDC 50 0.04 0 0.02 0.64 0 0.02 0 0 0.06 0.08 0.14 0 0 0
DCRef 42 0.024 0 0 0.762 0 0 0 0 0.095 0.071 0.024 0 0.024 0
Allelic size (bp) 152 154 156 158 160 162 164 166 168 170 172
FCA229 AWC 114 0.07 0.018 0.009 0.105 0.219 0.289 0.184 0.053 0.026 0.009 0.018
KDC 50 0 0 0 0.04 0.02 0 0 0.22 0.6 0.06 0.06
DCRef 42 0 0 0 0 0 0 0.119 0.167 0.595 0.071 0.048
Allelic size (bp) 154 156 158 160 162 164 166 168 170 172 174
FCA240 AWC 114 0.009 0 0 0.289 0.289 0.035 0.07 0.158 0.044 0.105 0
KDC 50 0.14 0.28 0.02 0 0 0.08 0 0.04 0 0.42 0.02
DCRef 42 0.071 0.167 0.048 0 0 0.095 0 0.048 0.048 0.405 0.119
Allelic size (bp) 177 179 181 183 185 187 189 191 193 195 197 199
FCA293 AWC 114 114 0.035 0.237 0.123 0.096 0.026 0.035 0.175 0.132 0.018 0.079 0.026 0.018
KDC 50 50 0 0.22 0 0.04 0.04 0.36 0.2 0.02 0.12 0 0 0
DCRef 42 42 0 0.19 0.071 0.024 0.071 0.405 0.024 0.095 0.119 0 0 0
Allelic size (bp) 116 118 120 122 124 126 128 130 132 134 136 138
FCA310 AWC 114 0.009 0.018 0.018 0.096 0.325 0.149 0.167 0.158 0.009 0.009 0.044 0
KDC 50 0 0 0.06 0.1 0.32 0.02 0.06 0.04 0 0 0.4 0
DCRef 42 0 0 0.238 0.024 0.095 0.143 0 0 0 0.024 0.381 0.095
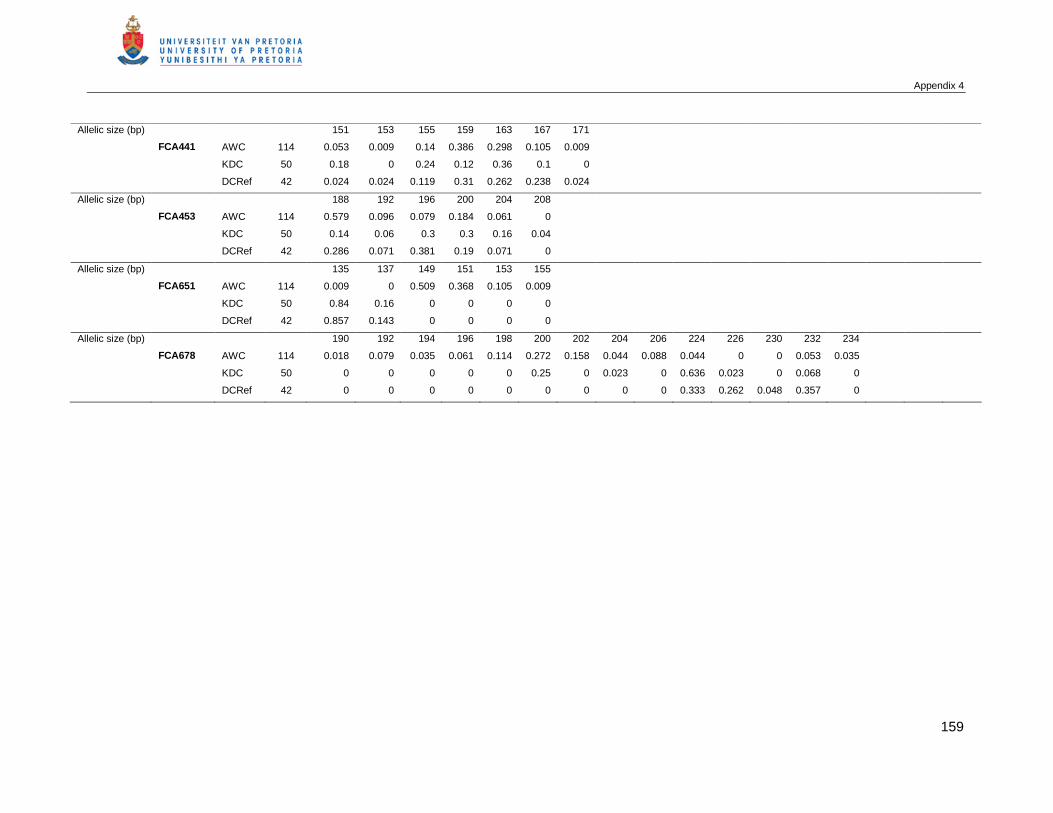
Appendix 4
159
Allelic size (bp) 151 153 155 159 163 167 171
FCA441 AWC 114 0.053 0.009 0.14 0.386 0.298 0.105 0.009
KDC 50 0.18 0 0.24 0.12 0.36 0.1 0
DCRef 42 0.024 0.024 0.119 0.31 0.262 0.238 0.024
Allelic size (bp) 188 192 196 200 204 208
FCA453 AWC 114 0.579 0.096 0.079 0.184 0.061 0
KDC 50 0.14 0.06 0.3 0.3 0.16 0.04
DCRef 42 0.286 0.071 0.381 0.19 0.071 0
Allelic size (bp) 135 137 149 151 153 155
FCA651 AWC 114 0.009 0 0.509 0.368 0.105 0.009
KDC 50 0.84 0.16 0 0 0 0
DCRef 42 0.857 0.143 0 0 0 0
Allelic size (bp) 190 192 194 196 198 200 202 204 206 224 226 230 232 234
FCA678 AWC 114 0.018 0.079 0.035 0.061 0.114 0.272 0.158 0.044 0.088 0.044 0 0 0.053 0.035
KDC 50 0 0 0 0 0 0.25 0 0.023 0 0.636 0.023 0 0.068 0
DCRef 42 0 0 0 0 0 0 0 0 0 0.333 0.262 0.048 0.357 0
Appendix 5
160
APPENDIX 5
Published book chapter: In Biology and Conservation of Wild Felids, Oxford University Press (in press)
Chapter 26
Black-footed cats (Felis nigripes) and African wild cats (Felis silvestris lybica): a
comparison of two small felids from South African arid lands
Alexander Sliwa, Marna Herbst, and Gus Mills
Some of the leading causes for the decline of felid populations are habitat loss, habitat
degradation and persecution. Africa’s two smallest cat species, the black-footed cat (BFC)
(Felis nigripes) and the African wild cat (AWC) (Felis silvestris) occur in southern Africa’s
grasslands and semi deserts and are affected by all these causes of decline. Additionally,
AWC are threatened by hybridisation with domestic cats (Felis silvestris catus) (Smithers
1983; Nowell and Jackson 1996; Macdonald et al., Chapter 22, this volume). Our objectives
were to: (1) explore the origins of and morphological differences between the two species;
(2) compare their life history and ecological parameters; (3) compare ecological factors that
impact species abundance and distribution; and (4) identify gaps in research knowledge,
particularly with relevance to conservation management of the species. While variation in
diet, home range size, resting site use and activity patterns were present between the two
species, we could not discern significant differences in these parameters, or in population
threats. We propose that collaborative research and concerted action planning will maximise
the efficiency of financial resources to develop applied conservation solutions for both
species.
26.1 Introduction
The BFC, also called the small-spotted cat, is the smallest cat species in Africa and amongst
the smallest in the world. Endemic to the arid grassland, dwarf shrub and savannah of the
Karoo and Kalahari in the western parts of southern Africa (Fig. 26.1) (Smithers 1983) it has
the most restricted distribution of any African cat species (Nowell & Jackson 1996). It shares
much of its habitat with the widespread AWC, which ranges throughout most of the African
continent (Fig. 26.1; Smithers 1983; Nowell & Jackson 1996). Erratic rainfall affects the food
resources in the Kalahari study area of the AWC described here and throughout the
distribution range of the BFC (Leistner 1967; Nel et al. 1984; van Rooyen 1984).
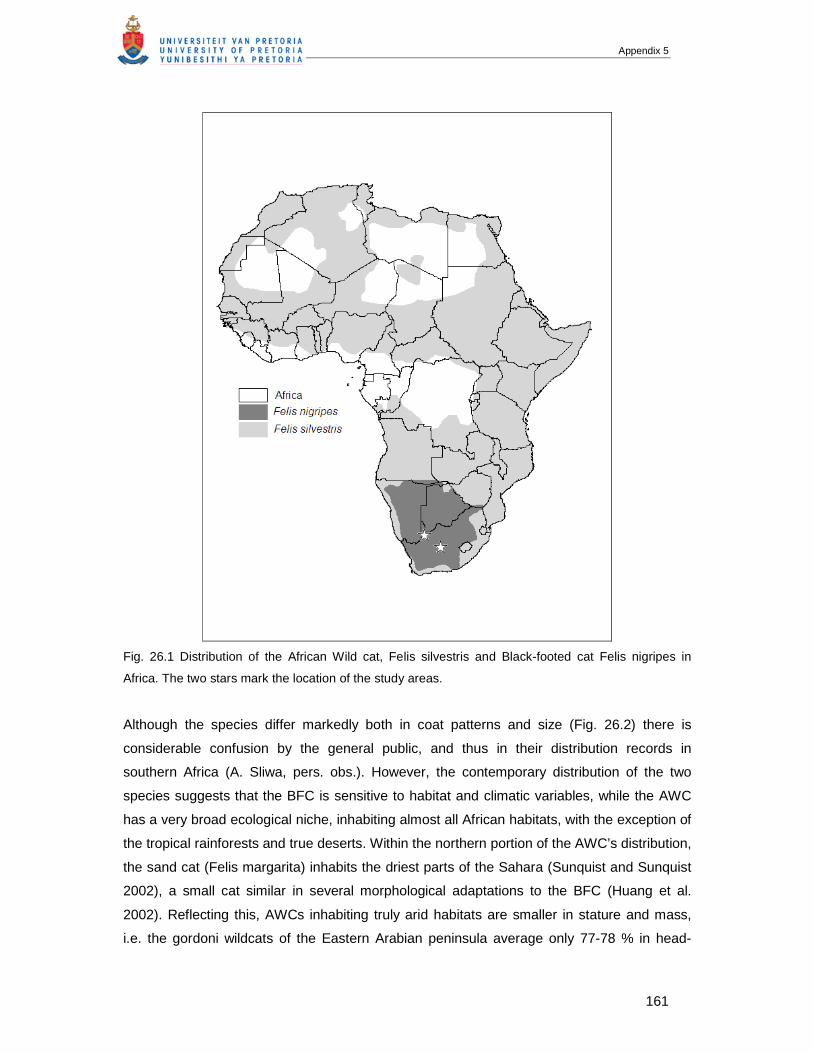
Appendix 5
161
Fig. 26.1 Distribution of the African Wild cat, Felis silvestris and Black-footed cat Felis nigripes in
Africa. The two stars mark the location of the study areas.
Although the species differ markedly both in coat patterns and size (Fig. 26.2) there is
considerable confusion by the general public, and thus in their distribution records in
southern Africa (A. Sliwa, pers. obs.). However, the contemporary distribution of the two
species suggests that the BFC is sensitive to habitat and climatic variables, while the AWC
has a very broad ecological niche, inhabiting almost all African habitats, with the exception of
the tropical rainforests and true deserts. Within the northern portion of the AWC’s distribution,
the sand cat (Felis margarita) inhabits the driest parts of the Sahara (Sunquist and Sunquist
2002), a small cat similar in several morphological adaptations to the BFC (Huang et al.
2002). Reflecting this, AWCs inhabiting truly arid habitats are smaller in stature and mass,
i.e. the gordoni wildcats of the Eastern Arabian peninsula average only 77-78 % in head-

Appendix 5
162
body length (♂♂ 50.3 to 65 cm; ♀♀ 47 to 60 cm) and 51-53% (♂♂ 2.7 kg to 5.1 kg; ♀♀ 2.0
to 3.9 kg) in mass compared to other wildcat subspecies (unpublished data measurements
on F. s. gordoni by Breeding Centre for Endangered Arabian Wildlife, Sharjah, United Arab
Emirates; Phelan and Sliwa 2005; Kalahari silvestris – Herbst unpublished data).
Fig. 26.2 (a) African Wild cat female © M. Herbst
Fig. 26.2 (b) Black-footed cat male © A. Sliwa.

Appendix 5
163
All African Felis species have been little studied (Nowell and Jackson 1996), thus no clear
limitations for their ecological separation have been defined. In this chapter we summarise
what is known about the behaviour and ecology BFCs and AWCs from two intensive field
studies in South Africa and make suggestions for future research and conservation
measures.
26.2 Origin and size
The two cat species belong to the old world domestic cat lineage (Johnson & O’Brien 1997;
Werdelin et al., Chapter 2, this volume), however, the BFC is thought to have diverged from
the other Felis species about three million years ago (Johnson et al. 2006). The wild cat
(Felis silvestris) of Europe, Africa, and Asia has been the subject of continuous taxonomic
debate. Nowell and Jackson (1996) divided wild cats into four groups: (i) the silvestris group
comprising the heavily furred forest cats of Europe and the Caucasus; (ii) the ornata group
including the light-bodied steppe cats of Asia; (iii) the lybica group comprising the long
legged African wild cats of Africa and the near East; and (iv) the domestic cat, Felis silvestris
catus. Genetic analysis confirms that these four groups of ‘wildcats’ are phylogenetically very
close to each other (Pocock 1907; Driscoll et al. 2007; Macdonald et al., Chapter 22, this
volume), and that interbreeding may severely threaten the status of true wild cats. This
process is accelerated by habitat loss and increased contact with human settlement and
associated domestic cats (Macdonald et al. 2004, Yamaguchi et al. 2004a, 2004b,
Macdonald et al., Chapter 22, this volume).
BFCs were shorter (♂♂ = 45 / ♀♀ = 40 cm HB) and smaller in mass (♂♂ = 1.9 / ♀♀ = 1.3 kg)
than AWCs (♂♂ = 65 / ♀♀ = 60 cm HB;♂♂ = 5.1 / ♀♀ = 3.9 kg) in the respective study areas
close to Kimberley and Twee Rivieren, South Africa (Sliwa 2004; Herbst unpublished data),
the difference in body mass being almost threefold. Smaller size allows the BFC to conceal
itself better in very short vegetation and find refuge in burrows of fossorial mammals, most
commonly those of springhares (Pedetes capensis), but also in those of the Cape ground
squirrel (Xerus inauris), South African porcupine (Hystrix africaeaustralis) and aardvark
(Orycteropus afer). In parts of its distribution the BFC utilises abandoned hollow termitaria
(Smithers 1983; Olbricht & Sliwa 1997). In contrast, the Kalahari AWCs spent most of the
day resting under dense bushes and vegetation (85%), holes and caves (11%) and open
shade (4%) (n = 304; observations of cats resting or sleeping before an activity period;
Herbst unpublished data).
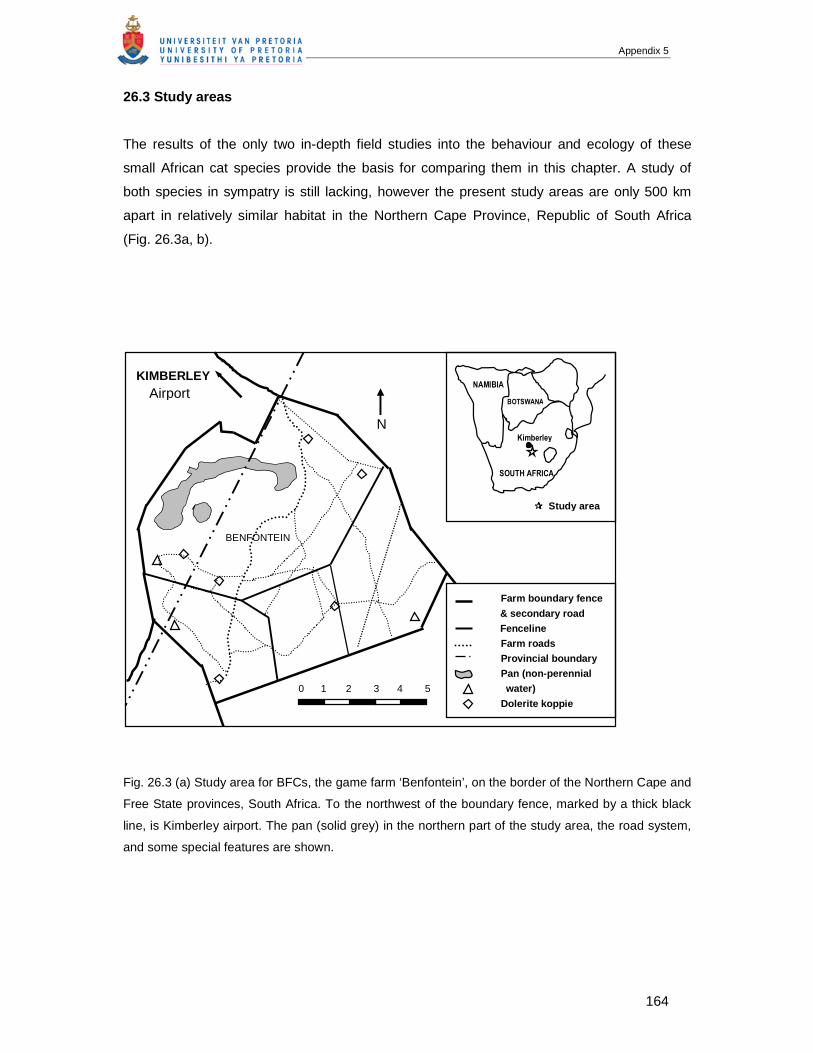
Appendix 5
164
26.3 Study areas
The results of the only two in-depth field studies into the behaviour and ecology of these
small African cat species provide the basis for comparing them in this chapter. A study of
both species in sympatry is still lacking, however the present study areas are only 500 km
apart in relatively similar habitat in the Northern Cape Province, Republic of South Africa
(Fig. 26.3a, b).
Fig. 26.3 (a) Study area for BFCs, the game farm ‘Benfontein’, on the border of the Northern Cape and
Free State provinces, South Africa. To the northwest of the boundary fence, marked by a thick black
line, is Kimberley airport. The pan (solid grey) in the northern part of the study area, the road system,
and some special features are shown.
Airport
BENFONTEIN
KIMBERLEY
N
Farm boundary fence
& secondary road
Fenceline
Farm roads
Provincial boundary
Pan (non-perennial
water)
Dolerite koppie
0 1 2 3 4 5
NAMIBIA
BOTSWANA
SOUTH AFRICA
Kimberley
���� Study area
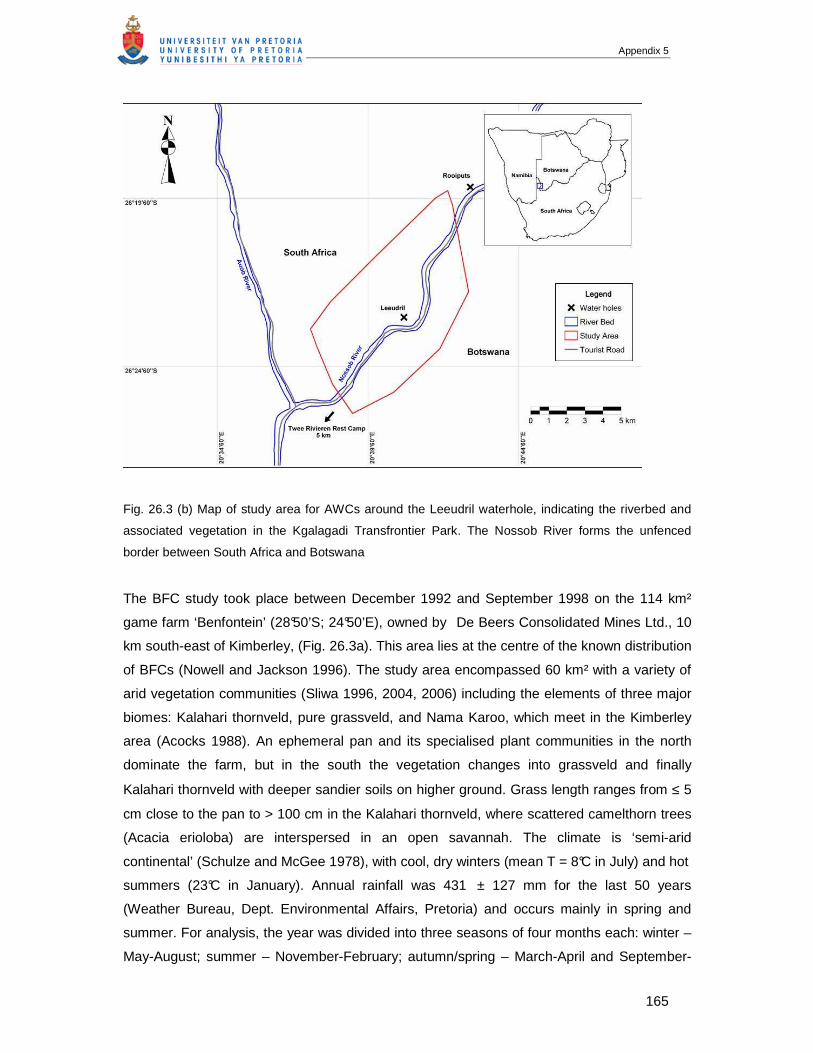
Appendix 5
165
Fig. 26.3 (b) Map of study area for AWCs around the Leeudril waterhole, indicating the riverbed and
associated vegetation in the Kgalagadi Transfrontier Park. The Nossob River forms the unfenced
border between South Africa and Botswana
The BFC study took place between December 1992 and September 1998 on the 114 km²
game farm ‘Benfontein’ (28°50’S; 24°50’E), owned by De Beers Consolidated Mines Ltd., 10
km south-east of Kimberley, (Fig. 26.3a). This area lies at the centre of the known distribution
of BFCs (Nowell and Jackson 1996). The study area encompassed 60 km² with a variety of
arid vegetation communities (Sliwa 1996, 2004, 2006) including the elements of three major
biomes: Kalahari thornveld, pure grassveld, and Nama Karoo, which meet in the Kimberley
area (Acocks 1988). An ephemeral pan and its specialised plant communities in the north
dominate the farm, but in the south the vegetation changes into grassveld and finally
Kalahari thornveld with deeper sandier soils on higher ground. Grass length ranges from ≤ 5
cm close to the pan to > 100 cm in the Kalahari thornveld, where scattered camelthorn trees
(Acacia erioloba) are interspersed in an open savannah. The climate is ‘semi-arid
continental’ (Schulze and McGee 1978), with cool, dry winters (mean T = 8°C in July) and hot
summers (23°C in January). Annual rainfall was 431 ± 127 mm for the last 50 years
(Weather Bureau, Dept. Environmental Affairs, Pretoria) and occurs mainly in spring and
summer. For analysis, the year was divided into three seasons of four months each: winter –
May-August; summer – November-February; autumn/spring – March-April and September-
Appendix 5
166
October. Populations of wild bovids, springbok (Antidorcas marsupialis), blesbok
(Damaliscus dorcas) and black wildebeest (Connochaetes gnou) are harvested at irregular
intervals for sport hunting and are culled for meat, but aside from this, human activity in the
study area is minimal. In the southeastern quarter of the farm, varying numbers of cattle (Bos
taurus dom.) are grazed.
The AWC study was conducted from March 2003 to December 2006 in the Kgalagadi
Transfrontier Park (KTP). The main study area was along the southern part of the Nossob
riverbed and surrounding dune areas (26°28’17.7”S, 20°36’45.2”E) (Fig. 26.3b). The KTP,
incorporating the Kalahari Gemsbok National Park (South Africa) and the neighbouring
Gemsbok National Park (Botswana), is a 37 000 km² area in the semi-arid southern Kalahari
system, which forms part of the South West Arid biotic zone (Eloff 1984). The KTP is a
wilderness area with minimum human impact; only limited tourism activities are present on
two main roads in the riverbeds of the park. Herds of springbok, blue wildebeest
(Connochaetes taurinus), red hartebeest (Alcelaphus buselaphus) and gemsbok (Oryx
gazella) are dominant and large predators such as lion (Panthera leo), leopard (Panthera
pardus), spotted hyaena (Crocuta crocuta), brown hyaena (Hyaena brunnea), and cheetah
(Acinonyx jubatus), and smaller carnivores such as caracal (Caracal caracal), black-backed
jackal (Canis mesomelas), Cape fox (Vulpes chama), honey badger (Mellivora capensis),
small-spotted genet (Genetta genetta) and various raptor species are common in the KTP.
The vegetation of the Kalahari is described by Acocks (1988) as the western form of the
Kalahari thornveld comprising an extremely open scrub savannah. Four main habitat types
were identified and described as: (i) the dry riverbed and immediate surroundings; (ii) the
adjacent Rhigozum veld; (iii) the sandy dune areas; and (iv) the calcrete ridges and
limestone plains. For more detailed descriptions of the vegetation see Bothma and De Graaf
(1973). The study site is characterised by low, irregular rainfall (Mills and Retief 1984),
varying between 200 mm and 250 mm annually. Three seasons are recognised in the KTP:
(i) a hot-wet season (HW) ranging from January to April, with mean monthly temperatures
equal to or greater than 20ºC, with 70% of the annual rainfall falling during this period; (ii) the
cold-dry season (CD) ranging from May to August with mean monthly temperatures below
20ºC and scarce rainfall; and (iii) the hot-dry season (HD) ranging from September to
December with monthly temperatures approximately 20ºC and rainfall generally not more
than 20% of the annual rainfall (Mills and Retief 1984).
Appendix 5
167
26.4 Methods
BFCs were detected with a spot lamp at night, then were either followed to a hole and dug
out by hand, or caught with a net while hiding on the ground. They were also trapped in
specially made wire-cage traps, 30 x 30 x 100 cm, baited with dead birds. BFCs were
anaesthetised by intra-muscular injection of 20 mg/kg ketamine-hydrochloride and 10 mg/kg
acetyl-promazine in order to fit custom-built radio-collars. All radio-transmitters (AVM
Instrument Co., Livermore, CA, USA) operated in the 148-150 MHz frequency range. The
radio-collars weighed 50 g and had a battery life of 6-8 months. Cats were weighed to the
nearest 50 g, measured, and aged based on a combination of tooth wear, body mass,
reproductive condition, and subsequent territorial behaviour. A cat was classified as adult
when it had permanent dentition with slight discolouring or chipping and adult body size and
mass or in females had used nipples. It was classified as subadult if it was independent, had
clean white unchipped teeth and, in females, unused nipples with <1 kg body mass. Resident
adult males spray marked on a regular basis while non-resident males and subadult males
did not. Twenty-one BFCs (six adult males, nine adult females, two subadult females - one
became a resident adult, and four subadult males - three of which became resident adults
during the study) were captured a total of 50 times. Twenty cats were radio-collared but three
collars either stopped transmitting or were dropped after two to six days (Sliwa 2004). The
remaining 17 individuals were each radio-tracked discontinuously over a period of 418 ± 355
days (mean ± SD; range: 16-1254 days).
AWCs were either caught in cage traps (10 cats), or immobilised while free-ranging by using
a dart gun (18 cats). Cage traps (50cm x 50cm x 150cm) were baited with chicken pieces. A
crush plate enabled a hand injection to be administered. AWCs were then immobilised with
25mg/ml Zoletil® (Tiletamine hydrochloride with Benzodiazephine derivative Zolazepam) in
order to fit them with radio-collars. Radio-collars weighing 80-85 g from African Wildlife
Tracking CC. were used, with a battery life of approximately 18 months. Trapping cats with
cage traps did not prove to be very efficient with 1.4% success rate (n = 1244; trap nights =
301). Darting free ranging cats was more effective. It was possible to approach cats with a
vehicle at night and temporarily deprive them of sight them with a spotlight. Qualified
SANParks wildlife veterinarians used a CO2 rifle (Dan-inject JM Standard model) with a
standard dart syringe (10.5 mm; 1.5 ml capacity) and fitted with a stopper to reduce
penetration. Cats were only darted when a clear shot was possible from a distance of 10
meters. Eighteen cats were successfully darted with a combination of drugs
(Butorphanol:Medetomidine and Zoletil:Medetomidine) and antagonists (Naltrexone for
Butorphanol, and Antipamezole for Medetomidine - Zoletil does not have an antidote) (Herbst

Appendix 5
168
et al. in prep). In all cases, a small skin sample, taken from a nick in the ear was collected for
DNA analysis and, if relevant, a radio-collar was fitted. Eight AWCs, consisting of 3 adult
females and 4 adult males and 1 young male were radio-collared.
Cats in both studies were observed directly from a four-wheel-drive vehicle after an initial
habituation period of 1-3 weeks. At night, cats were observed with a low-powered handheld
spot lamp and focal animals were closely followed at a distance of 10 - 100 m. We kept the
beam of the spot lamp slightly behind the cat to avoid illuminating the prey or the cat. When a
prey item was caught the observer attempted to identify it to the species level, where
possible, and its average mass was taken from the literature and museum mammal
collections for later diet analysis (Sliwa 2006, Herbst unpublished data; Tables 26.1, 26.2
and 26.3). Details of the focal cat's behaviour together with the location and length of the
dominant vegetation since the last observation were recorded onto an audio recorder
whenever the cat changed direction or behaviour, or after 15 minutes. Single fixes were also
recorded sporadically. The BFC study included 12 observation periods, each lasting a mean
of 50 ± 29 days. A total of 17 450 fixes was obtained while following BFCs over a distance of
2000 km for 3125 hours, including 1600 hours of direct observation (Sliwa 2004). For AWCs,
10 979 fixes and 1538 hours of direct observations were recorded (Herbst unpublished data).
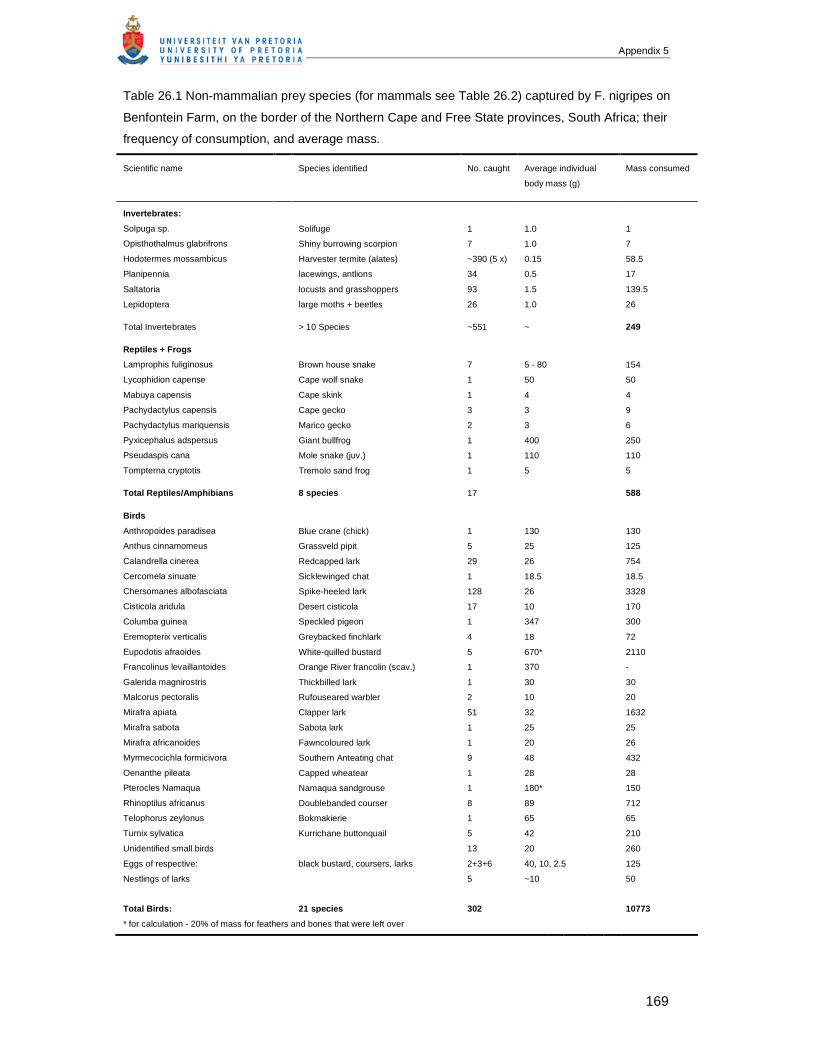
Appendix 5
169
Table 26.1 Non-mammalian prey species (for mammals see Table 26.2) captured by F. nigripes on
Benfontein Farm, on the border of the Northern Cape and Free State provinces, South Africa; their
frequency of consumption, and average mass.
Scientific name Species identified No. caught Average individual
body mass (g)
Mass consumed
Invertebrates:
Solpuga sp. Solifuge 1 1.0 1
Opisthothalmus glabrifrons Shiny burrowing scorpion 7 1.0 7
Hodotermes mossambicus Harvester termite (alates) ~390 (5 x) 0.15 58.5
Planipennia lacewings, antlions 34 0.5 17
Saltatoria locusts and grasshoppers 93 1.5 139.5
Lepidoptera large moths + beetles 26 1.0 26
Total Invertebrates > 10 Species ~551 ~ 249
Reptiles + Frogs
Lamprophis fuliginosus Brown house snake 7 5 - 80 154
Lycophidion capense Cape wolf snake 1 50 50
Mabuya capensis Cape skink 1 4 4
Pachydactylus capensis Cape gecko 3 3 9
Pachydactylus mariquensis Marico gecko 2 3 6
Pyxicephalus adspersus Giant bullfrog 1 400 250
Pseudaspis cana Mole snake (juv.) 1 110 110
Tompterna cryptotis Tremolo sand frog 1 5 5
Total Reptiles/Amphibians 8 species 17 588
Birds
Anthropoides paradisea Blue crane (chick) 1 130 130
Anthus cinnamomeus Grassveld pipit 5 25 125
Calandrella cinerea Redcapped lark 29 26 754
Cercomela sinuate Sicklewinged chat 1 18.5 18.5
Chersomanes albofasciata Spike-heeled lark 128 26 3328
Cisticola aridula Desert cisticola 17 10 170
Columba guinea Speckled pigeon 1 347 300
Eremopterix verticalis Greybacked finchlark 4 18 72
Eupodotis afraoides White-quilled bustard 5 670* 2110
Francolinus levaillantoides Orange River francolin (scav.) 1 370 -
Galerida magnirostris Thickbilled lark 1 30 30
Malcorus pectoralis Rufouseared warbler 2 10 20
Mirafra apiata Clapper lark 51 32 1632
Mirafra sabota Sabota lark 1 25 25
Mirafra africanoides Fawncoloured lark 1 20 26
Myrmecocichla formicivora Southern Anteating chat 9 48 432
Oenanthe pileata Capped wheatear 1 28 28
Pterocles Namaqua Namaqua sandgrouse 1 180* 150
Rhinoptilus africanus Doublebanded courser 8 89 712
Telophorus zeylonus Bokmakierie 1 65 65
Turnix sylvatica Kurrichane buttonquail 5 42 210
Unidentified small birds 13 20 260
Eggs of respective: black bustard, coursers, larks 2+3+6 40, 10, 2.5 125
Nestlings of larks 5 ~10 50
Total Birds: 21 species 302 10773
* for calculation - 20% of mass for feathers and bones that were left over
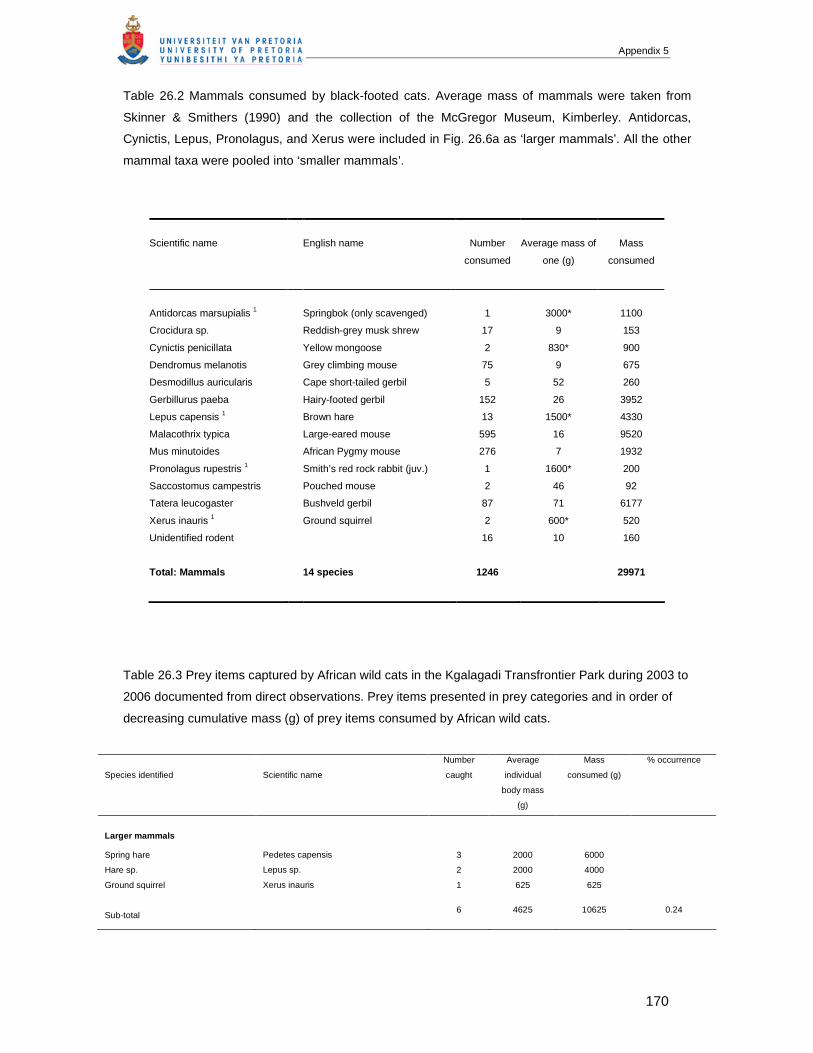
Appendix 5
170
Table 26.2 Mammals consumed by black-footed cats. Average mass of mammals were taken from
Skinner & Smithers (1990) and the collection of the McGregor Museum, Kimberley. Antidorcas,
Cynictis, Lepus, Pronolagus, and Xerus were included in Fig. 26.6a as ‘larger mammals’. All the other
mammal taxa were pooled into ‘smaller mammals’.
Scientific name English name Number
consumed
Average mass of
one (g)
Mass
consumed
Antidorcas marsupialis 1 Springbok (only scavenged) 1 3000* 1100
Crocidura sp. Reddish-grey musk shrew 17 9 153
Cynictis penicillata Yellow mongoose 2 830* 900
Dendromus melanotis Grey climbing mouse 75 9 675
Desmodillus auricularis Cape short-tailed gerbil 5 52 260
Gerbillurus paeba Hairy-footed gerbil 152 26 3952
Lepus capensis 1 Brown hare 13 1500* 4330
Malacothrix typica Large-eared mouse 595 16 9520
Mus minutoides African Pygmy mouse 276 7 1932
Pronolagus rupestris 1 Smith’s red rock rabbit (juv.) 1 1600* 200
Saccostomus campestris Pouched mouse 2 46 92
Tatera leucogaster Bushveld gerbil 87 71 6177
Xerus inauris 1 Ground squirrel 2 600* 520
Unidentified rodent 16 10 160
Total: Mammals 14 species 1246 29971
Table 26.3 Prey items captured by African wild cats in the Kgalagadi Transfrontier Park during 2003 to
2006 documented from direct observations. Prey items presented in prey categories and in order of
decreasing cumulative mass (g) of prey items consumed by African wild cats.
Species identified
Scientific name
Number
caught
Average
individual
body mass
(g)
Mass
consumed (g)
% occurrence
Larger mammals
Spring hare Pedetes capensis 3 2000 6000
Hare sp. Lepus sp. 2 2000 4000
Ground squirrel Xerus inauris 1 625 625
Sub-total 6 4625 10625 0.24
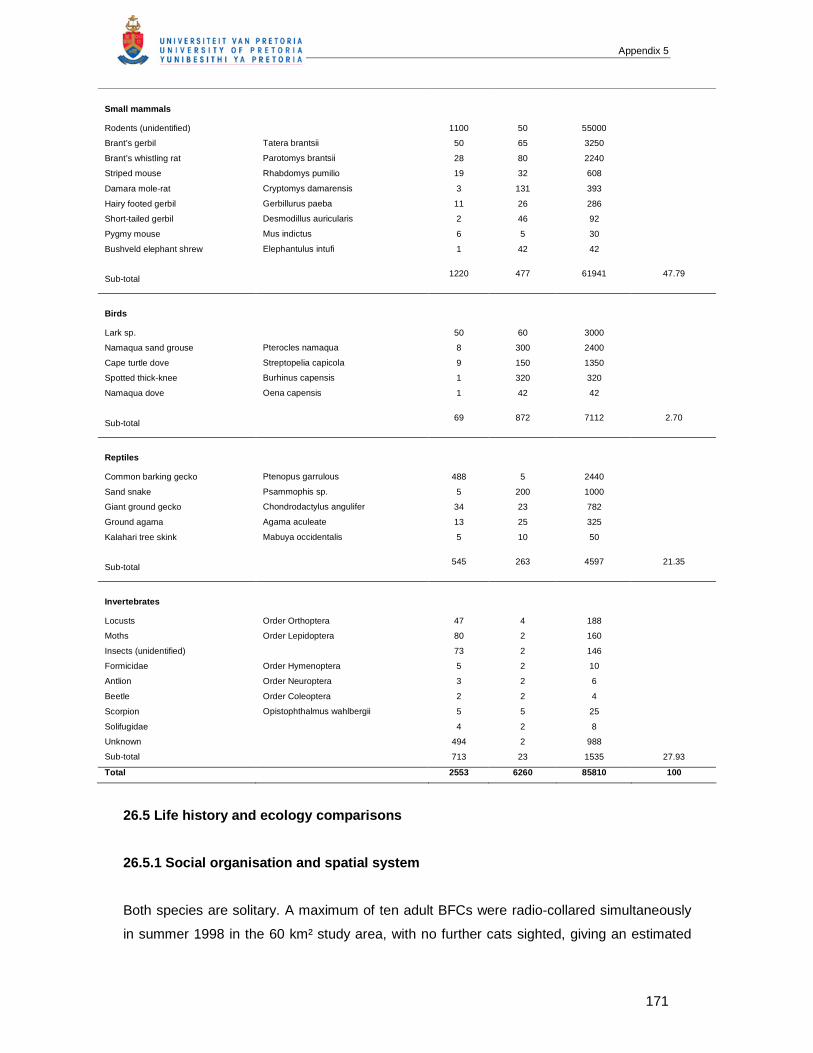
Appendix 5
171
Small mammals
Rodents (unidentified) 1100 50 55000
Brant’s gerbil Tatera brantsii 50 65 3250
Brant’s whistling rat Parotomys brantsii 28 80 2240
Striped mouse Rhabdomys pumilio 19 32 608
Damara mole-rat Cryptomys damarensis 3 131 393
Hairy footed gerbil Gerbillurus paeba 11 26 286
Short-tailed gerbil Desmodillus auricularis 2 46 92
Pygmy mouse Mus indictus 6 5 30
Bushveld elephant shrew Elephantulus intufi 1 42 42
Sub-total 1220 477 61941 47.79
Birds
Lark sp. 50 60 3000
Namaqua sand grouse Pterocles namaqua 8 300 2400
Cape turtle dove Streptopelia capicola 9 150 1350
Spotted thick-knee Burhinus capensis 1 320 320
Namaqua dove Oena capensis 1 42 42
Sub-total 69 872 7112 2.70
Reptiles
Common barking gecko Ptenopus garrulous 488 5 2440
Sand snake Psammophis sp. 5 200 1000
Giant ground gecko Chondrodactylus angulifer 34 23 782
Ground agama Agama aculeate 13 25 325
Kalahari tree skink Mabuya occidentalis 5 10 50
Sub-total 545 263 4597 21.35
Invertebrates
Locusts Order Orthoptera 47 4 188
Moths Order Lepidoptera 80 2 160
Insects (unidentified) 73 2 146
Formicidae Order Hymenoptera 5 2 10
Antlion Order Neuroptera 3 2 6
Beetle Order Coleoptera 2 2 4
Scorpion Opistophthalmus wahlbergii 5 5 25
Solifugidae 4 2 8
Unknown 494 2 988
Sub-total 713 23 1535 27.93
Total 2553 6260 85810 100
26.5 Life history and ecology comparisons
26.5.1 Social organisation and spatial system
Both species are solitary. A maximum of ten adult BFCs were radio-collared simultaneously
in summer 1998 in the 60 km² study area, with no further cats sighted, giving an estimated
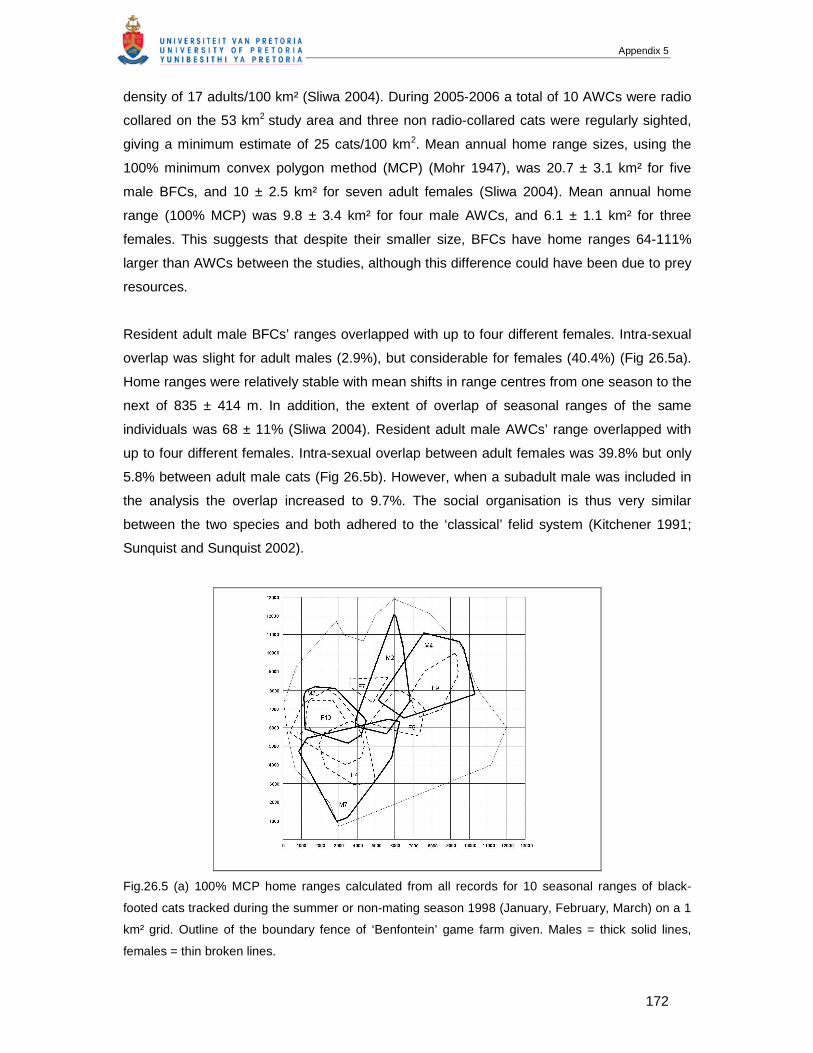
Appendix 5
172
density of 17 adults/100 km² (Sliwa 2004). During 2005-2006 a total of 10 AWCs were radio
collared on the 53 km2 study area and three non radio-collared cats were regularly sighted,
giving a minimum estimate of 25 cats/100 km2. Mean annual home range sizes, using the
100% minimum convex polygon method (MCP) (Mohr 1947), was 20.7 ± 3.1 km² for five
male BFCs, and 10 ± 2.5 km² for seven adult females (Sliwa 2004). Mean annual home
range (100% MCP) was 9.8 ± 3.4 km² for four male AWCs, and 6.1 ± 1.1 km² for three
females. This suggests that despite their smaller size, BFCs have home ranges 64-111%
larger than AWCs between the studies, although this difference could have been due to prey
resources.
Resident adult male BFCs’ ranges overlapped with up to four different females. Intra-sexual
overlap was slight for adult males (2.9%), but considerable for females (40.4%) (Fig 26.5a).
Home ranges were relatively stable with mean shifts in range centres from one season to the
next of 835 ± 414 m. In addition, the extent of overlap of seasonal ranges of the same
individuals was 68 ± 11% (Sliwa 2004). Resident adult male AWCs’ range overlapped with
up to four different females. Intra-sexual overlap between adult females was 39.8% but only
5.8% between adult male cats (Fig 26.5b). However, when a subadult male was included in
the analysis the overlap increased to 9.7%. The social organisation is thus very similar
between the two species and both adhered to the ‘classical’ felid system (Kitchener 1991;
Sunquist and Sunquist 2002).
Fig.26.5 (a) 100% MCP home ranges calculated from all records for 10 seasonal ranges of black-
footed cats tracked during the summer or non-mating season 1998 (January, February, March) on a 1
km² grid. Outline of the boundary fence of ‘Benfontein’ game farm given. Males = thick solid lines,
females = thin broken lines.
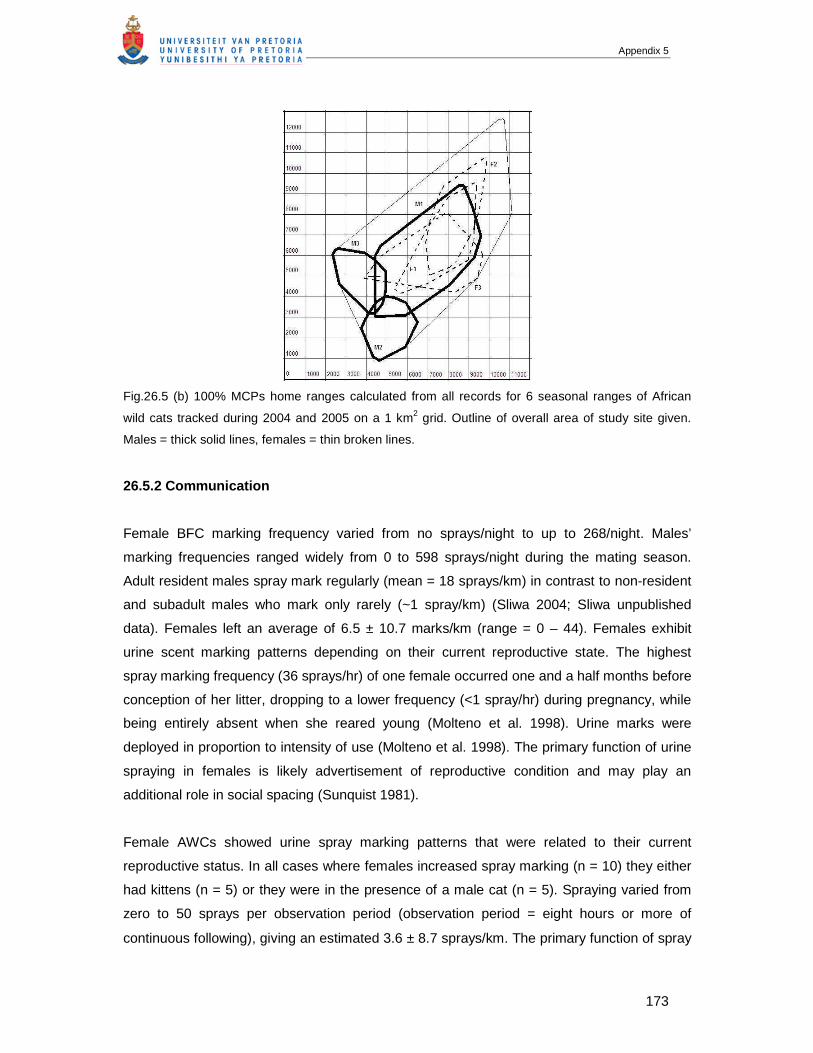
Appendix 5
173
Fig.26.5 (b) 100% MCPs home ranges calculated from all records for 6 seasonal ranges of African
wild cats tracked during 2004 and 2005 on a 1 km2 grid. Outline of overall area of study site given.
Males = thick solid lines, females = thin broken lines.
26.5.2 Communication
Female BFC marking frequency varied from no sprays/night to up to 268/night. Males’
marking frequencies ranged widely from 0 to 598 sprays/night during the mating season.
Adult resident males spray mark regularly (mean = 18 sprays/km) in contrast to non-resident
and subadult males who mark only rarely (~1 spray/km) (Sliwa 2004; Sliwa unpublished
data). Females left an average of 6.5 ± 10.7 marks/km (range = 0 – 44). Females exhibit
urine scent marking patterns depending on their current reproductive state. The highest
spray marking frequency (36 sprays/hr) of one female occurred one and a half months before
conception of her litter, dropping to a lower frequency (<1 spray/hr) during pregnancy, while
being entirely absent when she reared young (Molteno et al. 1998). Urine marks were
deployed in proportion to intensity of use (Molteno et al. 1998). The primary function of urine
spraying in females is likely advertisement of reproductive condition and may play an
additional role in social spacing (Sunquist 1981).
Female AWCs showed urine spray marking patterns that were related to their current
reproductive status. In all cases where females increased spray marking (n = 10) they either
had kittens (n = 5) or they were in the presence of a male cat (n = 5). Spraying varied from
zero to 50 sprays per observation period (observation period = eight hours or more of
continuous following), giving an estimated 3.6 ± 8.7 sprays/km. The primary function of spray
Appendix 5
174
marking for females is probably to advertise their reproductive status to male cats, however,
unlike with BFCs, spray marking was still performed by females raising young. Male AWCs
show much less spatial and seasonal variation in spray marking than females and spraying
ranged from 0 – 183 sprays per observation period and an estimated 13.6 ± 23.5 sprays/km
moved. BFCs are seasonal breeders while AWCs seem to be more opportunistic with
females already coming into oestrous while they are still suckling kittens. Thus the variation
in spray marking between the two species might be explained by a difference in the mating
system.
Male BFCs have a surprisingly loud call, reminiscent to that of a large domestic tomcat, with
calling bouts spaced 10 to 30 minutes apart (n = 19) between July and December, coinciding
with the mating seasons. They usually called after sniffing a urine spray mark, often after
demonstrating flehmen. Female ‘loud’ calling, similar to that of males, was heard only once,
when two competing males moved away from her (Sliwa, unpublished data). The ‘loud’ call
probably supplements spray marking, serving both as spacing and attracting mechanisms
during the brief female oestrous, lasting for only 36 hours (Leyhausen and Tonkin 1966;
Sliwa unpublished data). The tonal frequency is an octave lower than in the larger bodied
Felis species (Peters et al., in press). In addition BFCs utter softer vocalisations while
communicating between mother and kittens and during mating between the male and female
(Sliwa, unpublished data).
Both male and female AWCs have a loud call which is mostly evident when male cats are
calling females and vice versa. The ‘prau’ call described by Dards (1983) and Leyhausen
(1979) is a short, relative high-pitched cry, with a rapid rise in frequency and may be
repeated. As with BFCs, ‘loud’ calling by the male AWCs usually follows after sniffing a urine
spray mark followed by flehmen behaviour. The purpose of these calls is possibly to attract,
advertise receptiveness or establish spacing between cats (Kitchener 1991). On two
occasions male cats uttered a surprising loud whining-singing sound while courting a female.
Females may, in addition, call loudly to kittens after returning from a hunt to locate them in
dense vegetation. Upon reunion much softer vocalisations and rubbing between the mother
and her kittens occurs. Softer vocalisations were also evident during mating between male
and female cats. In summary, both species are not very vocal in general and use
vocalisations in a similar context, although only in brief periods throughout the year.
Appendix 5
175
26.5.3 Reproduction and mating behaviour
Wild BFCs mate between late July and March, leaving only four months where no mating
occurs. The main mating period starts at the end of winter, in July and August (7 of 11 (64%)
matings) resulting in litters born in September/October (Sliwa, unpublished data). One or
more males follow the female, who is receptive for only 36 hours (Leyhausen and Tonkin
1966; Sliwa unpublished data) and copulate up to 10 times (Sliwa, unpublished data; n = 3
mating sequences). After a 63-68 day gestation period (Schürer 1988; Olbricht and Sliwa
1997) an average of two kittens (1 – 4) are born inside a springhare burrow or hollow
termitarium (Smithers 1983; Olbricht and Sliwa 1997). On the day of parturition, females only
leave the maternal den for several hours. However, after four days they will have resumed
their normal routine of hunting throughout the night only returning at dawn to suckle the
kittens (Olbricht and Sliwa 1997), leaving the kittens for up to 10 continuous hours per night.
After their first week, kittens are moved frequently, perhaps to reduce the risk of predation. In
their second month they start to eat solid food and are weaned at two months (Olbricht and
Sliwa 1995). The mother carries prey back to them, both while at the den and later when
kittens are left in patches of long grass waiting for her return. Older kittens are presented with
live prey that they learn to hunt and kill, as observed in cheetahs (Caro 1994). Kittens
become independent at about five months, when their milk dentition is replaced by
permanent dentition. Up to two litters may be raised by a female in a year. One female had
litters in February and then eight months later in October 1994 (Olbricht and Sliwa 1997;
Molteno et al. 1998).
For the AWC no clear seasonality in breeding was evident. However, from all litters (n = 15)
observed during the study period, eight were conceived during the hot-dry seasons, four
during the hot-wet seasons and three in the cold-dry seasons. At the beginning of the study
(2003) food availability was low and no litters were conceived for a 14 month period.
However after an increase in rodent numbers each female produced up to four litters in a 12
month period. An average of 3 kittens (1 – 5) per litter was born, with kittens being born in
dense vegetation, holes in the ground or small crevices in calcrete ridges. Kittens were
moved frequently to new dens. They emerged from the den (n = 5) after 7-10 days, not
wandering further than a few metres. The mother spent most of her time at the den and
made short hunting trips around the den area. As kittens developed the mother stayed away
for extended periods, leaving the kittens in dense vegetation or in close proximity to trees.
Initially she hunted for herself and returned to the den to suckle the kittens. However as
kittens approached five weeks of age she carried live prey back to the kittens. The kittens
played and practised their hunting skills on the stunned prey and either ate it or left the dead
Appendix 5
176
prey for the mother, who ate it or covered the remains. Kittens remained with the mother for
2 to 4 months after which they dispersed.
Males spent on average 1.7 ± 0.5 days (n = 6) with a receptive female while chasing, playing
and courting. Mating involves grabbing the female by the scruff of neck and the female
lunging after successful stimulation (Smithers 1983; Sunquist and Sunquist 2002). Male cats
did not assist in the rearing of kittens although they twice visited females with kittens.
26.5.4 Social interactions
For both species of cats very few intra-specific interactions were observed. Adult BFCs of
opposite sex met rarely (two incidences) outside the mating season, resulting in a brief nose-
to-nose sniff of each other. Agonistic interaction was observed only once between males
during the mating season, where the resident cornered and threatened the transient while
vocalising, however no physical contact took place. A subadult male encountered an adult
female on two occasions, travelled for 300 and 160 m with her while attempting to play.
Because a subadult male is unlikely to approach a strange female we tentatively assume this
interaction was between a mother and offspring. No such visits were recorded while a female
was attending to kittens. A radio-marked subadult male played with another subadult cat on
one occasion (Sliwa, unpublished data). In the AWC older kittens did return to the den (n =
3), especially when litters were born shortly after each other, sometimes within a three month
period. These older kittens played with the younger siblings (observed in two different litters,
in one of which the older kitten returned for three consecutive nights) and joined the mother
on hunting forays. On these occasions the mother did not provide prey to the older kitten,
who hunted its own prey and the older kitten did not return to the den with the mother. No
provisioning of food to younger siblings was observed.
For both species of cats very few intra-specific interactions were observed and AWCs were
solitary except for the short periods (2 – 4 months) when females cared for kittens or during
the brief mating periods, when males trailed receptive females (1-2 days). Twice male cats
visited dens with kittens. The mother remained with the kittens, pulling her ears back and
uttering a soft hissing sound after which the male left. Often in encounters (n = 12), AWCs
may stare at each other for several minutes at a distance without any interactions after which
they walk away from each other. Two males were observed fighting, spitting, scratching and
caterwauling after which they ran away from each other. On three occasions the dominant
male cat in the study area stalked up to smaller subadult male cats and chased them away.
Appendix 5
177
26.5.5 Inter-specific interactions
On five occasions black-backed jackals circled cornered adult BFCs. Each time the BFC
attacked, succeeding in driving the jackal away (Olbricht and Sliwa 1997; A. Sliwa, pers.
obs.). However, kittens and inexperienced subadult cats are more likely to be in danger of
predation, particularly when two jackals are involved. In the three cases this was observed,
both jackals attempted to bite the cat in the back, making it more difficult even for an adult
cat to stand its ground, although no incident of killing was directly observed. Black-backed
jackals also stole hares (Lepus sp) from AWCs on two of the six occasions they were seen to
catch one, having being attracted by the noise of the chase through vegetation (as opposed
to the sounds of the prey – on only one occasion did a hare cry out loud). Afterwards, the cat
successfully took cover in thick vegetation. Although larger mammals such as hares
contribute a large amount of food for an AWC, the pirating of kills (kleptoparasitism) by
jackals probably contributes to the cats’ preference for hunting smaller rodents.
On three occasions in the Kimberley study site, BFCs, on sensing an AWC, squatted low
until the AWC passed without detecting them. Recently two radio-marked adult BFCs were
reported killed by a caracal and one by black-backed jackal (2007, B. Wilson and J. Kamler,
pers. comm.). There were numerous interactions between BFCs with other species resulting
in the investigation of the other species or vice versa with no specific outcome, e.g. aardwolf
(Proteles cristatus), South African hedgehog (Atelerix frontalis), springhare, springbok, and
even ostrich. Once, a male BFC stole a Tatera gerbil kill from a striped polecat (Ictonyx
striatus), by driving it away. Also a marsh owl (Asio capensis) trailed a hunting BFC on three
consecutive nights and captured small birds flushed by it (Sliwa 1994).
On five occasions AWCs avoided larger predators (leopards, lions, cheetahs and caracals)
by running or hiding from them in dense vegetation. There have been records of caracals
and leopards killing and consuming AWCs in the study area (M. Herbst and M.G.L. Mills,
pers. obs.). African wild cats chased away Cape foxes and small-spotted genets on rare
encounters. A giant eagle owl (Bubo lacteus) twice tried to grab a large adult male AWC on
his back while the cat was crossing a clearing in the riverbed. The owl was unable to lift the
cat and the cat then ran into thick vegetation.
26.5.6 Activity cycle and movement patterns
BFCs were strictly crepuscular and nocturnal, with cats leaving and returning to their dens
within 30 minutes of sunset and sunrise (Olbricht and Sliwa 1997). Occasionally, though,
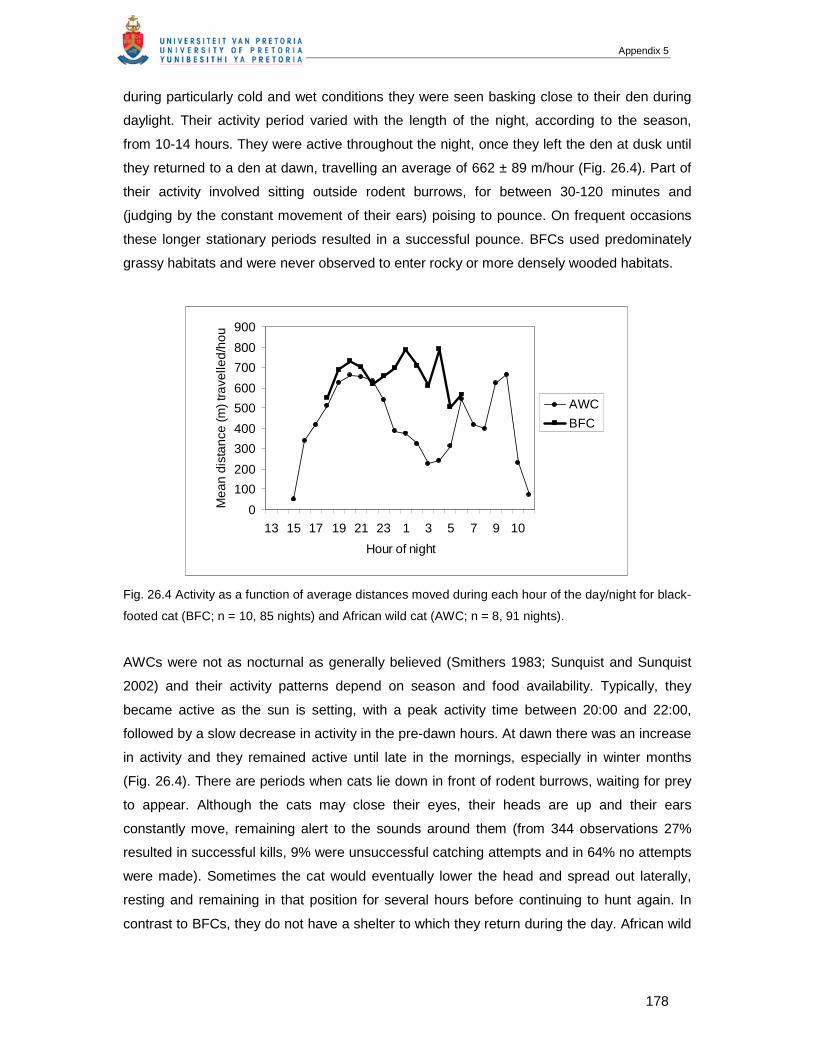
Appendix 5
178
during particularly cold and wet conditions they were seen basking close to their den during
daylight. Their activity period varied with the length of the night, according to the season,
from 10-14 hours. They were active throughout the night, once they left the den at dusk until
they returned to a den at dawn, travelling an average of 662 ± 89 m/hour (Fig. 26.4). Part of
their activity involved sitting outside rodent burrows, for between 30-120 minutes and
(judging by the constant movement of their ears) poising to pounce. On frequent occasions
these longer stationary periods resulted in a successful pounce. BFCs used predominately
grassy habitats and were never observed to enter rocky or more densely wooded habitats.
0
100
200
300
400
500
600
700
800
900
13 15 17 19 21 23 1 3 5 7 9 10
Hour of night
Mea
n di
stan
ce (m
) tra
velle
d/ho
ur
AWC
BFC
Fig. 26.4 Activity as a function of average distances moved during each hour of the day/night for black-
footed cat (BFC; n = 10, 85 nights) and African wild cat (AWC; n = 8, 91 nights).
AWCs were not as nocturnal as generally believed (Smithers 1983; Sunquist and Sunquist
2002) and their activity patterns depend on season and food availability. Typically, they
became active as the sun is setting, with a peak activity time between 20:00 and 22:00,
followed by a slow decrease in activity in the pre-dawn hours. At dawn there was an increase
in activity and they remained active until late in the mornings, especially in winter months
(Fig. 26.4). There are periods when cats lie down in front of rodent burrows, waiting for prey
to appear. Although the cats may close their eyes, their heads are up and their ears
constantly move, remaining alert to the sounds around them (from 344 observations 27%
resulted in successful kills, 9% were unsuccessful catching attempts and in 64% no attempts
were made). Sometimes the cat would eventually lower the head and spread out laterally,
resting and remaining in that position for several hours before continuing to hunt again. In
contrast to BFCs, they do not have a shelter to which they return during the day. African wild
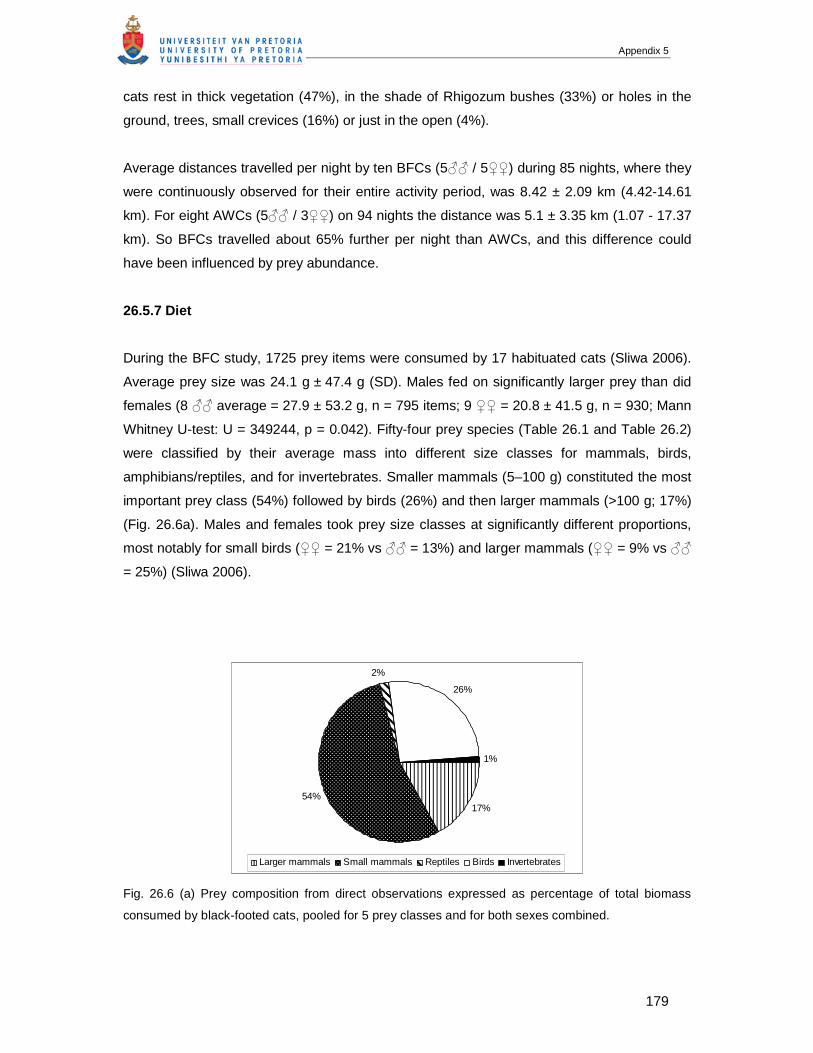
Appendix 5
179
cats rest in thick vegetation (47%), in the shade of Rhigozum bushes (33%) or holes in the
ground, trees, small crevices (16%) or just in the open (4%).
Average distances travelled per night by ten BFCs (5♂♂ / 5♀♀) during 85 nights, where they
were continuously observed for their entire activity period, was 8.42 ± 2.09 km (4.42-14.61
km). For eight AWCs (5♂♂ / 3♀♀) on 94 nights the distance was 5.1 ± 3.35 km (1.07 - 17.37
km). So BFCs travelled about 65% further per night than AWCs, and this difference could
have been influenced by prey abundance.
26.5.7 Diet
During the BFC study, 1725 prey items were consumed by 17 habituated cats (Sliwa 2006).
Average prey size was 24.1 g ± 47.4 g (SD). Males fed on significantly larger prey than did
females (8 ♂♂ average = 27.9 ± 53.2 g, n = 795 items; 9 ♀♀ = 20.8 ± 41.5 g, n = 930; Mann
Whitney U-test: U = 349244, p = 0.042). Fifty-four prey species (Table 26.1 and Table 26.2)
were classified by their average mass into different size classes for mammals, birds,
amphibians/reptiles, and for invertebrates. Smaller mammals (5–100 g) constituted the most
important prey class (54%) followed by birds (26%) and then larger mammals (>100 g; 17%)
(Fig. 26.6a). Males and females took prey size classes at significantly different proportions,
most notably for small birds (♀♀ = 21% vs ♂♂ = 13%) and larger mammals (♀♀ = 9% vs ♂♂
= 25%) (Sliwa 2006).
17%54%
2%
26%
1%
Larger mammals Small mammals Reptiles Birds Invertebrates
Fig. 26.6 (a) Prey composition from direct observations expressed as percentage of total biomass
consumed by black-footed cats, pooled for 5 prey classes and for both sexes combined.
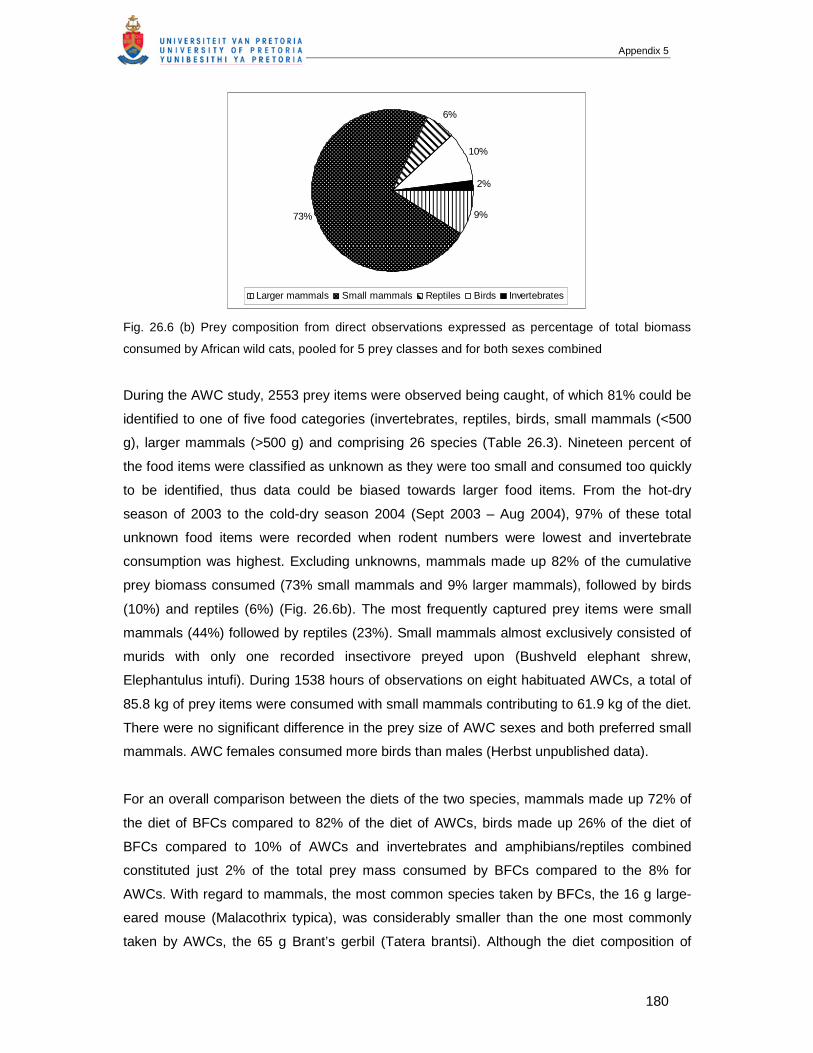
Appendix 5
180
9%73%
10%
2%
6%
Larger mammals Small mammals Reptiles Birds Invertebrates
Fig. 26.6 (b) Prey composition from direct observations expressed as percentage of total biomass
consumed by African wild cats, pooled for 5 prey classes and for both sexes combined
During the AWC study, 2553 prey items were observed being caught, of which 81% could be
identified to one of five food categories (invertebrates, reptiles, birds, small mammals (<500
g), larger mammals (>500 g) and comprising 26 species (Table 26.3). Nineteen percent of
the food items were classified as unknown as they were too small and consumed too quickly
to be identified, thus data could be biased towards larger food items. From the hot-dry
season of 2003 to the cold-dry season 2004 (Sept 2003 – Aug 2004), 97% of these total
unknown food items were recorded when rodent numbers were lowest and invertebrate
consumption was highest. Excluding unknowns, mammals made up 82% of the cumulative
prey biomass consumed (73% small mammals and 9% larger mammals), followed by birds
(10%) and reptiles (6%) (Fig. 26.6b). The most frequently captured prey items were small
mammals (44%) followed by reptiles (23%). Small mammals almost exclusively consisted of
murids with only one recorded insectivore preyed upon (Bushveld elephant shrew,
Elephantulus intufi). During 1538 hours of observations on eight habituated AWCs, a total of
85.8 kg of prey items were consumed with small mammals contributing to 61.9 kg of the diet.
There were no significant difference in the prey size of AWC sexes and both preferred small
mammals. AWC females consumed more birds than males (Herbst unpublished data).
For an overall comparison between the diets of the two species, mammals made up 72% of
the diet of BFCs compared to 82% of the diet of AWCs, birds made up 26% of the diet of
BFCs compared to 10% of AWCs and invertebrates and amphibians/reptiles combined
constituted just 2% of the total prey mass consumed by BFCs compared to the 8% for
AWCs. With regard to mammals, the most common species taken by BFCs, the 16 g large-
eared mouse (Malacothrix typica), was considerably smaller than the one most commonly
taken by AWCs, the 65 g Brant’s gerbil (Tatera brantsi). Although the diet composition of
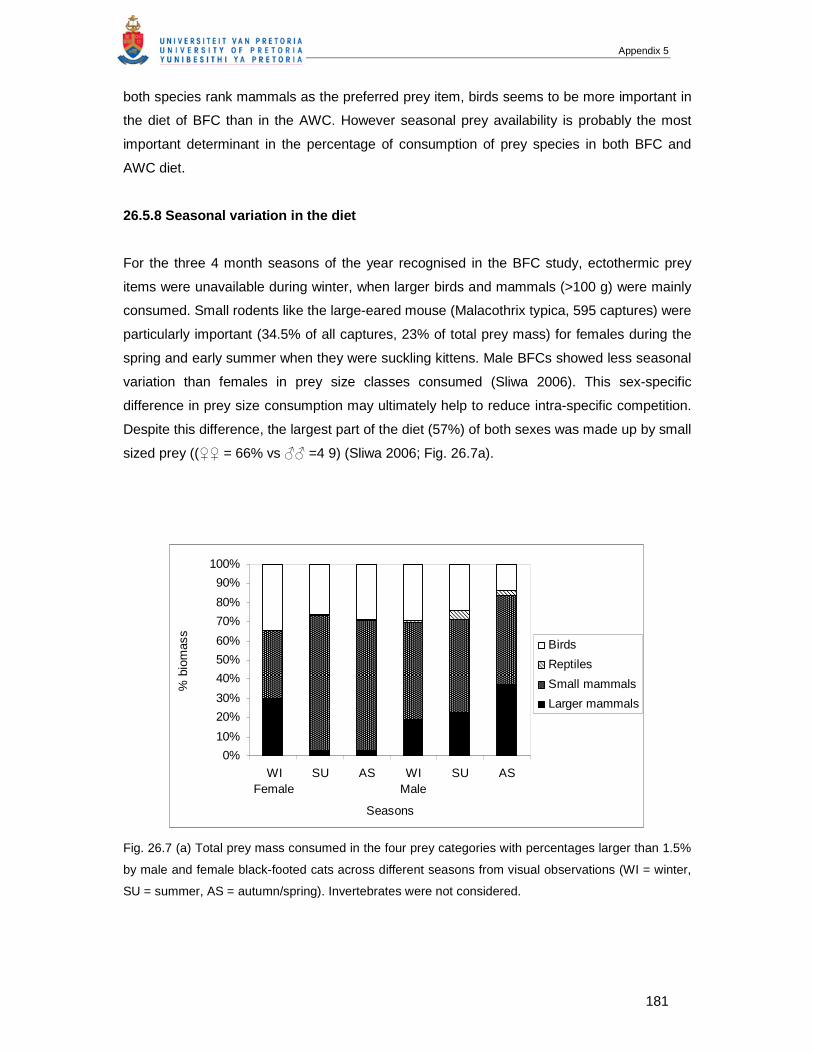
Appendix 5
181
both species rank mammals as the preferred prey item, birds seems to be more important in
the diet of BFC than in the AWC. However seasonal prey availability is probably the most
important determinant in the percentage of consumption of prey species in both BFC and
AWC diet.
26.5.8 Seasonal variation in the diet
For the three 4 month seasons of the year recognised in the BFC study, ectothermic prey
items were unavailable during winter, when larger birds and mammals (>100 g) were mainly
consumed. Small rodents like the large-eared mouse (Malacothrix typica, 595 captures) were
particularly important (34.5% of all captures, 23% of total prey mass) for females during the
spring and early summer when they were suckling kittens. Male BFCs showed less seasonal
variation than females in prey size classes consumed (Sliwa 2006). This sex-specific
difference in prey size consumption may ultimately help to reduce intra-specific competition.
Despite this difference, the largest part of the diet (57%) of both sexes was made up by small
sized prey ((♀♀ = 66% vs ♂♂ =4 9) (Sliwa 2006; Fig. 26.7a).
0%
10%
20%
30%
40%
50%
60%
70%
80%
90%
100%
WIFemale
SU AS WIMale
SU AS
Seasons
% b
iom
ass
Birds
Reptiles
Small mammals
Larger mammals
Fig. 26.7 (a) Total prey mass consumed in the four prey categories with percentages larger than 1.5%
by male and female black-footed cats across different seasons from visual observations (WI = winter,
SU = summer, AS = autumn/spring). Invertebrates were not considered.
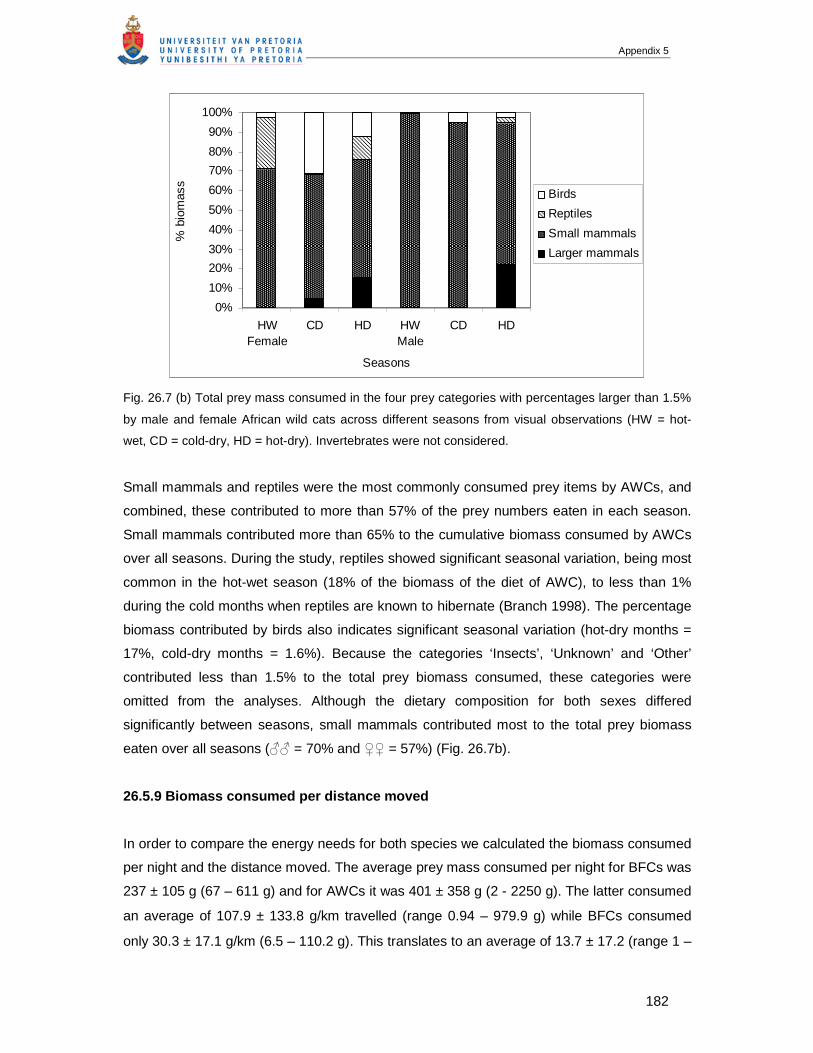
Appendix 5
182
0%
10%
20%
30%
40%
50%
60%
70%
80%
90%
100%
HWFemale
CD HD HWMale
CD HD
Seasons
% b
iom
ass
Birds
Reptiles
Small mammals
Larger mammals
Fig. 26.7 (b) Total prey mass consumed in the four prey categories with percentages larger than 1.5%
by male and female African wild cats across different seasons from visual observations (HW = hot-
wet, CD = cold-dry, HD = hot-dry). Invertebrates were not considered.
Small mammals and reptiles were the most commonly consumed prey items by AWCs, and
combined, these contributed to more than 57% of the prey numbers eaten in each season.
Small mammals contributed more than 65% to the cumulative biomass consumed by AWCs
over all seasons. During the study, reptiles showed significant seasonal variation, being most
common in the hot-wet season (18% of the biomass of the diet of AWC), to less than 1%
during the cold months when reptiles are known to hibernate (Branch 1998). The percentage
biomass contributed by birds also indicates significant seasonal variation (hot-dry months =
17%, cold-dry months = 1.6%). Because the categories ‘Insects’, ‘Unknown’ and ‘Other’
contributed less than 1.5% to the total prey biomass consumed, these categories were
omitted from the analyses. Although the dietary composition for both sexes differed
significantly between seasons, small mammals contributed most to the total prey biomass
eaten over all seasons (♂♂ = 70% and ♀♀ = 57%) (Fig. 26.7b).
26.5.9 Biomass consumed per distance moved
In order to compare the energy needs for both species we calculated the biomass consumed
per night and the distance moved. The average prey mass consumed per night for BFCs was
237 ± 105 g (67 – 611 g) and for AWCs it was 401 ± 358 g (2 - 2250 g). The latter consumed
an average of 107.9 ± 133.8 g/km travelled (range 0.94 – 979.9 g) while BFCs consumed
only 30.3 ± 17.1 g/km (6.5 – 110.2 g). This translates to an average of 13.7 ± 17.2 (range 1 –
Appendix 5
183
113) prey items captured by AWCs per night compared with 12.4 ± 5.3 (range 2 – 26)
captured by BFCs. While the number of prey items caught per night is similar for the species,
the difference in biomass consumed per kilometre travelled is 3.5 fold. When this is
calculated for the two species per kg body mass, it is 18.9 g/km/kg of cat for BFCs (mean =
1.6 kg body mass for sexes pooled) and 24 g/km/kg for AWCs (mean 4.5 kg), a 38.6 %
higher prey mass consumption per km and kg body mass.
During the hot-dry (HD) and hot-wet (HW) seasons, AWCs consumed more biomass per
kilometre than during the cold-dry (CD) season (HD = 130.3 ± 177 g/km, HW = 107.8 ± 105.6
g/km, CD = 75.8 ± 48.4 g/km). However during the winter (i.e. CD) months the cats travel
further per observation period (eight hours or more of continuous observations) (HD = 4.2 ±
2.5 km, HW = 4.8 ± 4.2 km and CD = 6.5 ± 3.4 km) and they are active over a longer period,
including early afternoons and late mornings. BFCs consumed similar biomass per kilometre
during all seasons (summer = 31.1 ± 15.7 g/km, winter = 29.5 ± 22.3 g/km, autumn/spring =
30.2 ± 14 g/km). BFCs travelled similar distances in all seasons (summer = 8.9 ± 2.1 km,
winter = 8.7 ± 2.3 km, autumn/spring = 7.8 ± 1.8 km).
26.6 Conclusions and recommendations
We compared BFCs with AWCs to see if body size differences might also explain differences
in the life history and ecology of these two small felid species (Table 26.4). Observed
differences between the species may also reflect the environmental differences of the study
areas and also the rainfall patterns of the study periods. Some possible but as yet not fully
tested hypotheses are discussed below.
Both cats are mainly nocturnal, however AWCs are more flexible and hunt during daylight.
BFCs have a set activity period from dusk till dawn and return to rest mostly within dens
during daylight. This may reduce predation risk by diurnal raptors as well as persistent
mobbing of BFCs by passerine birds, the latter seen often when they travel at dusk and dawn
(Olbricht and Sliwa 1997). Although AWCs in the Kalahari face similar predation risks with
even larger predators present, their larger body size may be more advantageous for hunting
in daylight hours, possibly being less susceptible to diurnal raptor predation. Alternatively, a
more diurnal activity regime might reduce inter-specific competition since the AWC is part of
a carnivore guild of various smaller and similar sized carnivores in the Kalahari.
In many predator studies prey abundances and availability have been found to be a crucial
factor in facilitating and determining distributions and co-existence (Creel and Creel 1996;
Appendix 5
184
Durant 1998; Karanth and Sunquist 2000). BFCs and AWCs fed mainly on mammalian prey
between 5 – 100 g. There was however a difference between the most frequently captured
prey species. BFCs hunted mostly large-eared mice (Malacothrix typica) (mean = 16 g)
(Sliwa 2006), whereas AWCs took Brant’s gerbil (Tatera brantsi) (65 g). Expressed as prey
mass per unit kilogram of cat, BFCs took 10 g of prey and AWCs 14.4 g of prey. Both
species consumed a similar number of prey items each night, therefore the fact that the most
commonly available rodent eaten by AWCs was larger than that eaten by BFCs resulted in a
larger biomass consumed by AWCs. However, when comparing the percentage biomass
consumed per unit (kg) body mass of cat, BFCs consumed 14.9% of their body mass per
night compared to 8.9% for AWCs. This is probably due to the higher metabolism related to
smaller body size in BFCs, and the need to cover longer distances per night to capture
enough prey to sustain their energy needs. Despite the strong seasonal variation in biomass
consumed per distance moved by AWCs (76-130 g/km), even the lowest prey mass
consumed in the cold winter season by AWCs was 2.5 times that consumed by BFCs (30
g/km) (Table 26.4).
The distribution of BFCs may be influenced by the availability and abundance of certain prey
species and prey sizes (i.e. the large eared mouse is absent in the Kalahari ecosystem and
AWC study site). One could describe the BFC as a habitat specialist that shows a preference
for grassland and avoids wooded or rocky areas. It moves further per night, while consuming
less biomass per distance than the AWC. This is reflected in the larger annual home ranges
and distances travelled per night of BFCs. Alternatively, these differences could have been
due to differences in prey abundance between sites.
BFCs consumed more birds (26%) in comparison to AWCs (10%), probably resulting from
their smaller size and agility, and being able to conceal themselves better in short vegetation.
Thus, a greater abundance of small birds in a habitat may favour BFCs over AWCs. Although
we could not compare bird abundance on each site, the body size of a cat may be negatively
correlated with hunting success of small birds as demonstrated in the differential hunting
success by BFC sexes. However, AWCs may not need to supplement their diet with birds
and the larger sized and more abundant rodents might be sufficient for their dietary
requirements. During seasons with low rodent numbers in the Kalahari AWCs changed their
diet accordingly and took more invertebrates and reptiles during the warmer seasons than
BFCs and, to a lesser extent, birds. Seasonal variation in the Kalahari contributed largely to
differences in AWC diet and the biomass consumed per night, with less seasonal variation in
the BFC study.
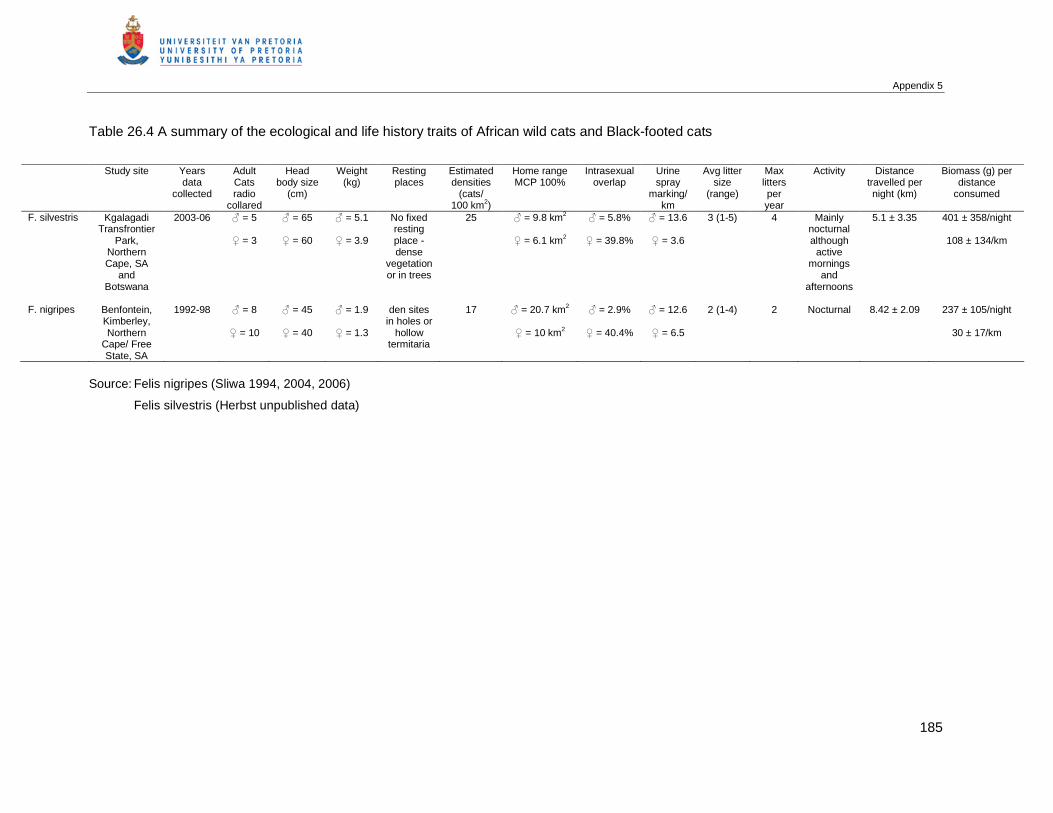
Appendix 5
185
Table 26.4 A summary of the ecological and life history traits of African wild cats and Black-footed cats
Study site Years data
collected
Adult Cats radio
collared
Head body size
(cm)
Weight (kg)
Resting places
Estimated densities
(cats/ 100 km2)
Home range MCP 100%
Intrasexual overlap
Urine spray
marking/km
Avg litter size
(range)
Max litters per year
Activity Distance travelled per night (km)
Biomass (g) per distance
consumed
F. silvestris Kgalagadi Transfrontier
Park, Northern Cape, SA
and Botswana
2003-06 ♂ = 5
♀ = 3
♂ = 65
♀ = 60
♂ = 5.1
♀ = 3.9
No fixed resting place - dense
vegetation or in trees
25 ♂ = 9.8 km2
♀ = 6.1 km2
♂ = 5.8%
♀ = 39.8%
♂ = 13.6
♀ = 3.6
3 (1-5) 4 Mainly nocturnal although
active mornings
and afternoons
5.1 ± 3.35 401 ± 358/night
108 ± 134/km
F. nigripes Benfontein,
Kimberley, Northern
Cape/ Free State, SA
1992-98 ♂ = 8
♀ = 10
♂ = 45
♀ = 40
♂ = 1.9
♀ = 1.3
den sites in holes or
hollow termitaria
17 ♂ = 20.7 km2
♀ = 10 km2
♂ = 2.9%
♀ = 40.4%
♂ = 12.6
♀ = 6.5
2 (1-4) 2 Nocturnal 8.42 ± 2.09 237 ± 105/night
30 ± 17/km
Source: Felis nigripes (Sliwa 1994, 2004, 2006)
Felis silvestris (Herbst unpublished data)
Appendix 5
186
BFCs consumed more birds (26%) in comparison to AWCs (10%), probably resulting from
their smaller size and agility, and being able to conceal themselves better in short vegetation.
Thus, a greater abundance of small birds in a habitat may favour BFCs over AWCs. Although
we could not compare bird abundance on each site, the body size of a cat may be negatively
correlated with hunting success of small birds as demonstrated in the differential hunting
success by BFC sexes. However, AWCs may not need to supplement their diet with birds
and the larger sized and more abundant rodents might be sufficient for their dietary
requirements. During seasons with low rodent numbers in the Kalahari AWCs changed their
diet accordingly and took more invertebrates and reptiles during the warmer seasons than
BFCs and, to a lesser extent, birds. Seasonal variation in the Kalahari contributed largely to
differences in AWC diet and the biomass consumed per night, with less seasonal variation in
the BFC study.
The AWC was possibly better able to respond reproductively to temporary food restrictions
and super abundances than the BFC, although a climatic variation between sites confounds
this data. AWCs have larger litter sizes and may raise up to 4 litters per year, while
reproduction can fail entirely in years with low prey abundance. Data for comparisons from
the BFC is still lacking. AWC mothers take short hunting trips around the den, while female
BFCs may need to travel longer distances to capture sufficient prey for their dependent
offspring.
26.7 Research gaps in relation to conservation management
Both species were influenced by the presence of competitors and predators. A high density
of mesocarnivores like jackals and caracal would both result in harassment, pirating of kills
and even intra-guild predation. This has been observed in other predator guilds (Palomares
and Caro 1999) specifically between foxes (Vulpes macrotis, V. velox, V. vulpes) and
coyotes (Canis latrans) (Moehrenschlager and List 1996) and for large felids between tiger
(Panthera tigris) and leopard (Seidensticker 1976) and among cheetah, lion and leopard
(Caro 1994), but recently also proposed for smaller felid guilds in tropical America comprised
of ocelot and oncilla (Leopardus pardalis, L. tigrinus,) (de Oliveira et al., Chapter 27, this
volume). In South African farming communities where livestock depredation occurs, densities
of jackals and caracals are regulated through predator control. In the protected area of the
southern Kalahari there is little interference from human activities and predator numbers are
mainly regulated by available food resources (Mills 1990).
Appendix 5
187
Increasing human impact, through population growth and changes in land use patterns
(small holdings farming, irrigation, overgrazing), may also affect the two cat species
differently. The BFC avoids human contact (Olbricht and Sliwa 1997; Sliwa 2004), while a
male AWC radio-monitored in the same study area stayed close to permanent water and
human habitation (Sliwa, unpublished data). However, if species like jackals and caracals are
removed from small stock farming areas this may be to the advantage of small cats
especially the BFC. The AWC seems to have a higher tolerance to human-modified habitats,
and may profit from increasing rodent populations associated with farming, however it may
also be threatened in its genetic integrity through hybridisation (Nowell & Jackson 1996,
Yamaguchi et al. 2004b) and disease transfer (Mendelssohn 1989; Macdonald et al. 2004)
from domestic cats associated with man.
Studies of smaller African felids are in their infancy, especially within their carnivore guild. A
number of key questions arise from our comparative research: (1) what are the maximum
levels of habitat loss, degradation and fragmentation both species could tolerate? (2) What
influences the distribution of the BFC – when does competition pressure from potential
predators and competitors become too high, leading to its exclusion from certain areas? (3)
Is conservation management for both species similar or mutually exclusive? (4) Could AWCs
negatively affect BFC numbers, especially given this behaviour among other felid species?
There is an urgent need for comparative studies of small felids in order to address specific
conservation questions. We trust that our studies will both contribute to the basic
understanding of BFC and AWC ecology, as well as provide the baseline data for future
research and conservation measures for small African felid studies.
Acknowledgements
The BFC study was funded by: Endangered Wildlife Trust, South Africa; San Diego
Zoological Society, Chicago Zoological Society, Columbus Zoo, John Ball Zoo Society,
Project Survival in the USA; International Society for Endangered Cats and Mountain View
Farms in Canada; People’s Trust for Endangered Species in the U.K. and Wuppertal
Zoological Garden, Germany. We thank De Beers Consolidated Mines for permission to work
on Benfontein Farm. Beryl Wilson, Arne Lawrenz, Gershom Aitchison, Enrico Oosthuysen,
Gregory and Nicola Gibbs, and Andrew Molteno helped with capturing and tracking cats.
The AWC study was funded by the Endangered Wildlife Trust’s Carnivore Conservation
Group, Elizabeth Wakeman Henderson Charitable Foundation and the Kaplan Award
Program from the Wildlife Conservation Society. We are grateful to South African National
Appendix 5
188
Parks, Department of Wildlife and National Parks, Botswana (Kgalagadi Transfrontier Park)
and the Mammal Research Institute, University of Pretoria.
We thank Chris and Mathilde Stuart for data on African wild cat distribution on the African
continent (Fig. 26.1) and the two editors of this volume, as well as Mike Daniels, Nobuyuki
Yamaguchi and one anonymous reviewer who greatly improved on the quality of our
manuscript.
References
Acocks JHP (1988). Veld types of South Africa. Mem. Bot. Survey S. Afr. 40, 1-128.
Bothma J Du P and De Graaff G (1973). A habitat map of the Kalahari Gemsbok National
Park. Koedoe 16, 181-188.
Branch B (1998). Field Guide to Snakes and other Reptiles of southern Africa. (3rd ed).
Struik Publishers (Pty) Ltd. South Africa.
Caro TM (1994). Cheetahs of the Serengeti Plains: Group Living in an Asocial Species.
Wildlife Behavior and Ecology series. 500 p.
Creel S and Creel NM (1996). Limitation of African wild dogs by competition with large
carnivores. Conservation Biology 10, 526-538.
Dards, JL (1983). The behaviour of dockyard cats: interactions of adult males. Applied
Animal Ethology 10, 133-153.
Driscoll CA, Menotti-Raymond M, Roca AL, Hupe K, Johnson WE, Geffen E, Harley E,
Delibes M, Pontier D, Kitchener AC, Yamaguchi N, O’Brien SJ and Macdonald D (2007). The
Near Eastern Origin of Cat Domestication. Science 317, 519-523.
Durant SM (1988). Competition refuges and coexistence: an example from Serengeti
carnivores. Journal of Animal Ecology 87, 370-386.
Eloff FC (1984). The Kalahari ecosystem. Koedoe (Suppl.) 1984, 11-20.
Appendix 5
189
Karanth KS and Sunquist ME (2000). Behavioural correlates of predation by tiger (Panthera
tigris), leopard, (Panthera pardus) and dhole (Cuon alpinus) in Nagarahole, India. Journal
Zoology, London 250, 255-265.
Kitchener A (1991). Roaring, Screaming and Purring. Scientific American (Oct), 107-108.
Huang GT, Rosowski JJ, Ravicz ME, Peake WT (2002). Mammalian ear specializations in
arid habitats: structural and functional evidence from sand cat (Felis margarita). Journal of
Comparative Physiology A: Sensory, Neural, and Behavioral Physiology 188, 663-681.
Johnson WE and O’Brien SJ (1997). Phylogenetic reconstruction of the Felidae using 16s
rRNA and NADH-5 mitochondrial genes. Journal of Molecular Evolution 44 (suppl.), 98-116.
Johnson WE, Eizirik E, Pecon-Slattery J, Murphy WJ, Antunes A, Teelig E and SJ O’Brien SJ
(2006). The late Miocene radiation of modern Felidae: a genetic assessment. Science 311,
73-77.
Leistner OA (1967). The plant ecology of the southern Kalahari. Mem. Bot. Surv. S. Afr. 38,
1-172.
Leyhausen P (1979). Cat Behaviour: The Predatory and Social Behaviour of Domestic and
Wildcats. Garland STPM Press, New York, NY.
Leyhausen P and Tonkin B (1966). Breeding the Black-footed cat (Felis nigripes). Int Zoo
Yearbook 6,178-182.
Macdonald, D.W., Daniels, M.J., Driscoll, C., Kitchener, A.C. & Yamaguchi, N. (2004). The
Scottish Wildcat: Analyses for Conservation and an Action Plan. Wildlife Conservation
Research Unit, Oxford.
Mendelssohn H (1989). Felids in Israel. Cat News 10, 2-4, Bougy-Villars, Switzerland.
Mills MGL (1990). Kalahari hyenas. Comparative Behavioural Ecology of Two Species. The
Blackburn Press.
Mills MGL and Retief PF (1984). The response of ungulates to rainfall along riverbeds of the
southern Kalahari, 1972-1982. Koedoe (Suppl.) 1984, 129-142.
Appendix 5
190
Moehrenschlager A, Cypher BL, Ralls K., List R and Sovada MA (2004). Swift and kit foxes,
comparative ecology and conservation priorities of swift and kit foxes. In. Macdonald, D.W.
and C.Sillero-Zubiri: The biology and conservation of wild canids. Oxford University Press,
Oxford, UK, 450 pp.
Mohr CO (1947). Table of equivalent populations of North American small mammals.
American Midland Naturalist 37, 223-249.
Molteno AJ, Sliwa A and Richardson PRK (1998). The role of scent marking in a free-
ranging, female black-footed cat (Felis nigripes). Journal of Zoology London 245, 35-41.
Nel JAJ, Rautenbach IL, Els DA and De Graaf G (1984). The rodents and other small
mammals of the Kalahari Gemsbok Naional Park. Koedoe Suppl. 1984, 195-220.
Nowell K and Jackson P (1996). Wild cats: status survey and conservation action plan.
Gland: IUCN.
Olbricht G and Sliwa A (1995). Analyse der Jugendentwicklung von Schwarzfußkatzen (Felis
nigripes) im Zoologischen Garten Wuppertal im Vergleich zur Literatur. D. Zool. Garten (N.F.)
65, 224-236. (English translation: Comparative development of juvenile black-footed cats at
Wuppertal Zoo and elsewhere in Int. Studbook for the Black-footed Cat 1995, Zool. Garten
der Stadt Wuppertal: 8-20.)
Olbricht G and Sliwa A (1997). In situ and ex situ observations and management of Black-
footed cats Felis nigripes. Int. Zoo Yb. 35, 81-89.
Palomares F and Caro TM (1999). Interspecific killing among mammalian carnivores.
American Naturalist 153, 492-508.
Peters G, Baum L, Peters MK, and Tonkin-Leyhausen B (in press). Spectral characteristics
of intensive mew calls in cat species of the genus Felis (Mammalia: Carnivora: Felidae). J
Ethol.
Phelan P and Sliwa A (2005). Range size and den use of Gordon’s wildcats Felis silvestris
gordoni in the Emirate of Sharjah, United Arab Emirates. Journal of Arid Environments 60,
15-25.
Appendix 5
191
Pocock RI (1907). Notes upon some African species of the genus Felis, based upon
specimens recently exhibited in the Society’s Gardens. Proceedings of the Zoological
Society of London 1907, 656-677.
Schürer U (1988). Breeding Black-footed Cats (Felis nigripes) at Wuppertal Zoo, with Notes
on their Reproductive Biology. Proceedings 5th World Conference on Breeding Endangered
Species in Captivity, October 9-12, 1988. Cincinnati, Ohio. B.L. Dresser, R.W. Reece and
E.J. Maruska (eds.), 547-554.
Schulze RE and McGee OS (1978). Climatic indices and classifications in relation to the
biogeography of southern Africa. In: Biogeography and Ecology of South Africa. Ed. by
M.J.A. Werger and W. Junk: The Hague. Pp. 19-52.
Seidensticker J (1976). On the ecological separation between tigers and leopards. Biotropica
8, 225-234
Skinner JD and Smithers RHN (1990). The Mammals of the Southern African Subregion.
Pretoria: University of Pretoria.
Sliwa A (1994). Marsh owl (Asio capensis) associating with black-footed cat (Felis nigripes).
Gabar 2, 23.
Sliwa A (1996). A functional analysis of scent marking and mating behaviour in the aardwolf,
Proteles cristatus (Sparrman, 1783). Diss.-thesis. University of Pretoria.
Sliwa A (2004). Home range size and social organisation of black-footed cats (Felis nigripes).
Mammalian Biology 69, 96-107.
Sliwa A (2006). Seasonal and sex-specific prey-composition of black-footed cats Felis
nigripes. Acta Theriologica 51, 195-206.
Smithers RHN (1983). The Mammals of the Southern African Subregion. Pretoria: University
of Pretoria Press.
Appendix 5
192
Sunquist ME and Sunquist F (2002). Wild cats of the world. University of Chicago Press,
Chicago.
Van Rooyen TH (1984). The soils of the Kalahari Gemsbok National Park. Koedoe (Suppl.)
1984, 45-63.
Yamaguchi, N., Driscoll, C.A., Kitchener, A.C., Ward, J.M. & Macdonald, D.W. (2004a).
Craniological differentiation amongst the European wildcat (Felis silvestris silvestris), the
African wildcat (F. s. lybica) and the Asian wildcat (F. s. ornata): implications for their
evolution and conservation. Biol. J. Linnean Soc. 83: 47-64.
Yamaguchi, N., Kitchener, A.C., Ward, J.M., Driscoll, C.A. & Macdonald, D.W. (2004b).
Craniological differentiation amongst wild-living cats in Britain and southern Africa: natural
variation or the effects of hybridisation? Anim. Conserv. 7: 339-351.