the behavioural ecology of reintroduced lions and
TRANSCRIPT
ii
THE BEHAVIOURAL ECOLOGY OF REINTRODUCED LIONS AND
CHEETAHS IN THE PHINDA RESOURCE RESERVE, KWAZULU-NATAL,
SOUTH AFRICA.
by
Luke T.B. Hunter
Thesis submitted in partial fulfilment of the requirements for the degree of
Doctor of Philosophy
in the
Faculty of Biological and Agricultural Sciences
University of Pretoria
Pretoria.
September 1998.

iii
To my parents, Tim and Lois for their unfailing encouragement and love, and to my
grandmother Dorothy Arthur, whose gift of a toy lion when I was three set me on an
inevitable path to Africa.
iv
THE BEHAVIOURAL ECOLOGY OF REINTRODUCED LIONS AND
CHEETAHS IN THE PHINDA RESOURCE RESERVE, KWAZULU-NATAL,
SOUTH AFRICA.
by
Luke T.B. Hunter
Supervisor: Prof. J. D. Skinner
Mammal Research Institute
University of Pretoria
Pretoria.
ABSTRACT
An effort to re-establish lions and cheetahs into northern KwaZulu-Natal, South
Africa, was studied for 40 months to collect information on the behaviour and ecology of
reintroduced felids and to assess the success of such restoration attempts. ‘Soft-release’
methods including a period of captivity prior to release were employed for the release and
probably increased project success. All reintroduced lions and cheetahs remained at the
release site. Animals generally did not display ‘homing’ behaviour, though three groups of
lions and cheetahs showed some evidence of homing for two months following release.
Unfamiliar, unrelated animals socialised during the pre-release captivity period often
remained together following release for long periods.
Reintroduced lions and cheetahs at Phinda established home ranges with similar
characteristics and patterns to that observed in other ecosystems. All individuals which
survived the early post-release period remained at Phinda and settled in ranges within the
reserve which were largely stable for the duration of the study. Lions (of both sexes) and
male cheetahs were territorial whereas female cheetahs showed no signs of establishing
territories and used (in some cases) the entire reserve as their home range. The long-term
nature of some individual’s ranges suggests that lions and cheetahs are able to establish a
home-range following translocation, and therefore, that reintroduction may be a viable
method for re-establishing resident felids in areas of their former distribution.
The greatest cause of mortality to reintroduced felids was as a result of human
activity, particularly poaching. Inter and intra-specific conflict with other large carnivores
was also a significant factor. Despite mortalities, population characteristics suggested lions
and cheetahs are rapid and effective in re-colonising vacant areas. Most lions and cheetahs
survived the critical early post-release stage and a minimum of 60% of females of both
species survived to reproduce. At least 43 lion cubs and 48 cheetah cubs were born during
the study. High rates of cub and sub-adult survival contributed to rapid population growth.

v
Population modelling suggested that low mortality rates for juveniles and sub-adults may be
critical for re-establishment.
Re-introduced lions and cheetahs foraged successfully and their post-release survival
was not affected by characteristics of food resources. Wildebeest, zebras, nyalas and
warthogs made up 86% of biomass killed by lions. Wildebeest were clearly the most
important species to lions which were killed at three times their availability. Predation
pressure on wildebeest resulted in a population decline during the study period, probably
due to the lack of predation-free refuges inherent in small, enclosed reserves.
Cheetahs preyed upon reedbucks at eight times their availability at Phinda and
reedbucks underwent a population decline. Nyalas and impalas were the other two most
important prey species to cheetahs, the former constituting almost 50% of biomass killed by
cheetahs. This is the first study of cheetah feeding ecology in woodland habitat and the first
to demonstrate that cheetahs can specialise on an ungulate species almost twice as heavy as
‘typical’ prey species from other ecosystems. Female cheetahs showed a pattern of hunting
larger prey as litters grew, particularly where a high percentage of cubs survived.
Aside from evidence that predation affected some ungulate populations, the study
demonstrated significant behavioural changes by herbivores in response to felid
reintroduction. Wildebeest and impalas underwent a 200% increase in vigilance behaviour
in the first five months following the release of lions and cheetahs. Wildebeest and impalas
in exclusion areas free of reintroduced felids did not show any change in vigilance.
The study suggested that, contrary to most other efforts at large African carnivore
translocation, reintroduction may be a viable method for re-population, at least in the short-
term. Methodological and management issues which may be important for the longer term
success of these types of projects are discussed.
vi
ACKNOWLEDGEMENTS The attempt to reintroduce large cats at Phinda involved the support, interest and
expertise of many dozens of people and I am grateful to everyone who contributed. First,
I thank my supervisor, Professor John Skinner who afforded me the opportunity to come
to Africa to fulfil a dream and without whose guidance I may never have begun my
research on large cats. The directors and staff of Phinda welcomed me from the day I
arrived and made me feel at home. In particular, many thanks to Kevin Leo-Smith and
Dave Varty for their ambitious plan to return lions and cheetahs to Maputaland and for
permitting me to radio-collar and research them. I am especially grateful to Les Carlisle
who had the project up and running when I arrived and whose enthusiasm for it and
personal support for me has not wavered in the six years I have known him. Thanks also
to Les’ wife Lynette for generous hospitality, home-cooked dinners and for ensuring
phone calls from Australia always came through. Martin and Danny Rickleton were great
friends from the start and among many other things, always ensured Camp Zinave was
running smoothly. Colin Bennett, Johnny Raw and Karl Rosenberg were terrific mates in
my first camp and provided many a beer and welcome distraction from field work after
long stretches of following lions. Thanks also to the many other Phinda people who
became friends and a source of support for my work. In particular, thanks to Iona Palmer,
Linda Figuera, Lesley-Anne Tucker, Rory and Karin du Plessis, Tony and Dee Adams,
Andrew Lewis and, Gavin and Jenny Hulett. A special thanks to Lizie Allender for many
things, but in particular the welcome sound of another Aussie accent in the sandforest.
Thanks also to Lance and Lilla Coetzee and to Charles Skinner for taking me under their
collective wing when I first arrived in Pretoria.
I am also indebted to Phinda’s rangers and trackers who were an invaluable
source of information on lions and cheetahs, and of whom, many became good friends. In
particular, I am grateful to John Dini, Andy Ewing, Tim Frayne, Ian Johnson, Neil
Mostert, Steve Mulholland, Benson Ngubane, Karl Rosenberg, Jeremiah Skosana, Mark
Tennant, Graeme Vercueil, and Carl Walker. To the many others who I haven’t named,
your constant feedback and updates helped me present a more complete picture of the
Phinda cats and added great value to the study.
Sean Carlisle deserves special thanks for carrying on the research in a prolonged
absence of mine, as does Mario Barbafiera whose enthusiasm for finding cats was only
hampered by the limitations of my vehicle. Gus van Dyk played a pivotal early role in
getting me started at Phinda and has provided terrific technical expertise and friendship
along the way. Thanks also to Martin Haupt for his telemetry work, and to Martin and
other MRI technicians Dominic Moss and Mike Hoffman for friendship, beer and
conversation during my time in Pretoria. Thanks also to other MRI post-grad students,

vii
Tim Jackson, Theo Wassenaar and Andy Taylor for discussion and feedback. A special
thanks to Mariana Erlank for tea breaks, making sure the place ran smoothly and much
more. Hector Dott, Andrew McKenzie, Phillip Richardson, Albert van Jaarsveld, Gus van
Dyk and Debbie Wilson all gave valuable feedback during the planning stages of the
project.
Hector Dott, Jackie Grimbeek and Elana Mauer were invaluable for advice and
guidance on statistical matters. Bernard Nieuwoudt helped me extensively with database
management. I am very grateful to Ian Mieklejohn for all his work in introducing me to
GIS and for his work on the vegetation map of Phinda. Dean Fairbanks of the CSIR and
Albert van Jaarsveld and his GIS team at UP assisted greatly during my later GIS
analyses, and special thanks to Albert for allowing me unlimited access to his facilities. In
particular, Belinda Reyers was a great help and very generously allowed me the use of her
own printer. Thanks also to Barend Erasmus and Heath Hull who tackled some of my GIS
problems with good cheer. Many thanks to Janet Casey of Ecological Consulting, Inc in
Portland, Oregon for her donation of CAMRIS software and to Philip Hooge of the U.S.
Geological Survey for his animal movement software for ArcView and his answers to my
questions on its use. I am very grateful to Laurie Marker for allowing me use of her data
on wild-caught cheetah weights and for many valuable discussions on cheetah behaviour
and ecology. Similarly, thanks to Gay Bradshaw, Paul Funston, Karen Laurenson, Gus
Mills, Craig Packer, Alex Sliwa, Rob Slotow and Gus van Dyk for input, comment and
encouragement.
I am very grateful to the Schuette family of Bumbeni Game Ranch for permission
to work on their property, particularly for my herbivore vigilance studies. Dr Dave
Cooper (Natal Parks Board) performed post-mortem examinations of animals and Drs
Pete Rogers and Jacques Flammand (then of the Natal Parks Board) were readily available
for veterinary work and advice on cats. I am very grateful to Dr Andrew McKenzie who
gave freely of his time and expertise to surgically implant a radio-transmitter in a lion. I
would also like to thank members of the Biyala Farmer’s Association and representatives
from the Mnqobogazi, Nibela and Mkasa Tribal Authorities for their contribution to and
confidence in the project. I am very grateful to Peter Jackson of the IUCN Cat Specialist
Group and Dr Bill Langbauer of the Pittsburgh Zoo for their interest and support. David
Rowe-Rowe, Ian Rushworth and Dr Adrian Armstrong, all of the Natal Parks Board,
were very helpful in providing data on past reintroduction attempts of cheetah. This
research was funded by Conservation Corporation Africa, the IUCN Cat Specialist Group,
a Pittsburgh Zoo Conservation Fund Award and a University of Pretoria Research
Assistantship and grants from the Foundation for Research Development and W.H. Craib
Memorial Trust.
viii
A few very special people contributed in ways I can never repay. Helen Alevaki
sacrificed much to leave family and friends in Australia and be a warm, tolerant source of
support for my days of fieldwork. Jess Brown and her folks, Stan and Eugenie, welcomed
me as their own and became my Johannesburg surrogate family. Phil and Jo Tiffin, and
Rex Merrifield were unsurpassed providers of pizza, conversation and friendship while I
was in Pretoria. Josie Wentzel has been a constant source of terrific support and so much
more during my write-up, a time without the enjoyable distraction of the fieldwork. She
deserves much more than the thanks I can give her here.
Finally, very special thanks to my family, without whose support and love I
would never have made it this far.
ix
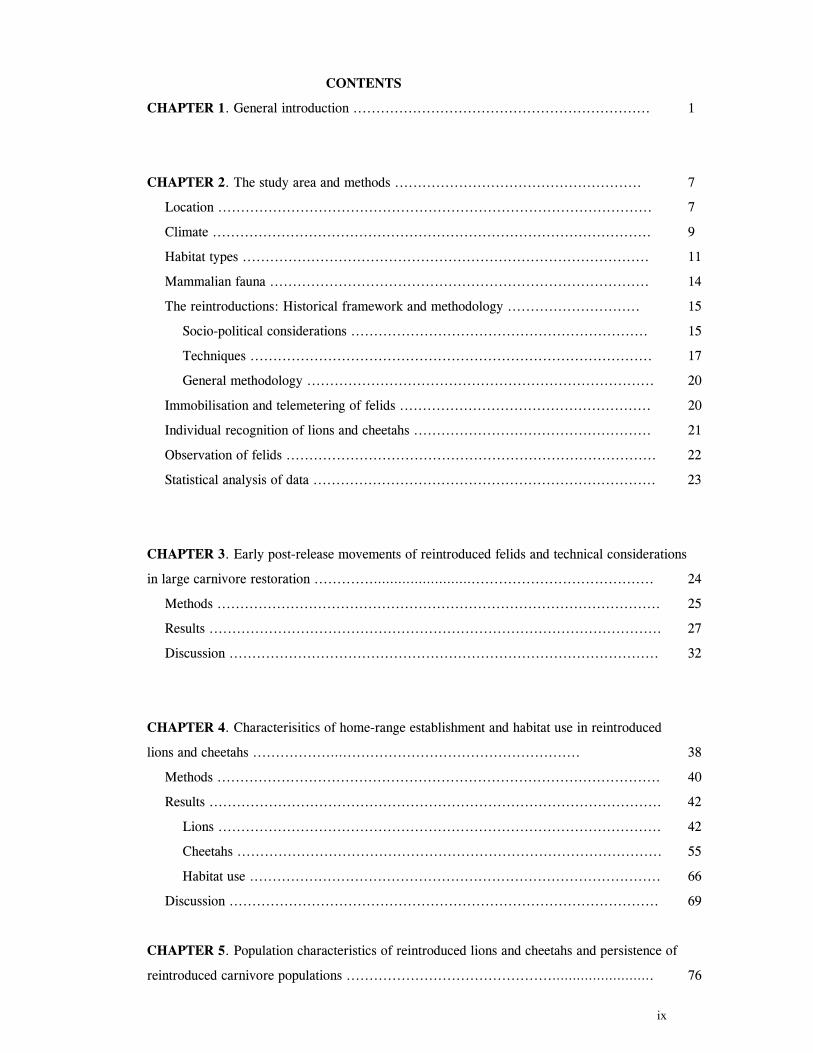
CONTENTS
CHAPTER 1. General introduction ................................................................. 1
CHAPTER 2. The study area and methods ...................................................... 7
Location ............................................................................................... 7
Climate ................................................................................................ 9
Habitat types ......................................................................................... 11
Mammalian fauna ................................................................................... 14
The reintroductions: Historical framework and methodology ............................. 15
Socio-political considerations ................................................................. 15
Techniques ........................................................................................ 17
General methodology ............................................................................ 20
Immobilisation and telemetering of felids ....................................................... 20
Individual recognition of lions and cheetahs .................................................... 21
Observation of felids ................................................................................. 22
Statistical analysis of data ........................................................................... 23
CHAPTER 3. Early post-release movements of reintroduced felids and technical considerations
in large carnivore restoration .............……………………........................................ 24
Methods ................................................................................................. 25
Results ................................................................................................... 27
Discussion .............................................................................................. 32
CHAPTER 4. Characterisitics of home-range establishment and habitat use in reintroduced
lions and cheetahs .................….................................................... 38
Methods ................................................................................................. 40
Results ................................................................................................... 42
Lions ................................................................................................. 42
Cheetahs ............................................................................................. 55
Habitat use .......................................................................................... 66
Discussion .............................................................................................. 69
CHAPTER 5. Population characteristics of reintroduced lions and cheetahs and persistence of
reintroduced carnivore populations .............................................……………………. 76

x
Methods ................................................................................................. 78
Results ................................................................................................... 79
Mortality............................................................................................. 79
Reproduction........................................................................................ 82
Population simulation modelling: VORTEX.................................................. 90
Discussion .............................................................................................. 98
CHAPTER 6. Feeding ecology and patterns of predation by reintroduced lions and cheetahs
..................................................................................................... 104
Methods ................................................................................................. 106
Results ................................................................................................... 110
General patterns of predation .................................................................... 110
Patterns of lion predation ......................................................................... 114
Patterns of cheetah predation .................................................................... 120
Discussion ............................................................................................... 125
CHAPTER 7. The impact of predation on herbivore populations in small reserves..…..... 134
Methods ................................................................................................. 135
Results ................................................................................................... 137
Discussion .............................................................................................. 149
CHAPTER 8. Vigilance behaviour in ungulates in response to felid reintroduction: the role of
predation pressure ………….................................................................... 155
Methods ................................................................................................. 157
Results ................................................................................................... 159
Predation pressure ................................................................................. 159
Herd size, location in herd and presence of juveniles ...................................... 162
Discussion .............................................................................................. 166
CHAPTER 9. General conclusions and management implications for large carnivore
reintroduction ……………….……….................................................................... 169
SUMMARY ............................................................................................... 173
REFERENCES ........................................................................................... 177
xi
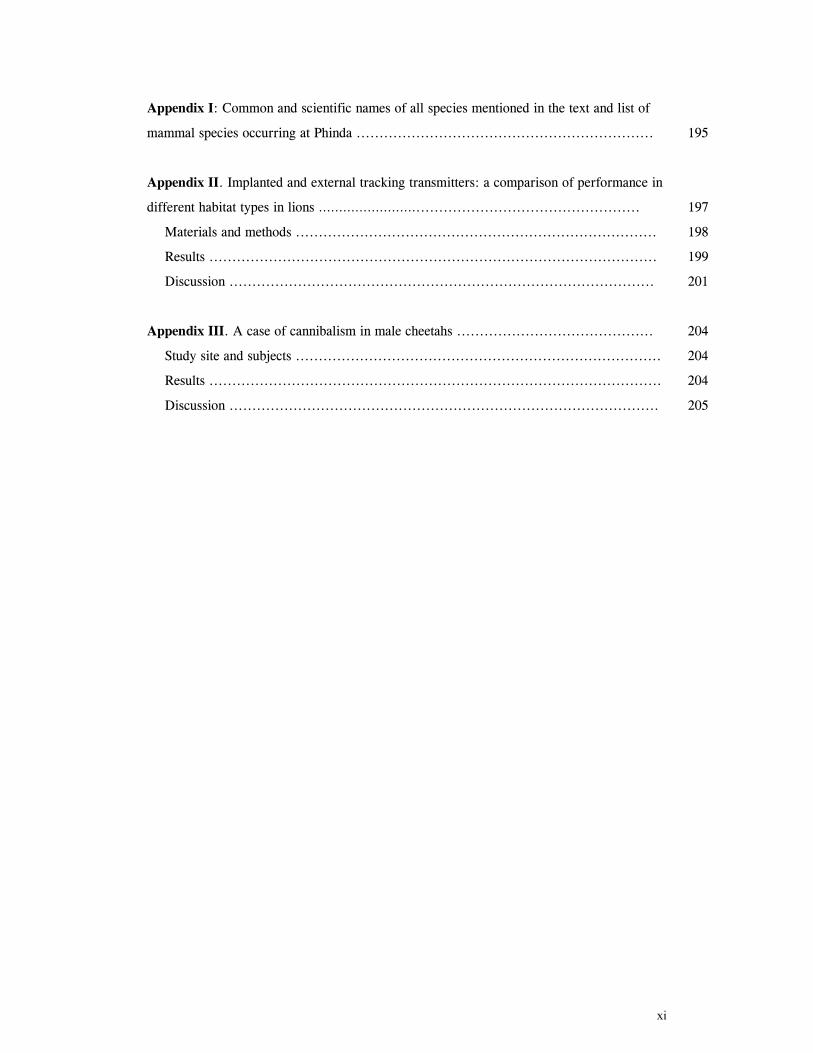
Appendix I: Common and scientific names of all species mentioned in the text and list of
mammal species occurring at Phinda ................................................................. 195
Appendix II. Implanted and external tracking transmitters: a comparison of performance in
different habitat types in lions ……………………................................................. 197
Materials and methods ............................................................................... 198
Results .................................................................................................. 199
Discussion ............................................................................................. 201
Appendix III. A case of cannibalism in male cheetahs ........................................... 204
Study site and subjects ................................................................................ 204
Results ................................................................................................... 204
Discussion .............................................................................................. 205

xii
LIST OF TABLES Table 1. Part attempts to reintroduce cheetahs in KwaZulu-Natal province, South Africa .............................................................................................................. 15 Table 2. Details of lions and cheetah released, arranged chronologically ................... 18 Table 3. Mean ± SD distance (km) of released cats from boma .............................. 27 Table 4. Mean ± SD distance (km) travelled by released cats ................................ 28 Table 5. Results of One-Sample Test for the Mean Angle indicating homing behaviour .............................................................................................................. 32 Table 6. Details of monitoring periods for home-range estimations for reintroduced lions and cheetahs at Phinda. ....................................................................………………... 43 Table 7. Seasonal home-range estimations for lions................. ............................... 44 Table 8. Home range sizes of lionesses when with young cubs (<4mo) ....................... 51 Table 9. Seasonal home-range estimations for cheetahs............................................. 56 Table 10. Habitat use by lions .......................................................................... 67 Table 11. Habitat use by cheetahs ....................................................................... 68 Table 12. Mean ± SD post-release survival time of reintroduced lions and cheetahs ................................................................................................................ 80 Table 13. Minimum survival time of animals still living, translocated or whose fate was uncertain .................................................................................................... 80 Table 14. Causes of mortality of reintroduced lions and cheetahs ............................... 81 Table 15. Details of lion and cheetah litters born at Phinda ..................................... 84 Table 16. Annual mortality rates for cubs, subadults and adults used as input parameters for VORTEX ‘base scenario’ simulations ............................................................ 92 Table 17. The ‘Base Scenario’ parameters for VORTEX population simulations ............ 94 Table 18. VORTEX predictions of the probability of extinction for the Phinda lion and cheetah populations under different mortality and reproduction regimes ....................... 95 Table 19. Results of Chi-squared analysis comparing occurrence of large vs small kills for three methods of data collection on lion and cheetah feeding ecology ......................... 110 Table 20. Complete list of all prey species of lions and cheetahs at Phinda, Winter 1992- Winter1995 ................................................................................................ 111 Table 21. Origin of carcasses on which lions and cheetahs fed ................................. 112 Table 22. Details of unobserved kills for lions and cheetahs .................................... 113 Table 23. Population and kill ratios of eight common prey species of lions and cheetahs ................................................................................................................ 113 Table 24. Lion prey by sex classes ................................................................... 114 Table 25. Lion prey by age classes ................................................................... 115 Table 26. Lion kills made in each habitat type ...................................................... 116 Table 27. Mean ± SD rate of carcase utilisation (kg/min) per individual for increasingly large groups of lions ..................................................................................... 118 Table 28. Cheetah prey by sex classes ............................................................... 120 Table 29. Cheetah prey by age classes ............................................................... 121 Table 30. Cheetah kills made in each habitat type .................................................. 122 Table 31. Mean ± SD rate of carcase utilisation (kg/min) per individual for increasingly large groups of cheetah females with cubs ......................................................... 123 Table 32. Overall density, population and biomass estimates of eight common ungulates in Phinda, Spring 1992- Winter 1995 ............................................................... 138
xiii
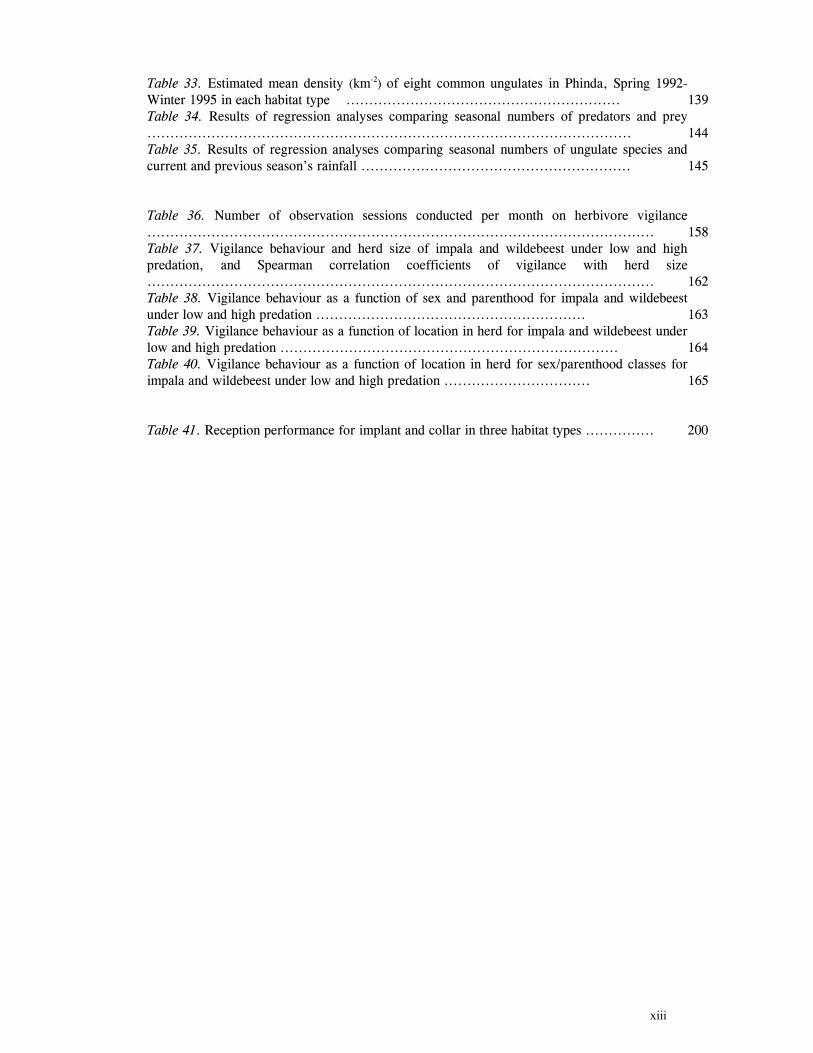
Table 33. Estimated mean density (km-2) of eight common ungulates in Phinda, Spring 1992-Winter 1995 in each habitat type ............................................................ 139 Table 34. Results of regression analyses comparing seasonal numbers of predators and prey .......................................................................................................... 144 Table 35. Results of regression analyses comparing seasonal numbers of ungulate species and current and previous season’s rainfall ........................................................... 145 Table 36. Number of observation sessions conducted per month on herbivore vigilance ............................................................................................................... 158 Table 37. Vigilance behaviour and herd size of impala and wildebeest under low and high predation, and Spearman correlation coefficients of vigilance with herd size ............................................................................................................... 162 Table 38. Vigilance behaviour as a function of sex and parenthood for impala and wildebeest under low and high predation ........................................................... 163 Table 39. Vigilance behaviour as a function of location in herd for impala and wildebeest under low and high predation .......................................................................... 164 Table 40. Vigilance behaviour as a function of location in herd for sex/parenthood classes for impala and wildebeest under low and high predation ................................ 165 Table 41. Reception performance for implant and collar in three habitat types ............... 200
xiv
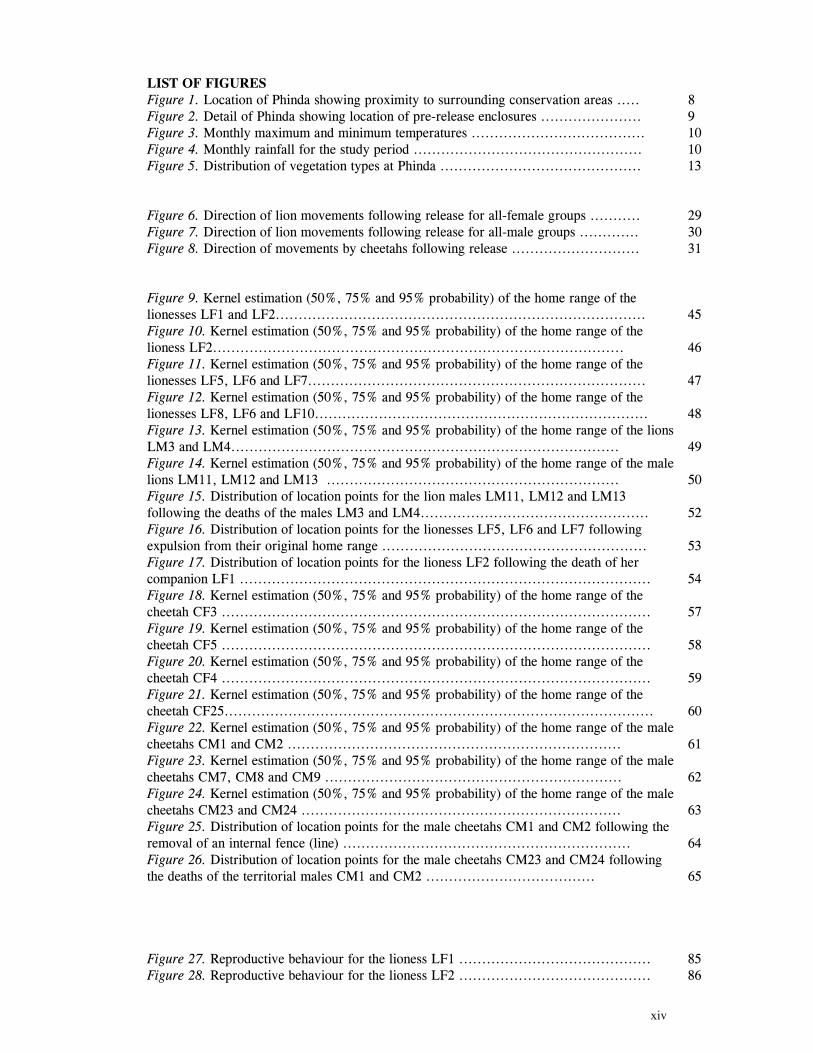
LIST OF FIGURES Figure 1. Location of Phinda showing proximity to surrounding conservation areas ..... 8 Figure 2. Detail of Phinda showing location of pre-release enclosures ...................... 9 Figure 3. Monthly maximum and minimum temperatures ...................................... 10 Figure 4. Monthly rainfall for the study period .................................................. 10 Figure 5. Distribution of vegetation types at Phinda ............................................ 13 Figure 6. Direction of lion movements following release for all-female groups ........... 29 Figure 7. Direction of lion movements following release for all-male groups ............. 30 Figure 8. Direction of movements by cheetahs following release ............................ 31 Figure 9. Kernel estimation (50%, 75% and 95% probability) of the home range of the lionesses LF1 and LF2................................................................................. 45 Figure 10. Kernel estimation (50%, 75% and 95% probability) of the home range of the lioness LF2.......................................................................................... 46 Figure 11. Kernel estimation (50%, 75% and 95% probability) of the home range of the lionesses LF5, LF6 and LF7.......................................................................... 47 Figure 12. Kernel estimation (50%, 75% and 95% probability) of the home range of the lionesses LF8, LF6 and LF10......................................................................... 48 Figure 13. Kernel estimation (50%, 75% and 95% probability) of the home range of the lions LM3 and LM4..................................................................................... 49 Figure 14. Kernel estimation (50%, 75% and 95% probability) of the home range of the male lions LM11, LM12 and LM13 ................................................................ 50 Figure 15. Distribution of location points for the lion males LM11, LM12 and LM13 following the deaths of the males LM3 and LM4.................................................. 52 Figure 16. Distribution of location points for the lionesses LF5, LF6 and LF7 following expulsion from their original home range .......................................................... 53 Figure 17. Distribution of location points for the lioness LF2 following the death of her companion LF1 .......................................................................................... 54 Figure 18. Kernel estimation (50%, 75% and 95% probability) of the home range of the cheetah CF3 .............................................................................................. 57 Figure 19. Kernel estimation (50%, 75% and 95% probability) of the home range of the cheetah CF5 .............................................................................................. 58 Figure 20. Kernel estimation (50%, 75% and 95% probability) of the home range of the cheetah CF4 .............................................................................................. 59 Figure 21. Kernel estimation (50%, 75% and 95% probability) of the home range of the cheetah CF25.............................................................................................. 60 Figure 22. Kernel estimation (50%, 75% and 95% probability) of the home range of the male cheetahs CM1 and CM2 ......................................................................... 61 Figure 23. Kernel estimation (50%, 75% and 95% probability) of the home range of the male cheetahs CM7, CM8 and CM9 ................................................................. 62 Figure 24. Kernel estimation (50%, 75% and 95% probability) of the home range of the male cheetahs CM23 and CM24 ...................................................................... 63 Figure 25. Distribution of location points for the male cheetahs CM1 and CM2 following the removal of an internal fence (line) ............................................................... 64 Figure 26. Distribution of location points for the male cheetahs CM23 and CM24 following the deaths of the territorial males CM1 and CM2 ..................................... 65 Figure 27. Reproductive behaviour for the lioness LF1 .......................................... 85 Figure 28. Reproductive behaviour for the lioness LF2 .......................................... 86
xv
Figure 29. Reproductive behaviour for the lioness LF5 .......................................... 87 Figure 30. Reproductive behaviour for the lioness LF6 .......................................... 88 Figure 31. Reproductive behaviour for the lioness LF7 .......................................... 89 Figure 32. Seasonal lion and cheetah numbers at Phinda ........................................ 90 Figure 33. Lion population size projections at 10 year intervals for 100 years, for different levels of cubs and subadult mortality and age at first reproduction for females and males at 3 years .................................................................................................….. 96 Figure 34. Lion population size projections at 10 year intervals for 100 years, for different levels of cubs and subadult mortality and age at first reproduction for females and males at 5 years ...................................................................................................... 96 Figure 35. Cheetah population size projections at 10 year intervals for 100 years, for different levels of cubs and subadult mortality and age at first reproduction for males at 3 years ......................................................................................................... 97 Figure 36. Cheetah population size projections at 10 year intervals for 100 years, for different levels of cubs and subadult mortality and age at first reproduction for males at 5 years ......................................................................................................... 97 Figure 37. Cheetah growth rate for calculating FEQs ............................................ 109 Figure 38. Scatter diagram showing relationship between time spent on kills of different weights and numbers of lions feeding ............................................................…. 117 Figure 39. Scatter diagram showing relationship between prey mass and numbers of lions feeding on kills .........................................................................................… 118 Figure 40. Percentages of different prey species killed by different social groups of lions at Phinda ...................................................................................................… 119 Figure 41. Scatter diagram showing relationship between time spent on kills of different weights and numbers of cheetahs feeding for cheetah females with cubs ..................…. 123 Figure 42 . Scatter diagram showing relationship between prey mass and numbers of cheetahs feeding on kills for cheetah females with cubs ...............................................…... 124 Figure 43. Proportion of cheetah kills of different mass for lone females, females with cubs and males ........................................................................................... 125 Figure 44. Seasonal population estimates for giraffe, Phinda, Spring 1992- Winter 1995 ... 140 Figure 45. Seasonal population estimates for impala, Phinda, Spring 1992- Winter 1995 ... 140 Figure 46. Seasonal population estimates for kudu, Phinda, Spring 1992- Winter 1995 ..... 141 Figure 47. Seasonal population estimates for nyala, Phinda, Spring 1992- Winter 1995 .... 141 Figure 48. Seasonal population estimates for reedbuck, Phinda, Spring 1992- Winter 1995 ................................................................................................................ 142 Figure 49. Seasonal population estimates for warthog, Phinda, Spring 1992- Winter 1995. 142 Figure 50. Seasonal population estimates for wildebeest, Phinda, Spring 1992- Winter 1995 ................................................................................................................ 143 Figure 51. Seasonal population estimates for zebra, Phinda, Spring 1992- Winter 1995 ... 143 Figure 52. Seasonal lion and cheetah numbers at Phinda, expressed as FEQs ................ 144 Figure 53. Seasonal predation rates by cheetahs on impala, nyala and reedbuck ............. 146 Figure 54. Seasonal predation rates by cheetahs on giraffe, kudu and warthog ............. 146 Figure 55. Seasonal predation rates by cheetahs on wildebeest, zebra and other prey species .............................................................................................................. 147 Figure 56. Seasonal predation rates by lions on nyala, warthog and wildebeest ............. 147 Figure 57. Seasonal predation rates by lions on impala, zebra and other prey species ..... 148 Figure 58. Seasonal predation rates by lions on giraffe, kudu and reedbuck ................. 148 Figure 59. Rate of looking by impala and wildebeest in low and high predation conditions ............................................................................................................... 160

xvi
Figure 60. Proportion of time spent looking by impala and wildebeest in low and high predation conditions .................................................................................... 161 Figure 61. Implant performance versus collar performance in three habitat types ............ 200
1
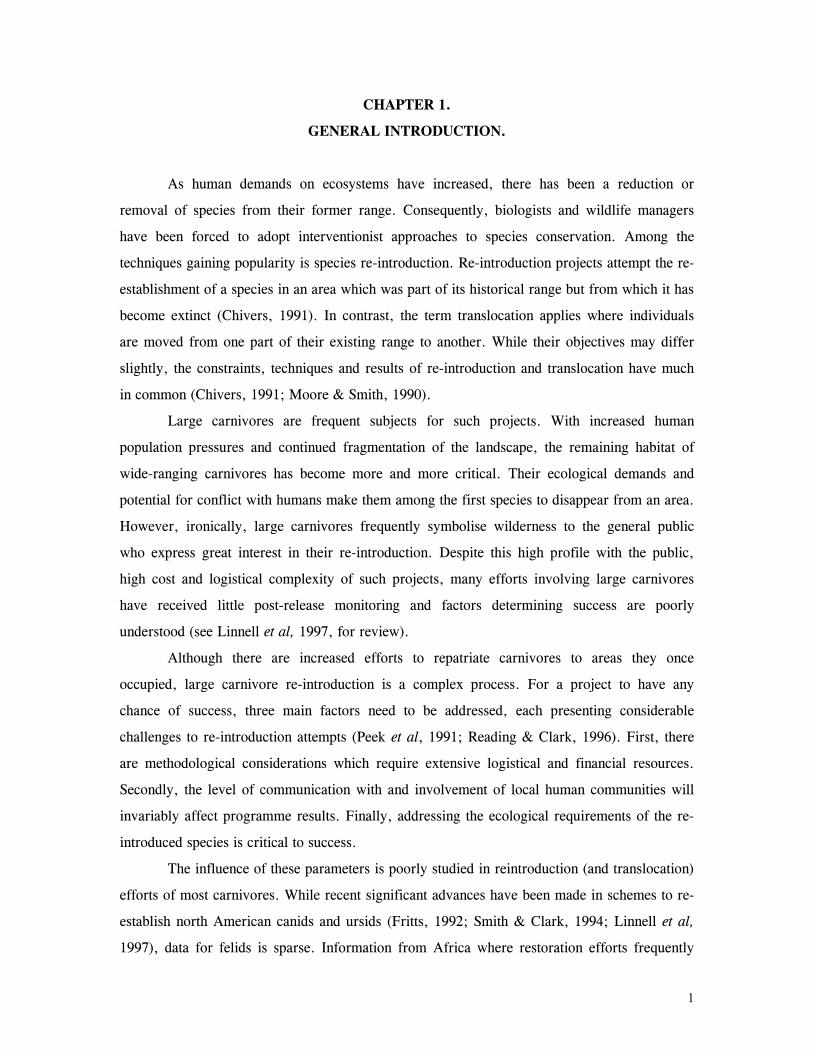
CHAPTER 1.
GENERAL INTRODUCTION.
As human demands on ecosystems have increased, there has been a reduction or
removal of species from their former range. Consequently, biologists and wildlife managers
have been forced to adopt interventionist approaches to species conservation. Among the
techniques gaining popularity is species re-introduction. Re-introduction projects attempt the re-
establishment of a species in an area which was part of its historical range but from which it has
become extinct (Chivers, 1991). In contrast, the term translocation applies where individuals
are moved from one part of their existing range to another. While their objectives may differ
slightly, the constraints, techniques and results of re-introduction and translocation have much
in common (Chivers, 1991; Moore & Smith, 1990).
Large carnivores are frequent subjects for such projects. With increased human
population pressures and continued fragmentation of the landscape, the remaining habitat of
wide-ranging carnivores has become more and more critical. Their ecological demands and
potential for conflict with humans make them among the first species to disappear from an area.
However, ironically, large carnivores frequently symbolise wilderness to the general public
who express great interest in their re-introduction. Despite this high profile with the public,
high cost and logistical complexity of such projects, many efforts involving large carnivores
have received little post-release monitoring and factors determining success are poorly
understood (see Linnell et al, 1997, for review).
Although there are increased efforts to repatriate carnivores to areas they once
occupied, large carnivore re-introduction is a complex process. For a project to have any
chance of success, three main factors need to be addressed, each presenting considerable
challenges to re-introduction attempts (Peek et al, 1991; Reading & Clark, 1996). First, there
are methodological considerations which require extensive logistical and financial resources.
Secondly, the level of communication with and involvement of local human communities will
invariably affect programme results. Finally, addressing the ecological requirements of the re-
introduced species is critical to success.
The influence of these parameters is poorly studied in reintroduction (and translocation)
efforts of most carnivores. While recent significant advances have been made in schemes to re-
establish north American canids and ursids (Fritts, 1992; Smith & Clark, 1994; Linnell et al,
1997), data for felids is sparse. Information from Africa where restoration efforts frequently
2
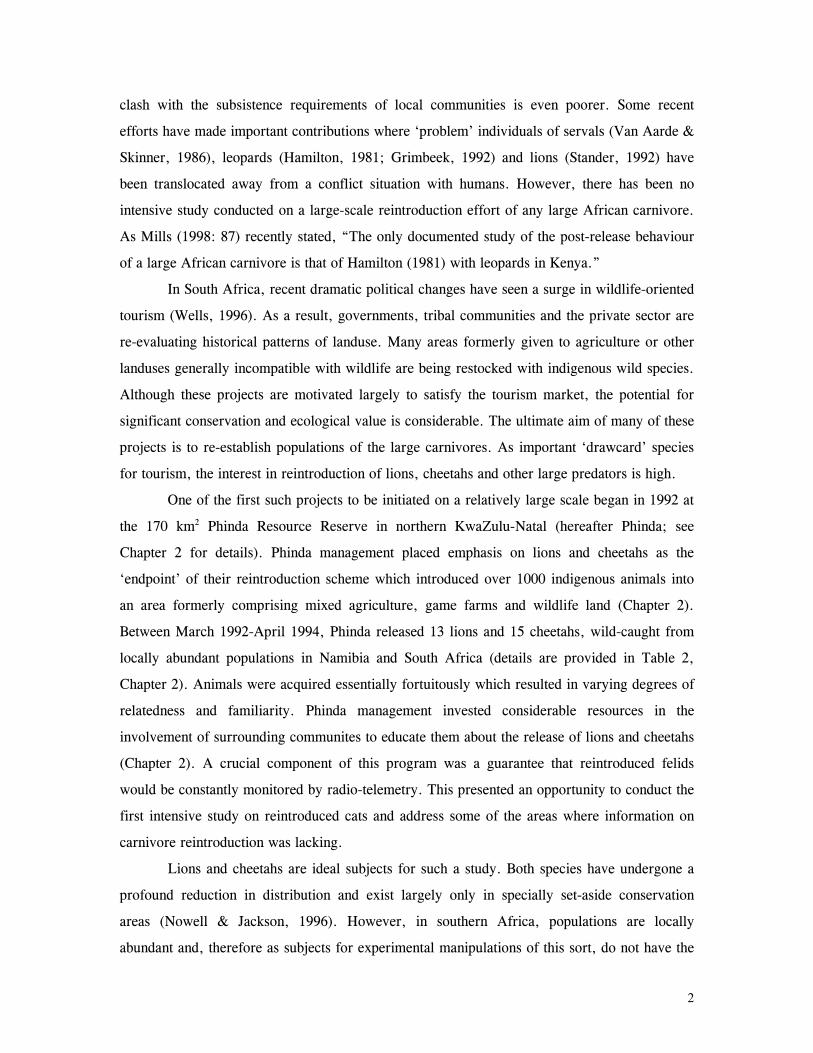
clash with the subsistence requirements of local communities is even poorer. Some recent
efforts have made important contributions where ‘problem’ individuals of servals (Van Aarde &
Skinner, 1986), leopards (Hamilton, 1981; Grimbeek, 1992) and lions (Stander, 1992) have
been translocated away from a conflict situation with humans. However, there has been no
intensive study conducted on a large-scale reintroduction effort of any large African carnivore.
As Mills (1998: 87) recently stated, “The only documented study of the post-release behaviour
of a large African carnivore is that of Hamilton (1981) with leopards in Kenya.”
In South Africa, recent dramatic political changes have seen a surge in wildlife-oriented
tourism (Wells, 1996). As a result, governments, tribal communities and the private sector are
re-evaluating historical patterns of landuse. Many areas formerly given to agriculture or other
landuses generally incompatible with wildlife are being restocked with indigenous wild species.
Although these projects are motivated largely to satisfy the tourism market, the potential for
significant conservation and ecological value is considerable. The ultimate aim of many of these
projects is to re-establish populations of the large carnivores. As important ‘drawcard’ species
for tourism, the interest in reintroduction of lions, cheetahs and other large predators is high.
One of the first such projects to be initiated on a relatively large scale began in 1992 at
the 170 km2 Phinda Resource Reserve in northern KwaZulu-Natal (hereafter Phinda; see
Chapter 2 for details). Phinda management placed emphasis on lions and cheetahs as the
‘endpoint’ of their reintroduction scheme which introduced over 1000 indigenous animals into
an area formerly comprising mixed agriculture, game farms and wildlife land (Chapter 2).
Between March 1992-April 1994, Phinda released 13 lions and 15 cheetahs, wild-caught from
locally abundant populations in Namibia and South Africa (details are provided in Table 2,
Chapter 2). Animals were acquired essentially fortuitously which resulted in varying degrees of
relatedness and familiarity. Phinda management invested considerable resources in the
involvement of surrounding communites to educate them about the release of lions and cheetahs
(Chapter 2). A crucial component of this program was a guarantee that reintroduced felids
would be constantly monitored by radio-telemetry. This presented an opportunity to conduct the
first intensive study on reintroduced cats and address some of the areas where information on
carnivore reintroduction was lacking.
Lions and cheetahs are ideal subjects for such a study. Both species have undergone a
profound reduction in distribution and exist largely only in specially set-aside conservation
areas (Nowell & Jackson, 1996). However, in southern Africa, populations are locally
abundant and, therefore as subjects for experimental manipulations of this sort, do not have the
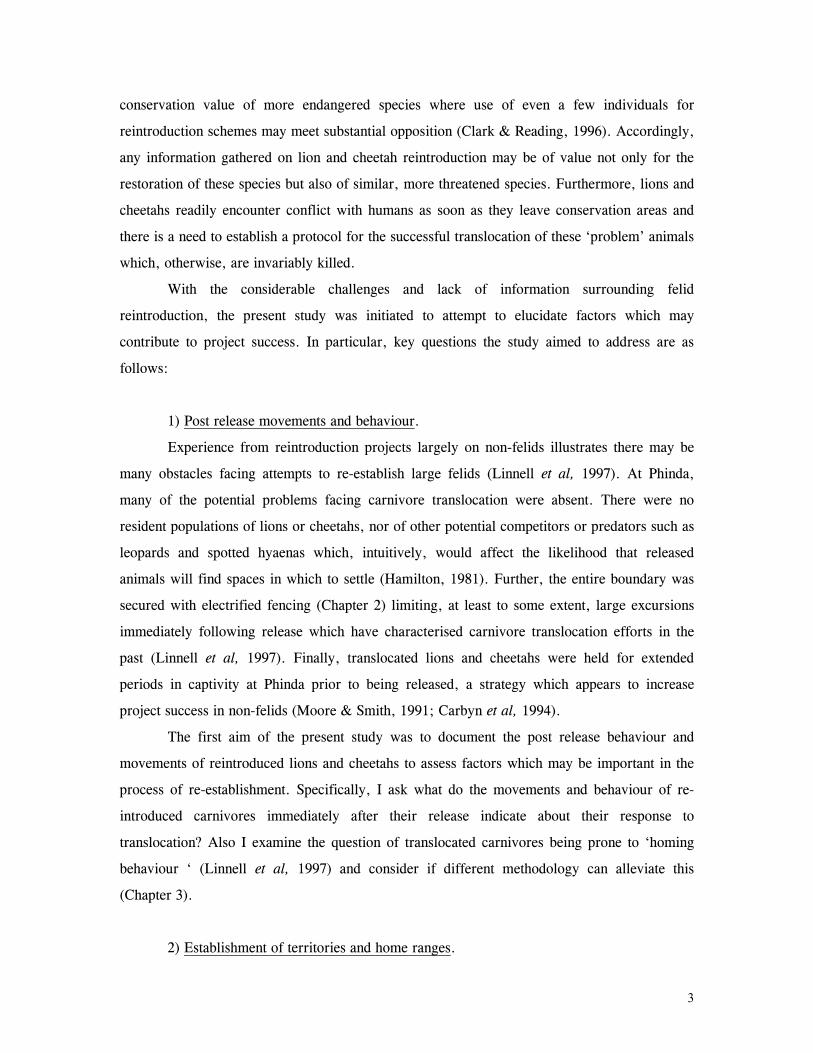
3
conservation value of more endangered species where use of even a few individuals for
reintroduction schemes may meet substantial opposition (Clark & Reading, 1996). Accordingly,
any information gathered on lion and cheetah reintroduction may be of value not only for the
restoration of these species but also of similar, more threatened species. Furthermore, lions and
cheetahs readily encounter conflict with humans as soon as they leave conservation areas and
there is a need to establish a protocol for the successful translocation of these ‘problem’ animals
which, otherwise, are invariably killed.
With the considerable challenges and lack of information surrounding felid
reintroduction, the present study was initiated to attempt to elucidate factors which may
contribute to project success. In particular, key questions the study aimed to address are as
follows:
1) Post release movements and behaviour.
Experience from reintroduction projects largely on non-felids illustrates there may be
many obstacles facing attempts to re-establish large felids (Linnell et al, 1997). At Phinda,
many of the potential problems facing carnivore translocation were absent. There were no
resident populations of lions or cheetahs, nor of other potential competitors or predators such as
leopards and spotted hyaenas which, intuitively, would affect the likelihood that released
animals will find spaces in which to settle (Hamilton, 1981). Further, the entire boundary was
secured with electrified fencing (Chapter 2) limiting, at least to some extent, large excursions
immediately following release which have characterised carnivore translocation efforts in the
past (Linnell et al, 1997). Finally, translocated lions and cheetahs were held for extended
periods in captivity at Phinda prior to being released, a strategy which appears to increase
project success in non-felids (Moore & Smith, 1991; Carbyn et al, 1994).
The first aim of the present study was to document the post release behaviour and
movements of reintroduced lions and cheetahs to assess factors which may be important in the
process of re-establishment. Specifically, I ask what do the movements and behaviour of re-
introduced carnivores immediately after their release indicate about their response to
translocation? Also I examine the question of translocated carnivores being prone to ‘homing
behaviour ‘ (Linnell et al, 1997) and consider if different methodology can alleviate this
(Chapter 3).
2) Establishment of territories and home ranges.

4
There are very few data available on home-range and territory characteristics for
reintroduced felids. While lion and cheetah spatial patterns have been well-studied in
established populations in numerous ecosystems (Van Ordsol et al, 1985; Stander, 1991; Caro,
1994; Hanby et al, 1995) they are not known from translocation or reintroduction scenarios. A
reintroduction project such as at Phinda offers opportunities to explore aspects of felid spatial
patterns which would not be possible in established populations. There were no resident lions or
cheetahs at Phinda prior to the release of the study subjects, so the movements and behaviour of
released individuals were not constrained by the presence of conspecifics. In addition, available
habitat was highly heterogeneous so that felids had a ‘choice’ of suitable habitats in which to
settle. Finally, given that Phinda was entirely enclosed, ungulates were not able to migrate, so
felids may not have experienced the same pressure to make large movements in order to forage
successfully as occurs in other ecosystems (Mills, 1990; Caro, 1994; Hanby et al, 1995).
The second aim of the study was to attempt to explore the process of home-range
establishment and patterns of habitat use by felids following reintroduction (Chapter 4). I
examine differences in seasonal ranges and the presence of young cubs on female ranging
behaviour. I also aimed to look at the impact of stochastic factors such as the deaths of
companions and conspecifics on ranging patterns in reintroduced felids. Finally, the study
aimed to establish management and technical considerations pertaining to lion and cheetah
ranging patterns and habitat use which may assist future reintroduction efforts.
3) Population characteristics.
One critical factor in assessing the success of reintroduction efforts is the demography
of reintroduced populations. In particular, reproduction, mortality and population growth are
crucial to understanding population dynamics, particularly for populations undergoing the
process of recolonisation (Kleiman et al, 1989; Stanley-Price, 1989). Furthermore, analyses
and predictions about viable population sizes and the persistence of populations are typically
produced using such demographic data (Lacy, 1987; Lacy & Clark, 1993). Few studies have
been able to collect detailed data of this sort for reintroduced carnivores.
Therefore, a further aim of the present study was to collect information on the mortality
and reproductive characteristics of reintroduced lions and cheetahs (Chapter 5). Specifically,
the study aimed to:
1. document the post-release survival of reintroduced lions and cheetahs and attempt to
determine important causes of mortality;
5
2. document patterns of reproduction of reintroduced lions and cheetahs;
3. use the above data as input parameters to model population viability estimations;
4. make methodological recommendations based on the data and population projections
to enhance the success of large felid reintroduction efforts.
4) Feeding ecology.
Patterns of predation and foraging in lions and cheetahs have been well-studied in many
parts of their range and determinants of such patterns are beginning to be well-understood
(Caro, 1994; Packer & Ruttan, 1988; Packer et al, 1990, 1995). Some of these factors differed
markedly at Phinda compared to most other well-studied populations. Reintroduced felids were
faced with a high density and diversity of naïve prey species which had experienced low
predation pressure prior to reintroduction (Hunter & Skinner, 1998). Furthermore, the lack of
resident lions and cheetahs, and low densities of other major predators (Chapter 2) meant that
competition for food resources was low. Additionally, some aspects of lion and cheetah
population dynamics were unusual compared to established populations (Chapter 5). Lions
prides were generally small so that competition for food within prides was potentially low.
Pride size was likely to undergo an increase over the duration of the study once the small
founding groups which were released, began breeding. This presented an opportunity to
examine changes in prey selection related to increasing group size over time. Finally, patterns
of predation for cheetahs are generally only well-known from very open habitat such as the
population of the Serengeti plains. The Acacia-dominated woodland mosaic at Phinda presented
an opportunity to examine cheetah feeding ecology in a very different environment to the
‘classic’ grassland habitat of cheetahs.
In this section of the study (Chapter 6), I aimed to examine lion and cheetah feeding
ecology under these circumstances. Specifically, I attempted to explore the following questions:
1: Does lion foraging behaviour reflect the reduced requirements inherent in small pride
size, and the abundance of smaller, easier-to-kill prey species at Phinda?
2: Does this behaviour change over time as pride size increased due to rapid
reproduction and high survival of cubs?
3. What are the patterns of feeding ecology of cheetahs in woodland-dominated
vegetation and can cheetahs successfully forage in habitats often assumed to be sub-optimal?
4: Does the high rate of survival of cheetah cubs place increased demands on mother
cheetahs and if so, how do they respond?
6
Finally I also aimed to assess the importance of food resources for reintroduced
carnivores in terms of project success and consider management issues related to predator-prey
interactions following carnivore reintroduction.
5) Carnivore-herbivore relationships.
The effect of predation by large carnivores on populations of their prey species is a
controversial subject. Predation is often assumed to regulate or even deplete herbivore
populations and as a result, predators may be persecuted by hunters, game farmers and
managers of some reserves (Keith, 1974; Bergerud, 1985; Skogland, 1991). However, studies
which unequivocally demonstrate the impact of predation in large mammal communities are
sparse. Previous work on large mammal predator-prey systems in Africa suggests that predation
generally has little regulating effect on prey populations. Herbivore populations appear to
periodically escape high predation pressure either by migratory movements (Sinclair et al,
1985; Fryxell & Sinclair, 1998; Mills & Shenk, 1992), or by being nomadic (Mills, 1992).
However, the small size of Phinda and its enclosure within electrified fencing established
conditions in which herbivores may have lacked refuges from predation. Accordingly, the
potential for considerable impact by predation on herbivore populations at Phinda was
substantial. This aspect of the present study aimed to document any impact on lion and cheetah
prey populations in a small enclosed area where there was no refuge from predation (Chapter
7).
The study also aimed to examine the vigilance response of a naïve prey population to
the introduction of their historical felid predators after an absence of those predators for many
decades. This aspect of the study investigated whether the increase in predation pressure as a
result of the re-introduction of lions and cheetahs would be reflected in increased vigilance and
also, if vigilance increased over time in the months immediately following the re-introduction of
lions and cheetahs. I also examined the relationship of group size, location in herd and the
presence of juveniles to vigilance behaviour where re-introduced cats were present and where
they were absent (Chapter 8).
The over-arching aim of this study was to attempt to establish biological and
methodological considerations which may contribute to the success of these sorts of
conservation efforts, the outcome of which has seldom been documented (Mills, 1991; Linnell
et al 1997).
7
CHAPTER 2.
THE STUDY AREA AND METHODS.
LOCATION.
Phinda is located in the Maputaland region of northern Kwa-Zulu Natal, South
Africa at latitude 27 o 40’ to 27 o 55 south and longitude 31o12’ to 32o26’ east. (Fig. 1).
The region forms part of the almost flat low level coastal plain which runs from the
Umfolozi River, north into Mozambique (Maud, 1980). Maputaland is bounded by the
Indian ocean to the east and the Lebombo Mountains to the west.
Phinda is approximately 30km from the eastern coast of South Africa and covers
an area of 170km2. Over 95% of the reserve lies beneath 100m above sea level with a
minimum altitude of 4m above sea level and a maximum of 201m above sea level where
the southern tip of the Ubombo mountains run through the reserve in its south-west.
Phinda has two rivers, the Mzinene which forms the boundary in the south and the
Munyawana which bisects the reserve at approximately the mid-point between northern
and southern tips. Both rivers are naturally seasonal though in the case of the Mzinene,
an artificial weir has resulted in year-round water. Numerous small, shallow seasonal
pans occur throughout the reserve as do a number of man-made dams which have water
piped to them on an ad-hoc basis during the dry winter.
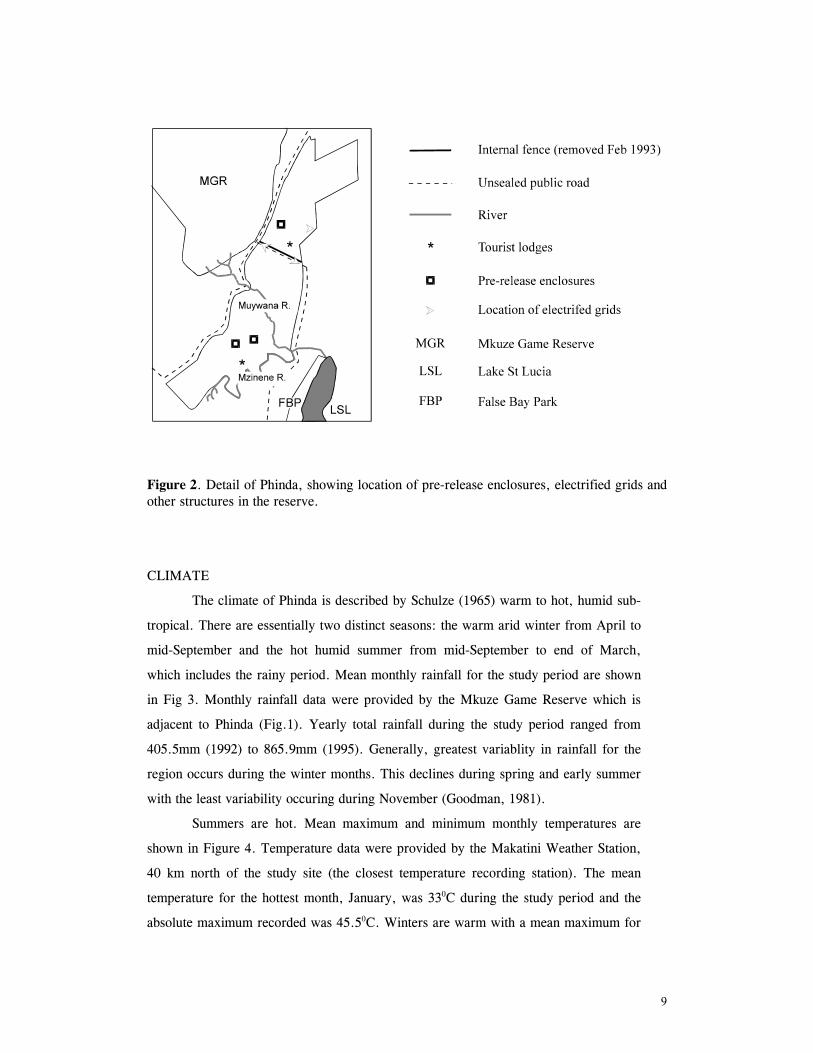
Surrounding land comprises privately owned farmland, rural Kwa-Zulu
communities and state and privately-owned game reserves (Fig.1). Phinda itself is
privately owned and was established as a conservation area in 1990. Prior to this, land-
use was a mixture of private farming concerns (livestock, pineapples and cotton) and
small game “farms” mostly devoid of large mammal species with the exception of some
ungulates (see below). Phinda’s mother company, the eco-tourism operation
Conservation Corporation Africa (hereafter CCA) purchased or leased a number of
these small properties to establish the reserve. During the study, the reserve’s land was
owned by a consortium comprising CCA and two private families from which CCA
leased to permit traversing rights for game drives. Internal fences divided the reserve
into two areas as illustrated in Fig.2 until February 1993. Prior to February 1993, re-
introduced felids only occupied the northern portion of the reserve. After February
1993, the internal fence was removed and cats were free to traverse the whole area. The
entire reserve formed the field site for this study. As is prescribed for reserves in South
Africa reintoducing dangerous species, the entire perimeter of Phinda (115km) is fenced
with electrified game fencing. Three entrance points to the reserve, the width of a
single-lane carriage way, are unfenced and protected by electrified cattle grids.

8
9
Figure 2. Detail of Phinda, showing location of pre-release enclosures, electrified grids and other structures in the reserve.
CLIMATE
The climate of Phinda is described by Schulze (1965) warm to hot, humid sub-
tropical. There are essentially two distinct seasons: the warm arid winter from April to
mid-September and the hot humid summer from mid-September to end of March,
which includes the rainy period. Mean monthly rainfall for the study period are shown
in Fig 3. Monthly rainfall data were provided by the Mkuze Game Reserve which is
adjacent to Phinda (Fig.1). Yearly total rainfall during the study period ranged from
405.5mm (1992) to 865.9mm (1995). Generally, greatest variablity in rainfall for the
region occurs during the winter months. This declines during spring and early summer
with the least variability occuring during November (Goodman, 1981).
Summers are hot. Mean maximum and minimum monthly temperatures are
shown in Figure 4. Temperature data were provided by the Makatini Weather Station,
40 km north of the study site (the closest temperature recording station). The mean
temperature for the hottest month, January, was 330C during the study period and the
absolute maximum recorded was 45.50C. Winters are warm with a mean maximum for

10
the coldest month (July) of 25.50C. The mean monthly minimum for July was 9.90C
and the absolute minimum recorded was 5.00C.
The prevailing winds for the Natal coastal strip are roughly north-easterly and
south-westerly (Goodman, 1990). The windiest period occurs during September and
October with the windiest month being September. The calmest month is June
(Goodman, 1981).
0
5
10
15
20
25
30
35
40
M J J A S O N D J F M A M J J A S O N D J F M A M J J A S O N D J F M A M J J A
Month (May 92- August 95)
Am
bien
t tem
pera
ture
(OC
)
Figure 3. Monthly maximum and minimum temperatures for the study region, May 1992 to August 1995. Data unavailable for May 1994.
0
20
40
60
80
100
120
140
160
180
200
M J J A S O N D J F M A M J J A S O N D J F M A M J J A S O N D J F M A M J J A
Months (May 92-August 95)
Mon
thly
rain
fall
(mm
)
Figure 4. Monthly rainfall for the study period, May 1992 to August 1995. Data from Makatini weather station.
11
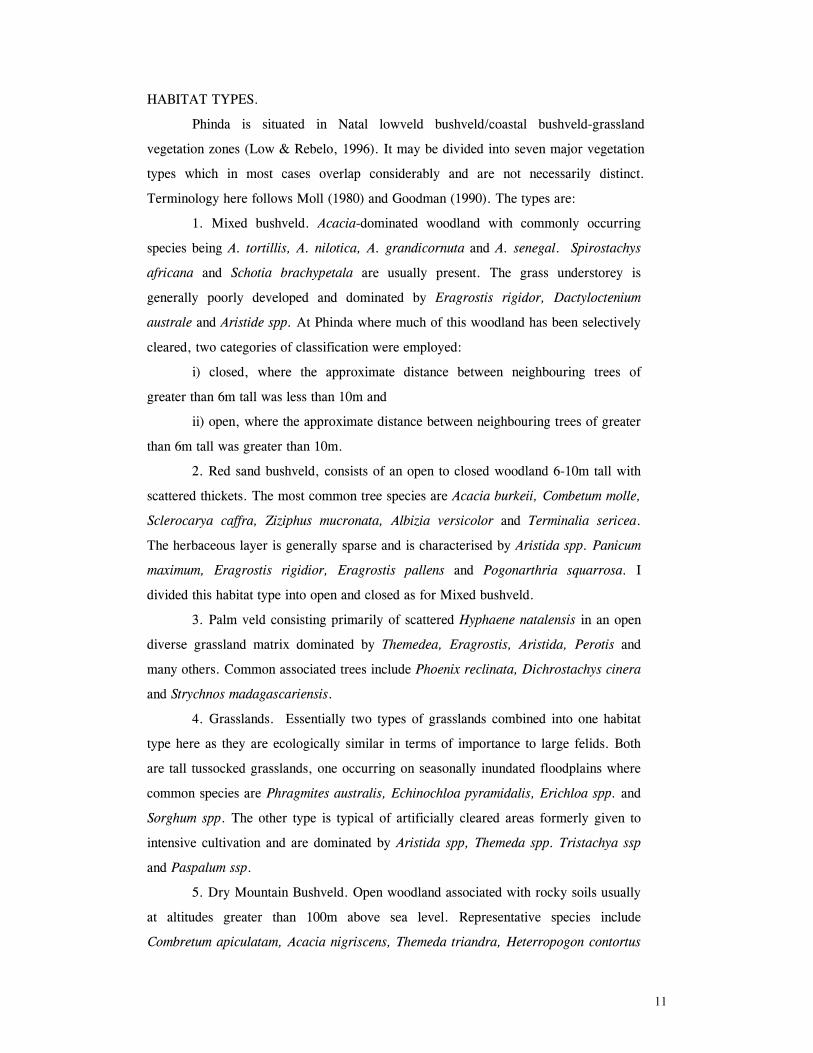
HABITAT TYPES.
Phinda is situated in Natal lowveld bushveld/coastal bushveld-grassland
vegetation zones (Low & Rebelo, 1996). It may be divided into seven major vegetation
types which in most cases overlap considerably and are not necessarily distinct.
Terminology here follows Moll (1980) and Goodman (1990). The types are:
1. Mixed bushveld. Acacia-dominated woodland with commonly occurring
species being A. tortillis, A. nilotica, A. grandicornuta and A. senegal. Spirostachys
africana and Schotia brachypetala are usually present. The grass understorey is
generally poorly developed and dominated by Eragrostis rigidor, Dactyloctenium
australe and Aristide spp. At Phinda where much of this woodland has been selectively
cleared, two categories of classification were employed:
i) closed, where the approximate distance between neighbouring trees of
greater than 6m tall was less than 10m and
ii) open, where the approximate distance between neighbouring trees of greater
than 6m tall was greater than 10m.
2. Red sand bushveld, consists of an open to closed woodland 6-10m tall with
scattered thickets. The most common tree species are Acacia burkeii, Combetum molle,
Sclerocarya caffra, Ziziphus mucronata, Albizia versicolor and Terminalia sericea.
The herbaceous layer is generally sparse and is characterised by Aristida spp. Panicum
maximum, Eragrostis rigidior, Eragrostis pallens and Pogonarthria squarrosa. I
divided this habitat type into open and closed as for Mixed bushveld.
3. Palm veld consisting primarily of scattered Hyphaene natalensis in an open
diverse grassland matrix dominated by Themedea, Eragrostis, Aristida, Perotis and
many others. Common associated trees include Phoenix reclinata, Dichrostachys cinera
and Strychnos madagascariensis.
4. Grasslands. Essentially two types of grasslands combined into one habitat
type here as they are ecologically similar in terms of importance to large felids. Both
are tall tussocked grasslands, one occurring on seasonally inundated floodplains where
common species are Phragmites australis, Echinochloa pyramidalis, Erichloa spp. and
Sorghum spp. The other type is typical of artificially cleared areas formerly given to
intensive cultivation and are dominated by Aristida spp, Themeda spp. Tristachya ssp
and Paspalum ssp.
5. Dry Mountain Bushveld. Open woodland associated with rocky soils usually
at altitudes greater than 100m above sea level. Representative species include
Combretum apiculatam, Acacia nigriscens, Themeda triandra, Heterropogon contortus

12
and Cymbopogon excavatus. Where the soils are shallow, the herbaceous understorey is
poor and Aloe martlothii is particularly common.
6. Sandforest, a unique vegetation type under threat in South Africa (Low &
Rebelo, 1996). The forest is very dense and the canopy is high extending to 25m.
Important tree species present include Newtonia hilderbrandtii, Cleistanthus schlerteri,
Hymanocardia ulmoides, Pteleopsis myrtifolia, Dialium schlerteri, Croton gratissimus
and Strychnos henningsii. Salacia leptoclada, Croton pseudopluchellus and
Hymenocardia ulmoides form a well-developed sub-canopy of small trees and shrubs
(Goodman, 1990). The herbaceous understory is almost non-existent.
7. Riparian woodland. Well-developed woodland occurring adjacent to the two
main rivers, Munywana and Mzinene. Main woody species are Acacia xanthophloea,
A. robusta, Spriostachys africana, Rauvolfia caffra and Trichilia emetica. The
subcanopy is dense, key species being A. schweinfurthii. Azima tetracantha and usually
the alien Eupatorium odoratum.
No detailed vegetation map exists of Phinda, so I surveyed the entire reserve
classifying habitat types into the above categories. I attempted to delimit edges of
habitat types using two series of 1:30,000 aerial photographs of Phinda taken in 1975
and 1995. This is accurate for obvious habitat divisions such as the boundaries of
grasslands and patches of sandforest. However, divisions between vegetation types are
generally indistinct, so I usually assigned edges to vegetation groups after ground
reconnaissance either by driving or walking and recording habitat types on a 100m x
100m grid overlaid on a 1:50,000 topographic map. Although this method is crude, it
is considered acceptable for defining coarse differences in plant communities which are
potentially ecologically significant to large mammals (Goodman, 1990:27). I drew the
boundaries of vegetation types by hand on the aerial photographs and then digitized the
data using ArcViewTM Geographical Informations Systems (GIS) software to generate a
habitat map of the reserve (Figure 5.)
13
6 0 6 12 km
N
River
Closed mixed bushveldClosed red sand bushveld
Dam
Dry mountain bushveld
Open mixed bushveldOpen red sand bushveldPalmveldRiparianSandforest
Grassland
Figure 5. Distribution of vegetation types at Phinda. See text for description of habitats

14
MAMMALIAN FAUNA.
Prior to 1990, the study site comprised a number of small privately owned
concerns with a mixture of land uses such as livestock and cash crop farming while also
utilising the wildlife mostly for recreational hunting. Most of the indigenous large mammal
fauna had been extirpated but small and medium-sized ungulates were common when
Phinda assumed control of the area in 1990. Species present include nyala, impala,
southern reedbuck, greater kudu, grey duiker, red duiker, steenbok, suni, warthog,
bushpig and small numbers of blue wildebeest, Burchell’s zebra and waterbuck (scientific
names of all species mentioned in the text are listed in Appendix I). Between 1990 and
1993, Phinda translocated to the reserve over 1000 head of ungulates, supplementing
numbers of the above species, particularly those anticipated to be important prey items for
re-introduced felids (nyala, impala, wildebeest and zebra). Most of these ungulates
originated from small (<50km2) ‘game farms’ in northern KwaZulu/Natal. During this
period, giraffe, white rhinoceros and elephant were also re-introduced. All species released
by Phinda were once indigenous to the area, with the possible exception of giraffe
(Goodman & Tomkinson, 1987). Very small (<20) populations of two non-indigenous
ungulates, blesbok and red hartebeest, occured in the reserve at its inception but were
largely removed prior to felid reintroduction in 1992.
Resident populations of lions and cheetahs were last recorded in the region in the
1938 and 1941 respectively (Rowe-Rowe, 1992; Maddock et al, 1996). Since 1966,
attempted re-introduction of cheetahs to the province has occurred at five sites (Table 1).
All these attempts appear to have failed to establish breeding populations (Rowe-Rowe,
1992: Table1). A second re-introduction attempt at Hluhluwe-Umfolozi Reserve is
presently underway: 22 cheetahs have been released since 1995 (Marker-Kraus, 1996).
Lions were re-introduced into the Hluhluwe-Umfolozi Reserve in 1965 and numbered 64 in
1996 (Maddock et al, 1996). This is the only other free-ranging lion population in
KwaZulu-Natal aside from the Phinda animals and is apparently in decline (Maddock et al,
1996). Between March 1992- April 1994, Phinda released 13 lions and 15 cheetahs (Table
2, next section.)

15
Site Number released
When released
Estimated population 1992*
Hluhluwe-Umfolozi Reserve
64 1966 -1969 13
Itala Game Reserve 13 1979 <10 Lake St Lucia Reserve 18 1978 -1981 rare Mkuzi Game Reserve 33 1966 <10 Ndumu Game Reserve 14 1971 unknown
Table 1: Past attempts to re-introduce cheetahs in KwaZulu-Natal province, South Africa. * Source: Rowe-Rowe 1992. In addition to re-introduced carnivores, Phinda has low numbers of leopards and
spotted hyaenas which had been heavily persecuted prior to Phinda’s establishment. Both
species are numerous in the adjacent Mkuze Game Reserve (Rowe-Rowe, 1992) and
individuals freely migrate across reserve boundaries. African wild dogs are not resident in
Phinda though transient animals occasionally pass through the area, most likely from the
Hluhluwe-Umfolozi population. A group of five dogs was seen at Phinda during the study
period (April, 1993). A single brown hyaena was killed on a district road along Phinda’s
western boundary in 1995, the only record of this species for the reserve. Small carnivores
present include serval, caracal, two species of jackals, three mustelids and five viverrids.
Other common mammals at Phinda include chacma baboon, vervet monkey, greater
bushbaby, African porcupine and aardvark (full list of mammals present at Phinda in
Appendix I).
THE REINTRODUCTIONS: Historical framework and methodology.
Socio-political considerations.
Increasingly practitioners of re-introduction are realising that socio-political
elements have a fundamental influence on the success of reintroduction projects (Peek et al,
1991; Reading & Clark, 1996). While biological and technical aspects are typically given
substantial attention, failure to address factors such as competing human values and socio-
economic pressures have doomed some reintroduction efforts (Reading & Clark, 1996).
Phinda management had initiated considerable involvement by surrounding communities in
16
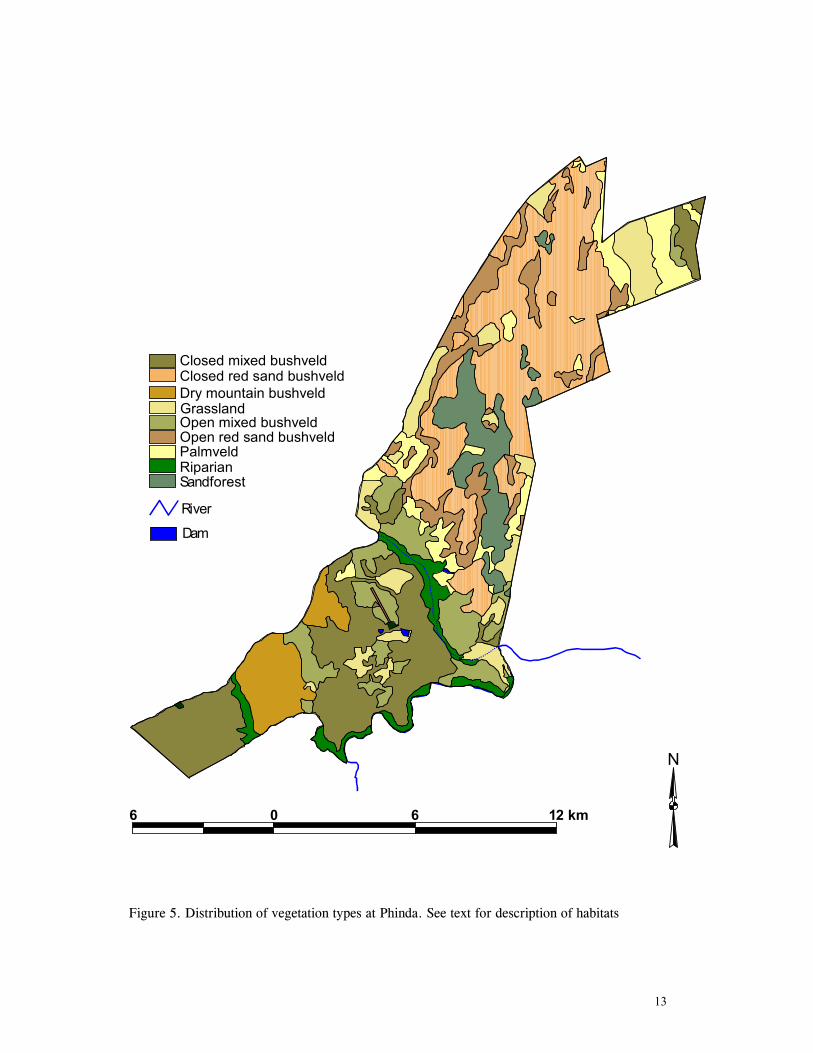
the reintroduction process prior to my arrival. Although my study is not directly concerned
with the human dimension of reintroductions, one of my roles at Phinda was to interact
with local communities regarding the reintroduced felids. I have included here the historical
background and details of this relationship to illustrate this important aspect of
reintroduction projects.
Phinda shares boundaries with rural Zulu communities and commercial farmers,
both groups relying on their subsistence primarily from livestock. During 1989,
communication was initiated with representatives from all surrounding communities. The
focus of these early meetings was to discuss the planned development of Phinda as a
wildlife reserve and to negotiate the placement of boundaries (which had been historically
disputed). During these discussions, the concept of re-introducing ‘dangerous game’ was
first introduced. The local provincial wildlife authority, the Natal Parks Board, controls
translocation and introduction of “dangerous game” which includes the large felids. Initial
negotiations focused on white rhinoceros, elephant and buffalo which were to be re-
introduced before cats. In particular, the discussions emphasised insurance taken by Phinda
to cover against any potential damage incurred by dangerous species should they leave
Phinda’s boundaries. By the time the release of lions and cheetahs was approaching, an
extensive communication system between Phinda and local authorities was in place.
Involvement and education of these communities regarding the large felids began nine
months before the first release of cats. A series of meetings was held with representatives
from the Biyala Farmers Association (commercial farmers), the three neighbouring tribal
communities Mnqobogazi, Nibela and Mkasa, and the then KwaZulu Department of
Veterinary Services. Additionally, the representatives were taken to areas within South
Africa where lions and cheetahs exist to illustrate the role large predators play in ecological
communities as well as emphasising the tourism appeal of these species and the role of post-
release monitoring as a security safeguard. The activities culminated in the signing of a
legally binding document in which the authorities representing all local communities gave
Phinda the permission to introduce lions and cheetahs.
Part of this agreement was that no predators would be re-introduced without first
informing all local communities and that representatives would be present for all releases.
At the first lion re-introduction, as many people as possible were invited to witness the
arrival of the lions. The local chiefs of the three tribal communities and all of the tribal
elders were present along with the Biyala Farmers Association and any other interested
17
members of the surrounding communities. The concept of radio-monitoring the cats and the
transponder system of marking animals was explained and demonstrated during procedures
in which sedated cats were fitted with radio-collars and transponders prior to their release.
This was an interactive process in which people were encouraged to examine the sedated
lions and the equipment used to monitor them. This was the first time many of those present
had seen wild felids and certainly, had been given the opportunity to interact at such an
intimate level and the process generated enormous excitement. For subsequent re-
introductions, all the relevant authorities expressed satisfaction with the process so long as
they were informed and one of their representatives was present: evidently the excitement
and uncertainty apparent during the first release was much reduced later on. To ensure on-
going confidence with the felid re-introduction project, Phinda has a yearly inspection in
which local authorities are invited to the reserve for a day in which they examine the
integrity of boundary fences, and the efficacy of monitoring re-introduced cats is illustrated
with radio-collared animals in the field. Additionally Phinda has an on-going undertaking
with the communities to mark with transponders all offspring born to re-introduced felids
before they are a year of age, an agreement which also assists in the monitoring and
management of populations.
Communication with the surrounding communities regarding re-introduced felids is
excellent and indicates that the general public is largely supportive or at least, tolerant of
the project. On seven occasions when lions or cheetahs moved out of the reserve (see
Chapter 3 for details), members of the farming public informed Phinda who recovered the
cats, often assisted by farmers. In one case, lions killed R18,000 worth of wild and
domestic stock on one farm before being sighted by the land-owner who called Phinda: the
lions were recovered and the farmer was compensated for his losses.
This marks a significant change in attitude of the farming public to felids. Historical
persecution of predators by farmers in this region is widespread and land-owners are legally
permitted to shoot carnivores if they are a threat to life or livelihood. Many farmers express
a wish to avoid shooting cats if an alternative exists. I believe the process of education and
involvement initiated by Phinda management provides that mechanism for re-introduced
species. Interestingly, indigenous carnivores such as leopards and spotted hyaenas (which
were not reintroduced and therefore not perceived as Phinda’s responsibility) are still
heavily persecuted on farms in the region.

18
Techniques
Between March 1992-April 1994, Phinda released 13 lions and 15 cheetahs, (Table
2). The lions originated from the eastern Transvaal, South Africa approximately 400km
north of Phinda. Most cheetahs originated from Namibia, largely within the Otjiwarongo-
Otavi region 1900km north-west of Phinda. Two cheetahs were captured within South
Africa, a transient female darted just outside Phinda’s north-west boundary and a male
caught 915km km north-west of Phinda on the Botswana border. The re-introduction
programme took place in seven separate releases (Table 2). Each release was a separate
event and all the individuals of each group were held together prior to release. Release
events were staggered and took place from different locations within Phinda (see Fig. 2.) in
the hope that individuals had sufficient time and space to establish home ranges before other
animals were released and conversely, that the chance of newly released individuals
encountering established animals was reduced in early post-release stages.
Release Species Group composition Relatedness among
group members* Date released
1 cheetah 2 adult males 4 adult females
All unrelated. 03/92
2 lion 2 adult females Adults unrelated to all (& each other).
05/92
2 subadult males Subadults all from 3 subadult females same pride. 3 cheetah 3 adult males 2 brothers, other Γ
unrelated. 11/92
4 lion 1 adult female Unrelated to all. 02/93 3 subadult males 2 brothers, one Γ
unrelated to all.
2 subadult females Unrelated to all. 5 cheetah 3 subadult females All from same litter. 06/93 6 cheetah 1 adult female 04/94 7 cheetah 2 adult males Unrelated. 06/94
Table 2: Details of lions and cheetahs released, arranged chronologically. *No animals
from different groups were related. “Unrelated to all” means those individuals were not
related to any other animal in the group.
As Reading and Clark (1996) have stressed, much of the methodology involved in
translocation is experimental. Manipulations quantifying the results of techniques are
19
beyond the scope of most re-introduction projects and in any case, would be impractical in
the majority of situations, particularly those involving large carnivores. In this section, I
present the techniques employed. I discuss the implications of some of these techniques in
following chapter dealing with post-release behaviour.
Upon their arrival to Phinda, each release group was introduced into one of three
acclimation pens located in the reserve, shown in Figure 2. The pens measured 80m x 80m
and were constructed of 3.5m high game fencing with an inner overhang and reinforced to a
height of 1.5 m with diamond mesh cyclone fencing. The fence was buried to a depth of 1m
to discourage animals digging out of the pen. Thick existing vegetation inside the enclosure
provided animals with refuges. The inner perimeter of the pen had three electrified wires
discharging an average of 7000 volts at heights of 30cm, 1m and 2.5m. During the holding
period, the animals were provided with a complete ungulate carcase every 2-5 days
depending on the number of animals housed together, providing approximately 5kgs of meat
per day per individual. All carcases were of wild prey species rather than domestic breeds
to avoid any possible ‘imprinting’ on livestock.
In all release groups, the irregular availability of animals during the capture stage
resulted in varying familiarity (and relatedness: see table 2) among individuals. Cheetahs of
each group had been progressively introduced to one another in a holding facility in
Namibia, and had gradually become accustomed to each other with low levels of aggression
and no injury. However, in the case of the lions, the aggression between newly unfamiliar
individuals posed a greater chance of injury to animals. Therefore, 100mg of long-acting
perphenazine enanthate (trade name; Trilafon®, Schering-Plough, Isando, RSA: hereafter
perphenazine) tranquilliser was administered intramuscularly to the adult individuals of each
group in an effort to reduce aggression directed to unfamiliar, sub-adult animals (refer
Table 2). Long-acting tranquillisers including perphenazine have been widely used in
newly-captured African herbivores to overcome problems such as aggressive behaviour,
panic and intra-specific conflicts in confined areas for up to 10 days (Ebedes, 1993). Lions
on perphenazine were apparently fully aware of their surroundings but were noticeably
affected (slower movements than undrugged animals, indifference to their captivity) 10-12h
after injection and appeared unwilling to engage in aggressive encounters with unfamiliar
cage-mates. Drugged animals displayed affiliative behaviour such as cheek-rubbing and
mutual grooming to unfamiliar cage-mates after approximately 72h on perphenazine. The
danger of mixing unfamiliar, undrugged lions precluded establishing a control group not
20
treated with perphenazine so one needs to be cautious when drawing conclusions. However,
unfamiliar individuals of large carnivores, particularly lions, are notoriously difficult to mix
in captivity typically resulting in high levels of aggression, injury and death (Burroughs,
1993). The lack of such problems in the study animals suggests that perphenazine is useful
in reducing aggression in lions (and may promote the establishment of lasting affiliative
relationships between unfamiliar individuals; see Chapter 3). This is the first study where
long-acting tranquillisers were used with this aim in large carnivores but it has been widely
employed with similar results during pre-release captivity periods in subsequent
translocation efforts of carnivores in South Africa (Van Dyk, 1997).
Each release group was held for 6-8 weeks in the enclosure before release, an
arbitrary duration established by the level of habituation of animals to vehicles. Monitoring
and tourism requirements at Phinda demanded that re-introduced cats were accustomed to
vehicles and it was also felt this period would assist newly-translocated felids in recovering
from any agitation or disorientation resulting from capture and transportation. When lions
and cheetahs showed indifference to vehicles, they were released by simply opening the
feeding gates which led into the reserve proper. The animals were allowed to move out of
their own accord, usually to a carcase which had been provided outside the enclosure. This
was the last time animals were provisioned: supplemental feeding after their release did not
occur, except where animals were darted, a procedure facilitated by the presence of a bait.
GENERAL METHODOLOGY
The general methodology used throughout the study is detailed in this section. More
specific techniques are described in detail in the relevant chapters. The field work for the
study was conducted over 40 months from May 1992 to September 1995 during which time
I lived at Phinda and gathered field data daily during this period. Apart from occasional
days off, periods I was absent from the reserve for longer than 3 days were: December
1992-January 1993 (4 weeks), October 1993 (12 days), December 1993 (10 days), March
1994 (10 days), April 1994 (4 weeks), October 1994 (10 days) November 1994 (5 days),
December 1994 (6 days), April 1995 (18 days), May 1995 (9 days) July 1995 (6 days) and
August 1995 (8 days). Total time of field work amounted to over 6000 hours. I made a total
of 12 brief (up to 3 weeks) visits to the reserve between September 1995 and June 1998 to
collect episodic data (sexes of new litters, deaths of animals etc) which are included in this
study. All radio-tracking and observations were conducted from a Toyota Hi-Lux 4wheel-
21
drive. I was in constant 2-way radio contact with tourist guides in the reserve which assisted
in gathering data on some parameters (see Observation of Felids).
Immobilisation and telemetering of felids.
Certain individuals in each re-introduced group were immobilised and radio-
collared prior to their release. Efforts were made to minimize the number of radio-collars
present to reduce the aesthetic impact on the tourism experience (see Appendix II). Non-
essential collars were removed post-release after a ‘settling-in’ period, so that each pride
(lions) or male coalition (lions and cheetahs) was represented by a single collar. Collars
were replaced when their battery life expired and, where possible, were fitted to individuals
temporarily not accompanying monitored animals (for example, when lionesses left the
pride to give birth).
After release, lions and cheetahs were immobilised from the vehicle at distances up
to 30m with a Telinject G.U.T. 50 dartgun (Telinject SA, Randburg, RSA). Darting was
often greatly assisted by drawing animals to a bait, a method which anchors them to a
location and is particularly useful when more than one individual in a group needs to be
caught. Animals were usually darted early morning before the hottest part of the day and,
night-time was avoided because of the risk of harassment to drugged cats by spotted
hyaenas. The drug used was a tiletamine-zolazepam combination (Trade name; Zoletil®,
Logos Agvet, Halfway House, RSA) at 3-5mg/kg body mass for lions and 2-3 mg/kg body
mass for cheetahs. Induction time was usually 7-8 minutes and they remained anaesthetised
for 45-60 minutes. Zoletil® does not have a widely available antagonist (reversing agent) and
complete recovery can take up to 4 hours. All darted cats were observed until they were
mobile and showed negligible effects of the drug.
Radio-collars consisted of a MMK4 transmitter (TelonicsTM, Mesa, Arizona) in the
148-151 Mhz band powered by a 3.6v D-sized lithium battery and encased in dental acrylic.
The collar was made of four cm wide industrial conveyer belting, which was fitted on
animals by pop-rivetting. The whole unit weighed approximately 400g. Collars transmitted
for over two years at ranges up to 2.8 km (on level ground). One male lion was fitted with
an implantable transmitter unit (IMP 400/L, TelonicsTM, Mesa, Arizona) which was
surgically sewn to the omentum membrane inside the abdominal cavity. However, signal
range never exceeded 850m (see Appendix II) and no further implants were used. The
22
receiver used to locate animals was a Yaesu FT 290RII (Yaesu Musen Co., Tokyo, Japan)
and an aluminium four-element Yagi antenna.
Individual recognition of lions and cheetahs.
All reintroduced felids and their offspring were recognisable by individual facial
features. Cats had both sides of their faces photographed so that the unique arrangement of
whisker spots (lions) or cheek markings (cheetahs) could be used to identify animals. In the
case of cheetahs, both sides of the tail were also photographed, as the bands at the end of the
tail are unique to individuals (Caro, 1994). All cats were injected sub-cutaneously with passive
identification transponders (TrovanTM, AEG/Unidata, Rosebank, RSA: one chip each in the
neck and the flank) and were tattooed with the letter "P" on the gum above an upper canine
tooth to assist identification of sedated or dead animals. Theoretically, transponders have an
unlimited lifespan barring loss or damage. They functioned without any drawbacks for the
duration of this study and enabled identification of decomposed animals which otherwise would
have been impossible. Occasionally, transponders ‘migrated’ under the skin up to 20cm from
the point of insertion but could always be detected after some searching. Conversely, gum
tattoos, though still present after a year, were barely recognisable.
I assigned each animal a unique alpha-numeric identification following the form,
species/sex/number. So, for example, CM2 refers to cheetah male two, LF5 refers to lion
female five and so on. Numbering was sequential in each species (lions and cheetahs),
regardless of sex e.g. CM1, CM2, CF3, CF4, CF5 etc, so that each individual (within a
species) could be identified by the unique number alone. Cubs born in the reserve were
numbered sequentially according to this system and if an animal died, its number was not used
again. I refer here to all study animals by this nomenclature.
Observation of felids
Lions and cheetahs habituate to vehicles very quickly if not persecuted and largely
ignored my vehicle, occasionally resting beneath it for shade or sitting on the bonnet to observe
the surroundings. Observations were usually made from 20m-50m away but was often far
greater, particularly during hunts. An attempt was made to locate all telemetred felids once
daily between sunrise and 12:00am. Perhaps the most effective method of studying the feeding
ecology of large carnivores is to follow them for long-term continuous sessions (Mills, 1992,
1996; Packer, 1995). This was possible on a limited basis at Phinda due to dense vegetation
23
where I could not travel. Where possible, I followed active individuals from their afternoon
active period (sunset ± 2-3 hours) until they became inactive or killed. For cheetahs this period
rarely persisted after 20:00hrs but for lions it frequently extended until sunrise the following
morning. As a tourism operation, Phinda has guided game-drives operating in the early
morning and late afternoon-early evening on a daily basis. The large felids are highly sought
after by the drives and very often I directed vehicles to cats that I was not observing (though I
regularly remained at a sighting while game drives were present). In this way, I gathered data
on some parameters from more than a single animal or group at the same time and the rangers
were invaluable in providing information. I have included here only those observations of
rangers not open to interpretation e.g. species killed by cats, the time it was killed and so on.
As I was in constant radio-contact with rangers, I could collect this information as it happened
and so avoided any loss of accuracy in reporting that may have occurred with time. Where
possible, I confirmed ranger reports by visiting the site of kills.
Basic data such as animal’s location, group composition, presence of a kill and so on
were recorded in notebooks at the site, whereas more involved observations such as continuous
sampling of behaviour were recorded on a pocket dictaphone and later transcribed. I recorded
locations on a 100m x 100m grid overlaid on a 1:50,000 topographic map or with the use of a
Garmin 12 GPS unit. Depending on distance between myself and the animals, I watched them
with the naked eye or a pair of 10x40 binoculars and used a 500,000 candle-power spotlight at
night. When animals were active and mobile such as when hunting, I attempted to remain as far
as possible from them and avoided the use of the spotlight so as not to influence behaviour or
the outcome of hunts.
Statistical analysis of data.
Where data sets satisfied the assumptions of parametric statistics, these were applied.
Transformations were applied to some data before parametric statistics could be used. Failing
that, non-parametric analyses were used. Details of all analyses and transformations are given
in each chapter.
Data were analysed using Statistica and SAS software packages. Details of other
software specific to particular analyses are provided in the relevant sections.
24
CHAPTER 3.
EARLY POST-RELEASE MOVEMENTS AND BEHAVIOUR OF REINTRODUCED
LIONS AND CHEETAHS, AND TECHNICAL CONSIDERATIONS IN LARGE
CARNIVORE RESTORATION.
Although re-introduction and translocation have been widely practised management
techniques employed with large carnivores, post-release monitoring of such attempts in the past has
been poor, particularly of African species. Where such monitoring has occurred, success has
generally been low and frequently, the reasons for failure were not well understood. Such failures
have led many authors to conclude that the factors affecting success are not well enough understood
to justify relocation as a method for conserving and managing large carnivores (Panwar & Rodgers,
1986; Wemmer & Sunquist, 1988; Mills, 1991).
There may be a number of factors contributing to low project success. Many well-
intentioned translocations have moved animals from a conflict situation with humans into a
protected region (Cobb, 1981; Rogers, 1988). Typically, so-called “problem animals” are
captured on the outskirts of a protected population and either returned to that population or
translocated to another area and released. However, conservation areas, by virtue of their very
status, may already contain saturated populations of the subject species. The presence of resident
individuals at the release site is likely to have a significant effect on the establishment of
translocated animals. Indeed, in many cases, it appears that the problem of dispersing individuals
leaving parks or reserves arises because there is no room for them in the population (Maddock et
al, 1996.)
Despite this, few projects have considered this factor. The pressure from the public for
non-lethal methods of control aswell as a genuine desire on the part of local conservation or
wildlife authorities to balance the problem generally dominates such concerns and translocation is
often employed where it is unlikely to succeed. For example, of 10 livestock killing leopards
translocated to Meru National Park in Kenya, only one eventually settled in the park after
extensive movement outside. All the animals left the park within two weeks of release, almost
certainly- at least to some extent- because of the presence of resident leopards and the lack of
available habitat in which to settle (Hamilton, 1981). In the 11 years prior to this study, 96
leopards had been released in Meru but were not monitored and their fates largely unknown.
A further factor which appears in the literature frequently but has rarely been addressed
is the tendency of translocated carnivores to return to the capture site. Large felids are strongly
25
territorial (Kruuk, 1972; Bertram, 1973; Smuts, 1976, 1978; Gittleman & Harvey, 1982; Caro &
Collins, 1987) and a shift from their known territory to a strange area is likely to be one of the
dominant stress factors in the re-introduction process. Most previous efforts involving large
felids have been ‘hard-releases’ in which animals are freed at the release site as soon as possible
after translocation. Experience from non-felids suggests that ‘soft-release’ methods incorporating
a captivity period at the release site may improve project success (Linnell et al, 1997).
Intuitively, the period immediately following release will be crucial for establishment of
translocated individuals (Chivers,1991; Ruth et al, 1993). Many carnivore translocations are
characterised by large post-release movements, presumably as animals orient themselves and
assess local conditions which may be important for survival, e.g. the presence of conspecifics,
the location of water and food resources, location of suitable refuges for females to bear young,
and so on. The early post-release period is often marked by high mortality as released individuals
are exposed to increased risk of ‘death by misadventure’ due to exploratory movements and lack
of knowledge of local conditions (Comly & Vaughan, 1995).
At Phinda, the opportunity arose to assess early post-release behaviour in a
comparatively controlled environment where many of the apparent problems facing carnivore
translocation had been addressed. The reserve lacked resident populations of either lions or
cheetahs and also had low densities of potential competitors or predators such as leopards and
spotted hyaenas. Further, the entire boundary was secured with electrified fencing (Chapter 2).
Finally, translocated lions and cheetahs were held for extended periods in captivity at Phinda
prior to being released.
In this chapter, I explore the role of these factors in early post-release movement and
behaviour of re-introduced lions and cheetahs. Ultimately, all lions and cheetahs released at
Phinda which survived the early post-release period established home ranges in the reserve
(Chapter 4). Here, I attempt to assess the importance of the first 12 weeks following release in
the process of re-establishment by released felids. Based on these observations, I include
management and technical recommendations for translocation and reintroduction projects of large
carnivores.
METHODS:
Details of the pre-release period and techniques were presented in Chapter 2. Following
release of felids, I monitored their movements and behaviour by telemetry and direct observation
as described in Chapter 2. Generally, telemetred cats were located at least once every three days
26
for the entire duration of this study. In the first 12 weeks following release, all newly released
cats were located at least every second day and daily where possible. Animals showed variable
patterns of association following release (see Results) and data here is presented as groups
(containing at least one telemetred animal) which remained together for 3 months immediately
after release. Some individuals which separated from telemetred groups shortly after release were
not radio-collared until later in the study and their early post-release behaviour is poorly known.
Locations were recorded as described in Chapter 2. Direction of travel and, direction and
distance from the release site were calculated from a 1:50,000 topographic map.
Angles of direction from the release site to the capture site (home) were calculated using
reference maps of southern Africa generated by MAPPIT (geo-referenced mapping software).
For lions, the precise location of their capture site was known but for cheetahs (which originated
largely from sporadic captures by wildlife dealers in Namibia), their exact origin was rarely
recorded. In this case, circular distribution statistics (Zar, 1984:441) were used to calculate the
mean angle of direction from release sites to home using ‘general’ locations (i.e. as described by
dealers) within the Otjiwarongo- Otavi region where the cheetahs were caught.
Released cats usually remained in the vicinity of the boma once freed so data for this
analysis was included only once animals had made an initial movement (IM) away from the boma
of at least 1km. Angles of direction from the release site of all locations in the first three months
following release were calculated from location data. If cats were stationary for more than one
location, such as when feeding on a kill or mating on consecutive days, only the first location
was included in the analysis. These angles were tested for uniform distribution around 360o using
a One-sample Test for Mean Angles (Zar, 1984:445). This test calculates the 95% confidence
interval of the mean angle for a population of angles and establishes whether a specified value (in
this case, the direction of the capture site) lies within the interval (Zar, 1984:445). In other
words, as used here, it determines whether or not released lions and cheetahs showed consistent
movement towards the direction of home.
Distance travelled per day was calculated from consecutive locations, not including
locations when cats were stationary for more than one day. This measurement represents the
minimum straight-line distance between locations, not the actual distance travelled by cats on the
ground. While lions and cheetahs were often followed for much of their active period (see
Chapter 2), it was logistically impossible to constantly record actual distance travelled of all
released individuals. Distance from the release site and daily distance travelled were compared
separately for each group for the first three months following release using a one-way ANOVA.
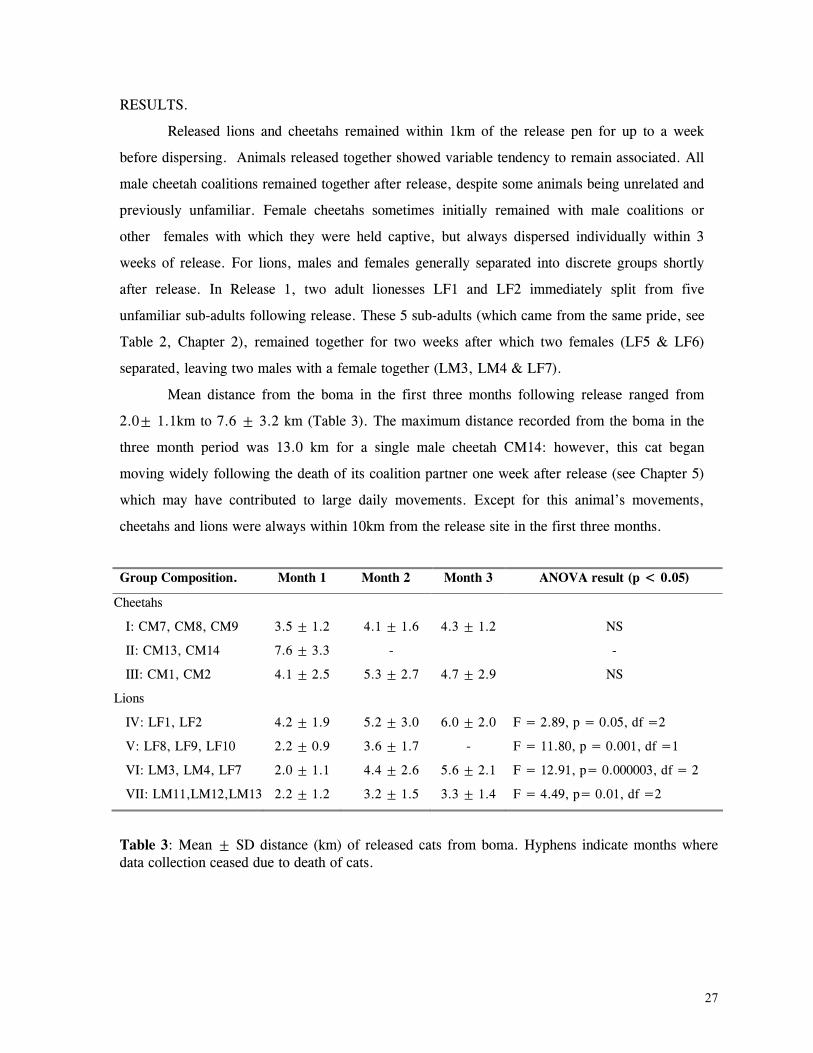
27
RESULTS.
Released lions and cheetahs remained within 1km of the release pen for up to a week
before dispersing. Animals released together showed variable tendency to remain associated. All
male cheetah coalitions remained together after release, despite some animals being unrelated and
previously unfamiliar. Female cheetahs sometimes initially remained with male coalitions or
other females with which they were held captive, but always dispersed individually within 3
weeks of release. For lions, males and females generally separated into discrete groups shortly
after release. In Release 1, two adult lionesses LF1 and LF2 immediately split from five
unfamiliar sub-adults following release. These 5 sub-adults (which came from the same pride, see
Table 2, Chapter 2), remained together for two weeks after which two females (LF5 & LF6)
separated, leaving two males with a female together (LM3, LM4 & LF7).
Mean distance from the boma in the first three months following release ranged from
2.0± 1.1km to 7.6 ± 3.2 km (Table 3). The maximum distance recorded from the boma in the
three month period was 13.0 km for a single male cheetah CM14: however, this cat began
moving widely following the death of its coalition partner one week after release (see Chapter 5)
which may have contributed to large daily movements. Except for this animal’s movements,
cheetahs and lions were always within 10km from the release site in the first three months.
Group Composition. Month 1 Month 2 Month 3 ANOVA result (p < 0.05)
Cheetahs
I: CM7, CM8, CM9 3.5 ± 1.2 4.1 ± 1.6 4.3 ± 1.2 NS
II: CM13, CM14 7.6 ± 3.3 - -
III: CM1, CM2 4.1 ± 2.5 5.3 ± 2.7 4.7 ± 2.9 NS
Lions
IV: LF1, LF2 4.2 ± 1.9 5.2 ± 3.0 6.0 ± 2.0 F = 2.89, p = 0.05, df =2
V: LF8, LF9, LF10 2.2 ± 0.9 3.6 ± 1.7 - F = 11.80, p = 0.001, df =1
VI: LM3, LM4, LF7 2.0 ± 1.1 4.4 ± 2.6 5.6 ± 2.1 F = 12.91, p= 0.000003, df = 2
VII: LM11,LM12,LM13 2.2 ± 1.2 3.2 ± 1.5 3.3 ± 1.4 F = 4.49, p= 0.01, df =2
Table 3: Mean ± SD distance (km) of released cats from boma. Hyphens indicate months where data collection ceased due to death of cats.

28
There was a general trend for animals to move more widely from the boma after the first
month. For all lions groups, this trend was significant (Table 3): however, it was not significant for
any cheetahs. The mean daily distance travelled by released felids ranged from 1.2 ± 0.7km to 3.4
± 1.2 km. The greatest distance travelled in 24hrs for each species was 16.2km (cheetahs) and
11km (lions). Daily distance travelled generally did not differ between months: it increased
significantly beyond the first month for two lion groups (Table 4).
GROUP Month 1 Month 2 Month 3 ANOVA result (p < 0.05)
Cheetahs
I: CM7, CM8, CM9 1.5 ± 0.5 2.7 ± 2.2 2.5 ± 0.9 NS
II: CM13, CM14 3.0 ± 4.3 - -
III: CM1, CM2 2.0 ± 1.8 2.1 ± 1.5 2.7 ± 1.4 NS
Lions
IV: LF1, LF2 3.1 ± 2.9 2.1 ± 1.3 2.6 ± 1.5 NS
V: LF8, LF9, LF10 1.2 ± 0.7 1.9 ± 1.2 - F = 5.45, p = 0.02, df = 1
VI: LM3, LM4, LF7 1.4 ± 0.6 2.5 ± 1.5 2.1 ± 2.1 NS
VII: LM11,LM12,LM13 1.6 ± 0.9 3.4 ± 1.2 2.8 ± 1.4 F = 9.91, p = 0.0002, df = 2
Table 4: Mean ± SD daily distance (km) travelled by released cats.
Figures 6-8 show the direction of lion and cheetah locations from the boma. In three groups, the
direction home was contained within the 95% confidence interval of their mean angle of
movement for the first two months following release. This suggests that direction of movement
for these three groups was consistently towards the capture site; that is, they exhibited homing
behaviour (Table 5).
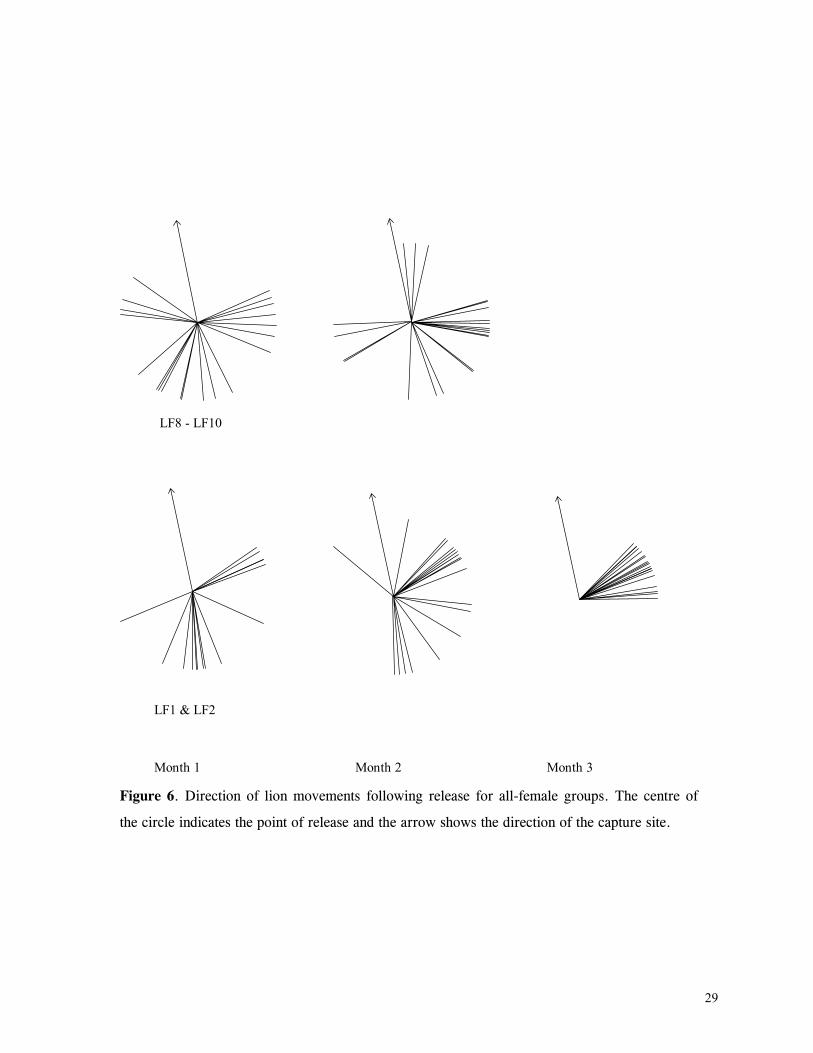
29
LF8 - LF10
LF1 & LF2
Month 1 Month 2 Month 3
Figure 6. Direction of lion movements following release for all-female groups. The centre of
the circle indicates the point of release and the arrow shows the direction of the capture site.

30
LM3, LM4 & LF7*
LM11 - LM13
Month 1 Month 2 Month 3
Figure 7: Direction of lion movements following release for all-male (or male dominated)
groups. The centre of the circle indicates the point of release and the arrow shows the direction
of the capture site.
*LM3 & LM3 were released with three lionesses, LF5 - LF7. LF5 and LF6 remained with the
group for two weeks following release and then separated (see text).

31
CM 13 & CM14
CM2 & CM3*
CM7 - CM9
Month 1 Month 2 Month 3
Figure 8: Direction of movements by cheetahs following release. The centre of the circle
indicates the point of release and the arrow shows the direction of the capture site.
*CM1 & CM2 were accompanied by four cheetah females CF3 - CF6 for the first month,
during which the females separated individually from the group and remained solitary thereafter.
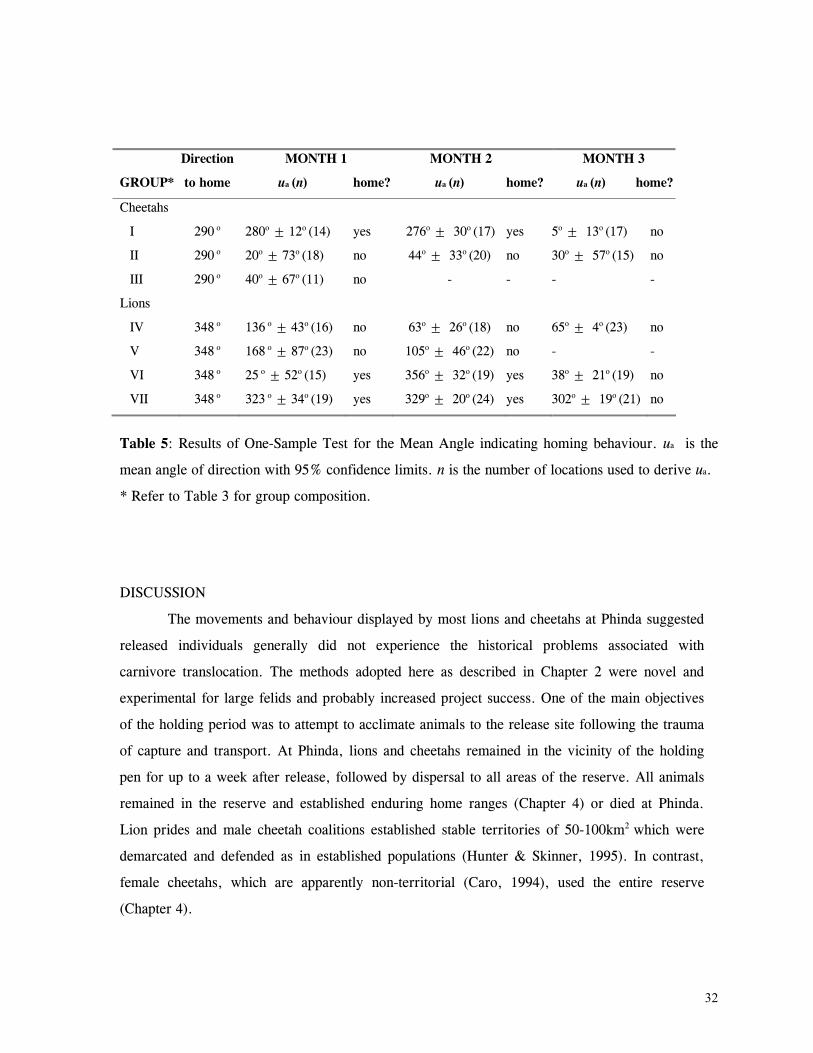
32
Direction MONTH 1 MONTH 2 MONTH 3
GROUP* to home ua (n) home? ua (n) home? ua (n) home?
Cheetahs
I 290 o 280o ± 12o (14) yes 276o ± 30o (17) yes 5o ± 13o (17) no
II 290 o 20o ± 73o (18) no 44o ± 33o (20) no 30o ± 57o (15) no
III 290 o 40o ± 67o (11) no - - - -
Lions
IV 348 o 136 o ± 43o (16) no 63o ± 26o (18) no 65o ± 4o (23) no
V 348 o 168 o ± 87o (23) no 105o ± 46o (22) no - -
VI 348 o 25 o ± 52o (15) yes 356o ± 32o (19) yes 38o ± 21o (19) no
VII 348 o 323 o ± 34o (19) yes 329o ± 20o (24) yes 302o ± 19o (21) no
Table 5: Results of One-Sample Test for the Mean Angle indicating homing behaviour. ua is the
mean angle of direction with 95% confidence limits. n is the number of locations used to derive ua.
* Refer to Table 3 for group composition.
DISCUSSION
The movements and behaviour displayed by most lions and cheetahs at Phinda suggested
released individuals generally did not experience the historical problems associated with
carnivore translocation. The methods adopted here as described in Chapter 2 were novel and
experimental for large felids and probably increased project success. One of the main objectives
of the holding period was to attempt to acclimate animals to the release site following the trauma
of capture and transport. At Phinda, lions and cheetahs remained in the vicinity of the holding
pen for up to a week after release, followed by dispersal to all areas of the reserve. All animals
remained in the reserve and established enduring home ranges (Chapter 4) or died at Phinda.
Lion prides and male cheetah coalitions established stable territories of 50-100km2 which were
demarcated and defended as in established populations (Hunter & Skinner, 1995). In contrast,
female cheetahs, which are apparently non-territorial (Caro, 1994), used the entire reserve
(Chapter 4).

33
One cheetah group and two lion groups showed evidence of homing behaviour, in all
cases, for the first two months after release. All the groups were male coalitions or male-
dominated. In the case of lions, the groups were composed largely of sub-adult males which are
generally the main dispersing cohort in established lion populations (Schaller, 1972; Hanby et al,
1995). The cheetah coalition which showed homing behaviour also comprised young males,
though they were adults approximately three to four years old. In contrast, young animals of
dispersal age in translocated black bears and pumas displayed the weakest homing behaviour
(Rogers, 1986; Ruth et al, 1993). This suggests that, despite the captivity period, some animals
may still retain an urge to home for at least for two months following release. The male lions
released at Phinda were mostly captured from stable prides, in all cases, before they were 18mo
which is younger than the age at which they normally disperse (Pusey & Packer, 1987). Although
these animals foraged successfully and all survived for at least one year after release (Chapter 5),
slightly older animals may be better suited to translocation.
Nonetheless, relative to other projects, none of the Phinda animals showed persistent
patterns of homing behaviour. Despite their early movements being oriented to home, young
male lions and cheetahs at Phinda did not wander more extensively than adults (Tables 3 and 4)
and in no cases, did they remain at fencelines for extended periods. Many translocated carnivores
demonstrate a marked ability to return to a capture site hundreds of kilometres away, or failing
that, make wide post-release movements in the direction of home (Linnell et al, 1997). Data on
felids is sparse but a few well-documented cases illustrate this tendency. Of 13 hard-released
mountain lions translocated an average of 477km, 10 that survived beyond 3.5 months of release
all displayed consistent, large movements towards the direction of home (Ruth et al, 1993). Four
mountain lions held for a week prior to release also made early post-release movements towards
home but eventually established home ranges within 32 km of the release site (Belden &
Hagedorn, 1993).
As Moore and Smith (1990) indicate in a discussion on re-introduction of the red wolf, a
pre-release holding period may be an important factor in reducing the tendency to home. The
captivity stage appears to acclimate animals to changes in their environmental and locational
conditions, thereby enabling acceptance of the new locality more rapidly. As a result, there may
be greater motivation to shift geographical fidelity and reduce homing behaviour. This was
generally the case in the Phinda animals. Having said this, these observations need to be
interpreted with caution. Other factors such as the location of herbivore aggregations or the
suitability of habitat may have influenced the initial movement patterns of cats. I do not have the
34
data to eliminate these potential factors and therefore cannot say with certainty that the observed
‘homing’ actually indicated an inclination to return to the capture site.
An essential aspect of encouraging site fidelity in released felids was exposing them to
electrified fencing prior to release to discourage breaches of the reserve's boundary fence.
Although I obviously could not ascertain the movements of animals if the fence was absent, there
is little doubt they would have moved beyond the boundary of the reserve if it was not secure.
Nonetheless, lions and cheetahs could easily cross this fence if inclined and I observed several
other species breaking through it (i.e.impala, nyala, kudu, zebra), going under it (i.e. hyaena,
leopard, warthog, wild dog) and climbing over it (i.e. leopard). While cats were in captivity,
contact with the boma’s electrified fence occurred during the first 2-3 days of their captivity,
after which the fence was avoided. Since their release, no lions or cheetahs have been recorded
actively attempting to either scale or dig under the boundary fence. “Passive” escapes, i.e.
escape through holes in the fence created by other species or by crossing electrified cattle grids at
unfenced entry gates, occurred on eight occasions by cheetahs and six occasions by lions. These
individuals returned to the reserve of their own volition (seven occasions), were recovered by
darting (five occasions) or were not recovered (two occasions, see Chapter 5).
Other observations suggest that avoidance behaviour of the fence assists in discouraging
break-outs, despite considerable incentive. Cheetahs and lions regularly sat at the fence observing
wild and domestic ungulates on adjacent land. On five occasions, I observed domestic cattle on
neighbouring property approach lions resting next to the fence to within 5-30 metres. The lions
displayed intense interest in the cattle, stalking them to the fenceline and then losing interest
when the cattle moved away. Once, two lionesses reacted highly aggressively to dogs in a vehicle
driving alongside the fenceline on a neighbouring property. The lionesses chased the vehicle for
1600m alongside the fence until it turned away. They ran repeatedly up and down the fence for a
further 20 minutes before losing interest. In another incident, hunting lions pursued a zebra into
the fence which it broke through, leaving a 3m break. Despite the hole, the lions discontinued
their chase at the fenceline, watching the zebra flee on the other side.
Although carnivores are notorious for ignoring fences (Linnell et al, 1996; Mizutani &
Jewell, 1998), a period of captivity during which they are exposed to electrified fencing appears
to be valuable in restricting post-release movements. Clearly, this is only of use where the
resources exist to fence the release site. South Africa is unusual in that most conservation areas
are fenced and indeed, conservation authorities demand it to permit to release of large cats. In
other regions where the restoration of carnivores is being attempted, the use of fencing should be
35
considered. For example, a proposal to establish a second population of the Asiatic lion which
presently only occurs in a single location in the Gir Forest is considering temporary fencing for
the early post-release stages based on the South African experience (Chellam, pers. comm.1 )
Unfamiliar animals socialised during captivity often remained together following release,
in contrast to observations from other social carnivores, particularly wolves (Fritts, 1992). Upon
release, two unrelated and previously unfamiliar lionesses remained together for 23 months until
the death of one female. Cubs born to these lionesses were treated by the other female with
affiliative behaviours typical of related animals, namely allosuckling, grooming and play. In
another release, an adult lioness remained with two unfamiliar sub-adult females for three
months, at which time they were responsible for the death of a human and were destroyed (see
Chapter 5). A trio of male lions comprising 2 brothers, LM11 and LM12, and an unrelated
animal, LM13 remained together. Three male cheetah coalitions comprising at least one
unfamiliar animal remained together following release. Two cases were unrelated male pairs who
stayed together until the death of one animal (36 months and 1 week after release respectively).
In another case, two males were brothers while the third animal was unrelated and unfamiliar.
This trio remained together after their release until the unrelated male was killed in a wire snare
4 months later. In all cases, individuals displayed very frequent affiliative behaviour such as
mutual grooming and play during their association.
In social carnivores, a lack of social stability in a population results in increased mortality
and movement (Caro & Collins, 1987; Orford et al, 1988, Stander, 1990). These are particularly
undesirable characteristics for re-introduced populations. However, cohesive family groups or
coalitions are rarely available for translocation in Africa. Additionally, the need exists to manage
individuals in conflict with humans. For example, lions leaving the boundaries of protected areas
and moving into farming areas are mostly lone individuals or small groups (Anderson, 1981;
Venter & Whateley, 1984; Stander, 1990), Similarly, in Namibia and Zimbabwe, opportunistic
capture of "problem" cheetahs by livestock and game farmers frequently results in single animals
becoming available, most of them males (Marker-Kraus et al, 1996; Zank & DuToit, 1996).
Acquisition of such animals as they become a problem and a period of captivity appears to be of
use in establishing socialised groups better suited for re-introduction purposes. In the case of
highly aggressive species such as lions, use of long-acting tranquillisers (as described in Chapter
2) may facilitate this process.
1 Chellam, R. Wildlife Institute of India, PO Box 18, Chandrabani, Dehra Dun 248 001, India.
36
The impact of stochastic events in the early post-release period is difficult to quantify but
probably has a marked effect on ranging patterns of re-introduced felids. One of a pair of male
cheetahs, CM13, was killed a week after release. The remaining animal CM14 wandered widely
covering an average of 10km ± 3.5 km per day until he entered the occupied territory of another
cheetah coalition and was killed (Hunter & Skinner, 1995: Chapter 5). Interestingly, this animal
had encountered the same coalition prior to the death of his companion without incident. The two
pairs sat watching each other about 60m apart for nine hours after which they moved off in
separate directions. In a reintroduction scenario, individuals which experience significant
disturbance shortly after release and display extensive movement might be better off if
recaptured. In the case of male cheetahs, such individuals could be exposed to a further pre-
release captivity period with another male or males to attempt to forge a coalition which would
probably have a greater chance of surviving and establishing a territory.
Sample size was too small to compare early releases (i.e. those where no other
conspecifics were present) with later releases which potentially had to contend with the
established individuals of prior releases. However the only cheetah coalition (Group III) which
encountered residents within the first three months following release moved the greatest distance
from the boma and the greatest daily distance for all male cheetah groups following the encounter
(Tables 3 and 4). This suggests that the presence of resident cats may affect the likelihood of
animals remaining near the release site which earlier studies have suggested (Hamilton, 1981).
Conversely, Fritts and co-workers found that the presence of resident wolves at the release site
did not appear to affect post-release behaviour of translocated animals (Fritts et al, 1984).
The strategy of locating release points in different places at the release area may have
reduced the potential for conflict between reintroduced individuals. Animals tended to remain
near the release boma and there were only two incidents of animals from later releases
encountering previously released conspecifics in the first three months. In one case involving two
coalitions of males cheetahs (described above), both coalitions had been housed in the same
boma. In the other case, two groups of lionesses encountered one another when LF5 & LF7
(‘early release’) moved far from their normal range and encountered LF8, LF9 and LF10 (‘late
release’) The latter animals chased the pair off. The release bomas at Phinda were located only
16 km apart, which a lion or cheetah could easily traverse in 24 hours. Experience from this
study suggests that, where possible, multiple release points should be established in a restoration
effort to enhance success.
37
Clearly, the problems facing reintroduction projects of large felids are considerable.
Aside from ecological and biological considerations, methodology and technical elements may
contribute significantly to a project’s outcome (Reading & Clark, 1996). Experience from the
current research suggests the importance of the latter should not be underestimated and, as in the
case of the planning of Phinda, considerable resources should be allocated to this element. It
remains to be seen whether these techniques would have similar results in other carnivore
species. Preliminary observations from other projects in South Africa suggests that other social
species such as wild dogs and spotted hyaena may benefit from these considerations (Hofmeyr,
pers. comm2). It would be of interest to apply these techniques to endangered carnivores in other
regions. Proposals for the reintroduction of the Asiatic lion and the Asiatic cheetah in India and
the Middle East (Nowell & Jackson, 1996) may present the opportunity to apply this knowledge
elsewhere.
2 Hofmeyr, M. Madikwe Game Reserve, North West Parks Board, PO Box 4124, Rustenburg, 0300, South Africa.
38
CHAPTER 4.
CHARACTERISTICS OF HOME-RANGE ESTABLISHMENT AND HABITAT USE
IN REINTRODUCED LIONS AND CHEETAHS.
Lions and cheetahs display far greater degrees of sociality than most other felids
and this has important implications for their ranging dynamics. As the only cat species
which lives in extended family groups, lions exhibit complex patterns of territoriality which
have fundamental implications on their spatial organisation. Related females live in stable
social groups which may occupy the same range for generations and generally exclude
unrelated females (Hanby et al, 1995). Coalitions of males associate with the female groups
and attempt to defend from other males an area which encompasses one or more prides
(Pusey & Packer, 1994; Hanby et al, 1995). In cheetahs, females appear to be non-
territorial and may occupy home-ranges as large as 1500km2 (Caro, 1994; Marker-Kraus et
al 1996). Male cheetah ranging behaviour, however, resembles patterns observed in lions in
that, where possible, coalitions of males establish exclusive territories and defend them
from other males in occasionally fatal clashes (Caro & Collins, 1986; Caro, 1994; Hunter
& Skinner, 1995; Appendix III).
The main factor determining establishment and spatial characteristics (particularly
size) of territories and home-ranges in felids is resource availability (Sandell, 1989;
Kitchener 1991; Caro, 1994; Mizutani & Jewell, 1998). The size of female home-ranges is
generally determined by prey density, availability and distribution, and will also be affected
by the availability and spacing of suitable den sites for rearing cubs (Sandell, 1989; Caro,
1994; Bothma et al, 1997). Male home-ranges are usually larger and may overlap a number
of female ranges, presumably to increase mating opportunities (Sandell, 1989; Bailey,
1993).
Considerable variation has been observed in lion and cheetah range size due to these
factors. Hanby et al (1995) demonstrated that lion ranges on the Serengeti Plains where
food supplies were ephemeral and den sites for cubs were widely scattered averaged almost
five times as large as ranges in superior habitat in Ngorongoro Crater where density of food
and den-sites was greater and more evenly distributed. Similarly, Van Ordsol (1982) and
Van Ordsol et al (1985) demonstrated that range size underwent a reduction when there was
an increase in lean season biomass in good years. Stander (1991) reported pride size in the
arid Etosha National Park may be as large as 2075km2, presumably due to migratory
movements and low density of ungulates.

39
In cheetahs, Serengeti females followed migratory gazelles and had home ranges larger than
800km2 (Durant et al, 1988). In Namibia, female ranges were almost twice that size
(Morsbach, 1986). Amongst male Serengeti cheetahs, the average size of territories was
37.4km2 (Caro, 1994) whereas for non-territorial males (usually singletons unable to defend
a territory), home-range size averaged 777km2. The main determinants of territory location
were a combination of adequate cover and adequate densities of Thomson’s gazelles (Caro,
1994).
Very few data are available on home-range and territory characteristics for
reintroduced felids. Ruth et al (1993) considered three translocated mountain lions to have
established home ranges after six months constant use of an area, but few additional details
are provided. Similarly, Hamilton (1981) established that one translocated female leopard
‘eventually settled’ at the release site but further details are unknown. Although there have
been numerous successful efforts to re-establish lynx in some European countries
(Breitenmoser & Breitenmoser-Wursten, 1990; Yalden, 1993), there are very few data on
their movements following release and the process by which they establish home ranges.
While lion and cheetah spatial patterns have been well-studied in established populations in
numerous ecosystems, they are not known from translocation or reintroduction scenarios.
A reintroduction project such as at Phinda offers opportunities to explore aspects of
felid spatial patterns which would not be possible in established populations. There were no
resident or, even transient lions or cheetahs at Phinda, so the movements and behaviour of
released individuals were not constrained by the presence of conspecifics. Available habitat
was highly heterogeneous (Fig. 5, Chapter 2) so that felids had a ‘choice’ of suitable
habitats in which to settle. Finally, ungulates were non-migratory and existed in high
densities in all habitats in approximately even distributions throughout the reserve (Chapter
7) so that felids may not have had to make large movements in order to secure prey.
In the previous chapter, I examined the movement patterns of reintroduced felids
immediately following release. In this section, I examine the home-range and movement
characteristics of lions and cheetahs over the entire duration of the study. I present details of
the home-range patterns of reintroduced lions and cheetahs. I attempt to explore the process
of home-range establishment by felids in an environment in which some factors affecting
spatial patterns in established populations were absent or minimal. I examine differences in
seasonal ranges and the presence of young cubs on female ranging behaviour. Finally, I
include some management and technical considerations pertaining to lion and cheetah
ranging patterns and habitat use which may assist future reintroduction efforts.
40
METHODS
Lions and cheetahs were located by radio-telemetry and their positions recorded as
specified in Chapter 2. Radio-collared cats were located as frequently as twice daily, though
this generally varied from between daily to every third day. I also recorded all opportunistic
sightings of non-telemetred cats which, naturally, were not as frequent (Table 6). Mindful
of the problem of autocorrelation of data (Rooney et al, 1998), I took the minimum time
interval between fixes for all analyses as one day. Autocorrelation of tracking data is the
phenomenon whereby the position of an animal at time t + ? t is not independent of its
position at time t (Rooney et al, 1998). If data are highly autocorrelated, the estimation of
home range size can be underestimated (Swihart & Slade, 1985) and interpretation of range
utilisation can be erroneous (Cresswell & Smith, 1992). The simplest way to deal with the
problem assumes that the time to independence between successive locations (i.e. the
shortest time between two data points which are not autocorrelated) will be the time it takes
an animal to traverse its home range. Accordingly, as lions and cheetahs could and often did
cross their home range easily within one day, that was the minimum frequency at which I
subsampled the data for analysis. If cats were stationary for more than one location, such as
when feeding on a kill or mating on consecutive days, only the first location was included in
the analysis. Daily locations have been used previously for similar analyses in large felids
with meaningful results (Mizutani & Jewell, 1998).
All location points were plotted and analysed using ArcView Geographical
Information System (GIS) software (version 3.0). I used a recently developed extension
package for ArcView which analyses animal movements and ranges (Hooge & Eichenlaub,
1998) in conjunction with the Spatial Analyst facility of ArcView. I adopted the kernel
utilisation distribution as the method of home range analysis for my data. The kernel
method is a probability density estimation which calculates the home range of an animal in
terms of the relative amount of time that an animal spends in different areas of the range
(Worton, 1987, 1989, 1995; Seaman & Powell, 1996). In other words, the density of points
at any location is an estimate of the amount of time spent there. This is potentially very
revealing about patterns of location use and preference (Worton, 1995; Seaman & Powell,
1996), and has been demonstrated to be an accurate method to meaningfully calculate range
size (Worton, 1995; Seaman & Powell, 1996). It was suited for data from Phinda in which
animal ranging patterns were constrained by boundary fences which less sophisticated
estimators of home ranges such as the widely used minimum convex polygon (Kenward,
1987) and Jennrich-Turner (Jennrich & Turner, 1969) methods do not easily accommodate.
41
Kernel methods are increasingly being adopted due to their advantages over more traditional
methods (Worton, 1995) and have been used formerly for analysis of home range patterns
in large carnivores (Seaman & Powell, 1996; Bothma et al, 1997; Powell et al, 1998.)
For all monitored animals, I have presented the 50% and 95% utilisation
distributions for the entire time for which they were monitored following release. I have
termed this the total home range. The 50% and 95% probabilities are generally considered
the most robust estimators of an animal’s centre of activity (or ‘core area’) and total range
size excluding excursions or ‘outliers’ (Mizutani & Jewell, 1998) respectively. For
interest’s sake, I have also included the 75% probability distribution in the total home range
estimations.
I also examined factors which may reasonably be expected to influence range size.
In the case of females which may reduce range size when lactating (Sandell, 1989;
Laurenson, 1995b), I analysed home range sizes for the periods in which they had young
cubs. For the sake of this analysis, I took young cubs as being four months old. Although
both lion and cheetah cubs often emerge from den-sites younger than this, they are
frequently left hidden while the mother hunts. After the age of four months or thereabouts,
cubs of both species are capable of accompanying the mother(s) all the time (Caro, 1994;
Laurenson, 1995b; pers. obs, this study).
I also examined seasonal differences in range sizes, comparing the dry winter (April
to September) to the wet summer (October to March: see Chapter 2). Van Ordsol et al
(1985) demonstrated expansion in lion range size during summer when herbivore
distribution was far more widespread than in winter. At Phinda, it small size, total
enclosure by fences and presence of artificially maintained sources of water may moderate
this effect. Finally, I analysed some data to look at the effect of certain stochastic events on
ranging patterns, in particular, the death of companions or of neighbours, and movements
following territory take-overs or expulsions. I provide specific details of these factors in the
relevant sections.
Finally, I also made some estimation of reintroduced lion and cheetah habitat use. I
calculated the density of locations for each animal in different habitat types and compared
this to random distribution by a chi-squared analysis. I calculated the ‘expected’ habitat use
(i.e. the distribution of ‘available’ habitats) separately for each animal, rather than simply
adopt the distribution of habitat types for the entire reserve (see Fig. 5, Chapter 2).
Although cats could easily traverse the entire reserve (and in some cases, did so), some
individuals never visited certain areas. Accordingly, they may never have used certain
habitat types or areas simply by virtue of not knowing they existed. Therefore, I derived a
minimum convex polygon which encompassed every location point (including all

42
excursions) for each individual, and within that area, I calculated the area of each habitat
type. In other words, available habitat figures were derived only for areas that each
individual had visited and therefore, of which it might reasonably be expected to have some
knowledge.
RESULTS
LIONS
Total home range
Total home range estimations for all monitored lions are presented in Figures 9 -
14. Lion home ranges (95% Kernel) ranged from 27.56km2 for the lone lioness LF2 to
130.20 km2 for a 3-male coalition (LMs11-13). Mean home-range size of lionesses (one,
two or three individuals) was 52.83 km2 ± 35.68 km2 (range: 27.56km2 - 105.60km2, n =
3). Prior to associating permanently till their deaths with LFs1-2 (see Table 6), the brothers
LMs 3-4 had a home range of 35.27 km2. Core areas (50% Kernel) averaged 6.78 km2 ±
5.21 km2 for females (n = 4) and 15.18 km2 ± 14.03 km2 for male coalitions (n = 2).
Seasonal home ranges
Kernel estimations for seasonal home ranges of lions are presented in Table 7. For
all lionesses combined, mean winter home range (95%) was 27.58km2 ±18.31 km2
compared to mean summer range of 47.25 km2 ± 19.97 km2 which was significantly
different (t = -1.83, p = 0.048, df = 11). Mean core areas (50%) for lionesses shrank
from 7.48 km2 ± 4.98 km2 in the summer to 3.12 km2 ± 2.68 km2 in the winter (t = -1.91,
p = 0.04, df = 11). For males, mean 95% range size in the summer was 126.85 km2 ±
9.29 km2 compared to 84.10 km2 ± 50.51 km2 in the winter which was not significantly
different (t = -1.64, p = 0.09, df = 3). Mean core area (50%) for males was 37.73 km2 ±
0.93 km2 in the summer and 17.73 km2 ± 16.08 km2 in the winter which was significantly
different (t = -2.49, p = 0.04, df = 3).
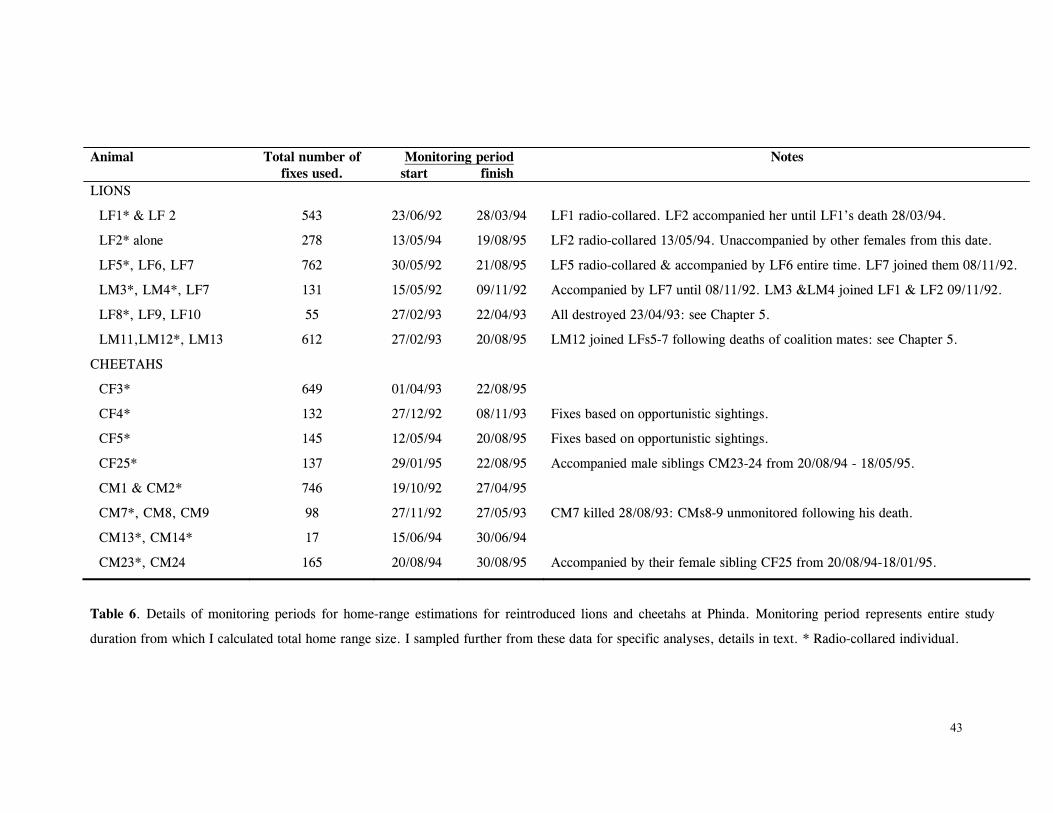
43
Animal Total number of fixes used.
Monitoring period start finish
Notes
LIONS
LF1* & LF 2 543 23/06/92 28/03/94 LF1 radio-collared. LF2 accompanied her until LF1’s death 28/03/94.
LF2* alone 278 13/05/94 19/08/95 LF2 radio-collared 13/05/94. Unaccompanied by other females from this date.
LF5*, LF6, LF7 762 30/05/92 21/08/95 LF5 radio-collared & accompanied by LF6 entire time. LF7 joined them 08/11/92.
LM3*, LM4*, LF7 131 15/05/92 09/11/92 Accompanied by LF7 until 08/11/92. LM3 &LM4 joined LF1 & LF2 09/11/92.
LF8*, LF9, LF10 55 27/02/93 22/04/93 All destroyed 23/04/93: see Chapter 5.
LM11,LM12*, LM13 612 27/02/93 20/08/95 LM12 joined LFs5-7 following deaths of coalition mates: see Chapter 5.
CHEETAHS
CF3* 649 01/04/93 22/08/95
CF4* 132 27/12/92 08/11/93 Fixes based on opportunistic sightings.
CF5* 145 12/05/94 20/08/95 Fixes based on opportunistic sightings.
CF25* 137 29/01/95 22/08/95 Accompanied male siblings CM23-24 from 20/08/94 - 18/05/95.
CM1 & CM2* 746 19/10/92 27/04/95
CM7*, CM8, CM9 98 27/11/92 27/05/93 CM7 killed 28/08/93: CMs8-9 unmonitored following his death.
CM13*, CM14* 17 15/06/94 30/06/94
CM23*, CM24 165 20/08/94 30/08/95 Accompanied by their female sibling CF25 from 20/08/94-18/01/95.
Table 6. Details of monitoring periods for home-range estimations for reintroduced lions and cheetahs at Phinda. Monitoring period represents entire study
duration from which I calculated total home range size. I sampled further from these data for specific analyses, details in text. * Radio-collared individual.
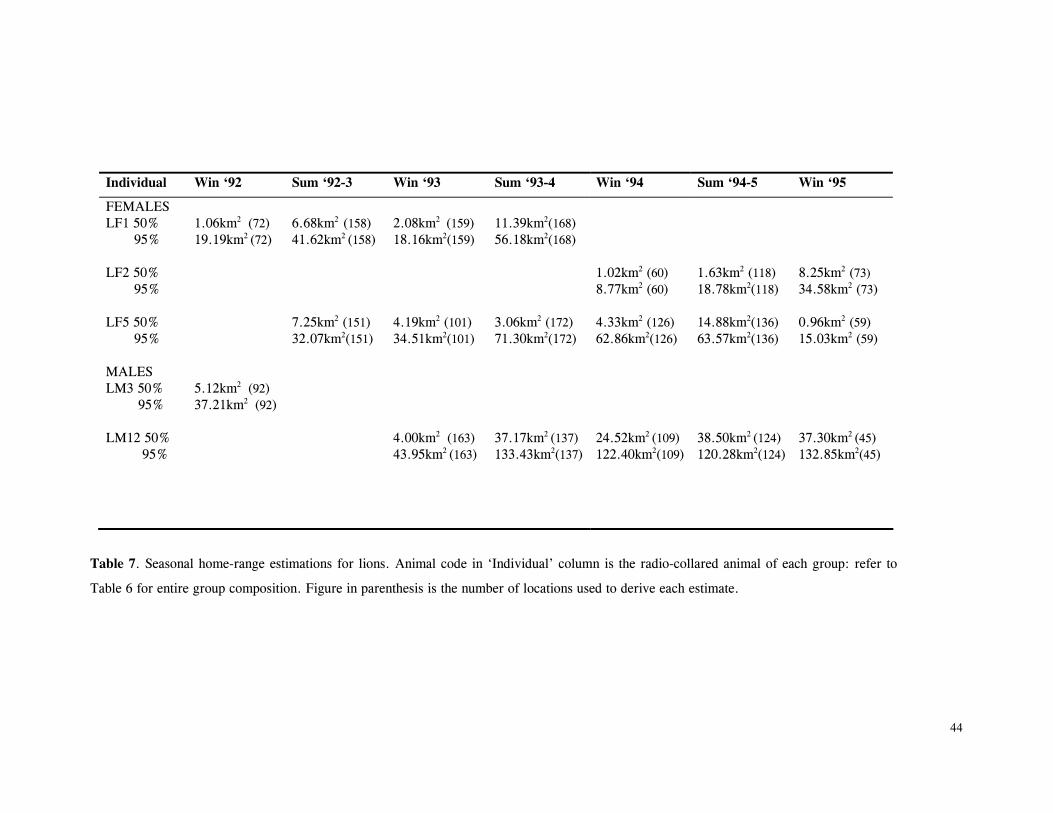
44
Individual Win ‘92 Sum ‘92-3 Win ‘93 Sum ‘93-4 Win ‘94 Sum ‘94-5 Win ‘95
FEMALES LF1 50% 1.06km2 (72) 6.68km2 (158) 2.08km2 (159) 11.39km2(168) 95% 19.19km2 (72) 41.62km2 (158) 18.16km2(159) 56.18km2(168) LF2 50% 1.02km2 (60) 1.63km2 (118) 8.25km2 (73) 95% 8.77km2 (60) 18.78km2(118) 34.58km2 (73) LF5 50% 7.25km2 (151) 4.19km2 (101) 3.06km2 (172) 4.33km2 (126) 14.88km2(136) 0.96km2 (59) 95% 32.07km2(151) 34.51km2(101) 71.30km2(172) 62.86km2(126) 63.57km2(136) 15.03km2 (59) MALES LM3 50% 5.12km2 (92) 95% 37.21km2 (92) LM12 50% 4.00km2 (163) 37.17km2 (137) 24.52km2 (109) 38.50km2 (124) 37.30km2 (45) 95% 43.95km2 (163) 133.43km2(137) 122.40km2(109) 120.28km2(124) 132.85km2(45)
Table 7. Seasonal home-range estimations for lions. Animal code in ‘Individual’ column is the radio-collared animal of each group: refer to
Table 6 for entire group composition. Figure in parenthesis is the number of locations used to derive each estimate.

45
Figure 9. Kernel estimation (50%, 75% and 95% probability) of the home range of the
lionesses LF1 and LF2.
Areas: 50% (Black): 1.79 sq.km, 75% (Dark Gray): 10.10 km, 95% (Light Gray): 42.23
sq. km.
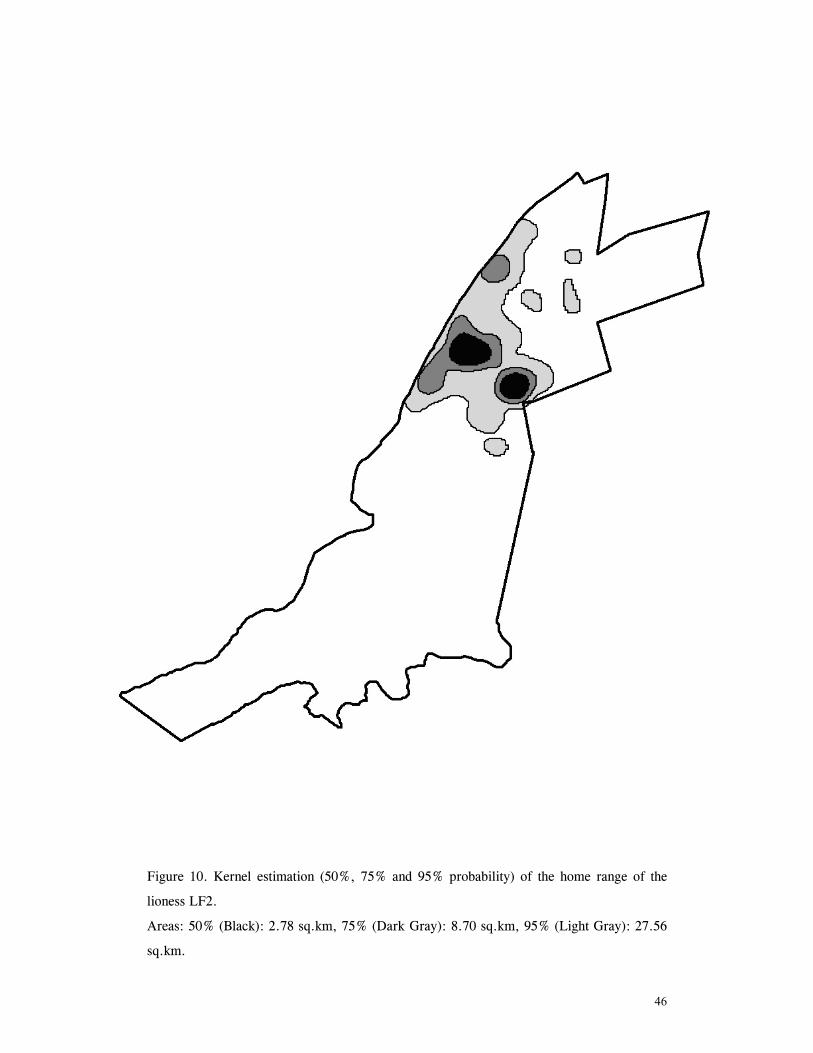
46
Figure 10. Kernel estimation (50%, 75% and 95% probability) of the home range of the
lioness LF2.
Areas: 50% (Black): 2.78 sq.km, 75% (Dark Gray): 8.70 sq.km, 95% (Light Gray): 27.56
sq.km.

47
Figure 11. Kernel estimation (50%, 75% and 95% probability) of the home range of the
lionesses LF5, LF6 and LF7.
Areas: 50% (Black): 11.76 sq.km, 75% (Dark Gray): 51.06 sq.km, 95% (Light Gray):
105.60 sq.km.
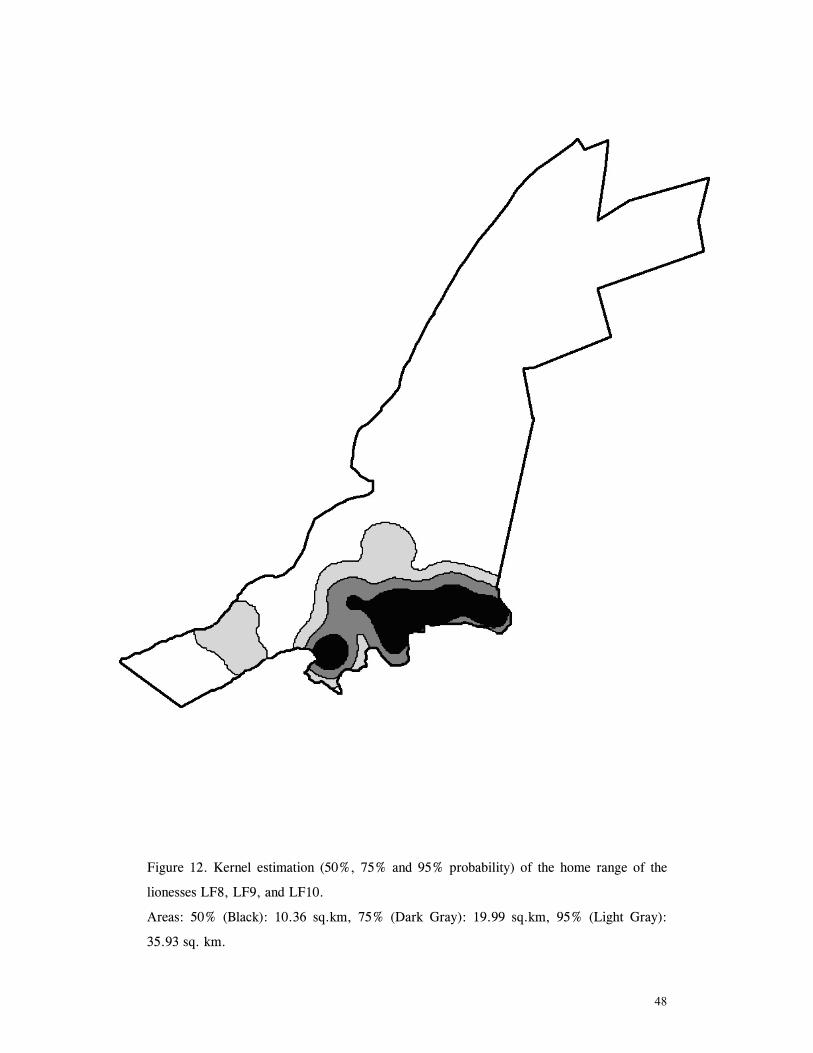
48
Figure 12. Kernel estimation (50%, 75% and 95% probability) of the home range of the
lionesses LF8, LF9, and LF10.
Areas: 50% (Black): 10.36 sq.km, 75% (Dark Gray): 19.99 sq.km, 95% (Light Gray):
35.93 sq. km.

49
Figure 13. Kernel estimation (50%, 75% and 95% probability) of the home range of the
lions LM3, LM4.
Areas: 50% (Black): 5.23 sq.km, 75% (Dark Gray): 15.09 sq.km, 95% (Light Gray):
35.27 sq.km.
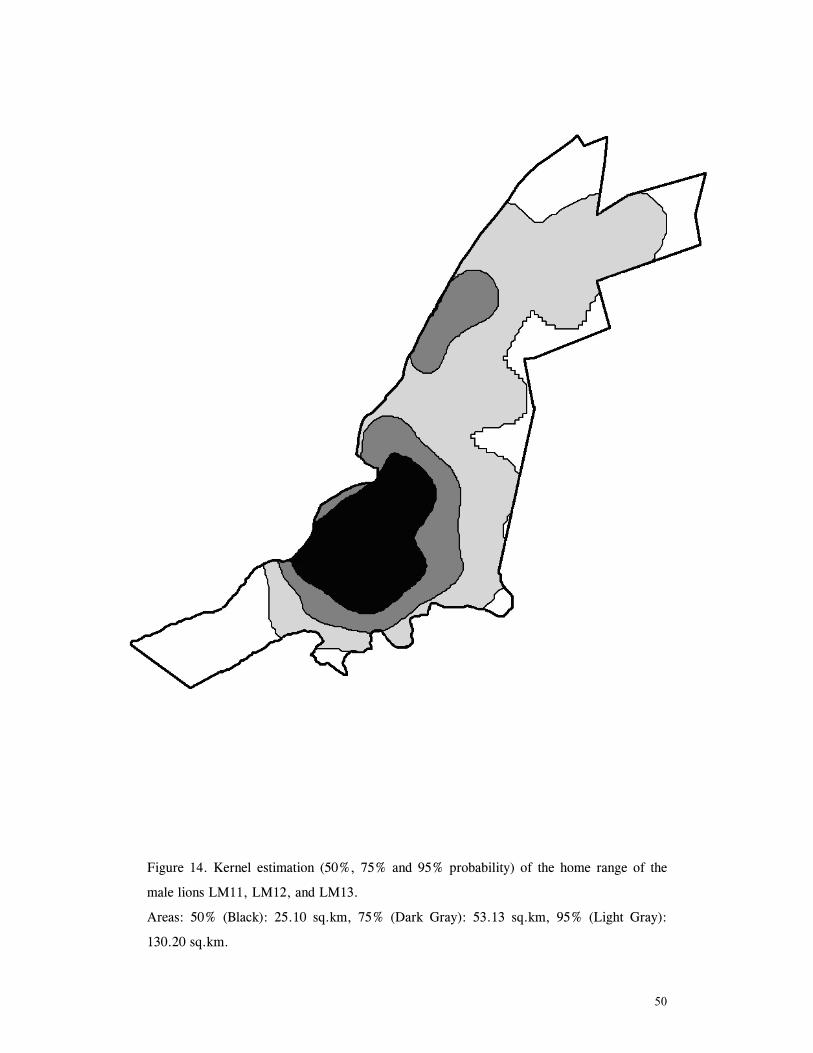
50
Figure 14. Kernel estimation (50%, 75% and 95% probability) of the home range of the
male lions LM11, LM12, and LM13.
Areas: 50% (Black): 25.10 sq.km, 75% (Dark Gray): 53.13 sq.km, 95% (Light Gray):
130.20 sq.km.

51
Females with young cubs
Mean range size (95%) for lionesses with young cubs was 19.14 km2 ± 6.69 km2
(n = 4): the mean core area (50%) was 2.29 km2 ± 1.39 km2. I do not have enough data
for statistical analyses, but I have presented each figure for comparison with the female’s
total home range in Table 8.
Lioness 50% range 95% range
LF2 total range 1.79 km2 42.23 km2
litter 1 4.17 km2 27.87 km2
litter 2 1.61 km2 16.05 km2
LF5 total range 11.67 km2 105.60 km2
litter 1 2.44 km2 20.37 km2
litter 2 0.93 km2 12.26 km2
Table 8. Home range sizes of lionesses when with young cubs (<4mo).
Stochastic factors
For lions, I analysed three specific incidents to examine the effects of stochastic
factors on movement and range characteristics. First, I examined the change in range size of
the three male lions LMs11-13 following the deaths by poaching of their only potential
‘rivals’, males LM3-4 (see Chapter 5). LMs11-13 occupied a 95% range of 60.91 km2
(50% range: 15.55km2) prior to these deaths and 142.84 km2 (50% range: 39.55km2) after
these deaths as they moved northwards to encompass the female ranges previously held by
the northern males (Figure 15).
Second, I have presented the movements of the three lionesses LFs8-10 following a
clash with the lionesses LFs1-2 in which they were chased for approximately 1200m and
subsequently left their original range, heading south (Figure 16). Range size is not
comparable as I only have three months of data prior to the conflict. However, Figure 16
clearly illustrates the shift in range following this encounter
Finally, I have presented the movements of the lioness LF2 in Figure 17 illustrating
her ranging patterns following the death of her only female companion LF1 by poaching in
April 1994 (Figure 17). Prior to this incident, her range (with LF1) was 42.23km2 (50%
range: 1.79 km2: see Figure 9): following the death of LF1, her range was 27.56 km2 (50%
range: 2.78 km2: see Figure 10).
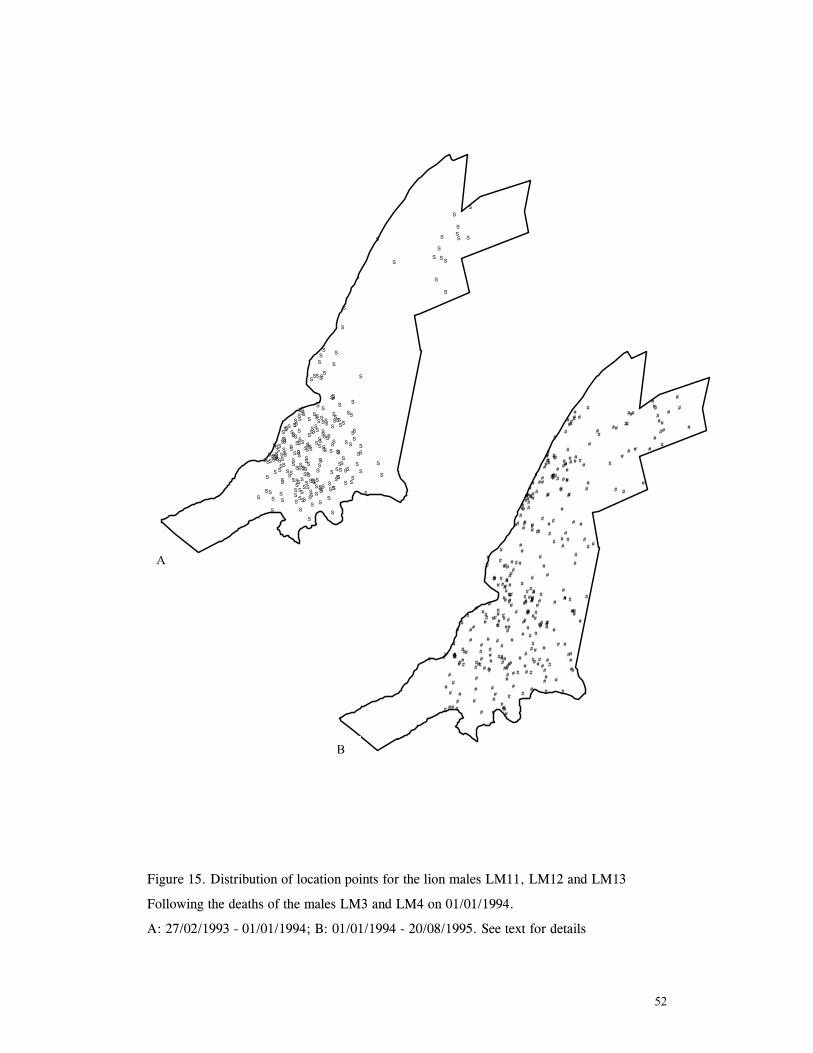
52
Figure 15. Distribution of location points for the lion males LM11, LM12 and LM13
Following the deaths of the males LM3 and LM4 on 01/01/1994.
A: 27/02/1993 - 01/01/1994; B: 01/01/1994 - 20/08/1995. See text for details
#S#S#S
#S#S
#S
#S
#S
#S#S #S
#S
#S
#S
#S
#S #S
#S
#S
#S
#S
#S
#S
#S#S#S
#S #S#S
#S
#S#S
#S
#S#S
#S#S
#S
#S
#S
#S#S
#S#S
#S#S
#S
#S
#S
#S
#S
#S
#S
#S
#S#S
#S
#S
#S
#S
#S
#S#S #S
#S
#S
#S
#S
#S
#S
#S#S
#S#S#S
#S
#S#S#S
#S
#S#S
#S #S
#S
#S
#S
#S#S
#S
#S
#S#S
#S
#S#S
#S#S
#S#S
#S
#S
#S#S
#S
#S
#S#S
#S
#S
#S
#S
#S
#S
#S
#S#S
#S
#S#S
#S
#S
#S
#S
#S
#S
#S
#S
#S#S
#S #S
#S
#S
#S
#S#S
#S
#S
#S
#S
#S
#S
#S
#S
#S
#S
#S
#S
#S
#S
#S
#S
#S
#S#S
#S
#S
#S
#S
#S
#S#S
#S
#S
#S
#S
#S
#S
#S
#S
#S
#S#S
#S#S
#S
#S
#S#S
#S
#S
#S#S
#S
#S
#S#S
#S
#S#S
#S
#S
#S
#S#S
#S
#S
#S
#S
#S
#S#S
#S #S#S
#S
#S
#S
#S
#S
#S
#S
#S
#S
#S#S
#S
#S
#S
#S#S
#S
#S
#S
#S
#S
#S
#S
#S#S
#S
#S
#S
#S
#S
#S
#S
#S
#S
#S
#S
#S
#S
#S
#S
#S
#S
#S#S
#S #S
#S #S
#S
#S
#S
#S
##
#
##
##
#
##
#
#
#
#
#
#
# #
#
#
###
#
#
#
#
#
#
#
#
#
#
#
#
#
#
#
#
#
##
#
#
##
#
#
#
#
#
#
#
##
#
#
#
#
#
#
#
#
#
#
#
##
#
#
#
#
##
#
#
#
#
##
#
#
#
#
##
#
#
##
#
#
#
#
##
#
##
#
#
#
#
#
#
##
#
#
#
## #
#
##
#
#
#
#
#
##
##
#
#
##
#
#
# #
#
#
#
#
#
#
#
#
#
##
#
#
#
#
#
#
#
#
#
#
#
##
#
#
##
###
#
##
#
#
#
#
#
##
#
#
#
#
#
#
##
#
#
#
#
#
#
#
#
#
#
#
#
# #
#
#
#
#
#
#
#
##
#
#
#
##
#
##
#
#
#
#
#
#
#
#
#
#
##
##
#
#
#
#
###
#
#
#
####
#
#
###
#
#
#
##
##
#
##
#
#
#
#
###
#
##
#
#
#
#
##
#
#
# #
#
#
#
#
#
#
#
#
####
#
#
## ###
#
#
#
#
#
#
##
##
#
#
#
#
#
###
# #
### #
#
#
#
#
#
#
#
#
#
#
#
#
#
#
#
#
#
#
#
#
##
#
#
#
#
#
#
#
#
#
#
#
#
#
A
B
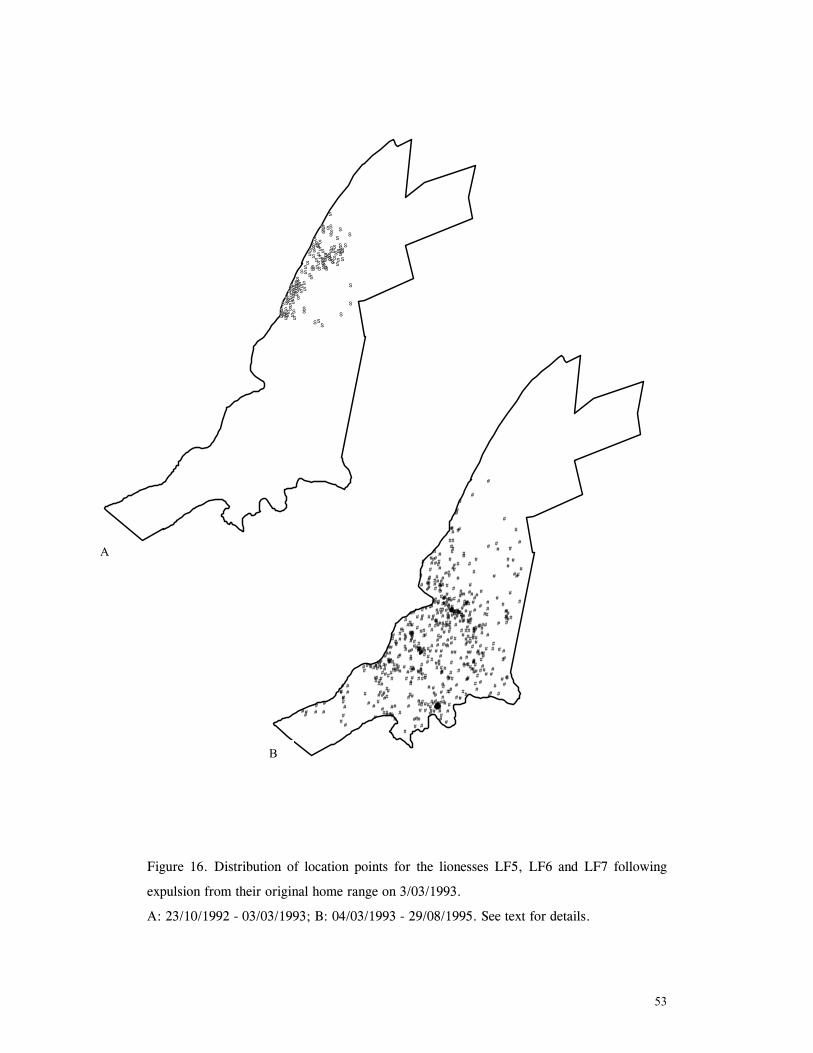
53
Figure 16. Distribution of location points for the lionesses LF5, LF6 and LF7 following
expulsion from their original home range on 3/03/1993.
A: 23/10/1992 - 03/03/1993; B: 04/03/1993 - 29/08/1995. See text for details.
#S#S
#S
#S
#S
#S #S#S
#S
#S#S
#S #S#S#S
#S
#S
#S#S
#S#S#S#S
#S
#S#S#S#S
#S
#S#S
#S#S
#S
#S#S
#S
#S#S#S#S
#S
#S
#S#S
#S
#S
#S
#S#S#S
#S
#S
#S#S#S
#S
#S#S
#S
#S #S
#S
#S#S
#S
#S#S#S
#S
#S
#S
#S
#S
#S#S
#S#S
#S
#S#S
#S
#S
#S
#S
#S
#S
#S#S
#S
#S#S
#S
#S
#S
#S#S
#S
#S
#S #S
#S
#S
#S
#S
#S
#S
#S
#S
#S
#S
#S
#S #S#S
#S
#S
#S
#S
#S
#S
#S#S
#S#S
#S#S#S
#S
#S
#S
#S
#S
#S
#S
#S
#S
#S
#S
#S #S#S
#S
#S
#S#S
#
#
#
#
#
#
##
#
#
#
##
#
##
#
#
###
#
#
# #
##
# #
#
###
#
##
##
##
##
##
#
#
#
#
# ##
#
##
#
#
#
#
#
##
#
###
#
#
#
#
##
#
#
#
##
###
#
##
#
####
#
#
# #
#
#
#
#
##
#
#
###
#
#
##
#
#
#
#
#
#
#
#
#
#
#
#
#
#
#
#
#
##
#
#
##
##
#
#
##
#
#
#
#
#
#
#
#
#
#
#
#
##
#
#
###
# #
#
#
#
#
##
#
##
#
#
##
#
#
##
##
##
#
#
######
#
#
# #
#
#
###
#
####
####
#
##
##
#####
##
##
#
#
#### #
#
#
#
#
#
##
####
#
#
#
##
##
#
##
##
#
#
#
#
#
#
##
##
#
#
#
##
###
##
#
##
#
#
#
#
#
#
#
# #
#
#
# #
##
#
#
##
#
#
##
# ##
##
### #
#
#
#
##
#
#
#
#
#
#
##
#
###
#
#
#
##
#
##
#
#
#
#
#
#
#
#
#
#
#
#
##
##
#
#
#
#
##
#
#
##
#
#
#
# #
#
#
#
#
#
#
#
#
#
#
#
#
##
#
#
#
#
#
#
##
##
#
#
#
#
#
#
#
#
### #
##
#
## #
#
#
#
#
#
#
#
#
#
#
#
#
#
#
# #
# #
##
#
##
#
#
#
# #
#
#
#
#
#
#
#
#
##
#
#
#
#
#
#
#
#
#
#
#
#
#
#
#
#
#
#
#
#
#
#
#
#
#
##
#
#
#
#
#
#
#
#
#
#
#
#
#
#
# #
##
#
#
##
#
#
#
##
##
#
#
#
#
#
#
#
#
#
#
#
#
###
#
##
#
##
#
##
###
#
# #
#
#
#
##
#
#
#
#
#
#####
## #
#
## ###
#
#
#
#
#
#
#
##
##
############
#
###
#
#
##
#
#
##
###
#
#
#
##
#
#
##
#
#
#
#
##
##
##
#
#
#
#
#
#
# ##
#
A
B
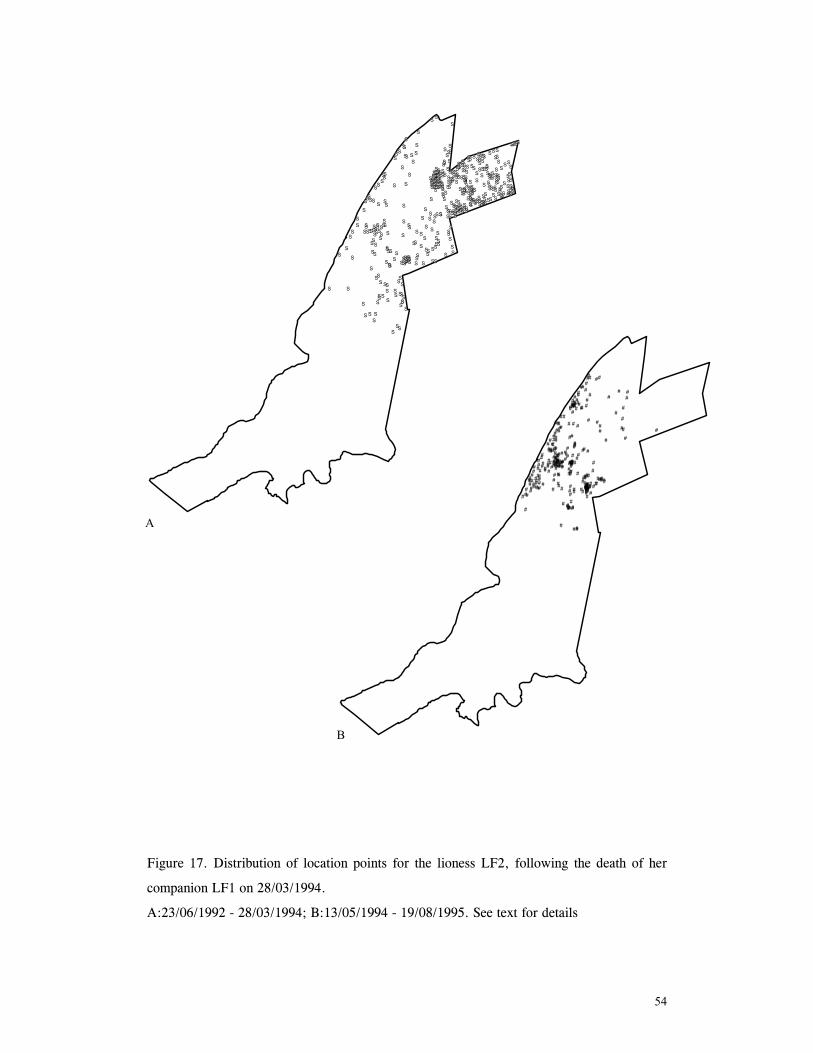
54
Figure 17. Distribution of location points for the lioness LF2, following the death of her
companion LF1 on 28/03/1994.
A:23/06/1992 - 28/03/1994; B:13/05/1994 - 19/08/1995. See text for details
#S
#S
#S
#S
#S
#S
#S
#S#S
#S
#S
#S
#S
#S #S#S #S
#S
#S
#S
#S#S
#S#S
#S
#S
#S
#S
#S
#S
#S
#S#S
#S#S
#S
#S#S#S
#S
#S
#S #S
#S#S
#S#S#S
#S#S
#S
#S
#S#S
#S
#S
#S
#S
#S#S
#S
#S
#S#S
#S
#S#S #S#S
#S#S
#S
#S
#S
#S
#S
#S
#S
#S#S
#S
#S
#S
#S
#S
#S
#S
#S
#S
#S
#S
#S#S#S
#S#S
#S#S#S
#S
#S
#S#S#S
#S#S#S
#S
#S#S#S
#S#S
#S
#S
#S
#S
#S
#S
#S
#S#S
#S
#S
#S
#S
#S
#S #S
#S#S
#S
#S
#S
#S
#S
#S#S
#S
#S
#S
#S
#S#S
#S #S
#S
#S
#S
#S
#S #S#S
#S
#S#S
#S
#S
#S
#S
#S
#S
#S
#S
#S
#S
#S
#S
#S
#S
#S
#S
#S
#S
#S
#S#S
#S#S
#S
#S
#S
#S
#S
#S
#S
#S
#S
#S#S
#S
#S#S
#S
#S
#S
#S
#S
#S
#S
#S#S#S
#S
#S
#S
#S
#S
#S#S
#S
#S
#S
#S#S
#S#S#S#S
#S
#S
#S
#S#S#S#S
#S
#S#S
#S
#S#S
#S
#S#S
#S
#S
#S#S
#S
#S
#S#S#S#S #S#S#S#S
#S
#S
#S
#S
#S
#S
#S
#S
#S
#S#S#S#S
#S
#S
#S#S #S#S#S#S#S#S
#S
#S
#S#S#S#S#S
#S#S#S#S#S #S#S
#S#S#S#S #S#S
#S
#S#S
#S
#S
#S
#S #S
#S
#S#S#S#S
#S
#S#S#S
#S#S#S#S
#S#S
#S
#S
#S
#S#S#S#S#S#S#S#S
#S #S#S#S#S#S#S
#S#S#S#S#S#S
#S
#S
#S
#S #S
#S
#S
#S#S
#S
#S#S#S
#S
#S#S
#S
#S
#S
#S#S
#S #S
#S#S#S
#S#S#S
#S
#S#S
#S
#S#S#S#S
#S #S
#S#S#S
#S
#S
#S #S
#S
#S
#S
#S
#S
#S
#S#S
#S
#S
#S
#S#S #S#S#S
#S
#S
#S
#S#S
#S
#S
#S
#S
#S
#S
#S#S#S#S
#S#S
#S
#S#S
#S
#S
#S
#S#S #S#S#S
#S
#S
#S #S
#S
#S#S#S
#S#S
#S
#S #S
#S#S
#S
#S#S
#S
#S
#S#S
#S
#S
#S
#S
#S
#S#S
#S#S
#S
#S
#S
#S
#S
#S
#S
#S
#S#S#S
#S #S
#S
#S
#S#S
#S
#S
#S
#S
#S#S
#S
#S
#S
#S#S
#S
#S
#S#S
#S#S
#S
#S
#S
#S
#S
#S
#S
#S
#S
#S
#S
#S
#S
#S
#S
#S
#S
#S#S
#S
#S
#S
#S
#S#S#S
#S#S
#S
#S
#S
#S
#S
#S
#S
#S
#S
#S
#S
#S
#S#S
#S
#S
#S#S
#S
#S
#S
#S
#S
#S
#
#
#
#
#
#
#
##
#
##
#
# #
#
#
#
#
#
#
##
# #
#
#
#
#
#
#
#
#
#
#
##
##
#
# #
#
#
#
#
#
##
#
#
###
#
#####
#
######
#
######
#
#
##
#
#####
#### ######
#
####
##
#####
##
##
## #
#
####
###
#
##
##
#
##
###### ####
#
## ##
##
#
#
##
#
#
######
##
##
###
#
##
#
#
#
#
##
## #
##
#
##
##
##
#
#
#
#####
#
#
####
#
##
#
##
#
#
##
#
##
##
#
#
#
#
##
##
#
##
#####
#
#
#
#
#
###
##
#
##
##
## #
#
###
#
#
#
#
#
##
#
#
#
###
#
#
#
# ##
#
#
#
#
#
#
A
B
55
CHEETAHS
Total home range
Total home range estimations for all monitored cheetahs are presented in Figures 18
- 24. Cheetah home-ranges varied from 33.86 km2 for the female CF5 to 161.44 km2 for the
sub-adult brothers, CMs 23-24. Mean home range size of females was 94.40 km2 ± 51.35
km2 (range 33.86 km2 - 157.26 km2, n = 4). Mean home range size of males was 92.89 km2
± 59.39 km2 (range 56.79 km2 - 161.44 km2, n = 3). The male pair CMs13-14 covered
134.96 km2 in the two weeks they survived following release (see Chapter 3): I have not
presented this as a kernel distribution as it is based on only 17 locations and is not
meaningful in terms of an actual home range. Core areas (50% Kernel) averaged 12.40 km2
± 8.73 km2 for females (n = 4) and 22.73 km2 ± 28.11 km2 for male coalitions (n = 2).
Seasonal home ranges
Kernel estimations for seasonal home ranges of cheetahs are presented in Table 8.
For all female cheetahs combined, mean winter home range (95%) was 104.44km2 ±
25.72km2 compared to mean summer range of 67.74 km2 ± 38.90km2 which was not
significantly different (t = 1.66, p = 0.08, df = 5). Excluding the dispersing sub-adult
CF25 from the analysis did not significantly alter the result (mean winter range: 105.09km2
± 28.69km2, mean summer range 73.66 km2 ± 45.18km2 :t = 1.08, p = 0.179, df = 3).
Mean core areas (50%) for female cheetahs were 15.43 km2 ± 4.98 km2 in the winter and
10.47 km2 ± 2.68 km2 in the summer (t = 1.02, p = 0.177, df = 5). Excluding the
dispersing sub-adult CF25 from the analysis did not significantly alter the result (mean
winter range: 14.41km2 ± 5.65km2, mean summer range 12.18 km2 ± 9.61km2 :t = 0.365,
p = 0.369, df = 3).
For males, mean 95% range size in the winter was 90.41km2 ± 30.60km2
compared to 61.04 km2 ± 59.86km2 in the summer which was not significantly different (t
= 0.91, p = 0.19, df = 6). Excluding the dispersing sub-adult brothers CM23 and 24 from
the analysis, winter ranges (mean: 72.75km2 ± 0.96 km2) were significantly larger than
summer ranges, (mean: 35.48km2 ± 26.56km2 :t = 3.61, p = 0.02, df = 3). Mean core
area (50%) for males was 17.58km2 ± 8.30km2 in the winter and 20.64km2 ± 37.89km2 in
the summer which was not significantly different (t = -0.17, p =0.43, df = 1). Excluding
the dispersing sub-adult brothers CM23 and 24 from the analysis did not alter this result
(winter ranges mean: 13.44 km2 ± 5.89 km2, summer ranges, mean: 3.72km2 ± 1.98 km2
:t = 2.26, p = 0.13, df = 1).
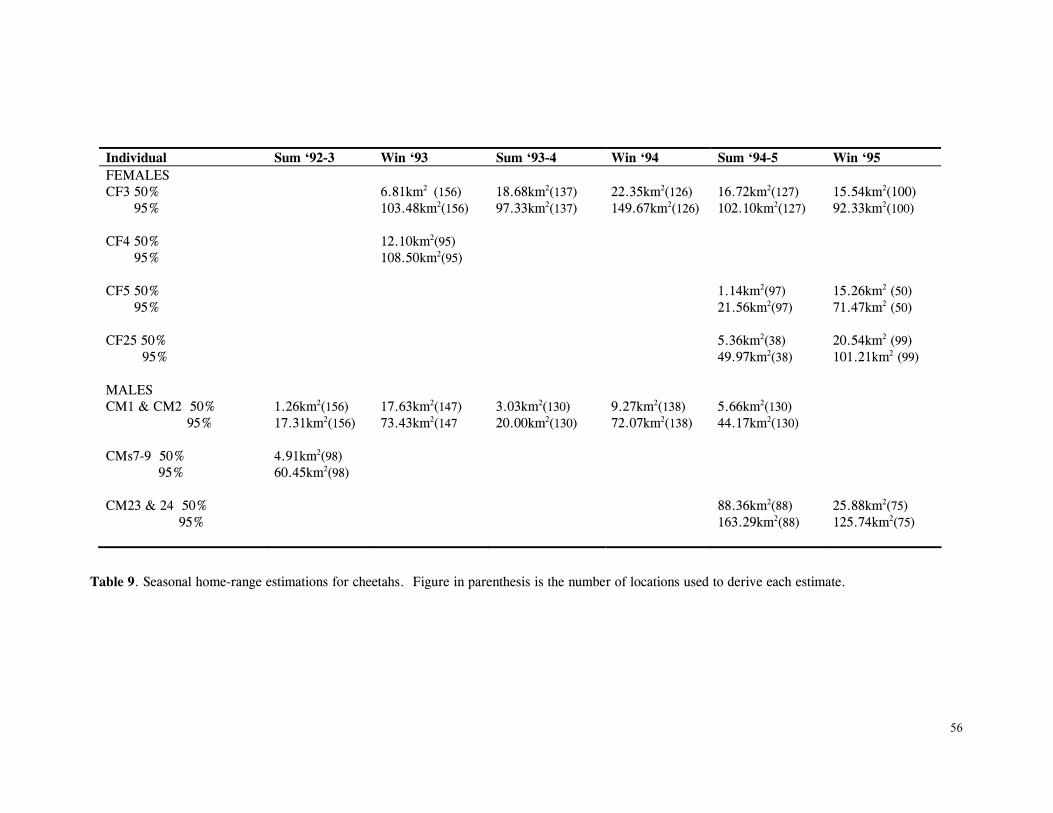
56
Individual Sum ‘92-3 Win ‘93 Sum ‘93-4 Win ‘94 Sum ‘94-5 Win ‘95 FEMALES CF3 50% 6.81km2 (156) 18.68km2(137) 22.35km2(126) 16.72km2(127) 15.54km2(100) 95% 103.48km2(156) 97.33km2(137) 149.67km2(126) 102.10km2(127) 92.33km2(100) CF4 50% 12.10km2(95) 95% 108.50km2(95) CF5 50% 1.14km2(97) 15.26km2 (50) 95% 21.56km2(97) 71.47km2 (50) CF25 50% 5.36km2(38) 20.54km2 (99) 95% 49.97km2(38) 101.21km2 (99) MALES CM1 & CM2 50% 1.26km2(156) 17.63km2(147) 3.03km2(130) 9.27km2(138) 5.66km2(130) 95% 17.31km2(156) 73.43km2(147 20.00km2(130) 72.07km2(138) 44.17km2(130) CMs7-9 50% 4.91km2(98) 95% 60.45km2(98) CM23 & 24 50% 88.36km2(88) 25.88km2(75) 95% 163.29km2(88) 125.74km2(75)
Table 9. Seasonal home-range estimations for cheetahs. Figure in parenthesis is the number of locations used to derive each estimate.
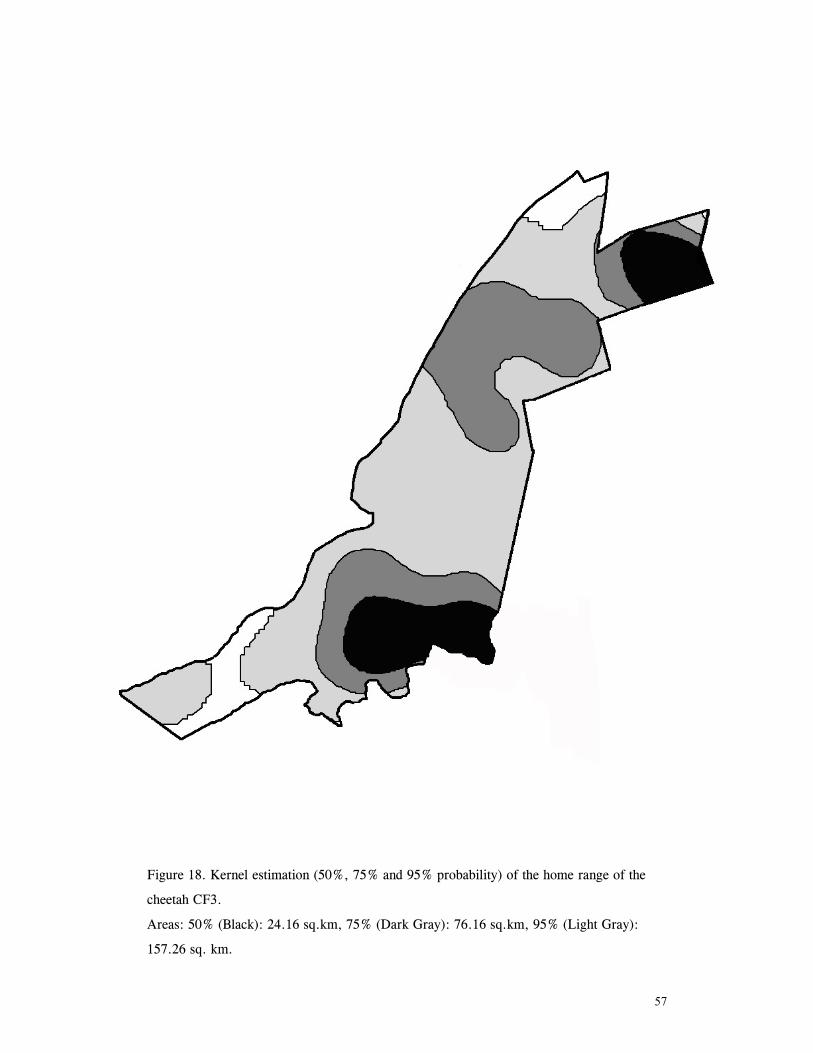
57
Figure 18. Kernel estimation (50%, 75% and 95% probability) of the home range of the
cheetah CF3.
Areas: 50% (Black): 24.16 sq.km, 75% (Dark Gray): 76.16 sq.km, 95% (Light Gray):
157.26 sq. km.
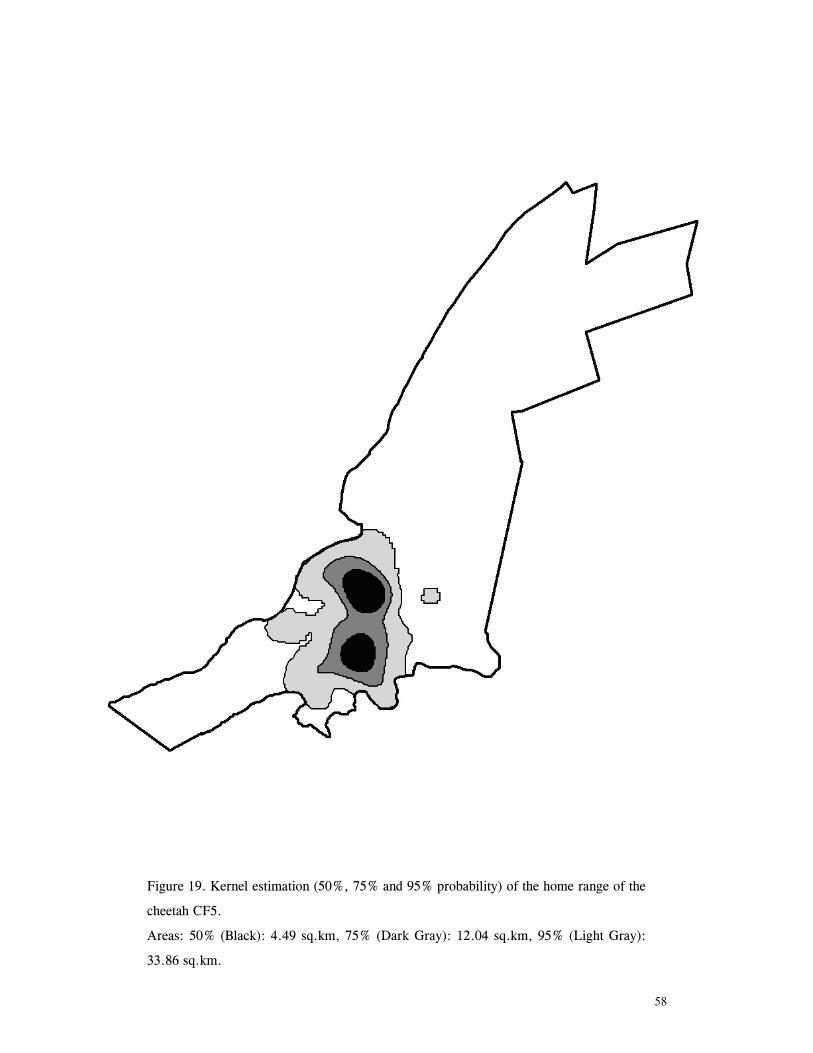
58
Figure 19. Kernel estimation (50%, 75% and 95% probability) of the home range of the
cheetah CF5.
Areas: 50% (Black): 4.49 sq.km, 75% (Dark Gray): 12.04 sq.km, 95% (Light Gray):
33.86 sq.km.
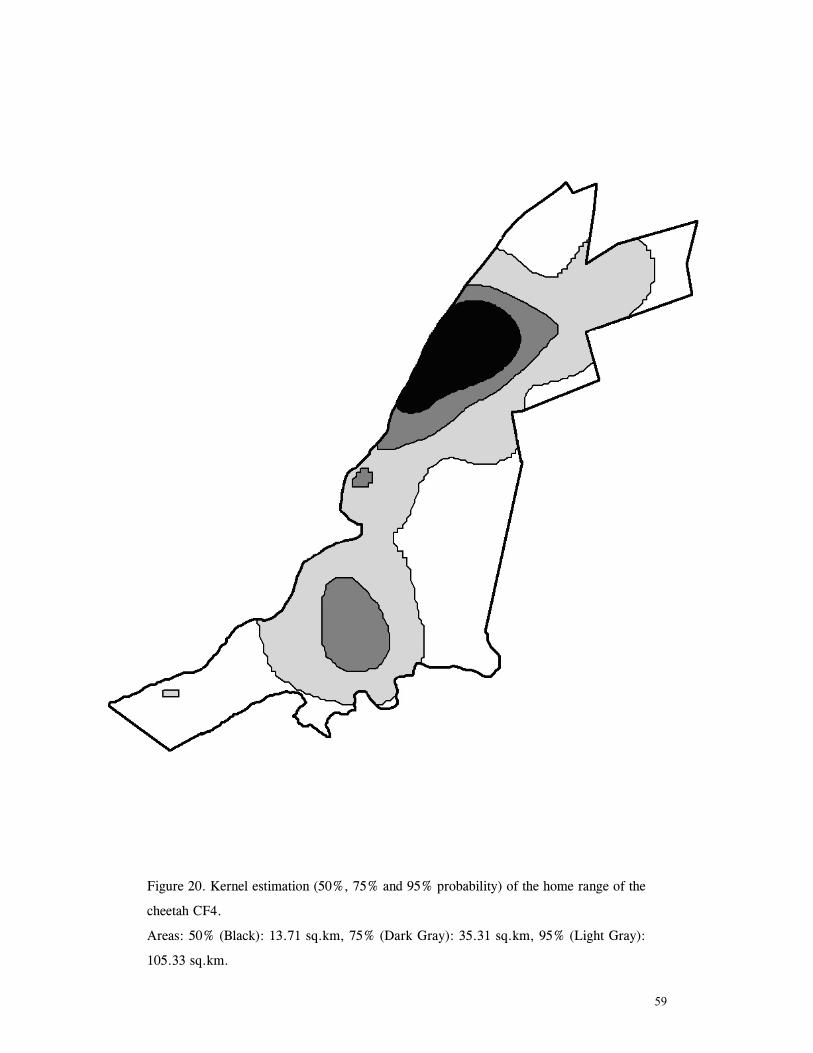
59
Figure 20. Kernel estimation (50%, 75% and 95% probability) of the home range of the
cheetah CF4.
Areas: 50% (Black): 13.71 sq.km, 75% (Dark Gray): 35.31 sq.km, 95% (Light Gray):
105.33 sq.km.
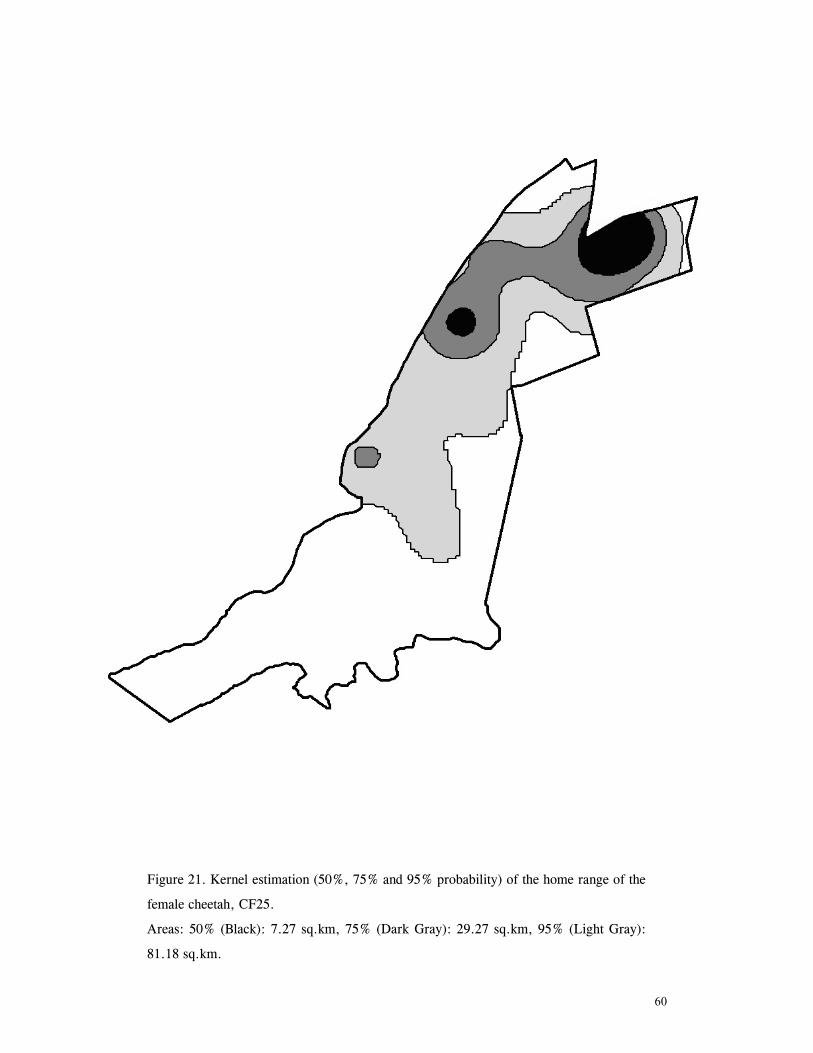
60
Figure 21. Kernel estimation (50%, 75% and 95% probability) of the home range of the
female cheetah, CF25.
Areas: 50% (Black): 7.27 sq.km, 75% (Dark Gray): 29.27 sq.km, 95% (Light Gray):
81.18 sq.km.

61
Figure 22. Kernel estimation (50%, 75% and 95% probability) of the home range of the
male cheetahs, CM1 and CM2.
Areas: 50% (Black): 8.15 sq.km, 75% (Dark Gray): 20.71 sq.km, 95% (Light Gray):
56.79 sq.km.
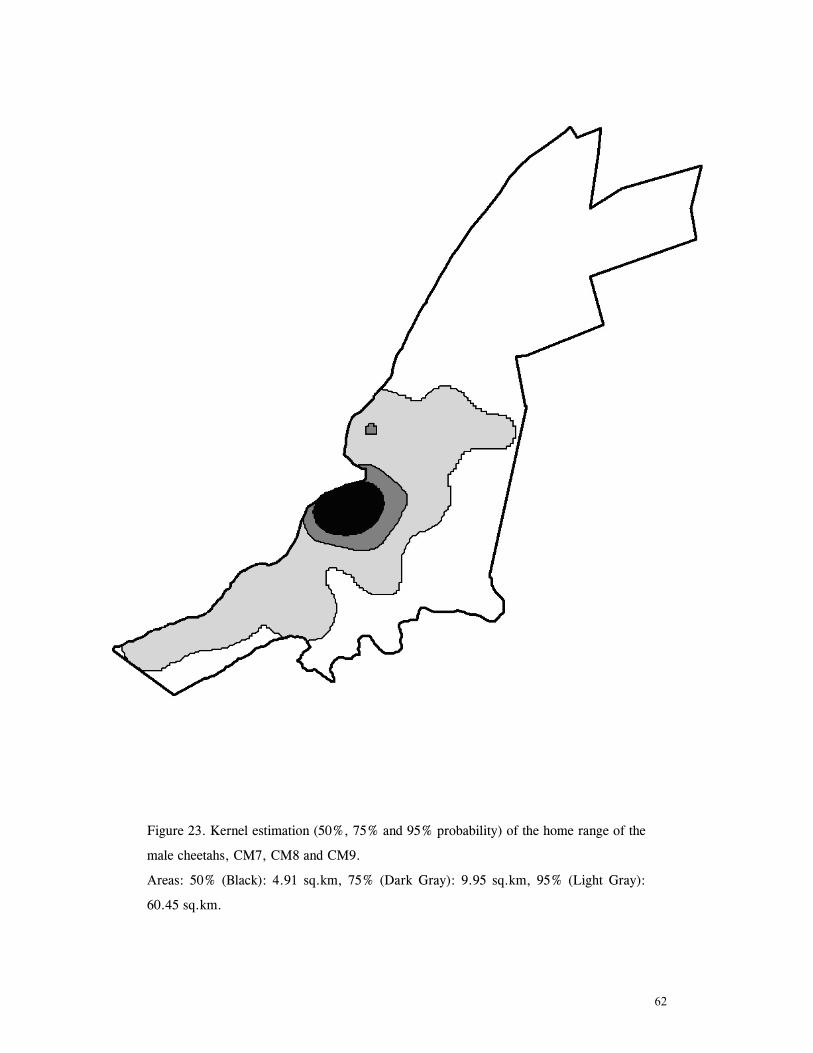
62
Figure 23. Kernel estimation (50%, 75% and 95% probability) of the home range of the
male cheetahs, CM7, CM8 and CM9.
Areas: 50% (Black): 4.91 sq.km, 75% (Dark Gray): 9.95 sq.km, 95% (Light Gray):
60.45 sq.km.

63
Figure 24. Kernel estimation (50%, 75% and 95% probability) of the home range of the
male cheetahs, CM23 and CM24.
Areas: 50% (Black): 55.15 sq.km, 75% (Dark Gray): 109.20 sq.km, 95% Light Gray):
161.44 sq.km.
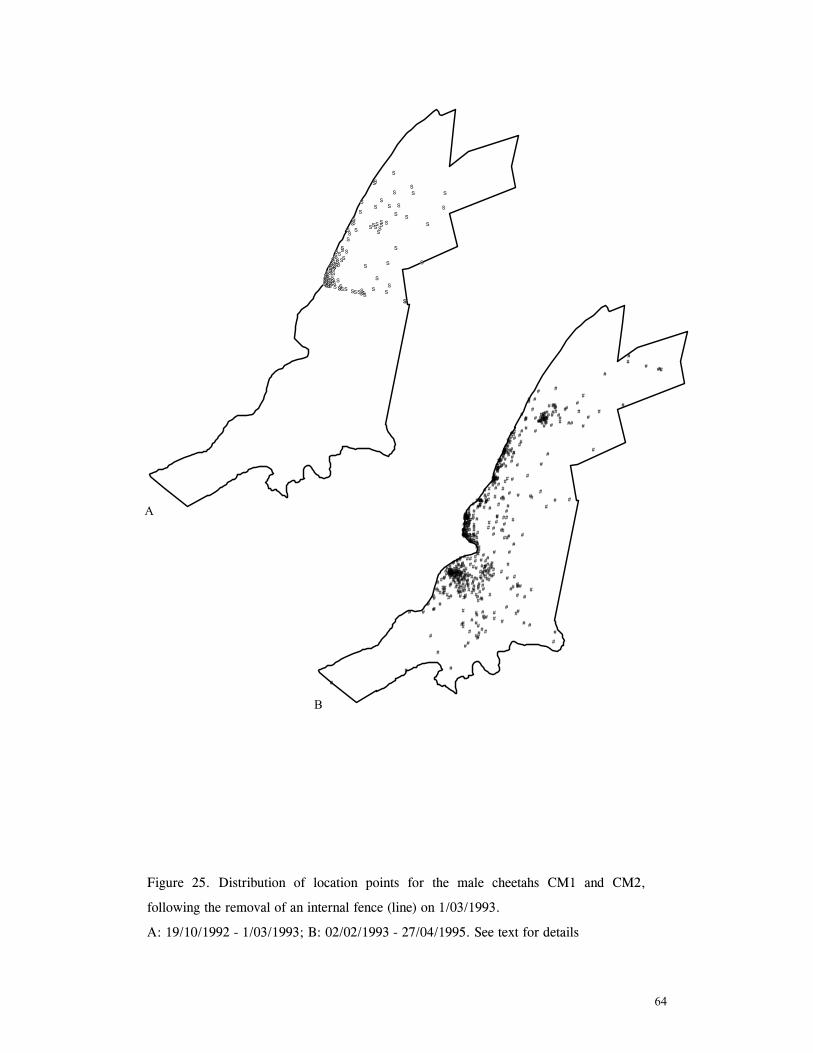
64
Figure 25. Distribution of location points for the male cheetahs CM1 and CM2,
following the removal of an internal fence (line) on 1/03/1993.
A: 19/10/1992 - 1/03/1993; B: 02/02/1993 - 27/04/1995. See text for details
#S
#S
#S
#S
#S#S
#S
#S
#S
#S#S
#S
#S#S#S#S
#S
#S
#S#S#S
#S
#S
#S
#S
#S#S#S
#S#S
#S
#S#S
#S
#S #S
#S
#S
#S
#S#S
#S
#S#S
#S
#S
#S
#S
#S#S
#S
#S
#S#S#S#S
#S
#S
#S
#S
#S
#S
#S
#S
#S
#S
#S #S
#S
#S
#S
#S
#S
#S
#S
#S
#S
#S
#S
#S
#S#S
#S
#S#S #S
#S #S
#S
#S
#S
#S
#S
#S
#S
#S#S
#S#S
#S
#S#S
#S
#S
#S
#S
#S#S
#S#S
#S
#S
#S#S
#S
#S
#S
#S #S
#S
#S
#S
#S#S
##
### #
#
#
#
#
#
#
#
#
#
#
##
#
#
#
# # # #
#
#
#
#
#
#
#
#
#
#
#
#
#
##
#
#
#
#
#
#
#
#
#
#
#
#
##
#
#
#
#
#
#
#
#
#
#
#
##
#
#
###
#
## #
###
#
##
#
#
#
#
#
##
#
#
#
#
#
#
#
#
#
#
#
#
#
#
#
#
#
#
#
#
#
##
#
#
##
#
#
#
#
#
#
#
#
#
#
#
# #
#
#
#
##
#
#
#
#
###
#
#
#
#
##
#
#
#
#
#
#
#
#
#
#
#
#
# ##
#
##
##
#
##
#
#
#
#
#
#
#
#
##
#
#
#
#
##
#
#
#
##
#
#
#
# #
#
#
#
#
# #
#
#
#
##
#
#
#
#
##
#
#
#
#
#
#
##
#
##
#
#
#
#
#
#
#
#
##
#
#
#
##
# #
##
#
#
#
##
#
#
#
#
#
#
#
#
#
#
#
# #
##
#
#
#
#
#
#
## ## #
#
#
#
#
# #
#
##
#
#
#
#
#
#
#
#
#
#
####
#
#
#
##
#
#
#
#
#
#
#
#
###
#
#
#
##
#
#
#
####
#
#
#
#
#
##
#
##
#
##
#
#
#
# #
#
#
##
#
##
#
#
#
#
##
#
#
#
#
#
#
#
#
#
#
#
#
##
#
#
#
#
#
#
#
#
#
#
#
#
#
##
#
# ###
#
###
#
#
#
#
#
##
#
##
#
##
#
#
##
##
#
#
#
#
#
#
#
#
#
#
#
#
#
#
#
##
#
#
#
#
#
#
###
#
##
#
#
#
#
#
#
#
#
#
#
#
#
#
#
#
#
#
#
#
#
#
#
###
#
#
#
#
##
#
#
##
#
#
#
##
#
#
#
#
#
##
#
#
#
#
#
#
##
#
#
#####
##
#
#
#
###
#
#
#
#
#
#
#
##
#
#
#
#
#
#
#
##
#
#
#
#
#
#
#
#
#
#
#
#
#
#
#
#
#####
#
#
#
#
###
##
#
#
#
##
##
#
#
#
#
#
#
#
#
#
#
#
##
#
#
##
#
#
#
#
#
#
#
#
#
#
#
##
#
#
#
#######
#
#
#
##
#
#
###
A
B
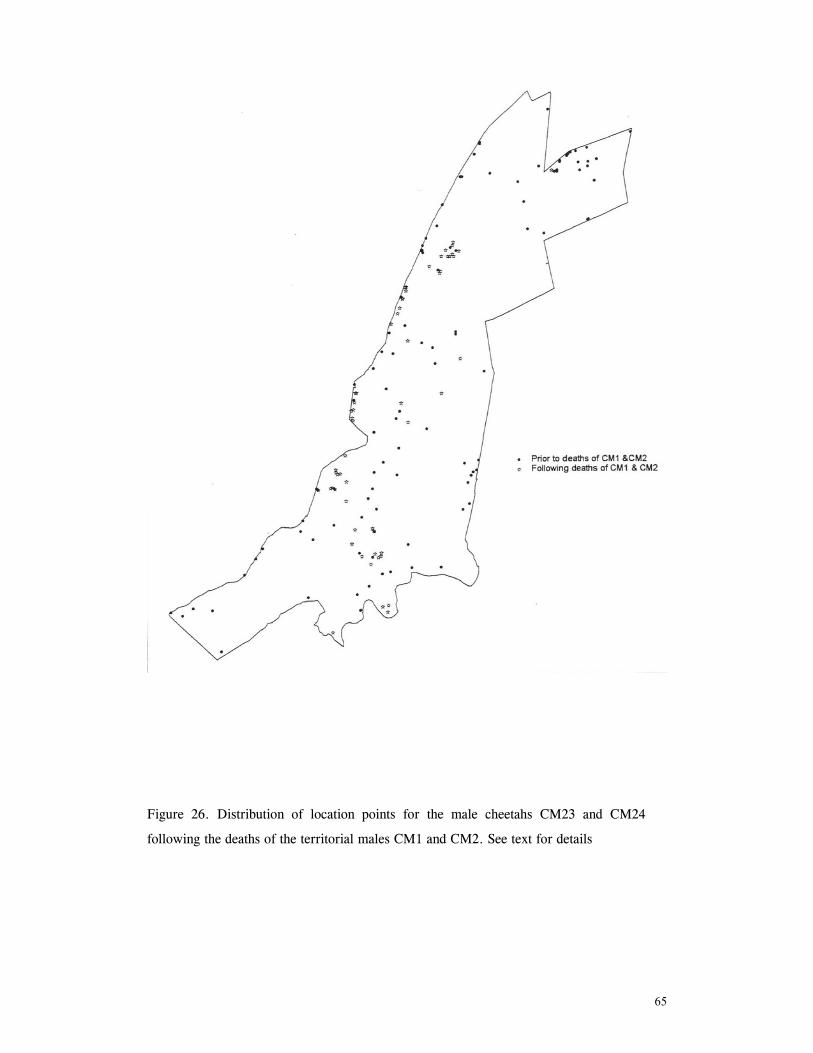
65
Figure 26. Distribution of location points for the male cheetahs CM23 and CM24
following the deaths of the territorial males CM1 and CM2. See text for details
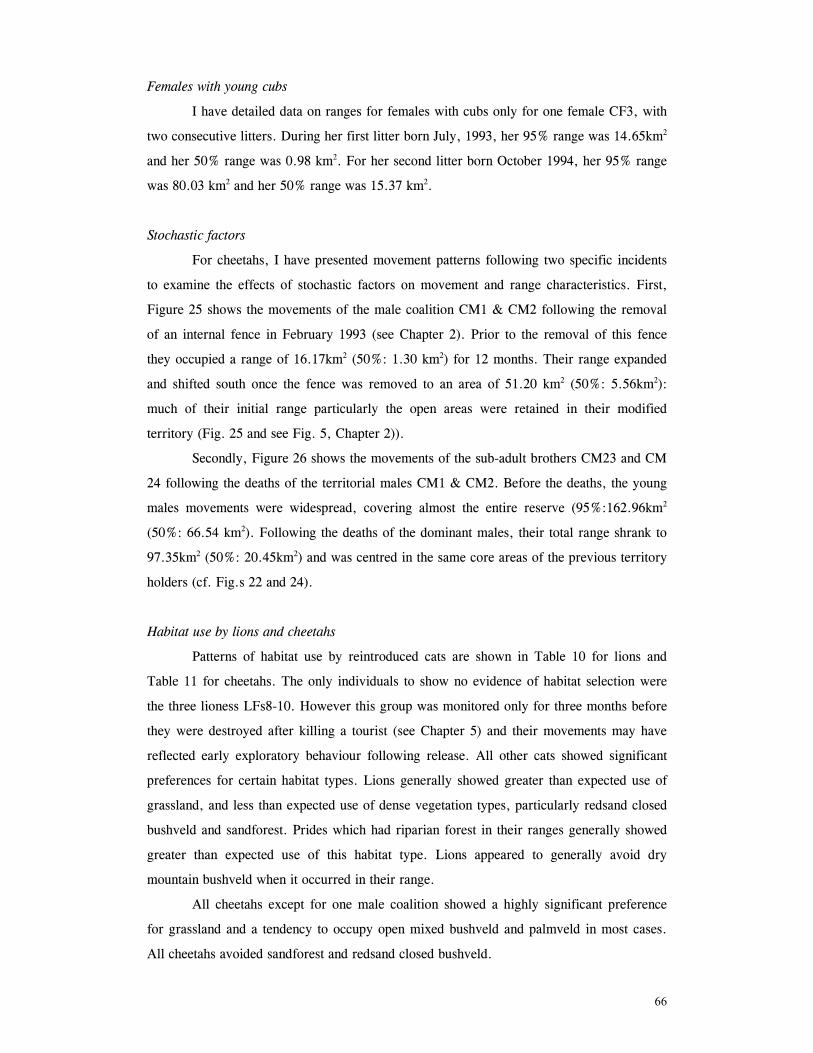
66
Females with young cubs
I have detailed data on ranges for females with cubs only for one female CF3, with
two consecutive litters. During her first litter born July, 1993, her 95% range was 14.65km2
and her 50% range was 0.98 km2. For her second litter born October 1994, her 95% range
was 80.03 km2 and her 50% range was 15.37 km2.
Stochastic factors
For cheetahs, I have presented movement patterns following two specific incidents
to examine the effects of stochastic factors on movement and range characteristics. First,
Figure 25 shows the movements of the male coalition CM1 & CM2 following the removal
of an internal fence in February 1993 (see Chapter 2). Prior to the removal of this fence
they occupied a range of 16.17km2 (50%: 1.30 km2) for 12 months. Their range expanded
and shifted south once the fence was removed to an area of 51.20 km2 (50%: 5.56km2):
much of their initial range particularly the open areas were retained in their modified
territory (Fig. 25 and see Fig. 5, Chapter 2)).
Secondly, Figure 26 shows the movements of the sub-adult brothers CM23 and CM
24 following the deaths of the territorial males CM1 & CM2. Before the deaths, the young
males movements were widespread, covering almost the entire reserve (95%:162.96km2
(50%: 66.54 km2). Following the deaths of the dominant males, their total range shrank to
97.35km2 (50%: 20.45km2) and was centred in the same core areas of the previous territory
holders (cf. Fig.s 22 and 24).
Habitat use by lions and cheetahs
Patterns of habitat use by reintroduced cats are shown in Table 10 for lions and
Table 11 for cheetahs. The only individuals to show no evidence of habitat selection were
the three lioness LFs8-10. However this group was monitored only for three months before
they were destroyed after killing a tourist (see Chapter 5) and their movements may have
reflected early exploratory behaviour following release. All other cats showed significant
preferences for certain habitat types. Lions generally showed greater than expected use of
grassland, and less than expected use of dense vegetation types, particularly redsand closed
bushveld and sandforest. Prides which had riparian forest in their ranges generally showed
greater than expected use of this habitat type. Lions appeared to generally avoid dry
mountain bushveld when it occurred in their range.
All cheetahs except for one male coalition showed a highly significant preference
for grassland and a tendency to occupy open mixed bushveld and palmveld in most cases.
All cheetahs avoided sandforest and redsand closed bushveld.
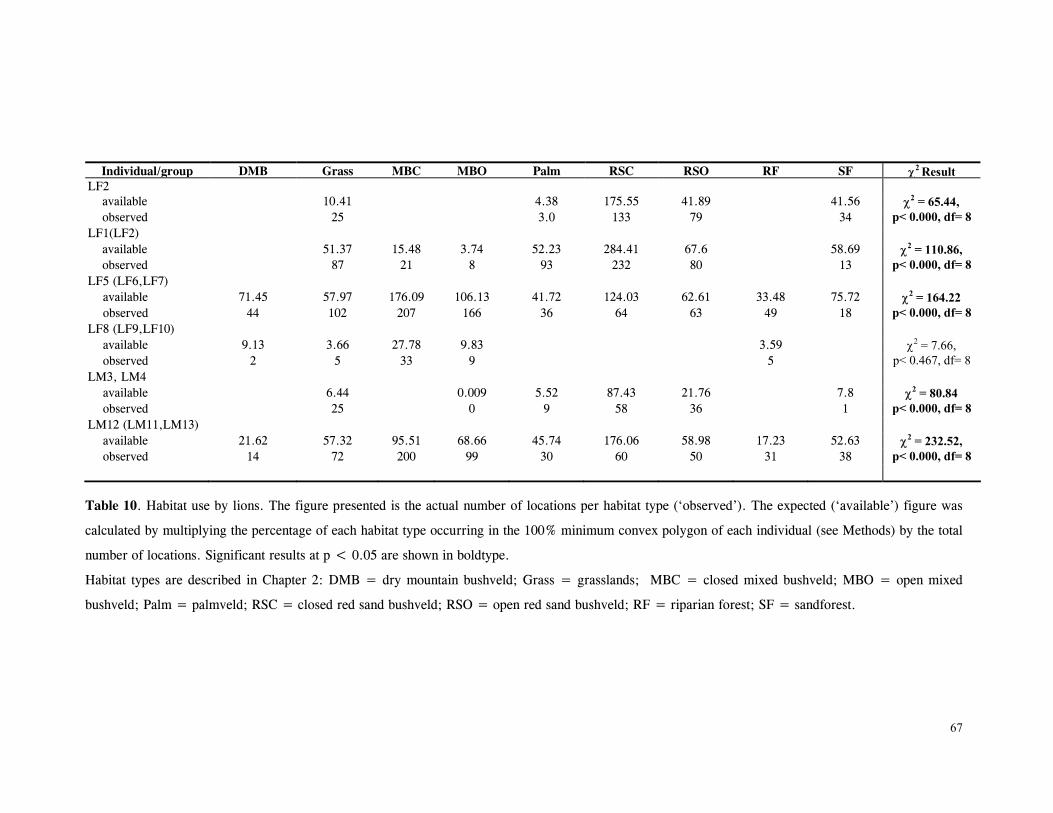
67
Individual/group DMB Grass MBC MBO Palm RSC RSO RF SF χ2 Result
LF2 available 10.41 4.38 175.55 41.89 41.56 χ2 = 65.44, observed 25 3.0 133 79 34 p< 0.000, df= 8
LF1(LF2) available 51.37 15.48 3.74 52.23 284.41 67.6 58.69 χ2 = 110.86, observed 87 21 8 93 232 80 13 p< 0.000, df= 8
LF5 (LF6,LF7) available 71.45 57.97 176.09 106.13 41.72 124.03 62.61 33.48 75.72 χ2 = 164.22 observed 44 102 207 166 36 64 63 49 18 p< 0.000, df= 8
LF8 (LF9,LF10) available 9.13 3.66 27.78 9.83 3.59 χ2 = 7.66, observed 2 5 33 9 5 p< 0.467, df= 8
LM3, LM4 available 6.44 0.009 5.52 87.43 21.76 7.8 χ2 = 80.84 observed 25 0 9 58 36 1 p< 0.000, df= 8
LM12 (LM11,LM13) available 21.62 57.32 95.51 68.66 45.74 176.06 58.98 17.23 52.63 χ2 = 232.52, observed 14 72 200 99 30 60 50 31 38 p< 0.000, df= 8
Table 10. Habitat use by lions. The figure presented is the actual number of locations per habitat type (‘observed’). The expected (‘available’) figure was
calculated by multiplying the percentage of each habitat type occurring in the 100% minimum convex polygon of each individual (see Methods) by the total
number of locations. Significant results at p < 0.05 are shown in boldtype.
Habitat types are described in Chapter 2: DMB = dry mountain bushveld; Grass = grasslands; MBC = closed mixed bushveld; MBO = open mixed
bushveld; Palm = palmveld; RSC = closed red sand bushveld; RSO = open red sand bushveld; RF = riparian forest; SF = sandforest.
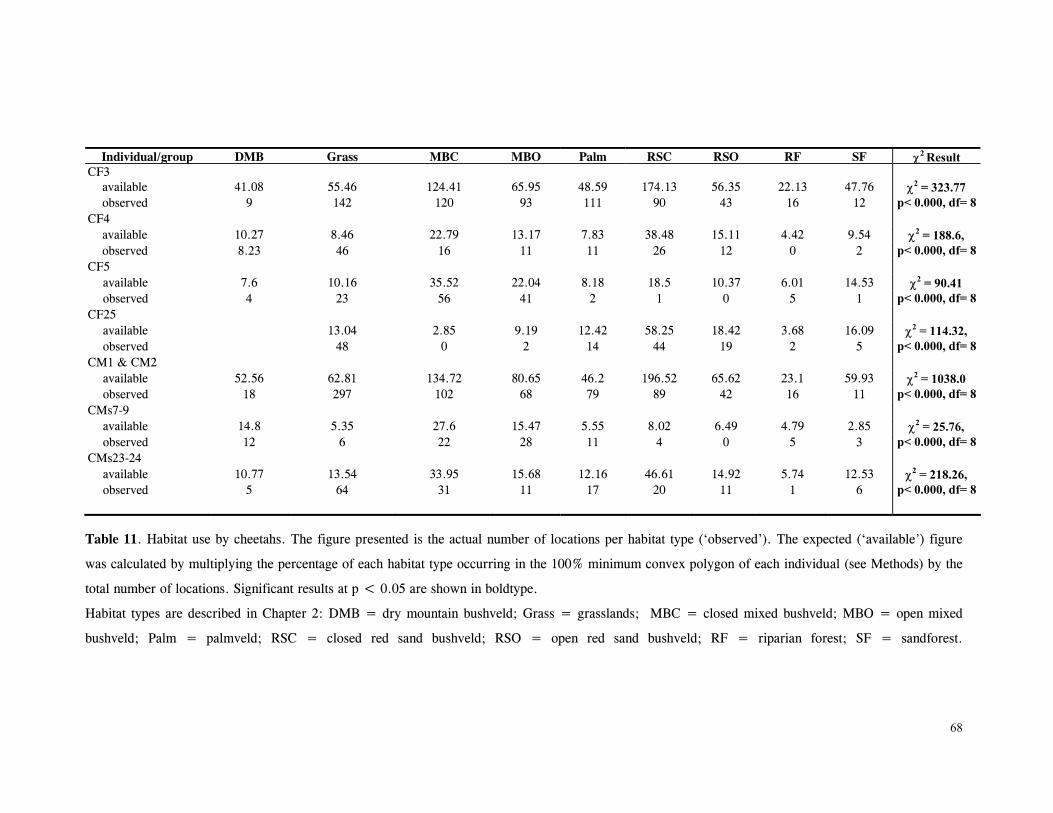
68
Individual/group DMB Grass MBC MBO Palm RSC RSO RF SF χ2 Result CF3
available 41.08 55.46 124.41 65.95 48.59 174.13 56.35 22.13 47.76 χ2 = 323.77 observed 9 142 120 93 111 90 43 16 12 p< 0.000, df= 8
CF4 available 10.27 8.46 22.79 13.17 7.83 38.48 15.11 4.42 9.54 χ2 = 188.6, observed 8.23 46 16 11 11 26 12 0 2 p< 0.000, df= 8
CF5 available 7.6 10.16 35.52 22.04 8.18 18.5 10.37 6.01 14.53 χ2 = 90.41 observed 4 23 56 41 2 1 0 5 1 p< 0.000, df= 8
CF25 available 13.04 2.85 9.19 12.42 58.25 18.42 3.68 16.09 χ2 = 114.32, observed 48 0 2 14 44 19 2 5 p< 0.000, df= 8
CM1 & CM2 available 52.56 62.81 134.72 80.65 46.2 196.52 65.62 23.1 59.93 χ2 = 1038.0 observed 18 297 102 68 79 89 42 16 11 p< 0.000, df= 8
CMs7-9 available 14.8 5.35 27.6 15.47 5.55 8.02 6.49 4.79 2.85 χ2 = 25.76, observed 12 6 22 28 11 4 0 5 3 p< 0.000, df= 8
CMs23-24 available 10.77 13.54 33.95 15.68 12.16 46.61 14.92 5.74 12.53 χ2 = 218.26, observed 5 64 31 11 17 20 11 1 6 p< 0.000, df= 8
Table 11. Habitat use by cheetahs. The figure presented is the actual number of locations per habitat type (‘observed’). The expected (‘available’) figure
was calculated by multiplying the percentage of each habitat type occurring in the 100% minimum convex polygon of each individual (see Methods) by the
total number of locations. Significant results at p < 0.05 are shown in boldtype.
Habitat types are described in Chapter 2: DMB = dry mountain bushveld; Grass = grasslands; MBC = closed mixed bushveld; MBO = open mixed
bushveld; Palm = palmveld; RSC = closed red sand bushveld; RSO = open red sand bushveld; RF = riparian forest; SF = sandforest.
69
DISCUSSION
Reintroduced lions and cheetahs at Phinda appeared to establish enduring home
ranges with similar characteristics and patterns to that observed in other ecosystems. All
individuals which survived the early post-release period (Chapter 3) remained at Phinda and
settled in ranges within the reserve which were stable at least for the duration of
monitoring. Lions (of both sexes) and male cheetahs were territorial whereas female
cheetahs showed no signs of establishing territories and used (in some cases) the entire
reserve as their home range. The long-term nature of some individual’s ranges (i.e. those of
the longest surviving animals) suggests that lions and cheetahs are amenable to establishing
a home-range following translocation, and therefore, that reintroduction may be a viable
method for re-establishing resident felids in areas of their former distribution.
Ranging and movement patterns in re-introduced lions followed the broad outline
typical of the species from other regions. In general, small founding groups of lionesses
established exclusive ranges and tolerated little overlap with other female groups. Male
coalitions associated with these female groups and their ranging patterns reflected the
distribution of females. For example, when the dominant male coalition in the north of the
reserve (Fig. 13) was killed by poachers, a coalition of males from the south expanded their
range to incorporate the female ranges in the north. As the only males in the reserve during
the latter part of the study, this coalition’s territory constituted 78.7% of the entire reserve,
moving between non-overlapping female territories. Between February and December 1993
when there were two coalitions of males in the reserve, each remained in discrete territories
of 42.23km2 (‘northern’ males: Fig. 9) and 60.91km2 (‘southern’ males: Fig. 14) which did
not overlap.
Sizes of female territories were amongst the smallest recorded for the species. The
95% range of the lone lioness LF2 was 27.56km2 which was approximately half the size of
her range when she was permanently in association with the lioness LF1 until her death 23
months after they were released. During most of this period, the males LMs7 and 8 were in
constant association with these females. Sample size is clearly too small to make robust
conclusions but the range of these four adult lions (42.23km2) is comparable to pride range
size in the ‘optimal’ habitat of Ngorongoro Crater which has very high, densities of prey
species which vary minimally year round. Ngorongoro contains one of the highest densities
of lions (and incidentally, spotted hyaenas) in studied populations anywhere and competition

70
for space is intense (Hanby et al, 1995). Lions at Phinda were not under the same social
pressures so it is difficult to predict the minimum size required by lions in the reserve and
therefore, the maximum lion density a small enclosed reserve such as Phinda could
maintain. Prey density is approximately six times as great in Ngorongoro (11,693 -
12000kg/km2; Hanby et al, 1995) compared to Phinda (1996.3 kg/km2; Chapter 7) so lion
densities at Phinda would never be able to reach the levels in similarly-sized Ngorongoro. It
would be interesting to establish the minimum spatial requirements of lions in the long-term
as they underwent population growth following re-introduction. However, the prospect for
such research is slim, at least in many of the small reserves in South Africa where large
felids have been reintroduced or where it is planned. Predation in enclosed reserves can
have considerable impact on prey populations (Chapter 7) and as a result, the lion
population at Phinda has been heavily managed with frequent removals since 1996 (Chapter
5). In Hluhluwe-Umfolozi Game Reserve, the pressure of increasing lion numbers forces
many dispersing sub-adults out of the reserve and similar population control measures have
been implemented there (Maddock et al, 1996). Most small reserves reintroducing lions
will probably have to implement similar management action and ultimately, the ranging
patterns of reintroduced lions in small areas will always be affected by such measures.
Despite the relatively uniform distribution of ungulates and a lack of migratory
movements of prey (Chapter 7), some lionesses at Phinda reduced their home ranges in
winter to almost half their summer range. Van Ordsol et al (1985) demonstrated an increase
in lean season biomass resulted in a subsequent reduction in range size in a number of lion
populations, although there was no clear evidence of seasonal fluctuation. The observed
patterns at Phinda may have reflected restricted and artificial availability of water during
the dry winter. Phinda management artificially supplied water to some dams and pans in
winter, particularly during 1992-1994. The strongest pattern of reduced winter ranges was
observed for the lionesses LFs1&2 whose ranges were centred around these water sources.
Indeed, the very small range of this pride during LF2’s first litter of cubs (Table 8) reflects
their almost exclusive use of a core area of 4.17 km2 surrounding one such waterhole.
These lionesses moved the cubs from their birth site approximately 6km to the water source
where they essentially remained for six months until summer rains. During this period, I
often saw these lions lie in wait at the waterhole and I observed them make 27 kills of
ungulates at the waterhole less than 300m from the den-site of the cubs.

71
Although predators will naturally seek high concentrations of available prey (Durant
et al, 1988; Caro, 1994) and the pattern observed at Phinda may arise naturally during
water shortages, the management of resource availability in small reserves is clearly an
issue which requires careful consideration. The provision of artificial sources of water may
substantially influence ungulate behaviour and movements (Mills & Retief, 1984; Knight et
al, 1998). In small reserves, the opportunity for herbivores to escape predation may be very
limited (Chapter 7). Managers need to be aware of exacerbating that problem by their
placement of artificial water sources. The waterhole around which the lionesses LFs1&2
centred their activities was the only source of water in their home range during this period
and probably concentrated ungulate activity in that area. I do not have sufficient data to
establish whether this increased ungulate vulnerability to predation or whether predation
rates were increased. However, intuitively, the potential for such effects would be reduced
by providing water at multiple sites so that herbivores had a ‘choice.’ While financial and
logistic restrictions invariably limit the numbers and distribution of such waterpoints,
planning with this in mind is an important aspect of predator-prey management in small
reserves.
Cheetah males established relatively small, exclusive territories. In two cases, I
observed male coalitions kill single males which were caught intruding into these territories
(Hunter & Skinner, 1995, Appendix III). Interestingly, all the males released at Phinda
originated from Namibia (see Chapter 2) where they apparently have very large home
ranges of between 800 to 1500km2 which are probably not defended as territories (Marker-
Kraus et al, 1996). Unfortunately I do not have specific data on any of the males before
they were translocated to Phinda: it would be extremely interesting to compare the ranging
patterns of known males from Namibia before and after they were translocated to a very
different region such as Phinda. Presumably, the high density of non-migratory game at
Phinda (see Chapter 7) facilitated the establishment of territories by males at Phinda. Caro
(1994) demonstrated that Serengeti males established territories averaging 37.4km2 in areas
with high concentrations of Thomson’s gazelles and sufficient cover which were favoured
by females for hunting. By locating their territories in areas with high rates of visitation by
females, males increased their chances of encountering females, and, presumably, therefore
opportunities to mate.

72
I do not have strong enough data to establish how males made decisions about where
to locate territories at Phinda. Female cheetahs at Phinda generally used the entire reserve
or a considerable portion of it and it was difficult to determine factors which may have
increased their use of a specific area. In the Serengeti, very localised rainfall patterns and
differences in soil quality gives rise to considerable spatial and temporal variation in the
flush of grass growth, causing Thomson’s gazelles to form temporary localised
concentrations (Caro, 1994). Female cheetahs move over large areas searching for these
resource patches. At Phinda, although the distribution of ungulates varied in different
habitats, herbivore density was high in all areas (Chapter 7) and I believe females did not
have to cover large areas in search of ungulate aggregations. However, suitable habitat for
hunting, rather than the prey itself, may have been the ‘patchy’ resource which gave rise to
cheetah movements. Open habitat, particularly grasslands, were heavily favoured by
cheetahs at Phinda (Table 11) and was the preferred habitat for hunting by cheetahs (Table
30: Chapter 6). Yet grasslands constituted only 8.6% of available habitat and were
distributed as small, discreet, widely spaced patches (Fig. 5; Chapter 2). The core areas of
the males with the longest tenure at Phinda (CMs1&2) were centred in regions with the
most extensive grasslands. All monitored females at Phinda used these same grasslands
extensively: in the case of the female CF5, her home range for 15 months was only 33.86
km2 and was centred in an area of grassland and open mixed bushveld (Fig. 19 and see Fig.
5, Chapter 2). Her range was entirely enclosed by CMs1&2’s territory for 12 of those
months until their deaths in April 1995. Following their deaths, the two brothers
CMs23&24 centred their activities in the same region. Furthermore, although I do not have
good data after the end of 1995, when these two males were captured and translocated
elsewhere (see Chapter 5), a coalition of three males born at Phinda (CMs31-33) have
apparently established the core area of their range in the same grasslands and open regions
(Walker, pers comm1).
The importance of such key areas to territory establishment by male cheetahs
following reintroduction is an area which requires further research. This is particularly so
in highly heterogeneous ecosystems such as at Phinda which is dominated by Acacia
woodlands and has relatively small areas of ‘typical’ cheetah habitat. I saw two fatal fights,
between male cheetahs, both occurring in these grasslands and two other single males were
1 Walker, C. Phinda Resource Reserve, Private Bag 6001, Hluhluwe, 3960. tel: 035 562 0271.
73
killed in the same areas by a territorial three-male coalition during 1997-8 (Chapter 5). This
suggests there is considerable competition for such areas. From a management perspective,
the suitability of habitat for cheetahs in a reintroduction project requires careful
consideration. Much of the region where Phinda is located (and indeed many areas
presently being ‘reclaimed’ as wildlife land in South Africa) suffers from the removal of
bulk grazers and browsers such as elephants and rhinoceros which may facilitate the
maintenance of open savannah (Dublin, 1995). Their expatriation, combined with high
densities of livestock has resulted in extensive areas of ‘bush encroachment’ in some areas
(Moll, 1981). Phinda has adopted an aggressive scheme of selective bush-clearing of such
areas, which aims to open up dense stands which were formerly open savannah (based on
aerial photographs). The impact of such procedures on cheetah ranging dynamics would be
a productive topic to explore as more open habitat becomes available.
Despite extensive overlap between lions and cheetahs, cheetahs appeared to be
relatively free of pressure from lions and were still successful in establishing home ranges
in the same areas as lions. I saw 29 occasions when cheetahs encountered lions, 11 of them
involving female cheetahs with young cubs: on two of those occasions, I saw female
cheetahs pursue lions for distances up to 70m in defence of their cubs (Chapter 5). In three
encounters between the two species, lions killed cheetahs, an 11 month old cub which was
separated from its mother and two adult males which had been resident at Phinda for over
three years at the time of their deaths (CM1 & CM2; fig 22). Interestingly, lions and
cheetahs displayed similar habitat preferences, showing high use of grasslands and
generally avoiding very dense habitat types (Tables 10 & 11). However, the pattern of kills
made in different habitat types differed markedly, illustrating that while lions often utilised
more open areas, they made more kills in dense bush (Chapter 6). As well as their
preference for open habitats for hunting, the use of such regions by cheetahs probably
assists them in avoiding lions due to increased visibility. On the three occasions lions killed
cheetahs, they were caught in thick vegetation after having moved from more open areas.
While heterogeneous habitat may provide advantages to females for raising cubs and
avoiding predation on juveniles (Laurenson, 1995b; Durant, 1998 and see Chapter 5), the
widespread distribution of small patches of open habitat may have increased the encounter
rate between lions and cheetahs at Phinda. Given that both species used these areas
extensively and that they generally occurred as isolated patches surrounded by much denser
74
habitat (Fig 5; Chapter 2), the potential for greater conflict and more cheetah deaths by
lions than observed here was high. In Nepal, McDougal (1998) documented high rates of
leopard mortality by tiger predation where habitat suitability favoured high densities of
tigers. At Phinda, Cheetahs may only have avoided increased pressure due to the relatively
low density of lions (Chapter 5). The balance between areas of suitable habitat and pressure
from competitors is a critical factor in the success of reintroduction attempts of cheetahs
and is an area where future efforts should devote extensive investigation.
There is clearly still considerable information to be gathered on the range and
movement patterns of reintroduced felids. The patterns observed at Phinda were subject to
considerable disruption by management practices, deaths of cats and other stochastic events
following their release. Reintroduced felids showed considerable variation in ranging
characteristics, though they generally conformed to the patterns observed for their species in
other regions. Small sample size is an aggravating factor here, given that only two or three
individuals of each species’ sex/age class could be monitored. This is probably inevitable in
most reintroduction projects of large cats in South Africa which typically involve a small
number of founding animals which are mostly sourced opportunistically (Chapter 2).
Ultimately, long-term monitoring of many such efforts will provide a clearer picture of home-
range patterns of reintroduced felids.
The present study illustrated that felid reintroduction into small areas entails extensive
management. Ultimately, the question most managers will seek to answer is how many
individuals of lions and cheetahs small reserves can sustain. At Phinda, with its relatively
high density of prey species, lions and cheetahs (particularly males) were able to occupy
small home-ranges and, in conjunction with the observed rapid reproduction (Chapter 5),
relatively high densities of both species were theoretically possible. During the present
study, lions and cheetahs reached a maximum number of the equivalent (in terms of
biomass) of 13 and 21 adult females respectively (see Chapter 5). Even with these relatively
low densities, there was considerable impact on some ungulate species as a result of
predation (Chapter 7). Accordingly, small reserves should perhaps ask the question how
many lions or cheetahs does the reserve ‘need’ rather than how many it can sustain. For
example, at Pilanesberg National Park, the main objective of lion reintroduction has been
for ‘eco-tourism’ (Van Dyk, 1997). Therefore, an important aspect of lion monitoring at
75
Pilanesberg is tourist surveys in an attempt to establish the ‘ideal’ density of lions to
enhance tourist sightings of lions (Van Dyk, 1997). Clearly, such a management plan needs
to operate in conjunction with monitoring of prey species to establish the impact of lions on
prey populations. The ‘result’, in terms of lion numbers will have to consider these
elements and balance the advantages and disadvantages of both.
Range characteristics of lions and cheetahs at Phinda were heavily influenced by human
activity which may prove to be a useful management tool for reserves attempting to re-establish
‘sustainable’ populations of large felids. The respective propensities of cheetahs to centre their
ranges in open habitat and lions to do likewise around artificial waterholes are useful
considerations for management of these species in small reserves. Although active manipulation
of lion and cheetah ranging patterns was not attempted during the present study, subsequent
projects may benefit from applying these observations. The strategic positioning of key
landscape features valued by lions and cheetahs could enhance the success of a reintroduction
project and diminish the level of management required in the longer-term. As efforts to restore
large felids in small reserves in South Africa proliferate, ongoing research across numerous
sites will be very valuable to quantify further the important elements contributing to lions and
cheetahs’ ranging behaviour. Analysis of data from different reserves and the experimental
manipulation of key factors (such as the location of artificial waterpoints) will be crucial to
refine these ambitious projects.

76
CHAPTER 5.
POPULATION CHARACTERISTICS OF REINTRODUCED LIONS AND CHEETAHS
AND PERSISTENCE OF REINTRODUCED CARNIVORE POPULATIONS.
Reintroduction of large carnivores as a viable method for species repatriation is still a
very controversial subject. Although large carnivores are frequent subjects for re-introduction
efforts, post-release monitoring of such attempts in the past has been poor, (particularly in
Africa), and where it has occurred, the success of projects has been limited, (Childes, 1988;
Hamilton, 1981; Kruger, 1988; Pettifer, 1981; Mills, 1991; Linnell et al 1998). Such failures
have led many authors to conclude that the factors affecting success are not well enough
understood to justify relocation as a method for conserving and managing large carnivores
(Panwar & Rodgers, 1986; Wemmer & Sunquist, 1988; Mills, 1991). One critical factor in
assessing the success of these projects is the demography of reintroduced populations. In
particular, reproduction, mortality and population growth are crucial to understanding
population dynamics (Kleiman et al, 1989; Stanley-Price, 1989). Furthermore, analyses and
predictions about viable population sizes and the persistence of populations are typically
produced using such demographic data (Lacy 1987; Lacy & Clark, 1993; Berry et al, 1997).
Few studies have been able to collect detailed data of this sort for reintroduced carnivores. As a
result, while certain technical perfections have improved success of reintroduction efforts
(Clark & Reading, 1996), insight into important demographic parameters which may contribute
to carnivore re-establishment is still poor.
In North America and Europe, observation largely from projects on non-felids has
yielded some important data regarding the factors influencing survival and reproduction of
reintroduced carnivores. For example, in one study, black bear cubs younger than a year
translocated with the mother suffered increased mortality, giving rise to recommendations that
females with young cubs were poor candidates for translocation (Rogers, 1986). Similarly,
translocated brown bear cubs and subadults suffered increased mortality rates even when the
mother survived, and adult females apparently had a reduced chance of reproducing the
following year (Brannon, 1987; Miller & Ballard, 1982). Only one study to date has accurately
documented the ability of translocated female bears to reproduce (Blanchard & Knight, 1995),
which, perhaps more than post-release survival, is a better indication of project success (Clark
& Reading 1996; Linnell et al, 1997). Among canids, reintroduced grey wolf females had a
tendency to abandon pups which usually perished (Fritts, 1992), although wolves in general
77
appear more successful at post-release reproduction than bears (Bangs et al, 1996; Bangs &
Fritts, 1996; Koch et al, 1995).
The information available for felids is less detailed. Two female mountain lions
produced cubs within 2 years of release in New Mexico despite a high mortality rate for the
project (Ruth et al, 1993). Eurasian lynx releases within Austria, France, Slovenia and
Switzerland appear to have successfully established populations (with the exception of Austria)
though specific details about mortality and reproduction are largely unknown (Breitenmoser &
Breitenmoser-Wursten, 1990; Yalden, 1993). Among African felids, published data is even
more scant. Numerous efforts to reintroduce cheetahs in South Africa have apparently failed
and were largely unmonitored so there is little post-release data available on demographic
parameters (Rowe-Rowe, 1992, and see Table 2, Chapter 2). In the well-documented study by
Hamilton (1981) on translocated leopards in Kenya only one female of 12 released individuals
eventually settled in the release site and potentially reproduced. Translocation of lions has been
largely unsuccessful for numerous reasons mostly related to dispersal from the release site and
past projects have not provided any demographic data (Van den Meulen, 1977; Stander, 1990).
An important exception occurred in Namibia, where lions which left Etosha National Park were
returned to their original range and usually remained there (Stander, 1990). However, while
useful, this provides no indication of demographic processes which affect the re-establishment
of felids.
Clearly, there is very little information available on the demographics of re-introduced
felids. In this chapter, I present the mortality and reproductive characteristics of reintroduced
lions and cheetahs. These data originates from daily observations from May 1992-September
1995 and episodic data collection on 12 field trips between September 1995 and June 1998.
The specific objectives of this section are to:
1. document the post-release survival of reintroduced lions and cheetahs and attempt to
determine important causes of mortality;
2. document patterns of reproduction of reintroduced lions and cheetahs;
3. use the above data as input parameters to model population viability estimations;
4. make methodological recommendations based on the data and population projections
to enhance the success of large felid reintroduction efforts.

78
METHODS
Daily radio-monitoring of felids allowed me to observe patterns of oestrous and mating
behaviour in female lions and cheetahs, and anticipate and document births. Lionesses have
very conspicuous oestrous and mating bouts which I noted. Following matings, I attempted to
observe lionesses daily to record any resumption of oestrus and determine if they were
pregnant. Lionesses generally showed obvious signs of pregnancy 3-6 weeks prior to birth
which, in conjunction with dates they last mated, allowed me to predict fairly accurately when
they would give birth. All lionesses were telemetred prior to giving birth or their daily locations
ascertained via association with telemetred individuals. As a result I was able to record all
births of lions at Phinda (with the possible exception of one litter: see Results).
This level of monitoring was not possible in cheetahs. Phinda management was
reluctant to permit radio-collaring of female cheetahs, (see Appendix II), so aside from two
telemetred females, I relied on opportunistic sightings to gather information. Mating behaviour
in cheetahs is extremely rarely observed due to their apparent shyness during consorts and the
brief nature of matings (Caro, 1994). I never observed matings but I often saw consortships
between males and females. I noted when males and females were in association, after which I
attempted to regularly locate these females until their predicted birth date, assuming they had
conceived. Whereas I knew the birth dates of all lion cubs to within a 3-4 day period, most
cheetah litters were aged after emergence and so birth dates presented here are accurate to
within about 1-3 weeks, depending on the level of monitoring possible with the mother.
Incidental sightings of unmonitored cheetahs with cubs indicated additional litters to those I
recorded: however, these females were often very shy and specific details are generally poorly
known.
Most litters of both species were counted after emergence at approximately 6-8wks so
mortality while still in the natal lair is largely unknown. Accordingly, my figures represent the
minimum numbers of cubs born at Phinda for the study period. However, partial loss of litters
prior to emergence appears to be rare (Laurenson, 1996; Packer et al, 1988) so my figures are
probably close to the actual number of cubs born, particularly for lions.
Most post-release mortalities of reintroduced felids were documented within 24h of an
animal’s death. Accordingly, the cause and date of death was apparent in most cases. For some
post-mortems, I consulted the regional veterinarian for the Natal Parks Board. For non-collared
cheetahs where sightings were opportunistic, I calculated post-release survival based on the date
79
these individuals were last sighted. However, it should be noted this represents a minimum
survival time: some of these animals were rarely sighted when living and certainly in some
cases would have been alive beyond the date I last saw them. I also present survival data on
animals which are still alive (as at 30/06/98) or which have been translocated to other reserves.
To attempt some estimation of the persistence of lion and cheetah populations following
reintroduction, I used the population viability analysis software VORTEX, a simple stochastic
simulation of population change and extinction. VORTEX is one of the most widely used
population models and has been used to simulate changes in lion and cheetah populations in
other regions and contexts (Berry et al, 1997; Zank, 1997). I used my specific demographic
data from the lion and cheetah populations at Phinda as the input parameters for the population
viability analysis. For some parameters (e.g. cub survival and age at first reproduction), my
data probably represent a ‘best case scenario’ (in comparison to established populations) which
may only apply in the early years following a reintroduction. Therefore, I explored the effect of
varying these parameters in subsequent simulations within observed variation from established
populations. Where VORTEX required data which I did not have specific to Phinda (for
example, age of reproductive senescence), I used data from the published literature. I present
details of all the parameters in the Results.
RESULTS
Mortality
Most reintroduced lions and cheetahs survived the early post-release stage of 3 months
(Chapter 3) and generally survived for considerably longer (Table 12). For cats which died
during my study, the mean post-release survival time was generally longer than a year.
The survival time of animals other than those which were confirmed dead is presented
in Table 13. All these lions survived a minimum of almost 4 years post-release. Some of these
animals are still living at Phinda after more than 6 years. Survival time of some unmonitored
cheetahs is less clear due to sporadic observations, but females generally appeared to live
longer than males. As indicated in the Methods, these individuals almost certainly survived
longer than to the date they were last seen.
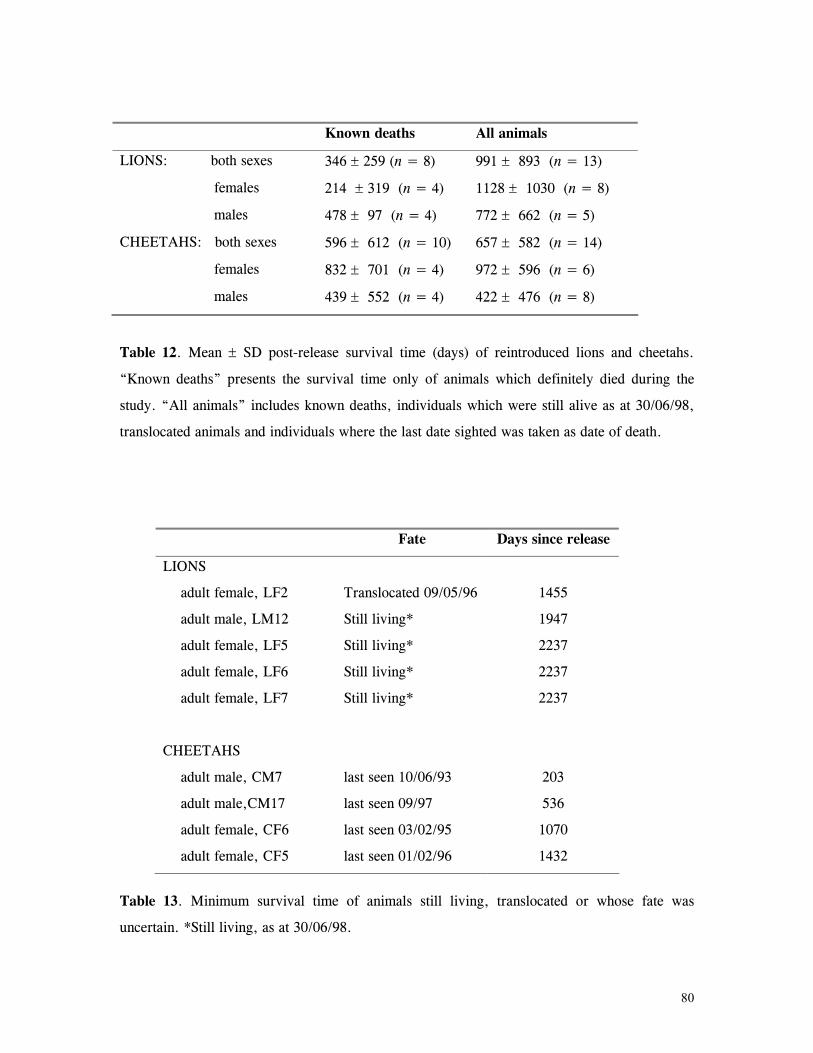
80
Known deaths All animals
LIONS: both sexes 346 ± 259 (n = 8) 991 ± 893 (n = 13)
females 214 ± 319 (n = 4) 1128 ± 1030 (n = 8)
males 478 ± 97 (n = 4) 772 ± 662 (n = 5)
CHEETAHS: both sexes 596 ± 612 (n = 10) 657 ± 582 (n = 14)
females 832 ± 701 (n = 4) 972 ± 596 (n = 6)
males 439 ± 552 (n = 4) 422 ± 476 (n = 8)
Table 12. Mean ± SD post-release survival time (days) of reintroduced lions and cheetahs.
“Known deaths” presents the survival time only of animals which definitely died during the
study. “All animals” includes known deaths, individuals which were still alive as at 30/06/98,
translocated animals and individuals where the last date sighted was taken as date of death.
Fate Days since release
LIONS
adult female, LF2 Translocated 09/05/96 1455
adult male, LM12 Still living* 1947
adult female, LF5 Still living* 2237
adult female, LF6 Still living* 2237
adult female, LF7 Still living* 2237
CHEETAHS
adult male, CM7 last seen 10/06/93 203
adult male,CM17 last seen 09/97 536
adult female, CF6 last seen 03/02/95 1070
adult female, CF5 last seen 01/02/96 1432
Table 13. Minimum survival time of animals still living, translocated or whose fate was
uncertain. *Still living, as at 30/06/98.
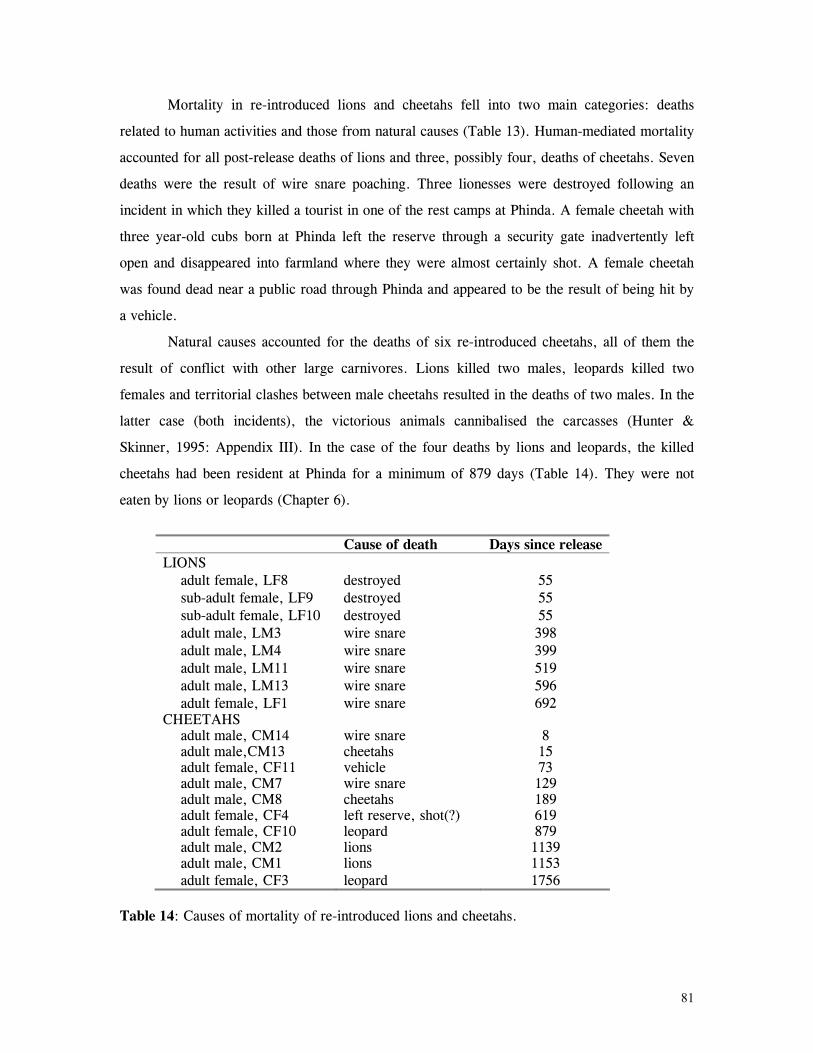
81
Mortality in re-introduced lions and cheetahs fell into two main categories: deaths
related to human activities and those from natural causes (Table 13). Human-mediated mortality
accounted for all post-release deaths of lions and three, possibly four, deaths of cheetahs. Seven
deaths were the result of wire snare poaching. Three lionesses were destroyed following an
incident in which they killed a tourist in one of the rest camps at Phinda. A female cheetah with
three year-old cubs born at Phinda left the reserve through a security gate inadvertently left
open and disappeared into farmland where they were almost certainly shot. A female cheetah
was found dead near a public road through Phinda and appeared to be the result of being hit by
a vehicle.
Natural causes accounted for the deaths of six re-introduced cheetahs, all of them the
result of conflict with other large carnivores. Lions killed two males, leopards killed two
females and territorial clashes between male cheetahs resulted in the deaths of two males. In the
latter case (both incidents), the victorious animals cannibalised the carcasses (Hunter &
Skinner, 1995: Appendix III). In the case of the four deaths by lions and leopards, the killed
cheetahs had been resident at Phinda for a minimum of 879 days (Table 14). They were not
eaten by lions or leopards (Chapter 6).
Cause of death Days since release LIONS
adult female, LF8 destroyed 55 sub-adult female, LF9 destroyed 55 sub-adult female, LF10 destroyed 55 adult male, LM3 wire snare 398 adult male, LM4 wire snare 399 adult male, LM11 wire snare 519 adult male, LM13 wire snare 596 adult female, LF1 wire snare 692
CHEETAHS adult male, CM14 wire snare 8 adult male,CM13 cheetahs 15 adult female, CF11 vehicle 73 adult male, CM7 wire snare 129 adult male, CM8 cheetahs 189 adult female, CF4 left reserve, shot(?) 619 adult female, CF10 leopard 879 adult male, CM2 lions 1139 adult male, CM1 lions 1153 adult female, CF3 leopard 1756
Table 14: Causes of mortality of re-introduced lions and cheetahs.
82
Reproduction
A minimum of 43 lions in 14 litters (mean litter size: 3.07 ± 0.91) and 48 cheetahs in
11 litters (mean litter size: 4.36 ± 0.92) were born at Phinda between 1992 and 1997 (Table
15.). The figure for lions represents all litters born at Phinda with the possible exception of one
litter born to LF1: she mated on the 5th-8th July 1993, followed by anoestrus for 110 days (the
typical gestation period). She then remained at one location in dense vegetation for 8 days
before emerging and leaving the area. These events suggest that she gave birth, though I could
not find any evidence of cubs, living or dead, when I searched her ‘den-site’ after she left. As
indicated in the Methods, the number of cheetah cubs born is a minimum estimate and I knew
of at least three additional litters born to shy, unmonitored females about which I have no
accurate data.
Patterns of reproductive behaviour for five reintroduced lionesses are presented in
figures 27 - 31. The inter-litter interval for females which had more than one litter during my
study averaged 601.5 days (SD= ± 119.8 days), with a range of 504 - 854 days. Three females
of known age had their first conception at age 32-33mo which is considerably younger than
recorded elsewhere in wild lions (Smuts, 1978; Pusey & Packer, 1987). Five male lions sired
cubs at the age of 26-28 months old which accords well with the age males are known to begin
producing spermatazoa (26 months old; Smuts, 1978). I do not have data for cheetahs.
Survivorship of monitored cubs of both species has been high relative to recorded
survivorship for established populations. 85% of lion cubs survived the first 12 months and
survived a minimum of 20 months (the minimum age at which ‘independent’ sub-adults were
translocated). 75% of cheetah cubs survived the first 12 mths and 62% reached independence
(Table 15: Note that a portion of the deficit is due to some cubs still being dependent upon
mothers at the time of writing: I have excluded them from the percentage reaching
independence, though the chances that some will are high). Where the causes of cub mortality
are known, most are due to natural causes: however, human activity is a factor in some losses.
For example, five lion cubs from two litters were lost to infanticidal males during pride take-
overs which occurred after the cubs’ sires were killed by poachers. The opportunity for
intrusion by foreign males may not have arisen if the pride males had survived. Additionally,
the first litter of cheetahs born to a re-introduced female was lost when they left the reserve as a
result of poor boundary security (see Mortality section). Other causes of cub mortality are
83
largely unknown: cubs mostly simply disappear and are never found. Lions were observed to
kill one cheetah cub at 11 months old and a 5 month old cheetah cub was separated from its
mother and never reunited. It survived and was apparently feeding for at least 23 days on its
own after which it disappeared. Five cubs of cheetah litter 17 were orphaned at 7 months old.
One disappeared at 8 months old and one was killed by a leopard at 9 months old. The
remaining three survived to a minimum of 24 months old.
Information on mortality of young adults after independence indicates high survival.
Aside from the six cubs which died before they were 12 months old (Table 15) only one other
lion born at Phinda has died, a 3 year old male killed in a snare in May, 1998. 29 lions born at
Phinda have been captured and translocated to other reintroduction sites: all were aged 20mo
and older at the time of translocation with the exception of two 14mo cubs translocated with
grown pride members. A 16 month old male cheetah was killed by spotted hyaenas after
sustaining a leg injury two months after separation from its mother. A 14mo female cheetah left
the reserve through a hole in the boundary fence and was still being sighted at a property 20km
away 12 months later. However, as she is probably the only cheetah on that property, her
chances of breeding are slight unless she returns to the Phinda population. Two young males,
both singletons, were killed in two separate clashes with a three-male coalition of cheetahs (NB:
these incidents are separate to the two deaths of reintroduced individuals from intra-specific
conflict detailed in Table 14 and Appendix III). Excepting these losses, all the cheetahs born at
Phinda for which I have good data are still alive at the time of writing. Four grown individuals
(2:2) and two dependent cubs all born at Phinda have been translocated to other re-introduction
sites.

84
Litter Born Litter size When counted
Survived to independence
LIONS 1 05/93 2 emerged 0 2 11/93 2 emerged 2 3 01/94 3 emerged 2 4 01/94 3 emerged 3 5 03/94 3 in lair 0 6 08/94 3 emerged 3 7 04/95 5 emerged 5 8 05/95 4 emerged 4 9 06/95 2 emerged 2 10 01/97 4 emerged 4 11 01/97 2 emerged [2]d 121 05/97 4 emerged [4]d 13 08/97 3 emerged [3]d 141 10/97 3 emerged [3]d
Total number lion cubs: 43 CHEETAHS
15 11/92 3 emerged 0* 16 07/93 5 in lair 3 16 05/94 5 emerged 4 18 06/94 5 emerged 5 19 10/94 4 emerged 4 20 10/94 5 in lair 3 21 06/96 6 emerged 3† 22 06/96 4 emerged 3 231 08/96 4 emerged 2 241 04/97 3 emerged [3]d 251 05/97 4 in lair [3]d Total number cheetah cubs: 48
Table 15: Details of lion and cheetah litters born at Phinda. 1 Litters of Phinda-born females. All other litters are those of originally re-introduced females.
d Surviving cubs still dependent on mother at time of writing.
* Three cubs still alive at 12mo when they left reserve with mother and disappeared. † This litter orphaned at 7mo. Three survived at least to 24 mo.
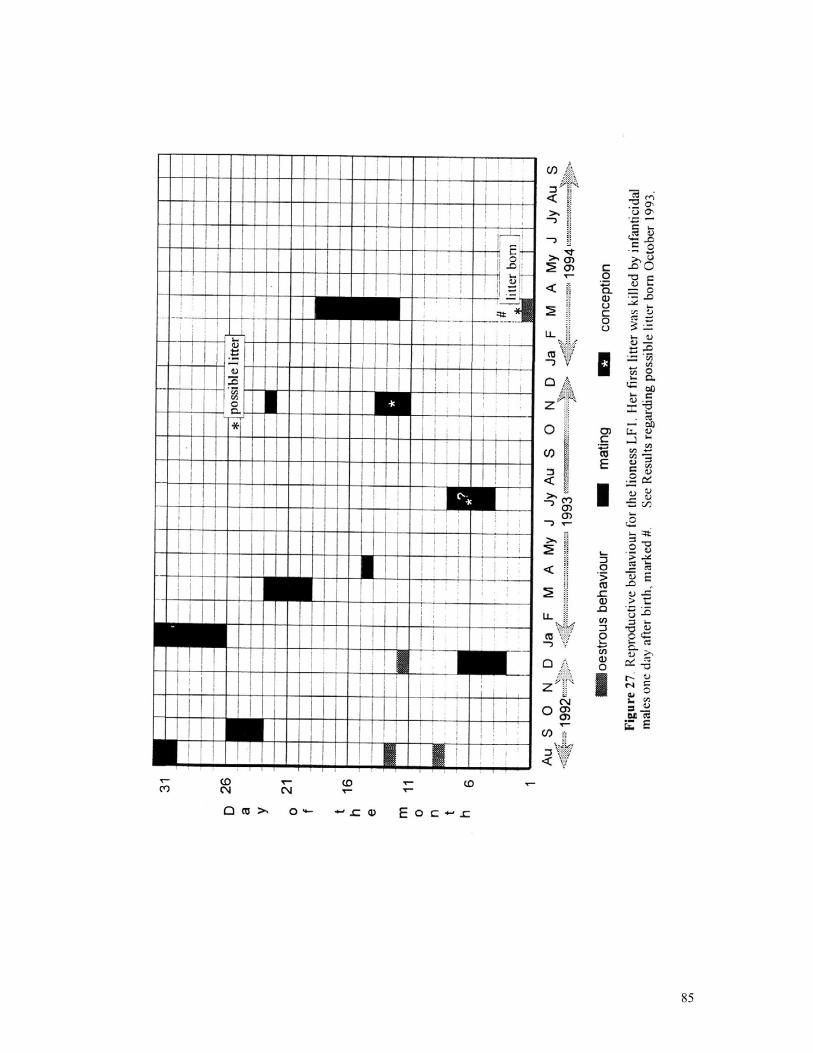
85
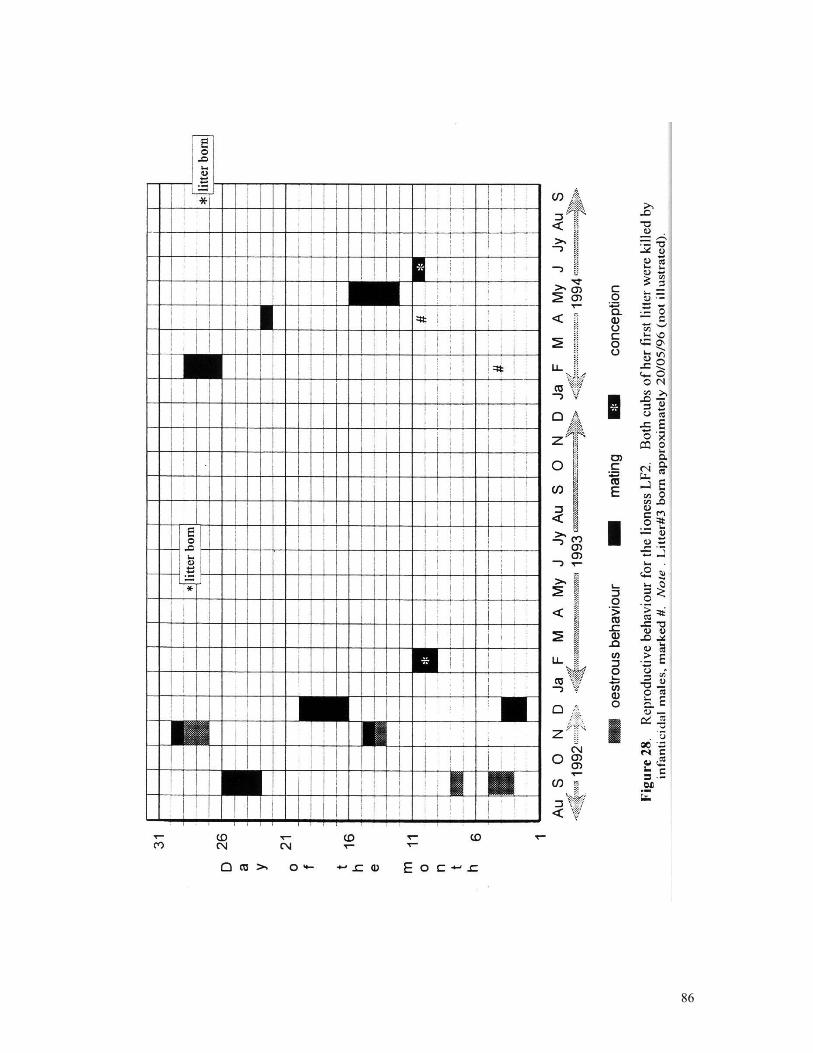
86
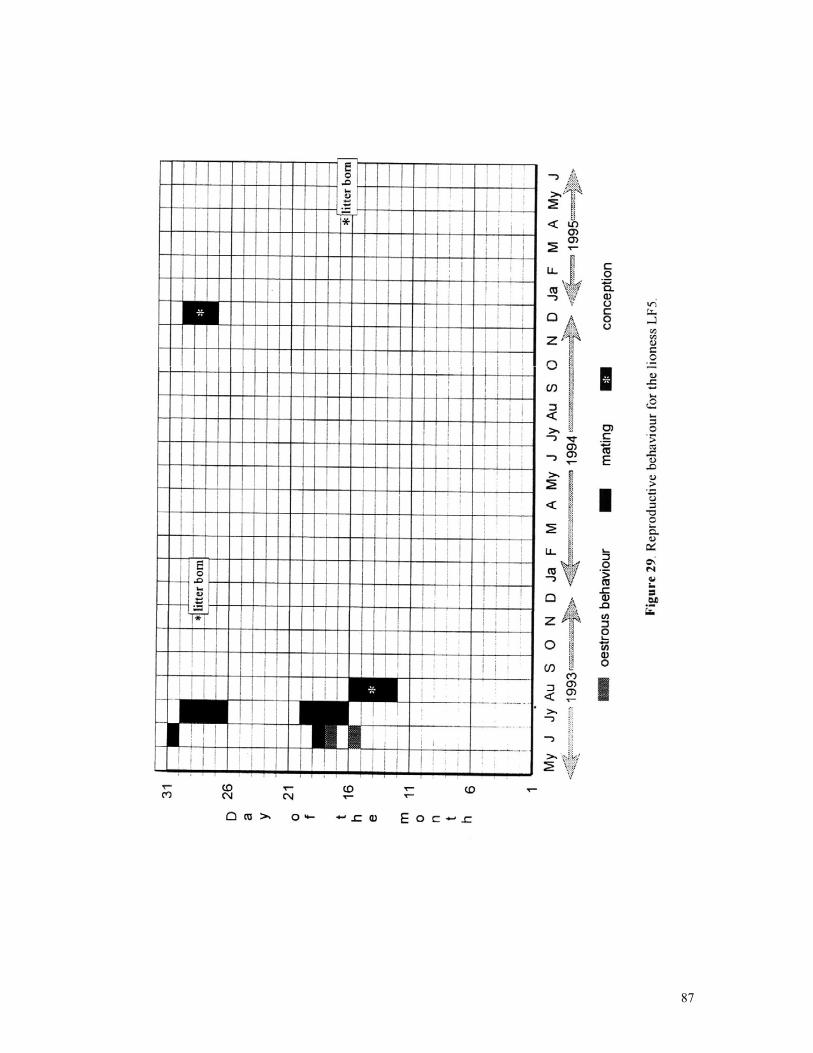
87
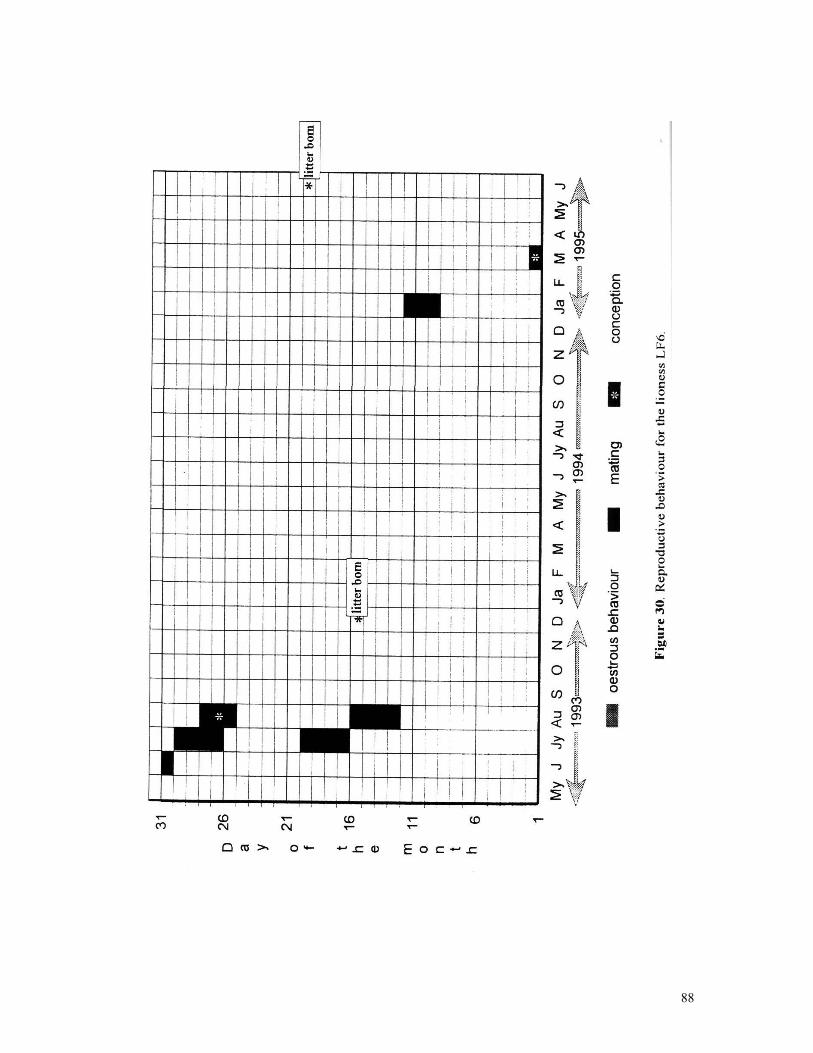
88

89

90
Actual population growth for lions and cheetahs at Phinda during the study period is
presented in Figure 32. The fluctuations during the first half of the study period reflect high
losses following reintroduction, subsequent releases of animals and the onset of reproduction.
Following this period, the graph shows a steady increase in the number of both species as
mortalities were low and reproduction increased.
LIONCHEETAH
SEASON
Lion
and
che
etah
num
bers
(FE
Qs)
4
6
8
10
12
14
16
18
20
22
sp92 su92 au93 wi93 sp93 su93 au94 wi94 sp94 su94 au95 wi95
Figure 32. Seasonal lion and cheetah numbers at Phinda, expressed as Female Equivalent
Units (FEQs). FEQs are an estimate of lion or cheetah biomass, expressed as the equivalent
number of adult females. I provide a detailed description in the Methods section of Chapter 6.
Population Simulation Modelling: VORTEX.
I used the above reproduction and mortality data for the simulations. The starting
population size and age distribution reflected the numbers and ages of lions and cheetahs
released (Chapter 2). Each scenario was repeated 200 times and projections were made for a
100 year period. I refer to the ‘Base Scenario’ for the starting parameters (based on Phinda
data) for all simulations (summarised in Table 17). I examined the effect of varying juvenile
and subadult mortality rates, and age at first breeding for adults, parameters which would be
expected to alter over time as population size increased following reintroduction. I present
specific details in each section.

91
Age of first reproduction and breeding system.
VORTEX defines breeding as the age when young are born, not the age of sexual
maturity. The opportunity to breed earlier than in established populations may exist in
reintroduced populations. Three lionesses at Phinda conceived at age 32-33 mths which is
generally earlier than other populations. Accordingly, I set this age for the model at three
years. However, opportunities for early breeding may only exist in the early years after
reintroduction, so I also ran the simulation with female age at first breeding at five years which
is the approximate age where females begin breeding in established populations (Smuts, 1978;
Pusey & Packer, 1987).
I did not have data on age at first reproduction from Phinda for cheetah females.
Namibian cheetahs on average have their first litter around three years of age (Berry et al,
1997). while data from 22 Serengeti females places this age at 2.4 years (Kelly et al, 1998).
Although females might have been able to breed earlier at Phinda, I set this age as three for the
model. VORTEX does not allow fractional ages and two years for the age of first reproduction
is very rare (Laurenson, 1994).
Reintroduced males may also have opportunities to mate earlier than in established
populations where they probably sire their first litter around the age of 5-6 years for both lions
and cheetahs. Five male lions at Phinda fathered litters at the age of 26-28mths. Similarly, I
saw male cheetahs between two and three years old associating with and displaying evident
sexual interest in females, though I never saw matings. Lions and cheetahs have a polygynous
mating system so populations must be extremely small for male reproductive age to have a
significant demographic effect in the model (Berry et al, 1997). Given the very small starting
population size at Phinda, I ran the simulation with male reproductive age at three years and at
five years for both species.
Cub production
VORETX requires data on the number of cubs per litter, interval between litters and
the proportion of females producing cubs per year. Mean litter size for lions was 3.1 (range 2-
5) and for cheetahs was 4.4 (range 3-6). Average interval between litters for Phinda lionesses
was 601.5 days which is lower than other populations where it is usually two to four years.
Given the very small sample here, I opted for the lower estimate of this figure from elsewhere,
i.e. two years. An inter-litter interval of two years translates to 50% of females not producing a
litter each year.
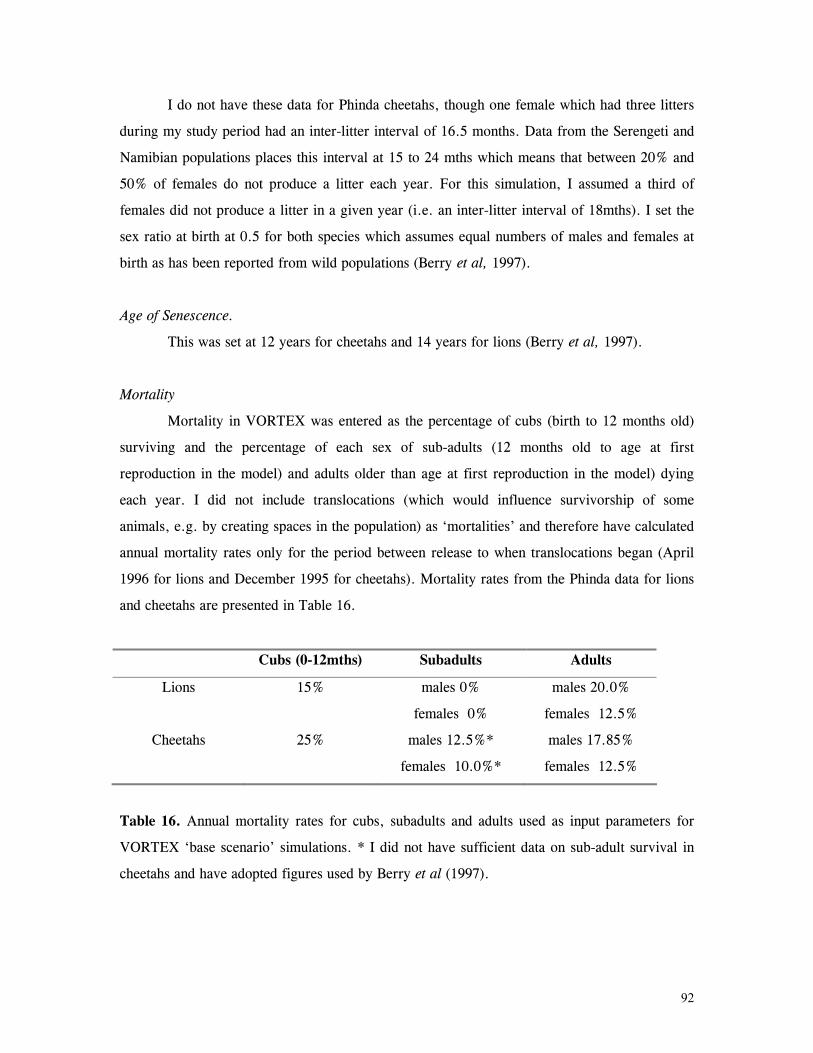
92
I do not have these data for Phinda cheetahs, though one female which had three litters
during my study period had an inter-litter interval of 16.5 months. Data from the Serengeti and
Namibian populations places this interval at 15 to 24 mths which means that between 20% and
50% of females do not produce a litter each year. For this simulation, I assumed a third of
females did not produce a litter in a given year (i.e. an inter-litter interval of 18mths). I set the
sex ratio at birth at 0.5 for both species which assumes equal numbers of males and females at
birth as has been reported from wild populations (Berry et al, 1997).
Age of Senescence.
This was set at 12 years for cheetahs and 14 years for lions (Berry et al, 1997).
Mortality
Mortality in VORTEX was entered as the percentage of cubs (birth to 12 months old)
surviving and the percentage of each sex of sub-adults (12 months old to age at first
reproduction in the model) and adults older than age at first reproduction in the model) dying
each year. I did not include translocations (which would influence survivorship of some
animals, e.g. by creating spaces in the population) as ‘mortalities’ and therefore have calculated
annual mortality rates only for the period between release to when translocations began (April
1996 for lions and December 1995 for cheetahs). Mortality rates from the Phinda data for lions
and cheetahs are presented in Table 16.
Cubs (0-12mths) Subadults Adults
Lions 15% males 0%
females 0%
males 20.0%
females 12.5%
Cheetahs 25% males 12.5%*
females 10.0%*
males 17.85%
females 12.5%
Table 16. Annual mortality rates for cubs, subadults and adults used as input parameters for
VORTEX ‘base scenario’ simulations. * I did not have sufficient data on sub-adult survival in
cheetahs and have adopted figures used by Berry et al (1997).
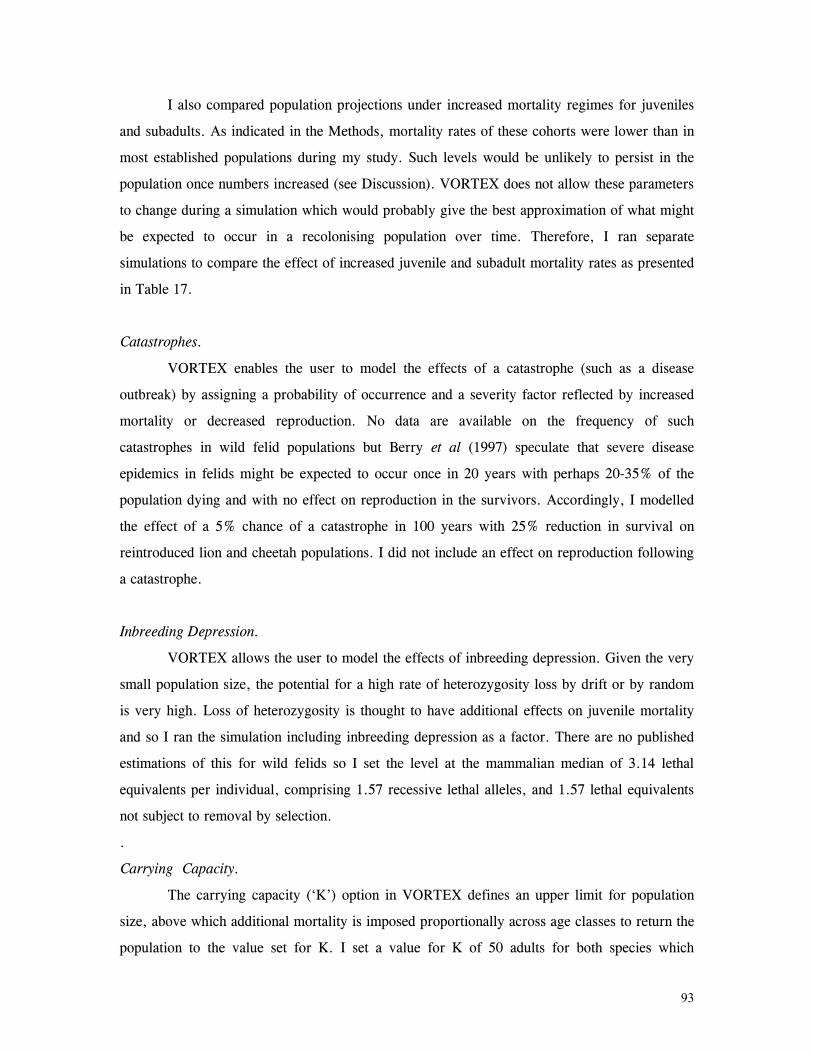
93
I also compared population projections under increased mortality regimes for juveniles
and subadults. As indicated in the Methods, mortality rates of these cohorts were lower than in
most established populations during my study. Such levels would be unlikely to persist in the
population once numbers increased (see Discussion). VORTEX does not allow these parameters
to change during a simulation which would probably give the best approximation of what might
be expected to occur in a recolonising population over time. Therefore, I ran separate
simulations to compare the effect of increased juvenile and subadult mortality rates as presented
in Table 17.
Catastrophes.
VORTEX enables the user to model the effects of a catastrophe (such as a disease
outbreak) by assigning a probability of occurrence and a severity factor reflected by increased
mortality or decreased reproduction. No data are available on the frequency of such
catastrophes in wild felid populations but Berry et al (1997) speculate that severe disease
epidemics in felids might be expected to occur once in 20 years with perhaps 20-35% of the
population dying and with no effect on reproduction in the survivors. Accordingly, I modelled
the effect of a 5% chance of a catastrophe in 100 years with 25% reduction in survival on
reintroduced lion and cheetah populations. I did not include an effect on reproduction following
a catastrophe.
Inbreeding Depression.
VORTEX allows the user to model the effects of inbreeding depression. Given the very
small population size, the potential for a high rate of heterozygosity loss by drift or by random
is very high. Loss of heterozygosity is thought to have additional effects on juvenile mortality
and so I ran the simulation including inbreeding depression as a factor. There are no published
estimations of this for wild felids so I set the level at the mammalian median of 3.14 lethal
equivalents per individual, comprising 1.57 recessive lethal alleles, and 1.57 lethal equivalents
not subject to removal by selection.
.
Carrying Capacity.
The carrying capacity (‘K’) option in VORTEX defines an upper limit for population
size, above which additional mortality is imposed proportionally across age classes to return the
population to the value set for K. I set a value for K of 50 adults for both species which
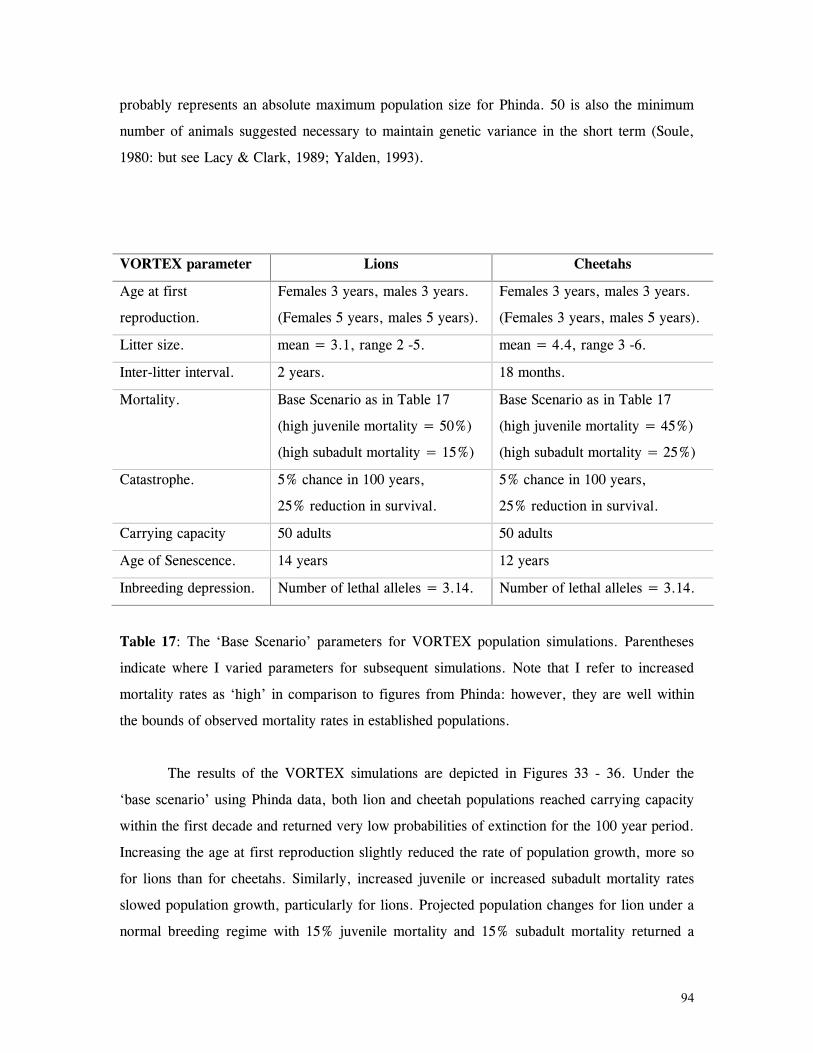
94
probably represents an absolute maximum population size for Phinda. 50 is also the minimum
number of animals suggested necessary to maintain genetic variance in the short term (Soule,
1980: but see Lacy & Clark, 1989; Yalden, 1993).
VORTEX parameter Lions Cheetahs
Age at first
reproduction.
Females 3 years, males 3 years.
(Females 5 years, males 5 years).
Females 3 years, males 3 years.
(Females 3 years, males 5 years).
Litter size. mean = 3.1, range 2 -5. mean = 4.4, range 3 -6.
Inter-litter interval. 2 years. 18 months.
Mortality. Base Scenario as in Table 17
(high juvenile mortality = 50%)
(high subadult mortality = 15%)
Base Scenario as in Table 17
(high juvenile mortality = 45%)
(high subadult mortality = 25%)
Catastrophe. 5% chance in 100 years,
25% reduction in survival.
5% chance in 100 years,
25% reduction in survival.
Carrying capacity 50 adults 50 adults
Age of Senescence. 14 years 12 years
Inbreeding depression. Number of lethal alleles = 3.14. Number of lethal alleles = 3.14.
Table 17: The ‘Base Scenario’ parameters for VORTEX population simulations. Parentheses
indicate where I varied parameters for subsequent simulations. Note that I refer to increased
mortality rates as ‘high’ in comparison to figures from Phinda: however, they are well within
the bounds of observed mortality rates in established populations.
The results of the VORTEX simulations are depicted in Figures 33 - 36. Under the
‘base scenario’ using Phinda data, both lion and cheetah populations reached carrying capacity
within the first decade and returned very low probabilities of extinction for the 100 year period.
Increasing the age at first reproduction slightly reduced the rate of population growth, more so
for lions than for cheetahs. Similarly, increased juvenile or increased subadult mortality rates
slowed population growth, particularly for lions. Projected population changes for lion under a
normal breeding regime with 15% juvenile mortality and 15% subadult mortality returned a
95
25% chance of extinction (Table 18). The most severe effects for both species were under a
normal breeding regime with combined increased juvenile and subadult mortality. In this
scenario, the lion population had a 94.5% chance of extinction and for the cheetah population,
it was 19.5%.
VORTEX scenario Lions Cheetahs
Early
breeding
Normal
breeding
Early
breeding
Normal
breeding
base scenario 0.005 0.01 0.000 0.01
high juvenile mortality 0.08 0.075 0.000 0.005
high subadult mortality 0.005 0.25 0.005 0.025
high combined mortality 0.495 0.945 0.07 0.195
Table 18. VORTEX predictions of the probability of extinction for the Phinda lion and cheetah
populations under different mortality and reproduction regimes. Early breeding refers to age of
first reproduction at 3 years (both species, both sexes). Normal breeding refers to age of first
reproduction at 3 years for female cheetahs and 5 years for male cheetahs and lions (both
sexes).
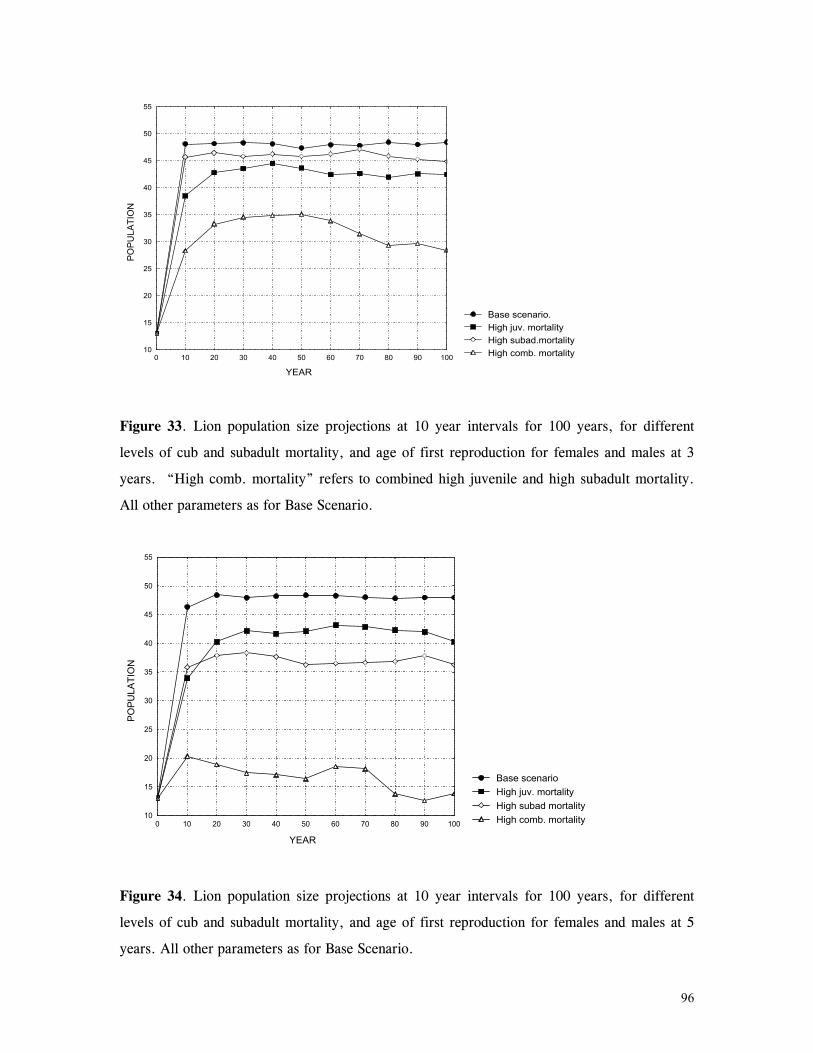
96
Base scenario. High juv. mortality High subad.mortalityHigh comb. mortality
YEAR
POPU
LATI
ON
10
15
20
25
30
35
40
45
50
55
0 10 20 30 40 50 60 70 80 90 100
Figure 33. Lion population size projections at 10 year intervals for 100 years, for different
levels of cub and subadult mortality, and age of first reproduction for females and males at 3
years. “High comb. mortality” refers to combined high juvenile and high subadult mortality.
All other parameters as for Base Scenario.
Base scenario High juv. mortality High subad mortalityHigh comb. mortality
YEAR
POPU
LATI
ON
10
15
20
25
30
35
40
45
50
55
0 10 20 30 40 50 60 70 80 90 100
Figure 34. Lion population size projections at 10 year intervals for 100 years, for different
levels of cub and subadult mortality, and age of first reproduction for females and males at 5
years. All other parameters as for Base Scenario.

97
Base scenario High juv. mortality High subad mortalityHigh comb. mortality
YEAR
PO
PU
LATI
ON
10
15
20
25
30
35
40
45
50
55
0 10 20 30 40 50 60 70 80 90 100
Figure 35. Cheetah population size projections at 10 year intervals for 100 years, for different
levels of cub and subadult mortality, and age of first reproduction for males at 3 years. All
other parameters as for Base Scenario.
Base scenario High juv mortality High subad mortalityHigh comb. mortality
YEAR
POPU
LATI
ON
10
15
20
25
30
35
40
45
50
55
0 10 20 30 40 50 60 70 80 90 100
Figure 36. Cheetah population size projections at 10 year intervals for 100 years, for different
levels of cub and subadult mortality, and age of first reproduction for males at 5 years. All
other parameters as for Base Scenario.

98
DISCUSSION
There is a scarcity of information on the population dynamics of reintroduced large
carnivores in Africa. The well-documented study by Hamilton (1981) of leopard translocation
in Kenya remains the strongest source of information on the fate of efforts to reintroduce large
African felids. Hamilton’s data- which, it must be noted, were collected under very different
conditions to those at Phinda- concluded that such efforts were very unlikely to succeed, though
the reasons for failure and possible solutions were vague. Apart from demonstrating a common
pattern of migration away from the release site, Hamilton was mostly unable to provide details
on mortality and reproductive characteristics of translocated leopards. The current study
represents the first concerted effort to assess such population parameters in re-introduced
African felids and apply these data to the appraisal of long-term population persistence, and
therefore, project success.
Lion and cheetah populations at Phinda displayed rapid growth during the study period.
The population viability projections indicated that numbers of both species would reach 50 (the
carrying capacity for the model) within the first decade. Together, these observations and
simulations suggest that both species are amenable to swift re-establishment, at least in the short
term. Despite relatively high mortality rates of reintroduced lions and cheetahs- particularly in
the initial period following release- most individuals of both species survived longer than a year
and a minimum of 60% of females of both species survived to reproduce. This suggests that
reintroduction may be a viable method for population re-establishment by lions and cheetahs.
The opportunity for hastened reproduction may be a factor in rapid recolonisation.
Although the sample size is far too small to make conclusive statements, certain aspects of lion
and cheetah reproduction became apparent which differ from established populations. Three
lionesses in this study had their first litter before the age of three years. In other populations,
lionesses usually do not conceive until around 42-43 months (Schaller, 1972; Smuts, 1980;
Pusey & Packer, 1987). However, in the small Nairobi National Park, lionesses often
conceived before their third birthday (Rudnai, 1973). In some mammals, socially induced
reproductive inhibition may occur in subordinate females which do not normally reproduce until
their social environment alters, such as with dispersal, immigration or the death of dominant
group members. Where such social factors appear to regulate reproduction, reduced population
density may result in a change in age-specific fecundity where subordinate females have the
chance to reproduce earlier (Macdonald & Moehlman, 1982; Van Aarde, 1987 a,b; Creel &
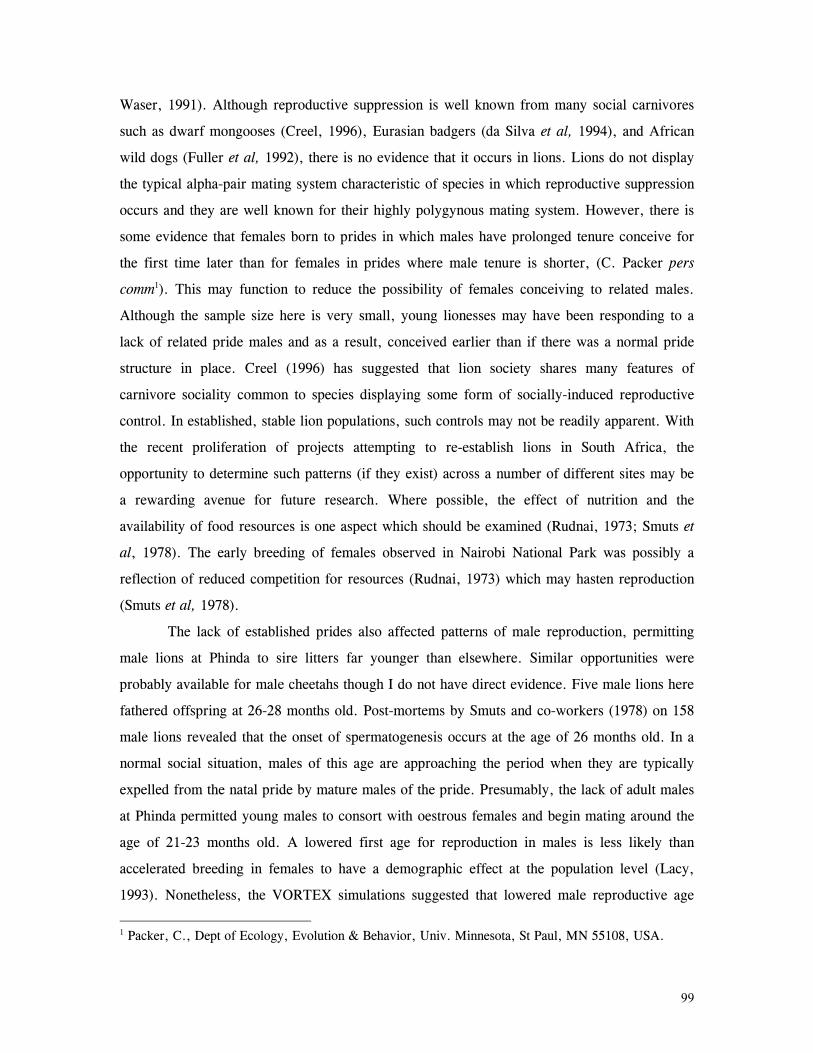
99
Waser, 1991). Although reproductive suppression is well known from many social carnivores
such as dwarf mongooses (Creel, 1996), Eurasian badgers (da Silva et al, 1994), and African
wild dogs (Fuller et al, 1992), there is no evidence that it occurs in lions. Lions do not display
the typical alpha-pair mating system characteristic of species in which reproductive suppression
occurs and they are well known for their highly polygynous mating system. However, there is
some evidence that females born to prides in which males have prolonged tenure conceive for
the first time later than for females in prides where male tenure is shorter, (C. Packer pers
comm1). This may function to reduce the possibility of females conceiving to related males.
Although the sample size here is very small, young lionesses may have been responding to a
lack of related pride males and as a result, conceived earlier than if there was a normal pride
structure in place. Creel (1996) has suggested that lion society shares many features of
carnivore sociality common to species displaying some form of socially-induced reproductive
control. In established, stable lion populations, such controls may not be readily apparent. With
the recent proliferation of projects attempting to re-establish lions in South Africa, the
opportunity to determine such patterns (if they exist) across a number of different sites may be
a rewarding avenue for future research. Where possible, the effect of nutrition and the
availability of food resources is one aspect which should be examined (Rudnai, 1973; Smuts et
al, 1978). The early breeding of females observed in Nairobi National Park was possibly a
reflection of reduced competition for resources (Rudnai, 1973) which may hasten reproduction
(Smuts et al, 1978).
The lack of established prides also affected patterns of male reproduction, permitting
male lions at Phinda to sire litters far younger than elsewhere. Similar opportunities were
probably available for male cheetahs though I do not have direct evidence. Five male lions here
fathered offspring at 26-28 months old. Post-mortems by Smuts and co-workers (1978) on 158
male lions revealed that the onset of spermatogenesis occurs at the age of 26 months old. In a
normal social situation, males of this age are approaching the period when they are typically
expelled from the natal pride by mature males of the pride. Presumably, the lack of adult males
at Phinda permitted young males to consort with oestrous females and begin mating around the
age of 21-23 months old. A lowered first age for reproduction in males is less likely than
accelerated breeding in females to have a demographic effect at the population level (Lacy,
1993). Nonetheless, the VORTEX simulations suggested that lowered male reproductive age
1 Packer, C., Dept of Ecology, Evolution & Behavior, Univ. Minnesota, St Paul, MN 55108, USA.
100
slightly increased the rate of population growth and significantly lowered the probability of
extinction. Furthermore, from a management point of view, practitioners of lion reintroduction
need to assume that males in the artificial and often unusual social circumstances of re-
establishing populations can begin fathering cubs when little more than two years old and
therefore have a potential reproductive lifespan of more than 10 years.
High rates of cubs and subadult survival also contributed to rapid population growth for
Phinda lions and cheetahs. On the short-grass plains of the Serengeti, Laurenson (1995)
estimated that 95% of cheetah cubs die before independence mostly as a result of predation by
other carnivores. In Serengeti lions, depending on the habitat, male take-overs and low prey
availability kill between one and two thirds of cubs before one year of age (Packer et al, 1988).
At Phinda, increased cub survival is probably due to low density of established predators
(conspecifics and competing species) and a high density of non-migratory game (Chapter 7). In
the case of cheetahs, the availability of refuges for cubs probably has a significant effect on
their survival. I saw 10 incidents in which mothers with cubs less then 6 months old
encountered lions. In all cases, the cubs scattered into thick bush while the mother attempted to
distract the lions. Although lions were often persistent is their search for cheetah cubs, spending
up to an hour trying to locate them, they were unsuccessful on all observed occasions and no
cubs were killed. The only incident of cub predation by lions of which I was aware (and
observed) occurred at night when a lioness separated an 11mo cub from its family and caught it
as it attempted to re-join it siblings. Laurenson (1995) has suggested the extremely high rate of
predation on cheetah cubs in the Serengeti may be due in part to a paucity of available refuges
for cubs and their extreme vulnerability on the short-grass plains. Durant (1998) recently
demonstrated that environmental heterogeneity, particularly with respect to the distribution of
prey and predators, provides cheetahs in the Serengeti with refugia from competition. The
current study suggests that habitat heterogeneity may do likewise, particularly for mothers with
small cubs (see Chapter 4).
Low mortality rates for cubs and subadults may be critical for the re-establishment of
re-introduced felids. VORTEX simulations in which these parameters were increased to
moderate-to-high levels (but certainly not the highest recorded for populations elsewhere)
significantly increased the predicted probability of extinction (Table 18) when all other
parameters were constant. Although such simulations are crude and must be interpreted
email: [email protected]

101
cautiously, this suggests that high juvenile or subadult mortality in the early years of a
reintroduction effort may increase the chance of project failure. Crooks et al (1998) recently
modelled the impact of increasing rates of mortality on eight different age classes of cheetahs
and concluded that the influence of juvenile survivorship on population growth rate is small and
that adult survivorship is the most important factor contributing to population increase. They
concluded that ‘even a slight decrease in adult survivorship outside of protected areas... may
counteract any benefits of even complete elimination of predation-related mortality in juvenile
stages.” Crooks and co-workers’ models were based on data from the established Serengeti
population, rather than re-colonising populations as at Phinda: nonetheless, the current study
suggest that population growth is strongly affected by juvenile survival in re-establishing
populations. While adult survival is clearly important, the relatively high rates of adult
mortality seen at Phinda argues that populations can sustain considerable losses in the adult
cohort and still increase rapidly where there is low cub and sub-adult mortality.
This has important implications for the planning of such programmes. At Phinda,
cheetahs and lions were released over the same 18 month period (Chapter 2). In some
subsequent projects, lions were already established when the release of cheetahs was attempted
and indications are that they have not been as successful as at Phinda due to lion predation and
competition (Van Dyk, pers comm2). Practitioners of multi-species re-introductions such as at
Phinda should consider establishing vulnerable species such as cheetahs prior to the release of
competitively dominant species such as lions. Although it is unclear from the present research
precisely what duration between cheetah and lion releases would be effective, the high potential
for reproduction by cheetahs freed of predation suggests that even a period of two to three years
would improve the chance of project success. Importantly, cheetahs experiencing ‘predator
release’ for longer periods may undergo such rapid population growth that converse
management problems are presented. In the lion-free Suikerbosrand Nature Reserve 80km
south of Johannesburg, seven cheetahs (4:3) released in 1975 gave rise to at least 40 cubs in the
following five years (Cohen et al, 1978; Pettifer et al 1979, 1981 a,b). The increasing cheetah
population was implicated in the reduction of some herbivore species (see Chapter 7) and
capture and removal of all cheetahs was initiated in 1980. Similar attempts from other areas
lacking competition for cheetahs such as Pilanesberg National Park (Anderson, 1980) and Itala
2 Van Dyk, G., North-west Parks Board, PO Box 4124, Rustenberg, 0300 South Africa.
102
Game Reserve (Rushworth, pers comm3) resulted in similar outcomes. Clearly, re-establishing
large felids presents many management difficulties and should not be undertaken lightly.
Other aspects of this study illustrate where additional considerations may further
facilitate the re-establishment process. Causes of mortality of re-introduced cats indicated that
stochastic factors following the re-introduction process probably had little effect and human
activity after release is the main contributory factor. All the deaths related to human activities
occurred within a 16month period between March 1993 and July 1994 when allocation of
resources shifted from issues of reserve and wildlife management to the tourism operation at
Phinda. Subsequently, improved procedures for anti-poaching, boundary inspections and
control of tourist movements have been implemented and no deaths as a result of human
activities have occurred since July 1994, with the exception of a male lion (born at Phinda)
killed in a snare in May 1998.
Increasingly, human activity is perceived as the single greatest factor likely to influence
the success of reintroduction projects, especially with controversial species such as large
carnivores (Peek et al, 1991; Reading & Clark, 1996; Linnell et al, 1997; Woodruffe &
Ginsberg, 1998). Phinda was established entirely for ‘eco-tourism’ which provides the revenue
for most of its running costs. Accordingly, the necessity of investing considerable resources in
the tourism operation cannot be flawed. However, the extremely rapid pace at which
development occurred at Phinda may ultimately have exacerbated the significant human-
mediated mortality of cats seen here. The development of extensive infrastructure such as costly
tourist lodges, airstrips and staff housing occurred in parallel with the felid reintroductions, and
should perhaps have been staggered to reduce competition for resources. This can be a
considerable challenge to newly established reserves where the tourism demand for large cats
and fully operational facilities places significant pressure on projects.
Phinda is now in its sixth year since lions and cheetahs were re-introduced and while
many lessons have been learned, the project faces long-term issues which, if ignored, will result
in failure. Carnivore re-introductions are typically initiated with a small number of founders
bringing genetic issues into question (Clark & Reading, 1996). A small population with few
founders such as at Phinda may be subject to losses of genetic variability, reducing its ability to
adapt to environmental changes and increasing chances of inbreeding and losses to disease
outbreaks or other catastrophes (Soule, 1983; Lacy, 1987). Although the impact of reduced
3 Rushworth, I., Regional Ecologist North, Natal Parks Board, PO Box 662, Pietermaritzburg, 3200

103
genetic heterogeneity is not well documented in populations of wild felids, two examples
suggest it may have crucial effects. Lions in the Umfolozi-Hluhluwe Game Reserve originated
from a maximum of five animals in the 1960s (Maddock et al, 1996). Although subsequent
population growth was rapid, these lions now apparently suffer from an immunodeficiency
syndrome possibly related to inbreeding and the population is in decline (Meltzer et al, 1997).
Similarly, the south-eastern sub-species of the mountain lion known as the Florida panther has
been reduced to less than 50 animals and suffers from a suite of genetic problems including
cryptorchidism, heart murmurs and high percentage of abnormal sperm (Roelke et al, 1993).
Small reintroduced populations arising from low numbers of founders such as at Phinda may
well encounter similar problems in the future if left unmanaged.
Spatial considerations of sites in such projects are also threats to long-term success.
Factors such as the degree of isolation from other potential release sites or established
populations and whether the area is large enough to sustain enough individuals required to
maintain demographic and genetic heterogeneity in the long term will impact the persistence of
populations, exceedingly so for small founder groups typical of carnivore reintroduction
(Gilpin, 1987; Clark & Reading, 1996). Minimum population sizes and the impact of these
processes on restored populations are still largely unknown for large carnivores (Beier, 1993;
Dinerstein et al, 1997). Small reserves such as Phinda will act as ongoing experiments to
establish some of these parameters and clearly will have considerable obstacles to long-term
success. Increasingly, managers of such reserves in South Africa are realising the need to view
small, isolated populations as a metapopulation (Gilpin, 1987). At the time of writing, Phinda
management are involved in negotiations to consolidate 500km2 of government and privately
owned land into a single conservation area and exchanges and translocations of lions and
cheetahs between Phinda and other developing reserves has been ongoing since 1995. While the
population characteristics displayed by lions and cheetahs at Phinda are encouraging, continued
data collection and intensive management of these issues will ultimately determine the long-
term viability of reintroduced felid populations.
South Africa. email: [email protected]
104
CHAPTER 6.
FEEDING ECOLOGY AND PATTERNS OF PREDATION BY REINTRODUCED
LIONS AND CHEETAHS.
As conspicuous, locally abundant major predators, the feeding ecology of lions and
cheetahs has received considerable attention in the scientific literature. The majority of
studies of both species have focused on their diet, feeding behaviour, hunting patterns and
foraging dynamics (Mitchell et al, 1965; Makacha & Schaller, 1969; Pienaar,1969;
Schaller, 1972; Eloff, 1973; Eaton, 1970, 1974; Rudnai, 1974; Bertram, 1978; Burney,
1980; van Ordsol, 1982,1984; Smuts, 1982; Mills, 1984; Packer & Ruttan, 1988;
Ruggiero, 1991, Stander ,1990,1992; Schee1, 1993; Viljoen, 1993; Packer et al, 1990,
1995). Recently, comprehensive studies such as those by Caro (1994) on cheetahs, and
Packer and co-workers on lions (Packer & Ruttan, 1988; Packer et al, 1990, 1995) have
examined such patterns in terms of the sociality of lions and cheetahs. More than any other
felids and indeed most other large carnivores, the relationship between lion and cheetah
feeding habits and other critical aspects of their behaviour and ecology are beginning to be
well-understood.
The social systems of lions and cheetahs furnish both advantages and disadvantages
in terms of feeding ecology, which in turn may influence some aspects of sociality. Reasons
for the formation of prides by lions were long attributed to the benefits group hunting
conferred by being able to subdue and kill large, dangerous prey (Wright, 1960; Schaller
1972, Rudnai 1974; Kruuk, 1975, Wilson, 1975; Elliot & Cohen, 1977; Bertram, 1983).
However, research by Packer and co-workers (Packer & Ruttan, 1988; Packer et al, 1990)
has demonstrated that, while increased pride size does yield some foraging benefits, other
complex factors such as the defence of young, the enhancement of reproductive success and
the maintenance of long-term territories contribute to patterns of lion sociality.
Concomitantly, this has implications for their feeding ecology.
Similarly, the unusually variable system of cheetah sociality in which females are
always solitary, and males may form coalitions or may remain alone (Caro, 1994) presents
costs and benefits. Even the largest aggregation of cheetahs could probably not tackle the
very large ungulates such as buffaloes and giraffes where group size in lions plays a
significantly beneficial role (Packer et al, 1990). However, male cheetahs in coalitions can
tackle larger animals than do single males or females, and hunting larger prey is one
adaptation used by male cheetahs to meet the increased (collective) energetic demands of
group living (Caro, 1994).
105
Various aspects of lion and cheetah ecology which may influence their patterns of
predation and foraging differed markedly at Phinda compared to most other well-studied
populations. First, reintroduced felids were faced with a high density and diversity of naïve
prey species which had experienced low predation pressure prior to reintroduction (Chapter
8). Furthermore, the ungulate fauna in the reserve was dominated by small to medium-sized
species such as impalas and nyalas. Thirdly, there were no resident lions and cheetahs
present and numbers of other major predators, particularly leopards and spotted hyaenas
were low due to historical persecution. Accordingly competition for food resources was
low. Additionally, some aspects of lion and cheetah population dynamics were unusual
compared to established populations (Chapter 5). Lions prides were generally small so that
competition for food within prides was low. Also, the period of the study spanned a period
when prides grew considerably, starting when small prides were released and ending when
prides were reaching the sizes of those elsewhere. This presented an opportunity to examine
changes in prey selection related to increasing group size over time. Finally, for cheetahs,
the fact that the survival rate of cubs was high placed different foraging pressure on females
compared to other well-studied populations where the survival rate of cubs may be very
low. Moreover, patterns of predation for cheetahs are generally only well-known from very
open habitat such as the population of the Serengeti plains. The Acacia-dominated woodland
mosaic at Phinda presented an opportunity to examine cheetah feeding ecology in a very
different environment to the ‘classic’ grassland habitat of cheetahs.
In this chapter, I examine lion and cheetah feeding ecology under these
circumstances. Specifically, I explore the following questions:
1: Does lion foraging behaviour reflect the reduced requirements inherent in small
pride size, and the abundance of smaller, easier-to-kill prey species at Phinda?
2: Does this behaviour change over time as pride size increased due to rapid
reproduction and high survival of cubs?
3. What are the patterns of feeding ecology of cheetahs in woodland-dominated
vegetation and can cheetahs successfully forage in habitats often assumed to be sub-optimal?
4: Does the high rate of survival of cheetah cubs place increased demands on
mother cheetahs and if so, how do they respond?
Finally I also examine the importance of food resources for reintroduced carnivores
in terms of project success and emphasise some management issues related to predator-prey
interactions following carnivore reintroduction.

106
METHODS.
I collected data on feeding ecology by three means. First, where possible I followed
hunting felids for extended periods to observe kills as they were made. I usually followed at
the greatest distance which enabled me to maintain contact with the cats but also so as not to
interfere with the hunt. In open regions, this distance was up to 300m but in woodland it
was often reduced to 40-50m. For lions which did most of their hunting at night, I used a
spotlight (as detailed in Chapter 2) which I switched off when they encountered prey and
waited until the attempt had been made before locating them again. Following cats for
extended periods had limited applicability at Phinda due to areas of dense vegetation where
I could not drive. When I lost cats in dense bush, I moved ahead of them in their path of
travel to areas of open habitat to wait for them to emerge, checking their progress by the
radio-signal. If they did not emerge and remained stationary for some time, this often
indicated they had killed. I determined the location by triangulation and attempted to walk
into the site once cats had left, usually the following morning. In this way I frequently
found fresh kill remains.
I often located cats which had already made a kill which, I have termed a radio-
location observation (after Mills, 1992). For each sighting of cats with a carcase, I recorded
whether it was killed by the cats feeding on it, scavenged by them, or origin unknown. To
assess origin of carcasses, I relied as much as possible on direct observation but other clues
assisted identification. Old carcasses were readily identified by their level of decomposition
and I recorded these as scavenged. Fresh kills, even when they were not witnessed could
sometimes be identified by signs of the capture or hunt (such as tracks or signs of struggle
in sandy soil), where dead ungulates had fresh blood flowing from bite wounds to the neck
or had fresh vegetation in their mouths. If the kill had not been witnessed (or heard), or I
could not find evidence of this type, I recorded the carcase origin as unknown.
Finally rangers on game drives provided many direct observations of kills and
carcases. I usually checked their reports (which I generally received as they occurred via
radio) by visiting the site to confirm details of the kill. All rangers were proficient in
species identification and generally provided good information on sex and age of prey
species. For the latter parameter, I provided guidelines according to my categories (see
below), but recorded it as unknown unless I was able to confirm it myself or had consensus
from two or more rangers at the same sighting.
For all kills, I recorded the species, sex (where possible), age (juvenile, sub-adult,
adult: where possible), the time of the kill if known, the location and the surrounding
habitat type. I also identified and recorded all cats which were present at the carcase. Where

107
I knew the time the kill had been made, I recorded how long felids spent feeding on the kill
before abandoning it. I also made an estimate of the weight of the kill based on published
data of herbivore age-sex classes1.
I also recorded occasions when cats had obviously fed but I could not locate the kill:
these sightings I recorded as ‘unobserved kills.’ To attempt some estimation of the prey type
of unobserved kills, I scored the belly size of cats after feeding on different prey species on
a five-point scale where one was ‘quarter-full’ (the lower limit when it was obvious to me
that cats had fed) and five was gorged. I derived a reference list of likely prey fed upon for
unobserved kills based on belly size which took into account the number of cats feeding and
the prey species, age-class and sex. For example, a coalition of three male cheetahs with a
belly size of five had probably consumed an animal approximately the size of the maximum
prey weight normally taken, which at Phinda was an adult male nyala (or thereabouts). This
method is clearly biased towards larger kills, particularly for lions which often did not show
any visible evidence of feeding on small and medium-sized species, depending on the size of
the pride. Accordingly, I do not make any attempt to accurately identify unobserved kills
and present this data in coarse categories: small, medium and large kills. Any attempt to
refine prey identification of missed kills based on belly size would be questionable.
Nonetheless, I was reasonably confident of my estimations particularly given that I located
most cats daily and could accurately assess if they had fed since my previous sighting.
Statistical analyses
To assess whether lions and cheetahs were selecting certain prey, I used Chi-
squared tests which compared availability of prey species (i.e. the relative frequency at
which they occurred in Phinda) to the rate at which they were killed by lions and cheetahs.
Herbivore population estimates and demographic characteristics were established for eight
common ungulates at Phinda by seasonal censuses, which I detail in the following chapter. I
also compared population structure of eight herbivore species with the frequency of
different sex-age classes to determine if selection for any cohort was occurring. For all the
analyses I excluded scavenged carcasses as well those species which were killed and left
uneaten, which occurred frequently for lions with other carnivores, reptiles and so on. This
never happened with cheetahs, though I have excluded two male cheetahs which were killed
in territorial clashes and later fed upon (Hunter & Skinner, 1995; Appendix III).
1 Weights of ungulates after the following sources: Anderson, 1978 (nyala); Attwell, 1977 (wildebeest); Fairall & Braack, 1976 (impala); Hall-Martin, 1976 (giraffe); Mason, 1985 (warthog); Schmidt, 1984 (common duiker); Silva & Dowling, 1995 (reedbuck); Skinner & Smithers, 1990 (blesbok, kudu, red duiker, steenbok, suni); Smuts, 1974 (zebra);Wilson, 1970 (kudu).
108
To examine if prey selection was related to increases in group size in lions and
cheetahs (females with cubs) I calculated the total number of individuals (of either lions or
cheetahs) at each kill in terms of biomass expressed as Female Equivalent Units (FEQs).
FEQs have been used as an estimate of carnivore biomass in previous predator-prey studies,
particularly of lions (Bertam 1979, Packer et al 1994). However, calculation of FEQs has
tended to be crude: for example, Bertram (1979) used general estimates where cubs
weighed 1/9th of adult female weight during the first third of a year of life, 2/3rds in the
second third of a year of their life and so on. I had very accurate estimates of dates when
cubs were born, so I knew ages of all cubs (Chapter 5). I used regression equations relating
mass to known age to calculate FEQs for all cubs at every kill. For lions, I adopted the
following equations from Smuts (1980) which he derived separately for male and female
lions from a sample of 158 males and 186 females; y = mass, x = age:
y = 4.21x + 5.29 (males).
y = 3.31x + 6.64 (females).
Equivalent data do not exist for cheetahs in the literature so I derived a growth
equation irrespective of sex from mass data in Laurenson (1993: 79 free-living cubs from
the Serengeti, aged 6-48 days old) and unpublished data provided by Marker2 (112 free-
living cheetahs from Namibia aged 3-24 months). This is presented in Figure 37. This is
less than ideal for two reasons: east African cheetahs may be slightly smaller than southern
African individuals (Caro 1994: 382) and Marker’s data is based on estimated, rather than
known, ages of animals. Nonetheless, better data for wild cheetahs do not exist and these
disadvantages are probably insignificant for their use here.
For every cub at every sighting with a kill, I estimated mass from its known age
according to the regression equations and then divided this by mean female weight to give
the FEQ. Mean lioness weight was taken as 124.2kg (Smuts, 1980) and mean female
cheetah weight was 36.7kg (Marker; unpubl data: 37 females, range 25.5 - 50.5kgs). An
adult female’s FEQ was 1.0 and the total FEQ for each kill was calculated by tallying the
FEQs of the cubs with that of the female’s. If males were present, I included their FEQ as
1.5 for lions which average 50% heavier than lionesses (Smuts, 1980). Adult male cheetahs
are very rarely in attendance to a mother with cubs when she makes a kill and are unlikely
to be a factor in any prey selection by female cheetahs that may be occurring. Accordingly,
I excluded three cases when male cheetahs accompanied a mother when she killed.
Therefore, for lions on kills in this study, FEQ ranged between 1.0 (single female) to 7.97
2 Marker, L. Cheetah Conservation Fund, PO Box 247 Windhoek, Nambia, Tel +264 658 11812 email: [email protected].

109
(pride of 3 females with cubs of different ages) and for cheetahs, the range was 1.0 (single
female) to 4.35 for a female with five 13mo cubs.
Age (months)
Mas
s (k
g)
0
10
20
30
40
50
0 4 8 12 16 20 24
Figure 37: Cheetah growth rate for calculating FEQs. Scatter diagram and least-squares
regression line showing relationship between body mass and age. y = 2.928 + 1.697x, r2
= 0.8470, n = 191. Data from Laurenson (1993) and unpublished data provided by
Marker1, details in text.
I used single regression analyses to determine if selection of larger prey species was
related to increasing group size as measured by FEQs. The independent variable was FEQ
and the dependent variable was the weight of prey. However, much of my data on kills
were gathered by methods which bias data towards larger kills (see above). Consequently, I
needed to ensure that the relative likelihood of finding small kills versus large kills did not
decrease with increasing FEQs (due, for example, to increased competition between
individuals in groups of larger FEQs). Therefore, to establish the rates at which carcasses
were utilised by different sized groups, I calculated the average time spent per cat on kills
of different weights for different FEQs. I used a Kruskal-Wallace ANOVA to test if this
differed for different group sizes. I performed this analysis separately for lions and
cheetahs.

110
RESULTS
General patterns of predation.
I have combined data from all three methods of data collection (direct observation,
radio-location observations and ranger reports) for most of my analyses in this chapter.
Mills (1992, 1996 and see Stander, 1992:Table 8) has indicated this may lead to erroneous
conclusions, particularly as some methods are more likely to increase the contribution of
large kills in food habit studies. Accordingly, I compared the three methods for differences
by Chi-squared analysis as presented in Table 19. There were no significant differences
between methods in terms of a bias for larger kills for either species, which agrees with
Mills (1992) for cheetahs but not for lions. There was a trend for ranger reports to
underestimate the contribution of small kills made by lions when compared to direct
observation [direct: small kills, 33 (46.9%), large kills, 48 (53.1%); rangers: small kills, 41
(31.1%), large kills, 91 (68.9%)] but it was not statistically significant (Table 19).
CHEETAHS LIONS
Direct vs radio-location. χ2 = 0.614, p< 0.433, df= 1 χ2 = 1.096, p< 0.295, df= 1
Direct vs ranger reports. χ2 = 0.265, p< 0.606, df= 1 χ2 = 3.505, p< 0.061, df= 1
Radio location vs ranger reports. χ2 = 1.590, p< 0.207, df= 1 χ2 = 0.627, p< 0.428, df= 1
Table 19. Results of chi-squared analysis comparing occurrence of large vs small kills for
three methods of data collection on lion and cheetah feeding ecology. Following Mills
(1992), large kills were >25kg for cheetahs and >100kg for lions.
Lions killed 28 species and cheetahs killed 15 species at Phinda (Table 20). 97.8%
and 99.7% of lion and cheetah kills respectively were mammals. Lions generally abandoned
prey without eating it when the species were other carnivores (mustelids, herpestids and
three cheetahs), reptiles and one wattled plover caught by an 8 month old cub. In nine
cases, they killed and abandoned bushpigs without feeding, apparently without reason.
Cheetahs always ate from all species they killed. Cannibalism occurred in one case for lions
(three neonates eaten) and two cases for cheetahs (Hunter & Skinner, 1995; Appendix III).
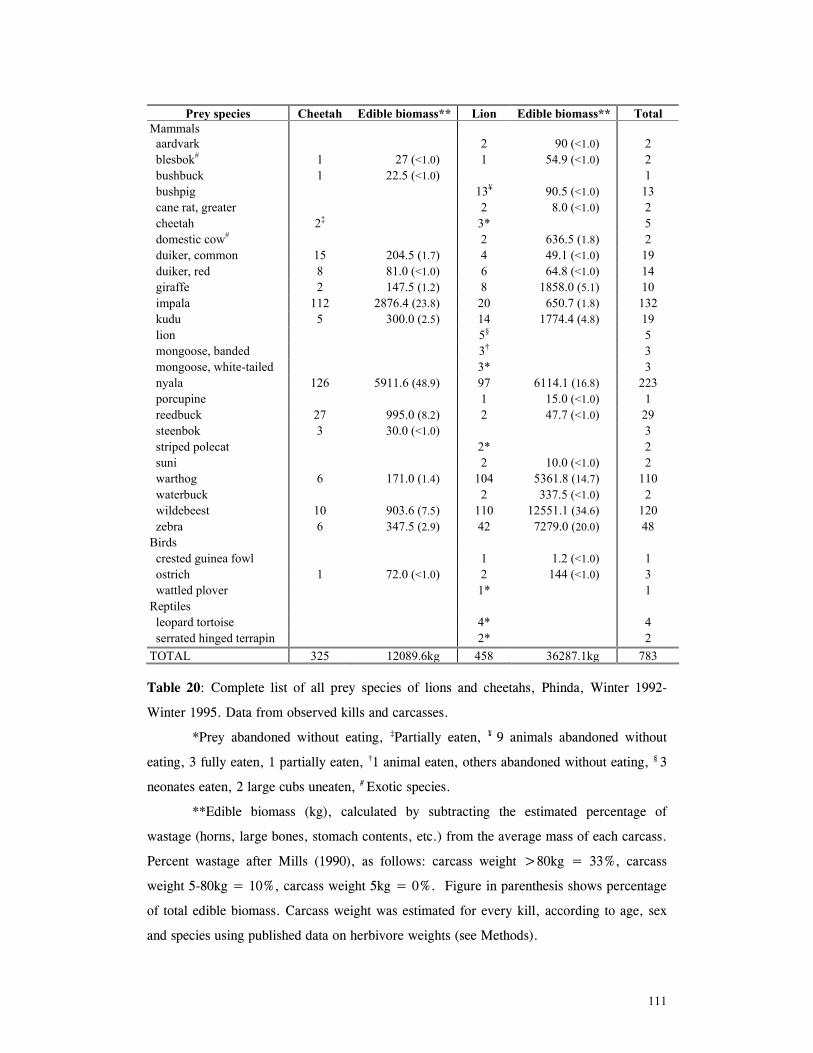
111
Prey species Cheetah Edible biomass** Lion Edible biomass** Total
Mammals aardvark 2 90 (<1.0) 2 blesbok# 1 27 (<1.0) 1 54.9 (<1.0) 2 bushbuck 1 22.5 (<1.0) 1 bushpig 13¥ 90.5 (<1.0) 13 cane rat, greater 2 8.0 (<1.0) 2 cheetah 2‡ 3* 5 domestic cow# 2 636.5 (1.8) 2 duiker, common 15 204.5 (1.7) 4 49.1 (<1.0) 19 duiker, red 8 81.0 (<1.0) 6 64.8 (<1.0) 14 giraffe 2 147.5 (1.2) 8 1858.0 (5.1) 10 impala 112 2876.4 (23.8) 20 650.7 (1.8) 132 kudu 5 300.0 (2.5) 14 1774.4 (4.8) 19 lion 5§ 5 mongoose, banded 3† 3 mongoose, white-tailed 3* 3 nyala 126 5911.6 (48.9) 97 6114.1 (16.8) 223 porcupine 1 15.0 (<1.0) 1 reedbuck 27 995.0 (8.2) 2 47.7 (<1.0) 29 steenbok 3 30.0 (<1.0) 3 striped polecat 2* 2 suni 2 10.0 (<1.0) 2 warthog 6 171.0 (1.4) 104 5361.8 (14.7) 110 waterbuck 2 337.5 (<1.0) 2 wildebeest 10 903.6 (7.5) 110 12551.1 (34.6) 120 zebra 6 347.5 (2.9) 42 7279.0 (20.0) 48
Birds crested guinea fowl 1 1.2 (<1.0) 1 ostrich 1 72.0 (<1.0) 2 144 (<1.0) 3 wattled plover 1* 1
Reptiles leopard tortoise 4* 4 serrated hinged terrapin 2* 2
TOTAL 325 12089.6kg 458 36287.1kg 783 Table 20: Complete list of all prey species of lions and cheetahs, Phinda, Winter 1992-
Winter 1995. Data from observed kills and carcasses.
*Prey abandoned without eating, ‡Partially eaten, ¥ 9 animals abandoned without
eating, 3 fully eaten, 1 partially eaten, †1 animal eaten, others abandoned without eating, § 3
neonates eaten, 2 large cubs uneaten, # Exotic species.
**Edible biomass (kg), calculated by subtracting the estimated percentage of
wastage (horns, large bones, stomach contents, etc.) from the average mass of each carcass.
Percent wastage after Mills (1990), as follows: carcass weight >80kg = 33%, carcass
weight 5-80kg = 10%, carcass weight 5kg = 0%. Figure in parenthesis shows percentage
of total edible biomass. Carcass weight was estimated for every kill, according to age, sex
and species using published data on herbivore weights (see Methods).

112
The four most important species for lions in terms of numbers killed were (in order)
wildebeest, warthogs, nyalas and zebras (Table 20). It was the same four species in terms of
biomass consumed, with wildebeest clearly the most important, followed by zebras, nyalas
and warthogs. For cheetahs, nyalas, impalas and reedbucks were the most important species
in terms of both numbers (82% of all kills) and biomass (81% of biomass).
Lions and cheetahs were observed on 783 kills, 525 (67%) of which they were
known to have killed (Table 21). Cheetahs were never seen to scavenge and lions only
scavenged on 8.8% of occasions where the origin of the carcase was certain. 17 scavenged
carcasses were simply found by lions dead from unknown causes, four of them, warthogs
which lions dug from burrows already dead. Three animals had died after being trapped in
mud at the edge of pans. Four carcases were appropriated from other carnivores (two from
cheetahs, one from a leopard, one from a side-striped jackal) and four were killed by wire-
snares and subsequently found by lions.
Carcase origin Cheetah Lion Total kill 235 290 525
scavenged - 28 28 unknown 90 140 230
unobserved kills 156 112 268 TOTAL 481 570 1050
Table 21. Origin of carcasses on which lions and cheetahs fed. See
Methods for explanation of terms.
I recorded 156 and 112 unobserved kills for cheetahs and lions respectively (Table
21). Most unobserved kills for cheetahs had estimated weights between 30-65kgs and for
lions, it was greater than 120kgs (Table 22). As indicated in the methods, data on
unobserved kills is heavily biased towards larger carcasses, particularly for lions.
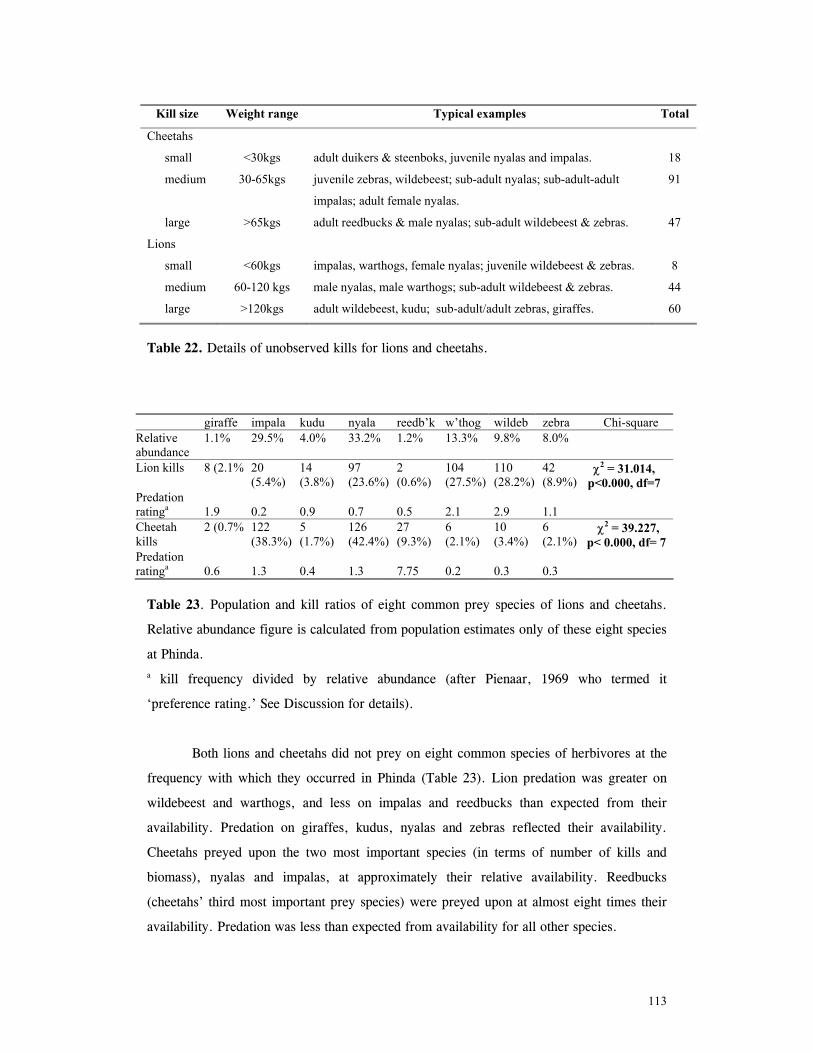
113
Kill size Weight range Typical examples Total
Cheetahs
small <30kgs adult duikers & steenboks, juvenile nyalas and impalas. 18
medium 30-65kgs juvenile zebras, wildebeest; sub-adult nyalas; sub-adult-adult
impalas; adult female nyalas.
91
large >65kgs adult reedbucks & male nyalas; sub-adult wildebeest & zebras. 47
Lions
small <60kgs impalas, warthogs, female nyalas; juvenile wildebeest & zebras. 8
medium 60-120 kgs male nyalas, male warthogs; sub-adult wildebeest & zebras. 44
large >120kgs adult wildebeest, kudu; sub-adult/adult zebras, giraffes. 60
Table 22. Details of unobserved kills for lions and cheetahs.
giraffe impala kudu nyala reedb’k w’thog wildeb zebra Chi-square Relative abundance
1.1% 29.5% 4.0% 33.2% 1.2% 13.3% 9.8% 8.0%
Lion kills
8 (2.1%) 20 (5.4%)
14 (3.8%)
97 (23.6%)
2 (0.6%)
104 (27.5%)
110 (28.2%)
42 (8.9%)
χ2 = 31.014, p<0.000, df=7
Predation ratinga
1.9
0.2
0.9
0.7
0.5
2.1
2.9
1.1
Cheetah kills
2 (0.7%) 122 (38.3%)
5 (1.7%)
126 (42.4%)
27 (9.3%)
6 (2.1%)
10 (3.4%)
6 (2.1%)
χ2 = 39.227, p< 0.000, df= 7
Predation ratinga
0.6
1.3
0.4
1.3
7.75
0.2
0.3
0.3
Table 23. Population and kill ratios of eight common prey species of lions and cheetahs.
Relative abundance figure is calculated from population estimates only of these eight species
at Phinda. a kill frequency divided by relative abundance (after Pienaar, 1969 who termed it
‘preference rating.’ See Discussion for details).
Both lions and cheetahs did not prey on eight common species of herbivores at the
frequency with which they occurred in Phinda (Table 23). Lion predation was greater on
wildebeest and warthogs, and less on impalas and reedbucks than expected from their
availability. Predation on giraffes, kudus, nyalas and zebras reflected their availability.
Cheetahs preyed upon the two most important species (in terms of number of kills and
biomass), nyalas and impalas, at approximately their relative availability. Reedbucks
(cheetahs’ third most important prey species) were preyed upon at almost eight times their
availability. Predation was less than expected from availability for all other species.
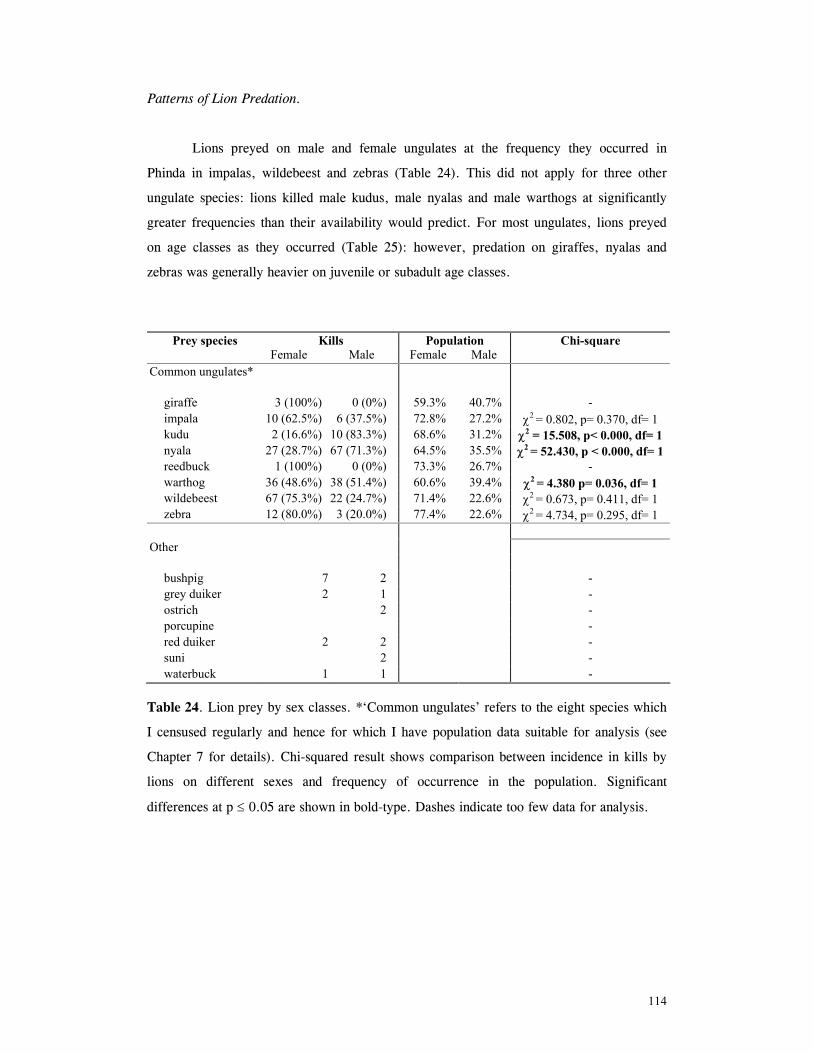
114
Patterns of Lion Predation.
Lions preyed on male and female ungulates at the frequency they occurred in
Phinda in impalas, wildebeest and zebras (Table 24). This did not apply for three other
ungulate species: lions killed male kudus, male nyalas and male warthogs at significantly
greater frequencies than their availability would predict. For most ungulates, lions preyed
on age classes as they occurred (Table 25): however, predation on giraffes, nyalas and
zebras was generally heavier on juvenile or subadult age classes.
Prey species Kills Population Chi-square Female Male Female Male
Common ungulates* giraffe 3 (100%) 0 (0%) 59.3% 40.7% - impala 10 (62.5%) 6 (37.5%) 72.8% 27.2% χ2 = 0.802, p= 0.370, df= 1 kudu 2 (16.6%) 10 (83.3%) 68.6% 31.2% χ2 = 15.508, p< 0.000, df= 1 nyala 27 (28.7%) 67 (71.3%) 64.5% 35.5% χ2 = 52.430, p < 0.000, df= 1 reedbuck 1 (100%) 0 (0%) 73.3% 26.7% - warthog 36 (48.6%) 38 (51.4%) 60.6% 39.4% χ2 = 4.380 p= 0.036, df= 1 wildebeest 67 (75.3%) 22 (24.7%) 71.4% 22.6% χ2 = 0.673, p= 0.411, df= 1 zebra 12 (80.0%) 3 (20.0%) 77.4% 22.6% χ2 = 4.734, p= 0.295, df= 1
Other
bushpig 7 2 - grey duiker 2 1 - ostrich 2 - porcupine - red duiker 2 2 - suni 2 - waterbuck 1 1 -
Table 24. Lion prey by sex classes. *‘Common ungulates’ refers to the eight species which
I censused regularly and hence for which I have population data suitable for analysis (see
Chapter 7 for details). Chi-squared result shows comparison between incidence in kills by
lions on different sexes and frequency of occurrence in the population. Significant
differences at p ≤ 0.05 are shown in bold-type. Dashes indicate too few data for analysis.
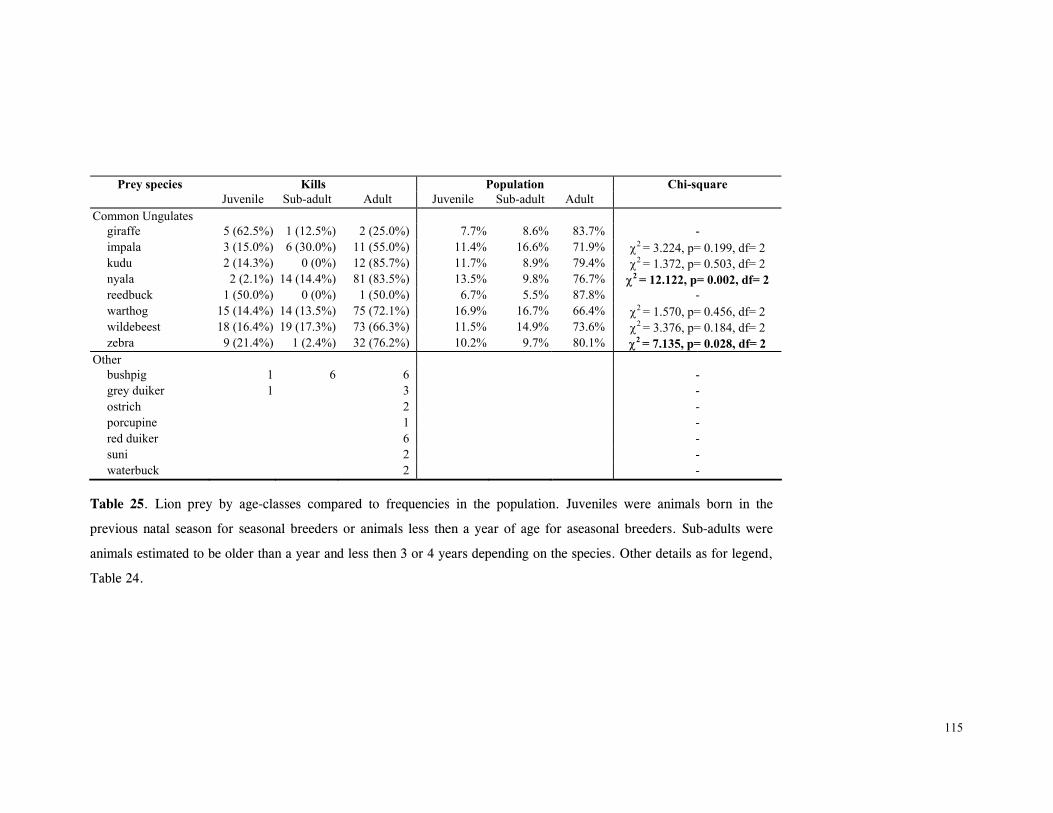
115
Prey species Kills Population Chi-square Juvenile Sub-adult Adult Juvenile Sub-adult Adult
Common Ungulates giraffe 5 (62.5%) 1 (12.5%) 2 (25.0%) 7.7% 8.6% 83.7% - impala 3 (15.0%) 6 (30.0%) 11 (55.0%) 11.4% 16.6% 71.9% χ2 = 3.224, p= 0.199, df= 2 kudu 2 (14.3%) 0 (0%) 12 (85.7%) 11.7% 8.9% 79.4% χ2 = 1.372, p= 0.503, df= 2 nyala 2 (2.1%) 14 (14.4%) 81 (83.5%) 13.5% 9.8% 76.7% χ2 = 12.122, p= 0.002, df= 2 reedbuck 1 (50.0%) 0 (0%) 1 (50.0%) 6.7% 5.5% 87.8% - warthog 15 (14.4%) 14 (13.5%) 75 (72.1%) 16.9% 16.7% 66.4% χ2 = 1.570, p= 0.456, df= 2 wildebeest 18 (16.4%) 19 (17.3%) 73 (66.3%) 11.5% 14.9% 73.6% χ2 = 3.376, p= 0.184, df= 2 zebra 9 (21.4%) 1 (2.4%) 32 (76.2%) 10.2% 9.7% 80.1% χ2 = 7.135, p= 0.028, df= 2
Other bushpig 1 6 6 - grey duiker 1 3 - ostrich 2 - porcupine 1 - red duiker 6 - suni 2 - waterbuck 2 -
Table 25. Lion prey by age-classes compared to frequencies in the population. Juveniles were animals born in the
previous natal season for seasonal breeders or animals less then a year of age for aseasonal breeders. Sub-adults were
animals estimated to be older than a year and less then 3 or 4 years depending on the species. Other details as for legend,
Table 24.
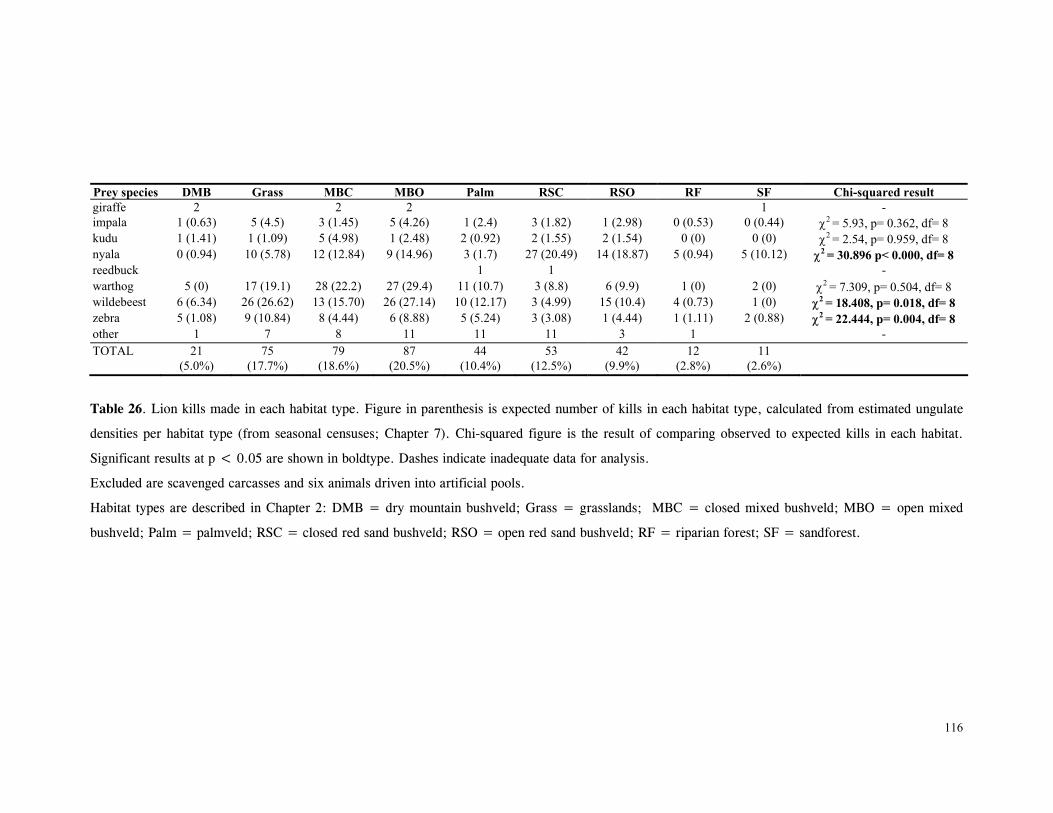
116
Prey species DMB Grass MBC MBO Palm RSC RSO RF SF Chi-squared resultgiraffe 2 2 2 1 - impala 1 (0.63) 5 (4.5) 3 (1.45) 5 (4.26) 1 (2.4) 3 (1.82) 1 (2.98) 0 (0.53) 0 (0.44) χ2 = 5.93, p= 0.362, df= 8 kudu 1 (1.41) 1 (1.09) 5 (4.98) 1 (2.48) 2 (0.92) 2 (1.55) 2 (1.54) 0 (0) 0 (0) χ2 = 2.54, p= 0.959, df= 8 nyala 0 (0.94) 10 (5.78) 12 (12.84) 9 (14.96) 3 (1.7) 27 (20.49) 14 (18.87) 5 (0.94) 5 (10.12) χ2 = 30.896 p< 0.000, df= 8 reedbuck 1 1 - warthog 5 (0) 17 (19.1) 28 (22.2) 27 (29.4) 11 (10.7) 3 (8.8) 6 (9.9) 1 (0) 2 (0) χ2 = 7.309, p= 0.504, df= 8 wildebeest 6 (6.34) 26 (26.62) 13 (15.70) 26 (27.14) 10 (12.17) 3 (4.99) 15 (10.4) 4 (0.73) 1 (0) χ2 = 18.408, p= 0.018, df= 8 zebra 5 (1.08) 9 (10.84) 8 (4.44) 6 (8.88) 5 (5.24) 3 (3.08) 1 (4.44) 1 (1.11) 2 (0.88) χ2 = 22.444, p= 0.004, df= 8 other 1 7 8 11 11 11 3 1 - TOTAL 21 75 79 87 44 53 42 12 11 (5.0%) (17.7%) (18.6%) (20.5%) (10.4%) (12.5%) (9.9%) (2.8%) (2.6%)
Table 26. Lion kills made in each habitat type. Figure in parenthesis is expected number of kills in each habitat type, calculated from estimated ungulate
densities per habitat type (from seasonal censuses; Chapter 7). Chi-squared figure is the result of comparing observed to expected kills in each habitat.
Significant results at p < 0.05 are shown in boldtype. Dashes indicate inadequate data for analysis.
Excluded are scavenged carcasses and six animals driven into artificial pools.
Habitat types are described in Chapter 2: DMB = dry mountain bushveld; Grass = grasslands; MBC = closed mixed bushveld; MBO = open mixed
bushveld; Palm = palmveld; RSC = closed red sand bushveld; RSO = open red sand bushveld; RF = riparian forest; SF = sandforest.
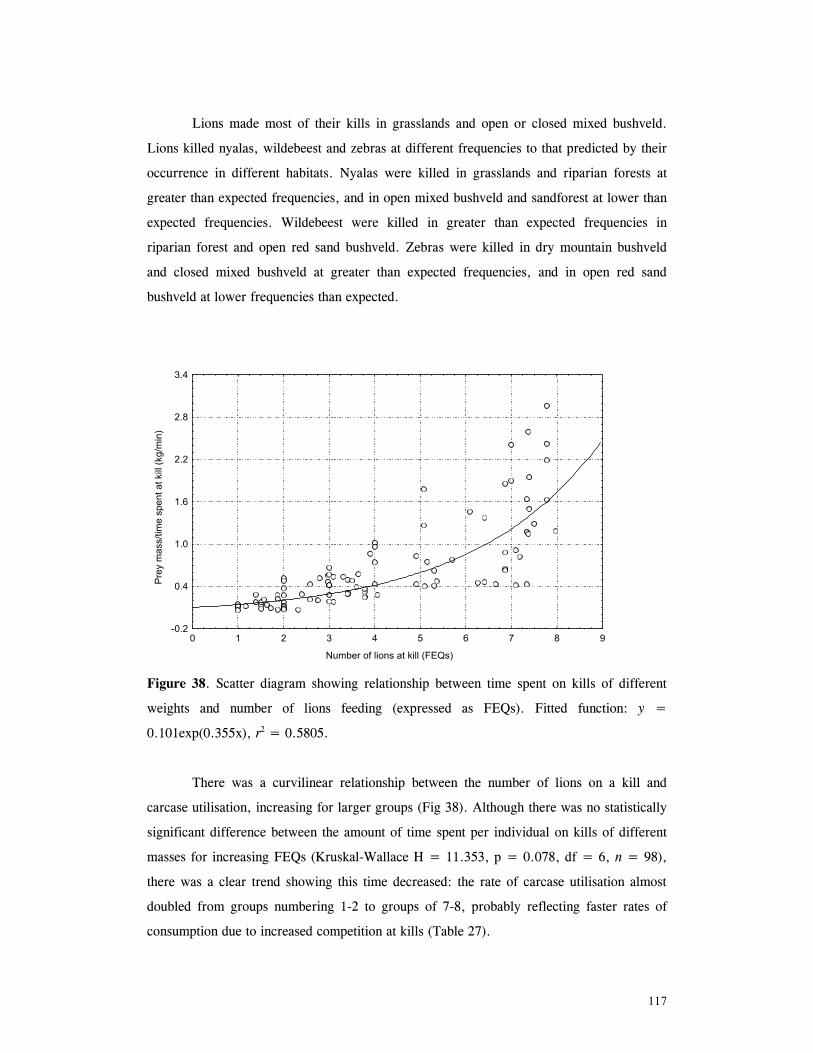
117
Lions made most of their kills in grasslands and open or closed mixed bushveld.
Lions killed nyalas, wildebeest and zebras at different frequencies to that predicted by their
occurrence in different habitats. Nyalas were killed in grasslands and riparian forests at
greater than expected frequencies, and in open mixed bushveld and sandforest at lower than
expected frequencies. Wildebeest were killed in greater than expected frequencies in
riparian forest and open red sand bushveld. Zebras were killed in dry mountain bushveld
and closed mixed bushveld at greater than expected frequencies, and in open red sand
bushveld at lower frequencies than expected.
Number of lions at kill (FEQs)
Pre
y m
ass/
time
spen
t at k
ill (k
g/m
in)
-0.2
0.4
1.0
1.6
2.2
2.8
3.4
0 1 2 3 4 5 6 7 8 9
Figure 38. Scatter diagram showing relationship between time spent on kills of different
weights and number of lions feeding (expressed as FEQs). Fitted function: y =
0.101exp(0.355x), r2 = 0.5805.
There was a curvilinear relationship between the number of lions on a kill and
carcase utilisation, increasing for larger groups (Fig 38). Although there was no statistically
significant difference between the amount of time spent per individual on kills of different
masses for increasing FEQs (Kruskal-Wallace H = 11.353, p = 0.078, df = 6, n = 98),
there was a clear trend showing this time decreased: the rate of carcase utilisation almost
doubled from groups numbering 1-2 to groups of 7-8, probably reflecting faster rates of
consumption due to increased competition at kills (Table 27).
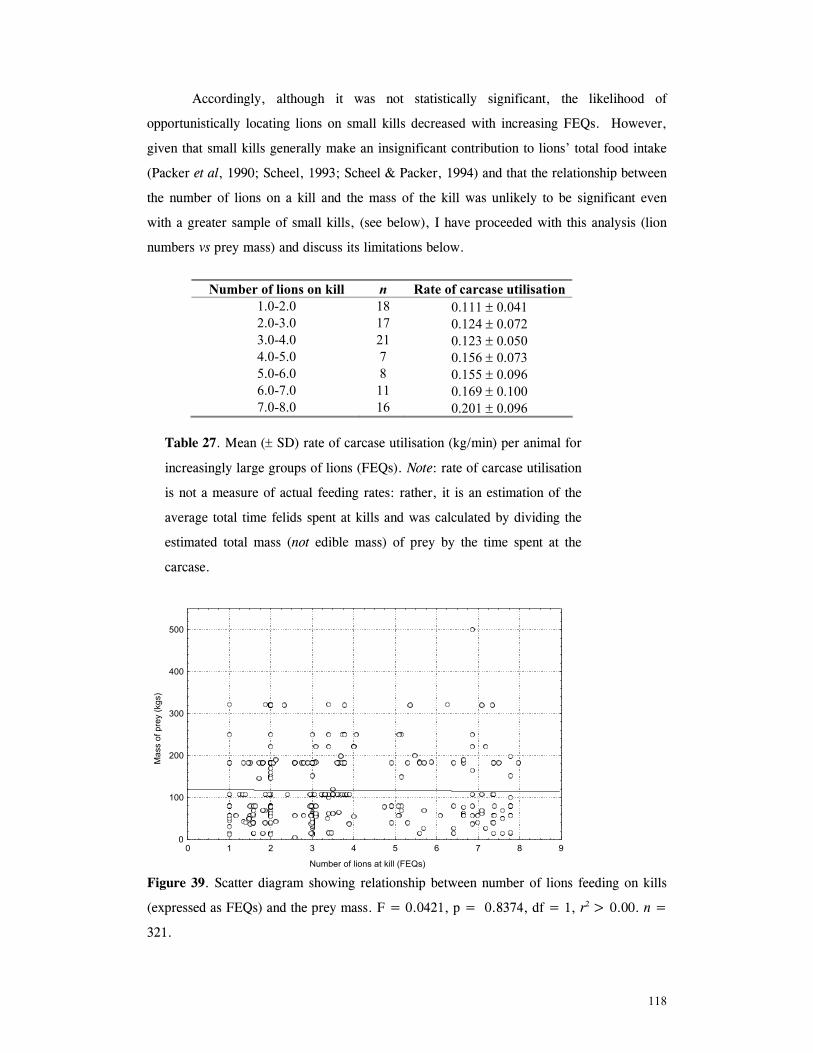
118
Accordingly, although it was not statistically significant, the likelihood of
opportunistically locating lions on small kills decreased with increasing FEQs. However,
given that small kills generally make an insignificant contribution to lions’ total food intake
(Packer et al, 1990; Scheel, 1993; Scheel & Packer, 1994) and that the relationship between
the number of lions on a kill and the mass of the kill was unlikely to be significant even
with a greater sample of small kills, (see below), I have proceeded with this analysis (lion
numbers vs prey mass) and discuss its limitations below.
Number of lions on kill n Rate of carcase utilisation
1.0-2.0 18 0.111 ± 0.041 2.0-3.0 17 0.124 ± 0.072 3.0-4.0 21 0.123 ± 0.050 4.0-5.0 7 0.156 ± 0.073 5.0-6.0 8 0.155 ± 0.096 6.0-7.0 11 0.169 ± 0.100 7.0-8.0 16 0.201 ± 0.096
Table 27. Mean (± SD) rate of carcase utilisation (kg/min) per animal for
increasingly large groups of lions (FEQs). Note: rate of carcase utilisation
is not a measure of actual feeding rates: rather, it is an estimation of the
average total time felids spent at kills and was calculated by dividing the
estimated total mass (not edible mass) of prey by the time spent at the
carcase.
Number of lions at kill (FEQs)
Mas
s of
pre
y (k
gs)
0
100
200
300
400
500
0 1 2 3 4 5 6 7 8 9
Figure 39. Scatter diagram showing relationship between number of lions feeding on kills
(expressed as FEQs) and the prey mass. F = 0.0421, p = 0.8374, df = 1, r2 > 0.00. n =
321.

119
Lions did not show any relationship between the mass of prey species killed and
number of lions at the kill when expressed as FEQs (Fig. 39). However some differences
emerged when comparing females alone or with cubs (Fig. 40). 20.8% of lone females’
kills were of ‘other’ prey species (i.e. species other than the eight common large ungulates
at Phinda). These species were largely small ungulates, particularly grey and red duiker,
which only constituted 6.6% of kills made by single females when they had cubs and 6.7%
of kills by prides (though the greater chance of finding small kills by single females
compared to groups must be noted). 86.6% of kills by single females with cubs were of
wildebeest, warthog and nyala: for lone females this was 54.1%. For prides, warthog,
wildebeest and nyala constituted 73.3% of all kills and the percentage of zebras and giraffes
killed increased. Males unaccompanied by females killed more large species (particularly
zebras and kudus) and fewer warthogs and nyalas than female groups.
5.2 5
10
12.5
22.2
2012.5
25 13.633.3
34.8
17.5
16.6 30.9
18.5
22.5
8.9
22.5
20.816
6.7 7.5
12.5
28.4
31.1
8
8.3
6.6
0%
10%
20%
30%
40%
50%
60%
70%
80%
90%
100%
Singlefemales,no cubs(n = 24)
Femalegroups,no cubs(n= 162)
Singlefemales& cubs(n= 45)
Prides(n= 135)
Males(n= 40)
otherzebrawildebeestwarthognyalakuduimpalagiraffe
Figure 40. Percentages of different prey species killed by different social groups of lions at
Phinda. Categories are: single lionesses alone, single lionesses with cubs, two or more
lionesses without cubs (‘female groups, no cubs”), with cubs (“Prides”) and males (single
males and coalitions of two and three males pooled, unaccompanied by females). Reedbucks
are included in ‘other’ prey category as only two kills of this species were recorded, both
by female groups with no cubs. n is number of kills for each category.
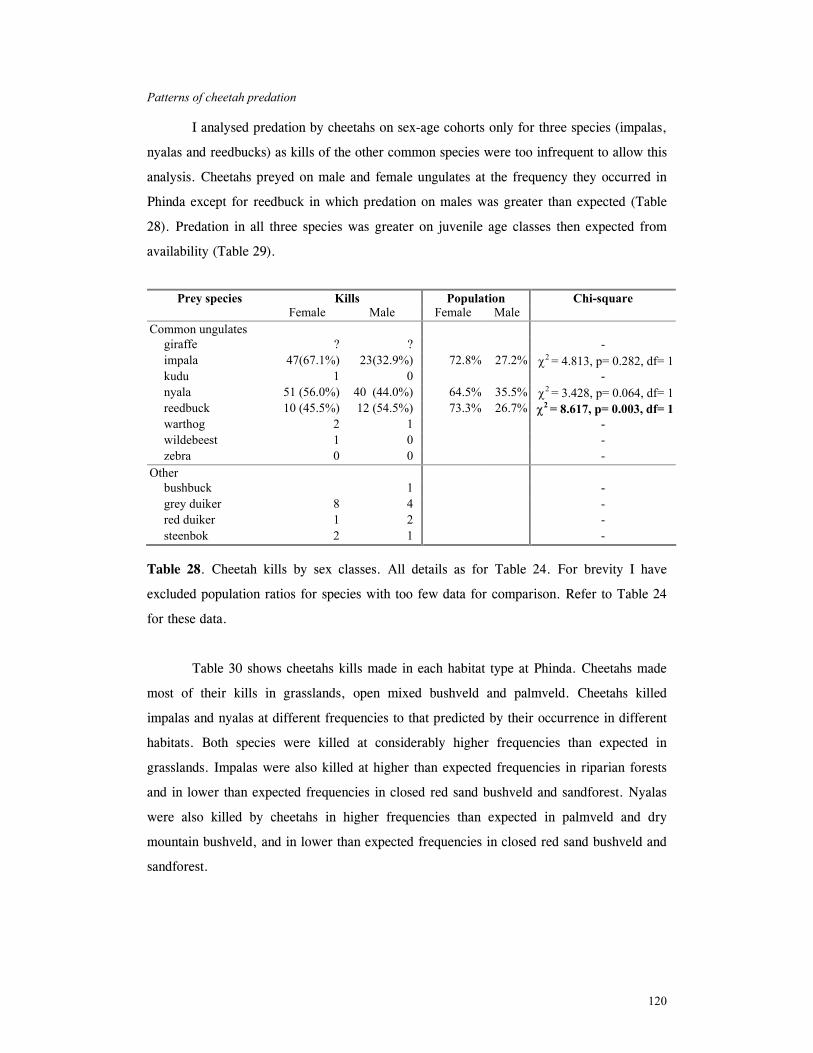
120
Patterns of cheetah predation I analysed predation by cheetahs on sex-age cohorts only for three species (impalas,
nyalas and reedbucks) as kills of the other common species were too infrequent to allow this
analysis. Cheetahs preyed on male and female ungulates at the frequency they occurred in
Phinda except for reedbuck in which predation on males was greater than expected (Table
28). Predation in all three species was greater on juvenile age classes then expected from
availability (Table 29).
Prey species Kills Population Chi-square Female Male Female Male
Common ungulates giraffe ? ? - impala 47(67.1%) 23(32.9%) 72.8% 27.2% χ2 = 4.813, p= 0.282, df= 1kudu 1 0 - nyala 51 (56.0%) 40 (44.0%) 64.5% 35.5% χ2 = 3.428, p= 0.064, df= 1reedbuck 10 (45.5%) 12 (54.5%) 73.3% 26.7% χ2 = 8.617, p= 0.003, df= 1warthog 2 1 - wildebeest 1 0 - zebra 0 0 -
Other bushbuck 1 - grey duiker 8 4 - red duiker 1 2 - steenbok 2 1 -
Table 28. Cheetah kills by sex classes. All details as for Table 24. For brevity I have
excluded population ratios for species with too few data for comparison. Refer to Table 24
for these data.
Table 30 shows cheetahs kills made in each habitat type at Phinda. Cheetahs made
most of their kills in grasslands, open mixed bushveld and palmveld. Cheetahs killed
impalas and nyalas at different frequencies to that predicted by their occurrence in different
habitats. Both species were killed at considerably higher frequencies than expected in
grasslands. Impalas were also killed at higher than expected frequencies in riparian forests
and in lower than expected frequencies in closed red sand bushveld and sandforest. Nyalas
were also killed by cheetahs in higher frequencies than expected in palmveld and dry
mountain bushveld, and in lower than expected frequencies in closed red sand bushveld and
sandforest.
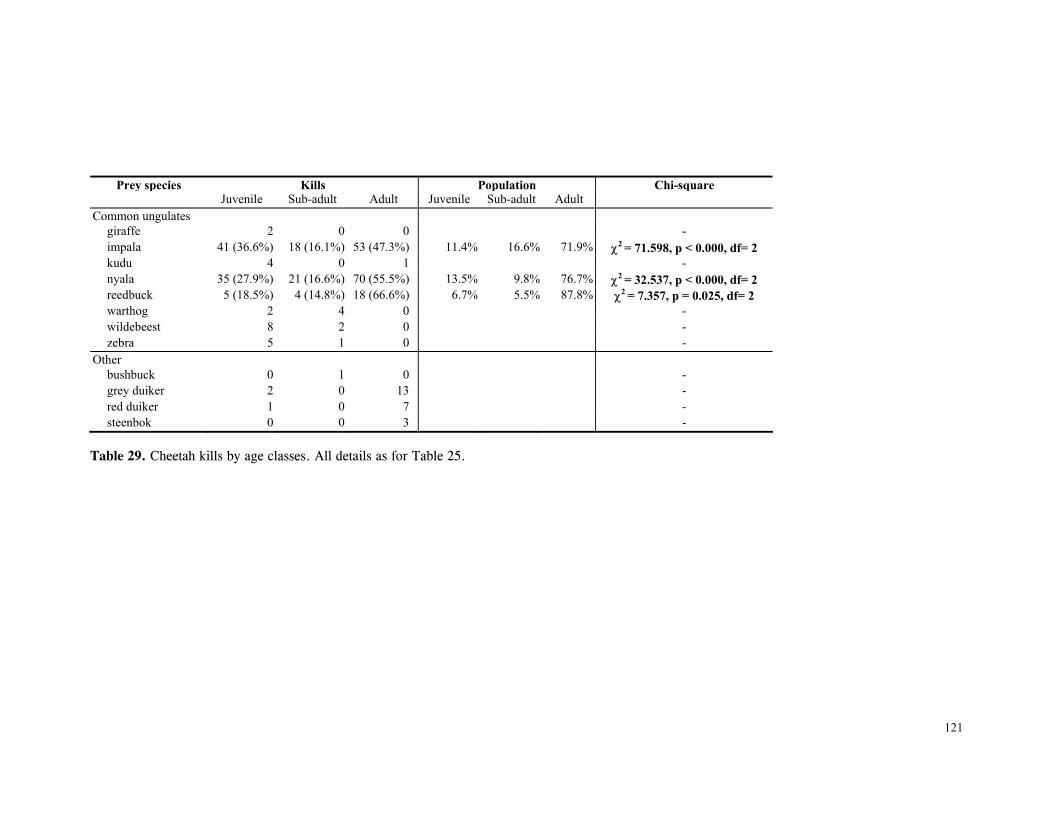
121
Prey species Kills Population Chi-square Juvenile Sub-adult Adult Juvenile Sub-adult Adult
Common ungulates giraffe 2 0 0 - impala 41 (36.6%) 18 (16.1%) 53 (47.3%) 11.4% 16.6% 71.9% χ2 = 71.598, p < 0.000, df= 2 kudu 4 0 1 - nyala 35 (27.9%) 21 (16.6%) 70 (55.5%) 13.5% 9.8% 76.7% χ2 = 32.537, p < 0.000, df= 2 reedbuck 5 (18.5%) 4 (14.8%) 18 (66.6%) 6.7% 5.5% 87.8% χ2 = 7.357, p = 0.025, df= 2 warthog 2 4 0 - wildebeest 8 2 0 - zebra 5 1 0 -
Other bushbuck 0 1 0 - grey duiker 2 0 13 - red duiker 1 0 7 - steenbok 0 0 3 -
Table 29. Cheetah kills by age classes. All details as for Table 25.

122
Prey species DMB Grass MBC MBO Palm RSC RSO RF SF Chi-squared result giraffe 1 1 - impala 1 (3.70) 37 (26.54) 10 (8.51) 27 (25.09) 10 (14.11) 6 (10.75) 14 (17.58) 7 (3.14) (2.53) χ2 = 17.790, p= 0.022, df= 8 kudu 3 1 1 - nyala 4 (1.39) 25 (8.57) 14 (19.02) 26 (22.17) 18 (2.52) 10 (30.36) 22 (27.97) 2 (1.39) 5 (14.99) χ2 = 155.33, p< 0.000, df= 8 reedbuck (0) 16 (14.77) 1 (0.59) 3 (1.38) 5 (7.85) 1 (0) (0.92) (1.48) 1 (0) χ2 = 5.724, p= 0.678, df= 8 warthog 1 2 1 2 - wildebeest 7 2 1 - zebra 4 2 - other 1 7 3 7 5 4 2 - TOTAL 8 98 34 66 42 18 40 9 8 (2.5%) (30.3%) (10.5%) (20.4%) (13.0%) (5.6%) (12.4%) (2.8%) (2.5%) Table 30. Cheetah kills made in each habitat type. Excluded are two cheetahs. All other details as for legend, Table 6.7

123
There was a strong relationship between the time spent on kills of different mass by
cheetah females with cubs (Fig. 41). Not surprisingly, the time spent on kills decreased
relatively linearly with increasing group size. There was no significant difference between the
amount of time spent per individual on kills of different masses for increasing FEQs (Kruskal-
Wallace H = 7.87, p = 0.248, df = 6, n = 100), suggesting that the likelihood of locating
cheetahs with kills of different masses was approximately equal for increasing FEQs (Table
31). In other words, although opportunistic location of cheetah kills was biased towards finding
larger kills, the relative likelihood of finding small kills did not significantly decrease with
increasing group size.
Number of cheetahs on kill (FEQ)
Pre
y m
ass/
time
spen
t at c
arca
se (k
g/m
in)
0.05
0.15
0.25
0.35
0.45
0.55
0.65
0.5 1.0 1.5 2.0 2.5 3.0 3.5 4.0 4.5 5.0
Figure 41. Scatter diagram showing relationship between time spent on kills of different
weights and number of cheetahs feeding (expressed as FEQs) for cheetah females with cubs.
Fitted function: y = 0.011 + 0.012x, r2 = 0.899, n =100.
Number of cheetahs on kill n Rate of carcase utilisation
<1.5 10 0.106 ± 0.019 1.5-2.0 21 0.117 ± 0.022 2.0-2.5 17 0.120 ± 0.016 2.5-3.0 17 0.114 ± 0.018 3.0-3.5 15 0.110 ± 0.015 3.5-4.0 5 0.116 ± 0.012 4.0-4.5 15 0.120 ± 0.007
Table 31. Mean (± SD) rate of carcase utilisation (kg/min) per individual for increasingly large
groups of cheetah females and cubs (FEQs). All other details as for Table 27.
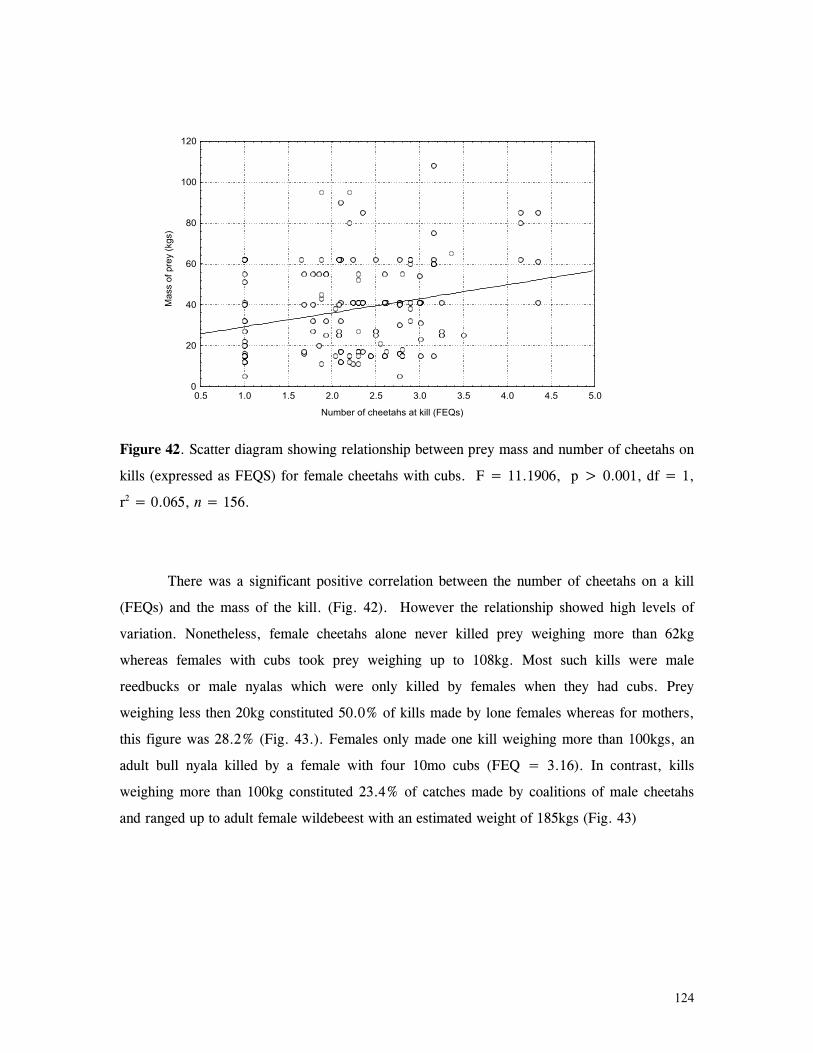
124
Number of cheetahs at kill (FEQs)
Mas
s of
pre
y (k
gs)
0
20
40
60
80
100
120
0.5 1.0 1.5 2.0 2.5 3.0 3.5 4.0 4.5 5.0
Figure 42. Scatter diagram showing relationship between prey mass and number of cheetahs on
kills (expressed as FEQS) for female cheetahs with cubs. F = 11.1906, p > 0.001, df = 1,
r2 = 0.065, n = 156.
There was a significant positive correlation between the number of cheetahs on a kill
(FEQs) and the mass of the kill. (Fig. 42). However the relationship showed high levels of
variation. Nonetheless, female cheetahs alone never killed prey weighing more than 62kg
whereas females with cubs took prey weighing up to 108kg. Most such kills were male
reedbucks or male nyalas which were only killed by females when they had cubs. Prey
weighing less then 20kg constituted 50.0% of kills made by lone females whereas for mothers,
this figure was 28.2% (Fig. 43.). Females only made one kill weighing more than 100kgs, an
adult bull nyala killed by a female with four 10mo cubs (FEQ = 3.16). In contrast, kills
weighing more than 100kg constituted 23.4% of catches made by coalitions of male cheetahs
and ranged up to adult female wildebeest with an estimated weight of 185kgs (Fig. 43)
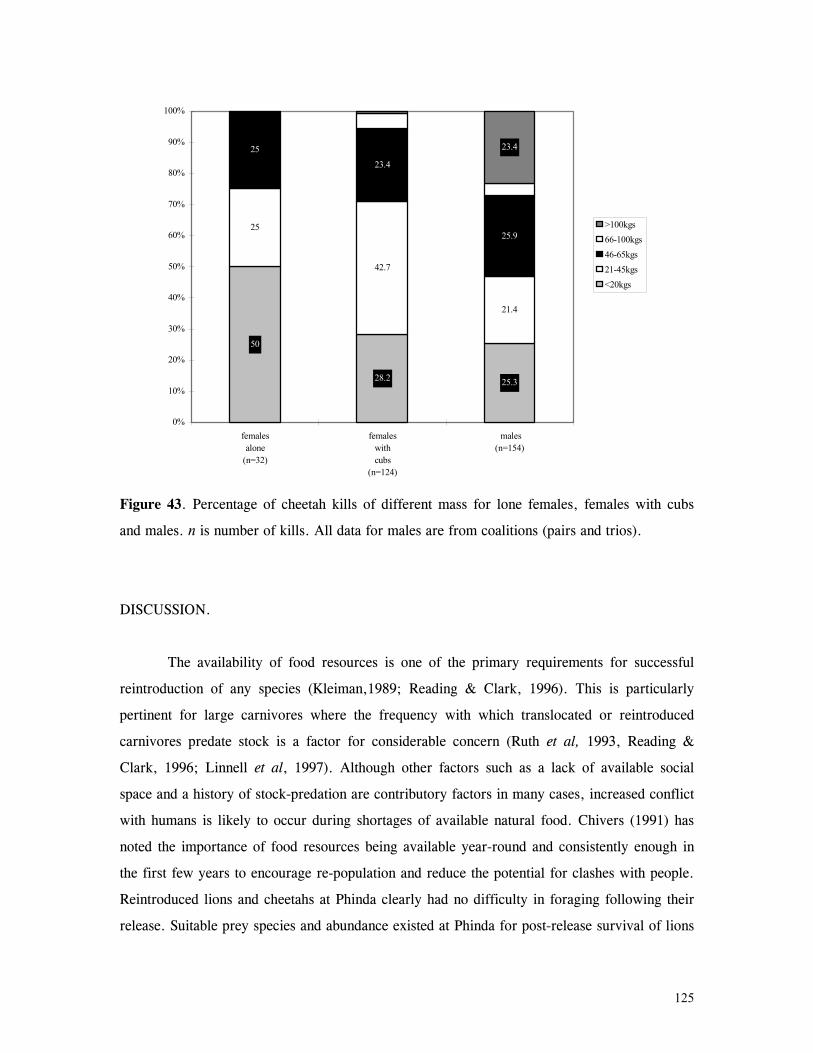
125
50
25.3
25
42.7
21.4
25
23.4
25.9
23.4
28.2
0%
10%
20%
30%
40%
50%
60%
70%
80%
90%
100%
femalesalone
(n=32)
femaleswithcubs
(n=124)
males(n=154)
>100kgs66-100kgs46-65kgs21-45kgs<20kgs
Figure 43. Percentage of cheetah kills of different mass for lone females, females with cubs
and males. n is number of kills. All data for males are from coalitions (pairs and trios).
DISCUSSION.
The availability of food resources is one of the primary requirements for successful
reintroduction of any species (Kleiman,1989; Reading & Clark, 1996). This is particularly
pertinent for large carnivores where the frequency with which translocated or reintroduced
carnivores predate stock is a factor for considerable concern (Ruth et al, 1993, Reading &
Clark, 1996; Linnell et al, 1997). Although other factors such as a lack of available social
space and a history of stock-predation are contributory factors in many cases, increased conflict
with humans is likely to occur during shortages of available natural food. Chivers (1991) has
noted the importance of food resources being available year-round and consistently enough in
the first few years to encourage re-population and reduce the potential for clashes with people.
Reintroduced lions and cheetahs at Phinda clearly had no difficulty in foraging following their
release. Suitable prey species and abundance existed at Phinda for post-release survival of lions
126
and cheetahs (see Chapter 5) to be free of constraints related to food resources or their feeding
ecology. Additionally, despite the availability of livestock on neighbouring properties and
numerous interactions through the boundary fence (Chapter 3), lions and cheetahs at Phinda
were able to forage successfully enough in the reserve for pre-release fears of domestic stock
depredation to remain unrealised (see Chapter 2: Socio-Political Considerations).
In general, observations from Phinda concur with lion predation patterns elsewhere in
which lions hunt (and may kill) everything they encounter, (Schaller, 1972; Smuts, 1982;
Stander, 1992). Phinda lions killed most species they encountered: elephants, white rhinoceros
and crocodiles were the only large species encountered which were not killed by lions during
this study (though these species have been recorded as prey for lions elsewhere, e.g. Pienaar,
1969). Schaller (1972) was probably the first to note that although the range of species taken by
lions is large, generally less than five medium to large ungulate species constitute about 75% of
food items of lions’ diet. This pattern has been demonstrated since in many studies (Rudnai,
1974; Mills, 1990; Stander, 1992; Packer et al, 1995) At Phinda, wildebeest, zebras, nyalas
and warthogs constituted 86% of edible biomass consumed by lions and made up 77% of all
carcasses. Of those species, lions killed wildebeest and warthogs at greater frequencies than
occurrence and zebras and nyalas at approximately their occurrence.
Prey preference for lions (Pienaar, 1969; Rodgers,1974; Rudnai,1974; Berry, 1981)
has been presented as a Preference Rating (PR) calculated where PR = kill frequency/relative
abundance of prey (Table 23). Stander (1992) suggested this is rather an indication of prey
vulnerability to a predator and is subject to factors such as the spatial distribution of prey and
hunting success on different prey species (Sunquist & Sunquist 1989; Stander, 1992). Actual
preferences for a prey species or type are difficult to demonstrate unless direct observation
permits an assessment of an actual selection being made by predators when faced with a choice
of prey species. This was rarely possible during the current study due to dense vegetation
where it was difficult to follow hunting lions and where it was frequently impossible to
determine which prey species were present when lions actually began their stalk. I saw 14
occasions where lions apparently made direct movements of 1-2km from areas of dense
vegetation (where small cubs were hidden), to open areas with high wildebeest and zebra
densities. In all cases, lions encountered smaller prey species (usually impalas and nyalas) at
distances of <100m on their way, but made no hunting attempt and proceeded to the
wildebeest/zebra herds. While this suggests lions were actively searching for large species and
127
ignoring smaller ones, there may be many factors contributing to such a pattern and I do not
have the sample size to examine the question in detail.
However, the importance of wildebeest to lions at Phinda was evident. Wildebeest were
preyed upon at three times their relative abundance and made up more than one-third of the
edible biomass killed by lions. As a result of lion predation, wildebeest underwent a
considerable population decline during the study period (Chapter 7). Given the small group size
of lions at Phinda, the low risk of losing kills to competitors and the far greater abundance of
other prey species particularly nyalas and impalas, it is interesting that lions still appeared to
‘prefer’ larger prey. Lions at Phinda showed no relationship between pride size and prey mass
(Fig. 39): different sized groups killed all prey sizes at essentially the same frequency with an
emphasis towards larger species. Although single lionesses killed more very small species, this
may have been a sampling artefact in that I was more likely to find small kills made by lone
lionesses. In Etosha National Park in Namibia, Stander (1992) showed that lions hunting in
pairs could meet their minimum daily requirements (5-8.5kg per day: Packer et al 1990) by
hunting mostly springboks weighing <50kg. Presumably, the small groups at Phinda could
have foraged efficiently by merely taking the most abundant ungulate, the nyala, or even
impalas (the second most abundant species) both of which are heavier than springboks.
Importantly, habitat use by nyalas differed markedly to that by wildebeest (Chapter 7) and lions
generally preferred habitats used by wildebeest (Chapter 4) and made proportionately more kills
there than in habitats where nyala density was highest (Table 26). Accordingly wildebeest may
have been ‘preferred’ by lions simply because they were encountered by lions at greater rates
than nyalas. However, two points suggest this is unlikely. Nyalas outnumbered wildebeest at
Phinda by a factor of 3.4 and their density in each habitat far exceeded wildebeests’ in all
habitats except dry mountain bushveld and grassland (in which density of each species was
close to parity) and palmveld in which density of wildebeest was greater (Chapter 7). Secondly,
impala habitat use is generally very similar to wildebeests’ (Hirst, 1975) which was the case for
this study (Chapter 7) and their far greater density in all habitats suggests lions should have
been more likely to kill them than wildebeests if encounter rate alone was the critical factor.
Smuts (1982) characterised lion predation patterns as favouring the ‘easiest’ prey and
perhaps wildebeest were simply easier for lions to catch. Wildebeest looked less often than
impalas and spent less time on average per scan than impalas (Chapter 8), so they were possibly
easier for lions to approach undetected. Furthermore, single lionesses alone are able to subdue
all prey species that groups of lions take except for the very largest quarry (Packer et al, 1990;
128
Stander, 1992) and only adult buffaloes, giraffes and occasionally zebras present a danger to
lions. Lions were never observed to incur injuries during hunts of wildebeests, and wildebeest
never escaped once caught by a lion as zebras may do (Rudnai, 1974; Berry, 1980; present
study). This suggests that while hunting wildebeest, they probably expended little extra energy
and presented little increased risk than when hunting nyalas, and therefore hunting wildebeest
maximised the amount of food received per hunt. However, it would require specific data such
as the success rates of hunting different species, the time spent and the frequency hunting
different species and the risk of injury hunting different species to confirm this, data which I do
not have for this study. Assuming the risk and effort is similar for the two prey species,
wildebeest would clearly be a far more valuable resource for lions. Lions rarely abandon kills
before they are entirely consumed and only lost two kills to hyaenas during this study.
Therefore, a pair or trio of lions could remain at a wildebeest kill for 3-4 days and then not
need to hunt for some days following. Although lions could almost certainly have foraged
efficiently at Phinda if they had hunted mostly smaller prey, the patterns observed here confirm
Stander’s (1992) suggestion that even when smaller prey is available, lions show a preference
for large prey when opportunity permits.
This may have important management implications for reserves introducing predators
or wishing to manage predator-prey interactions and populations. Van Dyk (1997) has
suggested that manipulating sizes of prides in reintroduced populations can be a valuable
technique for reducing predation on large (and generally valuable) prey species. Although this
applies for very large prey species such as giraffes and buffaloes which require large pride sizes
to hunt successfully (Packer et al, 1990), managers should not necessarily assume that an
abundance of smaller prey species will reduce predation on species such as wildebeest or
similarly-sized rarer species, for example, roan and sable. Van Ordsol showed that lions in two
regions of Queen Elizabeth National Park, Uganda opportunistically hunted small prey
(particularly warthogs) during the day but at night actively searched for large prey, in doing so
maximising the amount of food received per kill. At Phinda, it appears lions hunted small-
medium sized prey, particularly warthogs and nyalas opportunistically, but invested greater
effort in searching for larger species.
Not surprisingly, cheetahs at Phinda were far more selective than lions in terms of
species. Excluding two male cheetahs killed in intra-specific fights, all species killed by
cheetahs (except for one male ostrich) and more than 99% of all kills were ungulates. 81% of
129
kills in terms of biomass (and 82% of all kills in numbers) comprised three species: nyalas,
impalas and reedbucks. Despite extensive overlap in ranges and regular encounters (Chapter 4),
cheetahs at Phinda rarely came into direct competition with lions for food resources, which may
have contributed to cheetahs’ success during this study. Cheetahs lost only two kills to lions and
abandoned a kill on one other occasion when lions passed nearby but did not see the cheetahs.
Incidentally, cheetahs lost kills to other predators on two occasions, once each to a leopard and
a spotted hyaena.
Durant (1998) recently demonstrated the importance of local avoidance behaviour by
cheetahs in both space and time with respect to lions and hyaenas. The most abundant ungulate
at Phinda, nyalas, featured prominently in both lions’ and cheetahs’ diet, and therefore the
potential for competition was considerable. Nyalas are always found in association with dense
thickets and at Phinda, were at their greatest densities in Acacia woodlands and Red sand
bushveld (Chapter 7) which is where lions mostly killed them (Table 26). However they also
commonly graze in more open habitats, although never more then a few hundred metres from
cover (Tello & Van Gelder, 1975), suggesting they are vulnerable to predation in the open.
Cheetahs probably reduced competition with lions for nyalas by hunting them largely in open
habitat such as grassland and palm veld (Table 30). Although cheetahs were able to hunt in
much denser vegetation, nyalas are sluggish runners compared to many other antelopes and
seemed easily captured when cheetahs pursued them in the open. On the other hand, lions made
relatively few nyala kills in the open and nyalas often out-ran them in grasslands and palm veld.
The lack of direct competition experienced by cheetahs was manifested in other ways.
Cheetahs rarely abandoned kills before they were satiated, commonly spending 12-14 hours on
large carcasses. On one occasion, two males ate from a juvenile giraffe kill for 28 hours.
Furthermore, cheetahs sometimes returned to large kills after abandoning them overnight
(presumably to avoid nocturnal predators such as lions and hyaenas), resting up to 500m away
and returning to them the following morning. This has been rarely reported where the density
of competitors is high and cheetahs suffer from high rates of klepto-parasitism (Graham, 1965;
Burney, 1980). I saw 12 incidents when this occurred, all of them by females when
accompanied by large litters of adult-sized cubs. Laurenson (1992) demonstrated that females
with cubs younger than 2 months hunted more ‘large prey’ (>20kgs) and were more successful
during hunts of large prey than lone females. Mother’s preferences for large prey such as adult
Thomson’s and Grant’s gazelles persisted until the cubs were 8.5 months old and then declined,
probably because the most expensive energetic stage for mothers was during lactation (Caro,

130
1994). I do not have data this specific but there was a positive relationship between litter
size/age (as measured by FEQs) and prey mass, (although there was very high variation around
the relationship, see Figure 42). Lone females never killed prey greater than 62kgs (the mean
weight of adult female nyalas) and all kills weighing more than 75kgs (except for one) were
made by females with cubs whose combined FEQ was equivalent to at least another adult
female. At Phinda, the high survival rate of cubs meant that females probably experienced
increased energetic demands as cubs approached adult size or else energetic demands remained
high after lactation had ceased. Unlike most Serengeti mothers where juvenile mortality may be
as high as 95% (Laurenson 1992), Phinda females with many large cubs had to provide for the
equivalent of up to 3-4 other adult females (in terms of mass). Large cubs rarely contributed to
hunts or even to subduing prey once it was caught. Although females caught small prey which
they brought alive to the cubs to ‘practise on’ from when the cubs were 6 months old, I never
saw females relinquish large kills to cubs until the animal had been suffocated. Therefore,
mothers appeared to bear the substantial energetic demands of killing large animals on their
own. At Phinda, mother cheetahs appeared to offset this cost by hunting very large prey, eating
from it until it was finished and, in some cases, returning to the carcase when there was still
meat on it.
These behaviours probably had considerable costs. I saw female cheetahs injured in
successful hunts on 17 occasions: 15 of them were during hunts on prey larger than 60kgs.
Although it was rarely possible to determine how cheetahs received injuries, twice I saw
females tumble bodily with large prey (both adult male reedbucks) once they had caught it and
incur injuries on both occasions. However, I cannot say whether other factors such as the
density of vegetation or the continuity of the terrain contributed to the likelihood of injury.
Incidentally, all cheetahs which I saw injured during hunts always recovered. Presumably, the
risks of hunting large prey were outweighed by the benefits of acquiring a large carcase which,
in the absence of competition, could be utilised fully. Interestingly, I never observed cheetahs
to scavenge carcasses which is generally very rare behaviour (Pienaar, 1969; Caro, 1982) but
which, presumably, they may have done safely at Phinda given the lack of competing
predators. I only observed one occasion when cheetahs encountered an animal which had died
of natural causes (impala female). It was starting to putrefy and the cheetahs left it after a very
cautious approach and exploratory sniff. Interestingly, cheetahs always took fresh carcasses
offered to them when I needed to dart them.
131
Patterns of predation by male cheetahs suggested similar aspects of ‘predator release.’
Almost one-quarter of kills made by male coalitions weighed more than 100kgs and I only
noted eight occasions when males left kills before they were finished, 50% of which were due
to males being chased from kills by other carnivores. Most of the large kills made by males
were nyalas and the presence of this species at Phinda contributed significantly to patterns of
cheetah predation observed here. Caro (1994) has demonstrated that large gaps in the size
distribution of abundant prey determine patterns of prey selection and hunting rates in Serengeti
cheetahs. Such gaps “help to explain why individual foraging returns rise with group size in
(smaller) male cheetahs but decline or remain static in (larger) lionesses” (Caro, 1994:274). In
the Serengeti, single males could meet their foraging needs by preying on Thomson’s gazelles,
pairs needed to switch to young wildebeests and trios had to kill nothing smaller than a yearling
wildebeest to satisfy their needs. However, wildebeests are a dangerous species for cheetahs to
hunt. Caro mentions five occasions where cheetahs were kicked, butted or tossed by wildebeest
(Caro 1994:276). I saw yearling/sub-adult wildebeest turn to face cheetahs on six occasions
after the cheetahs had actually caught them and the wildebeest escaped. On two occasions, I
saw adult wildebeest attempt to drive cheetahs from their catch of juvenile wildebeest,
vigorously trying to butt or horn cheetahs (but failing). I also saw three occasions when
wildebeest herds chased single cheetahs walking nearby.
At Phinda, the most abundant ungulate species was nyala (Chapter 7) which weighs
120-130kgs in the males and 60-70 kgs in the females, yet nyalas did not appear to present the
risks entailed in hunting wildebeest. Despite their impressive horns, nyalas seem easily subdued
and very rarely made any effort to defend themselves. I only saw one occasion when a male
nyala defended itself from attack by cheetahs, three siblings recently separated from their
mother. The nyala backed into an Acacia nylotica thicket and rushed the cheetahs with horns
lowered whenever the cheetahs approached. The cheetahs eventually gave up, though an adult
coalition may have been able to subdue the nyala (which, incidentally, was totally blind).
Despite the ease with which cheetahs appeared to prey on nyalas at Phinda, male nyalas were
too large or too dangerous for female cheetahs. Male cheetahs in coalitions killed mostly male
nyalas (58.6% of adult or sub-adult nyalas killed) whereas female cheetahs killed mostly female
nyalas (79.9% of adult or sub-adult nyalas killed).
As an abundant, large prey species easily caught with relatively little risks, the nyala
represented a highly profitable resource for cheetahs. Nyalas constituted almost 50% of kills
made by cheetahs (in terms of biomass) which was more than double the next most important
132
prey species, impalas (23.8%; Table 20), often the most important prey species in other
systems (eastern Transvaal, South Africa: Hirst, 1969; Pienaar, 1969, Nairobi National Park,
Kenya: McLaughlin, 1970; Eaton, 1974). This is the first study of cheetah feeding ecology to
illustrate that cheetahs can specialise on a relatively large, heavy ungulate. Although cheetahs
from other studies are well-known to take prey as large as the largest taken at Phinda, in all
other comprehensive studies of their feeding ecology, the most important prey species generally
weighed less than 60kgs in the male (e.g. impalas) and was often as small as 20kg (e.g.
Thomson’s gazelle). Although cheetahs are the most specialised felid, preferring small to
medium sized gazelle-type prey, particularly in open grassland where most studies have been
undertaken (Caro, 1994; Nowell & Jackson, 1996), the patterns observed at Phinda illustrate
they are flexible and efficient hunters in woodland-dominated habitat and are not necessarily
dependent on gazelle or impala-sized prey to be successful. Comparisons with cheetah
populations in other woodland habitats would be especially interesting, particularly where the
prey base differs to that at Phinda and where attempts are ongoing to re-establish cheetahs (such
as at Pilanesberg National Park and Madikwe Game Reserve).
Some male ungulates at Phinda were more vulnerable than females to predation by both
cheetahs and lions. Lions killed male kudus, nyalas and warthogs, and cheetahs killed male
reedbucks at greater than expected frequencies. Male nyalas were also killed by cheetahs at
high frequencies, though it was not statistically significant (Table 28). Numerous studies have
demonstrated a higher rate of predation on male ungulates compared to females (Hirst, 1969;
Schaller, 1972; Rudnai, 1974; Fitzgibbon, 1990; Mills, 1990; Ruggiero, 1991; Stander, 1992).
Estes & Goddard (1967) believed wild dog predation was associated with the site fidelity of
territorial males. Conversely, Walther (1969) believed that in Grant’s gazelles, non-territorial
males were mostly killed. However, unlike many other bovids, the three species in which males
were killed disproportionately at Phinda do not maintain breeding territories (Jungius, 1971;
Anderson, 1980; Owen-Smith, 1984) nor do warthog males (Mason, 1982). Fitzgibbon (1990)
demonstrated that cheetahs killed more male Thomson’s gazelles because they were less vigilant
than females. I did not examine vigilance behaviour in any of the species in which males were
disproportionately killed. However, in impalas and wildebeest, females were generally more
vigilant than males when they were accompanied by juveniles but male impalas looked more
than females without young, and male wildebeest and females without young looked the same
amount (Chapter 8). Kudu, nyalas, reedbucks and warthogs all differ from these species in

133
generally having small family groups with no territories. Most of them (kudu, nyalas and
warthogs: occasionally reedbucks) form small bachelor groups or are often solitary as males.
This may increase their vulnerability as they do not have benefit of the ‘many eyes’ effect
which suggests that as group size increases, there are more eyes watching for predators which
enhances the likelihood of detection (Lima, 1995). Studies of vigilance, grouping patterns and
other predation avoidance behaviour in different social groups (which may vary considerably)
of these species would be valuable. It would be particularly fruitful to compare these behaviours
where predation pressure is absent or low, and where it is high (see Chapter 8).
Finally, a comment on methodology used for feeding studies of large carnivores is
appropriate. I combined data from three different methods of data collection (direct
observation, radio-location observations and ranger reports) which as Mills (1992, 1996) had
indicated, must be done with caution. Some methods are more likely to increase the
contribution of large kills in food habit studies and therefore, pooling data may lead to
inaccurate conclusions. The situation at Phinda was different from Mills’ study in that lion
groups were generally small which increased the chances of all methods locating smaller kills.
Furthermore, direct observation was far less effective than in Mills’ study site due to dense
vegetation and I could not conduct continuous long-term night watches as he and others
(Stander, 1992; Hanby et al, 1994; Scheel & Packer, 1994) have done in more open habitat.
Conversely, as I located all cats usually daily or every second day, my data from radio-location
observations probably included more small kills than less frequent telemetry. Finally, while
ranger reports were most akin to Mills’ opportunistic method (which is known to under-
represent small kills), rangers often spent extended periods following lions hunting, recording
kills as they happened and so, probably increased the percentage of small kills included.
Accordingly, while all three methods inevitably over-represented large kills, there was no
difference in the degree to which they did and hence, I pooled the data. As Mills (1992) has
discussed, where it can be shown that data from different methods is compatible, combining
data may be a useful technique for presenting a more accurate picture of carnivore food habits.
The constraints and advantages in the present study are similar to those experienced by many
research projects in southern Africa. While thick vegetation may limit the opportunities for
direct observation, high levels of tourism activity can significantly supplement data collection.
Researchers can improve data collection by being cognisant of such logistical conditions before
embarking on a project and by incorporating them in its planning stages.
134
CHAPTER 7.
THE EFFECT OF PREDATION ON HERBIVORE POPULATIONS IN SMALL
RESERVES.
The effect of predation by large carnivores on populations of their prey species is a
complex and controversial subject. Predation is widely assumed to regulate or even diminish
herbivore populations and as a result, predators are widely persecuted by interest groups
such as hunters, game farmers and managers of some reserves (Keith, 1974; Bergerud,
1985; Skogland, 1991) . However, studies which unequivocally demonstrate the impact of
predation in large mammal communities are sparse. Quantification of this impact requires
very precise data which are often difficult to gather, particularly in studies of large
mammals. This includes accurate estimates of the numbers of predators and prey species in
an area, the pattern of predation with respect to herbivore demographic characteristics, the
contribution of predation to overall prey mortality and other sources of mortality in prey
populations (Mills, 1990).
Previous work on large mammal predator-prey systems in Africa suggests that
predation generally has little regulating effect on prey populations. Herbivore populations
appear to periodically escape high predation pressure either by migratory movements such
as wildebeest in the Serengeti (Sinclair et al, 1985), white-eared kob in Sudan (Fryxell &
Sinclair, 1998) and zebra in the Kruger National Park (Mills & Shenk, 1992), or by being
nomadic or semi-nomadic such as the large ungulate assemblage of the southern Kalahari
(Mills, 1990). However, while regulation for migratory herds appears rare, resident
populations of prey species may be more heavily impacted by predation. Fryxell, Greever &
Sinclair (1988) suggested that the low population densities of resident herbivore prey species
increased the potential for a regulatory effect by predation. Their models predicted that as
few as 1000 predators (lions and hyaenas) could regulate a resident wildebeest population
below 85,000 in the Serengeti. In contrast, this number of predators could not regulate a
migratory herd. Lending support to their models, Sinclair (1995) presented evidence that
resident topi, impala, Thompson’s gazelle and warthog were limited by predation in the
Serengeti-Mara ecosystem and Mills & Shenk (1992) demonstrated that resident wildebeest
in the south-eastern region of the Kruger National Park were more heavily impacted by lion
predation than seasonally migratory zebras.
In small reserves such as Phinda, the opportunity for herds to temporally or
spatially escape predation may be limited. Reintroduced lions and cheetahs established small
to medium-sized home ranges (Chapter 4) which they could easily traverse in a day or
135
night. Furthermore, although the intensity of use of different areas of home ranges varied
periodically, lions and cheetahs were present in all areas of the reserve in more-or-less
uniform densities which increased during the course of this study. Accordingly, while rates
of predation were not strictly constant in all areas of Phinda at all times, populations of prey
animals were unable to move to areas where predation by lions and cheetahs was reduced
for substantial periods, as occurs in migratory herds such as in the Serengeti.
Such a situation may give rise to a population decline if predation mortality
outweighs annual recruitment. For example, in south-eastern British Columbia, wolves prey
on two adjacent populations of caribou. In the Wells Gray Park area, caribou migrate
beyond wolf range in the summer and seasonally avoid predation (Seip, 1992). This
population experiences high recruitment rates averaging 37 calves per 100 females. Caribou
from the Quesnel Lake area nearby experience year-round predation and recruitment is only
2.5 calves per 100 females. Adult mortality is 29%, far higher than the recruitment rate and
the population is declining, possibly towards extinction (Seip, 1992).
In this Chapter, I attempt to examine the impact of predation on resident herbivore
populations in small reserves. I reasoned that conditions at Phinda were ideal for
considerable impact on herbivore populations, particularly as lion and cheetah numbers
increased following introduction. In order to investigate the possible role of predation on
ungulates at Phinda, in conjunction with daily monitoring of reintroduced lions and
cheetahs, I made seasonal estimates of the numbers and population characteristics of prey
species available to them for the duration of the study. My aim was to document any impact
on prey populations over time in a small enclosed area where ungulates had no refuge from
predation.
METHODS.
As Phinda is traversed by an extensive network of roads and has considerable areas
of dense vegetation which do not permit accurate aerial counts, I sampled herbivores based
on a road strip sampling technique similar to that used by Hirst (1969, 1975). I drove two
separate transect routes totalling 64km which passed through all vegetation types present on
Phinda. The same two routes were used for the entire study. I counted herbivores on a
seasonal basis. For each season, I drove each route three times over a 6-8 day period (i.e:
six counts), alternating the direction driven on consecutive counts. All counts were made in
the early morning usually between 06:00-10:00 on clear, still days. Vehicle speed was

136
maintained at 10-15km/h by running the vehicle in low-range 4 wheel drive in which it
essentially ‘drives itself’ at a constant speed in first gear.
I counted eight species of ungulates which I anticipated would be likely prey for
reintroduced felids and which were visible enough to census. These species were giraffe,
impala, kudu, nyala, reedbuck, warthog, wildebeest and zebra. As it transpired, these
species constituted eight of the 10 most important prey species (as percentage of kills and
biomass consumed) for lions and cheetahs (Chapter 6). I initially attempted to also count red
duiker and common duiker (the other two species of the 10 most frequently preyed upon
species) as well as suni and steenbok. However, due to their secretive habits and difficulty
of viewing, I saw them rarely during counts and did not gather enough data to give reliable
population estimates.
I calculated the mean visible distance of each species in each habitat type by use of
range-finder binoculars to determine the width of the effective strip. Within each habitat
type I recorded the distance from the road ungulates disappeared from view and averaged
them to give the mean visibility limit for each species, yielding a specific strip width for
each habitat type. I only counted ungulates on the driver’s side of the road as visibility was
not consistent for both sides of the vehicle and furthermore, vegetation types frequently
differed markedly on opposite sides of the road due largely to human activity such as bush
clearing and former cultivated land. Density of each species in each habitat was calculated
according to the following formula:
Density = number animals counted . distance driven in each habitat type x effective strip width
As used here, where mean visibility limit determines strip width, this methodology
is considered to yield reasonably accurate estimates for African ungulate populations in
variable woodland habitat (Eberhardt, 1968; Hirst, 1969; Caughley, 1977). The eight
ungulate species observed from the road were counted and classified by age (juvenile, sub-
adult and adult) and sex. Juveniles were not sexed and it was generally not possible to
accurately sex subadult zebras and warthogs, though I recorded it where it was obvious. To
estimate the total population of each prey species at Phinda, I multiplied the calculated mean
density (i.e. from the six counts) of each species in each habitat type by the total area
covered by each habitat. I calculated the coverage of each habitat type using ArcView GIS
software on the digitised vegetation map I derived in Chapter 2 (Figure 5). Total numbers
of animals for each habitat type were tallied to give total population estimates for Phinda.
137
I have excluded from the analyses counts from Winter 1992 when I first arrived at
Phinda. I was inexperienced in the counting method and spotting game. Furthermore,
having accustomed myself to the entire reserve, I modified the route by Spring 1992 to
ensure the census included all habitat types. Using data from Spring 1992 to Winter 1995, I
compared seasonal fluctuations in ungulate numbers using a one-way ANOVA for each
species to assess if differences were significant across seasons.
To compare the impact of predation, one would ideally compare rates of predation
with ungulate population fluctuations. However, as I mostly relied on opportunistic
recovery of kill data (Chapter 6), my estimations of predation rates are biased towards large
species, adult animals rather than juveniles, and animals which were more likely to be
victims of predation in open habitats where I could travel. Accordingly, I used the growth
in lion and cheetah numbers as an index of predation pressure on herbivore populations. To
examine the relationship between lion and cheetah numbers, and ungulate numbers, I used
the seasonal mean number of lions and cheetahs in terms of Female Equivalent Units as
described in Chapter 6 (see Figure 52). I then analysed the ungulate population data using
single and multiple regression analyses where the independent variables were lion and
cheetah numbers and the dependent variables were population estimates of each of the eight
ungulate species. To avoid spurious correlations, I excluded giraffes, warthogs, wildebeests
and zebras from the regression with cheetah numbers: these species each comprised less
than 5% of cheetah kills and were too numerous for cheetah predation to have any impact
on their numbers. I also included seasonal rainfall data as an independent variable in the
regression analysis, testing for both current and previous season’s rainfall.
RESULTS
Table 32 and Figures 44 to 51 show the results of herbivore counts for each species.
The road strip method using mean visibility limits for counting ungulates generally appeared
to provide reasonable population estimates of each species, though as Hirst (1969) has
indicated, results tend to be subject to high variation. Replicate counts diminish this
problem to some extent and confidence intervals for the mean population estimate of each
species for the entire study period were generally between 6-15% (Table 32). For southern
reedbuck, this figure was 27%, probably due to this species’ shyness and low numbers in
Phinda meaning they were frequently not sighted during counts. A greater number of
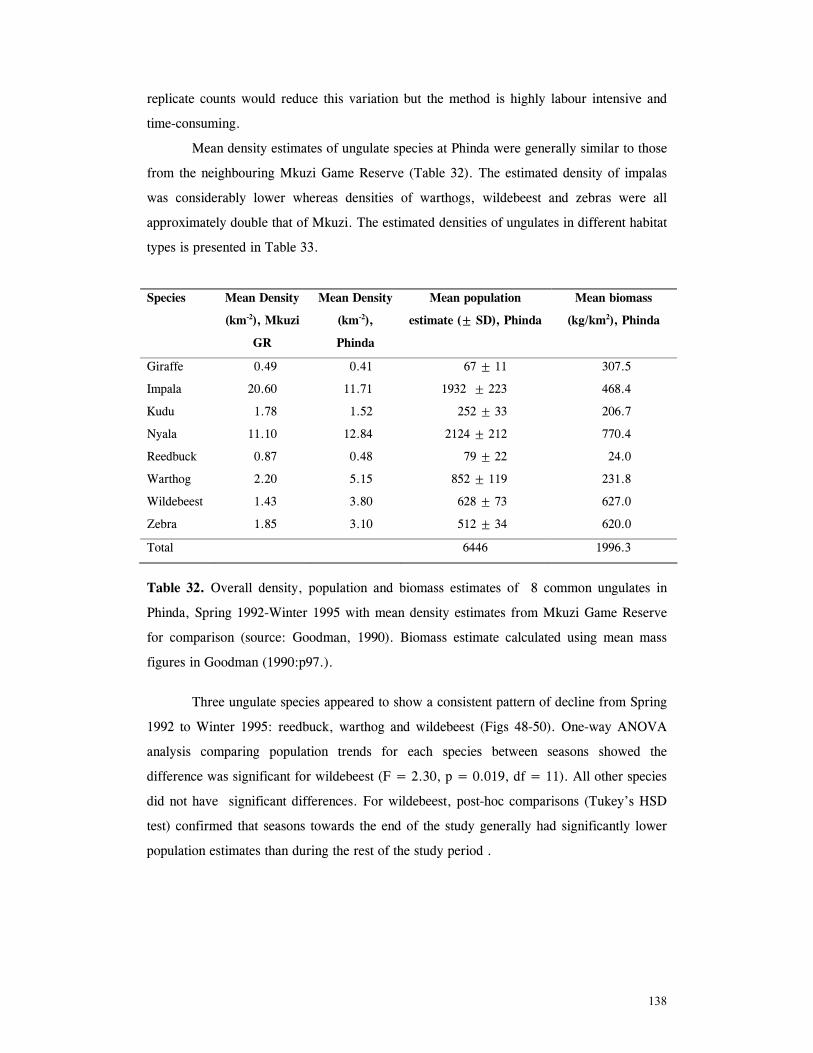
138
replicate counts would reduce this variation but the method is highly labour intensive and
time-consuming.
Mean density estimates of ungulate species at Phinda were generally similar to those
from the neighbouring Mkuzi Game Reserve (Table 32). The estimated density of impalas
was considerably lower whereas densities of warthogs, wildebeest and zebras were all
approximately double that of Mkuzi. The estimated densities of ungulates in different habitat
types is presented in Table 33.
Species Mean Density
(km-2), Mkuzi
GR
Mean Density
(km-2),
Phinda
Mean population
estimate (± SD), Phinda
Mean biomass
(kg/km2), Phinda
Giraffe 0.49 0.41 67 ± 11 307.5
Impala 20.60 11.71 1932 ± 223 468.4
Kudu 1.78 1.52 252 ± 33 206.7
Nyala 11.10 12.84 2124 ± 212 770.4
Reedbuck 0.87 0.48 79 ± 22 24.0
Warthog 2.20 5.15 852 ± 119 231.8
Wildebeest 1.43 3.80 628 ± 73 627.0
Zebra 1.85 3.10 512 ± 34 620.0
Total 6446 1996.3
Table 32. Overall density, population and biomass estimates of 8 common ungulates in
Phinda, Spring 1992-Winter 1995 with mean density estimates from Mkuzi Game Reserve
for comparison (source: Goodman, 1990). Biomass estimate calculated using mean mass
figures in Goodman (1990:p97.).
Three ungulate species appeared to show a consistent pattern of decline from Spring
1992 to Winter 1995: reedbuck, warthog and wildebeest (Figs 48-50). One-way ANOVA
analysis comparing population trends for each species between seasons showed the
difference was significant for wildebeest (F = 2.30, p = 0.019, df = 11). All other species
did not have significant differences. For wildebeest, post-hoc comparisons (Tukey’s HSD
test) confirmed that seasons towards the end of the study generally had significantly lower
population estimates than during the rest of the study period .
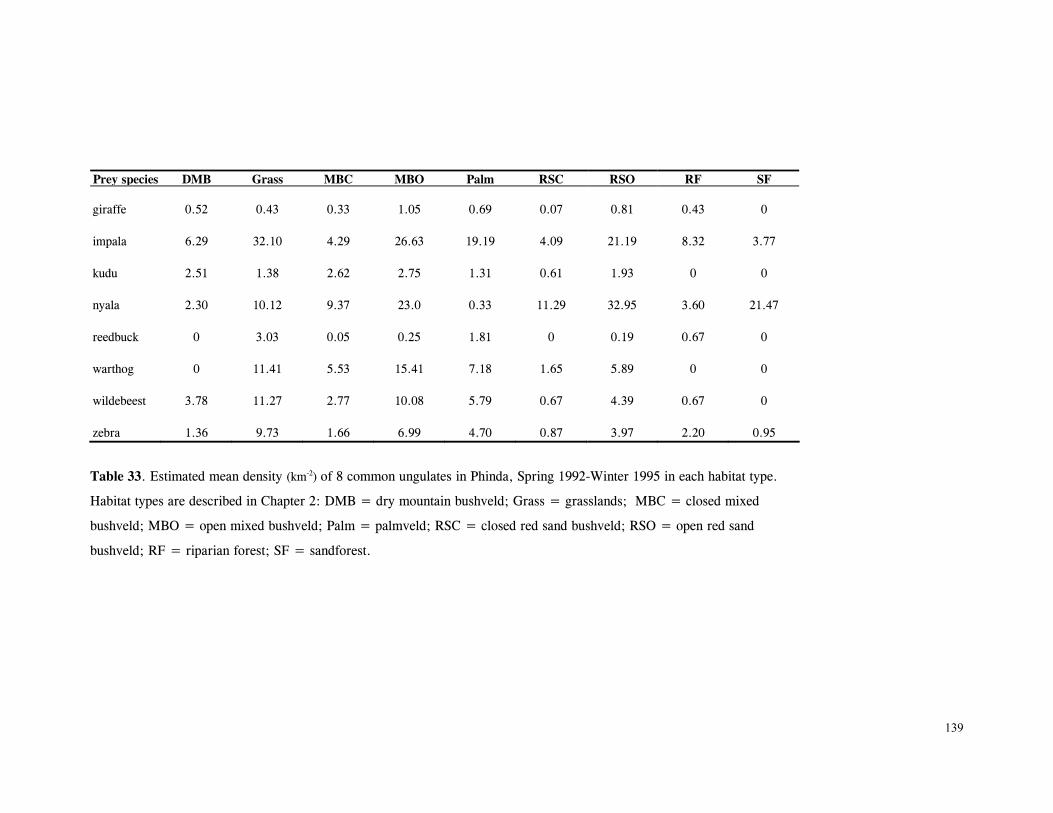
139
Prey species DMB Grass MBC MBO Palm RSC RSO RF SF giraffe 0.52 0.43 0.33 1.05 0.69 0.07 0.81 0.43 0 impala 6.29 32.10 4.29 26.63 19.19 4.09 21.19 8.32 3.77 kudu 2.51 1.38 2.62 2.75 1.31 0.61 1.93 0 0 nyala 2.30 10.12 9.37 23.0 0.33 11.29 32.95 3.60 21.47 reedbuck 0 3.03 0.05 0.25 1.81 0 0.19 0.67 0 warthog 0 11.41 5.53 15.41 7.18 1.65 5.89 0 0 wildebeest 3.78 11.27 2.77 10.08 5.79 0.67 4.39 0.67 0 zebra 1.36 9.73 1.66 6.99 4.70 0.87 3.97 2.20 0.95
Table 33. Estimated mean density (km-2) of 8 common ungulates in Phinda, Spring 1992-Winter 1995 in each habitat type.
Habitat types are described in Chapter 2: DMB = dry mountain bushveld; Grass = grasslands; MBC = closed mixed
bushveld; MBO = open mixed bushveld; Palm = palmveld; RSC = closed red sand bushveld; RSO = open red sand
bushveld; RF = riparian forest; SF = sandforest.

140
Mean+SDMean-SDMean
SEASON
Pop
ulat
ion
estim
ate
0
20
40
60
80
100
120
140
SP92 SU92 AU93 WI93 SP93 SU93 AU94 WI94 SP94 SU94 AU95 WI95
45
55
65
75
85
95
sp92 au93 sp93 au94 sp94 au95
Figure 44. Seasonal population estimates for giraffe, Phinda, Spring 1992 - Winter 1995. Error bars depict standard deviation. Inset graph depicts population fluctuation for mean values only.
Mean+SDMean-SDMean
SEASON
Pop
ulat
ion
estim
ate
0
500
1000
1500
2000
2500
3000
3500
SP92 SU92 AU93 WI93 SP93 SU93 AU94 WI94 SP94 SU94 AU95 WI95
1400
1700
2000
2300
sp92 au93 sp93 au94 sp94 au95
Figure 45. Seasonal population estimates for impala, Phinda, Spring 1992 - Winter 1995. All details as for Fig. 44.
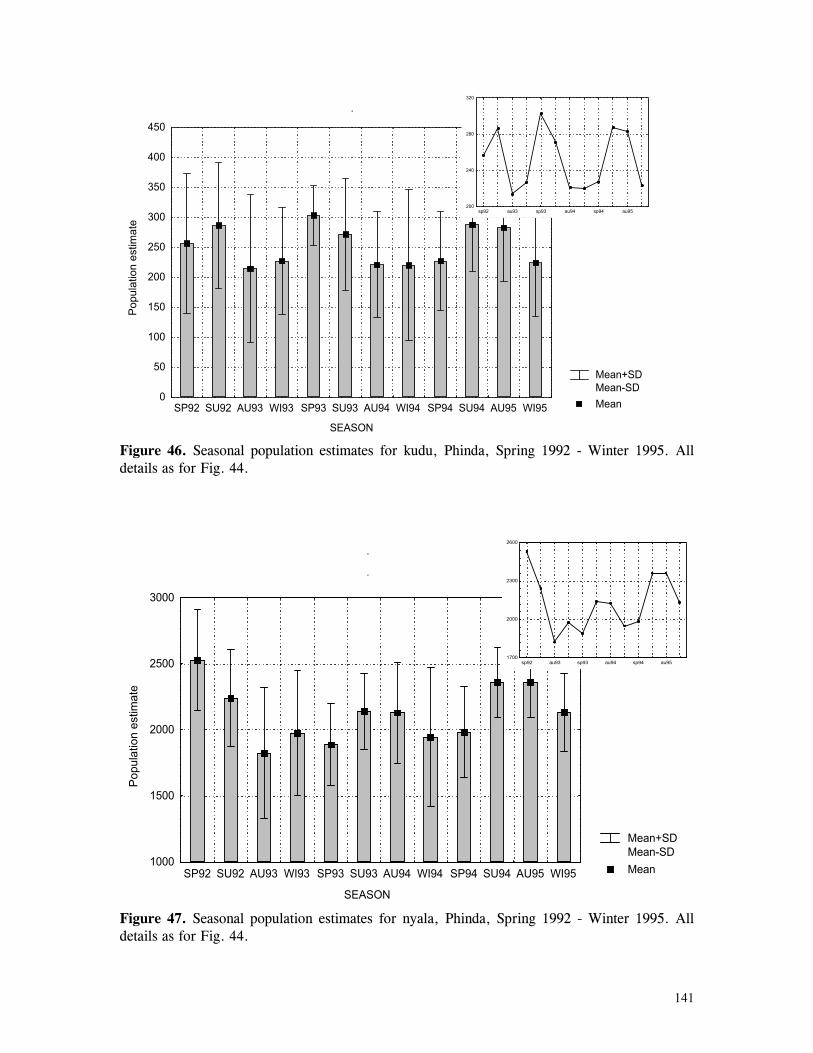
141
Mean+SDMean-SDMean
.
SEASON
Pop
ulat
ion
estim
ate
0
50
100
150
200
250
300
350
400
450
SP92 SU92 AU93 WI93 SP93 SU93 AU94 WI94 SP94 SU94 AU95 WI95
200
240
280
320
sp92 au93 sp93 au94 sp94 au95
Figure 46. Seasonal population estimates for kudu, Phinda, Spring 1992 - Winter 1995. All details as for Fig. 44.
Mean+SDMean-SDMean
.
.
SEASON
Pop
ulat
ion
estim
ate
1000
1500
2000
2500
3000
SP92 SU92 AU93 WI93 SP93 SU93 AU94 WI94 SP94 SU94 AU95 WI95
1700
2000
2300
2600
sp92 au93 sp93 au94 sp94 au95
Figure 47. Seasonal population estimates for nyala, Phinda, Spring 1992 - Winter 1995. All details as for Fig. 44.
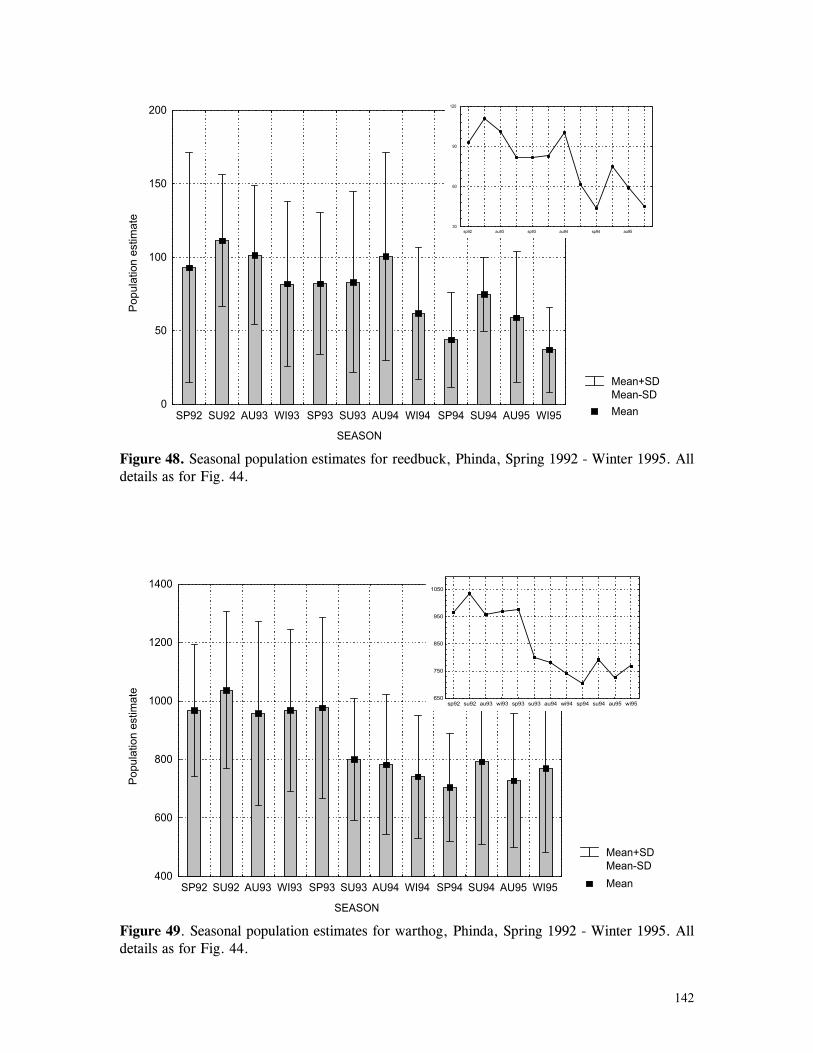
142
Mean+SDMean-SDMean
SEASON
Pop
ulat
ion
estim
ate
0
50
100
150
200
SP92 SU92 AU93 WI93 SP93 SU93 AU94 WI94 SP94 SU94 AU95 WI95
30
60
90
120
sp92 au93 sp93 au94 sp94 au95
Figure 48. Seasonal population estimates for reedbuck, Phinda, Spring 1992 - Winter 1995. All details as for Fig. 44.
Mean+SDMean-SDMean
SEASON
Pop
ulat
ion
estim
ate
400
600
800
1000
1200
1400
SP92 SU92 AU93 WI93 SP93 SU93 AU94 WI94 SP94 SU94 AU95 WI95
650
750
850
950
1050
sp92 su92 au93 wi93 sp93 su93 au94 wi94 sp94 su94 au95 wi95
Figure 49. Seasonal population estimates for warthog, Phinda, Spring 1992 - Winter 1995. All details as for Fig. 44.
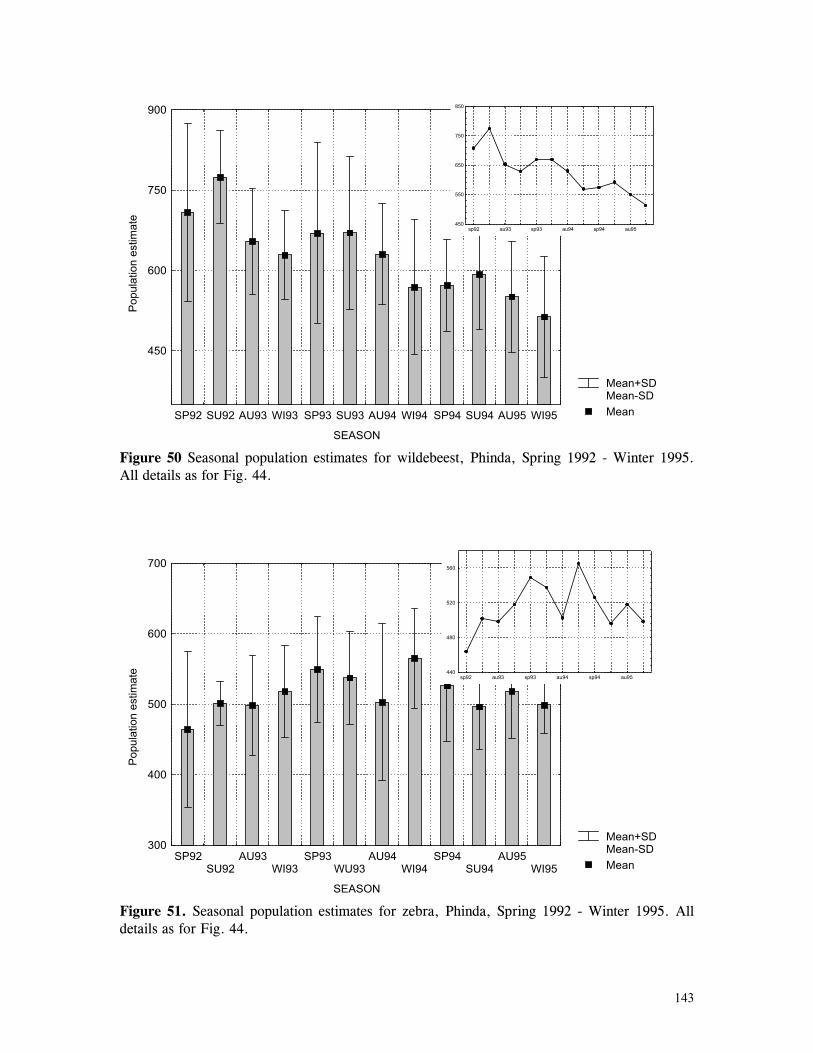
143
Mean+SDMean-SDMean
SEASON
Pop
ulat
ion
estim
ate
450
600
750
900
SP92 SU92 AU93 WI93 SP93 SU93 AU94 WI94 SP94 SU94 AU95 WI95
450
550
650
750
850
sp92 au93 sp93 au94 sp94 au95
Figure 50 Seasonal population estimates for wildebeest, Phinda, Spring 1992 - Winter 1995. All details as for Fig. 44.
Mean+SDMean-SDMean
SEASON
Pop
ulat
ion
estim
ate
300
400
500
600
700
SP92SU92
AU93WI93
SP93WU93
AU94WI94
SP94SU94
AU95WI95
440
480
520
560
sp92 au93 sp93 au94 sp94 au95
Figure 51. Seasonal population estimates for zebra, Phinda, Spring 1992 - Winter 1995. All details as for Fig. 44.

144
LIONCHEETAH
SEASON
Lion
and
che
etah
num
bers
(FE
Qs)
4
6
8
10
12
14
16
18
20
22
sp92 su92 au93 wi93 sp93 su93 au94 wi94 sp94 su94 au95 wi95
Figure 52. Seasonal lion and cheetah numbers at Phinda, expressed as FEQs.
Tables 34 and 35 show the results of regression analyses comparing seasonal ungulate
numbers with numbers of lions and cheetahs (Fig. 52), and with seasonal rainfall.
Lion Cheetah
Giraffe F = 0.05, p = 0.83, r2 = 0.005 -
Impala F = 0.008 p = 0.93, r2 = 0.0008 F = 2.80, p = 0.13 r2 = 0.22
Kudu F = 0.43 p = 0.53, r2 = 0.041 F = 0.002, p = 0.95, r2 = 0.0003
Nyala F = 1.58, p = 0.83, r2 = 0.14 F = 0.30, p = 0.59, r2 = 0.03
Reedbuck F = 2.12, p = 0.18, r2 = 0.18 F = 16.54, p = 0.002, r2 = 0.62
Warthog F = 2.95, p = 0.11, r2 = 0.22 -
Wildebeest F = 7.36, p = 0.02 r2 = 0.42 -
Zebra F = 1.47, p = 0.25, r2 = 0.12 -
Table 34. Results of regression analyses comparing seasonal numbers of predators and prey. F
is one-way ANOVA result (df = 11), followed by r2 result. Dashes indicate ungulate species
excluded from the analysis to avoid false correlations (see Methods). Significant results (at p<
0.05) indicated in boldtype.

145
Fluctuations in ungulate numbers did not appear to be related to rainfall, either that of
the current season or of the previous season. Seasonal breeders such as wildebeest and impala
which have a flush of births during November to January (Vincent, 1972; Attwell, 1977) were
slightly more sensitive to rainfall of the previous season than aseasonal breeders, as may be
expected: however correlations were still very low (Table 35).
Conversely, increasing populations of predators were negatively correlated to
population fluctuations of two ungulate species. Cheetah population increase was significantly
related to population decline of reedbuck and an increase in lion numbers was negatively
correlated to wildebeest population decline.
Current season’s rainfall Previous season’s rainfall
Giraffe NS, r2 = 0.004 NS, r2 = 0.008
Impala NS, r2 = 0.017 NS, r2 = 0.05
Kudu NS, r2 = 0.26 NS, r2 = 0.088
Nyala NS, r2 = 0.0002 NS, r2 = 0.016
Reedbuck NS, r2 = 0.003 NS, r2 = 0.001
Warthog NS, r2 = 0.0001 NS, r2 = 0.025
Wildebeest NS, r2 = 0.064 NS, r2 = 0.14
Zebra NS, r2 = 0.032 NS, r2 = 0.001
Table 35: Results of regression analysis comparing seasonal numbers of ungulate species and
current and previous season’s rainfall. NS indicates non-significant at p = 0.05, df = 11.
Figures 53-58 show seasonal changes in the ratio of common prey species killed by
lions and cheetahs. The strongest evidence of a pattern of prey switching was for lions which
reduced predation on wildebeest and nyalas and increased predation on warthogs following
Spring 1993 (Fig. 56). Cheetahs maintained high levels of predation on nyalas and impalas but
drops in predation on impalas were associated with peaks in nyala predation, and vice-versa.
(Fig. 53).
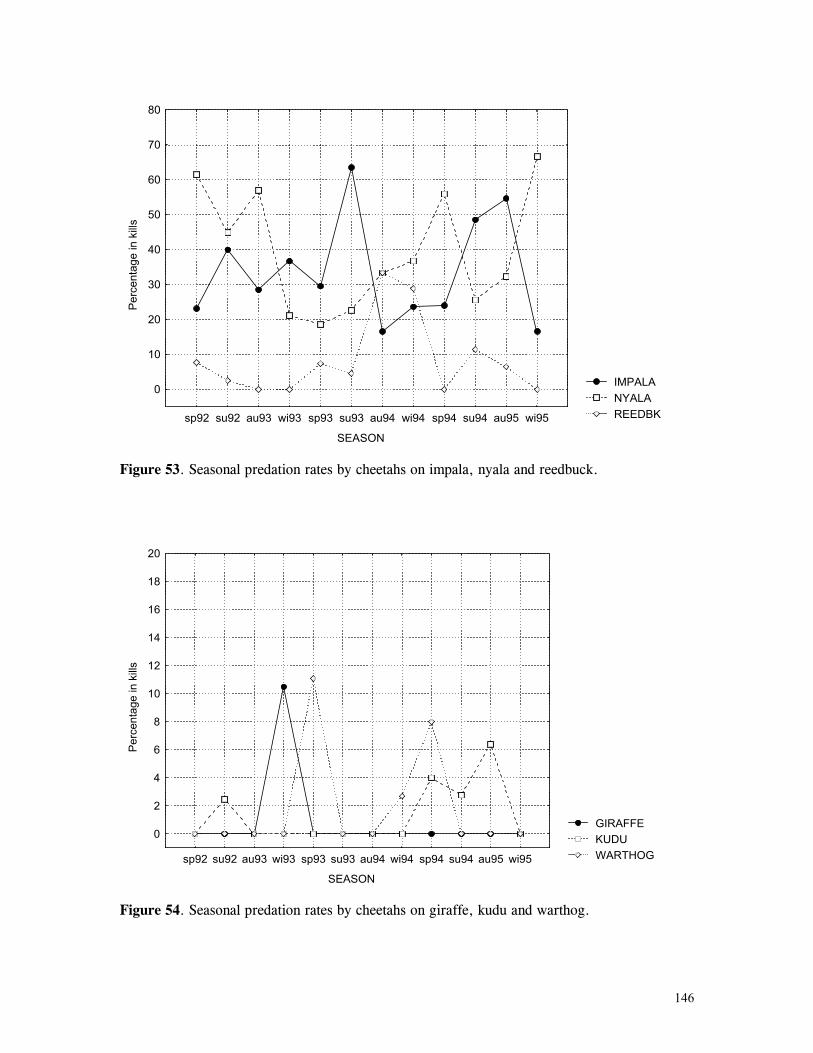
146
IMPALANYALAREEDBK
SEASON
Per
cent
age
in k
ills
0
10
20
30
40
50
60
70
80
sp92 su92 au93 wi93 sp93 su93 au94 wi94 sp94 su94 au95 wi95
Figure 53. Seasonal predation rates by cheetahs on impala, nyala and reedbuck.
GIRAFFEKUDUWARTHOG
SEASON
Per
cent
age
in k
ills
0
2
4
6
8
10
12
14
16
18
20
sp92 su92 au93 wi93 sp93 su93 au94 wi94 sp94 su94 au95 wi95
Figure 54. Seasonal predation rates by cheetahs on giraffe, kudu and warthog.
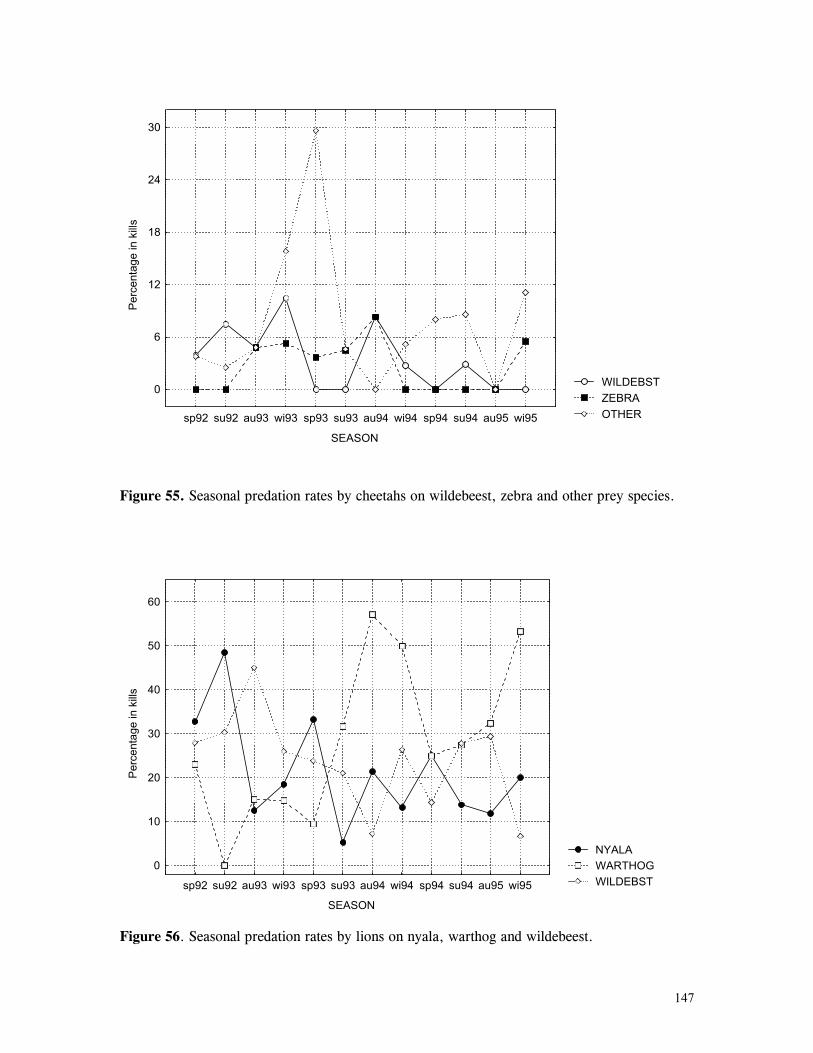
147
WILDEBSTZEBRAOTHER
SEASON
Per
cent
age
in k
ills
0
6
12
18
24
30
sp92 su92 au93 wi93 sp93 su93 au94 wi94 sp94 su94 au95 wi95
Figure 55. Seasonal predation rates by cheetahs on wildebeest, zebra and other prey species.
NYALAWARTHOGWILDEBST
SEASON
Per
cent
age
in k
ills
0
10
20
30
40
50
60
sp92 su92 au93 wi93 sp93 su93 au94 wi94 sp94 su94 au95 wi95
Figure 56. Seasonal predation rates by lions on nyala, warthog and wildebeest.

148
IMPALAZEBRAOTHER
SEASON
Per
cent
age
in k
ills
0
5
10
15
20
25
30
35
sp92 su92 au93 wi93 sp93 su93 au94 wi94 sp94 su94 au95 wi95
Figure 57. Seasonal predation rates by lions on impala, zebra and other prey species.
GIRAFFEKUDUREEDBK
SEASON
Per
cent
age
in k
ills
0
4
8
12
16
sp92 su92 au93 wi93 sp93 su93 au94 wi94 sp94 su94 au95 wi95
Figure 58. Seasonal predation rates by lions on giraffe, kudu and reedbuck.
149
DISCUSSION
Predation by reintroduced lions and cheetahs may have resulted in the decline of
populations of two ungulate species at Phinda, namely by lions on wildebeest and by cheetahs
on reedbuck. Lions killed wildebeest at almost three times their relative abundance in Phinda
and cheetahs killed reedbuck at almost eight times their availability, exposing them to high
levels of predation pressure (Chapter 6). In addition, warthogs underwent a slight population
decline which, although statistically insignificant, may have been related to lion predation.
Lions killed warthogs at more than twice their availability and the decline in their numbers was
associated with a marked increase in their frequency in lion kills following Spring 1993.
Cheetahs and lions killed most other prey species at approximately their relative abundance.
For example, zebras, which have very similar ecological requirements to wildebeest (Gwynne
& Bell, 1968; Maddock, 1979), and occurred in similar numbers to wildebeest (Table 32),
constituted 8.0% of available herbivores and 8.9% of lion kills at Phinda (Chapter 6). In
contrast to wildebeest, zebra population estimates did not alter significantly over the study
period and if anything, showed a slight increase (Fig. 51).
This corresponds to observations from other areas where lions appear to kill wildebeest
more frequently than zebras when relative availability is considered. As a result, resident
wildebeest herds are vulnerable to more extreme population effects from predation. In the
Timbavati, Hirst (1969) found that lion predation appeared to limit population growth of
wildebeest and not of zebras apparently as a result of far greater predation rates on wildebeest.
Similarly, Mills & Shenk (1992) developed models based on lion-wildebeest/zebra interactions
in the south-eastern region of the Kruger Park which demonstrated that lion predation affected
wildebeest more severely then zebras, despite zebras being more abundant in the area. In this
case, the sedentary nature of the wildebeest population increased their vulnerability to predation
and the semi-migratory behaviour of the zebras reduced predation.
Could predation on wildebeest and reedbuck at Phinda have resulted in the observed
declines in their populations? For this to occur, a number of factors need to be operating.
Mortality in the prey population must be greater than the net recruitment. This can occur when
there is no refuge from predation for prey, predators have an alternative source of prey to
maintain numbers when the primary prey reach low numbers and predators do not exhibit prey
switching (Caughley & Sinclair, 1992).

150
At Phinda, the first two conditions were clearly operating. Herbivores experienced
year-round predation where they were unable to migrate to predation free (or reduced) refuges.
Secondly, wildebeest and reedbuck were preferred prey by lions and cheetahs respectively, but
alternative species such as nyalas and impalas were very numerous (and killed at approximately
their availability), so lions and cheetahs had an alternative food resource on which they could
easily maintain their populations. In the case of cheetahs, impalas and nyalas were more
important than reedbuck as prey species, and predation levels on these two species showed
some evidence of being negatively associated. Reedbuck were not the primary prey in terms of
numbers killed and hence the role of prey switching in reducing the impact of predation was not
strictly relevant here. On the other hand, lions appeared to reduce predation levels on
wildebeest and ‘compensate’ with increased predation on warthogs during the course of the
study. That wildebeest numbers continued to decline despite slightly reduced predation levels
may reflect the presence of more lions as their population grew: although wildebeest decreased
in terms of their frequency in lions’ diet, the numbers killed remained relatively consistent
(Chapter 6).
Accordingly, conditions at Phinda existed for considerable impact by predation on
herbivore populations. However, establishing actual recruitment from the juvenile component
of the population may be confounded by my observations on neonate survival, particularly for
reedbuck. I do not have good data on survival of reedbuck lambs which were difficult to
census. Although reedbuck in the region display a weak birth peak in the summer, lambs may
be born at any time of the year (Jungius, 1970) so there is no conspicuous flush of young which
would enable a reasonable estimation of annual lamb survival from the seasonal censuses I
conducted. In addition, lambs are hidden by the females in long grass away from the herd for
up to four months (Jungius, 1970; Howard, 1986) and as a result, were difficult to see and
assign an age during counts. Conversely, wildebeest have a flush of births from November to
March and calves accompany their mothers from birth (Attwell, 1977), which allowed me to
make accurate estimates of the percentage of the juvenile cohort surviving from the previous
season. Juvenile wildebeest constituted a mean of 23.2% of the population in summer but only
4.5% by the following spring. Finding kills or remains of juvenile ungulates is rare, so I am
unable to say with certainty that predation on juvenile wildebeest accounted entirely for the
decline. Other factors such as accidents, weakness at birth and abandonment (Page, 1985;
Adams et al, 1988; Linnell, et al 1995) probably accounted for some losses. However, Linnell
and co-workers (1995) demonstrated that predation was the single greatest cause of death for
151
juvenile ungulates in a review of 98 studies of ungulate mortality, and was also probably the
major cause of death for ungulates at Phinda (see below). Furthermore, all juvenile wildebeest
on which I observed lions and cheetahs feeding (n = 26: Chapter 6), they had killed rather than
scavenged or obtained by other means, though two of those were lone calves which appeared to
have lost their herd. Although mean adult wildebeest mortality by predation was only 4.8% of
the population per year (Chapter 6), this alone exceeds recruitment from the juvenile
component. Moreover, predation during the sub-adult period removes additional individuals
before they reproduce. Accordingly, all the evidence suggests predation was a compelling
factor in the decline of wildebeest at Phinda.
Having said this, other factors may have contributed to herbivore population
fluctuations and need to be considered. I do not have good data on other sources of mortality in
ungulates during the study period. However, the low numbers of dead ungulates which lions
scavenged (n = 24 excluding carcasses appropriated from other carnivores: 7.5% of all
carcasses of known origin, Chapter 6) is illustrative that large scale mortality from other causes
did not seem to be occurring. In addition to the 24 animals which lions found dead, I found
dead ungulates only on a further 21 occasions, 10 of which were deaths by snaring. Deaths by
snaring other than those I recorded were not noted during the study period so I have no estimate
how important this was as a source of mortality to ungulates. However, for 1996 and 1997,
when such records were kept, a total of only four and five ungulates were killed in snares
respectively: two of these mortalities were wildebeest, none were reedbucks1. Although I
believe snaring was more severe in 1992-1993 (see Chapter 5), it appears not to have been a
major source of mortality to wildebeest and reedbucks at Phinda.
Of the other 11 dead ungulates I found, three animals died from being caught in the
boundary fence and two were trapped in deep mud at the edge of pans. The other deaths were
for reasons I could not identify, though they may have been from starvation. Large scale
mortality due to food shortages during dry seasons has been shown to regulate numerous
ungulate populations by decreasing survival of both calves and adults (Sinclair, 1979;
Maddock, 1979). Rainfall is the single most important variable affecting availability of food
and, therefore, starvation-related mortality of ungulates in the dry season (Sinclair, 1979). Dry
season rainfall (April to September) for 1992 was only 29.5mm compared to a mean of 131.8
± 99.8mm for a 10 year period 1988-1997, and annual rainfall in 1992 was the lowest for any
1 Lewis, A. Phinda Resource Reserve, Private Bag 6001, Hluhluwe, 3960, RSA. Tel. 035 562 0271
152
year of this period (South African Weather Bureau, Pretoria). However, all other dry seasons
of the same period experienced rainfall within one standard deviation or greater than the mean
so if drought contributed to ungulate mortality, it was probably only during 1992. Furthermore,
Phinda management employs a rotational fire regime to stimulate new growth of grasses and
artificially maintains water points so that seasonal shortages of food and water which lead to
mortality of resident ungulates elsewhere (Maddock, 1979) are less extreme. All these factors
suggest that food shortage was not a major cause of mortality for ungulates during the study and
that most ungulates at Phinda died by predation.
Quality of food resources may have been a factor in ungulate population declines. In
Tanzania’s Ngorongoro Crater, resident wildebeest and other ruminant grazers declined in
numbers over a 30 year period in response to diminished quality of food resources (Runyoro et
al, 1994). Two wildebeest and one zebra carcase (all adults) I examined during the dry season
of 1992 had full stomachs, though only of mature grasses which may not supply enough
nutrients to maintain digestion (McNaughton, 1985). I did not attempt to assess the quality of
available forage for herbivores during my study so I cannot eliminate this as a possible factor.
However, given that there was little evidence of large-scale starvation, if forage quality was
contributing to wildebeest mortality, it was probably as a secondary factor to the role played by
predation. Unlike non-ruminants such as zebras which are able to tolerate large quantities of
mature fibrous grasses, wildebeest require high quality grasses to satisfy their nutritional
requirements (Demment & van Soest 1985). It is possible that wildebeest were struggling to
meet their nutritional requirements and were in poor condition. This may also apply to
warthogs which, like wildebeest, prefer short, young grass, though they are able to supplement
their diet during the dry season by digging for grass rhizomes (Mason, 1982). If wildebeest and
warthogs were in poor condition as a result of low forage quality, large scale starvation need
not have been occurring for this to have effects at the population level. For example, poor
nutrition can diminish lactation in ungulate females and lower the condition of juveniles,
making them more vulnerable to predation (McNaughton, 1985; Linnell et al, 1995). The
combination of high predation pressure on animals in poor condition might have been
responsible for the population declines observed here. However, as I made no estimation of the
condition of prey animals during my study, this remains speculative. The interaction between
predation and the availability of resources for herbivores would be a fruitful area to examine in
small, enclosed reserves. This is particularly pertinent in a ‘reclaimed’ conservation area such
as Phinda where historical disturbance by cultivation and high livestock density may have

153
considerable impact in altering the structure of grass communities (Moll, 1982; Goodman,
1990, Runyoro et al, 1994).
It is possible that wildebeest, warthog and reedbuck numbers were declining in
response to adjusted carrying capacity. Ben-Shahar (1993) demonstrated that wildebeest and
zebra populations in the 540km2 Sabi-Sand Wildtuin underwent a gradual decline over 25 years
following fencing, possibly as populations adjusted to confinement in an area of lower carrying
capacity. At Phinda, densities of three species (warthog, wildebeest and zebra) were high
compared to neighbouring Mkuzi Reserve (Table 32) and for the latter two species, had
recently been supplemented by translocations between 1990-1991 (Chapter 2). The decline of
wildebeest at Phinda may have been an adjustment following supplementation if carrying
capacity was reduced. However, wildebeest were historically far more abundant in the region,
estimated at a density of 10.3 km-2 in Mkuzi in 1963 (Goodman 1990:108) and up until 1984,
had been subject to a culling program which aimed to stabilise their population at a density of
3.5 km-2 which the region could evidently support with ease (Goodman 1990:108).
Furthermore, Phinda’s translocated wildebeest originated from much smaller fenced areas
(<50km2) lacking large predators, where their estimated density was higher than at Phinda, yet
these populations were apparently growing and had sustained annual harvesting by humans (live
sales and hunting) of between 5 and 15% since at least the mid-1980s (Carlisle, pers comm2).
Accordingly, it seems unlikely that the decline in wildebeest numbers was a result of the
supplementary translocations and fencing. Interestingly, wildebeest numbers are apparently still
declining at Phinda and at the end of 1997 numbered an estimated 350 (Lewis, pers comm3).
This has important implications for small reserves with resident populations of
herbivores. As many reserves in South Africa and indeed all areas reintroducing large
predators, Phinda is entirely fenced. As a result, herbivores are limited in their ability to
migrate away from areas of high predation pressure. Where such reserves are small as at
Phinda, predators can conceivably follow preferred prey throughout the entire reserve and high
rates of predation such as occurred here with wildebeest and reedbuck can be maintained.
Where conditions exist that predators can sustain their numbers on alternative, abundant prey
species, species at low densities which experience high predation pressure may undergo a
population decline. It remains to be seen whether such a scenario will lead to the extinction of a
2 Carlisle, L, Phinda Resource Reserve, Private Bag 6001, Hluhluwe, 3960, RSA. Tel. 035 562 0271 3Lewis, A. Phinda Resource Reserve, Private Bag 6001, Hluhluwe, 3960, RSA. Tel. 035 562 0271.
154
species in a small reserve, but presumably at the rate of decrease observed during the present
study, wildebeest and reedbuck will decline to a population level from which they are unable to
recover. An attempt to restore eland at Phinda in 1996 failed because only 20 animals were
released. Lion pressure quickly fragmented the herd and the released animals were killed within
six months. In response to such a possibility occurring with wildebeest and reedbuck
populations, Phinda management has taken some radical and financially costly action. Since
1996, 30 lions have been captured at Phinda and translocated to other reserves, and
supplemental translocations of wildebeest were resumed in 1998. It will be interesting to assess
the response of ungulate populations following these activities.
155
CHAPTER 8
VIGILANCE BEHAVIOUR IN UNGULATES IN RESPONSE TO FELID
REINTRODUCTION: THE ROLE OF PREDATION PRESSURE.
(This section published as: Hunter, L.T.B. & J.D. Skinner, 1998. Vigilance behaviour in
African ungulates: the role of predation pressure. Behaviour 135:195-211.)
Vigilance behaviour in ungulates has been attributed to a number of different reasons. It
is widely accepted that one of the principal functions is to increase the probability of predator
detection. However, many ungulates live in social groups where they may need to co-ordinate
their movements with companions and where interactions between individuals are mediated by
complex visual signals (Leuthold, 1977; Prins, 1996). Furthermore, herbivores potentially find
food by eye so the reasons for being alert may be more complex than solely looking for danger.
Nonetheless, most studies on ungulates have assumed the risk of being preyed upon is the
primary influence on vigilance behaviour and have investigated its role in the detection of
predators. Intuitively, this seems reasonable and there is extensive empirical evidence that
predation risk is one of the main reasons animals are alert (see review in Elgar, 1989) and that
less vigilant animals are more vulnerable to predation (Fitzgibbon, 1990b). However, few
studies have been able to directly examine the role of predation pressure where all other factors
are controlled. Comparisons in the field, particularly in large mammals, are complicated by
problems such as the difficulty in quantifying predation levels, ecological differences between
field sites and the logistical difficulties in performing the necessary manipulations to control for
sources of variation.
Berger and Cunningham (1988) compared vigilance in bison where their major predator
the wolf was present and where it was absent. Search times did not differ between the two sites.
However in the wolf-present site, predation pressure varied on a seasonal basis and as the
authors stress, their data was collected during a period when wolf predation was not likely:
hence predation pressure between the two sites at the time of their study probably did not differ.
Scheel (1993) related vigilance to the risk of predation for eight species of African ungulates in
the Serengeti and counter-intuitively, discovered that species experiencing the most predation
pressure from lions exhibited the lowest vigilance. However, these species employed other anti-
predatory behaviours such as active self-defence and the formation of extremely large herds.
Those species which displayed no other anti-predatory behaviours were the most vigilant. The
differences between species in their reliance on vigilance for other reasons was not explored.
156
Underwood (1982) suggested that even when the likelihood of being preyed upon is low,
vigilance in ungulates nonetheless appears to be affected by the possibility of predation. In his
study where the risk of predation was apparently very low, animals in thick cover looked more
than in open habitats, central animals in the herd looked less than their companions and head-up
behaviour was negatively correlated with group size, attributes one would expect in animals
watching for predators. While there is clearly a fundamental link between predation and
vigilance, the degree to which predation pressure versus other factors affects vigilance remains
unclear. Differences in the degree to which vigilance is influenced by the interplay of predation
pressure and other factors may become more apparent in a situation where comparisons can be
made among populations where the level of predation is the only source of variation.
In this chapter, I report on the vigilance response of a naïve prey population to the
introduction of their historical felid predators and compare that to a population where those
predators were absent. I examined vigilance behaviour in impalas and wildebeest following the
re-introduction of lions and cheetahs after at least four decades of absence (Rautenbach et al,
1980). I concurrently monitored vigilance in these ungulates in an adjacent site where cats had
not been released.
I postulated that:
1. The increase in predation pressure as a result of the re-introduction of lions and
cheetahs would be reflected in increased vigilance, and
2. Vigilance should show an increase over time in the months immediately following an
increase in predation pressure (i.e. following the re-introduction of lions and cheetahs).
I also examined the relationship of the following factors to vigilance behaviour where
re-introduced cats were present and where they were absent:
i: group size
ii: location in herd.
iii: presence of juveniles.
Many studies have reported a negative correlation between group size and levels of
individual vigilance, widely attributed to the anti-predatory benefits of living in groups (see
review by Elgar, 1989). Central to this hypothesis is the “many eyes” effect which suggests that
as group size increases in socially foraging animals, there are more eyes watching for predators
which increases the likelihood of their detection. Individuals can, therefore, devote more time to
foraging without increasing their personal risk of being preyed upon (Lima, 1995). If this is the
case, the relationship may be less compelling where predation is not a strong factor. Here I
compare the relationship of group size to vigilance where lions and cheetahs were present and
where they were absent. Position in the group also has an influence on vigilance in socially
157
foraging species. Numerous studies on African ungulates (Underwood, 1982; Prins & Iason,
1989; Bednekoff & Ritter, 1994; Burger & Gochfield, 1994) have demonstrated that animals on
the edge of herds devoted more time to vigilance than individuals in central locations,
presumably because they were more exposed to attack. If predation is non-existent or at very
low levels, one would expect that location in the group becomes less of an influencing factor in
vigilance behaviour. Similarly, mothers with juveniles are generally more alert than females
without young (Burger & Gochfield, 1994), presumably because juveniles are exposed to
greater levels of predation as a result of predator naïveté, reduced ability to escape an attack and
vulnerability to a greater variety of predators due to their small size. If risk of predation is low,
the disparity between mothers’ vigilance and that of females without young should be reduced.
To assess these questions, I compared the effect of position in the herd and the presence of
juveniles on vigilance where re-introduced cats were present and where they were absent.
METHODS.
This study was carried out between August and December, 1992. During that time,
an internal fence divided Phinda into two approximately-equal sized halves and release of
lions and cheetahs was restricted to the northern half of the reserve (refer Fig. 2, Chapter 2).
Leopards, spotted hyaenas and smaller carnivores such as jackals Canis mesomelas and C.
adustas, were present throughout the reserve, though at very low densities as a result of
heavy persecution prior to the establishment of Phinda. I assumed that the presence of re-
introduced cats in one half of the reserve gave rise to an increase in predation pressure and
have termed that condition “high predation pressure”. I refer to “low predation pressure”
where re-introduced cats were absent.
Impala and wildebeest herds were located by and observed from a 4WD vehicle.
Animals at Phinda are continually exposed to vehicles and mostly ignore them. Nonetheless,
in an effort to eliminate any vehicle effect, herds were allowed to ‘settle down’ for a
minimum of 5 min before beginning observations and my vehicle was the only one present
during observations in case a build-up of cars stimulated increased interest from ungulates.
Observations were usually conducted at distances greater than 70m.
Data was recorded within 3h of sunrise or within 3h before sunset, periods in which
predators were typically active and ungulates were alert. In the high predation treatment, all
observations were made in areas known to be used by re-introduced cats (which were radio-
monitored) but at times when they were not closer than 1000m to observed herds.
Observations were restricted to open grassland (maximum grass height 60cm) to eliminate
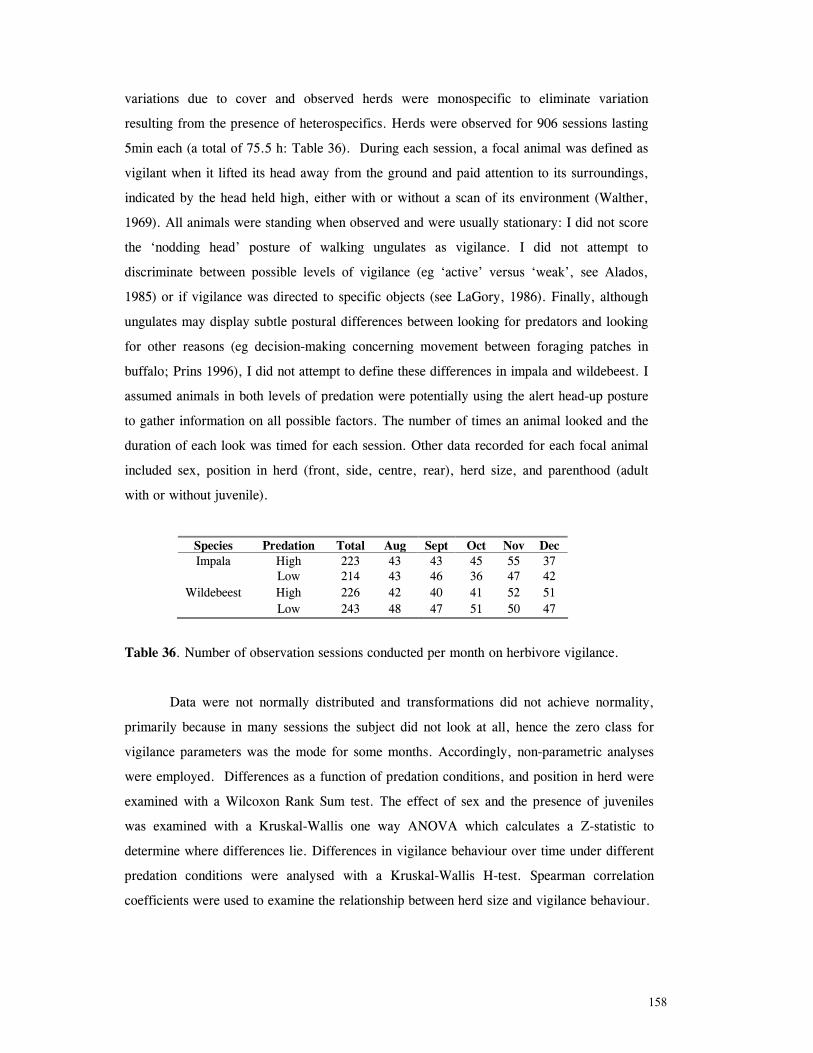
158
variations due to cover and observed herds were monospecific to eliminate variation
resulting from the presence of heterospecifics. Herds were observed for 906 sessions lasting
5min each (a total of 75.5 h: Table 36). During each session, a focal animal was defined as
vigilant when it lifted its head away from the ground and paid attention to its surroundings,
indicated by the head held high, either with or without a scan of its environment (Walther,
1969). All animals were standing when observed and were usually stationary: I did not score
the ‘nodding head’ posture of walking ungulates as vigilance. I did not attempt to
discriminate between possible levels of vigilance (eg ‘active’ versus ‘weak’, see Alados,
1985) or if vigilance was directed to specific objects (see LaGory, 1986). Finally, although
ungulates may display subtle postural differences between looking for predators and looking
for other reasons (eg decision-making concerning movement between foraging patches in
buffalo; Prins 1996), I did not attempt to define these differences in impala and wildebeest. I
assumed animals in both levels of predation were potentially using the alert head-up posture
to gather information on all possible factors. The number of times an animal looked and the
duration of each look was timed for each session. Other data recorded for each focal animal
included sex, position in herd (front, side, centre, rear), herd size, and parenthood (adult
with or without juvenile).
Species Predation Total Aug Sept Oct Nov Dec Impala High 223 43 43 45 55 37
Low 214 43 46 36 47 42 Wildebeest High 226 42 40 41 52 51
Low 243 48 47 51 50 47
Table 36. Number of observation sessions conducted per month on herbivore vigilance.
Data were not normally distributed and transformations did not achieve normality,
primarily because in many sessions the subject did not look at all, hence the zero class for
vigilance parameters was the mode for some months. Accordingly, non-parametric analyses
were employed. Differences as a function of predation conditions, and position in herd were
examined with a Wilcoxon Rank Sum test. The effect of sex and the presence of juveniles
was examined with a Kruskal-Wallis one way ANOVA which calculates a Z-statistic to
determine where differences lie. Differences in vigilance behaviour over time under different
predation conditions were analysed with a Kruskal-Wallis H-test. Spearman correlation
coefficients were used to examine the relationship between herd size and vigilance behaviour.
159
RESULTS.
I examined two aspects of vigilance behaviour: the rate of looking and the proportion
of time spent looking. Most previous studies of mammal vigilance have used only one
measurement, usually the latter as this is the most meaningful when examining the trade-off
between time devoted to watching and foraging (Elgar, 1989). However, this eliminates the
possibility that ungulates employ different search strategies under different predation
conditions: for example, animals exposed to greater predation may look more often but may
“compensate” by reducing the duration of each look. This combination may be not be
apparent if only the proportion of time spent vigilant is examined.
Predation Pressure.
The rate of looking where predation was high was significantly greater than under
low predation for all months of the study period in both impalas and wildebeest (Fig. 59).
For impalas, a significant increase in rate of looking occurred over time under high
predation pressure (H = 38.45, p=0.0000, df =4) and not under low predation pressure (H
= 3.65, p=0.3.65, df =4). Although this pattern was evident in wildebeest (Fig. 59), it was
not significant at p ≤ 0.05 (high predation: H = 8.82, p=0.0657, df =4. Low predation: H
= 1.92, p=0.7501, df =4.)
The proportion of time spent vigilant by both species was also significantly greater
under high predation for all months (Figure 60). For impalas, as in their rate of looking, the
time spent vigilant increased over time under high predation (H = 115.75, p=0.0000, df
=4) and not under low predation (H = 3.68, p=0.4507, df =4). Impalas under high
predation spent a mean of 10.9% of their time vigilant in August which had increased to
22.1% by December, a growth of 203%. In low predation, impalas spent 8.3% of their time
vigilant in August which differed little from the figure for December (8.8%). Wildebeest
displayed a similar pattern, which, in contrast to the result for their rate of looking, was
highly significant (high predation, H = 46.15, p=0.0000, df =4; low predation, H =
3.76, p=0.4389, df =4). August low predation vigilance was 2.1% of their time compared
to 5% for high predation. Proportion of time spent vigilant in December in low predation
was 2.5% compared to 10.1% in high predation.
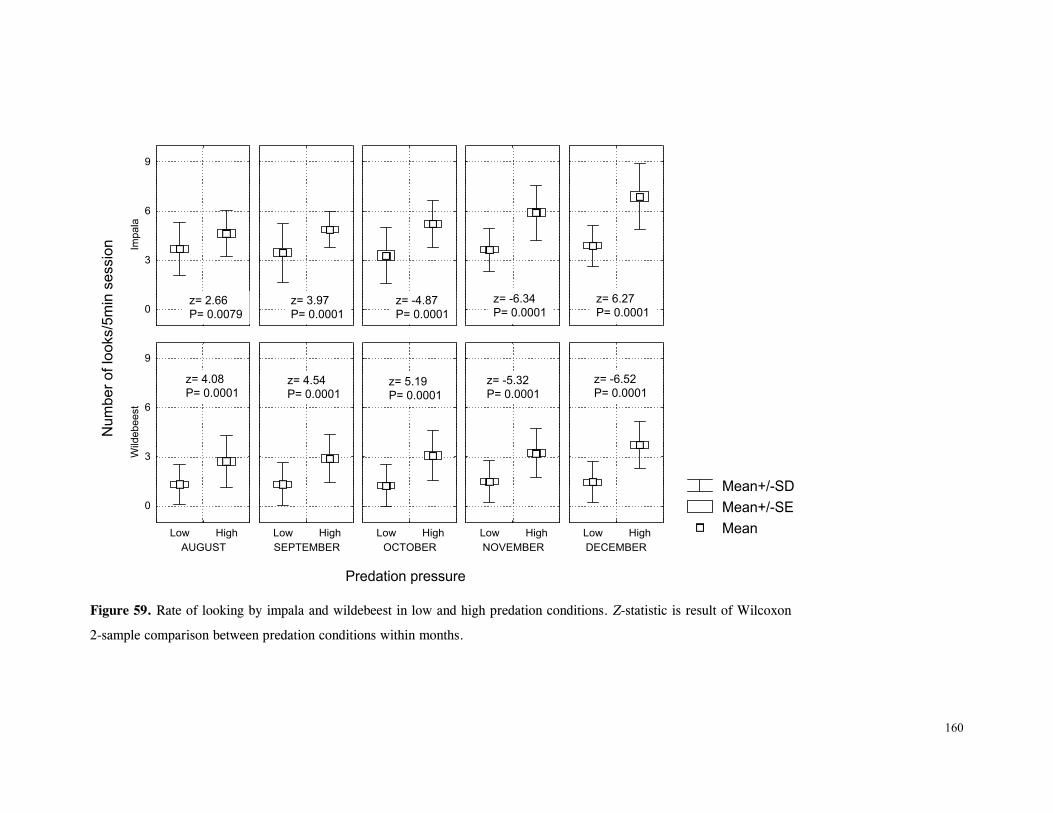
160
Mean+/-SDMean+/-SEMean
Predation pressure
Num
ber o
f loo
ks/5
min
ses
sion Im
pala
0
3
6
9
AUGUST
Wild
ebee
st
0
3
6
9
Low HighSEPTEMBERLow High
OCTOBERLow High
NOVEMBERLow High
DECEMBERLow High
z= 3.97P= 0.0001
z= 2.66P= 0.0079
z= -4.87P= 0.0001
z= -6.34P= 0.0001
z= 6.27P= 0.0001
z= 4.08P= 0.0001
z= 4.54P= 0.0001
z= 5.19P= 0.0001
z= -5.32P= 0.0001
z= -6.52P= 0.0001
Figure 59. Rate of looking by impala and wildebeest in low and high predation conditions. Z-statistic is result of Wilcoxon
2-sample comparison between predation conditions within months.

161
Mean+/-SDMean+/-SEMean
Predation pressure
Pro
porti
on o
f tim
e sp
ent v
igila
nt Impa
la
0.0
0.1
0.2
0.3
AUGUST
Wild
ebee
st
0.0
0.1
0.2
0.3
Low High SEPTEMBERLow High
OCTOBERLow High
NOVEMBERLow High
DECEMBERLow High
z= 3.46p= 0.0005
z= 3.95p= 0.0001
z= -6.81p= 0.0001
z= -8.09p= 0.0001
z= 7.60p= 0.0001
z= 4.53p= 0.0001
z= 5.94p= 0.0001
z= 6.38p= 0.0001
z= -7.00p= 0.0001
z= -7.94p= 0.0001
Figure 60. Proportion of time spent looking by impala and wildebeest in low and high predation conditions. Z-statistic is result
of Wilcoxon 2-sample comparison between predation conditions within months.
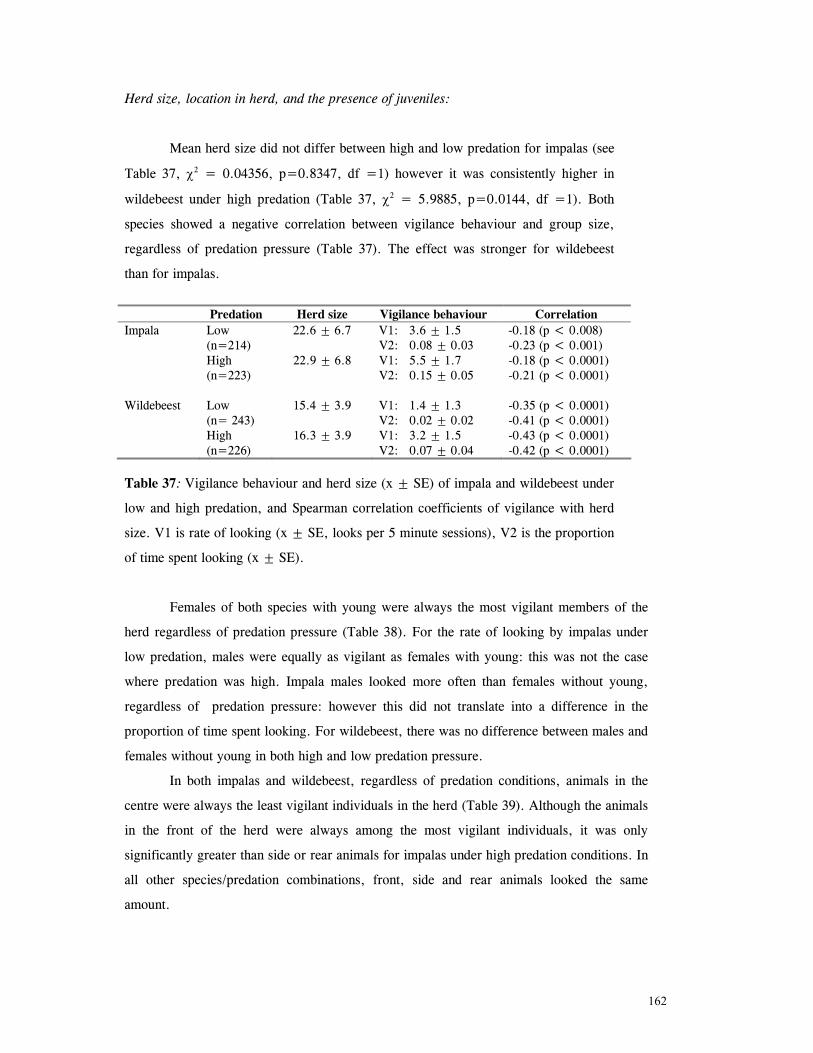
162
Herd size, location in herd, and the presence of juveniles:
Mean herd size did not differ between high and low predation for impalas (see
Table 37, χ2 = 0.04356, p=0.8347, df =1) however it was consistently higher in
wildebeest under high predation (Table 37, χ2 = 5.9885, p=0.0144, df =1). Both
species showed a negative correlation between vigilance behaviour and group size,
regardless of predation pressure (Table 37). The effect was stronger for wildebeest
than for impalas.
Predation Herd size Vigilance behaviour Correlation Impala Low 22.6 ± 6.7 V1: 3.6 ± 1.5 -0.18 (p < 0.008) (n=214) V2: 0.08 ± 0.03 -0.23 (p < 0.001) High 22.9 ± 6.8 V1: 5.5 ± 1.7 -0.18 (p < 0.0001) (n=223) V2: 0.15 ± 0.05 -0.21 (p < 0.0001) Wildebeest Low 15.4 ± 3.9 V1: 1.4 ± 1.3 -0.35 (p < 0.0001) (n= 243) V2: 0.02 ± 0.02 -0.41 (p < 0.0001) High 16.3 ± 3.9 V1: 3.2 ± 1.5 -0.43 (p < 0.0001) (n=226) V2: 0.07 ± 0.04 -0.42 (p < 0.0001) Table 37: Vigilance behaviour and herd size (x ± SE) of impala and wildebeest under
low and high predation, and Spearman correlation coefficients of vigilance with herd
size. V1 is rate of looking (x ± SE, looks per 5 minute sessions), V2 is the proportion
of time spent looking (x ± SE).
Females of both species with young were always the most vigilant members of the
herd regardless of predation pressure (Table 38). For the rate of looking by impalas under
low predation, males were equally as vigilant as females with young: this was not the case
where predation was high. Impala males looked more often than females without young,
regardless of predation pressure: however this did not translate into a difference in the
proportion of time spent looking. For wildebeest, there was no difference between males and
females without young in both high and low predation pressure.
In both impalas and wildebeest, regardless of predation conditions, animals in the
centre were always the least vigilant individuals in the herd (Table 39). Although the animals
in the front of the herd were always among the most vigilant individuals, it was only
significantly greater than side or rear animals for impalas under high predation conditions. In
all other species/predation combinations, front, side and rear animals looked the same
amount.
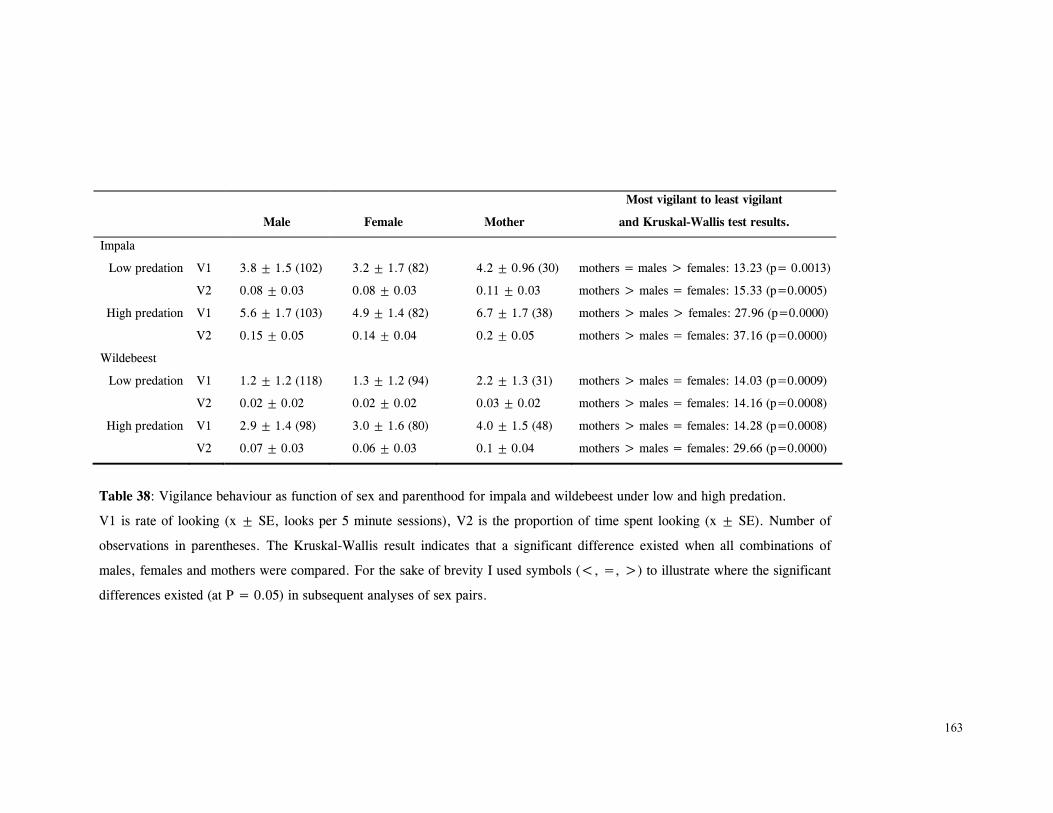
163
Male
Female
Mother
Most vigilant to least vigilant
and Kruskal-Wallis test results.
Impala
Low predation V1 3.8 ± 1.5 (102) 3.2 ± 1.7 (82) 4.2 ± 0.96 (30) mothers = males > females: 13.23 (p= 0.0013)
V2 0.08 ± 0.03 0.08 ± 0.03 0.11 ± 0.03 mothers > males = females: 15.33 (p=0.0005)
High predation V1 5.6 ± 1.7 (103) 4.9 ± 1.4 (82) 6.7 ± 1.7 (38) mothers > males > females: 27.96 (p=0.0000)
V2 0.15 ± 0.05 0.14 ± 0.04 0.2 ± 0.05 mothers > males = females: 37.16 (p=0.0000)
Wildebeest
Low predation V1 1.2 ± 1.2 (118) 1.3 ± 1.2 (94) 2.2 ± 1.3 (31) mothers > males = females: 14.03 (p=0.0009)
V2 0.02 ± 0.02 0.02 ± 0.02 0.03 ± 0.02 mothers > males = females: 14.16 (p=0.0008)
High predation V1 2.9 ± 1.4 (98) 3.0 ± 1.6 (80) 4.0 ± 1.5 (48) mothers > males = females: 14.28 (p=0.0008)
V2 0.07 ± 0.03 0.06 ± 0.03 0.1 ± 0.04 mothers > males = females: 29.66 (p=0.0000)
Table 38: Vigilance behaviour as function of sex and parenthood for impala and wildebeest under low and high predation.
V1 is rate of looking (x ± SE, looks per 5 minute sessions), V2 is the proportion of time spent looking (x ± SE). Number of
observations in parentheses. The Kruskal-Wallis result indicates that a significant difference existed when all combinations of
males, females and mothers were compared. For the sake of brevity I used symbols (<, =, >) to illustrate where the significant
differences existed (at P = 0.05) in subsequent analyses of sex pairs.
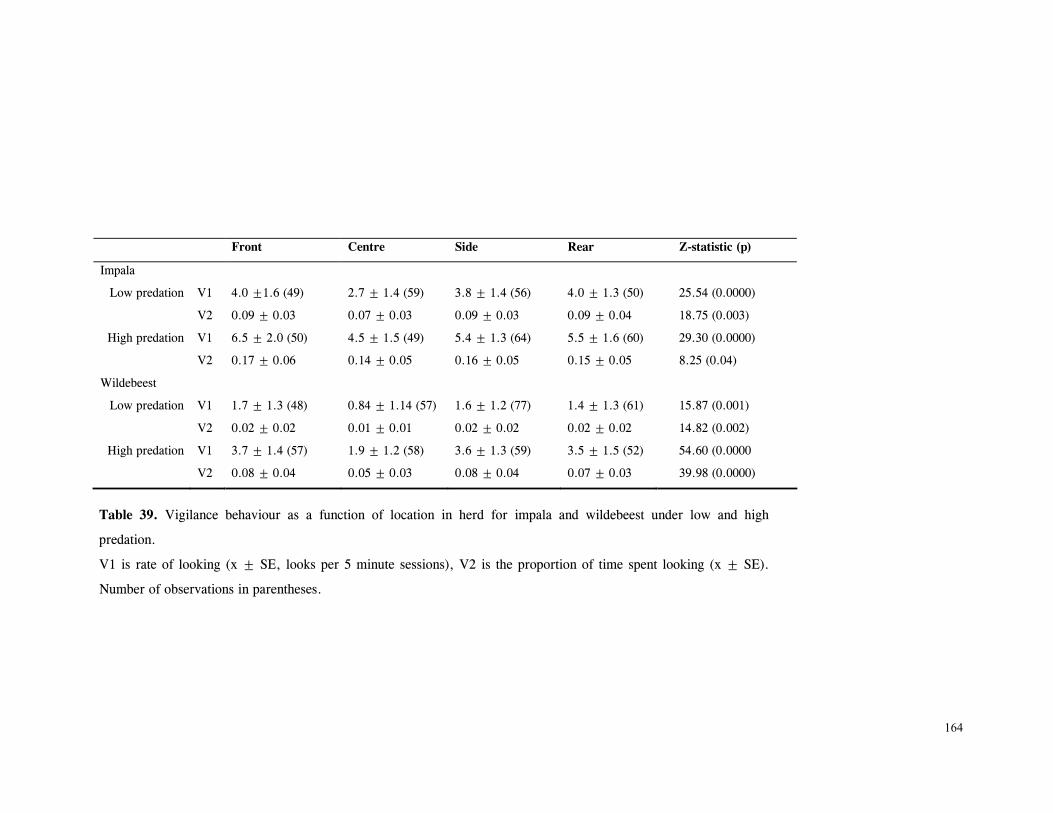
164
Front Centre Side Rear Z-statistic (p)
Impala
Low predation V1 4.0 ±1.6 (49) 2.7 ± 1.4 (59) 3.8 ± 1.4 (56) 4.0 ± 1.3 (50) 25.54 (0.0000)
V2 0.09 ± 0.03 0.07 ± 0.03 0.09 ± 0.03 0.09 ± 0.04 18.75 (0.003)
High predation V1 6.5 ± 2.0 (50) 4.5 ± 1.5 (49) 5.4 ± 1.3 (64) 5.5 ± 1.6 (60) 29.30 (0.0000)
V2 0.17 ± 0.06 0.14 ± 0.05 0.16 ± 0.05 0.15 ± 0.05 8.25 (0.04)
Wildebeest
Low predation V1 1.7 ± 1.3 (48) 0.84 ± 1.14 (57) 1.6 ± 1.2 (77) 1.4 ± 1.3 (61) 15.87 (0.001)
V2 0.02 ± 0.02 0.01 ± 0.01 0.02 ± 0.02 0.02 ± 0.02 14.82 (0.002)
High predation V1 3.7 ± 1.4 (57) 1.9 ± 1.2 (58) 3.6 ± 1.3 (59) 3.5 ± 1.5 (52) 54.60 (0.0000
V2 0.08 ± 0.04 0.05 ± 0.03 0.08 ± 0.04 0.07 ± 0.03 39.98 (0.0000)
Table 39. Vigilance behaviour as a function of location in herd for impala and wildebeest under low and high
predation.
V1 is rate of looking (x ± SE, looks per 5 minute sessions), V2 is the proportion of time spent looking (x ± SE).
Number of observations in parentheses.
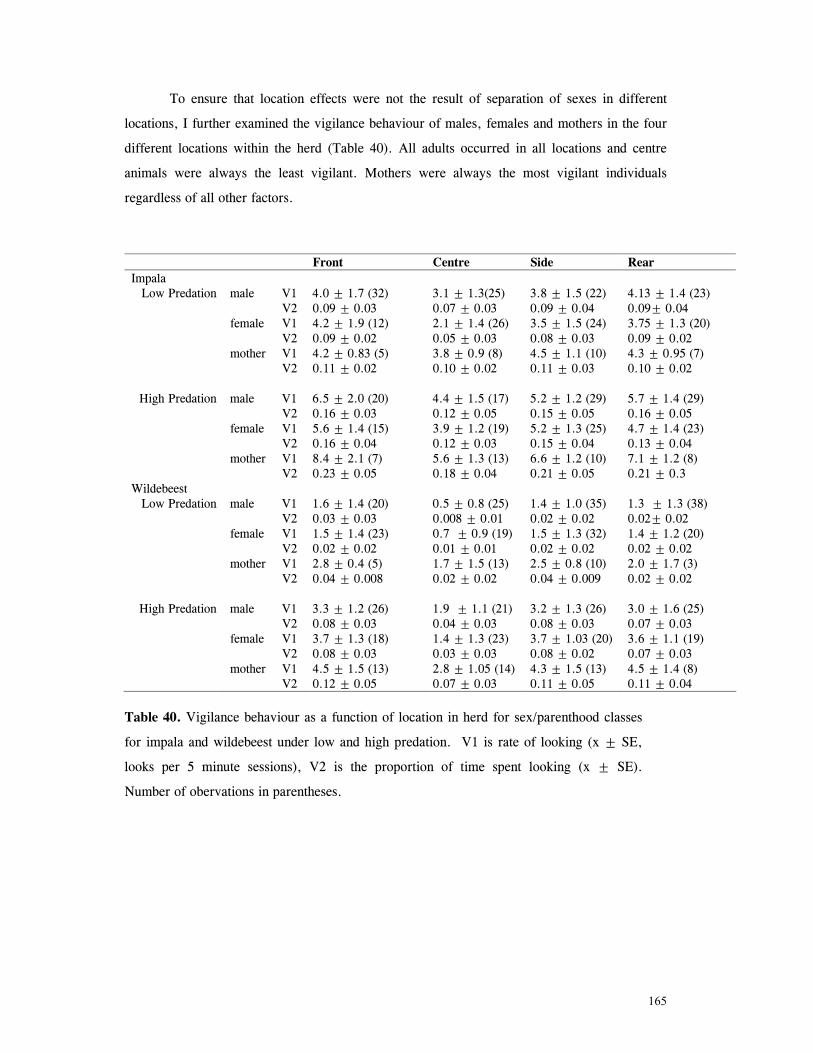
165
To ensure that location effects were not the result of separation of sexes in different
locations, I further examined the vigilance behaviour of males, females and mothers in the four
different locations within the herd (Table 40). All adults occurred in all locations and centre
animals were always the least vigilant. Mothers were always the most vigilant individuals
regardless of all other factors.
Front Centre Side Rear Impala Low Predation male V1 4.0 ± 1.7 (32) 3.1 ± 1.3(25) 3.8 ± 1.5 (22) 4.13 ± 1.4 (23)
V2 0.09 ± 0.03 0.07 ± 0.03 0.09 ± 0.04 0.09± 0.04 female V1 4.2 ± 1.9 (12) 2.1 ± 1.4 (26) 3.5 ± 1.5 (24) 3.75 ± 1.3 (20) V2 0.09 ± 0.02 0.05 ± 0.03 0.08 ± 0.03 0.09 ± 0.02 mother V1 4.2 ± 0.83 (5) 3.8 ± 0.9 (8) 4.5 ± 1.1 (10) 4.3 ± 0.95 (7) V2 0.11 ± 0.02 0.10 ± 0.02 0.11 ± 0.03 0.10 ± 0.02
High Predation male V1 6.5 ± 2.0 (20) 4.4 ± 1.5 (17) 5.2 ± 1.2 (29) 5.7 ± 1.4 (29) V2 0.16 ± 0.03 0.12 ± 0.05 0.15 ± 0.05 0.16 ± 0.05 female V1 5.6 ± 1.4 (15) 3.9 ± 1.2 (19) 5.2 ± 1.3 (25) 4.7 ± 1.4 (23) V2 0.16 ± 0.04 0.12 ± 0.03 0.15 ± 0.04 0.13 ± 0.04 mother V1 8.4 ± 2.1 (7) 5.6 ± 1.3 (13) 6.6 ± 1.2 (10) 7.1 ± 1.2 (8) V2 0.23 ± 0.05 0.18 ± 0.04 0.21 ± 0.05 0.21 ± 0.3 Wildebeest Low Predation male V1 1.6 ± 1.4 (20) 0.5 ± 0.8 (25) 1.4 ± 1.0 (35) 1.3 ± 1.3 (38)
V2 0.03 ± 0.03 0.008 ± 0.01 0.02 ± 0.02 0.02± 0.02 female V1 1.5 ± 1.4 (23) 0.7 ± 0.9 (19) 1.5 ± 1.3 (32) 1.4 ± 1.2 (20) V2 0.02 ± 0.02 0.01 ± 0.01 0.02 ± 0.02 0.02 ± 0.02 mother V1 2.8 ± 0.4 (5) 1.7 ± 1.5 (13) 2.5 ± 0.8 (10) 2.0 ± 1.7 (3) V2 0.04 ± 0.008 0.02 ± 0.02 0.04 ± 0.009 0.02 ± 0.02
High Predation male V1 3.3 ± 1.2 (26) 1.9 ± 1.1 (21) 3.2 ± 1.3 (26) 3.0 ± 1.6 (25) V2 0.08 ± 0.03 0.04 ± 0.03 0.08 ± 0.03 0.07 ± 0.03 female V1 3.7 ± 1.3 (18) 1.4 ± 1.3 (23) 3.7 ± 1.03 (20) 3.6 ± 1.1 (19) V2 0.08 ± 0.03 0.03 ± 0.03 0.08 ± 0.02 0.07 ± 0.03 mother V1 4.5 ± 1.5 (13) 2.8 ± 1.05 (14) 4.3 ± 1.5 (13) 4.5 ± 1.4 (8) V2 0.12 ± 0.05 0.07 ± 0.03 0.11 ± 0.05 0.11 ± 0.04
Table 40. Vigilance behaviour as a function of location in herd for sex/parenthood classes
for impala and wildebeest under low and high predation. V1 is rate of looking (x ± SE,
looks per 5 minute sessions), V2 is the proportion of time spent looking (x ± SE).
Number of obervations in parentheses.
166
DISCUSSION
The main finding of this study is the clear increase in both the rate of looking and the
proportion of time spent looking by impalas and wildebeest exposed to increased levels of
predation. Many predictions about vigilance theory have been tested by measuring changes in
vigilance in response to changes in factors that should affect predation risk. An increase in vigilance
behaviour has been demonstrated in some bird species following exposure to a simulated predator
or threat (Powell, 1974; Gluck, 1987; Lima and Zollner, 1996), alarm calls (Lazarus, 1979), and in
closed habitats versus open (Repasky, 1996). Similarly, pronghorn antelope were more vigilant
when exposed to human induced disturbances than undisturbed animals (Berger et al,, 1983). In the
present research, the proportion of time spent looking by both species exposed to high predation
underwent an increase of over 200% in the five month study period. This suggests that as almost
universally assumed, the risk of being preyed upon is the principal reason ungulates are vigilant.
The fact that vigilance remained at very low levels in ungulates exposed to low predation conditions
suggests that the relationship between vigilance and other factors such as intraspecific interactions
or finding food, is weak in these species. At Phinda, impalas in the low predation treatment looked
for around 8% of their time: for wildebeest, the mean figure was just over 2%. This is comparable
to the time animals spent vigilant in Underwood’s (1982) study where most of their major predators
were absent. Individuals apparently freed of high predation pressure appear to also be freed of most
of the need for vigilance.
Having said this, I believe that the possibility of predation, however low, contributed to the
maintenance of vigilance behaviour in animals under low predation pressure. Contrary to our
expectations, I found that many of the patterns of vigilance behaviour evident amongst ungulates
exposed to low predation pressure did not substantially alter when predation pressure was
increased. The negative correlation between vigilance and group size for both predation conditions
suggests that even when predation pressure is very low, the anti-predation benefits of grouping may
still be realised. Underwood (1982) found a similar pattern amongst four species of African
ungulates (including wildebeest) in low predation conditions, though interestingly, impalas
displayed a positive correlation between vigilance and group size. He suggested that under low
predation conditions, impalas used scanning to promote group cohesion rather than as an anti-
predatory measure. My data do not indicate this and other evidence suggests that even at low levels,
predation risk is a strong factor in maintaining vigilance. For example, animals in the centre of the
herd were always the least vigilant, and front, side and rear animals generally looked the same
amount regardless of predation pressure. Similarly, female ungulates with young were the most

167
vigilant individuals in the herd in both predation conditions. If animals were looking for social or
feeding reasons, one would expect this to become more evident where risk of attack is low.
Increased predation appears to result in a concomitant increase amongst vigilance in all individuals,
hence the patterns of the behaviour remained the same in both low and high predation.
I intentionally avoided discriminating between different levels or types of vigilance. LaGory
(1986) differentiated between vigilance apparently directed towards conspecifics and towards the
observer in white-tailed deer and found that deer spent a mean of between 1.0% to 2.3% of their
time alert to other deer, depending on the availability of cover. While this is revealing, animals
may be gathering information about different factors not immediately apparent to the observer.
Alados (1985) considered two levels of vigilance in Spanish Ibex: actively searching the
surroundings and “weak” watching in which animals had raised heads but were not looking around.
Active watching, but not weak watching, was negatively correlated with group size and Alados
suggested the latter is not related to predator detection. However, animals engaged in weak
watching are almost certainly gathering information from their conspecifics about the threat of
predation. I suggest that the vigilance behaviour displayed by animals under the low predation
conditions at Phinda represented a maximum in terms of time they devoted to the behaviour,
regardless of its focus. Even if one disregards the evidence that predation pressure was
contributory, animals in this study are clearly devoting very little time to being alert where
predation is minimal. It must be noted that my observations took place during periods of relatively
low social activity. Heightened social interaction such as occurs during the mating season increases
vigilance behaviour (Leuthold, 1977, Alados, 1985). In the study region, the rut in impalas occurs
between March and June (Vincent, 1972), and peaks in April and August in wildebeest (Attwell,
1977), periods prior to the study. Accordingly, the levels of vigilance specified here should not be
assumed to apply for months outside the study period.
The maximum time animals devoted to vigilance when exposed to increased predation was
comparable to other studies (cf Fitzgibbon, 1990a; Bedneokff & Ritter, 1994; Burger & Gochfield,
1994). At Phinda, under high predation, the mean time spent vigilant peaked in December at 22.1%
for impalas and 10.1% for wildebeest. Presumably, ungulates reach a threshold in the amount of
time they spend vigilant as predation pressure increases. While this may ultimately have increased
beyond the peaks observed in the final month of the study, the current research was too short in
duration to establish a maximum with any certainty. The observed increase over time in vigilance is
probably due to numerous factors. Individual predation risk probably increased over time as re-
introduced cats began making an impact on prey herds. While this was a minor effect at the
population level during the study period for most species (Hunter, unpubl. data: but compare for

168
wildebeest and reedbuck; Chapter 7), the effect on each herd may have been accumulative given
that group sizes were small and so removal by predation of even a few animals would increase
substantially the risk to remaining herd members. Additionally, the increase may simply have been
due to increased awareness of predation over time. While all my observations took place in areas
known to be used by re-introduced cats, individual herds sometimes experienced long periods
between “bouts” of predation as lions and cheetahs dispersed and established home-ranges
following re-introduction. Qualitatively, I felt that individual ungulates did not immediately assume
and maintain a certain level of vigilance following their first experience with re-introduced cats.
Naïve prey populations probably require some repeated exposure to predation before individuals
“realise” the risk of attack is ongoing. Nonetheless, it is interesting that vigilance behaviour seemed
to increase rapidly following release of cats. At the inception of this study, individuals in the high
predation treatment had been exposed to increased pressure from cheetahs for only five months and
from lions for three months (cheetahs being more important predators on impala than wildebeest
and vice-versa for lions, Chapter 6). Unfortunately I have no data on the period immediately
following release but by August, high predation ungulates were already more vigilant (Fig.s 59 &
60).
Ungulates may reduce the chance of being preyed upon in other ways. Scheel (1993) suggests
that wildebeest show a tendency to develop large aggregations as a defence against predation (the
dilution effect, see Dehn, 1990). Similarly, Berger et al (1983) found a strong effect on grouping in
pronghorn antelope which, when exposed to human-induced disturbance, formed increased group
sizes. In the present study, wildebeest showed larger group sizes when exposed to high predation
whereas impalas did not (Table 37). While a consistent pattern suggesting this emerged from our
data, this should be treated with caution. Actual group size in wildebeest in the high predation site
was a mean of only 0.9 animals greater than low predation herds and the increase may be a
statistical artefact. Herd size in the present study was low compared to other studies (de Boer &
Prins, 1990; Scheel, 1993; Table 37), a characteristic of wildebeest populations in the region
(Attwell, 1977) and a constant small difference may return a significant result. Although this was
consistently the case for all months, it is premature to conclude that a definite anti-predatory
response in grouping behaviour was occurring. The opportunity to explore this and other details of
anti-predatory behaviour under changing predation conditions exists increasingly in South Africa
where re-introduction programs of predators are flourishing in response to increased eco-tourism. It
will be intriguing to assess the response of prey populations to these manipulations as field
experiments proliferate.
169
CHAPTER 9.
GENERAL CONCLUSIONS AND MANAGEMENT IMPLICATIONS FOR LARGE
CARNIVORE REINTRODUCTION.
The present study suggested that, contrary to most other efforts at large African
carnivore translocation, reintroduction may be a viable method for re-population, at least in the
short-term. From a behavioural and ecological perspective, reintroduced lions and cheetahs
appeared well-disposed to translocation: they established home ranges, foraged successfully and
produced offspring which they raised to independence. Methodological considerations
contributed in part to the success of early establishment of reintroduced felids. Released lions
and cheetahs at Phinda showed minimal evidence of homing behaviour compared with previous
efforts to translocate large felids (Chapter 3) and subsequently established enduring home
ranges at the release site (Chapter 4).
Quantifying the influence of these techniques is complicated by the difficulty of
establishing control groups but a substantial pre-release captivity period combined with the
presence of electrified fencing appears to be important in these processes. Since the use of these
techniques at Phinda, many subsequent efforts at large carnivore reintroduction have adopted
them with similar results and success (Van Dyk 1997; Hofmeyr & Van Dyk, 1998; Purchase,
1998). Although such techniques require considerable resources, it is highly recommended that
projects attempting to reintroduce large felids in South Africa consider their use. In areas where
fencing release sites is not practised or not feasible, such methods may have reduced
applicability and is an area which would be productive for further study. Regardless of the
techniques adopted by practitioners, projects involving large carnivore restoration are inevitably
expensive and therefore, should not be undertaken without access to at least the capital required
by the methods adopted during this study.
The availability of suitable habitat and resources is another factor which will
significantly influence project success and should be an important aspect of a management plan
for reintroduced lions and cheetahs. Some lions at Phinda showed extended periods of activity
around small, isolated artificial dams and this may have contributed to increased predation
pressure on herbivores. Although the understanding of this relationship is still in its infancy,
careful consideration of the placement and distribution of artificial water sources is an important
aspect of predator-prey management in small reserves. Similarly, the suitability of habitat for
cheetahs in a reintroduction project requires careful consideration. The limited availability of
open woodland and savannah at Phinda may have forced cheetahs to encounter conspecifics and

170
other carnivores (particularly lions) at increased rates. Some of these incidents resulted in the
deaths of healthy, adult cheetahs which may not have occurred if more open habitat was
available. In regions where the extirpation of large herbivores has resulted in bush
encroachment, active manipulation of habitat types using techniques such as selective bush-
clearing may be necessary to improve success.
Again, this requires considerable resources, but it can play a significant role in the
creation of jobs and access to resources for local people on the boundaries of reserves, itself an
important factor in the long-term success of carnivore restoration (Chapter 2; Peek et al, 1991;
Reading & Clark, 1996). At Phinda, much of the bush-clearing project was conducted using
locally employed labour which cleared encroached areas using hand tools. Further, the wood
from these operations was made available to local communities for fuel and also formed the
basis of a charcoal-producing cottage industry. Importantly, such methods take substantially
longer than using heavy machinery and if they are to form part of an effort to improve habitat
suitability for reintroduced cheetahs, must be planned and implemented far in advance of the
release of cats.
This study illustrated the importance of human activity in post-release mortality of re-
introduced cats, an area where intensive management could significantly improve results.
Human activity is increasingly considered to be the single greatest factor likely to influence the
success of reintroduction projects, particularly of large carnivores (Peek et al, 1991; Reading &
Clark, 1996; Linnell et al, 1997; Woodruffe & Ginsberg, 1998). The pressure on reserves to
provide an established tourism operation while felid reintroduction is ongoing may exacerbate
the significant human-mediated mortality of cats, as seen in the present study. Where possible,
the development of the extensive infrastructure required by wildlife tourism operations should
be staggered to reduce competition for resources which might otherwise be allocated to felid
reintroduction and management. In many cases, where the reserve is established and functional,
the potential for conflict will be reduced. However in newly established reserves (which are
presently the most common sites for release of large carnivores in South Africa), this may be a
significant problem.
Carnivore reintroductions face considerable obstacles beyond the initial stages following
release. In small, enclosed reserves, managers need to be aware that monitoring and
management of reintroduced felids is an ongoing, long-term process. This cannot be neglected
following the early stages of a project, which are typically marked by high levels of excitement
and resource allocation but which inevitably decline once animals are considered “settled”. At
Phinda, the impact of growing populations of reintroduced cats led to the decline of some
171
herbivore species (Chapter 7) and removals of both lions and cheetahs were implemented from
1995 onwards (Hunter, 1996b). In small, enclosed reserves with resident populations of
herbivores, this kind of long-term population control will probably be necessary to avoid
excessive impact on prey species. Although it remains to be seen whether excessive levels of
predation would result in the extinction of a species following reintroduction of cats, managers
will be unable to make informed decisions if consistent monitoring of cats and their prey species
is not maintained long after the early post-release period.
Other long-term issues may threaten project success. Most such projects are typically
initiated with a small number of founders bringing genetic considerations into question. A small
population with few founders may be subject to losses of genetic variability, reducing its ability
to adapt to environmental changes and increasing chances of inbreeding and losses to disease
episodes. The decline of lions in the Umfolozi-Hluhluwe Game Reserve apparently related to an
immunodeficiency syndrome as a result of inbreeding (Meltzer et al, 1997) suggests that a
management plan for reintroduced populations should specify how to avoid this problem in the
early stages of a project. At the time of writing, Phinda already has an inbred generation of
lions, a problem experienced by other reserves with small, reintroduced lion populations
(Braack, pers comm)1. Avoiding this outcome is most easily achieved in the early years
following release when the relationships between founding animals and their offspring tend to
be well monitored and understood. Further, the present study demonstrated that unrelated
animals can be ‘bonded’ to form founder groups, a technique which has subsequently been
refined elsewhere in South Africa (Van Dyk 1997) and which can be adopted to offset this
problem.
Spatial characteristics of sites in such projects are also threats to long-term success. The
persistence of populations will be affected by whether the area is large enough to sustain enough
individuals required to maintain demographic and genetic heterogeneity in the long term,
exceedingly so for small founder groups typical of carnivore reintroduction (Gilpin, 1987;
Clark & Reading, 1996). Furthermore the degree of isolation from other potential release sites
or established populations will influence the degree to which the exchange of individuals-
whether natural or mediated by man- is possible. Minimum population sizes and the impact of
these processes on restored populations are still largely unknown for large carnivores (Beier,
1993; Dinerstein et al, 1997). Increasingly, wildlife managers and conservation biologists are
faced with the problem of fragmented and isolated wildlife populations where the normal
1 Braack, J. Makalali Private Game Reserve. PO Box 809, Hoedspruit, 1380, South Africa. Tel: 015 793 1798.
172
processes of dispersal, immigration and emigration are 1impeded or impossible (Lacy, 1987).
To ensure the long-term persistence of reintroduced populations in small, enclosed reserves
such as Phinda, a metapopulation management approach- in which each population is treated as
a sub-division of the entire population, and genetic and demographic exchange is mediated
‘artificially’ by human management- will probably be necessary (Gilpin, 1987). At the time of
writing, Phinda management is involved in negotiations to consolidate 500km2 of government
and privately-owned land surrounding Phinda into a single conservation area, and exchanges
and translocations of lions and cheetahs between Phinda and other developing reserves has been
ongoing since 1995 (Hunter 1996b). Ultimately, such an approach will considerably enhance
the conservation value of the Phinda lion and cheetah populations.
Clearly, considerable obstacles face efforts to re-establish large felids. Ongoing
research and extensive, continued management of such ‘restored’ ecosystems will prove to be
critical factors in the long-term survival of these expensive, high-profile conservation efforts.
Nonetheless, the short-term benefits of these types of projects may be significant. From an ‘eco-
tourism’ perspective, Phinda is widely considered to be one of the best reserves in which to
view lions and cheetahs, and that kudos has encouraged other similar projects in southern
Africa (Wells, 1996). The gradual consolidation of such efforts and exchange of information
between them will substantially increase their contribution to conservation biology. This is the
subject for on-going research within southern Africa (Hunter, 1998b) and will ultimately
provide more answers to the long-term management issues surrounding large felid restoration.
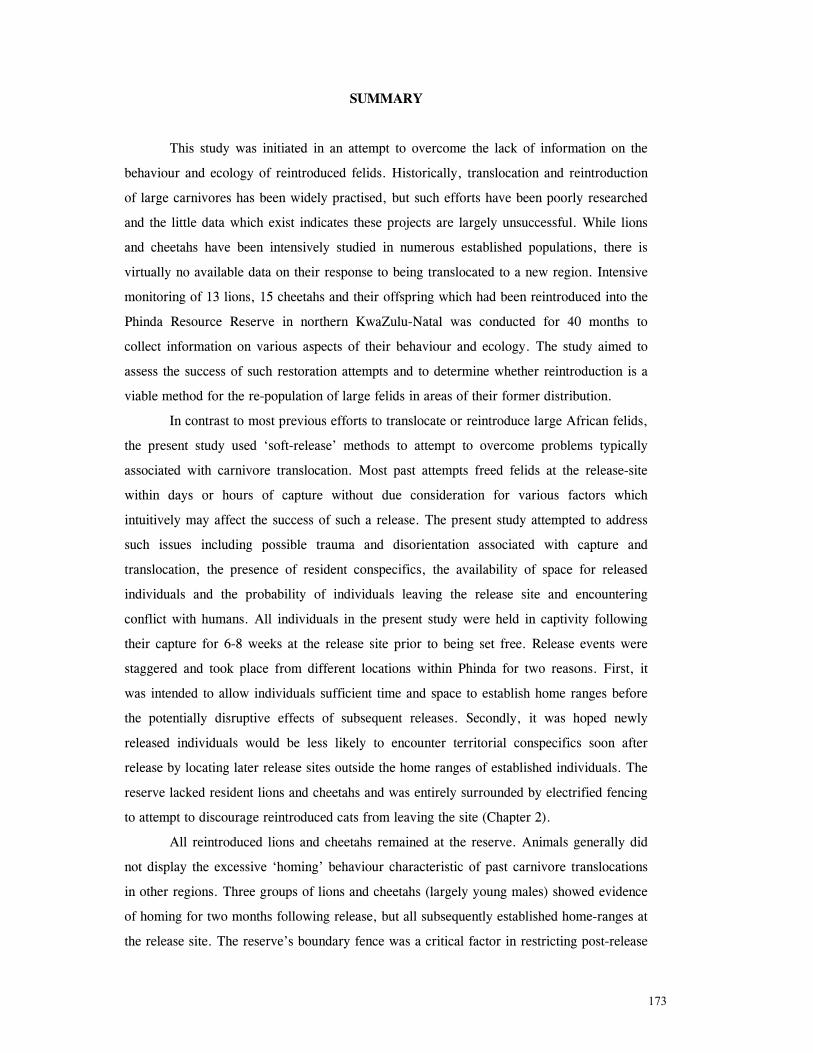
173
SUMMARY
This study was initiated in an attempt to overcome the lack of information on the
behaviour and ecology of reintroduced felids. Historically, translocation and reintroduction
of large carnivores has been widely practised, but such efforts have been poorly researched
and the little data which exist indicates these projects are largely unsuccessful. While lions
and cheetahs have been intensively studied in numerous established populations, there is
virtually no available data on their response to being translocated to a new region. Intensive
monitoring of 13 lions, 15 cheetahs and their offspring which had been reintroduced into the
Phinda Resource Reserve in northern KwaZulu-Natal was conducted for 40 months to
collect information on various aspects of their behaviour and ecology. The study aimed to
assess the success of such restoration attempts and to determine whether reintroduction is a
viable method for the re-population of large felids in areas of their former distribution.
In contrast to most previous efforts to translocate or reintroduce large African felids,
the present study used ‘soft-release’ methods to attempt to overcome problems typically
associated with carnivore translocation. Most past attempts freed felids at the release-site
within days or hours of capture without due consideration for various factors which
intuitively may affect the success of such a release. The present study attempted to address
such issues including possible trauma and disorientation associated with capture and
translocation, the presence of resident conspecifics, the availability of space for released
individuals and the probability of individuals leaving the release site and encountering
conflict with humans. All individuals in the present study were held in captivity following
their capture for 6-8 weeks at the release site prior to being set free. Release events were
staggered and took place from different locations within Phinda for two reasons. First, it
was intended to allow individuals sufficient time and space to establish home ranges before
the potentially disruptive effects of subsequent releases. Secondly, it was hoped newly
released individuals would be less likely to encounter territorial conspecifics soon after
release by locating later release sites outside the home ranges of established individuals. The
reserve lacked resident lions and cheetahs and was entirely surrounded by electrified fencing
to attempt to discourage reintroduced cats from leaving the site (Chapter 2).
All reintroduced lions and cheetahs remained at the reserve. Animals generally did
not display the excessive ‘homing’ behaviour characteristic of past carnivore translocations
in other regions. Three groups of lions and cheetahs (largely young males) showed evidence
of homing for two months following release, but all subsequently established home-ranges at
the release site. The reserve’s boundary fence was a critical factor in restricting post-release

174
movements of felids. Unfamiliar and unrelated animals socialised during the pre-release
captivity period often remained together following release for long periods. This has
important implications for translocation attempts where individuals are generally captured
opportunistically, often after coming into conflict with humans. The study demonstrated that
when exposed to a period of captivity, unfamiliar individuals of lions and cheetahs
established enduring relationships which persisted long after release. This technique
facilitated the formation of socialised groups which are probably better suited for
reintroduction purposes than lone individuals (Chapter 3).
Reintroduced lions and cheetahs at Phinda which survived the crucial early post-
release period established home ranges in the reserve, most of which endured for the
duration of the study. This suggested that reintroduction may be a viable method for re-
establishing resident felids. Lions (of both sexes) and male cheetahs were territorial whereas
female cheetahs showed no signs of establishing territories and, in some cases, used the
entire reserve as their home range. Lion individuals and groups used between 27.56km2 and
130.20km2 as their home-ranges in Phinda. Mean home range size of female groups was
52.83 km2 ± 35.68 km2 (range: 27.56km2 - 105.60km2, n = 3). Male home-ranges reflected
their attempts to encompass as many female territories as possible and were as extensive as
78.7% of the entire reserve. Lions showed evidence of home-ranges shrinking during the
dry winter, which probably reflected the distribution of artificial water sources in the
reserve. The placement of such waterpoints may be an important issue for the management
of predator-prey relationships in small reserves (Chapter 4).
Mean size of the territories of male cheetah coalitions was 92.89 km2 ± 59.39 km2
(range 56.79 km2 - 161.44 km2, n = 3). Territories were fiercely contested and fights
between rival males resulted in four deaths of males during the study. The ‘patchiness’ of
available preferred habitat may have exacerbated conflicts between male cheetahs. Such
habitat, particularly open grassland, formed the core areas of both male and female cheetahs’
ranges. In regions such as at Phinda where historical human influences such as cultivation
and the removal of indigenous bulk grazers and browsers (for example, elephants) may
radically alter the structure of habitats, the planning of a restoration attempt of cheetahs must
include consideration of available suitable habitat. The ‘rehabilitation’ of human-altered
landscapes may be an important factor affecting project success (Chapter 4).
The greatest cause of mortality to reintroduced felids was as a result of human
activity, particularly poaching. Five reintroduced lions and two cheetahs were killed in wire
snares. Other human-mediated causes of mortality included road-kills and poor boundary
security which allowed individuals to leave the reserve and enter farming communities
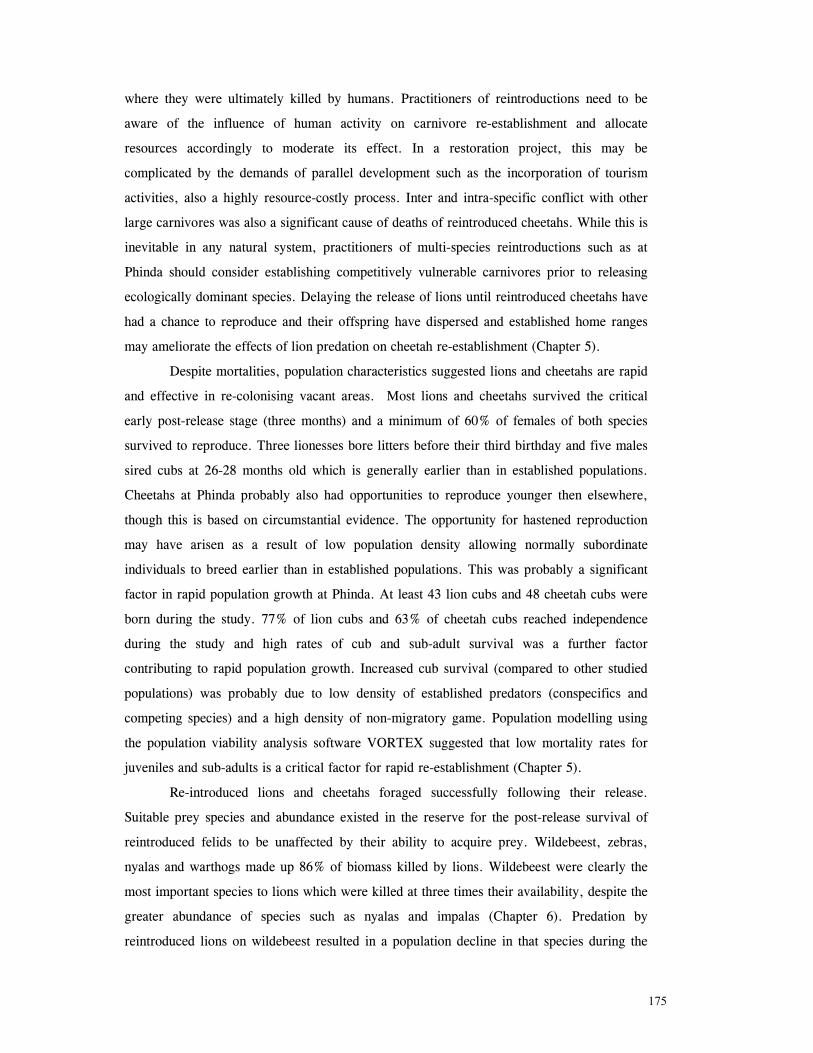
175
where they were ultimately killed by humans. Practitioners of reintroductions need to be
aware of the influence of human activity on carnivore re-establishment and allocate
resources accordingly to moderate its effect. In a restoration project, this may be
complicated by the demands of parallel development such as the incorporation of tourism
activities, also a highly resource-costly process. Inter and intra-specific conflict with other
large carnivores was also a significant cause of deaths of reintroduced cheetahs. While this is
inevitable in any natural system, practitioners of multi-species reintroductions such as at
Phinda should consider establishing competitively vulnerable carnivores prior to releasing
ecologically dominant species. Delaying the release of lions until reintroduced cheetahs have
had a chance to reproduce and their offspring have dispersed and established home ranges
may ameliorate the effects of lion predation on cheetah re-establishment (Chapter 5).
Despite mortalities, population characteristics suggested lions and cheetahs are rapid
and effective in re-colonising vacant areas. Most lions and cheetahs survived the critical
early post-release stage (three months) and a minimum of 60% of females of both species
survived to reproduce. Three lionesses bore litters before their third birthday and five males
sired cubs at 26-28 months old which is generally earlier than in established populations.
Cheetahs at Phinda probably also had opportunities to reproduce younger then elsewhere,
though this is based on circumstantial evidence. The opportunity for hastened reproduction
may have arisen as a result of low population density allowing normally subordinate
individuals to breed earlier than in established populations. This was probably a significant
factor in rapid population growth at Phinda. At least 43 lion cubs and 48 cheetah cubs were
born during the study. 77% of lion cubs and 63% of cheetah cubs reached independence
during the study and high rates of cub and sub-adult survival was a further factor
contributing to rapid population growth. Increased cub survival (compared to other studied
populations) was probably due to low density of established predators (conspecifics and
competing species) and a high density of non-migratory game. Population modelling using
the population viability analysis software VORTEX suggested that low mortality rates for
juveniles and sub-adults is a critical factor for rapid re-establishment (Chapter 5).
Re-introduced lions and cheetahs foraged successfully following their release.
Suitable prey species and abundance existed in the reserve for the post-release survival of
reintroduced felids to be unaffected by their ability to acquire prey. Wildebeest, zebras,
nyalas and warthogs made up 86% of biomass killed by lions. Wildebeest were clearly the
most important species to lions which were killed at three times their availability, despite the
greater abundance of species such as nyalas and impalas (Chapter 6). Predation by
reintroduced lions on wildebeest resulted in a population decline in that species during the
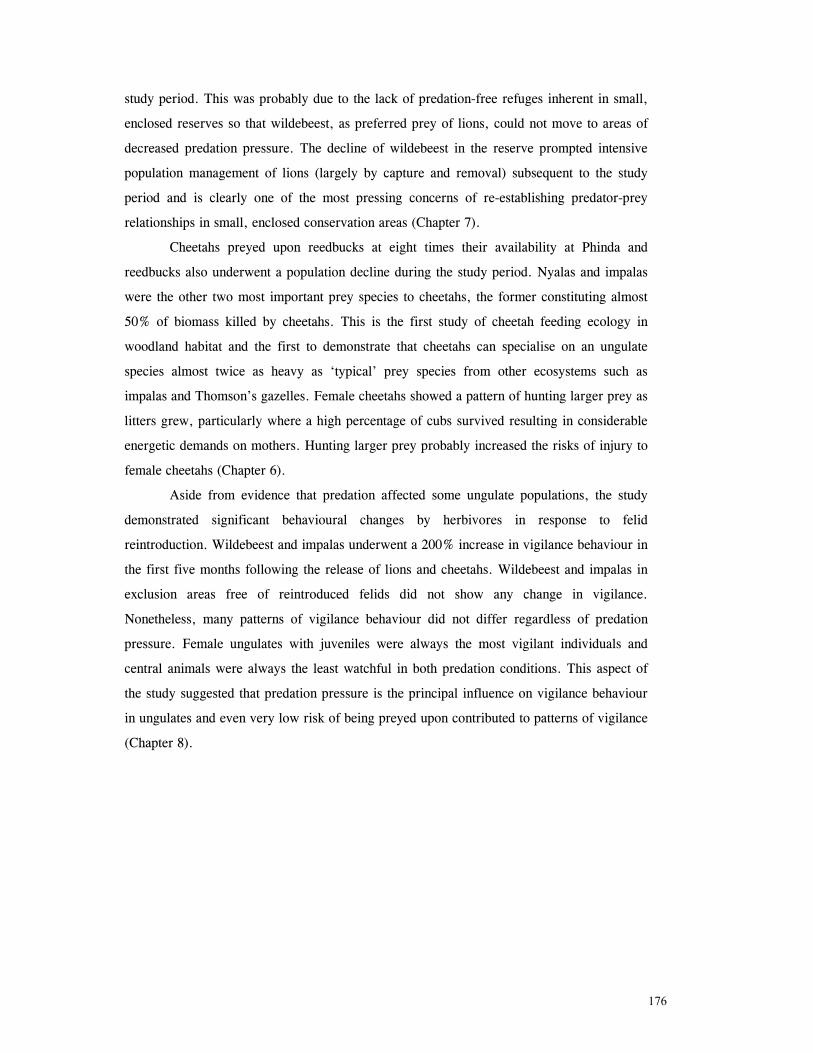
176
study period. This was probably due to the lack of predation-free refuges inherent in small,
enclosed reserves so that wildebeest, as preferred prey of lions, could not move to areas of
decreased predation pressure. The decline of wildebeest in the reserve prompted intensive
population management of lions (largely by capture and removal) subsequent to the study
period and is clearly one of the most pressing concerns of re-establishing predator-prey
relationships in small, enclosed conservation areas (Chapter 7).
Cheetahs preyed upon reedbucks at eight times their availability at Phinda and
reedbucks also underwent a population decline during the study period. Nyalas and impalas
were the other two most important prey species to cheetahs, the former constituting almost
50% of biomass killed by cheetahs. This is the first study of cheetah feeding ecology in
woodland habitat and the first to demonstrate that cheetahs can specialise on an ungulate
species almost twice as heavy as ‘typical’ prey species from other ecosystems such as
impalas and Thomson’s gazelles. Female cheetahs showed a pattern of hunting larger prey as
litters grew, particularly where a high percentage of cubs survived resulting in considerable
energetic demands on mothers. Hunting larger prey probably increased the risks of injury to
female cheetahs (Chapter 6).
Aside from evidence that predation affected some ungulate populations, the study
demonstrated significant behavioural changes by herbivores in response to felid
reintroduction. Wildebeest and impalas underwent a 200% increase in vigilance behaviour in
the first five months following the release of lions and cheetahs. Wildebeest and impalas in
exclusion areas free of reintroduced felids did not show any change in vigilance.
Nonetheless, many patterns of vigilance behaviour did not differ regardless of predation
pressure. Female ungulates with juveniles were always the most vigilant individuals and
central animals were always the least watchful in both predation conditions. This aspect of
the study suggested that predation pressure is the principal influence on vigilance behaviour
in ungulates and even very low risk of being preyed upon contributed to patterns of vigilance
(Chapter 8).
177
REFERENCES
ADAMS, L.G., SINGER, F.J., & DALE, B.W. 1995. Caribou calf mortality in Denali
National Park. J. Wildl. Mgmt 59:584-594.
ALADOS, C.L. 1985. An analysis of vigilance in the Spanish Ibex (Capra pyrenaica). Z.
Tierpsychol. 68:58-64.
ANDERSON, J.L. 1978. Aspects of the ecology of the nyala in Zululand. PhD Thesis, Univ.
London.
ANDERSON, J.L. 1980. A summary of observations on the larger carnivores of the
Hluhluwe/Corridor/Umfolozi Game Reserve complex, Zululand. Natal Parks Board
unpublished report 7pp.
ANDERSON, J.L. 1981. The re-establishment and management of lion Panthera leo
population in Zululand, South Africa. Biol. Conserv. 1:107-117
ATTWELL, C.A.M. 1977. Reproduction and population ecology in the blue wildebeest
in Zululand. PhD thesis, University of Natal.
BAILEY, T.N. 1993. The African leopard. Columbia Univ. Press, New York.
BANGS, E.E., & FRITTS, S.H. 1996. Reintroducing the gray wolf to central Idaho and
Yellowstone National Park. Wildl. Soc. Bull. 24:402-413.
BEARDER, S.K. 1975. Inter-relationships between hyaenas and their competitiors in the
Transvaal lowveld. Nuwe Reeks. Pub. Univ. Pretoria 97:39-48.
BEIER, P. 1993. Determining minimum habitat areas and habitat corridors for cougars.
Conser. Biol. 7:94-108.
BELDEN, R.C. & HAGEDORN, B.W. 1993. Feasibility of translocating panthers into
northern Florida. J.Wildl. Mgmt. 57:388-397.
BERGER, J. & CUNNINGHAM, C. 1988. Size-related effects on search times in North
American grassland female ungulates. Ecology 69:177-183.
BERGER, J., DANEKE, D., JOHNSON, J. & BERWICK, S.H. 1983. Pronghorn
foraging economy and predator avoidance in a desert ecosystem: Implications for the
conservation of large mammalian herbivores. Biol. Cons. 25: 193-208.
BERTRAM, B.C.R. 1973. Lion population regulation. E. Afr. Wildl. J. 11:215-225
BERTRAM, B.C.R. 1978. Social factors influencing reproduction in wild lions. J. Zool.
London. 177,463-482.
BERTRAM, B.C.R. 1979. Studying Predators. Handbook No. 3. African Wildlife
Leadership Foundation, Nairobi. 2nd Edition 44pp

178
BERRY. H, BUSH, M., DAVIDSON, B., FORGE, O., FOX, B., GRISHAM, J., HOWE,
M., HURLBUT, S., MARKER-KRAUS, L., MARTENSON, J., MUNSON, L.,
NOWELL, K., SCHUMANN, M., SHILLE, T., STANDER, P., VENZKE, K.,
WAGENER, T., WILDT, D., ELLIS, S, AND SEAL, U. (eds). 1997. Population and
habitat viability assessment for the Namibian cheetah and lion. Workshop report.
IUCN/SSC Conservation Breeding Specialist Group, Minn.
BLANCHARD, B.M. & KNIGHT, R.R. 1995. Biological consequences of relocating
grizzly bears in the Yellowstone ecosystem. J.Wildl. Mgmt. 59:560-565.
BOTHMA, J. du P., KNIGHT, M.H., le RICHE, E.A.N., & van HENSBERGEN, H.J.
1997. Range size of southern Kalahari leopards. S. Afr. J. Wildl. Res. 27:94-99.
BRANNON, R.D. 1985. Nuisance grizzly bear translocations in the Greater Yellowstone
Region. Can. Field. Nat. 101:569-575.
BREITENMOSER, U., & BREITENMOSER-WURSTEN, C. 1990. Status, conservation
needs and reintroduction of the lynx in Europe. Strasbourg, Council of Europe, Nature &
Environment Series 45.
BRYDEN, B.R. 1976. The biology of the African lion (Panthera leo Linn. 1758) in the
Kruger National Park. MSc. Thesis, Univ. Pretoria 96pp.
BURGER, J. & GOCHFIELD, M. 1994. Vigilance in African mammals: Difference
among mothers, other females and males. Behav. 131:154-169.
BURNEY, D.A. 1980. The effects of human activities on cheetah Acinonyx jubatus in the
Mara region of Kenya. MSc. thesis, University of Nairobi.
BURROUGHS, R.E.J. 1993. Care of carnivores in captivity. In The Capture and Care
Manual: Capture, Care, Accommodation and Transportation of Wild African
Animals. (ed A.A. McKenzie), Pp. 304-311. Wildlife Decision Support Services and
the South African Veterinary Foundation, Pretoria.
CARACO, T. & WOLF, L.L. 1975 Ecological determinants of group sizes of foraging
lions. Am. Nat. 109:343-352
CARBYN, L.N., ARMBUSTER, H.J., & MAMO, C. 1995. The Swift fox
reintroduction program in Canada from 1983 to 1992. In: Restoration of Endangered
Species; Conceptual Issues, Planning and Implementation. (eds. M.L. Bowles & C.J.
Whelan), pp 243-271. Cambridge University Press, Cambridge.
CARO, T.M. & COLLINS, D.A. 1987. Male cheetah social organisation and territoriality.
Ethology 74:52-64
179
CARO, T.M. 1994. Cheetahs of the Serengeti Plains. Group living in an asocial
species. University of Chicago Press, Chicago. 478pp.
CARO, T.M. 1982. A record of the cheetah scavenging in the Serengeti. Afr. J Ecol.
20:213-214.
CHILDES, S.L. 1988. Can re-introduction save the wild dog? Zimb. Wildl. 51: 27-33
CHIVERS, D.J. 1991. Guidelines for re-introductions: procedures and problems. Symp.
Zool. Soc. Lond. 62:89-99.
COBB, S. 1981. The leopard- problems of an overabundant, threatened, terrestrial
carnivore. In Problems in management of locally abundant wild mammals by P.A.
Jewell and S. Holt (eds), pp. 181-192. Academic Press, London.
COMLY, L.M. & VAUGHAN, M.R. 1995. Survival and reproduction of translocated
Virginia black bears. Int. Conf. Bear Res. Manage. 9:428-437.
CREEL, S.R. 1996. Behavioral endocrinology and social organization in dwarf
mongoooses. In Carnivore Behavior, Ecology and Evolution. Volume II. (ed J.L.
Gittleman), pp 46-78. Cornell University Press, New York.
CREEL, S.R. & WASER, P.M. 1991. Failures of reproductive suppresion in dwarf
mongooses: accident or adaptation? Behav. Ecol. 5:339-348.
CRESSWELL, W.J. & SMITH, G.C. 1992. The effects of temporally autocorrelated data
on methods of home-range analysis. In Wildlife Telemetry. by I. Priede & S. Swift. (eds).
pp272-284. Ellis Harwood, Chichester, UK.
CROOKS, K.R., SANJAYAN, M.A. & DOAK, D.F. 1998. New insights on cheetah
conservation through demographic modelling. Cons. Biol. 12(4):889-895.
DaSILVA, J., MACDONALD, D.W., & EVANS, P.G.H. 1994. Net costs of group
living in a solitary forager, the Eurasian badger: genetic evidence. J. Zool. London.
218:587-595.
DE BOER, W.F. & PRINS, H.H.T. 1990. Large herbivores that strive mightily but eat
and drink as friends. Oecologia (Berl.) 82: 264-274.
DEHN, M.M. 1990. Vigilance for predators: detection and dilution effects. Behav. Ecol
Sociobiol. 26:337-342.
DINERSTEIN, E, WIKRAMANAYAKE, E., ROBINSON, J., KARANTH, U.,
RABINOWITZ, A., OLSON, D., MATHEW, T., HEDEO, P., & CONNOR, M.
1997. A Framework for Identifying High Priority Areas and Actions for the Conservation
of Tigers in the Wild. WWF-US & Wildlife Conservation Society. 72pp.
DUBLIN, H.T. 1995. Vegetation dynamics in the Serengeti-Mara ecosystem: the role of
elephants, fire and other factors. In Serengeti II: Dynamics, Management and
180
Conservation of an Ecosystem. (eds A.R.E. Sinclair and P. Arcese). pp 49-70.
University of Chicago Press, Chicago.
DURANT, S.M, 1998. Competition refuges and coexistence: an example from Serengeti
carnivores. J.Anim. Ecol. 67:370-386.
DURANT, S.M, CARO, T.M., COLLINS, D.A., ALAWI, R.M., & FITZGIBBON, C.D.
1988. Migration patterns of Thomson’s gazelles and cheetahs on the Serengeti Plains.
Afr. J. Ecol. 26:257-268.
EATON, R.L. 1970. Hunting behavior of the cheetah. J. Wildl. Mgmt. 34:56-67.
EATON, R.L. 1974. The cheetah. Van Nostrand Reinhold, New York.
EATON, R.L.1979. Interference competition among carnivores: a model for the
evolution of social behavior. Carnivore 2:9-16.
EBEDES, H. 1993. The use of long-acting tranquillisers in captive wild animals. In: The
Capture and Care Manual: Capture, Care, Accommodation and Transportation of Wild
African Animals. (ed A.A. McKenzie), Pp. 71-99. Wildlife Decision Support Services and
the South African Veterinary Foundation, Pretoria.
ELGAR, M.A. 1989. Predator vigilance and group size in mammals and birds: A
critical review of the empirical evidence. Biol. Review 64:13-33.
ELOFF, F.C. 1964. On the predatory habits of lions and hyaenas. Koedoe 7:105-112
ELTRINGHAM, S.K. 1979. The ecology and conservation of large African mammals.
Macmillan Press, London.
EMMONS, L.H. 1988. A field study of ocelots (Felis pardalis) in Peru. Rev. Ecol.
(Terre. Vie.) 43,133-157.
FAIRALL, N. & BRAACK, H.H. 1976. Growth and development of the impala. Koedoe.
19:83-88.
FITZGIBBON, C.D. 1990a. Mixed species grouping in Thompson’s and Grant’s
gazelles: the antipredator benefits. Anim. Behav. 39: 1116-1126.
FITZGIBBON, C.D. 1990b. Why do hunting cheetahs prefer male gazelles? Anim.
Behav. 40: 837-845.
FRITTS, S.H. 1992. Reintroductions and translocations of wolves in North America: an
analysis. Wolves for Yellowstone? Report to the United States Congress 4: Research
and Analysis: 3-5 - 3-31.
FRITTS, S.H, PAUL, W.J., & MECH, L.D. 1985. Can relocated wolves survive?
Wildl. Soc. Bull. 13:459-463.
181
FRYXELL, J.M., GREEVER, J, & SINCLAIR, A.R.E. 1988. Why are migratory
ungulates so abundant? Am. Nat. 131:781-98.
GILPIN, M.E. 1987. Spatial structure and population vulnerability. In Viable Populations
for Conservation (ed M.E. Soule), pp 125-139. New York, Cambridge University
Press.
GIRALDEAU, L. & ELLIS, D. 1988. Do lions hunt in group sizes that maximise
hunter's daily food returns? Anim. Behav. 36:611-613
GITTLEMAN, J.L. & HARVEY, P.H. 1982. Carnivore home-range size, metabolic needs
and ecology. Behav.Ecol. Sociobiol. 10:57-63.
GLUCK, E. 1987. An experimental study of feeding, vigilance and predator avoidance in a
single bird. Oecologia 71: 268-272.
GOODMAN, P.S. 1981. A preliminary summary of the climatic features of Mkuzi
Game Reserve. Unpubl. N.P.B. report, Pietermaritzburg.
GOODMAN, P.S. 1990. Soil, vegetation and large herbivore relations in Mkuzi Game
Reserve, Natal. Unpubl. PhD Thesis, University of Witswatersrand, 324pp.
GOODMAN, P.S. & TOMKINSON, A.J. 1987. The past distribution of giraffe in
Zululand and its implications for reserve management. S. Afr. J. Wild. Res. 17: 28- 32.
GRAHAM, A.D. & PARKER, I.S.C. 1965. East African Wildlife Society cheetah
survey. Report by Wildlife Services. East African Wildlife Society, Nairobi. 20pp.
GREEN, J.S., GOLIGHTY, R.T., LINDSEY, S.L., & LEAMASTER, B.R. 1985. Use
of radio transmitter implants in wild canids. Gt. Basin Nat. 45:567-570.
GRIFFITH, B., SCOTT, J.M., CARPENTER, J.W. & REED, C. 1989. Translocation
as a species conservation tool: status and strategy. Science 245:477-490.
GUGGISBERG, C.A.W. 1961. Simba. Howard Tinnins, Cape Town.
GUYNN, D.C., DAVIS, J.R., & VON RECUM, A.F. 1987. Pathological potential of
intraperitoneal transmitter implants in beavers. J. Wildl. Manage 51: 605-606.
GWYNNE, M.D. & BELL, R.H.V. 1968. Selection of vegetation components by grazing
ungulates in the Serengeti National Park. Nature. 220:390-93.
HALL-MARTIN, A. 1976. Studies on the biology and productivity of the giraffe. DSc Thesis,
Univ. Pretoria.
HAMILTON, P.H. 1981. The leopard and the cheetah in Kenya. Unpubl. report to the U.S.
Fish and Wildlife Service.

182
HANBY, J.P., BYGOTT, J.D & PACKER, C. 1995. Ecology, demography and behavior
of lions in two contrasting habitats: Ngorongoro Crater and the Serengeti Plains.
Serengeti II: Dynamics, Management and Conservation of an Ecosystem. (eds A.R.E.
Sinclair and P. Arcese). pp 315-331. University of Chicago Press, Chicago.
HARRIS, S., CRESSWELL, W.J., FORDE, P.G., TREWHELLA, W.J.,
WOOLLARD,T. & WRAY, S. 1990. Home-range analysis using radio-tracking data-
a review of problems and techniques particularly as applied to the study of mammals.
Mamm. Rev. 20:97-123.
HEMKER, T.P., LINDZEY, F.G. ACKERMAN, B.B. & BUTTON, A.J. 1986.
Survival of cougar cubs in a non-hunted population. In: S.D. Miller and D.D.
Everett (eds) Cats Of the World. National Wildlife Federation, Washington DC,
pp65-76.
HERBST, L. 1991. Pathological and reproductive effects of intraperitoneal telemetry
devices on female armadillos. J. Wildl. Mgmt. 55(4):628-631.
HIRST, S.M. 1969a. Road-strip census techniques for wild ungulates in African
Woodland. J. Wildl. Mgmt. 33:40-48.
HIRST, S.M. 1969b. Predation as a regulating factor of wild ungulate populations in a
Transvaal lowveld nature reserve. Zool. Afr. 4:199-230.
HIRST, S.M. 1975. Ungulate-habitat relationships in a South African woodland/savanna
ecosystem. Wildlife Monographs 44:1-60.
HOFMEYR, M & VAN DYK, G. 1998. Cheetah introductions to two North West
parks: case studies from Pilanesberg National Park and Madikwe Game Reserve. pp
60-71 in B.L. Penzhorn (Ed.): Proceedings of a Symposium on Cheetahs as Game
Ranch Animals, S.A. Veterinary Assoc., Onderstepoort.
HOOGE, P. N. and W.M. EICHENLAUB. 1998. Animal movement extension to
Arcview. ver. 1.1. Alaska Biological Science Center, U.S. Geological Survey,
Anchorage, AK, USA. Available: http://www.absc.usgs.gov/ glba/gistools.htm.
HORNOCKER, M.G. 1970. An analysis of mountain lion predation upon mule deer and
elk in the Idaho Primitive Area. Wildlife Monographs 21,1-39.
HUNTER, L.T.B. 1996a. The reintroduction of cheetahs into Phinda Resource Reserve,
Northern Natal South Africa. In: Marker-Kraus, L. (ed) 1994-95 International
Cheetah Studbook. National Zoological Park, Washington.
HUNTER, L.T.B. 1996b. Secondary re-introductions of large cats in South Africa. Cat
News 25:14.
183
HUNTER, L.T.B. 1998a. Early post-release movements and behaviour of reintroduced
cheetahs and lions, and technical considerations in large carnivore restoration. pp 72-
82 in B.L. Penzhorn (Ed.): Proceedings of a Symposium on Cheetahs as Game Ranch
Animals, S.A. Veterinary Assoc., Onderstepoort.
HUNTER, L.T.B. 1998b. The socio-ecology of re-introduced lions in small reserves:
comparisons with established populations and the implications for management in
enclosed conservation areas. Unpubl. project proposal, Dept of Biology, Univ.
Natal.
HUNTER, L.T.B. & SKINNER, J.D. 1995. A case of cannibalism in male cheetahs. J.
Afr. Ecol, 33,169-171.
HUNTER, L.T.B. & SKINNER, J.D. 1998. Vigilance in African ungulates: The role of
predation pressure. Behav. 135:195-211.
HUNTER, L.T.B. & SKINNER, J.D. In press. Effect of habitat type on performance of
intraperitoneal and external radiotransmitters in lions. J. Wildl. Res.
JAKSIC, F.M. & DELIBES, M. 1987. A comparative analysis of food-niche relationships
and trophic guild structure in two assemblages of vertebrate predators differing in species
richness: causes, correlations and consequences. Oecologia 71:461-472.
JENNRICH, R.I. & TURNER, F.B. 1969. Measurements of non-circular home-range. J.
Theor. Biol. 22:227-237.
KELLY, M.J., LAURENSON, M.K., FITZGIBBON, C.D., COLLINS, D.A., DURANT,
S.M., FRAME, G.W., BERTRAM, C.R. & CARO, T.M. 1998. Demography of the
Serengeti cheetah population: the first 25 years. J. Zool. Lond. 244:473-488.
KENWARD, R. 1987. Wildlife Radio Tagging: Equipment, field techniques and data
analysis. Academic Press, London. 222pp.
KLEIMAN,D.G. 1989. Reintroduction of captive mammals for conservation. BioScience
39:152-153.
KOCH, T, WHITELAW, A., & ASHER, V. 1995. Idaho wolf update. Wolf! magazine
18-21.
KOEHLER, D.K., REYNOLDS, T.D. & ANDERSON, S.H. 1987. Radio- transmitter
implants in 4 species of small mammals. J. Wildl. Mgmt. 51: 105-108.
KORSCHGEN, C.E., MAXSON, S.J. & KUECHLE, V.B. 1984. Evaluation of
implanted radio transmitters in ducks. J. Wildl. Mgmt.48:982-987.
184
KORSCHGEN, C.E., KENOW, K.P., GENDRON-FITZPATRICK, A., GREEN, W.L.
& DEIN, J. 1996. Implanting intra-abdominal radiotransmitters with external whip
antennas in ducks. J. Wildl. Manage. 60:132-137.
KNIGHT, M.H., KNIGHT-ELOFF, A.K. & BORNMAN, J.J. 1988. The importance of
borehole water and lick sits to Kalahari ungulates. J. Arid Env. 15:269-281.
KREBS, J.R. & DAVIES, N.B. 1992. Behavioural Ecology, an Evolutionary Approach.
3rd Edition. Blackwell Scientific Publications, Oxford.
KRUGER, J.E. 1988. Interrelationships between the larger carnivores of the Klasserie
Private Nature Reserve with special reference to the leopard Panthera pardus (Linn.
1758) and the cheetah Acinonyx jubatus (Schreber 1775). Unpubl. M.Sc. Thesis.
Univ. of Pretoria, 227p.
KRUUK, H. 1972. Group territories of carnivores: empires and enclaves. In Behavioural
Ecology. Ecological Consequences of Adaptive Behaviour. (eds R.M. Sibly and R.H.
Smith). pp. 521-536. Blackwell Scientific Publications. Oxford.
KRUUK, H. 1972. The Spotted Hyaena. A Study of Predation and Social Behavior.
University of Chicago Press, Chicago.
LACY, R.C 1987. Loss of genetic diversity from managed populations: Interacting effects
of drift, mutation, immigration, selection and population subdivision. Cons. Biol. 1:143-
58.
LAGORY, K.E. 1986. Habitat, group size and the behaviour of white-tailed deer.
Behav. 98: 168-179.
LAURENSON, M.K. 1994. High juvenile mortality in cheetahs and its consequences for
maternal care. J.Zool. Lond. 234:387-408.
LAURENSON, M.K. 1995a. Cub growth and maternal care in cheetahs. Behav. Ecol 6:405-
409
LAURENSON, M.K. 1995b. Implications of high offspring mortality for cheetah
population dynamics. In Serengeti II: Dynamics, Management and Conservation of an
Ecosystem. (eds A.R.E. Sinclair and P. Arcese). pp 385-399. University of Chicago
Press, Chicago.
LAURENSON, M.K., CARO, T.M., & BORNER, M. 1992. Female cheetah reproduction
Nat. Geo. Res. Expl. 8.64-75.
LAZARUS, J. 1979. The early warning function of flocking in birds: an experimental study
with captive quelea. Anim. Behav. 27: 855-865.
185
LEUTHOLD, W. 1977 African ungulates, a comparative review of their ethology and
behavioural ecology. Springer Verlag, Berlin.
LIMA, S.L. 1995. Back to the basics of anti-predatory vigilance: the group size effect.
Anim. Behav. 49:11-20.
LIMA, S.L & ZOLLNER, P.A. 1996. Anti-predatory vigilance and the limit to
collective detection: visual and spatial separation between foragers. Behav. Ecol.
Sociobiol. 38:355-363.
LINNELL, J.D.C., ODDEN, J., SMITH, M.E., AANES, R., SWENSON, J. 1997.
Translocation of carnivores as a method for problem animal management: a review.
Biodiv. Conserv. 6:1245-1257.
LINNELL, J.D.C., AANES, R. & ANDERSEN, R. 1995. Who killed bambi? The role of
predation in the neonatal mortality of temperate ungulates. Wildl. Biol. 1:209-223.
LOW, A.B. & REBELO, A.G. 1996. Vegetation of South Africa, Lesotho and Swaziland.
Dept. Environmental Affairs and Tourism, Pretoria. 84pp.
MACDONALD, D.W. 1983. The ecology of carnivore social behaviour. Nature
301:379-384.
MACDONALD, D.W & MOEHLMAN, P.D. 1982. Cooperation, altruism and restraint
in the reproduction of carnivores. Persp. Ethol. 5:433-467.
MACDONALD, D.W., APPS, P.J., CARR, G.M. & KERBY, G. 1986. Social
dynamics, nursing coalitions and infanticide among farm cats Felis catus. Adv.
Ethol. 28,1-68. Verlag Paul Parey, Berlin.
MADDOCK, L. 1979. The ‘migration’ and grazing succession. In Sinclair A.R.E. &
Norton-Griffiths, M. (Eds). Serengeti. Dynamics of an ecosystem. pp104-129.
University of Chicago Press, Chicago.
MADDOCK, A., ANDERSON, A., CARLISLE, F., GALLI, N., JAMES, A.,
VERSTER, A., & WHITFIELD, W. 1996. Changes in lion numbers in Hluhluwe-
Umfolozi Park. Lammergeyer 44:6-18.
MAKACHA, S. & SCHALLER, G.B. 1969. Observations on lions in Lake Manyara
National Park, Tanzania. E. Afr. Wildl. J. 7:99-103.
MARKER-KRAUS, L., D.KRAUS, D., BARNETT, D., & HURLBUT, S. 1996.
Cheetah Survival on Namibian Farmlands. Cheetah Conservation Fund. 85pp.
MARKER-KRAUS, L.1996. Cheetah relocation, Cheetah Conservation Fund Newsletter
6:5
186
MASON, D.R 1985. Post-natal growth and physical condition of warthog in Zululand.
S.Afr. J. Wildl. Res. 15:89-97.
MAUD, R.R. 1980. The climate and geology of Maputaland. In: The Ecology of
Maputaland. (eds M.N. Bruton and K.H. Cooper), pp 1-7. Rhodes University and the
Wildlife Society of Southern Africa.
MCDOUGAL, C. 1988. Leopard and tiger interactions at Royal Chitwan National Park,
Nepal. J. Bombay Natl. Hist. Soc. 85: 609-11.
MCKENZIE, A.A., MELTZER, D.G.A., LE ROUX, P.G., & GOSS, R.A. 1990. Use
of implantable radio transmitters in large African carnivores. S.Afr. J. Wildl. Res.
20(1): 33-35.
MCVITTIE, R. 1979. Changes in the social behaviour of the South West African
cheetah. Madoqua, 11,171-184.
MELTZER, D.G.A. 1998. Reproduction in male cheetahs. In: 6th Biennial International
Symposium of Wildlife Utilization. Faculty of Vet. Sci, Onderstepoort, Pretoria, pp 35-
54.
MILLER, S.D. & BALLARD, W.B. 1982. Homing of transplanted Alsakan brown
bears. J.Wildl. Mgmt. 46:869-876.
MILLS, M.G.L. 1990. Kalahari hyaenas. London, Unwin Hyman.
MILLS, M.G.L. 1991. Conservation management of large carnivores in Africa. Koedoe
34:81-90.
MILLS, M.G.L. 1992. A comparison of methods used to study food habits of large African
carnivores. In Wildlife 2001: populations by D.R. McCullough and R.H. Barrett. (eds).
pp1112-1124, Elsevier Applied Science, London.
MILLS, M.G.L. 1996. Methodological advances in capture, census,and food habits
studies of large African carnivores. In Carnivore Behavior, Ecology and Evolution.
Volume II. (ed J.L. Gittleman), pp 223-242. Cornell University Press, New York.
MILLS, M.G.L. & RETIEF, P.F. 1984. The effect of windmill closure on the movement
patterns of ungulates along the Aoub riverbed. Koedoe suppl. 107-118.
MILLS, M.G.L. & SHENK, T.M. 1992. Predator-prey relationships: the impact of lion
predation on wildebeest and zebra populations. J.Anim. Ecol. 61:693-702.
MITCHELL, B, SHENTON, J. UYS, J. 1965. Predation on large mammals in the Kafue
National Park, Zambia. Zool. Afr. 1:297-318.
MIZUTANI, F. & JEWELL, P.A. 1998. Home-range and movements of leopards on a
livestock ranch in Kenya. J.Zool. Lond. 244:269-286.
187
MOLL, E.J. 1980. Terrestrial plant ecology. In The Ecology of Maputaland. (eds M.N.
Bruton and K.H. Cooper), pp52-68. Rhodes University and the Wildlife Society of
Southern Africa.
MOORE, D.E. & SMITH, R. 1990. The red wolf as a model for carnivore
reintroductions. Symp. Zool. Soc. Lond. 65:263-278.
NOWELL, K & JACKSON, P. 1996. Wild Cats: Status survey and conservation action
plan. IUCN/SSC, Gland, Switzerland.
NUDDS, T.D. 1978. Convergence of group size strategies by mammalian social
carnivores. Am. Nat. 112:957-960.
ORFORD, H.J.L., PERRIN, M.R., AND BERRY, H.H., 1988. Contraception,
reproduction and demography of free-ranging Etosha lions (Panthera leo). J. Zool.
Lond. 216:717-733.
PACKER, C. & PUSEY A.E.1983. Adaptations of female lions to infanticide by
incoming males. Am. Nat. 121:717-728.
PACKER, C. & PUSEY, A.E. 1984. Infanticide in carnivores. In: G. Hausfater and S.B.
Hrdy (eds), Infanticide: Comparative and evolutionary perspectives. Aldine, New York,
pp31-42.
PACKER, C. & RUTTAN, L. 1988. The evolution of cooperative hunting. Am Nat.
132:159-198.
PACKER, C.P., HERBST L, PUSEY, A.E., BYGOTT, D.J., HANBY, J.P. CAIRNS,
S.J. & BORGERHOF MULDER, M. 1988. Reproductive success of lions. In
Reproductive Success: Studies of Individual Variation in Contrasting Breeding
Systems. (ed T.H. Clutton-Brock). pp 363-383. University of Chicago Press,
Chicago.
PACKER, C., SCHELL, D. & PUSEY, A.E. 1990. Why lions form groups :food is not
enough. Am. Nat. 136:1-19.
PANWAR, H.S. & RODGERS, W.A., 1986. The reintroduction of large cats into
wildlife protected areas. Indian Forestor. 112:939-944.
PEEK, J.M., BROWN, D.E., KELLERT, S.R., MECH, L.D., SHAW, J.H., AND VAN
BALLENNBERGHE, V. 1991. Restoration of wolves in North America. Wildl. Soc.
Tech Rev. 91-1:1-21.
188
PETTIFER, H.L. 1981a. The experimental release of captive-bred cheetahs (Acinonyx
jubatus) into the natural environment. In Worldwide Furbearer Conference Proceedings.
(eds J.A. Chapman & D. Pursely). pp.1001-1024. R.R. Donelly & Sons, Co. Falls
Church, VA.
PETTIFER, H.L. 1981b. Aspects of the ecology of cheetahs (Acinonyx jubatus) on the
Suikerbosrand Nature Reserve. In Worldwide Furbearer Conference Proceedings. (eds
J.A. Chapman & D. Pursely). pp.1121-1142. R.R. Donnelly & Sons, Co. Falls
Church, VA.
PHILLIPS, J.A. 1993 Bone consumption by cheetahs at undisturbed kills: evidence for a
lack of focal-palatine erosion. J. Mamm. 74:487-492
PIENAAR, U. de V. 1969. Predator-prey relationships amongst the larger mammals of
the Kruger National Park. Koedoe 12:108-187.
POWELL, G.V.N. 1974. Experimental analysis of the social value of flocking by
starlings in relation to predation and foraging. Anim. Behav. 22: 501-505.
POWELL, R.A., ZIMMERMAN, J.W., & SEAMAN, D.E. 1998. Ecology and
Behaviour of North American Black Bears: Home Ranges, Habitat and Social
Organisation. Chapman & Hall, London, 203pp.
PRINS, H.H.T. & IASON, G. 1989. Dangerous lions and nonchalant buffalo. Behav. 108:
262-296.
PRINS, H.H.T. 1996. Ecology and Behaviour of the African buffalo: Social inequality and
decision making. Chapman & Hall, London.
PURCHASE, G.K. 1998. The Matusadona cheetah project: lessons from a wild-to-wild
translocation. pp 83-89 in B.L. Penzhorn (Ed.): Proceedings of a Symposium on
Cheetahs as Game Ranch Animals, S.A. Veterinary Assoc., Onderstepoort.
PUSEY A.E. & PACKER, C. 1987. The evolution of sex-based dispersal in lions.
Behav. 101: 275-310.
PUSEY A.E. & PACKER, C. 1994. Infanticide in lions: consequences and counter-
strategies. In: S. Parmigiani and F. von Saal (eds), Infanticide and Parental Care,
Harwood Academic Publishers, London, pp 277-299.
QUINN, N.W.S. & PARKER, G. 1987. Lynx. In: M. Novak, J.A. Baker, M.E.
Obbard and B. Malloch (eds) Wild Furbearer Management and Conservation in North
America. Ministry of Natural Resources, Ontario: pp 682-695.
189
RABINOWITZ, A.R. & WALKER, S.R. 1991. The carnivore community in a dry
tropical forest mosaic in Huai Kha Khaeng Wildlife Sanctury, Thailand. J. Trop. Ecol.
7:37-47.
RALLS, K., SINIFF, D.B., WILLIAMS, T.D., KUECHLE, V.B. 1989. An
intraperitoneal radio transmitter for sea otters. Mar. Mamm. Sci. 5(4):376-381.
RAUTENBACH, I.L., SKINNER, J.D. & NEL, J.A.J. 1980. The past and present status
of mammals of Maputaland. In: The Ecology of Maputaland. (eds Bruton, M.N. and
K.H. Cooper), pp 322-345. Rhodes University and the Wildlife Society of Southern
Africa.
RAUTENBACH, I.L. & NEL, J.A.J. 1978. Coexistence in Transvaal Carnivora. Bull.
Carn. Mus. Nat. Hist. 6:138-145.
READING, R.P & CLARK, T.W. 1996. Carnivore reintroductions: an
interdisciplinary examination. In Carnivore Behavior, Ecology and Evolution.
Volume II. (ed J.L. Gittleman), pp 296-336. Cornell University Press, New York
REID, D.G., MELQUIST, W.E., WOOLINGTON, J.D., & NOLL, J.M. 1986.
Reproductive effects of intraperitoneal transmitter implants in river otters. J. Wildl.
Mgmt. 50(1): 92-94.
REPASKY, R.P. 1996. Using vigilance behaviour to test whether predation promotes
habitat partitioning. Ecology 77:1880-1887.
ROELKE, M.E., MARTENSON, J.S. & O’BRIEN, S.J. 1993. The consequences of
demographic reduction and genetic depletion in the endangered Florida panther. Curr.
Biol. 3:340-350.
ROGERS, L.L. 1986. Effects of translocation distance on frequency of return by adult black
bears. Wildl. Soc. Bull. 14:76-80.
ROSENWEIG, M.L. 1966. Community structure in sympatric Carnivora. J. Mamm.
47:602-612.
ROWE-ROWE, D.T. 1992. The Carnivores of Natal. Natal Parks Board,
Pietermaritzburg, 31pp.
RUDNAI, J. 1973. Reproductive biology of lions (P.l.massaica) in Nairobi National Park.
E. Afr. Wild. J. 11:241-253.
RUDNAI, J. 1974. The pattern of lion predation in Nairobi Park. E. Afr. Wild. J.
12:213-225.
RUDNAI, J.A. 1973. The Social life of the lion. A study of the behaviour of wild lions
(P.l. massaica [Newmann]) in the Nairobi National Park, Kenya. Med. & Tech. Pub.
Co. Ltd., Great Britain.
190
RUGGEIRO, R.G. 1991. Prey selection of the lion in the Manovo-Gounda-St Floris
National Park, Central African Republic. Mammalia 55:23-33.
RUTH, T.K., LOGAN, K.A., SWEANOR, L.L., SMITH, J.F. & TEMPLE, L.J.
1993. Evaluating mountain lion translocation. Final report, Hornocker Widlife
Research Institute, pp46.
SANDELL, M. 1989. The mating tactics and spacing patterns of solitary carnivores. In
Carnivore Behavior, Ecology and Evolution. Volume I. (ed J.L. Gittleman), pp 164- 182.
Cornell University Press, New York.
SANDWITH, T. & WHATELEY, A. 1987. Results of the lion monitoring programme
in the Hluhluwe & Umfolozi Game Reserves for the period Nov. 1984- Dec. 1986. NPB
unpubl. report. 24p.
SARGEANT, A.B. 1980. Approaches, field considerations and problems associated with
radio tracking carnivores. In: Alamaner, C.J. & D.W. Macdonald (Eds). A Handbook
on Biotelemetry and Radio Tracking. Pp 57-64. Pergamon Press, Oxford.
SCHALLER, G.B. 1967. The Deer and the Tiger. University of Chicago Press,
Chicago.
SCHEEL, D. 1993. Watching for lions in the grass: the usefulness of scanning and its
effects during hunts. Anim. Behav 46: 695-704.
SCHEEL, D. & PACKER, C. 1991. Group hunting behaviour of lions: a search for
cooperation. Anim. Behav. 41:697-709.
SCHEEL, D. & PACKER, C. 1995. Variation in predation by lions: tracking a
movable feast. In Serengeti II: Dynamics, Management and Conservation of an
Ecosystem. (eds A.R.E. Sinclair and P. Arcese). pp 297-299. University of Chicago
Press, Chicago.
SCHMIDT, J.L.1984. Common duiker measurements in Natal and Zambia- an example of
Bergmann’s and Allen’s Rules. Lammergeyer 32:8-10.
SCHULZE, B R. 1965. Climate of South Africa Part 8. General Survey. South African
Weather Bureau. Government Printer, Pretoria.
SEAMAN, D.E. & POWELL, R.A. 1996. An evaluation of the accuracy of kernel density
estimators for home-range analysis. Ecology. 77:2075-2085.
SEIP, D.R.1992. Factors limiting woodland caribou populations and their inter- relationships
with wolves and moose in southeastern British Columbia. Can. J. Zool. 70:1494-1503.
SILVA, M. & DOWLING, J.A. 1995. CRC Handbook of Mammalian Body Masses. CRC
Press, New York, 359pp.

191
SINCLAIR, A.R.E. 1979. Dynamics of the Serengeti ecosystem: process and pattern. pp1-
30 in Sinclair A.R.E. & Norton-Griffiths, M. (Eds). Serengeti. Dynamics of an
ecosystem. University of Chicago Press, Chicago.
SINCLAIR, A.R.E. 1995. Population limitation of resident herbivores. In Serengeti II:
Dynamics, Management and Conservation of an Ecosystem. (eds A.R.E. Sinclair and
P. Arcese). pp 194-219. University of Chicago Press, Chicago.
SKINNER, J.D. & SMITHERS, R.H.N. 1990. The mammals of the Southern African
Subregion. 2nd Edition. Univ. of Pretoria, Pretoria.
SKOGLAND, T. 1991. What are the effects of predators on large ungulate populations?
OIKOS 61:401-411.
SMITH, J.L.D. & MCDOUGAL, C.W. 1990. The contribution of variance in lifetime
reproduction to effective population size in tigers. Cons. Biol.5:484-490.
SMITH, K.G. & CLARK, J.D. 1994. Black bears in Arkansas: characteristics of a
successful translocation. J. Mamm. 75:309-320.
SMUTS, G.L. 1974. Growth, reproduction and population characteristics of Burchell’s
zebra in the Kruger National Park. Dsc thesis, Univ. Pretoria.
SMUTS, G.L. 1976. Population characteristics and recent history of lions in two parts of
the Kruger National Park. Koedoe 19:153-164.
SMUTS, G.L. 1978. Reproduction and social organisation of lions from the Kruger
National Park. Carnivore 1:17-28
SOULÉ, M.E. 1980. Thresholds for survival: maintaining fitness and evolutionary
potential. In: Conservation Biology: An Evolutionary-Ecological Perspective. (eds M.E.
Soulé and B.A. Wilcox), pp151-169. Sinauer, Massachusetts.
STANDER, P.E. 1990. A suggested management strategy for stock-raiding lions in
Namibia. S. Afr. J. Wild. Res. 20:37-43.
STANDER, P.E. 1991. Demography of lions in Etosha National Park. Madoqua 18:1-9.
STANDER, P.E. 1992a. Cooperative hunting in lions: the role of the individual.
Behav. Ecol. Sociobiol. 29:445-454.
STANDER, P.E. 1992b. Foraging dynamics of lions in a semi-arid environment. Can. J.
Zool. 70:8-21.
STANLEY-PRICE, M,R. 1989. Animal reintroductions: the Arabian oryx in Oman.
Cambridge University Press, Cambridge.
STEELE, N.A. 1970. A preliminary report on the lions in the Umfolozi and Hluhluwe
Game Reserves. Lammergeyer 11:68-79.
192
SUNQUIST, M.E. & SUNQUIST, F. 1989. Ecological constraints on predation by large
felids. pp283-301 in Gittleman, J.L. (Ed), Carnivore behavior, ecology and
evolution. Cornell Univ. Press, New York.
SUNQUIST, M.E., SUNQUIST,F. & DANEKE, D.E. 1989. Ecological separation in a
Venezuelan Ilanos carnivore community. pp.197-232 in Redford, K.H. & Eisenberg
J.F. (Eds). Advances in Neotropical mammalogy. Sandhill Crane Press, Gainesville,
FL. 614pp.
SWIHART, R.K. & SLADE, N.A. 1985. Testing for independence of observations in animal
movements. Ecol. 66:1176-1184.
UNDERWOOD, R. 1982a. Vigilance behaviour in grazing African Antelopes. Behav.
79:81-107
UNDERWOOD, R. 1982b. On surveying ungulate groups. Afr.J. Ecol. 20:105-111.
VAN AARDE, R.J. 1987a. Reproduction in the Cape porcupine: an ecological perspective.
S.Afr. J. Sci. 83:605-607.
VAN AARDE, R.J. 1987b. Demography of a Cape porcupine population. J. Zool. London.
213:205-212.
VAN AARDE, R.J. & SKINNER, J.D.1986. Pattern of space use by relocated servals Felis
serval. Afr. J. Ecol. 24:94-101.
VAN DER MEULEN, J.H. 1977. Notes on the capture and translocation of stock-
raiding lions in north eastern and north western Rhodesia. S. Afr. J. Wildl. Res. 7:15-
17.
VAN DYK, G. 1997. Reintroduction techniques for lion (Panthera leo). In: Proceedings
of a Symposium on Lions and Leopards as Game Ranch Animals. (ed. J. van
Heerden), pp 82-91. Wildlife Group of the SA Veterinary Association,
Onderstepoort.
VAN ORDSOL, K.G. 1982. Ranges and food habits of lions in Ruwenzori National Park,
Uganda. Symp. Zol. Soc. Lond. 49:325-340.
VAN ORDSOL, K.G. 1984. Foraging behaviour and hunting success of lions in Queen
Elizabeth National Park, Uganda. Afr. J. Ecol. 22:79-99.
VAN ORDSOL, K.G, HANBY, J.P. & BYGOTT, J.D. 1985. Ecological correlates of lion
social organisation. J.Zool. Lond. 206:97-112.
VAN VUREN, D. 1989. Effects of intraperitoneal transmitter implants on yellow-
bellied marmots. J. Wildl. Mgmt. 53(2):320-323.
193
VENTER, J. AND WHATELEY, A. 1985. Results of the lion monitoring programme in
the Hulhluwe-Umfolozi Game Reserves for the period November 1983-October
1984. Unpublished report, Natal Parks Board, 24pp.
VILJOEN, P.C. 1993. The effects of change in prey availability in lion predation in a large
natural ecosystem in northern Botswana. Symp. Proc. Zool. Soc. 65:
VINCENT, J. 1972. Reproduction in the impala with particular reference to the Mkuzi
Game Reserve, Zululand. M.Sc. thesis, University of Pretoria.
WALTHER, F. 1969. Flight behaviour and avoidance of predators in Thompson’s
gazelle. Behav. 34:184-221.
WELLS, M.P. 1996. The social role of protected areas in the new South Africa. Envir.
Conserv. 23(4): 322-331.
WEMMER, C. & SUNQUIST, M. 1988. Felid reintroductions: economic and energetic
considerations. In Proceedings of the 5th International Snow Leopard Sypmosium. (ed
H. Freeman), pp193-205. ISLT and Wildlife Institute India.
WHATELEY, A. & BROOKS, P.M. 1985 The carnivores of the Hluhluwe and
Umfolozi Game Reserves, 1973-1982. Lammergeyer 35:1-27.
WILSON, V.J. 1970. Data from the culling of kudu in the Kyle National Parl. Arnoldia
Rhod. 4:1-26.
WORTON, B.J. 1987. A review of models of home-range for animal movement. Ecol.
Model. 38:277-298.
WORTON, B.J. 1989. Kernel models for estimating the utilization distribution in home
range studies. Ecology. 70:164-168.
WORTON, B.J. 1995. Using Monte Carlo simulation to evaluate kernel-basedd home- range
estimators, J.Wildl. Mgmt. 59:794-800.

194
YALDEN, D.W. 1993. The problems of reintroducing carnivores. Symp. Zool. Soc.
Lond. 65:289-304.
ZANK, C.M. & J.T.DuTOIT. 1996. Translocation as a management option for cheetah
Acinonyx jubatus conservation: A Zimbabwean case-study. In: Proceedings of the 1996
ZSSA Symposium, p 120. Zoological Society of Southern Africa. Abstract only.
ZAR, J.H. 1984. Biostatisitical Analysis. Prentice-Hall, New Jersey, 718pp.
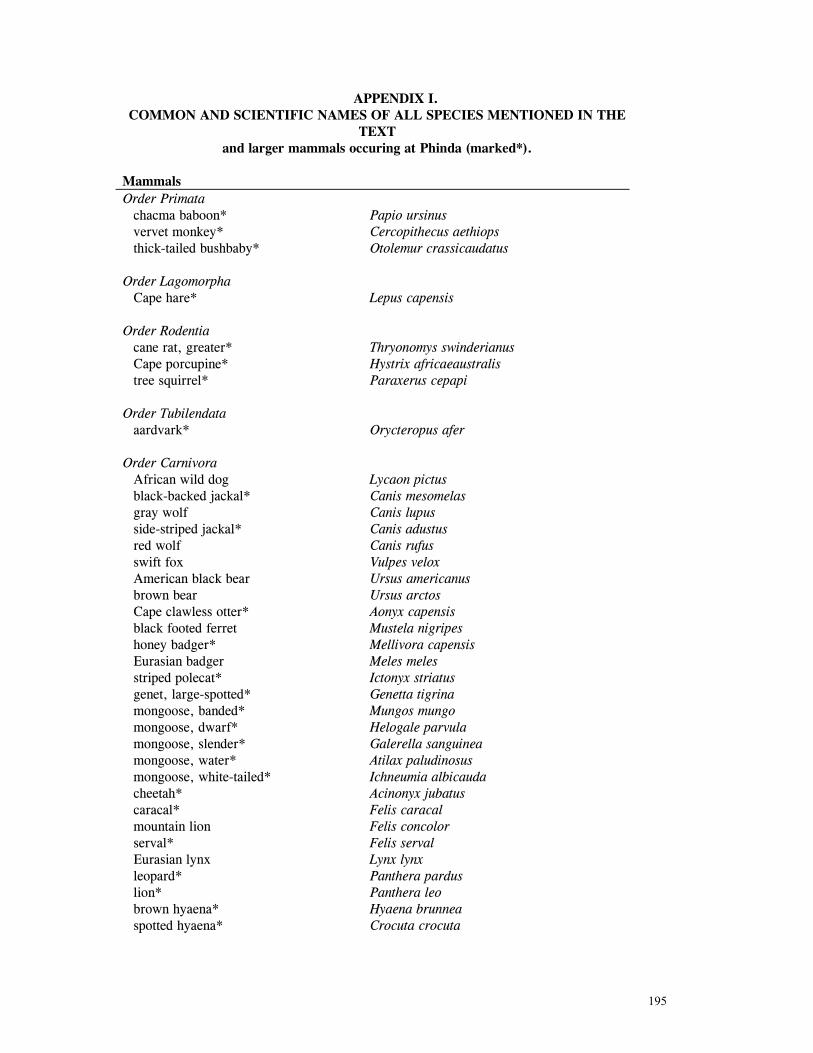
195
APPENDIX I. COMMON AND SCIENTIFIC NAMES OF ALL SPECIES MENTIONED IN THE
TEXT and larger mammals occuring at Phinda (marked*).
Mammals Order Primata
chacma baboon* Papio ursinus vervet monkey* Cercopithecus aethiops thick-tailed bushbaby* Otolemur crassicaudatus
Order Lagomorpha Cape hare* Lepus capensis
Order Rodentia
cane rat, greater* Thryonomys swinderianus Cape porcupine* Hystrix africaeaustralis tree squirrel* Paraxerus cepapi
Order Tubilendata
aardvark* Orycteropus afer Order Carnivora
African wild dog Lycaon pictus black-backed jackal* Canis mesomelas gray wolf Canis lupus side-striped jackal* Canis adustus red wolf Canis rufus swift fox Vulpes velox American black bear Ursus americanus brown bear Ursus arctos Cape clawless otter* Aonyx capensis black footed ferret Mustela nigripes honey badger* Mellivora capensis Eurasian badger Meles meles striped polecat* Ictonyx striatus genet, large-spotted* Genetta tigrina mongoose, banded* Mungos mungo mongoose, dwarf* Helogale parvula mongoose, slender* Galerella sanguinea mongoose, water* Atilax paludinosus mongoose, white-tailed* Ichneumia albicauda cheetah* Acinonyx jubatus caracal* Felis caracal mountain lion Felis concolor serval* Felis serval Eurasian lynx Lynx lynx leopard* Panthera pardus lion* Panthera leo brown hyaena* Hyaena brunnea spotted hyaena* Crocuta crocuta
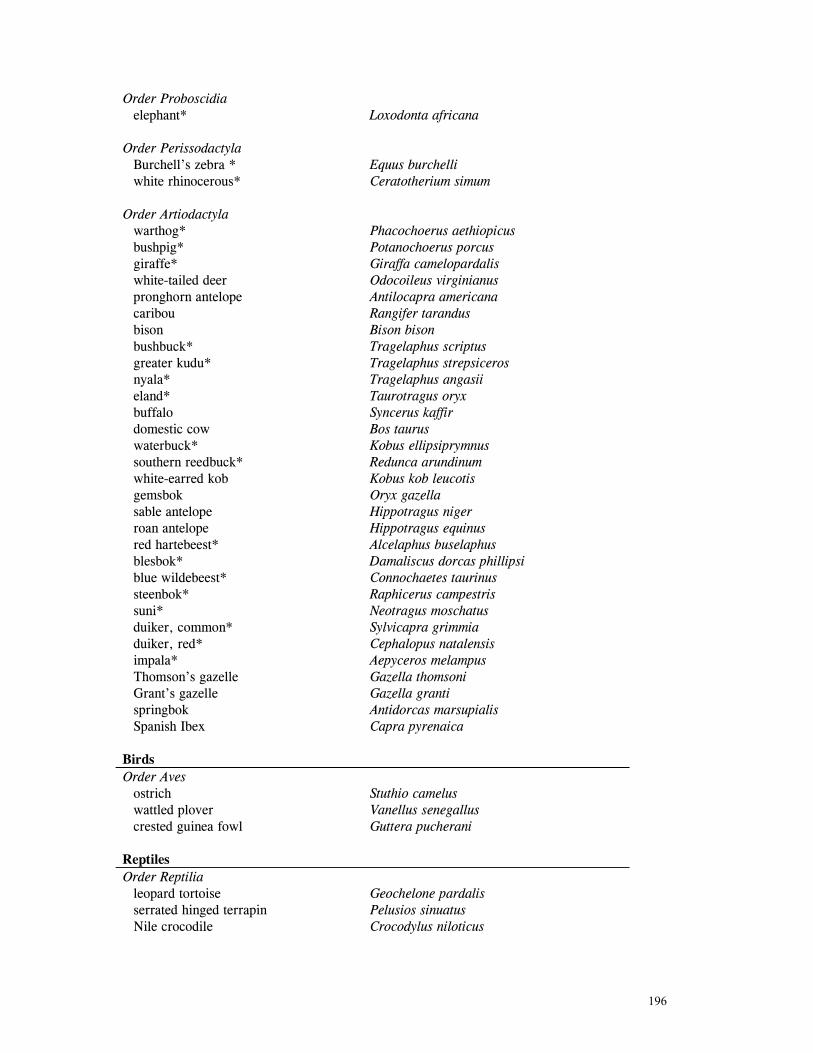
196
Order Proboscidia elephant* Loxodonta africana
Order Perissodactyla
Burchell’s zebra * Equus burchelli white rhinocerous* Ceratotherium simum
Order Artiodactyla
warthog* Phacochoerus aethiopicus bushpig* Potanochoerus porcus giraffe* Giraffa camelopardalis white-tailed deer Odocoileus virginianus pronghorn antelope Antilocapra americana caribou Rangifer tarandus bison Bison bison bushbuck* Tragelaphus scriptus greater kudu* Tragelaphus strepsiceros nyala* Tragelaphus angasii eland* Taurotragus oryx buffalo Syncerus kaffir domestic cow Bos taurus waterbuck* Kobus ellipsiprymnus southern reedbuck* Redunca arundinum white-earred kob Kobus kob leucotis gemsbok Oryx gazella sable antelope Hippotragus niger roan antelope Hippotragus equinus red hartebeest* Alcelaphus buselaphus blesbok* Damaliscus dorcas phillipsi blue wildebeest* Connochaetes taurinus steenbok* Raphicerus campestris suni* Neotragus moschatus duiker, common* Sylvicapra grimmia duiker, red* Cephalopus natalensis impala* Aepyceros melampus Thomson’s gazelle Gazella thomsoni Grant’s gazelle Gazella granti springbok Antidorcas marsupialis Spanish Ibex Capra pyrenaica
Birds Order Aves
ostrich Stuthio camelus wattled plover Vanellus senegallus crested guinea fowl Guttera pucherani
Reptiles Order Reptilia
leopard tortoise Geochelone pardalis serrated hinged terrapin Pelusios sinuatus Nile crocodile Crocodylus niloticus
197
APPENDIX II
IMPLANTED AND EXTERNAL TRACKING TRANSMITTERS: A COMPARISON OF
PERFORMANCE IN DIFFERENT HABITAT TYPES IN LIONS.
Introduction.
Radio-telemetry is now a widely-used effective tool for locating and studying free-
ranging animals. Radio-transmitters are usually attached to the animal externally, by means of
collars, harnesses and so forth. However, where a species’ behaviour, morphology or habitat
precludes this option, researchers have experimented with internal implantation of transmitters,
usually in the intraperitoneal cavity or sub-cutaneously. Although implantation presents potential
problems such as surgical trauma, anaesthesia risks, post-operative infection and pathological
effects on organ function (Guyunn et al 1987; Herbst 1991), reported success of the procedure is
high (Reid et al 1986; Van Vuren, 1989; Korshgen et al 1996).
Surgical complications aside, a very real limitation of implantable transmitters is their
reduced reception range when compared to external transmitters (Green et al 1986), as a result of
short antennas (Korschgen et al 1996) and signal absorbtion by body tissue (Kenward 1987).
Although considerable experimentation with implantable transmitters has been conducted (and is
ongoing), most studies have involved birds, or small mammals and data on their performance in
large mammals are sparse.
Increasingly, managers in wildlife tourism ventures are seeking to balance their need for
locating animals with the negative aesthetic impact of radio-collars on the tourism experience.
This is particularly pertinent for carnivore re-introduction efforts in South Africa where constant
monitoring may be a requirement for release by conservation authorities (Chapter 2). Implanted
transmitters are widely perceived as the solution, but a comparison between implants and radio-
collars in large carnivores is lacking and hence, choices being made between telemetry options are
not necessarily suitable for local requirements.
Although some studies have yielded impressive results (Ralls et al, 1989; McKenzie et al
1990), the effect of local conditions on performance is largely unknown. Vegetation, terrain, soil
type and climatological conditions apparently all affect reception distance (Sargeant 1981,

198
Kenward 1987), and while most reseachers will vouch for sometimes unpredictable performance
under changing conditions, empirical data on the effects of environmental influences are rare.
Mckenzie et al (1990) successfully implanted leopards and spotted hyaenas in Botswana
and reported maximum reception distances of 1.5km to 2.5km (depending on transmitter model)
from the ground. Although they mention that terrain type can affect reception range, they provide
no details on the habitat in which their trials took place. Green et al (1986) compared implants
and collars in captive north American canids held in large enclosures, rating signal quality at a
fixed distance and established that signals from implants were inferior to collars, but again, did
not provide data on environmental influences.
The opportunity to explore the performance of implants in difficult conditions for
telemetry arose in the present study when Phinda expressed a desire to reduce the use of radio-
collars on re-introduced cats due to negative feedback from paying tourists. This section reports
on the results of one experiment in which a male lion was surgically implanted with a transmitter,
enabling me to compare the signal reception of the implanted lion in three habitat types with the
reception of a radio-collar carried by a lioness in the same social group. I conducted performance
trails in three habitat classes to establish if vegetation characterisitics (particularly density)
affected signal strength.
Materials and methods.
A detailed account of the surgical procedure is beyond the focus and expertise of this
section and a qualified vet should always be retained to perform these types of operations. A brief
summary is included here by way of introduction.
The subject, a 30 month old male lion, was darted with 500mg Zoletil after a holding
period in captivity for three days during which he was starved. While sedated, normal saline was
administered intravenously for the duration of the operation, which lasted approximately 50
minutes. A mid-ventral incision approximately 7 cm long was made through the skin and linea
alba into the abdominal cavity. The transmitter (model IMP 400/L, 100 x 35mm, weight 200g;
TelonicsTM, Mesa, Arizona) was inserted into the abdominal cavity and sutured into the omentum
using No. 2-0 chromic catgut. When the transmitter was in place, the muscle layers and skin were
sutured closed using No. 2 monofilament nylon. During all stages of the operation, the signal
reception was constantly monitored to be sure the implant was functioning. The patient was
allowed to recover in a large (80m2) outdoor enclosure and released 24 hrs after the operation.
Apart from licking the incision up to 3 days after surgery, he appeared indifferent to the wound
and did not disturb sutures. There was no evidence of infection or trauma to the wound site
following healing. He reunited with his pride the same day as release.
199
The implanted lion’s social group included a female fitted with a radio-collar (see Chapter 2 for
details on transmitter). Whenever this group was located stationary, I drove away from them
along a straight compass bearing and determined the respective distances at which the signals
from the implant and the collar became inaudible. Initially I checked every 100m, decreasing to
the nearest 50m as signal strength weakened. Distance was measured from the vehicle’s odometer
or later from topographic maps when it was impossible to maintain a straight line between myself
and the animals. I conducted the measurements in three different habitat types which follow
descriptions in Chapter 2. The habitat types were:
i. grassland. Tall tussocked grassland essentially devoid of large woody vegetation,
ii. open woodland. Acacia-dominated woodland with a canopy less than 6m, with trees
occurring >10m apart and a sparse sub-canopy,
iii. closed woodland. Mixed Acacia and Terminalia woodland dominated by large (7-15m
high) trees and having a dense sub-canopy of smaller trees.
All measurements were taken at ground level. After I had established the maximum
distance of signal reception, I drove back to the lions to ensure they had not changed location
during the trial. I conducted 34 such trials between March and June 1993 when the implanted
male was killed in a poacher’s snare.
A very obvious difference between transmitter types in their maximum reception distance
was immediately apparent (see Results) and statistical tests would be meaningless to confirm this.
To examine whether this difference was affected by habitat type, I compared the difference
between collar and implant performance in each habitat type using a one-way ANOVA, followed
by a Newman-Keuls test, a conservative post hoc comparison of means, to determine where
differences existed.
Results.
The mean distance of signal reception for both transmitters in different habitat types is
presented in Fig. 1 . In all habitats, the collar could be received at least three times as distant as
the implant. The maximum distance the implant was received was 850m (in grassland) compared
to 2800m for the collar in the same habitat (Table 1). In some trials in closed woodland
particularly when the density of large trees was very high, the signal from the implant became
inaudible at 100m.
The difference in performance between transmitter types increased significantly in
grassland compared to the two woodland habitats (F = 25.123, p = 0.0000, df = 2: Newman-Keuls
test, grass:open woodland, p = 0.00013; grass:closed woodland p = 0.0015; Table 1.). Although

200
performance difference increased marginally in open woodland compared to closed woodland, it
was not statistically significant (Newman-Keuls p = 0.1302).
Implant Collar Habitat x range x range mean
difference Closed woodland (n = 11) 182.2 100-320 1200.0 1000-1400 1017.3 Open woodland (n = 11) 427.3 200-600 1563.7 1400-2000 1136.4 Grassland (n =12) 683.3 500-850 2212.5 1800-2800 1529.2 All habitats combined (n = 34)
438.6 1675.0
Table 1. Reception performance for implant and collar in three habitat types.
Mean +/- SDMean +/- SEImplant Collar
HABITAT
sign
al re
cept
ion
(m)
0
400
800
1200
1600
2000
2400
2800
closed openwood grass
Figure 1: Implant versus collar performance in three habitat types.
201
Discussion
This study, albeit brief, suggested that signal loss in implanted transmitters may negate
their practicability in some radio-tracking scenarios. Even the maximum reception range of 850m
in optimum habitat (grassland) would not be sufficient to regularly locate animals with a large
home range and large daily movements such as in lions. In denser habitat where this range is
considerably reduced, such as both types of woodland at Phinda, it would be almost impossible to
predictably locate animals carrying implants. Phinda has an extensive road network which
facilitated ‘sweeping’ an area for radio-tagged animals in habitat impossible to drive. However,
this method was dependent on the radio signal being able to penetrate stands of vegetation in
which roads existed approximately every 2 kilometres. Implanted animals would not be detected
in a situation such as this unless they happened to be resting close to a road.
It is interesting that the disparity between transmitter performance increased as habitat
became more open (Table 1). It is unclear why the mean difference was not consistent across
habitat types. Interference and reflection from wooded habitat (Kenward 1987) may reach a
‘threshold’ level for the implant in which the antenna is considerably shortened compared to the
collar. It was revealing that signal strength was noticeably reduced (in both transmitters, but more
so in the implant) merely by positioning a large Silver terminalia Terminalia sericea or marula
tree Sclerocarya birrea between myself and the lions. Where habitat is very open, it may be
feasible to use implants to locate animals: however, these results suggest open habitat is ideal for
maximum performance of external transmitters, arguing that resources may be better invested in
conventional radio-collars.
202
Some innovative techniques have attempted to reduce poor performance in internal transmitters.
Korschgen et al (1996) successfully implanted ducks and exited a long external antenna through
the caudal abdominal wall and skin, improving signal range. It is unlikely that most mammal
species which groom themselves and show interest in novel objects would tolerate this.
Conspecifics or cubs of radio-collared lions and cheetahs invariably bit off the external antenna
on collars until design was modified so that the antenna was hidden between two layers of collar
belting. Additionally, given that the main concern here is physical appearance of animals, it is
highly unlikely that visible external whip antennas would be considered an improvement by
tourists.
The use of an aircraft can significantly improve reception in implants (McKenzie et al
1990) and radio-tracking from the air is widely undertaken for wide-ranging species (Kenward
1987). If this option is regularly available, implants may be an effective means to locate radio-
tagged individuals in the sorts of conditions described here. Nonetheless, cost and effort needs to
be weighed against this gain. External transmitter reception will likely be far superior than
implant reception, reducing time in the air which is the main expense and probably allowing for
more accurate and/or more frequent locations. By way of example, although I was not able to
assess implant signal strength from an aircraft during these trials, at a later date I received the
signal from the same radio-collar tested here at distance of more than 20km while in a Cessna
Grand Caravan flying at approximately 500ft: McKenzie et al (1990) reported a maximum of 6km
for implants from aerial searches.
Having said this, these results need to be interpreted cautiously. The study was brief
because of the implanted lion’s premature death and a longer comparison would permit
investigation of other potential environmental influences such as humidity, cloud cover and
electrical storms (Kenward, 1987). Furthermore, a greater sample of both types of transmitters
would be more compelling. Given that only one implant was available for the trials, I was not able
to ascertain whether this particular unit was functioning optimally in comparison with other
implants, though field personnel more experienced than myself in use of this equipment suggested
it was ‘normal’. Although I did not conduct extensive trials of its performance prior to
implantation, it was possible to receive a signal up to 1500m in grassland. Some diminishment in
signal strength once implanted can be expected because tissue absorbs some signal radiation and
McKenzie et al (1990) have suggested that leaving the unit free floating in the abdominal cavity
as opposed to lateral attachment of the implant (the method employed here), may improve signal
strength.
In conclusion, serious thought needs to be given to deployment of implants in wide
ranging mammals such as large felids, particularly where the sole concern is aesthetics. The
potential risks of invasive surgery combined with the far greater performance of external
transmitters argues against implants. Furthermore, there is no evidence that radio-collars affect

203
behaviour of large cats: indeed lions and cheetahs seem largely oblivious to collars from the
moment they recover from sedation after being fitted. Although the aesthetic impact of collars is
undeniably negative, perhaps managers of wildlife tourism operations would better be served by
allocating resources to educating tourists about the reasons for collars and the drawbacks to
alternatives. The development of effective, less invasive, inconspicuous telemetry such as sub-
cutaneous implants for large mammals would render many of the problems of both collars and
implants obsolete. Encouragingly, research on these options is underway1.
1 Ed Levine, Merlin Systems, Inc. P.O. Box 190257 Boise, ID 83719. Ph:(208)362-2254
204
APPENDIX III.
A CASE OF CANNIBALISM IN MALE CHEETAHS.
(This section published as: Hunter, L.T.B. & J.D. Skinner, 1995. “A case of
cannibalism in male cheetahs” Afr. J. Ecol. 33:169-171. 13 months after the case described
here, I observed a second, virtually identical incident of cannibalism by the same male cheetahs
which occurred while this manuscript was in press).
Among large felids, individuals appear to establish territories which may be rigourously
defended from conspecifics of the same sex (see Packer, 1986 and Gittleman, 1989 for
references). Contests over these territories can be fierce and occasionally result in the death of
combatants (Schaller, 1967, 1972; Caro et al 1987a,b). Although the consumption of a killed
conspecific after such an encounter would possibly benefit the victor/s by replenishing energy
expended during the fight, cannibalism in these clashes appears to be rare. In the incident
described, the victorious pair of cheetahs utilised the carcass of a killed male in the manner of a
typical kill.
STUDY SITE AND SUBJECTS
The present research is part of an ongoing project examining the behavioural ecology of
reintroduced cheetahs and lions in the Phinda Resource Reserve (hereafter Phinda), a privately
owned reserve of 17600 Ha in northern Natal Province, South Africa. The area is within the
historical range of cheetahs, the last of which were extirpated in 1941 (Rautenbach et al 1980).
Between March 1992 and May 1993, Phinda released five male and seven female cheetahs wild
caught in Namibia and Botswana. Two of the males (representing all five males by their
association in coalitions) and a single female have been radio-collared (Telonics, Arizona) and
monitored since their release.
RESULTS
The observations are presented here as a detailed case history. A resident two-male
coalition of cheetahs was located at 0650h well within the borders of their territory pursuing
some impalas They were lost for 15 minutes and then relocated 1700m away where they had
caught another male cheetah which they were attacking with savage throttling and repeated
205
mauling of the hindquarters. No movement or response was seen by the third male from the
moment of arriving at the scene and it was possibly already dead. Nonetheless, both of the
attacking males bore bite wounds to the cheeks and ears, indicating the third male had attempted
to defend itself. Two game guards on fence patrol had witnessed the actual attack and reported
that after an initial brief skirmish lasting only 2-3 minutes, they had lost sight of the cheetahs in
the long grass, most probably the point at which the intruding male was overcome by the two
attackers.
Both males maintained their respective holds on the third animal without rest for 15
minutes from first contact, before moving 5m away from the third cheetah which was clearly
dead at this stage. After resting for less than a minute, they approached the dead cheetah
aggressively and then attacked the carcass again, savagely throttling the throat and repeatedly
tearing at the hind-quarters and genitals. The throttling motion at the throat was performed in
the same way with which a prey animal is killed: however, the action was much more forceful
and prolonged than observed during the killing of ungulates (Hunter pers. obs.). The pattern of
a brief rest followed by renewed attack on the carcass was repeated for 45 minutes in which the
carcass was "re-attacked" five times.
At 0802h, one of the males began lapping blood from the wounds and then proceeded to
open the carcass at the right flank and fed on it for 25 minutes. The second male then
approached the carcass and fed for 10 minutes before also moving off to rest. At this point, the
carcass was removed for identification purposes. The entire muscle mass of the right hind leg
had been eaten and the abdominal cavity opened. The intestines had not been eaten. In normal
feeding patterns, cheetahs intersperse feeding periods with short rests close to the kill until it is
finished (Hunter pers obs.) which probably would have occurred here if there had been no
intervention.
DISCUSSION
The behaviour presented here is interesting as cannibalism is rarely observed in large
felids, except in cases of infanticide (Packer & Pusey, 1982). The motivation for the
consumption of the killed male in this incident is unclear. Pienaar (1969) mentions records of
cannibalism in cheetahs in the Kruger National Park, suggesting these stem from fights over
carcasses. This does not appear to be the reason in this case as the attacking animals were
hunting before encountering the third male and there were no carcasses in the area. Although
fights over a resource such as territory or an oetrous female have been known to result in the
death of competing cheetahs (Stevenson-Hamilton 1945, Kuenkel 1978, Caro et al 1987b,
206
Skinner et al 1991), such instances have not been recorded resulting in cannibalism. Similarly,
extreme hunger does not appear to be the likely cause here as the victorious males had together
consumed a subadult impala killed less than 48 hours prior to the incident.
Although the resident pair were hunting when they encountered the third male, there
seems little doubt that the intruding cheetah was attacked as a competitor rather than a prey
item. The repeated mauling of the animal long after it was dead and the aggression of the
attackers are behaviours not seen when cheetahs deal with prey (Eaton 1970c and Hunter, pers
obs). Accordingly, the possibility of the cheetah pair actually hunting their own species (as
appears to occur occasionally in some primates, see Goodall 1986) seems very unlikely. This is
particularly so when one considers that observed interactions between these two males and
females (including a female with large dependent male cubs) were devoid of any atypical
aggression. Accordingly, the possibilty that the reintroduction process contributed to the
cannibalistic behaviour seems unlikely. The two attacking males had been resident in their
territory for 15 months at the time of the incident and during this time, had displayed no
behaviour indicating disturbance or trauma resulting from the reintroduction.
It is possible that the extensive nature of the wounds inflicted on the hindquarters
stimulated the cheetahs to begin feeding. In normal cheetah feeding patterns, the carcass is
almost always opened at the hindquarters (Leyhausen, 1979). The mauling of the hindquarters
had left large tears in the skin and muscle layer from which blood was flowing freely. Just prior
to initiating feeding, one of the males had begun to lap the blood, which may have then
stimulated him to open the carcass. Unfortunately, no records exist on the extent and location of
wounding in other male cheetahs killed in intraspecific fighting, so one cannot make a
comparison between this case and others in which cannibalism has not occurred. Until this data
becomes available, the motivation for this behaviour will remain unclear.