behavioral economics strategies and vegetable consumption
TRANSCRIPT

Behavioral Economics Strategies and Vegetable Consumption Among Low-Income
Children
A DISSERTATION
SUBMITTED TO THE FACULTY OF THE GRADUATE SCHOOL
OF THE UNIVERSITY OF MINNESOTA
BY
Tashara M. Leak
IN PARTIAL FULFILLMENT OF THE REQUIREMENTS
FOR THE DEGREE OF DOCTOR OF PHILOSPOHY
Marla Reicks, PhD, RD, Advisor
Zata Vickers, PhD, Co-Advisor
August 2015

© Tashara M. Leak 2015

i
Acknowledgements
First and foremost, I thank God for this amazing opportunity.
Thank you to Drs. Marla Reicks and Zata Vickers for investing so much time, energy,
and money into my academic endeavors. I am a better researcher because of this
experience and I look forward to applying my newly acquired skills in my post-doctoral
studies. To Dr. Aaron Rendahl, I appreciate the countless hours that you spent helping
me run statistics. You were always so patient and kind when I came to your office. To
my other committee members, Drs. Lisa Harnack and Len Marquart, thank you for
serving as my sounding board and for all of the great career advice. Dr. Teri Burgess-
Champoux, you have been an amazing mentor and I honestly do not know if I would
have made it without you.
I am so fortunate to have supportive family and friends. To my father, John Leak, thank
you for always believing in me, no matter what obstacle I encountered. To my mother,
Veronica Patterson, you have always been my rock and I appreciate every single sacrifice
you ever made for me. You always allowed me to color outside of the lines and because
of you I know the sky is the limit. To Alison Swenson, I am so glad we could be on this
adventure together. To Elizabeth Mishler, I will miss all of our writing sessions and
thank you for being an amazing friend. Lastly, I am so grateful to my sister-friend, the
soon to be Dr. Nakia Best. When I felt like no one understood what I was going through
as a doctoral student, I could always call you.

ii
This dissertation is dedicated to my mother, Veronica Patterson, and to all of the little
Black girls who dare to dream.

iii
Abstract
Children from a low socioeconomic background are at increased risk for becoming obese,
which underscores the importance of encouraging healthful behaviors such as vegetable
consumption. Several factors influence child vegetable intake, including whether
children like vegetables and if vegetables are available for consumption. Researchers
have attempted to improve child vegetable intake in the school setting through the use of
behavioral economics-informed changes in the cafeteria, where the social and physical
environment is manipulated in a way to ‘nudge’ children to make healthier choices.
Interventions grounded in behavioral economics have been shown to improve vegetable
intake in the school setting but have not been thoroughly explored in the home food
environment. The latter is an ideal setting in which to improve vegetable consumption
because children consume the majority of their daily calories at home. This dissertation
investigated the feasibility and effectiveness of behavioral economics strategies to
improve vegetable intake at dinner meals among children aged 9-12 residing in
households receiving food assistance. Included in this dissertation were three studies
which determined the feasibility of implementing behavioral economics strategies (Phase
1), measured the effectiveness of behavioral economics strategies to increase child
vegetable intake (Phase 2), and explored adolescent involvement in home food
preparation.

iv
Exploring the Feasibility of Implementing Behavioral Economics Strategies to
Increase Vegetable Intake, Liking, and Variety Among Children Aged 9 to 12 Residing
in Food Assistance Households (Phase 1)
Phase 1 was a formative study that aimed to identify facilitators and barriers caregivers
may experience when implementing strategies during dinner preparation and mealtime.
One-time, in-home observations of dinner preparation and mealtime were conducted with
caregiver/child dyads (n = 20). Survey data to assess vegetable availability, parent and
child vegetable liking, and household food security were collected. Facilitators included
liking of most vegetables by caregivers and children, and home vegetable availability
(most families had 7-21 different types of vegetables available in the home). Barriers
included perceived time constraints, lack of appropriate vegetable types or
utensils/dishware, and concerns about child involvement in food preparation. Based on
Phase 1 data, nine behavioral economics strategies were selected for further evaluation in
a randomized controlled trial (Phase 2).
Testing the Effectiveness of In-Home Behavioral Economics Strategies to Increase
Vegetable Intake and Liking Among Children Residing in Households that Receive
Food Assistance (Phase 2)
The objectives for Phase 2 were to 1) to determine the 6 of 9 most effective and feasible
behavioral economics strategies, and 2) to evaluate if 9 behavioral economics strategies
increase vegetable intake, liking, and availability during a randomized controlled trial.
Over the course of six weeks, caregivers in the intervention group (n = 39) incorporated
one new strategy/week. Caregivers in the control group (n = 10) were not assigned

v
strategies. For Objective 1, parent-reported food records (3 days/week) were used to
assess child vegetable consumption at dinner meals on the days that strategies were
implemented. Caregivers in the intervention group rated the level of difficulty for
assigned strategies (1 - not difficult to 10 - very difficult) during weekly phone calls.
They also reported facilitators and barriers to implementing the strategies. No differences
were observed between intervention and control group for mean child dinner meal
vegetable intake for any of the nine strategies. However, pairwise comparisons for the
intervention group showed that vegetable intake for the strategy of serving at least two
vegetables for the dinner meal was greater than intake for two other strategies: ‘Pair
vegetables with other foods child likes’ and ‘Eat dinner together with an adult(s)
modeling vegetable consumption’. Caregivers indicated that the strategies were
generally not difficult to implement. For Objective 2, three 24-hour dietary recalls were
collected at baseline and study conclusion from children to assess changes in overall
vegetable intake. Also, at baseline and study conclusion, children and caregivers
provided liking scores for 36 different vegetable types on a10-point labeled hedonic scale
(1-Hate it to 10-Like it a lot, or ‘Never tried’). For the same 36 different vegetable types,
home vegetable availability data were collected at baseline and study conclusion.
Change in total daily vegetable intake (baseline to study conclusion) was not different
between intervention and control group. No differences were noted in changes (pre-post
differences) in caregiver and child mean vegetable liking ratings when mean liking was
assessed across all vegetables. There were also no changes in home vegetable
availability from baseline to study conclusion between intervention and control group.

vi
Adolescent Involvement in Food Preparation
In the final study, the objective was to understand how low-income adolescents are
involved in home food preparation. At the conclusion of Phase 2, if an adolescent (13-18
years) was present in the home, he or she was invited to participate in a semi-structured
interview. Interview questions inquired about how adolescents were involved in food
preparation. Interviews (n = 19) were analyzed using grounded theory methodology.
Three levels of involvement in food preparation were described. Eight adolescents were
highly involved with responsibility for cooking for others in the household. When
deciding what to prepare at mealtimes, they considered preferences of others, variety,
nutrition, and time. Some adolescents were highly involved in food preparation out of
family obligation and cultural expectations. Those highly involved in food preparation
indicated that the additional responsibilities produced stress. They also indicated that they
were confident in their ability to cook without the assistance of an adult. Adolescents
who were moderately involved in food preparation (n = 7) assisted with cooking. They
reported that they enjoyed cooking. Four adolescents had low levels of involvement in
food preparation and rarely, if ever, helped their caregiver with cooking. They were not
expected or encouraged to be involved in food preparation by parents.

vii
Table of Contents
Acknowledgements .............................................................................................................. i
Abstract .............................................................................................................................. iii
Exploring the Feasibility of Implementing Behavioral Economics Strategies to Increase Vegetable Intake, Liking, and Variety Among Children Aged 9 to 12 Residing in Food Assistance Households (Phase 1) .............................................. iv
Testing the Effectiveness of In-Home Behavioral Economics Strategies to Increase Vegetable Intake and Liking Among Children Residing in Households that Receive Food Assistance (Phase 2) ................................................................ iv
Adolescent Involvement in Food Preparation ........................................................ vi
List of Tables .................................................................................................................... xii
List of Figures .................................................................................................................. xiii
INTRODUCTION..............................................................................................................1
CHAPTER 1: LITERATURE REVIEW ........................................................................5
1.1 Childhood Obesity .........................................................................................................6
1.2 Vegetable Intake and Relationship to Overweight/Obesity in Childhood, Food Security and Household Income ..........................................................................................7
1.3 Vegetable Liking and Intake ..........................................................................................9
1.4 Home Food Environment, Family Meals and Relationship to Child Obesity Risk and Vegetable Intake ................................................................................................................11
1.5 Behavioral Economics .................................................................................................12
Overview ................................................................................................................12
Pair vegetables with other foods the child already likes. .......................................14
Make vegetables more easily available and visible than other foods at the dinner meal ........................................................................................................................15
Serve vegetables before the rest of the meal ..........................................................16
Use a dinner plate that shows the amount of vegetables to eat for a meal ............17
Offer the child 2 vegetable options for dinner, one liked and one less liked .........18

viii
If the caregiver puts vegetables on the child’s plate, give more than usual. If children typically serve themselves, put a larger spoon than normally used with the vegetable so they get more than usual .............................................................19
Eat dinner together with an adult(s) modeling vegetable consumption .................20
Serve at least two vegetables with dinner meals ....................................................20
Let the child help prepare vegetable dishes ...........................................................21
1.6 Social Cognitive Theory ..............................................................................................22
1.7 Summary and specific objectives.................................................................................24
Research objectives and hypotheses ......................................................................24
1.8 References (Introduction & Chapter 1) ........................................................................27
CHAPTER 2: PHASE 1 ..................................................................................................35
2.1 Introduction ..................................................................................................................36
2.2 Methods........................................................................................................................37
Participants and Recruitment .................................................................................37
Study Design ..........................................................................................................38
Procedure ...............................................................................................................41
Instruments/Measures ............................................................................................43
Qualitative Data Collection....................................................................................48
Pilot Test ................................................................................................................49
Data Analyses ........................................................................................................50
2.3 Results ..........................................................................................................................52
Instruments/Measures ............................................................................................52
Summary of Brief Qualitative Interviews ..............................................................67
Feasibility of Strategy Findings .............................................................................68
2.4 Discussion ....................................................................................................................74

ix
2.5 Selection of Strategies for Phase 2...............................................................................76
2.6 References ....................................................................................................................79
CHAPTER 3: PHASE 2 METHODOLOGY ................................................................83
3.1 Overview of Phase 2 Methodology (Chapter 3) ..........................................................84
3.2 Introduction ..................................................................................................................85
3.3 Methods........................................................................................................................88
Participants .............................................................................................................88
Study Design and Intervention...............................................................................92
Data Analysis .......................................................................................................100
3.4 Discussion ..................................................................................................................104
3.5 References ..................................................................................................................107
CHAPTER 4: PHASE 2 FINDINGS ............................................................................113
4.1 Results ........................................................................................................................114
Objective 1. Determination of the Most Effective Behavioral Economics Strategies ..............................................................................................................120
Objective 2. Vegetable Intake, Liking, and Availability-Comparison of Baseline and Study Conclusion Outcome Measurements ..................................................129
4.2 Discussion ..................................................................................................................152
Determination of the Most Effective Behavioral Economics Strategies .............152
Explanations for why the behavioral economics strategies did not significantly impact child mean vegetable intake .....................................................................153
Explanations for why changes in vegetable intake, liking, and availability were not observed from baseline to study conclusion ..................................................157
Strengths & Limitation ........................................................................................160
Conclusion ...........................................................................................................161
4.3 References ..................................................................................................................162

x
CHAPTER 5: ADOLESCENT INVOLVEMENT IN FOOD PREPARATION .....165
5.1 Introduction ................................................................................................................166
5.2 Materials and Methods ...............................................................................................168
Study Design and Participants .............................................................................168
Interview Guide and Protocol ..............................................................................169
Data Analysis .......................................................................................................172
5.3 Results ........................................................................................................................173
High Level of Involvement ..................................................................................173
Moderate Level of Involvement ...........................................................................177
Low Level of Involvement...................................................................................179
5.4 Discussion ..................................................................................................................181
Limitations ...........................................................................................................182
5.5 References ..................................................................................................................183
CHAPTER 6: COMPLETE LIST OF REFERENCES FOR DISSERTATION ....185
CHAPTER 7: APPENDICES .......................................................................................201
7.1 Phase 1 Consent Form ...............................................................................................202
7.2 Phase 1 Assent Form ..................................................................................................204
7.3 Phase 1 Sociodemographic and Household Characteristics Questionnaire ...............205
7.4 Phase 1 US Household Food Security Survey Module: Amended Five-Item Short Form .................................................................................................................................210
7.5 Phase 1 Adult Liking .................................................................................................211
7.6 Phase 1 Child Liking ..................................................................................................218
7.7 Phase 1 Behavioral Strategy Questionnaire ...............................................................223
7.8 Phase 1 Home Food Inventory ...................................................................................225
7.9 Phase 1 Observation Checklist Form .........................................................................227

xi
7.10 Phase 1 Adult Interview Guide ................................................................................231
7.11 Phase 1 Child Interview Guide ................................................................................234
7.12 Phase 1 Sample Strategy Analysis Sheets ...............................................................236
7.13 Phase 2 Dinner Vegetable Record Form ..................................................................237
7.14 Phase 2 Weekly Record Follow Up .........................................................................238
7.15 Phase 2 Strategy Guide ............................................................................................240
7.16 Phase 2 Demographic Questionnaire .......................................................................250
7.17 Phase 2 Caregiver Vegetable Liking/Variety Questionnaire ...................................253
7.18 Phase 2 Child Vegetable Liking Questionnaire .......................................................255
7.19 Phase 2 Child Physical Activity Form .....................................................................257
7.20 Phase 2 Home Vegetable Inventory .........................................................................259
7.21 Phase 2 Observation Checklist.................................................................................262
7.22 Phase 2 Exit Questionnaire ......................................................................................263

xii
List of Tables
Table 2.1 Behavioral strategies evaluated for feasibility ...................................................41
Table 2.2 Order in which data were collected ...................................................................43
Table 2.3 Sociodemographic and household characteristics .............................................54
Table 2.4 Number of caregivers currently doing the behavioral strategies, and of those who are not doing the strategies, the mean rating of likelihood to trying the strategy. .....62
Table 2.5 Kitchen equipment availability ..........................................................................65
Table 2.6 Dinner meal description .....................................................................................66
Table 2.7 Strategy feasibility scores and comments ..........................................................70
Table 3.1 Behavioral economics strategies tested for effectiveness ..................................91
Table 3.2 Description of in-home data collection surveys, questionnaires, and procedures97
Table 4.1 Participant sociodemographic characteristics at baseline. ...............................118
Table 4.2 Behavioral economics strategies impact on child mean dinner vegetable intake.121
Table 4.3 Caregiver rating of difficulty, and perceived facilitators and barriers to implementing behavioral economics strategies. ..............................................................126
Table 4.4 Mean daily vegetable group, energy, and nutrient intakes based on 24-hour dietary recalls. ..................................................................................................................131
Table 4.5 Mean dinner vegetable, energy, and nutrient intakes based on 24-hour recalls.135
Table 4.6 Mean vegetable liking across all vegetables for caregivers and children in the intervention and control group at baseline and study conclusion. ...................................140
Table 4.7 Number of households where fresh, canned, and frozen vegetables were present at the baseline and study conclusion visit. .......................................................................144
Table 4.8 Number of caregivers and children in both the intervention and control group that liked a vegetable (rating of ≥ 5) and the number of homes where the vegetable was present at baseline (n = 49). .............................................................................................148
Table 5.1 Interview guide used to explore perceived role in home food preparation among low-income adolescents ...................................................................................................171

xiii
List of Figures
Figure 1.1. Using the Social Cognitive Theory as a framework to understand relationships between vegetable liking, behavioral economics strategies (i.e., environmental changes), and vegetable intake among low-income 9 to 12 year old children. .................................23
Figure 2.1 Distribution of household food security status among the study population based on the following scale: 0-1 high or marginal food security, 2-3 low food security, and 4-5 very low food security. .........................................................................................56
Figure 2.2 Caregiver vegetable liking ratings based on the transformed rating scale where 0 and 10 corresponded with the lowest and highest rating of vegetables respectively, and a value of 5 represented neither like nor dislike. ...............................................................58
Figure 2.3 Mean target child vegetable liking ratings where 1 = “hate it”, 5-6 = “it’s okay”, and 10 = “like it a lot.” The number at the top of each bar in the graph represents the number of children who had tried each of the vegetable types. ...................................60
Figure 2.4 Number of households where a vegetable type was present. ...........................64
Figure 4.2 Intervention group child ratings for each of the 36 vegetables they had tried at baseline and study conclusion. .........................................................................................141
Figure 4.3 Control group child ratings for each of the 36 vegetables they had tried at baseline and study conclusion. .........................................................................................142
Figure 4.4 A comparison of baseline number of caregivers in both the intervention and control group that liked a vegetable and the number of households where that vegetable was available. ...................................................................................................................150
Figure 4.5 A comparison of baseline number of children in the intervention and control group that liked a vegetable and the number of households where that vegetable was available. ..........................................................................................................................151

1
INTRODUCTION
This dissertation examined whether implementing behavioral economics strategies during
dinner meals in the home by caregivers was both feasible and effective for increasing
vegetable intake among low-income children between the ages of 9 and 12. Childhood
obesity interventions often incorporate dietary behavior change (e.g., vegetable intake)
(Kral, Kabay, Roe, & Rolls, 2010; Correia, O'Connell, Irwin, & Henderson, 2014; Leak
et al., 2015), acknowledging that diet is an integral part of a healthy lifestyle. The
importance of vegetable consumption is underscored in the 2010 Dietary Guidelines for
Americans, which recommends that children consume both adequate amounts and a
variety of vegetable types (USDA MyPlate, 2011). Despite recommendations, children
continue to have insufficient intake of vegetables (USDA ARS, 2014). This is especially
concerning for low-income (Kirkpatrick, Dodd, Reedy, & Krebs-Smith, 2012) and food
insecure (Fram, Ritchie, Rosen, & Frongillo, 2015) children who may experience barriers
to vegetable consumption such as limited vegetable availability. Thus, an intervention
was developed and implemented as part of this dissertation research project to improve
child vegetable intake among those residing in lower socioeconomic households.
One approach to improve vegetable intake among children used in the school setting is
the implementation of strategies grounded in behavioral economics principles (Just &
Wansink, 2009) that ‘nudge’ children into eating more vegetables (Thaler & Sunstein,
2008). For example, the HealthierUS School Challenge: Smarter Lunchrooms

2
(HUSSC:SL) is an initiative where eligible schools have the opportunity to implement
techniques geared towards nudging children to make healthier choices during lunch
(USDA Food and Nutrition Service, 2014). Of the 100 techniques (i.e., behavioral
economics strategies) listed on the Smarter Lunchroom Self-Assessment Scorecard, 15
are dedicated to encouraging vegetable selection and consumption. One technique is to
make sure “available vegetable options have been given creative or descriptive names”
(USDA Food and Nutrition Service, 2014). This strategy was shown to be effective at
increasing carrot intake among students aged 8 to 11 who were offered “X-ray Vision
Carrots” (Wansink, Just, Payne, & Klinger, 2012). The intervention conducted as part of
this dissertation was based on the implementation of behavioral economics strategies, as
this is a promising approach to behavior change.
In addition to the school setting, researchers are exploring the home food environment as
a location to intervene and encourage child vegetable consumption through the use of
behavioral economics strategies (Cravener et al., 2015; Leak et al., 2015). For example,
in a home-based four-week randomized controlled trial, Cravener and colleagues (2015)
tested whether implementing several behavioral economics principles during meal and
snack times improved vegetable intake among preschool aged children. The home
environment is a promising setting to encourage healthy eating behaviors because
children consume 66.1% of their daily kcals in the home setting (Poti & Popkin, 2011).
Therefore, the intervention conducted as part of this dissertation implemented behavioral
economics strategies in the home, recognizing of the importance of foods consumed at
home in meeting dietary recommendations.

3
It is important to include caregivers in home-based dietary interventions. Caregivers play
an essential role in household food availability (Birch & Davison, 2001), deciding what
to prepare at mealtimes (Brown & Wenrich, 2012), role modeling (Draxten, M.,
Fulkerson, Friend, Flattum, & Schow, 2014), and the social environment (e.g.,
encouragement) (Faught, Vander Ploeg, Chu, Storey, & Veugelers, 2015). Furthermore,
it has been shown that caregivers can effectively serve as change agents for the purpose
of improving child diet and/or health status (Golan, 2006, Cravener et al., 2015).
However, the feasibility for caregivers to implement behavioral economics strategies in
the home, for the purpose of increasing child vegetable intake, remains unclear. Several
factors could impact feasibility including, time to plan and actually prepare the meal
(Jabs et al., 2007; Mancino & Newman, 2007), child and caregiver vegetable liking, and
food preparation knowledge and skills (Fulkerson et al., 2008; Brown & Wenrich, 2012;
Berge, Hoppmann, Neumark-Sztainer, 2014). One must also consider that low-income
households may encounter additional challenges that higher socioeconomic households
may not (e.g., inadequate kitchen equipment needed to prepare vegetables and limited
vegetable availability) (Landers & Shults, 2008). A key feature of this dissertation was to
assess feasibility of the implementation of behavioral economics strategies by low-
income caregivers by examining facilitators and barriers.
Lastly, this dissertation acknowledges that in low-income households, older
children/adolescents may take on adult responsibilities (Burton, 2007), such as food
preparation. Thus, a final study in this dissertation explored perceived involvement in

4
home food preparation among how low-income adolescents residing in food assistance
households (a proxy for income status).
In the following sections relevant literature was reviewed (Chapter 1). Then three
chapters (Chapters 2, 3, and 4) report on two studies that address feasibility and
effectiveness of behavioral economics strategies. In Chapter 5, a third study explored the
role of low-income adolescents in home food preparation.

5
CHAPTER 1: LITERATURE REVIEW

6
1.1 Childhood Obesity
In the United States, the prevalence of childhood obesity is a major public health concern.
Obesity places children at increased risk for developing high blood pressure, elevated
blood cholesterol, diabetes and a host of other conditions that continue into adulthood
(Serdula et al., 1993; Gurnani, Birken, Hamilton, 2015). Obesity is characterized by an
excess accumulation of body fat. Body mass index (BMI = weight (kg)/height (m) 2) is
used to categorize individuals based on weight status. Children with a BMI in the 85th to
< 95th percentile are classified as overweight and those with a BMI ≥ 95th percentile are
classified as obese (Kuczmarski et al., 2000). According to data from the 2011-2012
U.S. National Health and Nutrition Examination Survey (NHANES), 16.9% of children
between the ages of 2 and 19 were obese and 17.7% of children aged 6 to 11 were obese
(Ogden, Carroll, Kit, & Flegal, 2014). Obesity prevalence was lowest among non-
Hispanic Asians (8.6%; 95% CI [5.7-12.7%]), compared to non-Hispanic whites (14.1%;
p = 0.04), non-Hispanic blacks (20.2%; p < 0.001), and Hispanic (22.4%; p < 0.001)
children between the ages of 2 and 18 (Ogden, Carroll, Kit, & Flegal, 2014). There were
no differences in obesity prevalence between girls and boys aged 2 to 19 (Ogden, Carroll,
Kit, & Flegal, 2014).
Research suggests that an association exists between household income status and child
weight status, as well as between food insecurity and child weight status. In a cross
sectional analysis of 2001-2010 NHANES data, Kaur and colleagues (2015) found that
children aged 2 to 11 years were more likely to be obese if they were food insecure and if
they were low-income (based on poverty-to-income ratio ≤ 130) than children who were

7
food secure and residing in higher income households. Others have shown that children
aged 6 to 11 were more likely to be obese if they were food insecure than children aged 6
to 11 who were not food insecure (p < 0.001; Kaur, Lamb, & Ogden, 2015). In a cross
sectional analysis of the 2003-2004 National Survey of Children’s Health data, Lutfiyya
et al. (2008) reported that 5 to 18 year old children residing in households ≤ 150% of the
Federal poverty level were more likely to be overweight compared to children residing in
households > 150% of the Federal poverty level (Odds Ratio 1.54; 95% CI [1.54–1.56]).
1.2 Vegetable Intake and Relationship to Overweight/Obesity in Childhood, Food
Security and Household Income
Children in the U.S. are not meeting recommendations for vegetable intake (USDA ARS,
2014). The 2010 Dietary Guidelines for Americans recommend that girls and boys aged
9 to 13 consume 2 to 2.5 cups of vegetables, respectively, on a daily basis, including a
variety of vegetables of different colors (e.g., dark green, red and orange), as well as
beans and peas, and starchy vegetables (USDA MyPlate, 2011). Cross-sectional data
from the Continuing Survey of Food Intakes by Individuals (CSFII) and NHANES
showed that despite these recommendations, vegetable intake among children aged 2 to
19 has declined from 1989 to 2010 (Slining et al., 2013). According to a 2011-2012
report of What We Eat in America (USDA ARS, 2014), U.S. children (aged 2 to 19) were
not meeting dietary recommendations for vegetable intake (0.93 cups) on a given day,
with children between the ages of 6 and 11 consuming less than 1 cup (between 0.84-0.87
cups) of vegetables on a given day. Of the different varieties of vegetables, children in
all age groups consumed dark green vegetables in lower amounts than any other

8
vegetable type (e.g., red and orange, starchy) (Nielson, Rossen, Harris, & Ogden, 2014;
USDA ARS, 2014).
The relationship between child vegetable intake and weight status is unclear. Some
epidemiologic evidence suggests that an inverse relationship exists between child weight
status and vegetable consumption (Matthews, Wien, & Sabaté, 2011; Miller, Moore, &
Kral, 2011). In a cross-sectional study conducted with mothers of 5 to 6 year olds,
children who were overweight/obese consumed fewer vegetables than normal weight
children (Miller, Moore, & Kral, 2011). However, only one of four longitudinal studies
among children found an inverse relationship between child vegetable intake and weight
status (Ledoux, Hingle, & Baranowski, 2011).
The relationship between child vegetable intake and food security and household income
status is also unclear. In an analysis of NHANES 2003-2010, no significant differences
in vegetable intake were observed between children (ages of 2 and 18) in three different
family income to poverty ratio categories (< 130%, 130% to <349%, and ≥ 349%) (Kim
et al., 2014). When Kirkpatrick et al. (2012) examined 2001-2004 NHANES data, low-
income children (≤ 130% of the poverty threshold) aged 2 to 18 years consumed more
vegetables and legumes than children from the highest income group (> 185%)
(Kirkpatrick, Dodd, Reedy, & Krebs-Smith, 2012). In another study, among low-income
fourth and fifth grade students recruited from San Diego schools, food insecure children
had lower vegetable intake compared to children who were food secure (Fram, Ritchie,
Rosen, & Frongillo, 2015).

9
1.3 Vegetable Liking and Intake
One of the many factors that may influence whether children eat vegetables is their liking
of vegetables (Gibson, Wardle, & Watts, 1998; Blanchette & Brug, 2005; Anzman-
Frasca, Savage, Marini, Fisher, & Birch, 2012;Caton et al., 2013; Fildes, van Jaarsveld,
Wardle, & Cooke, 2014). This relationship between vegetable liking and intake was
observed in a study conducted by Gibson and colleagues (1998), where 9 to 11 year old
olds completed 3-day food records and provided liking ratings for 3 vegetables
(tomatoes, carrots, and peas) using the following 5 point scale: -2 ‘hate it’ to +2 ‘love it’.
Results indicated that child vegetable liking ratings were positively related to child
vegetable intake (p < 0.005) (Gibson, Wardle, & Watts, 1998).
Repeated taste exposure is one strategy that has been used to improve liking of novel
(Caton, et al., 2013), moderately disliked (Corsini, Slater, Harrison, Cooke, & Cox,
2013), and disliked vegetables (Lakkakula, Geaghan, Zanovec, Pierce, & Tuuri, 2010;
Anzman-Frasca, Savage, Marini, Fisher, & Birch, 2012; Noradilah & Zahara, 2012;
Fildes, van Jaarsveld, Wardle, & Cooke, 2014; Holley, Haycraft, Farrow, 2015). For
example, Caton et al. (2013) examined if vegetable intake among preschoolers would
increase after ten taste exposures of pureed artichoke (novel vegetable) offered in the
daycare setting. At the conclusion of the study, preschoolers consumed significantly
more artichoke than at baseline (p < 0.001). In a study conducted by Corsini and
colleagues (2013), caregivers prepared ½ cup of a target vegetable every day for two
weeks for their 4 to 6 year old child. To identify the target vegetable, caregivers provided
a list of six vegetables that they struggled to get their child to eat. Then the child ranked

10
the vegetables (1 = most liked and 6 = least liked). The vegetable that was ranked fourth
was selected as the target vegetable. Child liking and intake of the target vegetable
increased significantly from baseline to post-intervention. Lakkakula and colleagues
conducted a study that explored repeated exposure of four vegetables (green bell peppers,
carrots, peas, tomatoes) offered to low-income elementary students during lunch in the
school cafeteria (Lakkakula, Geaghan, Zanovec, Pierce, & Tuuri, 2010). After the initial
tasting of all four vegetables, if a child indicated that they “did not like” at least one of
the four vegetables, they were placed in Group 1. Children that either reported “like it” or
“like it a lot” for all four vegetables were assigned to Group 2. After tasting all four
vegetables once a week for 10 weeks, 4th and 5th graders in Group 1 significantly
improved their liking of carrots, peas, and tomatoes (p < 0.05), whereas Group 2 did not
experience any increases in mean vegetable liking.
The majority of the repeated exposure studies that have improved liking of novel,
moderately disliked, and disliked vegetables have been conducted with young children
(ages 2 to 6) (Anzman-Frasca, Savage, Marini, Fisher, & Birch, 2012; Noradilah &
Zahara, 2012; Caton, et al., 2013; Corsini, Slater, Harrison, Cooke, & Cox, 2013; Fildes,
van Jaarsveld, Wardle, & Cooke, 2014; Holley, Haycraft, Farrow, 2015). Fewer studies
have explored if repeated exposure can improve child vegetable liking and vegetable
intake among elementary aged children (Lakkakula, Geaghan, Zanovec, Pierce, & Tuuri,
2010; Lakkakula, Geaghan, Wong, Zanovec, Pierce, & Tuuri, 2011).
.

11
1.4 Home Food Environment, Family Meals and Relationship to Child Obesity Risk
and Vegetable Intake
Children consume about two-thirds of their daily calories at home (Poti & Popkin, 2011),
thus making this an optimal setting to alter child dietary behaviors. One aspect of the
home food environment associated with child dietary behaviors is family meals.
A negative relationship may exist between the frequency of family meals and child BMI
(Taveras et al., 2005; Fulkerson, Neumark-Sztainer, Hannan, & Story, 2008; Serrano,
Torres, Perez, Palacios, 2014). Data from the 2003 National Survey of Children’s Health
showed that frequency of family meal consumption among non-Hispanic white children
between the ages of 6 and 11 was inversely related to being obese (Rollins, Belue, &
Francis, 2010). Findings were not statistically significant for children of other
race/ethnicity groups. A secondary analysis of data from the Project EAT study found an
inverse association between the frequency of family meals and BMI z-scores for
adolescent girls and boys (Berge et al., 2014).
More consistent is the research that shows that eating together as a family is related to
healthful dietary patterns including vegetable intake. In a study conducted with 2383
children recruited from 52 primary schools in London, children were more likely to meet
5-A-Day government recommendations, based on a single day of food diary
questionnaire, if they reported that they always ate with their family at mealtime, in
comparison to children who reported that they only sometimes or never ate with their
family (Christian, Evans, Hancock, Nykjaer, & Cade, 2013). In another study, a

12
secondary analysis was conducted based on data collected from the Home Environment
Comparison Study, a cross sectional study with families from low-income (≤ 250% of
federal poverty line) households in Chicago (Appelhans, Waring, Schneider, & Pagoto,
2014). The analysis explored the relationship between family meals, home-prepared
dinner, and child vegetable intake. Data from 103 households were analyzed, including
mostly Black and Hispanic families with a mean child age of 10 years. Excluding salad
and fried potatoes, general vegetable consumption was positively associated with
frequency of family meals.
1.5 Behavioral Economics
Overview
Behavioral economics, a concept grounded in principles of psychology and economics
(Just & Wansink, 2009), is based on the premise that the social and physical environment
can be framed in a way to “nudge” individuals to make choices (Thaler & Sunstein, 2008;
Heshmat, 2011). Behavioral economics strategies are presented in a subtle manner where
individuals are unaware that they are being employed.
An essential component of behavioral economics is libertarian paternalism, whereby it is
acceptable to shape choices but not restrict choices (i.e., individuals should have the
option to opt-out) (Thaler & Sunstein, 2008). The requirement that choice not be
restricted distinguishes behavioral economics strategies from traditional behavioral
strategies. For example, hiding vegetables may increase child vegetable intake (Spill,
Birch, Roe, & Rolls, 2011), but this is not a behavioral economics strategy because

13
children are unaware that vegetables are in the food and thus do not have the option to
opt-out from eating them. In a qualitative longitudinal study, low-income parents
indicated that hiding vegetables decreases opportunities to develop an appreciation for
vegetables, which may impact the development of healthy dietary habits in the long run
(Pescud & Pettigrew, 2014). Another example of a strategy that imposes restrictions on
choice is banning junk food.
According to Thaler and Sunstein (2008), a choice architect is someone who “has the
responsibility for organizing the context in which people make decisions.” The choice
architect may vary depending on the setting and the circumstance. For example, if
behavioral economics strategies were implemented during school lunch, the choice
architects may be a food service director, a teacher, or anyone else who has the authority
to make changes. In the home food environment, choice architects could be the primary
food preparer or anyone who plays a significant role in the grocery shopping, food
preparation, and/or mealtime routines (e.g., serving food, role modeling, etc.).
Altering the size and shape of vegetables (Liem & Zandstra, 2009; Olsen, Ritz, Kramer,
& Møller, 2012), as well as giving vegetables attractive names are effective behavioral
economics strategies that have increased child vegetable intake in the school setting.
Olsen and colleagues (2012) explored whether shape and/or size impacted child liking of
3 different vegetables (red peppers, cucumbers, and carrots) offered during a school
intervention (Olsen et al., 2012). The study was conducted with Danish children between
the ages of 9 and 12. Children liked their vegetables cut versus served whole, with slices

14
and sticks preferred over whole pieces and chunks. Shapes, such as stars, were preferred
over slices and sticks. Another study, conducted with 8 to 11 year old children in New
York, found that giving vegetables attractive names during school lunch (e.g. “X-ray
Vision Carrots”) increased vegetable intake (Wansink, Just, Payne, & Klinger, 2012).
Behavioral economics strategies tested in schools and other settings may be appropriate
for increasing child vegetable consumption during home dinner meals. The following
sections will explore nine behavioral economics strategies that could be implemented in
the home setting to potentially increase child vegetable intake.
Pair vegetables with other foods the child already likes.
Choices may be more desirable if presented in conjunction with a cue (i.e., a liked food)
(Samson, 2014). Thus pairing vegetables with dips and/or liked foods may be an effective
behavioral economics strategy.
Several studies have found that vegetable intake increases when vegetables are paired
with dips (Johnston et al., 2011; Savage, Peterson, Marini, Bordi, & Birch, 2013). For
example, in a randomized controlled study, once a week for 4 months children (middle
school aged) in the control group were served raw vegetables (i.e., carrots, broccoli, and
celery), while children in the intervention group were served the same raw vegetables
with peanut butter (Johnston et al., 2011). At the conclusion of the study, children in the
intervention group who were able to pair peanut butter with vegetables ate significantly
more vegetables than children in the control group (Johnston et al., 2011). In another

15
study conducted with preschoolers, children consumed more celery and yellow squash
when offered with a reduced-fat herb dip than when they were offered the vegetables
alone without the dip (Savage et al., 2013).
The impact of pairing vegetables with actual food (vs. dips) on vegetable intake remains
unclear. One study conducted with preschoolers found that children in the intervention
group (i.e., served steamed broccoli on top of cheese pizza) did not consume more
vegetables than children in the control group (i.e., served steamed broccoli as a side dish
with cheese pizza) (Correia, O'Connell, Irwin, & Henderson, 2014). When pairing
vegetables with other liked foods, it may be more effective to have the vegetable mixed
in with the food (e.g., green peas mixed in with macaroni and cheese), rather than just
placing the vegetable on top of the food. By mixing the vegetable in with the food, it
becomes more challenging for the child to pick the vegetable out of the food.
Make vegetables more easily available and visible than other foods at the dinner meal
When vegetables are visible and physically convenient, children consume more
vegetables. In a study conducted by Musher-Eizenman et al. (2010) children between the
ages of 3 and 11 were served carrot sticks for an afternoon snack in the school
gymnasium. Children were randomly assigned to sit at one of five tables, which were
arranged lengthwise down the room. All children were provided one serving of carrots
(i.e., 4 carrot slices). If children wanted more carrots, they got up from their seat and
informed the experimenter. They were then able to take another serving of carrots, which
was located in a serving bowl placed on the first table. Children were only allowed to

16
take one serving (i.e., 4 carrot slices) at a time. The study found that after controlling for
child’s age, the distance from the child’s seat to the first table, where the carrots were
located, predicted the number of carrots that were consumed.
Privitera and Zuraikat (2014) also conducted a study on how location of foods affects
intake. A between-subject study design was used where 56 adults were assigned to one
of three treatment groups: Apples Near (130 grams of sliced apples in arms reach and 37
grams of popcorn visibly located 2 m away on a counter top), Popcorn Near (37 grams of
popcorn in arms reach and 130 grams of sliced apples visibly located 2 m away on a
counter top), Both Near (130 grams of sliced apples in arms reach and 37 grams of
popcorn in arms reach). Study participants in the Apples Near and Popcorn Near groups
consumed more apples and popcorn, respectively.
Serve vegetables before the rest of the meal
By serving vegetables before the meal, children have the opportunity to choose and
consume vegetables without competition with other foods. An intervention conducted
with elementary students (grades K through 5) tested whether serving raw mini carrots, in
isolation, prior to the school lunch meal, increased carrot consumption for the total meal
(Redden, et al., 2015). On the control day, students could serve themselves pre-portioned
amounts of milk, fruit, and carrots from the lunch line. The hot entrée was served by
food service employees and included chicken tenders and buttered noodles. Children
were also able to go back for second servings of fruits and vegetables. On the
intervention day, children were served the same foods as previously mentioned, but they

17
also were given 2 raw mini carrots prior to entering the school lunch line. The study
found that on the intervention day, children consumed more carrots (including carrots
served first and carrots from the lunch line) than what was consumed on the control day.
The importance of serving vegetables in isolation was also underscored by a study
conducted by Harnack et al. (2012). These authors found that when preschoolers at a
Head Start Program were served fruits and vegetables prior to lunch, vegetable intake did
not improve. The authors suggested that vegetable intake did not improve because the
vegetables were served in conjunction with fruit, which is often more preferred and
therefore, could displace vegetable consumption.
Use a dinner plate that shows the amount of vegetables to eat for a meal
Physical characteristics (e.g., size) of a dinner plate may serve as a visual cue and
behavioral economics strategy that influences both food choice and intake. Several
studies have shown that there is a positive association between the size of dinnerware,
how much food is placed on the dinnerware, and how much of the food is actually
consumed (DiSantis et al., 2013; Wansink & van Ittersum, 2013; Libotte, Siegrist, &
Bucher, 2014; Wansink, Van Ittersum, & Payne, 2014). For example, one study found
that participants who used a larger plate (i.e., 32 cm vs. 27 cm) served themselves more
vegetables and consumed more vegetables (Libotte, Siegrist, & Bucher, 2014). McClain
and colleagues (2014) also suggested that the width of a dinner plate rim might influence
food intake, as wider rims were associated with smaller portions of food placed on the
plate. Lastly, dinner plates that are segmented and coupled with a food image can serve
as an assortment allocation cue about the type and quantity of food to eat. A study

18
conducted by Reicks and colleagues (2012) placed photographs of green beans and
carrots in separate compartments on cafeteria trays and found that consumption of both
vegetables increased significantly for elementary students during lunchtime.
One of the objectives for Healthy People 2010 was to “Increase the proportion of persons
aged 2 years and older who consume at least three daily servings of vegetables, with at
least one-third being dark green or orange vegetables” (Healthy People 2010, 2000). To
support this objective, in 2011 the USDA launched the MyPlate icon, a graphic
representation of the appropriate proportions of fruit, vegetables, grains, protein, and
dairy recommended at mealtimes (USDA, 2011). When the MyPlate icon is illustrated on
an actual plate (i.e., dinnerware), the graphic may have the potential to improve dietary
choices by serving as a visual reminder to not only place vegetables on the plate, but also
for these vegetables to represent one-quarter of the foods included in the meal.
Offer the child 2 vegetable options for dinner, one liked and one less liked
Offering children the choice between a liked and less liked vegetable is an example of the
behavioral economics concept known as asymmetric dominance and/or the decoy effect
(Samson, 2014). Asymmetric dominance occurs when an individual preference for one
option is presented with a less attractive option. It is hypothesized that if children are
asked to choose between two vegetable options, one liked and one less liked, children
will 1) make a choice and 2) most likely choose the vegetable that they like. Also, if
children are involved in selecting the vegetable they may be more likely to consume the
vegetable. A study has yet to evaluate if children given the choice between two

19
vegetables (one liked and one less liked) will increase vegetable intake in comparison to
children not given the choice.
If the caregiver puts vegetables on the child’s plate, give more than usual. If children
typically serve themselves, put a larger spoon than normally used with the vegetable so
they get more than usual
By making a larger serving spoon the default serving utensil for vegetable dishes,
children may serve themselves, or be served, larger portions of vegetables. The food
serving size is a visual cue that nudges individuals to consume the amount of food served
on their plate, in their bowl, etc. (Wadhera & Capaldi-Phillips, 2014). Mathias et al.
(2012) used a 2 X 2 within-subjects study design, where conditions varied by the amount
of fruit (75 vs. 150 grams) and vegetables (75 vs. 150 g) served to children between the
ages of 4 and 6 during dinner meals. Children who were served 150 grams of vegetables
consumed more vegetables than those served 75 grams, regardless if served 75 or 150
grams of fruit (i.e., the portion size of fruit did not influence vegetable intake).
The influence of size of dinnerware on food intake may be mediated by the size of the
serving utensil (Wansink, van Ittersum, & Painter, 2006; Fisher, Birch, Zhang, Grusak, &
Hughes, 2013). For example, using a 2 X 2 within-subjects study design, Fisher and
colleagues (2013) randomly assigned 60 children between the ages of 4 and 6 a serving
bowl with varying amounts of macaroni and cheese (275 or 550 grams) and a serving
spoon (teaspoon or tablespoon). When children were given the larger serving bowl of
macaroni and cheese (i.e., 550 grams) and a tablespoon, they served themselves more and

20
consumed more than when assigned any of the other conditions. Additional studies are
needed to determine if increasing the size of the serving spoon for vegetable dishes will
increase vegetable consumption among older children.
Eat dinner together with an adult(s) modeling vegetable consumption
Caregivers have the opportunity to role model healthy eating, which has been shown to
influence child dietary behaviors. Draxten et al. (2014) collected three 24-hour dietary
recalls from 8 to 12 year old children. Child/caregiver dyads also completed surveys that
assessed perceptions of parental role modeling of fruit and vegetable consumption during
dinner meals and snack times. In comparison to children who did not report parental role
modeling, children who reported parent role modeling of vegetable intake at snack times
and salad intake at dinner, were more likely to meet dietary recommendations for fruit
and vegetable intake.
Serve at least two vegetables with dinner meals
Serving more than one type of food is a visual cue that nudges consumers into eating
more (Wadhera & Capaldi-Phillips, 2014). Studies have shown a positive association
between the number of foods offered during a meal and how much consumers served
themselves and how much they ate (Just, Lund, & Price, 2012; Levitsky, Iyer, &
Pacanowski, 2012). The impact of offering more than one vegetable type on the selection
and consumption of vegetables has been tested in several studies with children (Kral,
Kabay, Roe, & Rolls, 2010; Roe, Meengs, Birch, & Rolls, 2013; Bucher, Siegrist, & van
der Horst, 2014). In an experimental study, 7 to 10 year old children were assigned to

21
serve themselves from one of three fake food buffet lines where the following fake foods
were available: 1) pasta, chicken, and carrots, 2) pasta, chicken, and green beans, or 3)
pasta, chicken, carrots, and green beans (Bucher, Siegrist, & van der Horst, 2014).
Children who were offered two vegetables (both carrots and green beans) served
themselves more vegetables than children who were only offered one vegetable. A study
conducted by Roe and colleagues (2013) found that preschoolers offered three types of
vegetables (cucumber, sweet pepper, and tomato) during snack consumed more
vegetables than preschoolers only offered a single vegetable type.
Let the child help prepare vegetable dishes
Involving children in vegetable preparation may be an effective behavioral economics
strategy to increase child vegetable intake by utilizing the “IKEA® Effect” (Norton,
Mochon, Ariely, 2011). The “IKEA Effect” is a concept that suggests that when
individuals are involved in the labor process, they value their product more highly. In a
series of experiments where college students were encouraged to build IKEA boxes, fold
origami, and build LEGO® sets, researchers learned that the value students placed on
their creation depended on whether or not they successfully completed their creation.
Thus children may need to not only be involved in vegetable preparation, but they may
need to be involved in the entire process to create the vegetable dish. One intervention
study found that 6 to 10 year old children who helped prepare a dinner salad (i.e., select
ingredients, wash, and chop vegetables) ate more salad than children who did not help
(Van der Horst, Ferrage, & Rytz, 2014).

22
1.6 Social Cognitive Theory
The Social Cognitive Theory (SCT) proposes a triadic and reciprocal relationship
between personal factors (e.g., beliefs and perceptions), environment (e.g, social and
physical environemnt), and behavior (e.g., vegetable intake) (Bandura, 1986; Baranowski
T, Perry CL, Parcel GS, 2002). Figure 1.1 is an adaptation of the SCT and illustrates a
proposed reciprocal relationship among personal factors (vegetable liking),
environmental strategies (behavioral economics strategies), and child behavior (vegetable
intake).
The SCT is commonly used to understand child dietary behaviors and inform
interventions that aim to modify these dietary behaviors. For example, Pearson and
colleagues (2010) used the SCT to inform the design of a study where adolescents (12 to
14 yrs) in the intervention group were mailed two fruit and vegetable newsletters over a
month. The newsletters addressed personal factors (e.g., normative beliefs, knowledge,
preferences) and healthy eating behaviors (e.g., fruit and vegetable intake). Adolescents
in the intervention group did not receive the fruit and vegetable newsletters. At the
conclusion of the intervention, adolescents in the intervention group had a higher intake
(p < 0.05) and preference (p < 0.01) for vegetables than adolescents in the control group.

23
Figure 1.1. Using the Social Cognitive Theory as a framework to understand
relationships between vegetable liking, behavioral economics strategies (i.e.,
environmental changes), and vegetable intake among low-income 9 to 12 year old
children.
Personal factors
(e.g., child vegetable liking)
Behavior
(e.g., child vegetable intake)
Environmental factors
(e.g., changes based on behavioral economics
strategies)

24
1.7 Summary and specific objectives
Children consume a substantial amount of their daily calories in the home environment,
making this a promising setting to improve vegetable consumption, especially among
low-income children who are at increased risk for diet-related conditions such as obesity.
When designing a home-based nutrition intervention, it is important to acknowledge that
personal factors (e.g., vegetable liking) and factors related to the home food environment
(e.g., frequency of family meals) influence child vegetable intake.
An alternative to traditional behavioral strategies, such as hiding vegetables in mixed
dishes, is the use of behavioral economics strategies. Behavioral economics
acknowledges that choices are often irrational and that the choice architecture (i.e.,
physical and social environment) can be manipulated to nudge individuals to make
healthier choices. Behavioral economics strategies, such as making healthier foods more
accessible than less healthy foods, nudge children to make healthier choices in the school
setting (Privitera and Zuraikat, 2014). In the home setting, a parent is often responsible
for preparing meals and thus would be the ideal choice architect to implement the
behavioral economics strategies. To our knowledge, a study has yet to explore whether
behavioral economics strategies can improve the selection and consumption of vegetables
during home-prepared meals among low-income children.
Research objectives and hypotheses
In two phases, this dissertation used both qualitative and quantitative methodology to
explore the feasibility and effectiveness of using behavioral and behavioral economics

25
strategies to increase dinner vegetable consumption among low-income children ages 9 to
12 residing in the Minneapolis/St. Paul metropolitan area. Additionally, a qualitative
study was conducted to understand how adolescent siblings (aged 13 to 18) of the 9 to 12
year old child, were involved in food preparation. The specific objectives and hypotheses
(when appropriate) of each study are listed below, along with the chapter numbers
indicating where the methodology, results and discussion relating to these objectives are
presented.
Phase 1 (Chapter 2)
Objective: To explore the feasibility, including facilitators and barriers, of implementing
16 behavioral strategies during in-home dinner meals using observational, survey, and
interview data.
Phase 2 (Chapters 3 and 4)
Objective 1: To determine the 6 of 9 most effective and feasible and feasible behavioral
economics strategies. Also, to explore perceived ease of use, as well as barriers and
facilitators to implementing the strategies.
Hypothesis: Mean dinner vegetable intake over 1 to 3 days for each strategy will
be greater for children exposed to some of the 9 behavioral economics strategies
(Intervention group) in comparison to children who are not exposed to the
behavioral economics strategies (Control group).
Objective 2: To evaluate if 9 behavioral economics strategies increase vegetable intake,
liking, and availability during an 8-week randomized controlled trial.

26
Hypothesis 1: Children exposed to behavioral economics strategies (Intervention
group) will consume more vegetables than children not exposed to the behavioral
economics strategies (Control group).
Hypothesis 2: Children exposed to behavioral economics strategies (Intervention
group) will have a higher liking of vegetables than children not exposed to the
behavioral economics strategies (Control group).
Hypothesis 3: Households where the behavioral economics strategies were
implemented (Intervention group) will have more vegetables available than
households where the behavioral economics strategies were not implemented
(Control group).
Adolescent Cooking Involvement Study (Chapter 5)
Objective: To understand how low-income adolescents are involved in home food
preparation.

27
1.8 References (Introduction & Chapter 1)
Anzman-Frasca, S., Savage, J. S., Marini, M. E., Fisher, J. O., & Birch, L. L. (2012). Repeated exposure and associative conditioning promote preschool children’s liking of vegetables. Appetite, 58(2), 543-553.
Appelhans, B. M., Waring, M. E., Schneider, K. L., & Pagoto, S. L. (2014). Food
preparation supplies predict children's family meal and home-prepared dinner consumption in low-income households. Appetite, 76, 1-8.
Bandura, A. (1986). Social foundations of thought and action: A social cognitive theory.
Englewood Cliffs, NJ: Prentice-Hall. Baranowski, T., Perry, C.L., & Parcel, G.S. (2002). How individuals, environments, and
health behavior interact. Health Behavior and Health Education. San Francisco, CA: Jossey-Bass, 165-84.
Berge, J.M., Wall, M. Larson, N., Forsyth, A., Bauer, K.W., & Neumark-Sztainer, D.
(2014). Youth dietary intake and weight status: healthful neighborhood food environments enhance the protective role of supportive family home environments. Health & Place, 26, 69-77.
Birch, L.L., & Davison, K.K. (2001). Family environmental factors influencing the
developing behavioral controls of food intake and childhood overweight. Pediatric Clinics of North America, 48 (4), 893-907.
Blanchette, L., & Brug, J. (2005). Determinants of fruit and vegetable consumption
among 6-12 year old children and effective interventions to increase consumption. Journal of Human Nutrition and Dietetics, 18 (6), 431-443.
Brown JL, Wenrich TR. (2012). Intra-family role expectations and reluctance to change
identified as key barriers to expanding vegetable consumption patterns during interactive family-based program for Appalachian low-income food preparers. Journal of the Academy of Nutrition and Dietetics, 112(8): 1188-1200.
Bucher, T., Siegrist, M., van der Horst, K. (2014). Vegetable variety: an effective strategy
to increase vegetable choice in children. Public Health Nutrition, 17, 1232-1236. Burton L. (2007). Childhood adultification in economically disadvantaged families: a
conceptual model*. Family Relations, 56(4), 329-345. Caton, S. J., Ahern, S. M., Remy, E., Nicklaus, S., Blundell, P., & Hetherington, M. M.
(2013). Repetition counts: repeated exposure increases intake of a novel vegetable in UK pre-school children compared to flavour–flavour and flavour–nutrient learning. British Journal of Nutrition, 109(11), 2089-2097.

28
Christian, M.S., Evans, C.E., Hancock, N., Nykjaer, C., & Cade, J.E. (2013). Family
meals can help children reach their 5 A Day: a cross-sectional survey of children’s dietary intake from London primary schools. Journal of Epidemiology
and Community Health, 67(4), 332-338. Correia, D. C., O'Connell, M., Irwin, M. L., & Henderson, K. E. (2014). Pairing
vegetables with a liked food and visually appealing presentation: promising strategies for increasing vegetable consumption among preschoolers. Childhood
Obesity, 10(1), 72-76. Corsini, N., Slater, A., Harrison, A., Cooke, L., & Cox, D. N. (2013). Rewards can be
used effectively with repeated exposure to increase liking of vegetables in 4–6-year-old children. Public Health Nutrition, 16(05), 942-951.
Cravener, T.L., Schlechter, H., Loeb, K.L., Radnitz, C., Schwartz, M., Zucker, N.,
Finkelstein, S., Wang, Y.C., Rolls, B.J. & Keller, K.L. (2015). Feeding strategies derived from behavioral economics and psychology can increase vegetable intake in children as part of a home-based intervention: results of a pilot study. Journal
of the Academy of Nutrition and Dietetics. May 23. doi: 10.1016/j.jand.2015.03.024. [Epub ahead of print]
DiSantis, K. I., Birch, L. L., Davey, A., Serrano, E. L., Zhang, J., Bruton, Y., & Fisher, J.
O. (2013). Plate size and children’s appetite: effects of larger dishware on self-served portions and intake. Pediatrics, 131(5), e1451-e1458.
Draxten, M., Fulkerson, J. A., Friend, S., Flattum, C. F., & Schow, R. (2014). Parental
role modeling of fruits and vegetables at meals and snacks is associated with children's adequate consumption. Appetite, 78, 1-7.
Faught, E., Vander Ploeg, K., Chu, Y.L., Storey, K., & Veugelers, P.J. (2015). The
influence of parental encouragement and caring about healthy eating on children’s diet quality and body weights. Public Health Nutrition, Jun 23:1-8. [Epub ahead of print]
Fildes, A., van Jaarsveld, C. H., Wardle, J., & Cooke, L. (2014). Parent-administered
exposure to increase children's vegetable acceptance: a randomized controlled trial. Journal of the Academy of Nutrition and Dietetics, 114(6), 881-888.
Fisher, J.O., Birch, L.L., Zhange, J., Grusak, M.A., & Hughes, S.O. (2013). External
influences on children’s self-served portions at meals. International Journal of
Obesity, 37 (7), 954-960. Fram, M.S., Ritchie, L.D., Rosen, N., & Frongillo, E.A. (2015). Child experience with

29
food insecurity is associated with child diet and physical activity. The Journal of
Nutrition. 145, 499-504.
Fulkerson, J. A., Neumark‐Sztainer, D., Hannan, P. J., & Story, M. (2008). Family meal
frequency and weight status among adolescents: cross‐sectional and 5‐year longitudinal associations. Obesity, 16(11), 2529-2534.
Gibson, E.L., Wardle, J., & Watts, C.J. (1998). Fruit and vegetable consumption,
nutritional knowledge and beliefs in mothers and children. Appetite, 31 (2), 205-228.
Golan, M. (2006). Parents as agents of change in childhood obesity‐from research to practice. International Journal of Pediatric Obesity, 1(2), 66-76. Gurnani, M., Birken, C., Hamilton, J. (2015). Childhood obesity: causes, consequences, and management. Pediatric Clinics of North America, 62(4), 821-40. Harnack, L.J., Oakes, J.M., French, S.A., Rydell, S.A., Farah, F.M., Taylor, G.L. (2012).
Results from an experimental trial at a Head Start center to evaluate two meal service approaches to increase fruit and vegetable intake of preschool aged children. International Journal of Behavioral Nutrition and Physical Activity, 9:51.
Heshmat, S. (2011). Eating Behavior and Obesity: Behavioral Economics Strategies for
Health Professionals. Springer Publishing Company. Holley, C.E., Haycraft, E., & Farrow, C. (2015). ‘Why don’t you try it again?’ a
comparison of parent led, home based interventions aimed at increasing children’s consumption of a disliked vegetable. Appetite, 87, 215-222.
Jabs, J., Devine, C.M., Bisogni, C.A., Farrell, T.J., Jastran, M., Wethington, E. (2007).
Trying to find the quickest way: employed mothers’ constructions of time for food. Journal of Nutrition Education and Behavior, 39(1): 18-25.
Johnston, C.A., Palcic, J.L., Tyler, C., Stansberry, S., Reeves, R.S., & Foreyt, J.P. (2011).
Increasing vegetable intake in Mexican-American youth: A randomized controlled trial. Journal of the American Dietetic Association, 111 (5), 716-720.
Just, D.R., Lund, J., Price, J. (2012). The role of variety in increasing the consumption of
fruits and vegetables among children. Agricultural Resource Economic Review,
41, 72–81. Just, D. R., & Wansink, B. (2009). Smarter lunchrooms: using behavioral economics to
improve meal selection. Choices, 24(3), 1-7.

30
Kaur, J., Lamb, M. M., & Ogden, C. L. (2015). The association between food insecurity and obesity in children—The National Health and Nutrition Examination Survey. Journal of the Academy of Nutrition and Dietetics, 115(5), 751-758.
Kim, S.A., Moore, L.V., Galuska, D., Wright, A.P., Harris, D., Grummer-Strawn, L.M.,
Merlo, C.L., Nihiser, A.J., Rhodes, D.G. (2014). Vital signs: fruit and vegetable intake among children-United States, 2003-2010. MMWR Morbidity Mortality
Weekly Report, 63 (31), 671-676. Kirkpatrick, S. I., Dodd, K. W., Reedy, J., & Krebs-Smith, S. M. (2012). Income and
race/ethnicity are associated with adherence to food-based dietary guidance among US adults and children. Journal of the Academy of Nutrition and Dietetics, 112(5), 624-635.
Kral, T.V., Kabay, A.C, Roe, L.S., & Rolls, B.J. (2010). Effects of doubling the portion
size of fruit and vegetable side dishes on children’s intake at a meal. Obesity, 18 (3), 521-527.
Kuczmarski, R. J., Ogden, C. L., Grummer-Strawn, L. M., Flegal, K. M., et al. (2000).
CDC growth charts: United States. Advance Data, 314, 1-27. Lakkakula, A., Geaghan, J., Zanovec, M., Pierce, S., & Tuuri, G. (2010). Repeated taste
exposure increases liking for vegetables by low-income elementary school children. Appetite, 55(2), 226-231.
Lakkakula, A., Geaghan, J. P., Wong, W. P., Zanovec, M., Pierce, S. H., & Tuuri, G.
(2011). A cafeteria-based tasting program increased liking of fruits and vegetables by lower, middle and upper elementary school-age children. Appetite, 57(1), 299-302.
Landers, P., & Shults, C. (2008). Pots, Pans, and Kitchen Equipment: Do Low-Income Clients Have Adequate Tools for Cooking?. Journal of Extension, 46(1). Leak, T.M., Swenson, A., Vickers, Z., Mann, T., Mykerezi, E., Redden, J., Rendahl, A.,
Reicks, M. (2015). Testing the effectiveness of in-home behavioral economics strategies to increase vegetable intake, liking, and variety among children residing in households that receive food assistance. Journal of Nutrition Education and
Behavior, 47 (2), e1-e9. Ledoux, T. A., Hingle, M. D., & Baranowski, T. (2011). Relationship of fruit and
vegetable intake with adiposity: a systematic review. Obesity Reviews, 12(5), e143-e150.
Levitsky, D.A., Iyer, S. & Pacanowski, C.R. (2012). Number of foods available at a meal
determines the amount consumed. Eating Behaviors, 13 (3), 183-187.

31
Libotte, E., Siegrist, M., & Bucher, T. (2014). The influence of plate size on meal
composition. Literature review and experiment. Appetite, 82, 91-96. Liem, D. G., & Zandstra, L. H. (2009). Children's liking and wanting of snack products:
Influence of shape and flavour. International Journal of Behavioral Nutrition and
Physical Activity, 6, 38. doi: 10.1186/1479-5868-6-381479-5868-6-38 [pii]. Lutfiyya, M. N., Garcia, R., Dankwa, C. M., Young, T., & Lipsky, M. S. (2008).
Overweight and obese prevalence rates in African American and Hispanic children: an analysis of data from the 2003–2004 National Survey of Children's Health. The Journal of the American Board of Family Medicine, 21(3), 191-199.
Mancino, L., Newman, C. Who has time to cook? How family resources influence food preparation. Economic Research Service. http://www.ers.usda.gov/publications/err40/. Accessed August 4, 2015.
Mathias, K.C., Rolls, B.J., Birch, L.L, Kral, T.V. Hanna, E.L., Davey, A., & Fisher, J.O.
(2012). Serving larger portions of fruits and vegetables together at dinner promotes intake of both foods among young children. Journal of the Academy of
Nutrition and Dietetics, 112(2), 266-270. Matthews, V. L., Wien, M., & Sabaté, J. (2011). The risk of child and adolescent
overweight is related to types of food consumed. Nutrition Journal, 10(1), 71-74. McClain, A. D., van den Bos, W., Matheson, D., Desai, M., McClure, S. M., &
Robinson, T. N. (2014). Visual illusions and plate design: the effects of plate rim widths and rim coloring on perceived food portion size. International Journal of
Obesity, 38(5), 657-662. Miller, P., Moore, R. H., & Kral, T. V. (2011). Children’s daily fruit and vegetable
intake: associations with maternal intake and child weight status. Journal of
Nutrition Education and Behavior, 43(5), 396-400. Musher-Eizenman, D.R., Young, K.M., Laurene, K., Galliger, C., Hauser, J., & Oehlhof,
M.W. (2010). Children’s sensitivity to external cues: How distance to serving bowl influences children’s consumption. Health Education & Behavior, 37 (2), 186-192.
Nielson,S.J., Rossen, L.M., Harris, D.M., & Ogden, C.L. (2014). Fruit and vegetable
consumption of US youth, 2009-2010. NCHS Data Brief, 156, 1-8. Noradilah, M., & Zahara, A. (2012). Acceptance of a test vegetable after repeated
exposures among preschoolers. Malaysian Journal of Nutrition, 18(1), 67-75.

32
Norton, M.I., Mochon, D., & Ariely, D. (2011). The 'IKEA effect': When labor leads to love. Harvard Business School Marketing Unit Working Paper, (11-091).
Ogden, C. L., Carroll, M. D., Kit, B. K., & Flegal, K. M. (2014). Prevalence of childhood
and adult obesity in the United States, 2011-2012. The Journal of the American
Medical Association, 311(8), 806-814. Olsen, A., Ritz, C., Kramer, L., & Møller, P. (2012). Serving styles of raw snack
vegetables. What do children want?. Appetite, 59(2), 556-562. Pearson, N., Atkin, A.J., Biddle, S.J., & Gorely, T. (2010). A family-based intervention
to increase fruit and vegetable consumption in adolescents: a pilot study. Public
Health Nutrition, 13 (06), 876-885. Pescud, M., & Pettigrew, S. (2014). Parents’ experiences with hiding vegetables as a
strategy for improving children's diets. British Food Journal, 116(12), 1853-1863. Poti, J. M., & Popkin, B. M. (2011). Trends in energy intake among US children by
eating location and food source, 1977-2006. Journal of the American Dietetic
Association, 111(8), 1156-1164. Privitera, G.J., & Zuraikat, F.M. (2014). Proximity of foods in a competitive food
environment influences consumption of a low calorie and a high calorie food. Appetite, 76, 175-179.
Redden, J.P., Mann, T., Vickers, Z., Mykerezi, E., Reicks, M., Elsbernd, S. (2015).
Serving first in isolation increases vegetable intake among elementary schoolchildren. PLoS One, 10(4):e0121283.
Reicks, M., Redden, J.P., Mann, T., Mykerezi, E., Vickers, Z. (2012). Photographs in
lunch tray compartments and vegetable consumption among children in elementary school cafeterias. Journal of the American Medical Association, 307, 784-785.
Roe, L.S., Meengs, J.S., Birch, L.L., & Rolls, B.J. (2013). Serving a variety of vegetables and fruit as a snack increased intake in preschool children. The American Journal
of Clinical Nutrition, 98 (3), 693-699.
Rollins, B. Y., Belue, R. Z., & Francis, L. A. (2010). The beneficial effect of family meals on obesity differs by race, sex, and household education: the national survey of children's health, 2003-2004. Journal of the American Dietetic
Association, 110(9), 1335-1339. Samson, A. (Ed.)(2014). The Behavioral Economics Guide 2014 (with a foreword by
George Loewenstein and Rory Sutherland) (1st ed.). Retrieved from http://www.behavioraleconomics.com.

33
Savage, J.S., Peterson, J., Marini, M., Bordi, P.L., & Birch, L.L. (2013). The addition of
a plain or herb-flavored reduced-fat dip is associated with improved preschoolers' intake of vegetables. Journal of the Academy of Nutrition and Dietetics, 113 (8), 1090-1095.
Serrano, M., Torres, R., Perez, C.M., Palacios, C. (2014). Social environmental factors,
diet quality, and body weight in 12-year-old children from four public schools in Puerto Rico. Puerto Rico Health Sciences Journal, 33 (2), 80-87.
Slining, M. M., Mathias, K. C., & Popkin, B. M. (2013). Trends in food and beverage
sources among US children and adolescents: 1989-2010. Journal of the Academy
of Nutrition and Dietetics, 113(12), 1683-1694. Spill, M. K., Birch, L. L., Roe, L. S., & Rolls, B. J. (2011). Hiding vegetables to reduce
energy density: an effective strategy to increase children's vegetable intake and reduce energy intake. The American Journal of Clinical Nutrition, 94(3), 735-741.
Serdula M.K., Ivery D., Coates R.J., Freedman, D.S., Williamson, D.F., & Byers, T.
(1993). Do obese children become obese adults? A review of the literature. Preventive Medicine, 22(2),167-177.
Taveras, E. M., Rifas‐Shiman, S. L., Berkey, C. S., Rockett, H. R., Field, A. E., Frazier, A. L., & Gillman, M. W. (2005). Family dinner and adolescent overweight. Obesity
Research, 13(5), 900-906. Thaler, R. H., & Sunstein, C. R. (2008). Nudge: Improving Decisions about Health,
Wealth, and Happiness. Yale University Press. United States Department of Agriculture. ChooseMy-Plate.gov. Available at:
http://www.choosemyplate.gov/index.html. Published 2011. Accessed September 23, 2014.
United States Department of Agriculture Food and Nutrition Service. HealthierUS School Challenge: Smarter Lunchrooms. Available at
http://teamnutrition.usda.gov/hussc/healthierus-school-challenge-smarter-lunchrooms. Accessed July 27, 2015.
United States Department of Health and Human Services, Public Health Service, Office of Disease Prevention and Health Promotion. Healthy People 2010: Volume I and II. Washington, DC: U.S. Government Printing Office; January 2000. Van der Horst, K., Ferrage, A., & Rytz, A. (2014). Involving children in meal
preparation. Effects on food intake. Appetite, 79, 18-24.

34
Wadhera, D., & Capaldi-Phillips, E.D. (2014). A review of visual cues associated with food on food acceptance and consumption. Eating Behaviors, 15 (1), 132-143.
Wansink, B., Just, D. R., Payne, C. R., & Klinger, M. Z. (2012). Attractive names sustain
increased vegetable intake in schools. Preventive Medicine, 55(4), 330-332. Wansink, B., & van Ittersum, K. (2013). Portion size me: plate-size induced consumption
norms and win-win solutions for reducing food intake and waste. Journal of
Experimental Psychology: Applied, 19(4), 320. Wansink, B., Van Ittersum, K., & Painter, J.E. (2006). Ice cream illusions: bowls,
spoons, and self-served portion sizes. American Journal of Preventive Medicine, 31 (3), 240-243.
Wansink, B., Van Ittersum, K., & Payne, C. R. (2014). Larger bowl size increases the
amount of cereal children request, consume, and waste. The Journal of Pediatrics, 164(2), 323-326.

35
CHAPTER 2: PHASE 1
Exploring the Feasibility of Implementing Behavioral Economics Strategies to Increase
Vegetable Intake, Liking, and Variety Among Children Aged 9 to 12 Residing in Food
Assistance Households

36
2.1 Introduction
According to What We Eat in America NHANES 2011-2012, children (2 to 19 years) are
not consuming sufficient amounts of vegetables to meet dietary recommendations
(USDA, ARS 2014; USDA, 2010). Child and adolescent vegetable intake has declined in
the past 20 years (Slining, et al., 2013). These undesirable vegetable trends raise
concerns, especially for low-income children who may be at greater risk for diet-related
health conditions such as obesity (Singh, et al., 2010).
One of the most influential determinants of child vegetable consumption is vegetable
liking. Many studies have found that repeated exposure increases both vegetable liking
and intake among pre-school aged children (Anzman-Frasca, et al. 2012; Fildes, et al.,
2014; Holley, et al., 2015), but few have studied this relationship among older children
(Lakkakula, et al., 2010; Corsini, et al. 2013; Remington et al., 2012).
Behavioral economics is based on the premise that choices can be framed in a way to
“nudge” individuals to make a particular choice, but not to impose objectionable
restrictions (Thaler & Sunstein, 2008). Several studies have shown that behavioral
economics strategies in the school setting (e.g., making healthy options more accessible
than less healthy options) can effectively improve child dietary intake (Hanks et al.,
2012; Reicks, Redden, Mann, & Vickers, 2012; Hanks et al., 2013; Wansink et al., 2013;
Miller et al., 2015; Price et al., 2015; Redden et al., 2015). The home environment is a
promising setting to promote child vegetable consumption because children consume
most of their food calories at home (Adair & Popkin, 2005). In the home environment,

37
there are several ways caregivers play an important role in shaping child dietary patterns,
such as deciding what to prepare for meals (Wang, 2013), controlling food availability
(Cutler, et al., 2011; Ding et al., 2012; Couch et al., 2014), and modeling healthful eating
behaviors (Berge et al., 2014; Draxten et al., 2014). A study has yet to explore the
feasibility of implementing behavioral economics strategies in the home setting,
especially in low-income households, as a means of increasing child vegetable intake.
Research is needed to understand the low-income home food environment choice
architecture.
The purpose of this formative study was to assess the feasibility of implementing home-
based behavioral strategies to increase dinner vegetable intake among children aged 9 to
12 years who reside in food assistance households. More specifically, the facilitators and
barriers that caregivers may experience when implementing strategies during dinner
preparation and mealtime were explored. The findings from this study informed the
design and implementation of a randomized-controlled study that evaluated the
effectiveness of 9 behavioral economics strategies to improve child intake, liking, and
variety of vegetables at dinner meals (described in Chapters 3-4).
2.2 Methods
Participants and Recruitment
The study sample consisted of 20 caregiver-child dyads residing in the Minneapolis/St.
Paul metropolitan area. Staff from the University of Minnesota Extension assisted with
recruitment efforts by serving as liaisons between the research team and community

38
partners who worked with the study target population. Recruitment sites included
libraries, community centers, school-related events, and health clinics. Caregivers were
eligible to participate if they reported having at least one child between the ages of 9 and
12, were the primary food preparer in the home, prepared dinner at least three nights a
week, and indicated that someone in the home visited a food shelf in the last three months
or participated in at least one of the following programs: Supplemental Nutrition
Assistance Program (SNAP), Special Supplemental Nutrition Program for Women,
Infants, and Children (WIC), and National School Lunch Program (NSLP) at a free or
reduced cost. In instances when there was more than one 9 to 12 year old in the home,
the caregiver was asked to select one child (i.e., target child) to participate in the study.
Caregivers who were not comfortable reading, writing, and speaking English were
excluded from the study. Approval was obtained from the University of Minnesota-Twin
Cities Institutional Review Board and participants signed informed consent/assent forms.
Caregivers were compensated with $40 for their time.
Study Design
One time in-home observations of a typical dinner, including preparation and mealtime,
were conducted on weeknights (i.e., Monday through Friday) between August and
December 2012. Visits were scheduled at various times in the evening when both the
caregiver and the target 9 to 12 year old child were home, along with anyone else who
was normally present at dinner meals. At least two researchers were present during all
in-home visits, which lasted between 1 and 3.5 hours (on average, 1 hour 45 minutes).
In-home visits consisted of three components: 1) a checklist form where researchers

39
recorded observations about the home food environment, dinner preparation, and
mealtime, 2) questionnaires about household sociodemographic characteristics and food
security, home vegetable availability, as well as caregiver and child vegetable liking, and
3) brief individual interviews with the caregiver and child to better understand typical
dinner meal routines and vegetable preferences.
Strategy Selection Process
A literature review was conducted to identify behavioral economics strategies that have
improved child dietary behaviors in various settings (e.g., school, home, etc.). After
reviewing the literature, a multidisciplinary team selected 20 strategies for further
evaluation. These 20 strategies were then sent via email to 48 experts in the field of
behavioral economics for review. These experts had 1) authored publications in the area
of behavioral economics applied to food choice or factors affecting home vegetable
intake among children; 2) made presentations at conferences regarding behavioral
economics research and food choice; and/or 3) received funding to apply behavioral
economics strategies to child feeding programs. Panelists rated the strategies for
feasibility (1 = none, 2 = low, 3 = moderate and 4 = high), potential effectiveness (1 =
none, 2 = low, 3 =moderate and 4=high), and classification as a behavioral economics
strategy (1 = no, not at all, 2 = borderline and 3 = yes, definitely). Sixteen strategies were
selected, including 14 behavioral economics strategies and two traditional behavioral
strategies (i.e., ‘Hide vegetables in other foods’ and ‘Ban junk food at meals’), which
were included to compare feasibility (Table 2.1). These strategies were selected based on
the expert review panel ratings, as well as feedback provided by the multidisciplinary

40
team regarding feasibility, potential effectiveness, and whether the strategies were
informed by behavioral economics.
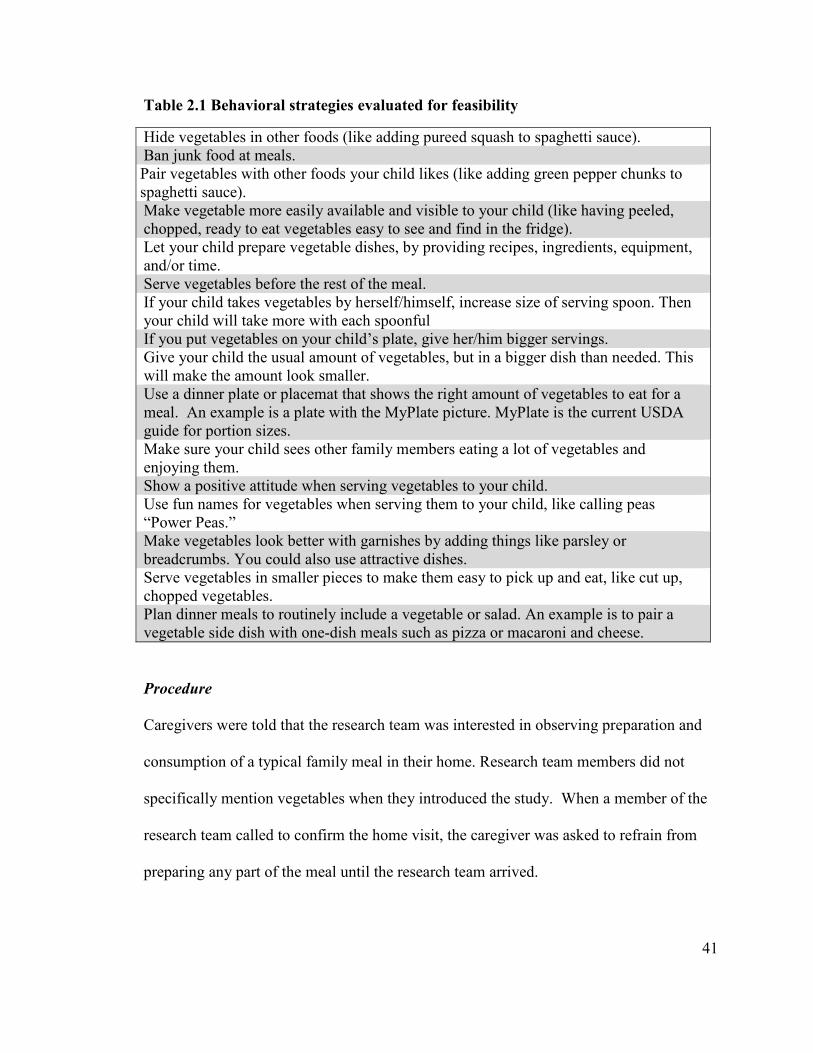
41
Table 2.1 Behavioral strategies evaluated for feasibility
Hide vegetables in other foods (like adding pureed squash to spaghetti sauce). Ban junk food at meals. Pair vegetables with other foods your child likes (like adding green pepper chunks to spaghetti sauce). Make vegetable more easily available and visible to your child (like having peeled, chopped, ready to eat vegetables easy to see and find in the fridge). Let your child prepare vegetable dishes, by providing recipes, ingredients, equipment, and/or time. Serve vegetables before the rest of the meal. If your child takes vegetables by herself/himself, increase size of serving spoon. Then your child will take more with each spoonful If you put vegetables on your child’s plate, give her/him bigger servings. Give your child the usual amount of vegetables, but in a bigger dish than needed. This will make the amount look smaller. Use a dinner plate or placemat that shows the right amount of vegetables to eat for a meal. An example is a plate with the MyPlate picture. MyPlate is the current USDA guide for portion sizes. Make sure your child sees other family members eating a lot of vegetables and enjoying them. Show a positive attitude when serving vegetables to your child. Use fun names for vegetables when serving them to your child, like calling peas “Power Peas.” Make vegetables look better with garnishes by adding things like parsley or breadcrumbs. You could also use attractive dishes. Serve vegetables in smaller pieces to make them easy to pick up and eat, like cut up, chopped vegetables. Plan dinner meals to routinely include a vegetable or salad. An example is to pair a vegetable side dish with one-dish meals such as pizza or macaroni and cheese.
Procedure
Caregivers were told that the research team was interested in observing preparation and
consumption of a typical family meal in their home. Research team members did not
specifically mention vegetables when they introduced the study. When a member of the
research team called to confirm the home visit, the caregiver was asked to refrain from
preparing any part of the meal until the research team arrived.

42
Upon arrival, and after consent/assent were obtained (Appendices 7.1 and 7.2),
researchers asked the caregiver where to set up the video recorder to capture dinner
preparation. When possible, researchers would place the video recorder on a tripod and
sit in another room to reduce the risk of influencing what the caregiver prepared and
served. At times, several caregivers wanted to talk with a member of the research team
during meal preparation. If this occurred, only one researcher remained in the room with
the caregiver and was careful not to discuss food and/or any other topic that could
introduce bias (e.g., personal dietary habits). The other researcher attempted to be out of
sight and would begin completing the Observation Checklist or collecting Field Notes
(described in more detail in upcoming sections).
The schedule first allowed the caregiver to prepare the meal and eat with their family, and
then complete the surveys/questionnaires and participate in a brief qualitative interview.
A researcher administered all surveys/questionnaires, such that questions and answer
choices were read aloud for both the caregiver and child. Also, data were collected from
the caregiver by one researcher and from the target child by another researcher.
Researchers also attempted to collect the data from the caregiver and target child in
different areas of the home so they would not influence each other’s responses.
The research team was very purposeful about the order in which data were collected, as
illustrated in Table 2.2. If free time was available while the meal was being prepared
(e.g., the food being prepared needed to bake for 30 minutes), the caregiver was asked to
complete the Sociodemographic and Household Characteristics Questionnaire. Also, a

43
researcher would begin collecting the Home Vegetable Inventory and Observation
Checklist data, if they felt they could do so without being obtrusive (e.g., if the caregiver
was not in the kitchen). The Vegetable Liking Surveys were not completed until after the
meal was consumed to avoid alerting the caregiver that the research team was interested
in vegetables, which could have altered what the caregiver would prepare for the dinner
meal. The caregiver completed the Household Food Security Questionnaire last due to
the sensitive nature of the questions. The study instruments/measures, as well as
qualitative data collection measures are described in more detail in the following
sections.
Table 2.2 Order in which data were collected
Completed by Caregiver Completed by Target
Child
Completed by Researcher
1. Sociodemographic and Household Characteristics Questionnaire
1. Child Vegetable Liking Survey
1. Field Notes
2. Caregiver Vegetable Liking Survey
2. Brief Qualitative Interview
2. Observation Checklist
3. Behavioral Strategy Questionnaire
3. Home Vegetable Inventory
4. Brief Qualitative Interview
5. Household Food Security Survey
Instruments/Measures
Sociodemographic and Household Characteristics Questionnaire
Items on the Household Characteristics Questionnaire were intended to capture data on
household sociodemographic characteristics, grocery shopping practices, and caregiver

44
vegetable consumption patterns (Appendix 7.3). Questions were included to assess
caregiver’s age, gender, race/ethnicity, highest educational attainment, and employment
status. If applicable, information about race/ethnicity and employment status of a
spouse/significant other residing in the home was obtained. Information about age,
gender, and race/ethnicity of the 9 to 12 year old child was obtained. Household
composition data were also collected on the total number of children and adults residing
in the home. Caregivers also answered food frequency questions about how often
vegetable juices, green salad, potatoes, beans, vegetable soup, and other vegetables were
consumed (i.e., less than one week, once a week, 2-3 times a week, 4-6 times a week,
once a day, more than 2 times a day) (National Cancer Institute, 2000).
Household Food Security Survey
An amended version of the 6-item USDA Food Security Survey was used to assess
household food security (USDA Economics Research Service, 2012). In the original 6-
item USDA Food Security Survey, question AD1 read, “In the last 12 months, since last
(name of current month), did (you/you or other adults in your household) ever cut the size
of your meals or skip meals because there wasn't enough money for food?” and question
AD1a read, “[IF YES AD1, ASK] How often did this happen—almost every month,
some months but not every month, or in only 1 or 2 months?” For the current study, the
response options from AD1a were used for question AD1, and thus participants were
only asked 5 questions. For every affirmative response, 1 point was assigned. The
following scale was used to determine household food security: 0 to 1 indicated high or
marginal food security, 2-3 low food security, and 4-5 very low food security. The 5-

45
item USDA Food Security Survey used in the current study is provided in Appendix 7.4.
Vegetable Liking Survey
Both the child and caregiver provided liking scores for 16 types of vegetables. For 11 of
those vegetables they provided two scores, one score for the vegetable raw and another
score for the vegetable cooked (i.e., a total of 27 scores). Caregivers rated liking on a
labeled affective magnitude (LAM) scale ranging from “greatest possible dislike” to
“greatest possible like”, with “neither liked nor disliked” at the middle of the horizontal
scale (Schutz & Cardello, 2001; Appendix 7.5). The scale ranged from 0 cm at one end
(greatest possible dislike) to 23 cm at the other end (greatest possible like). Caregivers
were able to mark anywhere on the line to indicate vegetable liking. A trained researcher
measured the distance from where the caregiver marked the line to the 0 cm mark and
this value was recorded. Children used a 10-point hedonic scale to rate vegetable liking
(where 1 = “hate it”, 5-6 = “it’s okay”, and 10 = “like it a lot”), which was expressed
verbally by the child and written down by the researcher (Appendix 7.6). When a
caregiver and/or child indicated that they had never had a vegetable, the researcher
checked the “never tried” box.
Behavioral Strategy Questionnaire
Caregivers were asked if they were currently implementing any of the 16 behavioral
strategies (Table 2.1), yes or no (Appendix 7.7). If caregivers indicated that they were
not currently doing the strategy, they were asked how likely they were to try the strategy

46
using the following scale: very unlikely (0), somewhat unlikely (1), neither unlikely nor
likely (2), somewhat likely (3), or very likely (4).
Home Vegetable Inventory
A shortened version of a previously validated home food inventory was used to document
the presence of 36 vegetables, including four types of legumes (Fulkerson et al., 2008;
Appendix 7.8). A member of the research team asked the caregiver where all food was
located in the home (e.g., cupboard, refrigerator, freezer). That researcher then checked
each of those locations and marked yes (1) or no (0) if the vegetable was present and also
noted in what form (s) (e.g., fresh, frozen, and/or canned).
Observation Checklist
A multidisciplinary research team consisting of professionals in food science, nutrition,
health psychology, applied economics, and marketing developed the observation
checklist form. Researchers used the observation checklist form to document information
about the home food environment that may impact the feasibility of implementing
behavioral strategies at dinner meals (Appendix 7.9).
Researchers assessed several aspects of the physical environment, such as vegetable
accessibility and available kitchen space for preparation. To determine if caregivers had
the necessary kitchen equipment/supplies to implement the behavioral economics
strategies, researchers recorded the presence of the following items in the home: knives,
strainers, peelers, vegetable brushes, blenders, food processors, cutting boards, steamers,

47
and any other equipment that could assist with vegetable preparation (e.g., can opener).
Other information about the home food physical environment recorded on the
observation checklist form included the way the dinner meal was served (e.g., family
style, buffet, pre-plated, etc.) and size of serving containers and utensils used for the meal
(i.e., small, medium, or large).
Additional questions assessed whether the vegetables were served in a child-friendly
form (e.g., cut in small pieces), if the vegetables were paired with other foods the child
liked, and if there was positive parental interaction based on consensus between both
researchers. Information was collected about the time the menu for the evening was
decided upon (the caregiver was asked explicitly), how the vegetables were prepared, and
time it took to prepare all of the vegetables.
Relevant social interactions were also assessed, such as child involvement in deciding
what was served at the dinner meal and assistance with vegetable preparation. The
potential for role modeling vegetable intake was documented by assessing whether the
child and caregiver consumed vegetables with their meal and, if so, the fraction
consumed (none, ¼, ½, ¾, all, and seconds). General mealtime observations were also
made including who was present for the meal (e.g., how many children and adults),
where the meal was consumed (e.g., living room, kitchen table), whether everyone ate
together, and if there were any dinnertime distractions (e.g., television, radio, cell
phones).

48
Qualitative Data Collection
Brief qualitative interviews
Brief individual semi-structured qualitative interviews were conducted with both the
caregiver and target child at the end of the home visit. The overall aim of the interviews
was to better understand potential barriers and facilitators caregivers may experience
when implementing the behavioral economics strategies. More specifically, caregivers
were asked about how they decide what to serve for dinner, general dinner meal routines,
and grocery shopping habits (Appendix 7.10). Interviews with the caregiver lasted
between 5 and 21 minutes (on average, 10 minutes). The target child was asked about
vegetable preferences, typical vegetable preparation and serving style in the home, and
rules about eating vegetables (Appendix 7.11). Interviews with the children lasted
between 5 and 16 minutes (on average, 7 minutes).
Field Notes
Researchers wrote field notes to record relevant observations that may not have been
included on the Observation Checklist or captured on the video recording, as well as to
document any challenges participants experienced with the data collection tools. Also,
notes from conversations were recorded, especially if during those conversations
participants revealed information that could impact the feasibility of the behavioral
economics strategies.

49
Video Observations
The data from the video recordings were not used to assess the feasibility of the
behavioral economics strategies. The video observations were discussed in more detail in
the thesis of Alison Swenson (Swenson, 2015).
Pilot Test
A pilot test of the data collection instruments and procedures was conducted with 5
families who met the study eligibility criteria. Based on the pilot test findings, several
changes were made to the data collection instruments and procedures. One concern was
that the in-home visits were too long and this might be a burden for some families. In an
attempt to decrease participant burden and shorten in-home visits, researchers decided to
use the 6-item USDA Food Security Survey moving forward, instead of the 18-item
USDA Food Security Survey. During the pilot, the Home Vegetable Inventory included
questions about competitive foods (i.e., frozen desserts, microwaveable/quick cook
frozen foods, prepared desserts, chips/crackers/other snack foods, beverages, candy) that
may displace the presence of vegetables. Researchers decided to only document the
presence of vegetables and legumes on the Home Vegetable Inventory to decrease the
length of time spent collecting data in the home. Lastly, many of the target children
appeared to have a limited attention span during the Child Vegetable Liking Survey,
therefore questions about where each vegetable was usually consumed (i.e., home,
school, restaurant, friend’s house, relative’s house, or other) were removed.

50
Additional changes were also made after the pilot test. For example, because steaming
vegetables is a healthy alternative to frying vegetables, vegetable steamers were added to
the list of kitchen equipment included on the Observation Checklist. Researchers also
believed that it would be better for caregivers to use a labeled affective magnitude (LAM)
scale (Schutz & Cardello, 2001) instead of the 10-point hedonic scale used during the
pilot study to rate vegetable liking and thus this change was made to the Adult Vegetable
Liking Survey. To better determine if caregivers were actually implementing any of the
strategies, questions on the Behavioral Strategy Questionnaire were changed to inquire if
the caregiver was doing the strategy and if not, would they be willing to implement it,
instead of what they thought about the behavioral strategies. Lastly, to encourage more
in-depth responses from the participants, questions on the caregiver and child brief
qualitative interview guide were rephrased to be more open-ended. Researchers also
added more probes.
Data Analyses
Instruments/Measures
Descriptive statistics (e.g., mean, ranges, percentages, sum/counts) were calculated to
examine the distribution of sociodemographic and household characteristics, household
food security, vegetable liking, whether caregivers were currently implementing any of
the behavioral strategies, and home vegetable availability. Both quantitative and
qualitative data were captured on the Observation Checklist. Descriptive statistics were
calculated for some data on the Observation Checklist. Other findings were summarized.

51
In order for researchers to compare liking ratings between the caregiver and target child,
caregiver ratings were converted to a 10-point scale. Children rated vegetable liking on a
scale of 1 to 10, so the caregiver rating scale was changed to 1 to 24 cm (originally 0 to
23 cm, but the child rating did not include 0). As reported by Swenson (2015), “these
values were converted to the 10-point scale by multiplying by 10/24, then adding 10/24,
and rounding any values < 1.0 to 1.0”. For both the Caregiver and Child Vegetable
Liking, ratings ≥ 5 indicated that the vegetable was liked and < 5 indicated that the
vegetable was not liked.
Qualitative Analyses
All interviews were audio recorded and transcribed verbatim. Transcripts were entered
into NVivo (version 10, QSR International) to facilitate coding. The research team
developed 2 codebooks, one for the child and another for the caregiver to guide analysis,
and these codebooks were modified as needed to provide clarification on codes. Two
researchers independently coded transcripts. When there were differences in coding, the
researchers discussed the differences and came to a consensus to reconcile the difference.
After the transcripts were coded, researchers summarized the facilitators and barriers to
implementing each of the behavioral economics strategies.
Feasibility of Strategies
A Strategy Analysis Form was developed by the research team to organize the survey,
observation, and interview data for the purpose of determining feasibility of each strategy
(Appendix 7.12). Two researchers separately assigned a score on a 5-point scale (1 “not

52
at all” to 5 “very feasible”) upon consideration of the feasibility data collected. Each
family received 32 feasibility scores, two scores for each strategy that were later averaged
to determine how feasible it was for that family to implement each of the 16 strategies. If
the individual scores differed by more than one point, the two researchers met to discuss
their rationale behind scoring that strategy for that particular family and came to a
consensus. Once the two scores were averaged for each strategy, the total scores for all
20 families were then averaged for each of the 16 strategies to determine how feasible
strategies were for the entire study population. A sample page from the Strategy
Analysis Form can be found in Appendix 7.12.
2.3 Results
Instruments/Measures
Sociodemographic and Household Characteristics
Findings from the Sociodemographic and Household Characteristics Questionnaire are
described in Table 2.3. Caregivers were between the ages of 28 and 55 years. The
majority of the caregivers were female (n = 19). The self-identified race of the caregivers
varied: Black or African American (n = 7), White or Caucasian (n = 5), Alaska Native or
American Indian (n = 2), Asian (n = 1), and ‘Other’ (n = 5). Eleven of the caregivers
attended some college or technical school. Almost half of the caregivers were employed
full-time (n = 9). Nine of the caregivers had a spouse/significant other, the majority of
whom were Black or African American (n = 5), non-Hispanic (n = 7).

53
Slightly more than half of the 9-12 year old target children were female (n = 11). Seven
children were Black or African American, two were White or Caucasian, one was Alaska
Native or American Indian, one was Asian, one was Native Hawaiian or other Pacific
Islander, and eight identified as ‘Other’. Among the 20 households, the number of adults
in the home ranged from 1 to 6 (average of about 2). The number of children in the home
ranged from 1 to 5 (average of about 2).
All caregivers reported eating at least one of the vegetables from one of the six categories
vegetable at least 2 to 3 times a week, with three caregivers reporting eating vegetables
more than twice daily. Among the six categories of vegetables listed (i.e., vegetable
juice, green salad, potatoes, vegetable soup, other vegetables, and legumes), the most
frequently consumed vegetables were from the ‘other vegetables’ category, which
included string beans, peas, corn, broccoli, and any other kind of vegetable not included
in the remaining categories. Also, the majority of caregivers reported eating some type of
potato more than 2 to 3 times per week. Vegetable juices were consumed least often,
with the majority of caregivers reporting that they drink these juices less than once a
week.

54
Table 2.3 Sociodemographic and household characteristics
Individual Characteristics Caregiver n = 20 Spouse/Significant Other n = 9 Target Child n = 20
Age, y (mean [range]) 37.9 (28-55) 10.45 (9-12)
Female, n (%) 19 (95) 11 (55)
Race (n [% of sample])1
Black or African American 7 (35) 5 (62.5) 7 (35)
White or Caucasian 5 (25) 2 (25) 2 (10)
Alaska Native or American Indian 2 (8) 0 (0) 1 (5)
Asian 1 (5) 1 (12.5) 1 (5)
Native Hawaiian or other Pacific Islander 0 (0) 0 (0) 1 (5)
Other2 5 (25) 0 (0) 8 (40)
Hispanic or Latino n (%)3 1 (5) 1 (5) 3 (15)
Education n (%)
Have not completed high school 2 (10)
Received high school diploma or GED 4 (20)
Some college or technical school 11 (55)
4-year college 3 (15)
Employment Status n (%)
Homemaker 2 (10) 2 (22)
Not employed 4 (20) 2 (22)
Employed part time 4 (20) 2 (22)
Employed full time 9 (45) 3 (33)
Retired 1 (5) 0 (0)
Household Characteristics
Total number of adults (mean [range]) 1.7 (1-6)
Total number of children (mean [range]) 2.35 (1-5) 1. One caregiver did not provide race of spouse/significant other. 2. ‘Other’ category also included when more than one race was selected.

55
3. Two caregivers did not provide ethnicity data.

56
Household Food Security
Nine of the caregivers were characterized as having very low food security, six low food
security, and five high or marginal food security (Figure 2.1).
Figure 2.1 Distribution of household food security status among the study
population based on the following scale: 0-1 high or marginal food security, 2-3 low
food security, and 4-5 very low food security.
25% High or marginal food
security
30% Low food security
45% Very low food security

57
Vegetable Liking
The 20 caregivers had tried all of the vegetable types and forms (raw and cooked), with
the exception of raw green beans (n = 18), raw green peas (n = 19), and raw spinach (n =
19).
The majority of caregivers liked (i.e., provided a rating of ≥ 5 on a scale of 1 to 10) all of
the vegetables listed on the Vegetable Liking Survey, with few caregivers rating any
vegetable less than 5 (regardless if it was cooked or raw) (Figure 2.2). Cooked broccoli,
corn, and lettuce were the most liked vegetables, whereas raw Brussels sprouts, raw
cabbage, and black beans were least liked. In general, caregivers rated liking of cooked
vegetables higher than raw vegetables.

58
Figure 2.2 Caregiver vegetable liking ratings based on the transformed rating scale where 0 and 10 corresponded with the
lowest and highest rating of vegetables respectively, and a value of 5 represented neither like nor dislike.
1
2
3
4
5
6
7
8
9
10
Care
biv
er r
ati
ng
(0-l
ow
est
rati
ng t
o 1
0-h
igh
est
rati
ng
)
Vegetable type
Caregiver Vegetable Liking
Cooked Raw

59
All 20 children had tried the following vegetables: cooked broccoli, cooked and raw
carrots, cooked green beans, cooked corn, raw lettuce, and cooked tomatoes (Figure 2.3).
Few children had tried raw green beans (n = 9), cooked Brussels sprouts (n = 7), and raw
Brussels sprouts (n = 5).
Of the 27 vegetable types/forms (i.e., cooked vs. raw), children on average liked 16
vegetables and disliked 11 vegetables (Figure 2.3). Corn and lettuce had the highest
liking scores. The least liked vegetables were raw Brussels sprouts and raw cauliflower.
Few children had tried raw Brussels sprouts (n = 5) and those who did tended to indicate
a low rating for them (mean rating 2.8). Ratings for cooked vegetables ranged from
about 4 to 8.6, whereas ratings for raw vegetables ranged from about 2.8 to 7.7.
Generally, children provided higher likings scores for cooked versus raw vegetables.

60
Figure 2.3 Mean target child vegetable liking ratings where 1 = “hate it”, 5-6 = “it’s okay”, and 10 = “like it a lot.” The
number at the top of each bar in the graph represents the number of children who had tried each of the vegetable types.
1920
20
18
17
20
15 19
17
20
13 15
20
10 7
20 20
9
14
17
18
12 14
11
19
13
5
1
2
3
4
5
6
7
8
9
10
Ch
ild
ra
tin
g
(1 o
r "
Hate
It"
-10 o
r "
Lik
e it
a L
ot"
)
Vegetable type
Child Vegetable Liking
Cooked Raw

61
Behavioral Strategy Questionnaires
The majority of caregivers indicated that they were currently implementing most of the
strategies (Table 2.4). The largest number (n = 18) of caregivers reported doing the
strategy ‘Give your child the usual amount of vegetables, but in a bigger dish than
needed. This will make the amount look smaller’ strategy. Few caregivers reported
implementing the ‘MyPlate’ and ‘Serve vegetables before the rest of the meal’ strategies
(n = 3). In general, caregivers who were not currently implementing a strategy reported
they were “somewhat likely” to try the strategy.

62
Table 2.4 Number of caregivers currently doing the behavioral strategies, and of those who are not doing the strategies, the
mean rating of likelihood to trying the strategy.
Behavioral Strategy No. of Caregivers
Doing Strategy (%)
Mean Rating of Likelihood
of Trying Strategy a
Give your child the usual amount of vegetables, but in a bigger dish than needed. This will make the amount look smaller. 18 (90) 3.6
Plan dinner meals to routinely include a vegetable or salad. 17 (85) 3.6
If your child takes vegetables by herself/himself, increase size of serving spoon. Then your child will take more with each spoonful. 17 (85) 3.2
Pair vegetables with other foods your child likes 17 (85) 2.0
Ban junk food at meals. 16 (80) 2.8
Have a positive attitude when serving vegetables. 14 (70) 3.3
Let your child prepare vegetable dishes, by providing recipes, ingredients, equipment, and/or time. 14 (70) 2.7
Use fun names for vegetables when serving them to your child. 14 (70) 2.6
Make sure your child sees other family members eating a lot of vegetables and enjoying them. 12 (60) 3.7
Serve vegetables in smaller pieces to make them easy to pick up and eat, like cut up, chopped vegetables. 12 (60) 3.6
Hide vegetables in other foods. 10 (50) 3.5
If you put vegetables on your child’s plate, give her/him bigger servings. 8 (40) 3.2
Make vegetables more easily available and visible to your child 6 (30) 3.5
Make vegetables look better with garnishes by adding things like parsley or breadcrumbs. You could also use attractive dishes. 6 (30) 3.2
Serve vegetables before the rest of the meal. 3 (15) 3.6
Use a dinner plate or placemat that shows the right amount of vegetables to eat for a meal. An example is a plate with the MyPlate picture. 3 (15) 3.4 a. Ratings 0 = very unlikely, 1 = somewhat unlikely, 2 = neither unlikely nor likely, 3 = somewhat likely, 4 = very likely.

63
Home Food Inventory
Almost all of the homes had potatoes (n = 18), tomatoes (n = 18), corn (n = 17), onions (n
= 17), and green beans (n = 16) (Figure 2.4). None of the 20 households had Bok Choy,
edamame, jicama, plantains, or squash. On average a household had 7 types of
vegetables available in canned form (range: 2 to 17), 5.5 types of vegetables available in
fresh form (range: 1 to 12), and 2 types of vegetables available in frozen form (range: 0 to
7). Families had, on average, 13 types of vegetables available in the home (range: 7 to
21).

64
Figure 2.4 Number of households where a vegetable type was present.
02468
101214161820
Nu
mb
er o
f h
ou
seh
old
s
Vegetable type
Home Food Inventory
(Vegetable Availability)

65
Observation Checklist
On average, households had at least 4 pieces of kitchen equipment (range: 1 to 7) (Table
2.5). All 20 households had at least one knife, though one family only had a butter knife.
Other less common kitchen equipment found in several homes were a whisk, mandoline
slicer, potato ricer. Several homes had can openers and microwave ovens. Observations
by researchers indicated that some households had a kitchen flow that could easily
accommodate vegetable preparation, whereas others were narrow and had little counter
space. Based on their observations, researchers suggested that most kitchens had
adequate space for the food preparer, but if the child were to assist with the
dinner/vegetable preparation this space would be cramped.
Table 2.5 Kitchen equipment availability
Equipment Availability, n (%)
Knives 20 (100) Peeler 14 (70)
Strainer 17 (85) Vegetable Brush 6 (30)
Blender 14 (70) Food Processor 1 (5) Cutting Board 16 (80)
Steamer 15 (75) Other 12 (60)
Advance menu planning varied greatly, with the most frequently reported response being
3-5 days in advance. Most caregivers reported that children did not have a say in what
was prepared for dinner. Vegetable preparation time varied; with some caregivers
spending minimal time preparing vegetables (e.g., opening a can of mushroom soup and

66
heating in a microwave) and others spending more than an hour on vegetable preparation
(e.g., one caregiver stewed tomatoes for 2 hours). Half of the children assisted with
vegetable preparation. Most of the vegetables were prepared in a child-friendly manner
(e.g., vegetables chopped), paired with other foods the child likes, and several dishes
were served in ways where the child could not avoid the vegetable (e.g., onions in a
sauce). The types of foods prepared during the in-home visits are reported in Table 2.6.
One caregiver did not serve vegetables with the meal. Most caregivers did not serve any
food before dinner. Of the caregivers who served food before the dinner, only 2 served
vegetables before dinner, which included raw red peppers, carrots, and celery.
Table 2.6 Dinner meal description
Main Dinner Entrée Vegetables Prepared
Tacos with ground beef Lettuce, tomato Chicken tinga Tomato, onion, chipotle pepper
Breakfast burrito None Chicken pita Lettuce, onion Hamburger French fries, pickles Spaghetti Tomato sauce
Taco with ground beef Lettuce Pork loin Mashed potatoes
Rice a roni with ground beef Cream of mushroom soup Hamburger French fries, corn
Fried cat fish Mashed potatoes, cauliflower Chicken enchilada Peas, carrots, onions Chicken casserole Green beans
Ethiopian beef stew Onions, tomatoes, cabbage Hamburger French fries, carrots, broccoli
Taco with ground beef Refried beans, lettuce Taco with ground beef Corn
Pho Onion, cabbage Fish sticks Carrots, tater tots Fry bread Refried beans, green beans, corn

67
The serving containers and utensils used with the vegetables varied greatly depending on
the dish prepared. The majority of the meals were pre-plated for the child, with 5 meals
served buffet style and 1 meal served family style.
The majority of the caregivers (n = 15) ate vegetables at the dinner meal. Four caregivers
did not eat dinner at all during the in-home visit (i.e., the child ate alone or with someone
other than the caregiver). All of the children ate vegetables at the dinner meal, with the
exception of two children. One child chose not to put lettuce on a taco and another child
was not offered any vegetables with the dinner meal. Fifteen households experienced
some form of distraction during the mealtime, including 6 families that had the television
on while eating dinner. Other distractions observed were people going in and out of the
house during mealtime and telephones ringing.
Summary of Brief Qualitative Interviews
Findings from the caregiver interviews suggest that time and availability greatly
influenced what was prepared for mealtimes. Many caregivers specifically mentioned
that they attempted to prepare healthy meals, which included vegetables, but sometimes
this was challenging because healthier foods were viewed as more expensive. When
caregivers were asked how they decided what to prepare for the observed dinner meal,
responses varied. Some caregivers reported that they allowed others in the home
(including children) to make a request about what was served, whereas other caregivers
decided on their own because they were too busy to consider the preferences of others
and needed to make dinner quickly. Some caregivers allowed their child(ren) to help
68
with meal preparation and gave examples of how they implemented other strategies listed
in Table 2.1. Most common were discussions about how caregivers hid vegetables and
paired vegetables with condiments. Several caregivers mentioned that they role-modeled
healthy eating for their children. When discussing grocery-shopping practices, caregivers
made decisions based on what was affordable and attempted to purchase healthy foods
(e.g., fruits and vegetables) when they were affordable.
The child interviews indicated that all children liked at least some vegetables, whereas
responses were mixed regarding the preference for raw versus cooked vegetables. Taste,
smell, and appearance were cited as reasons why children did not like some vegetables.
Most children were open to trying new vegetables, but some considered the smell and
appearance of that vegetable before trying it. Sometimes children preferred to eat
vegetables by themselves and others times they liked to pair vegetables with condiments
(e.g., carrots with ranch dressing). The way that vegetables were served varied.
Sometimes children served themselves and other times their caregiver would prepare
their plate. Most children said that their caregivers did not have rules about eating
vegetables specifically, with the exception of not wasting food, which was a rule about
eating in general.
Feasibility of Strategy Findings
Based on the findings from the Strategy Analysis Form (Table 2.7), mean feasibility
scores ranged from 1.8 to 4.6. The strategy with the highest mean feasibility rating score
(4.6) was ‘Pair vegetables with other foods your child likes’. The strategy with the lowest

69
mean feasibility rating score (1.8) was ‘Use fun names for vegetables when serving them
to your child’.
Strategies were generally provided a high feasibility score if the caregivers were observed
implementing the strategy during the in-home dinner observation. For example, ‘Ban
junk food at meals’ was rated the second highest strategy because during the in-home
observations, few caregivers offered junk foods during the dinner meal. Also, ‘Plan
dinner meals to routinely include a vegetable or salad’ was considered feasible because
all households served at least one vegetable during the dinner meal observations, with the
exception of one household.

70
Table 2.7 Strategy feasibility scores and comments
Behavioral Strategy Mean Feasibility
Rating
(1 “not at all” to
5 “very feasible”)
Comments
Pair vegetables with other foods your child likes.
4.6 Sometimes this strategy was interpreted as pair with condiments, such as carrots with ranch dressing, instead of pair with other foods. There were preconceived ideas of what foods went well together, for example, steak and potatoes. According to the caregiver and child interviews, many families were already implementing this strategy. Caregivers reported knowing their child’s food preferences and made efforts to purchase vegetables that their child liked.
Ban junk food at meals. 4.1 During the dinner observations, most families did not offer or prepare junk food.
Plan dinner meals to routinely include a vegetable or salad.
3.9 Most caregivers reported that they were already doing this strategy and only one family did not serve vegetables during the observation period. All households had at least one vegetable available in the home. It was observed that some caregivers only prepared one canned vegetable for dinner, even though they had additional cans of other vegetables in the cupboard.
Let your child prepare vegetable dishes, by providing recipes, ingredients, equipment, and/or time.
3.8 In half of the households (n = 10), the 9-12 year old assisted with vegetable preparation. Girls were more likely to assist than boys, some of whom explicitly said they had no interest in cooking. Some caregivers were fearful that children could hurt themselves while managing sharp kitchen utensils and/or get burnt by the oven/stovetop. Another concern was that it would take longer to prepare dinner if the child was involved in food preparation. Also, concerns about how to find a task for multiple children were expressed. Limited space was also a barrier in several homes that had small/narrow kitchens without adequate counter space.
Make sure your child sees 3.8 All of the caregivers who prepared a vegetable with the dinner meal ate at least

71
other family members eating a lot of vegetables and enjoying them.
some of the vegetables, with the exception of two households where the caregiver did not eat at all during the in-home visit. One home had only one dining room chair so the mother ate in the living room. Most caregivers reported liking at least some vegetables. Most of the caregivers ate dinner with the child.
Have a positive attitude when serving vegetables.
3.8 The subjective appraisal by researchers indicated that most dinner meals were pleasant based on the caregiver’s attitude. Also, when caregivers completed the Behavioral Strategy Questionnaire, they questioned the term ‘positive attitude’. Only a few caregivers fussed at the child during the dinner meal.
Make vegetables more easily available and visible to your child.
3.8 Several households had chopped vegetables ready to eat in the refrigerator. For one family, the children took the vegetable tray out on their own and ate vegetables while the mother prepared dinner. Most caregivers perceived this strategy to only work with fresh vegetables, which was a barrier because most households did not have many fresh vegetables.
Serve vegetables in smaller pieces to make them easy to pick up and eat, like cut up, chopped vegetables.
3.6 Many vegetables served during the dinner meal were canned and thus inherently in small pieces. Many participants interpreted this strategy to mean cut fresh vegetables into smaller pieces, which was a barrier since only a few of the homes served fresh vegetables with the dinner meal. Participants were concerned that it would take a lot of time to cut up vegetables in smaller pieces. Additionally, they felt that it was not necessary to cut up vegetables in smaller pieces in order for their children to eat vegetables. Some caregivers reported that this strategy would work better for younger children.
If you put vegetables on your child’s plate, give her/him bigger servings.
3.3 Participants indicated that they were likely to try this strategy per the Strategy Questionnaire, but concerns about food waste were reported during the adult interviews, which might limit their ability to use this strategy. Some caregivers commented that money was tight and they had to make food stretch. In a few instances, the child did not finish the vegetables that were served, so bigger servings could go to waste.
Serve vegetables before the 3.1 Most caregivers interpreted this strategy as serve raw vegetables as a snack

72
rest of the meal.
before dinner and/or serve a salad first with the meal. Both interpretations required raw vegetables, which was a barrier for most families who did not have many raw vegetables in their home. Children did appear to be hungry before dinner, which was a facilitator for this strategy. Several children ate raw vegetables while dinner was being prepared, but a few children snacked on other foods such as yogurt, a banana, or a cookie. Thinking about ways to implement this strategy with canned and/or frozen vegetables was challenging for families. Another barrier to this strategy was the perceived amount of time it takes to prepare a canned and/or frozen vegetable before the dinner meal. Most caregivers preferred to cook the entire meal at one time.
Make vegetables look better with garnishes by adding things like parsley or breadcrumbs. You could also use attractive dishes.
2.9 Most participants indicated that they were already doing this strategy, though researchers did not observe this during the in-home visits, with the exception of 1 family who used cilantro and two families who used green onion and limes to garnish foods. Perceived lack of time was also a concern as many caregivers indicated that they prepare quick and easy meals for dinner and adding a garnish would take more time.
If your child takes vegetables by herself/himself, increase size of serving spoon.
2.7 Most families indicated that they were already implementing this strategy and if they were not, they reported that they were likely to try it. Some households did not have a variety of spoon sizes.
Give your child the usual amount of vegetables, but in a bigger dish than needed.
2.4 Many families ate dinner on a paper plate. There was a lack of different sized dishware.
Use a dinner plate or placemat that shows the right amount of vegetables to eat for a meal. An example is a plate with the MyPlate picture.
2.4 One family had a MyPlate and/or something that provided a visual image of appropriate vegetable portion sizes. Half of the caregivers said that they were doing this strategy and the other half reported that they were likely to try MyPlate.

73
Hide vegetables in other foods.
2.2 If the child helped with vegetable preparation, the caregiver was not able to hide the vegetable. In the interviews with the caregivers, they gave examples of how they had implemented this strategy, mostly hiding onions in hamburgers and putting cut up vegetables into casseroles.
Use fun names for vegetables when serving them to your child.
1.8 One mother gave a fun name to a vegetable, calling broccoli “trees,” but none of the other caregivers implemented this strategy during the visit.

74
2.4 Discussion
In general, availability of kitchen equipment, vegetable availability, and vegetable liking
were facilitators for all strategies. Because vegetable preparation was necessary for the
implementation of most strategies, one of the most essential kitchen supplies was a knife
to prepare or chop vegetables. All households had at least one knife, however the
Observation Checklist did not capture whether the knife present in the home was sharp
enough to actually chop vegetables (i.e., researchers could have checked the yes box for
the presence of a knife even if it were a butter knife). The Observation Checklist also did
not account for the presence of a can opener in the home, though many researchers
documented whether or not the home had one in the ‘Other’ kitchen supplies category.
Considering that the majority of vegetables available in the home were canned,
documenting whether households had a working can opener is important. Regarding
vegetable availability, households had a minimum of 7 types of vegetables on hand (on
average 13 vegetable types), although researchers did not collect data on actual amounts
(e.g., number of cans of each vegetable). Also, all of the caregivers, with the exception
of one, served a vegetable with the dinner meal, thus providing an opportunity for
researchers to observe how vegetables were prepared and served in the home setting.
Both caregivers and children liked at least some vegetables, with a higher liking for
cooked vegetables than raw vegetables (based on liking scores).
Barriers to implementing the strategies included perceived time constraints, lack of
appropriate vegetable types or utensils/dishware, and concerns about child involvement

75
in food preparation. During the brief qualitative interviews, caregivers talked about time
being a major factor when deciding what to prepare for dinner. Several of the strategies
were perceived as taking more time such as using garnishes to make foods more
attractive or cutting up vegetables into small pieces. According to Alison Swenson
(2015), caregivers spent, on average, 8 minutes to prepare vegetables. Caregivers
reported that they believed the ‘Serve vegetables before the rest of the meal’, ‘Serve
vegetables in smaller pieces to make them easy to pick up and eat, like cut up, chopped
vegetables’, and ‘Make vegetables more easily available and visible to your child’
strategies required raw/fresh vegetables. Households had anywhere between 1 to 12
different types of raw/fresh vegetables, therefore, it is possible that some caregivers did
not believe they had an adequate amount or variety of raw/fresh vegetables available in
the home. Households did not have serving spoons and dishes of various sizes, which
was a barrier for ‘Give your child the usual amount of vegetables, but in a bigger dish
than needed. This will make the amount look smaller’ and ‘If your child takes vegetables
by herself/himself, increase size of serving spoon. Then your child will take more with
each spoonful’ strategies. Barriers for the ‘Let your child prepare vegetable dishes, by
providing recipes, ingredients, equipment, and/or time.’ strategy were concerns about
children being harmed, additional dinner preparation time, finding tasks for multiple
children, and limited kitchen space.
The strengths of this study included collection of multiple forms of data, which were
collected in the home. The ethnographic/observational nature of the current study

76
allowed researchers to better understand facilitators and barriers to improving dietary
quality for this population group. Another strength was use of previously validated
surveys such as the Home Food Inventory (Fulkerson, et al., 2008) and the USDA Food
Security Survey (USDA Economics Research Service, 2012).
One limitation of the study was that in-home visits were conducted only at one time
point. It would have been advantageous to conduct in-home observations on more than
one night in order to draw conclusions about typical dinner preparation and mealtime
routines. Also, vegetable availability was only collected at one time point and may have
been influenced by when the family last went grocery shopping and/or received food
assistance. Due to the lack of information on the quantity of vegetables available in the
home, it is unclear if families had adequate amounts of vegetables to implement the
strategies.
2.5 Selection of Strategies for Phase 2
Researchers decided which of the 16 strategies to include in Phase 2 based on a variety of
issues that could impact the ability of these strategies to become habits for the caregiver
and thus have long-term impacts on child vegetable intake and liking. Seven of the 16
strategies were not selected for further evaluation in Phase 2 for several reasons. The
‘Plan dinner meals to routinely include a vegetable or salad’ strategy was excluded
because all 16 strategies required caregivers to serve a vegetable. Also, researchers were
concerned that ‘Use fun names for vegetables when serving them to your child’ was not

77
age appropriate for 9 to 12 year olds and thus was excluded. The following strategies
were perceived by caregivers to require additional time and thus were excluded from
Phase 2: ‘Serve vegetables in smaller pieces to make them easy to pick up and eat, like
cut up, chopped vegetables’ and ‘Make vegetables look better with garnishes by adding
things like parsley or breadcrumbs. The ‘Use attractive dishes’ strategy was excluded
because households did not have colorful dishware and/or dishware that would be
considered attractive by a child. The ‘Have a positive attitude when serving vegetables’
strategy was not included in Phase 2 because when caregivers were completing the
Behavioral Strategy Form, there appeared to be confusion about what it meant to have a
positive attitude. Researchers were also concerned that it may be challenging for
caregivers to always have a positive attitude if they were dealing with food insecurity and
other sensitive issues. Lastly, researchers were interested in evaluating behavioral
economics strategies. As such, ‘Hide vegetables in other foods’ and ‘Ban junk food at
meals’ were not included in Phase 2. These strategies take away the child’s ability to
choose, a requirement for a strategy to be classified as a behavioral economics strategy
(Thaler & Sunstein, 2008).
Several strategies were revised based on the facilitators and barriers discussed in the
current study. For example, ‘If you put vegetables on your child’s plate, give her/him
bigger servings’ and ‘If your child takes vegetables by herself/himself, increase size of
serving spoon. Then your child will take more with each spoonful’ were merged and
redefined so a larger spoon will be used to serve vegetables regardless if the caregiver

78
serves the child or if the child serves themselves. Researchers felt it was important for
caregivers to have this choice about how to use the larger spoon because it was evident in
some households that caregivers and children had preferences about who served the
vegetable.
After the Phase 1 research was completed, researchers identified an additional strategy to
include in Phase 2. This strategy was based on the idea that contrasting a liked vegetable
option against the competition of a less liked option could result in greater consumption.
The strategy was ‘Offer the child 2 vegetable options for dinner, one liked and one less
liked. Then let the child choose what is served.’

79
2.6 References
Adair, L. S., & Popkin, B. M. (2005). Are child eating patterns being transformed globally?. Obesity Research, 13(7), 1281-1299. Anzman-Frasca, S., Savage, J. S., Marini, M. E., Fisher, J. O., & Birch, L. L. (2012). Repeated exposure and associative conditioning promote preschool children’s liking of vegetables. Appetite, 58(2), 543-553. Berge, J. M., Wall, M., Larson, N., Forsyth, A., Bauer, K. W., & Neumark-Sztainer, D. (2014). Youth dietary intake and weight status: Healthful neighborhood food environments enhance the protective role of supportive family home environments. Health & Place, 26, 69-77. Corsini, N., Slater, A., Harrison, A., Cooke, L., & Cox, D. N. (2013). Rewards can be used effectively with repeated exposure to increase liking of vegetables in 4–6-year-old children. Public Health Nutrition, 16(05), 942-951. Couch, S. C., Glanz, K., Zhou, C., Sallis, J. F., & Saelens, B. E. (2014). Home food environment in relation to children’s diet quality and weight status. Journal of the
Academy of Nutrition and Dietetics, 114(10), 1569-1579. Cutler, G.J., Flood, A., Hannan, P., & Neumark-Sztainer, D. (2011). Multiple sociodemographic and socioenvironmental characteristics are correlated with major patterns of dietary intake in adolescents. Journal of the American Dietetic Association, 111 (2), 230-240. Ding, D., Sallis, J.F., Norman, G.J., Saelens, B.E., Harris, S.K., Kerr, J., Rosenberg, D., Durant, N., Glanz, K. (2012). Community food environment, home food environment, and fruit and vegetable intake of children and adolescents. Journal of Nutrition Education
and Behavior, 44 (6), 634-638. Draxten, M., Fulkerson, J. A., Friend, S., Flattum, C. F., & Schow, R. (2014). Parental role modeling of fruits and vegetables at meals and snacks is associated with children's adequate consumption. Appetite, 78, 1-7. Keita, A.D., Risica, P. M., Drenner, K. L., Adams, I., Gorham, G., & Gans, K. M. (2014). Feasibility and acceptability of an early childhood obesity prevention intervention: results from the Healthy Homes, Healthy Families Pilot Study. Journal of Obesity, 2014. doi: 10.1155/2014/378501. Epub 2014 Oct 27. Fildes, A., van Jaarsveld, C.H., Wardle, J. & Cooke, L. (2014). Parent-administered exposure to increase children’s vegetable acceptance: a randomized controlled trial. Journal of the Academy of Nutrition and Dietetics, 114 (6), 881-888.

80
Fulkerson, J. A., Nelson, M. C., Lytle, L., Moe, S., Heitzler, C., & Pasch, K. E. (2008). The validation of a home food inventory. International Journal of Behavioral Nutrition
and Physical Activity, 5(1), 55.
Golan, M. (2006). Parents as agents of change in childhood obesity‐from research to practice. International Journal of Pediatric Obesity, 1(2), 66-76. Hanks, A. S., Just, D. R., Smith, L. E., & Wansink, B. (2012). Healthy convenience: nudging students toward healthier choices in the lunchroom. Journal of Public Health, 34(3), 370-6.
Hanks, A. S., Just, D. R., & Wansink, B. (2013). Smarter lunchrooms can address new school lunchroom guidelines and childhood obesity. The Journal of Pediatrics, 162(4), 867-869. Holley, C.E., Haycraft, E., & Farrow, C. (2015). ‘Why don’t you try it again?’ a comparison of parent led, home based interventions aimed at increasing children’s consumption of a disliked vegetable. Appetite. 87, 215-222 Lakkakula, A, Geaghan, J, Zanovec, M, Pierce, S., & Tuuri, G. (2010). Repeated taste exposure increase liking for vegetables by low-income elementary school children. Appetite, 55 (2), 226-231. Miller, N., Reicks, M., Redden, J.P., Mann, T., Mykerezi, E., Vickers, Z. (2015). Increasing portion sizes of fruits and vegetables in an elementary school lunch program can increase fruit and vegetable consumption. Appetite. doi:10.1016/j.appet.2015.04.081 National Cancer Institute Fruit/Vegetable Screener evaluated in the Eating at America’s Table Study: Eating at America’s Table Study: Quick Food Scan. 2000. National Cancer Institute website. Retrieved from http://riskfactor.cancer.gov/diet/screeners/fruitveg/allday.pdf. NVivo qualitative data analysis software; QSR International Pty Ltd. Version 10, 2014. Price, J., & Just, D. R. (2015). Lunch, recess and nutrition: Responding to time incentives in the cafeteria. Preventive Medicine, 71, 27-30. Redden JP, Mann T, Vickers Z, Mykerezi E, Reicks M, Elsbernd, S. (2015). Serving first in isolation increases vegetable intake among elementary schoolchildren. PLoS ONE 10(4): e0121283. doi: 10.1371/journal.pone.0121283.

81
Reicks, M. Redden, J. Mann, T, & Vickers, Z. (2012). Pictures in lunch tray compartments and vegetable consumption among children in elementary school cafeterias. Journal of the American Medical Association, 307(8):784-785. Remington, A., An, E., Croker, H., Wardle, J., & Cooke, L. (2012). Increasing food acceptance in the home setting: a randomized controlled trial of parent-administered taste exposure with incentives. The American Journal of Clinical Nutrition, 95(1), 72-77. Schutz, H.G., & Cardello, A.V. (2001). A labeled affective magnitude (LAM) scale for assessing food liking/disliking. Journal of Sensory Studies, 16(2), 117-159. Singh, G.K., Siahpush, M., Kogan, M.D. (2010). Rising social inequalities in US childhood obesity, 2003–2007. Annals of Epidemiology, 20(1), 40-52.
Slining, M. M., Mathias, K. C., & Popkin, B. M. (2013). Trends in Food and Beverage Sources among US Children and Adolescents: 1989-2010. Journal of the Academy of
Nutrition and Dietetics, 113(12), 1683-1694.
Spill, M. K., Birch, L. L., Roe, L. S., & Rolls, B. J. (2011). Hiding vegetables to reduce energy density: an effective strategy to increase children's vegetable intake and reduce energy intake. The American Journal of Clinical Nutrition, 94(3), 735-741.
Swenson, A. An exploration of factors that may affect vegetable intake among children, 9-12 years: availability, preferences, and preparation time. University of Minnesota thesis. April 2015. 177.
Thaler, R. H., & Sunstein, C. R. (2008). Nudge. Yale University Press.
USDA Economics Research Service. (2012). Six-Item Short Form of the Food Security Survey Module. Retrieved from http://www.ers.usda.gov/topics/food-nutrition-assistance/food-security-in-the-us/survey-tools.aspx#six.
U.S. Department of Agriculture and U.S. Department of Health and Human Services. Dietary Guidelines for Americans, 2010. 7th Edition, Washington, DC: U.S. Government Printing Office, December 2010. U.S. Department of Agriculture, Agricultural Research Service. (2014). Food Patterns Equivalents Intakes from Food: Mean Amounts Consumed per Individual, by Gender and Age, What We Eat in America, NHANES 2011-2012. Available at www.ars.usda.gov/ba/bhnrc/fsrg Wang, W. (2013). Parents' Time with Kids More Rewarding Than Paid Work-and More
Exhausting. Pew Research Center. Available at

82
http://www.pewsocialtrends.org/2013/10/08/parents-time-with-kids-more-rewarding-than-paid-work-and-more-exhausting/ Wansink, B., Just, D. R., Payne, C. R., & Klinger, M. Z. (2012). Attractive names sustain increased vegetable intake in schools. Preventive Medicine, 55(4), 330-332. Wansink, B., Just, D. R., Hanks, A. S., & Smith, L. E. (2013). Pre-sliced fruit in school cafeterias: Children's selection and intake. American Journal of Preventive Medicine, 44(5), 477-480.

83
CHAPTER 3: PHASE 2 METHODOLOGY
*Prior to data analyses, Phase 2 methodology was published by the Journal of Nutrition
Education and Behavior in an article entitled, “Testing the effectiveness of in-home
behavioral economics strategies to increase vegetable intake, liking and variety among
children residing in households that receive food assistance.” Authors included: Tashara
M Leak, MS, RD; Alison Swenson, MS; Zata Vickers, PhD; Traci Mann, PhD; Elton
Mykerezi, PhD; Joseph P. Redden, PhD; Aaron Rendahl, PhD; Marla Reicks, PhD, RD.
The current chapter is a revised version of the published article and more accurately
reflects data collection and analyses completed for Phase 2.

84
3.1 Overview of Phase 2 Methodology (Chapter 3)
Objective: To test the effectiveness of behavioral economics strategies for increasing
vegetable intake, variety, and liking among children residing in homes receiving food
assistance.
Design: A randomized controlled trial with data collected at baseline, once weekly for 6
weeks, and at study conclusion.
Setting: Family homes.
Participants: Families with a child (9-12 years) will be recruited through community
organizations and randomly assigned to an intervention (n = 36) or control (n = 10)
group.
Intervention: The intervention group will incorporate a new behavioral economics
strategy during home dinner meal occasions each week for 6 weeks. Strategies are simple
and low-cost.
Main Outcome Measure(s): The primary dependent variable will be child dinner meal
vegetable consumption based on weekly reports by caregivers. Fixed independent
variables will include the strategy and week of strategy implementation. Secondary
dependent variables will include vegetable liking and variety of vegetables consumed
based on data collected at baseline and study conclusion.
Analysis: Mean vegetable intake for each strategy across families will be compared using
a mixed model analysis of variance with a random effect for child. Additionally, overall
mean changes in vegetable consumption, variety, and liking will be compared between
intervention and control groups.

85
3.2 Introduction
Childhood obesity remains a significant public health concern in the United States,
especially among populations with low socioeconomics status.1,2 While the direct
relationship between vegetable intake and weight status among children remains unclear,
replacing high energy-dense foods with vegetables has the potential to lower dietary
energy intake, thereby reducing risk of obesity.3 According to National Health and
Nutrition Examination Survey (NHANES) data (2007-2008), approximately 95% of
children between the ages of 9 and 13 years do not meet the dietary recommendation for
total daily vegetable intake.4 To address this concern, the National School Lunch Program
(NSLP) provides nutritious meals, including vegetable choices, to low-income children at
a free or reduced cost.5 Although programs such as the NSLP address the issue of
availability in schools, additional efforts are necessary to encourage vegetable selection
and consumption among children at home.
The relatively new field of behavioral economics is proposed as a means to improve
dietary behavior based on the effectiveness of small, environmental changes known as
nudges to alter choice behavior.6 Nudges are made by someone with control over the
choice environment, but not in a way that imposes objectionable restrictions. They
“guide” the consumer into making particular choices (e.g., healthier foods), often without
the consumer noticing. Nudges work best when they address behaviors based on quick,
automatic decisions that may represent a departure from a strictly rational model of
beliefs, preferences, and decision-making. Behavioral economics strategies have strong

86
appeal because they are potentially easy to implement, inexpensive, and influence desired
choices. Nudges have been successfully applied to change food choice and intake among
children in school cafeterias, but less often have these strategies been explored in the
home setting.7 Children consume about two-thirds of their daily calories from foods
prepared in the home;8 therefore, using behavioral economics strategies at home has the
potential to affect overall vegetable intake.
The purpose of the current study is to test the effectiveness of 9 behavioral economics
strategies or nudges (Table 3.1) for improving vegetable intake, liking, and variety of
vegetables consumed by children (9-12 years) during dinner. Researchers will use the
socio-ecological model as a framework for addressing eating behavior based on how
individual, social, physical, and macro-level environments influence food choices.20
Caregivers will implement the behavioral strategies or nudges to improve the food choice
set for children by manipulating the home physical and/or social environment (Table 3.1).
The goal of the study is to select 6 of these 9 strategies for incorporation into future
Cooking Matters for Families courses conducted in the Minneapolis/St. Paul area.
Cooking Matters for Families is a program implemented in many states in the U.S. where
parents and children learn to prepare food together.21
There are two primary objectives for this study:
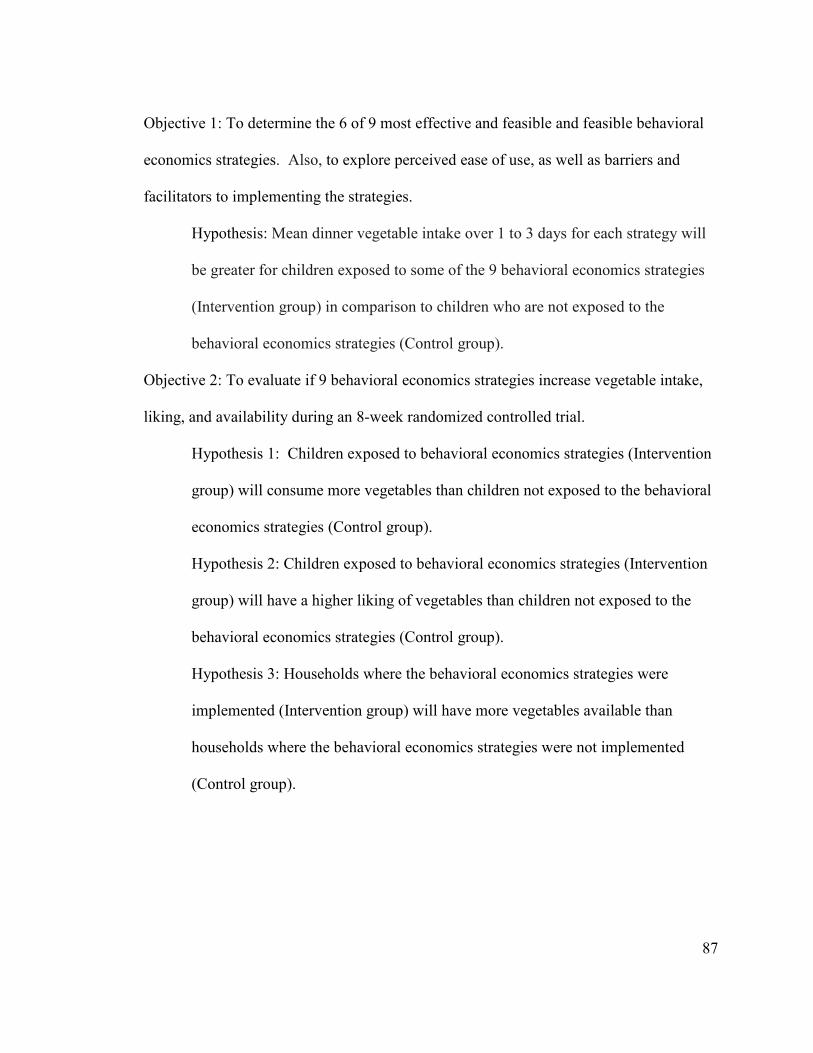
87
Objective 1: To determine the 6 of 9 most effective and feasible and feasible behavioral
economics strategies. Also, to explore perceived ease of use, as well as barriers and
facilitators to implementing the strategies.
Hypothesis: Mean dinner vegetable intake over 1 to 3 days for each strategy will
be greater for children exposed to some of the 9 behavioral economics strategies
(Intervention group) in comparison to children who are not exposed to the
behavioral economics strategies (Control group).
Objective 2: To evaluate if 9 behavioral economics strategies increase vegetable intake,
liking, and availability during an 8-week randomized controlled trial.
Hypothesis 1: Children exposed to behavioral economics strategies (Intervention
group) will consume more vegetables than children not exposed to the behavioral
economics strategies (Control group).
Hypothesis 2: Children exposed to behavioral economics strategies (Intervention
group) will have a higher liking of vegetables than children not exposed to the
behavioral economics strategies (Control group).
Hypothesis 3: Households where the behavioral economics strategies were
implemented (Intervention group) will have more vegetables available than
households where the behavioral economics strategies were not implemented
(Control group).

88
3.3 Methods
Participants
Researchers will recruit caregivers of at least 1 child (9-12 years) and the 9-12 year-old
child through local agencies and organizations, such as community centers, churches, and
afterschool/summer programs. In addition to having a child between the ages of 9 and 12,
inclusion criteria include 1) being the caregiver primarily responsible for food
preparation for the child; 2) preparing dinner at home at least 3 times weekly; and 3)
reporting use of food assistance (e.g., participating in the Supplemental Nutrition
Assistance Program). Caregivers who report not feeling comfortable speaking, reading,
and writing in English will be excluded. Families from diverse backgrounds will be
included to reflect the race/ethnicity distribution of those participating in the Minnesota
Cooking Matters for Families program.
Sample size calculations
Calculations will assume a standard deviation of 0.25 cups, based on findings of
Wengreen et al. (2013),39 who reported mean intake of 0.22 to 0.40 cups and standard
deviations of 0.19 to 0.30 cups. To detect strategies that would increase the response by
0.225 cups (0.9 standard deviations) from the control with 80% power, 33 intervention
families and 15 control families are needed, using a level of significance of 0.05.
Additionally, for the aim of simply detecting the 6 best strategies, if 3 strategies increase
the response by 0.25 cups (1 standard deviation), 3 increase the response by 0.15 cups
(0.6 standard deviations), and 3 have no effect, there will be 80% power to correctly

89
identify the 6 with positive effect. The minimal detectable difference for the 3 paired t-
tests between baseline and study conclusion is .275 cups (1.1 standard deviations), using
a Bonferroni-corrected significance value. To account for a possible 25% drop out rate,
the goal is to enroll 44 families in the intervention group and 20 in the control group. All
computations will be performed in R 40, and simulations will be used for the mixed model
computations.
Compensation and research ethics
To enhance study retention, caregivers will receive a total of $100 ($25 at baseline, $25
at mid-study, and $50 at the final in-home visit) and children will receive a total of $20
($10 at baseline and $10 at the final in-home visit). Researchers will also distribute
newsletters to caregivers and small gifts (e.g., water bottles) to children to enhance
retention. The University of Minnesota Institutional Review Board approved the study.
Selection of Behavioral Economics Strategies
The 9 behavioral economics strategies that will be tested in this study (Table 3.1) were
identified through a literature review/expert panel review process followed by in-home
observation sessions. A multidisciplinary team with expertise in nutrition, food science,
health psychology, marketing, and economics conducted a literature search to identify
previously tested behavioral economics strategies that aimed to improve dietary
behaviors. Based on the reviewed literature and consensus discussions among the team, a
survey was constructed listing 20 commonly reported strategies each with rating scales

90
for feasibility in the home and potential impact on vegetable consumption and liking. The
survey was sent via email to 48 experts who had 1) authored publications in the area of
behavioral economics applied to food choice or factors affecting home vegetable intake
among children; 2) made presentations at conferences regarding behavioral economics
research and food choice; and/or 3) received funding to apply behavioral economics
strategies to child feeding programs. Responses from 24 experts were used to reduce the
list of 20 strategies to 16 considered to be feasible and potentially effective.
Observation sessions with 20 families receiving food assistance were conducted during
dinner meal preparation and consumption to identify barriers and facilitators to
implementation of the 16 strategies in home settings. Observation sessions were
conducted to assess availability of cooking utensils/tools, vegetable availability, cooking
skills, typical menus, and potential family responses. Based on these observations, 9
behavioral economics strategies were selected for further evaluation in the current study.

91
Table 3.1 Behavioral economics strategies tested for effectiveness
Strategy/Example Rationale Pair vegetables with other foods the child already likes. For example, add beans (less liked) to tacos (liked).
Associative conditioning (flavor-flavor learning) has promoted vegetable intake among middle-school children.9
Make vegetables more easily available and visible than other foods at the dinner meal. For example, place the vegetable serving dish on the dinner table and keep other foods in another room and/or out of sight.
Increasing the prominence and convenience of certain foods while decreasing the accessibility and convenience of other foods has resulted in changes in intake of each food.10
Serve vegetables before the rest of the meal. For example, serve vegetables while dinner is being prepared.
Removing competition with other foods or decreasing non-fruit or vegetable options improved fruit intake among preschool children.11
Use a dinner plate that shows the amount of vegetables to eat for a meal. Use paper plates provided for all family members for 3 meals with sections printed according to MyPlate.12 [Caregivers will be provided enough 9” disposable MyPlates for everyone in the household to use on the 3 dinner meals when this strategy is implemented.]
Use of assortment allocation cues (pictures in school lunch tray compartments) has improved selection and consumption of vegetables among school-aged children.13
Offer the child 2 vegetable options for dinner, one liked and one less liked. Then let the child choose what is served.
Contrasting a liked option against the competition of a less liked option (asymmetric dominance) has resulted in changes in consumer decision making.14
If the caregiver puts vegetables on the child’s plate, give more than usual. If children typically serve themselves, put a larger spoon than normally used with the vegetable so they get more than usual. [Caregivers will be provided a serving spoon that holds approximately ½ cup vegetables.]
Using a larger serving spoon makes the default option a larger serving and has increased ice cream intake among nutrition experts.15
Eat dinner together with an adult(s) modeling vegetable consumption.
Decision-making may be influenced by parental social (descriptive) norms representing a departure from the assumption of rationality. Associations have been established between parental normative influence and vegetable intake of children.16
Serve at least two vegetables with dinner meals. Include 2 different vegetables as side
Increasing variety of vegetables offered has increased selection and consumption

92
dishes OR 1 side dish of vegetables plus another food item with vegetables.
among children.17,18
Let the child help prepare vegetable dishes. For example, ask the child to get vegetables out and wash them.
Individuals have liked and preferred products they made themselves over those made by others. The mere act of preparing a certain food enhanced liking and consumption among adults.19
Study Design and Intervention
A randomized, controlled trial will be conducted over 6 weeks with intervention families
implementing 1 new strategy each week during at least 3 dinner meals. Caregivers will be
randomly assigned 6 of the 9 strategies to implement over the 6-week intervention period.
To assess effectiveness of the individual strategies, weekly phone calls will be made by a
research team member to 1) estimate the frequency that the assigned strategy was used;
2) document the manner in which the strategy was implemented during each attempt to
determine if the caregiver implemented the strategy as defined by researchers; 3) identify
barriers and facilitators to use; 4) collect information about the type and amount of
vegetables the child consumed at the dinner meal on the assigned days using a Dinner
Vegetable Record Form completed by the caregiver; and 5) provide detailed instructions
for implementing the next week’s strategy. Instructions will include specific information
about how caregivers should implement the strategy in the home with their child,
including a discussion of overcoming barriers to using the strategy. The fourth weekly
contact will be conducted in person instead of by phone to enhance retention.

93
On the nights when the behavioral economics strategy is implemented, the caregiver will
record child vegetable intake on a Dinner Vegetable Record Form (Appendix 7.13). At
the end of each week, during an audio-recorded telephone call, a researcher will review
the data from the Dinner Vegetable Record Form and ask the following questions: “How
difficult was it to implement the strategy on a scale from 1 to 10 (1 being not difficult and
10 being very difficult)?,” “What were some things that helped you implement the
strategy?,” “What were some things that kept you from implementing the strategy?” The
researcher will record the caregiver’s responses on the Weekly Strategy Record Script
Follow-Up Call Form (Appendix 7.14). At the end of the call, the researcher will assign
the caregiver another behavioral economics strategy and refer them to the Strategy Guide
(Appendix 7.15), which provides several examples of how the caregiver can implement
the strategy. To gauge whether or not the caregiver understands the strategy, the
researcher will ask the caregiver to explain the strategy in his or her own words and to
brainstorm ways in which he or she may implement the strategy in the upcoming week.
Before ending the call, the researcher will ask the caregiver if he or she has any questions
about the strategy and/or can foresee any challenges with implementing the strategy in
the upcoming week.
Caregivers in the control group will not be assigned strategies and will be asked to
prepare dinner as they normally would. They will complete the same Dinner Vegetable
Record Form to report child dinner meal vegetable intake on 3 days each week for a total

94
of 6 weeks. At the end of each week, during an audio-recorded telephone call, a
researcher will review the data from the Dinner Vegetable Record Form.
Data will be collected in three blocks (i.e., block 1, 2, or 3). The blocks represent a time
frame when the families will be part of the study. The proposed 44 families in the
intervention group and 20 families in the control group will be assigned to 1 of the 3
blocks. Families assigned to block 1 will start the study in September and finish by
November. Families in block 2 will begin in January and finish by March. The final set
of families will start in March and finish by May. Researchers will attempt to assign
equal number of families in each block (~21 to 22 families in each block).
Baseline and Final Outcome Measures
Two research team members will meet with each family (both intervention and control
groups) in their home at baseline, at the 4th week, and at the conclusion of the study. At
the baseline home visit, after informed consent/assent is obtained, a research team
member will measure the child’s height and weight according to standard procedures.22,23
The caregiver and child will then be separated while completing several questionnaires.
The only questionnaires/forms from Phase 2 that are provided in the Appendices are
those that were not included in Chapter 2, Phase 1. Thus, many of the
questionnaires/forms from Phase 1, which were used in Phase 2, can be found in the
Phase 1 Appendices. The caregiver will complete demographic (Appendix 7.16),
vegetable liking and variety (Appendix 7.17),24, 25 and household food insecurity

95
questionnaires.26 After caregivers complete their questionnaires, a research team member
will provide instructions to caregivers about how to record child dinner meal vegetable
intake using a Dinner Vegetable Record Form (for 3 dinner meals during the week)
(Appendix 7.13). At this time, the caregiver will practice completing the Dinner
Vegetable Record Form by indicating the type and amount of vegetables the child ate the
night before. Caregivers will be encouraged to use the visual aids provided, such as the
Nutrition Data System for Research (NDSR) food amount booklet and the Center for
Disease Control and Prevention (CDC) “What Counts as a Cup” guide, to improve the
accuracy of amounts reported.27,28
The child will complete vegetable liking (Appendix 7.18) 24 and physical activity
questionnaires29 (Appendix 7.19) with a research team member. To assess dietary intake,
that same team member will also conduct a 24-hour dietary recall with the child
following an amended version of the NHANES Dietary Interviewers Procedures
Manual.30 Caregivers will assist their 9-12 year child with the 24-hour dietary recall,
especially for eating occasions in which the caregiver was present. Two additional 24-
hour recalls will be completed with the child by phone within the next 10 days, similar to
NHANES procedures.30 Recalls will be collected on nonconsecutive days and will also
be used to evaluate child vegetable variety.31 Recall data will be entered into the NDSR
software (University of Minnesota Nutrition Coordinating Center, Minneapolis, MN),
and dietary output data will be analyzed. According to the NDSR Manual, “Vegetable
servings are defined per the 2000 Dietary Guidelines for Americans as 1 cup of raw leafy

96
vegetables or, ½ cup of other cooked or raw vegetables” (University of Minnesota
Nutrition Coordinating Center, Minneapolis, MN). To increase the accuracy of the
recalls, food models in addition to the NDSR food amount booklet will be used at the
first recall collected during the in-home visit. The children will also participate in
measurement exercises where they practice measuring liquids in glasses that they
frequently use. The research team member will take notes of these measurements in case
the child references these glasses during the telephone recalls. Lastly, a research team
member will conduct a home vegetable inventory (Appendix 7.20) and complete an
observation checklist (Appendix 7.21) regarding cooking supplies/equipment and take
notes about the layout of the kitchen/dining area.32-34
At the final home visit, the same procedures and instruments will be used for data
collection, except that demographic, food security, child height/weight, and the child
physical activity data are only collected at baseline. Also, at the final in-home visit,
caregivers will complete an exit questionnaire (Appendix 7.22) to assess reactions to their
experience and whether household composition changes during the study. Data collection
description and schedules are described in Table 3.2.

97
Table 3.2 Description of in-home data collection surveys, questionnaires, and procedures
Data Collection Tool
Schedule Description Analysis
Completed with the caregiver
Demographic questionnaire (Appendix 7.16)
Baseline in-home visit
Age, gender, race/ethnicity, household composition, education, employment, and participation in food assistance programs.
Means and standard deviation (or frequencies) as appropriate.
Exit questionnaire (Appendix 7.22)
Final in-home visit
Intervention families’ perceptions about the effectiveness of the behavioral economics strategies and control families’ perceptions about whether participating in the study impacted child vegetable intake.
Means and standard deviation (or frequencies) as appropriate.
Vegetable liking/variety questionnaire (Appendix 7.17)
Baseline and Final in-home visit
Adapted from an existing validated questionnaire,25 including 36 vegetable items. Caregivers will indicate if they consumed the vegetable in the past 30 days (yes/no) to assess variety. Liking of each vegetable will be assessed using a 10-point hedonic labeled scale.
Mean variety scores will be determined as the sum of the 36 vegetable items where 1 point is assigned for each yes response. Liking of each vegetable will be rated on a 10-point labeled hedonic scale from Hate it (1) to Like it a lot (10) or ‘Never tried’.35
Household food security
Baseline Household food security status will be assessed using an amended version of the 6-item USDA Food Security Survey, where questions AD1 and AD1a are combined.26
Participants who respond with 0 to 1 affirmative responses will be classified as food secure, 2 to 4 affirmative responses low food security, and 5 to 6 affirmative responses very low food security.

98
Completed with the child
Height and weight of child
Baseline Trained researchers will collect data according to standard procedures. Height will be measured twice barefoot using a stadiometer (Seca 202, Hanover, MD) to the nearest 0.1 cm. Weight will be measured twice barefoot and in light clothing on a digital scale to the nearest 0.1 kg (Tanita BWB-800P, Arlington Heights, IL).
Mean height and weight will be calculated from the 2 measurements. BMI z-score and BMI percentile for sex and age will be calculated using CDC growth curves.36
Physical activity (Appendix 7.19)
Baseline Youth Risk Behavior Surveillance System questions with well-established reliability.29
Will assess whether children meet physical activity recommendations (i.e., > 60 minutes of moderate or vigorous intensity aerobic activity).37
24-Hour Dietary Recalls and variety evaluation
Baseline and Final in-home visit
Three non-consecutive 24-hour dietary recalls (the first recall conducted in person followed by 2 via telephone). Changes in dietary intake: vegetable servings, energy, energy density (kcal/g), and foods/nutrients expected to vary with vegetable intake. Vegetable variety for the child will be measured with 3 days 24-hour dietary recalls.
Intake will be analyzed using NDSR software and averaged across the 3 days of intake data. The number of NDSR vegetable groups consumed over 3 days of dietary recall will be used to assess variety of vegetables consumed.31
Completed by researchers
Home vegetable inventory (Appendix 7.20)
Baseline and Final in-home visit
A validated home food inventory form was adapted and will be used to record the availability of vegetables in the home.33 Revisions were made to estimate amount (ounces) of vegetables present.
A count of different types of vegetables will be made based on all forms of the same vegetable (fresh, canned or frozen). One point will be assigned for each vegetable regardless of its form. Mean vegetable counts will be calculated.

99
Observation checklist (Appendix 7.21)
Baseline and Final in-home visit
An observation checklist was developed and includes information on cooking supplies present in the home as well as a description of the home dining environment (e.g., presence of dining room table).
A count of specific equipment for use in vegetable preparation will be made based on its presence in the home (e.g., knives, strainers, peelers).38
Completed by caregiver after baseline visit
Dinner Vegetable Record Form (Appendix 7.13)
Weekly phone calls
This form includes information on the days/dates the intervention was implemented in the home and lists the names and the amounts of vegetables eaten by the child at the dinner meal on that day.
The names of specific vegetables eaten and the quantity eaten (cups)
Weekly strategy record script-follow-up call (Appendix 7.14)
Weekly phone calls
A questionnaire script for interviewing the caregiver regarding the experience of implementing the strategy.
Open-ended questions addressing the manner in which the strategy was implemented, facilitators and barriers.
Vegetable liking questionnaire (Appendix 7.18)
Baseline and Final in-home visit
The same questionnaire that adults complete will be used, except that children will not be asked about vegetables consumed in the last 30 days as a measure of variety.
Liking of each vegetable will be rated on a 10-point labeled hedonic scale from Hate it (1) to Like it a lot (10) or ‘Never tried’.35

100
Pilot testing
Data collection protocols were developed to maintain consistent data collection
procedures throughout the study for all families. Study personnel experienced in
community research methods trained other research team members to improve skills
through repeated demonstration/modeling/critiquing and in-home practice sessions. The
protocols were first pretested with 6 families using 6 strategies to refine data collection
procedures and instructions for study participants. After the pretest, the research team
conducted a pilot test with 16 families (11 in the intervention group and 5 in the control
group) for the entire length of the study (implementation of 6 strategies per family). At
the conclusion of the pilot test, 3 of the 9 strategies were revised to improve consistency
as implementation of these 3 strategies widely varied across families. The instructions for
most of the strategies were also clarified and simplified. To improve the accuracy of
food/vegetable amounts reported, additional resources (e.g., a pre-measured serving
spoon) were provided to families, and the Dinner Vegetable Record Form was simplified.
Data Analysis
To determine if there are differences in sociodemographic characteristics between the
intervention and control group at baseline, t-tests and chi-square tests will be conducted
for continuous and categorical variables, respectively.

101
Data Analyses for Objective 1. Determining the Most Effective Behavioral Economics
Strategies
To determine if each of the 9 behavioral economics strategies increased child dinner
vegetable intake when compared to the control group, mean dinner vegetable intake will
be analyzed from the Dinner Vegetable Record Forms completed by the caregiver. Mean
dinner vegetable intake will be calculated over the 3 days each strategy is implemented in
its assigned week. For the control group, mean dinner vegetable intake will be calculated
over 3 days/week selected by the caregiver. Least square means for dinner vegetable
intake per each of the 9 strategies and 95% confidence intervals will be reported.
Vegetable intakes for the strategies will then be compared using a mixed model analysis
of variance (ANOVA) with a random effect for child. Fixed independent variables will
include strategies, the week of strategy implementation, and the block when the strategy
will be implemented. The week*block interaction will also be included in the model.
The first fixed independent variable will be the strategies, which will consist of 10 levels
(i.e., the 9 behavioral economics strategies and the 1 control group). The second fixed
independent variable will be the week the strategy is implemented (i.e., weeks 1 to 6),
which will be treated as a continuous variable. The last fixed independent variable will
be the block when strategies will be implemented, which will be treated as a categorical
variable.

102
Dunnett’s post hoc test will be applied to the mixed model ANOVA to identify if any of
the behavioral economics strategies improved mean vegetable intake compared to the
control group. In addition to the mixed model ANOVA, multiple pairwise comparisons
of the behavioral economics strategies will be evaluated using Tukey Honestly
Significant Difference (HSD) test. Statistical significance will be set at p-value < 0.05.
Several covariates will be tested to control for possible differences observed between
each strategy. Variables used as covariates will include caregiver’s age, race/ethnicity,
caregiver education and employment status, number of individuals residing in the
household, household food security, household vegetable availability, caregiver vegetable
intake, child BMI, and vegetable liking for both children and caregivers. Due to the
relatively small sample size and large number of covariates (i.e., too many degrees of
freedom), each covariate will be tested separately in the mixed model ANOVA.
Covariates will be tested separately to avoid overfitting in the model where random error
and noise is interpreted as a true effect.
After the weekly telephone call to review the Dinner Vegetable Record Form, a second
researcher will listen to the audio recording and add missing details to the Weekly
Strategy Record Script Follow-Up Call Form. The difficulty rating scores will be
averaged for each strategy, and caregivers’ perceived facilitators and barriers when
implementing the strategies will be summarized. Considerations for determining which 6
strategies will be implemented in the next phase of the project will include the mean

103
increase in vegetable intake for each strategy in the intervention compared to the control
group (according to dinner vegetable record data), ratings of ease of use, and
considerations of perceived facilitators and barriers.
Data Analyses for Objective 2. Vegetable Intake, Liking, Availability-Comparison of
Baseline and Study Conclusion Outcome Measurements
To determine if children in the intervention group experienced a greater increase in
vegetable intake from baseline to study conclusion than children in the control group,
differences in the daily mean amount of vegetables (servings), energy, and nutrients
consumed will be tested for significance using Wilcoxon signed-rank test (based on 3
days of 24-hour dietary recalls collected at baseline and study conclusion). Also, 95%
confidence intervals for mean total vegetable intake will be calculated. Findings will be
reported for average daily intake and average dinner intake.
To determine if children in the intervention group experience a greater increase in the
number of vegetables tried, number of vegetables liked, and vegetable liking across all
vegetables from baseline to study conclusion than children in the control group, t-tests
will be conducted. Also, to determine if children in the intervention group experience an
increase in vegetable liking for each of the 36 different vegetable types from baseline to
study conclusion, t-tests will be conducted. Vegetable liking will be based on a 10-point
labeled hedonic scale from ‘Hate it’ (1) to ‘Like it a lot’ (10). A score of ≥ 5 will be
considered a liked vegetable. If a child indicates that they ‘Never tried’ a vegetable, they

104
will not provide a liking rating. Researchers will inquire about 36 different vegetable
types.
To determine if households in the intervention group experience a greater increase in the
number of vegetables available in the home from baseline to study conclusion than
households in the control group, t-tests will be conducted. The total number of
households with fresh, frozen, and canned types of each of the vegetable types will also
be reported. Pearson’s correlation coefficients will be computed to determine if there is a
relationship between baseline child vegetable liking (rating score of ≥ 5), caregiver
vegetable liking (rating score of ≥ 5), and home vegetable availability separately for each
of 36 different vegetable types. A p-value < 0.05 will be used as the criterion for
statistical significance.
3.4 Discussion
A major strength of the study includes the efforts to recruit and retain participants for the
entire length of the randomized controlled trial. A high dropout rate (~25%) is expected
given that this audience tends to be extremely mobile (i.e., change housing often) and
telephone numbers change frequently. To address this issue, the research team will
oversample to account for dropouts, compensate caregivers and children for their time,
and conduct sessions at times convenient for the family. The research team will also
collect information for an alternate contact person in case they lose contact with the
participant. Reasons for dropouts will be recorded and addressed as much as possible to

105
enhance retention. The contacts at baseline, the fourth week, and at study conclusion will
be conducted in the participants’ homes to allow researchers to build rapport with the
family and enhance retention. Also, a monthly newsletter will be mailed to each family’s
home to enhance retention.
Another strength is that the research team will inquire about facilitators and barriers
caregivers experience, as well as how they actually implement each behavioral
economics strategy during dinner meals. This information will be considered when
selecting the subset of 6 behavioral economics strategies for the next phase of the project
and will help the research team determine how to revise the instructions provided to
caregivers for implementing the strategies.
Strengths and limitations exist with respect to conducting 24-hour dietary recalls with
children and using the Dinner Vegetable Record Forms provided by caregivers as a proxy
for child dinner vegetable intake. Although dietary recalls are criticized because they rely
on memory, especially among children, they are less burdensome and an appropriate
option when researchers are interested primarily in mean intake of vegetables.41
Collection of this information over 3 days (1 day in person) using the NDSR multi-pass
approach with visual portion-size estimation aids will minimize misreporting error. Also,
the use of the food models, NDSR food amount booklets, and measurement exercises
completed during the first recall at the in-home visit should improve the accuracy for the
child 24-hour dietary recalls. Similarly, the practice Dinner Vegetable Record Form

106
completed with the caregiver at the first in-home visit will also help minimize reporting
errors.
Limitations for this study will include the use of a non-representative convenience
sample, with caregivers residing in the Twin Cities or surrounding areas having a similar
sociodemographic background. Furthermore, prior to participating in the study,
caregivers must report preparing dinner meals in the home at least 3 times weekly. Thus,
findings cannot be generalized to a broader group of caregivers and children. Caregivers
may provide socially desirable responses, as those interested in nutrition may be more
likely to volunteer and have higher compliance rates throughout the study. Lastly, this
study will not address the outcome of weight change, only the potential proximal
outcome of dinner meal vegetable intake.

107
3.5 References
1. Singh GK, Siahpush M, Kogan MD. Rising social inequalities in US childhood
obesity, 2003–2007. Ann Epidemiol. 2010;20:40-52.
2. Pan L, May AL, Wethington H, Dalenius K, Grummer-Strawn LM. Incidence of
obesity among young US children living in low-income families, 2008–2011.
Pediatrics. 2013;132:1006-1013.
3. Ledikwe JH, Blanck HM, Khan LK, Serdula MK, Seymour JD, Tohill BC, Rolls
BJ. Dietary energy density is associated with energy intake and weight status in
US adults. Am J Clin Nutr. 2006;83:1362-1368.
4. Krebs-Smith SM, Guenther PM, Subar AF, Kirkpatrick SI, Dodd KW. Americans
do not meet federal dietary recommendations. J Nutr. 2010;140:1832-1838.
5. USDA Economics Research Service. The Food Assistance Landscape: FY 2007
Annual Report. Washington, DC: US Department of Agriculture; 2008.
Economics Information Bulletin No. 6-5.
6. Thaler RH, Sunstein CR. Nudge: Improving Decisions about Health, Wealth, and
Happiness. New Haven, CT: Yale University Press; 2008.
7. Hanks AS, Just DR, Wansink B. Smarter Lunchrooms can address new school
lunchroom guidelines and childhood obesity. J Pediatr. 2013;162:867-869.
8. Poti JM, Popkin BM. Trends in energy intake among US children by eating
location and food source, 1977-2006. J Am Diet Assoc. 2011;111:1156-1164.

108
9. Johnston CA, Palcic JL, Tyler C, Stansberry S, Reeves RS, Foreyt J. Increasing
vegetable intake in Mexican–American youth. A randomized controlled trial. J
Am Diet Assoc. 2011;111:716-720.
10. Wansink B, Painter JE, Lee Y-K. The office candy dish: proximity’s influence on
estimated and actual consumption. Int J Obes. 2006;30:871-875.
11. Harnack LJ, Oakes JM, French SA, Rydell SA, Farah FM, Taylor GL. Results
from an experimental trial at a Head Start center to evaluate two meal service
approaches to increase fruit and vegetable intake of preschool aged children. Int J
Behav Nutr Phys Act. 2012;9:51.
12. MyPlates (MyPlate Paper Portion Plate, Positive Promotions, 15 Gilpin Avenue,
Hauppauge, NY.
13. Reicks M, Redden JP, Mann T, Mykerezi E, Vickers Z. Photographs in lunch tray
compartments and vegetable consumption among children in elementary school
cafeterias. JAMA. 2012;307:784-785.
14. Simonson I, Tversky A. Choice in context: tradeoff contrast and extremeness
aversion. J Marketing Res 1992;29:281-295.
15. Wansink B, van Ittersum K, Painter JE. Ice cream illusions bowls, spoons, and
self served portion sizes. Am J Prev Med. 2006;31:240–243.
16. Pedersen S, Grønhøj A, Thøgersen J. Following family or friends. Social norms in
adolescent healthy eating. Appetite. 2014 Aug 1. [Epub ahead of print].
17. Bucher T, Siegrist M, van der Horst K. Vegetable variety: an effective strategy to
increase vegetable choice in children. Public Health Nutr. 2014;17:1232-1236.

109
18. Just DR, Lund J, Price J. The role of variety in increasing the consumption of
fruits and vegetables among children. Agric Resource Econ Rev. 2012;41:72–81.
19. Dohle S, Rall S, Siegrist M. I cooked it myself: preparing food increases liking
and consumption. Food Quality Preference 2013;33:14-16.
20. Story M, Kaphingst KM, Robinson-O'Brien R, Glanz K. Creating healthy food
and eating environments: policy and environmental approaches. Annu Rev Public
Health. 2008;29:253-272.
21. Cooking Matters (Formerly Operation Frontline), Share Our Strength,
Washington, DC. http://cookingmatters.org. Accessed December 5, 2014.
22. Centers for Disease Control and Prevention. NHANES Anthropometry
Procedures Manual.
http://www.cdc.gov/nchs/data/nhanes/nhanes_03_04/BM.pdf. Accessed
December 5, 2014.
23. Lohman TG, Roche AF, Martorell R. Anthropometric Standardization Reference
Manual. Champaign, IL: Human Kinetics Books; 1988.
24. Chapter 14: Acceptance Testing. In: Lawless HT, Heymann H, eds. Sensory
Evaluation of Food-Principals and Practices. 2nd ed. New York, NY, Springer;
2010: 325-344 .
25. Wolfe WS, Frongillo EA, Cassano PA. Evaluating brief measures of fruit and
vegetable consumption frequency and variety cognition, interpretation, and other
measurement issues. J Am Diet Assoc. 2001;101:311-318.

110
26. USDA Economics Research Service. Six-Item Short Form of the Food Security
Survey Module. http://www.ers.usda.gov/topics/food-nutrition-assistance/food-
security-in-the-us/survey-tools.aspx#six. Accessed December 5, 2014.
27. Nutrition Coordinating Center, University of Minnesota.
http://www.ncc.umn.edu/ndsrsupport/foodamountreportingpostersandbooklets.ht
ml. Accessed December 5, 2014.
28. Division of Nutrition, Physical Activity and Obesity, National Center for Chronic
Disease Prevention and Health Promotion. What Counts as a Cup.
http://www.cdc.gov/nutrition/everyone/fruitsvegetables/cup.html. Accessed
December 5, 2014.
29. Centers for Disease Control and Prevention. Methodology of the youth risk
behavior surveillance system. MMWR Morb Mortal Wkly Rep. 2004;53:1-16.
30. Centers for Disease Control and Prevention (CDC). National Center for Health
Statistics (NCHS). National Health and Nutrition Examination Survey MEC In-
Person Dietary Interviewers Procedures Manual. Hyattsville, Md: US Department
of Health and Human Services, Centers for Disease Control and Prevention, 2009.
31. Nutrition Data Systems for Research (NDSR) User Manual 2013. Version 2013
(1998-2014), page A10.3-A10.5. Nutrition Coordinating Center (NCC),
University of Minnesota, Minneapolis, MN.
http://www.ncc.umn.edu/ndsrsupport/ndsrmanual2013.pdf. Accessed December
5, 2014.

111
32. Broughton MA, Janssen PS, Hertzman C, Innis SM, Frankish CJ. Predictors and
outcomes of household food insecurity among inner city families with preschool
children in Vancouver. Can J Public Health. 2006;97:214-216.
33. Fulkerson JA, Nelson MC, Lytle L, Moe S, Heitzler C, Pasch KE. The validation
of a home food inventory. Int J Behav Nutr Phys Act. 2008;5:55.
34. Lang T, Caraher M, Dixon P, Carr-Hill R. Cooking Skills and Health. London:
Health Education Authority.
http://www.nice.org.uk/nicemedia/documents/cooking_skills_health.pdf. 1999.
Accessed December 5, 2014.
35. Peryam DR, Girardot NF. Advanced taste-test method. Food Engineering.
1952;24:58-61.
36. Centers for Disease Control and Prevention. A SAS Program for the CDC Growth
Charts. http://www.cdc.gov/nccdphp/dnpao/growthcharts/resources/sas.htm.
Accessed December 5, 2014.
37. Physical Activity Guidelines Advisory Committee. Physical Activity Guidelines
Advisory Committee Report, 2008. Washington, DC: US Department of Health
and Human Services, 2008, A1-H14.
38. Landers P, Shults C. Pots, pans, and kitchen equipment: do low-income clients
have adequate tools for cooking? J Extension. 2008;46.
39. Wengreen HJ, Madden GJ, Aguilar SS, Smits RR, Jones BA. Incentivizing
children's fruit and vegetable consumption: results of a United States pilot study
of the Food Dudes Program. J Nutr Educ Behav. 2013;45(1):54-9.

112
40. R Development Core Team. R: A language and environment for statistical
computing. R Foundation for Statistical Computing, Vienna, Austria.
http://www.R-project.org/2008. Accessed December 5, 2014.
41. Thompson FE, Subar AF. Dietary assessment methodology. In: Coulston AM,
Boushey CJ, Ferruzzi M, eds. Nutrition in the Prevention and Treatment of
Disease. 3rd ed. Waltham, MA: Academic Press; 2008:5-46.

113
CHAPTER 4: PHASE 2 FINDINGS
Testing the Effectiveness of In-Home Behavioral Economics Strategies to Increase
Vegetable Intake and Liking Among Children Residing in Households that Receive Food
Assistance
* The introduction and methods for Phase 2 were described in Chapter 3, while Phase 2
results are provided and discussed in the current Chapter 4.

114
4.1 Results
A total of 63 child-caregiver dyads were assigned to either the intervention (n = 47) or
control (n = 16) group. By the conclusion of the study, 14 child-caregiver dyads had
withdrawn from the study (intervention: n = 8, control: n = 6). Thus, data were collected
at baseline and study conclusion in-home visits from 39 child-caregiver dyads in the
intervention group and 10 child-caregiver dyads in the control group. Participant flow
through the study is presented in Figure 4.1.

115
Assessed for eligibility (n = 132)
Randomized (n = 63)
Excluded (n = 69) Did not participate in baseline visit n = 42 Did not meet inclusion criteria n = 10 Declined to participate n = 7
Allocated to control group (n = 16)
Completed mid-study visit (n = 42)
Withdrawn n = 5
Allocated to intervention group
(n = 47)
Completed mid-study visit (n = 11)
Withdrawn n = 5
Completed final study visit (n = 39)
Total withdrawn n = 8
Completed final study visit (n = 10)
Total withdrawn n = 6
Included in data analysis (n = 36) Excluded from analyses (n = 3)
-Incomplete data (n = 3)
Included in data analysis (n = 10) Total withdrawn n = 6
Figure 4.1 Participant flow through a study to determine if behavioral
economics strategies implemented at dinner meals increased child vegetable
consumption.

116
At baseline, no significant differences in sociodemographic characteristics were observed
between the intervention and control group (all p values > 0.13; Table 4.1). The mean
age of children in both groups was 10. Gender was relatively evenly distributed for those
in the intervention group, but in the control group there were eight girls and two boys.
Most of the children (n = 24) in the intervention group were normal weight (BMI 5th
percentile to < 85th percentile), whereas six were overweight (BMI 85th to < 95th), seven
were obese (BMI ≥ 95th percentile), and one was underweight (BMI < 5th percentile). In
the control group, there was a relatively even number of normal, overweight, and obese
children. None of the children in the control group were underweight. The majority of
the children in both the intervention and control group were either non-Hispanic
Black/African American or non-Hispanic White/Caucasian. Several children in the
intervention group (n = 7) classified themselves as mixed race.
Mean age of caregivers in the intervention and control groups was 37 and 38 years,
respectively. All of the caregivers in both the intervention and control group were
female, with the exception of one father in the intervention group. Race/ethnicity of
caregivers was similar to that of the child, though fewer caregivers identified themselves
as mixed race in comparison to children who identified themselves as mixed race. The
majority of caregivers in both the intervention and control group attended at least some
college or technical school. Employment status among the caregivers in the intervention
group was relatively evenly distributed among homemaker, part-time employment, or
full-time employment. Half of the caregivers in the control group were homemakers.

117
Half of the caregivers in the control group were employed full-time. Caregivers in the
intervention and control group reported consuming vegetables on average about one time
per day. They reported consuming on average 1 cup of vegetables on the days they
consumed vegetables.
The largest percentage of households experienced low food security (37% in the
intervention group and 50% in the control group), followed by high or marginal food
security, then very low food security. Lastly, most households had more than one adult
and more than one child residing in the home.

118
Table 4.1 Participant sociodemographic characteristics at baseline.
Intervention (n = 39) Control (n = 10)
Target Child Characteristics
Age, mean (SD)a 10.4 (1.0) 10.4 (1.3)
Male, n (%)b 20 (51.3) 2 (20)
Race, n (%)b
Black or African American 18 (47.4) 3 (30)
White or Caucasian 9 (23.7) 4 (40)
Alaska Native or American Indian 2 (5.3) 0 (0)
Mixed Race 7 (18.4) 2 (20)
Other 2 (5.3) 1 (10)
Hispanic or Latino, n (%)b 3 (7.9) 0 (0)
BMI Status, n (%)b
Underweight 1 (2.6) 0 (0)
Normal weight 24 (63.2) 3 (30)
Overweight 6 (15.8) 4 (40)
Obese 7 (18.4) 3 (30)
Primary Food Preparer Characteristics
Age, mean (SD)ac 37.1 (7.1) 38.1 (5.6)
Male, n (%)bc 1 (2.6) 0 (0)
Race, n (%)bc
Black or African American 18 (47.4) 2 (20)
White or Caucasian 14 (36.8) 7 (70)
Alaska Native or American Indian 2 (5.3) 0
Mixed Race 2 (5.3) 0
Other 2 (5.3) 1 (10)

119
Primary Food Preparer Characteristics Intervention (n = 39) Control (n = 10)
Hispanic or Latino, n (%)bc 3 (7.9) 0
Education, n (%)bc
Have not completed high school 3 (7.9) 1 (10)
Received high school diploma or GED 5 (13.2) 0
Some college or technical school 24 (63.2) 7 (70)
4-year college, university degree or advanced degree 6 (15.8) 2 (20)
Employment Status, n (%)bc
Homemaker 16 (42.1) 5 (50)
Employed part time 11 (28.9) 0
Employed full time 11 (28.9) 5 (50)
During the past 7 days how many times did you eat vegetables other than white potatoes?, mean times per day (SD)ac
1.0 (0.78) 0.9 (0.64)
On the days you eat vegetables, on average how much do you eat?, mean cups/day (SD)ac
1.0 (0.86) 1.0 (1.2)
Household Characteristics
Food Security, n (%)bc
High or marginal 13 (34.2) 4 (40)
Low food security 14 (36.8) 5 (50)
Very low food security 11 (28.9) 1 (10)
Number of Adults in the Home, mean (SD)a 1.6 (0.9) 1.8 (.63)
Number of Children in the Home, mean (SD)a
<9 years 1.2 (.54) 1.4 (.52)
9 to 12 years 1.1 (1.0) 0.9 (.88)
13-18 0.5 (.64) 0.5 (.85) a. T-test used to compare responses between intervention and control groups
b. Χ2 test used to compare proportions between intervention and control groups
c. Missing data for one caregiver in the intervention group

120
Objective 1. Determination of the Most Effective Behavioral Economics Strategies
Mean dinner vegetable intake for children in the control group was 0.82 cups (95% CI
[0.54, 1.09]) and ranged from 0.77 to 1.21 cups/dinner meal for those in the intervention
group (Table 4.2). Mean dinner vegetable intake among children exposed to any of the
behavioral economics strategies was not significantly different from children in the
control group according to Dunnett’s test (Table 4.2).
Children consumed more vegetables with the ‘Serve at least two vegetables with dinner
meals’ strategy than with the ‘Pair vegetables with other foods child likes’ strategy (0.43
more cups; p = 0.01). Also, children consumed more vegetables with the ‘Serve at least
two vegetables with dinner meals’ strategy than with the ‘Eat dinner together with an
adult(s) modeling vegetable consumption’ strategy (0.39 more cups; p = 0.04).

121
Table 4.2 Behavioral economics strategies impact on child mean dinner vegetable intake.
Behavioral Economics Strategies No. of
Households
Where the
Strategy Was
Implementeda
Dinner
Vegetable
Intake, LS
mean (SE)
(cups)b
Dinner
Vegetable
Intake,
95% CI
(cups)
Differences
between
Intervention
and Control
(cups)c,d
Differences
between
Intervention
and Control,
95% CI (cups)
P
valuee,f
Serve at least two vegetables with dinner meals.
27 1.2 (0.11) 1.00-1.42 0.4 -0.05-0.83 0.11
Serve vegetables before the rest of the meal.
21 1.09 (0.12) 0.85-1.32 0.27 -0.19-0.73 0.43
Let child help prepare vegetable dishes.
23 0.99 (0.11) 0.77-1.22 0.17 -0.28-0.63 0.8
Offer child two vegetable options for dinner, one liked and one disliked, let child choose what is served.
21 0.97 (0.12) 0.74-1.19 0.15 -0.31-0.60 0.9
Use a dinner plate that shows the right amount of vegetables to eat for a meal.
25 0.96 (0.11) 0.74-1.17 0.14 -0.31-0.59 0.92
If caregiver puts vegetables on child’s plate, give child more than usual.
27 0.95 (0.11) 0.74-1.16 0.13 -0.31-0.58 0.93
Make vegetables more easily available and visible than other foods at the dinner meal.
23 0.88 (0.12) 0.64-1.12 0.06 -0.41-0.52 1
Eat dinner together with an adult(s) modeling vegetable consumption.
25 0.81 (0.11)g 0.60-1.03 -0.01 -0.45-0.44 1

122
Pair vegetables with other foods child likes.
25 0.77 (0.11)g 0.55-0.99 -0.05 -0.49-0.40 1
a Within a week, a caregiver may have provided Vegetable Dinner Food Record data from 1 to 3 dinners. b Least square means (standard error of the mean), according to the ANOVA model. c Differences = Intervention – Control d Mean vegetable intake for control group was 0.82 cups. e Dunnett’s test, p < 0.05 was considered statistically significant. f Adjusted p values > 1 were truncated to one. g Consumed significantly fewer vegetables than ‘Serve at least two vegetables with dinner meals’, according to Tukey pairwise comparisons (p values for these differences are not provided in Table 4.2, see text).

123
Caregiver Perception of Behavioral Economics Strategies
On average, caregivers rated the difficulty of implementing the strategies as 2.6 (scale of
1 - not difficult to 10 - very difficult), with mean scores for individual strategies ranging
from 2.1 to 2.9 (Table 4.3).
Several strategies shared common facilitators as reported by caregivers (Table 4.3). One
common facilitator was having implemented the behavioral economics strategies prior to
the study. Another frequently reported facilitator was the Strategy Guide provided by the
research team because the guide provided several examples for ways caregivers could
implement the strategy.
There were several common barriers to implementing the strategies. A commonly
reported barrier was that some strategies were out of the norm and felt unnatural for
caregivers. For example, this was an issue for the ‘Make vegetables more easily
available and visible than other foods at the dinner meal’ strategy because caregivers said
it was strange to have foods located in different places during the dinner meal and
because children made negative comments about the food being separated. Caregivers
who implemented the ‘Serve at least two vegetables with dinner meals’ and ‘If caregiver
puts vegetables on child’s plate, give child more than usual’ strategies, were concerned
that implementation of the strategy would result in wasting food.
124
Having enough time to implement the strategies was reported as both a facilitator and
barrier, depending on the strategy. Some caregivers reported that ‘Serve vegetables
before the rest of the meal’ gave them more time to prepare the meal, but a barrier to this
strategy was that it required children to be home prior to dinner. This was an issue when
children had after school activities and/or did not get home until the actual dinner meal
was served. Caregivers reported that other strategies added an extra step to their normal
dinner routine and increased time spent on the dinner meal. For example, caregivers
reported that ‘Let child help prepare vegetable dishes’ increased the food preparation time
because they had to take the time to instruct the child. This was especially a barrier
considering that caregivers reported that dinners needed to be prepared relatively quickly
due to hectic work/school schedules.
Caregivers reported that they had enough vegetables in the home to implement most
strategies, but there were several strategies where caregivers reported that not having
enough vegetables and/or not having a variety of vegetable types was a barrier. Not
having enough vegetables was a commonly reported barrier for the ‘Serve at least two
vegetables with dinner meals’ and ‘If caregiver puts vegetables on child’s plate, give
child more than usual’ strategies. Also, caregivers who implemented ‘Offer child two
vegetable options for dinner, one liked and one disliked, let child choose what is served’
reported that it was helpful when they had vegetables available in the home that the child
liked and disliked. Not having raw vegetables in the home was a commonly reported as a
barrier to ‘Serve vegetables before the rest of the meal’. Caregivers reported that they

125
often did not have raw vegetables available in the home and were unsure about the
feasibility of using canned vegetables to implement the strategy.
Lastly, vegetable liking was a facilitator and vegetable disliking was a barrier, depending
on the strategy. Many caregivers reported that it was helpful that they could choose
vegetables they knew their child liked to implement the strategies. One common barrier
for the ‘Eat dinner together with an adult(s) modeling vegetable consumption’ strategy
was that some caregivers reported that they did not like vegetables in general and/or it
was challenging to find a vegetable to prepare that both they and the child liked.

126
Table 4.3 Caregiver rating of difficulty, and perceived facilitators and barriers to implementing behavioral economics
strategies.
Behavioral Economics
Strategy
Rating of
Difficulty,
Meana
(SD)
Facilitatorsb Barriersb
Serve at least two vegetables with dinner meals.
2.9 (2.3) • Implemented strategy in the past
• Target child liked vegetables
• Vegetable availability
• Planning ahead
• Having help in the kitchen
• Concerned about food waste
• Misinterpretation of the strategy
• Not enough vegetables available in the home
• Money to buy more vegetables
• Extra time required
• Planning ahead
• Children noticed and complained
• Trying to form a new habit
• Multiple preferences in the home
• Finding 2 vegetables that go with the meal.
Use a dinner plate that shows the right amount of vegetables to eat for a meal.
2.8 (2.5) • Implemented strategy in the past
• Images on the MyPlate facilitated conversation about food groups
• Some children reported that they liked the plate
• Guided portions allotted
• Difficult with certain foods (e.g., soup, combination foods)
• Not sure how to explain MyPlate
• Plate was too small
• Not having all the food groups to put on the plate
• Everyone not accepting the plate (i.e., age appropriate)
• Time and forgetting to use the plate
• Plate was not sectioned and children complained about food touching
If caregiver puts 2.7 (2.2) • Served children liked vegetables • Concerned about food waste

127
vegetables on child’s plate, give child more than usual.
• Large spoon researchers provided helped caregivers know that they were serving more than usual
• Child liked vegetables
• Easy strategy to implement
• Having enough vegetables available
• Not enough vegetables available in the home
• Children noticed and complained
• Forgot to use the large spoon provided (i.e., not the norm)
• Vegetables that do not fit in a spoon (e.g., lettuce, mixed dish)
• Using the large spoon was an extra step
• Large spoon was too big (i.e., too many vegetables)
• Shape of the large spoon was awkward
Pair vegetables with other foods child likes.
2.7 (2.5) • Implemented strategy in the past
• Examples in the Strategy Guide
• Not a lot of preparation time needed
• Required less time than other strategies
• Choosing vegetables child liked
• Instructions unclear, some interpreted as hide vegetables
• Not enough vegetables available in the home
• Extra time required
• Planning ahead
• Multiple preferences in the home
• Trying to figure out what to pair
Offer child two vegetable options for dinner, one liked and one disliked, let child choose what is served.
2.7 (2.4) • Have given children choices in the past
• Had vegetables child liked and disliked available in the home
• Easy strategy to implement
• Extra time required
• Not enough vegetables available in the home
• Children did not want to pick
• Normally children do not have choices (i.e., going against the norm)
Serve vegetables before the rest of the meal.
2.6 (2.4) • Implemented strategy in the past
• Examples in the Strategy Guide
• Allowed for more time to cook dinner
• Child was normally in the kitchen anyways while the parent is cooking
• Extra time required
• Not having a variety of fresh vegetables (using canned vegetables was against the norm)
• Planning ahead
• Children not home before dinner
• Disliked separating vegetables (i.e., going against

128
• Having vegetables available the norm)
Let child help prepare vegetable dishes.
2.4 (2.0) • Implemented strategy in the past
• Examples provided in the Strategy Guide
• Caregiver and child enjoyed cooking together
• Caregiver appreciated the help
• Having vegetables that were easy for child to prepare
• Extra time required
• Child not interested in helping
• Child not home to help prepare the meal
• Child’s safety (e.g., using the knife, stove)
• Chaos when multiple children want to help
• Inadequate kitchen supplies (e.g., vegetable peeler)
• Not knowing how to involve child
• Caregiver too busy for help
• Caregiver unsure of their own cooking skills
Make vegetables more easily available and visible than other foods at the dinner meal.
2.4 (2.1) • Easy to implement
• Having vegetables available
• Using vegetables the target child likes
• Not enough serving dishes
• Disliked separating the food (i.e., going against the norm)
Eat dinner together with an adult(s) modeling vegetable consumption.
2.1 (2.2) • Implemented strategy in the past
• Examples provided in the Strategy Guide
• Caregiver enjoyed eating with family
• Caregiver wanted to encourage child vegetable consumption
• Caregiver did not like vegetables
• Not enough vegetables available
• Caregiver does not always eat with family because of busy schedules
• Finding vegetables that the caregiver and target child liked
• Kitchen table too small to seat everyone a. Rating of difficulty was based on a scale of 1 - not difficult to 10 - very difficult. b. When multiple caregivers reported the same facilitator and/or barrier, it was only listed once in Table 4.3.

129
Objective 2. Vegetable Intake, Liking, and Availability-Comparison of Baseline and
Study Conclusion Outcome Measurements
Mean Daily Dietary Intake
Child 24-hour dietary recall data collected at baseline and study conclusion visits showed
no difference when comparing change (pre-post differences) in daily mean total
vegetable intake between the intervention and control group (Table 4.4). At baseline,
children in the intervention group had a mean total daily vegetable intake of 2 servings
(Table 4.4), 95% CI [1.55-2.49]. Children in the control group had a mean total daily
vegetable intake of 1.83 servings (Table 4.4), 95% CI [1.28-2.38]. By the study
conclusion visit, children in the intervention group reported that they had a daily mean
total vegetable intake of 2.5 servings, 95% CI [1.89-3.07], and the control group had a
daily mean total vegetable intake of 1.6 servings, 95% CI [0.91-2.33].
No significant differences between the intervention and control group were observed
when comparing change (pre-post differences) in daily mean intake of dark green
vegetables, deep yellow vegetables, tomatoes, white potatoes, fried potatoes, other
starchy vegetables, legumes, other vegetables, and vegetable based savory snacks (Table
4.4).
The vegetable subgroup with one of the lowest intakes was dark green vegetables. At
baseline, mean daily dark green vegetable intake was 0.13 and 0.04 servings, respectively
for children in the intervention and control groups. By the conclusion of the study, mean

130
daily dark green vegetable intake for children in the intervention group was 0.22 servings
and 0.17 servings for children in the control group.
The change in pre-post daily mean energy intake between the intervention and control
group was not significant, nor were there any significant differences in changes in pre-
post daily mean intake of any macronutrients or micronutrients listed in Table 4.4.

131
Table 4.4 Mean daily vegetable group, energy, and nutrient intakes based on 24-hour dietary recalls.
Dietary componenta
Intervention
baseline
(n = 39)
mean (SD)
Intervention
study
conclusion
(n = 36)
mean (SD)
Pre-post
change
intervention
mean (SD)
Control
baseline
(n = 10)
mean (SD)
Control
study
conclusion
(n = 10)
mean (SD)
Pre-post
change
control
mean (SD)
P value
(difference
in pre-post
change
between
group)b
Vegetable Total (servings) 2.0 (1.5) 2.5 (1.8) 0.5 (1.7) 1.83 (0.8) 1.6 (1.0) -0.23 (0.8) 0.21
Dark Green Vegetables (servings)
0.13 (0.29) 0.22 (0.68) 0.09 (0.60) 0.04 (0.09) 0.17 (0.33) 0.13 (0.25) 0.26
Deep Yellow Vegetables (servings)
0.12 (0.22) 0.14 (0.22) 0.02 (0.34) 0.10 (0.14) 0.08 (0.13) -0.02 (0.10) 0.09
Tomato (servings) 0.36 (0.38) 0.45 (0.52) 0.09 (0.52) 0.32 (0.27) 0.24 (0.33) -0.08 (0.44) 0.40
White Potatoes (servings) 0.18 (0.38) 0.32 (0.67) 0.14 (0.70) 0.37 (0.55) 0.11 (0.26) -0.26 (0.57) 0.06
Fried Potatoes (servings) 0.21 (0.30) 0.37 (0.66) 0.15 (0.62) 0.19 (0.23) 0.14 (0.35) -0.05 (-0.46) 0.17
Other Starchy Vegetables (servings)
0.10 (0.18) 0.28 (0.41) 0.16 (0.43) 0.02 (0.03) 0.15 (0.24) 0.13 (0.24) 0.86
Legumes (servings) 0.25 (0.58) 0.13 (0.50) -0.12 (0.34) 0.09 (0.15) 0.19 (0.44) 0.10 (0.51) 0.89
Other Vegetables (servings)
0.53 (0.50) 0.46 (0.45) -0.07 (0.60) 0.64 (0.43) 0.43 (0.43) -0.21 (0.45) 0.71
Vegetable Based Savory Snack (servings)
0.15 (0.34) 0.09 (0.22) -0.06 (0.31) 0.06 (0.20) 0.11 (0.31) 0.05 (0.40) 0.82
Energy (kcal) 1769 (462) 1891 (693) 129 (707) 1726 (401) 1661 (481) -65 (381) 0.47
Total Fat (g) 69 (22) 75 (36) 7 (37) 62 (18) 62 (22) 0 (25) 0.80
Total Carbohydrate (g) 225 (65) 241 (80) 14 (91) 230 (56) 216 (68) -14 (46) 0.25
Total Protein (g) 67 (21) 70 (27) 4 (24) 66 (14) 65 (21) -1 (20) 0.78

132
Dietary componenta
Intervention
baseline
(n = 39)
mean (SD)
Intervention
study
conclusion
(n = 36)
mean (SD)
Pre-post
change
intervention
mean (SD)
Control
baseline
(n = 10)
mean (SD)
Control
study
conclusion
(n = 10)
mean (SD)
Pre-post
change
control
mean (SD)
P value
(difference
in pre-post
change
between
group)b
Total Dietary Fiber (g) 13.3 (6.2) 15.0 (7.3) 1.6 (6.8) 12.2 (4.2) 13.1 (5.3) 0.9 (5.0) 1
Iron (mg) 13.4 (4.2) 13.7 (5.4) 0.4 (5.7) 13.2 (4.5) 13.5 (5.6) 0.3(4.4) 1
Vitamin D (mcg) 6.5 (3.8) 5.8 (3.3) -0.28 (2.9) 7.0 (4.0) 4.7 (3.3) -2.3 (3.8) 0.19
Calcium (mg) 951 (406) 1004 (473) 59 (453) 1061 (345) 894 (332) -168 (301) 0.13
Sodium (mg) 2999 (815) 3373 (1475) 401 (1521) 2925 (677) 2933 (725) 7.8 (968) 0.55
Potassium (mg) 1937 (727) 2175 (838) 247 (843) 1899 (424) 1767 (620) -131 (463) 0.24 a. 1 serving = 1 cup of raw leafy vegetables or ½ cup of other cooked or raw vegetables.
b. Difference in pre-post change between intervention and control group, Wilcoxon signed rank test, p < 0.05 was considered statistically significant.

133
Mean Dinner Dietary Intake
There were no significant differences when comparing change (pre-post differences) in
dinner mean total vegetable intake between the intervention and control group (Table
4.5). At baseline, children in the intervention group had a mean dinner total vegetable
intake of 1.09 servings (Table 4.5), 95% CI [0.81-1.36]. Children in the control group
had a mean dinner total vegetable intake of 0.84 servings (Table 4.5), 95% CI [0.33-
1.33]. By the study conclusion visit, children in the intervention group had a mean dinner
total vegetable intake of 1.2 servings, 95% CI [0.79-1.67]. Children in the control group
had a mean dinner total vegetable intake of 0.83 servings, 95% CI [0.21-1.45].
No significant differences between the intervention and control group were observed
when comparing change (pre-post differences) in dinner mean intake of dark green
vegetables, deep yellow vegetables, tomatoes, white potatoes, fried potatoes, other
starchy vegetables, legumes, other vegetables, and vegetable based savory snacks.
The vegetable subgroup with one of the lowest intakes during dinner meals was deep
yellow vegetables. According to the mean dinner vegetable group intakes, deep yellow
vegetables were consumed in small amounts (i.e., about 0.06 servings for the intervention
group and less than 0.01 servings for the control group). At baseline, mean dinner deep
yellow vegetable intake for children in the intervention group was 0.05 servings and 0.01
servings for the control group. By the conclusion of the study, mean dinner deep yellow
vegetable intake for children in the intervention group was 0.06 servings and 0.01

134
servings for the control group. Change (pre-post differences) in mean deep yellow
vegetable intake when comparing intervention to the control group was not significantly
different (Table 4.5).
Change in pre-post mean dinner energy intake when comparing intervention to control
group was not significant, nor were there significant differences in changes in pre-post
dinner intake for any macronutrients or micronutrients listed in Table 4.5.

135
Table 4.5 Mean dinner vegetable, energy, and nutrient intakes based on 24-hour recalls.
Dietary componenta
Intervention
baseline
(n = 39)
mean (SD)
Intervention
study
conclusion
(n = 36)
mean (SD)
Pre-post
change
intervention
mean (SD)
Control
baseline
(n = 10)
mean (SD)
Control
study
conclusion
(n = 10)
mean (SD)
Pre-post
change
control
mean (SD)
P value
(differences
in pre-post
change
between
group)b
Vegetable Total (servings) 1.09 (0.85) 1.2 (1.3) 0.11 (1.24) 0.84 (0.69) 0.83 (0.87)
-0.003 (0.81)
1
Dark Green Vegetables (servings)
0.12 (0.26) 0.13 (0.38) -0.01 (0.39) 0.04 (0.12) 0.11 (0.33) 0.12 (0.35) 0.32
Deep Yellow Vegetables (servings)
0.05 (0.14) 0.06 (0.14) 0.03 (0.16) 0.01 (0.03) 0.01 (0.03) 0.01 (0.01) 1
Tomato (servings) 0.22 (0.26) 0.26 (0.49) 0.02 (0.53) 0.14 (0.21) 0.18 (0.30) 0.06 (0.46) 0.66
White Potatoes (servings) 0.16 (0.34) 0.27 (0.69) 0.11 (0.66) 0.19 (0.41) 0.00
-0.22 (0.43)
0.12
Fried Potatoes (servings) 0.08 (0.22) 0.08 (0.27) 0.03 (0.32) 0.16 (0.33) 0.10 (0.22)
-0.06 (0.46)
0.76
Other Starchy Vegetables (servings)
0.07 (0.17) 0.18 (0.31) 0.12 (0.35) 0.00 0.17 (0.50) 0.19 (0.53) 0.81
Legumes (servings) 0.13 (0.38) 0.07 (0.26) -0.08 (0.33) 0.10 (0.22) 0.21 (0.47) 0.20 (0.51) 0.56
Other Vegetables (servings) 0.30 (0.30) 0.32 (0.52) 0.004 (0.50) 0.29 (0.34) 0.14 (0.21)
-0.15 (0.29)
0.32
Vegetable Based Savory Snack (servings)
0.01 (0.05) 0.01 (0.08) 0.01 (0.10) 0.00 0.00 0.00 1
Energy (kcal) 675 (253) 688 (341) 17 (397) 594 (175) 515 (155) -99 (266) 0.34
Total Fat (g) 29 (14) 30 (21) 1.3 (23.3) 23.5 (9.2) 19 (12) -6.6 (17.8) 0.47

136
Dietary componenta
Intervention
baseline
(n = 39)
mean (SD)
Intervention
study
conclusion
(n = 36)
mean (SD)
Pre-post
change
intervention
mean (SD)
Control
baseline
(n = 10)
mean (SD)
Control
study
conclusion
(n = 10)
mean (SD)
Pre-post
change
control
mean (SD)
P value
(differences
in pre-post
change
between
group)b
Total Carbohydrate (g) 71 (33) 74 (32) 2.0 (45) 66 (22) 63 (16) -1.4 (25.8) 0.65
Total Protein (g) 32 (12) 32 (18) -0.36 (18.04) 29 (12) 25 (13) -7.1 (17.5) 0.4
Total Dietary Fiber (g) 5.0 (3.2) 5.2 (3.5) -0.05 (3.67) 4.0 (1.5) 4.8 (3.0) 1.4 (3.1) 0.26
Iron (mg) 4.6 (1.7) 4.5 (2.2) -0.11 (2.57) 4.5 (2.5) 5.0 (2.5) 0.61 (1.89) 0.45
Vitamin D (mcg) 1.9 (2.0) 1.5 (1.8) -0.40 (2.28) 1.6 (1.9) 1.5 (1.6)
-0.17 (1.07)
0.91
Calcium (mg) 313 (202) 315 (299) -7.8 (308.8) 335 (192) 234 (127) -99 (174) 0.34
Sodium (mg) 1293 (511) 1604 (892) 330 (1034) 1159 (583) 1147 (372) 30 (882) 0.52
Potassium (mg) 772 (375) 832 (495) 52 (508) 673 (229) 665 (259) 32 (312) 0.73 a. 1 serving = 1 cup of raw leafy vegetables or ½ cup of other cooked or raw vegetables. b. Difference in pre-post change between intervention and control group, Wilcoxon sign rank test, p < 0.05 was considered statistically significant.

137
Vegetable Liking
On average, caregivers in both the intervention and control group had tried approximately
30 different types of vegetables at baseline (out of a total of 36 vegetable types), with no
change in the number of vegetables tried by the study conclusion. There was no change
(pre-post differences) in the mean number of vegetables tried from baseline to study
conclusion when comparing caregivers in the intervention group compared to the control
group (p = 0.56). On average at baseline, children in the intervention group had tried
approximately 24 vegetable types (23.7) and children in the control group had tried on
average 22 vegetable types (21.8). On average at study conclusion, children in the
intervention group had tried 24 vegetable types and children in the control group had
tried on average approximately 22 vegetable types (22.2). There was no change (pre-post
differences) in the mean number of vegetables tried from baseline to study conclusion
when comparing children in the intervention group compared to the control group (p = 1).
At baseline, caregivers in the intervention group liked (rating ≥ 5 on a 10-point labeled
hedonic scale from ‘Hate it’ (1) to ‘Like it a lot’ (10)) approximately 24 types of
vegetables (23.7) and caregivers in the control group liked approximately 23 different
types of vegetables (23.1). On average at study conclusion, caregivers in the intervention
group liked 24 (23.9) vegetable types and caregivers in the control group liked on
average approximately 23 vegetable types (22.7). There was no change in the mean
number of vegetables liked from baseline to study conclusion for caregivers in the
intervention group compared to the control group (p = 0.61). On average, at baseline

138
children in the intervention group liked approximately 17.3 vegetable types (Figure 4.2)
and children in the control group liked approximately 16.2 vegetable types (Figure 4.3).
At the conclusion of the study, children in the intervention group liked a mean of 17.8
types of vegetables and children in the control group liked a mean of 15.9 types of
vegetables. There was no change (pre-post differences) in the mean number of
vegetables liked from baseline to study conclusion for children in the intervention group
compared to the control group (p = 0.41).
On average at baseline, caregivers in the intervention group provided a mean vegetable
liking of 7.0, and caregivers in the control group provided a mean vegetable liking of 6.9
(on a 10-point labeled hedonic scale from ‘Hate it’ (1) to ‘Like it a lot’ (10)) across all
vegetables (Table 4.6). On average at study conclusion, caregivers in the intervention
group provided a mean vegetable liking of 7.1. Caregivers in the control group provided
a mean vegetable liking of 6.5 across all vegetables. When comparing the intervention
and control group, the change in mean vegetable liking (pre-post differences) across all
vegetables showed that there were no differences for caregivers (p = 0.2). On average at
baseline, children in the intervention group provided a mean vegetable liking of 6.7 and
children in the control group provided a mean vegetable liking of 6.8 across all
vegetables. On average at study conclusion, children in the intervention and control
group provided a mean vegetable liking of 6.8. When comparing the intervention and
control group, the change in mean vegetable liking (pre-post differences) showed that
there were no differences for children (p = 1).

139
Children in the intervention group provided the highest individual vegetable liking
ratings for potatoes, corn, and carrots (Figure 4.2) and children in the control group
provided the highest individual vegetable liking ratings for corn, potatoes, and
beans/legumes other than black beans (Figure 4.2). Children in the intervention group
provided the lowest individual vegetable liking ratings for beets, water chestnuts, and
Brussels sprouts (Figure 4.2) and children in the control group provided the lowest
individual vegetable liking ratings for edamame, eggplant, and beets (Figure 4.3).
Children in the intervention group reported an increase in individual vegetable liking
from baseline to study conclusion for jicama (p = 0.035) and soup (p = 0.03), based on t-
tests.

140
Table 4.6 Mean vegetable liking across all vegetables for caregivers and children in the intervention and control group at
baseline and study conclusion.
Intervention
baseline
(n = 39)
mean (SD)
Intervention study
conclusion
(caregiver n = 36)
child n = 35)
mean (SD)
Pre-post
change
intervention
mean (SD)
Control
baseline
(n=10)
mean (SD)
Control
study
conclusion
(n = 10)
mean (SD)
Pre-post
change
control
mean (SD)
P value
(differences
in pre-post
change
between
group)a
Caregiver 7.0 (1.1) 7.1 (1.4) 0.11 (1.0) 6.9 (1.1) 6.5 (0.9) -0.4 (1.0) 0.2
Child 6.7 (1.1) 6.8 (1.4) 0.07 (1.4) 6.8 (1.5) 6.8 (1.8) 0.06 (1.2) 1 a Pre-post change between intervention and control group, t test, p < 0.05 was considered statistically significant.

141
Figure 4.2 Intervention group child ratings for each of the 36 vegetables they had tried at baseline and study conclusion.
123456789
10
Art
ich
ok
e
Asp
ara
gu
s
Av
oca
do
Gu
aca
mo
le
Ba
mb
oo
Sh
oo
ts
Be
an
Sp
rou
ts
Bla
ck B
ea
ns
Oth
er
Be
an
s
Be
ets
Bro
cco
li
Bru
sse
ls S
pro
uts
Ca
bb
ag
e
Ca
uli
flo
we
r
Ca
rro
ts
Ce
lery
Cu
cum
be
r
Co
rn
Ed
am
am
e
Eg
gp
lan
t
Gre
en
s sp
ina
ch k
ale
bo
k c
ho
y
Gre
en
Be
an
s
Jica
ma
Mix
ed
Ve
ge
tab
les
Ok
ra
On
ion
Pe
as
Pe
pp
er
red
, ora
ng
e, g
ree
n, h
ot
Pla
inta
in
Po
tato
es
Ro
ot
Ve
ge
tab
les,
yu
cca
, ra
dis
h
So
up
ve
ge
tab
le o
r to
ma
to
Sq
ua
sh
Sw
ee
t P
ota
to, Y
am
To
ma
till
o
To
ma
to
Wa
ter
Ch
est
nu
ts
Rati
ng
(1 o
r "
Hate
It"
-10 o
r "
Lik
e it
a L
ot"
)
Vegetable type
Child Vegetable Ratings
(Intervention Baseline and Study Conclusion) Intervention Baseline
Intervention Follow-Up

142
Figure 4.3 Control group child ratings for each of the 36 vegetables they had tried at baseline and study conclusion.
12
3
4
56
7
89
10
Rati
ng
(1 o
r "
Hate
It"
-1
0 o
r "
Lik
e it
a L
ot"
)
Vegetable type
Child Vegetable Ratings
(Control Baseline and Study Conclusion) Control Baseline
Control Follow-Up

143
Home Vegetable Availability
At baseline, families in the intervention group had on average 10 different types of
vegetables present in the home. Families in the control group had on average 11 different
types of vegetables at baseline. At the conclusion of the study, families in both the
intervention and control group had on average 11 different types of vegetables. The
change in the number of vegetable types available in the home from baseline to
conclusion of the study between intervention compared to control group was not
statistically significant (p = 0.42). Households in both the intervention and control group
had more canned vegetables than fresh or frozen vegetables (Table 4.7).
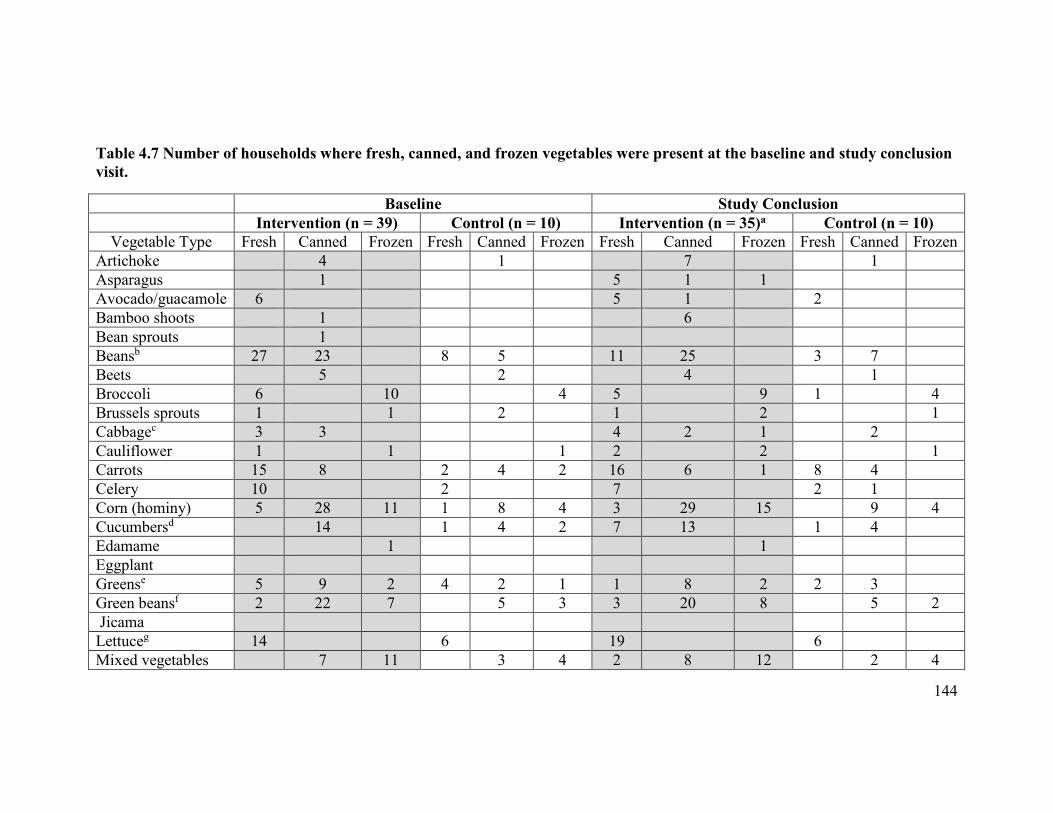
144
Table 4.7 Number of households where fresh, canned, and frozen vegetables were present at the baseline and study conclusion
visit.
Baseline Study Conclusion
Intervention (n = 39) Control (n = 10) Intervention (n = 35)a Control (n = 10)
Vegetable Type Fresh Canned Frozen Fresh Canned Frozen Fresh Canned Frozen Fresh Canned Frozen
Artichoke 4 1 7 1
Asparagus 1 5 1 1
Avocado/guacamole 6 5 1 2
Bamboo shoots 1 6
Bean sprouts 1
Beansb 27 23 8 5 11 25 3 7
Beets 5 2 4 1
Broccoli 6 10 4 5 9 1 4
Brussels sprouts 1 1 2 1 2 1
Cabbagec 3 3 4 2 1 2
Cauliflower 1 1 1 2 2 1
Carrots 15 8 2 4 2 16 6 1 8 4
Celery 10 2 7 2 1
Corn (hominy) 5 28 11 1 8 4 3 29 15 9 4
Cucumbersd 14 1 4 2 7 13 1 4
Edamame 1 1
Eggplant
Greense 5 9 2 4 2 1 1 8 2 2 3
Green beansf 2 22 7 5 3 3 20 8 5 2
Jicama
Lettuceg 14 6 19 6
Mixed vegetables 7 11 3 4 2 8 12 2 4

145
Baseline Study Conclusion
Intervention (n = 39) Control (n = 10) Intervention (n = 35)a Control (n = 10)
Vegetable Type Fresh Canned Frozen Fresh Canned Frozen Fresh Canned Frozen Fresh Canned Frozen
Okra 1 1
Onionsh 20 4 5 1 18 3 5
Peasi 11 9 4 1 3 11 8 1 2 2
Peppersj 11 9 3 3 1 9 8 3 4 4
Plantains
Potatoesk 19 5 9 2 2 3 21 6 10 6 3
Root vegetablesl 3
Soupm 15 4 15 5 1
Squashn 4 1 1 2 4 1 1 1
Sweet Potatoes/Yams
3 8 1 4 2 3 3 1
Tomatillos 1 3
Tomatoeso 14 32 2 10 10 31 2 1 9
Water chestnuts 6 5
Sum: 162 216 73 37 64 26 157 217 82 43 63 23 a Missing a home food inventory for 1 household at follow-up, so reporting on n = 35 families instead of n = 36 b Included black, pinto, kidney, navy, white, refried, baked, lima, soy, black-eyed, garbanzo/chickpea, hummus, lentils, split peas c Included sauerkraut, coleslaw
d Included pickles e Included spinach, collard, mustard, turnip, kale, bok choy
f Included snap, string, wax beans g Included romaine, endive, iceberg h Included white, red, green, leek i Included green, snap peas, snow peas j Included red, green, hot

146
k Included white and russet, fries, box mixes, hashbrowns, potato salad l Included yucca/cassava, yautia, taro, rutabaga, parsnip, turnip, radish (excluded white potatoes)
m Included vegetable, tomato
n Included butternut, acorn, pumpkin, zucchini o Included tomato sauce, canned tomatoes, salsa, spaghetti sauce, pizza sauce, tomato juice, in mixed dishes

147
Comparing Baseline Caregiver and Child Vegetable Liking and Home Vegetable
Availability
The percentage of caregivers who liked various vegetables ranged from 8% (edamame) to
98% (other beans, tomatoes, potatoes) at baseline (Table 4.8). The percentage of children
who liked various vegetables ranged from 4% (okra) to 98% (potatoes) at baseline (Table
4.8). At baseline, black beans, other beans (i.e., beans other than black beans), and
tomatoes were present in 90% of the homes. No household had edamame, jicama, okra,
plantains, or tomatillo at baseline. Pearson correlation analysis showed a strong positive
relationship between baseline caregiver vegetable liking and home vegetable availability
(r = 0.74), and also baseline child vegetable liking and home availability (r = 0.77).
Thus, vegetables were more likely to be available in the home if the caregiver (Figure
4.4) and child (Figure 4.5) liked the vegetable.

148
Table 4.8 Number of caregivers and children in both the intervention and control
group that liked a vegetable (rating of ≥ 5) and the number of homes where the
vegetable was present at baseline (n = 49).
Vegetable
Number of
caregivers that
liked the
vegetable (%)
Number of
children that
the liked
vegetable n (%)
Number of homes
where the
vegetable was
present n (%)
Black Beans 34 (69) 18 (36) 44 (90)
Other Beans 48 (98) 41 (84) 44 (90)
Tomato 48 (98) 37 (76) 44 (90)
Corn 45 (92) 47 (96) 41 (84)
Green Beans 46 (94) 42 (86) 35 (71)
Potatoes 48 (98) 48 (98) 35 (71)
Onion 43 (88) 22 (45) 28 (57)
Carrots 47 (96) 45 (92) 24 (49)
Peas 34 (69) 32 (65) 24 (49)
Peppers 47 (96) 30 (61) 24 (49)
Mixed Vegetables 33 (67) 36 (74) 23 (47)
Lettuce 49 (100) 44 (90) 21 (43)
Greens 44 (90) 33 (67) 20 (41)
Soup 38 (78) 40 (82) 19 (39)
Broccoli 42 (86) 41 (84) 18 (37)
Cucumber 45 (92) 35 (71) 18 (37)
Sweet Potatoes 40 (82) 30 (61) 16 (33)
Celery 41 (84) 37 (76) 12 (25)
Cabbage 43 (88) 30 (61) 8 (16)
Beets 11 (22) 3 (6) 7 (14)
Avocado 34 (69) 18 (37) 6 (12)
Squash 31 (63) 15 (31) 6 (12)
Water Chestnuts 14 (29) 5 (10) 6 (12)
Artichoke 22 (45) 5 (10) 5 (10)
Cauliflower 34 (69) 17 (35) 3 (6)
Brussels Sprouts 19 (39) 9 (18) 2 (4)
Root Vegetables 21 (43) 12 (25) 2 (4)
Asparagus 32 (65) 13 (27) 1 (2)
Bean Sprouts 31 (63) 13 (27) 1 (2)
Bamboo Shoots 16 (33) 6 (12) 1 (2)
Edamame 4 (8) 7 (14) 1 (2)
Eggplant 12 (25) 4 (8) 0

149
Vegetable
Number of
caregivers that
liked the
vegetable (%)
Number of
children that
the liked
vegetable n (%)
Number of homes
where the
vegetable was
present n (%)
Jicama 7 (14) 9 (18) 0
Okra 20 (41) 2 (4) 0
Plantain 16 (33) 4 (8) 0
Tomatillo 18 (37) 7 (14) 0

150
Figure 4.4 A comparison of baseline number of caregivers in both the intervention and control group that liked a vegetable
and the number of households where that vegetable was available.
black beans tomato
other beans
corn
green beans
potatoes
onion
pepperspeascarrots
mixed vegetableslettuce
greenssoup brocolli
cucumberssweet potatoes
celery
cabbagebeets
avocadosquash
water chestnuts artichokes
cauliflowerbrussels sproutsroot vegetables asparagus
bean sproutsbamboo shootsedamame
eggplantjicama okra
plantaintomatillo
0
5
10
15
20
25
30
35
40
45
50
0 5 10 15 20 25 30 35 40 45 50Nu
mb
er o
f h
om
es w
her
e th
e veg
etab
le w
as
pre
sen
t
Number of caregivers that liked vegetable
Baseline Caregiver Vegetable Liking and Home Vegetable Availability Vegetable

151
Figure 4.5 A comparison of baseline number of children in the intervention and control group that liked a vegetable and the
number of households where that vegetable was available.
black beans other beanstomatoes
corn
green beans potatoes
onion
carrotspeas
peppers
mixed vegetableslettuce
greens soupbrocollicucumber
sweet potatoes
celery
cabbagebeets
avocadosquashwater chestnuts
artichokecauliflowerbrussels sproutsroot vegetables
bean sproutsasparagusedamameeggplant
jicamaokra
plantaintomatillo0
5
10
15
20
25
30
35
40
45
50
0 5 10 15 20 25 30 35 40 45 50
Nu
mb
er o
f h
om
es n
her
e th
e veg
etab
le w
as
pre
sen
t
Number of children that liked vegetable
Baseline Child Vegetable Liking and Home Vegetable Availability Vegetable

152
4.2 Discussion
Determination of the Most Effective Behavioral Economics Strategies
Children consumed significantly more vegetables when the ‘Serve at least two vegetables
with dinner meals’ strategy was implemented than when the ‘Pair vegetables with other
foods child likes’ strategy was implemented. Previous research has shown that serving
more than one vegetable significantly increased both the selection (Bucher, Siegrist, &
van der Horst, 2014) and consumption of vegetables (Roe, Meengs, Birch, & Rolls,
2013). Also, consistent with the findings from the current study, Correia and colleagues
(2014) reported that pairing broccoli with pizza (i.e., a liked food) was not an effective
means of increasing child vegetable intake. Children may have consumed more
vegetables when the ‘Serve at least two vegetables with dinner meals’ strategy was
implemented because they were served a larger quantity of vegetables than when the
‘Pair vegetables with other foods child likes’ strategy was implemented. A positive
association has been observed between the amount of vegetables served and the amount
consumed (Rolls, Roe, Meengs, 2010; Mathias et al., 2012). The vegetables served when
the ‘Pair vegetables with other foods the child likes’ strategy was implemented may have
been served in addition to the liked food. They may also have been served in a small
quantity. Caregivers implementing the ‘Serve at least two vegetables with dinner meals’
strategy were asked to serve at least one of the two vegetables as a side dish.
Children exposed to the ‘Serve at least two vegetables with dinner meals’ strategy also
consumed significantly more vegetables than when exposed to the ‘Eat dinner together

153
with an adult(s) modeling vegetable consumption’ strategy. The ‘Eat dinner together with
an adult(s) modeling vegetable consumption’ strategy may have been less effective if
there were influential people at the dinner meal who were not role modeling vegetable
consumption. For instance, research suggests that siblings can influence dietary habits of
other children in the home (Salvy, Vartanian, Coelho, Jarrin, & Pliner, 2008; Hingle et al.
2012). In one study, parents of 3 to 5 year olds reported that one way to encourage child
vegetable consumption was to have older siblings role model healthy eating (Hingle et al.
2012). Thus, it is possible that siblings could choose not to role model healthy eating,
which would serve as a barrier to the implementation of the ‘Eat dinner together with an
adult(s) modeling vegetable consumption’ strategy.
Explanations for why the behavioral economics strategies did not significantly impact
child mean vegetable intake
The ability to detect differences in child vegetable intake between the intervention and
control groups when different behavioral economics strategies were implemented may
depend on how caregivers implemented the strategies. The Strategy Guide instructions
allowed for caregivers to implement the strategies in various ways (Appendix 7.15). This
variability makes it challenging to determine the effectiveness of the strategy. For
example, as part of the ‘Serve More’ strategy, researchers did not specify whether or not
children should serve themselves or be served by their caregivers. Research suggests that
children consume more when they serve themselves in comparison to when food is
served by others (Savage, Haisfield, Fisher, Marini, & Birch, 2012). Thus, the amount of

154
vegetables consumed by the child during the ‘Serve More’ strategy may have varied
depending on who served the vegetables. Also, caregivers were instructed to use a larger
serving spoon for vegetables as part of the ‘Serve More’ strategy. They were given a
serving spoon that held approximately ½ cup of vegetables that they could use if they
chose. If caregivers had been given a larger spoon (e.g., a serving spoon that held 1 cup),
the strategy may have been more effective in increasing child vegetable intake. Wansink
and colleagues (2006) found that when two serving spoons only differed in size by 50%,
no difference was observed in ice cream intake. These authors suggested that there
should be at least a 100% difference between treatments (e.g., spoon size) in order to
observe an effect. Thus, there may not have been a 100% difference in the size of the
serving spoon that families used for the ‘Serve More’ strategy in the intervention group
and the size of the serving spoon that families in the control group used. Another
example is the ‘Make vegetables more easily available and visible than other foods at the
dinner meal’ strategy, which allowed caregivers to decide where vegetables were placed.
When vegetables were placed at the dinner table, children may have consumed varying
amounts of vegetables depending on the proximity of the vegetable serving dish.
Wansink and colleagues (2006) found that adults consumed more candy when the candy
dish was located on their desk versus when the candy was 2 meters away from their desk.
Thus, vegetables may have been consumed in larger quantities if caregivers placed the
vegetable serving dish within arm’s reach.

155
Some of the strategies are common behaviors and thus caregivers in the control group
may have been implementing the strategies as part of their usual routine. According to
Phase 1 findings from the Behavioral Strategy Questionnaire (Chapter 2), many of the
caregivers were already implementing several of the strategies. In previous studies,
mothers of young children indicated that they implemented similar strategies at home to
improve vegetable intake among children (Quan, Salomon, Nitzke, Reicks, 2000; Evans
et al., 2011; Hingle et al., 2012). In a study conducted by Williams and colleagues
(2011), children between the ages of 7 and 12 reported that one way their caregivers
encouraged healthy dietary behaviors was by making healthy food available in the home
environment. This is very similar to the ‘Make vegetables more easily available and
visible than other foods at the dinner meal’ strategy tested in the current study.
Another explanation for why the behavioral economics strategies were not effective is
that the strategies may have been contrary to mealtime cultural norms and traditions, thus
creating a barrier to strategy implementation. One way in which mealtimes are culturally
structured is by how food is displayed and served (Ochs & Shoshet, 2006). Several
caregivers who implemented the ‘Make vegetables more easily available and visible than
other foods at the dinner meal’ strategy reported that others in the home made negative
comments about the vegetables being located apart from the rest of the meal. Also,
several caregivers believed that serving raw/fresh vegetables was the only way to
implement the ‘Serve vegetables first’ strategy. The Strategy Guide provided examples
for how caregivers could use canned vegetables for the ‘Serve vegetables first’ strategy,

156
but caregivers reported that this was ‘odd’ and others people in the family questioned
why cooked vegetables were being served prior to the meal. As reported by Ryden and
Snyder (2011), caregivers find it challenging to make mealtime changes if their family is
not accepting and/or supportive of the changes (Ryden & Snyder, 2011).
Lastly, wide confidence intervals (e.g., 95% CI [0.64-1.12 cups]) may explain why the
differences in intake of vegetables at the dinner meal were not significantly different
between intervention and control group for any of the nine behavioral economics
strategies. This is especially important for two strategies where the differences in intake
were 0.4 and 0.27 cups more in the intervention compared to the control group. One
explanation for the wide confidence intervals is that the variability in mean child dinner
vegetable intake was large. This variability may be due to limitations associated with
caregivers serving as proxies for child dinner vegetable intake. For example, despite
efforts to train caregivers on how to document child dinner vegetable intake,
measurement error is a possibility. Variability may also be due to reporting bias, where
caregivers over reported vegetable intake. Lastly, some of the variability may be due to
using the Dinner Vegetable Record Form (Appendix 7.13), which was not validated.
Another explanation for the wide confidence intervals is the small sample size. The
sample size calculation (Chapter 3) called for 15 children in the control group, yet there
were only 10.

157
Explanations for why changes in vegetable intake, liking, and availability were not
observed from baseline to study conclusion
Vegetable intake
When comparing the change (i.e., baseline to study conclusion) in mean child total
vegetable intake between the intervention and control group, wide confidence intervals
may explain why there were no significant differences (e.g., 95% CI [0.91-2.33servings]).
Large variability in mean child total vegetable intake may be due to issues associated
with children recalling what they had eaten the previous day. In general, one of the
challenges with dietary recalls is that they rely on memory. Studies have shown that
children > 8 years are often able to recall what they ate, but struggle with reporting
accurate portion sizes (Lytle, Murray, Perry, & Eldridge, 1993). Furthermore, it is
possible that it was more difficult for younger children (e.g., 9 year olds) to accurately
recall what they ate and how much than older children in the study. This could result in
outliers that contribute to greater variability in intake. The sample size for the control
group was small (n = 10), also contributing to the wide confidence intervals for the
difference in intake between the intervention and control groups. Comparison of
vegetable intake across groups of children is typically done with larger sample sizes
because of the variability in intake (> 10 children) (Diep, Chen, Davies, Baranowski, &
Baranowski, 2014).

158
Vegetable liking
In the current study, caregivers were allowed to choose which vegetables they served at
the dinner meal, and thus no specific vegetable(s) was targeted for strategy
implementation. If specific vegetables had been targeted, exposure to the vegetable may
have increased, which could have affected liking. Research studies that have improved
vegetable liking have targeted specific vegetables (Lakkakula, Geaghan, Zanovec, Pierce,
& Tuuri, 2010; Lakkakula, Geaghan, Wong, Zanovec, Pierce, & Tuuri, 2011; Noradilah
& Zahara, 2012; Caton et al., 2013). For example, fourth and fifth grade students
attending a low-income elementary school were asked to taste four vegetables (green bell
peppers, carrots, peas, tomatoes) once a week for 10 weeks and rate their liking of each
vegetable (1 = I don’t like this, 2 = I like this, 3 = I like this a lot, 4 = I don’t know what
this is) (Lakkakula et al., 2010). Students who disliked at least one of the vegetables at
baseline reported an increase in liking for carrots, peas, and tomatoes by the 10th
exposure.
Qualitative findings from Phase 2 also suggest that caregivers used vegetables that their
child already liked to implement the behavioral economics strategies. The studies that
have been most successful at improving child vegetable liking have done so with novel
vegetables (Caton et al., 2013) and vegetables that are less liked (Anzman-Frasca,
Savage, Marini, Fisher, Birch, 2012; Corsini, Slater, Harrison, Cooke, & Cox, 2013;
Holley, Haycraft, Farrow, 2015). In the current study, changes in vegetable liking may
not have been observed from baseline to study conclusion because children were served

159
vegetables they already generally liked. Thus, repeated exposure may only be effective
at increasing child vegetable liking when specific vegetables are targeted (Caton et al.,
2013) and those vegetables are not previously liked (Anzman-Frasca, Savage, Marini,
Fisher, Birch, 2012; Corsini, Slater, Harrison, Cooke, & Cox, 2013; Holley, Haycraft,
Farrow, 2015). This would explain why children in the intervention group did not
experience a greater increase in vegetable liking than children in the control group.
Vegetable availability
In the current study, home vegetable availability was highly correlated with both child
and caregiver vegetable liking. According to a review conducted by Jago et al. (2007),
availability may be the mediating variable between liking and consumption patterns
among children. For example in one study, Cullen and colleagues (2003) found a
positive relationship between fourth through sixth graders’ preference and intake of fruit,
fruit juice, and vegetables that was mediated by the availability of those items. This is
similar to findings from the current study that suggests that child and caregiver vegetable
liking, and home vegetable availability are highly correlated.
Comparing the results of the current study regarding the number of vegetable types
available in the home with other studies is challenging because of differences in
methodology and populations studied (Nackers & Appelhans, 2013; (Fulkerson et al.,
2010). For instance, Nackers and Appelhans (2013) measured the presence of 20
different vegetable types and found that households had on average 10.8 different types

160
of vegetables. The current study inquired about 36 different vegetable types. The
participants in the Nackers and Appelhans (2013) study may have had additional
vegetable types available in the home that were not included in the assessment. Also, in a
home-based randomized controlled trial, Fulkerson et al. (2010) found that at baseline,
households in the control group had on average 23.7 different fruit and vegetable types
and the intervention group had on average 21.7. The proportion of vegetables is
unknown because researchers did not report on fruits and vegetables separately. Neither
study (Nackers & Appelhans, 2013; Fulkerson et al., 2010) was conducted with a low-
income population. Therefore, because household vegetable availability may vary by
socioeconomic status, the results may not be applicable to those of the current study.
Strengths & Limitation
Strengths and limitations of the Phase 2 study were described in detail in Chapter 3 prior
to the completion of data collection and analysis. The Strategy Guide was commonly
cited as a facilitator for implementing the strategies. Caregivers commented on how the
examples provided in the Strategy Guide were helpful and made it easier to implement
the strategies. This appeared to be especially true for the ‘Let child help prepare
vegetable dishes’, because many caregivers expressed feeling nervous about having their
child in the kitchen. Many were also unsure about which tasks were age appropriate.
Thus, without the suggestions provided in the Strategy Guide, caregivers may have
struggled to identify ways to implement the strategy. While the Strategy Guide provided

161
caregivers flexibility in strategy implementation, this likely resulted in non-standardized
implementation, which needs to be considered when interpreting findings from this study.
Conclusion
The ‘Serve at least two vegetables with dinner meals’ strategy produced a significantly
larger increase on mean child dinner vegetable intake than the ‘Pair vegetables with other
foods child likes’ and ‘Eat dinner together with an adult(s) modeling vegetable
consumption’ strategies. When compared to the control group, none of the individual 9
behavioral economics strategies increased mean child dinner vegetable intake.
Children in the intervention group, in comparison to the control group, did not experience
a greater increase in vegetable intake or liking from baseline to study conclusion. Also,
households in the intervention group, in comparison to the control group, did not
experience an increase in vegetable availability from baseline to study conclusion.
Household vegetable availability was highly correlated with child and caregiver
vegetable liking at baseline.

162
4.3 References
Anzman-Frasca, S., Savage, J. S., Marini, M. E., Fisher, J. O., & Birch, L. L. (2012). Repeated exposure and associative conditioning promote preschool children’s liking of vegetables. Appetite, 58(2), 543-553. Bucher, T., Siegrist, M., van der Horst, K. (2014). Vegetable variety: an effective strategy to increase vegetable choice in children. Public Health Nutrition, 17, 1232-1236. Cason-Wilkerson, R., Goldberg, S., Albright, K., Allison, M., & Haemer, M. (2015). Factors influencing healthy lifestyle changes: a qualitative look at low-income families engaged in treatment for overweight children. Childhood Obesity, 11(2), 170-176. Caton, S. J., Ahern, S. M., Remy, E., Nicklaus, S., Blundell, P., & Hetherington, M. M. (2013). Repetition counts: repeated exposure increases intake of a novel vegetable in UK pre-school children compared to flavour–flavour and flavour–nutrient learning. British
Journal of Nutrition, 109(11), 2089-2097. Corsini, N., Slater, A., Harrison, A., Cooke, L., & Cox, D. N. (2013). Rewards can be used effectively with repeated exposure to increase liking of vegetables in 4–6-year-old children. Public Health Nutrition, 16(05), 942-951. Cullen, K. W., Baranowski, T., Owens, E., Marsh, T., Rittenberry, L., & de Moor, C. (2003). Availability, accessibility, and preferences for fruit, 100% fruit juice, and vegetables influence children's dietary behavior. Health Education & Behavior, 30(5), 615-626. Diep, C.S., Chen, T.A., Davies, V.F., Baranowski, J.C., & Baranowski, T. (2014). Influence of behavioral theory on fruit and vegetable intervention effectiveness among children: a meta-analysis. Journal of nutrition education and behavior, 46 (6), 506-546. Ding D, Sallis JF, Norman GJ, et al. (2012). Community food environment, home food environment, and fruit and vegetable intake of children and adolescents. Journal of
Nutrition Education and Behavior. 44(6): 634-638. Fulkerson, J. A., Nelson, M. C., Lytle, L., Moe, S., Heitzler, C., & Pasch, K. E. (2008). The validation of a home food inventory. International Journal of Behavioral Nutrition
and Physical Activity, 5(1), 55. Fulkerson, J.A., Rydell, S., Kubik, M.Y., Lytle, L. (2010). Healthy home offerings via the mealtime environment (HOME): feasibility, acceptability, and outcomes of a pilot study. Obesity, 18 (S1), S69-S74.

163
Hingle, M., Beltran, A., O’Connor, T., Thompson, D., Baranowski, J., & Baranowski, T. (2012). A model of goal directed vegetable parenting practices. Appetite, 58(2), 444-449. Holley, C.E., Haycraft, E., & Farrow, C. (2015). ‘Why don’t you try it again?’ a comparison of parent led, home based interventions aimed at increasing children’s consumption of a disliked vegetable. Appetite, 87, 215-222. Jago, R., Baranowski, T., & Baranowski, J. C. (2007). Fruit and vegetable availability: a micro environmental mediating variable?. Public Health Nutrition, 10(07), 681-689. Kirkpatrick, S. I., Dodd, K. W., Reedy, J., & Krebs-Smith, S. M. (2012). Income and race/ethnicity are associated with adherence to food-based dietary guidance among US adults and children. Journal of the Academy of Nutrition and Dietetics, 112(5), 624-635. Lakkakula, A., Geaghan, J. P., Wong, W. P., Zanovec, M., Pierce, S. H., & Tuuri, G. (2011). A cafeteria-based tasting program increased liking of fruits and vegetables by lower, middle and upper elementary school-age children. Appetite, 57(1), 299-302. Lakkakula, A., Geaghan, J., Zanovec, M., Pierce, S., & Tuuri, G. (2010). Repeated taste exposure increases liking for vegetables by low-income elementary school children. Appetite, 55(2), 226-231. Lytle, L.A., Murray, D.M., Perry, C.L., & Eldridge, A.L. (1998). Validating fourth-grade students’ self-report of dietary intake: results from the 5 A Day Power Plus program. Journal of the American Dietetic Association, 98 (5), 570-572. Mathias, K.C., Rolls, B.J., Birch, L.L, Kral, T.V. Hanna, E.L., Davey, A., & Fisher, J.O. (2012). Serving larger portions of fruits and vegetables together at dinner promotes intake of both foods among young children. Journal of the Academy of Nutrition and Dietetics,
112(2), 266-270. Noradilah, M., & Zahara, A. (2012). Acceptance of a test vegetable after repeated exposures among preschoolers. Malaysian Journal of Nutrition, 18(1), 67-75. Ochs, E., & Shohet, M. (2006). The cultural structuring of mealtime socialization. New
Directions for Child and Adolescent Development, 111, 35-49. Roe, L.S., Meengs, J.S., Birch, L.L., & Rolls, B.J. (2013). Serving a variety of vegetables and fruit as a snack increased intake in preschool children. The American Journal of
Clinical Nutrition, 98 (3), 693-699.

164
Rolls, B.J., Roe, L.S., & Meengs, J.S. (2010). Portion size can be used strategically to increase vegetable consumption among adults. The American Journal of Clinical
Nutrition, 91 (4), 913-922. Rydén, P. J., & Sydner, Y. M. (2011). Implementing and sustaining dietary change in the context of social relationships. Scandinavian Journal of Caring Sciences, 25(3), 583-590. Salvy, S. J., Vartanian, L. R., Coelho, J. S., Jarrin, D., & Pliner, P. P. (2008). The role of familiarity on modeling of eating and food consumption in children. Appetite, 50(2), 514-518. Savage, J. S., Haisfield, L., Fisher, J. O., Marini, M., & Birch, L. L. (2012). Do children eat less at meals when allowed to serve themselves?. The American Journal of Clinical
Nutrition, 96(1), 36-43. U.S. Department of Agriculture, Agricultural Research Service. (2014). Food Patterns Equivalents Intakes from Food: Mean Amounts Consumed per Individual, by Gender and Age, What We Eat in America, NHANES 2011-2012. Available at www.ars.usda.gov/ba/bhnrc/fsrg. Wansink B, Painter JE, Lee Y-K. (2006). The office candy dish: proximity’s influence on estimated and actual consumption. International Journal of Obesity, 30, 871-875. Wansink, B., Van Ittersum, K., & Painter, J. E. (2006). Ice cream illusions: bowls, spoons, and self-served portion sizes. American Journal of Preventive Medicine, 31(3), 240-243. Williams, L. K., Veitch, J., & Ball, K. (2011). What helps children eat well? A qualitative exploration of resilience among disadvantaged families. Health Education Research, 26(2), 296-307.

165
CHAPTER 5: ADOLESCENT INVOLVEMENT IN FOOD PREPARATION

166
5.1 Introduction
A growing body of literature suggests that the frequency in which children and
adolescents are involved in food preparation is positively associated with improved
dietary behaviors (Larson, Story, Eisenberg, & Neumark-Sztainer, 2006; Woodruff &
Kirby, 2013; Chu, Storey, & Veugelers, 2014; de Jong, Visscher, HiraSing, Seidell, &
Renders, 2014; Leech, et al., 2014). For example, in a cross-sectional analysis of data
collected from the Project EAT adolescent cohort (11 to 18 years), Larson and colleagues
(2006) found that frequency of helping with dinner preparation was positively associated
with fruit and vegetable intake among girls and fruit consumption among boys. Another
study found that children (4 to 13 years) residing in low socioeconomic status households
were less likely to consume vegetables daily (i.e. 7 days/week) if they assisted with food
preparation less than 5 days a week, in comparison to 5 to 7 days/week (de Jong,
Visscher, HiraSing, Seidell, & Renders, 2015).
Several studies have also explored whether helping with specific tasks during food
preparation is associated with healthful dietary behaviors (Woodruff & Kirby, 2013; van
der Horst, et al. 2014). An intervention study conducted with parent-child dyads found
that 6 to 10 year old children who helped select ingredients, wash, and chop vegetables
for a salad, ate more salad than children who were not involved in meal preparation (van
der Horst, et al. 2014).

167
In addition to improving dietary behaviors (e.g., consuming vegetables), there are other
ways in which assisting with food preparation is beneficial for children. Several studies
have shown that children view cooking with family members as enjoyable (Telzer &
Fuligni, 2009; Lukas & Cunningham-Soba, 2011; Van der Horst, et al., 2014). Telzer
and Fuligni (2009) found that middle adolescents (14 and 15 year olds) who perceived
themselves as fulfilling a household role (including cooking) reported increased feelings
of happiness and decreased feelings of stress. Involvement in home food preparation
may also improve child and adolescent cooking self-efficacy (Woodruff & Kirby, 2013).
When children and adolescents have adult roles and responsibilities, the phenomenon is
often referred to as child adultification. Burton (2007) describes this phenomenon as the
“contextual, social, and developmental processes in which youth are prematurely, and
often inappropriately, exposed to adult knowledge and assume extensive adult roles and
responsibilities within their family networks”. One form of adultification is
parentification, which occurs when certain children behave more as a parental figure to
siblings and often become caretakers (Jurkovic, 2014). Low-income children are at risk
for taking on adultified roles and responsibilities, including cooking, because of family
need (e.g., parents away at work for long periods of time) and as such, may be involved
in food preparation to a greater extent than merely providing assistance (Burton, 2007).
Certain children in lower socioeconomics homes are more likely to experience
adultification because of their gender, birth order (i.e., oldest child), and/or cultural
beliefs (Burton, 2007). While adultified children often demonstrate self-confidence and

168
responsible behaviors, they may also experience stress and a decline in school
performance (Burton, 2007).
Considering the potential positive and negative consequences of adultification from the
perspective of responsibility for food preparation, a deeper understanding of adolescent
involvement in household food preparation is necessary. The current study aimed to
better understand how low-income adolescents residing in food assistance households (a
proxy for income status) perceived their involvement in household food preparation.
5.2 Materials and Methods
Study Design and Participants
Semi-structured interviews were conducted with 19 adolescents, a purposive sample
drawn from a randomized-controlled study that explored the use of behavioral economics
strategies in the home environment to improve dinner vegetable consumption (Leak et al.,
2015, Chapter 3). In the randomized-controlled study, caregivers were eligible to
participate if they were the primary food preparer, had at least one child between the ages
of 9 and 12, prepared dinner at least three times weekly, received food assistance (e.g.,
Supplemental Nutrition Assistance Program), and resided in the Twin Cities metropolitan
area. If caregivers also reported having an adolescent between the ages of 13 and 18, the
adolescent was invited to participate in a semi-structured interview at the conclusion of
the randomized-controlled study. The University of Minnesota Institutional Review
Board approved this study. Informed consent/assent was collected at the beginning of the

169
randomized-controlled trial. Adolescents were compensated with $40 for their
participation.
Sixty-three families participated in the original study with 24 of these families having an
adolescent in the household. Five of the 24 families dropped out of the study and thus 19
adolescents were invited and participated in the interview. Caregivers provided
demographic information at the beginning of the randomized controlled trial.
Adolescents were on average 14 years old, mostly female (n = 12), and racially diverse
(42% African American, 32% White, 26% Other). Caregivers were on average 44 years
old, mostly female (n = 18), and also racially diverse (47% African American, 42%
White, 11% Other). Caregiver employment status varied (26% full time, 26% part time,
47% not employed or homemakers). Households consisted of 2 adults (ranging from 1 to
4), 3 children ≤ 18 years old (ranging from 2 to 6). The sample had a relatively equal
distribution of food security status (37% high food security, 37% low food security, 26%
very low food security).
Interview Guide and Protocol
The role of low-income adolescents in food preparation is a topic supported by limited
research, therefore a semi-structured (vs. structured) interview guide with broad open-
ended questions was appropriate (Turner, 2010). A funneling approach was used to
organize the interview guide (Table 5.1) such that questions were broad initially and then
became increasingly more specific. The interview guide was pilot tested to determine if
170
the research questions needed refinement for clarity. Four pilot interviews were
conducted with adolescents from the randomized-controlled trial. Upon reviewing the
data from the pilot study, researchers decided to include additional probes in the
interview guide in order to obtain more in-depth responses from the participants. The
four pilot interviews were included in the final analysis since major changes were not
made to the interview guide.
All interviews took place in the participants’ home at the conclusion of the randomized-
controlled study and were conducted by the lead author (TML), a researcher with
experience collecting interview data and working with ethnically diverse,
socioeconomically disadvantaged populations. Interviews were audio recorded and
lasted on average 30 minutes. Field notes were recorded to capture relevant non-verbal
communication.

171
Table 5.1 Interview guide used to explore perceived role in home food preparation
among low-income adolescents
Main Question Probe (s)
Tell me about your family.
What is it like living in your house? What do you like about living in this family? What do you dislike about living in this family? What would you change if you could?
What is it like being the oldest child in your family OR What is it like being an older brother/sister?
What do you like about being an older brother/sister? What do you dislike about being an older brother/sister?
What do your parents expect of you?
Specific responsibilities. How you feel about these responsibilities/expectations?
Describe a typical dinner meal. What do you all normally eat for dinner?
Location and composition (who regularly participates in a family dinner meal)
Who primarily prepares dinner? What is it like when they make dinner?
How do they decide what to prepare? What are you doing while they are preparing dinner? What is everyone else doing while they are making dinner?
Who is the other person who prepares dinner most often? What’s it like when they makes dinner?
How do they decide what to prepare? What are you doing while they are preparing dinner? What is everyone else doing while they are making dinner?
Tell me about a time that you prepared dinner or helped prepare dinner?
How did you decide what to prepare (e.g., home food availability, family preferences, adolescent’s preferences, cookbook/recipes)? Did anyone help you? If so, who? What are you comfortable with making? What cooking skills do you have (i.e., chopping, etc.)? What are you uncomfortable with making? What cooking skills do you wish you had? Potential limitations such as time, space, food, kitchen equipment
Once dinner is prepared, how is the meal served (i.e. family style, buffet, pre-plated)? How are vegetables served?
Where do you typically eat (e.g., living room, kitchen table)? If family style or buffet: How do you decide what to put on your plate? If pre-plated: Who prepares your plate? How do they decide what to put on your plate and how much?
What would you prefer in terms of how the meal is served?

172
What is it like eating dinner with your family?
Who is usually present during dinner? Describe the overall environment: relaxed versus rushed; stressed; conversational Other than eating, what else is going on during a typical dinner? What are you normally doing during the meal? What about everyone else? Is the television on? Radio? What about texting, phone calls during meals?
Tell me about any rules your parents have about eating.
Food behaviors: manners, help with preparation and/or cleanup
Data Analysis
Audio recordings were transcribed verbatim and transcripts were coded using an iterative
process informed by grounded theory and the constant comparative method (Glaser &
Straus, 1967; Denzin & Lincoln, 2005). Open coding techniques were applied by two of
the authors (TML and TAA), who independently coded the first four interviews, line-by-
line, to identify potential themes that emerged from the interviews. The researchers then
met to assess the level of coding concordance. Coding discrepancies were discussed until
a consensus was reached. The two researchers then proceeded to apply open coding to
the remaining 15 transcripts using the previously described process. Throughout this
process, the two researchers constantly explored similarities and differences between
codes until major themes were identified. To increase the credibility of the findings, data
from the demographic form, field notes, and transcripts were triangulated as a means of
corroborating the findings (Denzin & Lincoln 2005).

173
5.3 Results
Emerging from the data were three levels of involvement in food preparation (i.e., high,
moderate, low) and perceived roles in both food preparation and the food decision-
making process at mealtime within the household. Eight adolescents (6 girls, 2 boys)
described cooking as one of their main responsibilities. Several of these stated that they
were the primary or secondary food preparer for the household, cooking mostly without
the assistance of an adult. Seven adolescents (6 girls, 1 boy) were moderately involved
in food preparation. The extent of their involvement was mostly to “help with the food
sometimes.” Four adolescent boys described having little to no involvement in cooking.
Two of the boys said that they have never helped, one boy said that he “helped [his] dad
make breakfast like once”, and another said, “I haven’t prepared dinner since we [moved
from] Missouri.”
High Level of Involvement
Adolescents characterized as having a high level of involvement provided several reasons
to explain the extent of their responsibility for food preparation. Many believed that they
had more cooking responsibilities than their sibling(s) because they were the oldest and
“had to grow up extra fast.” One Hmong adolescent girl cited cultural expectations as the
reason for cooking responsibilities. She stated, “in [her] culture it’s like the girl who has
to cook and clean, watch kids and do everything you know and the men are the ones that
don’t have as much responsibilities. And the girls are supposed to be like good wives.”
Other adolescents provided more practical explanations about why they were expected to

174
cook for others in the home. For example, many of the caregivers had busy work
schedules and as such, adolescents became responsible for cooking for siblings. As
explained by one adolescent girl, “when my mom’s not around, I kinda keep everybody
in order, like I cook food too.” Another practical explanation for cooking responsibilities
was provided by an adolescent boy who cooked for his dual-parent household. He stated
that, “since my mom got her job at the cafeteria she hasn’t been cooking as
much…because she has to cook for like hundreds of kids at the school.”
Some adolescents described the time period when they began taking on more cooking
responsibilities and how long they had served in this capacity. For example, one
adolescent girl with four younger siblings recalled that she started cooking at the age of 7.
She went on to state, “I wasn’t really experienced and these responsibilities kinda just
popped out of nowhere. I was like whoa I don’t think I remember signing up for this.”
Another adolescent girl with 2 younger brothers suggested that after her parents separated
several years ago and her mother moved out of the home, she acquired additional
household responsibilities, including cooking. Also, an adolescent who reported a high
level of involvement in food preparation for his 2 parents and 2 younger siblings stated,
“my [older] sister moved out to go to college which was probably like 2 years ago [2012]
and I started having to do more stuff and take responsibility, like more chores.”
Adolescents who had a high level of involvement in food preparation were also highly
involved in deciding what to prepare for dinner meals. They described several factors that

175
they took into consideration when deciding what to prepare. Adolescents would cook
“what [caregiver] says [they] should have for dinner”, sometimes they would ask “what
everybody else wants”, and other times they cooked “whatever [they] want that day.”
They talked about how difficult it was to find something to cook that everyone would eat
because everyone “wants different things.” It was especially challenging when trying to
please a picky eater. One female adolescent in a dual-parent household explained, “my
dad is kinda like a picky eater so if it doesn’t look good then he’s going to be like ‘ew
that’s weird’.” Adolescents were also interested in learning how to make “different
things” and increasing the variety of meals served. One female participant described that
she’s “trying to work on what foods are good to eat with each other.” Many adolescents
“only [knew] a few recipes” and when they wanted to cook new foods they would look
up recipes “online” or use “the recipe on the box.” There were even instances when
adolescents experimented with their own recipe. One adolescent stated that her siblings
“love [her] meat loaf. They are addicted to it.” The main reason adolescents did not
experiment more often was that they “really [didn’t] wanna like waste the food.”
Adolescents also considered the type of foods available in the home, their familiarity with
a dish and/or ingredients, and nutrition, such as having vegetables for the dinner meal.
Regarding health and nutrition, one female adolescent in a single parent household with 4
younger siblings stated, “I usually do baked chicken because I think it’s actually like a
healthy alternative to fried chicken seeing as it might contain less grease and oil.”

176
The types of foods that highly involved adolescents prepared varied greatly, as did the
skill required to prepare those foods. Some of the foods that adolescents prepared were
“quick and easy”, such as “hot dogs”, “Ramen noodles”, “chicken nuggets like the frozen
ones”, “quesadillas”, and “peanut butter and jelly sandwiches”. Other times, the foods
were more elaborate such as “chicken stir fry”, “Salisbury steak with potatoes”, “chicken
alfredo”, “Brussels sprout chips”, and “cornbread.” Adolescents prepared foods on the
stovetop, oven, and in the microwave. They often described using a knife to help prepare
meals. For example, one adolescent who described julienning potatoes to make French
fries explained, “I actually cut the potatoes up in a different manner and I showed my
mom how it looked and how to do it. Now she wanna do it because we just usually do
round potatoes.”
There were also conversations indicating that having extensive food preparation
responsibilities had negative and positive consequences. Some adolescents talked about
how cooking for others “can be stressful.” Adolescents who were highly involved in
cooking talked about the challenge of having to multi-task responsibilities. A frustrated
adolescent girl said, “Dad you should have been in here to help…[because] like if
somebody’s watching [infant sister], then I can cook really quick and I can get to my
homework.” Several other adolescents also mentioned that excessive responsibilities,
such as cooking, “get in the way of homework.” Positive experiences with cooking were
often related to the social interactions that take place during meal preparation. And while
not directly related to food preparation, one adolescent who enjoyed role modeling

177
healthy eating for her younger siblings said, “my little sister wasn’t really a fan of
vegetables, but as soon as I started eating more vegetables, she actually started eating
more vegetables as well.”
Moderate Level of Involvement
Adolescents who were moderately involved in food preparation often said that there was
an adult in the home who did most of the cooking. Some also provided information that
indicated the reason why that particular adult was responsible for the cooking. For
example, one adolescent said that living with her aunt, the primary food preparer, was
different than living with her mother because “there’s no violence, no drinking, no abuse
in the house.” She went on to say that, “I get more food here than I used to get.” For her,
cooking was something fun she did with her aunt, rather than a chore. In several
households another sibling was responsible for cooking. For instance, an adolescent boy
with two parents who “worked pretty late” explained that his sister does most of the
cooking and explained that, “she really likes cooking. I’m a horrible cook.” He went on
to say that his younger sister will cook for him and their younger brother, and their “mom
would leave a note and ingredients out and then [sister] would cook that.” Several of
these adolescents suggested that their caregiver often times preferred to cook meals
alone. As one adolescent explained, “she gets like aggravated when we’re all in the
kitchen together, it’s really cramped.” There were circumstances where the adolescents
would prepare foods for themselves, but they “don’t make it for everybody.” For

178
example, adolescents would “make [their] our own sandwich”, “make hamburger
helper”, and other foods you just “throw in the oven and its done.”
Adolescents who were moderately involved in food preparation described collaborating
with the primary food preparer to decide what was served at mealtime. Adolescents
responded that “basically all of us” decide what is served for dinner. As one adolescent
stated, “well sometimes she [mother] tells us or sometimes she will ask us what we want
to eat.”
There were several ways in which adolescents assisted with food preparation. One
adolescent girl responded, “whenever she [mom] needs something cut, I’ll cut it. Or like
if she makes noodles, I’ll do the noodles or like stir the noodles… I season stuff.”
Another adolescent girl said that her mother might say something like “you do the
chicken and I’ll do the mashed potatoes.” An adolescent boy responded, “a time that I
helped my mom cook dinner would be fish fry. What I did was I actually got the recipe
and my mom helped me get the ingredients and she helped me get it all started and then I
just took over.” Others said that they would “cut [vegetables] up and then put them in the
pan”, “cut up the cabbage or onions and peppers”, and “give [aunt] supplies…peel the
onion.” Most of the cooking skills described included using a knife to chop foods and
using a whisk, fork, and/or blender for mixing. Many adolescents were not comfortable
using the stovetop and oven because as one adolescent stated, “I’m scared I might burn
myself.”

179
Adolescents who were moderately involved in food preparation tended to enjoy cooking,
as one adolescent girl explained, “I like to help her cook. It’s fun.” Adolescents enjoyed
the social interactions that took place while helping with food preparation. One
adolescent girl said, “we interact pretty good. We talk about our day and talk about how
school was.” Furthermore, adolescents who were moderately involved in food
preparation did not describe negative feelings about cooking. A couple of adolescents
even expressed interest in wanting to be more involved at mealtime, but they suggested
that their caregiver (s) was hesitant. For example, one adolescent girl said, “[mom] don’t
want me to touch [stove]…[but] I am older and I can show [mom] responsibility.”
Low Level of Involvement
Four adolescents described a low level of involvement based on not participating in food
preparation and being removed from the decision-making process. Two of these
adolescents suggested that because of sensitive issues taking place in the home, their
caregivers did not expect them to take on extensive responsibilities, which included
cooking. One adolescent said, “I’m not really the person to take responsibility for
things…I know my [parents] won’t let me sit with the kids, I’d beat them senseless by the
end of the night.”
The four adolescent boys who had little involvement in food preparation were also
removed from the mealtime decision-making process. When asked how the primary food

180
preparer decides what to serve for dinner, many of these adolescents responded, “I don’t
know” or they stated that the primary food preparer “just cooks dinner and we eat it.”
The two adolescents in this group who had assisted with meal preparation depended on
their parents to give instructions, as one adolescent said, “my dad just tells me.” The
other adolescent said, “basically, my mom gives me a set of instructions unless I know
what it is and have made it enough times where I can make it by myself. I usually just
follow the description as best as I can and hope it ends well and doesn’t all end up
burned.”
Adolescents with little to no involvement in meal preparation described having minimal
cooking skills. One simply stated that he “never learned how to cook.” Most of these
adolescents said they felt comfortable with “like stuff that’s easy like that I can throw in
the microwave”, but even using the microwave was a challenge for one adolescent who
“burned ramen noodles in a microwave.” None of the adolescents talked about actual
skills (e.g., cutting, etc.), with the exception of one who said that his mother “showed
[him] how to cut [chicken] the correct way.”
The adolescents with little involvement in food preparation did not report that their
caregiver (s) expected or encouraged them to participate in cooking. These adolescents
did not express an interest in wanting to be more involved in the mealtime decision-
making process and often described being satisfied with what their caregiver selected.

181
5.4 Discussion
The results of this qualitative study showed that the level of involvement in home food
preparation and responsibility for specific tasks by adolescents residing in low-income
households varied greatly. Previous research has relied on child, adolescent and parent
survey data regarding frequency of food involvement and tasks performed (Chu et al.,
2013; de Jong, Visscher, HiraSing, Seidell, & Renders, 2015; Leech, et al., 2014). The
limited response options associated with survey data make it challenging to assess the
various levels of involvement and tasks completed by children and adolescents. The
surveys used in these studies estimated the frequency of food preparation (Chu et al.
2013), the frequency of cooking or grocery shopping with a caregiver (de Jong et al.
2015), and frequency of predefined tasks (e.g., making breakfast) (Leech et al. 2014). In
contrast, the current study used qualitative methods to better understand the various
levels of involvement and specific tasks completed. Studies relying on survey methods
also indicated that the level of involvement and tasks varied (Chu et al., 2013; de Jong et
al., 2015; Leech et al., 2014), but the rationale for these variations and implications,
positive or negative, were not assessed.
Cooking was a primary responsibility for adolescents who were highly involved in food
preparation. Many adolescents felt that they had no choice as to whether they prepared
dinner, and some even explained that others in the home (e.g., siblings and adults)
verbally reprimanded them if dinner was not prepared in a timely manner. As other
studies have reported (Burton, 2007), some of the adolescents who were highly involved

182
in food preparation perceived their birth order, gender, and/or cultural expectations, as
justification for this level of involvement. Consistent with the literature on child
adultification consequences (Burton, 2007), the majority of adolescents who were highly
involved in food preparation acknowledged that cooking for others was gratifying at
times, but cooking was also associated with stress and interfered with schoolwork.
A particularly noteworthy finding was that adolescents who were highly involved in food
preparation were also extensively involved in the food decision-making process. These
adolescents described challenges such as catering to multiple food preferences and
having minimal food preparation knowledge and skills, which are barriers that caregivers
in other studies have described when deciding what to prepare for meals (Fulkerson,
Story, Neumark-Sztainer, & Rydell, 2008; Brown & Wenrich, 2012; Berge, Hoppmann,
Hanson, & Neumark-Sztainer, 2013). Also, similar to what caregivers have reported in
other studies (Berge et al., 2013), adolescents were interested in preparing healthy meals
and considered nutrition when deciding what to prepare.
Limitations
There are several limitations that must be acknowledged. The small sample size and
geographically similar population make it challenging to generalize the findings to a
broader audience. As such, the study should be replicated with a larger sample size,
which includes equal representation of girls and boys, and a more racially/ethnically
diverse population.

183
5.5 References
Berge, J. M., Hoppmann, C., Hanson, C., & Neumark-Sztainer, D. (2013). Perspectives about family meals from single-headed and dual-headed households: a qualitative analysis. Journal of the Academy of Nutrition and Dietetics, 113(12), 1632-1639.
Brown J.L., Wenrich T.R. (2012). Intra-family role expectations and reluctance to change identified as key barriers to expanding vegetable consumption patterns during interactive family-based program for Appalachian low-income food preparers. Journal of the
Academy of Nutrition and Dietetics, 112(8), 1188-1200.
Burton L. (2007). Childhood adultification in economically disadvantaged families: a conceptual model*. Family Relations, 56(4), 329-345. Chu Y.L., Farmer A., Fung C., Kuhle S., Storey K.E., Veugelers P.J. (2013). Involvement in home meal preparation is associated with food preference and self-efficacy among Canadian children. Public Health Nutrition, 16(01),108-112. Chu, Y. L., Storey, K. E., & Veugelers, P. J. (2014). Involvement in meal preparation at home is associated with better diet quality among Canadian children. Journal of Nutrition
Education and Behavior, 46(4), 304-308. Denzin N.K., Lincoln Y.S. Handbook of Qualitative Research. Thousand Oaks, CA: Sage Publications; 2005. Fulkerson, J. A., Story, M., Neumark-Sztainer, D., & Rydell, S. (2008). Family meals: perceptions of benefits and challenges among parents of 8-to 10-year-old children. Journal of the American Dietetic Association, 108(4), 706-709. Glaser B.G., Strauss A. The Discovery of Grounded Theory: Strategies for Qualitative Research. New York, NY: Aldine Transactions; 1967. de Jong E., Visscher T.L.S., HiraSing R.A., Seidell J.C., Renders C.M. (2015). Home environmental determinants of children's fruit and vegetable consumption across different SES backgrounds. Pediatric Obesity, 10 (2): 134-140.
Jurkovic, G. J. (2014). Lost Childhoods: The Plight of the Parentified Child. Routledge. Larson N.I., Story M., Eisenberg M.E., Neumark-Sztainer D. (2006). Food preparation and purchasing roles among adolescents: associations with sociodemographic characteristics and diet quality. Journal of the American Dietetic Association, 106(2), 211-218.

184
Leak, T.M., Swenson, A., Vickers, Z., Mann, T., Mykerezi, E., Redden, J., Rendahl, A., Reicks, M. (2015). Testing the effectiveness of in-home behavioral economics strategies to increase vegetable intake, liking, and variety among children residing in households that receive food assistance. Journal of Nutrition Education and Behavior, 47 (2), e1-e9. Leech, R.M., McNaughton, S.A., Crawford, D.A., Campbell, K.J., Pearson, N., & Timperio, A. (2014). Family food involvement and frequency of famliy dinner meals among Australian children aged 10-12 years. Cross-sectional and longitundial associations with dietary pattersn. Appetite, 75, 64-70. Lukas, C. V., & Cunningham-Sabo, L. (2011). Qualitative investigation of the Cooking with Kids Program: focus group interviews with fourth-grade students, teachers, and food educators. Journal of Nutrition Education and Behavior, 43(6), 517-524.
Telzer E.H., Fuligni A.J. (2009). Daily family assistance and the psychological well being of adolescents from Latin American, Asian, and European backgrounds. Developmental Psychology, 45, 1177–1189.
Turner, D. W., III. (2010). “Qualitative Interview Design: A Practical Guide for Novice Investigators.” The Qualitative Report, 15, 754-760.
Van der Horst, K., Ferrage, A., & Rytz, A. (2014). Involving children in meal preparation. Effects on food intake. Appetite, 79, 18-24. Woodruff, S. J., & Kirby, A. R. (2013). The associations among family meal frequency, food preparation frequency, self-efficacy for cooking, and food preparation techniques in children and adolescents. Journal of Nutrition Education and Behavior, 45(4), 296-303.

185
CHAPTER 6: COMPLETE LIST OF REFERENCES FOR DISSERTATION

186
Adair, L. S., & Popkin, B. M. (2005). Are child eating patterns being transformed globally?. Obesity Research, 13(7), 1281-1299. Anzman-Frasca, S., Savage, J. S., Marini, M. E., Fisher, J. O., & Birch, L. L. (2012). Repeated exposure and associative conditioning promote preschool children’s liking of vegetables. Appetite, 58(2), 543-553. Appelhans, B. M., Waring, M. E., Schneider, K. L., & Pagoto, S. L. (2014). Food preparation supplies predict children’s family meal and home-prepared dinner consumption in low-income households. Appetite, 76, 1-8. Bandura, A. (1986). Social foundations of thought and action: A social cognitive theory. Englewood Cliffs, NJ: Prentice-Hall. Baranowski, T., Perry, C.L., & Parcel, G.S. (2002). How individuals, environments, and health behavior interact. Health Behavior and Health Education. San Francisco, CA: Jossey-Bass, 165-84. Berge, J. M., Hoppmann, C., Hanson, C., & Neumark-Sztainer, D. (2013). Perspectives about family meals from single-headed and dual-headed households: a qualitative analysis. Journal of the Academy of Nutrition and Dietetics, 113(12), 1632-1639. Berge, J. M., Wall, M., Larson, N., Forsyth, A., Bauer, K. W., & Neumark-Sztainer, D. (2014). Youth dietary intake and weight status: Healthful neighborhood food environments enhance the protective role of supportive family home environments. Health & place, 26, 69-77. Birch, L.L., & Davison, K.K. (2001). Family environmental factors influencing the developing behavioral controls of food intake and childhood overweight. Pediatric
Clinics of North America, 48 (4), 893-907. Blanchette, L., & Brug, J. (2005). Determinants of fruit and vegetable consumption among 6-12 year old children and effective interventions to increase consumption. Journal of Human Nutrition and Dietetics, 18 (6), 431-443. Broughton M.A., Janssen P.S., Hertzman C., Innis S.M., Frankish C.J. (2006). Predictors and outcomes of household food insecurity among inner city families with preschool children in Vancouver. Canadian Journal of Public Health, 97, 214-216. Brown, J.L., Wenrich, T.R. (2012). Intra-family role expectations and reluctance to change identified as key barriers to expanding vegetable consumption patterns during interactive family-based program for Appalachian low-income food preparers. Journal of
the Academy of Nutrition and Dietetics, 112(8): 1188-1200.

187
Bucher, T., Siegrist, M., van der Horst, K. (2014). Vegetable variety: an effective strategy to increase vegetable choice in children. Public Health Nutrition, 17, 1232-1236. Burton L. (2007). Childhood adultification in economically disadvantaged families: a conceptual model*. Family Relations, 56(4), 329-345. Cason-Wilkerson, R., Goldberg, S., Albright, K., Allison, M., & Haemer, M. (2015). Factors influencing healthy lifestyle changes: a qualitative look at low-income families engaged in treatment for overweight children. Childhood Obesity, 11(2), 170-176. Caton, S. J., Ahern, S. M., Remy, E., Nicklaus, S., Blundell, P., & Hetherington, M. M. (2013). Repetition counts: repeated exposure increases intake of a novel vegetable in UK pre-school children compared to flavour–flavour and flavour–nutrient learning. British
Journal of Nutrition, 109(11), 2089-2097. Centers for Disease Control and Prevention. A SAS Program for the CDC Growth Charts. http://www.cdc.gov/nccdphp/dnpao/growthcharts/resources/sas.htm. Accessed December 5, 2014. Centers for Disease Control and Prevention (CDC). National Center for Health Statistics (NCHS). National Health and Nutrition Examination Survey MEC In-Person Dietary Interviewers Procedures Manual. Hyattsville, Md: US Department of Health and Human Services, Centers for Disease Control and Prevention, 2009. Centers for Disease Control and Prevention. NHANES Anthropometry Procedures Manual. http://www.cdc.gov/nchs/data/nhanes/nhanes_03_04/BM.pdf. Accessed December 5, 2014. Centers for Disease Control and Prevention. (2004). Methodology of the youth risk behavior surveillance system. MMWR Morbidity and Mortality Weekly Report, 53, 1-16. Chapter 14: Acceptance Testing. In: Lawless HT, Heymann H, eds. Sensory Evaluation of Food-Principals and Practices. 2nd ed. New York, NY, Springer; 2010: 325-344 . Christian, M.S., Evans, C.E., Hancock, N., Nykjaer, C., & Cade, J.E. (2013). Family meals can help children reach their 5 A Day: a cross-sectional survey of children’s dietary intake from London primary schools. Journal of Epidemiology and Community
Health, 67(4), 332-338. Chu Y.L., Farmer A., Fung C., Kuhle S., Storey K.E., Veugelers P.J. (2013). Involvement in home meal preparation is associated with food preference and self-efficacy among Canadian children. Public Health Nutrition, 16(01): 108-112.

188
Chu, Y. L., Storey, K. E., & Veugelers, P. J. (2014). Involvement in meal preparation at home is associated with better diet quality among Canadian children. Journal of nutrition
education and behavior, 46(4), 304-308. Cooking Matters (Formerly Operation Frontline), Share Our Strength, Washington, DC. http://cookingmatters.org. Accessed February 7, 2014. Correia, D. C., O'Connell, M., Irwin, M. L., & Henderson, K. E. (2014). Pairing vegetables with a liked food and visually appealing presentation: promising strategies for increasing vegetable consumption among preschoolers. Childhood Obesity, 10(1), 72-76. Corsini, N., Slater, A., Harrison, A., Cooke, L., & Cox, D. N. (2013). Rewards can be used effectively with repeated exposure to increase liking of vegetables in 4–6-year-old children. Public Health Nutrition, 16(05), 942-951. Couch, S. C., Glanz, K., Zhou, C., Sallis, J. F., & Saelens, B. E. (2014). Home Food Environment in Relation to Children’s Diet Quality and Weight Status. Journal of the
Academy of Nutrition and Dietetics, 114(10), 1569-1579. Cravener, T.L., Schlechter, H., Loeb, K.L., Radnitz, C., Schwartz, M., Zucker, N., & Keller, K.L. (2015). Feeding strategies derived from behavioral economics and psychology can increase vegetable intake in children as part of a home-based intervention: results of a pilot study. Journal of the Academy of Nutrition and Dietetics, S2212-S2672. Cullen, K. W., Baranowski, T., Owens, E., Marsh, T., Rittenberry, L., & de Moor, C. (2003). Availability, accessibility, and preferences for fruit, 100% fruit juice, and vegetables influence children's dietary behavior. Health Education & Behavior, 30(5), 615-626. Cutler, G.J., Flood, A., Hannan, P., & Neumark-Sztainer, D. (2011). Multiple sociodemographic and socioenvironmental characteristics are correlated with major patterns of dietary intake in adolescents. Journal of the American Dietetic Association, 111 (2), 230-240. Denzin, N.K., Lincoln, Y.S. Handbook of Qualitative Research. Thousand Oaks, CA: Sage Publications; 2005. Diep, C.S., Chen, T.A., Davies, V.F., Baranowski, J.C., & Baranowski, T. (2014). Influence of behavioral theory on fruit and vegetable intervention effectiveness among children: a meta-analysis. Journal of nutrition education and behavior, 46 (6), 506-546.

189
Ding, D., Sallis, J.F., Norman, G.J., et al. (2012). Community food environment, home food environment, and fruit and vegetable intake of children and adolescents. Journal of
Nutrition Education and Behavior, 44(6): 634-638. DiSantis, K. I., Birch, L. L., Davey, A., Serrano, E. L., Zhang, J., Bruton, Y., & Fisher, J. O. (2013). Plate size and children’s appetite: effects of larger dishware on self-served portions and intake. Pediatrics, 131(5), e1451-e1458. Division of Nutrition, Physical Activity and Obesity, National Center for Chronic Disease Prevention and Health Promotion. What Counts as a Cup. http://www.cdc.gov/nutrition/everyone/fruitsvegetables/cup.html. Accessed December 5, 2014. Dohle S., Rall S., Siegrist M. (2013). I cooked it myself: preparing food increases liking and consumption. Food Quality Preference, 33, 14-16. Draxten, M., Fulkerson, J. A., Friend, S., Flattum, C. F., & Schow, R. (2014). Parental role modeling of fruits and vegetables at meals and snacks is associated with children's adequate consumption. Appetite, 78, 1-7. Evans, A., Chow, S., Jennings, R., Dave, J., Scoblick, K., Sterba, K. R., & Loyo, J. (2011). Traditional foods and practices of Spanish-speaking Latina mothers influence the home food environment: Implications for future interventions. Journal of the American
Dietetic Association, 111(7), 1031-1038. Faught, E., Vander Ploeg, K., Chu, Y.L., Storey, K., & Veugelers, P.J. (2015). The influence of parental encouragement and caring about healthy eating on children’s diet quality and body weights. Public health nutrition, 1-8. Fildes, A., van Jaarsveld, C.H., Wardle, J. & Cooke, L. (2014). Parent-administered exposure to increase children’s vegetable acceptance: a randomized controlled trial. Journal of the Academy of Nutrition and Dietetics, 114 (6), 881-888. Fisher, J.O., Birch, L.L., Zhange, J., Grusak, M.A., & Hughes, S.O. (2013). External influences on children’s self-served portions at meals. International Journal of Obesity, 37 (7), 954-960. Fram, M.S., Ritchie, L.D., Rosen, N., & Frongillo, E.A. (2015). Child experience with food insecurity is associated with child diet and physical activity. The Journal of
Nutrition, 145, 499-504.

190
Fulkerson, J. A., Neumark‐Sztainer, D., Hannan, P. J., & Story, M. (2008). Family meal
frequency and weight status among adolescents: cross‐sectional and 5‐year longitudinal associations. Obesity, 16(11), 2529-2534. Fulkerson, J. A., Nelson, M. C., Lytle, L., Moe, S., Heitzler, C., & Pasch, K. E. (2008). The validation of a home food inventory. International Journal of Behavioral Nutrition
and Physical Activity, 5(1), 55. Fulkerson, J.A., Rydell, S., Kubik, M.Y., Lytle, L. (2010). Healthy home offerings via the mealtime environment (HOME): feasibility, acceptability, and outcomes of a pilot study. Obesity, 18 (S1), S69-S74. Fulkerson, J. A., Story, M., Neumark-Sztainer, D., & Rydell, S. (2008). Family meals: perceptions of benefits and challenges among parents of 8-to 10-year-old children. Journal of the American Dietetic Association, 108(4), 706-709. Gibson, E.L., Wardle, J., & Watts, C.J. (1998). Fruit and vegetable consumption, nutritional knowledge and beliefs in mothers and children. Appetite, 31 (2), 205-228. Glaser, B.G., Strauss, A. The Discovery of Grounded Theory: Strategies for Qualitative Research. New York, NY: Aldine Transactions; 1967.
Golan, M. (2006). Parents as agents of change in childhood obesity‐from research to practice. International Journal of Pediatric Obesity, 1(2), 66-76. Gurnani, M., Birken, C., Hamilton, J. (2015). Childhood obesity: causes, consequences, and management. Pediatric Clinics of North America, 62(4), 821-40. Hanks, A. S., Just, D. R., Smith, L. E., & Wansink, B. (2012). Healthy convenience: nudging students toward healthier choices in the lunchroom. Journal of Public Health, 34 (3), 370-376.
Hanks, A. S., Just, D. R., & Wansink, B. (2013). Smarter lunchrooms can address new school lunchroom guidelines and childhood obesity. The Journal of Pediatrics, 162(4), 867-869. Harnack, L.J., Oakes, J.M., French, S.A., Rydell, S.A., Farah, F.M., Taylor, G.L. (2012). Results from an experimental trial at a Head Start center to evaluate two meal service approaches to increase fruit and vegetable intake of preschool aged children. International Journal of Behavioral Nutrition and Physical Activity, 9, 51. Heshmat, S. (2011). Eating behavior and obesity: Behavioral economics strategies for
health professionals. Springer Publishing Company.

191
Hingle, M., Beltran, A., O’Connor, T., Thompson, D., Baranowski, J., & Baranowski, T. (2012). A model of goal directed vegetable parenting practices. Appetite, 58(2), 444-449. Holley, C.E., Haycraft, E., & Farrow, C. (2015). ‘Why don’t you try it again?’ a comparison of parent led, home based interventions aimed at increasing children’s consumption of a disliked vegetable. Appetite, 87, 215-222. Jabs, J., Devine, C.M., Bisogni, C.A,. Farrell, T.J., Jastran, M., Wethington, E. (2007). Trying to find the quickest way: employed mothers’ constructions of time for food. Journal of Nutrition Education and Behavior, 39(1), 18-25. Jago, R., Baranowski, T., & Baranowski, J. C. (2007). Fruit and vegetable availability: a micro environmental mediating variable?. Public Health Nutrition, 10(07), 681-689. Johnston, C.A., Palcic, J.L., Tyler, C., Stansberry, S., Reeves, R.S., Foreyt, J. (2011). Increasing vegetable intake in Mexican–American youth. A randomized controlled trial. Journal of the American Dietetic Association, 111, 716-720. de Jong E, Visscher, T.L.S., HiraSing, R.A., Seidell, J.C., Renders, C.M. (2015). Home environmental determinants of children's fruit and vegetable consumption across different SES backgrounds. Pediatric Obesity, 10 (2): 134-140. Jurkovic, G. J. (2014). Lost childhoods: The plight of the parentified child. Routledge. Just, D.R., Lund, J., Price, J. (2012). The role of variety in increasing the consumption of fruits and vegetables among children. Agricultural Resource Economic Review, 41, 72–81. Just, D. R., & Wansink, B. (2009). Smarter lunchrooms: using behavioral economics to improve meal selection. Choices, 24(3), 1-7. Kaur, J., Lamb, M. M., & Ogden, C. L. (2015). The association between food insecurity and obesity in children—the National Health and Nutrition Examination Survey. Journal
of the Academy of Nutrition and Dietetics, 115(5), 751-758. Kim, S.A., Moore, L.V., Galuska, D., Wright, A.P., Harris, D., Grummer-Strawn, L.M., Merlo, C.L., Nihiser, A.J., Rhodes, D.G. (2014). Vital signs: fruit and vegetable intake among children-United States, 2003-2010. MMWR Morbidity and Mortality Weekly Report, 63 (31), 671-676. Kirkpatrick, S. I., Dodd, K. W., Reedy, J., & Krebs-Smith, S. M. (2012). Income and

192
race/ethnicity are associated with adherence to food-based dietary guidance among US adults and children. Journal of the Academy of Nutrition and Dietetics, 112(5), 624-635. Kral, T.V., Kabay, A.C, Roe, L.S., & Rolls, B.J. (2010). Effects of doubling the portion size of fruit and vegetable side dishes on children’s intake at a meal. Obesity, 18 (3), 521-527. Krebs-Smith, S.M., Guenther, P.M., Subar, A.F., Kirkpatrick, S.I., Dodd, K.W. (2010). Americans do not meet federal dietary recommendations. Journal of Nutrition140, 1832-1838. Kuczmarski, R. J., Ogden, C. L., Grummer-Strawn, L. M., Flegal, K. M., et al. (2000). CDC growth charts: United States. Advance Data, (314), 1-27. Lakkakula, A., Geaghan, J. P., Wong, W. P., Zanovec, M., Pierce, S. H., & Tuuri, G. (2011). A cafeteria-based tasting program increased liking of fruits and vegetables by lower, middle and upper elementary school-age children. Appetite, 57(1), 299-302. Lakkakula, A, Geaghan, J, Zanovec, M, Pierce, S., & Tuuri, G. (2010). Repeated taste exposure increase liking for vegetables by low-income elementary school children. Appetite, 55 (2), 226-231. Landers, P., & Shults, C. (2008). Pots, pans, and kitchen equipment: do low-income clients have adequate tools for cooking?. Journal of Extension, 46(1). Lang, T., Caraher, M., Dixon, P., Carr-Hill, R. Cooking Skills and Health. London: Health Education Authority. http://www.nice.org.uk/nicemedia/documents/cooking_skills_health.pdf. 1999. Accessed December 5, 2014. Larson, N.I., Story, M., Eisenberg, M.E., Neumark-Sztainer, D. (2006). Food preparation and purchasing roles among adolescents: associations with sociodemographic characteristics and diet quality. Journal of the American Dietetic Association, 106(2), 211-218.
Leak, T.M., Swenson, A., Vickers, Z., Mann, T., Mykerezi, E., Redden, J., Rendahl, A., Reicks, M. (2015). Testing the effectiveness of in-home behavioral economics strategies to increase vegetable intake, liking, and variety among children residing in households that receive food assistance. Journal of Nutrition Education and Behavior, 47 (2), e1-e9. Ledikwe, J.H, Blanck, H.M., Khan, L.K., Serdula, M.K, Seymour, J.D., Tohill, B.C., Rolls, B.J. (2006). Dietary energy density is associated with energy intake and weight status in US adults. American Journal of Clinical Nutrition,83, 1362-1368.

193
Ledoux, T. A., Hingle, M. D., & Baranowski, T. (2011). Relationship of fruit and vegetable intake with adiposity: a systematic review. Obesity Reviews, 12(5), e143-e150. Leech, R.M., McNaughton, S.A., Crawford, D.A., Campbell, K.J., Pearson, N., & Timperio, A. (2014). Family food involvement and frequency of famliy dinner meals among Australian children aged 10-12 years. Cross-sectional and longitundial associations with dietary pattersn. Appetite, 75, 64-70. Levitsky, D.A., Iyer, S. & Pacanowski, C.R. (2012). Number of foods available at a meal determines the amount consumed. Eating Behaviors, 13(3), 183-187. Libotte, E., Siegrist, M., & Bucher, T. (2014). The influence of plate size on meal composition. Literature review and experiment. Appetite, 82, 91-96. Liem, D. G., & Zandstra, L. H. (2009). Children's liking and wanting of snack products: Influence of shape and flavour. International Journal of Behavioral Nutrition and
Physical Activity, 6, 38. doi: 10.1186/1479-5868-6-381479-5868-6-38 [pii]. Lohman, T.G., Roche, A.F., Martorell, R. Anthropometric Standardization Reference Manual. Champaign, IL: Human Kinetics Books; 1988. Lukas, C. V., & Cunningham-Sabo, L. (2011). Qualitative investigation of the Cooking with Kids Program: focus group interviews with fourth-grade students, teachers, and food educators. Journal of Nutrition Education and Behavior, 43(6), 517-524. Lutfiyya, M. N., Garcia, R., Dankwa, C. M., Young, T., & Lipsky, M. S. (2008). Overweight and obese prevalence rates in African American and Hispanic children: an analysis of data from the 2003–2004 National Survey of Children's Health. The Journal
of the American Board of Family Medicine, 21(3), 191-199. Lytle, L.A., Murray, D.M., Perry, C.L., & Eldridge, A.L. (1998). Validating fourth-grade students’ self-report of dietary intake: results from the 5 A Day Power Plus program. Journal of the American Dietetic Association, 98 (5), 570-572. Mancino, L., Newman, C. Who has time to cook? How family resources influence food preparation. Economic Research Service. http://www.ers.usda.gov/publications/err40/. Accessed August 4, 2015. Mathias, K.C., Rolls, B.J., Birch, L.L, Kral, T.V. Hanna, E.L., Davey, A., & Fisher, J.O. (2012). Serving larger portions of fruits and vegetables together at dinner promotes intake of both foods among young children. Journal of the Academy of Nutrition and Dietetics, 112(2), 266-270.

194
Matthews, V. L., Wien, M., & Sabaté, J. (2011). The risk of child and adolescent overweight is related to types of food consumed. Nutrition Journal, 10(1), 71-74. McClain, A. D., van den Bos, W., Matheson, D., Desai, M., McClure, S. M., & Robinson, T. N. (2014). Visual illusions and plate design: the effects of plate rim widths and rim coloring on perceived food portion size. International Journal of Obesity, 38(5), 657-662. Miller, P., Moore, R. H., & Kral, T. V. (2011). Children’s daily fruit and vegetable intake: associations with maternal intake and child weight status. Journal of Nutrition
Education and Behavior, 43(5), 396-400. Miller,N., Reicks, M., Redden, J.P., Mann, T., Mykerezi, E., Vickers, Z. (2015). Increasing portion sizes of fruits and vegetables in an elementary school lunch program can increase fruit and vegetable consumption. Appetite. doi:10.1016/j.appet.2015.04.081 Musher-Eizenman, D.R., Young, K.M., Laurene, K., Galliger, C., Hauser, J., & Oehlhof, M.W. (2010). Children’s sensitivity to external cues: How distance to serving bowl influences children’s consumption. Health Education & Behavior, 37 (2), 186-192. MyPlates (MyPlate Paper Portion Plate), Positive Promotions, 15 Gilpin Avenue, Hauppauge, NY. National Cancer Institute Fruit/Vegetable Screener evaluated in the Eating at America’s Table Study: Eating at America’s Table Study: Quick Food Scan. 2000. National Cancer Institute website. Retrieved from http://riskfactor.cancer.gov/diet/screeners/fruitveg/allday.pdf. Nielson,S.J., Rossen, L.M., Harris, D.M., & Ogden, C.L. (2014). Fruit and vegetable consumption of US youth, 2009-2010. NCHS data brief, 156, 1-8. Noradilah, M., & Zahara, A. (2012). Acceptance of a test vegetable after repeated exposures among preschoolers. Malaysian Journal of Nutrition, 18(1), 67-75. Norton, M.I. Mochon, D., & Ariely, D. (2011). The 'IKEA effect': When labor leads to love. Harvard Business School Marketing Unit Working Paper, (11-091). Nutrition Coordinating Center, University of Minnesota. http://www.ncc.umn.edu/ndsrsupport/foodamountreportingpostersandbooklets.html. Accessed December 5, 2014.

195
Nutrition Data Systems for Research (NDSR) User Manual 2013. Version 2013 (1998-2014), page A10.3-A10.5. Nutrition Coordinating Center (NCC), University of Minnesota, Minneapolis, MN. http://www.ncc.umn.edu/ndsrsupport/ndsrmanual2013.pdf. Accessed December 5, 2014. NVivo qualitative data analysis software; QSR International Pty Ltd. Version 10, 2014. Ochs, E., & Shohet, M. (2006). The cultural structuring of mealtime socialization. New
Directions for Child and Adolescent Development, 111, 35. Ogden, C. L., Carroll, M. D., Kit, B. K., & Flegal, K. M. (2014). Prevalence of childhood and adult obesity in the United States, 2011-2012. The Journal of the American Medical
Association, 311(8), 806-814. Olsen, A., Ritz, C., Kramer, L., & Møller, P. (2012). Serving styles of raw snack vegetables. What do children want?. Appetite, 59(2), 556-562. Pan, L., May, A.L., Wethington, H., Dalenius, K., Grummer-Strawn, L.M. (2013). Incidence of obesity among young US children living in low-income families, 2008–2011. Pediatrics.,132, 1006-1013. Pedersen, S., Grønhøj, A., Thøgersen, J. (2014). Following family or friends. Social norms in adolescent healthy eating. Appetite, 86, 54-60. Peryam, D.R., Girardot, N.F. (1952). Advanced taste-test method. Food Engineering, 24, 58-61. Pescud, M., & Pettigrew, S. (2014). Parents’ experiences with hiding vegetables as a strategy for improving children's diets. British Food Journal, 116(12), 1853-1863. Physical Activity Guidelines Advisory Committee. Physical Activity Guidelines Advisory Committee Report, 2008. Washington, DC: US Department of Health and Human Services, 2008, A1-H14. Poti, J.M., Popkin, B.M. (2011). Trends in energy intake among US children by eating location and food source, 1977-2006. Journal of the American Dietetic Association,111, 1156-1164. Price, J., & Just, D. R. (2015). Lunch, recess and nutrition: Responding to time incentives in the cafeteria. Preventive Medicine, 71, 27-30.

196
Privitera, G.J., & Zuraikat, F.M. (2014) Proximity of foods in a competitive food environment influenes consumption of a low calorie and a high calorie food. Appetite, 76, 175-179. Quan, T. U., Salomon, J., Nitzke, S., & Reicks, M. (2000). Behaviors of low-income mothers related to fruit and vegetable consumption. Journal of the American Dietetic
Association, 100(5), 567-569. R Development Core Team. R: A language and environment for statistical computing. R Foundation for Statistical Computing, Vienna, Austria. http://www.R-project.org/2008. Accessed December 5, 2014. Redden, J.P., Mann, T., Vickers, Z., Mykerezi, E., Reicks, M., Elsbernd, S. (2015) Serving first in isolation increases vegetable intake among elementary schoolchildren. PLoS ONE, 10(4): e0121283. doi: 10.1371/journal.pone.0121283. Reicks, M. Redden, J. Mann, T, and Vickers, Z. (2012). Pictures in lunch tray compartments and vegetable consumption among children in elementary school cafeterias. JAMA, 307(8):784-785. Remington, A., An, E., Croker, H., Wardle, J., & Cooke, L. (2012). Increasing food acceptance in the home setting: a randomized controlled trial of parent-administered taste exposure with incentives. The American Journal of Clinical Nutrition, 95(1), 72-77. Roe, L.S., Meengs, J.S., Birch, L.L., & Rolls, B.J. (2013). Serving a variety of vegetables and fruit as a snack increased intake in preschool children. The American Journal of
Clinical Nutrition, 98 (3), 693-699. Rollins, B. Y., Belue, R. Z., & Francis, L. A. (2010). The beneficial effect of family meals on obesity differs by race, sex, and household education: the national survey of children's health, 2003-2004. Journal of the American Dietetic Association, 110(9), 1335-1339. Rolls, B.J., Roe, L.S., & Meengs, J.S. (2010). Portion size can be used strategically to increase vegetable consumption among adults. The American Journal of Clinical
Nutrition, 91 (4), 913-922. Rydén, P. J., & Sydner, Y. M. (2011). Implementing and sustaining dietary change in the context of social relationships. Scandinavian Journal of Caring Sciences, 25(3), 583-590. Salvy, S. J., Vartanian, L. R., Coelho, J. S., Jarrin, D., & Pliner, P. P. (2008). The role of familiarity on modeling of eating and food consumption in children. Appetite, 50(2), 514-518.

197
Samson, A. (Ed.)(2014). The Behavioral Economics Guide 2014 (with a foreword by
George Loewenstein and Rory Sutherland) (1st ed.). Retrieved from http://www.behavioraleconomics.com. Savage, J. S., Haisfield, L., Fisher, J. O., Marini, M., & Birch, L. L. (2012). Do children eat less at meals when allowed to serve themselves?. The American Journal of Clinical
Nutrition, 96(1), 36-43. Savage, J.S., Peterson, J., Marini, M., Bordi, P.L., & Birch, L.L. (2013). The addition of a plain or herb-flavored reduced-fat dip is associated with improved preschoolers' intake of vegetables. Journal of the Academy of Nutrition and Dietetics, 113 (8), 1090-1095. Schutz, H.G., & Cardello, A.V. (2001). A labeled affective magnitude (LAM) scale for assessing food liking/disliking. Journal of Sensory Studies, 16(2), 117-159. Serrano, M., Torres, R., Perez, C.M., Palacios, C. (2014). Social environmental factors, diet quality, and body weight in 12-year-old children from four public schools in Puerto Rico. Puerto Rico Health Sciences Journal, 33 (2), 80-87. Simonson, I., Tversky, A. (1992). Choice in context: tradeoff contrast and extremeness aversion. Journal of Marketing Research, 29, 281-295. Singh, G.K., Siahpush, M., Kogan, M.D. (2010). Rising social inequalities in US childhood obesity, 2003–2007. Annals of Epidemiology, 20(1): 40-52.
Slining, M. M., Mathias, K. C., & Popkin, B. M. (2013). Trends in Food and Beverage Sources among US Children and Adolescents: 1989-2010. Journal of the Academy of
Nutrition and Dietetics, 113(12), 1683-1694. Spill, M. K., Birch, L. L., Roe, L. S., & Rolls, B. J. (2011). Hiding vegetables to reduce energy density: an effective strategy to increase children's vegetable intake and reduce energy intake. The American Journal of Clinical Nutrition, 94(3), 735-741. Story, M., Kaphingst, K.M., Robinson-O'Brien, R., Glanz, K. (2008). Creating healthy food and eating environments: policy and environmental approaches. Annual Review of
Public Health. 29, 253-272. Serdula M.K., Ivery D., Coates R.J., Freedman, D.S., Williamson, D.F., & Byers, T. (1993). Do obese children become obese adults? A review of the literature. Preventive
Medicine, 22(2),167-177.

198
Swenson, A. An exploration of factors that may affect vegetable intake among children, 9-12 years: availability, preferences, and preparation time. University of Minnesota thesis. April 2015. 177. Telzer, E.H., Fuligni, A.J. (2009) Daily family assistance and the psychological well being of adolescents from Latin American, Asian, and European backgrounds. Developmental Psychology, 45: 1177–1189. Thaler, R. H., & Sunstein, C. R. (2008). Nudge: Improving Decisions about Health,
Wealth, and Happiness. New Haven, CT: Yale University Press. Thompson, F.E., Subar, A.F. Dietary assessment methodology. In: Coulston AM, Boushey CJ, Ferruzzi M, eds. Nutrition in the Prevention and Treatment of Disease. 3rd ed. Waltham, MA: Academic Press; 2008:5-46.
Taveras, E. M., Rifas‐Shiman, S. L., Berkey, C. S., Rockett, H. R., Field, A. E., Frazier, A. L., ... & Gillman, M. W. (2005). Family dinner and adolescent overweight. Obesity
Research, 13(5), 900-906. Turner, D. W., III. (2010). “Qualitative Interview Design: A Practical Guide for Novice Investigators.” The Qualitative Report, 15, 754-760. US Bureau of Labor Statistics. BLS Reports. Women in the Labor Force: A Databook. Report 1040. February 2013. http://www.bls.gov/cps/wlf-databook-2012.pdf. Accessed November 26, 2014. United States Department of Agriculture. ChooseMy-Plate.gov. Available at: http://www.choosemyplate.gov/index.html. Published 2011. Accessed September 23, 2014. U.S. Department of Agriculture, Agricultural Research Service. (2014). Food Patterns Equivalents Intakes from Food: Mean Amounts Consumed per Individual, by Gender and Age, What We Eat in America, NHANES 2011-2012. Available at www.ars.usda.gov/ba/bhnrc/fsrg. United States Department of Agriculture Food and Nutrition Service. HealthierUS School Challenge: Smarter Lunchrooms. Available at http://teamnutrition.usda.gov/hussc/healthierus-school-challenge-smarter-lunchrooms. Accessed July 27, 2015. United States Department of Health and Human Services, Public Health Service, Office of Disease Prevention and Health Promotion. Healthy People 2010: Volume I and II. Washington, DC: U.S. Government Printing Office; January 2000.

199
U.S. Department of Agriculture and U.S. Department of Health and Human Services. Dietary Guidelines for Americans, 2010. 7th Edition, Washington, DC: U.S. Government Printing Office, December 2010. USDA Economics Research Service. (2012) Six-Item Short Form of the Food Security Survey Module. Retrieved from http://www.ers.usda.gov/topics/food-nutrition-assistance/food-security-in-the-us/survey-tools.aspx#six. Accessed??? USDA Economics Research Service. The Food Assistance Landscape: FY 2007 Annual Report. Washington, DC: US Department of Agriculture; 2008. Economics Information Bulletin No. 6-5. Van der Horst, K., Ferrage, A., & Rytz, A. (2014). Involving children in meal preparation. Effects on food intake. Appetite, 79, 18-24. Wadhera, D., & Capaldi-Phillips, E.D. (2014). A review of visual cues associated with food on food acceptance and consumption. Eating Behaviors, 15 (1), 132-143. Wang, W. (2013). Parents' Time with Kids More Rewarding Than Paid Work-and More
Exhausting. Pew Research Center. Available at http://www.pewsocialtrends.org/2013/10/08/parents-time-with-kids-more-rewarding-than-paid-work-and-more-exhausting/ Wansink, B., Just, D. R., Payne, C. R., & Klinger, M. Z. (2012). Attractive names sustain increased vegetable intake in schools. Preventive Medicine, 55(4), 330-332. Wansink, B., Just, D. R., Hanks, A. S., & Smith, L. E. (2013). Pre-sliced fruit in school cafeterias: Children's selection and intake. American Journal of Preventive Medicine, 44(5), 477-480. Wansink, B., Painter, J.E., Lee, Y-K. (2006). The office candy dish: proximity’s influence on estimated and actual consumption. International Journal of Obesity,30, 871-875. Wansink, B., & van Ittersum, K. (2013). Portion size me: plate-size induced consumption norms and win-win solutions for reducing food intake and waste. Journal of
Experimental Psychology: Applied, 19(4), 320. Wansink, B., van Ittersum, K., Painter, J.E. (2006). Ice cream illusions bowls, spoons, and self served portion sizes. American Journal of Preventive Medicine, 31, 240–243.

200
Wansink, B., Van Ittersum, K., & Payne, C. R. (2014). Larger bowl size increases the amount of cereal children request, consume, and waste. The Journal of Pediatrics, 164(2), 323-326. Wengreen, H.J., Madden, G.J., Aguilar, S.S., Smits, R.R., Jones, B.A. (2013). Incentivizing children's fruit and vegetable consumption: results of a United States pilot study of the Food Dudes Program. Journal of Nutrition Education and Behavior, 45(1), 54-9. Wolfe W.S., Frongillo E.A., Cassano P.A. (2001). Evaluating brief measures of fruit and vegetable consumption frequency and variety cognition, interpretation, and other measurement issues. Journal of the American Dietetic Association, 101, 311-318. Woodruff, S. J., & Kirby, A. R. (2013). The associations among family meal frequency, food preparation frequency, self-efficacy for cooking, and food preparation techniques in children and adolescents. Journal of Nutrition Education and Behavior, 45(4), 296-303.

201
CHAPTER 7: APPENDICES

202
7.1 Phase 1 Consent Form
CONSENT FORM
Dinner Meals Study You and your child are invited to be in a research study of ways that parents make dinner meals for children. You and your child were selected as possible participants because your child is 9-12 years-old and you are the main person responsible for preparing dinner meals for this child. We ask that you read this form and ask any questions you may have before agreeing to be in this study and before allowing your child to be in this study. This study is being conducted by: Marla Reicks, Zata Vickers, Food Science and Nutrition, Traci Mann, Psychology, Elton Mykerezi, Applied Economics and Joseph Redden, Carlson School of Management; University of Minnesota; Teri Burgess-Champoux and Dennis Degeneffe, Consultants; Alison Swenson, Rachel Iannazzo and Tashara Leak, Nutrition students and Alicia Perales-Esparza, Community Nutrition Educator, University of Minnesota Extension Service.
Background Information The purpose of this study is to learn more about how parents/caregivers and children prepare foods at home for dinner.
Procedures:
If you agree to be in this study, we would ask you to participate in one observation/interview session in your home as you prepare and eat your dinner meal with your 9-12 year-old child. We will ask questions about food selection, preparation, and consumption after your dinner meal. We will ask you to fill out questionnaires about the foods you have at home and about yourself, vegetable preferences, likelihood of using strategies to help children change food intake, and food security. The session is expected to take 2-3 hours depending on the length of time it takes for you to prepare and eat dinner. We ask that you allow your child to answer interview questions about foods he or she likes after your meal. We will video record you and your family as you prepare and eat your dinner meal. We will audio record your responses and your child’s responses to interview questions after dinner. We will take several pictures of your kitchen, dining area, dinner plates, and places where you store food. We will take notes about the food you have at home. All video and audio recordings and notes will be kept private and will only be accessible to the researchers. The photos will be used for educational purposes only.
Risks and Benefits of being in the Study The study has the following risk: Researchers will visit your home and observe a family meal which will be an invasion of your privacy. There are no benefits to participation.
Compensation:
You will receive payment of $40 cash after the dinner meal observation in your home.

203
2 of 2
Confidentiality:
The records of this study will be kept private. In any sort of report we might publish, we will not include any information that will make it possible to identify a subject. Research records will be stored securely and only researchers will have access to the records. Video and audio recordings will only be accessible to study investigators and will be destroyed after being transcribed or viewed. By law, the privilege of confidentiality does not extend to all data collected. The following information is not limited by confidentiality and may be released as governed by law: 1) information about a child being maltreated or neglected, 2) information about an individual’s plan to seriously harm him/herself, 3) information about an individual’s plan to seriously harm another person. If members of the research staff have or are given such information, they may be required to report it to the authorities. The obligation to report includes alleged or probable abuse as well as known abuse. Voluntary Nature of the Study:
Participation in this study is voluntary. Your decision whether or not to participate will not affect your current or future relations with the University of Minnesota or the University of Minnesota Extension nutrition education programs. If you decide to participate, you are free to not answer any question or withdraw at any time without affecting those relationships. Contacts and Questions:
The researchers conducting this study are Marla Reicks, Zata Vickers, Traci Mann, Elton Mykerezi, Joseph Redden, Teri Burgess-Champoux, Dennis Degeneffe, Alison Swenson, Rachel Iannazzo, Tashara Leak, and Alicia Perales-Esparza. You may ask any questions you have now. If you have questions later, you are encouraged to contact Alison Swenson or Alicia Perales-Esparza at the University of Minnesota, Alison – 612-454-9055 or [email protected] or Alicia – 763-767-2884 or 612-819-8687 or [email protected]. If you have any questions or concerns regarding this study and would like to talk to someone other than the researcher(s), you are encouraged to contact the Research Subjects’ Advocate Line, D528 Mayo, 420 Delaware St. Southeast, Minneapolis, Minnesota 55455; (612) 625-1650. You will be given a copy of this information to keep for your records.
Statement of Consent:
I have read the above information. I have asked questions and have received answers. I consent to participate in the study. I consent to have my child to participate in this study. Signature of participant:___________________________________D ate__________________ Signature of Investigator:_________________________________ Date: __________________

204
7.2 Phase 1 Assent Form
Assent Form for Children
Dinner Meals Study
We are asking if you are willing to have us watch while you and your parent or other caregiver make and eat dinner one night, because we are trying to learn more about the foods kids your age like. Because you are between the ages of 9 and 12, we are asking if you want to be in a study. We hope that watching how families make and eat dinner will help us learn how to help families eat better in the future. If you agree to be in this study, we will ask you to let us come to your home one night during the week. We will ask if we can watch and video record while you and your parent or other caregiver make and eat dinner. We will ask you some questions about the foods you eat and like and record your voice while you answer. And, if you change your mind during the study, you can always let us know and we will stop our session where we watch you and your parent make and eat dinner. Being in this study is totally up to you, and no one will be mad at you if you don’t want to do it. You can ask any questions that you have about this study.
Signing here means that you have read this paper or had it read to you and that you are willing to be in this study. If you don’t want to be in this study, don’t sign. Remember, being in this study is up to you, and no one will be mad at you if you don’t sign this or even if you change your mind later. Signature of participant_________________________________________________________ Signature of person explaining study _________________________Date_________________

205
7.3 Phase 1 Sociodemographic and Household Characteristics Questionnaire
About You and Your Family
Questions 1-7 are about YOUR CHILD. If you have more than one child between the ages of 9-12, choose one child and answer these questions about that child. Fill in the appropriate circle. 1. How old is your 9-12 year old child? � 9 years � 10 years � 11 years � 12 years 2. Is this child a boy or girl? � Boy � Girl
3. Please fill in only one circle about the ethnicity of your 9-12 year old child. � Hispanic or Latino. A person of Cuban, Mexican, Puerto Rican, South or Central
American, or other Spanish culture or origin, regardless of race.
� Not Hispanic or Latino 4. How would you best describe this 9-12 year old child with respect to race? You may
fill in more than one circle. � Black or African American. A person having origins in any of the Black racial groups of Africa.
� White. A person having origins in any of the original peoples of Europe, the Middle East,
or North Africa.
� Alaska native or American Indian. A person having origins in any of the original peoples of North, Central and South America, and who maintains tribal affiliation or community attachment.
� Asian. A person having origins in any of the original peoples of the Far East, Southeast Asia, or the Indian subcontinent including for example, Cambodia, China, India, Japan, Korea, Malaysia, Pakistan, the Philippine Islands, Thailand and Vietnam
� Native Hawaiian or other Pacific Islander. A person having origins in any of the original peoples of Hawaii, Guam, Samoa, or other Pacific Islands.
� Other. A group not mentioned above. Please describe___________________________
5. What is your relationship to this child? (Fill in only one circle)
� Parent (includes step parent/foster)
� Grandparent
� Aunt or uncle
� Sibling
� Other, please specify __________________________ 6. On average, how many days of the week does this child live in your home? (Fill in
only one circle)
� 1-3 days
� 4 or more days
7. How many children living in your home are: Under the age of 9? ____ Between 9-12? ____ Between 13-18? _____

206
Questions 8-9 are about YOUR SPOUSE/SIGNIFICANT OTHER
8. Please fill in only one circle about the ethnicity of your spouse/significant other. � I don’t have a spouse/significant other.
� Hispanic or Latino. A person of Cuban, Mexican, Puerto Rican, South or Central American, or other Spanish culture or origin, regardless of race.
� Not Hispanic or Latino
9. How would you best describe your spouse/significant other with respect to race? You may fill in more than one circle. � I don’t have a spouse/significant other.
� Black or African American. A person having origins in any of the Black racial groups of Africa.
� White. A person having origins in any of the original peoples of Europe, the Middle East, or North Africa.
� Alaska native or American Indian. A person having origins in any of the original peoples of North, Central and South America, and who maintains tribal affiliation or community attachment.
� Asian. A person having origins in any of the original peoples of the Far East, Southeast
Asia, or the Indian subcontinent including for example, Cambodia, China, India, Japan, Korea, Malaysia, Pakistan, the Philippine Islands, Thailand and Vietnam
� Native Hawaiian or other Pacific Islander. A person having origins in any of the original peoples of Hawaii, Guam, Samoa, or other Pacific Islands.
� Other. A group not mentioned above. Please describe___________________________
Questions 10-27 are about YOU.
10. Please fill in only one circle about your ethnicity. � Hispanic or Latino. A person of Cuban, Mexican, Puerto Rican, South or Central American, or other Spanish culture or origin, regardless of race.
� Not Hispanic or Latino
8. 11. How would you best describe yourself with respect to race? You may fill in more than one circle. � Black or African American. A person having origins in any of the Black racial groups of Africa.
� White. A person having origins in any of the original peoples of Europe, the Middle East, or North Africa.
� Alaska native or American Indian. A person having origins in any of the original peoples of North, Central and South America, and who maintains tribal affiliation or community attachment.
� Asian. A person having origins in any of the original peoples of the Far East, Southeast Asia, or the Indian subcontinent including for example, Cambodia, China, India, Japan, Korea, Malaysia, Pakistan, the Philippine Islands, Thailand and Vietnam
� Native Hawaiian or other Pacific Islander. A person having origins in any of the original peoples of Hawaii, Guam, Samoa, or other Pacific Islands.
� Other. A group not mentioned above. Please describe___________________________

207
12. How old are you? ________ years
13. Are you a man or a woman?
� Man
� Woman
14. How many adults over the age of 18, counting yourself, live in your home?
� 1
� 2
� 3 or more
15. What is your highest level of formal education?
� Have not completed high school
� Received high school diploma or GED
� Some college or technical school
� 4-year college, university degree or advanced degree
16. Which of the following best describes your employment status? (Mark all that apply)
� Homemaker/househusband
� Not employed
� Employed part-time
� Employed full-time
� Retired
17. Which of the following best describes the employment status of your spouse/significant other? (Mark all that apply)
� Homemaker/househusband
� Not employed
� Employed part-time
� Employed full-time
� Retired
18. Are you a student (either full or part time)?
� Yes
� No
19. Are you or your family members participating in the following programs? (Mark all that apply)
� WIC
� SNAP (Supplemental Nutrition Assistance Program) or formerly called Food stamps
� Free/reduced priced school lunch
� Food shelves, meals, or other food distribution programs
� None
20. What language do you speak at home? Ο Only English Ο Mostly English Ο English and another language about the same Ο Mostly another language Ο Only another language

208
21. How long have you lived in the U.S.? Ο 1-5 years Ο 6-10 years Ο More than 10 years
22. Where do you usually shop for groceries? Mark all that apply.
Ο Supermarkets (like Cub, Rainbow, Lunds, Byerly’s, Trader Joe’s)
Ο Supercenters (like Target or Wal*Mart)
Ο Club Stores (like Sam's Club or Costco)
Ο Discount grocery (like Mike’s Discount Foods, So Low Grocery)
Ο Convenience/corner store (like Super America or Holiday)
Ο Dollar Stores (like Family Dollar or Dollar General)
Ο Specialty/Ethnic Food Stores (like Mercado Central, Patel Groceries)
Ο Drug Stores (like Walgreen's or CVS)
Ο Farmer’s market
Ο Natural/Organic/Health Stores (like Whole Foods)
Ο Bakery (stand alone - not inside a supermarket)
Ο Butcher/meat market
Ο Home Delivered Internet Grocery
Ο Other ______________________________ please write where you shop (if other) 23. During the past month, how often did you use a food shelf to provide foods for you and your family? Ο None Ο 1-2 times Ο 3-4 times Ο 5 or more times
24. During the past month, when did you receive SNAP benefits? Write in the date: _____________________ or Ο I did not receive SNAP benefits
25. During the past week, how much of the vegetables in your home were thrown away because they spoiled before you and your family could eat them? Ο None Ο Some Ο Half Ο Most Ο All
26. When did you make your last major grocery shopping trip? Ο 0 to 7 days ago Ο 1 to 2 weeks ago Ο 3 to 4 weeks ago Ο More than a month ago

209
27. Where did you shop when you made your last major grocery shopping trip?
Write in the location: ________________________________________
28. Think about your eating habits over the past year or so. About how often do you eat each of the following foods? Remember breakfast, lunch, dinner, snacks and eating out. Check one box for each food.
Less than 1/WEEK
Once a WEEK
2-3 times a WEEK
4-6 times a WEEK
Once a DAY
2+ a DAY
Vegetable juice, like tomato juice, V-8, carrot � � � � � �
Green salad � � � � � �
Potatoes, any kind, including baked, mashed or French fried � � � � � �
Vegetable soup, or stew with vegetables � � � � � �
Any other vegetables, including string beans, peas, corn, broccoli or any other kind
� � � � � �
Beans such as baked beans, pinto, kidney, or lentils (not green beans)
� � � � � �
29. How did you learn about this study? _________________________________________
Thank you for your participation!

210
7.4 Phase 1 US Household Food Security Survey Module: Amended Five-Item Short
Form
U.S. Household Food Security Survey Module: Amended Six-Item Short Form1
These next questions are about the food eaten in your household in the last 12 months, since
November of last year and whether you were able to afford the food you need.
HH3. Please indicate below whether the statement was often true, sometimes true, or never true for
(you/your household) in the last 12 months—that is, since last November.
The first statement is, “The food that we bought just didn’t last, and we didn’t have money
to get more.” Was that often, sometimes, or never true for (you/your household) in the last
12 months?
[ ] Often true
[ ] Sometimes true
[ ] Never true
[ ] DK or Refused
HH4. “We couldn’t afford to eat balanced meals.” Was that often, sometimes, or never true for
(you/your household) in the last 12 months?
[ ] Often true
[ ] Sometimes true
[ ] Never true
[ ] DK or Refused
AD1. In the last 12 months, since last November, did (you/you or other adults in your household)
ever cut the size of your meals or skip meals because there wasn't enough money for food?
[ ] Yes, almost every month
[ ] Yes, some months but not every month
[ ] Yes, only 1 or 2 months
[ ] No
[ ] Don’t know
AD2. In the last 12 months, did you ever eat less than you felt you should because there wasn't enough money for food?
[ ] Yes
[ ] No
[ ] Don’t know
AD3. In the last 12 months, were you every hungry but didn't eat because there wasn't enough
money for food?
[ ] Yes
[ ] No
[ ] Don’t know
1 Score of 0 to 1 indicated high or marginal food security, 2-3 low food security, and 4-5 very low food security.

`211
7.5 Phase 1 Adult Liking
Vegetable Liking
Please use the following scales to tell us how much you like certain vegetables. Place a mark anywhere on the line to show how much you like or dislike that vegetable, from “Greatest possible dislike for any food” to “Greatest possible like for any food.” You can also mark that you have never tried the vegetable.
Broccoli – cooked □ ����� ���
Broccoli – raw □ Never Tried
Carrots – cooked □ ����� ���
Carrots – raw □ ����� ���
Greatest
Possible Dislike
Dislike
Extremely
Dislike
Very Much
Dislike
Moderately
Dislike
Slightly
Neither
Like
Nor
Dislike
Like
Slightly
Like
Moderately
Like Very
Much
Like
Extremely
Greatest
Possible Like
Greatest
Possible Dislike
Dislike
Extremely
Dislike
Very Much
Dislike
Moderately
Dislike
Slightly
Neither
Like
Nor
Dislike
Like
Slightly
Like
Moderately
Like Very
Much
Like
Extremely
Greatest
Possible Like
Greatest
Possible Dislike
Dislike
Extremely
Dislike
Very Much
Dislike
Moderately
Dislike
Slightly
Neither
Like
Nor
Dislike
Like
Slightly
Like
Moderately
Like Very
Much
Like
Extremely
Greatest
Possible Like
Greatest
Possible Dislike
Dislike
Extremely
Dislike
Very Much
Dislike
Moderately
Dislike
Slightly
Neither
Like
Nor
Dislike
Like
Slightly
Like
Moderately
Like Very
Much
Like
Extremely
Greatest
Possible Like

`212
Green Beans – cooked □ ����� ���
Green Beans – raw □ ����� ��� Green Peas – cooked □ ����� ��� Green Peas – raw (sugar snap pea) □ ����� ���
Greatest
Possible Dislike
Dislike
Extremely
Dislike
Very Much
Dislike
Moderately
Dislike
Slightly
Neither
Like
Nor
Dislike
Like
Slightly
Like
Moderately
Like Very
Much
Like
Extremely
Greatest
Possible Like
Greatest
Possible Dislike
Dislike
Extremely
Dislike
Very Much
Dislike
Moderately
Dislike
Slightly
Neither
Like
Nor
Dislike
Like
Slightly
Like
Moderately
Like Very
Much
Like
Extremely
Greatest
Possible Like
Greatest
Possible Dislike
Dislike
Extremely
Dislike
Very Much
Dislike
Moderately
Dislike
Slightly
Neither
Like
Nor
Dislike
Like
Slightly
Like
Moderately
Like Very
Much
Like
Extremely
Greatest
Possible Like
Greatest
Possible Dislike
Dislike
Extremely
Dislike
Very Much
Dislike
Moderately
Dislike
Slightly
Neither
Like
Nor
Dislike
Like
Slightly
Like
Moderately
Like Very
Much
Like
Extremely
Greatest
Possible Like

`213
Cauliflower – cooked □ ����� ��� Cauliflower – raw □ ����� ��� Corn □ ����� ��� Celery – cooked □ ����� ���
Greatest
Possible Dislike
Dislike
Extremely
Dislike
Very Much
Dislike
Moderately
Dislike
Slightly
Neither
Like
Nor
Dislike
Like
Slightly
Like
Moderately
Like Very
Much
Like
Extremely
Greatest
Possible Like
Greatest
Possible Dislike
Dislike
Extremely
Dislike
Very Much
Dislike
Moderately
Dislike
Slightly
Neither
Like
Nor
Dislike
Like
Slightly
Like
Moderately
Like Very
Much
Like
Extremely
Greatest
Possible Like
Greatest
Possible Dislike
Dislike
Extremely
Dislike
Very Much
Dislike
Moderately
Dislike
Slightly
Neither
Like
Nor
Dislike
Like
Slightly
Like
Moderately
Like Very
Much
Like
Extremely
Greatest
Possible Like
Greatest
Possible Dislike
Dislike
Extremely
Dislike
Very Much
Dislike
Moderately
Dislike
Slightly
Neither
Like
Nor
Dislike
Like
Slightly
Like
Moderately
Like Very
Much
Like
Extremely
Greatest
Possible Like

`214
Celery – raw □ ����� ���
Cucumbers □ ����� ��� Red Bell Pepper (or pimiento) – cooked □ ����� ��� Red Bell Pepper (or pimiento) – raw □ ����� ���
Greatest
Possible Dislike
Dislike
Extremely
Dislike
Very Much
Dislike
Moderately
Dislike
Slightly
Neither
Like
Nor
Dislike
Like
Slightly
Like
Moderately
Like Very
Much
Like
Extremely
Greatest
Possible Like
Greatest
Possible Dislike
Dislike
Extremely
Dislike
Very Much
Dislike
Moderately
Dislike
Slightly
Neither
Like
Nor
Dislike
Like
Slightly
Like
Moderately
Like Very
Much
Like
Extremely
Greatest
Possible Like
Greatest
Possible Dislike
Dislike
Extremely
Dislike
Very Much
Dislike
Moderately
Dislike
Slightly
Neither
Like
Nor
Dislike
Like
Slightly
Like
Moderately
Like Very
Much
Like
Extremely
Greatest
Possible Like
Greatest
Possible Dislike
Dislike
Extremely
Dislike
Very Much
Dislike
Moderately
Dislike
Slightly
Neither
Like
Nor
Dislike
Like
Slightly
Like
Moderately
Like Very
Much
Like
Extremely
Greatest
Possible Like

`215
Lettuce □ ����� ��� Spinach – cooked □ ����� ��� Spinach – raw □ ����� ��� Cabbage – cooked □ ����� ���
Greatest
Possible Dislike
Dislike
Extremely
Dislike
Very Much
Dislike
Moderately
Dislike
Slightly
Neither
Like
Nor
Dislike
Like
Slightly
Like
Moderately
Like Very
Much
Like
Extremely
Greatest
Possible Like
Greatest
Possible Dislike
Dislike
Extremely
Dislike
Very Much
Dislike
Moderately
Dislike
Slightly
Neither
Like
Nor
Dislike
Like
Slightly
Like
Moderately
Like Very
Much
Like
Extremely
Greatest
Possible Like
Greatest
Possible Dislike
Dislike
Extremely
Dislike
Very Much
Dislike
Moderately
Dislike
Slightly
Neither
Like
Nor
Dislike
Like
Slightly
Like
Moderately
Like Very
Much
Like
Extremely
Greatest
Possible Like
Greatest
Possible Dislike
Dislike
Extremely
Dislike
Very Much
Dislike
Moderately
Dislike
Slightly
Neither
Like
Nor
Dislike
Like
Slightly
Like
Moderately
Like Very
Much
Like
Extremely
Greatest
Possible Like

`216
Cabbage – raw □ ����� ��� Tomatoes – cooked □ ����� ��� Tomatoes – raw □ ����� ��� Avocado □ ����� ���
Greatest
Possible Dislike
Dislike
Extremely
Dislike
Very Much
Dislike
Moderately
Dislike
Slightly
Neither
Like
Nor
Dislike
Like
Slightly
Like
Moderately
Like Very
Much
Like
Extremely
Greatest
Possible Like
Greatest
Possible Dislike
Dislike
Extremely
Dislike
Very Much
Dislike
Moderately
Dislike
Slightly
Neither
Like
Nor
Dislike
Like
Slightly
Like
Moderately
Like Very
Much
Like
Extremely
Greatest
Possible Like
Greatest
Possible Dislike
Dislike
Extremely
Dislike
Very Much
Dislike
Moderately
Dislike
Slightly
Neither
Like
Nor
Dislike
Like
Slightly
Like
Moderately
Like Very
Much
Like
Extremely
Greatest
Possible Like
Greatest
Possible Dislike
Dislike
Extremely
Dislike
Very Much
Dislike
Moderately
Dislike
Slightly
Neither
Like
Nor
Dislike
Like
Slightly
Like
Moderately
Like Very
Much
Like
Extremely
Greatest
Possible Like

`217
Black Beans □ ����� ��� Brussels Sprouts – cooked □ ����� ��� Brussels Sprouts – raw □ ����� ���
Greatest
Possible Dislike
Dislike
Extremely
Dislike
Very Much
Dislike
Moderately
Dislike
Slightly
Neither
Like
Nor
Dislike
Like
Slightly
Like
Moderately
Like Very
Much
Like
Extremely
Greatest
Possible Like
Greatest
Possible Dislike
Dislike
Extremely
Dislike
Very Much
Dislike
Moderately
Dislike
Slightly
Neither
Like
Nor
Dislike
Like
Slightly
Like
Moderately
Like Very
Much
Like
Extremely
Greatest
Possible Like
Greatest
Possible Dislike
Dislike
Extremely
Dislike
Very Much
Dislike
Moderately
Dislike
Slightly
Neither
Like
Nor
Dislike
Like
Slightly
Like
Moderately
Like Very
Much
Like
Extremely
Greatest
Possible Like

`218
7.6 Phase 1 Child Liking
Child Liking
I’m going to ask you some questions about vegetables that you may or may not have eaten and about meal times with your family and/or friends. Try to answer in the best way you can.
I’m going to ask you to rate how much you like certain vegetables on a scale of 1 to 10 where 1 means
you Hate it and 10 means you Like it a lot.
For example, what is a food you really don’t like, and where would you rate it on the scale?
How about a food you really love? Where would you rate that on the scale?
So that is the same way you should rate how much you like the vegetables I’m going to ask you about.
If you’ve never had the vegetable before then just tell me that.
Broccoli - cooked
Never
had it
1 2 3 4 5 6 7 8 9 10
Hate it It’s okay Like it
a lot
Broccoli – raw
Never
had it
1 2 3 4 5 6 7 8 9 10
Hate it It’s okay Like it
a lot
Carrots - cooked
Never
had it
1 2 3 4 5 6 7 8 9 10
Hate it It’s okay Like it
a lot
Carrots - raw
Never
had it
1 2 3 4 5 6 7 8 9 10
Hate it It’s okay Like it
a lot
Green beans - cooked
Never
had it
1 2 3 4 5 6 7 8 9 10
Hate it It’s okay Like it
a lot

`219
Green beans - raw
Never
had it
1 2 3 4 5 6 7 8 9 10
Hate it It’s okay Like it
a lot
Green peas - cooked
Never
had it
1 2 3 4 5 6 7 8 9 10
Hate it It’s okay Like it
a lot
Green peas – raw (sugar snap peas)
Never
had it
1 2 3 4 5 6 7 8 9 10
Hate it It’s okay Like it
a lot
Cauliflower - cooked
Never
had it
1 2 3 4 5 6 7 8 9 10
Hate it It’s okay Like it
a lot
Cauliflower - raw
Never
had it
1 2 3 4 5 6 7 8 9 10
Hate it It’s okay Like it
a lot
Corn - cooked
Never
had it
1 2 3 4 5 6 7 8 9 10
Hate it It’s okay Like it
a lot

`220
Celery- cooked
Never
had it
1 2 3 4 5 6 7 8 9 10
Hate it It’s okay Like it
a lot
Celery - raw
Never
had it
1 2 3 4 5 6 7 8 9 10
Hate it It’s okay Like it
a lot
Cucumbers - raw
Never
had it
1 2 3 4 5 6 7 8 9 10
Hate it It’s okay Like it
a lot
Red bell pepper (or pimiento) - cooked
Never
had it
1 2 3 4 5 6 7 8 9 10
Hate it It’s okay Like it
a lot
Red bell pepper (or pimiento) - raw
Never
had it
1 2 3 4 5 6 7 8 9 10
Hate it It’s okay Like it
a lot
Lettuce - raw
Never
had it
1 2 3 4 5 6 7 8 9 10
Hate it It’s okay Like it
a lot
Spinach - cooked
Never
had it
1 2 3 4 5 6 7 8 9 10
Hate it It’s okay Like it
a lot

`221
Spinach - raw
Never
had it
1 2 3 4 5 6 7 8 9 10
Hate it It’s okay Like it
a lot
Cabbage - cooked
Never
had it
1 2 3 4 5 6 7 8 9 10
Hate it It’s okay Like it
a lot
Cabbage - raw
Never
had it
1 2 3 4 5 6 7 8 9 10
Hate it It’s okay Like it
a lot
Tomatoes - cooked
Never
had it
1 2 3 4 5 6 7 8 9 10
Hate it It’s okay Like it
a lot
Tomatoes - raw
Never
had it
1 2 3 4 5 6 7 8 9 10
Hate it It’s okay Like it
a lot
Avocado - raw
Never
had it
1 2 3 4 5 6 7 8 9 10
Hate it It’s okay Like it
a lot
Black beans - cooked
Never
had it
1 2 3 4 5 6 7 8 9 10
Hate it It’s okay Like it
a lot

`222
Brussels sprouts - cooked
Never
had it
1 2 3 4 5 6 7 8 9 10
Hate it It’s okay Like it
a lot
Brussels sprouts - raw
Never
had it
1 2 3 4 5 6 7 8 9 10
Hate it It’s okay Like it
a lot

`223
7.7 Phase 1 Behavioral Strategy Questionnaire
Vegetable Strategy Questionnaire
Directions: Please answer the following questions about strategies you can use to get your 9 to 12 year-old child to
eat vegetables. If you have more than one child 9 to 12 years, choose one child and answer these questions about
that child. Mark or circle one response to each question.
Hide vegetables in other foods (like adding pureed squash to spaghetti sauce).
Are you doing this now? � Yes � No
If no, how likely are you to try this? Very unlikely Somewhat unlikely
Neither unlikely nor likely
Somewhat likely
Very likely
Pair vegetables with other foods your child likes (like adding green pepper chunks to spaghetti sauce).
Are you doing this now? � Yes � No
If no, how likely are you to try this? Very unlikely Somewhat unlikely
Neither unlikely nor likely
Somewhat likely
Very likely
Make vegetable more easily available and visible to your child (like having peeled, chopped, ready to eat vegetables easy to see and find in the fridge).
Are you doing this now? � Yes � No
If no, how likely are you to try this? Very unlikely Somewhat unlikely
Neither unlikely nor likely
Somewhat likely
Very likely
Ban junk food at meals.
Are you doing this now? � Yes � No
If no, how likely are you to try this? Very unlikely Somewhat unlikely
Neither unlikely nor likely
Somewhat likely
Very likely
Let your child prepare vegetable dishes, by providing recipes, ingredients, equipment, and/or time.
Are you doing this now? � Yes � No
If no, how likely are you to try this? Very unlikely Somewhat unlikely
Neither unlikely nor likely
Somewhat likely
Very likely
Serve vegetables before the rest of the meal.
Are you doing this now? � Yes � No
If no, how likely are you to try this? Very unlikely Somewhat unlikely
Neither unlikely nor likely
Somewhat likely
Very likely
If your child takes vegetables by herself/himself, increase size of serving spoon. Then your child will take more with each spoonful
Are you doing this now? � Yes � No
If no, how likely are you to try this? Very unlikely Somewhat unlikely
Neither unlikely nor likely
Somewhat likely
Very likely
If you put vegetables on your child’s plate, give her/him bigger servings.
Are you doing this now? � Yes � No
If no, how likely are you to try this? Very unlikely Somewhat unlikely
Neither unlikely nor likely
Somewhat likely
Very likely
Give your child the usual amount of vegetables, but in a bigger dish than needed. This will make the amount look smaller.
Are you doing this now? � Yes � No
If no, how likely are you to try this? Very unlikely Somewhat unlikely
Neither unlikely nor likely
Somewhat likely
Very likely

`224
Use a dinner plate or placemat that shows the right amount of vegetables to eat for a meal. An example is a plate with the MyPlate picture. MyPlate is the current USDA guide for portion sizes.
Are you doing this now? � Yes � No
If no, how likely are you to try this? Very unlikely Somewhat unlikely
Neither unlikely nor likely
Somewhat likely
Very likely
Make sure your child sees other family members eating a lot of vegetables and enjoying them.
Are you doing this now? � Yes � No
If no, how likely are you to try this? Very unlikely Somewhat unlikely
Neither unlikely nor likely
Somewhat likely
Very likely
Show a positive attitude when serving vegetables to your child.
Are you doing this now? � Yes � No
If no, how likely are you to try this? Very unlikely Somewhat unlikely
Neither unlikely nor likely
Somewhat likely
Very likely
Use fun names for vegetables when serving them to your child, like calling peas “Power Peas.”
Are you doing this now? � Yes � No
If no, how likely are you to try this? Very unlikely Somewhat unlikely
Neither unlikely nor likely
Somewhat likely
Very likely
Make vegetables look better with garnishes by adding things like parsley or bread crumbs. You could also use attractive dishes.
Are you doing this now? � Yes � No
If no, how likely are you to try this? Very unlikely Somewhat unlikely
Neither unlikely nor likely
Somewhat likely
Very likely
Serve vegetables in smaller pieces to make them easy to pick up and eat, like cut up, chopped vegetables.
Are you doing this now? � Yes � No
If no, how likely are you to try this? Very unlikely Somewhat unlikely
Neither unlikely nor likely
Somewhat likely
Very likely
Plan dinner meals to routinely include a vegetable or salad. An example is to pair a vegetable side dish with one-dish meals such as pizza or macaroni and cheese.
Are you doing this now? � Yes � No
If no, how likely are you to try this? Very unlikely Somewhat unlikely
Neither unlikely nor likely
Somewhat likely
Very likely

`225
7.8 Phase 1 Home Food Inventory
Home Food Inventory
1. Vegetables
Fresh Can/Jar Frozen
Yes No (mark all that apply)
1 0 a. Asparagus 1 1 1 1 0 b. Avocado 1 1 1 1 0 c. Bamboo shoots 1 1 1 1 0 d. Bean sprouts 1 1 1 1 0 e. Beets 1 1 1 1 0 f. Bell peppers (e.g. pimiento, green, red) 1 1 1 1 0 g. Bok choy 1 1 1 1 0 h. Broccoli 1 1 1 1 0 i. Brussels sprouts 1 1 1 1 0 j. Cabbage (e.g. includes sauerkraut,
coleslaw) 1 1 1
1 0 k. Cauliflower 1 1 1 1 0 l. Carrots 1 1 1 1 0 m. Celery 1 1 1 1 0 n. Corn (e.g. includes hominy) 1 1 1 1 0 o. Cucumbers 1 1 1 1 0 p. Edamame 1 1 1 1 0 q. Green beans 1 1 1 1 0 r. Jicama 1 1 1 1 0 s. Lettuce (e.g. romaine, endive, iceberg) 1 1 1 1 0 t. Mushrooms 1 1 1
1 0 u. Okra 1 1 1
1 0 v. Onions 1 1 1
1 0 w. Peas (e.g. green, snap peas, snow peas) 1 1 1
1 0 x. Plantains 1 1 1
1 0 y. Potatoes (e.g. fresh, frozen, box mixes,
salad) 1 1 1
1 0 z. Spinach/other greens (e.g. collard,
mustard, turnip, kale)
1 1 1
1 0 aa. Soup (e.g. vegetable, tomato) 1 1 1
1 0 bb. Squash (example: butternut, zucchini) 1 1 1
Fresh Can/Jar Frozen
1 0 cc. Sweet Potatoes/Yams 1 1 1
1 0 dd. Tomatoes (e.g. includes in mixed dishes
and prepared main dishes, pasta sauce, salsa)
1 1 1
1 0 ee. Mixed vegetables 1 1 1
1 0 ff. Water chestnuts 1 1 1
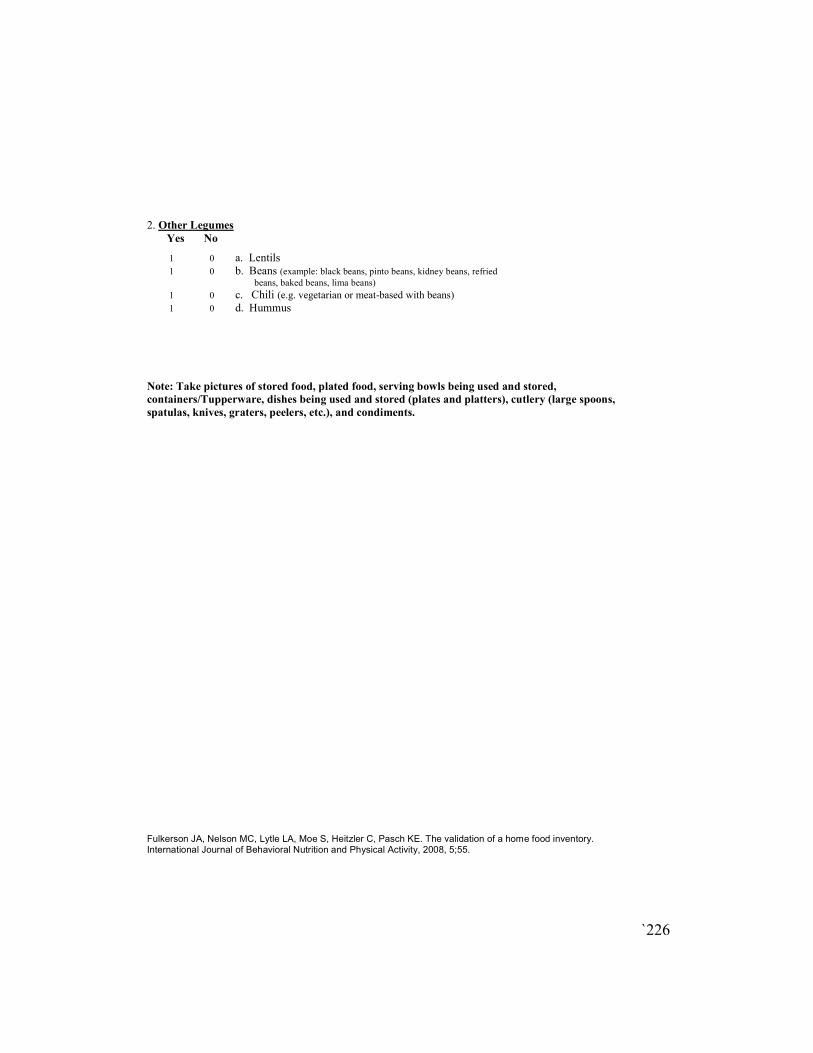
`226
Fulkerson JA, Nelson MC, Lytle LA, Moe S, Heitzler C, Pasch KE. The validation of a home food inventory. International Journal of Behavioral Nutrition and Physical Activity, 2008, 5;55.
2. Other Legumes
Yes No
1 0 a. Lentils 1 0 b. Beans (example: black beans, pinto beans, kidney beans, refried
beans, baked beans, lima beans)
1 0 c. Chili (e.g. vegetarian or meat-based with beans) 1 0 d. Hummus
Note: Take pictures of stored food, plated food, serving bowls being used and stored,
containers/Tupperware, dishes being used and stored (plates and platters), cutlery (large spoons,
spatulas, knives, graters, peelers, etc.), and condiments.

`227
7.9 Phase 1 Observation Checklist Form
Observation Checklist
Instructions: As the researcher completes the checklist items, questions involving a child should be completed
with the 9-12 year-old child in the home in mind. Add notes to further explain responses.
1. Observation of Food Preparation Area Physical Layout Yes No Don’t
Know
Is appropriate kitchen equipment present to prepare vegetables? (Record by observation, and ask if not seen)
Knives
Peelers
Strainers
Brushes
Blenders
Food Processors
Cutting Boards
Steamers
Other:
Notes: (Whether equipment enables child to help)
Are the vegetables and related ingredients to be used for the meal easily accessible? Notes: (Decisions or changes in plans related to what is readily available in home)
�
�
�
Is the kitchen flow (proximity of sink, counter space, appliances) conducive to vegetable preparation? Notes: (How is the kitchen flow conducive or how not conducive?)
Assess the adequacy of the space for food preparation for the preparer, and the preparer and child. For the Preparer - Circle: Cramped…Adequate…More than adequate
For the Preparer and child – Circle: Cramped…Adequate…More than adequate
�
�
�
Assess the level of sanitation for food preparation - is it adequate for the participation of the child? Notes: (dish towels, cloths, soap use, cleanliness of surfaces, cleaning behaviors, handling of meats)
� � �
2. Meal Planning & Food Selection Yes No DK
(Observe, but if necessary ask respondent )When was the menu for this occasion decided upon? Circle: At the time of meal…Within an hour prior…Within 4 hours prior…The day of the meal… The day before…3-5 days before…A week before…More than a week before. (Observe, but if necessary ask respondent) What specific dishes were planned for this occasion? Circle: The main dish(es)…Side dish(es)…Salad(s)…Dessert(s)…Other dishes
Did the child have any influence in deciding what vegetables will be served today? Notes: (How, and assess extent child influence and/or involvement)
� � �

`228
3. Meal Preparation Yes No DK
Describe vegetable preparation for this meal - If more than one, note preparation method for each: cleaned, chopped, sliced, boiled, fried, sautéed, baked, other (specify) ______________________________________________________________________________________ ______________________________________________________________________________________ How much time did it take to prepare all of the vegetables to be served? __________minutes
Is the child helping with vegetable preparation during meal preparation? Notes: (Assess feasibility of child involvement, note tasks child is doing – cleaning, chopping, etc.)
� � �
Are the vegetables prepared so they are more kid friendly? Notes: (E.g. cut into small, convenient finger foods as appropriate?)
� � �
Are vegetables being mixed with other foods the child likes? Notes: (overt/covert incorporation)
�
�
�
Are the vegetables served with positive parental interaction: Notes: (e.g. with a smile, etc.)
�
�
�
4. Serving the Meal Yes No DK
Were any foods served ahead of the meal to the child? Notes: (Explain the order of foods served)
�
�
�
Are vegetables being served in ways that children can’t avoid them (hidden in sauces, part of well-liked dishes – e.g., on pizza)? Notes: (If so, how?)
�
�
�
Describe the vegetables serving container(s) Circle and Note size (S, M, L) and “fullness” (¼, ½, ¾, or full) : Plate/platter, Size ________, Fullness _______… Bowl, Size ________, Fullness _______…. Pan/skillet, Size _________,Fullness _______…. Other, Type ________, Size ________, Fullness _______ Describe serving utensils type and size: Circle and Note: Spoon(s), Size _________…Fork(s), Size ________…. Other, Type ________, Size _________ Notes: (portion size manipulation, labeling dinnerware, take pictures of dinner plates when full before
consumption with ruler in background to estimate plate size)
How is the meal served?
Circle: Family Style….Buffet Style….Pre-Plated…..Other ______________
Notes: (portion size manipulation, norms, accessibility)

`229
Are foods served to children by a parent? Notes: (portion size manipulation, norms, accessibility)
�
�
�
5. Eating the Meal Yes No DK
Did the adult eat the vegetables? Describe type, amount): Type___________ Amount Circle: None…1/4…1/2…3/4…All…Seconds
Type___________ Amount Circle: None…1/4…1/2…3/4…All…Seconds
Type___________ Amount Circle: None…1/4…1/2…3/4…All…Seconds
Type___________ Amount Circle: None…1/4…1/2…3/4…All…Seconds Notes: (Other observations with respect to amount eaten)
� � �
Did the child eat the vegetables? Describe type, quantity): Type___________ Amount Circle: None…1/4…1/2…3/4…All…Seconds
Type___________ Amount Circle: None…1/4…1/2…3/4…All…Seconds
Type___________ Amount Circle: None…1/4…1/2…3/4…All…Seconds
Type___________ Amount Circle: None…1/4…1/2…3/4…All…Seconds Notes: (Other observations with respect to amount eaten)
� � �
Did family members (parents and siblings, etc) role model eating and enjoying vegetables? Notes: (How, instituting norms)
� � �
Was vegetable consumption by the child expected? Notes: (Describe how this was assessed - instituting norms)
� � �
Other things that are observed that may affect vegetables being served or consumed?
�
�
�
General Meal Observations
What Foods Were Served (List, and circle that contained vegetables) Appetizer(s) ___________________________________________________________
Salad(s) ___________________________________________________________ Main Dish(es) ___________________________________________________________
Side Dishes ___________________________________________________________ Dessert ___________________________________________________________
Who Was Present? Adults ___________________________________________________________ Children ___________________________________________________________
Where Meal Was Served and Consumed?
Circle: Kitchen…Dining room…Family room...Living room…Deck/Patio…Bedroom… Other Location ______________
Table…Counter…Tray(s)….Other______________

`230
Did they all eat together? ___________________________________________________________
When Meal Was Served?
Day of Week _______________ Time of Day _______________ How Long Did the Meal Take to Eat? __________________ Situational Factors/Distractions:
TV on in eating area Yes No _________________________ TV on in other room in home Yes No _________________________ Radio/Music playing Yes No _________________________ Members coming and going Yes No _________________________ Members rushed, need to eat/finish quickly Yes No _________________________ Telephone/texting interruption(s) Yes No _________________________ Other (Specify) __________________________________________________________
Other information of interest concerning the meal:
______________________________________________________________________________ ______________________________________________________________________________
______________________________________________________________________________

`231
7.10 Phase 1 Adult Interview Guide
Adult Interview Questions
Inform the participant that the following questions should be answered with their 9-12 year-old child in
mind.
Typical Dinner Meals
1. Tell me about how you decided what to prepare for dinner tonight? Talk me through the process.
2. How did you decide whether or not you would include vegetables? This includes vegetables that may
have been an ingredient in your meal such as tomato sauce or potato salad.
PROBE (If Some): Why did you decide to serve vegetables? How did you decide to serve these
vegetables specifically?
PROBE (If None): Tell me more about why you did not serve vegetables tonight? What would have
encouraged you to include vegetables?
a. What if you had more time – would anything change?
b. What if you had more money – would anything change?
3. (Optional Questions) If vegetables were served:
a. What did you think about the vegetables served during tonight’s meal?
b. What did your child think about the vegetables served during tonight’s meal?
3. How would you compare the meal you had tonight to the dinner meals you would typically prepare on a
weekday? Describe a typical dinner in your home.
PROBE: How was this meal like and/or different from what you would normally prepare for dinner
(where you eat, who you eat with, what you’re eating, time you have to eat)?

`232
Vegetable Preferences
4. Which vegetables do you like/dislike? Why?
5. Which vegetables do your child like/dislike? Why?
6. In general, how do you decide which vegetables to serve during dinner meals (eg. time constraints,
money constraints, taste, pleasure, hunger, other people’s influence, brand preference, deal, coupons,
ads, health-related)
PROBE: What role does everyone play in the decision? Talk me through this process.
7. What happens when you serve a vegetable that you do not like? How do you decide whether or not you
would eat it?
PROBE: Give an example of a time when you prepared a vegetable you did not like for dinner and
whether or not you ate the vegetable? How did you make this decision?
8. What happens if you serve a vegetable that your child does not like? How does your child decide
whether or not they will eat them?
PROBE: Give an example of a time when you prepared a vegetable that your child did not like for
dinner and whether or not they ate the vegetable? How did they make this decision?
9. Tell me about any challenges you have faced when trying to encourage your child to eat vegetables?
a. If none, then, what do you recommend to other parents if their children do not like vegetables?

`233
10. What are some things you have done or could do to encourage your child to eat vegetables at the dinner
meal?
PROBE: Which have been or could be most effective?
11. What role does your child play in preparing dinner?
PROBE: Does your child help you make dinner?
a. If yes, can you give some examples of what they do?
b. If no, do you think they would like to? And what might he/she be interested in doing?
Food Shopping
12. Who typically does the grocery shopping in the household? Anyone else go with _________?
PROBE: What about the child?
a. How does your child influence the types of vegetables that are purchased for the home?
b. Do you think having your child choose which vegetables they want at the store will encourage
them to eat more vegetables? Tell me more about this.
13. When shopping for vegetables, how do you decide what to buy (eg. Coupons, prices, quality, taste)?

`234
7.11 Phase 1 Child Interview Guide
Child Interview Questions
1. (Assuming the Child Liked A Vegetable) Tell me what you like about eating
_________________ ( select 1-2 vegetables from above)?
PROBE: What is it about ____________________ t hat you like?
2. In general, how do you like your vegetables prepared?
PROBE: What is it that makes you like your vegetables prepared this way?
3. (Assuming the Child Disliked a Vegetable) Tell me what you dislike about eating
_________________ ( select 1-2 vegetables from above)?
PROBE: What is it about ____________________ t hat you dislike?
4. Tell me about a time you ate a vegetable that you did not like, but ate it anyways.
PROBE: Why did you eat it?
5. Tell me about a vegetable that you did not like when you first tried it, but then tried it
later and you liked it?
PROBE: What do you think changed your mind about eating the vegetable?
6. With this in mind, thinking about some of the vegetables you listed that you do not like,
what would make you like those vegetables more?
PROBE: For example, you listed that you do not like _________________, what would
make you like eating that vegetable more.
7. What do you think about trying new vegetables?
PROBE: If offered a new vegetable, how do you decide whether or not to try it?
8. Tell me what it’s like when you eat vegetables at home with your family?
PROBE: How are vegetables served (eg. Self served, etc.)
PROBE: Do you ever add anything to the vegetables served (eg. Sauces, dips, etc.)

`235
9. What role do you play in what vegetables are served during meal times?
10. Tell me about any rules your parents have about eating vegetables?
Anything else I should know about what you think about vegetables?

`236
7.12 Phase 1 Sample Strategy Analysis Sheets
Researcher Name________________________
Participant Code_________________________
1
Dinner Observation Analysis12
1. Hide (covertly) vegetables in other foods (like adding pureed squash to spaghetti sauce).
Document Consider Notes
Demographic Form 1. Age of child 2. Are there other children in
the home?
Home Food Inventory Vegetables available that the child indicated they did not like (see Child Liking)
Observation Checklist 1. Equipment: At minimum a knife (possibly a blender and food processor)
2. Did the child have any influence in deciding what vegetables will be served today?
3. Is the child helping with vegetable preparation during meal preparation?
4. Are vegetables being served in ways that children can’t avoid them (hidden in sauces, part of well-liked dishes – e.g., on pizza)?
Adult Interview Refer to codes
Child Interview Refer to codes
Child Vegetable Liking Look at vegetables the child does not like (indicated by a score <5). Consider the vegetables the child does not like can be easily hidden
Field Notes Anything not picked up on recording devices but worth noting
Is this strategy feasible?
1 2 3 4 5
Not at all Very feasible
1 This document will be completed for each family

`237
7.13 Phase 2 Dinner Vegetable Record Form
Please do not show or discuss this record with your child.
Daily Food Record
Directions: (1) Record only on days your child eats dinner at home. (2) Complete this Record immediately after your child goes to bed.
Child name: ______________________________
Date: ____________________________________
Day of the week (Circle):
Monday Tuesday Wednesday Thursday Friday Saturday Sunday
Did your child eat a vegetable at home on the day you circled above?
Yes No
List each vegetable your child ate and how much your child ate.
_______________________________________________________________ _______(meal)
(Χιρχλε Ονε) � χυπ … χυπ χυπ 1 χυπ 1 χυπσ 2 χυπσ 2 χυπσ 3 χυπσ
_____________________________________________________________ ________ (meal)
(Χιρχλε Ονε) � χυπ … χυπ χυπ 1 χυπ 1 χυπσ 2 χυπσ 2 χυπσ 3 χυπσ
_____________________________________________________________ ________ (meal)
(Circlε Ονε) � χυπ … χυπ χυπ 1 χυπ 1 χυπσ 2 χυπσ 2 χυπσ 3 χυπσ
___________________________________________________________ __________ (meal)
(Χιρχλε Ονε) � χυπ … χυπ χυπ 1 χυπ 1 χυπσ 2 χυπσ 2 χυπσ 3 χυπσ
________________________________________________ _____________________ (meal)
(Χιρχλε Ονε) � χυπ … χυπ χυπ 1 χυπ 1 χυπσ 2 χυπσ 2 χυπσ 3 cups

`238
7.14 Phase 2 Weekly Record Follow Up
1
Weekly Strategy Record Script-Follow-up Call
Participant ID: _______ Week ______(# 1-6)
Date and Day of phone call: __________________________ __________________________
Strategy introduced the previous week: ___________________________________________
Date and Day strategy was assigned: _____________________________________________
Introduction
I would like to check in with you about the strategy we asked you to use last week.
1. Since, ________________ (day or date), can you tell me how many days you tried this
idea?
1: (day and date), (yes, no, maybe)
2:
3:
2. How difficult was it to do this on a scale from 1 to 10 (1 being not difficult, 10 being
very difficult)? Why did you rate it a ________?
3. Can you briefly tell me how you did this? I would love to hear some examples of how
you _________________ (insert strategy).
4. (facilitators): What were some things that helped you _______________________
(strategy)?
Preparation (Choose 1)
SEE PROBES FOR STRATEGY
5. (barriers): What were some things that kept you from ______________________
(strategy)?
Cost (Choose 1)
a. What was the most challenging thing about trying the strategy this week?

`239
2
o If money was a barrier ask, “if I gave you an unlimited credit card and you could buy whatever food you wanted at the grocery store, do you think you would do the strategy regularly.”
o If time was a barrier asks, “what if you had more time and were not as rushed, could you see yourself doing this strategy regularly.” Why or why not?
SEE PROBES FOR STRATEGY
6. How would you compare dinner tonight regarding your use of this strategy, to what you
would normally do for dinner?
7. What made this strategy easier than the others?
8. What made this strategy harder than others?
9. Could you see yourself continuing to use this strategy after the study? Why or Why not?
If not, what could be done to encourage you and/or help you be able to do this strategy on a regular basis?
10. When did you fill out the green record sheets last week?
Probe: Did you do it at the end of the week or the day you completed the strategy
(intervention)/prepared dinner (control)?
11. Tell me about any other strategies you used this week.
NOTES
CLOSING
Thank you for talking with me today. You have been very helpful. I need to schedule another
call/home visit with you for one week from now. (Schedule next call/visit.)

`240
7.15 Phase 2 Strategy Guide

`241

`242

`243
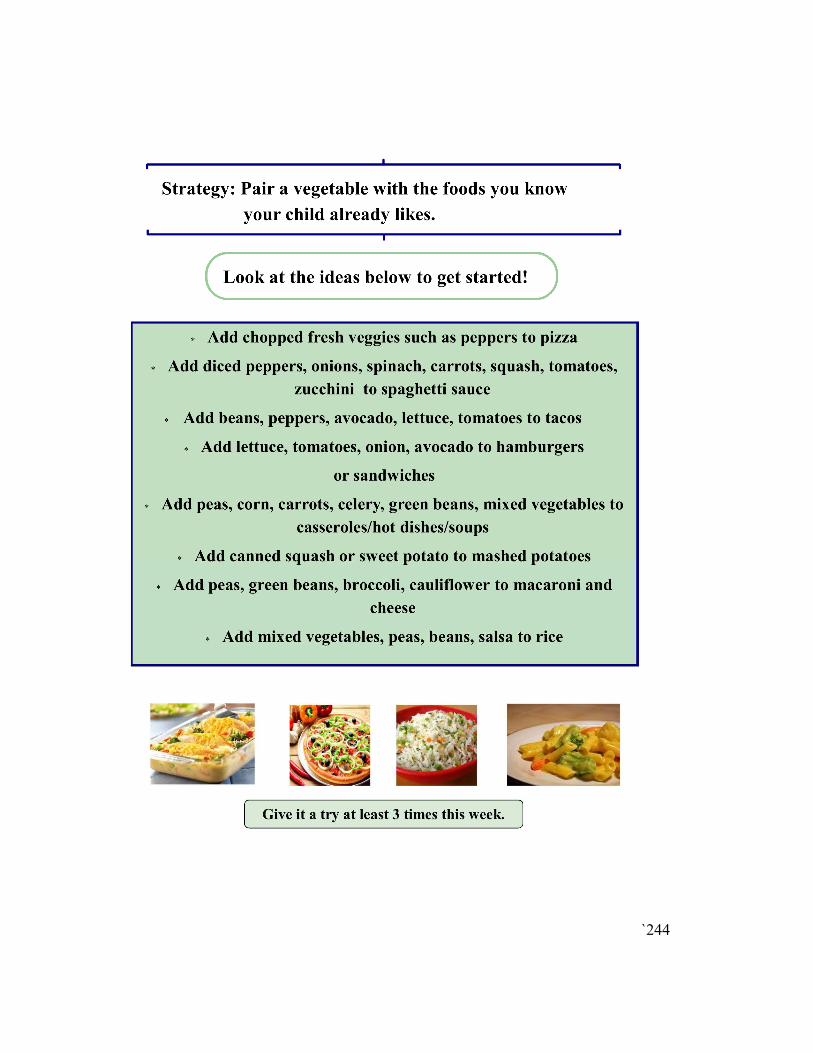
`244

`245

`246

`247

`248

`249

`250
7.16 Phase 2 Demographic Questionnaire
Demographic Form
1. How old are you? ________ years
2. Are you a man or a woman? � Man � Woman
3. What is your ethnicity? (Check one only) � Hispanic or Latino � Not Hispanic or Latino
4. What is your race? (Check all that apply) � Black or African American � White � Alaska native or American Indian � Asian � Native Hawaiian or other Pacific Islander � Other ___________________________
5. What language do you speak at home? (Check one only) � Only English � Mostly English � English and another language about the same � Mostly another language � Only another language � Other ______________________________
6. How long have you lived in the U.S.? (Check one only) � 1-5 years � 6-10 years � More than 10 years
7. What is your highest level of formal education? (Check one only)
� Have not completed high school � Received high school diploma or GED � Some college or technical school � 4-year college, university degree or advanced degree
8. Which of the following best describes your employment status? (Check all that apply) � Homemaker � Not employed � Employed part-time � Employed full-time � Retired
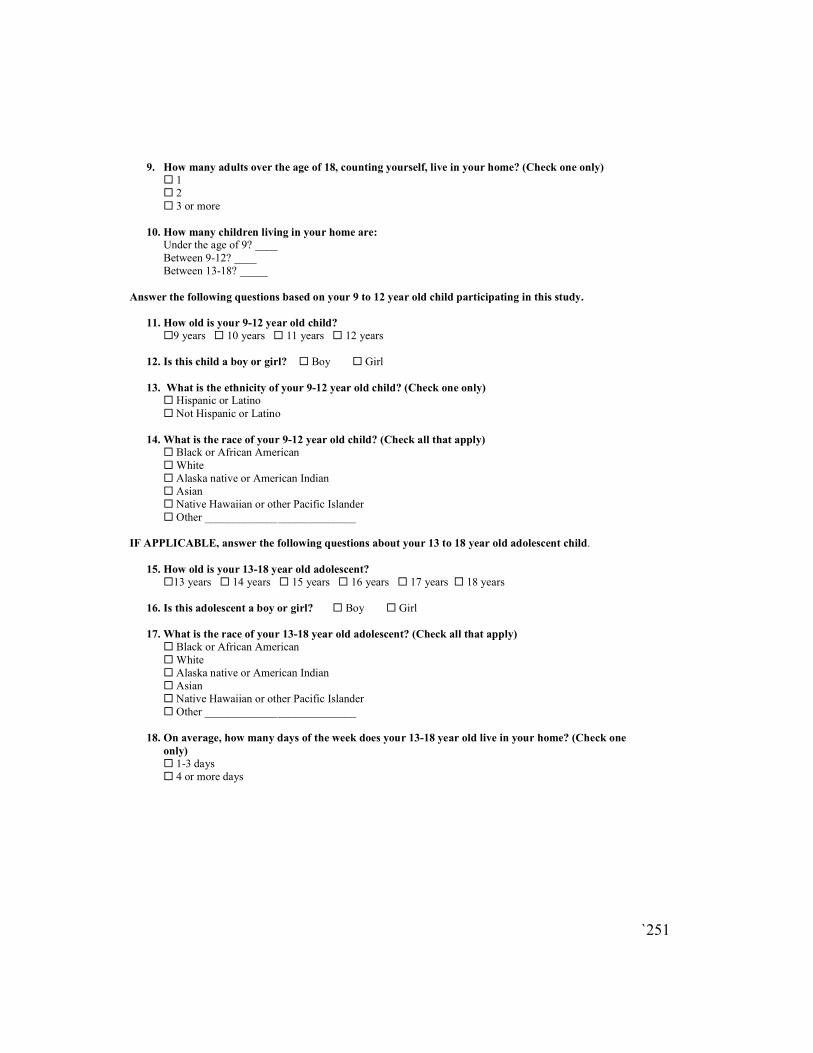
`251
9. How many adults over the age of 18, counting yourself, live in your home? (Check one only) � 1 � 2 � 3 or more
10. How many children living in your home are: Under the age of 9? ____ Between 9-12? ____ Between 13-18? _____
Answer the following questions based on your 9 to 12 year old child participating in this study.
11. How old is your 9-12 year old child?
�9 years � 10 years � 11 years � 12 years
12. Is this child a boy or girl? � Boy � Girl
13. What is the ethnicity of your 9-12 year old child? (Check one only) � Hispanic or Latino � Not Hispanic or Latino
14. What is the race of your 9-12 year old child? (Check all that apply) � Black or African American � White � Alaska native or American Indian � Asian � Native Hawaiian or other Pacific Islander � Other ___________________________
IF APPLICABLE, answer the following questions about your 13 to 18 year old adolescent child.
15. How old is your 13-18 year old adolescent?
�13 years � 14 years � 15 years � 16 years � 17 years � 18 years
16. Is this adolescent a boy or girl? � Boy � Girl
17. What is the race of your 13-18 year old adolescent? (Check all that apply) � Black or African American � White � Alaska native or American Indian � Asian � Native Hawaiian or other Pacific Islander � Other ___________________________
18. On average, how many days of the week does your 13-18 year old live in your home? (Check one
only) � 1-3 days
� 4 or more days

`252
Answer the following questions about grocery shopping.
19. When did you make your last major grocery shopping trip? (Check one only)
� 0 to 7 days ago � 1 to 2 weeks ago � 3 to 4 weeks ago � More than a month ago
20. Are you or your family members participating in the following programs? (Check all that apply) � WIC � SNAP (Supplemental Nutrition Assistance Program) or formerly called Food stamps � Free/reduced priced school lunch � Food shelves, meals, or other food distribution programs � None
21. During the past month, when did you receive SNAP benefits?
Write in the date: _____________________ or � I did not receive SNAP benefits
22. During the past 7 days how many times did you eat vegetables other than white potatoes? (Check one
only.) � I did not eat vegetables other than white potatoes during the past 7 days � 1 to 3 times during the past 7 days � 4 to 6 times during the past 7 days � 1 time per day � 2 times per day � 3 times per day
23. On the days you eat vegetables, on average how much do you eat? (Check one only)
� � χυπ � ¼ cup � ½ cup � 1 cup � 1½ cups � 2 cups � 2 ½ cups � 3 cups 24. How did you learn about this study?
________________________________________ _
Thank you for your participation!

`253
7.17 Phase 2 Caregiver Vegetable Liking/Variety Questionnaire
Caregiver Vegetable Liking/Variety Questionnaire
Directions: We are going to ask how much you like a variety of vegetables and how often you
eat them.
1. You will see this box next to each vegetable to mark if you have eaten the vegetable in the
past month:
Please remember to include vegetables in casseroles, soups, and other mixed dishes.
2. Then we will ask you to rate how much you like the vegetable on a scale of 1 to 10. Circle a
number where 1 means you Hate it and 10 means you Like it a lot. Circle Never had it if you
have never eaten the vegetable.
Never
had it
1 2 3 4 5 6 7 8 9 10
Hate
it
It’s okay Like it
a lot
Artichoke
Never
had it
1 2 3 4 5 6 7 8 9 10
Hate
it
It’s okay Like it
a lot
Asparagus
Never
had it
1 2 3 4 5 6 7 8 9 10
Hate
it
It’s okay Like it
a lot
□ Yes □ No □ Don't Know
□ Yes □ No □ Don't Know
□ Yes □ No □ Don't Know

`254
The same format is used for the following vegetables:
Bean sprouts, beans- black beans, beans- other (bean dishes, kidney, lentil, hummus), beets, broccoli, Brussels sprouts, cabbage, cauliflower, carrots, celery, corn, cucumber, edamame, eggplant, greens (spinach, collard, bok choy, kale), green beans, jicama, lettuce, mixed
vegetables, onion, peas, pepper (rec, orange, green, hot), plantain, potato, root vegetables (yucca, radish, rutabaga, parsnip, turnip, taro), soup (vegetable or tomato), squash, sweet potato/yam, tomatillo, tomato, water chestnuts
!

`255
7.18 Phase 2 Child Vegetable Liking Questionnaire
!
Child Vegetable Liking
I’m going to ask you to rate how much you like certain vegetables on a scale of 1 to 10 where 1 means you Hate it and 10 means you Like it a lot.
For example, what is a food you really don’t like, and where would you rate it on the scale?
How about a food you really love? Where would you rate that on the scale?
So that is the same way you should rate how much you like the vegetables I’m going to ask you about. If you’ve never had the vegetable before then just tell me that.
Artichoke
Never
had it
1 2 3 4 5 6 7 8 9 10
Hate
it
It’s okay Like it
a lot
Asparagus
Never
had it
1 2 3 4 5 6 7 8 9 10
Hate
it
It’s okay Like it
a lot
Avocado/guacamole
Never
had it
1 2 3 4 5 6 7 8 9 10
Hate
it
It’s okay Like it
a lot
Bamboo shoots
Never
had it
1 2 3 4 5 6 7 8 9 10
Hate
it
It’s okay Like it
a lot
Bean sprouts
Never
had it
1 2 3 4 5 6 7 8 9 10
Hate
it
It’s okay Like it
a lot

`256
The same format is used for the following vegetables:
Bean sprouts, beans- black beans, beans- other (bean dishes, kidney, lentil, hummus), beets, broccoli, Brussels sprouts, cabbage, cauliflower, carrots, celery, corn, cucumber, edamame, eggplant, greens (spinach, collard, bok choy, kale), green beans, jicama, lettuce, mixed
vegetables, onion, peas, pepper (rec, orange, green, hot), plantain, potato, root vegetables (yucca, radish, rutabaga, parsnip, turnip, taro), soup (vegetable or tomato), squash, sweet potato/yam, tomatillo, tomato, water chestnuts
!

`257
7.19 Phase 2 Child Physical Activity Form
1
PHYSICAL ACTIVITY FORM
The Eating at Home FOR Kids (or FORK) Study
This survey is about health behavior. It has been developed so you can tell us what you do
that may affect your health. The information you give will be used to improve health
education for young people like yourself. Please read each question below and circle your
answer.
1. During the past 7 days, on how many days were you physically active for a total of at
least 60 minutes per day? (Add up all the time you spent in any kind of physical activity that increased your heart rate and made you breathe hard some of the time.) A. 0 days B. 1 day C. 2 days D. 3 days E. 4 days F. 5 days G. 6 days H. 7 days
2. On how many of the past 7 days did you do exercises to strengthen or tone your
muscles, such as push-ups, sit-ups, or weight lifting?
A. 0 days B. 1 day C. 2 days D. 3 days E. 4 days F. 5 days G. 6 days H. 7 days
3. On an average school day, how many hours do you watch TV? A. I do not watch TV on an average school day B. Less than 1 hour per day C. 1 hour per day D. 2 hours per day E. 3 hours per day F. 4 hours per day G. 5 or more hours per day

`258
2
4. On an average school day, how many hours do you play video or computer games or use a computer for something that is not school work? (Count time spent on things such as Xbox, PlayStation, an iPod, an iPad or other tablet, a smartphone, YouTube, Facebook or
other social networking tools, and the Internet.)
A. I do not play video or computer games or use a computer for something that is not school work
B. Less than 1 hour per day C. 1 hour per day D. 2 hours per day E. 3 hours per day F. 4 hours per day G. 5 or more hours per day
5. In an average week when you are in school, on how many days do you go to physical education (PE) classes?
A. 0 days B. 1 day C. 2 days D. 3 days E. 4 days F. 5 days
6. During the past 12 months, on how many sports teams did you play? (Count any teams run by your school or community groups.)
A. 0 teams B. 1 team C. 2 teams D. 3 or more teams

`259
7.20 Phase 2 Home Vegetable Inventory
Home Food Inventory
Fresh (#, unit: such as
small, medium, large
or estimate how much
in cups)
Can/Jar (#, unit) Frozen (#, unit)
a. Artichoke
b. Asparagus
c. Avocado/guacamole
d. Bamboo shoots
e. Bean sprouts
f. Beans (black, pinto,
kidney, navy, white, refried, baked, lima,
soy, black-eyed,
garbanzo/chickpea,
hummus, lentils, split peas)
g. Beets
h. Broccoli
i. Brussels sprouts
j. Cabbage (sauerkraut,
coleslaw)
k. Cauliflower
l. Carrots
m. Celery
n. Corn (hominy)
o. Cucumbers (pickles)
Directions: Look through refrigerator, freezer, cupboards, and pantries. When a vegetable is present,
write the number of units on the first line and describe the units on the second line (i.e. Artichoke: 2
Heads, Beans: 6 15 oz. cans). Be sure to ask if there is food somewhere else in the home besides the
kitchen.

`260
2
Fresh (#, unit: such as
small, medium, large
or estimate how much
in cups)
Can/Jar (#, unit) Frozen (#, unit)
p. Edamame
q. Eggplant
r. Greens (spinach,
collard, mustard,
turnip, kale, bok choy)
s. Green beans (snap,
string, wax)
t. Jicama
u. Lettuce ( romaine, endive, iceberg)
v. Mixed vegetables
w. Okra
x. Onions (white, red, green, leek)
y. Peas (green, snap
peas, snow peas)
z. Peppers (red, green,
hot)
aa. Plantains
bb. Potatoes - white/russet
(fries, box mixes, hash
browns, potato salad)
cc. Root vegetables –
other than potatoes
(yucca/cassava, yautia, taro, rutabaga, parsnip, turnip, radish)
dd. Soup (vegetable,
tomato)
ee. Squash (butternut, acorn, pumpkin, zucchini)
ff. Sweet potatoes/yams
gg. Tomatillos

`261
3
Fresh (#, unit: such as
small, medium, large
or estimate how much
in cups)
Can/Jar (#, unit) Frozen (#, unit)
hh. Tomatoes (tomato
sauce, canned tomatoes, salsa,
spaghetti sauce, pizza
sauce, tomato juice, in mixed dishes
ii. Water chestnuts
Other
Other
Other
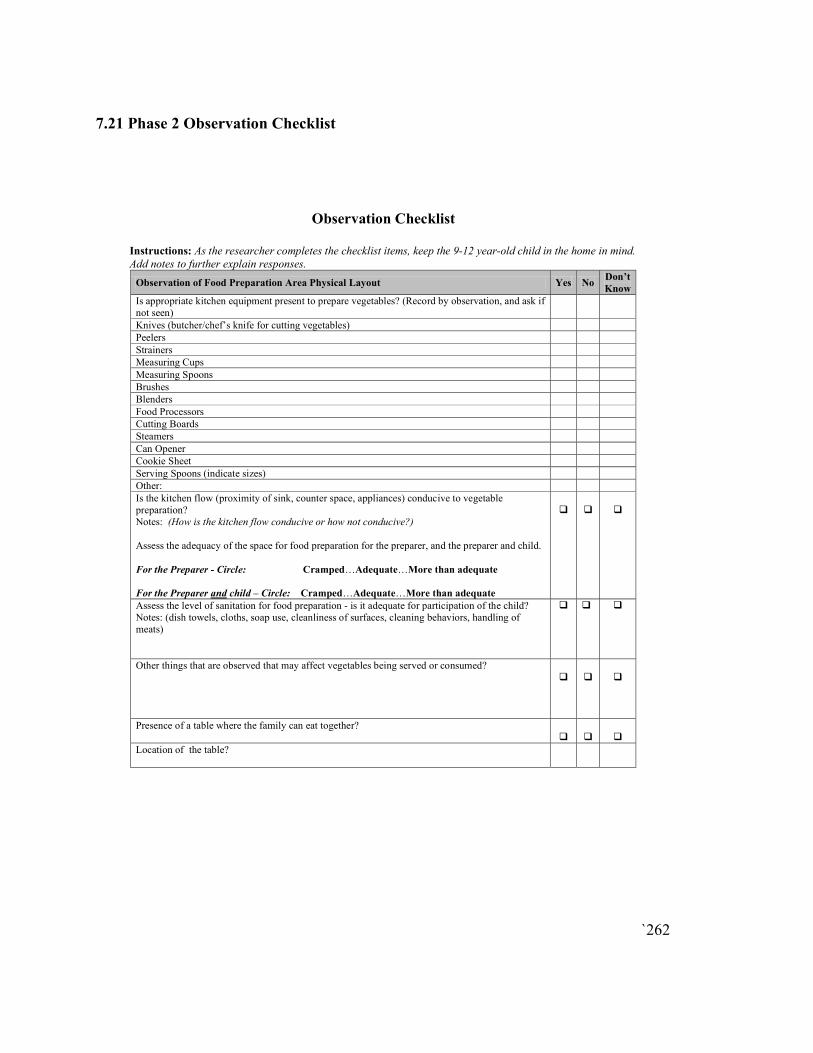
`262
7.21 Phase 2 Observation Checklist
Observation Checklist
Instructions: As the researcher completes the checklist items, keep the 9-12 year-old child in the home in mind.
Add notes to further explain responses.
Observation of Food Preparation Area Physical Layout Yes No Don’t
Know
Is appropriate kitchen equipment present to prepare vegetables? (Record by observation, and ask if not seen)
Knives (butcher/chef’s knife for cutting vegetables)
Peelers
Strainers
Measuring Cups
Measuring Spoons
Brushes
Blenders
Food Processors
Cutting Boards
Steamers
Can Opener
Cookie Sheet
Serving Spoons (indicate sizes)
Other:
Is the kitchen flow (proximity of sink, counter space, appliances) conducive to vegetable preparation? Notes: (How is the kitchen flow conducive or how not conducive?)
Assess the adequacy of the space for food preparation for the preparer, and the preparer and child. For the Preparer - Circle: Cramped…Adequate…More than adequate
For the Preparer and child – Circle: Cramped…Adequate…More than adequate
�
�
�
Assess the level of sanitation for food preparation - is it adequate for participation of the child? Notes: (dish towels, cloths, soap use, cleanliness of surfaces, cleaning behaviors, handling of meats)
� � �
Other things that are observed that may affect vegetables being served or consumed?
�
�
�
Presence of a table where the family can eat together?
�
�
�
Location of the table?

`263
7.22 Phase 2 Exit Questionnaire
!
Exit Questionnaire
Household Characteristics
1. How many adults over the age of 18, counting yourself, live in your home? 1
2
3 or more
2. How many children living in your home are?
Under the age of 9? ____
Between 9-12? ____
Between 13-18? _____
3. Which of the following best describes your employment status? (Check all that apply)
Homemaker
Not employed
Employed part-time Employed full-time
Retired
4. Are you or your family members participating in the following programs? (Check all
that apply)
WIC
SNAP (Supplemental Nutrition Assistance Program) or formerly called Food stamps
Summer food program Free/reduced priced school lunch
Food shelves, meals, or other food distribution programs
None
5. During the past month, when did you receive SNAP benefits?
Date: _____________________ or I did not receive SNAP benefits
6. Which of the following has your child attended since our first in home visit? We are only interested in programs attended while in the study.
Summer school
Summer overnight camp
Summer day camp After school program
Traditional School
Year Around School
Home School

`264
!
Adult Intake
7. During the past 7 days how many times did you eat vegetables other than white
potatoes? (Check one only.)
I did not eat vegetables other than white potatoes during the past 7 days
1 to 3 times during the past 7 days
4 to 6 times during the past 7 days
1 time per day 2 times per day
3 times per day
8. On the days you eat vegetables, on average how much do you eat? (Check one only)
⅛ cup
¼ cup
½ cup
1 cup 1½ cups
2 cups
2 ½ cups 3 cups
Intervention Families
9. Did your child notice that you were doing any of the strategies?
Yes No
I don’t know
10. Compared to before the study, which of the strategies helped your 9-12 year old to eat more vegetables? (Check all that apply)
Prepare a vegetable that is new to your child.
Your child helps prepare vegetables.
Serve at least two vegetables with a meal. You set an example by eating vegetables with your child.
Pair a vegetable with the foods you know your child already likes.
Make vegetables more easily available and visible than other foods.
When you put vegetables on your child’s plate, give more than usual. Serve vegetables before the rest of the meal.
Use a plate that shows the right amount of vegetables to eat for a meal.
Offer your child two vegetable options for meals– one liked and one less liked.
11. Of all of the strategies you were assigned, which one do you think worked the best to
help your 9-12 year old eat more vegetables?
______________________________________
12. If applicable, compared to before the study, which of the strategies helped your 13-18
year old to eat more vegetables? (Check all that apply)

`265
!
Prepare a vegetable that is new to your child. Your child helps prepare vegetables.
Serve at least two vegetables with a meal.
You set an example by eating vegetables with your child.
Pair a vegetable with the foods you know your child already likes. Make vegetables more easily available and visible than other foods.
When you put vegetables on your child’s plate, give more than usual.
Serve vegetables before the rest of the meal.
Use a plate that shows the right amount of vegetables to eat for a meal. Offer your child two vegetable options for meals– one liked and one less liked.
13. Of all of the strategies you were assigned, which one do you think worked the best to
help your 13-18 year old to eat more vegetables? ______________________________________
14. After being in the FORK Study, which of the following strategies will you keep
doing?
a. Prepare a vegetable that is new to your child.
Yes No
NA
b. Your child helps prepare vegetables. Yes
No NA
c. Serve at least two vegetables with a meal.
Yes No
NA
d. You set an example by eating vegetables with your child. Yes
No
NA
e. Pair a vegetable with the foods you know your child already likes.
Yes
No
NA
f. Make vegetables more easily available and visible than other foods.
Yes
No
NA

`266
!
g. When you put vegetables on your child’s plate, give more than usual. Yes
No
NA
h. Serve vegetables before the rest of the meal.
Yes
No
NA
i. Use a plate that shows the right amount of vegetables to eat for a meal.
Yes
No NA
j. Offer your child two vegetable options for meals– one liked and one less liked.
Yes
No NA
15. Of all of the strategies you were assigned, which one would you be most likely to do weekly?
______________________________
Control Families
16. While in the study, were the foods you prepared in the home typical (i.e. The type of meals you prepared)?
Yes
No
17. Did participating in the study (the surveys, weekly phone calls, or keeping track of
what your child ate), impact what type of foods your child ate?
Yes
No
18. Do you think your child ate more vegetables while in the study?
Yes
No