the association between fruit and vegetable consumption
TRANSCRIPT

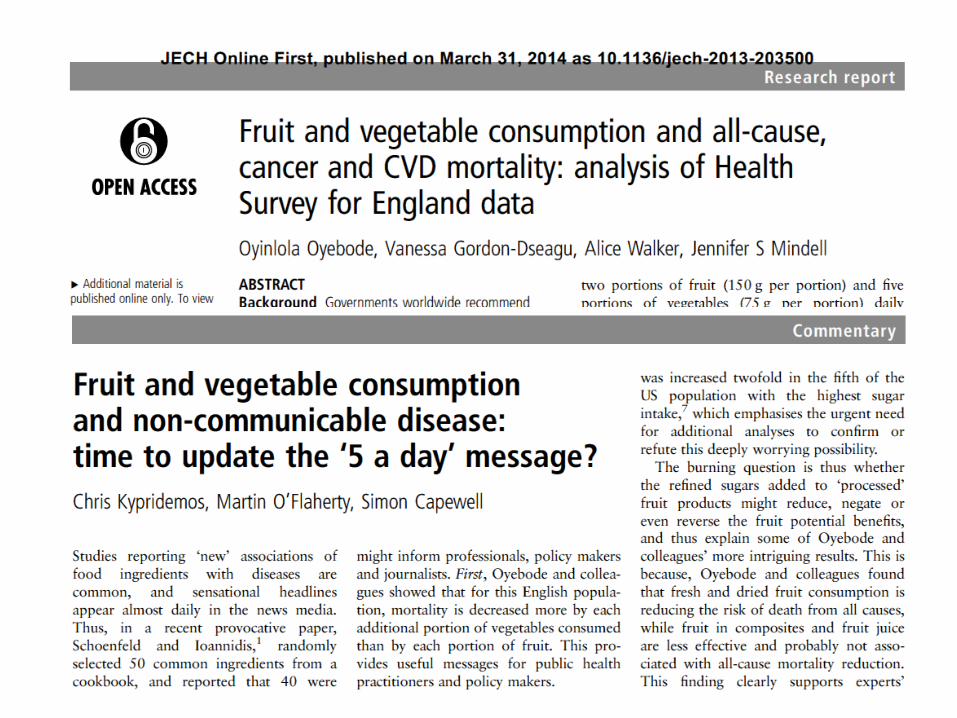
The association between fruit and vegetable consumption and
death from any cause, cancer or heart disease/stroke
15th October 2014Oyinlola Oyebode

Introduction
• Recommendations for fruit and vegetable consumption– 400g (WHO, 1990)– Fruit and Veggies-More Matters (USA, 2007)– “Go for 2+5” (Australia, 2005)– 5-a-day (France, Germany, UK)
• “Population nutrient goals have been set judgementally rather than on the basis of specific evidence as to the necessary level of intake”.

The Health Survey for England
• The major monitoring tool for looking at the nation’s health.• Used by the government to make important policy decisions
that have an impact on us all• It is an annual survey and has been running since 1991• Every address in England has an equal chance of being
included in the survey each year and the results are representative of the population

Methods
• Health Survey for England• Participants aged 35+, 2001-2008
– 65,226 (2,695 excluded: 4%) • Asked about 24 hour consumption• Coded into portion sizes• Max of one portion of pulses, fruit
juice/smoothie, dried fruit contribute to total• Linked to mortality up to 2013

Survival Analysis
0-<1 1-<33-<55-<77+
100%
95%
90%
4,399 people died(6.7%)
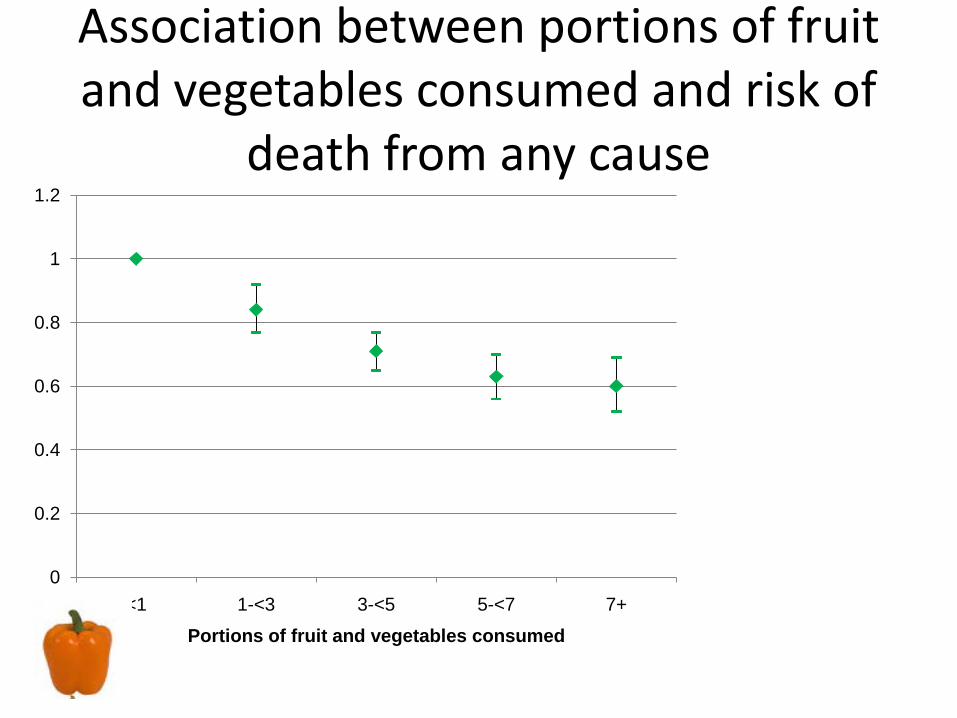
Association between portions of fruit and vegetables consumed and risk of
death from any cause
0
0.2
0.4
0.6
0.8
1
1.2
<1 1-<3 3-<5 5-<7 7+
Portions of fruit and vegetables consumed
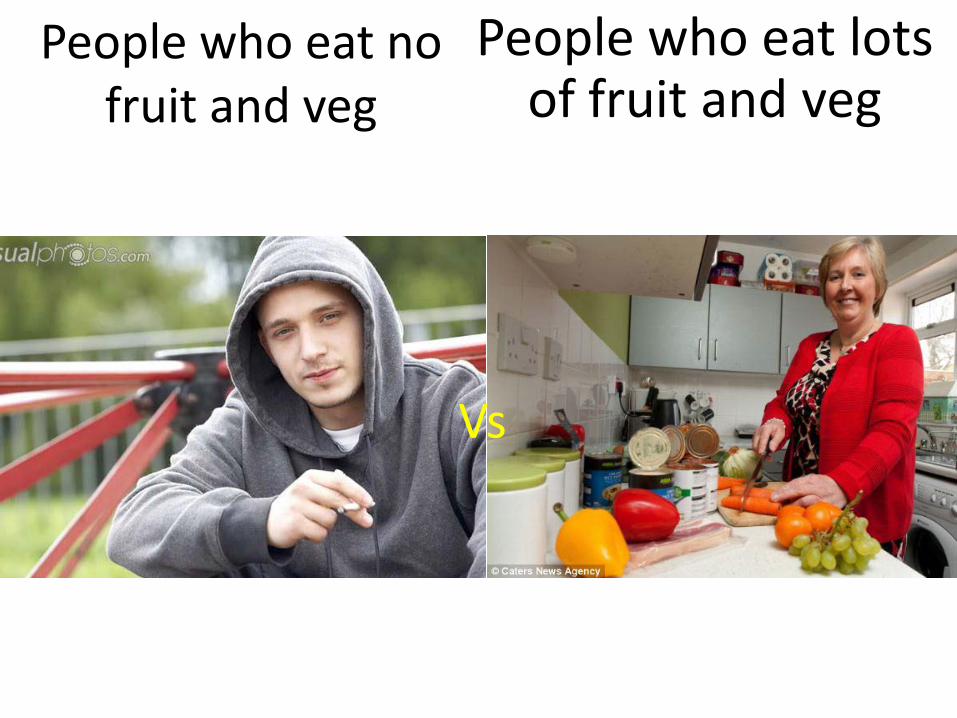
People who eat no fruit and veg
People who eat lots of fruit and veg
Vs

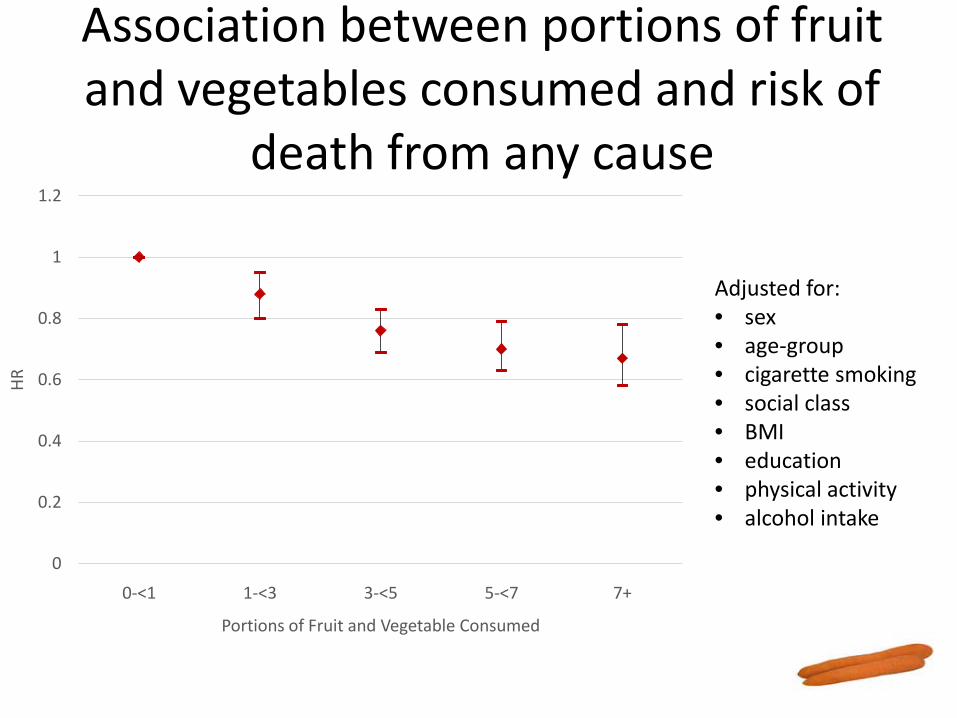
Association between portions of fruit and vegetables consumed and risk of
death from any cause
0
0.2
0.4
0.6
0.8
1
1.2
<1 1-<3 3-<5 5-<7 7+
Portions of fruit and vegetables consumed

Association between portions of fruit and vegetables consumed and risk of
death from any cause
0
0.2
0.4
0.6
0.8
1
1.2
<1 1-<3 3-<5 5-<7 7+
Portions of fruit and vegetables consumed
Adjusted for: • sex • age-group• cigarette smoking • social class • BMI • education• physical activity• alcohol intake
Association between portions of fruit and vegetables consumed and risk of
death from any cause
Adjusted for: • sex • age-group• cigarette smoking • social class • BMI • education• physical activity• alcohol intake
0
0.2
0.4
0.6
0.8
1
1.2
0-<1 1-<3 3-<5 5-<7 7+
HR
Portions of Fruit and Vegetable Consumed
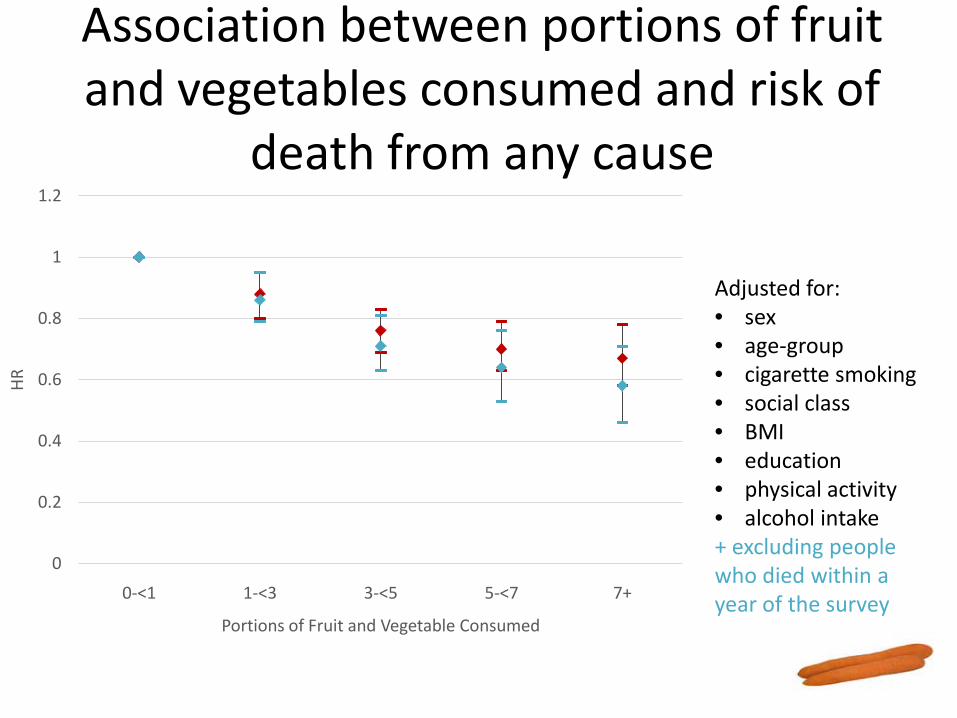
Association between portions of fruit and vegetables consumed and risk of
death from any cause
Adjusted for: • sex • age-group• cigarette smoking • social class • BMI • education• physical activity• alcohol intake+ excluding people who died within a year of the survey
0
0.2
0.4
0.6
0.8
1
1.2
0-<1 1-<3 3-<5 5-<7 7+
HR
Portions of Fruit and Vegetable Consumed

Association between portions of fruit and vegetables consumed and risk of
death from cancer or CVD
0
0.2
0.4
0.6
0.8
1
1.2
<1 1-<3 3-<5 5-<7 7+
HR
Portions of fruit and vegetables consumed
0
0.2
0.4
0.6
0.8
1
1.2
<1 1-<3 3-<5 5-<7 7+
HR
Portions of fruit and vegetables consumed
Cancer CVD

Association between portions of fruit or vegetables consumed
0
0.2
0.4
0.6
0.8
1
1.2
0-<1 1-<2 2-<3 3-<4
HR
Portions of Fruit or Vegetables Consumed
Fruit Vegetables

Association between variety of fruit and vegetable consumed and risk of
death from all-causes
00.20.40.60.8
11.21.4

Conclusions
• Strong association between fruit and veg consumption and all-cause mortality, cancer and CVD mortality.
• Consuming vegetables appears to be better than similar quantities of fruit.
• Consumption of fresh vegetables, salad, fresh fruit and dried fruit were associated with decreased mortality.
• Consumption of frozen or canned fruit was associated with increased mortality.
Final thoughts
• Most people should try to eat more fruit and veg
• Increasing availability, affordability and acceptability more effective than health education
• Good to stimulate public debate and increase the visibility of the issues involved

With thanks to:Vanessa Gordon-DseaguAlice WalkerJenny MindellHealth Survey for England teamHealth Survey for England participants
Thank you for listening!