fruit and vegetable consumption among college students in
TRANSCRIPT

International Food and Agribusiness Management ReviewVolume 10, Issue 3, 2007
Fruit and Vegetable Consumption among College Students in Arkansas and Florida: Food Culture vs. Health Knowledge
Christiane Schroeter aL, Lisa House b, and Argelia Lorence c
a Assistant Professor, California Polytechnic State University, Agribusiness Department, San Luis Obispo, CA 93401; USA
b Professor, University of Florida, Department of Food and Resource Economics,1177 MCCA, PO Box 110240 IFAS, Gainesville, FL 32611, USA
c Assistant Professor, Arkansas State University, Arkansas Biosciences Institute,PO Box 639, State University, AR 72467, USA
.
Abstract
This study determines the impact of demographics, dietary and health knowledge, and food culture on fruit and vegetable consumption of college students in Arkansas and Florida. Our empirical analysis demonstrates that food culture significantly impacts consumption of fruits and vegetables; a finding which emphasizes the need to target cultural aspects when developing effective and efficient management of agribusiness firms. Understanding the antecedents to consumption for products like fruits and vegetables is important to agribusiness industry, policy makers and organizations interested in evaluating the effectiveness of health education in promoting college students’ health and decreasing the trends to obesity.
Keywords: fruit and vegetable consumption, college students, food culture, health knowledge
LCorresponding author: Tel: + 805-756-5000 Email: [email protected]
Other contact information: L. House: [email protected] A. Lorence: [email protected]
© 2007 International Food and Agribusiness Management Association (IAMA). All rights reserved.

Schroeter, et. al. / International Food and Agribusiness Management Review Volume 10, Issue 3, 2007
Introduction and Objectives
Many factors impact a person’s food choice, from age to culture, from income level totradition, from location of residence to health knowledge, and the list goes on (Cosper and Wakefield, 1975). The impact of culture on food consumption can not be understated, yet it is rarely considered in agricultural economics and agribusiness literature. Combined with the importance of understanding the relationship between food consumption and culture is the issue of understanding food consumption for health. The increasing prevalence of obesity has led to debates on how to reverse the trend of increasing body weights.
Increased policy attention has been placed on increasing health education and preventing obesity in adolescents and young adults, given that adolescent obesity tends to persist into adulthood, which increases the risk of a multitude of chronic disease health risks that are related with high costs to the individual and the society (Mokdad et al., 2000; U.S. Department of Health and Human Services (USDHHS), 2000). About 21% of all college students in the U.S. are overweight or obese (Lowry et al., 2000)1. Previous studies have shown that overweight or obese individuals may experience social stigmatization and discrimination in academic situations (American Obesity Association (AOA), 2005).
With the gene pool remaining relatively stable, factors such as change in eating habits and sedentary lifestyles are considered to be responsible for much of the increase in the obesity epidemic. The World Health Organization, the U.S. Surgeon General, and the 2005 Dietary Guidelines for Americans associate the consumption of fruits and vegetables with the prevention of overweight, high blood pressure, heart disease, diabetes, and stroke (World Health Organization, 2003; U.S.Department of Health and Human Services/U.S. Department of Agriculture, 2005; CDC, 2007b). One of the national initiatives to increase the consumption of fruits and vegetables is the 5 A Day program, which encourages the consumption of 5 to 9 servings of fruits and vegetables a day (Five A Day, 2005). However, the National College Health Risk Behavior Survey (NCHRBS) determined that 74% of U.S. college students eat less than five servings of fruits and vegetables daily and 22% eat three or more high-fat foods per day. To meet the Dietary Guideline’srecommendations, Americans on a 2,000-calorie diet would need to increase daily fruit consumption by 132% and daily vegetable consumption by 31% (Buzby, Wells, and Vocke, 2006). Thus, there is a need to determine whether and to what extent a relationship between health knowledge, food culture, and fruit and vegetable consumption among college students exists.
1 Whether an individual is overweight or obese is determined by the Body Mass Index (BMI), which is determined by the formula: weight (in kilograms)/height2 (in meters). Among adults, overweight is classified by a BMI between 25.0 and 29.9, while a BMI greater than or equal to 30.0 defines obesity (CDC, 2004 and 2006).
© 2007 International Food and Agribusiness Management Association (IAMA). All rights reserved.

Schroeter, et. al. / International Food and Agribusiness Management Review Volume 10, Issue 3, 2007
However, only limited evidence exists on the health behavior of college students. Aside from the NCHRBS that took place in 1995, the prevalence of health-riskbehaviors among college students has not been well characterized and no dataexists regarding college students in Arkansas and Florida. Both states representdiverse cultures, which may be reflected in the consumption of fruits and vegetables. Arkansas was recently ranked as the seventh unhealthiest state in the United States due to its high levels of obesity, inactivity and smoking (Segal, 2006). Florida is one of the major producing states of fruits and vegetables and thus, health knowledge and consumption of produce may vary from Arkansas.
In order to address the missing link between dietary and health knowledge, food culture, fruit and vegetable consumption, and adolescent obesity, a deeperinvestigation is needed. The objectives of this study are to determine the impact of (1) demographics, (2) dietary and health knowledge, and (3) food culture on consumption of fruits and vegetables among college students by developing a model consistent with economic theory.
The findings of this study will provide important insights to agribusiness firms. How does dietary and health knowledge of college students vary by state, age, gender, rural-urban location, or income? How does the consumption of fruits and vegetables differ? What is the relationship between dietary and health knowledge, consumption of fruits and vegetables, and obesity? How does culture and tradition impact the consumption of fruits and vegetables? Do lifestyle choices influence the consumption of produce? These are issues that must be assessed in order to determine the impact of food culture and health knowledge on fruit and vegetable demand.
Background
While the understanding of food culture in agribusiness research has only recently begun, cultural anthropology is rooted in identifying cultural variations among humans and the study of food and culture. However, while cultural anthropologists have been the pioneer in the definition and measurement of food and culture, they have not used it to predict behavior, such as food consumption. In this section, the most important concepts and definitions of food and culture are reviewed, as they are crucial for the formulation of the food culture variables that will predict fruit and vegetable consumption in our study. Furthermore, we review literature on public policy implications with regard to food consumption changes.
As stated by Counihan and Van Esterik (1997), “food is the foundation of every economy. It is a central pawn in political strategies of states and households…” There are many examples of the relationship between food and culture. For instance, Barthes (1997) uses sugar to demonstrate how these concepts are intertwined. He asks why sugar consumption is higher in the U.S. than it is in
© 2007 International Food and Agribusiness Management Association (IAMA). All rights reserved.

Schroeter, et. al. / International Food and Agribusiness Management Review Volume 10, Issue 3, 2007
other countries. This question could be approached from many angles, and indeed food is often studied by multiple disciplines, such as economics, sociology, and history. Besides the economics of sugar consumption, the sociologist would examine the relationship between standards of living and sugar consumption, and the historian would find how sugar evolved as part of the American culture. However Barthes (1997) describes the act of consuming food not from the standpoint of demographics, value or history, but as an attitude. This attitude encompasses the function of food (for example, the historical quality of cooking a traditional food), theanthropological situation of food (for example, avoiding foods that are considered a sign of inferiority), and the relation of food to health. These are seen as themes found in food and culture. In addition to themes, behavior surrounds food consumption. Behaviors, such as work, sports, leisure, and celebration, are also expressed through food consumption. It is this attitude that produces the rituals and customs associated with the consumption of a food item. Douglas (1997) usesdifferent terminology but captures the same notion when she notes that food is a code, with the culture of food consumption encoded in messages found in the patterns of social relationships.
In cultural anthropology, measuring food and culture is frequently performed by identifying the most salient foods of a culture. This can be done by examining the common answers found in lists of foods cited by many participants in a study (Gittelsohn et al. 1999). By accumulating a list of foods identified by many, and selecting the most common elements, the researcher can use methods like pile sorts to understand the content and structure of that particular food subculture. In the 1999 study by Gittelsohn et al., children sorted food into the general categories of “good for you” and “not good for you”. Within this categorization, “things you drink”, “breakfast foods” and “fruits and vegetables” were identified as things that were in the “good for you” category.
To our knowledge, no recent study has measured food and culture among college students. Fifteen years ago, Counihan (1992) found that food rules in U.S. college culture focus on its emotional associations. Though certain foods were related to specific meanings (i.e. turkey and Thanksgiving), the overall interest in food came from the relationship to it, not from the food’s intrinsic qualities, such as nutritional content. Counihan determined that many students were vaguely aware of nutrition, but had trouble being explicit about specific nutritional recommendations. Fruits and vegetables were categorized as foods that were “good for you”. However, students stated they were more concerned about calories than the nutritional content of individual foods. “Good” eating was defined as including three meals per day. Eating was also seen as a way to express power, with individuals feeling some sense of control from selecting their own diet.
However, given the rise in obesity, several critics have argued that the public sectorshould take on more control with regard to an individual’s diet (Kuchler, Tegene,
© 2007 International Food and Agribusiness Management Association (IAMA). All rights reserved.

Schroeter, et. al. / International Food and Agribusiness Management Review Volume 10, Issue 3, 2007
and Harris, 2005). Although a number of state and federal proposals have been put forth to curb the rise in obesity, there remains an inadequate conceptual foundation for determining the transaction costs of market interventions, such as taxing “unhealthy” food or subsidizing “healthy” food, such as fruits and vegetables. Overall, many suggestions for public policy interventions that aim at reducing obesity may be difficult, if not prohibitively expensive, to implement (Cash, Sunding, and Zilberman, 2004). On one hand, taxing high-calorie foods may raise additional state revenue, while providing an important financial incentive to food manufacturers and fast-food restaurants to revise the nutritional content of their foods (USA Today, 2004). Accompanying the high-calorie tax could be an actual redistribution of income, given that especially low-income families depend on the consumption of the lower-priced fast foods (Cash, Sunding and Zilberman, 2004; British Broadcasting Corporation (BBC) News, 2004). On the other hand, a high-calorie tax would also punish snacking in moderation, which is probably not linked to too many negative consequences if combined with a healthy diet, and anadditional policy would be needed that distinguishes between moderate and excessive snacking. Furthermore, Schroeter, Lusk, and Tyner (2007) evaluate various public policy implications within an economic framework and find that a tax on food away from home could actually lead to a body weight increases.
Thus, a policy that would encourage the consumption of fruits and vegetables may be valuable. In addition to improving the health of U.S. Americans, increasing the intake of fruits and vegetables would have several implications for U.S. agriculture. Previous studies have shown that if Americans changed their current fruit consumption patterns, U.S. production would need to rise by 117%. In order to meet the guidelines for vegetable consumption, U.S. farmers would need to increase their vegetable harvest by 137%. Substantial increases in U.S. fruit and vegetable production would also increase demand for farm labor, land, and transportation, which would increase labor and land costs. In some cases, the higher costs would likely be passed on to the consumer in form of higher fruit and vegetable prices. Furthermore, imports and exports would be affected; particularly the largest markets for U.S. vegetable exports, Mexico and Canada (Buzby, Well, and Vocke, 2006). Overall, firms along the supply chain in fruit and vegetable production would benefit from these increases in consumption. This expresses the further need to determine factors that impact food choices and lifestyle choice of U.S. adults in order to successfully provide direct results for the effective and efficientmanagement of agribusiness firms.
Research Methodology
Survey Design
In this study, an online survey was designed using SurveyCrafter software to collect college student data (18 years or older). The survey included questions regarding
© 2007 International Food and Agribusiness Management Association (IAMA). All rights reserved.
Schroeter, et. al. / International Food and Agribusiness Management Review Volume 10, Issue 3, 2007
students’ height, weight, dietary intake, demographics, lifestyle, dietary and healthknowledge, and food culture. Questions from nationally representative surveyswere incorporated into the survey in order to allow for cross-comparisons between average U.S. college students and college students in Arkansas and Florida. Several questions about dietary and health knowledge were drawn from the National Health and Nutrition Examination Survey (NHANES), which is administered bythe U.S. Department of Health and Human Services (CDC, 2004). The National College Health Risk Behavior Survey (NCHRBS) provided the dietary intake and lifestyle questions (CDC, 1997). Food culture questions were based on previous research findings from cultural anthropology that define food culture, such as locations of food purchase and food consumption, traditions, as well as eatingpatterns in college and at home.
Data Collection
We conducted the online survey of undergraduate and graduate students atArkansas State University and the University of Florida in March 2007. We invited 870 students of specific classes throughout the universities via e-mail to take the survey. The e-mail contained a link to the online survey, which was hosted at a non-University website to reduce bias from respondents from either University. The students were informed about the survey in their classes and where possible, they were offered extra credit to complete the survey. At Arkansas State University, thesurvey was distributed to approximately 440 students, while approximately 430 were invited from the University of Florida. A total of 473 students responded andcompleted the survey, for an overall response rate of 54.4%. Response rates varied by University, with a response rate of approximately 72% from Arkansas State University, and a response rate of 42% from the University of Florida.
Variable Selection
This study employs five types of variables: 1) fruit and vegetable consumption; 2) demographics; 3) lifestyle variables, 4) dietary and health knowledge, and 5) food culture. Table 1 (See Appendix A) shows the definitions, means and standard deviations of each variable used in the regression analyses. While fruit and vegetable consumption served as our dependent variables, the remaining four variable categories were used as independent variables in our analyses.
Fruit and Vegetable Consumption: This study utilizes two food groups and estimates statistical models that determine the impact on these foods. The food groups are 1) fruits (the sum of fruit and fruit juice consumption) and 2) green salad. The respondents had to evaluate their eating habits on a ranking scale which assessed the frequency of consumption of these foods. As shown in Table 1, on average, respondents consumed fruits and fruit juices 1.64 times per day – far below
© 2007 International Food and Agribusiness Management Association (IAMA). All rights reserved.

Schroeter, et. al. / International Food and Agribusiness Management Review Volume 10, Issue 3, 2007
the required intake of 5 servings of fruits and vegetables per day. The averagefrequency to consume green salad was about 0.5 times per day.
Demographics: Several demographic variables may impact the consumption of fruits and vegetables, such as age, gender, BMI, income, and the university attended. Previous studies have shown that age plays an important role with regard to fruit and vegetable consumption. A recent study by the Centers forDisease Control and Prevention (CDC) determined that adults ages 18 to 24 ate the fewest vegetables, with almost 80% reporting they regularly do not consume any vegetables. Table 2 shows the age distribution of the survey respondents.
Table 2: Age Distribution of Survey Respondents
18 or under Total (n=473)
9 ASU (n=299)
9 UF (n=174)
0 19 37 30 7 20 63 39 24 21 107 62 45 22 103 54 49 23 43 20 23 24 31 18 13 25 15 7 8 26 or older 65 60 5
Regarding gender, previous research shows that the consumption of fruits and vegetables is typically lower among men in comparison to women (CDC, 2007a). In our study, 53% of all survey respondents were male. The BMI of the individual respondent was calculated, given the student’s answers to body weight and height. On average, the respondents were slightly overweight, with an average BMI of 25.45. The average BMI for males (females) was 26.2 (24.6). In our sample, 53%(35%) of males (females) were overweight, while 17% (13%) of males (females) were obese. This is a considerably higher rate of overweight and obesity than the rate that was found by Lowry et al. (2000). Given the increasing rates of obesity over time, this is not unexpected.
Economic variables, such as individual income may influence the intake of fruits and vegetables. The analysis included two variables to assess income: low income and medium income. These two income groups typically have a lower ability to purchase fruits and vegetables, which are often perceived as higher priced. Highincome could also indicate a better access to nutrition information compared to lower income households (Drenowski, 2003). Table 3 shows the income distribution of the survey respondents.
© 2007 International Food and Agribusiness Management Association (IAMA). All rights reserved.
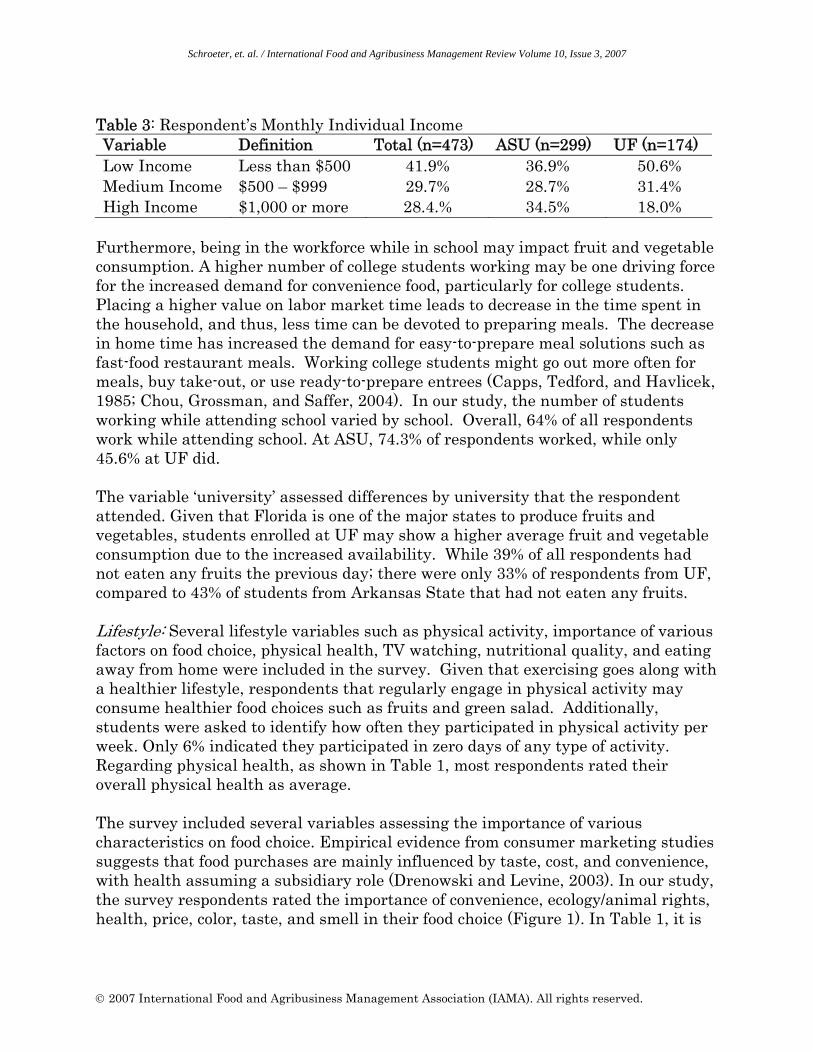
Table 3: Respondent’s Monthly Individual Income Variable Definition Total (n=473) ASU (n=299) UF (n=174) Low Income Less than $500 41.9% 36.9% 50.6% Medium Income $500 – $999 29.7% 28.7% 31.4% High Income $1,000 or more 28.4.% 34.5% 18.0%
Schroeter, et. al. / International Food and Agribusiness Management Review Volume 10, Issue 3, 2007
Furthermore, being in the workforce while in school may impact fruit and vegetable consumption. A higher number of college students working may be one driving force for the increased demand for convenience food, particularly for college students. Placing a higher value on labor market time leads to decrease in the time spent inthe household, and thus, less time can be devoted to preparing meals. The decrease in home time has increased the demand for easy-to-prepare meal solutions such as fast-food restaurant meals. Working college students might go out more often for meals, buy take-out, or use ready-to-prepare entrees (Capps, Tedford, and Havlicek, 1985; Chou, Grossman, and Saffer, 2004). In our study, the number of students working while attending school varied by school. Overall, 64% of all respondents work while attending school. At ASU, 74.3% of respondents worked, while only 45.6% at UF did.
The variable ‘university’ assessed differences by university that the respondent attended. Given that Florida is one of the major states to produce fruits and vegetables, students enrolled at UF may show a higher average fruit and vegetable consumption due to the increased availability. While 39% of all respondents had not eaten any fruits the previous day; there were only 33% of respondents from UF, compared to 43% of students from Arkansas State that had not eaten any fruits.
Lifestyle: Several lifestyle variables such as physical activity, importance of various factors on food choice, physical health, TV watching, nutritional quality, and eating away from home were included in the survey. Given that exercising goes along with a healthier lifestyle, respondents that regularly engage in physical activity may consume healthier food choices such as fruits and green salad. Additionally,students were asked to identify how often they participated in physical activity per week. Only 6% indicated they participated in zero days of any type of activity. Regarding physical health, as shown in Table 1, most respondents rated their overall physical health as average.
The survey included several variables assessing the importance of various characteristics on food choice. Empirical evidence from consumer marketing studies suggests that food purchases are mainly influenced by taste, cost, and convenience, with health assuming a subsidiary role (Drenowski and Levine, 2003). In our study, the survey respondents rated the importance of convenience, ecology/animal rights, health, price, color, taste, and smell in their food choice (Figure 1). In Table 1, it is
© 2007 International Food and Agribusiness Management Association (IAMA). All rights reserved.

70%•- 60%c•~ 50%ccc
40%••~- 30%c-c 20%•y" 10%•c
0%
• health
• convenience
• animal rights/ECology
• price
• color/taste/smell
Schroeter, et. al. / International Food and Agribusiness Management Review Volume 10, Issue 3, 2007
Figure 1: Ranking of Importance of Food Choice Determinants
shown that on average, 86% of respondents indicated that color, taste, and smell arethe most important factors in their food choice. Other factors in food choice, in descendingorder of importance, were price, health, convenience, and animal rights/ecology (Figure 1). Convenience is another important decision factor for the food purchasing decision, which is consistent with previous research that shows that the individual cost of nutritional and leisure time choices have increased over the past two decades (e.g. Chou, Grossman, and Saffer, 2004). Moreover, a loss of proper cooking skills increases the need to eat convenience food or food away from home (European Food Information Council, 2005).
As Table 1 shows, food prices play a major role when making purchasing decisions and on average, 74% of all respondents place a high importance on this characteristic. This finding is consistent with empirical evidence from consumer marketing studies (Drenowski and Levine, 2003). Interestingly, U.S. Americans spend a smaller share of their income on food than citizens of any other country – the current share is about 14% of disposable income. Of each consumer dollar, food accounted for 13¢ in 2003, which is down from 32¢ in 1950 and 43¢ in 1901 (Atkinson, 2005)2. In one sense, these facts represent the success achieved by the American food production and processing system to reduce relative food costs while generating additional value for consumers. Unfortunately, this great success may
2 Recent estimates by the U.S. States Department of Agriculture/ Economic Research Service (USDA/ERS) suggest that the share of disposable income spent on food is approximately 11% (USDA/ERS, 2003).
© 2007 International Food and Agribusiness Management Association (IAMA). All rights reserved.

45%
40%
~ 35%C~
"C 30%00Co 25%~
~~
" 20%
C 15%~u"~ 10%~
5%
0%
poor fair average above excellentaverage
• nutrition knowledge
• healthy behaviorknowledge
Schroeter, et. al. / International Food and Agribusiness Management Review Volume 10, Issue 3, 2007
also have non-market costs linked to it, because these lower cost energy sources have been noted for their high fat and sugar content, which ultimately increases theprevalence of overweight and obesity (Drenowski, 2003; Cutler, Glaeser, and Shapiro, 2003).
Respondents were also asked about the daily frequency of eating out and 83% of all respondents eat out in a restaurant, fast-food place, diner, and cafeteria per day. We expect that respondents, who eat out frequently, consume fewer servings of fruits and vegetables. The typical meal is less healthy than home-cooked food, since it is more calorie-dense and contains more total fat, more saturated fat, less calcium, fiber, and iron (Chou, Grossman, and Saffer, 2002; Lin and Frazão, 1999, Lin and Frazão, 1997). One factor contributing to the increased demand for food away from home is the fact that the per capita number of fast food restaurants doubled between 1972 and 1997, which reduces the search and travel time (Chou, Grossman and Saffer, 2002).
Regarding nutritional quality, respondents were asked to rate the nutritional quality of their diet. Most students rated their nutritional quality as average, while 33% rated it as below average and 27% as above average. A higher intake of fruits, fruit juices, and green vegetables should be expected from the respondents with higher-rated nutritional quality.
Dietary and health knowledge: In this section of our survey, we asked the respondents to self-rate their knowledge about knowledge of nutrition and health (Figure 2). A positive relationship between higher self-rated nutrition and health knowledge, and fruit and green salad consumption is expected.
Figure 2: Self-rating of Health and Nutrition Knowledge.
© 2007 International Food and Agribusiness Management Association (IAMA). All rights reserved.

IU%
60%
50%
40%
30%
20%
10%
0%
• fruit
• fruit juice
• green salad
o times 1 time 2 limes 3 or nlore
times
Schroeter, et. al. / International Food and Agribusiness Management Review Volume 10, Issue 3, 2007
In terms of the link between fruit and vegetable consumption and vitamin consumption, respondents that value their health more, may additionally take vitamins. In our sample, 66% of respondents indicated they take vitamins at least sometimes, with 29% indicating they take them regularly. Thus a positive relationship may be expected between fruit and vegetable consumption and vitamin intake.
In our study, 64% of respondents thought that healthy food is expensive. This finding is consistent with previous research. A recent study by the Rand Corporation [Central Broadcasting Station (CBS), 2005] suggests that on average, a high price of fresh fruits and vegetables contributes 29 pounds to the weights of individuals. Students who live in communities where fruits and vegetables are expensive, may be more likely to be obese than students who live in areas with lower produce cost.
Food culture: The survey included several questions to assess the impact of food culture and tradition on fruit and vegetable consumption. Food consumption has astrong cultural element, as it is not just influenced by food availability, but also by the traditions that extend across large numbers of people. Having students identify the expected behavior of food consumption in their family home serves as a measure of the ideal set of goods (i.e. similar to how food culture was measured in Gittelsohnet al. (1999). This represents their knowledge of the set of cultural foods typically eaten by their family. We also included variables representing the consumption of fruits and fruit juices, green salad, and other vegetables in the family home. It is expected that a larger frequency of consumption of a food product in the family will lead to a higher frequency of the product’s consumption by the individual college student. Figure 3 compares the respondent’s fruit and green salad consumption to
Figure 3: Daily Frequency of Fruit and Vegetable Consumption by the Individual
© 2007 International Food and Agribusiness Management Association (IAMA). All rights reserved.

70%
60%
50%
40%
30%
20%
10%
0%
• fruit
• fruit juice
• green salad
Otimes 1 time 2 times 3 or moretimes
Schroeter, et. al. / International Food and Agribusiness Management Review Volume 10, Issue 3, 2007
Figure 4: Daily Frequency of Fruit and Vegetable Consumption when with Family
However, as the college students are exposed to new cultures and encounter a different availability of foods, these behaviors may change. In addition to includingfood culture as measured by the family’s food consumption pattern, previous studies show that ethnic origin determines food culture. A recent study determined that while Hispanics showed the highest fruit and lowest vegetable intake, the oppositewas true for Caucasians (CDC, 2007a). Table 4 shows the distribution of all respondents by ethnic origin. While 16% of ASU students were Black, Hispanic or ofanother race, 36.6% of UF students were from ethnic origins other than Caucasian.
Table 4: Ethnic Origin of all Survey Respondents Variable Total (n=473) ASU (n=299) UF (n=174) Caucasian, non-Hispanic 80.3% 84.4% 73.4% Black, non-Hispanic 9.0% 10.2% 6.9% Hispanic/Latino 6.4% 2.0% 13.9% Other Race 4.3% 3.4% 5.8%
© 2007 International Food and Agribusiness Management Association (IAMA). All rights reserved.
Additionally, food consumption is cultural as it is usually done in a ritual (Barthes, 1997). Considering the meal activities or locations of meal consumption will allow us to investigate the impact of culture. The variables meal activity and home meal activity measure whether the meal is typically eaten while sitting at a table without the TV on. This is measured for both school and family meals. At school, 28% of respondents indicated they eat meals sitting at a table without the television on, while 59% watch TV while eating. At home, 93% of the respondents typically shared at least one meal together as a family. Of all respondents, 76% indicated they ate
Schroeter, et. al. / International Food and Agribusiness Management Review Volume 10, Issue 3, 2007
more than one meal together. For those that ate meals together as a family at home, 65% indicated they ate the meal at a table without television, while 33% indicated they watched television during the meal. Likewise, families that eat out more, may impact the students’ frequency of eating out, hence consuming less fruits and green salad.
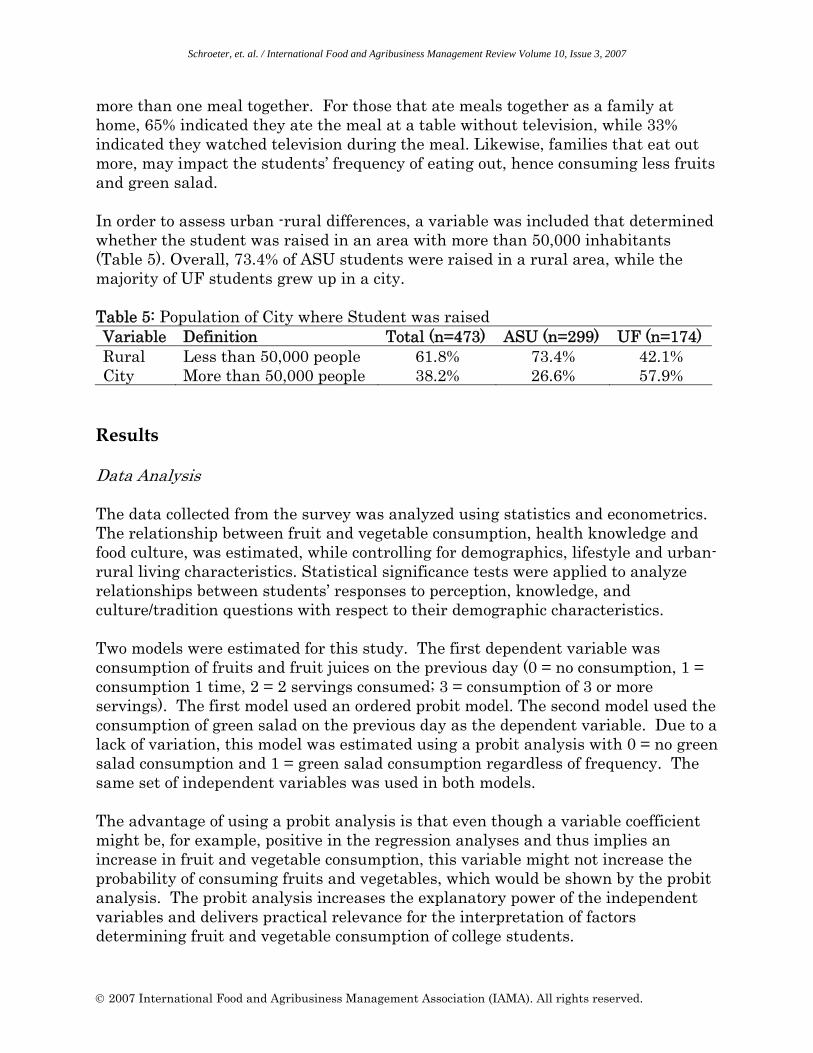
In order to assess urban -rural differences, a variable was included that determined whether the student was raised in an area with more than 50,000 inhabitants (Table 5). Overall, 73.4% of ASU students were raised in a rural area, while the majority of UF students grew up in a city.
Table 5: Population of City where Student was raised Variable Rural City
Definition Less than 50,000 peopleMore than 50,000 people
Total (n=473) 61.8% 38.2%
ASU (n=299) 73.4% 26.6%
UF (n=174) 42.1% 57.9%
Results
Data Analysis
The data collected from the survey was analyzed using statistics and econometrics. The relationship between fruit and vegetable consumption, health knowledge and food culture, was estimated, while controlling for demographics, lifestyle and urban-rural living characteristics. Statistical significance tests were applied to analyze relationships between students’ responses to perception, knowledge, and culture/tradition questions with respect to their demographic characteristics.
Two models were estimated for this study. The first dependent variable wasconsumption of fruits and fruit juices on the previous day (0 = no consumption, 1 = consumption 1 time, 2 = 2 servings consumed; 3 = consumption of 3 or more servings). The first model used an ordered probit model. The second model used the consumption of green salad on the previous day as the dependent variable. Due to a lack of variation, this model was estimated using a probit analysis with 0 = no green salad consumption and 1 = green salad consumption regardless of frequency. The same set of independent variables was used in both models.
The advantage of using a probit analysis is that even though a variable coefficient might be, for example, positive in the regression analyses and thus implies an increase in fruit and vegetable consumption, this variable might not increase the probability of consuming fruits and vegetables, which would be shown by the probit analysis. The probit analysis increases the explanatory power of the independent variables and delivers practical relevance for the interpretation of factors determining fruit and vegetable consumption of college students.
© 2007 International Food and Agribusiness Management Association (IAMA). All rights reserved.

Schroeter, et. al. / International Food and Agribusiness Management Review Volume 10, Issue 3, 2007
In the probit model, the dependent variable Yi is discrete and binary, and has the outcome Yi = 1 for to indicate individuals that consume green salad; and Yi = 0 , if the respondent does not consume this food. The probability mass function forYi under a Bernoulli probability model for the data sampling process is
yi − yif (Yi ) = pi (1 − pi )1 with pi = Prob [Yi = 1], E[Yi ] = pi , and var(Yi ) = pi (1− pi ) . Assuming
that the individual-specific decision outcomes are dependent upon a set of explanatory variables xi , a model should reflect the linkage of the decision outcomes to these variables. Each Bernoulli success probability can be set equal to a linear combination of the explanatory variables, which delivers pi = xi β . The probit model can be defined asYi
* = xi β + ε i , where Yi * is an unobservable variable, xi is a set of
independent variables, β is a coefficient vector, ε i is the noise component with *ε i ≈ N[0,1]. The observed dichotomous choice variable Yi is related to Yi in the
following manner: Yi = 1 if Yi * > 0 and Yi = 0 if Yi
* ≤ 0 . A positive (negative) coefficient in the probit analysis means that higher values of this explanatory variable are linked to an increase (decrease) in the likelihood of consuming green salads. Assuming that the individual decisions are independent, the log-likelihood function based on the observations for n individuals can be written as:
n n
ln L(β ; y, x) = ∑ yi ln( pi (xi β )) +∑(1 − yi ) ln(1 − pi (xi β )) (Mittelhammer, Judge, and i=1 i=1
Miller, 2000).
Regarding estimating determinants on fruit consumption, an ordered probit model was chosen, given that the order of the discrete choice mattered. The frequency of fruit consumption varied by respondent, as the standard deviation of 1.44 shows (Table 1). As in the probit model, the ordered probit model is: Yi
* = xi β + ε i . Although Yi
* is not directly observable, the observed dichotomous choice variable Yi consists of ordinal responses, i.e Yi =0, Yi =1, Yi =2, etc. Thus, Yi is related to the
* * * *Yi in the following manner: Yi = 0 if Yi ≤ 0 , Yi = 1 if 0 < Yi ≤ α1 , Yi = 2 if 0 < Yi ≤ α 2 , and Yi = J if α ( j −1) ≤ Yi
* , where α i are unknown threshold parameters. Results of both models are shown in Table 6.
© 2007 International Food and Agribusiness Management Association (IAMA). All rights reserved.

* ** *** **
** * * * *** ***
*** *** ***
** ***
*** *** *** *** ** ***
** *** ***
*** *** *** ***
* *** *** *** *** * ** *** * ***
*** ***
*** *** *** *** *** *** *** ***
* *** *** ***
***
** * *** ***
*** *** *** ***
*** *** *** ***
*** * *** *** *** **
Schroeter, et. al. / International Food and Agribusiness Management Review Volume 10, Issue 3, 2007
Table 6: Results from the Ordered Probit and Probit Models Fruits Green Salad
AgeMale
Demographics Coefficient 0.053 -0.240*
St.Err. 0.131 0.141
Coefficient -0.019 -0.444***
St.Err. 0.160 0.172
BMI 0.004 0.012 0.032** 0.015 Work -0.305** 0.143 -0.181 0.170 Low Income -0.538*** 0.162 -0.087 0.193 Medium Income -0.559*** 0.166 -0.067 0.199 University
Lifestyle Low Overall Physical Health High Overall Physical Health Low Level of Physical Activity High Level of Physical Activity Time Exercise
-0.136
0.335* -0.012 0.122 0.340* 0.021*
0.146
0.197 0.170 0.180 0.186 0.012
-0.130
0.276 0.162 0.052 0.204
-0.002
0.178
0.241 0.205 0.224 0.229 0.015
TV -0.071*** 0.026 -0.047 0.036 Importance of Convenience Importance of Ecology/Animal Rights Importance of Health Importance of Price Importance of Color, Taste, Smell Eating Out Low Nutritional Quality High Nutritional Quality
Dietary and Health Knowledge Low Nutrition Knowledge High Nutrition Knowledge Low Health Knowledge High Health Knowledge Vitamins
-0.227 0.253 0.379** 0.022 0.160
-0.149* -0.352** 0.090
-0.141 0.190 0.002
-0.177 0.322**
0.180 0.180 0.162 0.147 0.180 0.086 0.178 0.173
0.282 0.205 0.241 0.209 0.132
0.147 0.199 0.267 0.064
-0.480** 0.111
-0.197 0.107
0.000 0.089 0.119
-0.144 0.017
0.213 0.213 0.198 0.176 0.213 0.103 0.217 0.205
0.342 0.245 0.290 0.251 0.160
Healthy Food Price Food Culture
0.149 0.130 -0.090 0.155
Family Fruit and Fruit Juice Family Green Salad Family VegetablesOther Race
0.462*** -0.318* 0.068
-0.422
0.057 0.164 0.099 0.300
-0.069 0.444** 0.081
-0.095
0.065 0.197 0.119 0.358
Black 0.266 0.240 -0.107 0.289 Hispanic/Latino Meal Activity Home Meal Activity Family Eating Out City Log-Likelihood Correct Prediction
0.168 0.096
-0.011 0.062
-0.017 -523.17 45.9%
0.277 0.153 0.137 0.094 0.134
0.154 -0.230 0.345** 0.010 0.271*
-255.23 66.2%
0.337 0.185 0.163 0.112 0.160
Naïve Prediction 29.0% 59.9% Significance indicated by *, **, and *** at the 90%, 95%, and 99% confidence levels.
© 2007 International Food and Agribusiness Management Association (IAMA). All rights reserved.

Schroeter, et. al. / International Food and Agribusiness Management Review Volume 10, Issue 3, 2007
Interpretation
Results of this study provide information the impact of a) health knowledge, b) food culture, c) lifestyle, and d) subgroup differences by region, college major, gender, and urban-rural location on fruit and vegetable consumption of college students.
Health knowledge
Self-rated health knowledge had little impact on respondent’s consumption of fruits and green salad. The only significant variable in this category was vitamin consumption. Students indicating they consumed vitamins (either regularly or irregularly) were 8.4% less likely to consume no fruit or fruit juice and 7.9% more likely to consume three or more servings of fruits.
This finding is consistent with previous research, as typically, self-rated knowledge, also known as subjective knowledge, impacts food consumption. Objectiveknowledge could be tested by asking respondents a set of multiple choice questions and open-ended questions about nutrition and health to directly test knowledge in various subject areas. The most representative survey to test diet and health knowledge is the Diet and Health Knowledge Survey (DHKS), which is thecompanion to the Continuing Survey of Food Intakes by Individuals (CSFII). Both of these surveys are conducted by the U.S. Department of Agriculture (USDA). During the DHKS, the household’s main meal planner is asked to answer two sets of questions: One set of questions relates to nutrient knowledge and another set of questions captures diet-health awareness. To test nutrient knowledge, one sample question would be to identify which of two foods has the higher fiber content: fruit or meat, cornflakes, or oatmeal, popcorn or pretzels. The diet-health awareness questions take the general form, Have you heard about any health problem that might be related to how much of a particular nutrient (e.g. fat) a person eats? (Variyam et al., 1999). Thus, in order to expand and improve the current survey questionnaire, measures of objective knowledge could be included into the survey. For example, we could ask respondents to identify foods with the highest vitamin C content. Furthermore, diet-health awareness could be assessed by asking, What are some health benefits of fruits, vegetables, and other foods?
Food Culture
As expected, the food culture variables were highly significant in determining the consumption of fruits and green salad. Family consumption of fruits was highly predictive of the individual’s consumption of fruits. The same is true for the green salad model. Interestingly, family consumption of green salad significantly decreased the consumption of fruits. This may be indicating that within the family, if the culture emphasized the consumption of vegetables such as salad, it did not stress fruit consumption jointly with it. For each one serving increase in fruit
© 2007 International Food and Agribusiness Management Association (IAMA). All rights reserved.

Schroeter, et. al. / International Food and Agribusiness Management Review Volume 10, Issue 3, 2007
consumption in the family, the likelihood of having no servings of fruits at school decreased by 11.5% and the likelihood of having three or more servings increased by 11.8%. For each one serving increase in green salad in the family, the likelihood of having green salad at school increased by 16.9%. Consumption of green salad in the family increased the likelihood to eat no servings of fruits by 7.9%. In addition to the family consumption variables, the family meal activity variables significantly impacted the consumption of green salad. Respondents who indicated their family ate dinner at a table without watching television were 12.9% more likely to consume green salad. It could be hypothesized that salads are more likely consumed at a table than on-the-go, therefore, the tradition of sitting at a meal table would increase the likelihood of consuming products like green salad. This finding is consistent with previous research which determined that watching television during meals has been found to be related to higher fat consumption in adolescents and adults (Boutelle et al., 2003). Other research showed a relationship between television watching and overweight, given that television viewing is such a sedentary activity (Strauss and Knight, 1999; Agras and Mascola, 2005; Salmon et al., 2005). ). This research indicates that tradition of eating at the dinner table carries forward to healthy eating behaviors in college. These findings are consistent with recent research. Fitzpatrick, Edmunds, and Dennison (2007) identified that families who eat dinner together at the dinner table with the television off eat morefruits and vegetables than those who eat separately or watch television while eating. Thus, there is need to promote meal environments that support healthful eating. Parents can play a role by limiting television and video games or other sedentary activities during meal times (Ritchie et al., 2005; Lindsay et al., 2006). Finally, those survey respondents who were raised in urban areas were 10.4% more likely to consume green salad, indicating that a different food culture exists between the urban and rural respondents. Urban respondents may have anincreased ability to purchase fruits and vegetables, given a higher density and variety of grocery stores (The Economist, 2002).
Lifestyle
Many lifestyle variables had a significant impact on fruit consumption, but only one had a significant impact on green salad consumption, indicating the types of products we studied are considerably different. For green salad, the only significantlifestyle variable was based on whether a person indicated that color, taste, and smell are important factors in food choice. In this case, these respondents were 18.8% less likely to consume green salad. On the other hand, respondents who indicated health was an important factor in food choice were 8.9% more likely to eat three or more servings of fruits and 10.3% less likely to consume no fruits. Behavior did impact consumption of fruits to a lesser degree. For each additional hour of television watched above the average of 2.5 hours, respondents increased their likelihood to consume no fruits by 1.8%. These findings are consistent with previous research that determined for each additional hour of television viewed per
© 2007 International Food and Agribusiness Management Association (IAMA). All rights reserved.

Schroeter, et. al. / International Food and Agribusiness Management Review Volume 10, Issue 3, 2007
day, fruit and vegetable consumption decreased by 0.16 servings per day (Boynton-Jarrett et al., 2003). In addition, research showed that television shows targeted at adolescents feature mostly commercials for high-calorie and high-sugar foods (Strauss and Knight 1999).
Those that ate out more frequently were 3.7% more likely to consume no fruits. On the other hand, for every exercise activity above the average amount, the likelihood to consume three or more servings of fruits increased by 0.5%. Finally, those whorated their level of physical activity as higher than average were 8.2% less likely to eat no fruits.
One unexpected relationship was discovered in this category. Students who rated their overall physical health as below average were 7.4% less likely to consume no fruits. A possible explanation for this outcome could be that concern about their physical health has led these students to consume more servings of fruit.
Subgroup differences
Demographics did impact both fruit and green salad consumption. However, they influenced these variables differently. Gender differences were similar, with males 3.3% and 6.2% less likely to consume two or three servings of fruits, respectively, and 16.9% less likely to consume green salad. Students who worked were 7.3% more likely to consume no fruits and students with relatively lower incomes were about 15% more likely than those in the highest income category to consume no fruits. Finally, for green salad, for each unit increase in BMI above average, the likelihood to consume green salad increased by 1.2%. This was not the expected relationship, though perhaps it could be indicating that those with higher BMIs are concerned about their weight and act on that concern.
Also of interest were the demographic variables that were not significant. Age and location were not significant, indicating there were no statistical differences between UF and ASU students, though UF students were expected to eat more fruit and fruit juice given their proximity to production and given Arkansas’ position as one of the states with the largest rates of obesity.
Conclusions
The impact of culture on food consumption can not be understated, yet it is rarely considered in agricultural economics and agribusiness literature. Culture is not measured by income levels and cities of residence. Often, the proxy used for culture is ethnicity, which is often underrepresented in survey research. Additionally, this provides a view of culture that is based on demographics. In this study, we measure food culture by including family behavior versus the behavior of the individual studied. In anthropology, a field where culture is the focus of study, family behavior
© 2007 International Food and Agribusiness Management Association (IAMA). All rights reserved.

Schroeter, et. al. / International Food and Agribusiness Management Review Volume 10, Issue 3, 2007
is likened to an ideal set of goods. Aggregating this ideal set across people would allow patterns to emerge that would be considered culture, or similarities among different groups of people. Additionally, family behavior impacts food choice, as well as food consumption behavior. Food consumption is considered to be cultural because it is often done in rituals. An example is the ritual of eating dinner at the table, without the television on. If this was common in the family, we found that itwould increase the likelihood of consuming green salad.
This study showed that fruit and vegetable consumption decreased with anincreased frequency of eating away from home. This finding is consistent with previous studies. Eating away from home has been associated with poor diet quality. This may be due to fewer food choices, or less information about the nutrient content of the foods consumed. Another reason may be that consumers regard eating away from home as a 'splurge', independent from its frequency and use it as an opportunity to enjoy foods other than their usual diet, such as desserts. In this case, behavioral strategies need to change consumer attitudes regarding eating out or modify the environmental setting of fast food and full service restaurants. Increased information on the nutrient content of foods should be provided or institutional meal plans should adjust to more healthful food choices in order to reduce the intake of high-calorie foods (Guthrie, Derby, and Levy, 1999). Since there is no expectation that the trend of eating away from home is going to reverse itself, there is need for nutrition policy, education, and promotion strategies that focus on improving the nutritional quality of food away from home (Lin, Guthrie, and Frazão, 1999). For college students, an improved quality of the on-campus cafeteria food could be reached by incorporating more dishes with fruits and vegetables.
In addition to improving students’ health, increasing fruit and vegetable demand would be beneficial for agribusiness companies. Recent studies suggest that small estimated changes in fruit and vegetable consumption would lead to adequate time for U.S. agriculture to adjust production and for the food industry to develop and market new packaged fresh-food options and new processed foods (Buzby, Wells, and Vocke, 2006). U.S. agriculture has proven to be flexible in response to constant changes in consumer demand, new production and processing technologies and supply shocks, such as in the case of the recent wave of low-fat and low-carb products (Buzby, Farah, and Vocke, 2005). The food and agribusiness industry hasexpressed the need for studies to explain consumption patterns, as it closely watches whether and how consumers will react to the call for increased fruit and vegetable consumption by the new dietary guidelines. Hence, this study forms animportant step to understanding underlying demand drivers. This information will help to determine efficient management decisions. Furthermore, the availability of this information may provide help considering design, development, and improvement of fruit and vegetable marketing decisions. Understanding consumerdemand will also help restaurant and other food outlets to determine what appears
© 2007 International Food and Agribusiness Management Association (IAMA). All rights reserved.

Schroeter, et. al. / International Food and Agribusiness Management Review Volume 10, Issue 3, 2007
on their menus (Buzby, Wells, and Vocke, 2006). Thus, a deeper understanding ofthe relationship between food culture and health knowledge on food consumption directly benefits agribusiness companies along the supply chain.
This study leaves some questions open for future research. The impact of family consumption of green salad decreased the likelihood to consume fruits. Relationships between variables, and inclusion of other vegetables would proveinteresting for future research. Additionally, the BMI, which is frequently used as ameasure of quality of diet, was not significantly related to fruit consumption and was positively related to green salad consumption. Investigation into thisrelationship could provide answers to these outcomes, such as that those respondents with higher BMI’s might be more conscious of their diets and thus, more likely to eat healthy in an attempt to reduce their BMI. In fact, those respondents that were overweight were more likely to rate their physical health lower than those who were not overweight, indicating a certain level of awareness. Related to this subject is the limitation that this was an online study. Self-reporting of variables, like weight and diet habits, is typically more reliable in intervention studies when these data can be more directly collected.
An additional limitation of this study is that data on consumption was collected by asking respondents to report their eating habits “yesterday”. It can always beargued that the previous day was not a typical day, and thus, is not representative of their true behavior. However, this has to be balanced with the ability of the respondent to recall their eating habits over a period of time. Typical food diarystudies, such as the national representative Behavioral Risk Factor Surveillance System (BRFSS) collected by the CDC, rely on the 24-hour recall method – what foods have you eaten in the last 24 hours – because of the inability of people to accurately recall what they ate over a longer period of time (CDC-BRFSS, 2005). Intervention studies that observe eating behaviors are a more accurate, but also a more costly method of data collection. As a preliminary study in this area, the online survey provides us with evidence of issues to be further investigated and directions that agribusinesses and policy makers should consider. This studyindicates that food culture, demographics, and lifestyle have an impact on fruit and green salad consumption of college students in Arkansas and Florida. Unfortunately, when sampling college students, it is difficult to compare the sample to the population. Expanding the geographic focus of the study to include more states, or even other countries, would also enrich the findings, given that obesity is a global epidemic.
Among the interesting findings was that self-reported knowledge had little impact on produce consumption. Future research should consider both objective and self-reported knowledge, but this preliminary finding indicates that emphasis should be placed on food culture and lifestyle if attempting to influence fruit and vegetable consumption. Typically, public health policies have focused on education, hence
© 2007 International Food and Agribusiness Management Association (IAMA). All rights reserved.

Schroeter, et. al. / International Food and Agribusiness Management Review Volume 10, Issue 3, 2007
aimed at increasing knowledge. It is possible that increased communication about the importance of family traditions, like eating at the dinner table would have a greater impact than increasing information on the number of servings of fruits and vegetables people should consume. Additionally, information targeted at different demographic segments, as well as at different subcultures, needs to be adjusted according to subgroup, to reflect the different behaviors of these groups.
References
Agras, W.S. and A.J. Mascola (2005). "Risk factors for childhood overweight." Current Opinion in Pediatrics 17(5):648-652.
American Obesity Association (AOA). “AOA Fact Sheets: What is Obesity?” (2005).Retrieved on May 29, 2006:
http://www.obesity.org/subs/fastfacts/obesity_what2.shtml
Atkinson, C. “What U.S. Consumers Buy and Why.” AdAge.com, February 9, 2005.
Barthes, R. “Toward a Psychosociology of Contemporary Food Consumption.” In Counihan and van Esterik, ed. Food and Culture: A Reader. New York,
Routledge, 1997:28-35.
Boynton-Jarrett, R., Thomas, T.N., Peterson, K.E., Wiecha, J., Sobol, A.M., and S.L. Gortmaker. “Impact of Television Viewing Patterns on Fruit and Vegetable Consumption among Adolescents.” Pediatrics 112(2003):1321-1326.
British Broadcasting Corporation (BBC) News. “‘Fat Tax’ could save lives.” February 20, 2004.
Buzby, J.C., Wells, H.F., and G. Vocke. “Possible Implications for U.S. Agriculture from Adoption of Select Dietary Guidelines.” United States Department of Agriculture- Economic Research Service. Economic Research Report No. 31,
November 2006.
Buzby, J.C., Farah, H. and G. Vocke. “Will 2005 be the Year of the Whole Grain?” Amber Waves 3(2005):2-7.
Cash, S.B., Sunding, D.L., and D. Zilberman. “Fat Taxes and Thin Subsidies: Prices, Diet, and Health Outcomes.” Paper presented at the Annual Meeting of the American Agricultural Economics Association, Denver, CO, August 1-4, 2004.
© 2007 International Food and Agribusiness Management Association (IAMA). All rights reserved.
Schroeter, et. al. / International Food and Agribusiness Management Review Volume 10, Issue 3, 2007
Capps, O. Jr., Tedford, J.R., and J. Havlicek, Jr. “Household Demand for Convenience and Nonconvenience Products Foods.” American Journal of Agricultural Economics 67(1985):862-869.
Centers for Disease Control Prevention (CDC). “Fruit and Vegetable ConsumptionAmong Adults- United States, 2005. Morbidity and Mortality Weekly Report 56(2007a):213-217.
Centers for Disease Control and Prevention (CDC). “Prevalence of Fruit and Vegetable Consumption and Physical Activity by Race/Ethnicity - UnitedStates, 2005.” Morbidity and Mortality Weekly Report 56(2007b):301-304:Retrieved on April 13, 2007:
http://www.cdc.gov/mmwr/preview/mmwrhtml/mm5613a2.htm
Centers for Disease Control and Prevention (CDC). “About BMI for Adults.” (2006).Retrieved on May 29, 2006:
http://www.cdc.gov/nccdphp/dnpa/bmi/adult_BMI/about_adult_BMI.htm
Centers for Disease Control and Prevention (CDC). “Trends in Intake of Energy and Macronutrients—United States, 1971–2000.” (2004).Morbidity and Mortality Weekly Report 53, 80–82. Retrieved on January 25, 2003:
http://www.cdc.gov/mmwr/preview/mmwrhtml/mm5304a3.htm.
Centers for Disease Control and Prevention (CDC). “Youth Risk Behavior Surveillance: National College Health Risk Behavior Survey -United States, 1995.” Morbidity and Mortality Weekly Report 46(1997):1-54. Retrieved on April 10, 2007:
http://www.cdc.gov/mmwr/preview/mmwrhtml/00049859.htm#00002793.htm
Centers for Disease Control and Prevention- Behavioral Risk Factor Surveillance System (CDC-BRFSS). “BRFSS Frequently Asked Questions.” (2005).Retrieved on September 11, 2005: http://www.cdc.gov/brfss/faqs/htm
Central Broadcasting Station (CBS). “Obesity Linked to Cost of Produce?” October 5, 2005. Retrieved on October 5, 2005:
http://www.cbsnews.com/stories/2005/10/05/national/main917319.shtml
Chou, S.Y., Grossman, M., and H. Saffer. “An Economic Analysis of Adult Obesity:Results from the Behavioral Risk Factor Surveillance System.” National Bureau of Economic Research Working Paper No. 9247, 2002.
Chou, S.Y., Grossman, M., and H. Saffer. “An Economic Analysis of Adult Obesity:Results from the Behavioral Risk Factor Surveillance System.” Journal of Health Economics 23(2004):565-587.
© 2007 International Food and Agribusiness Management Association (IAMA). All rights reserved.

Schroeter, et. al. / International Food and Agribusiness Management Review Volume 10, Issue 3, 2007
Counihan, C. “Food Rules in the United States: Individualism, Control and Hierarchy.” Anthropological Quarterly 65(1992):55-66.
Counihan, C. and P. van Esterik. Food and Culture: A Reader. New York: Routledge, 1997.
Cosper, B.A. and L.M. Wakefield. “Food Choices of Women.” Journal of the American Dietetic Association 66(1975):152-155.
Cutler, D.M., Glaeser, E.L., and J.M. Shapiro. “Why have Americans become more Obese?” Journal of Economic Perspectives 17(2003):93-118.
Douglas, M. “Deciphering a Meal.” In Counihan and van Esterik, ed. Food and Culture: A Reader. New York, Routledge, 1997:55-66.
Drenowski, A. “Energy Density, Palatability, and Satiety: Implications for Weight Control.” Nutrition Reviews 56(1998):347-353.
Drenowski, A. “Fat and Sugar: An Economic Analysis.” The Journal of Nutrition 133(2003):838S-840S.
Drenowski, A. and A.S. Levine. “Sugar and Fat- From Genes to Culture.” The Journal of Nutrition 133(2003):829S-830S.
European Food Information Council. “Why We Eat What We Eat: Social andEconomic Determinants of Food Choice.” Food Today 45(2005). Retrieved on November 9, 2005: http://www.eufic.org/gb/food/pag/food45/food451.htm
Fitzpatrick, E., Edmunds, L.S, and B.A. Dennison. “Positive Effects of FamilyDinner Are Undone by Television Viewing.” Journal of the American Dietetic Association 107(2007):666-671.
Five A Day. “Eat 5 to 9 For Better Health.” Retrieved on September 23, 2005:http://www.5aday.gov/
Gittelsohn, J., Toporoff, E., Story, M., Evans, M., Anliker, J., Davis, S., Sharma, A., and J. White. “Food Perceptions and Dietary Behavior of American-Indian Children, Their Caregivers, and Educators: Formative Assessment Findings
from Pathways.” Journal of Nutrition Education 32(2000):2-12.
Guthrie, J.F., Derby, B.M., and A. S. Levy. “What People Know and Do Not Know about Nutrition.” In: Frazão, E. (eds.): America’s Eating Habits: Changes and Consequences. U.S Department of Agriculture, Economic ResearchService, Food and Rural Economics Division. Agriculture Information Bulletin Number 750, 1999.
© 2007 International Food and Agribusiness Management Association (IAMA). All rights reserved.
Schroeter, et. al. / International Food and Agribusiness Management Review Volume 10, Issue 3, 2007
Kuchler, F., Tegene, A., and J.M. Harris. “Taxing Snacking Foods: ManipulatingDiet Quality or Financing Information Programs?” Review of AgriculturalEconomics 27(2005):4-20.
Levine, A.S., Kotz, C.M., and B.A. Gosnell. “Sugars and Fats: The Neurobiology of Preference.” Journal of Nutrition 133(Supplement)(2003):831S-834S.
Lin, B.-H. and E. Frazão. “Nutritional Quality of Foods At and Away from Home.” Food Review 20(1997):33-40.
Lin, B.-H. and E. Frazão. “Away-From-Home Foods Increasingly Important to Quality of American Diet.” USDA Agricultural Information Bulletin No. 749, 1999.
Lin, B.-H., Guthrie J, and E. Frazão. Nutrient Contribution of Food Away From Home. In: Frazão, E. (eds.): America’s Eating Habits: Changes and Consequences. U.S Department of Agriculture, Economic Research Service, Food and Rural Economics Division. Agriculture Information Bulletin Number 750, 1999.
Lindsay, A., Sussner, K.M., Kim, J., and S. Gortmaker (2006). "The role of parents in preventing childhood obesity." The Future of Children 18(1):169-186.
Lowry, R., Galuska, D.A., Fullerton, J.E., Wechsler, H., Kann, L., and J.L. Collins. “Physical Activity, Food Choice, and Weight Management Goals and Practices among U.S. College Students.” American Journal of Preventative Medicine 18(2000):18-27.
Mittelhammer, R.C., Judge, G.G., and D.J. Miller. Econometric Foundations. Cambridge, UK: Cambridge University Press, 2000.
Mokdad A.H., Sedula, M.K., Dietz, W.H., Bowman, B.A., Marks, J.S., and J.P. Koplan “The Continuing Epidemic of Obesity in the United States.” JAMA 284(2000):1650-1651.
Ritchie, L.D., Welk, G., Styne, D., Gerstein, D.E., and P.B. Crawford (2005). "Family Environment and Pediatric Overweight: What is a Parent to Do?" Journal of the American Dietetic Association 105(5: supplement 1):s70-s79.
Salmon, J., Timperio, A., Telford, A., Carver, A., and D. Crawford (2005). "Association of family environment with children’s television viewing and with low level of physical activity." Obesity Research ad(11):1939-1951.
© 2007 International Food and Agribusiness Management Association (IAMA). All rights reserved.

Schroeter, et. al. / International Food and Agribusiness Management Review Volume 10, Issue 3, 2007
Schroeter, C., Lusk, J.L., and W. Tyner (2007). “Determining the Impact of Food Price and Income Changes on Body Weight.” Journal of Health Economics. Corrected proof available April 20, 2007:http://dx.doi.org/10.1016/j.jhealeco.2007.04.001
Segal, L. “Arkansas ranks 7th heaviest in the country, according to a new report that finds America’s obesity epidemic is getting worse.” Trust for America’s Health. HeathyAmericans.org, August 29, 2006.
Strauss, R.S. and J. Knight (1999). "Influence of the Home Environment on the Development of Obesity in Children." Pediatrics 103:85-95.
The Economist. “Come on in. How bad is American Food? And whose Fault is it?” August 31, 2002.
U.S. Department of Agriculture- Agricultural Research Service (USDA-ARS). “Information Collected in the 1994-96 Diet and Health Knowledge Survey.” (2007). Retrieved on June 1,
2007:http://www.ars.usda.gov/Services/docs.htm?docid=7776
U.S. Department of Agriculture- Economic Research Service, (ERS/USDA), 2003.ERS/USDA Data- International Food Consumption Patterns. Retrieved onSeptember 10, 2006:
http://www.ers.usda.gov/data/InternationalFoodDemand/
U.S. Department of Health and Human Services/U.S. Department of Agriculture. Dietary Guidelines for Americans, 2005. 6th ed. Washington, D.C.: U.S. Government Printing Office; 2005. Retrieved on April 12, 2007:
http://www.health.gov/dietaryguidelines.
U.S. Department of Health and Human Services, National Center for Health Statistics (USDHHS-NCHS). “Prevalence of Overweight and Obesity among Adults: United States, 1999-2000.” (2000). Retrieved on October 8, 2002:
http://www.cdc.gov/nchs/products/pubs/pubd/hestats/obese/obse99.htm
USA Today. ‘Twinkie Tax’ Worth a Try in Fight Against Obesity. December 1, 2004.
Variyam, J.N., Blaylock, J., Lin, B.-H., Ralston, K., and D. Smallwood. “Mother’s Nutrition Knowledge and Children’s Dietary Intake.” American Journal of
Agricultural Economics 81(1999):373-384.
World Health Organization (WHO). “Global Strategy on Diet, Physical Activity, and Health: Fruit, vegetables, and NCD disease prevention.” World Health Organization, Geneva, 2003. Retrieved from the WWW on April 12, 2007::
http://www.who.int/hpr/NPH/fruit_and_vegetables/fruit_vegetables_fs.pdf
© 2007 International Food and Agribusiness Management Association (IAMA). All rights reserved.

Schroeter, et. al. / International Food and Agribusiness Management Review Volume 10, Issue 3, 2007
Appendix: A
Table 1: Definitions, Means and Standard Deviations of Variables used in the Regression Mean and Variable Definition Std.deviation
Fruit and Vegetable Consumption Fruits 1.64Frequency of consuming fruits /fruit juices per day (1.44) Green Salad 0.47Frequency of consuming green salad per day (0.63) Demographics Age
Male Body Mass Index (BMI)
Work
Low Income
Medium Income High income University
Lifestyle Low Overall PhysicalHealth Medium Overall PhysicalHealth
High Overall Physical Health Low Level of Physical Activity
Medium Level of Physical Activity
High Level of PhysicalActivity Time Exercise
TV
Importance of Convenience
Importance ofEcology/Animal Rights
Importance of Health
Age of respondent (>18 years)
=1 if male, =0 if female
Weight (kg)/ (Height (m))2
=1 if individual works while attending school, = 0 otherwise 0.64 Individual income of less than $499 per month 0.42 Individual income of $500-$999 per month 0.30 Individual income of ≥$1,000 per month (omitted variable) 0.28 =1 if individual attended ASU, =0 if individual attended UF 0.63
22.0 (2.14) 0.53 23.45 (5.33)
Self-rating of overall physical health is poor or fair 0.16
Self-rating of overall physical health is average (omitted 0.44 variable)
Self-rating of overall physical health is above average or 0.40 excellent Self-rating of physical activity is poor or fair 0.27
Self-rating of physical activity is average (omitted variable) 0.33
Self-rating of physical activity is above average or excellent 0.41
Frequency of performing physical activity and exercise per 8.51 week, as measured by number of times involved in (6.66) cardiovascular, strengthening, stretching, and walking exercises (range 0-28) Number of hours the respondent watches TV per day 2.50
(2.46) Rated importance of convenience on food choice as 0.84 important or higher
Rated importance of ecology/ animal rights on food choice 0.15 as important or higher
Rated importance of health on food choice as important or 0.74 higher
© 2007 International Food and Agribusiness Management Association (IAMA). All rights reserved.

Schroeter, et. al. / International Food and Agribusiness Management Review Volume 10, Issue 3, 2007
Importance of Price
Importance of Color, Taste, Smell
Eating Out
Low Nutritional Quality Medium Nutritional Quality
High Nutritional Quality
Dietary and Health Knowledge Low Nutrition Knowledge
Medium Nutrition Knowledge High Nutrition Knowledge
Low Health Knowledge Medium Health Knowledge
High Health Knowledge
Vitamins
Healthy Food Price
Rated importance of price on food choice as important or 0.74 higher Rated importance of color/taste/smell on food choice as 0.86 important or higher
Frequency of respondent eating out in a restaurant, fast- 0.83 food place, diner, cafeteria, etc. per day (0.76Self - rating of nutritional quality of diet is poor or fair 0.33 Self - rating of nutritional quality of diet is average 0.40 (omitted variable)
Self - rating of nutritional quality of diet is above average 0.27 or excellent
Self - rating of nutrition knowledge is poor or fair 0.15
Self - rating of nutrition knowledge is average (omitted 0.39 variable) Self - rating of nutrition knowledge is above average or 0.46 excellent Self - rating of health knowledge is poor or fair 0.11 Self - rating of health knowledge is average (omitted 0.38 variable)Self - rating of health knowledge is above average or 0.51 excellent = 1 if respondent took vitamins during the past year; 0.65 = 0 otherwise = 1 if respondent thinks that healthy food is expensive; 0.64 = 0 otherwise
Food Culture Family Fruit and FruitJuice Family Green Salad
Family Vegetables
Caucasian
Other Race Black
Hispanic/Latino
Meal Activity
Home Meal Activity
Family Eating Out
City
Rural
Frequency of fruit and fruit juice intake in family home per 2.30 day (1.37) Frequency of consumption of green salad in family home 0.84 per day (0.65) Frequency of consumption of cooked vegetables, French 2.14 fries, and potato chips in family home per day (1.07) = 1 if respondent is Caucasian (omitted variable); = 0 0.82 otherwise = 1 if respondent is Pacific Islander or Asian 0.04 = 1 if respondent is non-Hispanic Black; = 0 otherwise 0.08
= 1 if respondent is Hispanic; = 0 otherwise 0.06
= 1 if respondent typically consumes meal while sitting at 0.26 a table without TV on when at school; = 0 otherwise = 1 if respondent typically consumes meal while sitting at 0.58 a table without TV on when at home; = 0 otherwise Frequency of respondent eating out in a restaurant, fast- 0.68 food place, diner, cafeteria, etc. in family home per day (0.71) = 1 if respondent was raised in an area with more than 0.39 50,000 people; = 0 otherwise =1 if respondent was raised in an area with less than 0.61 50,000 people (omitted variable); = 0 otherwise
© 2007 International Food and Agribusiness Management Association (IAMA). All rights reserved.