before the hamilton city council district … · chartered professional engineer. (b) ... senior...
TRANSCRIPT

BEFORE THE HAMILTON CITY COUNCIL DISTRICT PLAN HEARINGS PANEL
IN THE MATTER of the Resource Management Act 1991 AND IN THE MATTER of the hearing by Hamilton City Council of submissions
relating to the Proposed Hamilton District Plan in respect of Business Zones
STATEMENT OF EVIDENCE OF ALASDAIR DAVID ANGUS GRAY ON BEHALF OF HAMILTON CITY COUNCIL
November 2013
0

INTRODUCTION AND QUALIFICATIONS 1. My name is Alasdair David Angus Gray. My qualifications and experience
are as follows:
(a) I hold a Bachelor of Science degree (Civil Engineering, 1986) from
the University of Aberdeen. I am a Corporate Member of the
Institution of Professional Engineers New Zealand and a
Chartered Professional Engineer.
(b) I have worked in the transportation field as a civil/transportation
engineer for more than 25 years and have been involved at a
senior level in the investigation and development of projects in
Hamilton City and the Waikato region for more than 15 years. I am
based in Hamilton and established my own consultancy, Gray
Matter Ltd, in January 2006. For 5 years prior to that I was Group
Engineer, Asset Development, with Opus International
Consultants Ltd in Hamilton, managing approximately 30 technical
staff in a range of road projects. For the previous 5 years I was a
senior civil/transportation engineer with Maunsell in Hamilton.
(c) I am familiar with the transport issues arising in and around
Hamilton, having provided advice to Hamilton City Council and
other local authorities, Environment Waikato, NZ Transport
Agency, and developers on projects in the area over the past 17
years. I have the following specific experience with respect to the
matters currently in front of the Commissioners:
(i) Consultant civil/ transportation engineer for developers,
landowners and local authorities assisting in preparing and
reviewing consent applications including for commercial
developments and notices of requirement for road projects,
including Environment Court Hearings, Boards of Inquiry,
mediation and expert witness conferencing;
(ii) Project Manager and traffic engineer/transportation planner
for the Hamilton Integrated Transport Strategy (1999), the
Hamilton Alternatives to Roading Study (2004) and the
Access Hamilton 2010 – 2040 integrated transport
strategy;
1

(iii) Project Manager and traffic engineer for the development
of the Road Safety Strategies and Road Safety
Management Systems for Hamilton;
(iv) Assisting Waikato Regional Council in transportation
planning analysis for the Regional Land Transport Strategy
2011 – 2041 relating to strategic transportation corridors;
(v) Assisting NZTA with preparation and review of the Waikato
Expressway Network Plan 2012;
(vi) Assisting Hamilton City Council and Waipa District Council
with the transportation provisions of their Proposed District
Plans;
(vii) Assisting Hamilton City Council, NZTA and Waikato District
Council with funding applications and performance
monitoring methods for road improvement projects
including the Hamilton Ring Road;
(viii) Assisting NZTA and Rotorua District Council with
preparation of their Integrated Network Strategy, 2013 and
corridor implementation plans;
(ix) Assisting Tauranga City Council with resolution of Appeals
to their Proposed District Plan including commercial
developments at Bethlehem and around the Hospital
(x) Assisting Waikato District Council with transportation
aspects of Plan Change 2: District wide Growth and Rural
and Coastal Subdivision;
(xi) Working with NZTA and local authorities regarding
integrated transport planning for local roads and state
highways in Tamahere, Pokeno, Rotorua and Tauranga;
and
(xii) Project Manager for HCC and NZTA for the Southern Links
Investigation relating to a Notice of Requirement for 32km
of proposed arterial road network to the south of Hamilton.
(d) I confirm that I have read and will comply with the Code of
Conduct set out in the Environment Court of New Zealand Practice
Note 2011, Section 5. I state where I have relied on the
2

statements of evidence of others for my assessment1. I have not
omitted to consider material facts known to me that might alter or
detract from my opinions.
PURPOSE AND SCOPE OF EVIDENCE
2. I have been retained by Hamilton City Council to provide traffic
engineering and transportation planning expertise to inform consideration
of submissions relating to the proposed business zone provisions in the
Proposed Hamilton District Plan.
3. The purpose of this statement of evidence is to explain:
(a) The transportation planning context of and response to the
centres-based spatial framework for the Proposed Hamilton
District Plan;
(b) How the transportation network is expected to accommodate the
growth and zoning implications of the plan;
(c) How the expected trip generation from the Business 4 zoning at
the Te Rapa North Sub Regional Centre has been taken into
account.
4. My statement addresses the following matters:
(a) A brief description of the existing strategic road network and its
regional context;
(b) An explanation of the transportation planning processes and key
documents behind the existing and planned transport network and
how it is reflected in the Proposed District Plan;
(c) The forecast performance for the transportation network for the
duration of the District Plan and in the long term;
(d) The implications of changes in activities at Te Rapa for traffic
generation including comments on concerns raised in other
statements2 relating to traffic;
1 Not generally from evidence but I rely on information provided by others such as the Waikato Regional Traffic Model and associated inputs (e.g. Attachments 5 and 7) and PDP activity comparisons (Attachment 3). 2 Philip Brown, Cameron Inder, 4 November 2013
3

(e) My conclusions relating to the plan provisions providing a suitable
framework for ensuring effective performance of the transportation
network.
5. In summary, I consider that:
(a) HCC’s application of integrated transport planning in the Proposed
District Plan is reasonable;
(b) The existing and planned infrastructure is either adequate to deal
with the expected demand or the forecast deficiencies have been
identified for resolution or acceptance;
(c) The changes in traffic generation likely as a result of the Business
4 zoning at the Te Rapa North Sub Regional Centre could
increase traffic in the area by 2000 – 3000 veh/hr. Actual traffic
generation within the 10 year horizon for the Proposed District
Plan is more likely to depend on demand for development;
(d) The potential additional traffic will result in increased delays in the
local network but these are not likely to have a significant impact
on existing or planned infrastructure or in access to the town
centre or other nodes;
(e) Integrated transport planning will continue in a way that is
responsive to changes in development rates and characteristics in
accordance with HCC’s strategic objectives; and
(f) The Transportation objectives, policies, rules and assessment
criteria in the Proposed Hamilton District Plan provide a safeguard
against unexpected transport outcomes; and,
(g) Should unexpected conditions arise, existing methods such as
optimising signal phasing to manage side road access on Te Rapa
Straight can manage them.
EXISTING STRATEGIC ROADING NETWORK AND WIDER CONTEXT;
6. Hamilton’s strategic road network is illustrated in Figures in Attachment 1.
The figures are from the Proposed District Plan, the Waikato Regional
Policy Statement, Waikato Expressway Hamilton Section consultation
information, the Operative District Plan and Access Hamilton. These
show how the strategic road network has changed little from the
4

Operative District Plan and is now reflected consistently in local and
regional documents.
7. The existing and planned strategic roading network in the vicinity of
Hamilton comprises a combination of state highways and local arterials
which form four main elements:
(a) Regional connections – including SH1;
(b) External ring – including Waikato Expressway (or SH1B),
SH39/SH3 and Southern Links;
(c) Internal ring road- including Wairere Drive, existing SH1 Avalon
Drive, Greenwood Street, Kahikatea Drive, Lorne Street, Cobham
Drive;
(d) Internal grid connections;
(i) North-south – Te Rapa Straight, Ulster Street, etc;
(ii) East-west – key river crossings including northern river
crossing (proposed), Cross city connector.
8. The combination of elements is progressively being completed to form a
flexible and robust strategic network that is able to provide for a range of
traffic demands and maintain effective access to and between the key
nodes. The ring roads provide the option to avoid congestion at key
nodes or within the urban area should that become an issue. This allows
congestion (and other) costs and agglomeration (and other) benefits from
intensification in urban areas to reach an appropriate equilibrium3 without
significantly affecting wider traffic movements.
9. The New Zealand Transport Agency (the Agency) and HCC are working
together to develop a Network Operating Framework. This will include a
Network Operating Plan and Network Improvement Plan following an
approach that State Highways and HCC roads operate as one network.
The Network Operating Plan will allow HCC and the Agency to optimise
use of the existing road network on a consistent basis by establishing an
agreed framework for prioritising competing road user demands. NZTA
and HCC already deliver this informally through traffic signal management
using SCATS4. Anglesea Street is an example of where through traffic
phasing is prioritised over side road traffic.
3 Principles discussed in RR513 Impact of urban form on transport and economic outcomes, NZTA 2013. 4 The Sydney coordinated adaptive traffic system (SCATS) is a computer-based area-wide traffic management system designed and developed by the Roads and Traffic Authority of NSW.
5

10. Access Hamilton 2010 – 2040 acknowledges that a degree of congestion
is inevitable and that continuing to meet capacity demands is unlikely to
be economically sustainable. Hamilton is already facing congestion on
key corridors and at conflict points. Access Hamilton includes a suite of
action plans supporting an integrated transport plan to deliver a range of
options. The action plans cover public transport, active travel, safety,
asset management, network, travel demand management and parking.
11. Hamilton’s transport system works within a complex framework illustrated
at Attachment 2 including:
(a) The Land Transport Management Act 2003 which sets National
and Regional Land Transport Programme processes;
(b) Land Transport Act 1998 which sets a framework for access to
and use of the road network;
(c) Local Government Acts 1974 and 2002 which set responsibilities
and powers for roads and LTP processes;
(d) National influences such as Government Policy Statements and
investment priorities such as the National Land Transport
Programme and Roads of National Significance leading to the Te
Rapa Section and proposed Hamilton Section of the Waikato
Expressway;
(e) Regional influences such as the Regional Land Transport
Strategy, Regional Land Transport Programme (regional
prioritisation feeding into the national process), Passenger
Transport Plan and operations and Regional Policy Statements;
(f) Sub-regional influences such as Waipa’s District Plan and growth
strategy encouraging growth in Cambridge and at the airport, and
Waikato’s control of rural subdivision;
(g) Local influences such as strategic objectives and HCC policies,
District Plan, and importantly funding priorities and constraints. An
example of this is the Hamilton Ring Road funding arrangement
which will take up a significant proportion of future network
improvement expenditure; and,
(h) Development influences such as The Base and Ruakura, and
central intensification such as redevelopment at Bryce Street,
Centre Place, Wintec and the City Gate offices.
12. Attachment 2 also reproduces the equivalent Figure 1 from the Section
42A Hearing Report for the Introduction and Statutory Framework
6
sections. The main difference lies in the role of the Land Transport
Management Act 2003 and its associated framework.
TRANSPORTATION PLANNING AND THE PROPOSED DISTRICT PLAN;
13. The management and development of Hamilton’s road-related transport
systems is guided by the HCC integrated transport strategy Access
Hamilton and delivered through the LTP. The land use patterns upon
which Access Hamilton was based are shown in Figure 1 below. They
were derived from Hamilton’s Urban Growth Strategy (HUGS) and
although they have evolved slightly with less infill, are consistent with the
Proposed District Plan and recognised destination nodes.
14. The objectives and policies in the PDP5 relating to the strategic
framework provide for a clear spatial framework including areas where
intensification is desirable, a hierarchy of business centres and zoning
that sets out where land use activities are expected to locate. Objective
2.2.13 “Land use and development is integrated with the provision of
infrastructure” and its associated policies highlight some transport-
relevant aspects implicit in other objectives and policies such as
sustainability (energy consumption, travel mode, compact form, and the
Central City as a primary centre for business). In a practical sense, a
compact form reduces travel distances and intensification of development
around centres supports accessibility using a range of modes. A hierarchy
of centres provides guidance for the transport network hierarchy and
passenger transport planning and means that strategic transport
infrastructure and services can be managed and delivered more efficiently
than if activities were dispersed.
15. From a transportation planning perspective, the certainty provided by a
clear land use framework6 makes it much easier not only to plan (funding
as well as form and function) infrastructure for the future but to assess the
effects of other proposals. A more permissive framework makes it very
hard to establish a useful expected environment against which to assess
the effects of development proposals and what mitigation may be
appropriate.
5 E.g. Section 2: Figure 2.1a Hamilton’s Plan at a glance, and Section 2.2 Objectives and Policies – Strategic Framework 6 Starting with Future Proof, now reflected in the Proposed Waikato Regional Policy Statement, through Structure Plans, Approved Concept Plans and Comprehensive Development Plans and now in the Proposed District Plan.
7

Figure 1: Generation and Destination Nodes (from Access Hamilton)
16. Access Hamilton states that it will “meet the changing travel demands of
the city by providing an affordable, safe, responsive and sustainable
transport system. The city’s strategic objectives have a long term focus
and are consistent with the objectives of the Land Transport Management
Amendment Act and the NZ Transport Strategy.” The current purpose of
the Land Transport Management Act 20037 is to “to contribute to an
effective, efficient, and safe land transport system in the public interest.”
7 Section 3: replaced, on 13 June 2013, by section 4 of the Land Transport Management Amendment Act 2013 (2013 No 35).
8

There is an implied difference in direction with “responsive” and
“sustainable”
17. Access Hamilton states that “In broad terms, Access Hamilton aims to:
• Support Hamilton’s economic, social, environmental and cultural
well-being.
• Support the land use, sustainability and economic development
objectives for a compact city with consolidation and intensification
around key nodes and a vibrant city centre.
• Manage incremental change in the transport and land use system
necessary to achieve Hamilton’s strategic objectives.
• Position infrastructure and land development to meet the city’s
long term needs.
18. The first bullet point reflects the previous LGA outcome areas, now
superseded8 by the following purpose:
“(1) The purpose of local government is—
(a) to enable democratic local decision-making and action by, and on
behalf of, communities; and
(b) to meet the current and future needs of communities for good-quality
local infrastructure, local public services, and performance of regulatory
functions in a way that is most cost-effective for households and
businesses.
(2) In this Act, good-quality, in relation to local infrastructure, local public
services, and performance of regulatory functions, means infrastructure,
services, and performance that are—
(a) efficient; and
(b) effective; and
(c) appropriate to present and anticipated future circumstances”
19. The second bullet point is consistent with the objectives from Hamilton’s
Urban Growth Strategy (HUGS), the Operative District Plan and the
Proposed District Plan, recognising the city centre as the primary focus
and acknowledging the importance of Te Rapa and Chartwell. Transport
infrastructure planning has been based on centres with a focus on
supporting a compact form and intensification of the city centre since
HITS in 1999. Consolidation of this approach in the District Plan also
8 Section 10(1)(b): replaced, on 5 December 2012, by section 7(1) of the Local Government Act 2002 Amendment Act 2012 (2012 No 93). Section 10(2): inserted, on 5 December 2012, by section 7(2) of the Local Government Act 2002 Amendment Act 2012 (2012 No 93).
9

supports passenger transport, walking and cycling which contributes to
travel demand management.
20. An example of Access Hamilton being delivered through the Proposed
District Plan is through a significant change in the town centre parking
policy. No minimum requirement should result in unbundling of parking
from land use activities and support intensification. In addition, it allows
the true cost of parking to be realised as a separate activity, rather than
being unavoidably sunk in property costs. There are already sites where
this direction is being supported by developers such as apartments with a
very small proportion of the parking that would otherwise have been
expected.
21. Access Hamilton is a 30 year strategy and identified a series of packages
for consideration for funding. These are shown in Figure 2 below and
have progressed as follows:
(a) Northern Corridor- (NZTA/HCC) – includes Te Rapa Section
(complete), Rotokauri Roading (progressing), Northern River
Crossing (preliminary investigation), etc. – under way – various
stages;
(b) Southern Links (NZTA/HCC) – Designation process under way;
(c) Waikato Expressway (NZTA) – Alteration to Designation under
way – completion expected by 2019;
(d) Wairere Drive – Hamilton Ring Road – substantial progress with
further construction under way for 4 laning from River Road to
Resolution Drive and Ruakura Road to Cobham Drive;
(e) Cross City Connector – considered but unfunded;
(f) Hamilton East Precinct – considered but unfunded;
(g) City Centre (includes access, parking strategy – lower priority –
insufficient funding for some activities including dealing with the
main access points. A parking strategy is being implemented and
activities such as the connection of Alexandra Street to Worley
Place and closure of Ward Street support the precinct approach in
the City Centre Local Area Plan;
(h) Avalon Drive Access (HCC/NZTA) – lower priority – insufficient
funding;
(i) Hamilton Transport Centre– lower priority; and
(j) Hospital Precinct– lower priority.
10

Figure 2: Access Hamilton Packages
FORECAST PERFORMANCE FOR THE TRANSPORTATION NETWORK
22. HCC and NZTA use traffic modelling to assist in investigation of options
when planning for transport. It is worth emphasising that:
(a) Traffic models are simply a tool used to compare options and are
based on generalisations and assumptions that become
11

increasingly less certain the further one attempts to forecast into
the future. The scenarios being considered around Te Rapa are
nominally ten years (matches LTP funding plans and District Plan
durations). Access Hamilton and the RLTS work on a 30 year
planning horizon.
(b) Modelling and planning based on concerns about vehicle capacity
is a “predict and provide” approach which may not be the optimum
long term outcome and can be contrary to wider strategic
objectives.
(c) Land use and transport infrastructure interact. The need for
integration arises from the complex inter-relationships between
land use activities and the transport systems that serve them.
Development increases demand for travel and transport. Access
constraints can restrict or adversely influence development.
Choosing the right place for development can avoid conflict and
reduce the need for additional infrastructure.
(d) In some circumstances congestion is a network condition which
can be tolerated and to some extent is self-regulating. For
example in the Te Rapa Road area the Te Rapa Bypass provides
an alternative route for passing traffic. Where impacts on the
wider network are minor, the benefits of addressing localised peak
period congestion are reduced. When peak period delays reach a
level that a driver finds unacceptable, their travel decisions
(whether/where to travel, when to travel, how to travel) are
influenced.
(e) The Waikato Regional Traffic Model (WRTM) is a four step model9
which can take into account mode selection as part of the travel
decision process – e.g. introducing more frequent bus services or
bus priority. Accepting congestion for private vehicles can
promote passenger transport and active modes. Managing parking
by availability, time control or price can influence travel choices
and reduce car use.
(f) Modelling tends to balance intersection delays to optimise the
network as a whole. In practice some movements may be
prioritised. For example, the replacement of the roundabout at
9 The four steps of the transportation planning system model are Trip generation, Trip distribution, Mode choice and Route assignment
12

Eagle Way/Te Rapa Road with traffic signals allows the north
south arterial movement to be allocated additional time through
signal phasing when through movement priority is desirable.
23. Hamilton City generally relies on the WRTM for network planning
supported by local models such as a project model for Southern Links, the
VISSIM model at the Base and Paramics models for some town centre
activities and for south east Hamilton where more detailed analysis is
required. Models such as SIDRA as used by Mr Ryan for his statement
are commonly then used for investigation and design of specific
intersections.
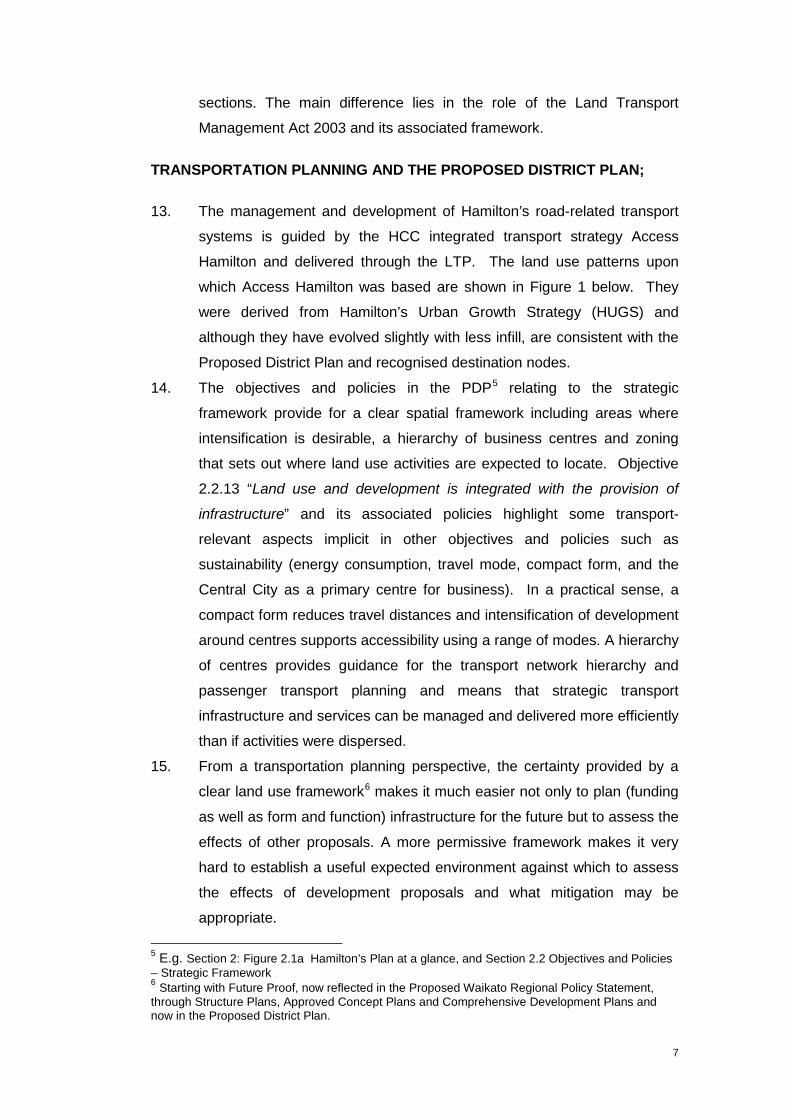
24. Figures 3 and 4 illustrate network levels of service for the Hamilton
network for 2021 and 2041. In transportation planning I use tools such as
these to identify key areas at risk and guide further investigation. Blue
indicates a barely satisfactory condition10 but often accepted for peak
periods and red indicates a poor level of service11. The lines show
performance along the roads (links) and the dots or circles show
performance at intersections (nodes). Recent studies12 suggest that peak
period delays do not significantly influence productivity.
10 Level of Service E: Edge of unstable flow, slow speeds on links, intersection delays >55 seconds 11 Level of Service F: Demand exceeds practical capacity, stop-start flows, intersection delays >80 seconds. 12 Note: US research mainly for freeways and larger cities - results suggest that congestion slows job growth above thresholds of approximately 4.5 minutes of delay per one-way auto commute and 11,000 average daily traffic (ADT) per lane on average across the regional freeway network. While higher ADT per freeway lane appears to slow productivity growth, there is no evidence of congestion-induced travel delay impeding productivity growth.( Sweet M, Traffic Congestion's Economic Impacts: Evidence from US Metropolitan Regions, Urban Stud, October 2013)
13
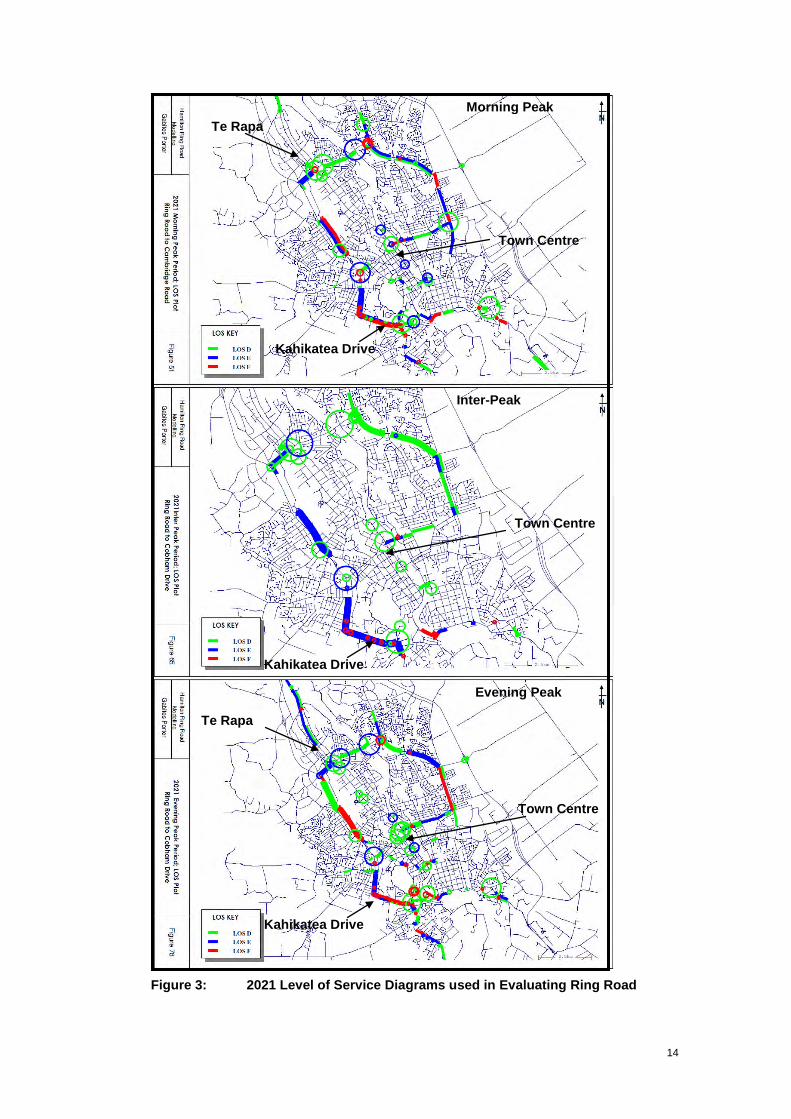
Figure 3: 2021 Level of Service Diagrams used in Evaluating Ring Road
Morning Peak
Inter-Peak
Evening Peak
Te Rapa
Town Centre
Te Rapa
Town Centre
Kahikatea Drive
Kahikatea Drive
Kahikatea Drive
Town Centre
14

Figure 4: 2041 Level of Service Diagrams used in Evaluating Ring Road
Morning Peak
Inter-Peak
Evening Peak
Te Rapa
Town Centre
Te Rapa
Town Centre
Kahikatea Drive
Kahikatea Drive
Kahikatea Drive
Town Centre
Te Rapa
15

25. The forecast patterns are similar to those found in Access Hamilton and
match the packages already identified as desirable for mitigation. The
main congestion issues are expected to take place around the ring road
and the cross-city connector. The ring road is intended to provide for
efficient movement to traffic generating nodes such as the university, The
Base, Wintec Avalon Campus and Crawford Street inland port. The
congestion patterns are similar between 2021 and 2041. The
consequences of congestion are mainly on journey times becoming
longer and less predictable. In a mainly controlled urban network, serious
safety issues are unlikely because intersections are managed and speeds
are relatively low.
26. In a simplistic sense, acceleration or an increase in traffic generation in a
known growth area where the activity is in the right place13 would simply
bring the 2021 or 2041 scenario forward. The need to deal with the effects
of expected development have been known for some time but projects
such as the Te Rapa Bypass and Wairere Drive have been a higher
priority for funding. As long as traffic can get past the ring road, the worst
level of service problems are restricted to the cross city connector and
town centre fringes. If funding for infrastructure or transport system
improvements is available to match increased demands from growth then
options to avoid or mitigate transport problems are generally available.
For example, the Northern Corridor Package in Access Hamilton includes
a northern river crossing. That would be likely to relieve demand on the
Wairere Drive route and potentially Te Rapa Road. Preliminary
investigations have been completed and although a corridor is not yet
protected the connection is recognised as part of the strategic network.
Funding for further investigation, route protection, design and construction
will be considered for future long term plans. It will form part of HCC’s 30
year infrastructure strategy.
27. In 2010/2011, HCC asked me to look at options to manage adverse
effects on the transport system. Figure 6 below illustrates the concept.
Ideally, there would be no gaps between the existing system (land use,
infrastructure, performance expectations and funding) and the expected
changes managed by the District Plan. The Network Tolerance Plan
13 Access is one consideration in land use planning and in some cases may be outweighed by other factors.
16

identified performance standards for the transport network, sensitive
areas requiring additional attention and options for triggering control or
management. These informed the development of the proposed District
Plan.
Figure 5: Network Tolerance Plan Concept
28. The combination of the LTP and PDP processes provides the community
with opportunities to balance encouraging growth and dealing with its
effects:
(a) LTP investment or lack of investment in infrastructure
improvements either facilitates or constrains growth.
(b) Growth takes up reserve network capacity and will result either in
a need for investment or a reduction in level of service.
This covers existing activities and expected (permitted) development.
29. The planning framework provides some flexibility through the consents
processes for unexpected development. The PDP manages potential
adverse effects on the transport system using methods including:
(a) A clear spatial framework with tighter controls through activity
descriptions and status to reduce the “unexpected” gap between
the existing system and expected growth. This allows that the LTP
infrastructure demands can better be defined for consideration for
inclusion as development contributions;
(b) A road hierarchy with rules and standards for access;
17

(c) Traffic generation triggers for assessment through Integrated
Transport Assessments including:
(i) Particular attention for sensitive areas;
(ii) Less demanding criteria for activities in the right zone;
(iii) More rigorous assessments for large traffic generators and
medium size activities that may be better located
elsewhere.
(d) Assessment criteria including some guidance on desirable network
performance14 and timeframes for traffic forecasts15;
(e) Providing for a level of discretion; and
(f) Linking status and assessment to financial contributions to cover
funding not covered by development contributions.
30. WRTM is currently being reviewed and updated to reflect the 2013 census
information and this should be available in 2014. Access Hamilton is also
being reviewed. The proposed Private Plan Change for Ruakura could
have an impact on take up rates and distribution of development in other
areas of the city. This would change the timing of future traffic demand
increases but is unlikely to significantly alter network conditions since it
should be expected to mitigate its own effects. My understanding of the
draft plan change is that there are infrastructure triggers and network
performance thresholds incorporated.
31. Based on the above, and my understanding of the network and land use
trends, I therefore consider that:
(a) HCC’s application of integrated transport planning in the Proposed
District Plan is reasonable;
(b) The existing and planned infrastructure is either adequate to deal
with the expected demand or the forecast deficiencies have been
identified for resolution or acceptance;
14 E.g. PDP Appendix 1.2 V7: i. An average delay per vehicle during Peak Periods on the approaches to intersections of no greater than: 55 seconds for the Strategic Network, Major and Minor Arterial transport corridors and 80 seconds for all other transport corridors…..” 15 10 years for simple assessments and 20 years for strategic network and major arterials.
18

THE IMPLICATIONS OF CHANGES IN ACTIVITIES AT TE RAPA
32. HCC staff asked me to comment on the potential traffic implications of
zoning changes in the Te Rapa North Suburban Centre. Some of the
changes to zoning (Business 4 in particular, which provides for large
format retail) will result in higher traffic generation than from the existing
zoning and consented activities. The changes are presented in Figures 6
and 7 below.
Figure 6: Comparison between Operative (left) and Proposed (Right) DP Zoning
Figure 7: Comparison between Notified and Recommended PDP Zoning
Industrial
Industrial
Industrial
Industrial Commercial
Service
Commercial Service
Business
Business
Industrial
Industrial
Industrial
Industrial Industrial
Industrial
Industrial Industrial
Industrial
19

33. However, the activities anticipated in the ODP are similar to those in the
PDP so the potential impact of the change in zoning is reduced. In
addition, potential traffic generation is moderated to an extent by greater
discretion for small scale retail, offices, dwellings and apartments.
Attachment 3 includes a comparison of activity status provided by HCC.
34. I have assessed an area as shown in Figure 3 below comprising
approximately 170ha including Rotokauri industrial east of the railway, the
Boulevard, The Base, Kawera Place/Eagle Way, Maui Street and Church
Road. The Base block makes up approximately 33ha. The Business 4
and Business 1 shaded blue to the east of Te Rapa Road is
approximately 25ha. North of Te Kowhai Road, the recommended change
(shaded yellow with dashed red outline) leaves approximately 6ha of 11ha
as notified.
Figure 8: Area Assessed and Main Zoning Differences
Nominal Boundary for my assessment
Recommended change from notified Business 4 to Industrial – was Commercial Service
Additional area sought by Porters
Additional Business 1 and 4 Zoning over Operative Industrial
20

35. There is a significant amount of commercial activity consented in the area
which means that a comparison with existing zones is not particularly
useful. In addition, and as noted in the evidence of Mr Brown, Mr Inder
and Mr Ryan, modelling does not presume 100% take up of all land but
rather a realistic level and type of development for 2021. I have taken
2021 as a representative year approximately equivalent to the ten year life
of the District Plan. The year is not significant. It is rather the level of
development that is assumed to take place for that scenario.
36. From that perspective, if we accept that the assumptions behind the
VISSIM and WRTM modelling that relate to the rate of development are
reasonable, then an additional area of land zoned for a particular activity
will have little impact other than providing a surplus in supply. Unless the
market is significantly constrained, it is unlikely to lead to a change in
demand and there would therefore be no change in traffic for the medium
term focus. The additional area of land zoned would ultimately lead to
higher traffic generation, but outside the period being considered.
37. However, in relation to the Proposed District Plan zoning at the Te Rapa
North Suburban Centre, submissions have:
(a) Supported the objectives and policies16
(b) Supported extensions to the Business 4 zoning17
(c) Expressed concern about the effects of additional traffic18
I have therefore considered the potential increase in traffic compared to
the 2021 forecast traffic generation19 rather than based on zoning.
38. Traffic modelling in the vicinity of Te Rapa has come under much scrutiny
recently for the Te Rapa Bypass investigations and development and
resolution of agreements between NZTA, HCC, Waikato DC and
developers/ landowners in the area.
39. The traffic models relevant to the Te Rapa area include:
(a) The VISSIM software model operated by BBO for Tainui Group
Holdings Ltd focussing on the vicinity of The Base; and,
(b) The Waikato Regional Traffic Model (WRTM) operated by TDG as
part of the Waikato Local Area Shared Services arrangement
covering the region.
16 608 Future Proof Implementation Committee 17 1153 Porter Development Ltd 18 1199 Tainui Group Holdings Ltd 19 2021 Land Use Trip Generation Model Workings, Opus 21/10/13.
21

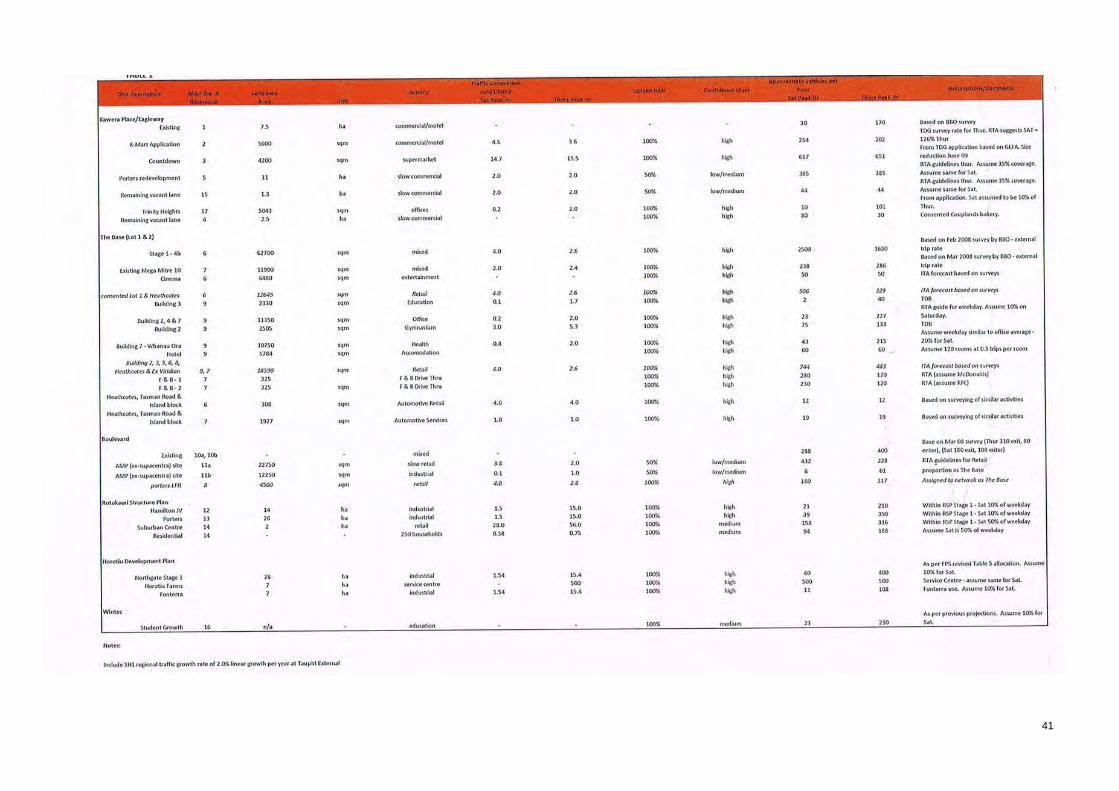
40. The underlying assumptions used as inputs for the VISSIM model are set
out in Mr Inder’s attachment 1. These include site areas, take up rates,
site coverage and traffic generation. The total traffic for relevant areas
identified in that attachment (dashed blue in Figure 1) is approximately
6,000 veh/hr pm peak.
Figure 9: Areas for comparison between modelled traffic generation
41. By comparison, the WRTM model suggests approximately 5,000 veh/hr
pm peak. This is a difference of approximately 20%. Reasons for this
difference could include:
(a) WRTM reflecting typical weekdays rather than the highest demand
days (Thursday and Saturday).
(b) Different take up rates – e.g. WRTM employment areas are often
moderated to achieve a closer match between jobs and
population;
22

(c) Differences in activity/zone boundaries; and,
(d) Multi-purpose and internal trips (e.g. shopping and eating within
The Base).
42. The differences between the model types make direct comparison
difficult. However, I consider that the VISSIM and WRTM model outputs
are sufficiently close to inform consideration of the potential effects on the
rest of the network.
43. There appears to be little dispute about the potential for higher traffic
generation rates. These are generally based on the difference between
the currently expected environment based on the Operative District Plan
zones and consented activities and the environment that would be
expected with development consistent with the Proposed District Plan
provisions. The PDP allows for large format retail with fewer controls. The
traffic evidence on behalf of submitters20 appears broadly consistent. Both
indicate an increase in rate from “slow commercial” at 2 trips/hr per
100m2 gross floor area (GFA) to around 4.5 trips/hr per 100m2 gross floor
area (GFA) and site coverage around 45% - 50% for commercial and
retail activities.
(a) Mr Inder expresses concern about the potential effects of
additional traffic and suggests additional modelling21.
(b) Mr Ryan considers the impact of a net increase in extent of
Business 4 and concludes that an additional 1,485 veh/hr22 will
have little additional impact on network performance.
44. The differences in opinion relate to the potential effects on the network.
Mr Inder raises concerns but does not quantify the total traffic or potential
impact. Extending the areas, site coverage and traffic generation rates
from the table in Mr Inder’s statement I infer (Attachment 3.1) an
additional 2,330 veh/hr (pm peak) but note that this could require
demolition and replacement of some relatively recent buildings. Based on
a coarse evaluation (Attachment 3.2) by gross land area and site
coverage assumptions I estimate approximately 2,200veh/hr extra
(Expected to PDP).
45. I arranged for intersection modelling using SIDRA based on:
20 1153 Ryan for Porter Development Ltd, 1199 Brown and Inder for Tainui Group Holdings Ltd 21 Inder paragraphs 3.3, 3.4. Note - My coarse check based on gross land areas = 2400 veh/hr 22 75% development of 11ha site by 2021= 135 veh/hr/ha. 100% would be 180 veh/hr/ha.
23

(a) Allocating a nominal 1,000 trips of the additional 2,330 veh/hr (pm
peak) to the vicinity of Eagle Way;
(b) Assigning the trips according to the approximate splits from
analysis of the modelled routes (WRTM) for pm peak traffic to and
from one of the nodes on Maui Street. This suggests that less than
30% of the traffic is to or from north or south using Te Rapa Road
with the rest dispersing via Te Kowhai and Church Road (20%)
and via Wairere Drive (40%). Any potential impact of the
difference in modelled values is therefore reduced. The nominal
1000 vehicles adds around 800 veh/hour to the intersection; and,
(c) Adding those to the WRTM flows for 2021 pm peak. WRTM
forecasts approximately 4,100veh/hr on approaches to the Te
Rapa Road/Eagle Way intersection during the pm peak hour in
2021.
46. The additional traffic results in:
(a) An increase in average pm peak period intersection delay/vehicle
from 48.6 seconds (Level of Service D) to 61.9 seconds (Level of
Service E) – i.e. 13 seconds/vehicle.
(b) The worst pm peak period approach delay changing from Eagle
Way at 55.2 seconds/vehicle (Level of Service E) to Te Rapa
South at 69 seconds/vehicle (Level of Service E).
The impact on level of service is broadly consistent with that presented by
Mr Ryan.
47. As another check I compared the pm peak performance in WRTM of the
Wairere Drive/Te Rapa Intersection in 2021 with the pm peak
performance in 2041. Model output extracts are included in Attachment 4.
There are an additional 205 veh/hr onto 2021’s 3,200 veh/hr which results
in an increase in the average delay of around 4 seconds. This is a
reasonable comparison because the additional traffic reduces as it
disperses through the network.
48. The assessment criteria in the PDP set a minimum desirable level of
service for intersections on major arterials and the strategic network of
less than 55 seconds average approach delay per vehicle, and would be
based on a 20 year traffic forecast. The additional traffic results in an
increase in the average approach delay and is at the fringes of the
minimum desirable level of service based on 140% to 150% of the 10
24

year expected23 development rate24. The change from 55.2 seconds to
69 seconds means that performance is less than desirable but still better
than the desirable minimum for the rest of the network (80 seconds).
49. It should be noted that there will be an increase in travel and transport
costs from the additional delay which should be considered against the
economic and strategic benefits from the additional development in this
location. I estimated the financial implications of the additional delays
(Attachment 5) as approximately $80,000/year. For the area affected this
represents around 2% of the land value and is therefore not significant in
relation to the potential economic benefit from intensification.
50. If there is additional demand for development of the Business 4 type, then
I consider that this area is a more appropriate location for zoning than
many areas. It has convenient access to the arterial road network in an
area where the Te Rapa Bypass provides an efficient alternative route to
protect access to the wider sub-regional network.
51. In summary, additional Business 4 zoning in Te Rapa will lead to
additional traffic and adverse effects on efficiency. However, for the ten
year planning horizon of the PDP realisation of these effects is more likely
to be related to demand and development rates than the additional area
allocated. For the foreseeable future the potential additional traffic is
likely to mean a minor change in network performance and lead to
expected interventions being required a few years earlier. More
significant long term effects are likely to be localised and could be
mitigated through network and travel demand management. In my
opinion the adverse effects on traffic are likely to be outweighed by wider
zoning and strategic land use pattern considerations and the difference is
not significant enough to worry about additional modelling at this stage.
CONCLUSIONS
52. I consider that:
(a) HCC’s application of integrated transport planning in the Proposed
District Plan is reasonable;
23 As referenced in the attachment to Mr Inder’s evidence, agreed between HCC, TGHL and NZTA for The Base modelling. 24 Approx. 2300veh/hr onto 5000 – 6000 veh/hr (Sections 34, 35 above)
25

Attachment 1: Strategic Road Network – Illustration showing local and regional consistency
27

Extract showing Regional Policy Statement - Map 6.1A: Significant transport corridors (Hamilton)
Approximate area covered by PDP Figure 15-5B
28

(Source: HCC: http://www.hamilton.co.nz/our-council/council- publications/operativedistrictplan/Documents/Operative%20District%20Plan%20Maps%20only%20-
%20linked%20-%20REDUCED%20-%20FEB%202013.pd 22/8/13)
Approximate area covered by PDP Figure 15-5B
29

Waikato Expressway Consultation Extracts (Source: ZTA - http://www.nzta.govt.nz/projects/hamilton/docs/hamilton-recommended-route-and-connections.pdf)
Approximate area covered by PDP Figure 15-5B
30
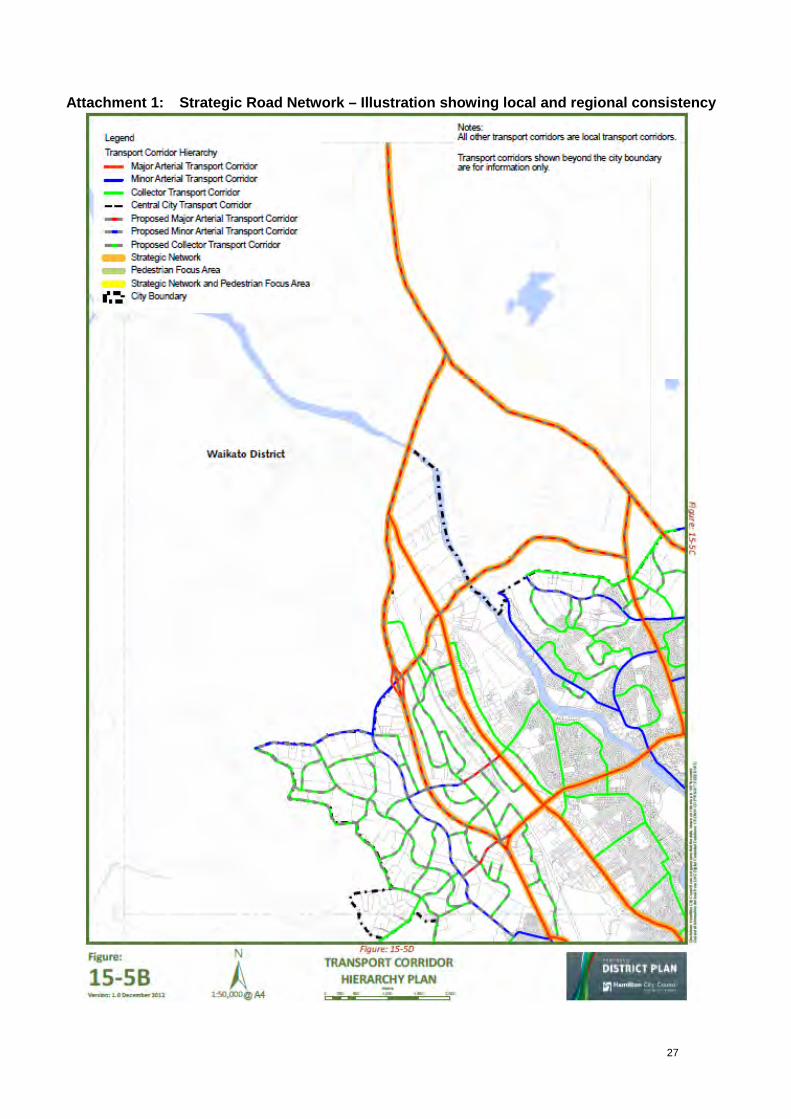
Extract from Access Hamilton – Proposed Strategic Network
Approximate area covered by PDP Figure 15-5B
31
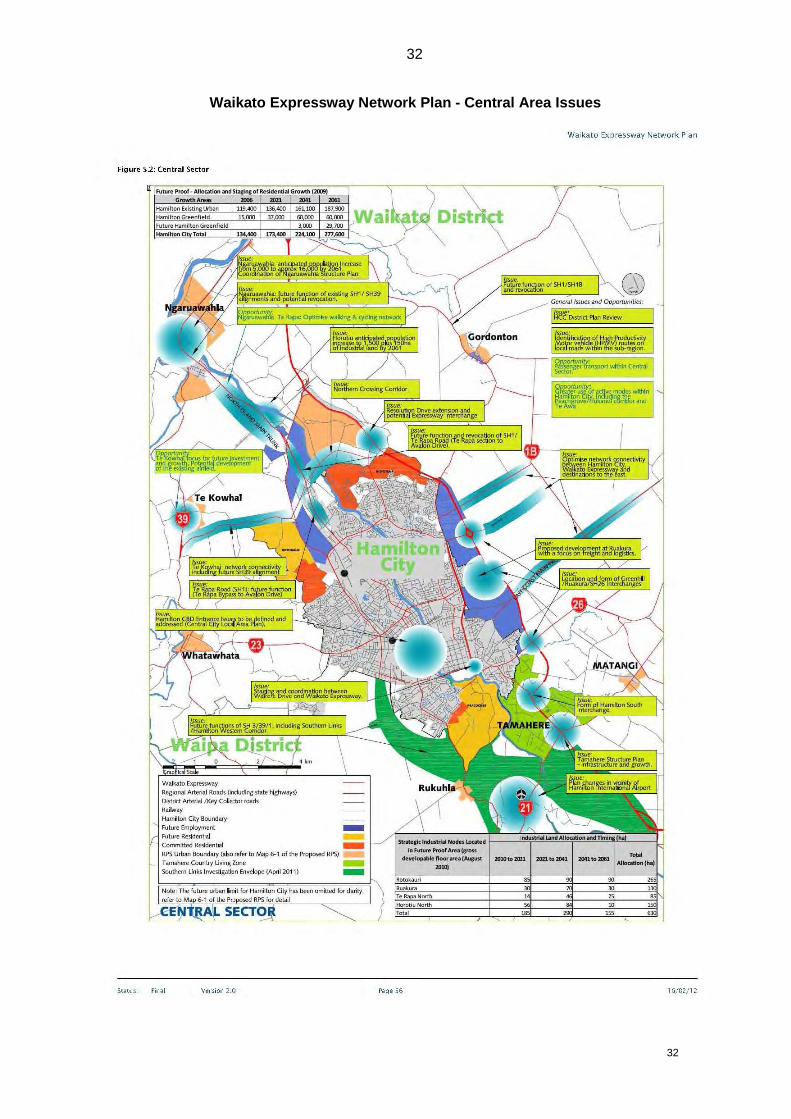
32
Waikato Expressway Network Plan - Central Area Issues
32

Attachment 2: Planning and Statutory Framework
(Source – http://www.pikb.co.nz/home/planning-and-statutory-framework/ 4/11/13)
Local Government Act – Strategic Objectives,
Responsibility for Road Transport Infrastructure
Passenger Transport Planning - Services
Road management responsibilities,
authority and funding assistance
Planning Framework, Zoning and Effects-based
Approach
Operative and Proposed Hamilton
District Plan Waikato and Waipa
District Plans
RPS Strategic Infrastructure
protection
10 year plan balancing funding,
costs and outcomes (Delivery for HCC’s Strategic
Framework)
Future Proof – Sub-regional land use now reflected in
Proposed RPS
E.g. Hamilton Ring Road, Te Rapa Section
of Expressway
Waikato Expressway
Network Plan
State Highway Network Operating
Plans, Network Improvement Plans
Hamilton Network Operating
Framework (NZTA and HCC)
Safety Objectives reflected in NZTA Funding Priorities
e.g. Rotokauri Structure
Plan
RPS Land Use Allocations
33

34
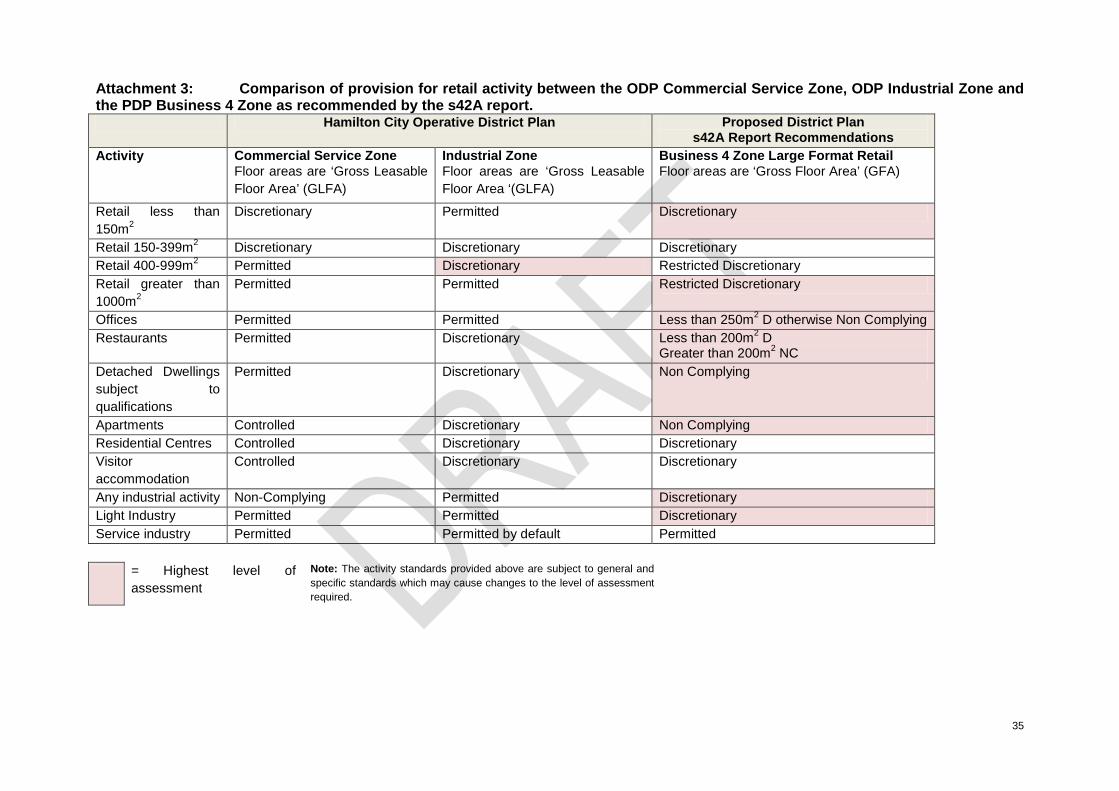
Attachment 3: Comparison of provision for retail activity between the ODP Commercial Service Zone, ODP Industrial Zone and the PDP Business 4 Zone as recommended by the s42A report.
Hamilton City Operative District Plan Proposed District Plan s42A Report Recommendations
Activity Commercial Service Zone Floor areas are ‘Gross Leasable Floor Area’ (GLFA)
Industrial Zone Floor areas are ‘Gross Leasable Floor Area ‘(GLFA)
Business 4 Zone Large Format Retail Floor areas are ‘Gross Floor Area’ (GFA)
Retail less than 150m2
Discretionary Permitted Discretionary
Retail 150-399m2 Discretionary Discretionary Discretionary Retail 400-999m2 Permitted Discretionary Restricted Discretionary Retail greater than 1000m2
Permitted Permitted Restricted Discretionary
Offices Permitted Permitted Less than 250m2 D otherwise Non Complying Restaurants Permitted Discretionary Less than 200m2 D
Greater than 200m2 NC Detached Dwellings subject to qualifications
Permitted Discretionary Non Complying
Apartments Controlled Discretionary Non Complying Residential Centres Controlled Discretionary Discretionary Visitor accommodation
Controlled Discretionary Discretionary
Any industrial activity Non-Complying Permitted Discretionary Light Industry Permitted Permitted Discretionary Service industry Permitted Permitted by default Permitted
= Highest level of assessment
Note: The activity standards provided above are subject to general and specific standards which may cause changes to the level of assessment required.
35

Attachment 4: Traffic Generation Comparisons 4.1 (Extension of Table in Statement of Evidence of Cameron Inder)
Modelled Site
Plan Area
# Size Unit GFA
(sqm) Modelled Activity
Peak Hour Trips/100sqm
modelled Modelled
Traffic
Peak Hour Trips/100sqm
PDP PDP
Traffic
Porters Te Rapa 5 6 ha 30000 Slow commercial 2 600 5 1350
AMP Site 11a 22750 sqm 22750 Slow retail 3.8 865 5 1024 Vacant land at Harvey Norman 11b 12250 sqm 12250 Industrial 0.1 12 5 551 Church Road Northern Corner - 4 ha 20000
Existing office/industry 1 200 5 900
Church Road Business 1 Zone 17 1500 sqm 1500 Offices 2 30 8 113 Church Road Business 1 Zone
North side 1500 sqm 1500
Existing Office/Industry 1 15 8 113
Total
Modelled 1722 Total PDP 4050 Additional Traffic = 2328
36

4.2 Coarse Assessment of Potential Traffic Generation Based on Gross Areas Affected
Proposed District Plan Gross
area (ha) Net Area
(70% - ha) Site
coverage GFA (sqm) Trips/100sqm
peak Trips
peak hr
Additional Traffic over
Expected
Additional Traffic over Operative
The Base South 19 13.3 50% 66500 4.5 2993 The Base North 16 11.2 50% 56000 4.5 2520 Harvey Norman vicinity 7 4.9 50% 24500 4.5 1103 East side Business 1 1 0.7 50% 3500 7.5 263 East side Business 4 24 16.8 50% 84000 4.5 3780 Balance Industrial 103 72.1 35% 252350 1 2524
Total 119
13181 2198 3164
Operative District Plan Gross
area (ha) Net Area
(70% - ha) Site
coverage GFA (sqm) Trips/100sqm
peak Trips
peak hr The Base South 19 13.3 50% 66500 4.5 2993 The Base North 16 11.2 50% 56000 4.5 2520 Harvey Norman vicinity 9 6.3 50% 31500 4.5 1418 East side Business 1 0 0 50% 0 7.5 0 East side Business 4 0 0 50% 0 4.5 0 Balance Industrial 126 88.2 35% 308700 1 3087
Total 119
10017 -966 0
Existing and Expected Gross
area (ha) Net Area
(70% - ha) Site
coverage GFA (sqm) Trips/100sqm
peak Trips
peak hr The Base South 19 13.3 50% 66500 4.5 2993 The Base North 16 11.2 50% 56000 4.5 2520 Harvey Norman vicinity 9 6.3 50% 31500 4.5 1418 East side Business 1 1 0.7 50% 3500 7.5 263 East side Business 4 (slower) 16 11.2 50% 56000 2 1120 Balance Industrial 109 76.3 35% 267050 1 2671
Total 119
10983 0 966
37
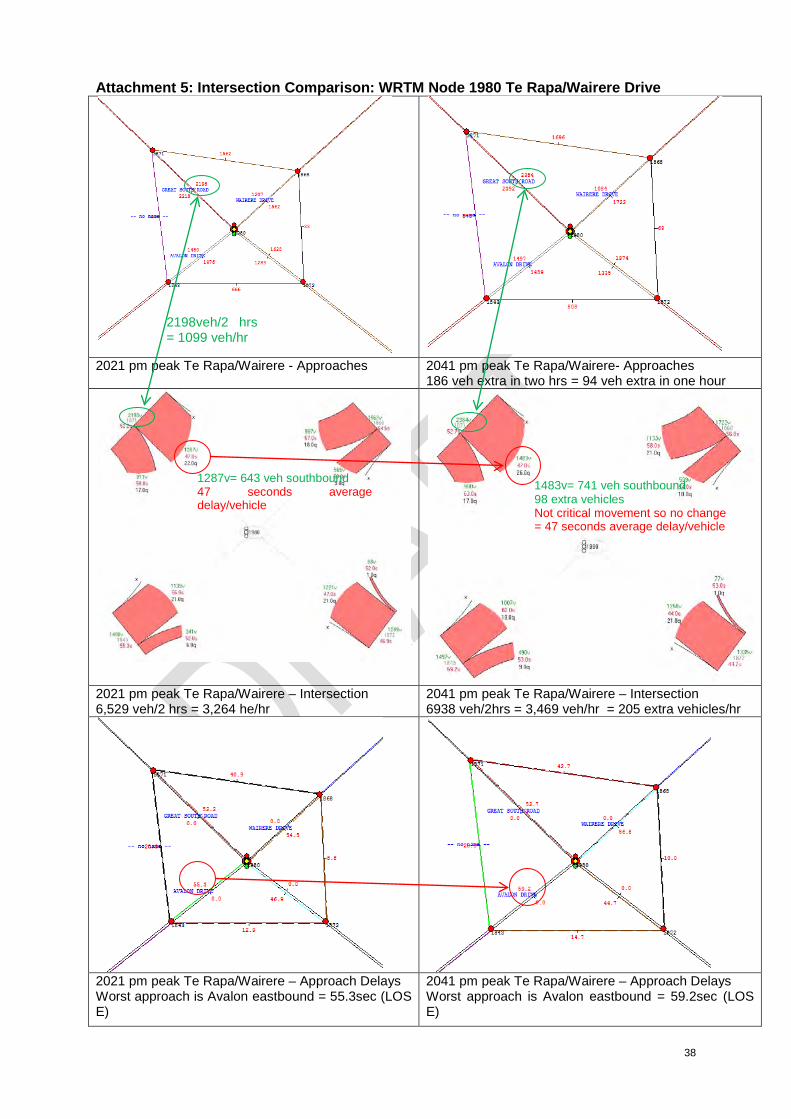
Attachment 5: Intersection Comparison: WRTM Node 1980 Te Rapa/Wairere Drive
2021 pm peak Te Rapa/Wairere - Approaches 2041 pm peak Te Rapa/Wairere- Approaches
186 veh extra in two hrs = 94 veh extra in one hour
2021 pm peak Te Rapa/Wairere – Intersection 6,529 veh/2 hrs = 3,264 he/hr
2041 pm peak Te Rapa/Wairere – Intersection 6938 veh/2hrs = 3,469 veh/hr = 205 extra vehicles/hr
2021 pm peak Te Rapa/Wairere – Approach Delays Worst approach is Avalon eastbound = 55.3sec (LOS E)
2041 pm peak Te Rapa/Wairere – Approach Delays Worst approach is Avalon eastbound = 59.2sec (LOS E)
2198veh/2 hrs = 1099 veh/hr
1287v= 643 veh southbound 47 seconds average delay/vehicle
1483v= 741 veh southbound 98 extra vehicles Not critical movement so no change = 47 seconds average delay/vehicle
38

Attachment 6: Travel Time Cost Implications of extra 1000 veh/hr (pm peak only)
Without extra traffic
With 1000 extra veh/hr
Average Intersection Delay 48.6 61.9 Sec Additional Travel Time/veh 13.3 Sec Number of vehicles/hr 4142 veh Periods/week 5 hours/week Weeks/year 48 weeks/year Urban arterial
Time/year 3673 veh-h/year afternoon peak update Value/hr $ 20.94 /veh-hr $ 14.96 1.4
Evaluation Period Amount Rounded to $10K
Discount Rate
Uniform Series Present Worth Factor
Travel Time Cost/year $76,918 $80,000
6% Travel Time Cost/year 1 $72,565 $70,000
USPWF1 0.9434
Travel Time Cost/10 years (Life of Plan) $582,941 $580,000
USPWF10 7.5787 Travel Time Cost/40 years (Economic
Evaluation Period) $1,191,719 $1,190,000
USPWF40 15.4933 net land with improved opportunities 17.5 ha
(Te Rapa Road west side - Carters $1.7M/0.906ha, Porters $5.4M/3.9944ha)
Value/ha (2012 rating valuation(ish)) $1,500,000 /ha Land value $26,250,000 Increase in value required to deliver return $580,000 Delay Cost
$26,250,000 Land Value 2.2% Increase required (e.g. From $1.35M/ha to $1.38M/ha) Compared to Loan Cost of Holding Land $80,000 Delay Cost/year Cost of Holding Land over 1 year $1,968,750 Loan Cost/year 7.50% 4.1% Relative cost
39

Attachment 7: Attachment from Statement of Evidence of C Inder (4 November 2013) Addressing Chapter 6 – Business 1 – 7 Zones
40
41