before independent hearing commissioners … · fonterra ltd / fonterra co-operative group ltd ......
TRANSCRIPT
STATEMENT OF PRIMARY EVIDENCE OF BAS VEENDRICK FOR FONTERRA LTD
HYDROLOGY
8 MARCH 2018
Counsel Instructed B J Matheson Richmond Chambers PO Box 1008 Shortland Street Auckland 1140
BEFORE INDEPENDENT HEARING COMMISSIONERS
AT WHAKATANE
IN THE MATTER of the Resource Management Act 1991
AND
IN THE MATTER of the hearing of submissions on Proposed Plan Change 9 to the Bay of Plenty Regional Plan
2
Fonterra Ltd / Fonterra Co-operative Group Ltd Submissions on Proposed Plan Change 9 to the Bay of Plenty Regional Plan
1. EXECUTIVE SUMMARY
1.1 Fonterra operates a dairy manufacturing site in Edgecumbe, which
can process up to approximately 4.2 million litres of whole-milk per
day. Fonterra takes water from the Rangitaiki River at Edgecumbe
for use in their operation (Industrial Processing and Cooling). A
portion of the waste water generated on site along with the cooling
water is discharged back into the Rangitaiki.
1.2 My analyses of the take and discharge data indicate that the volume
of water discharged back to the river is approximately 73 – 80% of
the water that is taken from the river. Consequently the take can
be considered partially non-consumptive. Whilst this discharge might
not occur all the time, when limits or restrictions are imposed on
abstractions, a credit should be given for the volume of water
returned to the river. From a technical perspective I consider that
this (partially) non-consumptive nature of the take should be
recognised in PC9.
1.3 In addition submitters have proposed different minimum flows than
those proposed in PC9 as well as proposed additional wording to
policies which could be interpreted as requiring certain abstractions
to cease at particular times.
1.4 The Department of Conservation’s (DOC) submission to PC9 sought to
replace the interim minimum flows proposed in PC9 with the interim
minimum flows in the proposed National Environmental Standard
(proposed NES) on Ecological Flows and Water Levels (Ministry for
the Environment, 2008). PC9 proposes a continuation of the status
quo with a minimum flow of 90% of the Q5 7 day low flow and an
allocation of 10% of the Q5 7 day low flow. I consider that the
proposed interim limits in PC9 are conservative and appropriate until
catchment specific limits are developed for the Bay of Plenty region.
1.5 The Rangitaiki River at Te Teko is the flow recorder used by BOPRC
to calculate the minimum flow and allocation for the lower
Fonterra Ltd / Fonterra Co-operative Group Ltd Submissions on Proposed Plan Change 9 to the Bay of Plenty Regional Plan
3
Rangitaiki River downstream of the Matahina Hydro Electric Power
Scheme (Matahina HEPS). Using the available flow data for this
recorder site would result in a minimum flow of 32.97 m3/s for PC9
(90% of the Q5 7 day low flow) and 33.80 m3/s based on the
minimum flow proposed in the DOC submission (80 % of the 7D
MALF). Increasing the minimum flow to the interim minimum flow
detailed in the proposed NES, as proposed in the DOC submission,
will result in a lower reliability of supply for abstractive users in the
lower Rangitaiki River compared to the reliability of supply under
PC9.
1.6 DOC seeks changes to Policy WQ P4 and proposes to add specific
flow thresholds (flows between 1.5 and 3 times the median flow) to
maintain flow variability in rivers and streams. The proposed
additional wording to this policy could require abstractions to cease
when flows are between 1.5 and 3 times the median flow, which
would decrease the reliability of supply for abstractors.
1.7 In general terms the taking of water has the potential to reduce
fresh and flood flows and flow variation, which is an important
aspect of a river flow regime. The flow regime in the lower
Rangitaiki River is strongly influenced by the Matahina Hydro Electric
Power Scheme. My analyses of the flow data for the Rangitaiki River
at Te Teko indicates that flow variability is predominantly
influenced by the operation of the Mathina HEPS and abstracting 10%
of the Q5 7 day low flow has little effect on flow variability. For
rivers not influenced by ‘peaking’ from hydro electric power
schemes the proposed interim allocation limit in PC9 (10% of the 7
day mean annual low flow) is sufficiently (and conservatively) small
that flow variability is unlikely to be affected.
1.8 In addition I note that the size and frequency of flushing flows
required to remove periphyton are catchment specific and as such
specific flow thresholds should not be applied on a region wide
basis. The appropriate time to incorporate specific flow thresholds
for periphyton removal (if considered to be an issue in specific
Fonterra Ltd / Fonterra Co-operative Group Ltd Submissions on Proposed Plan Change 9 to the Bay of Plenty Regional Plan
4
catchments) would be when catchment specific limits are
developed.
2. INTRODUCTION
2.1 My name is Bas Veendrick. I am a Water Services Leader in the
Christchurch office of Pattle Delamore Partners Ltd. My
qualifications are Master of Science (Hydrology) and Bachelor of
Science (Physical Geography). I am a member of the New Zealand
Hydrological Society.
2.2 I have 13 years professional work experience as a senior hydrologist
and environmental scientist. I specialise in surface water
assessments, irrigation and hydropower project and hydrological and
hydraulic modelling.
2.3 Since 2008 I have been employed by Pattle Delamore Partners
Limited (PDP), an environmental consulting firm specialising in
surface water and groundwater investigations. During my
employment with PDP I have carried out work and presented
evidence for both large scale irrigation schemes, individual
irrigators, regional authorities and the Environmental Protection
Agency. The following is a short summary of some of the relevant
work I have carried out:
Hurunui Water Project, Waitohi Irrigation and Hydro Project
Hydrology assessment associated with the resource consent
applications for the Waitohi Irrigation & Hydro Scheme. Irrigation
supply - demand modelling to determine the irrigation requirements
for the area and to size the storage reservoirs for a 58,500 ha
proposed irrigation scheme. Presentation of evidence at resource
consent hearing for the take and use of water from the Hurunui
River.
Fonterra Ltd / Fonterra Co-operative Group Ltd Submissions on Proposed Plan Change 9 to the Bay of Plenty Regional Plan
5
Environmental Protection Agency, Ruataniwha Water Storage
Proposal
Completeness check of consent application documents for the
proposed Ruataniwha Storage Scheme with regard to all the surface
water and irrigation assessments. The proposed scheme consists of a
93 million m3 storage reservoir in the Makaroro River (Hawkes Bay)
which will irrigate an area of approximately 25,000 ha.
Environment Bay of Plenty, Kaituna River Re-diversion and
Maketu Estuary Enhancement
Expert peer review of all hydrological and morphological
assessments for the project. The proposed re-diversion will
significantly increase the (freshwater) volume flowing from the
Kaituna River into Maketu Estuary with the aim to improve the water
quality, ecosystem health and cultural values.
Environment Canterbury, Waitohi Catchment Investigations
Investigation into surface and groundwater interaction in the
Waitohi Catchment. Analyses of water quantity and water quality
data in the Waitohi Catchment and Amuri Reach of the Hurunui
River. The report summarising the technical work will be used to
assist Environment Canterbury with water quantity and water quality
limit setting during the development of one of the sub-regional plans
(the Hurunui- Waiau Zone).
Tim Wilding and Jane Andrew Ltd (Conway River Plan
Change)
Assessment of proposed environmental flow and allocation regime
for the Conway River. Hydrological analysis regarding the impact of
different proposed flow regimes and surface water takes on river
flows and irrigation reliability of supply. Presentation of evidence at
the Conway River Plan Change hearing.
Fonterra Ltd / Fonterra Co-operative Group Ltd Submissions on Proposed Plan Change 9 to the Bay of Plenty Regional Plan
6
Dairy Holdings Ltd
Assessment of proposed environmental flow and allocation regime
for the Ashburton River and hydrological analysis regarding the
impact of the proposed flow regimes on irrigation reliability of
supply for irrigators. Presentation of evidence at the Canterbury
Land and Water Plan hearing.
2.4 In summary I have a large amount of experience with environmental
flow and allocation regimes and have analysed the impact of
minimum flows and allocation limits on river flow patterns and
reliability of supply.
2.5 I provide the following statement of evidence in support of the
submissions lodged by Fonterra Ltd for Proposed Plan Change 9 (PC9)
to the Bay of Plenty regional Water and Land Plan.
Code of Conduct
2.6 Although this is a Council hearing, I have read the Environment
Court's Code of Conduct and agree to comply with it. My
qualifications as an expert are set out above. I confirm that the
issues addressed in this statement of evidence are within my area of
expertise.
Scope of Evidence
2.7 Submitters have proposed different minimum flows than those
proposed in PC9 as well as proposed additional wording to policies
which could be interpreted to require the imposition of ‘take
cessations’ for abstractions. In addition PC9 does not appear to
allow for partially non-consumptive takes.
2.8 My evidence will focus on these items and will cover the following
matters:
Fonterra Ltd / Fonterra Co-operative Group Ltd Submissions on Proposed Plan Change 9 to the Bay of Plenty Regional Plan
7
A description of the Fonterra take of water from and
discharge of water to the Rangitaiki River at Edgecumbe for
industrial processing and cooling;
An analysis of Fonterra’s data for the take of water from and
discharge to the Rangitaiki River at Edgecumbe;
An analysis of the minimum flows proposed by submitters and
a comparison with the minimum flows proposed in PC9;
An analysis of the flow data for the Rangitaiki River at Te
Teko to describe the flow pattern in the lower Rangitaiki
River in relation to flushing flows; and
An analysis of flow data for Waimapu Stream to demonstrate
the difference in flow pattern and influence of the proposed
allocation in PC9 on flow variability.
3. FONTERRA’S MANUFACTURING OPERATIONS AT EDGECUMBE
3.1 Fonterra operates a dairy manufacturing site in Edgecumbe, which
currently processes approximately 4.2 million litres of whole-milk
per day. Production occurs predominantly from August through to
May, whereas production is minimal during June and July.
Wastewater, cooling water and water treatment solids from the
manufacturing process is discharged onto farmland across the
Rangitaiki Plains and also to the Rangitaiki River.
3.2 Resource Consent 62000 authorises Fonterra to take water from the
Rangitaiki River at Edgecumbe for use in their operation (Industrial
Processing and Cooling). Under this consent the daily quantity of
water taken from the river shall not exceed 30,000 cubic metres and
the rate of abstraction shall not exceed 900 litres per second. This
consent expires 30 June 2023.
3.3 Resource consent 02-4211 authorises Fonterra to discharge cooling
water, wastewater and water treatment solids to the Rangitaiki
Fonterra Ltd / Fonterra Co-operative Group Ltd Submissions on Proposed Plan Change 9 to the Bay of Plenty Regional Plan
8
River. The daily quantity of water discharged shall not exceed
30,000 cubic metres and 900 litres per second.
3.4 Resource consent 02-4606 authorises Fonterra to discharge cooling
water (from the Grantee’s distillery at Edgecumbe) into the
Rangitaiki River. The daily quantity of water discharged shall not
exceed 6,000 m3.
3.5 I note that both discharge consents described above are now expired
but continue to be operated under Section 124 of the Act as further
detailed in the evidence of Mr. Willis.
4. NON-CONSUMPTIVE WATER TAKE
FONTERRA’S SUBMISSION
4.1 Section 4.2 to 4.5 of my evidence relates to item 23 and 24 in
Fonterra’s submission to PC9 which proposes changes to Policy WQ
P31 and Rule WQ R10. In summary the relief sought relates to
recognition of the non-consumptive nature of some of the surface
water takes in the Bay of Plenty Region (such as Fonterra’s surface
water take from the Rangitaiki River). Details of the specific relief
sought to Policy WQ P31 and Rule WQ R10 is set out in the evidence
of Mr. Willis.
ANALYSES OF TAKE AND DISCHARGE DATA
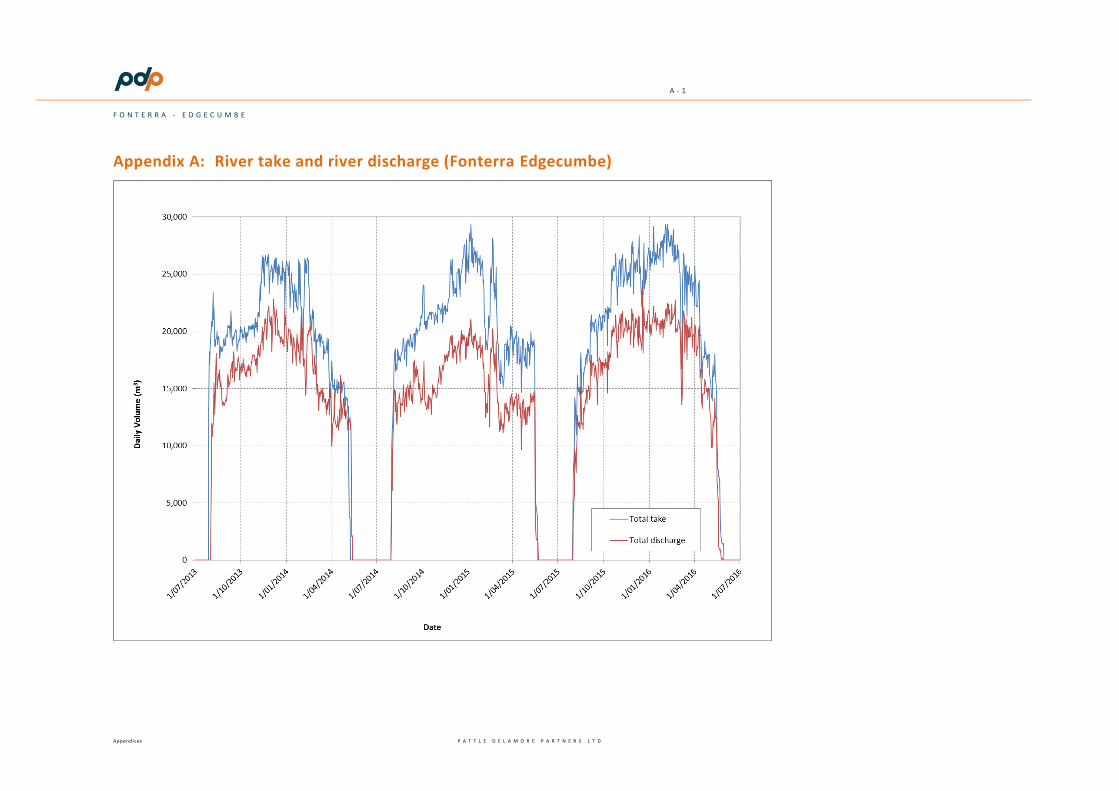
4.2 Fonterra has provided me with the available data for the water take
from the Rangitaiki River along with the total daily amount of water
discharged back to the river at Edgecumbe (from consent 02-4211
and 02-4606). Appendix A shows a graph with the total daily volume
of water taken and discharged between July 2013 and June 2016.
The data indicates that Fonterra’s Edgecumbe site generally takes
and discharges water between early August through to mid/late May
each year. No milk processing is undertaken outside this period.
Fonterra Ltd / Fonterra Co-operative Group Ltd Submissions on Proposed Plan Change 9 to the Bay of Plenty Regional Plan
9
4.3 As shown on the graph, when water is taken from the Rangitaiki
River, water is also discharged into the river. Although some water is
discharged back onto land, a portion of the wastewater generated
along with the cooling water is discharged back into the river.
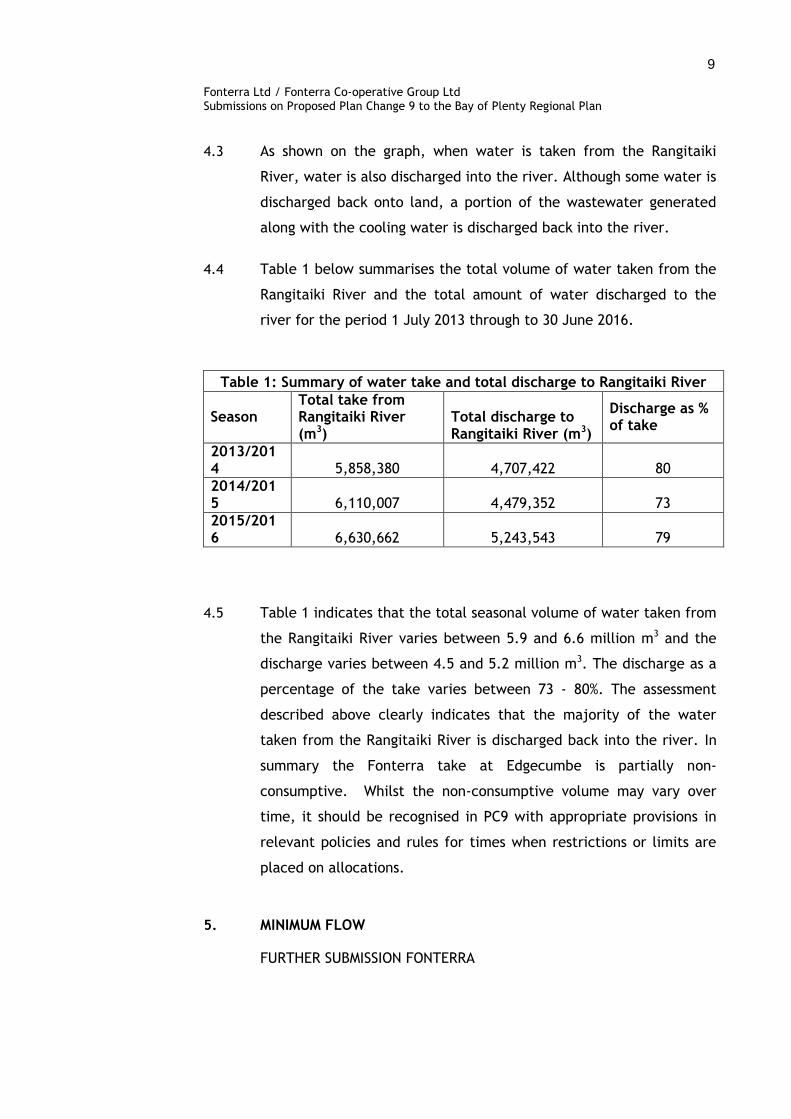
4.4 Table 1 below summarises the total volume of water taken from the
Rangitaiki River and the total amount of water discharged to the
river for the period 1 July 2013 through to 30 June 2016.
Table 1: Summary of water take and total discharge to Rangitaiki River
Season Total take from Rangitaiki River (m3)
Total discharge to Rangitaiki River (m3)
Discharge as % of take
2013/2014 5,858,380 4,707,422 80
2014/2015 6,110,007 4,479,352 73
2015/2016 6,630,662 5,243,543 79
4.5 Table 1 indicates that the total seasonal volume of water taken from
the Rangitaiki River varies between 5.9 and 6.6 million m3 and the
discharge varies between 4.5 and 5.2 million m3. The discharge as a
percentage of the take varies between 73 - 80%. The assessment
described above clearly indicates that the majority of the water
taken from the Rangitaiki River is discharged back into the river. In
summary the Fonterra take at Edgecumbe is partially non-
consumptive. Whilst the non-consumptive volume may vary over
time, it should be recognised in PC9 with appropriate provisions in
relevant policies and rules for times when restrictions or limits are
placed on allocations.
5. MINIMUM FLOW
FURTHER SUBMISSION FONTERRA
Fonterra Ltd / Fonterra Co-operative Group Ltd Submissions on Proposed Plan Change 9 to the Bay of Plenty Regional Plan
10
5.1 The Department of Conservation (DOC) in its submission to PC9
sought to replace the interim minimum flows proposed in PC9 with
the interim minimum flows in the proposed National Environmental
Standard (proposed NES) on Ecological Flows and Water Levels
(Ministry for the Environment, 2008). However, it proposes to retain
the interim allocation limit (10% of the Q5 7D low flow) as proposed
in PC9. PC9 proposes a continuation of the status quo with a
minimum flow of 90% of the Q5 7 day low flow and an allocation of
10% of the Q5 7 day low flow. Fonterra opposes the replacement of
minimum flows with the proposed NES interim limits as proposed by
DOC.
5.2 The interim limits in the proposed NES specify a minimum flow and
allocation limit based on a percentage of the 7 day mean annual low
flow (7D MALF). The 7D MALF is calculated by calculating the daily
moving average over the last seven days. The lowest (7 day) flow for
each year is then averaged across the available flow record. That is
in contrast to the Q5 7 day low flow in PC9 which is the 7 day low
flow value which has a 20% probability of occurring in any one year.
5.3 For rivers and streams with a mean flow of less than or equal to 5
m3/s the proposed NES specifies an interim minimum flow of 90% of
the 7D MALF and and interim allocation limit of 30% of the 7D MALF.
For rivers and streams with a mean flow greater than 5 m3/s the
proposed NES specifies an interim minimum flow of 80% of the 7D
MALF and an interim allocation limit of 50% of the 7D MALF. It is
worth noting that the proposed NES was prepared in 2008. It has
never progressed past the submissions stage and given the length of
time since its preparation seems unlikely to ever become a NES.
Therefore it has no official status to provide a minimum flow and
allocation regime for PC9.
MINIMUM FLOW ANALYSIS
5.4 The National Institute of Water and Atmospheric research (NIWA) has
provided me with the available flow data for the Rangitaiki River at
Fonterra Ltd / Fonterra Co-operative Group Ltd Submissions on Proposed Plan Change 9 to the Bay of Plenty Regional Plan
11
Te Teko. This flow recorder is used by BOPRC to calculate the
minimum flow and allocation for the lower Rangitaiki River
downstream of the Matahina Hydro Electric Power Scheme (Matahina
HEPS) which is operated by TrustPower. A map with the location of
the Matahina HEPS, the Rangitaiki at Te Teko flow recorder and the
Fonterra site at Edgecumbe is shown in Appendix B of my evidence.
5.5 Using the available flow data for the Rangitaiki at Te Teko provides
a Q5 7 day low flow of 36.63 m3/s and a 7D MALF is 42.26 m3/s. This
would result in a minimum flow of 32.97 m3/s for PC9 (90% of the Q5
7 day low flow) and 33.80 m3/s based on the minimum flow proposed
in the DOC submission (80 % of the 7D MALF). I note that the
Rangitaiki River has a mean flow greater than 5 m3/s and as such an
interim minimum flow of 80% of the 7D MALF is applicable when
using the proposed NES.
5.6 In summary the submission from DOC to replace the minimum flows
with those in the proposed NES would result in an increase in the
minimum flow for the lower Rangitaiki River compared to the
minimum flows proposed in PC9. This would result in a lower
reliability of supply for abstractive users in the lower Rangitaiki
River compared to the reliability of supply under PC9.
5.7 In addition to my comments on the minimum flow I note that DOC
mixes the 7D MALF and Q5 7 day low flow in its submission. In other
words DOC proposes to retain the (conservatively small) allocation
limit proposed in PC9 (i.e. 10% of Q5 7 day low flow) but proposes to
increase the minimum flow (from 90% of the Q5 7 day low flow to
80% of the 7D MALF). As detailed in section 5.2 of my evidence
above the allocation limit in the proposed NES for rivers and stream
with a flow of more than 5 m3/s is 50% of the 7D MALF which is
significantly greater than 10% of the Q5 7 day low flow. For example
for the Rangitaiki River at Te Teko PC9 results in an allocation limit
of around 3.66 m3/s (10% of Q5 7 day low flow) whereas the
proposed NES results in an allocation of 21.1 m3/s (50% of 7D MALF).
Fonterra Ltd / Fonterra Co-operative Group Ltd Submissions on Proposed Plan Change 9 to the Bay of Plenty Regional Plan
12
5.8 An environmental flow regime for a river or stream is a combination
of a minimum flow and an allocation limit. It is the combination of
these two components that determines the effect on the flow
regime of a river or stream and the effect on instream values. For
most rivers and streams the PC9 minimum flow (90% of Q5 7 day low
flow) is likely to be slightly lower than the minimum flow propsed by
DOC (based on the proposed NES) however the proposed allocation
limit under PC9 is significantly smaller than what is in the proposed
NES.
5.9 Overall I therefore consider that the proposed interim limits in PC9
are conservative and appropriate until catchment specific limits are
developed for the Bay of Plenty region. Increasing the minimum
flow to the interim minimum flow detailed in the proposed NES, as
proposed in the DOC submission will result in a lower reliability of
supply for abstractive users in the lower Rangitaiki River compared
to the reliability of supply under PC9. The PC9 interim limits are
intended to be in place only until BOPRC develops catchment-
specific limits. At that stage, catchment specific minimum flows and
allocation limits should be developed taking into account local
knowledge and expertise of the river system and the abstractive uses
of the water.
6. FLOW VARIABILITY
FURTHER SUBMISSION FONTERRA
6.1 DOC seeks changes to Policy WQ P4 and proposes to add specific
flow thresholds to maintain flow variability in rivers and streams.
DOC proposes to add at the end of Policy WQ P4:
‘Including flows that are between 1.5 to 3 times the median flow
to scour and flush periphyton and cyanobacteria accumulation,
mobilise and transport bed material, trigger flow dependent
aquatic life cycle processes such as fish migration and provide for
recreational and tangata whenua values.’
Fonterra Ltd / Fonterra Co-operative Group Ltd Submissions on Proposed Plan Change 9 to the Bay of Plenty Regional Plan
13
6.2 The proposed additional wording to this policy could be interpreted
as requiring abstractions to cease when flows are between 1.5 and 3
times the median flow. In addition, the size and frequency of
flushing flows required are catchment specific and as such specific
flow thresholds should not be applied on a region wide basis.
Fonterra seeks to reject this additional wording.
FLUSHING FLOW ANALYSIS
6.3 In general terms the taking of water has the potential to reduce
fresh and flood flows and I agree that flow variation is an important
aspect of a flow regime for the reasons outlined in the DOC
submission (i.e. flush periphyton, mobilisation and transport of bed
material etc.). However, the size and frequency of flushing flows
required are catchment specific and depends on items such as river
geomorphology, substrate etc.
6.4 Biggs (2000) and Biggs and Stockseth (1996) suggest that (depending
on water temperature and water quality) periphyton may grow to
nuisance levels during prolonged periods of low, stable flows. High
flows can be beneficial for removing periphyton accrual from the
riverbed due to abrasion, dislocation, and/or bed mobilisation. The
period in between these flushing flows is often called accrual time.
This is the time during which periphyton is able to grow and
accumulate. An increase in accrual time (for example as a result of
increased abstraction) may contribute to periphyton build up in
rivers.
6.5 A recent draft report from NIWA (April 2017) labelled ‘Analysis of a
three-year database of periphyton biomass and cover in Canterbury
Rivers’ analyses the magnitude of the flow that effectively removes
periphyton to low levels. This report uses the term ‘effective flow’
to describe the flow required to remove periphyton from the
riverbed and concludes that the ‘effective flow’ (flood threshold)
required for removing periphyton varied between 1.5 and 10 x
median flow as between rivers.
Fonterra Ltd / Fonterra Co-operative Group Ltd Submissions on Proposed Plan Change 9 to the Bay of Plenty Regional Plan
14
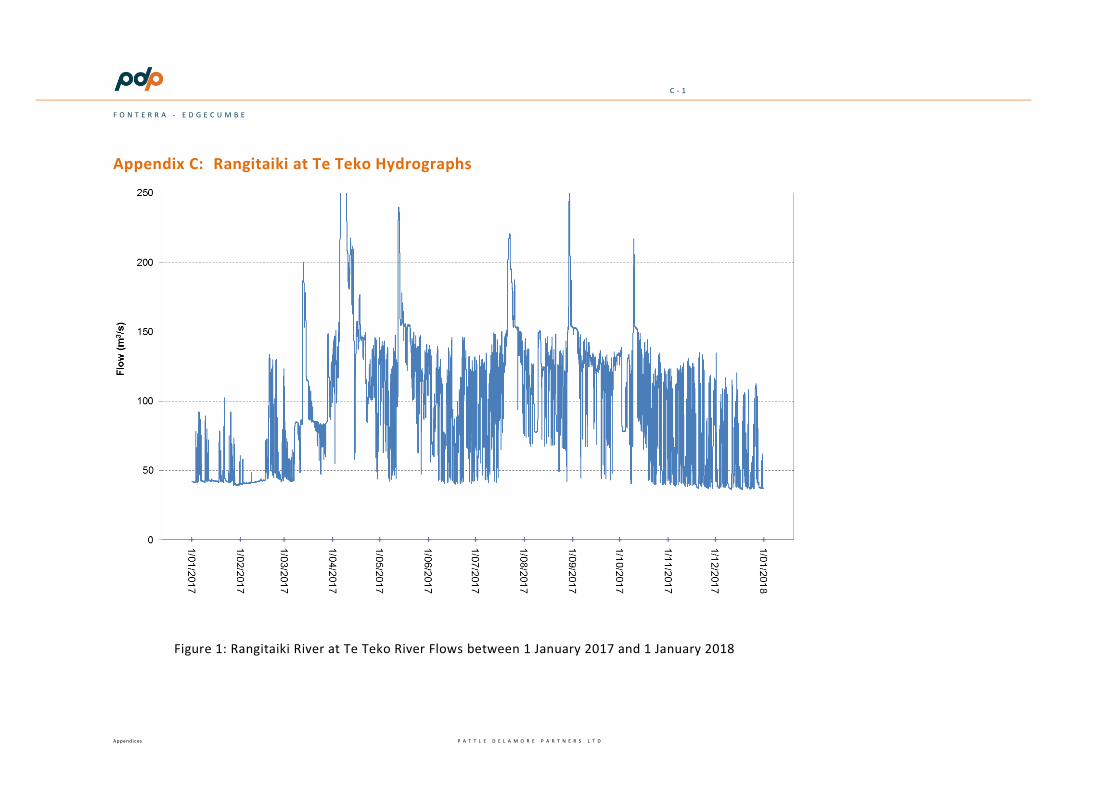
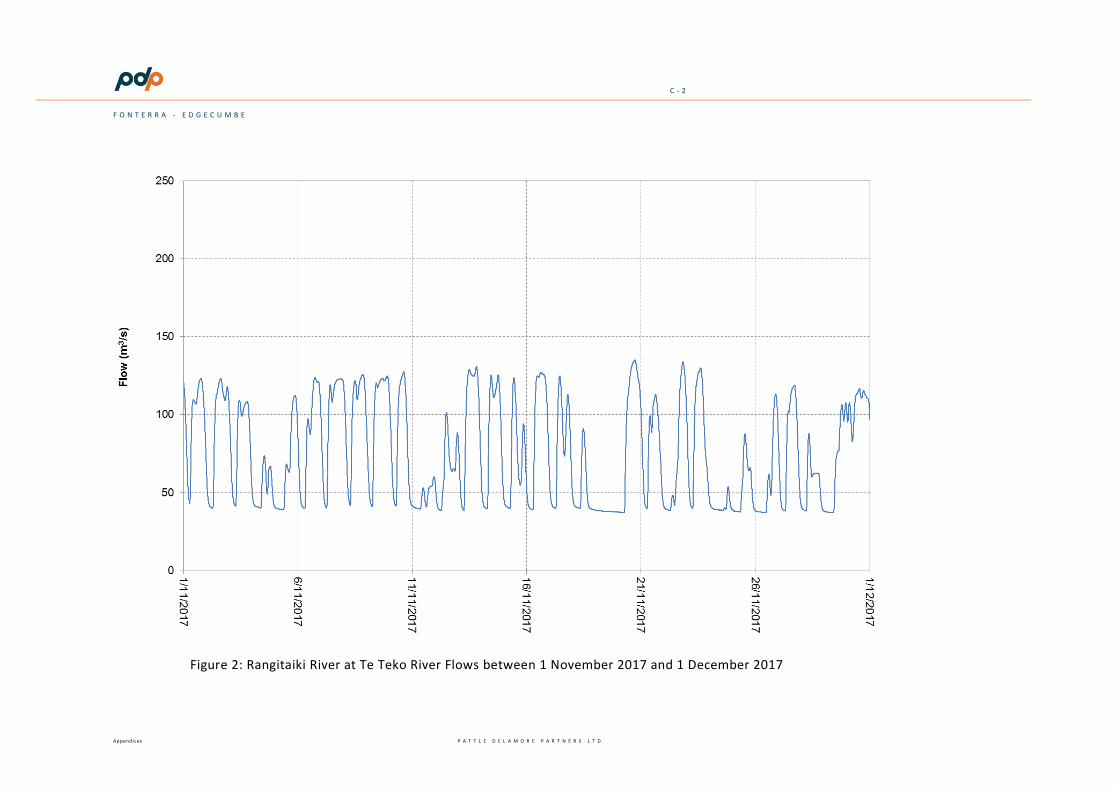
6.6 Appendix C to my evidence provides two hydrograph of the flows in
the Rangitaiki River at Te Teko from 1 January 2017 through to 31
December 2017 as well as a hydrograph for November 2017. These
hydrographs indicate that the flow regime in the Rangitaiki River
downstream of the Matahina Dam is strongly influenced by
TrustPower Limited’s (TPL) Matahina Hydro Electric Power Scheme
(Matahina HEPS). The hydrographs indicate the typical ‘peaking’ of
the power scheme with high flows during the day and low flows at
night. These hydrographs indicate that flow variability in the lower
Rangitaiki River is predominantly influenced by the operation of
Mathina HEPS. Flows in the lower Rangitaiki River therefore typically
experience large daily fluctuations in river flow and as such there
are no prolonged periods of low stable flow in the lower Rangitaiki
River. The graphs in Appendix C indicate typical daily fluctuations in
flow from around 30 – 40 m3/s at night and around 70 - 130 m3/s
during the day. This compares to an allocation limit of around 3.66
m3/s (10% of Q5 7 day low flow) for the lower Rangitaiki River as
detailed in section 5.7 of my evidence.
6.7 In summary the proposed additional wording to Policy WQ P4 to add
specific flow thresholds to maintain flow variability (i.e. flows
between 1.5 to 3.0 times the median) should not be applied on a
region wide basis. Flow variability in the lower Rangitaiki River is
predominantly influenced by the Matahina HEPS and abstracting 10%
of the Q5 7 day low flow has little effect on flow variability.
6.8 In order to provide an indication of the effect of the (primary)
allocation limit in PC9 on flow variability on a river in the Bay of
Plenty Region that is not influenced by hydro-electric peaking I have
modelled the abstraction of the primary allocation limit (10% of the
Q5 7 day low flow) on Waimapu Stream. The reason for choosing
this river is that there is currently only 2.1 L/s allocated from this
stream which indicates that the flow regime measured at the
recorder site is largely unmodified. This stream is located near
Fonterra Ltd / Fonterra Co-operative Group Ltd Submissions on Proposed Plan Change 9 to the Bay of Plenty Regional Plan
15
Tauranga and flows into the Waimapu Estuary as shown in Appendix
D.
6.9 BOPRC provided me with the flow record for the Waimapu Stream at
McCarroll. This flow recorder has an available flow record from
February 1991 through to February 2018, a flow record of
approximately 27 years.
6.10 The Q5 7 day low flow for this river is 705 L/s (BOPRC, October
2016) which results in a minimum flow of 634 L/s (90% of Q5 7 day
low flow) and an allocation of 70.5 L/s (10% of Q5 7 day low flow). I
have modelled the effect of this allocation on the flow regime of the
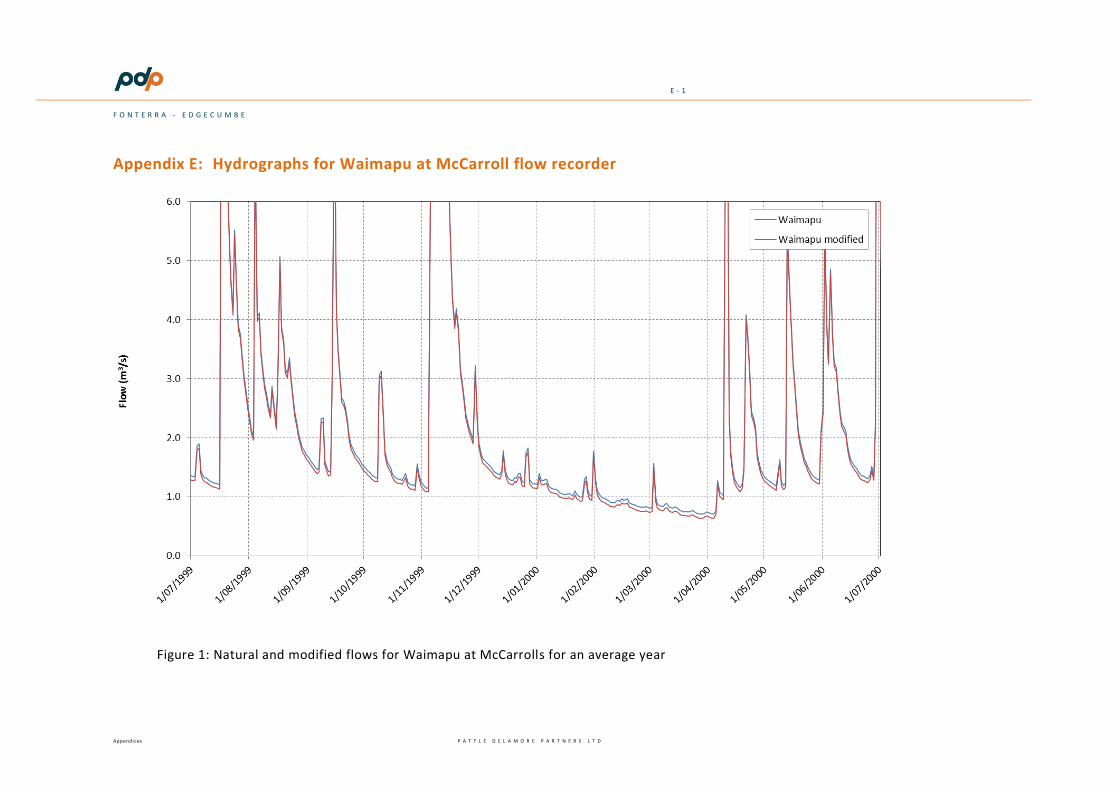
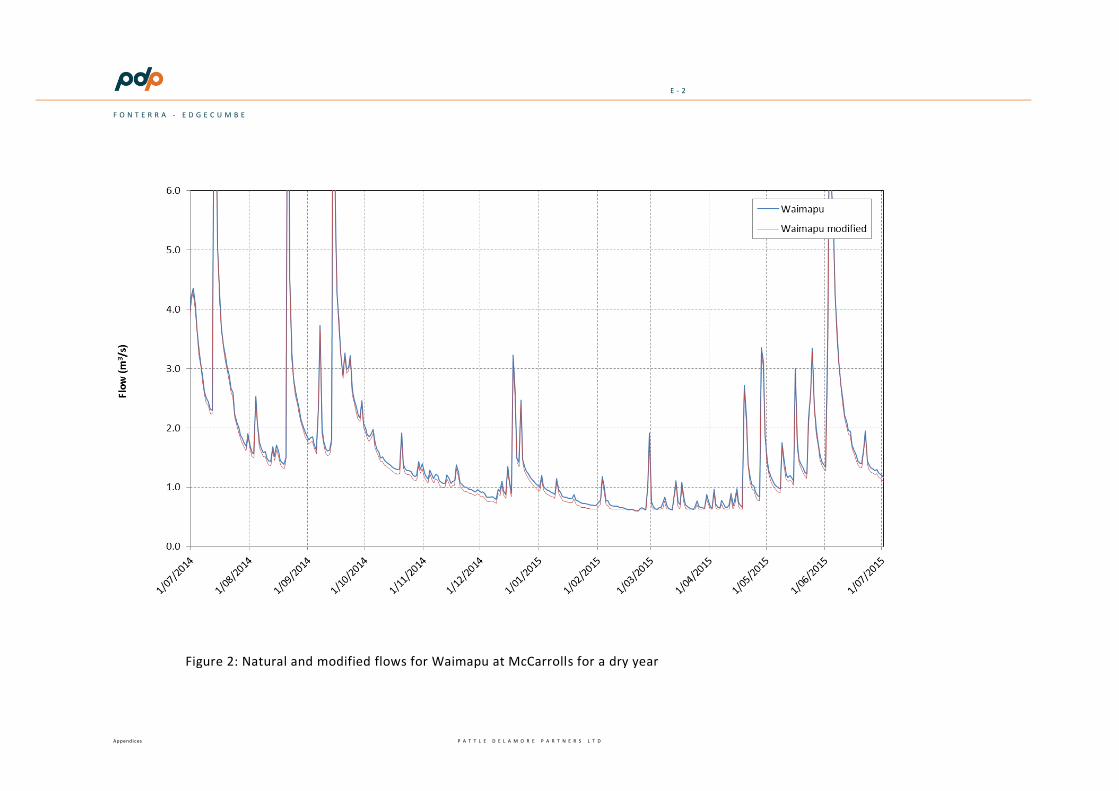
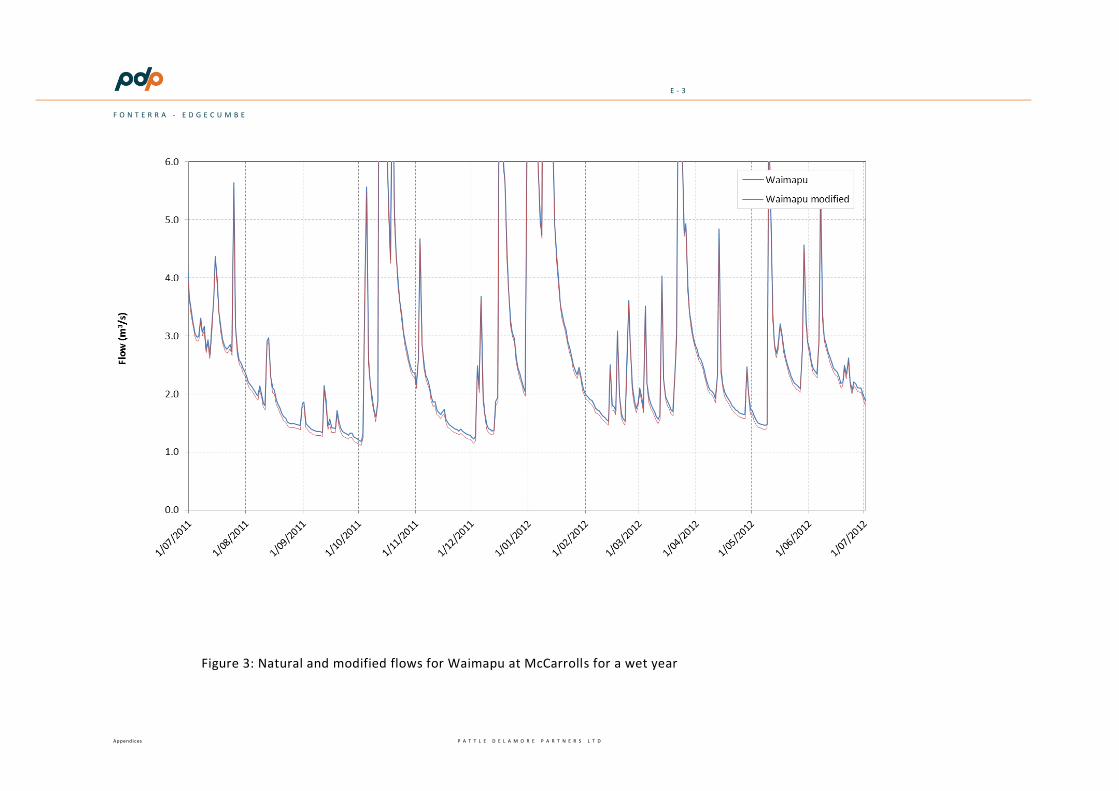
river. Example hydrographs for Waimapu Stream at McCarroll for
wet, average and dry years are included in Appendix E. As can be
seen the effect of abstracting 10% of Q5 7 day low flow on flood
flows and flow variability is minimal.
6.11 The FRE3 statistic is a measure of the frequency at which flood flows
occur on an annual basis. Specifically, the FRE 3 statistic is the mean
annual frequency at which the flow exceeds three times the median
flow. Table 2 summarises the FRE3 statistic for the natural and
modified flows and provides an indication of the change in the
frequency of flood flows as a result of abstracting 10 % of the Q5 7
day low flow. The table also includes the mean and maximum
accrual time.
Table 2: FRE3 statistic for natural and modified flow (Waimapu at McCarroll)
Scenario Mean number of distinct events per annum
Mean number of days absent (accrual time)
Maximum number of days absent (accrual time)
Natural 8.0 32.6 260
Modified 7.9 32.9 260
6.12 As can be seen, abstracting 10% of the Q5 7 day low flow has little
(if any) effect on the number of flood flow events and/or the mean
and maximum accrual time.
Fonterra Ltd / Fonterra Co-operative Group Ltd Submissions on Proposed Plan Change 9 to the Bay of Plenty Regional Plan
16
6.13 As previously indicated the flow required to remove periphyton
varies greatly between rivers and as such a flow of 3 times the
median may not be the appropriate flow required for removing
periphyton for the Waimapu River. I have therefore also calculated
the change in the number of flood flow events and accrual time
using a flow of 1.5 and 10 times the median flow. Using these
thresholds the effect of the allocation proposed under PC9 (10% of
the Q5 7 day low flow) on the number of flood events and accrual
time is similarly small.
6.14 In summary I conclude that the proposed interim allocation limit in
PC9 (10% of the 7 day mean annual low flow) is sufficiently (and
conservatively) small that flow variability is unlikely to be affected.
Adding specific flood flow thresholds to Policy WQ P4 to maintain
flow variability is therefore not considered to be required. The
proposed additional wording to this policy could be interpreted to
require an unreasonable imposition of ‘take cessations’ for
abstractions when flows are between 1.5 and 3 times the median
flow which would decrease the reliability of supply for abstractors.
6.15 In addition the size and frequency of flushing flows required to
remove periphyton are catchment specific and as such specific flow
thresholds should not be applied on a region wide basis. The
appropriate time to incorporate specific flow thresholds for
periphyton removal (if considered to be an issue in specific
catchments) would be when catchment specific limits are
developed.
7. CONCLUSIONS
7.1 Based on the information and assessment carried out and presented
in my evidence I conlude the following:
• The majority of the Fonterra take (at Edgecumbe) from the
Rangitaiki River is discharged back into the river and as such
is partially non-consumptive. Whilst this return discharge
Fonterra Ltd / Fonterra Co-operative Group Ltd Submissions on Proposed Plan Change 9 to the Bay of Plenty Regional Plan
17
might not always occur, from a technical perspective I
consider that its effect should be recognised in PC9 with
appropriate provisions in relevant policies and rules related
to the imposition of limits on abstractions.
• The proposed interim limits in PC9 are conservative and
appropriate until catchment specific limits are developed for
the Bay of Plenty region. Increasing the minimum flow to the
interim minimum flow detailed in the proposed NES, as
proposed in the DOC submission will result in a lower
reliability of supply for abstractive users in the lower
Rangitaiki River compared to the reliability of supply under
PC9.
• Adding specific flood flow thresholds to Policy WQ P4 to
maintain flow variability (as proposed in the DOC submission)
is therefore not considered to be required. The proposed
additional wording (by DOC) to this policy could be
interpreted to require the imposition of ‘take cessations’ for
abstractions when flows are between 1.5 and 3 times the
median flow which would decrease the reliability of supply
for abstractors.
• Flow variability in the lower Rangitaiki River is predominantly
influenced by the Matahina HEPS and abstracting 10% of the
Q5 7 day low flow has little effect on flow variability in the
lower Rangitaiki River. For rivers not influenced by ‘peaking’
from hydro electric power schemes the proposed interim
allocation limit in PC9 (10% of the 7 day mean annual low
flow) is sufficiently (and conservatively) small that flow
variability is unlikely to be affected.
• The size and frequency of flushing flows required to remove
periphyton are catchment specific and as such specific flow
thresholds should not be applied on a region wide basis. The
appropriate time to incorporate specific flow thresholds for
Fonterra Ltd / Fonterra Co-operative Group Ltd Submissions on Proposed Plan Change 9 to the Bay of Plenty Regional Plan
18
periphyton removal (if considered to be an issue in specific
catchments) would be when catchment specific limits are
developed. However this is unlikely to be required for the
lower Rangitaiki River because of the peaking operation of
the Matahina Dam.
Bas Veendrick
8 March 2018
REFERENCES
Bay of Plenty Regional Council (October 2016), Assessment of water
availability and estimates of current allocation levels.
Biggs, B.J.F. (2000), Eutrofication of streams and rivers: dissolved nutrient –
chlorofyll relationships for benthic algae. Journal of the North
American Benthological Society 19(1): 17-31.
Biggs, B.J.F. and Stockseth, S. (1996), Hydraulic habitat suitability for
periphyton in rivers. Regulated Rivers 12, 251 – 261.
Ministry for the Environment (2008), Proposed National Environmental
Standard on Ecological Flows and Water Levels. Discussion
Document.
National Institute of Water and Atmospheric Research (April 2017). Draft
report: Analysis of a three- year dataset of periphyton biomass and
cover in Canterbury Rivers. Prepared for Environment Canterbury.
A - 1
F O N T E R R A - E D G E C U M B E
Appendices P A T T L E D E L A M O R E P A R T N E R S L T D
D
R
A
F
T
Appendix A: River take and river discharge (Fonterra Edgecumbe)
B - 1
F O N T E R R A - E D G E C U M B E
Appendices P A T T L E D E L A M O R E P A R T N E R S L T D
D
R
A
F
T
Appendix B: Location of Matahina HEPS, Rangitaiki at Te Teko flow recorder and Fonterra Edgecumbe site
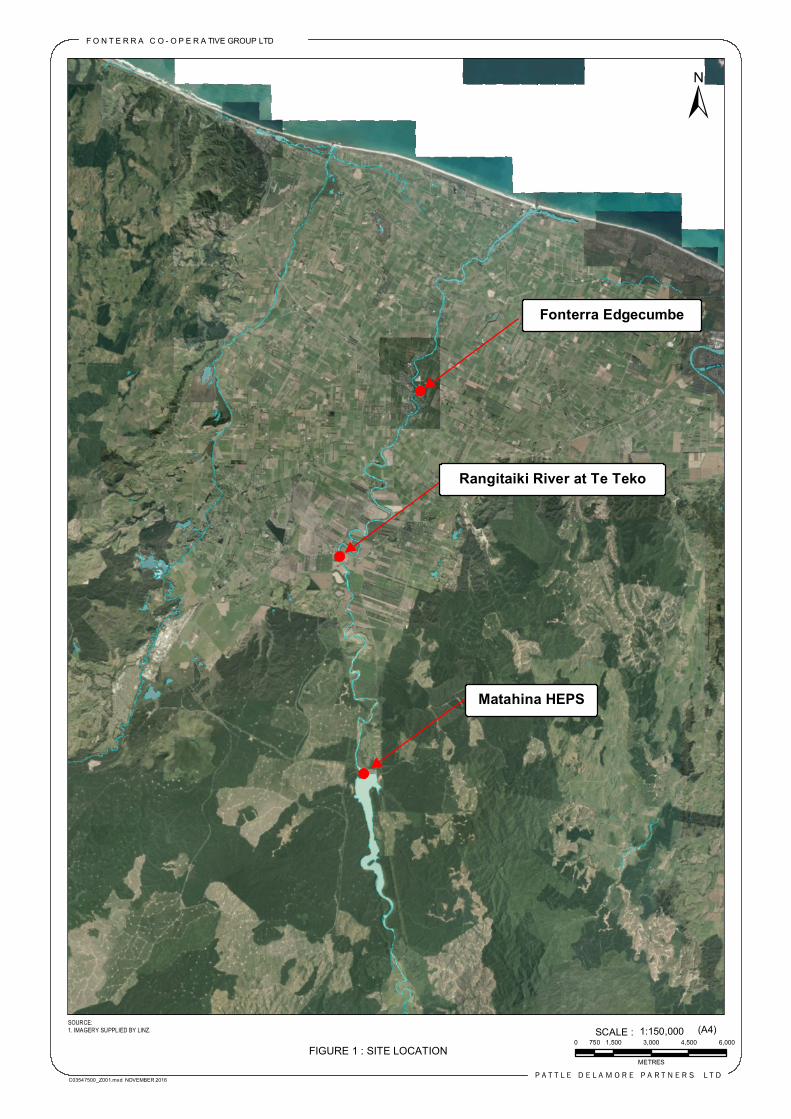
FIGURE 1 : SITE LOCATIONP A T T L E D E L A M O R E P A R T N E R S L T D
SCALE : 1:150,000 (A4)0 1,500 3,000 4,500 6,000750
METRES
F O N T E R R A C O - O P E R A TIVE GROUP LTD
C03547500_Z001.mxd NOVEMBER 2016
SOURCE:1. IMAGERY SUPPLIED BY LINZ.
±
Fonterra Edgecumbe
Matahina HEPS
Rangitaiki River at Te Teko
C - 1
F O N T E R R A - E D G E C U M B E
Appendices P A T T L E D E L A M O R E P A R T N E R S L T D
D
R
A
F
T
Appendix C: Rangitaiki at Te Teko Hydrographs
Figure 1: Rangitaiki River at Te Teko River Flows between 1 January 2017 and 1 January 2018
C - 2
F O N T E R R A - E D G E C U M B E
Appendices P A T T L E D E L A M O R E P A R T N E R S L T D
D
R
A
F
T
Figure 2: Rangitaiki River at Te Teko River Flows between 1 November 2017 and 1 December 2017

D - 1
F O N T E R R A - E D G E C U M B E
Appendices P A T T L E D E L A M O R E P A R T N E R S L T D
D
R
A
F
T
Appendix D: Waimapu Stream and flow recorder
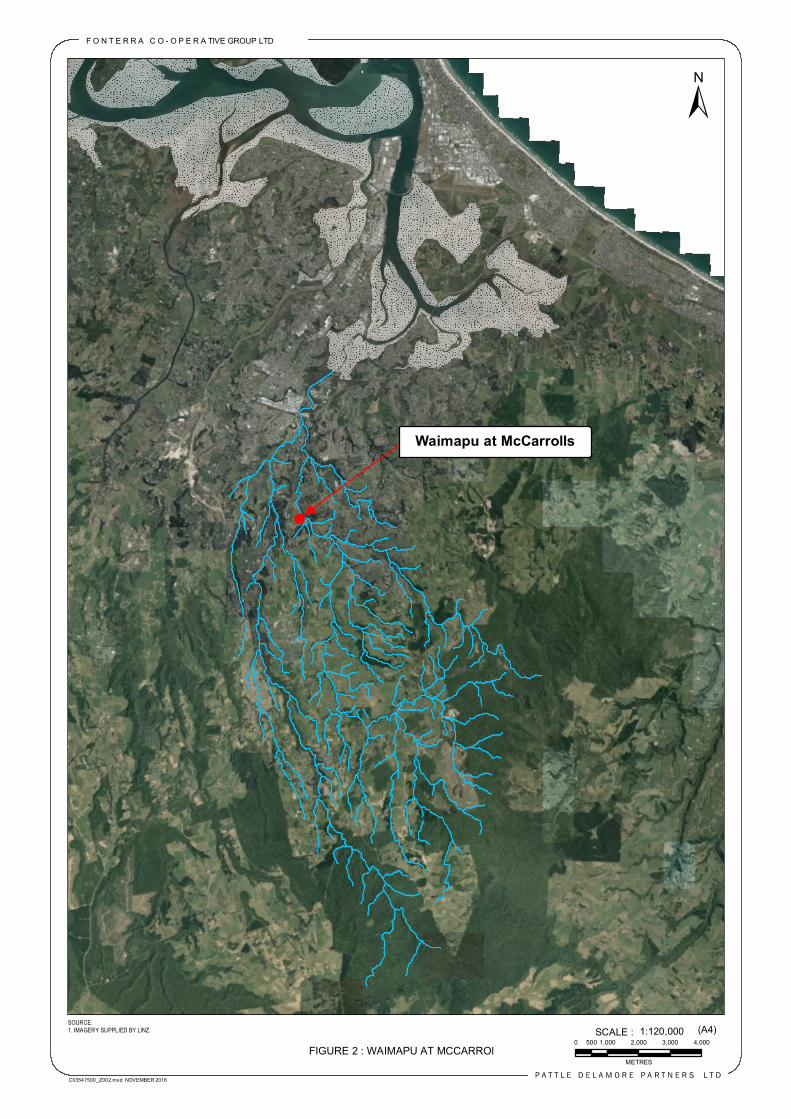
FIGURE 2 : WAIMAPU AT MCCARROlP A T T L E D E L A M O R E P A R T N E R S L T D
SCALE : 1:120,000 (A4)0 1,000 2,000 3,000 4,000500
METRES
F O N T E R R A C O - O P E R A TIVE GROUP LTD
C03547500_Z002.mxd NOVEMBER 2016
SOURCE:1. IMAGERY SUPPLIED BY LINZ.
±
Waimapu at McCarrolls
E - 1
F O N T E R R A - E D G E C U M B E
Appendices P A T T L E D E L A M O R E P A R T N E R S L T D
D
R
A
F
T
Appendix E: Hydrographs for Waimapu at McCarroll flow recorder
Figure 1: Natural and modified flows for Waimapu at McCarrolls for an average year
E - 2
F O N T E R R A - E D G E C U M B E
Appendices P A T T L E D E L A M O R E P A R T N E R S L T D
D
R
A
F
T
Figure 2: Natural and modified flows for Waimapu at McCarrolls for a dry year
E - 3
F O N T E R R A - E D G E C U M B E
Appendices P A T T L E D E L A M O R E P A R T N E R S L T D
D
R
A
F
T
Figure 3: Natural and modified flows for Waimapu at McCarrolls for a wet year