fonterra dairy for life...fonterra dairy for life annual review 2017 fonterra co-operative group...
TRANSCRIPT
FONTERRA DAIRY FOR LIFE
ANNUAL REVIEW 2017FONTERRA CO-OPERATIVE GROUP LIMITED
This document is printed on an environmentally responsible paper produced using elemental chlorine free (ECF)FSC® certified mixed source pulp, sourced from well managed and legally harvested forests, and manufactured under the strict ISO14001 environmental management system.
FON
TERRA A
NN
UA
L REVIEW
2017
FINANCIAL YEAR 2017 TOTAL DIVIDEND PER SHARE
TOTAL CASH PAYOUT FOR 2016/17 SEASON
GROUP NORMALISED EBIT (NZD)
NET PROFIT AFTER TAX (NZD)
FARMERS TOOK ADVANTAGE OF INTEREST-FREE AND DEFERRED PAYMENTS
GROUP VOLUMEADDITIONAL MILK CONVERTED INTO CONSUMER AND FOODSERVICE
FONTERRA FARM SOURCE™ REWARDS AND BENEFITS AND DISCOUNTS
GROUP REVENUE
4,000 $50M 576
NEW ZEALANDMILK COLLECTION FOR THE 2016/17 SEASON
INVESTING IN TECHNOLOGY AND PEOPLE FOR THE FUTURE
CREATING SUSTAINABLE VALUE FOR ALL STAKEHOLDERS
$6.52 $1,155M
40CPS $745M
1,526 11%
OUR CO-OPERATIVE
OUR PERFORMANCE
OUR POTENTIAL
M KGMS
$19B
DEMAND-LED STRATEGY TO OPTIMISE NEW ZEALAND MILK, SUPPORTED BY MILK POOLS
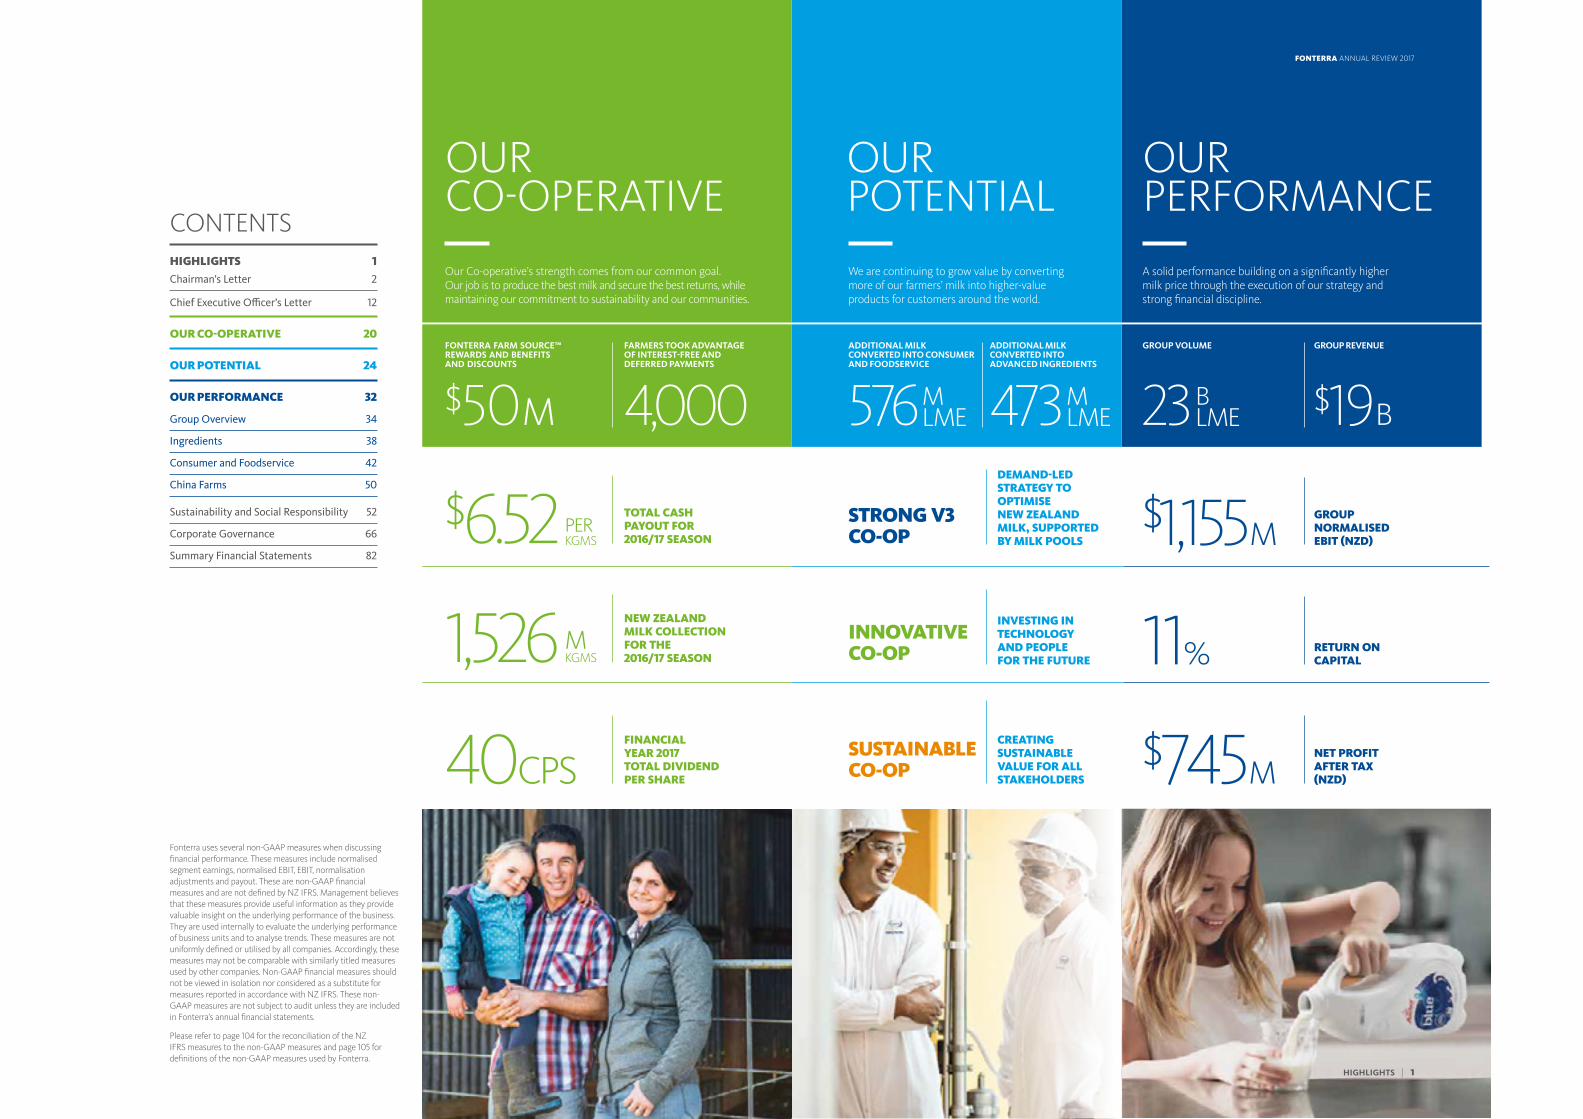
Our Co-operative’s strength comes from our common goal. Our job is to produce the best milk and secure the best returns, while maintaining our commitment to sustainability and our communities.
We are continuing to grow value by converting more of our farmers’ milk into higher-value products for customers around the world.
A solid performance building on a significantly higher milk price through the execution of our strategy and strong financial discipline.
M LME
ADDITIONAL MILK CONVERTED INTO ADVANCED INGREDIENTS
Fonterra uses several non-GAAP measures when discussing financial performance. These measures include normalised segment earnings, normalised EBIT, EBIT, normalisation adjustments and payout. These are non-GAAP financial measures and are not defined by NZ IFRS. Management believes that these measures provide useful information as they provide valuable insight on the underlying performance of the business. They are used internally to evaluate the underlying performance of business units and to analyse trends. These measures are not uniformly defined or utilised by all companies. Accordingly, these measures may not be comparable with similarly titled measures used by other companies. Non-GAAP financial measures should not be viewed in isolation nor considered as a substitute for measures reported in accordance with NZ IFRS. These non-GAAP measures are not subject to audit unless they are included in Fonterra’s annual financial statements.
Please refer to page 104 for the reconciliation of the NZ IFRS measures to the non-GAAP measures and page 105 for definitions of the non-GAAP measures used by Fonterra.
HIGHLIGHTS 1Chairman’s Letter 2
Chief Executive Officer’s Letter 12
OUR CO-OPERATIVE 20
OUR POTENTIAL 24
OUR PERFORMANCE 32
Group Overview 34
Ingredients 38
Consumer and Foodservice 42
China Farms 50
Sustainability and Social Responsibility 52
Corporate Governance 66
Summary Financial Statements 82
CONTENTS
RETURN ON CAPITAL
23B LME473M
LME
STRONG V3 CO-OP
INNOVATIVE CO-OP
SUSTAINABLE CO-OP
PER KGMS
HIGHLIGHTS | 1
FONTERRA ANNUAL REVIEW 2017
2 | LETTER FROM THE CHAIRMAN
FONTERRA ANNUAL REVIEW 2017
This reflects the positive performance across the business, with the final Farmgate Milk Price of $6.12 per kgMS and a dividend of 40 cents per share from an earnings per share of 46 cents.
Our Co-operative’s ability to maintain its forecast dividend despite a 57 per cent increase in the Farmgate Milk Price over the year is an excellent result. In delivering it, the business managed the downside of relative stream returns of $180 million, by maintaining an owners’ mind-set that continued to drive new revenue streams and improve accountability for costs in the business.
The result comes after two seasons of low global prices and is pleasingly $1.47 kgMS ahead of DairyNZ’s on-farm breakeven point for the season. Our transparent Farmgate Milk Price and demand-led strategy of shifting more milk into higher value products have seen the total payout to our New Zealand farmers largely return to parity when compared to farmers internationally.
We knew that the events which impacted global dairy markets from 2013 – 2015 did not represent a structural shift in prices. It is a credit to our farmers who responded to the circumstances, sharpening their systems, maximising the natural strength of New Zealand’s pasture-based model to reduce costs, and in all cases made significant personal sacrifices through this sustained low milk price period.
Prolonged wet weather in many regions over the 2017 season made farming conditions difficult, contributing to a decline in milk volumes of three per cent to 1,526 million kgMS. However the increased Farmgate Milk Price offset this and means our farmers will receive more than $3 billion additional payments compared to last year.
Farmers will be focused now on carrying their cost efficiencies and pasture-based advantages through to the new season to make the most of improving prices.
STRONGER TOGETHERWe have helped farmers keep their costs down by lowering the cost of farm supplies through our Farm Source™ stores and by offering competitive terms. More than 4,000 shareholders and sharemilkers took advantage of extended interest free and deferred payment terms and $17.8 million worth of Farm Source™ Rewards Dollars over the year.
Our Farm Source™ store offering has delivered the average sized Fonterra farm approximately 10 cents per kgMS in savings and rewards if they purchased farm supplies exclusively with Farm Source™.
Improvements in the forecast Farmgate Milk Price over the season will trigger a first repayment of the Fonterra Support Loan when the total advance rate exceeds $6.00 in October.
It was pleasing to be able to use the financial strength of the Co-operative to help farmers during this time. The loan, launched in the 2015/16 season, was interest free until May 31 2017. It was taken up by 76 per cent of farmers and $383 million in support was provided. After the October 2017 payment, there will be $190 million outstanding.
Our regional leadership model is going from strength to strength, connecting our local farmers and their communities with our management team so they are more responsive to local needs.
There have been many examples of this over the year but perhaps it was best demonstrated in April when Cyclone Cook caused widespread flood damage to homes and farms in Edgecumbe, Te Puke, Galatea and Reporoa. Following the initial flooding, our Farm Source™ team and staff from our Edgecumbe site transformed the site into a hub for the community, and a base for clean-up operations in the area. The team then took to the streets, helping the town with the clean-up. A Farm Source™ flood relief package was pulled together to help ease the pressure and support local farmers. Well done to all of the team who came together and supported their communities at difficult times during the year.
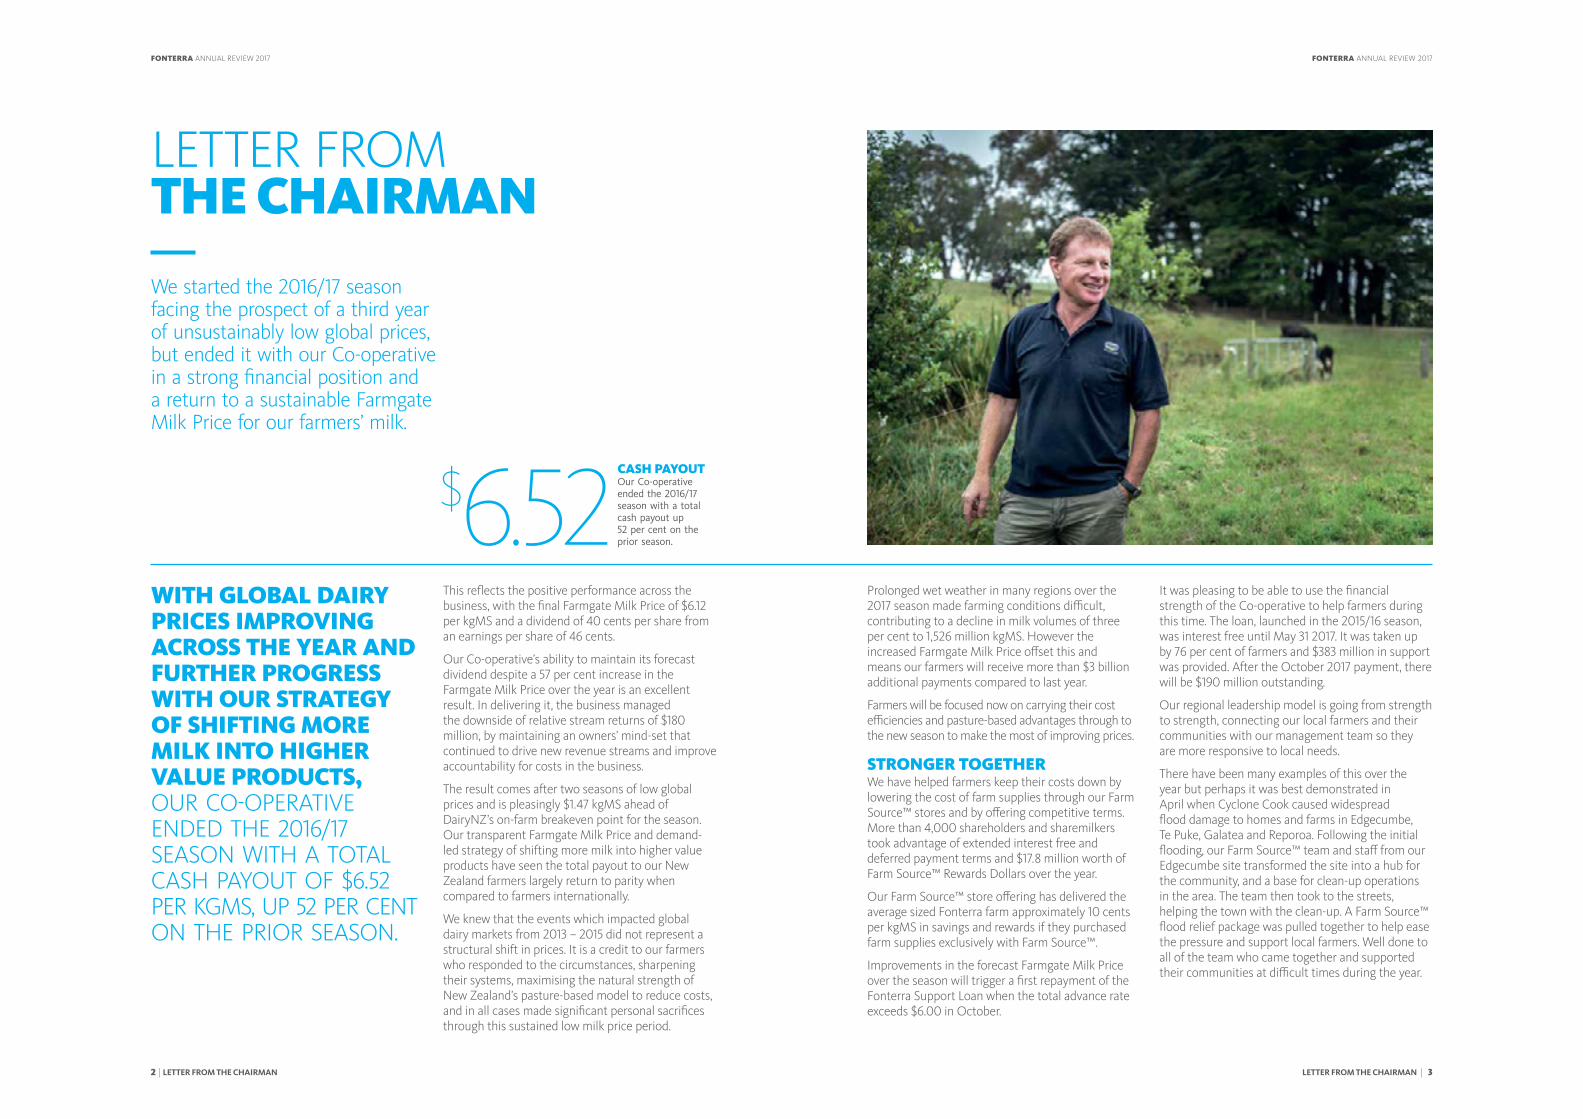
WITH GLOBAL DAIRY PRICES IMPROVING ACROSS THE YEAR AND FURTHER PROGRESS WITH OUR STRATEGY OF SHIFTING MORE MILK INTO HIGHER VALUE PRODUCTS, OUR CO-OPERATIVE ENDED THE 2016/17 SEASON WITH A TOTAL CASH PAYOUT OF $6.52 PER KGMS, UP 52 PER CENT ON THE PRIOR SEASON.
LETTER FROM THE CHAIRMAN
We started the 2016/17 season facing the prospect of a third year of unsustainably low global prices, but ended it with our Co-operative in a strong financial position and a return to a sustainable Farmgate Milk Price for our farmers’ milk.
CASH PAYOUT Our Co-operative ended the 2016/17 season with a total cash payout up 52 per cent on the prior season.
$6.52
LETTER FROM THE CHAIRMAN | 3
FONTERRA ANNUAL REVIEW 2017

OUR STRATEGY IS DELIVERINGOur Co-operative increased revenue by 12 per cent to $19.2 billion, with rising prices offsetting a three per cent decline in volumes at 22.9 billion LME. Normalised EBIT of $1.2 billion was down 15 per cent as a result of reduced margins across the business which also influenced net profit after tax, down 11 per cent at $745 million.
IngredientsIngredients sales volumes were down five per cent, partially as a result of lower milk collections that were restricted by New Zealand weather conditions and by the historically low opening inventory levels.
Our Ingredients business generated $943 million in normalised EBIT, a 22 per cent reduction on last year. That result reflects downward pressure on gross margins in our Ingredients business, which reduced by 20 per cent primarily due to materially lower stream returns.
Over this financial year, the relative prices of non-reference products over reference products narrowed significantly, reflected in the 30 per cent increase in revenue per metric tonne for reference products versus a 12 per cent increase for non-reference products. This resulted in negative stream returns of $40 million, a decline of $180 million relative to last year.
This year we have reported our Advanced Ingredients segment for the first time. Advanced Ingredients are differentiated products that attract premium prices over base ingredients through superior product performance. Whey protein isolate and medical grade lactose are good examples. We shifted 473 million LME into this segment, an increase of nine per cent on last year.
Consumer and FoodserviceThis year a further 576 million LME went into higher value products in Consumer and Foodservice, bringing the total to 5.5 billion compared to last year’s 4.9 billion. We remain on-track to reach our overall goal of 10 billion LME in Consumer and Foodservice by 2025.
Our progress continues to be demand driven, supported by investments in capacity to produce high value products. Foodservice volumes grew by 27 per cent to 2.3 billion LME, helped by 46 per cent volume growth in Greater China and increased sales across all of our Asia markets. Revenue from our Foodservice business alone crossed the $2 billion threshold for the first time.
Our Soprole business in Latin America delivered a strong sales performance through the execution of its consumer focussed innovations. Soprole drove the 18 per cent increase in Consumer and Foodservice volumes in Latin America. However, adverse economic conditions in Brazil and Venezuela resulted in our overall normalised earnings for Latin America being down five per cent at $103 million.
In Australia the successful turnaround of our local business contributed to a four per cent increase in normalised earnings in Oceania. We finished the year by reaching a significant milestone with the re-opening of our Stanhope cheese plant in Victoria, two and a half years after fire destroyed the previous plant. With the turnaround complete, Australia is now a global ingredients hub for Fonterra’s cheese, whey and nutritionals, complementing our Consumer and Foodservice businesses.
The strong performance of our overall Consumer and Foodservice business delivered a return on capital of 47 per cent up from 42 per cent last year. This is a good result given the higher Farmgate Milk Price contributed to a four per cent reduction in Consumer and Foodservice margins.
Greater ChinaOur Greater China business continues to deliver both volume and value growth with an additional 402 million LME this year and normalised earnings of $209 million, up 60 per cent on last year. Our Ingredients business sold four billion LME, and our China Foodservice business delivered another strong performance, with volume growth of 48 per cent this year.
Two important parts of our China strategy are Beingmate and our China Farms.
Beingmate’s performance, while very disappointing, is a reflection of China’s market conditions, which remain challenging for everyone in the infant formula market due to the impact of regulatory changes. Beingmate was amongst the first to receive regulatory approval and will be well-positioned as the regulations come into full effect and the market stabilises.
Our China Farms continued to focus on operational improvement, significantly reducing cash costs by 0.21 RMB per litre or six per cent. After a long period of establishment, these farms are now complete with 335 million LME produced this year. While local farmgate milk prices have remained low, Fonterra is now increasing its sales of fresh liquid milk to our customers and Consumer and Foodservice business in-market, complementing milk from our New Zealand farmers.
LETTER FROM THE CHAIRMAN
FARM SOURCE™ FLOOD RELIEFA Farm Source™ flood relief package was pulled together to support Bay of Plenty farmers after Cyclone Cook.
DOLLARS DEALS AND DISCOUNTSMore than 4,000 shareholders and sharemilkers took advantage of extended interest free and deferred payment terms and $17.8 million worth of Farm Source™ rewards dollars over the year.
HELPING KEEP COSTS DOWNOur Farm Source™ store offering has delivered the average sized Fonterra farm approximately 10 cents per kgMS in savings and rewards if they purchased farm supplies exclusively with Farm Source™. 4,00010C
4 | LETTER FROM THE CHAIRMAN LETTER FROM THE CHAIRMAN | 5
FONTERRA ANNUAL REVIEW 2017 FONTERRA ANNUAL REVIEW 2017

Operating costs and debtAs our farmers have done, our Co-operative’s management team continued their push to reduce costs and maximise returns for our farmers.
Operationally, our New Zealand sites delivered further improvements in yields and managed cost of quality to similar levels as last year, despite tightening standards. The unusual profile of milk collections over the season provided some challenges to operational planning but savings were generated across the supply chain and management continued its focus on controlling operating costs across the business. As a result, operating expenses were down six per cent.
At 44 per cent, our gearing is the same as reported in 2016 and within our target range of 40–45 per cent.
STRENGTHENING OUR STRATEGYNew Zealand farmers have always been quick to adopt new technology and drive innovation, it’s a culture that our people across Fonterra have embraced. Our people must earn the right to transform our business into the dairy industry of tomorrow, by delivering for our farmers today.
Maintaining financial discipline and a strong balance sheet has enabled us to help farmers through difficult years. Our business transformation work over the past two years has also reinforced this discipline, reducing costs, enabling faster decision making and giving our people ownership of their business targets and accountability for their delivery.
Our people are excited by innovation and the prospects for positive changes to the way we grow, make and deliver food to our customers.
We have a genuine advantage. Our traditional pasture-based model produces some of the best milk in the world, both in quality and nutrition, at a time when consumers are increasingly willing to pay a premium for food that has been produced in a socially and environmentally responsible way. Our Trusted Goodness™ quality seal, launched last year, provides our customers with that assurance.
We are strengthening our position by utilising advances in technology and innovation, especially those which protect and enhance our premium position, building on the more than $1 billion we have spent on research and development over the last 10 years. This innovation will help secure our ability to generate sustainable value for all of our stakeholders, from our farmers through to customers, consumers and communities.
Advancements in farming practices and on-farm technology have helped to improve land productivity of dairy farms by 84 per cent since the year 2000, up to $7,893 of export value per hectare. They have also contributed to a 70 per cent increase in export revenue per cow since 2001.
There will always be a global, growing market for natural dairy given its complex mixture of proteins, fats, minerals and other nutrients. Alongside that, we’re investigating consumers’ attitudes to alternative proteins to look at the role they may play in future nutrition.
Alternative products have been in the market for many years, including soy, rice and nut products. With global demand for food expected to increase 50 per cent by 2050 there will be a place for both categories but it is clear that the natural strength of dairy, and its nutritive value and efficacy, will be the premium nutrition of choice.
SUSTAINABLE FARMINGSustainability is at the forefront of everything we do. Our farmers continue to make significant investments and management changes as they grapple with rapid and challenging regional policy changes.
Two recent independent reports show that, while there is undoubtedly work to do, dairy farmers are leading the way in the protection of our waterways by fencing waterways and investing in additional riparian planting and in their farm management practices to effectively manage nutrients.
This year Fonterra and DairyNZ released the Dairy for Climate Change Action Plan which will help the industry to contribute to New Zealand meeting the Paris Climate Agreement by helping dairy farmers to better understand and manage their farming emissions.
The United Nation’s Food and Agriculture Organisation already puts New Zealand as a world-leader for efficiently producing milk on a greenhouse gas per unit of milk basis, and our science community has confidence in new and emerging technologies to manage ruminant emissions further.
New Zealand farmers have always been quick to adopt these types of new technologies. Our future success relies on investment in science and innovation, and our willingness to continue to evolve our practices based on that science.
LETTER FROM THE CHAIRMAN
INVESTING IN THE FUTURE
We are strengthening our position by utilising advances in technology and innovation,
especially those which protect and enhance our premium
position, building on the more than $1 billion we have spent
on research and development over the last 10 years.
RIPARIAN PLANTING Dairy farmers have spent more than $1 billion on environmental improvements, including riparian planting.
6 | LETTER FROM THE CHAIRMAN LETTER FROM THE CHAIRMAN | 7
FONTERRA ANNUAL REVIEW 2017 FONTERRA ANNUAL REVIEW 2017

Sharing the continued hard work of our farmers, and the positive environmental outcomes that all New Zealanders enjoy as a result, will remain a priority for the Co-operative.
TRADE In the current geopolitical climate, we are seeing a concerning trend towards rising protectionism and reduced international co-operation, both of which could slow global trade growth.
Connecting our premium dairy products with global consumers relies on quality trade agreements in our key markets.
Trading dairy nutrition is not easy. Tariffs on our products distort global dairy markets and mask pricing signals to international farmers. Ideally, we would have free trade into all of the markets in which we operate. Currently, 87 per cent of all New Zealand dairy exports are restricted by quotas or tariffs of more than 10 per cent. Lowering import tariffs will help countries to address food security concerns and lower food prices. They will also ensure New Zealand dairy products and dairy innovation remain price competitive and accessible to consumers in our key markets.
Opening up market access and tackling non-tariff barriers must remain a priority for the New Zealand Government.
ACKNOWLEDGEMENTSBeing first to market with new innovations, or adapting quickly to new technologies that are changing the way our customers want to do business with us are key to our continued success.
Our people are at the heart of our Co-operative’s adaption to these changes and I’d like to thank them for their willingness to accept change, seek out new opportunities for our business, and continue to focus on achieving the best possible returns for our farmer owners.
Our people have strong co-operative values and have dedicated and hard-working leaders whose examples they can follow. We have seen a significant transformation in Fonterra over the last three or four years, all with our farmers’ interests and returns at the forefront. Thank you to the management team for the effort to date, and for your willingness to drive the further changes which are a certainty over the next 3–4 years if we are to stay at the forefront of global dairy. Those changes aren’t possible without the support of our customers and suppliers who work with us as partners for mutual long-term success.
This year we welcomed two new Directors onto the Board, Scott St John, an Independent Director, and Donna Smit, a Farmer Director.
Scott is one of New Zealand’s leading investment advisors. He has almost 30 years of experience with funds management and securities transactions which have involved him advising the boards and senior managers of prominent companies and organisations in New Zealand and globally.
Donna, a Chartered Accountant, owns with her family, dairy farms in Eastern Bay of Plenty and Oamaru. She is a Director of Ballance Agri Nutrients and Primary ITO and a Trustee of Taratahi Agricultural Training Centre and Eastern Bay Energy Trust.
On behalf of our farmers, I want to thank Independent Director David Jackson and Farmer Director Ian Farrelly as they retire from the Board. Special mention must also go to Michael Spaans who stepped down from our Board this year but continues to show strong leadership in our industry.
David has given us 10 years of leadership and wise counsel through some of the most significant stages of our evolution including the implementation of our Milk Price, Trading Among Farmers and our Governance and Representation Review. He is a strong advocate for our strategy and a firm believer in our people’s ability to execute it to secure the best returns for farmers.
David’s commitment to reporting transparency and governance disciplines has been very important to our Board and wider Co-operative.
In January, Michael Spaans made the difficult decision to step down from our Board for health reasons. Michael’s contribution to the New Zealand dairy industry has been significant both inside and outside the Fonterra boardroom. We wish Michael all the best with his continued recovery.
After making the decision to retire from our Board at the 2016 Annual Meeting, we welcomed Ian Farrelly back onto the Board part way through the year to fill the casual vacancy created by Michael’s retirement. I’d like to personally thank Ian for returning to our Board, putting our Co-operative’s interests first and making a significant contribution this year.
John WilsonChairman
LETTER FROM THE CHAIRMAN
HALF THE PIZZAS IN CHINAFonterra mozzarella tops over half the pizzas in China.
IMPROVED PRODUCTIVITYAdvancements in on-farm technology have helped to improve land productivity 84 per cent since the year 2000.84%
8 | LETTER FROM THE CHAIRMAN LETTER FROM THE CHAIRMAN | 9
FONTERRA ANNUAL REVIEW 2017 FONTERRA ANNUAL REVIEW 2017

SHARING OUR STORY IS IMPORTANT TO US – WE WANT NEW ZEALANDERS TO KNOW WHO WE ARE AND WHAT WE STAND FOR.From the tech-savvy farmers who own our Co-operative, to our commitment to clean waterways, we are letting the world in on what matters most to us.
TRUST IN DAIRY 1.5 million New Zealanders feel Fonterra is making a change for the better. M1.5
FONTERRA ANNUAL REVIEW 2017
11 10

473LMEWe will do this by building on the strength of our Co-operative to take on challenges and make the most of new opportunities. Our grass to glass business means we are well-placed to succeed.
This year, we have concentrated on making the most of every opportunity as milk prices returned to more normal levels, bringing the benefits of better demand and improving returns to our farmers. At the same time we have maximised earnings by moving more volume into higher value products.
We are working with new technologies and finding new ways of thinking about dairy nutrition. We are delivering on our strategy which gives us the right to be able to look into the future, using the benefits and versatility of dairy to create sustainable value for our farmer shareholders and unitholders.
STRONG V3 CO-OPERATIVEWe are implementing our strategy across three strategic horizons – Strong V3 Co-operative, Innovative Co-operative, and Sustainable Co-operative. New Zealand milk remains at the very core of our Co-operative, and it is clear that our future requires us to be strongly connected to the diverse and ever-changing needs of our customers and consumers.
Our V3 strategy of Volume, Value and Velocity is at the heart of our ambition, and provides the foundation for us to fund and drive innovation and sustainable value creation. This has been a year where our V3 strength has made sure that we can deliver solid earnings alongside rapidly increasing milk prices.
In Ingredients, we achieved a nine per cent increase in sales volumes for our higher value Advanced Ingredients, such as functional proteins, high-spec whole milk powder and extra-stretch cheese.
These Advanced Ingredients grew in volume by 473 million LME this year, increasing Advanced Ingredients to 19 per cent of total external sales.
Margins for our non-reference products were down 14 per cent per tonne this year, but through our manufacturing flexibility we have been able to partially offset this by making the best choices in our product mix.
Our Consumer and Foodservice businesses saw continued growth, as our global customer teams sold almost 5.5 billion LMEs, an additional 576 million LME on last year. This is further demonstration that our new product development and strong customer relationships in our key markets are locking in good market shares. Each year we capture more and more of the full potential in these categories.
Higher input costs this year provided some pressure in our Consumer and Foodservice businesses but our strategy to drive more milk into higher margin products allowed us to achieve a normalised EBIT of $614 million, an increase of six per cent over last year.
We have also continued to do what we said we would do in Australia. Australia contributed well to Oceania’s normalised EBIT, up four per cent to $101 million in Consumer and Foodservice, with Australia Ingredients achieving $62 million in normalised EBIT despite lower sales volumes.
WE TRADE ACROSS GLOBAL BORDERS AND CONNECT WITH MORE THAN A BILLION CONSUMERS EVERY YEAR, AND ARE WELL ON OUR WAY TO MAKING A DIFFERENCE IN THE LIVES OF TWO BILLION PEOPLE BY 2025.
LETTER FROM THE CHIEF EXECUTIVEThe world is experiencing huge momentum across markets, industries and geographies.
SALES VOLUME GROWTH5.5 billion LMEs sold in Consumer and Foodservice – an additional 576 million on last year.
ADVANCED INGREDIENTSSales in highly specialised, high margin ingredients formed a key part of our solid result.
SALES VOLUME GROWTH
ADVANCED INGREDIENTSExamples of Advanced Ingredients include functional proteins, high- spec WMP, and extra-stetch cheese.
M
12 | LETTER FROM THE CHIEF EXECUTIVE LETTER FROM THE CHIEF EXECUTIVE | 13
FONTERRA ANNUAL REVIEW 2017 FONTERRA ANNUAL REVIEW 2017
INNOVATIVE CO-OPERATIVEThe world’s population is growing, and quickly. It is estimated that by 2050 there will be more than 9.7 billion people, doubling the global demand for food.
This is a world where demand is outstripping supply, high energy protein-rich diets are becoming more common and the consumer of the future is shaping the way we will approach food production and supply.
To succeed in this future we need to be more agile. Embracing change means looking at every facet of our Co-operative – on-farm, across our manufacturing assets and supply chain, our office functions, right through to the food we produce and how we produce it.
Our farmers have a history of innovation, and this has always been a feature of the Co-operative. We will continue to build on our already strong base, being well prepared for the fast pace of change and rapid development in technology facing us in the future.
Our ongoing progression in being an Innovative Co-operative is covered in more detail in the Our Potential section of this report.
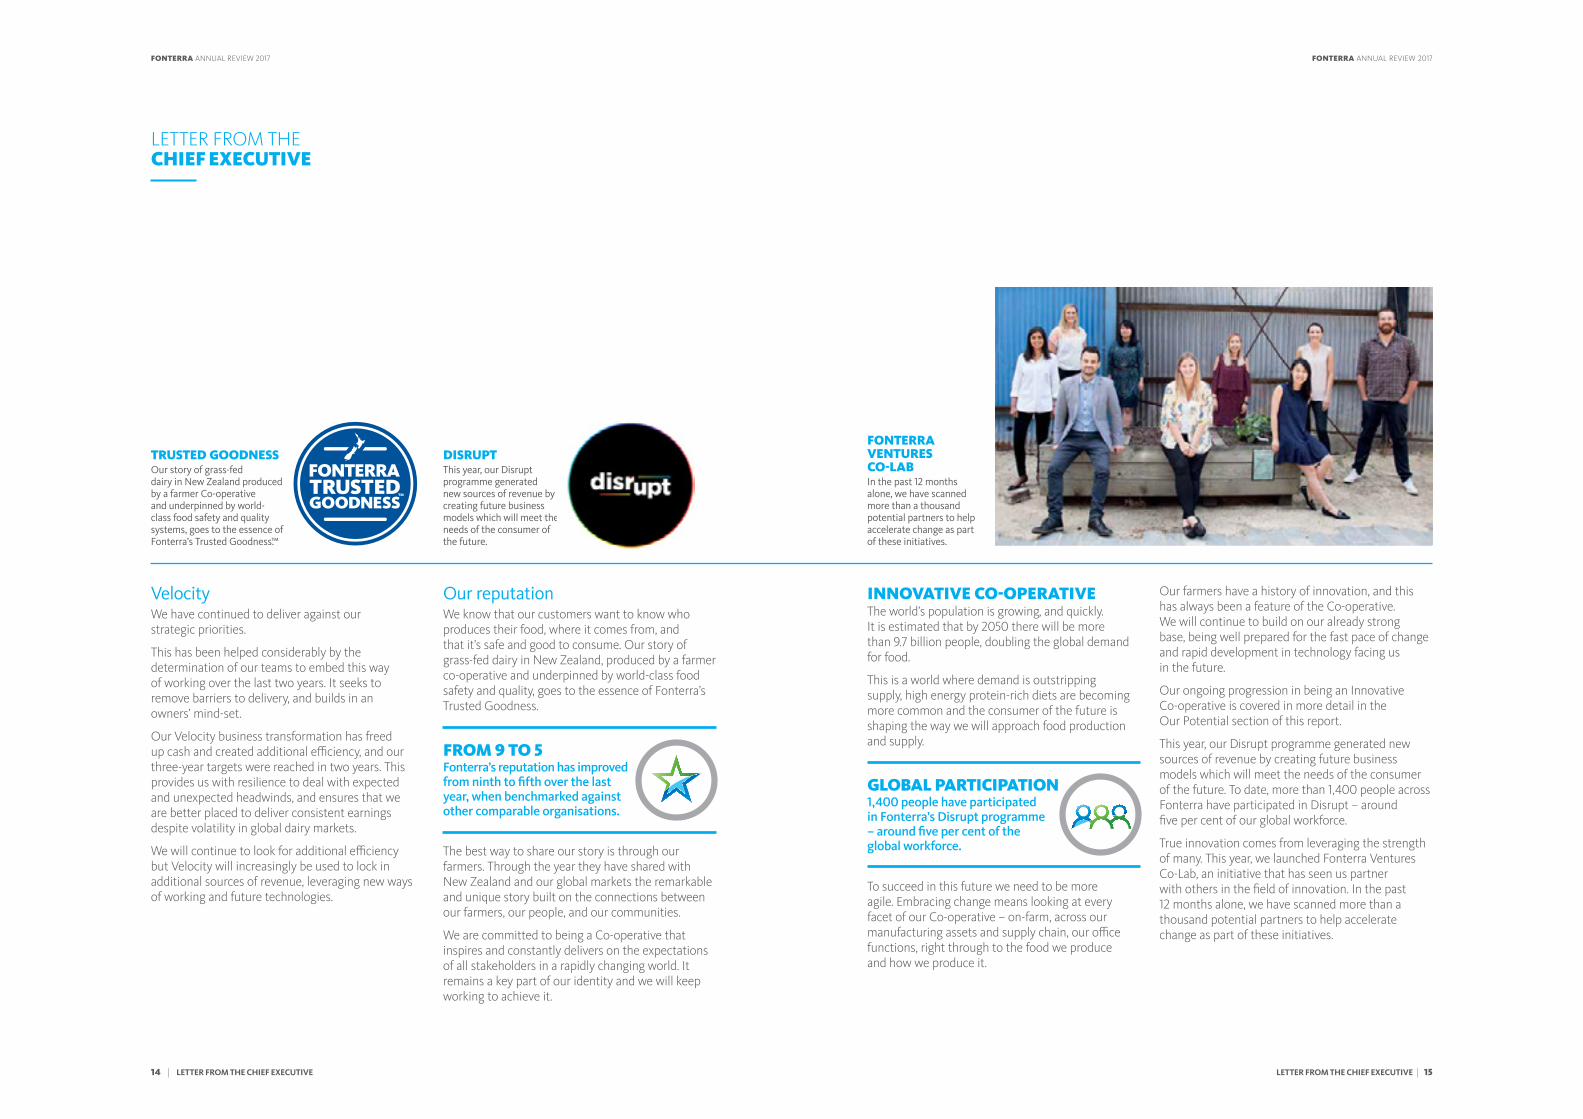
This year, our Disrupt programme generated new sources of revenue by creating future business models which will meet the needs of the consumer of the future. To date, more than 1,400 people across Fonterra have participated in Disrupt – around five per cent of our global workforce.
True innovation comes from leveraging the strength of many. This year, we launched Fonterra Ventures Co-Lab, an initiative that has seen us partner with others in the field of innovation. In the past 12 months alone, we have scanned more than a thousand potential partners to help accelerate change as part of these initiatives.
VelocityWe have continued to deliver against our strategic priorities.
This has been helped considerably by the determination of our teams to embed this way of working over the last two years. It seeks to remove barriers to delivery, and builds in an owners’ mind-set.
Our Velocity business transformation has freed up cash and created additional efficiency, and our three-year targets were reached in two years. This provides us with resilience to deal with expected and unexpected headwinds, and ensures that we are better placed to deliver consistent earnings despite volatility in global dairy markets.
We will continue to look for additional efficiency but Velocity will increasingly be used to lock in additional sources of revenue, leveraging new ways of working and future technologies.
Our reputation We know that our customers want to know who produces their food, where it comes from, and that it’s safe and good to consume. Our story of grass-fed dairy in New Zealand, produced by a farmer co-operative and underpinned by world-class food safety and quality, goes to the essence of Fonterra’s Trusted Goodness.
The best way to share our story is through our farmers. Through the year they have shared with New Zealand and our global markets the remarkable and unique story built on the connections between our farmers, our people, and our communities.
We are committed to being a Co-operative that inspires and constantly delivers on the expectations of all stakeholders in a rapidly changing world. It remains a key part of our identity and we will keep working to achieve it.
LETTER FROM THE CHIEF EXECUTIVE
FROM 9 TO 5Fonterra’s reputation has improved from ninth to fifth over the last year, when benchmarked against other comparable organisations.
GLOBAL PARTICIPATION1,400 people have participated in Fonterra’s Disrupt programme – around five per cent of the global workforce.
TRUSTED GOODNESSOur story of grass-fed dairy in New Zealand produced by a farmer Co-operative and underpinned by world-class food safety and quality systems, goes to the essence of Fonterra’s Trusted Goodness.™
FONTERRA VENTURES CO-LABIn the past 12 months alone, we have scanned more than a thousand potential partners to help accelerate change as part of these initiatives.
DISRUPTThis year, our Disrupt programme generated new sources of revenue by creating future business models which will meet the needs of the consumer of the future.
14 | LETTER FROM THE CHIEF EXECUTIVE LETTER FROM THE CHIEF EXECUTIVE | 15
FONTERRA ANNUAL REVIEW 2017 FONTERRA ANNUAL REVIEW 2017

From within our business, we are identifying the capabilities and cross-functional collaboration needed to meet the needs of future consumers. We are calling this VelocityNXT, and it will see us take our first exciting steps into new consumer and technology trends emerging around the world.
Our investment in innovation is enabled by the Strong V3 Co-operative of today. Investing in advanced technologies now will pave the way for exciting new drivers of value in the future.
Without question, the face of the food industry is already undergoing a major shift. What we will be eating in another 20 years will be very different to what we’re eating today. Consumer expectations continue to evolve, signalling a need for more agile, responsive and sustainable sources of nutrition. Food tailored to meet individual consumers’ needs is not far away, but we are well placed through our Innovative Co-operative strategy and with the foundations of natural, high quality nutrition already well established.
SUSTAINABLE CO-OPERATIVEOur Fonterra Story talks about building on the proud heritage of the New Zealand dairy industry for future generations. To do this we need to make sure that we have an enduring business. This is not just about sustainability, it’s about looking at everything we do and making sure it contributes to creating sustainable, long-term value.
The Sustainable Co-operative does not stand alone from our Strong V3 Co-operative and Innovative Co-operative; they’re intertwined. The Sustainable Co-operative will challenge us along our strategic horizons to make plans and decisions to deliver value for all our stakeholders, infinitely into the future.
In New Zealand and everywhere we operate around the world, sustainable value means many things, such as refining our farming practices, our role in the future of food, considering how diets are changing and how dairy can solve some of the world’s nutrition challenges, obesity and malnutrition – right through to our support for a sustainable global dairy industry through dairy development.
Sustainable value will require innovation and we will constantly look for alternatives in the energy and clean technology arena, helping us reduce our footprint and improve our operating efficiency while increasing our returns through the farming generations.
We are already well on track to deliver against our targets. There will be challenges, that is certain, but I firmly believe they will be some of the most formative in the history of Fonterra and our global dairy industry, and that is exciting.
None of this is achievable without the passion and commitment of our people. Our future is exciting, and I know we will exceed the ambitions that might now seem like lofty goals. I would like to thank the Board for their ongoing support, my colleagues on the Fonterra Management Team for their dedication and strong advice, and all of our people around the world for coming to work each and every day determined to make a difference for our farmers, our customers and our Co-operative.
Theo SpieringsChief Executive
LETTER FROM THE CHIEF EXECUTIVE
CREATING SUSTAINABLE VALUEBeing truly sustainable means refining our farming practices, our role in the future of food, through to supporting a sustainable global dairy industry.
MEETING THE CHANGING NEEDS OF OUR CONSUMERSBuilding on the foundations of natural, high quality dairy nutrition, Fonterra is well placed to meet the diverse and evolving preferences in the future of food.
SUSTAINABLE VALUESustainable value will require innovation and we will constantly look for alternatives in the energy and clean technology arena, helping us reduce our footprint and improve our operating efficiency while increasing our returns through the farming generations.
16 | LETTER FROM THE CHIEF EXECUTIVE LETTER FROM THE CHIEF EXECUTIVE | 17
FONTERRA ANNUAL REVIEW 2017 FONTERRA ANNUAL REVIEW 2017

COW 799COW 830
WEIGHT490 KGS
COW 828
FROM SMARTPHONES, THROUGH TO ROBOTIC MILKING, AND DRONE MAPPING.
Our farmers are increasingly using on-farm innovations that increase efficiency, productivity and sustainable outcomes.
%
FARMING SMART89 per cent of Fonterra farms are connected to the Co-operative through smartphones or tablets.89
FONTERRA ANNUAL REVIEW 2017
18 19
We have also used our strong Farm Source™ balance sheet to provide financial support during tough times with more than 4,000 shareholders and sharemilkers taking advantage of extended interest free and deferred payment terms over the season.
DIGITAL TOOLS FOR REAL TIME INFORMATIONAs technology evolves, we do too, making farming business easier with our apps On Farm, My Co-op and Monthly Plant Check.
My Co-op provides constantly updated news and information from across the Co-operative and the industry including milk price announcements, updates from the Chairman and CEO and rural and regional council news. The On Farm app provides daily milk production and quality information, comparisons against last season volumes, tanker ETA and summary reports of key milk performance information for the last 30 days.
The Monthly Plant Check app makes it easier for farmers to complete this assessment with diagrams, space to record notes and a ‘farm summary’ screen that shows what checks have been completed and what checks still need to be done. The apps complement our Farm Source™ website, which offers the same or more detailed data online back at the farm office.
Launched this year, the Agrigate online tool developed by Farm Source™ and LIC combines all the key data farmers need to make faster and smarter decisions on one, easy to use online dashboard. By bringing together this data into one platform, Agrigate will help with future traceability of end products, creating additional value in our supply chain. On-farm, this data helps farmers to assess the interaction between different on-farm factors, such as weather conditions, animal health, milk production, financials, pasture cover and fertiliser applications.
A REGIONAL NETWORK TO SUPPORT OUR FARMERS Farmers are fast adopters of technology, but apps can’t replace real people, including our Area Managers, Sustainable Dairying Advisors, feed experts, Technical Sales Reps and Food Safety Managers. These are our local people, there to support farmers with a sounding board, practical solutions and direct links to senior people who can handle concerns or questions.
The value of our regional model is no more evident than during severe weather events or natural disasters and many regions of New Zealand experienced that this year.
In April, Cyclone Cook caused widespread flood damage to homes and farms in Edgecumbe, Te Puke, Galatea and Reporoa. Following the initial flooding, our Farm Source™ team and staff from our Edgecumbe site, and the Co-operative’s Emergency Response Team transformed the local site into a hub of operations and meeting place for the community.
Our people went to work sandbagging properties threatened by rising flood waters, and then as the water receded, helped the town to fill 120 rubbish skips each day as part of the clean-up. We also provided tankers to be used for transporting drinking water to local residents.
TIAKI: FARM SOURCE™ SUSTAINABLE DAIRYINGAs a responsible Co-operative, sustainable dairying is core to our long-term strategy. Our customer and community expectations continue to rise, so it’s our ability to produce high quality dairy within environmental limits that will create the most long-term value for our farmers. Our Tiaki programme is designed to support our farmers to meet these standards.
As part of our wider sustainability strategy, Tiaki brings together our Co-operative’s on-farm sustainability tools and services, tailored to individual farm needs. We have built up a team of skilled experts over the years in every region to work with farmers in key areas like nutrient management.
Through Tiaki, our Sustainable Dairy Advisors are helping to develop Farm Environment Plans to assist farmers in meeting regional regulatory requirements. They are using the best tools and technology such as innovative Geographic Information Systems (GIS) mapping technology to manage and mitigate the environmental impacts of farming. They help farmers to navigate through resource consent processes which vary by region.
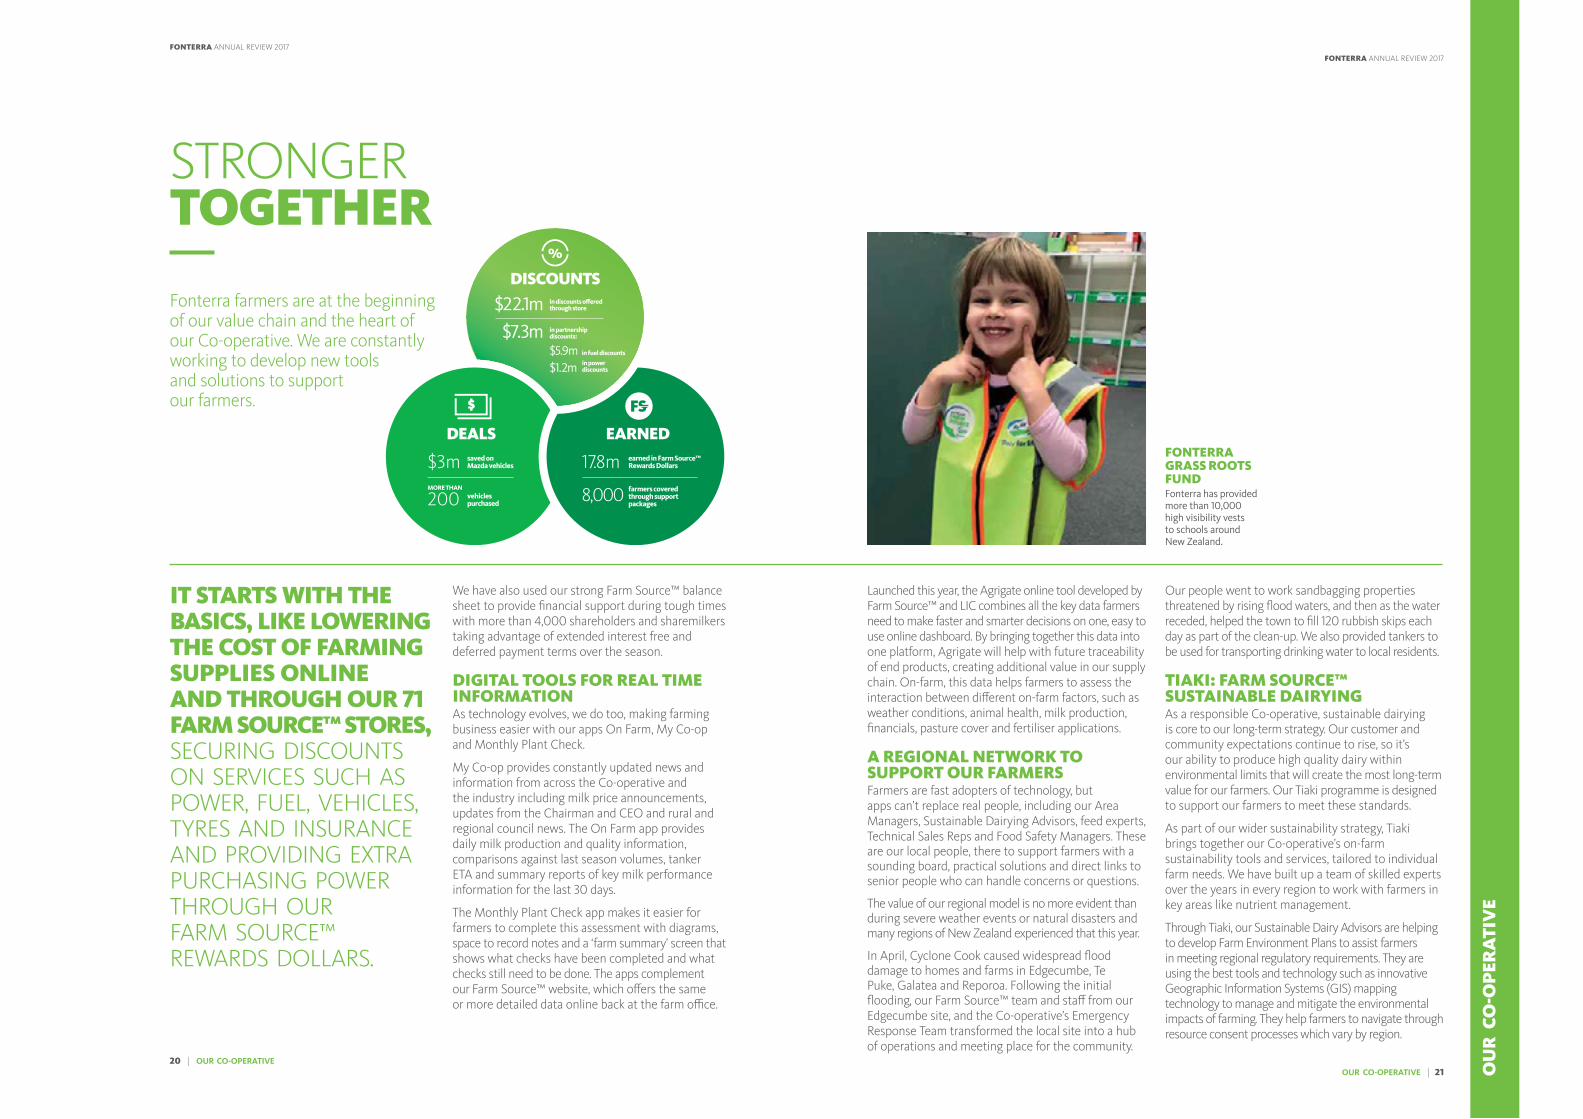
IT STARTS WITH THE BASICS, LIKE LOWERING THE COST OF FARMING SUPPLIES ONLINE AND THROUGH OUR 71 FARM SOURCE™ STORES, SECURING DISCOUNTS ON SERVICES SUCH AS POWER, FUEL, VEHICLES, TYRES AND INSURANCE AND PROVIDING EXTRA PURCHASING POWER THROUGH OUR FARM SOURCE™ REWARDS DOLLARS.
STRONGER TOGETHER
Fonterra farmers are at the beginning of our value chain and the heart of our Co-operative. We are constantly working to develop new tools and solutions to support our farmers.
FONTERRA GRASS ROOTS FUNDFonterra has provided more than 10,000 high visibility vests to schools around New Zealand.
DISCOUNTS
DEALS EARNED
$3m MORE THAN
saved onMazda vehicles
200 vehiclespurchased
17.8m earned in Farm Source™ Rewards Dollars
8,000 farmers covered through support packages
$7.3m in partnershipdiscounts:
$5.9m in fuel discounts
$1.2m in powerdiscounts
$22.1m in discounts o�ered through store
OUR CO-OPERATIVE | 21 OU
R C
O-O
PER
ATI
VE
FONTERRA ANNUAL REVIEW 2017
20 | OUR CO-OPERATIVE
FONTERRA ANNUAL REVIEW 2017

FONTERRA MILK FOR SCHOOLSMore than 1,450 schools and around 140,000 children take part in our Milk for Schools programme.
SHARING OUR FARMERS’ STORYOur Co-operative’s reputation shifted from ninth to fifth in our reputation comparison set.
DAIRY DEVELOPMENTNew Zealand farmers are considered to be among the best in the world. Through our Dairy Development programme they share their skills with their counterparts overseas, either as volunteers abroad or by hosting farmers from developing dairy regions back here in New Zealand.
Dairy Development supports local farmers to produce consistently safe, quality milk that local consumers can trust. In the process, it improves livelihoods and creates thriving communities by generating sustainable employment.
We work with small-scale farmers to teach global best practice techniques for food quality and safety, and animal husbandry.
We have a new exchange scheme this year for young Chilean farmers. The first group of 11 arrived in New Zealand in June for a year of paid hands-on work experience at participating farms.
CONTRIBUTING TO OUR COMMUNITIES
The Fonterra Grass Roots Fund Our Grass Roots Fund financially supports initiatives that help to strengthen our dairy communities, bringing them together, caring for the environment and promoting safe and healthy lifestyles. Launched in 2007, we now have
This is part of our philosophy of delivering solutions to farmers, helping them to manage their businesses within ever-evolving regulatory environments.
SHARING OUR FARMERS’ STORY: FROM HERE TO EVERYWHEREWe continued to tell our farmers’ story to the New Zealand public by sharing our Co-operative’s efforts to take Kiwi innovation and dairy nutrition to the world. We know that when the public have a better understanding of who’s behind our Co-operative and what we stand for, they feel more positive towards us. The support of New Zealand is important to our farmers and our people.
We measure our reputation using a system called RepZ, which is the global standard for reputation measurement. It compares us against nine organisations, that are either similar to Fonterra, or have public reputations similar to where we want the Co-operative to be.
At the start of the year we were last in our comparative set. Over the course of the year, our reputation work focused on giving our farmers an opportunity to talk about all of the good things their Co-operative does for New Zealand, and the areas that we know are important to the public and that we are trying to improve.
We finished the year fifth equal in our comparative set, an improvement in RepZ which is virtually unprecedented in New Zealand.
OUR CO-OPERATIVE
Grass Roots Funds in New Zealand, Australia and Sri Lanka. This year more than 430 grants were awarded with more than $750,000 donated.
In New Zealand, the fund is helping to provide safety, rescue and lifesaving equipment, providing more than 10,000 high-visibility vests to school children, and helping the Whakatane Kiwi Trust to buy equipment to protect the kiwi.
In Australia, many of the grants supported sports and kids’ education. We helped three pre-schools to establish garden beds to grow fruit and vegetables to learn about healthy eating and sustainability.
The focus in Sri Lanka has been on education. At Moragahahena Maha Vidyalaya, Horana, a school attended by some of our farmers’ children, there was no water during the frequently occurring periods of drought. Funding and volunteer time from staff have seen their old well fully renovated, providing a permanent water solution.
IN-SCHOOL PROGRAMMES
Fonterra Milk for SchoolsWe are making a difference to the health of future generations of Kiwi kids by offering a free serving of cold milk to primary-aged children every school day.
Over five years since it was launched, participation is still strong with more than 1,450 schools and around 140,000 children taking part, drinking upwards of 87 million individual packs to date.
New research1 from Massey University shows children who regularly drink milk as part of the programme had significantly improved bone health when compared to a control group who do not participate in the Milk for Schools programme. It also confirmed that Fonterra Milk for Schools has increased the proportion of children achieving the Ministry of Health’s recommended number of serves of dairy on weekdays.
KickStart BreakfastKickStart Breakfast helps Kiwi kids achieve their potential, not only by providing a nutritious breakfast, but also by providing a supportive, nurturing environment. Through a partnership between the Ministry of Vulnerable Children, Sanitarium and Fonterra, the programme provides children with Weet-Bix™ and Anchor™ milk and supports the local community volunteers who run the breakfast clubs.
This year KickStart Breakfast reached 946 clubs serving breakfasts to more than 29,000 children and young people every week.
1 In addition to the findings by University of Auckland reported last year.
22 | OUR CO-OPERATIVE OUR CO-OPERATIVE | 23 OU
R C
O-O
PER
ATI
VE
FONTERRA ANNUAL REVIEW 2017 FONTERRA ANNUAL REVIEW 2017

HIGH QUALITY MILK PROTEIN CONCENTRATES MADE FROM THE MILK OF FONTERRA FARMERS.These are used in formulations both in New Zealand and overseas to help millions of people recovering from surgery and serious accidents.
EXPERTISE IN INNOVATIONFonterra’s Research and Development Centre in New Zealand is one of the largest of its kind in the world, with around 250 scientific and technical staff.
OU
R P
OTE
NTI
AL
FONTERRA ANNUAL REVIEW 2017
25 24
OUR POTENTIAL
WE SET OUR SIGHTS FIRMLY ON VALUE CREATION FOR OUR FARMERS AND BUILDING A CO-OPERATIVE WITH THE STRENGTH AND CAPABILITY TO DELIVER – AND WE FEEL WELL SET FOR THIS WITH OUR LEGACY OF CHALLENGING THE BOUNDARIES OF WHAT WE THOUGHT WAS POSSIBLE.
Our world continues to shift, with population, global economic, technology, science, consumer and food consumption trends all moving fast. To keep pace, we too are evolving in our approach to providing sustainable, affordable dairy nutrition to meet growing global demand.
The foundation of our strategy still remains the same – to build a strong Co-operative with our V3 strategy delivering consistent strong results over the long-term.
STRONG V3 CO-OPERATIVEOur Strong V3 Co-operative remains the solid foundation needed to build our business and move into leadership areas where future value will be uncovered.
We have consistently delivered on this strategy since its inception, and this will continue to be the platform we leverage for our other strategic horizons.
Grow Volume with Value at VelocityEmerging markets, growing populations and a desire for safe, accessible and nutritious food is driving strong demand for our natural dairy nutrition.
Our strategy is simple – to help satisfy the world’s demand for dairy – supplementing our New Zealand milk by growing our global milk supply and creating more value from every drop of milk through the right mix of products, services and global partnerships, and of course doing this at pace.
When this strategy is executed well we are at our best, delivering strong returns to our farmers and enabling our business to reinvest in initiatives to promote growth and additional value.
Sustainable value from NZMPDairy Ingredients remain at the core of our business and are the foundation on which we build our Strong V3 Co-operative. Keeping this engine tuned and performing is key to achieving our ambition.
To build sustainable value from our engine, we are investing in the application of technology to further lift quality and productivity, improve our operating efficiency and maximise value achievement through customised nutritional solutions for our customers.
Our NZMP teams around the world have a strong track record of delivering improved margins above Global Dairy Trade (GDT) prices through the strong NZMP brand proposition.
Focused growth in our Consumer portfolioBy 2050, global demand for food is projected to double.
Staying ahead of demand will mean being closer to our consumers, anticipating their consumption needs and being more visible in the places and platforms where they choose to purchase.
To achieve this, we are investing in capabilities such as agile product development and concentrating our efforts on the fastest growing categories in key markets. These include dairy beverages, yoghurts and cheeses. Our three global brands – Anchor™, Anlene™ and Anmum™ – will carry the banner for growth across these product categories and remain our most trusted hero brands in each of our key regions.
Foodservice expansionThe development of our Foodservice capability is a very strong growth story. It continued over the past 12 months as our focused product range and innovative chef-led strategy delivered a 27 per cent growth in sales volume. This was off the back of rapidly changing consumer preferences towards out-of-home consumption.
Over the past four years, Fonterra has invested more than $850 million in plants dedicated to making Foodservice products to support the steady increase in demand.
This investment is delivering strong results for the business, supporting our double-digit growth strategy for Foodservice.
Building an Active Living portfolioMore than ever before, consumers are conscious of the role nutrition plays in maintaining a healthy lifestyle. Once, protein powders were seen as nutrition for elite athletes, but as people live longer and populations age, advanced adult nutrition is becoming more important and mainstream.
As consumer awareness of the role of nutrition in health rises, demand for sports and medical nutrition will continue to grow, across both the developed and developing world. This will be an area of significant focus for us in meeting our V3 targets.
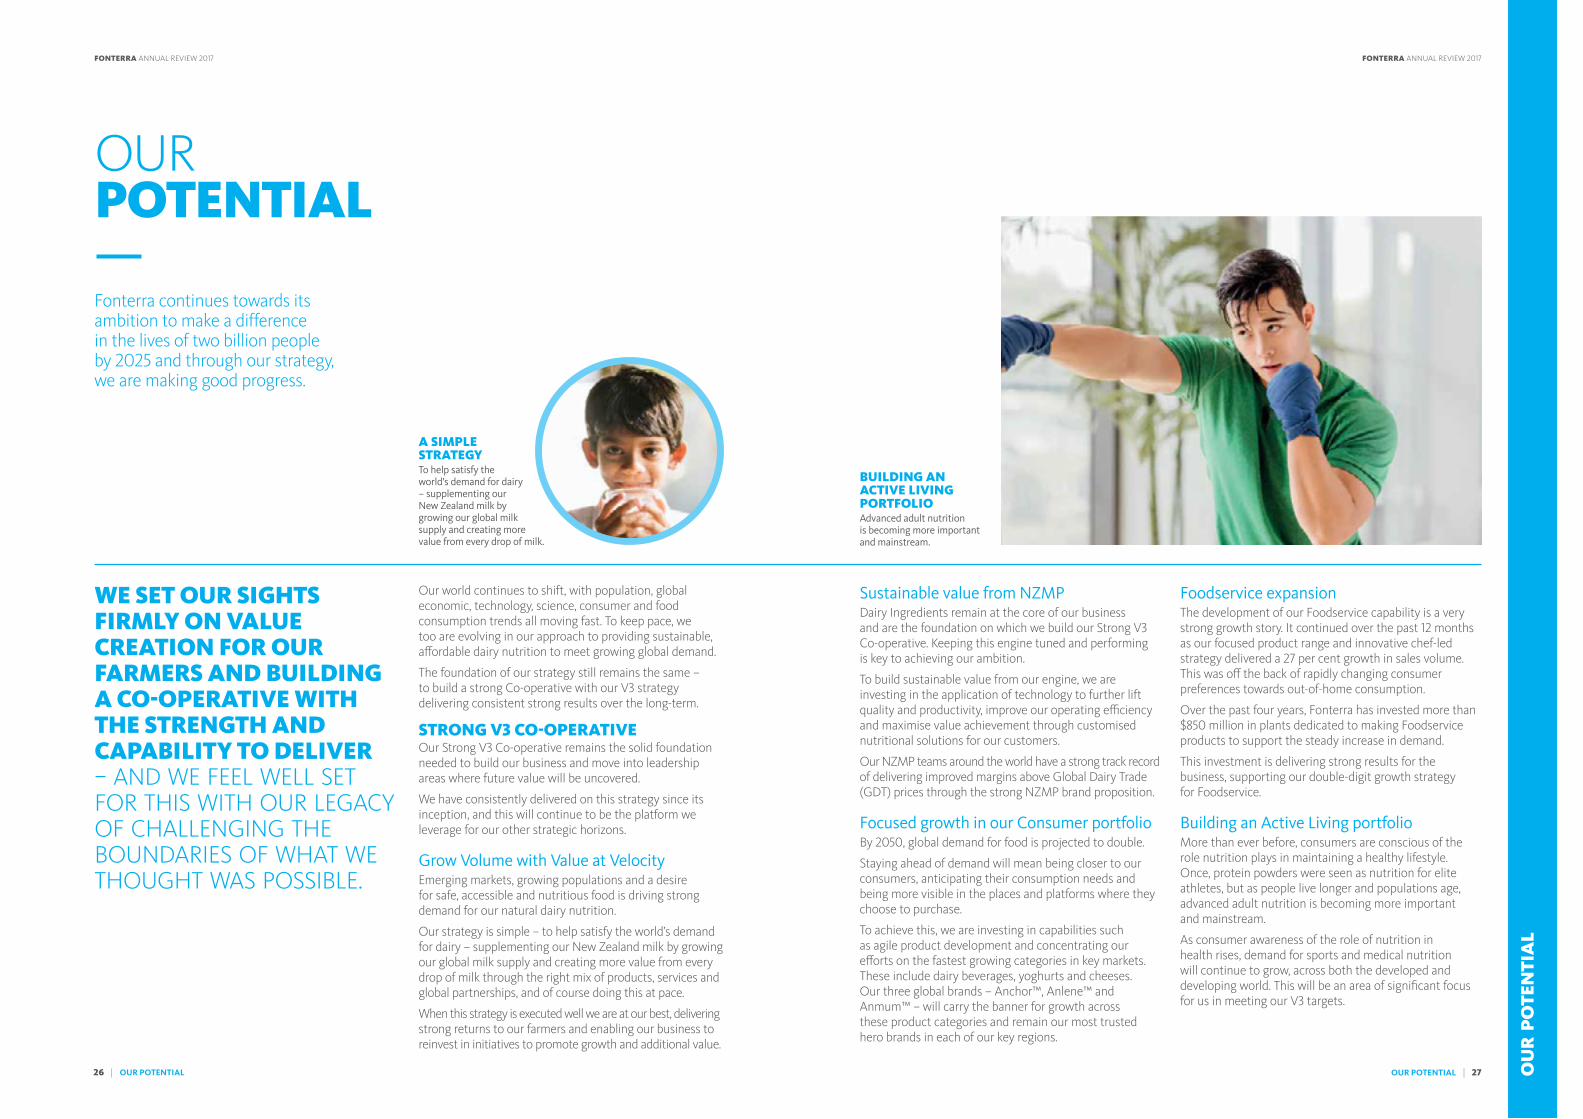
Fonterra continues towards its ambition to make a difference in the lives of two billion people by 2025 and through our strategy, we are making good progress.
A SIMPLE STRATEGYTo help satisfy the world’s demand for dairy – supplementing our New Zealand milk by growing our global milk supply and creating more value from every drop of milk.
BUILDING AN ACTIVE LIVING PORTFOLIOAdvanced adult nutrition is becoming more important and mainstream.
OU
R P
OTE
NTI
AL
26 | OUR POTENTIAL OUR POTENTIAL | 27
FONTERRA ANNUAL REVIEW 2017 FONTERRA ANNUAL REVIEW 2017
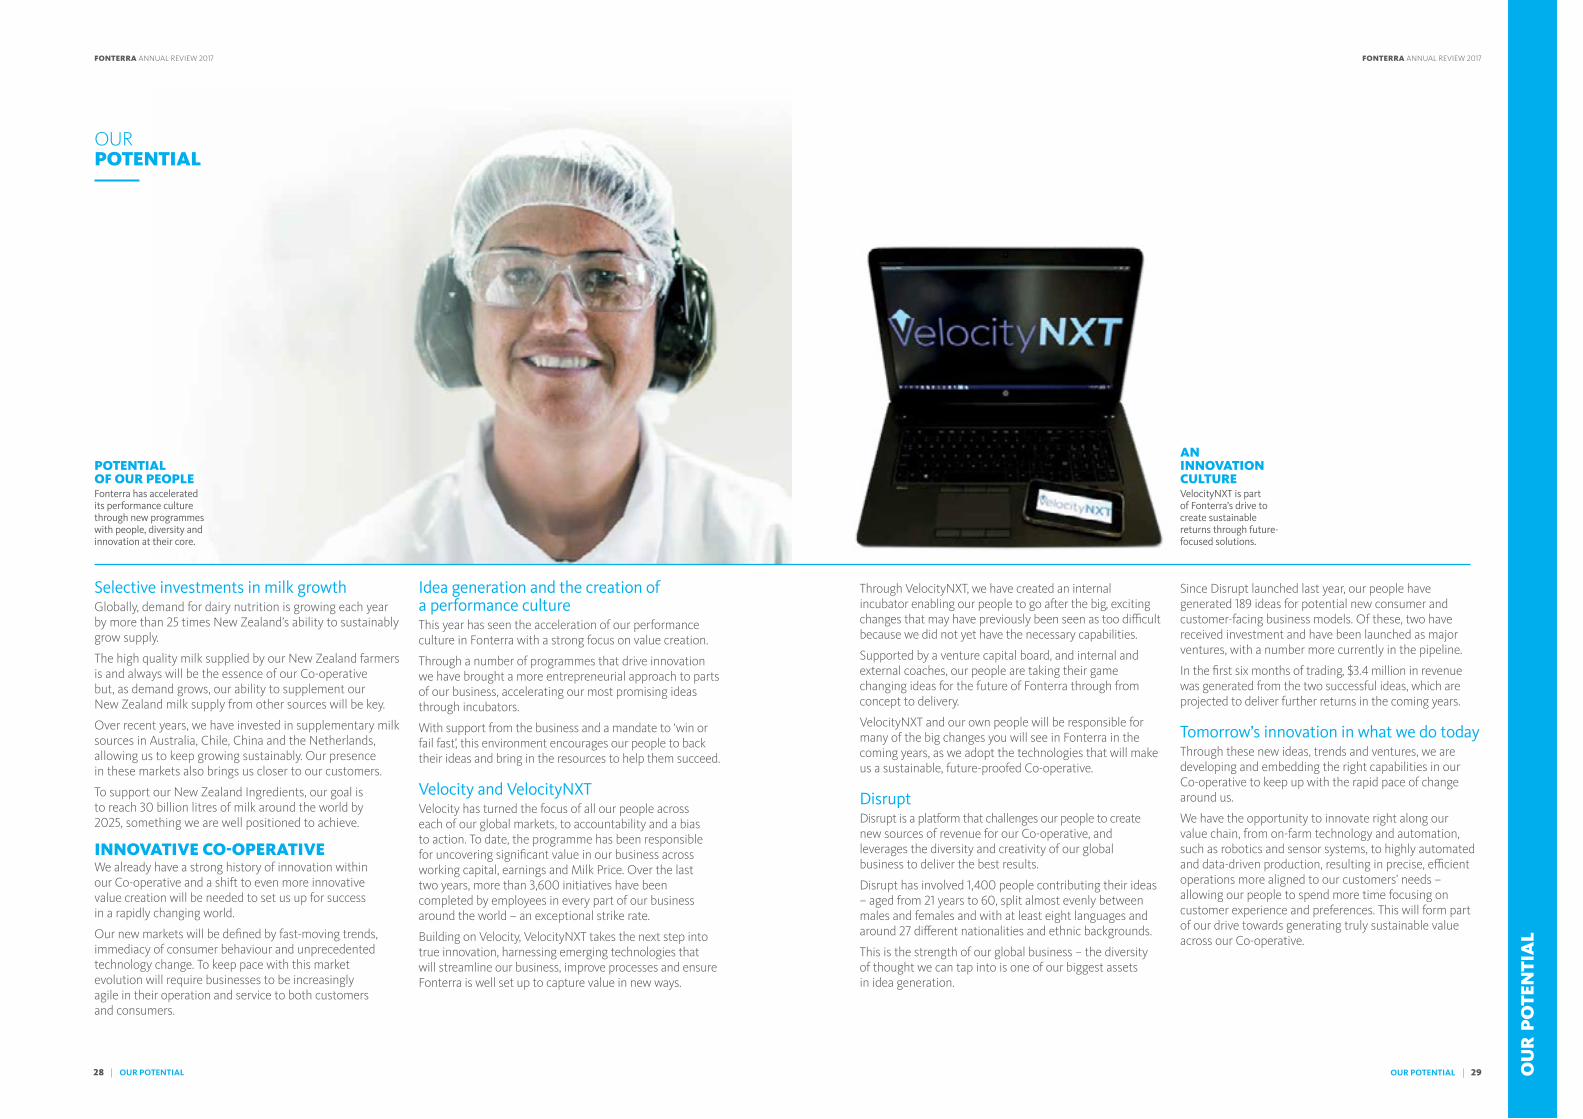
POTENTIAL OF OUR PEOPLEFonterra has accelerated its performance culture through new programmes with people, diversity and innovation at their core.
Selective investments in milk growthGlobally, demand for dairy nutrition is growing each year by more than 25 times New Zealand’s ability to sustainably grow supply.
The high quality milk supplied by our New Zealand farmers is and always will be the essence of our Co-operative but, as demand grows, our ability to supplement our New Zealand milk supply from other sources will be key.
Over recent years, we have invested in supplementary milk sources in Australia, Chile, China and the Netherlands, allowing us to keep growing sustainably. Our presence in these markets also brings us closer to our customers.
To support our New Zealand Ingredients, our goal is to reach 30 billion litres of milk around the world by 2025, something we are well positioned to achieve.
INNOVATIVE CO-OPERATIVEWe already have a strong history of innovation within our Co-operative and a shift to even more innovative value creation will be needed to set us up for success in a rapidly changing world.
Our new markets will be defined by fast-moving trends, immediacy of consumer behaviour and unprecedented technology change. To keep pace with this market evolution will require businesses to be increasingly agile in their operation and service to both customers and consumers.
Idea generation and the creation of a performance cultureThis year has seen the acceleration of our performance culture in Fonterra with a strong focus on value creation.
Through a number of programmes that drive innovation we have brought a more entrepreneurial approach to parts of our business, accelerating our most promising ideas through incubators.
With support from the business and a mandate to ‘win or fail fast’, this environment encourages our people to back their ideas and bring in the resources to help them succeed.
Velocity and VelocityNXTVelocity has turned the focus of all our people across each of our global markets, to accountability and a bias to action. To date, the programme has been responsible for uncovering significant value in our business across working capital, earnings and Milk Price. Over the last two years, more than 3,600 initiatives have been completed by employees in every part of our business around the world – an exceptional strike rate.
Building on Velocity, VelocityNXT takes the next step into true innovation, harnessing emerging technologies that will streamline our business, improve processes and ensure Fonterra is well set up to capture value in new ways.
Through VelocityNXT, we have created an internal incubator enabling our people to go after the big, exciting changes that may have previously been seen as too difficult because we did not yet have the necessary capabilities.
Supported by a venture capital board, and internal and external coaches, our people are taking their game changing ideas for the future of Fonterra through from concept to delivery.
VelocityNXT and our own people will be responsible for many of the big changes you will see in Fonterra in the coming years, as we adopt the technologies that will make us a sustainable, future-proofed Co-operative.
DisruptDisrupt is a platform that challenges our people to create new sources of revenue for our Co-operative, and leverages the diversity and creativity of our global business to deliver the best results.
Disrupt has involved 1,400 people contributing their ideas – aged from 21 years to 60, split almost evenly between males and females and with at least eight languages and around 27 different nationalities and ethnic backgrounds.
This is the strength of our global business – the diversity of thought we can tap into is one of our biggest assets in idea generation.
Since Disrupt launched last year, our people have generated 189 ideas for potential new consumer and customer-facing business models. Of these, two have received investment and have been launched as major ventures, with a number more currently in the pipeline.
In the first six months of trading, $3.4 million in revenue was generated from the two successful ideas, which are projected to deliver further returns in the coming years.
Tomorrow’s innovation in what we do todayThrough these new ideas, trends and ventures, we are developing and embedding the right capabilities in our Co-operative to keep up with the rapid pace of change around us.
We have the opportunity to innovate right along our value chain, from on-farm technology and automation, such as robotics and sensor systems, to highly automated and data-driven production, resulting in precise, efficient operations more aligned to our customers’ needs – allowing our people to spend more time focusing on customer experience and preferences. This will form part of our drive towards generating truly sustainable value across our Co-operative.
OUR POTENTIAL
AN INNOVATION CULTUREVelocityNXT is part of Fonterra’s drive to create sustainable returns through future-focused solutions.
OU
R P
OTE
NTI
AL
28 | OUR POTENTIAL OUR POTENTIAL | 29
FONTERRA ANNUAL REVIEW 2017 FONTERRA ANNUAL REVIEW 2017
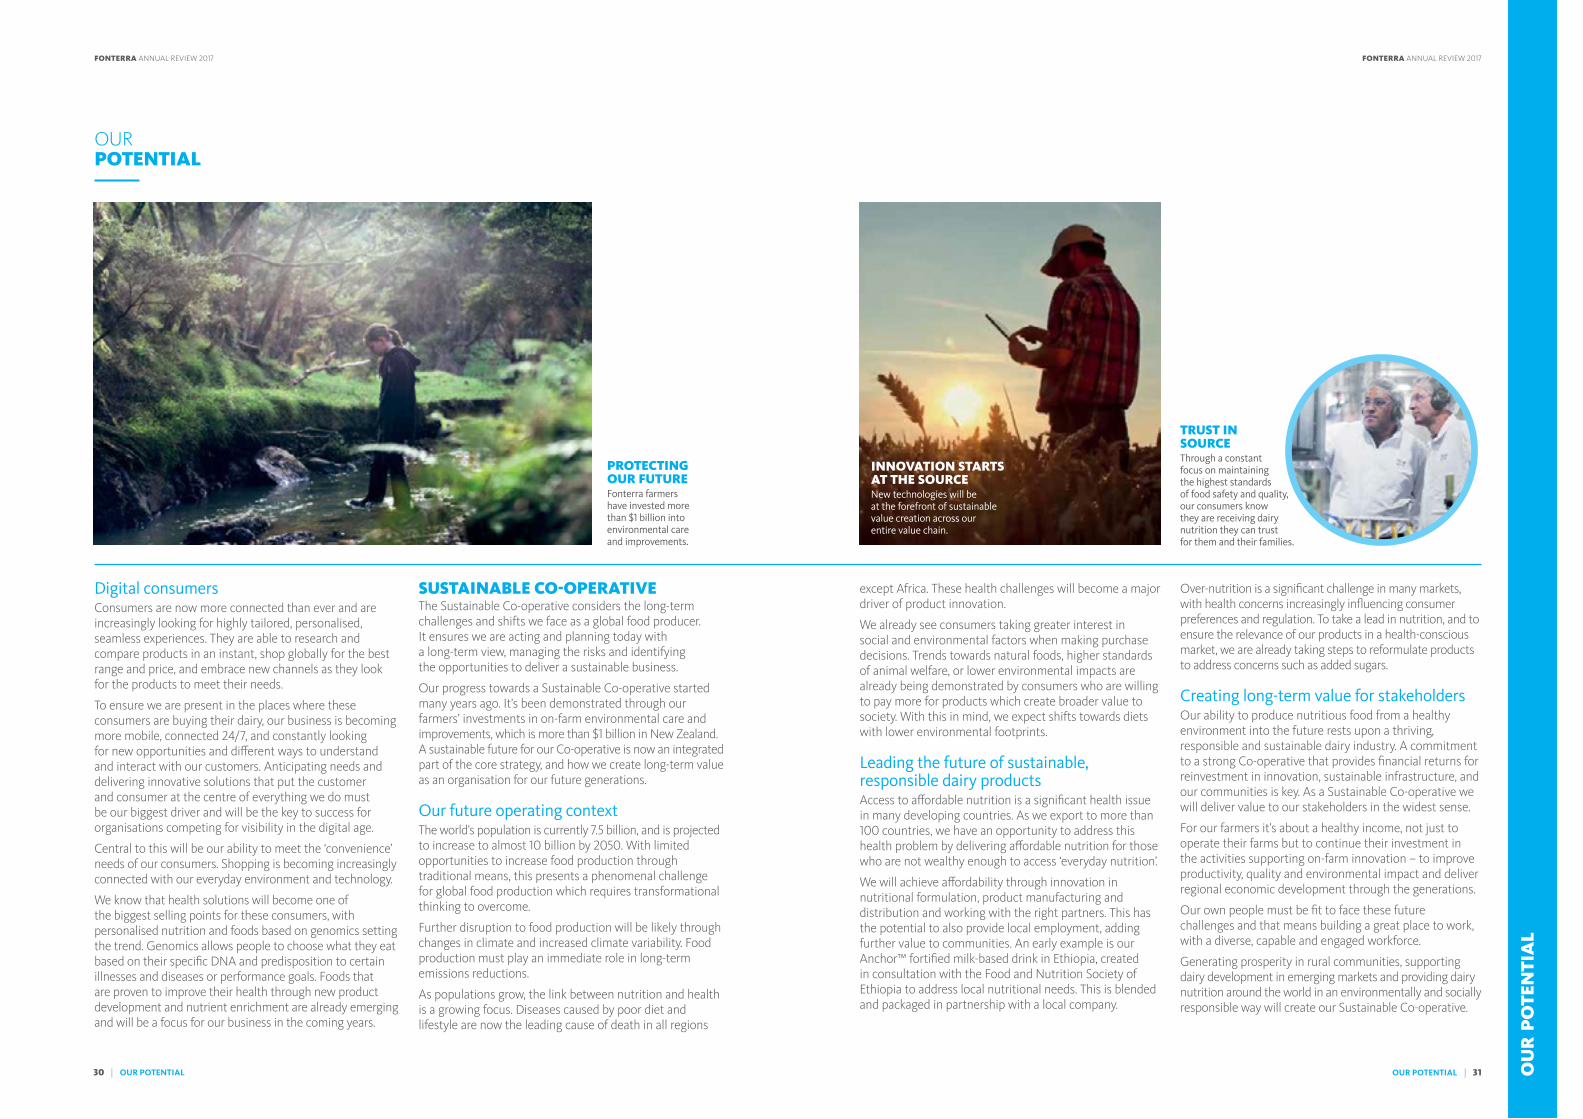
PROTECTING OUR FUTUREFonterra farmers have invested more than $1 billion into environmental care and improvements.
TRUST IN SOURCEThrough a constant focus on maintaining the highest standards of food safety and quality, our consumers know they are receiving dairy nutrition they can trust for them and their families.
INNOVATION STARTS AT THE SOURCENew technologies will be at the forefront of sustainable value creation across our entire value chain.
Digital consumersConsumers are now more connected than ever and are increasingly looking for highly tailored, personalised, seamless experiences. They are able to research and compare products in an instant, shop globally for the best range and price, and embrace new channels as they look for the products to meet their needs.
To ensure we are present in the places where these consumers are buying their dairy, our business is becoming more mobile, connected 24/7, and constantly looking for new opportunities and different ways to understand and interact with our customers. Anticipating needs and delivering innovative solutions that put the customer and consumer at the centre of everything we do must be our biggest driver and will be the key to success for organisations competing for visibility in the digital age.
Central to this will be our ability to meet the ‘convenience’ needs of our consumers. Shopping is becoming increasingly connected with our everyday environment and technology.
We know that health solutions will become one of the biggest selling points for these consumers, with personalised nutrition and foods based on genomics setting the trend. Genomics allows people to choose what they eat based on their specific DNA and predisposition to certain illnesses and diseases or performance goals. Foods that are proven to improve their health through new product development and nutrient enrichment are already emerging and will be a focus for our business in the coming years.
SUSTAINABLE CO-OPERATIVEThe Sustainable Co-operative considers the long-term challenges and shifts we face as a global food producer. It ensures we are acting and planning today with a long-term view, managing the risks and identifying the opportunities to deliver a sustainable business.
Our progress towards a Sustainable Co-operative started many years ago. It’s been demonstrated through our farmers’ investments in on-farm environmental care and improvements, which is more than $1 billion in New Zealand. A sustainable future for our Co-operative is now an integrated part of the core strategy, and how we create long-term value as an organisation for our future generations.
Our future operating contextThe world’s population is currently 7.5 billion, and is projected to increase to almost 10 billion by 2050. With limited opportunities to increase food production through traditional means, this presents a phenomenal challenge for global food production which requires transformational thinking to overcome.
Further disruption to food production will be likely through changes in climate and increased climate variability. Food production must play an immediate role in long-term emissions reductions.
As populations grow, the link between nutrition and health is a growing focus. Diseases caused by poor diet and lifestyle are now the leading cause of death in all regions
except Africa. These health challenges will become a major driver of product innovation.
We already see consumers taking greater interest in social and environmental factors when making purchase decisions. Trends towards natural foods, higher standards of animal welfare, or lower environmental impacts are already being demonstrated by consumers who are willing to pay more for products which create broader value to society. With this in mind, we expect shifts towards diets with lower environmental footprints.
Leading the future of sustainable, responsible dairy productsAccess to affordable nutrition is a significant health issue in many developing countries. As we export to more than 100 countries, we have an opportunity to address this health problem by delivering affordable nutrition for those who are not wealthy enough to access ‘everyday nutrition’.
We will achieve affordability through innovation in nutritional formulation, product manufacturing and distribution and working with the right partners. This has the potential to also provide local employment, adding further value to communities. An early example is our Anchor™ fortified milk-based drink in Ethiopia, created in consultation with the Food and Nutrition Society of Ethiopia to address local nutritional needs. This is blended and packaged in partnership with a local company.
Over-nutrition is a significant challenge in many markets, with health concerns increasingly influencing consumer preferences and regulation. To take a lead in nutrition, and to ensure the relevance of our products in a health-conscious market, we are already taking steps to reformulate products to address concerns such as added sugars.
Creating long-term value for stakeholdersOur ability to produce nutritious food from a healthy environment into the future rests upon a thriving, responsible and sustainable dairy industry. A commitment to a strong Co-operative that provides financial returns for reinvestment in innovation, sustainable infrastructure, and our communities is key. As a Sustainable Co-operative we will deliver value to our stakeholders in the widest sense.
For our farmers it’s about a healthy income, not just to operate their farms but to continue their investment in the activities supporting on-farm innovation – to improve productivity, quality and environmental impact and deliver regional economic development through the generations.
Our own people must be fit to face these future challenges and that means building a great place to work, with a diverse, capable and engaged workforce.
Generating prosperity in rural communities, supporting dairy development in emerging markets and providing dairy nutrition around the world in an environmentally and socially responsible way will create our Sustainable Co-operative.
OUR POTENTIAL
OU
R P
OTE
NTI
AL
30 | OUR POTENTIAL OUR POTENTIAL | 31
FONTERRA ANNUAL REVIEW 2017 FONTERRA ANNUAL REVIEW 2017

NZMP LAUNCHED GRASS-FED AND NON-GMO FARM PRACTICE CLAIMS WITHIN THE LAST YEAR TO DELIVER EVEN GREATER VALUE TO OUR CUSTOMERS.
Through this programme, NZMP has so far delivered US$4.7M price achievement, with further growth projected into the future – a clear demonstration of the value of pure, New Zealand dairy.
TRUSTED GOODNESSOur Trusted Goodness™ quality seal is at the heart of our promise to provide trusted, high quality dairy nutrition.
OU
R P
ERFO
RM
AN
CE
FONTERRA ANNUAL REVIEW 2017
33 32

SALES REVENUERevenue grew 12 per cent on the back of strong demand.
$745M$19.2B
HIGHLIGHTS
> Significant growth in Consumer and Foodservice – additional 576 million LME
> Advanced Ingredients LME growth of 473 million, an increase of nine per cent
> $745 million net profit after tax, delivering 46 cents earnings per share
> Solid return on capital of 11.1 per cent
> Further improvement in working capital days
> Continued strong balance sheet and financial discipline
The 2016/2017 season saw a pleasing return to a more sustainable Farmgate Milk Price. At $6.12 per kgMS, a 57 per cent increase, our farmer shareholders will receive over $3 billion additional payments compared to last season. Improved prices are a reflection of continued balancing of supply and demand in the globally traded dairy market. The increase included an additional nine cents per kgMS due to changes in the Farmgate Milk Price assumptions. This year, an amended methodology for determining revenues delivered an additional six cents, with the remaining three cents mainly due to lower capital costs.
In the 2017 financial year, Fonterra significantly increased its sales volume of higher value products. This includes a 12 per cent increase in Consumer and Foodservice volumes and a nine per cent increase in Advanced Ingredients. These increases were achieved despite lower milk collections in New Zealand and alongside a significant increase in the Farmgate Milk Price.
Lower collections this year contributed to overall sales volumes declining five per cent in the Ingredients business. An unusually wet spring in New Zealand led to peak milk production being around six per cent lower than the previous season (and 11 per cent lower than the record volumes in the 2014/15 season). Conditions improved during the summer and into autumn, resulting in collections for the full season being down three per cent on the previous season.
GROUP OVERVIEWDelivery of our strategy to optimise our farmers’ New Zealand milk by moving more volume into higher value products has led to a solid operating and financial performance by the Co-operative, alongside a higher Farmgate Milk Price.
NZD MILLION YEAR ENDED 31 JULY 2017 YEAR ENDED 31 JULY 2016 CHANGE
Volume (LME, billion) 22.9 23.7 (3%)Volume (’000 MT) 4,180 4,3135 (3%)Sales revenue 19,232 17,199 12%Gross margin 3,264 3,632 (10%)Gross margin percentage 17.0% 21.1% –Operating expenses (2,370) (2,528) (6%)Reported EBIT 1,120 1,431 (22%)Normalised EBIT 1,155 1,358 (15%)Net finance costs (355) (499) (29%)Tax (expense)/credit (20) (98) (80%)Net profit after tax 745 834 (11%)Earnings per share (cents) 46 51 (10%)Adjusted earnings per share¹ (cents) 47 54 (13%)Dividend per share (cents) 40 40 0%Adjusted debt to EBITDA2 (ratio) 3.5 2.8 –Gearing ratio3 44.3% 44.3% –Return on capital4 11.1% 12.4% –Free cash flow 670 2,184 (69%)Capital expenditure 851 944 (10%)1 Adjusted earnings per share excludes certain non-cash items.2 Ratio is economic net interest bearing debt divided by earnings before interest, tax, depreciation and amortisation (EBITDA). Both debt and EBITDA are adjusted for the impact of operating leases.3 Gearing ratio is economic net interest bearing debt divided by economic net interest bearing debt, plus equity, excluding hedge reserves.4 Return on capital is calculated as normalised EBIT, less equity-accounted investees’ earnings, less a notional tax charge divided by capital employed. Capital employed excludes brands,
goodwill and equity-accounted investments. Return on capital, including brands, goodwill and equity-accounted investments was 8.3 per cent (2016: 9.2 per cent).5 China Farms volumes for the 2016 financial year have been restated to aid comparability between segments. Previously China Farms volumes were converted to metric tonnes based on the litres of raw
milk sold. These volumes are now converted based on weight of milk solids (i.e. fat and protein content) in line with the Ingredients methodology, where 1 litre of milk converts to approximately 0.07 kg.
NET PROFIT AFTER TAXWith stable dividend per share.
OU
R P
ERFO
RM
AN
CE
34 | OUR PERFORMANCE OUR PERFORMANCE | 35
FONTERRA ANNUAL REVIEW 2017 FONTERRA ANNUAL REVIEW 2017

The overall tighter supply environment, in combination with low opening inventories, supported improved pricing through the year. Despite the supply constraints, the Ingredients business prioritised the sale of higher value Advanced Ingredients, the volume of which grew by 473 million LME this year.
Our Consumer and Foodservice businesses had another strong year of sales growth. The 576 million increase in LMEs sold was supported by growth in both Consumer and Foodservice, the latter increasing 27 per cent this year. The standout performer was Greater China, where our successful Foodservice model continued to deliver growth in volume and earnings. Robust growth was also seen in our Soprole business in Chile, as well as in our operations in Sri Lanka.
China Farms had its first full year of production with our two hubs fully stocked with livestock. Total sales volume increased 47 per cent to 335 million LME, driven by larger herds and increased on-farm productivity.
In a year that saw a 57 per cent increase in the Farmgate Milk Price, Fonterra delivered a solid earnings performance.
Normalised EBIT for the Group was $1,155 million, delivering a net profit after tax of $745 million, 11 per cent lower than last year. Combined with continued strong financial discipline, the Co-operative maintained a 40 cents per share dividend. Overall, Group return on capital was 11.1 per cent reflecting solid earnings generation off a relatively stable capital base.
Our Ingredients business generated $943 million in normalised EBIT, a 22 per cent reduction on last year. This decrease was primarily the result of less favourable stream returns, which were $180 million lower than last year. Earnings were also impacted by changes to the Farmgate Milk Price Manual and the natural lag in contracts where pricing is set periodically, as these tend to underperform in a rising commodity environment.
Normalised EBIT for Consumer and Foodservice was up six per cent at $614 million. This reflects strong growth where higher volumes and improved pricing offset the compressed gross margins from increased input costs. Our Consumer businesses maintained stable gross margins of 29 per cent. Foodservice delivered strong gross margins of 22 per cent, a decline from last year, primarily due to the significantly higher global prices of fat-based products.
At the beginning of the year, responsibility for the sale of China Farms’ milk shifted to our Ingredients team in Greater China. The operations are now exclusively focussed on producing high-quality fresh milk in the most efficient and sustainable way, and our Ingredients business is responsible for capturing the greatest value from that milk. This is supported by the introduction of an internal raw milk price reflective of the long-term milk price forecast for high quality milk in China.
One of the highlights for the year was the performance of the Australian business. After a multi-year transformation the Ingredients, Consumer and Foodservice businesses are performing well, generating sustainable profits while paying a competitive milk price to our supplying farmers. This turnaround is reflected in our milk collections in Australia, where volumes grew by four million kgMS, up three per cent for the season despite the country’s overall production declining seven per cent. We have also re-opened our facility at Stanhope. This plant will produce a range of cheeses for the domestic and global markets.
The carrying value of our investment in Beingmate has been reduced this year to reflect the impact of the changing Chinese market for infant formula prior to a new regulatory framework being in place from 1 January 2018. The impact was $76 million overall, $41 million in losses reflecting Fonterra’s 18.8 per cent share of Beingmate’s performance, and a $35 million impairment of the value of Fonterra’s investment. This was partially offset by the $42 million gain on sale for Beingmate’s 51 per cent share of the Darnum site in Australia.
The Group result continues to reflect the benefits of our on-going Group-wide business transformation. This is evidenced by the further six per cent decrease in Group operating expenses, on top of last year’s eight per cent reduction.
Total net profit after tax reflected more favourable finance costs and tax expense for the year. Net finance costs were $144 million lower than last year due to lower average debt
through the year and a change in accounting treatment for certain non-cash fair value adjustments. Total tax expense was 80 per cent lower than last year at $20 million, partly due to lower operating profit and one-off capital gains taxes recognised last year.
The Co-operative again maintained strong financial discipline in a year where earnings performance was more challenging. The Group’s gearing ratio remained 44.3 per cent, the same as last year. This was the result of an increase of $173 million on the equity side of the calculation, which offset the $128 million higher closing balance for economic net interest-bearing debt.
Fonterra generated free cash flow of $670 million and again lowered working capital as measured in days’ sales, coming in at 75 days compared to 77 days last year. Working capital efficiency is a strategic focus across the organisation, with a particular focus on efficiently managing inventory. Due to a 54,000 MT reduction in inventory, the value of inventory only increased eight per cent, in a year where the average value increased 20 per cent per metric tonne due to higher global dairy prices. Capital expenditure was down ten per cent to $851 million, in line with expectations.
Another year of strong operating performance and continued financial discipline resulted in the Board declaring a full-year dividend of 40 cents, the same level as last year. This level is consistent with the Board’s policy to pay out 65-75 per cent of adjusted net profit after tax over time.
LIQUID MILK EQUIVALENTLME is a standard measure of the litres of milk allocated to each product based on the amount of fat and protein in the product relative to standardised raw milk. For example, a 1kg block of cheese equates to approximately 6.5 LME.
GROUP OVERVIEW
INCREASE IN VOLUMESConsumer and Foodservice sales grew by 12 per cent.576M
LME
GEARING RATIOSignificant improvement in the gearing ratio from last year maintained.44%
STANHOPEFirst production
from our new cheese lines in Australia.
OU
R P
ERFO
RM
AN
CE
36 | OUR PERFORMANCE OUR PERFORMANCE | 37
FONTERRA ANNUAL REVIEW 2017 FONTERRA ANNUAL REVIEW 2017
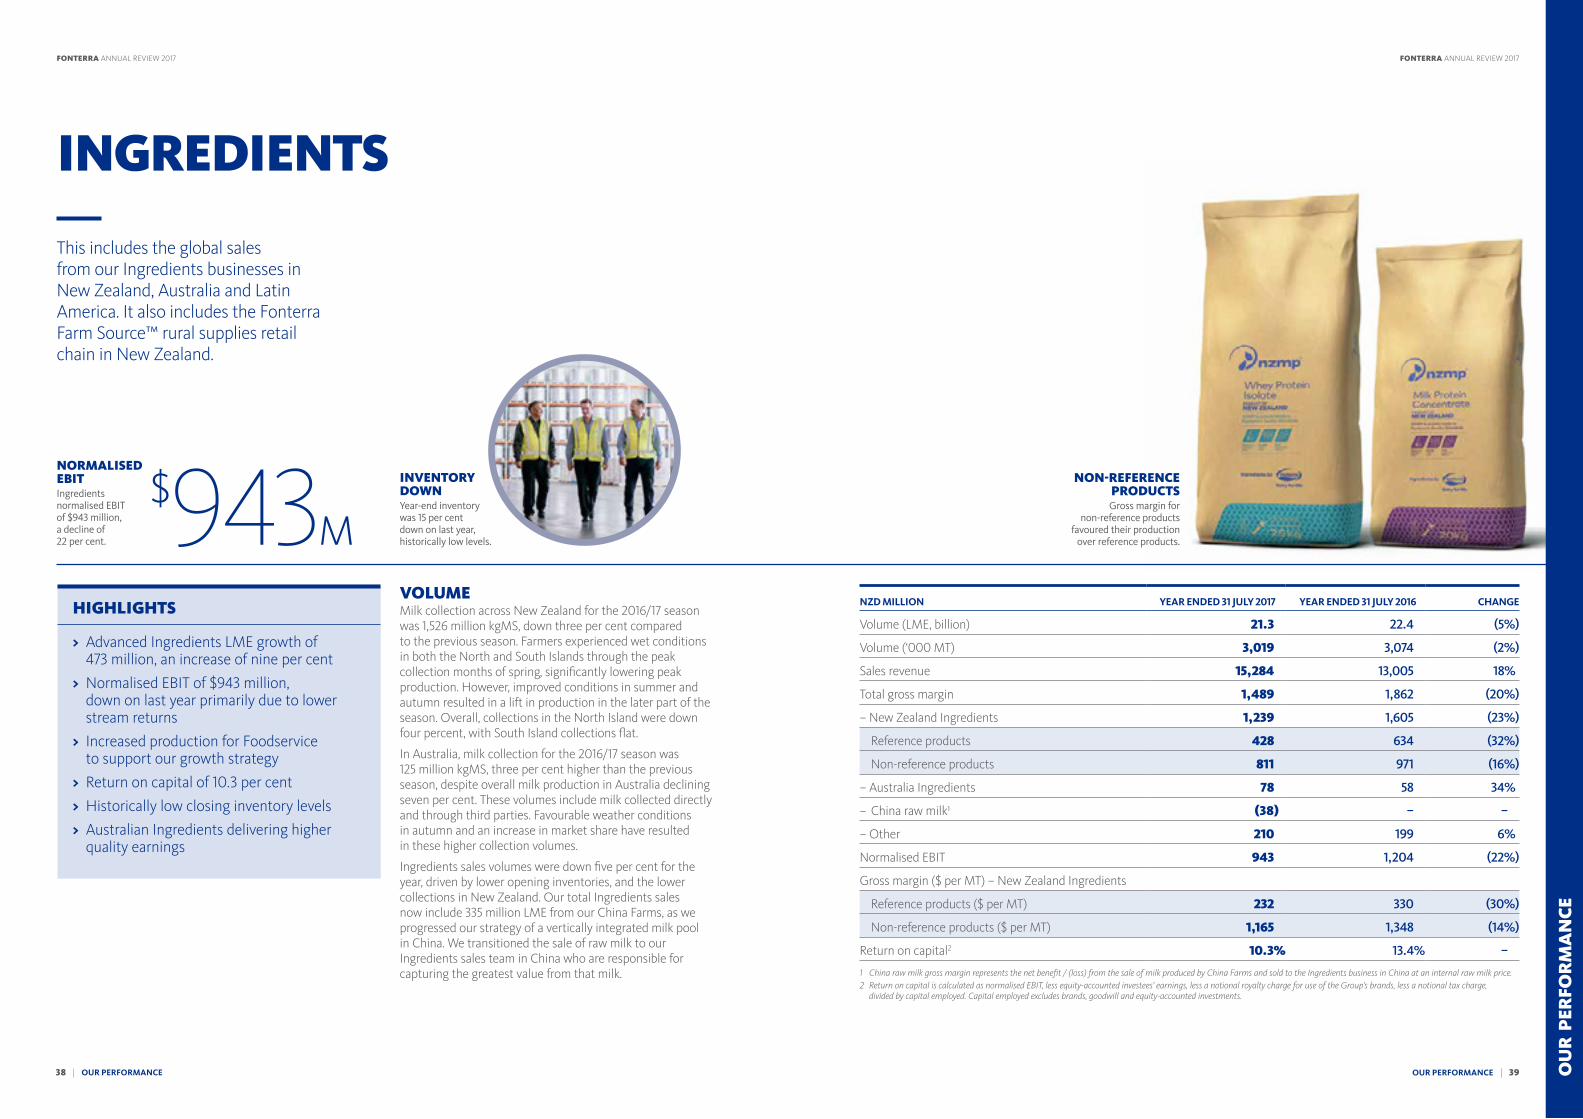
INVENTORY DOWNYear-end inventory was 15 per cent down on last year, historically low levels.
NORMALISED EBITIngredients normalised EBIT of $943 million, a decline of 22 per cent.
$943M
NON-REFERENCE PRODUCTSGross margin for
non-reference products favoured their production
over reference products.
VOLUME Milk collection across New Zealand for the 2016/17 season was 1,526 million kgMS, down three per cent compared to the previous season. Farmers experienced wet conditions in both the North and South Islands through the peak collection months of spring, significantly lowering peak production. However, improved conditions in summer and autumn resulted in a lift in production in the later part of the season. Overall, collections in the North Island were down four percent, with South Island collections flat.
In Australia, milk collection for the 2016/17 season was 125 million kgMS, three per cent higher than the previous season, despite overall milk production in Australia declining seven per cent. These volumes include milk collected directly and through third parties. Favourable weather conditions in autumn and an increase in market share have resulted in these higher collection volumes.
Ingredients sales volumes were down five per cent for the year, driven by lower opening inventories, and the lower collections in New Zealand. Our total Ingredients sales now include 335 million LME from our China Farms, as we progressed our strategy of a vertically integrated milk pool in China. We transitioned the sale of raw milk to our Ingredients sales team in China who are responsible for capturing the greatest value from that milk.
INGREDIENTS
This includes the global sales from our Ingredients businesses in New Zealand, Australia and Latin America. It also includes the Fonterra Farm Source™ rural supplies retail chain in New Zealand.
NZD MILLION YEAR ENDED 31 JULY 2017 YEAR ENDED 31 JULY 2016 CHANGE
Volume (LME, billion) 21.3 22.4 (5%)
Volume (‘000 MT) 3,019 3,074 (2%)
Sales revenue 15,284 13,005 18%
Total gross margin 1,489 1,862 (20%)
– New Zealand Ingredients 1,239 1,605 (23%)
Reference products 428 634 (32%)
Non-reference products 811 971 (16%)
– Australia Ingredients 78 58 34%
– China raw milk1 (38) – –
– Other 210 199 6%
Normalised EBIT 943 1,204 (22%)
Gross margin ($ per MT) – New Zealand Ingredients
Reference products ($ per MT) 232 330 (30%)
Non-reference products ($ per MT) 1,165 1,348 (14%)
Return on capital2 10.3% 13.4% –
1 China raw milk gross margin represents the net benefit / (loss) from the sale of milk produced by China Farms and sold to the Ingredients business in China at an internal raw milk price.2 Return on capital is calculated as normalised EBIT, less equity-accounted investees’ earnings, less a notional royalty charge for use of the Group’s brands, less a notional tax charge,
divided by capital employed. Capital employed excludes brands, goodwill and equity-accounted investments.
HIGHLIGHTS
> Advanced Ingredients LME growth of 473 million, an increase of nine per cent
> Normalised EBIT of $943 million, down on last year primarily due to lower stream returns
> Increased production for Foodservice to support our growth strategy
> Return on capital of 10.3 per cent
> Historically low closing inventory levels
> Australian Ingredients delivering higher quality earnings
OU
R P
ERFO
RM
AN
CE
38 | OUR PERFORMANCE OUR PERFORMANCE | 39
FONTERRA ANNUAL REVIEW 2017 FONTERRA ANNUAL REVIEW 2017

Our product mix shifted towards fat-based products reflecting the strong global demand and high prices for these products, in particular butter. Our Ingredients business is the main supplier of our global Foodservice business, therefore we saw significant volume growth in products manufactured for this business such as UHT cream, mozzarella and butter – demonstrating the important role Ingredients plays in supporting our Consumer and Foodservice growth strategy.
The Ingredients business has always had a focus on product innovation to meet exacting customer needs and open up new areas of demand. The products that serve these needs are called Advanced Ingredients, and generate premium pricing. They are differentiated from base ingredient offerings through their superior product performance, which is supported by Fonterra’s own research and process innovation. Sales volumes of Advanced Ingredients, such as medical grade lactose, grew nine per cent this year and now make up 19 per cent of Fonterra’s total external sales volume.
Strong customer demand and ongoing efforts to improve working capital meant that we closed the year with historically low inventory volume. Levels at our balance date of 31 July 2017 were 15 per cent lower than last year for Ingredients.
VALUETotal normalised EBIT for the Ingredients business was $943 million, 22 per cent lower than last year’s record level, primarily driven by lower gross margins in our New Zealand Ingredients business. The Ingredients business achieved manufacturing efficiencies, as well as reduced operating costs over the year. However, these benefits were more than offset by changes to the Farmgate Milk Price Manual, the impact of the natural lag in contracts with periodic pricing and the significant impact of stream returns.
Operationally our New Zealand sites delivered further improvements in yields and managed cost of quality to similar levels to last year despite tightening standards. The lower peak milk production, combined with additional processing capacity, ensured there were no costs associated with peak processing again this year. The unusual profile of milk collections over the season provided some challenges to operational planning, in particular the timing of late season production and sales.
The Farmgate Milk Price that informs our cost of milk for New Zealand production is calculated according to the Farmgate Milk Price Manual. The manual provides for Fonterra to retain an amount of earnings to generate a specified return on capital on an assumed asset base. These earnings are referred to as the regulated return. At the start of each season,
the manual is updated to reflect the latest revenue and cost assumptions. In 2017, lower assumed interest rates decreased the modelled return on capital, which lowered the regulated return across our New Zealand Ingredients portfolio. This negatively impacted gross margins in our Ingredients business.
In addition to this, the manual was amended to include prices from spot sales of WMP, SMP and AMF. This change was driven by Fonterra’s constitutional requirement to pay the maximum sustainable milk price and regulatory requirements to pay an efficient, competitive milk price. This added an additional six cents per kgMS to the Farmgate Milk Price.
Our New Zealand Ingredients business manufactures five commodity products that inform the Farmgate Milk Price. These are called reference products, while all other products are non-reference products.
Gross margins for reference products were $428 million, $206 million lower than last year. This was a result of structural changes to the milk price model, a lower regulated return, lower margins from the natural lag in contracts with periodic pricing, which underperform in a rising commodity price environment, and lower sales of prior season inventories.
For non-reference products, gross margins were $811 million, $160 million down on last year. This was primarily due to significantly lower stream returns. Stream returns are the relative difference between reference product and non-reference product prices. This relative gap narrowed significantly, reflected in the 30 per cent increase in revenue per metric tonne for reference products versus a 12 per cent increase for non-reference products. This resulted in negative
stream returns of $40 million, a decline of $180 million relative to last year. Non-reference product margins were also impacted by the structural changes to the milk price and a lower regulated return but these were offset by operational improvements.
The Australia Ingredients business delivered a strong performance. While normalised EBIT of $62 million was the same as last year, the quality of the earnings has improved.
Last year’s result included one-off gains such as the sale of Dairy Technical Services, whereas this year’s result is largely sustainable earnings, and is on course to improve next year with the commissioning of the Stanhope cheese plant.
The Ingredients gross margin was also impacted by a $38 million loss representing the difference between the domestic milk price and the internal raw milk price paid to China Farms.
Our Global Operations team tightly managed capital expenditure through the year by focusing on value added products, efficiency gains and sustainability improvements. This year saw significant investment at our Edgecumbe site, the commissioning of Lichfield, and our $149 million rebuild of Stanhope.
INGREDIENTS
NEW ZEALAND INGREDIENTS REVENUE AND VOLUME1 YEAR ENDED 31 JULY 2017 YEAR ENDED 31 JULY 2016 CHANGE
Production volume (’000 MT)
Reference products 1,837 1,873 (2%)
Non-reference products 749 746 0%
Sales volume (’000 MT)2
Reference products 1,841 1,920 (4%)
Non-reference products 696 720 (3%)
Revenue per MT (NZD)2
Reference products 4,262 3,276 30%
Non-reference products 5,567 4,972 12%
1 Table excludes bulk liquid milk. The bulk liquid milk volume for the year ended 31 July 2017 was 76,000 MT of kgMS equivalent (year ended 31 July 2016 was 77,000 MT).
2 Revenue and sales volume exclude Foodservice volumes to China and Latin America. This volume for the year ended 31 July 2017 was 143,000 MT (year ended 31 July 2016 was 92,000 MT).
NATURAL DEMANDGlobal demand for butter is strong due to an increased recognition by consumers in the benefits of healthy and natural foods.
NEW PLANTSOur Stanhope site in Australia
reopened and Edgecumbe in New Zealand was expanded.
INCREASED SHIPPINGWith the introduction of a regular big-ship service from Tauranga, we now have weekly shipments on vessels with capacities of around 10,000 standard containers.
OU
R P
ERFO
RM
AN
CE
40 | OUR PERFORMANCE OUR PERFORMANCE | 41
FONTERRA ANNUAL REVIEW 2017 FONTERRA ANNUAL REVIEW 2017
FOODSERVICE GROWTHOur Global Foodservice sales grew by 27 per cent this year.
NORMALISED EBITDespite significantly higher input costs earnings increased six per cent.
$614MVOLUMEThis year we continued to deliver on our strategy to move more volume into higher value Consumer and Foodservice products. We achieved volume growth of 12 per cent, selling 5.5 billion LME, an additional 576 million LME compared to last year. This increase was largely driven by strong Foodservice sales in Greater China, as well as strong growth out of Soprole and Sri Lanka. Overall volume growth for Foodservice was 27 per cent.
> Greater China: significant volume growth of 46 per cent, an additional 402 million LME this year, largely due to strong performance in China Foodservice.
> Latin America: strong growth of 18 per cent, due to another good performance by Soprole, with increased sales of yoghurts, liquid milk and desserts.
> Asia: volumes were up 153 million LME, a ten per cent increase, driven by double-digit growth in both Sri Lanka and Vietnam.
> Oceania: volumes were down five per cent, reflecting the sale of businesses in non-core categories in Australia.
CONSUMER AND FOODSERVICEThis comprises our Consumer brands and Foodservice businesses in Greater China, Latin America, Asia and Oceania.
NZD MILLION YEAR ENDED 31 JULY 2017 YEAR ENDED 31 JULY 2016 CHANGE
Volume (LME, billion) 5.5 4.9 12%
Consumer 3.2 3.1 3%
Foodservice 2.3 1.8 27%
Volume (‘000 MT) 1,783 1,800 (1%)
Sales revenue 6,517 6,296 4%
Gross margin 1,744 1,808 (4%)
Gross margin (percentage) 27% 29% –
Consumer 29% 29% –
Foodservice 22% 27% –
Normalised EBIT 614 580 6%
Return on capital1 47.2% 41.7% –
1 Return on capital is calculated as normalised EBIT, less equity-accounted investees’ earnings, less a notional royalty charge for use of the Group’s brands, less a notional tax charge, divided by capital employed. Capital employed excludes brands, goodwill and equity-accounted investments.
NORMALISED EBIT: KEY PERFORMANCE DRIVERSNZD MILLION YEAR ENDED 31 JULY 2017 YEAR ENDED 31 JULY 2016
Normalised EBIT prior year 580 408
Volume 116 120
Price 64 (210)
Cost of goods sold (176) 251
Operating expenses 53 (3)
Other (23) 14
Normalised EBIT 614 580
HIGHLIGHTS
> An additional 576 million LME moved into higher-value products
> Foodservice volume growth of 27 per cent and Consumer volumes up three per cent
> Normalised EBIT of $614 million, an increase of six per cent
> Return on capital of 47.2 per cent
> Successful product launches across every region
OU
R P
ERFO
RM
AN
CE
42 | OUR PERFORMANCE OUR PERFORMANCE | 43
FONTERRA ANNUAL REVIEW 2017 FONTERRA ANNUAL REVIEW 2017

CONSUMER AND FOODSERVICE
VALUEOur Consumer and Foodservice businesses delivered a solid result considering the pressure that was placed on margins by increased input costs this year. Normalised EBIT was $614 million, a six per cent increase compared to last year.
This increase was largely a result of higher volumes, improved pricing and reduced operating expenditure, partially offset by increased input costs as set out in the key performance drivers table. Overall our Consumer business maintained margins, with a gross margin of 29 per cent, the same as last year, reflecting a strong focus on strategic pricing and product range management. However, higher input costs were not able to be fully passed through in Foodservice, where gross margins compressed to 22 per cent from 27 per cent last year, due to a combination of competitive pressure and substitution risk.
> Greater China: delivered significant normalised EBIT growth of 60 per cent driven by increased volumes, particularly in Foodservice, and continued cost control.
> Latin America: strong earnings growth in Soprole driven by higher volumes through new product launches, however offset by the challenging economies of Brazil and Venezuela.
> Asia: normalised EBIT of $201 million, however higher input costs meant it was an 18 per cent decline.
> Oceania: normalised EBIT growth of four per cent, as our successful turnaround of the Australian business continues to deliver value.
REGIONAL UPDATE
Greater ChinaGreater China continues to deliver both volume and value growth, with an additional 402 million LME this year and normalised EBIT of $209 million, up 60 per cent on last year.
The China Foodservice business delivered another strong performance, with sales volume growth of 48 per cent this year, as our Anchor™ Food Professionals™ model continues to build momentum in Mainland China. We increased our geographic reach, expanding into a further 20 cities, and enhanced our value proposition by operating in-market warehouses to enhance our service offering to customers and maximise cost-to-serve efficiencies.
Our Consumer brands businesses in Hong Kong and Taiwan performed well with both volume and value growth. Anchor™ has become the number one imported UHT brand in Mainland China for e-commerce sales this year, reflecting our strong commitment to this sales channel.
Our success in both the Consumer and Foodservice segments is in large part driven by ongoing development of innovative new products and solutions specifically tailored to Chinese consumer tastes, for example, the cream cheese tea macchiato in Foodservice and Anchor™ UHT milk in golden kiwi flavour.
The Greater China result has been normalised to exclude the $76 million impact of losses relating to, and an impairment on, our 18.8 per cent investment in Beingmate, our strategic partner in China. While these impacts are disappointing, it reflects the industry-wide disruption in the infant formula category in China leading up to the introduction of stricter regulation from 1 January 2018. Beingmate is well positioned for the new regulatory environment, having had 12 products approved in the first group of approvals from the Chinese regulatory body.
Latin AmericaOur Latin America business delivered a good result with volumes up 18 per cent on last year. However, normalised EBIT has declined, down five per cent for the year, due to the impact of weak economies in Brazil and Venezuela, offsetting strong earnings growth in Soprole.
Our Soprole business in Chile continues to perform strongly with total gross margin up 12 per cent on last year, as sales of desserts, liquid milk and yoghurt increased on the back of the successful relaunch of the Soprole brand, as well as the reformulation of products to meet higher nutritional standards introduced by the government. Although the business faced rising input costs, our pricing strategy and operational efficiencies allowed us to deliver both volume and revenue growth as well as increased market share.
CONSUMER AND FOODSERVICE PERFORMANCE
LME (BILLION) NORMALISED EBIT ($M)
YEAR ENDED 31 JULY 2017
YEAR ENDED 31 JULY 2016 CHANGE
YEAR ENDED 31 JULY 2017
YEAR ENDED 31 JULY 2016 CHANGE
Consumer and foodservice 5.5 4.9 12% 614 580 6%
Greater China 1.3 0.9 46% 209 131 60%
Latin America 0.7 0.6 18% 103 108 (5%)
Asia 1.7 1.6 10% 201 244 (18%)
Oceania 1.7 1.8 (5%) 101 97 4%
NEW UHT FLAVOURS Our Anchor™ UHT range expanded, including a new ‘Golden Kiwi’ flavour.
MARKET LEADERSHIP Six million servings of Soprole products are consumed every day in Chile.
SOPROLE BRANDOur Soprole brand in Chile was relaunched this year.
OU
R P
ERFO
RM
AN
CE
44 | OUR PERFORMANCE OUR PERFORMANCE | 45
FONTERRA ANNUAL REVIEW 2017 FONTERRA ANNUAL REVIEW 2017
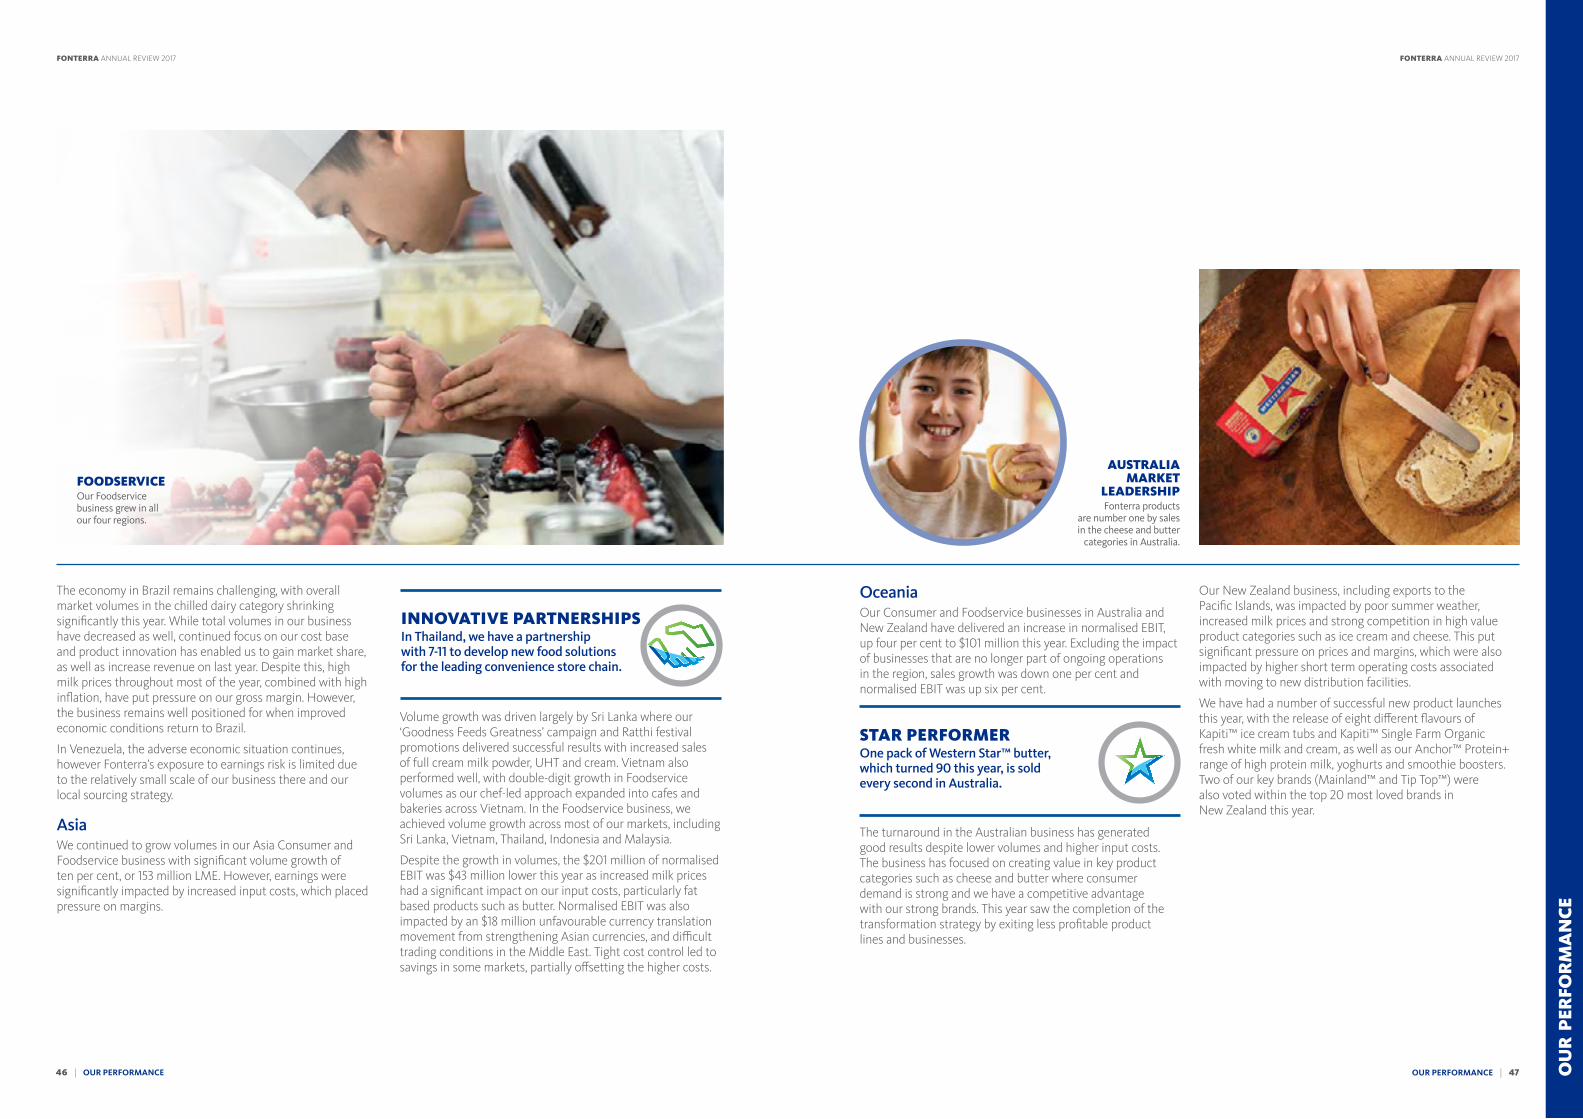
The economy in Brazil remains challenging, with overall market volumes in the chilled dairy category shrinking significantly this year. While total volumes in our business have decreased as well, continued focus on our cost base and product innovation has enabled us to gain market share, as well as increase revenue on last year. Despite this, high milk prices throughout most of the year, combined with high inflation, have put pressure on our gross margin. However, the business remains well positioned for when improved economic conditions return to Brazil.
In Venezuela, the adverse economic situation continues, however Fonterra’s exposure to earnings risk is limited due to the relatively small scale of our business there and our local sourcing strategy.
Asia We continued to grow volumes in our Asia Consumer and Foodservice business with significant volume growth of ten per cent, or 153 million LME. However, earnings were significantly impacted by increased input costs, which placed pressure on margins.
Volume growth was driven largely by Sri Lanka where our ‘Goodness Feeds Greatness’ campaign and Ratthi festival promotions delivered successful results with increased sales of full cream milk powder, UHT and cream. Vietnam also performed well, with double-digit growth in Foodservice volumes as our chef-led approach expanded into cafes and bakeries across Vietnam. In the Foodservice business, we achieved volume growth across most of our markets, including Sri Lanka, Vietnam, Thailand, Indonesia and Malaysia.
Despite the growth in volumes, the $201 million of normalised EBIT was $43 million lower this year as increased milk prices had a significant impact on our input costs, particularly fat based products such as butter. Normalised EBIT was also impacted by an $18 million unfavourable currency translation movement from strengthening Asian currencies, and difficult trading conditions in the Middle East. Tight cost control led to savings in some markets, partially offsetting the higher costs.
OceaniaOur Consumer and Foodservice businesses in Australia and New Zealand have delivered an increase in normalised EBIT, up four per cent to $101 million this year. Excluding the impact of businesses that are no longer part of ongoing operations in the region, sales growth was down one per cent and normalised EBIT was up six per cent.
The turnaround in the Australian business has generated good results despite lower volumes and higher input costs. The business has focused on creating value in key product categories such as cheese and butter where consumer demand is strong and we have a competitive advantage with our strong brands. This year saw the completion of the transformation strategy by exiting less profitable product lines and businesses.
Our New Zealand business, including exports to the Pacific Islands, was impacted by poor summer weather, increased milk prices and strong competition in high value product categories such as ice cream and cheese. This put significant pressure on prices and margins, which were also impacted by higher short term operating costs associated with moving to new distribution facilities.
We have had a number of successful new product launches this year, with the release of eight different flavours of Kapiti™ ice cream tubs and Kapiti™ Single Farm Organic fresh white milk and cream, as well as our Anchor™ Protein+ range of high protein milk, yoghurts and smoothie boosters. Two of our key brands (Mainland™ and Tip Top™) were also voted within the top 20 most loved brands in New Zealand this year.
FOODSERVICEOur Foodservice business grew in all our four regions.
STAR PERFORMEROne pack of Western Star™ butter, which turned 90 this year, is sold every second in Australia.
AUSTRALIA MARKET
LEADERSHIPFonterra products
are number one by sales in the cheese and butter
categories in Australia.
INNOVATIVE PARTNERSHIPSIn Thailand, we have a partnership with 7-11 to develop new food solutions for the leading convenience store chain.
OU
R P
ERFO
RM
AN
CE
46 | OUR PERFORMANCE OUR PERFORMANCE | 47
FONTERRA ANNUAL REVIEW 2017 FONTERRA ANNUAL REVIEW 2017

$1 OUT OF EVERY $6 SPENT ON FOODSERVICE IS DAIRY RELATED.
We are on the ground in more than 50 markets, giving us a remarkable level of insight into our customers’ needs. We sell to more than 10,000 bakeries each year, and this gives us a deep understanding of how that business operates and how to optimise it.
X
GROWTH RATEOur Anchor™ Food Professionals Foodservice™ business grew at 10 times the market growth rate for foodservice volume over the past 12 months.10
OU
R P
ERFO
RM
AN
CE
FONTERRA ANNUAL REVIEW 2017
49 48
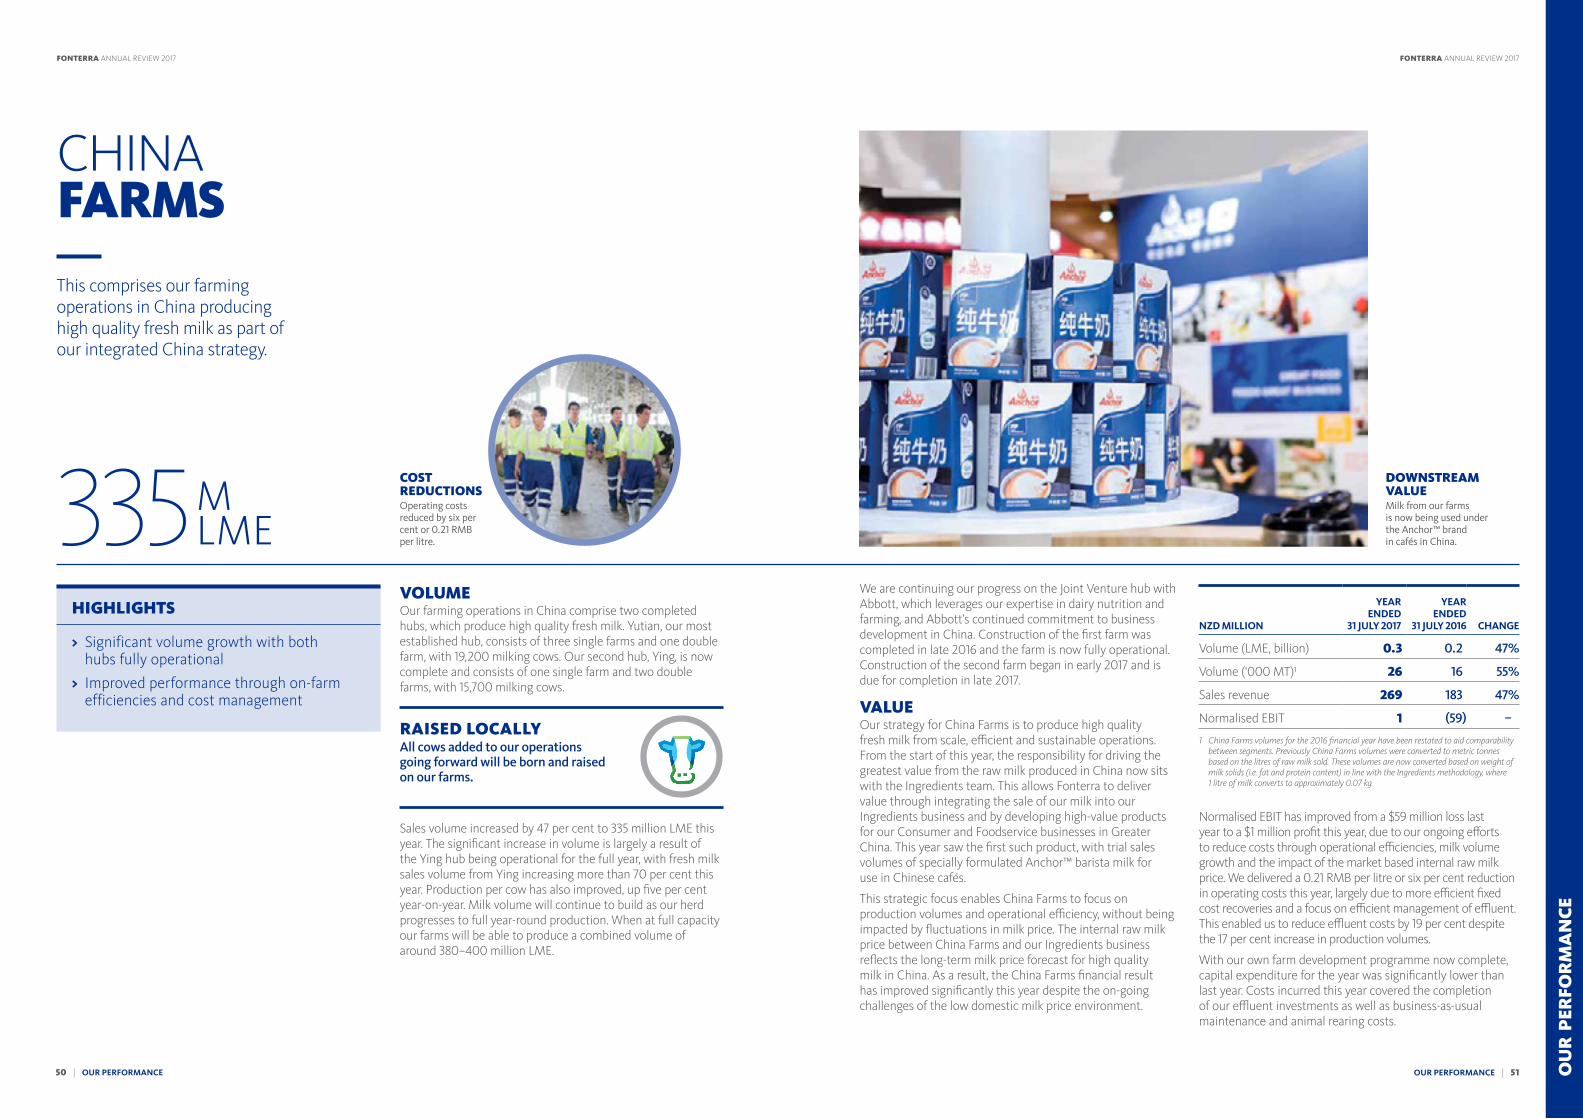
DOWNSTREAM VALUEMilk from our farms is now being used under the Anchor™ brand in cafés in China.
COST REDUCTIONSOperating costs reduced by six per cent or 0.21 RMB per litre.335M
LME
VOLUMEOur farming operations in China comprise two completed hubs, which produce high quality fresh milk. Yutian, our most established hub, consists of three single farms and one double farm, with 19,200 milking cows. Our second hub, Ying, is now complete and consists of one single farm and two double farms, with 15,700 milking cows.
RAISED LOCALLYAll cows added to our operations going forward will be born and raised on our farms.
Sales volume increased by 47 per cent to 335 million LME this year. The significant increase in volume is largely a result of the Ying hub being operational for the full year, with fresh milk sales volume from Ying increasing more than 70 per cent this year. Production per cow has also improved, up five per cent year-on-year. Milk volume will continue to build as our herd progresses to full year-round production. When at full capacity our farms will be able to produce a combined volume of around 380–400 million LME.
We are continuing our progress on the Joint Venture hub with Abbott, which leverages our expertise in dairy nutrition and farming, and Abbott’s continued commitment to business development in China. Construction of the first farm was completed in late 2016 and the farm is now fully operational. Construction of the second farm began in early 2017 and is due for completion in late 2017.
VALUEOur strategy for China Farms is to produce high quality fresh milk from scale, efficient and sustainable operations. From the start of this year, the responsibility for driving the greatest value from the raw milk produced in China now sits with the Ingredients team. This allows Fonterra to deliver value through integrating the sale of our milk into our Ingredients business and by developing high-value products for our Consumer and Foodservice businesses in Greater China. This year saw the first such product, with trial sales volumes of specially formulated Anchor™ barista milk for use in Chinese cafés.
This strategic focus enables China Farms to focus on production volumes and operational efficiency, without being impacted by fluctuations in milk price. The internal raw milk price between China Farms and our Ingredients business reflects the long-term milk price forecast for high quality milk in China. As a result, the China Farms financial result has improved significantly this year despite the on-going challenges of the low domestic milk price environment.
Normalised EBIT has improved from a $59 million loss last year to a $1 million profit this year, due to our ongoing efforts to reduce costs through operational efficiencies, milk volume growth and the impact of the market based internal raw milk price. We delivered a 0.21 RMB per litre or six per cent reduction in operating costs this year, largely due to more efficient fixed cost recoveries and a focus on efficient management of effluent. This enabled us to reduce effluent costs by 19 per cent despite the 17 per cent increase in production volumes.
With our own farm development programme now complete, capital expenditure for the year was significantly lower than last year. Costs incurred this year covered the completion of our effluent investments as well as business-as-usual maintenance and animal rearing costs.
CHINA FARMSThis comprises our farming operations in China producing high quality fresh milk as part of our integrated China strategy.
NZD MILLION
YEAR ENDED
31 JULY 2017
YEAR ENDED
31 JULY 2016 CHANGE
Volume (LME, billion) 0.3 0.2 47%
Volume (‘000 MT)1 26 16 55%
Sales revenue 269 183 47%
Normalised EBIT 1 (59) –
1 China Farms volumes for the 2016 financial year have been restated to aid comparability between segments. Previously China Farms volumes were converted to metric tonnes based on the litres of raw milk sold. These volumes are now converted based on weight of milk solids (i.e. fat and protein content) in line with the Ingredients methodology, where 1 litre of milk converts to approximately 0.07 kg.
HIGHLIGHTS
> Significant volume growth with both hubs fully operational
> Improved performance through on-farm efficiencies and cost management
OU
R P
ERFO
RM
AN
CE
50 | OUR PERFORMANCE OUR PERFORMANCE | 51
FONTERRA ANNUAL REVIEW 2017 FONTERRA ANNUAL REVIEW 2017

THIS YEAR WE ANNOUNCED A BOLD NEW AMBITION. We will lead the regeneration of 50 freshwater catchments across New Zealand.
50 FRESHWATER CATCHMENTS
FONTERRA ANNUAL REVIEW 2017
53 52
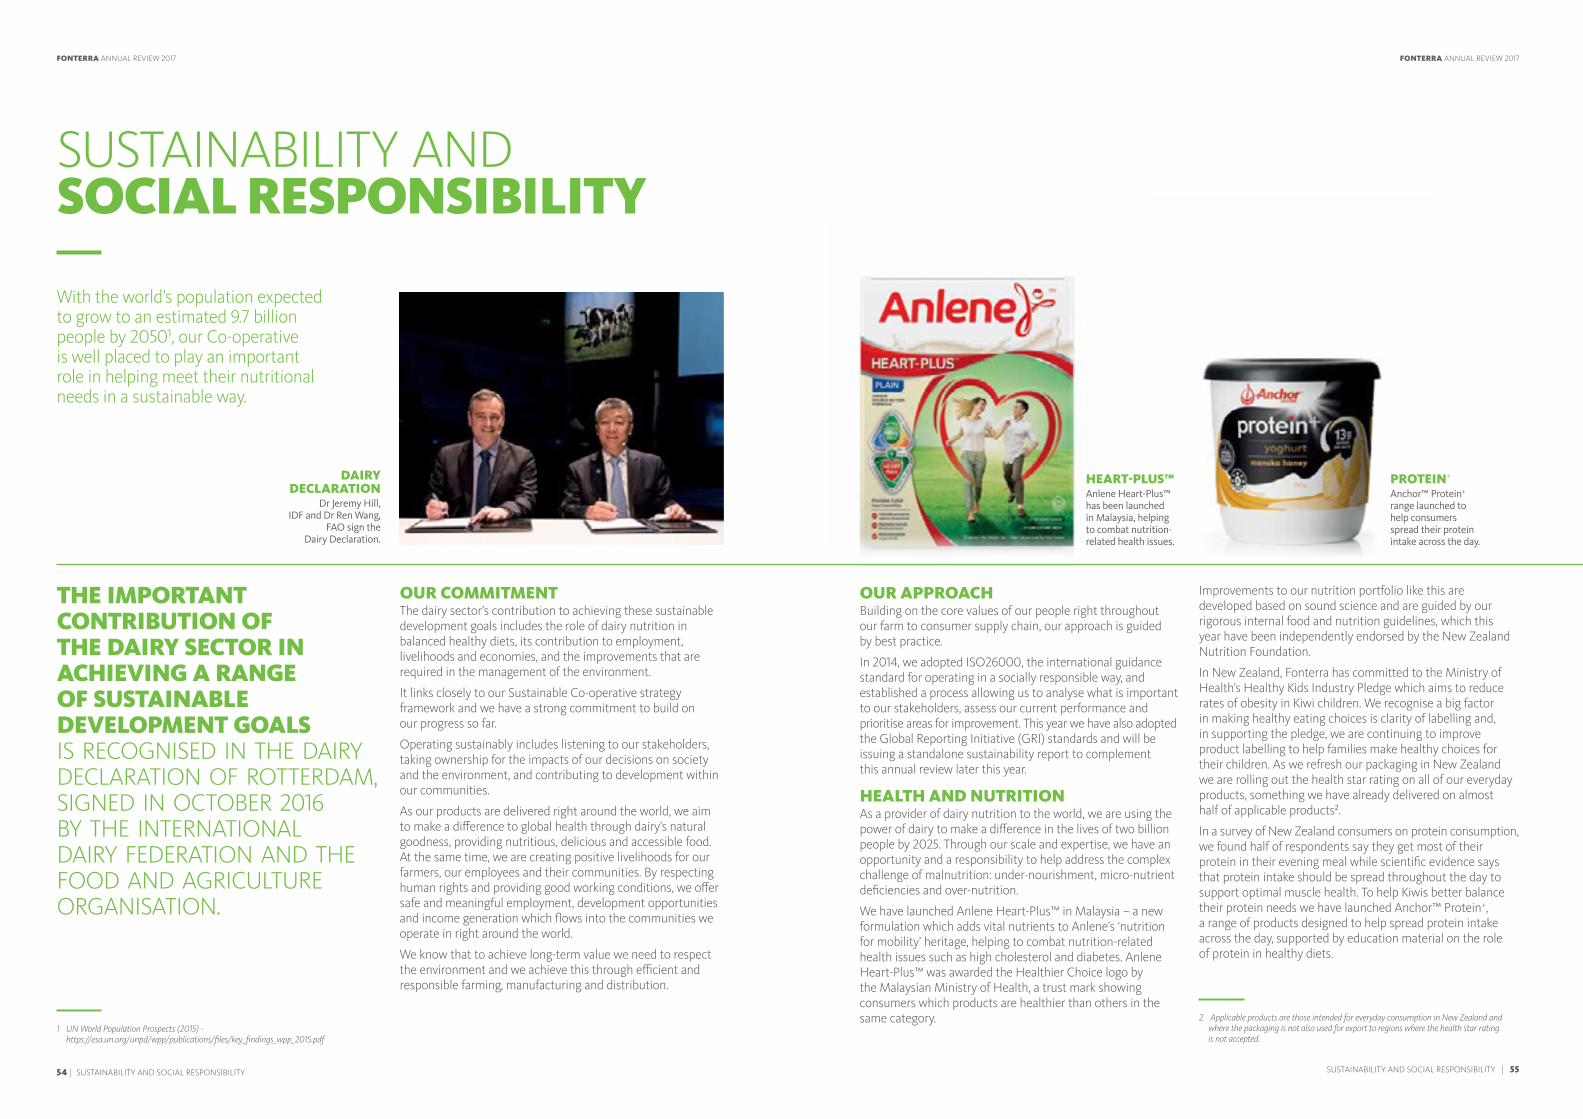
THE IMPORTANT CONTRIBUTION OF THE DAIRY SECTOR IN ACHIEVING A RANGE OF SUSTAINABLE DEVELOPMENT GOALS IS RECOGNISED IN THE DAIRY DECLARATION OF ROTTERDAM, SIGNED IN OCTOBER 2016 BY THE INTERNATIONAL DAIRY FEDERATION AND THE FOOD AND AGRICULTURE ORGANISATION.
OUR COMMITMENTThe dairy sector’s contribution to achieving these sustainable development goals includes the role of dairy nutrition in balanced healthy diets, its contribution to employment, livelihoods and economies, and the improvements that are required in the management of the environment.
It links closely to our Sustainable Co-operative strategy framework and we have a strong commitment to build on our progress so far.
Operating sustainably includes listening to our stakeholders, taking ownership for the impacts of our decisions on society and the environment, and contributing to development within our communities.
As our products are delivered right around the world, we aim to make a difference to global health through dairy’s natural goodness, providing nutritious, delicious and accessible food. At the same time, we are creating positive livelihoods for our farmers, our employees and their communities. By respecting human rights and providing good working conditions, we offer safe and meaningful employment, development opportunities and income generation which flows into the communities we operate in right around the world.
We know that to achieve long-term value we need to respect the environment and we achieve this through efficient and responsible farming, manufacturing and distribution.
OUR APPROACHBuilding on the core values of our people right throughout our farm to consumer supply chain, our approach is guided by best practice.
In 2014, we adopted ISO26000, the international guidance standard for operating in a socially responsible way, and established a process allowing us to analyse what is important to our stakeholders, assess our current performance and prioritise areas for improvement. This year we have also adopted the Global Reporting Initiative (GRI) standards and will be issuing a standalone sustainability report to complement this annual review later this year.
HEALTH AND NUTRITIONAs a provider of dairy nutrition to the world, we are using the power of dairy to make a difference in the lives of two billion people by 2025. Through our scale and expertise, we have an opportunity and a responsibility to help address the complex challenge of malnutrition: under-nourishment, micro-nutrient deficiencies and over-nutrition.
We have launched Anlene Heart-Plus™ in Malaysia – a new formulation which adds vital nutrients to Anlene’s ‘nutrition for mobility’ heritage, helping to combat nutrition-related health issues such as high cholesterol and diabetes. Anlene Heart-Plus™ was awarded the Healthier Choice logo by the Malaysian Ministry of Health, a trust mark showing consumers which products are healthier than others in the same category.
Improvements to our nutrition portfolio like this are developed based on sound science and are guided by our rigorous internal food and nutrition guidelines, which this year have been independently endorsed by the New Zealand Nutrition Foundation.
In New Zealand, Fonterra has committed to the Ministry of Health’s Healthy Kids Industry Pledge which aims to reduce rates of obesity in Kiwi children. We recognise a big factor in making healthy eating choices is clarity of labelling and, in supporting the pledge, we are continuing to improve product labelling to help families make healthy choices for their children. As we refresh our packaging in New Zealand we are rolling out the health star rating on all of our everyday products, something we have already delivered on almost half of applicable products2.
In a survey of New Zealand consumers on protein consumption, we found half of respondents say they get most of their protein in their evening meal while scientific evidence says that protein intake should be spread throughout the day to support optimal muscle health. To help Kiwis better balance their protein needs we have launched Anchor™ Protein+, a range of products designed to help spread protein intake across the day, supported by education material on the role of protein in healthy diets.
SUSTAINABILITY AND SOCIAL RESPONSIBILITY
With the world’s population expected to grow to an estimated 9.7 billion people by 20501, our Co-operative is well placed to play an important role in helping meet their nutritional needs in a sustainable way.
1 UN World Population Prospects (2015) - https://esa.un.org/unpd/wpp/publications/files/key_findings_wpp_2015.pdf
2 Applicable products are those intended for everyday consumption in New Zealand and where the packaging is not also used for export to regions where the health star rating is not accepted.
DAIRY DECLARATION
Dr Jeremy Hill, IDF and Dr Ren Wang,
FAO sign the Dairy Declaration.
JEREMY HILL SIGNING DAIRY DECLARATION
PROTEIN+
Anchor™ Protein+ range launched to help consumers spread their protein intake across the day.
HEART-PLUS™Anlene Heart-Plus™ has been launched in Malaysia, helping to combat nutrition-related health issues.
SUSTAINABILITY AND SOCIAL RESPONSIBILITY | 55
FONTERRA ANNUAL REVIEW 2017
54 | SUSTAINABILITY AND SOCIAL RESPONSIBILITY
FONTERRA ANNUAL REVIEW 2017

FOR FUTURE GENERATIONSFive years since Milk for Schools was launched, participation is still strong with more than 1,450 schools.
PRODUCT AUTHENTICATIONOur product authentication solution uses unique QR codes that allow consumers to check Anmum™ products are authentic.
Nutrition programmesWe aim to demonstrate our co-operative spirit by making a difference for our communities through the way we conduct ourselves and by investing in specific nutrition programmes. For example, in New Zealand we are caring for Kiwi kids through our in-school nutrition programmes; Fonterra Milk for Schools and KickStart Breakfast (see page 23).
Food banks Joining forces in 2007, our Australian business supports Foodbank, Australia’s largest hunger relief organisation, who provide meals to charities and schools around Australia. To celebrate ten years of partnership, the relationship will now see Fonterra become the exclusive supplier of fresh milk for Foodbank’s Milk Program in Victoria.
This programme distributes fresh milk to Australian families and individuals who need access to food. In 2016, Fonterra Australia donated fresh milk and other dairy foods equivalent to nearly 350,000 meals. Based largely on health and education outcomes, Foodbank has estimated a social return value of AU$4.4 million (NZ$4.66 million).
We also support other similar food bank initiatives throughout the world, including five food banks in the Auckland region, such as the Salvation Army and the Auckland City Mission; and also further afield with Red Alimentos in Chile.
TRUST IN SOURCEFonterra is committed to our promise of “Safe Food, Safe People, World Class Quality”, delivering what matters most to our customers and consumers throughout our entire supply chain. This includes commitments to animal welfare, milk quality and on-farm management in New Zealand and all over the world.
Achieving benchmark standardsTwo years ago, we set a target for all our manufacturing facilities to be certified to globally recognised benchmarks3 by 2019; demonstrating they have robust Food Safety Management Systems. More than 80 per cent are now at this level. In addition, our own farming operations in China have also achieved this benchmark this year.
SUSTAINABILITY AND SOCIAL RESPONSIBILITY
Thinking and living food safety and qualityTo ensure we deliver on our promise, we always focus on strengthening our food safety culture, knowing that with any improvement in the supply chain, everyone wins.
Independent research in 2017 shows the success of these efforts, with Fonterra employees better understanding their individual responsibilities as part of a food company. With this knowledge, they are empowered, encouraged and enabled to make decisions that ensure protecting food safety and quality is their first priority.
New and innovative thinking around food safety and quality has included turning procedural training activities into an interactive board game, customised to build engagement with its audience. The game has positively impacted food safety behaviours, and it won the New Zealand Association of Training and Documentation Learning Innovation of the Year 2016.
Global food defence – product authenticationWe continue to deliver on our food traceability strategy, improving our capability to track all batches of product and the ingredients that went into them – from raw milk right through to the consumer. Our external traceability, or product authentication solution, uses a unique QR code that allows consumers to check the product is authentic, either pre or post purchase, as well as giving real time product status information.
This product authentication solution was launched in 2017 across our Anmum™ paediatric and maternal range in New Zealand.
3 Independent certification to standards recognised by the Global Food Safety Initiative.
HELPING SET STANDARDSThrough participation in the GFSI’s* Food Safety Culture Working Group we encourage new industry standards. * GFSI = Global Food Safety Initiative
KICKSTART BREAKFASTIn partnership with Sanitarium, Kickstart Breakfast serves breakfast to more than 29,000 children and young people every week.
80%
BENCHMARK STANDARDSIn the last two years, 80 per cent of our manufacturing facilities have been certified to globally recognised benchmarks.
56 | SUSTAINABILITY AND SOCIAL RESPONSIBILITY SUSTAINABILITY AND SOCIAL RESPONSIBILITY | 57
FONTERRA ANNUAL REVIEW 2017 FONTERRA ANNUAL REVIEW 2017
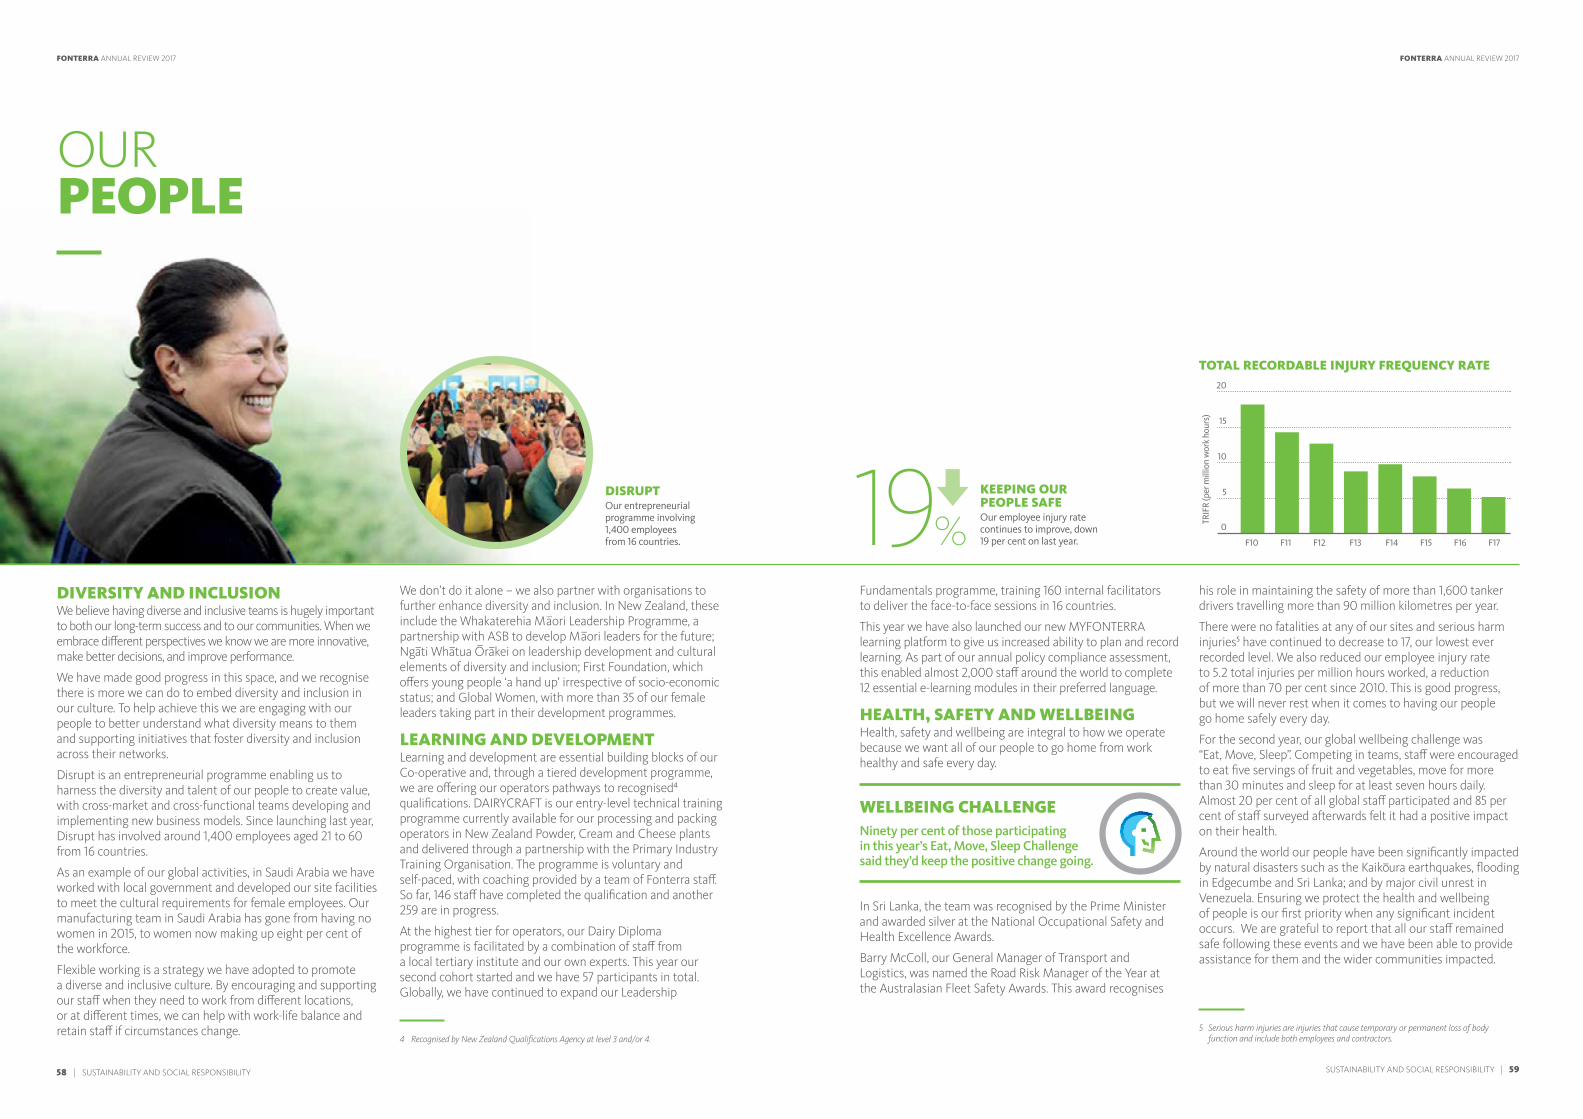
DISRUPTOur entrepreneurial programme involving 1,400 employees from 16 countries.
OUR PEOPLE
DIVERSITY AND INCLUSIONWe believe having diverse and inclusive teams is hugely important to both our long-term success and to our communities. When we embrace different perspectives we know we are more innovative, make better decisions, and improve performance.
We have made good progress in this space, and we recognise there is more we can do to embed diversity and inclusion in our culture. To help achieve this we are engaging with our people to better understand what diversity means to them and supporting initiatives that foster diversity and inclusion across their networks.
Disrupt is an entrepreneurial programme enabling us to harness the diversity and talent of our people to create value, with cross-market and cross-functional teams developing and implementing new business models. Since launching last year, Disrupt has involved around 1,400 employees aged 21 to 60 from 16 countries.
As an example of our global activities, in Saudi Arabia we have worked with local government and developed our site facilities to meet the cultural requirements for female employees. Our manufacturing team in Saudi Arabia has gone from having no women in 2015, to women now making up eight per cent of the workforce.
Flexible working is a strategy we have adopted to promote a diverse and inclusive culture. By encouraging and supporting our staff when they need to work from different locations, or at different times, we can help with work-life balance and retain staff if circumstances change.
We don’t do it alone – we also partner with organisations to further enhance diversity and inclusion. In New Zealand, these include the Whakaterehia Ma–ori Leadership Programme, a partnership with ASB to develop Ma–ori leaders for the future; Nga–ti Wha–tua O–ra–kei on leadership development and cultural elements of diversity and inclusion; First Foundation, which offers young people ‘a hand up’ irrespective of socio-economic status; and Global Women, with more than 35 of our female leaders taking part in their development programmes.
LEARNING AND DEVELOPMENTLearning and development are essential building blocks of our Co-operative and, through a tiered development programme, we are offering our operators pathways to recognised4 qualifications. DAIRYCRAFT is our entry-level technical training programme currently available for our processing and packing operators in New Zealand Powder, Cream and Cheese plants and delivered through a partnership with the Primary Industry Training Organisation. The programme is voluntary and self-paced, with coaching provided by a team of Fonterra staff. So far, 146 staff have completed the qualification and another 259 are in progress.
At the highest tier for operators, our Dairy Diploma programme is facilitated by a combination of staff from a local tertiary institute and our own experts. This year our second cohort started and we have 57 participants in total. Globally, we have continued to expand our Leadership
Fundamentals programme, training 160 internal facilitators to deliver the face-to-face sessions in 16 countries.
This year we have also launched our new MYFONTERRA learning platform to give us increased ability to plan and record learning. As part of our annual policy compliance assessment, this enabled almost 2,000 staff around the world to complete 12 essential e-learning modules in their preferred language.
HEALTH, SAFETY AND WELLBEINGHealth, safety and wellbeing are integral to how we operate because we want all of our people to go home from work healthy and safe every day.
In Sri Lanka, the team was recognised by the Prime Minister and awarded silver at the National Occupational Safety and Health Excellence Awards.
Barry McColl, our General Manager of Transport and Logistics, was named the Road Risk Manager of the Year at the Australasian Fleet Safety Awards. This award recognises
his role in maintaining the safety of more than 1,600 tanker drivers travelling more than 90 million kilometres per year.
There were no fatalities at any of our sites and serious harm injuries5 have continued to decrease to 17, our lowest ever recorded level. We also reduced our employee injury rate to 5.2 total injuries per million hours worked, a reduction of more than 70 per cent since 2010. This is good progress, but we will never rest when it comes to having our people go home safely every day.
For the second year, our global wellbeing challenge was “Eat, Move, Sleep”. Competing in teams, staff were encouraged to eat five servings of fruit and vegetables, move for more than 30 minutes and sleep for at least seven hours daily. Almost 20 per cent of all global staff participated and 85 per cent of staff surveyed afterwards felt it had a positive impact on their health.
Around the world our people have been significantly impacted by natural disasters such as the Kaiko–ura earthquakes, flooding in Edgecumbe and Sri Lanka; and by major civil unrest in Venezuela. Ensuring we protect the health and wellbeing of people is our first priority when any significant incident occurs. We are grateful to report that all our staff remained safe following these events and we have been able to provide assistance for them and the wider communities impacted.
WELLBEING CHALLENGENinety per cent of those participating in this year’s Eat, Move, Sleep Challenge said they’d keep the positive change going.
4 Recognised by New Zealand Qualifications Agency at level 3 and/or 4.5 Serious harm injuries are injuries that cause temporary or permanent loss of body
function and include both employees and contractors.
0
5
10
15
20
TRIF
R (p
er m
illio
n w
ork
hour
s)
F10 F11 F12 F13 F14 F15 F16 F1719%KEEPING OUR PEOPLE SAFEOur employee injury rate continues to improve, down 19 per cent on last year.
TOTAL RECORDABLE INJURY FREQUENCY RATE
58 | SUSTAINABILITY AND SOCIAL RESPONSIBILITY SUSTAINABILITY AND SOCIAL RESPONSIBILITY | 59
FONTERRA ANNUAL REVIEW 2017 FONTERRA ANNUAL REVIEW 2017

EMISSIONS EFFICIENTPasture-based dairying, is among the most emissions-efficient in the world.
TUITION IN CHINAFonterra Scholarship students from Shanxi Agricultural University provide tuition to rural children.
LIVELIHOODS AND INCOME CREATIONWe are committed to generating sustainable employment and income creation opportunities for our communities.
While international dairy prices were low, we sought creative ways to help alleviate the financial impact on our farmers, their employees and the wider communities they live in. Loans, which were interest free for two years have started to accrue interest but at a preferred rate. Our farmers benefited from discounts during FY17, both through our Farm Source™ stores and from our partnership vendors. They also earned Farm Source™ Rewards Dollars that can be used for on-farm purchases or for purchases for the family.
Approach to tax Over the last few years there has been significant interest from regulators and politicians on how multi-nationals approach tax. We see our social responsibility commitments as extremely important and collecting and paying tax is part of that responsibility. We pay our fair share of tax in all jurisdictions, ensure legal compliance wherever we operate and do not avoid our tax responsibilities.
Co-operatives and corporates are very different and this is accommodated from a tax treatment perspective. Our tax law in New Zealand reflects this and, like most co-operatives, we pass income6 directly to our farmer shareholders for them to pay tax rather than Fonterra paying tax directly and then passing those tax credits on to shareholders (the way a corporate would do).
COMMUNITY DEVELOPMENT
The Fonterra Grass Roots FundIn New Zealand, Australia and Sri Lanka, our Grass Roots Fund financially supports initiatives that help to strengthen our dairy communities by bringing them together, caring for the environment and promoting safe and healthy lifestyles (see pages 22–23).
Greater China In Greater China, our community care focusses on vulnerable or disadvantaged groups, both in the rural villages where we have farming operations and in some major cities. In addition to on-going activities, this year we introduced two new education programmes for primary-aged children from villages near our farms in the Ying county Shanxi Province.
Since 2010, nearly 900 university students have benefited from a Fonterra Scholarship and this year we established a summer holiday programme for them to return as teachers. Some students, from Shanxi Agricultural University, volunteered their time to provide extra tuition to around 70 children each day.
We have also funded lectures by influential NGO Girls’ Protection to provide “protect your body” guidance to more than 100 children. The course seeks to help the children protect themselves against harassment.
LATAMIn Chile, in addition to supporting school sports and free education theatre for children, Soprole has backed the national Teletón since it started in 1978. Teletón is a charitable foundation committed to the rehabilitation and inclusion of disabled children in society. After almost 40 years, the annual Teletón event has become a flagship for national unity and collective community support for the development of these children and their families.
SUSTAINABLE DAIRYING
Supporting our farmers around the worldIn all regions where we collect milk, we provide services specifically tailored to help our farmers build on existing good practices and make best use of on-farm innovations. In New Zealand, services are primarily provided through our Tiaki Sustainable Dairying Programme, in Australia it’s through SupportCrew™ and in other countries support comes via our Supplier Relationship Officers.
Climate – carbon footprintThe main contributor to our overall carbon footprint is greenhouse gas (GHG) emissions from dairy production systems, primarily from our cows. We continue to invest
in research and development7 and improving productivity on-farm remains our priority. This is achieved by looking after cows so they stay healthy and produce high quality milk, supported by growing high quality feed and optimising other farm inputs.
This year, in addition to analysing our New Zealand milk supply for the full on-farm carbon lifecycle, we have also considered our Australian and China footprints for the 2015/20168 seasons using a similar approach.
Continuing a trend downwards over the past five years, our footprint in New Zealand has reduced and our milk is among the most climate efficient in the world - most of our raw milk supply is at less than half of the global estimated average. We are committed to continuing this progress through increased productivity and investment into research, science and technology.
Launched this year, Dairy Action for Climate Change was spearheaded by Dairy New Zealand in partnership with Fonterra and supported by the Ministry for Primary Industries. Among other activities, this will see farmers on 100 pilot farms given an indication of their specific footprint and how it changes over time. We will learn a lot through this pilot, which we can later apply at scale.
SUSTAINABILITY AND SOCIAL RESPONSIBILITY
6 Being approximately NZ$10 billion this year.
7 Our investment in research and development in this area is primarily through the Pastoral Greenhouse Gas Research Consortium (PGgRc).
8 Due to data availability lifecycle analysis to the farm gate can only be reported for the prior season and not that just completed.
AUSTRALIA GRASS ROOTSWe helped three pre-schools establish gardens, to learn about healthy eating.
60 | SUSTAINABILITY AND SOCIAL RESPONSIBILITY SUSTAINABILITY AND SOCIAL RESPONSIBILITY | 61
FONTERRA ANNUAL REVIEW 2017 FONTERRA ANNUAL REVIEW 2017

LOREM IPSUMUt wisi enim ad minim veniam, quis nostrud exerci tatio ullamcorper suscip, lobortis is.
WaterWe are fully committed to helping develop strong, sustainable ecosystems that can support profitable farms alongside healthy land and fresh water. This view has underpinned our farmers’ active adoption of new farming practices, which both protect our waterways and support the production of high quality dairy products.
Our farmers have been working and investing in farming improvements for many years.
They have taken major steps to care for the land and their efforts to keep cows out of rivers and streams is a good example of this commitment. By fencing 98.4 per cent of significant waterways on dairy farms across the country and by ensuring that 99.8 per cent of regular water crossings now have a bridge or culvert, they are keeping their promise to care for the land.
Our next priority is for all New Zealand farmers to have a documented Riparian Management9 plan in place by 2020. The launch of the new Tiaki Sustainable Dairying Programme
in FY18 will support on-farm adoption rates, with a target of implementing 1,000 Farm Environment Plans over the next 12 months.
We know that science and technology will play a key role in meeting our commitment to swimmable waterways in New Zealand. Our farmers’ investment in, and adoption of, new technology is accelerating our on-farm efforts to improve rivers, lakes and streams. Using the detailed information our farmers collect, our nutrient management service uses OVERSEER®10, a nutrient software application, and our own systems to provide specialised reporting to our farmers. This information supports more informed decisions about nutrient management, helping to identify opportunities to reduce the risk of nitrogen leaching and improve efficiency. This year more than 95 per cent of our farmers completed an assessment for their farm.
Addressing water quality in New Zealand requires a localised approach. We are working proactively with Regional Councils to set environmental limits for water, looking at the land and water science, and determining the social, economic and environmental expectations of the communities they represent.
We have come a really long way, but of course we want to do more. Initiatives through our Innovative Co-operative strategy, tapping into the latest science and technology, will further help us make the transition to leading sustainable farming practices.
PARTNERSHIPS IN ACTION
Living WaterLiving Water is our 10-year partnership with the Department of Conservation (DOC) connecting our farmers with iwi, hapu–, scientists, councils and community groups to demonstrate that sustainable dairying and healthy fresh water systems can thrive together. Combining DOC’s conservation expertise with Fonterra’s Sustainable Dairying Programme, we are trialling solutions that will scale to improve freshwater systems on farms across New Zealand. The following are examples of some solutions we’ve tested this year:
• An ecosystem services report commissioned by Living Water identified detention bunds, which slow down the release of flood and storm water. These are now seen as a potential solution for improving catchment resilience. Living Water is trialling two affordable detention bunds in the Wairua catchment to assess their ability to reduce peak flows and capture sediment.
• Following on-farm biodiversity assessments in Te Waihora, we started “re-battering” and planting banks. Re-battering of steep banks prevents slips and reduces sediment. With the inclusion of fast-growing native plants, it quickly provides shade to inhibit aquatic weed growth and cool the water which helps the development of beneficial aquatic organisms.
50 CatchmentsWe recognise we have an important role in addressing water quality and this year we announced a bold new ambition to restore 50 freshwater catchments across New Zealand. Our immediate focus will be on working with our farmers, communities, Government and other key partners to identify the catchments and develop a framework and improvement action plan.
NUTRIENT MANAGEMENTMore than 95 per cent of farmers completed comprehensive nitrogen management assessments this year.
SUSTAINABILITY AND SOCIAL RESPONSIBILITY
LIVING WATERIdentifying solutions that can be adopted at scale.
CARING FOR OUR WATERWAYS98.4 per cent of significant waterways on dairy farms across the country are fenced.98.4%
9 Management of the strip of land adjacent to the waterways including suitable planting to reduce erosion, capture nutrients and provide shade.
10 OVERSEER® is owned by the Ministry for Primary Industries, the Fertiliser Association and AgResearch.
62 | SUSTAINABILITY AND SOCIAL RESPONSIBILITY SUSTAINABILITY AND SOCIAL RESPONSIBILITY | 63
FONTERRA ANNUAL REVIEW 2017 FONTERRA ANNUAL REVIEW 2017
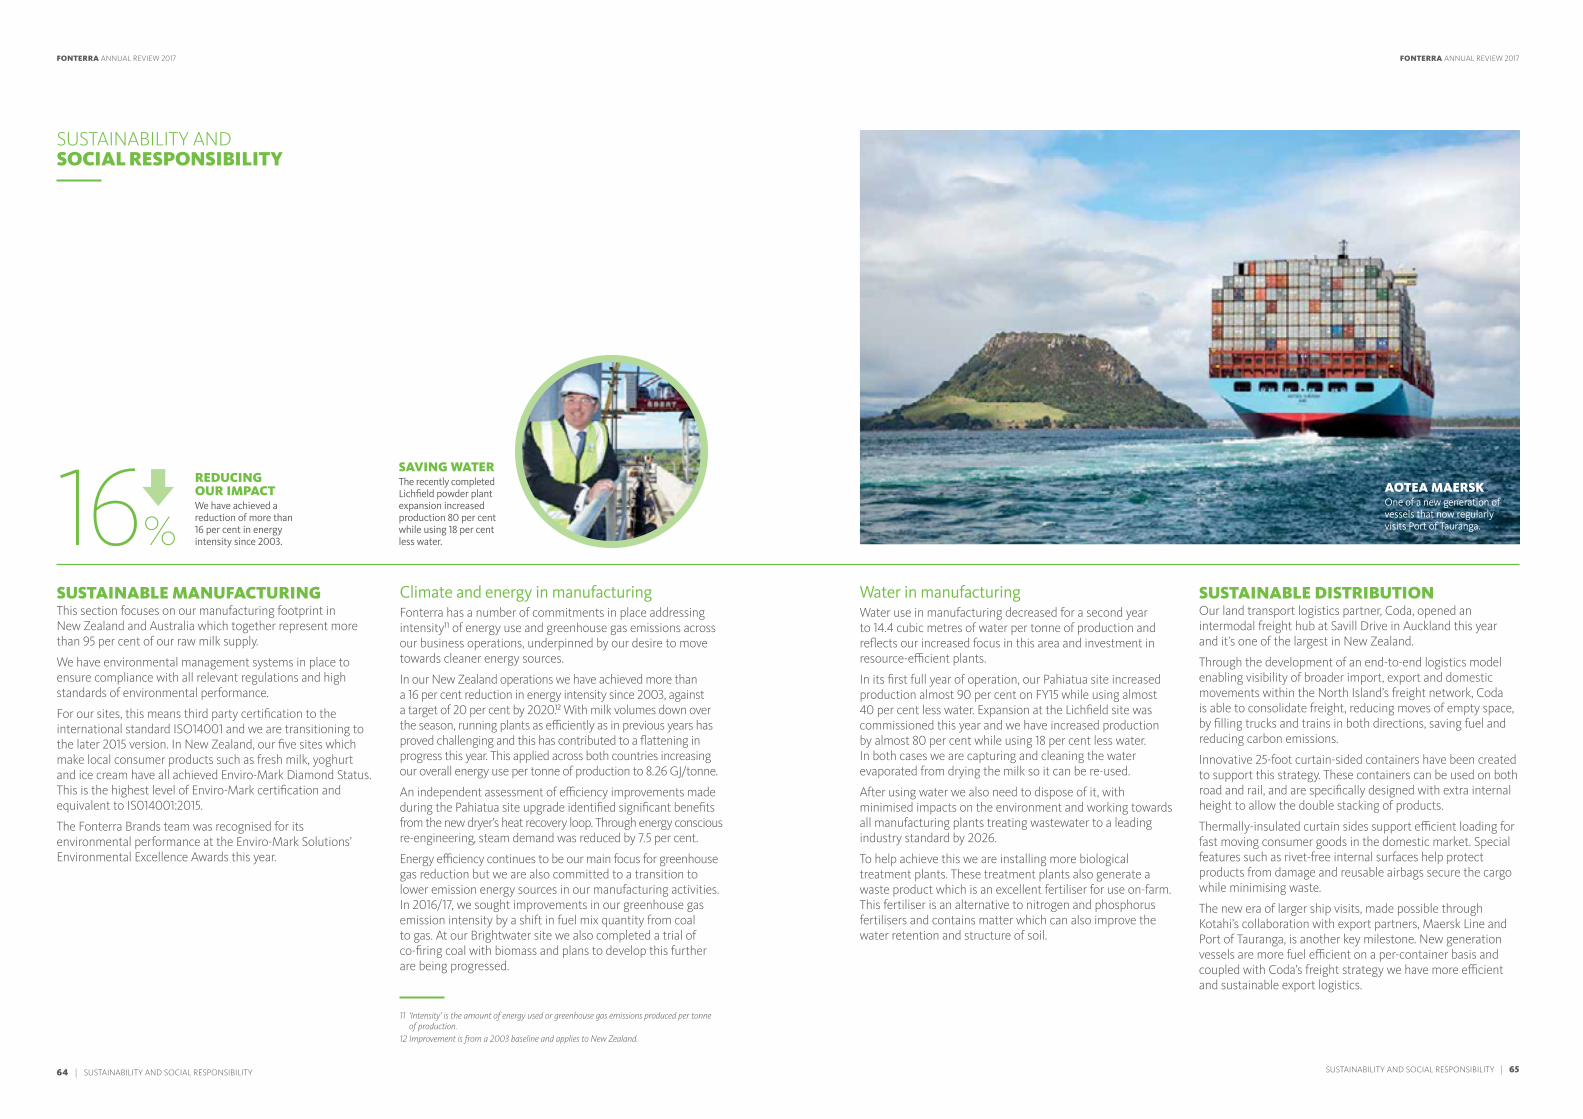
REDUCING OUR IMPACTWe have achieved a reduction of more than 16 per cent in energy intensity since 2003.
SUSTAINABLE MANUFACTURINGThis section focuses on our manufacturing footprint in New Zealand and Australia which together represent more than 95 per cent of our raw milk supply.
We have environmental management systems in place to ensure compliance with all relevant regulations and high standards of environmental performance.
For our sites, this means third party certification to the international standard ISO14001 and we are transitioning to the later 2015 version. In New Zealand, our five sites which make local consumer products such as fresh milk, yoghurt and ice cream have all achieved Enviro-Mark Diamond Status. This is the highest level of Enviro-Mark certification and equivalent to IS014001:2015.
The Fonterra Brands team was recognised for its environmental performance at the Enviro-Mark Solutions’ Environmental Excellence Awards this year.
Climate and energy in manufacturingFonterra has a number of commitments in place addressing intensity11 of energy use and greenhouse gas emissions across our business operations, underpinned by our desire to move towards cleaner energy sources.
In our New Zealand operations we have achieved more than a 16 per cent reduction in energy intensity since 2003, against a target of 20 per cent by 2020.12 With milk volumes down over the season, running plants as efficiently as in previous years has proved challenging and this has contributed to a flattening in progress this year. This applied across both countries increasing our overall energy use per tonne of production to 8.26 GJ/tonne.
An independent assessment of efficiency improvements made during the Pahiatua site upgrade identified significant benefits from the new dryer’s heat recovery loop. Through energy conscious re-engineering, steam demand was reduced by 7.5 per cent.
Energy efficiency continues to be our main focus for greenhouse gas reduction but we are also committed to a transition to lower emission energy sources in our manufacturing activities. In 2016/17, we sought improvements in our greenhouse gas emission intensity by a shift in fuel mix quantity from coal to gas. At our Brightwater site we also completed a trial of co-firing coal with biomass and plans to develop this further are being progressed.
Water in manufacturingWater use in manufacturing decreased for a second year to 14.4 cubic metres of water per tonne of production and reflects our increased focus in this area and investment in resource-efficient plants.
In its first full year of operation, our Pahiatua site increased production almost 90 per cent on FY15 while using almost 40 per cent less water. Expansion at the Lichfield site was commissioned this year and we have increased production by almost 80 per cent while using 18 per cent less water. In both cases we are capturing and cleaning the water evaporated from drying the milk so it can be re-used.
After using water we also need to dispose of it, with minimised impacts on the environment and working towards all manufacturing plants treating wastewater to a leading industry standard by 2026.
To help achieve this we are installing more biological treatment plants. These treatment plants also generate a waste product which is an excellent fertiliser for use on-farm. This fertiliser is an alternative to nitrogen and phosphorus fertilisers and contains matter which can also improve the water retention and structure of soil.
SUSTAINABLE DISTRIBUTIONOur land transport logistics partner, Coda, opened an intermodal freight hub at Savill Drive in Auckland this year and it’s one of the largest in New Zealand.
Through the development of an end-to-end logistics model enabling visibility of broader import, export and domestic movements within the North Island’s freight network, Coda is able to consolidate freight, reducing moves of empty space, by filling trucks and trains in both directions, saving fuel and reducing carbon emissions.
Innovative 25-foot curtain-sided containers have been created to support this strategy. These containers can be used on both road and rail, and are specifically designed with extra internal height to allow the double stacking of products.
Thermally-insulated curtain sides support efficient loading for fast moving consumer goods in the domestic market. Special features such as rivet-free internal surfaces help protect products from damage and reusable airbags secure the cargo while minimising waste.
The new era of larger ship visits, made possible through Kotahi’s collaboration with export partners, Maersk Line and Port of Tauranga, is another key milestone. New generation vessels are more fuel efficient on a per-container basis and coupled with Coda’s freight strategy we have more efficient and sustainable export logistics.
SUSTAINABILITY AND SOCIAL RESPONSIBILITY
AOTEA MAERSKOne of a new generation of vessels that now regularly visits Port of Tauranga.
11 ‘Intensity’ is the amount of energy used or greenhouse gas emissions produced per tonne of production.
12 Improvement is from a 2003 baseline and applies to New Zealand.
SAVING WATERThe recently completed Lichfield powder plant expansion increased production 80 per cent while using 18 per cent less water.16%
64 | SUSTAINABILITY AND SOCIAL RESPONSIBILITY SUSTAINABILITY AND SOCIAL RESPONSIBILITY | 65
FONTERRA ANNUAL REVIEW 2017 FONTERRA ANNUAL REVIEW 2017
CORPORATE GOVERNANCE
CORPORATE GOVERNANCEThe Board and Management of Fonterra consider that strong governance plays a critical role in the success of our Co-operative and are committed to achieving the highest standard of corporate governance and leadership.To support this our Board has developed governance systems that reflect Fonterra’s unique characteristics and requirements as a significant New Zealand based co-operative competing in the global dairy market.
Fonterra continuously reviews its Governance and Representation to ensure they reflect best practice for our Co-operative.In October 2016, Fonterra’s farmer shareholders voted to adopt a number of recommendations to enhance Fonterra’s Governance and Representation including a reduction in the number of farmer elected Directors on Fonterra’s Board and a change to the way Farmer Directors are elected.
CHANGES TO THE FONTERRA BOARDThere were a number of changes to the Fonterra Board during the financial year ending 31 July 2017:
• In August 2016, Mr John Waller, an Appointed Director, retired. In November 2016. Mr Scott St John was appointed by the Board to fill this vacancy.
• In December 2016, Mr Malcolm Bailey and Mr Ian Farrelly, both Farmer Directors, retired from the Board and Ms Donna Smit was elected to the Board as a Farmer Director.
• In January 2017, Mr Michael Spaans resigned from the Fonterra Board due to ill health. Mr Ian Farrelly was appointed by the Board to fill the vacancy created by Mr Spaans’ resignation. Mr Farrelly’s appointment is effective until the 2017 Annual Meeting on 2 November 2017.
• In June 2017, it was announced that Mr David Jackson, an Appointed Director, would be retiring from the Board in November 2017. Mr Bruce Hassall has been appointed by the Board to fill this vacancy with effect from 2 November 2017.
In line with the changes approved by farmer shareholders in October 2016, from 2 November 2017 the number of Directors elected by farmer shareholders (Farmer Directors) on the Board will be seven, with four Directors appointed by the Board (Appointed Directors).
COMPLIANCE WITH BEST PRACTICE GOVERNANCE STANDARDSThe Fonterra Board’s governance framework takes into consideration contemporary standards in New Zealand and Australia, including the principles in the NZX Corporate
Governance Code which comes into effect for reporting periods from 1 October 2017 (NZX Code). Fonterra has elected to report against the NZX Code. However, because it has elected to do this before it is required to do so, in certain instances Fonterra is not yet in compliance with all of the recommendations of the NZX Code.
We focus on governance in a way that promotes: > the interests of our farmer shareholders, unitholders and other key stakeholders
> Fonterra’s Co-operative philosophy, which is largely expressed through our Co-operative principles
> transparency, giving our farmer shareholders, unitholders and other stakeholders the information they need to assess our performance
> effective risk management and compliance to ensure that Fonterra meets its business objectives and all legal and reporting requirements
> an appropriate balance between the roles and responsibilities of the Board and Management
> communication with important stakeholder groups, including farmer shareholders, employees, customers, unitholders, debt investors, governments and the communities Fonterra works in.
CONTENTS
CORPORATE GOVERNANCE 67
BOARD OF DIRECTORS 78
FONTERRA MANAGEMENT TEAM 80
CORPORATE GOVERNANCE | 67 66 | CORPORATE GOVERNANCE
FONTERRA ANNUAL REVIEW 2017 FONTERRA ANNUAL REVIEW 2017
Principle 1: Code of Ethical Behaviour Code of Ethics A culture of honesty and integrity is integral to Fonterra’s reputation and commitment to become the world’s most trusted source of dairy nutrition. Fonterra expects its Directors, officers and employees to maintain high ethical standards and is committed to the use of global best management and business practices to ensure we operate ethically and legally in the countries where we do business.
Fonterra’s Code of Business Conduct - The Way We Work, the Board Charter and the Group Ethical Behaviour Policy comprise Fonterra’s code of ethics. These policies set clear expectations for our Directors and employees in matters relating to ethical behaviour which includes honesty and integrity, dealing with conflicts of interest, the use of corporate information and assets and property, giving and receiving gifts, procedures for whistle blowing and managing breaches. All three of these documents are required to be reviewed and approved annually.
Fonterra’s values are at the core of Fonterra’s commitment to acting ethically. These values are referenced in The Way We Work. This document provides straight forward, practical guidelines on how to apply Fonterra’s values in everyday work situations and when working with customers, farmer shareholders, suppliers and the wider community.
The Group Ethical Behaviour Policy and The Way We Work are published in multiple languages and are available to all employees on Fonterra’s internal website. As with other Fonterra Group Policies, employee training is included within Fonterra’s global induction programme and annually refreshed. Individuals are assessed to ensure understanding of Group Policies and an annual certification process promotes compliance.
Fonterra has an established independently operated telephone, email, mail and web-based hotline. This provides individuals with a confidential channel to report concerns about unethical behaviour or any other action that they are concerned does not meet the standards of behaviour set in The Way We Work. This hotline is available in all regions that Fonterra operates within. In the 2017 financial year, 35 disclosures were made globally to the hotline. All were fully investigated, appropriate action taken and timely updates made available to the whistle-blower. An awareness campaign of the hotline was launched in 2017 and will be annually refreshed.
Fonterra operates a Conflict of Interest Register where employees must enter all actual or potential conflict of interests. Corporate gifts given or received, and hospitality and entertainment with third parties must also be reported in Fonterra’s Gift & Entertainment Register.
The Way We Work, the Board Charter and the Group Ethical Behaviour Policy are available on www.fonterra.com.
Securities Trading PolicyFonterra has adopted a Securities Trading Policy that details the rules for trading in shares, capital notes, retail bonds, units, milk price futures and options traded on the NZX and other listed securities of Fonterra or the Fonterra Shareholders Fund from time to time. The policy applies to Directors, officers, employees and contractors of the Fonterra Group (globally) and members of the Shareholders’ Council and Milk Price Panel, and is additional to legislative requirements for trading securities in New Zealand and Australia.
The Securities Trading Policy is available, along with other key Group Policies on www.fonterra.com.
All Directors comply with the legislative requirements for disclosing interests in listed voting securities of Fonterra and its related companies.
Principle 2: Board Composition and PerformanceBoard Charter The Board Charter includes details about the Board composition and procedures including the Chairman’s election and role, the Board’s relationship with Management and Incident Management engagement, training provided to Directors, and the process for assessing the Board’s performance.
The Charter is reviewed annually and was last updated in June 2017. The Board Charter and the Charters of the Board Committees are available on www.fonterra.com.
Board AppointmentsThe Constitution of Fonterra provides for not more than 12 Directors until the conclusion of the 2017 Annual Meeting and not more than 11 Directors thereafter and sets out how they are appointed.
In accordance with the Constitution, presently not more than eight Directors are elected by farmer shareholders from the shareholder base (Farmer Directors), and not more than four Directors are appointed by the Board (Appointed Directors). Following the 2017 Annual Meeting this will change to not more than seven Farmer Directors, and not more than four Appointed Directors.
The Board is committed to building capabilities and maintaining the highest standards of governance. The Board also considers it important that there is a good balance of experience on the Board. A list of attributes that all Directors must be able to demonstrate has been developed by the Board and is reviewed annually. The Board has also developed a list of skills that the Board believes are required to effectively govern a complex, international co-operative, operating in multiple markets, answering to diverse stakeholders. The skills list is reviewed annually and, if required, updated. The Board then develops a ‘Skills Matrix’ by assessing the required weighting of each skill against the aggregate skills of the current Board.
The Skills Matrix is used to identify the skills to be targeted in each year, through the Farmer Director election process and the Appointed Director process. The list of attributes and skills, the Skills Matrix and the Board’s targeted skills are published each year as part of the Farmer Director election process to assist potential candidates in assessing their suitability and to assist voting shareholders when assessing the candidates put forward for election.
The Nominations Committee appoints an ‘Independent Selection Panel’ to recommend to it appropriate candidates to be put to shareholders for their consideration to be elected as Farmer Directors. In addition to candidates recommended by the Nominations Committee, there is a ‘self-nomination process’ where candidates can propose themselves for election as Farmer Directors with the support of 35 shareholders. The Farmer Directors are elected by postal ballot by farmer shareholders. The elections are overseen by the Shareholders’ Council.
The People, Culture and Safety Committee oversees the process for identifying and recommending potential Appointed Directors. Prior to appointment by the Board, the Fonterra Shareholders’ Fund is consulted. The Appointed Directors are ratified by farmer shareholders at the next Annual Meeting.
Appointed Directors are selected to enable the Board to access a full complement of skills and competencies needed to lead an enterprise of Fonterra’s size, global reach and complexity. They bring to the Board perspectives, experience and skills to augment the attributes and skills (including dairy industry knowledge) provided by the Farmer Directors.
Director Independence The rules of the Fonterra Shareholders’ Market (FSM Rules) require Fonterra to have a minimum of two Independent Directors or if there are eight or more Directors, three or one-third of the total number of Directors of Fonterra, whichever is greater. With Fonterra’s current Board of twelve Directors, four must be Independent Directors.
In order to be an Independent Director, a Director must not be an executive officer of Fonterra, or have a ‘disqualifying relationship’.
A Director has a disqualifying relationship where he or she has a direct or indirect interest or relationship that could reasonably influence, in a material way, the Director’s decisions in relation to Fonterra. The FSM Rules contain specific examples of what may give rise to a disqualifying relationship. Appointed Directors cannot be shareholders and are expected to maintain independence for the length of their term.
Farmer Directors must be qualified as farmer shareholders under section 12.3 of the Constitution and are therefore not considered Independent Directors.
As at 31 July 2017, Clinton Dines, Simon Israel, David Jackson, and Scott St John each did not have (and continue not to have) any disqualifying relationship in relation to Fonterra and were therefore Independent Directors. John Waller was an Independent Director until his resignation with effect from 31 August 2016.
John Wilson, who is a Farmer Director, is the Board-elected Chairman.
Disclosure Information about each Director (including experience, length of service, independence and ownership interests) is disclosed at the end of this section or in the statutory information section of this Annual Review, and is also available on www.fonterra.com.
Diversity PolicyWe believe that a culture of diversity and inclusion better equips Fonterra to deliver its ambition. Respecting, leveraging and embracing the unique skills and diverse perspectives of our people is consistent with what we stand for to all our stakeholders, and reflects a core Fonterra value to ‘Do What’s Right’.
Fonterra’s People Management Policy requires that all policies, standards and guidelines support the intent of diversity and inclusion. Over and above this, we have developed a Group Diversity and Inclusion Policy which sets out what people who work for and with Fonterra can expect around diversity and inclusion and how it will help Fonterra to deliver its ambition.
Fonterra develops and implements strategies and initiatives to build more diverse and inclusive teams. As part of Rautaki Ma–ori (our Ma–ori Strategy), we are active participants in the Whakaterehia programme which is identifying and developing Ma–ori leaders for the future. We are a major partner of Global Women and are heavily involved in the New Zealand-based Champions for Change initiative. We also focus our attention on how to attract and select a more diverse group of graduates for both our business and technical graduate programmes.
Fonterra has committed to early adoption of the Champions for Change Reporting Framework to collect diversity data for New Zealand for the 1 April 2017 to 31 March 2018 reporting year. Although the framework specifically asks for age, ethnicity and gender data, subject to compliance with local laws, we will also look to use this as an opportunity to gather additional data over time that will enable us to have a more comprehensive view of our diversity globally.
As at 31 July 2017, the gender composition of the Board comprised 9 male Directors and 3 female Directors (2016: 11 male Directors and 2 female Directors). Of eight officers who reported directly to the Chief Executive at 31 July 2017, 6 were male and 2 were female (2016: 5 male and 3 female).
Ongoing TrainingFollowing appointment to the Board, Directors undertake an induction programme to familiarise themselves with the Group. Areas covered include:
• business strategy and planning
• an overview of key financial metrics to monitor business performance
• an overview of material areas of the Fonterra business, including through meetings with key executives
• Fonterra’s Constitution and other governance systems.
CORPORATE GOVERNANCE
CORPORATE GOVERNANCE | 69 68 | CORPORATE GOVERNANCE
FONTERRA ANNUAL REVIEW 2017 FONTERRA ANNUAL REVIEW 2017

Directors are expected to keep themselves abreast of changes and trends in the business and in Fonterra’s environment and markets, and trends in the economic, political, social and legal climate generally. As a group, the Board holds several workshops on relevant subjects each year, and Directors are also expected to keep up to date with governance issues.
Assess Performance Directors formally assess the performance of the Board each year. A regular programme of peer review of individual
Directors also occurs as part of an ongoing Director development programme. The Shareholders’ Council reviews the Board’s Statement of Intentions against the performance and operation of the Group and reports on this to farmer shareholders annually. The Board is also responsible for reviewing the Chief Executive’s performance.
Division of RolesThe Chairperson and Chief Executive roles at Fonterra are not exercised by the same individual.
Principle 3: Board CommitteesFonterra has a number of permanent Board Committees, as detailed in the table below. Additional Board Committees will be formed when it is efficient or necessary to facilitate efficient decision-making by providing for a sub-group of Directors to focus on particular areas or issues and to develop recommendations to the full Board.
The Board Committees have standard ‘Terms of Reference’ and each committee has a charter, which defines the scope and responsibilities of that committee and is approved by the Board annually. The minutes for each of the Board Committees’ meetings are supplied to the Board for review.
Board and Committee Attendance
BOARD
AUDIT & FINANCE COMMITTEE
CO-OPERATIVE RELATIONS
COMMITTEEMILK PRICE
PANELNOMINATIONS
COMMITTEE RISK COMMITTEE
PEOPLE, CULTURE & SAFETY
COMMITTEE
Eligible to attend
Attendance
Eligible to attend
Attendance
Eligible to attend
Attendance
Eligible to attend
Attendance
Eligible to attend
Attendance
Eligible to attend
Attendance
Eligible to attend
Attendance
John Wilson 23 23 2 2 – – – – – – – – 15 15
Malcolm Bailey 12 10 – – 3 3 – – – – 2 1 – –
Clinton Dines 23 21 – – – – 1 1 1 1 2 2 15 14
Ian Farrelly 21 21 5 5 2 1 – – – – – – 8 8
Leonie Guiney 23 20 4 4 6 6 – – – – 2 2 – –
Simon Israel 23 16 – – – – – – – – – – 15 15
David Jackson 23 22 6 6 – – 7 7 1 1 4 4 15 15
David MacLeod 23 22 – – 6 5 – – – – 4 4 – –
John Monaghan 23 22 – – 6 6 – – 1 1 – – 15 14
Scott St John 14 14 5 5 – – 5 5 – – – – – –
Nicola Shadbolt 23 21 3 3 – – – – 1 1 4 4 – –
Donna Smit 11 11 3 3 – – – – – – – – – –
Michael Spaans 14 10 3 2 3 2 2 2 – – – – – –
John Waller 2 1 – – – – – – – – 1 – – –
Ashley Waugh 23 22 3 3 6 5 5 4 – – – – 6 6
CORPORATE GOVERNANCE
COMMITTEE OR GROUP MEMBERSHIP AS AT 31 JULY 2017 PURPOSE
Audit and Finance Committee
David Jackson (Chair and Independent)Ian Farrelly
Scott St John (Independent)Nicola ShadboltDonna Smit
To assist the Board in fulfilling its governance responsibilities in relation to Fonterra’s financial reporting, audit activities, treasury matters, financial risk management and internal control frameworks.
People, Culture and Safety Committee
John Wilson (Chair)Ashley WaughJohn MonaghanSimon Israel (Independent)
Clinton Dines (Independent)David Jackson (observer)
To assist the Board in fulfilling its governance responsibilities in relation to the recruitment, retention, remuneration and development of Directors, executives and other employees, and to promote a safe and healthy working environment.
Co-operative Relations Committee
John Monaghan (Chair)David MacLeodIan Farrelly
Leonie GuineyAshley Waugh
To assist the Board in fulfilling its governance responsibilities in relation to the supply of milk from Fonterra suppliers, and to seek to resolve supplier complaints before reference to the Milk Commissioner.
Nominations Committee David Jackson (Chair and Independent)Clinton Dines (Independent)Nicola Shadbolt
John Wilson Duncan Coull (SHC observer)Greg Kirkwood (SHC observer)
To recommend to the Board candidates for election as Farmer Directors.
Risk Committee Nicola Shadbolt (Chair)David Jackson (Independent)David MacLeod
Leonie GuineyClinton Dines (Independent)
To assist the Board in fulfilling its corporate governance responsibilities relating to Fonterra’s management of key enterprise wide risks. This includes strategic and operational risks, through Fonterra’s risk management framework, the behaviours required of its people and its guidelines, policies and processes for monitoring and mitigating enterprise-wide risks.
Audit and Finance CommitteeThere is an established Audit and Finance Committee as described above.
The Audit and Finance Committee comprises two Appointed Directors and three Farmer Directors. The committee is chaired by David Jackson, who is an Independent Director and a Fellow of the New Zealand Institute of Chartered Accountants.
Employees attend Audit and Finance Committee meetings at the invitation of the Committee.
Takeover OfferGiven its co-operative structure and the thresholds on share ownership in the Constitution, the Board does not believe that it is necessary to establish protocols for a takeover offer.
Majority Independent Directors – Audit and Finance Committee, Nominations Committee and People, Culture and Safety CommitteeThe Audit and Finance Committee, Nominations Committee and People, Culture and Safety Committee committees do not comprise a majority of Independent Directors.
There is currently no ‘headroom’ for Fonterra, based on it having 12 Directors, to have more than 4 Independent Directors (as prescribed by the FSM Rules), as the Farmer Directors fill each of the 8 positions open to them (and as noted above, the Farmer Directors are not considered Independent Directors). Given this, it is very difficult for Fonterra to appoint a majority of Independent Directors to these committees without
excluding Farmer Directors or significantly increasing the workload of the Independent Directors.
Fonterra does not consider that this is a significant issue, as both the Audit and Finance Committee and the Nominations Committee are chaired by Independent Directors, with the People, Culture and Safety Committee chaired by the Chair of the Board. In addition, under the FSM Rules, the Audit and Finance Committee is not required to comprise of a majority of Independent Directors.
Principle 4: Reporting and DisclosureDisclosure Policy Fonterra is committed to promoting a well-informed and efficient market in its shares, units issued by the Fonterra Shareholders’ Fund and debt securities. The Board has approved a Group Disclosure Policy to ensure compliance with the FSM Rules regarding disclosure. The Group Disclosure Policy governs Fonterra’s communications with investors and market participants, and the disclosure of information relevant to Fonterra.
Fonterra has established a Disclosure Committee that holds regular and ad hoc meetings to oversee Fonterra’s continuous disclosure obligations. The members of the Disclosure Committee are the CEO, CFO, Managing Director Corporate Affairs, Director Capital Markets and the Company Secretary.
The Disclosure Committee has a Charter which states that the committee has responsibility for overseeing Fonterra’s continuous disclosure obligations and reviewing, monitoring
CORPORATE GOVERNANCE | 71 70 | CORPORATE GOVERNANCE
FONTERRA ANNUAL REVIEW 2017 FONTERRA ANNUAL REVIEW 2017
and implementing the Group Disclosure Policy. The Committee maintains a register of continuous disclosure matters and also ensures a consistent and high standard of communication with farmer shareholders, investors and market participants on a timely basis.
The Chairman of the Board, the Chairman of the Audit and Finance Committee and the Chairman of the Milk Price Panel attend the Committee’s meetings to review and approve the release of the Interim and Annual Reports.
Fonterra and the Manager of the Fonterra Shareholders’ Fund have entered into an arrangement to co-operate with each other and take all steps reasonably required to ensure that information to be disclosed by either of them under the FSM Rules and the listing rules of the NZX or the ASX (as the case may be) is disclosed simultaneously to the Fonterra Shareholders’ Market, the NZX Main Board and the ASX. Fonterra simultaneously discloses relevant information on ASX on behalf of the Fonterra Shareholders Fund.
Website DisclosureAt present Fonterra has the following documents available on www.fonterra.com:
• Board Charter
• Co-operative Relations Committee Charter
• Risk Committee Charter
• Audit and Finance Committee Charter
• Environmental Policy
• Nominations Committee Charter
• People Culture and Safety Committee Charter
• The Way We Work (Code of Business Conduct)
• Group Disclosure Policy
• Group Ethical Behaviour Policy
• Group Securities Trading Policy
• Group Diversity and Inclusion Policy
Fonterra does not have a Director Remuneration Policy or a Management Remuneration Policy for the reasons noted under the heading ‘Remuneration’.
Financial Reporting The Audit and Finance Committee reviews the financial statements and recommends approval of the financial statements to the Board. The Committee considers whether the financial statements are complete, whether they reflect appropriate accounting policies, any major judgement areas, any legal matters that may significantly impact the financial statements and any complex transactions.
The CEO and CFO provide the Board with management representations that Fonterra’s financial statements give a true and fair view, in all material respects, of Fonterra’s financial position and financial performance for each financial reporting period.
Milk Price PanelThe Board has created the Milk Price Panel for the purpose
of providing assurances as to the governance of the Farmgate Milk Price and the proper application of the Farmgate Milk Price Manual and the Milk Price Principles.
The Panel does not determine the Farmgate Milk Price, as this is a decision for the Board.
The Dairy Industry Restructuring Act 2001 (New Zealand) requires that the Chair and a majority of the members of the Panel (including the Chair) are independent. The Panel consists of two Appointed Directors, one Farmer Director and two appropriately qualified persons nominated by the Shareholders’ Council, at least one of whom must be independent. The Chair must be one of the Appointed Director members. The Panel is currently chaired by Scott St John. Other Board members are David Jackson and Ashley Waugh. The Shareholders’ Council appointees are Andrew Wallace and Bill Donaldson. The Board confirmed that at 31 July 2017, Scott St John, David Jackson and Andrew Wallace are considered to be Independent Members of this Panel.
Non-Financial ReportingFonterra is guided by international best practice and agrees that adoption of internationally recognised reporting frameworks is a good way of allowing users of our disclosure information to more easily compare it with others. For this reason we have adopted the Global Reporting Initiative (GRI) guidelines.
In this Annual Review, we provide coverage of both financial and non-financial matters. Non-financial reporting includes coverage of progress on strategy in the ‘Our Potential’ section. High-level consideration of material environmental, social and governance (ESG) factors and practices are included in the ‘Sustainability and Social Responsibility’ section.
Later this year we intend to issue our first separate Sustainability Report based upon GRI guidelines to further expand our non-financial disclosure for this financial year.
Principle 5: RemunerationDirector RemunerationFonterra’s remuneration framework is designed to attract, retain and motivate high quality Directors and senior management.
The Constitution modifies the discretion of the Board to set remuneration of Directors. In accordance with the Constitution, farmer shareholders elect an independent committee of six farmer shareholders (the Directors’ Remuneration Committee) to consider and make recommendations to the Annual Meeting on remuneration for Farmer Directors, which is approved by farmer shareholders.
The members of the Directors’ Remuneration Committee as at 31 July 2017 were David Gasquoine (Chair), Murray Holdaway, Scott Montgomerie, Stephen Silcock, Philip Wilson and Gerard Wolvers.
The Board has full discretion over the remuneration of Appointed Directors with such remuneration not being approved at the Annual Meeting. The Board has historically remunerated
Appointed Directors at the same level as Farmer Directors in line with Directors’ Remuneration Committee recommendations.
Given the arrangements outlined above, Fonterra does not have a specific policy for remuneration of Directors.
The details of the Directors’ remuneration are contained on page 52 of the Annual Financial Results for the year ended 31 July 2017.
Management RemunerationThe People, Culture and Safety Committee governs the remuneration of management. There is no specific policy for management remuneration, but Fonterra has a framework which outlines relative weightings of remuneration components and relevant performance criteria.
Remuneration FrameworkA well-designed remuneration framework helps the Co-operative attract and retain talent, and both motivates and recognises the role our people play in the success of the Co-operative.
Fonterra’s remuneration framework for salaried staff is based on a ‘total remuneration’ approach, which is consistent with best practice globally. This includes fixed remuneration (salary), benefits (superannuation and insurance), and variable remuneration (incentives).
The amounts we pay to our employees are benchmarked against comparable companies in relevant markets, using information obtained from independent remuneration consultants. Adjustments to packages may occur on a cyclical basis, such as an annual salary review, or on an as-needed basis to recognise additional responsibilities.
The framework is designed to take into account budget targets and restraints, market conditions, internal equity, and governance factors such as local legislation, as well as taking into account individual performance.
Fonterra’s incentive programmes are designed to drive the Co-operative’s performance by:
• Focusing on the Co-operative’s primary objective of maximising returns for its farmer shareholders;
• Promoting collaboration and a one team approach to achieve Fonterra’s goals;
• Establishing targets which are challenging yet achievable; and linked to team (such as business unit) and group performance.
At the end of each financial year, performance is reviewed and incentive payments are approved by the People, Culture and Safety (“PCS”) Committee at its discretion. The Committee retains absolute discretion in respect to payments for all incentive schemes.
Fixed RemunerationUnder our total remuneration approach for salaried positions, Fonterra aims to pay at the median rate in the markets in which we operate. Remuneration for employees who are on
collective agreements is negotiated and agreed in partnership with Fonterra’s employee representative organisations.
Fixed remuneration for salaried and waged employees who are not covered by a collective agreement is reviewed annually. Remuneration for employees on a collective agreement is reviewed in line with the schedules agreed with employee representative organisations.
Short Term Incentive PlansThe majority of permanent salaried employees in Fonterra participate in an annual short term incentive (STI) plan. In FY17 this incentive covered approximately 5,600 employees.
The STI plan encourages our people to focus on Fonterra’s strategic objectives within each financial year. At the beginning of each financial year a series of Group and business unit key performance indicators (KPIs) are identified and approved by the Board’s People, Culture and Safety (“PCS”) Committee.
The KPIs are established every year, but normally include important financial measures (revenue and EBIT), capital efficiency (working capital), and measures centred on Safety and Quality.
Some employees eligible for the STI plan have a portion of their incentive aligned with their individual performance, and others are aligned fully to the relevant Group or business unit KPI scorecard.
Other Incentive Plans Some business units, both in New Zealand and offshore, use sales incentive plans (SIP) for our market facing sales and support teams. These are targeted to achieve specific growth outcomes in key markets as well as aligning to our Group and business unit strategic objectives.
Employees in these plans do not, typically, participate in any other short term incentive plans.
Long Term Incentive Plans – OverviewFonterra offers a Long Term Incentive (LTI) plan for certain senior executives. This plan is designed to reward and retain key senior executives based on longer-term objectives. The Fonterra Management Team (FMT) are eligible to participate, as well as a selected number of senior executives who lead large functions within our core business units, hold significant profit and loss responsibility, or head significant corporate functions.
Our LTI plan is based on achievement of specified long term outcomes for the Co-operative.
The nature of these Long Term Incentive plans means that payments are typically deferred over multiple time periods. This means that, in any given year, multiple payments may be made for incentives earned in prior years. For purposes of clarification, we have summarised the incentive plans that result in payments over multiple periods.
FY16 – Velocity Leadership Incentive
The LTI plan in place for FY16 and FY17 is our Velocity Leadership Incentive (VLI). The VLI was introduced in FY16
CORPORATE GOVERNANCE
CORPORATE GOVERNANCE | 73 72 | CORPORATE GOVERNANCE
FONTERRA ANNUAL REVIEW 2017 FONTERRA ANNUAL REVIEW 2017
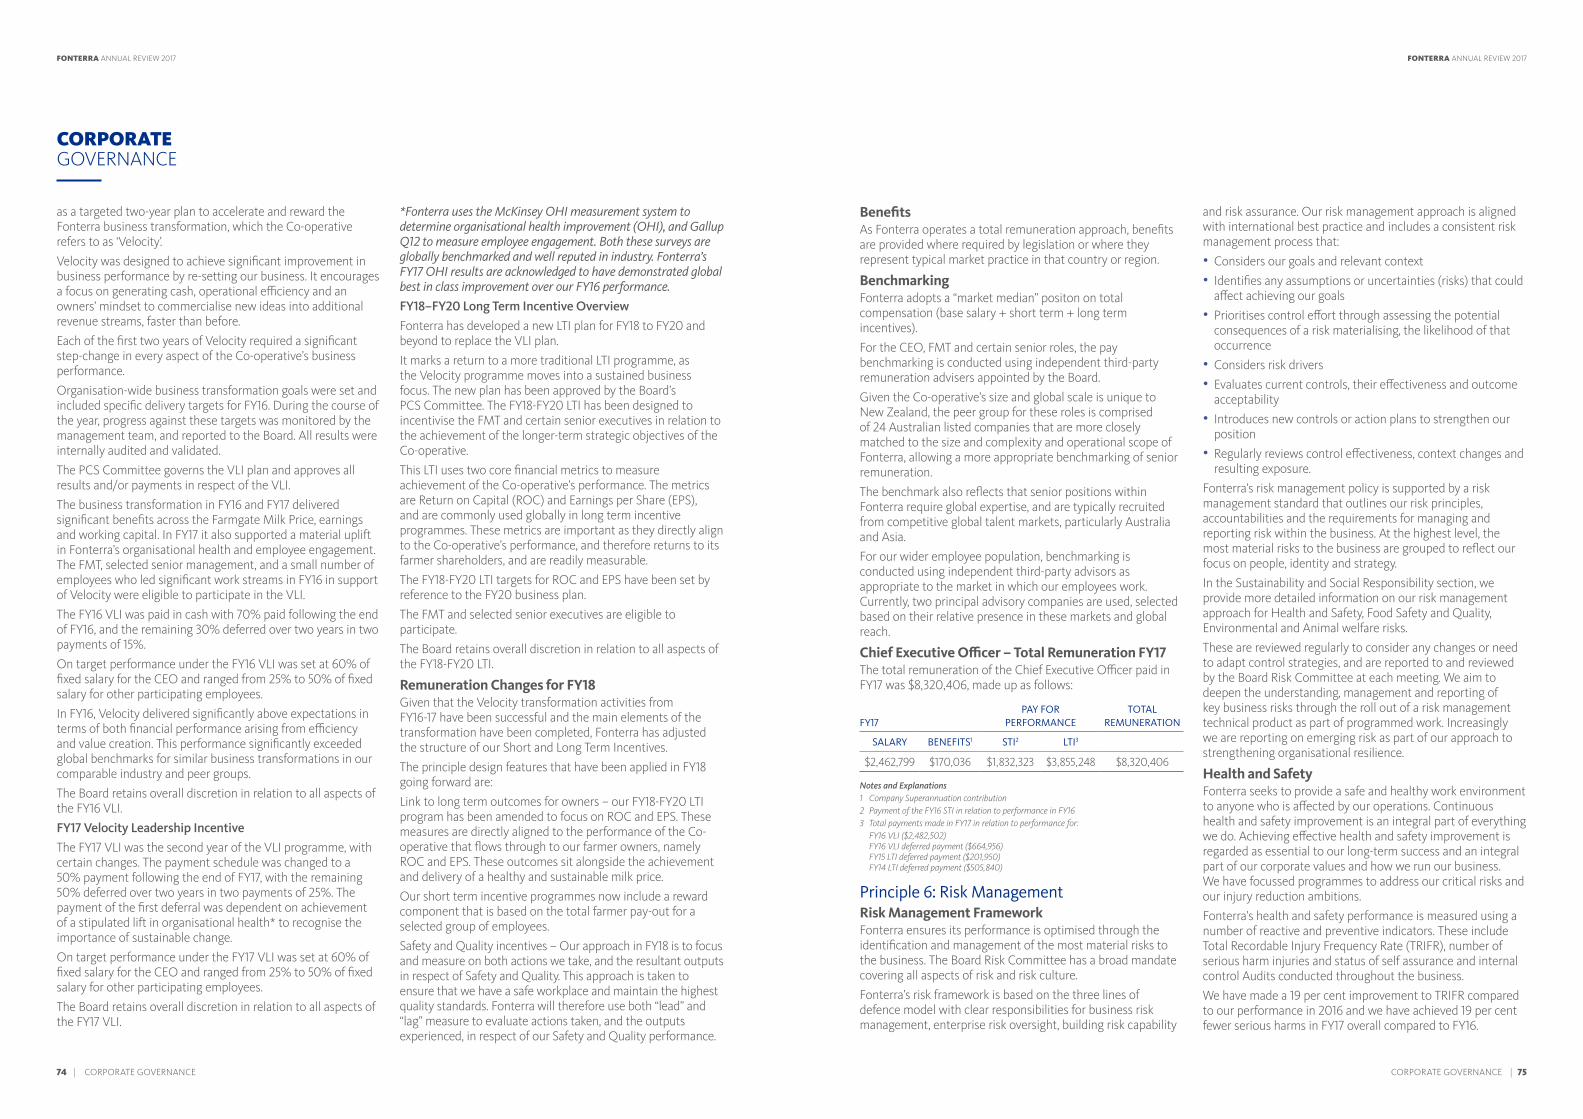
as a targeted two-year plan to accelerate and reward the Fonterra business transformation, which the Co-operative refers to as ‘Velocity’.
Velocity was designed to achieve significant improvement in business performance by re-setting our business. It encourages a focus on generating cash, operational efficiency and an owners’ mindset to commercialise new ideas into additional revenue streams, faster than before.
Each of the first two years of Velocity required a significant step-change in every aspect of the Co-operative’s business performance.
Organisation-wide business transformation goals were set and included specific delivery targets for FY16. During the course of the year, progress against these targets was monitored by the management team, and reported to the Board. All results were internally audited and validated.
The PCS Committee governs the VLI plan and approves all results and/or payments in respect of the VLI.
The business transformation in FY16 and FY17 delivered significant benefits across the Farmgate Milk Price, earnings and working capital. In FY17 it also supported a material uplift in Fonterra’s organisational health and employee engagement. The FMT, selected senior management, and a small number of employees who led significant work streams in FY16 in support of Velocity were eligible to participate in the VLI.
The FY16 VLI was paid in cash with 70% paid following the end of FY16, and the remaining 30% deferred over two years in two payments of 15%.
On target performance under the FY16 VLI was set at 60% of fixed salary for the CEO and ranged from 25% to 50% of fixed salary for other participating employees.
In FY16, Velocity delivered significantly above expectations in terms of both financial performance arising from efficiency and value creation. This performance significantly exceeded global benchmarks for similar business transformations in our comparable industry and peer groups.
The Board retains overall discretion in relation to all aspects of the FY16 VLI.
FY17 Velocity Leadership Incentive
The FY17 VLI was the second year of the VLI programme, with certain changes. The payment schedule was changed to a 50% payment following the end of FY17, with the remaining 50% deferred over two years in two payments of 25%. The payment of the first deferral was dependent on achievement of a stipulated lift in organisational health* to recognise the importance of sustainable change.
On target performance under the FY17 VLI was set at 60% of fixed salary for the CEO and ranged from 25% to 50% of fixed salary for other participating employees.
The Board retains overall discretion in relation to all aspects of the FY17 VLI.
*Fonterra uses the McKinsey OHI measurement system to determine organisational health improvement (OHI), and Gallup Q12 to measure employee engagement. Both these surveys are globally benchmarked and well reputed in industry. Fonterra’s FY17 OHI results are acknowledged to have demonstrated global best in class improvement over our FY16 performance.
FY18–FY20 Long Term Incentive Overview
Fonterra has developed a new LTI plan for FY18 to FY20 and beyond to replace the VLI plan.
It marks a return to a more traditional LTI programme, as the Velocity programme moves into a sustained business focus. The new plan has been approved by the Board’s PCS Committee. The FY18-FY20 LTI has been designed to incentivise the FMT and certain senior executives in relation to the achievement of the longer-term strategic objectives of the Co-operative.
This LTI uses two core financial metrics to measure achievement of the Co-operative’s performance. The metrics are Return on Capital (ROC) and Earnings per Share (EPS), and are commonly used globally in long term incentive programmes. These metrics are important as they directly align to the Co-operative’s performance, and therefore returns to its farmer shareholders, and are readily measurable.
The FY18-FY20 LTI targets for ROC and EPS have been set by reference to the FY20 business plan.
The FMT and selected senior executives are eligible to participate.
The Board retains overall discretion in relation to all aspects of the FY18-FY20 LTI.
Remuneration Changes for FY18Given that the Velocity transformation activities from FY16-17 have been successful and the main elements of the transformation have been completed, Fonterra has adjusted the structure of our Short and Long Term Incentives.
The principle design features that have been applied in FY18 going forward are:
Link to long term outcomes for owners – our FY18-FY20 LTI program has been amended to focus on ROC and EPS. These measures are directly aligned to the performance of the Co-operative that flows through to our farmer owners, namely ROC and EPS. These outcomes sit alongside the achievement and delivery of a healthy and sustainable milk price.
Our short term incentive programmes now include a reward component that is based on the total farmer pay-out for a selected group of employees.
Safety and Quality incentives – Our approach in FY18 is to focus and measure on both actions we take, and the resultant outputs in respect of Safety and Quality. This approach is taken to ensure that we have a safe workplace and maintain the highest quality standards. Fonterra will therefore use both “lead” and “lag” measure to evaluate actions taken, and the outputs experienced, in respect of our Safety and Quality performance.
BenefitsAs Fonterra operates a total remuneration approach, benefits are provided where required by legislation or where they represent typical market practice in that country or region.
BenchmarkingFonterra adopts a “market median” positon on total compensation (base salary + short term + long term incentives).
For the CEO, FMT and certain senior roles, the pay benchmarking is conducted using independent third-party remuneration advisers appointed by the Board.
Given the Co-operative’s size and global scale is unique to New Zealand, the peer group for these roles is comprised of 24 Australian listed companies that are more closely matched to the size and complexity and operational scope of Fonterra, allowing a more appropriate benchmarking of senior remuneration.
The benchmark also reflects that senior positions within Fonterra require global expertise, and are typically recruited from competitive global talent markets, particularly Australia and Asia.
For our wider employee population, benchmarking is conducted using independent third-party advisors as appropriate to the market in which our employees work. Currently, two principal advisory companies are used, selected based on their relative presence in these markets and global reach.
Chief Executive Officer – Total Remuneration FY17The total remuneration of the Chief Executive Officer paid in FY17 was $8,320,406, made up as follows:
FY17
PAY FOR PERFORMANCE
TOTAL REMUNERATION
SALARY BENEFITS1 STI2 LTI3
$2,462,799 $170,036 $1,832,323 $3,855,248 $8,320,406
Notes and Explanations1 Company Superannuation contribution2 Payment of the FY16 STI in relation to performance in FY163 Total payments made in FY17 in relation to performance for:
FY16 VLI ($2,482,502) FY16 VLI deferred payment ($664,956) FY15 LTI deferred payment ($201,950) FY14 LTI deferred payment ($505,840)
Principle 6: Risk ManagementRisk Management FrameworkFonterra ensures its performance is optimised through the identification and management of the most material risks to the business. The Board Risk Committee has a broad mandate covering all aspects of risk and risk culture.
Fonterra’s risk framework is based on the three lines of defence model with clear responsibilities for business risk management, enterprise risk oversight, building risk capability
and risk assurance. Our risk management approach is aligned with international best practice and includes a consistent risk management process that:
• Considers our goals and relevant context
• Identifies any assumptions or uncertainties (risks) that could affect achieving our goals
• Prioritises control effort through assessing the potential consequences of a risk materialising, the likelihood of that occurrence
• Considers risk drivers
• Evaluates current controls, their effectiveness and outcome acceptability
• Introduces new controls or action plans to strengthen our position
• Regularly reviews control effectiveness, context changes and resulting exposure.
Fonterra’s risk management policy is supported by a risk management standard that outlines our risk principles, accountabilities and the requirements for managing and reporting risk within the business. At the highest level, the most material risks to the business are grouped to reflect our focus on people, identity and strategy.
In the Sustainability and Social Responsibility section, we provide more detailed information on our risk management approach for Health and Safety, Food Safety and Quality, Environmental and Animal welfare risks.
These are reviewed regularly to consider any changes or need to adapt control strategies, and are reported to and reviewed by the Board Risk Committee at each meeting. We aim to deepen the understanding, management and reporting of key business risks through the roll out of a risk management technical product as part of programmed work. Increasingly we are reporting on emerging risk as part of our approach to strengthening organisational resilience.
Health and SafetyFonterra seeks to provide a safe and healthy work environment to anyone who is affected by our operations. Continuous health and safety improvement is an integral part of everything we do. Achieving effective health and safety improvement is regarded as essential to our long-term success and an integral part of our corporate values and how we run our business. We have focussed programmes to address our critical risks and our injury reduction ambitions.
Fonterra’s health and safety performance is measured using a number of reactive and preventive indicators. These include Total Recordable Injury Frequency Rate (TRIFR), number of serious harm injuries and status of self assurance and internal control Audits conducted throughout the business.
We have made a 19 per cent improvement to TRIFR compared to our performance in 2016 and we have achieved 19 per cent fewer serious harms in FY17 overall compared to FY16.
CORPORATE GOVERNANCE
CORPORATE GOVERNANCE | 75 74 | CORPORATE GOVERNANCE
FONTERRA ANNUAL REVIEW 2017 FONTERRA ANNUAL REVIEW 2017
We remain optimistic of achieving our longer term TRIFR goal of five which represents world class within our industry group.
Our focus is to continue to track our efforts on a broad range of health and wellbeing programmes to enhance our people care and actively prevent incidents from occurring.
Principle 7: Auditors Auditor FrameworkOne of the roles of the Audit and Finance Committee is responsibility for making recommendations to the Board regarding the appointment of the external auditor. The auditor is appointed by the shareholders at the Annual Meeting.
The Audit and Finance Committee reviews the independence of the auditor and reviews the external audit fees, the terms of engagement and annual audit plan.
Fonterra encourages the rotation of the lead external audit partner in the relationship in accordance with best practice. Fonterra has a Group Audit Independence Policy, for certain activities the auditor may undertake for the Group. This policy is prescriptive as to the types of activities that the auditor may undertake, those the auditor may only undertake with the approval of the Audit and Finance Committee, and the types of activities that are not permitted. The Audit and Finance Committee will not approve the auditor performing any tasks that have the potential to create a conflict except in exceptional circumstances and then only if appropriate safeguards are in place. The Audit and Finance Committee monitor the performance of these additional activities undertaken by the auditor.
The Audit and Finance Committee Chairman communicates regularly with the external auditor and the Audit and Finance Committee meet with the external auditor without Management at least twice a year.
The Audit and Finance Committee is responsible for ensuring that the ability of the auditors to carry out their statutory audit role is not impaired, or could reasonably be perceived to be impaired.
The fees paid to Fonterra’s auditor, PricewaterhouseCoopers are detailed in Note 4 to the Annual Financial Results for the year ended 31 July 2017.
Annual MeetingThe external auditor is required to attend Fonterra’s Annual Meeting and be available to answer questions from shareholders in relation to the audit.
Internal AuditFonterra’s Internal Audit function provides the Audit and Finance Committee and Management with objective and independent assurances on the design and effectiveness of internal controls.
Management through the CEO and CFO strongly support the need for Internal Audit. A close working relationship with Management is critical to ensure Internal Audit remains relevant and provides adequate audit coverage.
Internal Audit supports the achievement of Fonterra’s Group business objectives by:
• Evaluating the effectiveness of risk management, controls and governance processes
• Delivering reasonable assurance over key business risks to the Audit and Finance Committee and Management
• Providing recommendations for control environment improvements
• Executing assignments in compliance with Institute of Internal Audit Standards
The approach to internal audit is based on the principle of line management responsibility for risk and controls.
• Management is responsible for implementing, operating and monitoring the system of internal controls to provide reasonable assurance of achieving business objectives.
• Internal Audit is responsible for:
– Delivering a reasonable degree of assurance (as determined by the Audit and Finance Committee) over business risk
– Assisting the business with special reviews or investigations where requested and approved by the Audit and Finance Committee
– Complying with the Internal Audit methodology.
Principle 8: Shareholder Rights and RelationsWebsiteFonterra has a website (www.fonterra.com) where investors and interested stakeholders can access financial and operational information and key corporate governance information about the issuer.
Shareholders’ CouncilOne of the Board’s most important relationships is with the Shareholders’ Council. The Council, Fonterra’s representative body, which is established under the Fonterra Constitution, is independent of the Board and as at 31 July 2017 comprised 35 farmer shareholders elected as councillors, representing 35 wards across New Zealand. However, with effect from the 2017 Annual Meeting the number of wards will be reduced to 25. The Shareholders’ Council was created to be the guardian of the Co-operative Principles which apply to the cornerstone activities of the Co-operative. The functions of the Council are set out in the Constitution. The Council reviews the Board’s Statement of Intentions for the performance and operations of the Group and publishes an annual report, commenting on these matters.
The Council, Board and Management have a working interface document which sets out the principles to facilitate the working partnership between the Board, the Council and Management and the way operational issues will be dealt with by the Board and the Council.
The working interface document is available on the Farm Source website.
The Council and the Board meet regularly, as do the Chairs of the Board and the Council and the Chairs of their respective Committees.
Farmer CommunicationsFonterra is committed to maintaining and improving communication with its farmer shareholder base to ensure that the objectives of both the Group and farmer shareholders are understood. An extensive farmer shareholder and supplier relations programme is managed by the Chief Operating Officer, Farm Source. Channels for electronic communication are provided through the fonterra.com and Farm Source™ websites and the My Co-op phone application. In addition, Fonterra provides farmer shareholders with the ability to receive communications (such as the Annual Report) from Fonterra electronically.
Fonterra’s communications with farmer shareholders include regular face-to-face meetings, Sky broadcasts, a regular Global Dairy Update, Farm Source™ magazine publication, My Co-op posts and regular emails from the Chairman and Regional Heads. As described above, Fonterra releases to the relevant stock exchanges all material information, and will comply with the listing rules of the Fonterra Shareholders’ Market with respect to shareholder communications.
Farmer MeetingsA schedule of regular meetings with farmer shareholders, sharemilkers and farm workers is held across the country at least twice each year. Often these are run in conjunction with the Shareholders’ Council and Farm Source™ regional teams.
Farmer Directors also regularly attend other farmer meetings during the year on specific topics.
In addition, the Board consults with farmer shareholders on specific issues as they arise.
Fonterra.com and Farm Source™ Digital ToolsPresentations on the development of the business are available on the fonterra.com website. The Group also uses email alerts, including regular updates from the Chairman and regular farmer shareholder updates.
The Farm Source™ website enables farmer shareholders, their employees and business partners to transact online with Fonterra and access information and tools on milk production and quality, online statements and up-to-the-minute news and weather. This site is also used to provide information on the business to farmer shareholders.
Fonterra’s My Co-op provides constantly updated news and information from across the Co-op and the industry including milk price announcements, updates from the Chairman and CEO and rural and regional council news. The On Farm app provides daily milk production and quality information, comparisons against last season volumes, tanker ETA, and summary reports of key milk performance information for the last 30 days.
Annual MeetingThe Board views the Annual Meeting of farmer shareholders, which is held at a different venue around New Zealand each year, as an opportunity to communicate directly with farmer shareholders and also ensures that adequate time is provided at these meetings for farmer shareholders to raise issues or ask questions from the floor.
Notices of Meetings are sent to farmer shareholders at least 10 working days before the meeting.
The Constitution describes the process whereby a farmer shareholder can raise a proposal for discussion or resolution at the next meeting of farmer shareholders at which the farmer shareholder is entitled to vote.
Annual ReportThe Group’s Annual Report including financial statements and an annual review, together with the half-year reports and other material announcements, are designed to present a balanced and clear view of Fonterra’s activities and prospects and are available on fonterra.com.
Other DisclosuresInformation on the Group’s performance, annual and half-year financial results, Director changes, and other significant matters, is advised to the market through the NZX and ASX in accordance with the Group Disclosure Policy. Farmer shareholders and other stakeholders receive regular updates on these and other issues relevant to them and all media and market releases are available on fonterra.com.
VotingShareholders have the right to vote on major transactions (as defined in the Companies Act 1993) as well as other major decisions that may change the nature of Fonterra as prescribed by the listing rules of the FSM. In particular, FSM Rule 8.1.1 restricts Fonterra from entering into any transaction (or series of linked or related transactions) which would change the essential nature of the business of Fonterra or in respect of which the gross value is in excess of 50% of the average market capitalisation of Fonterra without the prior approval of Fonterra’s shareholders.
In accordance with the co-operative nature of Fonterra, voting is based on the quantity of milk solids supplied to Fonterra, backed by shares and is not on the principle of one vote per share.
CORPORATE GOVERNANCE
CORPORATE GOVERNANCE | 77 76 | CORPORATE GOVERNANCE
FONTERRA ANNUAL REVIEW 2017 FONTERRA ANNUAL REVIEW 2017
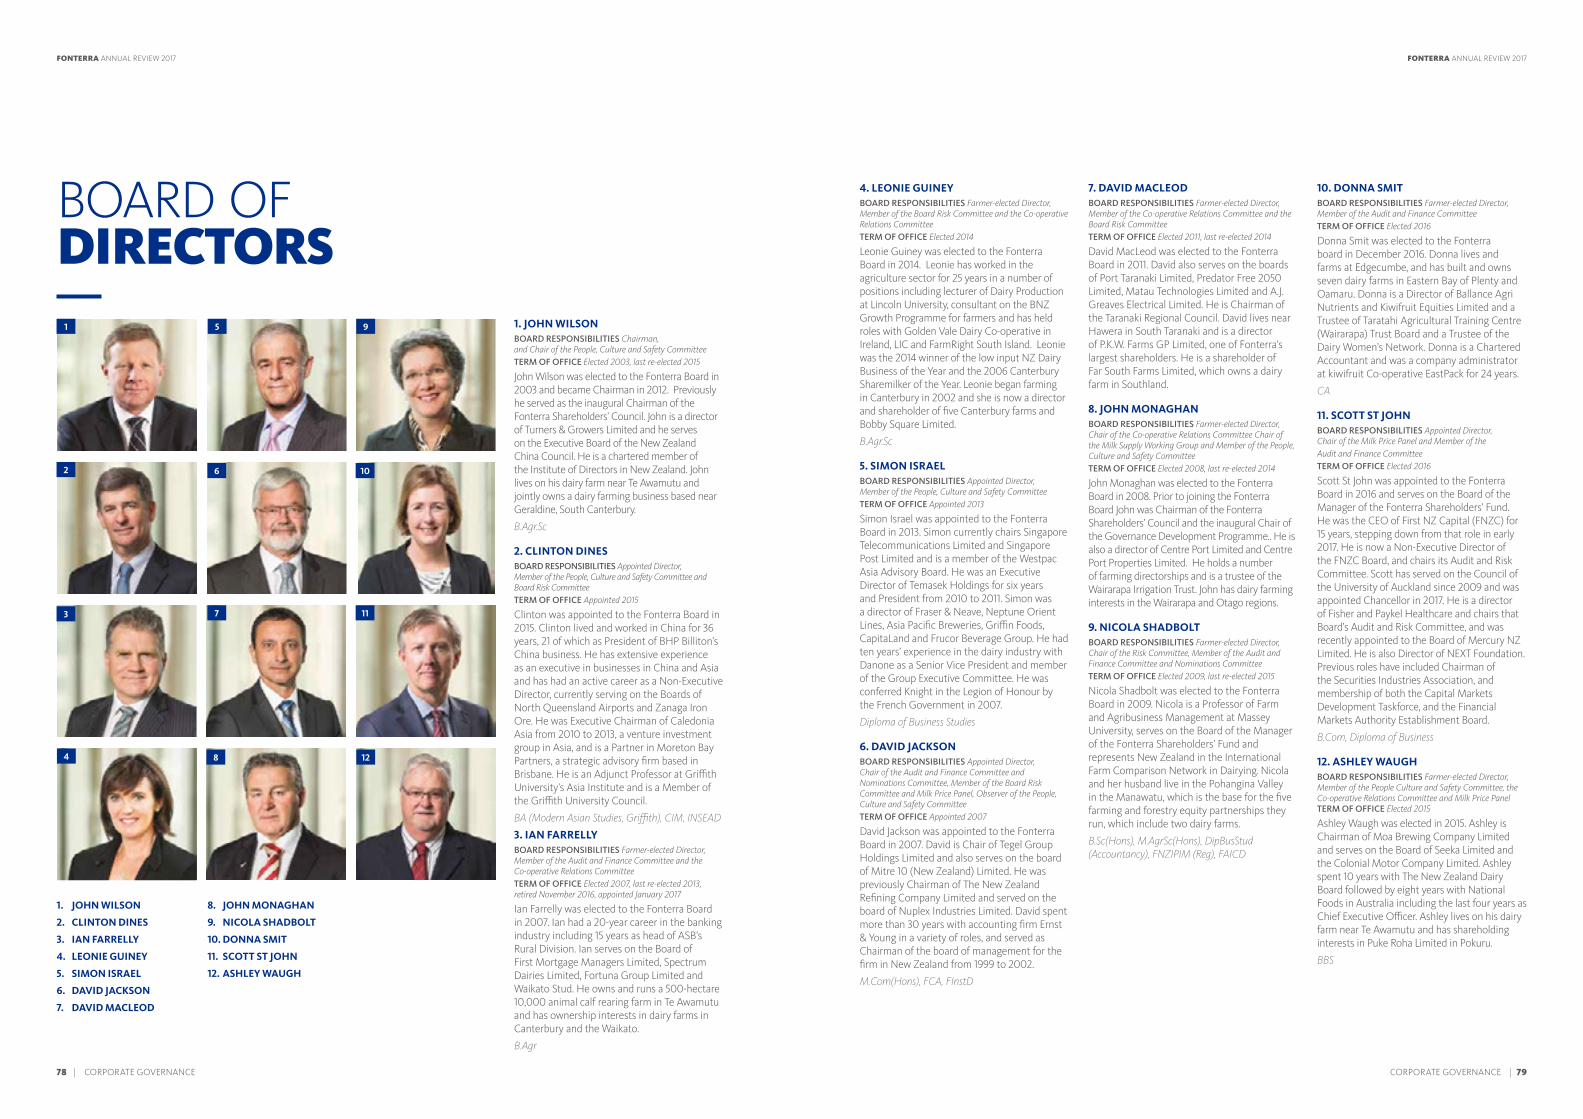
BOARD OF DIRECTORS
1. JOHN WILSON
2. CLINTON DINES
3. IAN FARRELLY
4. LEONIE GUINEY
5. SIMON ISRAEL
6. DAVID JACKSON
7. DAVID MACLEOD
8. JOHN MONAGHAN
9. NICOLA SHADBOLT
10. DONNA SMIT
11. SCOTT ST JOHN
12. ASHLEY WAUGH
4. LEONIE GUINEY BOARD RESPONSIBILITIES Farmer-elected Director, Member of the Board Risk Committee and the Co-operative Relations CommitteeTERM OF OFFICE Elected 2014
Leonie Guiney was elected to the Fonterra Board in 2014. Leonie has worked in the agriculture sector for 25 years in a number of positions including lecturer of Dairy Production at Lincoln University, consultant on the BNZ Growth Programme for farmers and has held roles with Golden Vale Dairy Co-operative in Ireland, LIC and FarmRight South Island. Leonie was the 2014 winner of the low input NZ Dairy Business of the Year and the 2006 Canterbury Sharemilker of the Year. Leonie began farming in Canterbury in 2002 and she is now a director and shareholder of five Canterbury farms and Bobby Square Limited.
B.Agr.Sc
5. SIMON ISRAELBOARD RESPONSIBILITIES Appointed Director, Member of the People, Culture and Safety CommitteeTERM OF OFFICE Appointed 2013
Simon Israel was appointed to the Fonterra Board in 2013. Simon currently chairs Singapore Telecommunications Limited and Singapore Post Limited and is a member of the Westpac Asia Advisory Board. He was an Executive Director of Temasek Holdings for six years and President from 2010 to 2011. Simon was a director of Fraser & Neave, Neptune Orient Lines, Asia Pacific Breweries, Griffin Foods, CapitaLand and Frucor Beverage Group. He had ten years’ experience in the dairy industry with Danone as a Senior Vice President and member of the Group Executive Committee. He was conferred Knight in the Legion of Honour by the French Government in 2007.
Diploma of Business Studies
6. DAVID JACKSONBOARD RESPONSIBILITIES Appointed Director, Chair of the Audit and Finance Committee and Nominations Committee, Member of the Board Risk Committee and Milk Price Panel, Observer of the People, Culture and Safety CommitteeTERM OF OFFICE Appointed 2007
David Jackson was appointed to the Fonterra Board in 2007. David is Chair of Tegel Group Holdings Limited and also serves on the board of Mitre 10 (New Zealand) Limited. He was previously Chairman of The New Zealand Refining Company Limited and served on the board of Nuplex Industries Limited. David spent more than 30 years with accounting firm Ernst & Young in a variety of roles, and served as Chairman of the board of management for the firm in New Zealand from 1999 to 2002.
M.Com(Hons), FCA, FInstD
7. DAVID MACLEODBOARD RESPONSIBILITIES Farmer-elected Director, Member of the Co-operative Relations Committee and the Board Risk CommitteeTERM OF OFFICE Elected 2011, last re-elected 2014
David MacLeod was elected to the Fonterra Board in 2011. David also serves on the boards of Port Taranaki Limited, Predator Free 2050 Limited, Matau Technologies Limited and A.J. Greaves Electrical Limited. He is Chairman of the Taranaki Regional Council. David lives near Hawera in South Taranaki and is a director of P.K.W. Farms GP Limited, one of Fonterra’s largest shareholders. He is a shareholder of Far South Farms Limited, which owns a dairy farm in Southland.
8. JOHN MONAGHANBOARD RESPONSIBILITIES Farmer-elected Director, Chair of the Co-operative Relations Committee Chair of the Milk Supply Working Group and Member of the People, Culture and Safety CommitteeTERM OF OFFICE Elected 2008, last re-elected 2014
John Monaghan was elected to the Fonterra Board in 2008. Prior to joining the Fonterra Board John was Chairman of the Fonterra Shareholders’ Council and the inaugural Chair of the Governance Development Programme.. He is also a director of Centre Port Limited and Centre Port Properties Limited. He holds a number of farming directorships and is a trustee of the Wairarapa Irrigation Trust. John has dairy farming interests in the Wairarapa and Otago regions.
9. NICOLA SHADBOLTBOARD RESPONSIBILITIES Farmer-elected Director, Chair of the Risk Committee, Member of the Audit and Finance Committee and Nominations CommitteeTERM OF OFFICE Elected 2009, last re-elected 2015
Nicola Shadbolt was elected to the Fonterra Board in 2009. Nicola is a Professor of Farm and Agribusiness Management at Massey University, serves on the Board of the Manager of the Fonterra Shareholders’ Fund and represents New Zealand in the International Farm Comparison Network in Dairying. Nicola and her husband live in the Pohangina Valley in the Manawatu, which is the base for the five farming and forestry equity partnerships they run, which include two dairy farms.
B.Sc(Hons), M.AgrSc(Hons), DipBusStud (Accountancy), FNZIPIM (Reg), FAICD
10. DONNA SMITBOARD RESPONSIBILITIES Farmer-elected Director, Member of the Audit and Finance Committee TERM OF OFFICE Elected 2016
Donna Smit was elected to the Fonterra board in December 2016. Donna lives and farms at Edgecumbe, and has built and owns seven dairy farms in Eastern Bay of Plenty and Oamaru. Donna is a Director of Ballance Agri Nutrients and Kiwifruit Equities Limited and a Trustee of Taratahi Agricultural Training Centre (Wairarapa) Trust Board and a Trustee of the Dairy Women’s Network. Donna is a Chartered Accountant and was a company administrator at kiwifruit Co-operative EastPack for 24 years.
CA
11. SCOTT ST JOHNBOARD RESPONSIBILITIES Appointed Director, Chair of the Milk Price Panel and Member of the Audit and Finance CommitteeTERM OF OFFICE Elected 2016
Scott St John was appointed to the Fonterra Board in 2016 and serves on the Board of the Manager of the Fonterra Shareholders’ Fund. He was the CEO of First NZ Capital (FNZC) for 15 years, stepping down from that role in early 2017. He is now a Non-Executive Director of the FNZC Board, and chairs its Audit and Risk Committee. Scott has served on the Council of the University of Auckland since 2009 and was appointed Chancellor in 2017. He is a director of Fisher and Paykel Healthcare and chairs that Board’s Audit and Risk Committee, and was recently appointed to the Board of Mercury NZ Limited. He is also Director of NEXT Foundation. Previous roles have included Chairman of the Securities Industries Association, and membership of both the Capital Markets Development Taskforce, and the Financial Markets Authority Establishment Board.
B.Com, Diploma of Business
12. ASHLEY WAUGH BOARD RESPONSIBILITIES Farmer-elected Director, Member of the People Culture and Safety Committee, the Co-operative Relations Committee and Milk Price Panel TERM OF OFFICE Elected 2015
Ashley Waugh was elected in 2015. Ashley is Chairman of Moa Brewing Company Limited and serves on the Board of Seeka Limited and the Colonial Motor Company Limited. Ashley spent 10 years with The New Zealand Dairy Board followed by eight years with National Foods in Australia including the last four years as Chief Executive Officer. Ashley lives on his dairy farm near Te Awamutu and has shareholding interests in Puke Roha Limited in Pokuru.
BBS
1
62
3
5
11
12
9
10
8
7
4
1. JOHN WILSONBOARD RESPONSIBILITIES Chairman, and Chair of the People, Culture and Safety CommitteeTERM OF OFFICE Elected 2003, last re-elected 2015
John Wilson was elected to the Fonterra Board in 2003 and became Chairman in 2012. Previously he served as the inaugural Chairman of the Fonterra Shareholders’ Council. John is a director of Turners & Growers Limited and he serves on the Executive Board of the New Zealand China Council. He is a chartered member of the Institute of Directors in New Zealand. John lives on his dairy farm near Te Awamutu and jointly owns a dairy farming business based near Geraldine, South Canterbury.
B.Agr.Sc
2. CLINTON DINESBOARD RESPONSIBILITIES Appointed Director, Member of the People, Culture and Safety Committee and Board Risk CommitteeTERM OF OFFICE Appointed 2015
Clinton was appointed to the Fonterra Board in 2015. Clinton lived and worked in China for 36 years, 21 of which as President of BHP Billiton’s China business. He has extensive experience as an executive in businesses in China and Asia and has had an active career as a Non-Executive Director, currently serving on the Boards of North Queensland Airports and Zanaga Iron Ore. He was Executive Chairman of Caledonia Asia from 2010 to 2013, a venture investment group in Asia, and is a Partner in Moreton Bay Partners, a strategic advisory firm based in Brisbane. He is an Adjunct Professor at Griffith University’s Asia Institute and is a Member of the Griffith University Council.
BA (Modern Asian Studies, Griffith), CIM, INSEAD
3. IAN FARRELLYBOARD RESPONSIBILITIES Farmer-elected Director, Member of the Audit and Finance Committee and the Co-operative Relations CommitteeTERM OF OFFICE Elected 2007, last re-elected 2013, retired November 2016, appointed January 2017
Ian Farrelly was elected to the Fonterra Board in 2007. Ian had a 20-year career in the banking industry including 15 years as head of ASB’s Rural Division. Ian serves on the Board of First Mortgage Managers Limited, Spectrum Dairies Limited, Fortuna Group Limited and Waikato Stud. He owns and runs a 500-hectare 10,000 animal calf rearing farm in Te Awamutu and has ownership interests in dairy farms in Canterbury and the Waikato.
B.Agr
CORPORATE GOVERNANCE | 79 78 | CORPORATE GOVERNANCE
FONTERRA ANNUAL REVIEW 2017 FONTERRA ANNUAL REVIEW 2017
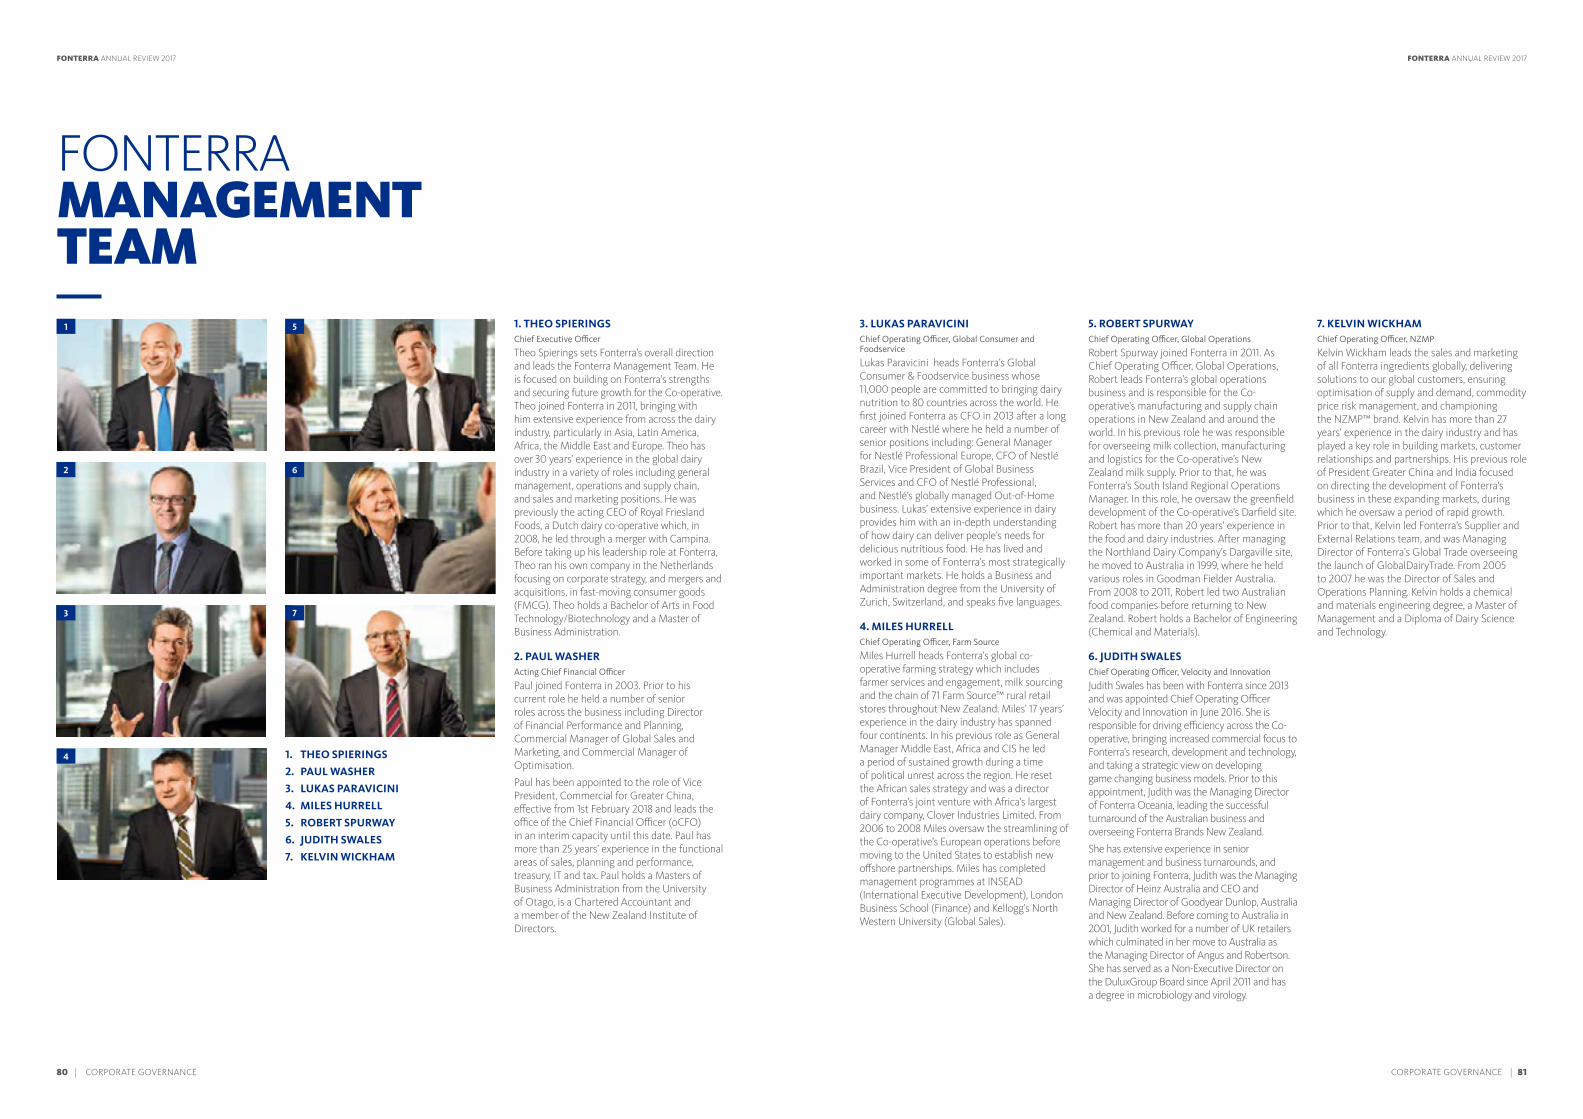
1. THEO SPIERINGS
2. PAUL WASHER
3. LUKAS PARAVICINI
4. MILES HURRELL
5. ROBERT SPURWAY
6. JUDITH SWALES
7. KELVIN WICKHAM
3. LUKAS PARAVICINIChief Operating Officer, Global Consumer and Foodservice
Lukas Paravicini heads Fonterra’s Global Consumer & Foodservice business whose 11,000 people are committed to bringing dairy nutrition to 80 countries across the world. He first joined Fonterra as CFO in 2013 after a long career with Nestlé where he held a number of senior positions including: General Manager for Nestlé Professional Europe, CFO of Nestlé Brazil, Vice President of Global Business Services and CFO of Nestlé Professional, and Nestlé’s globally managed Out-of-Home business. Lukas’ extensive experience in dairy provides him with an in-depth understanding of how dairy can deliver people’s needs for delicious nutritious food. He has lived and worked in some of Fonterra’s most strategically important markets. He holds a Business and Administration degree from the University of Zurich, Switzerland, and speaks five languages.
4. MILES HURRELLChief Operating Officer, Farm Source
Miles Hurrell heads Fonterra’s global co-operative farming strategy which includes farmer services and engagement, milk sourcing and the chain of 71 Farm Source™ rural retail stores throughout New Zealand. Miles’ 17 years’ experience in the dairy industry has spanned four continents. In his previous role as General Manager Middle East, Africa and CIS he led a period of sustained growth during a time of political unrest across the region. He reset the African sales strategy and was a director of Fonterra’s joint venture with Africa’s largest dairy company, Clover Industries Limited. From 2006 to 2008 Miles oversaw the streamlining of the Co-operative’s European operations before moving to the United States to establish new offshore partnerships. Miles has completed management programmes at INSEAD (International Executive Development), London Business School (Finance) and Kellogg’s North Western University (Global Sales).
5. ROBERT SPURWAYChief Operating Officer, Global Operations
Robert Spurway joined Fonterra in 2011. As Chief Operating Officer, Global Operations, Robert leads Fonterra’s global operations business and is responsible for the Co-operative’s manufacturing and supply chain operations in New Zealand and around the world. In his previous role he was responsible for overseeing milk collection, manufacturing and logistics for the Co-operative’s New Zealand milk supply. Prior to that, he was Fonterra’s South Island Regional Operations Manager. In this role, he oversaw the greenfield development of the Co-operative’s Darfield site. Robert has more than 20 years’ experience in the food and dairy industries. After managing the Northland Dairy Company’s Dargaville site, he moved to Australia in 1999, where he held various roles in Goodman Fielder Australia. From 2008 to 2011, Robert led two Australian food companies before returning to New Zealand. Robert holds a Bachelor of Engineering (Chemical and Materials).
6. JUDITH SWALESChief Operating Officer, Velocity and Innovation
Judith Swales has been with Fonterra since 2013 and was appointed Chief Operating Officer Velocity and Innovation in June 2016. She is responsible for driving efficiency across the Co-operative, bringing increased commercial focus to Fonterra’s research, development and technology, and taking a strategic view on developing game changing business models. Prior to this appointment, Judith was the Managing Director of Fonterra Oceania, leading the successful turnaround of the Australian business and overseeing Fonterra Brands New Zealand.
She has extensive experience in senior management and business turnarounds, and prior to joining Fonterra, Judith was the Managing Director of Heinz Australia and CEO and Managing Director of Goodyear Dunlop, Australia and New Zealand. Before coming to Australia in 2001, Judith worked for a number of UK retailers which culminated in her move to Australia as the Managing Director of Angus and Robertson. She has served as a Non-Executive Director on the DuluxGroup Board since April 2011 and has a degree in microbiology and virology.
7. KELVIN WICKHAMChief Operating Officer, NZMP
Kelvin Wickham leads the sales and marketing of all Fonterra ingredients globally, delivering solutions to our global customers, ensuring optimisation of supply and demand, commodity price risk management, and championing the NZMP™ brand. Kelvin has more than 27 years’ experience in the dairy industry and has played a key role in building markets, customer relationships and partnerships. His previous role of President Greater China and India focused on directing the development of Fonterra’s business in these expanding markets, during which he oversaw a period of rapid growth. Prior to that, Kelvin led Fonterra’s Supplier and External Relations team, and was Managing Director of Fonterra’s Global Trade overseeing the launch of GlobalDairyTrade. From 2005 to 2007 he was the Director of Sales and Operations Planning. Kelvin holds a chemical and materials engineering degree, a Master of Management and a Diploma of Dairy Science and Technology.
2
1 5
6
4
3 7
FONTERRA MANAGEMENT TEAM
1. THEO SPIERINGSChief Executive Officer
Theo Spierings sets Fonterra’s overall direction and leads the Fonterra Management Team. He is focused on building on Fonterra’s strengths and securing future growth for the Co-operative. Theo joined Fonterra in 2011, bringing with him extensive experience from across the dairy industry, particularly in Asia, Latin America, Africa, the Middle East and Europe. Theo has over 30 years’ experience in the global dairy industry in a variety of roles including general management, operations and supply chain, and sales and marketing positions. He was previously the acting CEO of Royal Friesland Foods, a Dutch dairy co-operative which, in 2008, he led through a merger with Campina. Before taking up his leadership role at Fonterra, Theo ran his own company in the Netherlands focusing on corporate strategy, and mergers and acquisitions, in fast-moving consumer goods (FMCG). Theo holds a Bachelor of Arts in Food Technology/Biotechnology and a Master of Business Administration.
2. PAUL WASHERActing Chief Financial Officer
Paul joined Fonterra in 2003. Prior to his current role he held a number of senior roles across the business including Director of Financial Performance and Planning, Commercial Manager of Global Sales and Marketing, and Commercial Manager of Optimisation.
Paul has been appointed to the role of Vice President, Commercial for Greater China, effective from 1st February 2018 and leads the office of the Chief Financial Officer (oCFO) in an interim capacity until this date. Paul has more than 25 years’ experience in the functional areas of sales, planning and performance, treasury, IT and tax. Paul holds a Masters of Business Administration from the University of Otago, is a Chartered Accountant and a member of the New Zealand Institute of Directors.
CORPORATE GOVERNANCE | 81 80 | CORPORATE GOVERNANCE
FONTERRA ANNUAL REVIEW 2017 FONTERRA ANNUAL REVIEW 2017
SUMMARY FINANCIAL STATEMENTSFor the year ended 31 July 2017
DIRECTORS’ STATEMENT FOR THE YEAR ENDED 31 JULY 2017
The Directors hereby approve and authorise for issue the summary financial statements for the year ended 31 July 2017 presented on pages 84 to 99. For and on behalf of the Board:
JOHN WILSON DAVID JACKSONCHAIRMAN DIRECTOR
23 September 2017 23 September 2017
Fonterra Co-operative Group Limited (Fonterra or the Co-operative) is a co-operative company incorporated and domiciled in New Zealand. Fonterra is registered under the Companies Act 1993 and the Co-operative Companies Act 1996, and is an FMC Reporting Entity under the Financial Markets Conduct Act 2013. Fonterra is also required to comply with the Dairy Industry Restructuring Act 2001.
These summary financial statements comprise Fonterra and its subsidiaries (together referred to as the Group) and include the Group’s interest in its equity accounted investees after adjustments to align to the accounting policies of the Group. They have been prepared in accordance with Financial Reporting Standard No. 43: Summary Financial Statements and have been extracted from the Group’s full financial statements. The Group’s full financial statements comply with International Financial Reporting Standards. They also comply with New Zealand Equivalents to International Financial Reporting Standards and have been prepared in accordance with Generally Accepted Accounting Practice applicable to for-profit entities.
The Board has elected to present summary financial statements for the year ended 31 July 2017 as part of the Annual Review sent to Shareholders. These summary financial statements include notes setting out key information.
These summary financial statements are presented for the year ended 31 July 2017. The comparative information is for the year ended 31 July 2016. These summary financial statements of the Group have been prepared using the same accounting policies and measurement basis as the Group’s full financial statements for the year ended 31 July 2017.
The full financial statements for the year ended 31 July 2017, approved and authorised for issue by the Board on 23 September 2017, have been audited by PricewaterhouseCoopers and given an unqualified opinion.
The Group is primarily involved in the collection, manufacture and sale of milk and milk-derived products and in fast-moving consumer goods and foodservice businesses. These summary financial statements are presented in New Zealand Dollars ($ or NZD), which is Fonterra’s functional and presentation currency, and rounded to the nearest million, except where otherwise stated.
The summary financial statements cannot be expected to provide as complete an understanding of the financial affairs of the Group as the full financial statements, which are available from Fonterra’s registered office at 109 Fanshawe Street, Auckland, New Zealand or on Fonterra’s website, www.fonterra.com.
CONTENTS
DIRECTORS’ STATEMENT 83
INCOME STATEMENT 84
STATEMENT OF COMPREHENSIVE INCOME 85
STATEMENT OF FINANCIAL POSITION 86
STATEMENT OF CHANGES IN EQUITY 87
CASH FLOW STATEMENT 88
NOTES TO THE SUMMARY FINANCIAL STATEMENTS 89
INDEPENDENT AUDITOR’S REPORT 100
SUMMARY FINANCIAL STATEMENTS | 83 82 | SUMMARY FINANCIAL STATEMENTS
FONTERRA ANNUAL REVIEW 2017 FONTERRA ANNUAL REVIEW 2017

The accompanying notes form part of these summary financial statements.The accompanying notes form part of these financial statements.
INCOME STATEMENTFOR THE YEAR ENDED 31 JULY 2017
GROUP $ MILLION
NOTES 31 JULY 2017 31 JULY 2016
Revenue from sale of goods 19,232 17,199
Cost of goods sold 2 (15,968) (13,567)
Gross profit 3,264 3,632
Other operating income 190 266
Selling and marketing expenses (641) (703)
Distribution expenses (550) (585)
Administrative expenses (810) (844)
Other operating expenses (369) (396)
Net foreign exchange gains 29 7
Share of profit of equity accounted investees 7 54
Profit before net finance costs and tax 1,120 1,431
Finance income 34 18
Finance costs (389) (517)
Net finance costs (355) (499)
Profit before tax 765 932
Tax expense 9 (20) (98)
Profit after tax 745 834
Profit after tax is attributable to:
Equity holders of the Co-operative 734 810
Non-controlling interests 11 24
Profit after tax 745 834
GROUP $
31 JULY 2017 31 JULY 2016
Earnings per share:
Basic and diluted earnings per share 0.46 0.51
STATEMENT OF COMPREHENSIVE INCOMEFOR THE YEAR ENDED 31 JULY 2017
GROUP $ MILLION
31 JULY 2017 31 JULY 2016
Profit after tax 745 834
Items that may be reclassified subsequently to profit or loss:
Cash flow hedges and other costs of hedging, net of tax 128 601
Net investment hedges and translation of foreign operations, net of tax (124) (318)
Hyperinflation losses attributable to equity holders (1) (16)
Share of equity accounted investees’ movements in reserves – 5
Other reserve movements (2) 5
Total items that may be reclassified subsequently to profit or loss 1 277
Items that will not be reclassified subsequently to profit or loss:
Net fair value gains on investments in shares 2 –
Foreign currency translation losses attributable to non-controlling interests (3) (84)
Hyperinflation movements attributable to non-controlling interests – (10)
Non-controlling interest other movements (2) –
Total items that will not be reclassified subsequently to profit or loss (3) (94)
Total other comprehensive (expense)/income recognised directly in equity (2) 183
Total comprehensive income 743 1,017
Total comprehensive income is attributable to:
Equity holders of the Co-operative 737 1,087
Non-controlling interests 6 (70)
Total comprehensive income 743 1,017
SUMMARY FINANCIAL STATEMENTS | 85 84 | SUMMARY FINANCIAL STATEMENTS
FONTERRA ANNUAL REVIEW 2017 FONTERRA ANNUAL REVIEW 2017
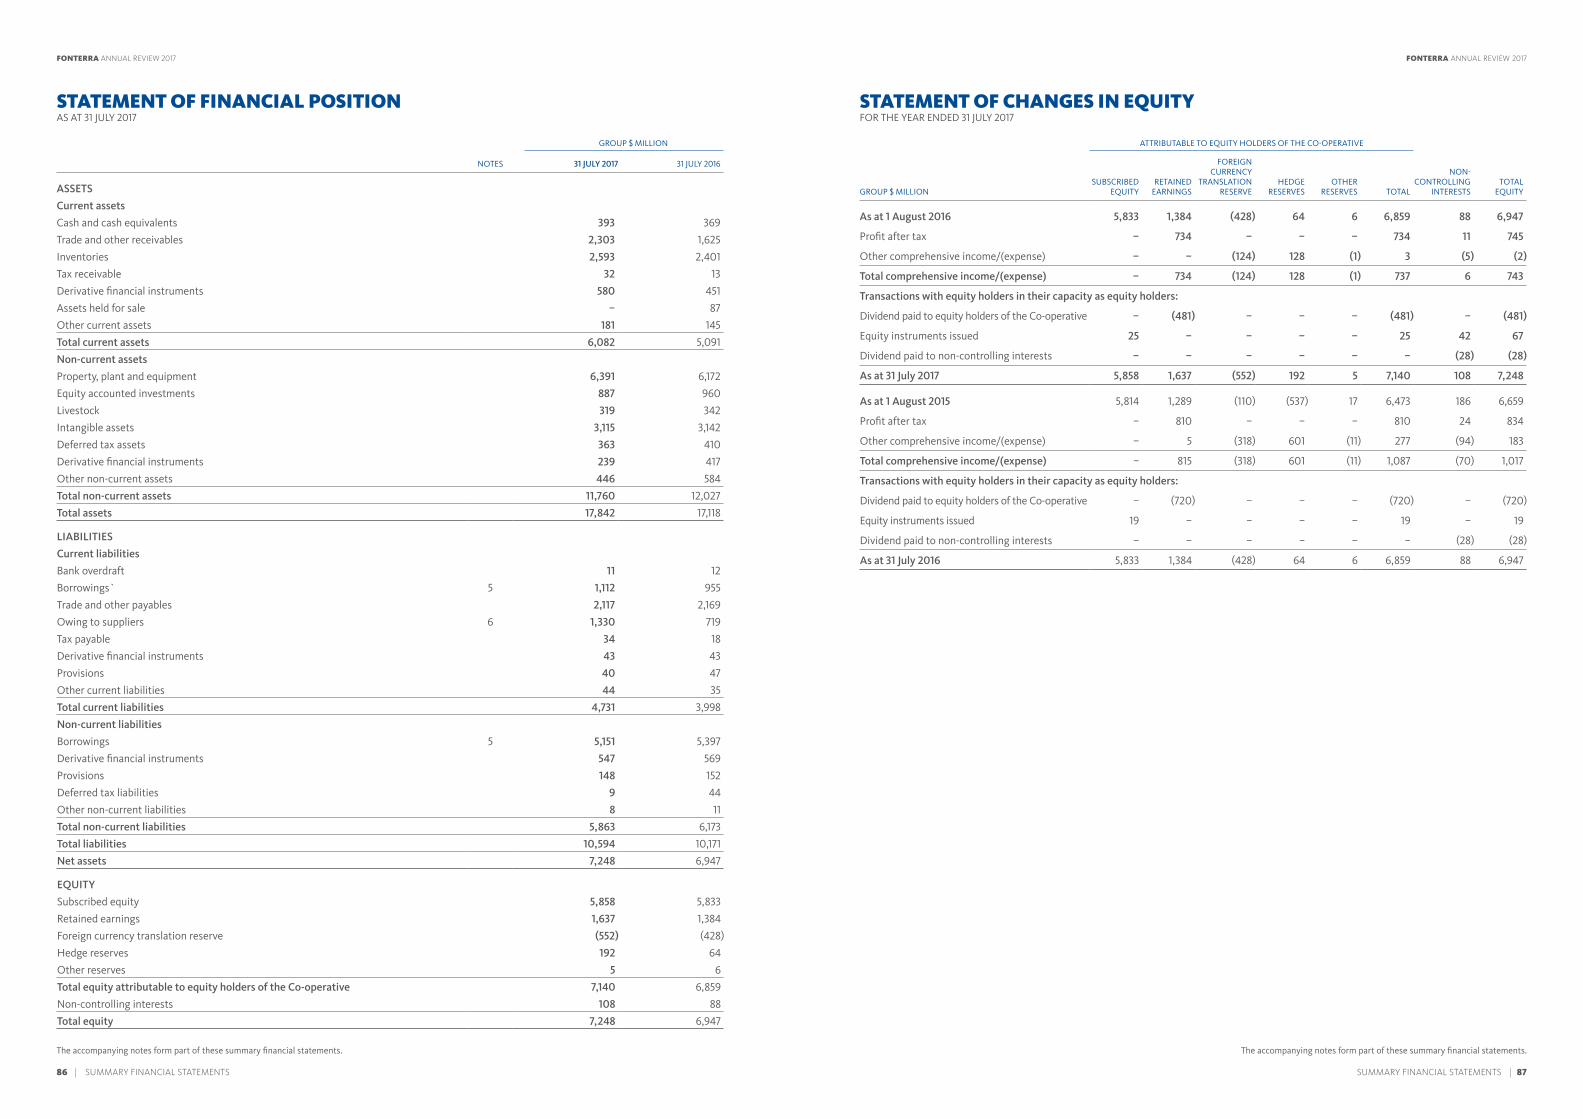
The accompanying notes form part of these summary financial statements. The accompanying notes form part of these summary financial statements.
STATEMENT OF FINANCIAL POSITIONAS AT 31 JULY 2017
GROUP $ MILLION
NOTES 31 JULY 2017 31 JULY 2016
ASSETS
Current assets
Cash and cash equivalents 393 369
Trade and other receivables 2,303 1,625
Inventories 2,593 2,401
Tax receivable 32 13
Derivative financial instruments 580 451
Assets held for sale – 87
Other current assets 181 145
Total current assets 6,082 5,091
Non-current assets
Property, plant and equipment 6,391 6,172
Equity accounted investments 887 960
Livestock 319 342
Intangible assets 3,115 3,142
Deferred tax assets 363 410
Derivative financial instruments 239 417
Other non-current assets 446 584
Total non-current assets 11,760 12,027
Total assets 17,842 17,118
LIABILITIES
Current liabilities
Bank overdraft 11 12
Borrowings` 5 1,112 955
Trade and other payables 2,117 2,169
Owing to suppliers 6 1,330 719
Tax payable 34 18
Derivative financial instruments 43 43
Provisions 40 47
Other current liabilities 44 35
Total current liabilities 4,731 3,998
Non-current liabilities
Borrowings 5 5,151 5,397
Derivative financial instruments 547 569
Provisions 148 152
Deferred tax liabilities 9 44
Other non-current liabilities 8 11
Total non-current liabilities 5,863 6,173
Total liabilities 10,594 10,171
Net assets 7,248 6,947
EQUITY
Subscribed equity 5,858 5,833
Retained earnings 1,637 1,384
Foreign currency translation reserve (552) (428)
Hedge reserves 192 64
Other reserves 5 6
Total equity attributable to equity holders of the Co-operative 7,140 6,859
Non-controlling interests 108 88
Total equity 7,248 6,947
STATEMENT OF CHANGES IN EQUITYFOR THE YEAR ENDED 31 JULY 2017
ATTRIBUTABLE TO EQUITY HOLDERS OF THE CO-OPERATIVE
GROUP $ MILLIONSUBSCRIBED
EQUITYRETAINED
EARNINGS
FOREIGN CURRENCY
TRANSLATION RESERVE
HEDGE RESERVES
OTHER RESERVES TOTAL
NON-CONTROLLING
INTERESTSTOTAL
EQUITY
As at 1 August 2016 5,833 1,384 (428) 64 6 6,859 88 6,947
Profit after tax – 734 – – – 734 11 745
Other comprehensive income/(expense) – – (124) 128 (1) 3 (5) (2)
Total comprehensive income/(expense) – 734 (124) 128 (1) 737 6 743
Transactions with equity holders in their capacity as equity holders:
Dividend paid to equity holders of the Co-operative – (481) – – – (481) – (481)
Equity instruments issued 25 – – – – 25 42 67
Dividend paid to non-controlling interests – – – – – – (28) (28)
As at 31 July 2017 5,858 1,637 (552) 192 5 7,140 108 7,248
As at 1 August 2015 5,814 1,289 (110) (537) 17 6,473 186 6,659
Profit after tax – 810 – – – 810 24 834
Other comprehensive income/(expense) – 5 (318) 601 (11) 277 (94) 183
Total comprehensive income/(expense) – 815 (318) 601 (11) 1,087 (70) 1,017
Transactions with equity holders in their capacity as equity holders:
Dividend paid to equity holders of the Co-operative – (720) – – – (720) – (720)
Equity instruments issued 19 – – – – 19 – 19
Dividend paid to non-controlling interests – – – – – – (28) (28)
As at 31 July 2016 5,833 1,384 (428) 64 6 6,859 88 6,947
SUMMARY FINANCIAL STATEMENTS | 87 86 | SUMMARY FINANCIAL STATEMENTS
FONTERRA ANNUAL REVIEW 2017 FONTERRA ANNUAL REVIEW 2017

The accompanying notes form part of these summary financial statements.
PERFORMANCE
1 SEGMENT REPORTING
During the year, financial information was viewed by the Fonterra Management Team based on two different management reporting structures. The first, based on operating segments as presented in section (a); and the second, a strategic platform view as presented in section (b).
a) Operating segmentsThe Group has five reportable segments that reflect the Group’s management and reporting structure as viewed by the Fonterra Management Team. Transactions between segments are based on estimated market prices.
REPORTABLE SEGMENT DESCRIPTION
Global Ingredients and Operations
Represents the collection, processing and distribution of New Zealand milk, global sales and marketing of New Zealand and non-New Zealand milk products (including the Quick Service Restaurant businesses in Asia and Greater China), Global Brands and Nutrition, Co-operative Affairs, Fonterra Farm Source™ stores and Group Services.
Oceania Represents fast-moving consumer goods (FMCG) businesses in New Zealand (including export to the Pacific Islands) and all FMCG and ingredients businesses in Australia (including Milk Supply and Manufacturing). It includes foodservice sales in Australia and New Zealand.
Asia Represents FMCG and foodservice businesses (excluding the Quick Service Restaurant business) in Asia (excluding Greater China), Africa and the Middle East.
Greater China Represents FMCG, foodservice (excluding the Quick Service Restaurant business) and farming businesses in Greater China.
Latin America Represents FMCG and ingredients businesses in South America and the Caribbean.
NOTES TO THE SUMMARY FINANCIAL STATEMENTS FOR THE YEAR ENDED 31 JULY 2017
CASH FLOW STATEMENTFOR THE YEAR ENDED 31 JULY 2017
GROUP $ MILLION
31 JULY 2017 31 JULY 2016
Cash flows from operating activities
Profit before net finance costs and tax 1,120 1,431
Adjustments for:
Foreign exchange gains (1) (365)
Depreciation and amortisation 526 570
Other 15 (44)
540 161
Decrease/(increase) in working capital:
Inventories (177) 597
Trade and other receivables (634) 485
Amounts owing to suppliers 745 560
Payables and accruals (100) 171
Other movements (48) (42)
Total (214) 1,771
Cash generated from operations 1,446 3,363
Net taxes paid (70) (85)
Net cash flows from operating activities 1,376 3,278
Cash flows from investing activities
Cash was provided from:
– Proceeds from sale of business operations – 230
– Proceeds from disposal of property, plant and equipment 105 26
– Proceeds from sale of livestock 62 35
– Proceeds from sale of investments in shares – 78
– Other cash inflows 51 26
Cash was applied to:
– Acquisition of property, plant and equipment (690) (859)
– Acquisition of livestock (89) (95)
– Acquisition of intangible assets (103) (85)
– Co-operative support loans – (383)
– Advances to and investments in equity accounted investees (42) (41)
– Other cash outflows – (26)
Net cash flows from investing activities (706) (1,094)
Cash flows from financing activities
Cash was provided from:
– Proceeds from borrowings 4,174 4,909
– Interest received 13 7
– Other cash inflows 38 –
Cash was applied to:
– Interest paid (393) (415)
– Repayment of borrowings (3,968) (5,815)
– Dividends paid to non-controlling interests (28) (28)
– Dividends paid to equity holders of the Co-operative (456) (701)
– Other cash outflows (2) (7)
Net cash flows from financing activities (622) (2,050)
Net increase in cash and cash equivalents 48 134
Cash and cash equivalents at the beginning of the year 357 303
Effect of exchange rate changes on cash balances (23) (80)
Cash and cash equivalents at the end of the year 382 357
Reconciliation of closing cash balances to the statement of financial position:
Cash and cash equivalents 393 369
Bank overdraft (11) (12)
Closing cash balances 382 357
SUMMARY FINANCIAL STATEMENTS | 89 88 | SUMMARY FINANCIAL STATEMENTS
FONTERRA ANNUAL REVIEW 2017 FONTERRA ANNUAL REVIEW 2017
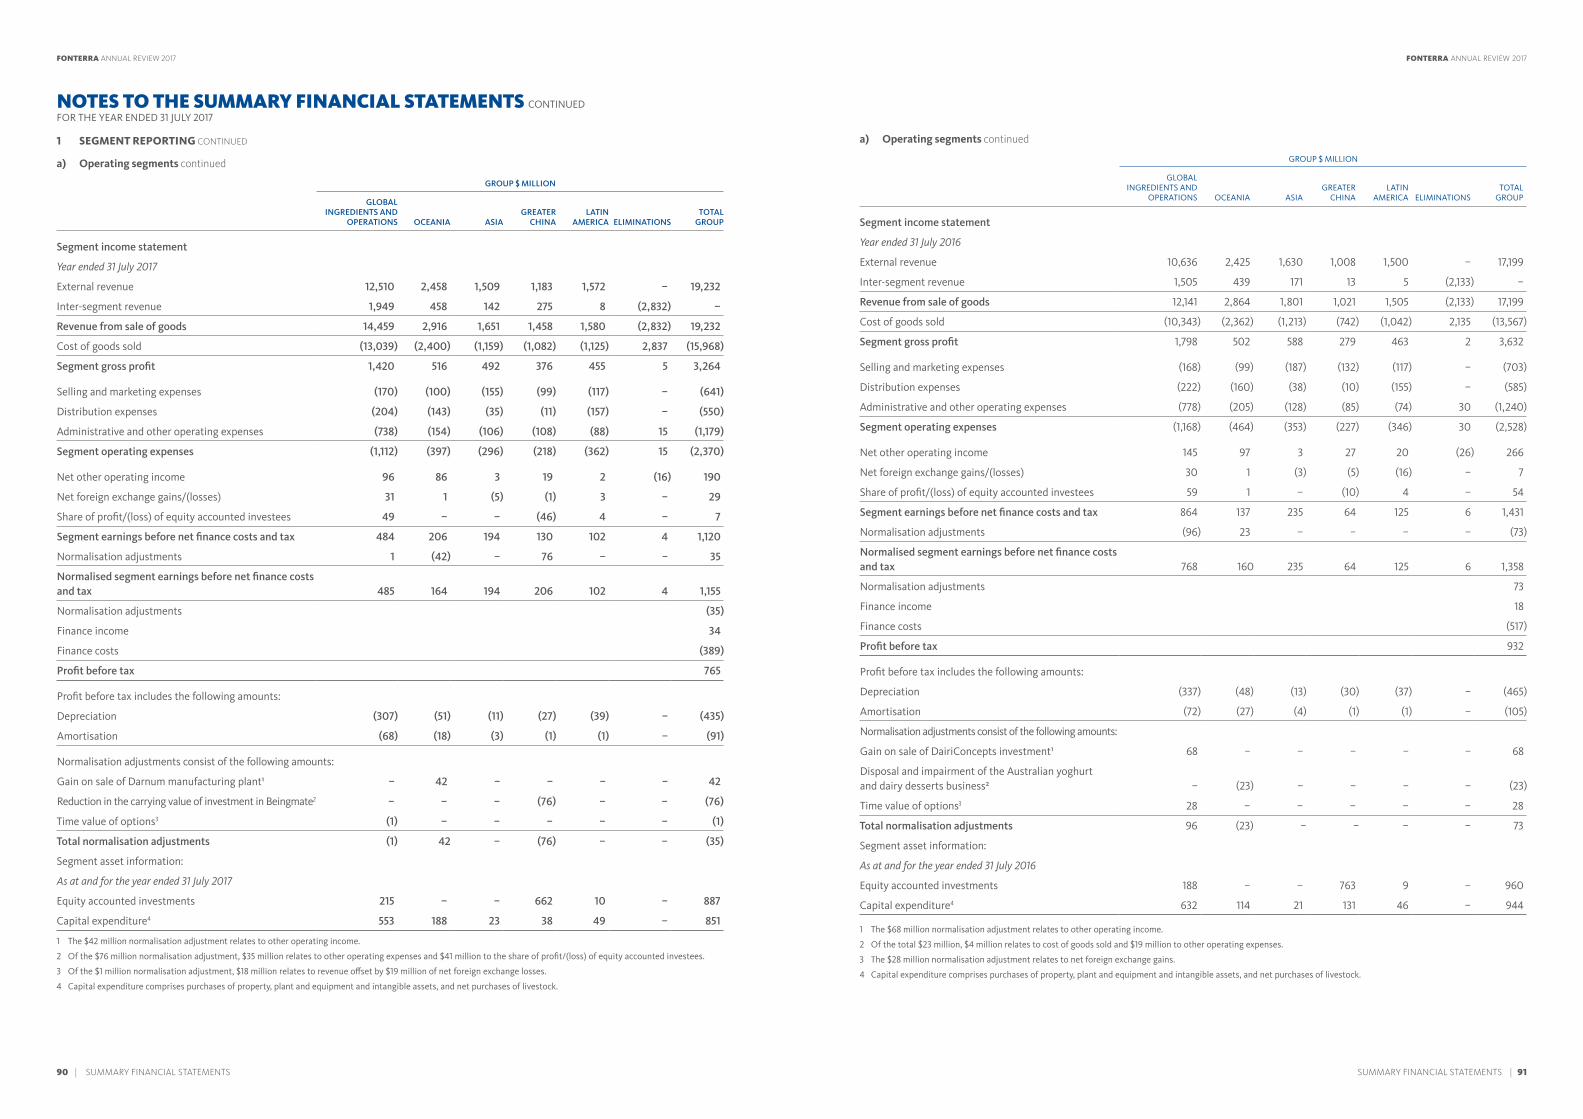
a) Operating segments continued
GROUP $ MILLION
GLOBAL INGREDIENTS AND
OPERATIONS OCEANIA ASIAGREATER
CHINALATIN
AMERICA ELIMINATIONSTOTAL
GROUP
Segment income statement
Year ended 31 July 2017
External revenue 12,510 2,458 1,509 1,183 1,572 – 19,232
Inter-segment revenue 1,949 458 142 275 8 (2,832) –
Revenue from sale of goods 14,459 2,916 1,651 1,458 1,580 (2,832) 19,232
Cost of goods sold (13,039) (2,400) (1,159) (1,082) (1,125) 2,837 (15,968)
Segment gross profit 1,420 516 492 376 455 5 3,264
Selling and marketing expenses (170) (100) (155) (99) (117) – (641)
Distribution expenses (204) (143) (35) (11) (157) – (550)
Administrative and other operating expenses (738) (154) (106) (108) (88) 15 (1,179)
Segment operating expenses (1,112) (397) (296) (218) (362) 15 (2,370)
Net other operating income 96 86 3 19 2 (16) 190
Net foreign exchange gains/(losses) 31 1 (5) (1) 3 – 29
Share of profit/(loss) of equity accounted investees 49 – – (46) 4 – 7
Segment earnings before net finance costs and tax 484 206 194 130 102 4 1,120
Normalisation adjustments 1 (42) – 76 – – 35
Normalised segment earnings before net finance costs and tax 485 164 194 206 102 4 1,155
Normalisation adjustments (35)
Finance income 34
Finance costs (389)
Profit before tax 765
Profit before tax includes the following amounts:
Depreciation (307) (51) (11) (27) (39) – (435)
Amortisation (68) (18) (3) (1) (1) – (91)
Normalisation adjustments consist of the following amounts:
Gain on sale of Darnum manufacturing plant¹ – 42 – – – – 42
Reduction in the carrying value of investment in Beingmate2 – – – (76) – – (76)
Time value of options3 (1) – – – – – (1)
Total normalisation adjustments (1) 42 – (76) – – (35)
Segment asset information:
As at and for the year ended 31 July 2017
Equity accounted investments 215 – – 662 10 – 887
Capital expenditure4 553 188 23 38 49 – 851
1 The $42 million normalisation adjustment relates to other operating income.
2 Of the $76 million normalisation adjustment, $35 million relates to other operating expenses and $41 million to the share of profit/(loss) of equity accounted investees.
3 Of the $1 million normalisation adjustment, $18 million relates to revenue offset by $19 million of net foreign exchange losses.
4 Capital expenditure comprises purchases of property, plant and equipment and intangible assets, and net purchases of livestock.
NOTES TO THE SUMMARY FINANCIAL STATEMENTS CONTINUEDFOR THE YEAR ENDED 31 JULY 2017
a) Operating segments continued
GROUP $ MILLION
GLOBAL INGREDIENTS AND
OPERATIONS OCEANIA ASIAGREATER
CHINALATIN
AMERICA ELIMINATIONSTOTAL
GROUP
Segment income statement
Year ended 31 July 2016
External revenue 10,636 2,425 1,630 1,008 1,500 – 17,199
Inter-segment revenue 1,505 439 171 13 5 (2,133) –
Revenue from sale of goods 12,141 2,864 1,801 1,021 1,505 (2,133) 17,199
Cost of goods sold (10,343) (2,362) (1,213) (742) (1,042) 2,135 (13,567)
Segment gross profit 1,798 502 588 279 463 2 3,632
Selling and marketing expenses (168) (99) (187) (132) (117) – (703)
Distribution expenses (222) (160) (38) (10) (155) – (585)
Administrative and other operating expenses (778) (205) (128) (85) (74) 30 (1,240)
Segment operating expenses (1,168) (464) (353) (227) (346) 30 (2,528)
Net other operating income 145 97 3 27 20 (26) 266
Net foreign exchange gains/(losses) 30 1 (3) (5) (16) – 7
Share of profit/(loss) of equity accounted investees 59 1 – (10) 4 – 54
Segment earnings before net finance costs and tax 864 137 235 64 125 6 1,431
Normalisation adjustments (96) 23 – – – – (73)
Normalised segment earnings before net finance costs and tax 768 160 235 64 125 6 1,358
Normalisation adjustments 73
Finance income 18
Finance costs (517)
Profit before tax 932
Profit before tax includes the following amounts:
Depreciation (337) (48) (13) (30) (37) – (465)
Amortisation (72) (27) (4) (1) (1) – (105)
Normalisation adjustments consist of the following amounts:
Gain on sale of DairiConcepts investment¹ 68 – – – – – 68
Disposal and impairment of the Australian yoghurt and dairy desserts business² – (23) – – – – (23)
Time value of options3 28 – – – – – 28
Total normalisation adjustments 96 (23) – – – – 73
Segment asset information:
As at and for the year ended 31 July 2016
Equity accounted investments 188 – – 763 9 – 960
Capital expenditure4 632 114 21 131 46 – 944
1 The $68 million normalisation adjustment relates to other operating income.
2 Of the total $23 million, $4 million relates to cost of goods sold and $19 million to other operating expenses.
3 The $28 million normalisation adjustment relates to net foreign exchange gains.
4 Capital expenditure comprises purchases of property, plant and equipment and intangible assets, and net purchases of livestock.
1 SEGMENT REPORTING CONTINUED
SUMMARY FINANCIAL STATEMENTS | 91 90 | SUMMARY FINANCIAL STATEMENTS
FONTERRA ANNUAL REVIEW 2017 FONTERRA ANNUAL REVIEW 2017
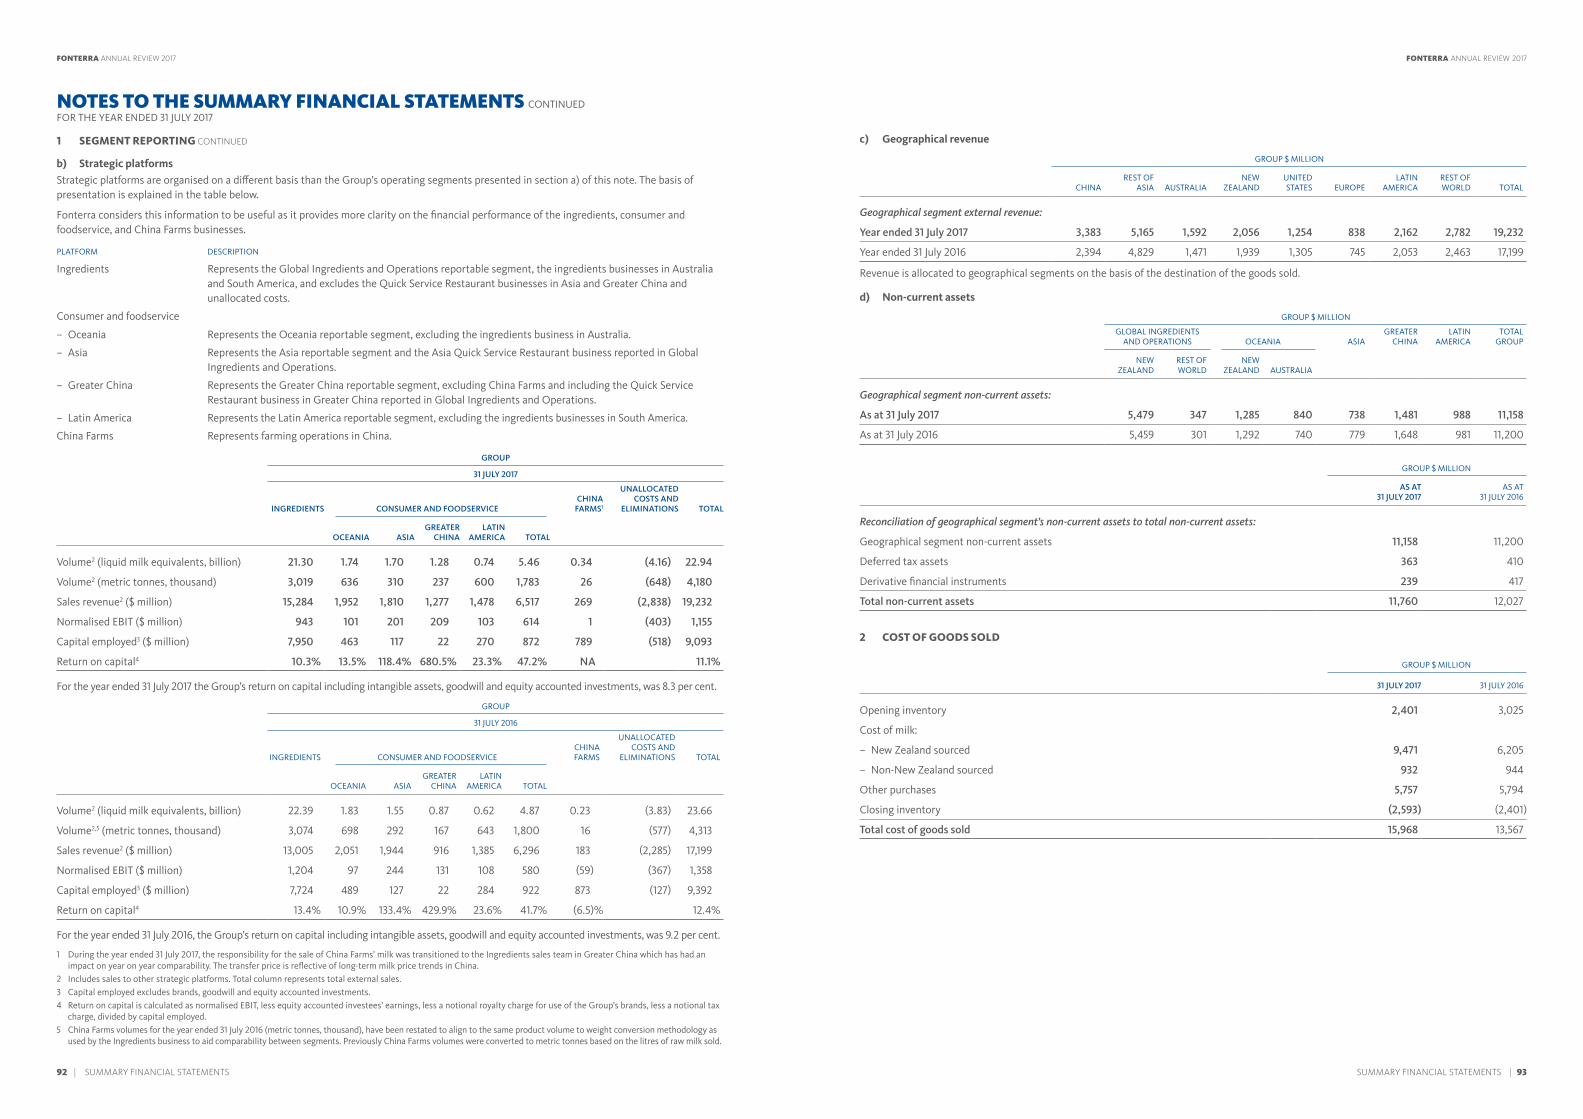
b) Strategic platformsStrategic platforms are organised on a different basis than the Group’s operating segments presented in section a) of this note. The basis of presentation is explained in the table below.
Fonterra considers this information to be useful as it provides more clarity on the financial performance of the ingredients, consumer and foodservice, and China Farms businesses.
PLATFORM DESCRIPTION
Ingredients Represents the Global Ingredients and Operations reportable segment, the ingredients businesses in Australia and South America, and excludes the Quick Service Restaurant businesses in Asia and Greater China and unallocated costs.
Consumer and foodservice
– Oceania Represents the Oceania reportable segment, excluding the ingredients business in Australia.
– Asia Represents the Asia reportable segment and the Asia Quick Service Restaurant business reported in Global Ingredients and Operations.
– Greater China Represents the Greater China reportable segment, excluding China Farms and including the Quick Service Restaurant business in Greater China reported in Global Ingredients and Operations.
– Latin America Represents the Latin America reportable segment, excluding the ingredients businesses in South America.
China Farms Represents farming operations in China.
GROUP
31 JULY 2017
INGREDIENTS CONSUMER AND FOODSERVICECHINA
FARMS1
UNALLOCATED COSTS AND
ELIMINATIONS TOTAL
OCEANIA ASIAGREATER
CHINALATIN
AMERICA TOTAL
Volume2 (liquid milk equivalents, billion) 21.30 1.74 1.70 1.28 0.74 5.46 0.34 (4.16) 22.94
Volume2 (metric tonnes, thousand) 3,019 636 310 237 600 1,783 26 (648) 4,180
Sales revenue2 ($ million) 15,284 1,952 1,810 1,277 1,478 6,517 269 (2,838) 19,232
Normalised EBIT ($ million) 943 101 201 209 103 614 1 (403) 1,155
Capital employed3 ($ million) 7,950 463 117 22 270 872 789 (518) 9,093
Return on capital4 10.3% 13.5% 118.4% 680.5% 23.3% 47.2% NA 11.1%
For the year ended 31 July 2017 the Group’s return on capital including intangible assets, goodwill and equity accounted investments, was 8.3 per cent.
GROUP
31 JULY 2016
INGREDIENTS CONSUMER AND FOODSERVICECHINA FARMS
UNALLOCATED COSTS AND
ELIMINATIONS TOTAL
OCEANIA ASIAGREATER
CHINALATIN
AMERICA TOTAL
Volume2 (liquid milk equivalents, billion) 22.39 1.83 1.55 0.87 0.62 4.87 0.23 (3.83) 23.66
Volume2,5 (metric tonnes, thousand) 3,074 698 292 167 643 1,800 16 (577) 4,313
Sales revenue2 ($ million) 13,005 2,051 1,944 916 1,385 6,296 183 (2,285) 17,199
Normalised EBIT ($ million) 1,204 97 244 131 108 580 (59) (367) 1,358
Capital employed3 ($ million) 7,724 489 127 22 284 922 873 (127) 9,392
Return on capital4 13.4% 10.9% 133.4% 429.9% 23.6% 41.7% (6.5)% 12.4%
For the year ended 31 July 2016, the Group’s return on capital including intangible assets, goodwill and equity accounted investments, was 9.2 per cent.
1 During the year ended 31 July 2017, the responsibility for the sale of China Farms’ milk was transitioned to the Ingredients sales team in Greater China which has had an impact on year on year comparability. The transfer price is reflective of long-term milk price trends in China.
2 Includes sales to other strategic platforms. Total column represents total external sales.3 Capital employed excludes brands, goodwill and equity accounted investments.4 Return on capital is calculated as normalised EBIT, less equity accounted investees’ earnings, less a notional royalty charge for use of the Group’s brands, less a notional tax
charge, divided by capital employed.5 China Farms volumes for the year ended 31 July 2016 (metric tonnes, thousand), have been restated to align to the same product volume to weight conversion methodology as
used by the Ingredients business to aid comparability between segments. Previously China Farms volumes were converted to metric tonnes based on the litres of raw milk sold.
NOTES TO THE SUMMARY FINANCIAL STATEMENTS CONTINUEDFOR THE YEAR ENDED 31 JULY 2017
c) Geographical revenue
GROUP $ MILLION
CHINAREST OF
ASIA AUSTRALIANEW
ZEALANDUNITED STATES EUROPE
LATIN AMERICA
REST OF WORLD TOTAL
Geographical segment external revenue:
Year ended 31 July 2017 3,383 5,165 1,592 2,056 1,254 838 2,162 2,782 19,232
Year ended 31 July 2016 2,394 4,829 1,471 1,939 1,305 745 2,053 2,463 17,199
Revenue is allocated to geographical segments on the basis of the destination of the goods sold.
d) Non-current assets
GROUP $ MILLION
GLOBAL INGREDIENTS AND OPERATIONS OCEANIA ASIA
GREATER CHINA
LATIN AMERICA
TOTAL GROUP
NEW ZEALAND
REST OF WORLD
NEW ZEALAND AUSTRALIA
Geographical segment non-current assets:
As at 31 July 2017 5,479 347 1,285 840 738 1,481 988 11,158
As at 31 July 2016 5,459 301 1,292 740 779 1,648 981 11,200
GROUP $ MILLION
AS AT31 JULY 2017
AS AT31 JULY 2016
Reconciliation of geographical segment’s non-current assets to total non-current assets:
Geographical segment non-current assets 11,158 11,200
Deferred tax assets 363 410
Derivative financial instruments 239 417
Total non-current assets 11,760 12,027
2 COST OF GOODS SOLD
GROUP $ MILLION
31 JULY 2017 31 JULY 2016
Opening inventory 2,401 3,025
Cost of milk:
– New Zealand sourced 9,471 6,205
– Non-New Zealand sourced 932 944
Other purchases 5,757 5,794
Closing inventory (2,593) (2,401)
Total cost of goods sold 15,968 13,567
1 SEGMENT REPORTING CONTINUED
SUMMARY FINANCIAL STATEMENTS | 93 92 | SUMMARY FINANCIAL STATEMENTS
FONTERRA ANNUAL REVIEW 2017 FONTERRA ANNUAL REVIEW 2017

DEBT AND EQUITY
3 SUBSCRIBED EQUITY INSTRUMENTS
Co-operative shares, including shares held within the GroupCo-operative shares may only be held by a shareholder supplying milk to the Company (farmer shareholder), by former farmer shareholders for up to three seasons after cessation of milk supply, or by Fonterra Farmer Custodian Limited (the Custodian). Voting rights in the Company are dependent on milk supply supported by Co-operative shares.¹
CO-OPERATIVE SHARES (THOUSANDS)
Balance at 1 August 2016 1,602,703
Shares issued under the dividend reinvestment plan² 4,230
Shares surrendered –
Balance at 31 July 2017 1,606,933
Balance at 1 August 2015 1,599,094
Shares issued under the dividend reinvestment plan² 3,609
Shares surrendered –
Balance at 31 July 2016 1,602,703
1 These rights are also attached to vouchers when backed by milk supply (subject to limits).
2 Total value of $25 million (31 July 2016:$19 million).
The rights attaching to Co-operative shares are set out in Fonterra’s Constitution, available in the ‘About Us/Our Governance’ section of Fonterra’s website.
Units in the Fonterra Shareholders’ Fund The Custodian holds legal title of Co-operative shares of which the Economic Rights have been sold to the Fund on trust for the benefit of the Fund. At 31 July 2017, 126,047,304 Co-operative shares (31 July 2016: 111,991,937) were legally owned by the Custodian, on trust for the benefit of the Fund.
UNITS (THOUSANDS)
Balance at 1 August 2016 111,992
Units issued 29,933
Units surrendered (15,878)
Balance at 31 July 2017 126,047
Balance at 1 August 2015 105,480
Units issued 27,137
Units surrendered (20,625)
Balance at 31 July 2016 111,992
The rights attaching to units are set out in the Trust Deed constituting the Fonterra Shareholders’ Fund, available in the ‘Our Financials/Fonterra Shareholder’s Fund’ section of Fonterra’s website.
Capital management and structureThe Board’s objective is to maximise equity holder returns over time by maintaining an optimal capital structure. Trading Among Farmers (TAF) allows shares in Fonterra to be traded between shareholders, on the Fonterra Shareholders’ Market (a private market operated by NZX Limited). The Fund supports this by allowing investors, including farmers, to trade in units backed by Economic Rights in Fonterra. The Fund also allows farmer shareholders to acquire units and exchange them for shares in Fonterra, and to exchange shares for units and dispose of those units on the NZX or ASX.
The Group provides returns to farmer shareholders through a milk price, and to equity holders through dividends and changes in the Company’s share price.
The Fund is subject to the issue and redemption of units at the discretion of Fonterra and Fonterra’s farmer shareholders. Fonterra has an interest in ensuring the stability of the Fund and has established a Fund Size Risk Management Policy, which requires that the number of units on issue remain within specified limits and that within these limits, the number of units is managed appropriately. Fonterra may use a range of measures to ensure the Fund size remains within the specified limits, including introducing or cancelling a dividend reinvestment plan, operating a unit and/or share repurchase programme and issuing new shares.
NOTES TO THE SUMMARY FINANCIAL STATEMENTS CONTINUEDFOR THE YEAR ENDED 31 JULY 2017
4 DIVIDENDS PAID
The Dividend Reinvestment Plan applied to all dividends in the table below.$ MILLION
DIVIDENDSYEAR ENDED
31 JULY 2017YEAR ENDED
31 JULY 2016
2017 Interim dividend – 20 cents per share¹ 321 –
2016 Final dividend – 10 cents per share² 160 –
2016 Interim dividend – 10 cents per share³ – 160
2016 Interim dividend – 20 cents per share⁴ – 320
2015 Final dividend – 15 cents per share⁵ – 2401 Declared on 21 March 2017 and paid on 20 April 2017 to all Co-operative shares on issue at 5 April 2017. 2 Declared on 18 August 2016 and paid on 9 September 2016 to all Co-operative shares on issue at 1 September 2016.3 Declared on 16 May 2016 and paid on 7 June 2016 to all Co-operative shares on issue at 30 May 2016. 4 Declared on 22 March 2016 and paid on 20 April 2016 to all Co-operative shares on issue at 8 April 2016. 5 Declared on 23 September 2015 and paid on 20 October 2015 to all Co-operative shares on issue at 8 October 2015.
Dividends declared after balance dateOn 23 September 2017, the Board declared a final dividend of 20 cents per share, to be paid on 20 October 2017 to all Co-operative shares on issue as at 9 October 2017.
Fonterra has a Dividend Reinvestment Plan, where eligible shareholders can choose to reinvest all or part of their dividend in additional Co-operative shares. The Dividend Reinvestment Plan does apply to this dividend. Participation in the Dividend Reinvestment Plan requires shareholders to submit an election notice for participation by 9 October 2017. Full details of the Dividend Reinvestment Plan are available in the ‘Our Dividends’ section of Fonterra’s website.
5 BORROWINGS
Economic net interest-bearing debtEconomic net interest-bearing debt reflects the effect of debt hedging in place at balance date.
GROUP $ MILLION
AS AT 31 JULY 2017
AS AT 31 JULY 2016
Net interest-bearing debt position
Total borrowings 6,263 6,352
Cash and cash equivalents (393) (369)
Interest-bearing advances1 (435) (464)
Bank overdraft 11 12
Net interest-bearing debt 5,446 5,531
Value of derivatives used to manage changes in hedged risks on debt instruments 155 (58)
Economic net interest-bearing debt 5,601 5,473
1 Includes $135 million of Fonterra Co-operative Support Loan repayments relating to the 2016/17 season (31 July 2016: nil).
SUMMARY FINANCIAL STATEMENTS | 95 94 | SUMMARY FINANCIAL STATEMENTS
FONTERRA ANNUAL REVIEW 2017 FONTERRA ANNUAL REVIEW 2017
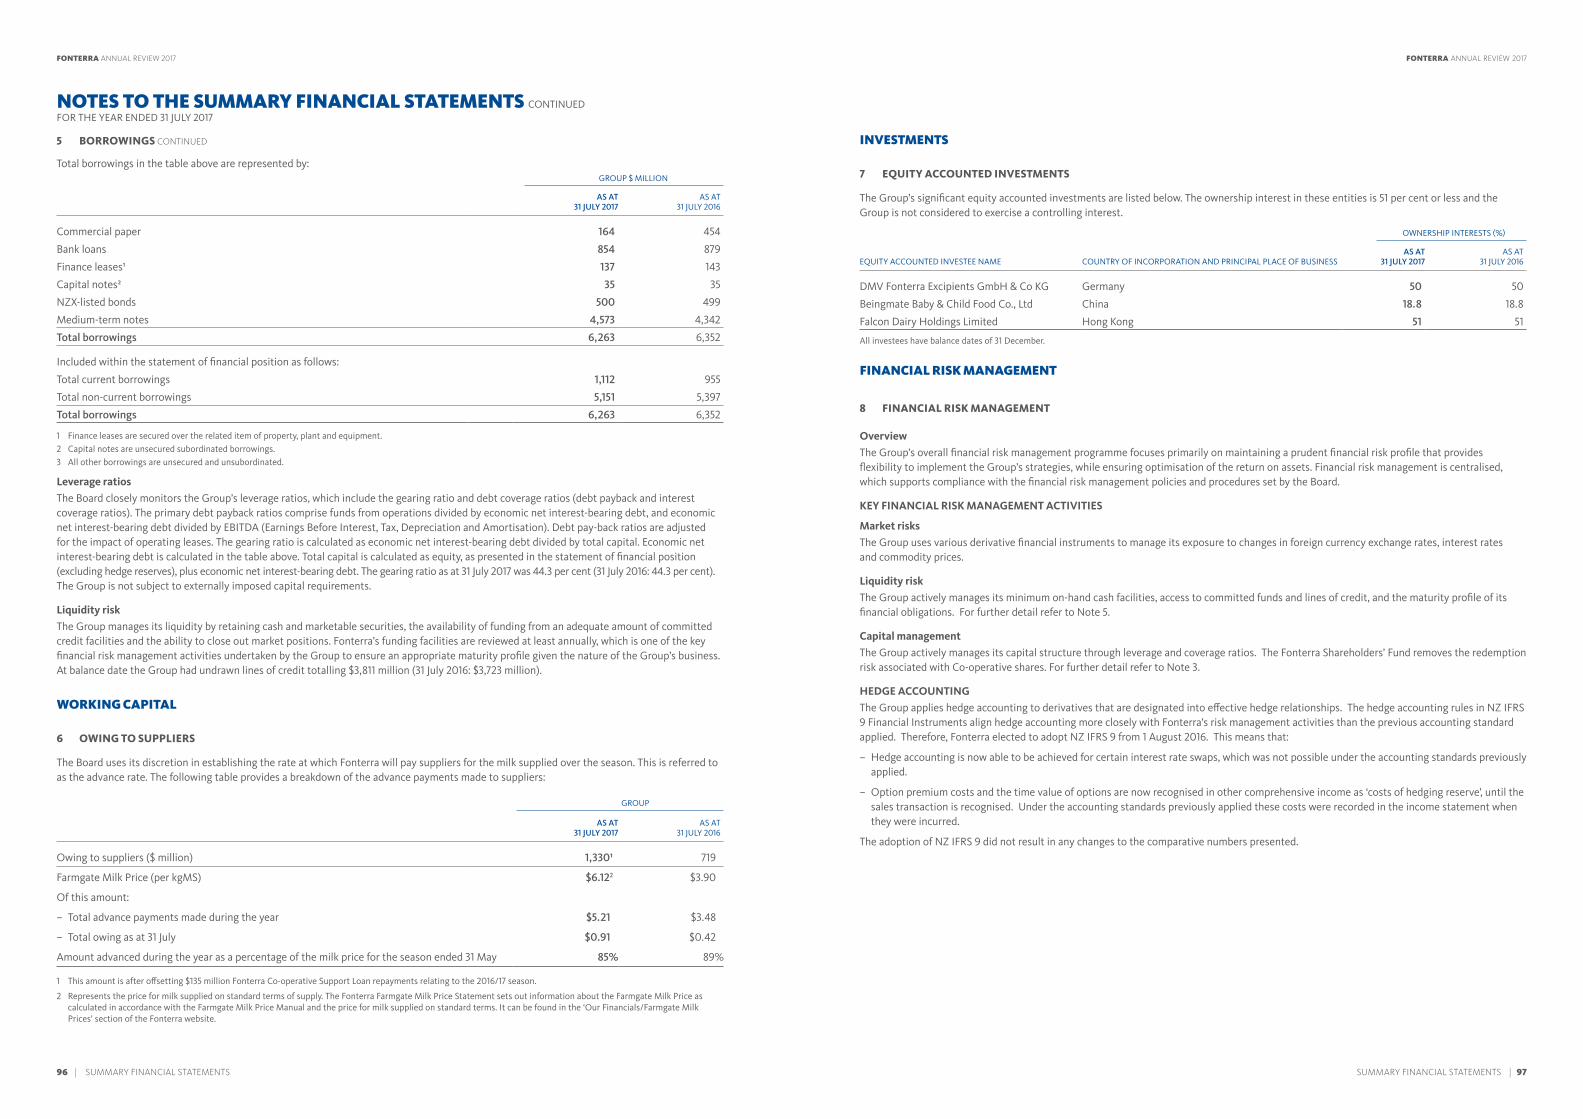
Total borrowings in the table above are represented by:GROUP $ MILLION
AS AT 31 JULY 2017
AS AT 31 JULY 2016
Commercial paper 164 454
Bank loans 854 879
Finance leases¹ 137 143
Capital notes² 35 35
NZX-listed bonds 500 499
Medium-term notes 4,573 4,342
Total borrowings 6,263 6,352
Included within the statement of financial position as follows:
Total current borrowings 1,112 955
Total non-current borrowings 5,151 5,397
Total borrowings 6,263 6,352
1 Finance leases are secured over the related item of property, plant and equipment.2 Capital notes are unsecured subordinated borrowings. 3 All other borrowings are unsecured and unsubordinated.
Leverage ratiosThe Board closely monitors the Group’s leverage ratios, which include the gearing ratio and debt coverage ratios (debt payback and interest coverage ratios). The primary debt payback ratios comprise funds from operations divided by economic net interest-bearing debt, and economic net interest-bearing debt divided by EBITDA (Earnings Before Interest, Tax, Depreciation and Amortisation). Debt pay-back ratios are adjusted for the impact of operating leases. The gearing ratio is calculated as economic net interest-bearing debt divided by total capital. Economic net interest-bearing debt is calculated in the table above. Total capital is calculated as equity, as presented in the statement of financial position (excluding hedge reserves), plus economic net interest-bearing debt. The gearing ratio as at 31 July 2017 was 44.3 per cent (31 July 2016: 44.3 per cent). The Group is not subject to externally imposed capital requirements.
Liquidity riskThe Group manages its liquidity by retaining cash and marketable securities, the availability of funding from an adequate amount of committed credit facilities and the ability to close out market positions. Fonterra’s funding facilities are reviewed at least annually, which is one of the key financial risk management activities undertaken by the Group to ensure an appropriate maturity profile given the nature of the Group’s business. At balance date the Group had undrawn lines of credit totalling $3,811 million (31 July 2016: $3,723 million).
WORKING CAPITAL
6 OWING TO SUPPLIERS
The Board uses its discretion in establishing the rate at which Fonterra will pay suppliers for the milk supplied over the season. This is referred to as the advance rate. The following table provides a breakdown of the advance payments made to suppliers:
GROUP
AS AT 31 JULY 2017
AS AT 31 JULY 2016
Owing to suppliers ($ million) 1,330¹ 719
Farmgate Milk Price (per kgMS) $6.122 $3.90
Of this amount:
– Total advance payments made during the year $5.21 $3.48
– Total owing as at 31 July $0.91 $0.42
Amount advanced during the year as a percentage of the milk price for the season ended 31 May 85% 89%
1 This amount is after offsetting $135 million Fonterra Co-operative Support Loan repayments relating to the 2016/17 season.
2 Represents the price for milk supplied on standard terms of supply. The Fonterra Farmgate Milk Price Statement sets out information about the Farmgate Milk Price as calculated in accordance with the Farmgate Milk Price Manual and the price for milk supplied on standard terms. It can be found in the ‘Our Financials/Farmgate Milk Prices’ section of the Fonterra website.
NOTES TO THE SUMMARY FINANCIAL STATEMENTS CONTINUEDFOR THE YEAR ENDED 31 JULY 2017
INVESTMENTS
7 EQUITY ACCOUNTED INVESTMENTS
The Group’s significant equity accounted investments are listed below. The ownership interest in these entities is 51 per cent or less and the Group is not considered to exercise a controlling interest.
OWNERSHIP INTERESTS (%)
EQUITY ACCOUNTED INVESTEE NAME COUNTRY OF INCORPORATION AND PRINCIPAL PLACE OF BUSINESSAS AT
31 JULY 2017AS AT
31 JULY 2016
DMV Fonterra Excipients GmbH & Co KG Germany 50 50
Beingmate Baby & Child Food Co., Ltd China 18.8 18.8
Falcon Dairy Holdings Limited Hong Kong 51 51
All investees have balance dates of 31 December.
FINANCIAL RISK MANAGEMENT
8 FINANCIAL RISK MANAGEMENT
OverviewThe Group’s overall financial risk management programme focuses primarily on maintaining a prudent financial risk profile that provides flexibility to implement the Group’s strategies, while ensuring optimisation of the return on assets. Financial risk management is centralised, which supports compliance with the financial risk management policies and procedures set by the Board.
KEY FINANCIAL RISK MANAGEMENT ACTIVITIES
Market risksThe Group uses various derivative financial instruments to manage its exposure to changes in foreign currency exchange rates, interest rates and commodity prices.
Liquidity riskThe Group actively manages its minimum on-hand cash facilities, access to committed funds and lines of credit, and the maturity profile of its financial obligations. For further detail refer to Note 5.
Capital managementThe Group actively manages its capital structure through leverage and coverage ratios. The Fonterra Shareholders’ Fund removes the redemption risk associated with Co-operative shares. For further detail refer to Note 3.
HEDGE ACCOUNTINGThe Group applies hedge accounting to derivatives that are designated into effective hedge relationships. The hedge accounting rules in NZ IFRS 9 Financial Instruments align hedge accounting more closely with Fonterra’s risk management activities than the previous accounting standard applied. Therefore, Fonterra elected to adopt NZ IFRS 9 from 1 August 2016. This means that:
– Hedge accounting is now able to be achieved for certain interest rate swaps, which was not possible under the accounting standards previously applied.
– Option premium costs and the time value of options are now recognised in other comprehensive income as ‘costs of hedging reserve’, until the sales transaction is recognised. Under the accounting standards previously applied these costs were recorded in the income statement when they were incurred.
The adoption of NZ IFRS 9 did not result in any changes to the comparative numbers presented.
5 BORROWINGS CONTINUED
SUMMARY FINANCIAL STATEMENTS | 97 96 | SUMMARY FINANCIAL STATEMENTS
FONTERRA ANNUAL REVIEW 2017 FONTERRA ANNUAL REVIEW 2017

OTHER
9 TAXATION
Taxation – income statementThe total taxation expense in the income statement is summarised as follows:
GROUP $ MILLION
31 JULY 2017 31 JULY 2016
Current tax expense 97 108
Prior period adjustments to current tax (25) 5
Deferred tax movements:
– Origination and reversal of temporary differences (52) (15)
Tax expense 20 98
The taxation charge that would arise at the standard rate of corporation tax in New Zealand is reconciled to the tax expense as follows:
GROUP $ MILLION
31 JULY 2017 31 JULY 2016
Profit before tax 765 932
Prima facie tax expense at 28% 214 261
Add/(deduct) tax effect of:
– Effect of tax rates in foreign jurisdictions (33) (24)
– Non-deductible expenses/additional assessable income 54 90
– Non-assessable income/additional deductible expenses (30) (66)
– Prior year under provision (25) 5
Tax expense before distributions and deferred tax 180 266
Effective tax rate before distributions and deferred tax¹ 23.5% 28.5%
Tax effect of distributions to farmer shareholders (163) (170)
Tax expense before deferred tax 17 96
Effective tax rate before deferred tax¹ 2.2% 10.3%
Add/(deduct) tax effect of:
– Origination and reversal of other temporary differences 2 (1)
– Losses of overseas Group entities not recognised 1 3
Tax expense 20 98
Effective tax rate1 2.6% 10.5%
Imputation credits
Imputation credits available for use in subsequent reporting periods 20 20
Tax losses
Gross tax losses available for which no deferred tax asset has been recognised 52 48
1 The effective tax rate is the tax charge on the face of the income statement expressed as a percentage of the profit before tax.
NOTES TO THE SUMMARY FINANCIAL STATEMENTS CONTINUEDFOR THE YEAR ENDED 31 JULY 2017
10 CONTINGENT LIABILITIES, PROVISIONS AND COMMITMENTS
Contingent liabilitiesIn the normal course of business, Fonterra, its subsidiaries and equity accounted investees, are exposed to claims and legal proceedings that may in some cases result in costs to the Group.
In early August 2013, Fonterra publicly announced a potential food safety issue with three batches of Whey Protein Concentrate (WPC80) produced at the Hautapu manufacturing site and initiated a precautionary product recall.
In late August 2013, the New Zealand Government confirmed that the Clostridium samples found in WPC80 were not Clostridium botulinum and were not toxigenic, meaning the consumers of products containing the relevant batches of WPC80 were never in danger from Clostridium botulinum.
In January 2014, Danone formally initiated legal proceedings against Fonterra in the High Court of New Zealand and separate Singapore arbitration proceedings against Fonterra in relation to the WPC80 precautionary recall. The New Zealand High Court proceedings have been stayed pending completion of the Singapore arbitration. An initial hearing of the arbitration took place in February 2016 and a final hearing of the arbitration took place in June 2016. A decision of the arbitration panel is pending.
Based on current information available and the claims made to date in both proceedings, Fonterra will vigorously defend its position in these proceedings. Uncertainty exists regarding the outcome of the proceedings. Fonterra has provided $11 million (31 July 2016: $11 million) in respect of the Danone claims, which represents the maximum contractual liability to Danone.
The Directors believe that these proceedings have been adequately provided for and disclosed by the Group and that there are no additional claims or legal proceedings in respect of this matter that are pending at the date of these financial statements that require provision or disclosure.
The Group has no other contingent liabilities as at 31 July 2017 (31 July 2016: nil).
11 NET TANGIBLE ASSETS PER SECURITY
GROUP
AS AT 31 JULY 2017
AS AT 31 JULY 2016
Net tangible assets per security¹
$ per listed debt security on issue 6.86 6.32
$ per equity instrument on issue 2.57 2.37
Listed debt securities on issue (million) 603 603
Equity instruments on issue (million) 1,607 1,603
1 Net tangible assets represents total assets less total liabilities less intangible assets.
SUMMARY FINANCIAL STATEMENTS | 99 98 | SUMMARY FINANCIAL STATEMENTS
FONTERRA ANNUAL REVIEW 2017 FONTERRA ANNUAL REVIEW 2017

100 | INDEPENDENT AUDITORS’ REPORT
REPORT OF THE INDEPENDENT AUDITOR ON THE SUMMARY FINANCIAL STATEMENTS
TO THE SHAREHOLDERS OF FONTERRA CO-OPERATIVE GROUP LIMITED
The summary financial statements comprise:
• the statement of financial position as at 31 July 2017;
• the income statement for the year then ended;
• the statement of comprehensive income for the year then ended;
• the statement of changes in equity for the year then ended;
• the cash flow statement for the year then ended; and
• the notes to the summary financial statements.
OUR OPINION
The summary financial statements are derived from the audited financial statements of Fonterra Co-operative Group Limited, including its controlled entities (the Group) for the year ended 31 July 2017.
In our opinion, the accompanying summary financial statements are consistent, in all material respects, with the audited financial statements, in accordance with FRS-43: Summary Financial Statements issued by the New Zealand Accounting Standards Board.
SUMMARY FINANCIAL STATEMENTS
The summary financial statements do not contain all the disclosures required by New Zealand equivalents to International Financial Reporting Standards (NZ IFRS). Reading the summary financial statements and the auditor’s report thereon, therefore, is not a substitute for reading the audited financial statements and the auditor’s report thereon. The summary financial statements and the audited financial statements do not reflect the effects of events that occurred subsequent to the date of our report on the audited financial statements.
THE AUDITED FINANCIAL STATEMENTS AND OUR REPORT THEREON
We expressed an unmodified audit opinion on the audited financial statements in our report dated 23 September 2017.
That report also includes the communication of key audit matters. Key audit matters are those matters that, in our professional judgement, were of most significance in our audit of the financial statements of the current year.
RESPONSIBILITIES OF THE DIRECTORS FOR THE SUMMARY FINANCIAL STATEMENTS
The Directors are responsible, on behalf of the Company, for the preparation of the summary financial statements in accordance with FRS-43: Summary Financial Statements.
AUDITOR’S RESPONSIBILITY
Our responsibility is to express an opinion on whether the summary financial statements are consistent, in all material respects, with the audited financial statements based on our procedures, which were conducted in accordance with International Standard on Auditing (New Zealand) 810 (Revised), Engagements to Report on Summary Financial Statements.
Our firm carries out other services for the Group in relation to advisory, other assurance and attestation services. Partners and employees of our firm may deal with the Group on normal terms within the ordinary course of trading activities of the Group. These matters have not impaired our independence as auditor of the Group.
WHO WE REPORT TO
This report is made solely to the Company’s shareholders, as a body. Our audit work has been undertaken so that we might state those matters which we are required to state to them in an auditor’s report and for no other purpose. To the fullest extent permitted by law, we do not accept or assume responsibility to anyone other than the Company and the Company’s shareholders, as a body, for our audit work, for this report or for the opinions we have formed.
Chartered AccountantsAuckland 23 September 2017
INDEPENDENT AUDITOR’S REPORT FOR THE YEAR ENDED 31 JULY 2017
STATUTORY INFORMATION | 101
STATUTORY INFORMATION FOR THE YEAR ENDED 31 JULY 2017
CURRENT CREDIT RATING STATUS
Standard & Poor’s long term rating for Fonterra is A- with a rating outlook of stable. Fitch’s long and short term default rating is A with a rating outlook of stable. Retail Bonds have been rated the same as the Company’s long term rating by both Standard & Poor’s and Fitch. Capital Notes which are subordinate to other Fonterra debt issued are rated BBB+ by Standard & Poor’s and A- by Fitch.
EXCHANGE RULINGS AND WAIVERS
NZX Limited (NZX) has ruled that Capital Notes do not constitute ‘equity securities’ under the NZX Main Board/Debt Market Listing Rules (‘Rules’). This means that where Capital Notes are quoted on NZX’s Debt Market (‘NZDX’), the Company is not required to comply with certain Rules which apply to an issuer of quoted equity securities.
The Company was issued with a waiver of Rule 11.1.1 to enable it to decline to accept or register transfers of Capital Notes (NZDX listed debt securities FCGHA) if such transfer would result in the transferor holding or continuing to hold Capital Notes with a face value or principal amount of less than $5,000 or if such transfer is for an amount of less than $1,000 or not a multiple thereof. The effect of this waiver is that the minimum holding amount in respect of the Capital Notes will at all times be $5,000 in aggregate and can only be transferred in multiples of $1,000.
The Company was issued with a waiver of Rule 5.2.3 by NZX on 10 April 2015 (for a period of one year from 21 April 2015) in respect of the Company’s issuance of $350 million of unsecured, unsubordinated, fixed rate bonds maturing on 20 October 2021 (‘FCG030 Bonds’), to the extent that that rule would otherwise require the FCG030 Bonds to be held by at least 500 members of the public holding at least 25% of the FCG030 Bonds.
The Company was also issued with a waiver of Rule 5.2.3, as modified by NZX’s ruling on Rule 5.2.3, by NZX on 18 February 2016 (for a period of six months from 8 March 2016) in respect of the Company’s issuance of $150 million of unsecured, unsubordinated, fixed rate bonds maturing on 7 March 2023 (‘FCG040 Bonds’), to the extent that the rule (as modified) would otherwise require the FCG040 Bonds to be held by at least 100 members of the public holding at least 25% of the FCG040 Bonds.
The effect of these waivers from Rule 5.2.3 is that the FCG030 Bonds and the FCG040 Bonds may not be widely held and there may be reduced liquidity in those bonds.
The Company was issued with a waiver of Rule 7.11.1 by NZX on 18 February 2016 in respect of the Company’s issuance of the FCG040 Bonds, to the extent that the rule would have otherwise required the Company to allot the FCG040 Bonds within five business days after the latest date on which applications for the FCG040 Bonds closed.
Fonterra Co-operative Group Limited (Fonterra) was issued with a ruling in respect of Rule 1.7.1(d) of the Fonterra Shareholders’ Market Rules (Rules) on 27 June 2017 by NZX Limited (NZX). The effect of this ruling was to not preclude the appointment of Mr Bruce Hassall to the position of an independent director of Fonterra by virtue of a child of Mr Hassall being employed in a non-decision making and non-senior role at Fonterra.
Fonterra was issued with a ruling in respect of Rule 5.1.2(c) on 22 November 2016 by NZX. The effect of this ruling is that Fonterra’s internal governance resolutions are considered to be matters that do not require the NZX to approve a notice of meeting under Rule 5.1.1.
Fonterra was issued with a waiver of Rule 3.2.1(c) on 31 August 2016 by the NZX, to the extent that such Rule requires Fonterra to have a minimum of two independent directors or, if Fonterra has eight or more directors, three or one-third of the total number of directors, whichever is greater. This waiver was granted in connection with the resignation of Mr John Waller and applied for a period ending on the earlier of the appointment of a new independent director or three months from the date of the waiver.
NZX TRADING HALTS
No trading halts were placed on Fonterra securities by NZX Regulation in the financial year ended 31 July 2017.
FONTERRA ANNUAL REVIEW 2017 FONTERRA ANNUAL REVIEW 2017
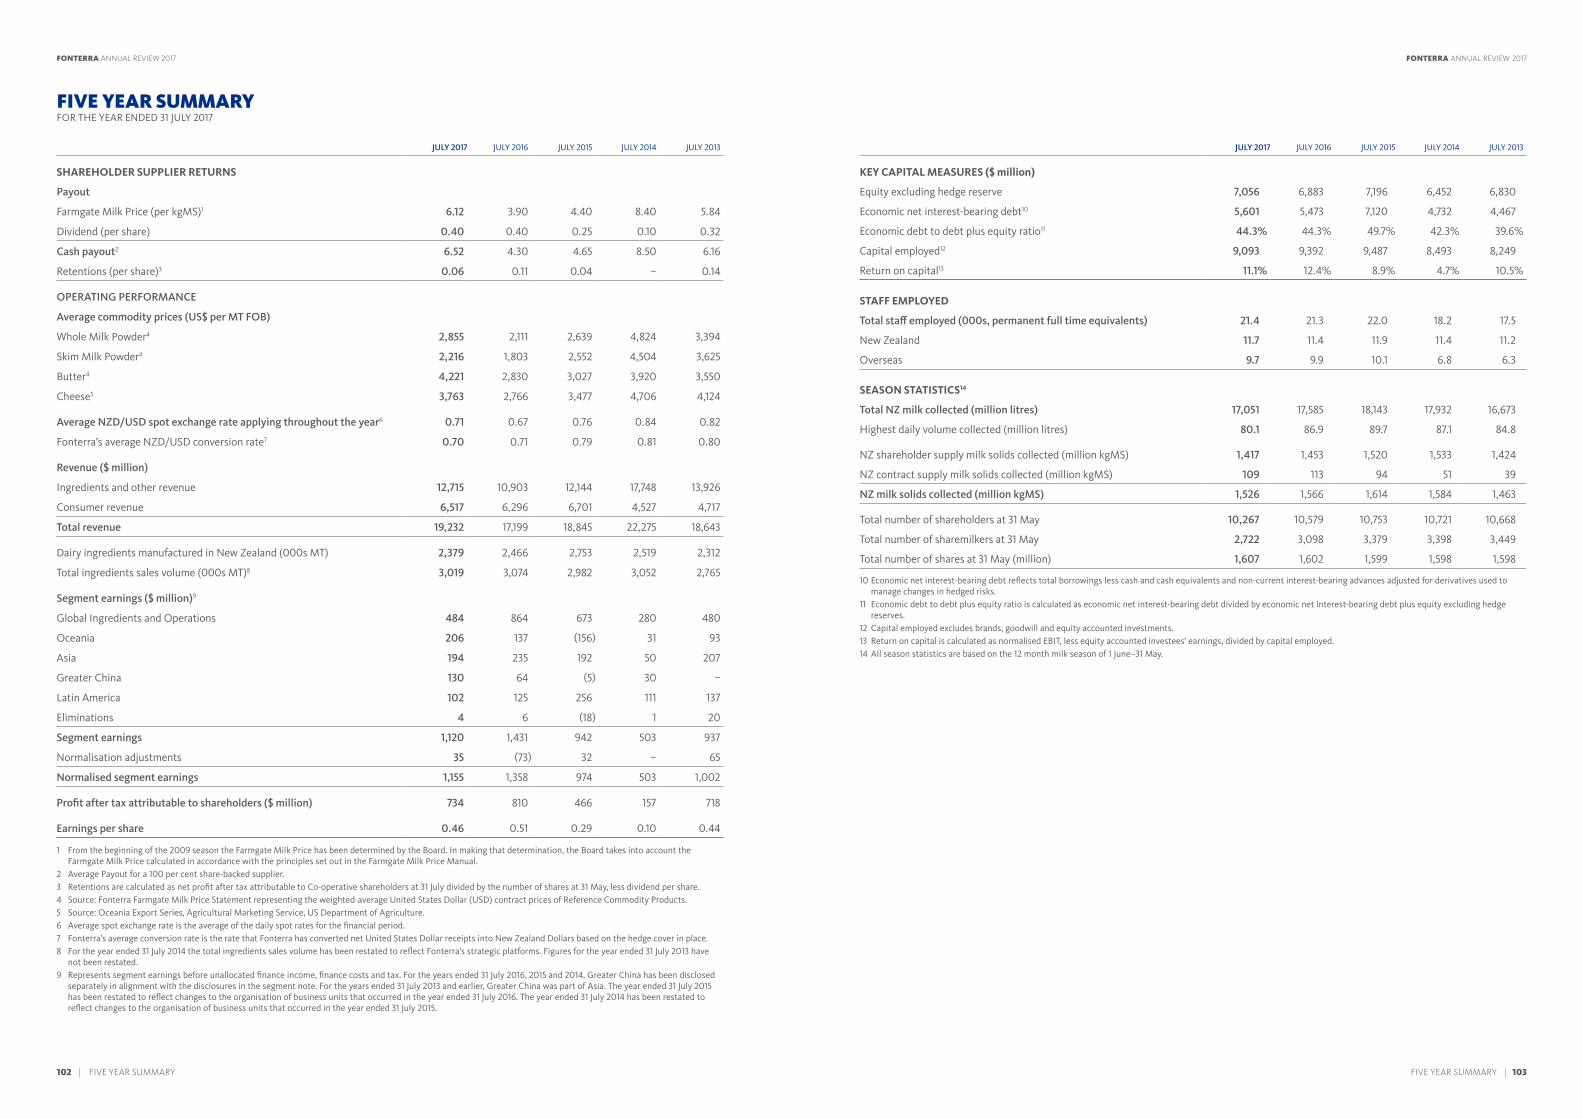
102 | FIVE YEAR SUMMARY
FIVE YEAR SUMMARYFOR THE YEAR ENDED 31 JULY 2017
JULY 2017 JULY 2016 JULY 2015 JULY 2014 JULY 2013
SHAREHOLDER SUPPLIER RETURNS
Payout
Farmgate Milk Price (per kgMS)1 6.12 3.90 4.40 8.40 5.84
Dividend (per share) 0.40 0.40 0.25 0.10 0.32
Cash payout2 6.52 4.30 4.65 8.50 6.16
Retentions (per share)3 0.06 0.11 0.04 – 0.14
OPERATING PERFORMANCE
Average commodity prices (US$ per MT FOB)
Whole Milk Powder4 2,855 2,111 2,639 4,824 3,394
Skim Milk Powder4 2,216 1,803 2,552 4,504 3,625
Butter4 4,221 2,830 3,027 3,920 3,550
Cheese5 3,763 2,766 3,477 4,706 4,124
Average NZD/USD spot exchange rate applying throughout the year6 0.71 0.67 0.76 0.84 0.82
Fonterra’s average NZD/USD conversion rate7 0.70 0.71 0.79 0.81 0.80
Revenue ($ million)
Ingredients and other revenue 12,715 10,903 12,144 17,748 13,926
Consumer revenue 6,517 6,296 6,701 4,527 4,717
Total revenue 19,232 17,199 18,845 22,275 18,643
Dairy ingredients manufactured in New Zealand (000s MT) 2,379 2,466 2,753 2,519 2,312
Total ingredients sales volume (000s MT)8 3,019 3,074 2,982 3,052 2,765
Segment earnings ($ million)9
Global Ingredients and Operations 484 864 673 280 480
Oceania 206 137 (156) 31 93
Asia 194 235 192 50 207
Greater China 130 64 (5) 30 –
Latin America 102 125 256 111 137
Eliminations 4 6 (18) 1 20
Segment earnings 1,120 1,431 942 503 937
Normalisation adjustments 35 (73) 32 – 65
Normalised segment earnings 1,155 1,358 974 503 1,002
Profit after tax attributable to shareholders ($ million) 734 810 466 157 718
Earnings per share 0.46 0.51 0.29 0.10 0.44
1 From the beginning of the 2009 season the Farmgate Milk Price has been determined by the Board. In making that determination, the Board takes into account the Farmgate Milk Price calculated in accordance with the principles set out in the Farmgate Milk Price Manual.
2 Average Payout for a 100 per cent share-backed supplier.3 Retentions are calculated as net profit after tax attributable to Co-operative shareholders at 31 July divided by the number of shares at 31 May, less dividend per share.4 Source: Fonterra Farmgate Milk Price Statement representing the weighted-average United States Dollar (USD) contract prices of Reference Commodity Products.5 Source: Oceania Export Series, Agricultural Marketing Service, US Department of Agriculture.6 Average spot exchange rate is the average of the daily spot rates for the financial period.7 Fonterra’s average conversion rate is the rate that Fonterra has converted net United States Dollar receipts into New Zealand Dollars based on the hedge cover in place.8 For the year ended 31 July 2014 the total ingredients sales volume has been restated to reflect Fonterra’s strategic platforms. Figures for the year ended 31 July 2013 have
not been restated.9 Represents segment earnings before unallocated finance income, finance costs and tax. For the years ended 31 July 2016, 2015 and 2014, Greater China has been disclosed
separately in alignment with the disclosures in the segment note. For the years ended 31 July 2013 and earlier, Greater China was part of Asia. The year ended 31 July 2015 has been restated to reflect changes to the organisation of business units that occurred in the year ended 31 July 2016. The year ended 31 July 2014 has been restated to reflect changes to the organisation of business units that occurred in the year ended 31 July 2015.
FIVE YEAR SUMMARY | 103
JULY 2017 JULY 2016 JULY 2015 JULY 2014 JULY 2013
KEY CAPITAL MEASURES ($ million)
Equity excluding hedge reserve 7,056 6,883 7,196 6,452 6,830
Economic net interest-bearing debt10 5,601 5,473 7,120 4,732 4,467
Economic debt to debt plus equity ratio11 44.3% 44.3% 49.7% 42.3% 39.6%
Capital employed12 9,093 9,392 9,487 8,493 8,249
Return on capital13 11.1% 12.4% 8.9% 4.7% 10.5%
STAFF EMPLOYED
Total staff employed (000s, permanent full time equivalents) 21.4 21.3 22.0 18.2 17.5
New Zealand 11.7 11.4 11.9 11.4 11.2
Overseas 9.7 9.9 10.1 6.8 6.3
SEASON STATISTICS14
Total NZ milk collected (million litres) 17,051 17,585 18,143 17,932 16,673
Highest daily volume collected (million litres) 80.1 86.9 89.7 87.1 84.8
NZ shareholder supply milk solids collected (million kgMS) 1,417 1,453 1,520 1,533 1,424
NZ contract supply milk solids collected (million kgMS) 109 113 94 51 39
NZ milk solids collected (million kgMS) 1,526 1,566 1,614 1,584 1,463
Total number of shareholders at 31 May 10,267 10,579 10,753 10,721 10,668
Total number of sharemilkers at 31 May 2,722 3,098 3,379 3,398 3,449
Total number of shares at 31 May (million) 1,607 1,602 1,599 1,598 1,598
10 Economic net interest-bearing debt reflects total borrowings less cash and cash equivalents and non-current interest-bearing advances adjusted for derivatives used to manage changes in hedged risks.
11 Economic debt to debt plus equity ratio is calculated as economic net interest-bearing debt divided by economic net interest-bearing debt plus equity excluding hedge reserves.
12 Capital employed excludes brands, goodwill and equity accounted investments.13 Return on capital is calculated as normalised EBIT, less equity accounted investees’ earnings, divided by capital employed. 14 All season statistics are based on the 12 month milk season of 1 June–31 May.
FONTERRA ANNUAL REVIEW 2017 FONTERRA ANNUAL REVIEW 2017
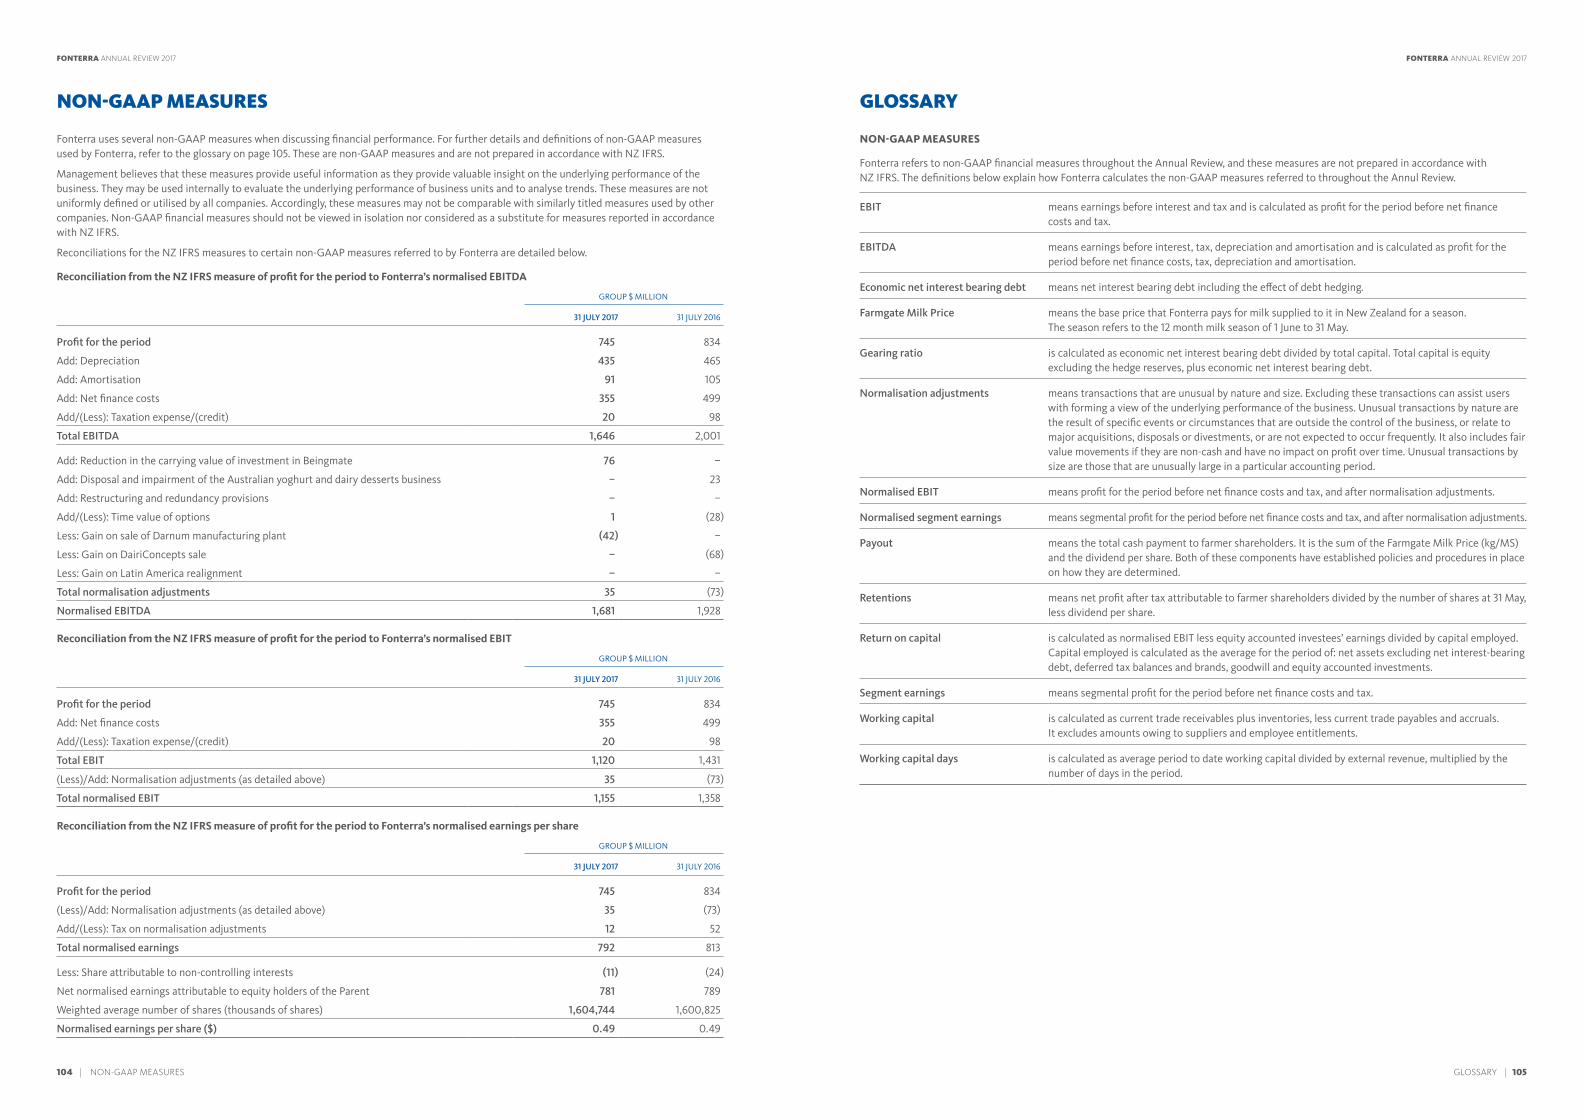
104 | NON-GAAP MEASURES
NON-GAAP MEASURES
Fonterra uses several non-GAAP measures when discussing financial performance. For further details and definitions of non-GAAP measures used by Fonterra, refer to the glossary on page 105. These are non-GAAP measures and are not prepared in accordance with NZ IFRS.
Management believes that these measures provide useful information as they provide valuable insight on the underlying performance of the business. They may be used internally to evaluate the underlying performance of business units and to analyse trends. These measures are not uniformly defined or utilised by all companies. Accordingly, these measures may not be comparable with similarly titled measures used by other companies. Non-GAAP financial measures should not be viewed in isolation nor considered as a substitute for measures reported in accordance with NZ IFRS.
Reconciliations for the NZ IFRS measures to certain non-GAAP measures referred to by Fonterra are detailed below.
Reconciliation from the NZ IFRS measure of profit for the period to Fonterra’s normalised EBITDA
GROUP $ MILLION
31 JULY 2017 31 JULY 2016
Profit for the period 745 834
Add: Depreciation 435 465
Add: Amortisation 91 105
Add: Net finance costs 355 499
Add/(Less): Taxation expense/(credit) 20 98
Total EBITDA 1,646 2,001
Add: Reduction in the carrying value of investment in Beingmate 76 –
Add: Disposal and impairment of the Australian yoghurt and dairy desserts business – 23
Add: Restructuring and redundancy provisions – –
Add/(Less): Time value of options 1 (28)
Less: Gain on sale of Darnum manufacturing plant (42) –
Less: Gain on DairiConcepts sale – (68)
Less: Gain on Latin America realignment – –
Total normalisation adjustments 35 (73)
Normalised EBITDA 1,681 1,928
Reconciliation from the NZ IFRS measure of profit for the period to Fonterra’s normalised EBIT
GROUP $ MILLION
31 JULY 2017 31 JULY 2016
Profit for the period 745 834
Add: Net finance costs 355 499
Add/(Less): Taxation expense/(credit) 20 98
Total EBIT 1,120 1,431
(Less)/Add: Normalisation adjustments (as detailed above) 35 (73)
Total normalised EBIT 1,155 1,358
Reconciliation from the NZ IFRS measure of profit for the period to Fonterra’s normalised earnings per share
GROUP $ MILLION
31 JULY 2017 31 JULY 2016
Profit for the period 745 834
(Less)/Add: Normalisation adjustments (as detailed above) 35 (73)
Add/(Less): Tax on normalisation adjustments 12 52
Total normalised earnings 792 813
Less: Share attributable to non-controlling interests (11) (24)
Net normalised earnings attributable to equity holders of the Parent 781 789
Weighted average number of shares (thousands of shares) 1,604,744 1,600,825
Normalised earnings per share ($) 0.49 0.49
GLOSSARY | 105
GLOSSARY
NON-GAAP MEASURES
Fonterra refers to non-GAAP financial measures throughout the Annual Review, and these measures are not prepared in accordance with NZ IFRS. The definitions below explain how Fonterra calculates the non-GAAP measures referred to throughout the Annul Review.
EBIT means earnings before interest and tax and is calculated as profit for the period before net finance costs and tax.
EBITDA means earnings before interest, tax, depreciation and amortisation and is calculated as profit for the period before net finance costs, tax, depreciation and amortisation.
Economic net interest bearing debt means net interest bearing debt including the effect of debt hedging.
Farmgate Milk Price means the base price that Fonterra pays for milk supplied to it in New Zealand for a season. The season refers to the 12 month milk season of 1 June to 31 May.
Gearing ratio is calculated as economic net interest bearing debt divided by total capital. Total capital is equity excluding the hedge reserves, plus economic net interest bearing debt.
Normalisation adjustments means transactions that are unusual by nature and size. Excluding these transactions can assist users with forming a view of the underlying performance of the business. Unusual transactions by nature are the result of specific events or circumstances that are outside the control of the business, or relate to major acquisitions, disposals or divestments, or are not expected to occur frequently. It also includes fair value movements if they are non-cash and have no impact on profit over time. Unusual transactions by size are those that are unusually large in a particular accounting period.
Normalised EBIT means profit for the period before net finance costs and tax, and after normalisation adjustments.
Normalised segment earnings means segmental profit for the period before net finance costs and tax, and after normalisation adjustments.
Payout means the total cash payment to farmer shareholders. It is the sum of the Farmgate Milk Price (kg/MS) and the dividend per share. Both of these components have established policies and procedures in place on how they are determined.
Retentions means net profit after tax attributable to farmer shareholders divided by the number of shares at 31 May, less dividend per share.
Return on capital is calculated as normalised EBIT less equity accounted investees’ earnings divided by capital employed. Capital employed is calculated as the average for the period of: net assets excluding net interest-bearing debt, deferred tax balances and brands, goodwill and equity accounted investments.
Segment earnings means segmental profit for the period before net finance costs and tax.
Working capital is calculated as current trade receivables plus inventories, less current trade payables and accruals. It excludes amounts owing to suppliers and employee entitlements.
Working capital days is calculated as average period to date working capital divided by external revenue, multiplied by the number of days in the period.
FONTERRA ANNUAL REVIEW 2017 FONTERRA ANNUAL REVIEW 2017

106 | DIRECTORY
FONTERRA BOARD OF DIRECTORS
John Wilson
Clinton Dines
Ian Farrelly
Leonie Guiney
Simon Israel
David Jackson
David MacLeod
John Monaghan
Nicola Shadbolt
Donna Smit
Scott St John
Ashley Waugh
FONTERRA MANAGEMENT TEAM
Theo Spierings
Lukas Paravicini
Miles Hurrell
Robert Spurway
Judith Swales
Paul Washer
Kelvin Wickham
REGISTERED OFFICE
Fonterra Co-operative Group Limited Private Bag 92032 Auckland 1010 New Zealand
Fonterra Centre 109 Fanshawe Street Auckland Central Auckland 1010 New Zealand
Phone +64 9 374 9000 Fax +64 9 374 9001
AUDITORS
PricewaterhouseCoopers Level 22, PwC Tower 188 Quay Street Auckland 1142 New Zealand
FARMER SHAREHOLDER AND SUPPLIER SERVICES
Freephone 0800 65 65 68
DIRECTORY
FONTERRA SHARES AND FSF UNITS REGISTRY
Computershare Investor Services Limited Private Bag 92119 Auckland 1142 New Zealand
Level 2, 159 Hurstmere Road Takapuna Auckland 0622 New Zealand
CAPITAL NOTES REGISTRY
Link Market Services Limited PO Box 91976 Auckland 1142 New Zealand
Level 11, Deloitte Centre 80 Queen Street Auckland 1010 New Zealand
INVESTOR RELATIONS ENQUIRIES
Phone +64 9 374 9000 [email protected]
www.fonterra.com
FONTERRA ANNUAL REVIEW 2017

FONTERRA DAIRY FOR LIFE
ANNUAL REVIEW 2017FONTERRA CO-OPERATIVE GROUP LIMITED
This document is printed on an environmentally responsible paper produced using elemental chlorine free (ECF)FSC® certified mixed source pulp, sourced from well managed and legally harvested forests, and manufactured under the strict ISO14001 environmental management system.
FON
TERRA A
NN
UA
L REVIEW
2017