bcp_corporate presentation_2016
TRANSCRIPT
CORPORATE PRESENTATION
February 2016
Disclaimer
This document is not an offer of securities for sale in the United States, Canada, Australia, Japan or any other jurisdiction.Securities may not be offered or sold in the United States unless they are registered pursuant to the US Securities Act of1933 or are exempt from such registration. Any public offering of securities in the United States, Canada, Australia orJapan would be made by means of a prospectus that will contain detailed information about the company andmanagement, including financial statements
The matters discussed in this document may include forward-looking statements that are subject to risks anduncertainties. By their nature, forward-looking statements involve known and unknown risks and uncertainties becausethey relate to events and depend on circumstances that may or may not occur in the future and may cause the actualresults, performance or achievements of BCP to be materially different from future results, performance or achievementsexpressed or implied by such forward looking statements. Many of these risks and uncertainties relate to factors that arebeyond BCP's ability to control or estimate precisely, such as future market conditions, currency fluctuations, the behaviorof other market participants, the actions of regulators and other factors such as BCP's ability to continue to obtainfinancing to meet its liquidity needs, changes in the political, social and regulatory framework in which BCP operates or in
2
financing to meet its liquidity needs, changes in the political, social and regulatory framework in which BCP operates or ineconomic or technological trends or conditions, including inflation and consumer confidence. Attendees at thispresentation are cautioned not to place undue reliance on these forward-looking statements, which speak only as of thedate of this presentation. Even if BCP’s financial condition, business strategy, plans and objectives of management forfuture operations are consistent with the forward-looking statements contained in this presentation, those results ordevelopments, as well as BCP past performance, may not be indicative of results or developments in future periods. BCPexpressly disclaims any obligation or undertaking to release any updates or revisions to these forward-looking statements,whether as a result of new information, future events or otherwise, except as required by applicable law
The information in this presentation has been prepared under the scope of the International Financial Reporting Standards(‘IFRS’) of BCP Group for the purposes of the preparation of the consolidated financial statements under Regulation (CE)1606/2002
2015 figures not audited
Summary
1. Portuguese macroeconomic update
2. Overview of Millennium bcp
3. Strategic Plan
A. Strategic plan metrics
B. Liquidity and Capital
3
B. Liquidity and Capital
4. Investment case
5. Appendix
A. 2015 Earnings
B. Other Information

Fiscal consolidation creates the conditions for the sustainability of the public debt, leading to normalisation of yields on sovereign debt
…with significant effort on expenditureBudget deficit decreases…
(% of GDP) (total expenditure, % of GDP)
Source: Bank of Portugal; Ministry of Finance (2015 Budget).Source: Statistics Portugal; Ministry of Finance (2016 Budget Draft).
11.2
7.4
5.7 4.8
7.2
2.6 2.9
2010 2011 2012 2013 2014 2015E 2016E
(*)
51.850.0
48.550.1
51.7
48.3
46.3
2010 2011 2012 2013 2014 2015E 2016E
4
10y Portuguese bonds (yield, %)
Yields have been decreasing
Source: Thomson Reuters.
0
3
6
9
12
15
18
2004 2005 2006 2007 2008 2009 2010 2011 2012 2013 2014 2015
Average: >10%
Average: ~4% <3%
Source: Bank of Portugal; Ministry of Finance (2015 Budget).
(Public debt, % of GDP)
(*) Excludes the capitalisation of Novo Banco (a one-off operation worth 2.8% of GDP)
Debt level is expected to reduce in 2015
Source: Statistics Portugal; Ministry of Finance (2016 Budget Draft).
96.2
111.1
126.2 129.0 130.2 128.8 127.7
2010 2011 2012 2013 2014 2015E 2016E
Source: Statistics Portugal; Ministry of Finance (2016 Budget Draft).
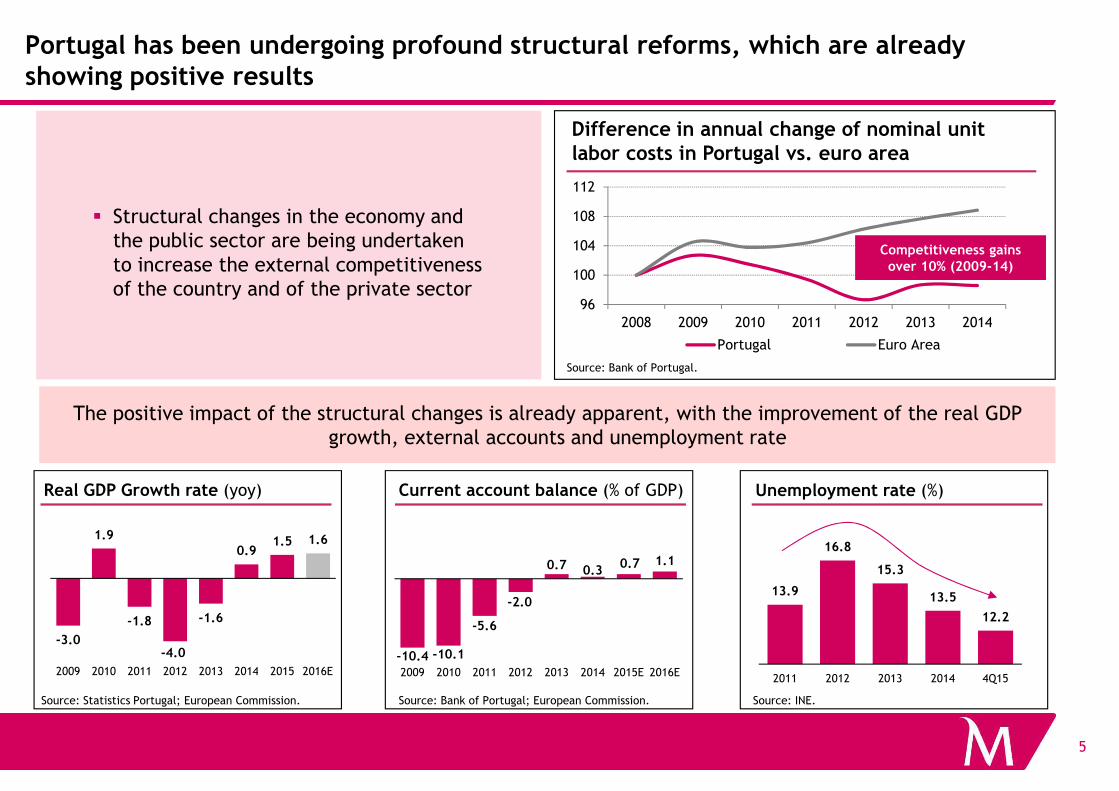
Portugal has been undergoing profound structural reforms, which are already showing positive results
� Structural changes in the economy and the public sector are being undertaken to increase the external competitiveness of the country and of the private sector
Source: Bank of Portugal.
Difference in annual change of nominal unit labor costs in Portugal vs. euro area
96
100
104
108
112
2008 2009 2010 2011 2012 2013 2014
Portugal Euro Area
Competitiveness gains
over 10% (2009-14)
5
13.9
16.8
15.3
13.5
12.2
2011 2012 2013 2014 4Q15
Real GDP Growth rate (yoy)
Source: Bank of Portugal; European Commission.
Current account balance (% of GDP)
-3.0
1.9
-1.8
-4.0
-1.6
0.91.5 1.6
2009 2010 2011 2012 2013 2014 2015 2016E
Source: Statistics Portugal; European Commission.
Unemployment rate (%)
Source: INE.
-10.4 -10.1
-5.6
-2.0
0.7 0.30.7 1.1
2009 2010 2011 2012 2013 2014 2015E 2016E
The positive impact of the structural changes is already apparent, with the improvement of the real GDP growth, external accounts and unemployment rate
Summary
1. Portuguese macroeconomic update
2. 0verview of Millennium bcp
3. Strategic Plan
A. Strategic plan metrics
B. Liquidity and capital
6
B. Liquidity and capital
4. Investment case
5. Appendix
A. 2015 Earnings
B. Other Information
Overview of Millennium bcp
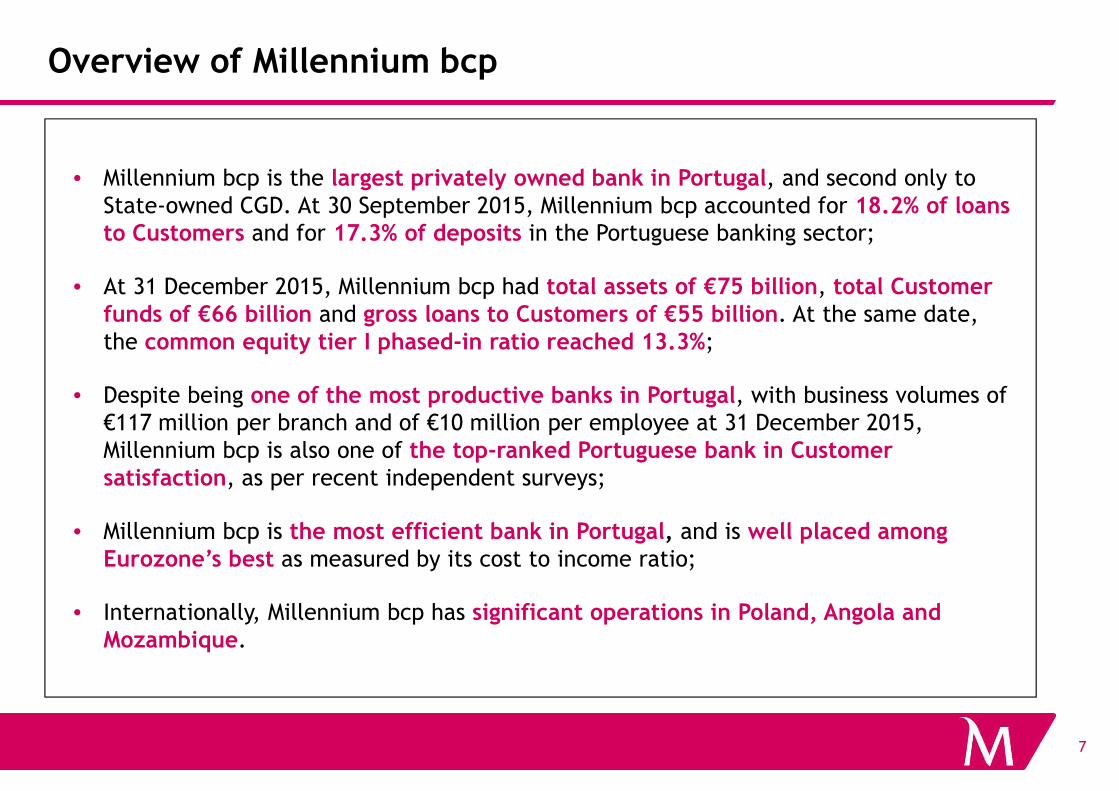
• Millennium bcp is the largest privately owned bank in Portugal, and second only to State-owned CGD. At 30 September 2015, Millennium bcp accounted for 18.2% of loans to Customers and for 17.3% of deposits in the Portuguese banking sector;
• At 31 December 2015, Millennium bcp had total assets of €75 billion, total Customer funds of €66 billion and gross loans to Customers of €55 billion. At the same date, the common equity tier I phased-in ratio reached 13.3%;
• Despite being one of the most productive banks in Portugal, with business volumes of
7
• Despite being one of the most productive banks in Portugal, with business volumes of €117 million per branch and of €10 million per employee at 31 December 2015, Millennium bcp is also one of the top-ranked Portuguese bank in Customer satisfaction, as per recent independent surveys;
• Millennium bcp is the most efficient bank in Portugal, and is well placed among Eurozone’s best as measured by its cost to income ratio;
• Internationally, Millennium bcp has significant operations in Poland, Angola and Mozambique.
10.2%
13.3%
CET1 fully implemented
CET1 phased-in
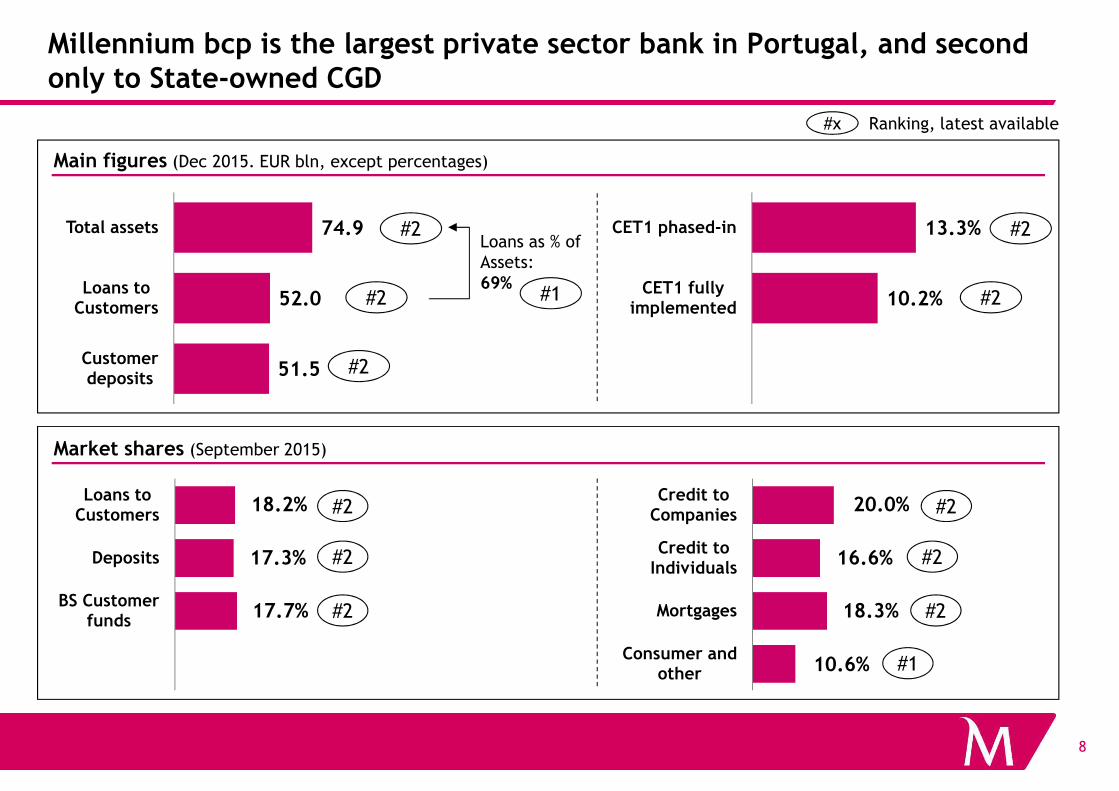
Millennium bcp is the largest private sector bank in Portugal, and second only to State-owned CGD
Main figures (Dec 2015. EUR bln, except percentages)
51.5
52.0
74.9
Customer deposits
Loans to Customers
Total assets
#x Ranking, latest available
#2
#2
#2
Loans as % ofAssets: 69%
#1
#2
#2
8
Market shares (September 2015)
BS Customer funds
Deposits
Loans to Customers #2
#2
#2
Consumer and other
Mortgages
Credit to Individuals
Credit to Companies #2
#2
#2
#1
18.2%
17.3%
17.7%
20.0%
16.6%
18.3%
10.6%
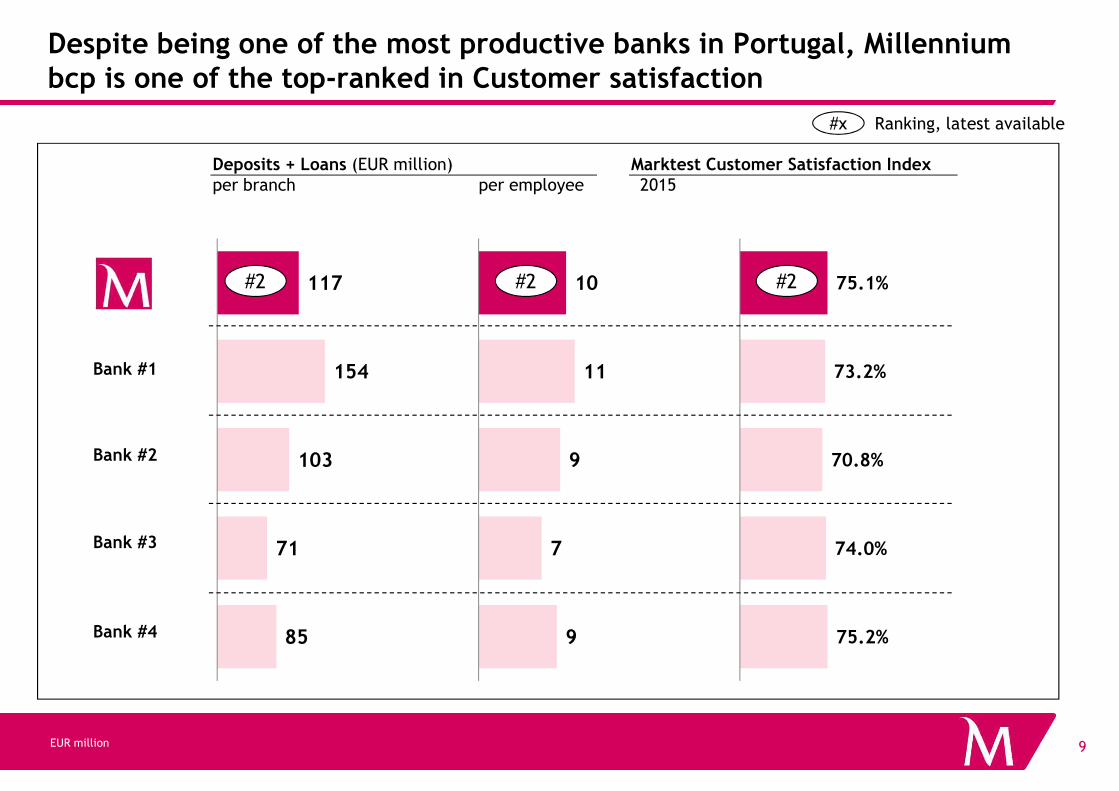
Despite being one of the most productive banks in Portugal, Millennium bcp is one of the top-ranked in Customer satisfaction
Deposits + Loans (EUR million)per branch per employee
154
117
11
10
73.2%
75.1%
Bank #1
Marktest Customer Satisfaction Index2015
#x Ranking, latest available
#2 #2 #2
9
85
71
103
9
7
9
75.2%
74.0%
70.8%Bank #2
Bank #3
Bank #4
EUR million
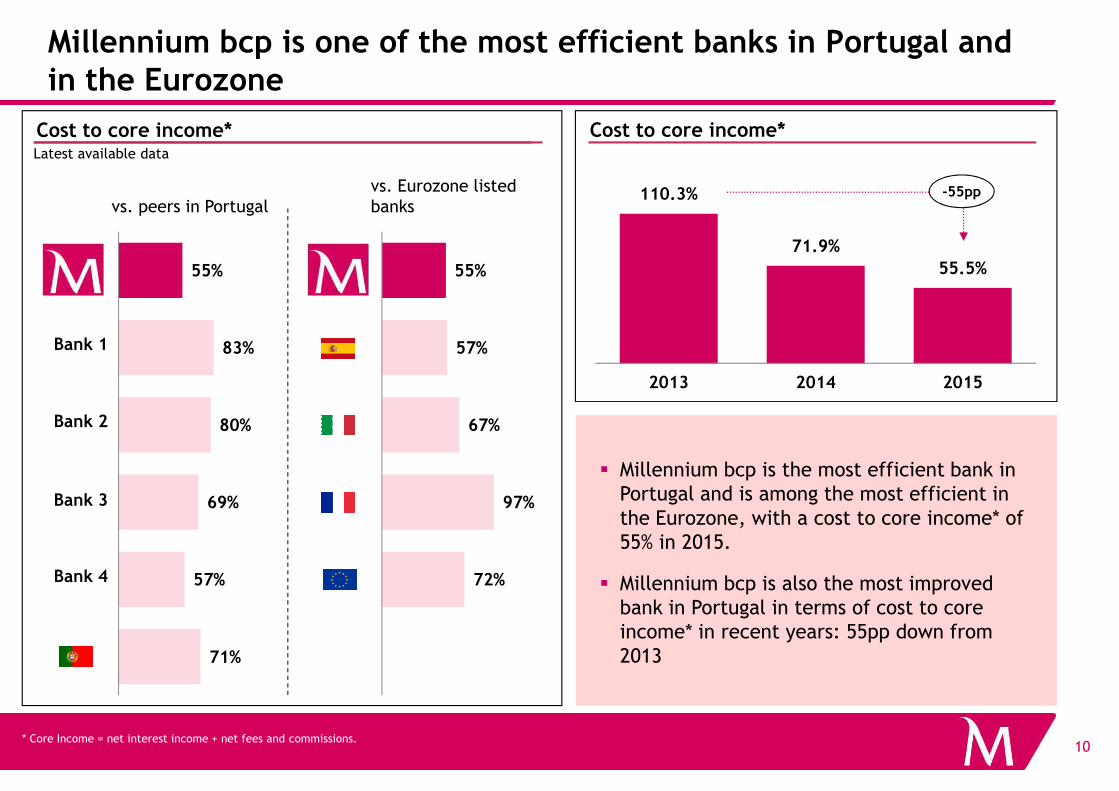
Millennium bcp is one of the most efficient banks in Portugal and in the Eurozone
Cost to core income*Cost to core income*
Bank 1
Latest available data
110.3%
71.9%
55.5%
2013 2014 2015
vs. peers in Portugalvs. Eurozone listed banks
-55pp
83%
55%
57%
55%
10* Core Income = net interest income + net fees and commissions.
� Millennium bcp is the most efficient bank in Portugal and is among the most efficient in the Eurozone, with a cost to core income* of 55% in 2015.
� Millennium bcp is also the most improved bank in Portugal in terms of cost to core income* in recent years: 55pp down from 2013
Bank 2
Bank 3
Bank 4
71%
57%
69%
80%
72%
97%
67%
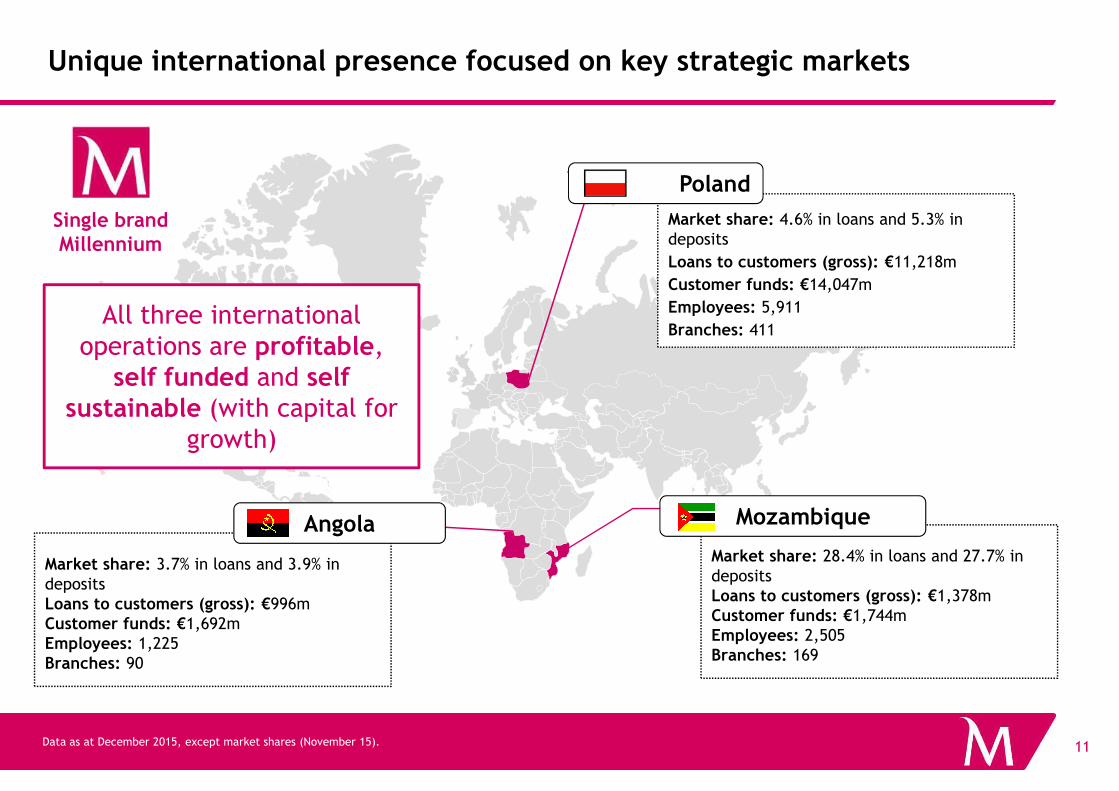
Unique international presence focused on key strategic markets
Single brand Millennium
Market share: 4.6% in loans and 5.3% in deposits
Loans to customers (gross): €11,218m
Customer funds: €14,047m
Employees: 5,911
Branches: 411
Poland
All three international operations are profitable,
self funded and self sustainable (with capital for
11Data as at December 2015, except market shares (November 15).
Market share: 28.4% in loans and 27.7% in deposits Loans to customers (gross): €1,378mCustomer funds: €1,744mEmployees: 2,505Branches: 169
Mozambique
Market share: 3.7% in loans and 3.9% in deposits Loans to customers (gross): €996mCustomer funds: €1,692mEmployees: 1,225Branches: 90
Angola
sustainable (with capital for growth)
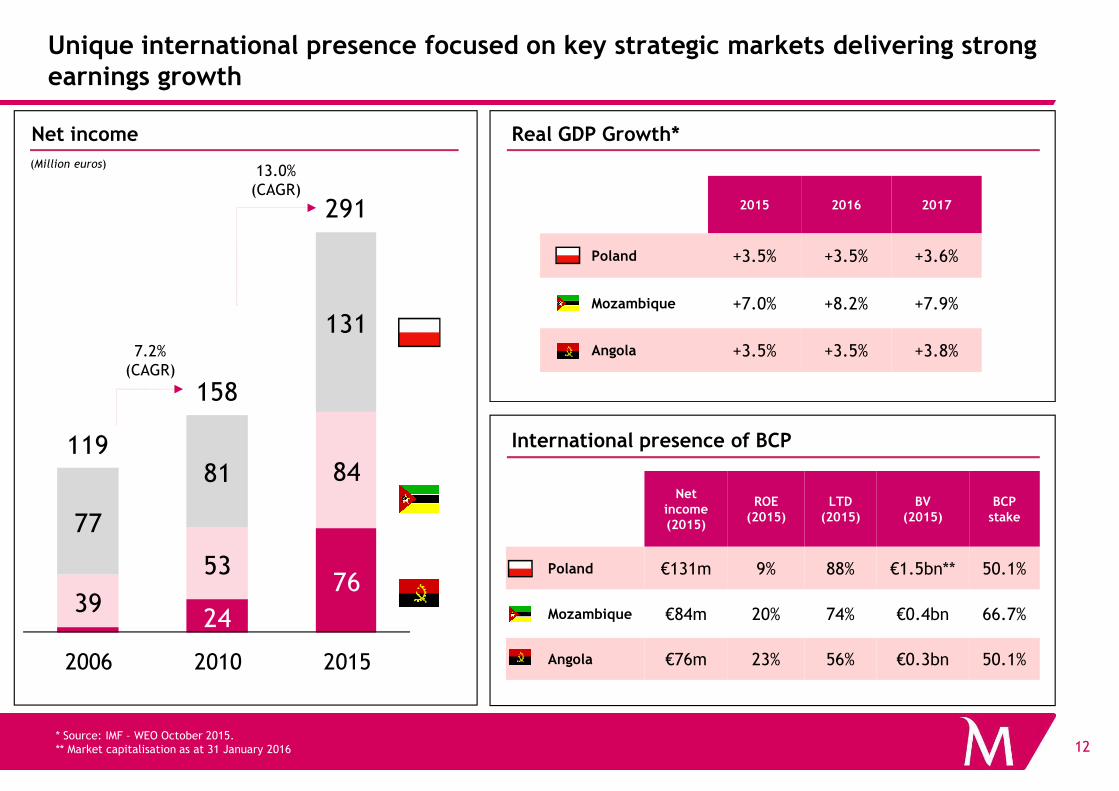
131
158
291
Unique international presence focused on key strategic markets delivering strong earnings growth
Net income
13.0% (CAGR)
7.2% (CAGR)
(Million euros)
Real GDP Growth*
2015 2016 2017
Poland +3.5% +3.5% +3.6%
Mozambique +7.0% +8.2% +7.9%
Angola +3.5% +3.5% +3.8%
12
24
7639
53
84
77
81119
158
2006 2010 2015
International presence of BCP
Netincome(2015)
ROE (2015)
LTD (2015)
BV(2015)
BCP stake
Poland €131m 9% 88% €1.5bn** 50.1%
Mozambique €84m 20% 74% €0.4bn 66.7%
Angola €76m 23% 56% €0.3bn 50.1%
* Source: IMF – WEO October 2015.** Market capitalisation as at 31 January 2016
Summary
1. Portuguese macroeconomic update
2. 0verview of Millennium bcp
3. Strategic Plan
A. Strategic plan metrics
B. Liquidity and capital
13
B. Liquidity and capital
4. Investment case
5. Appendix
A. 2015 Earnings
B. Other Information

Progress on 2012 strategic plan metrics
Recovery of profitability in PortugalCreating
growth and
Stronger balance sheetCET1*
(phased-in)
(fullyimplemented)
11.7%
7.8%
13.3%
10.2%
… >10% ��������
LtD** 102% 97% … <110% ��������
C/I 52% 44% … ≈50% ��������
Demanding economic
environment2012-2013
Phases Priorities 2015
Strategic plan
2014 2015
Actual
14
Sustained net income growth, greater balance between
domestic and international operations
growth and profitability conditions
2014-2015
Sustained growth
2016-2017
Continued development of business in Poland,
Mozambique and Angola
C/I 52% 44% … ≈50% ��������
Operatingcosts
€690M €642M … ≈€660M ��������
Cost of risk(bp)
194 150 … ≈100 ��������
ROE -6.5% 5.3% … ≈7% ��������
* Includes the impact of the new DTAs regime for capital purposes according with IAS. | ** Loans to deposits ratio based on net loans and on balance sheet Customer funds.
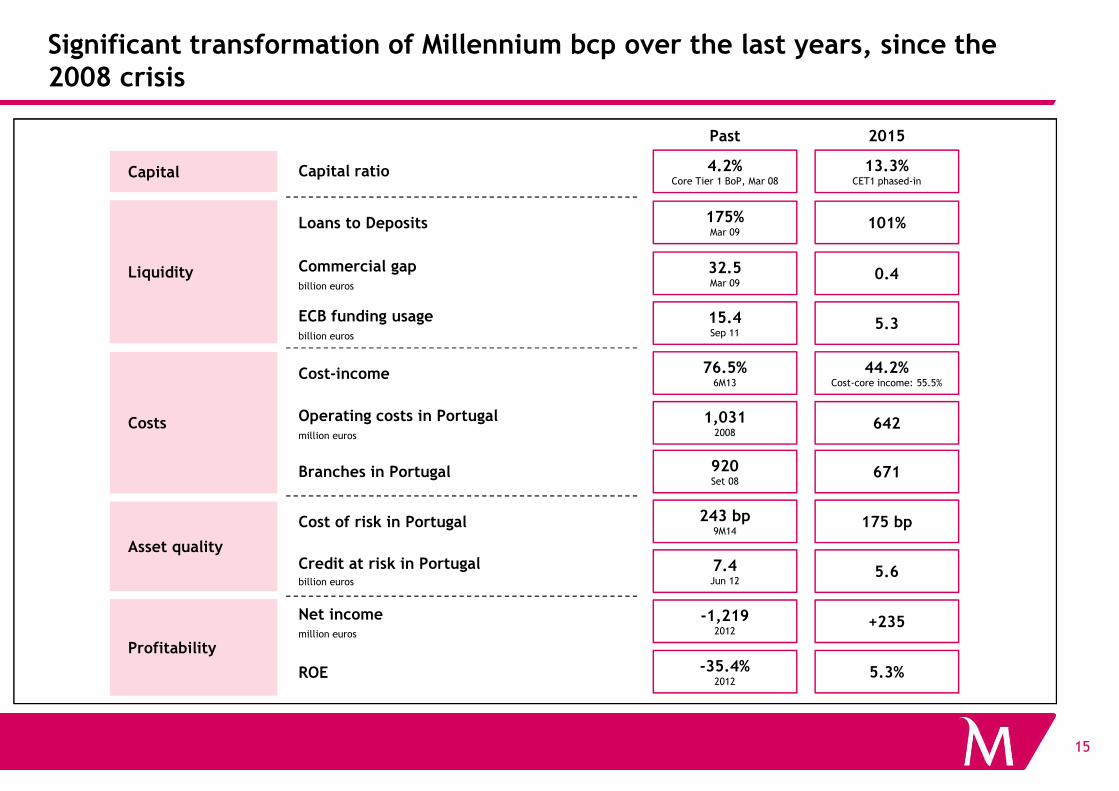
Significant transformation of Millennium bcp over the last years, since the 2008 crisis
2015
Capital
Liquidity
Past
Capital ratio 13.3%CET1 phased-in
4.2%Core Tier 1 BoP, Mar 08
Loans to Deposits 101%175%Mar 09
0.4Commercial gapbillion euros
32.5Mar 09
5.3ECB funding usagebillion euros
15.4Sep 11
Cost-income 76.5%6M13
44.2%Cost-core income: 55.5%
15
Costs
Asset quality
Profitability
Branches in Portugal 920Set 08
671
Cost of risk in Portugal 243 bp9M14
175 bp
7.4Jun 12
5.6Credit at risk in Portugalbillion euros
-35.4%2012
5.3%ROE
-1,2192012
+235Net incomemillion euros
642Operating costs in Portugalmillion euros
1,0312008
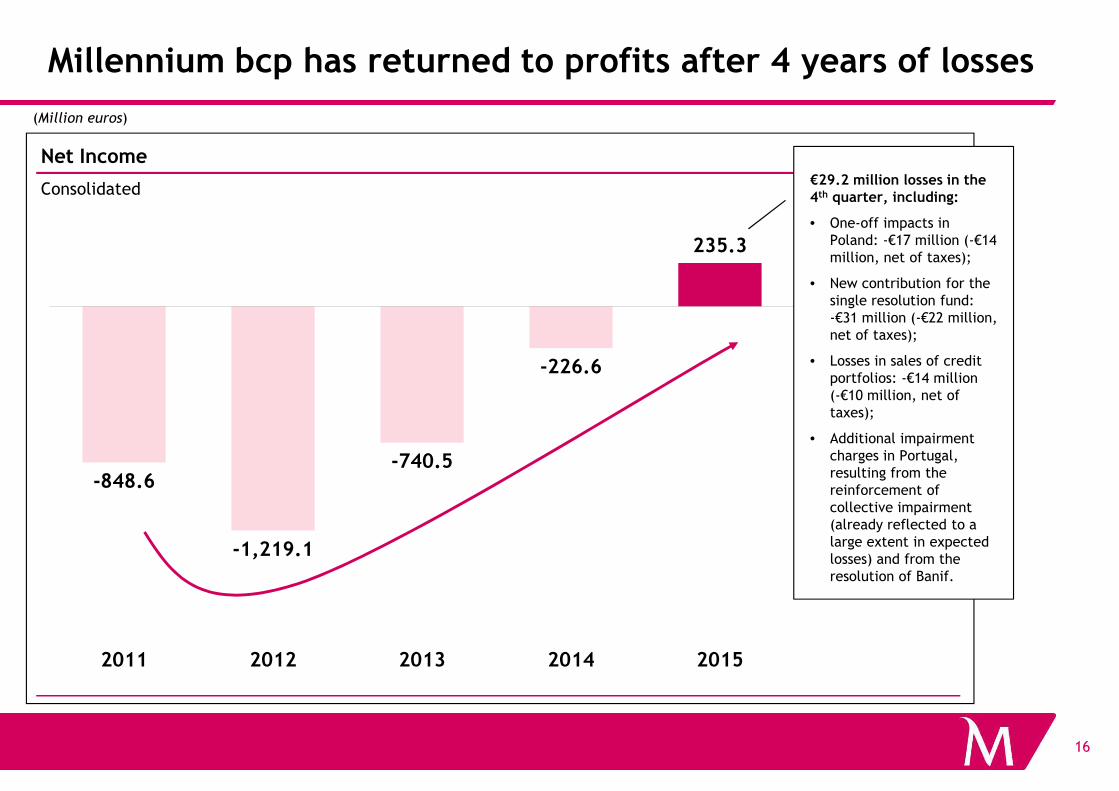
Millennium bcp has returned to profits after 4 years of losses
-226.6
235.3
Net Income
Consolidated
(Million euros)
€29.2 million losses in the 4th quarter, including:
• One-off impacts in Poland: -€17 million (-€14 million, net of taxes);
• New contribution for the single resolution fund: -€31 million (-€22 million, net of taxes);
• Losses in sales of credit portfolios: -€14 million (-€10 million, net of
16
-848.6
-1,219.1
-740.5
2011 2012 2013 2014 2015
(-€10 million, net of taxes);
• Additional impairment charges in Portugal, resulting from the reinforcement of collective impairment (already reflected to a large extent in expected losses) and from the resolution of Banif.

Improvement trend on core income and operating costs in Portugal proceeds
Core Income(Million euros)
773960
1,160
2013 2014 2015
Commissions
Net interest income
Core net income*(Million euros)
39
270
518
2013 2014 2015
+200
+248
17* Core net income = net interest income + net fees and commission income – operating costs.** Excludes non-recurring costs of €119 million in 2013.
� Core income increases to €1,160 million in 2015
� Operating costs down to €642 million in the same period
� Continuation of the core net income** expansion trend begun 2 years ago to €518 million in 2015
Operating costs**(Million euros)
734 690 642
2013 2014 2015
-48
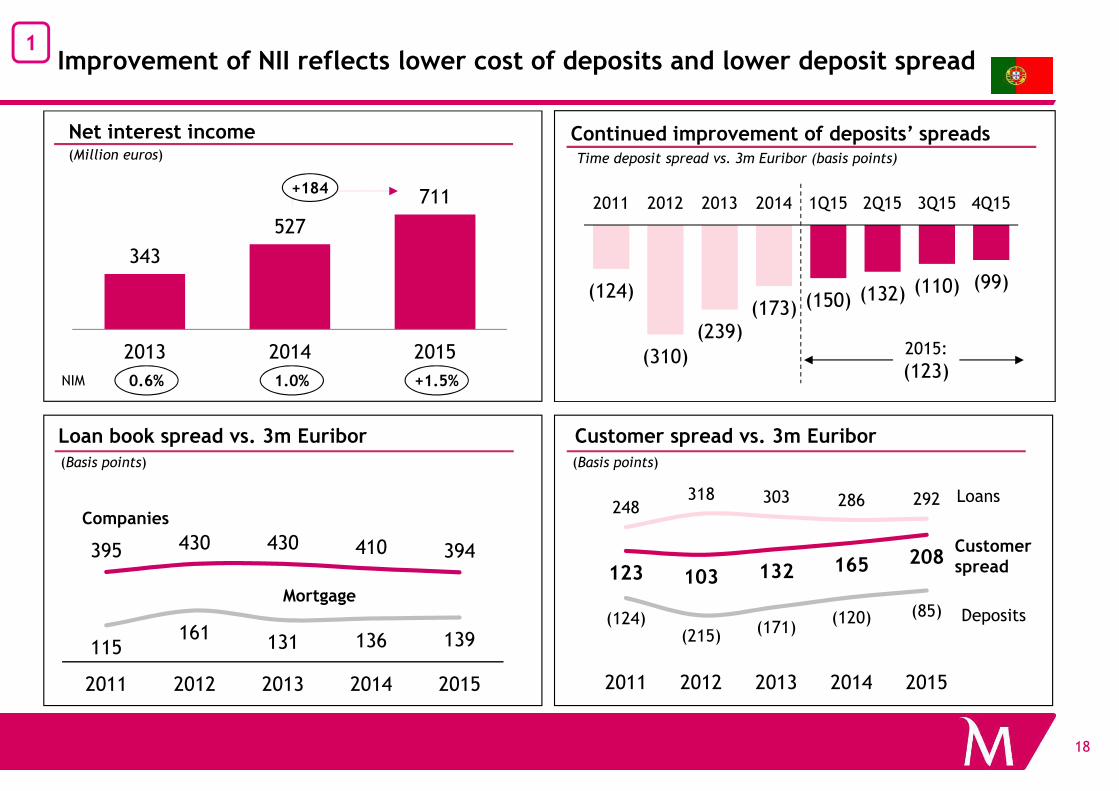
1Improvement of NII reflects lower cost of deposits and lower deposit spread
Continued improvement of deposits’ spreadsTime deposit spread vs. 3m Euribor (basis points)
Net interest income(Million euros)
343
527
711
2013 2014 2015
+184
1.0% +1.5%0.6%NIM
(124)
(310)(239)
(173) (150) (132) (110) (99)
2011 2012 2013 2014 1Q15 2Q15 3Q15 4Q15
2015:
(123)
18
Loan book spread vs. 3m Euribor
(Basis points)
Customer spread vs. 3m Euribor
(Basis points)
115161 131 136 139
395 430 430 410 394
2011 2012 2013 2014 2015
Companies
Mortgage
248318 303 286 292
(124)(215) (171)
(120) (85)
123 103 132 165 208
2011 2012 2013 2014 2015
Loans
Deposits
Customerspread
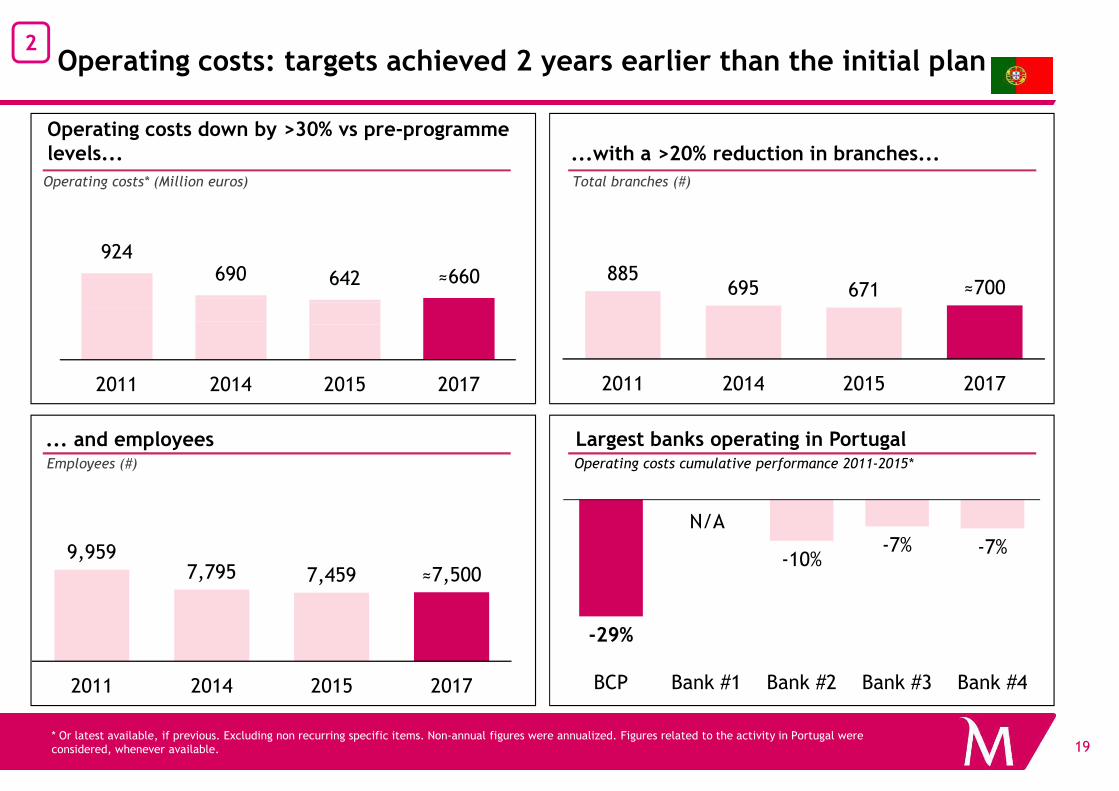
Operating costs: targets achieved 2 years earlier than the initial plan
Operating costs* (Million euros)
...with a >20% reduction in branches...Operating costs down by >30% vs pre-programme levels...
Total branches (#)
2
924690 642 ≈660
2011 2014 2015 2017
885695 671 ≈700
2011 2014 2015 2017
19* Or latest available, if previous. Excluding non recurring specific items. Non-annual figures were annualized. Figures related to the activity in Portugal were considered, whenever available.
Employees (#)
... and employees
2011 2014 2015 2017
Largest banks operating in PortugalOperating costs cumulative performance 2011-2015*
N/A
9,9597,795 7,459 ≈7,500
2011 2014 2015 2017
-29%
-10%-7% -7%
BCP Bank #1 Bank #2 Bank #3 Bank #4
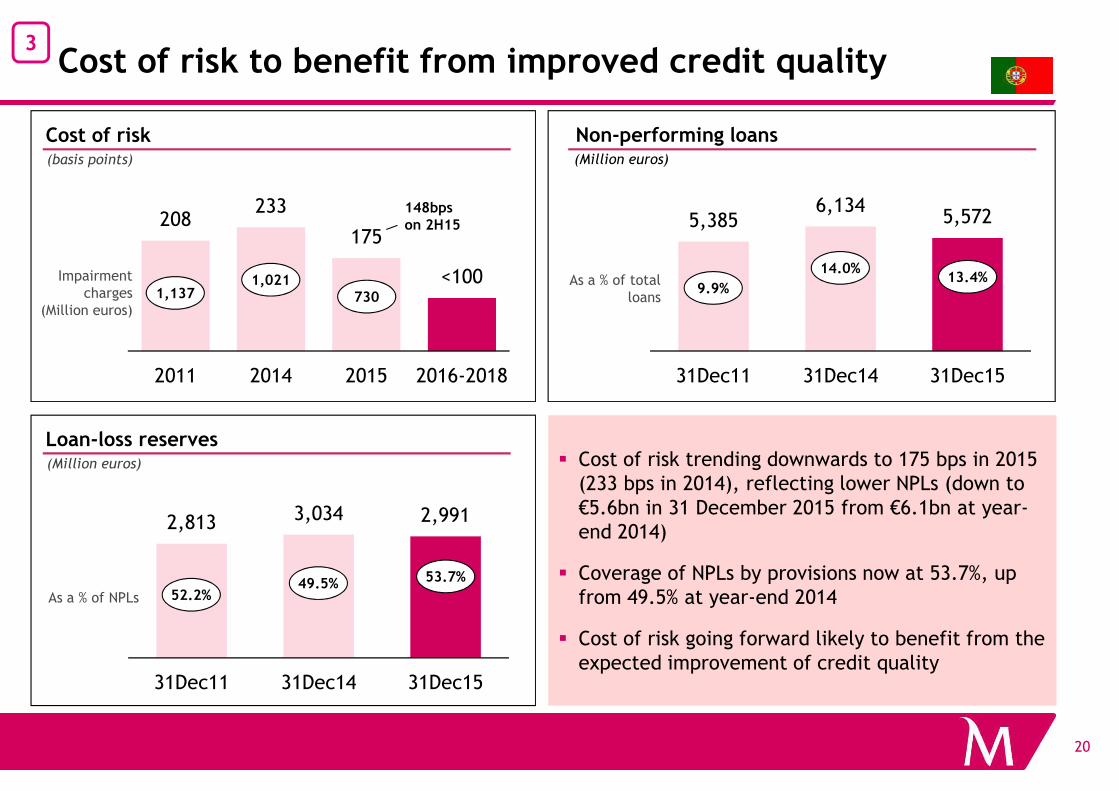
Cost of risk to benefit from improved credit quality3
208233
175
<100
2011 2014 2015 2016-2018
(basis points)
Cost of risk Non-performing loans(Million euros)
Impairment charges
(Million euros)1,137
1,021730
5,3856,134
5,572
31Dec11 31Dec14 31Dec15
As a % of total loans
9.9%
14.0%13.4%
148bps on 2H15
20
(Million euros)
Loan-loss reserves� Cost of risk trending downwards to 175 bps in 2015
(233 bps in 2014), reflecting lower NPLs (down to €5.6bn in 31 December 2015 from €6.1bn at year-end 2014)
� Coverage of NPLs by provisions now at 53.7%, up from 49.5% at year-end 2014
� Cost of risk going forward likely to benefit from the expected improvement of credit quality
2,813 3,034 2,991
31Dec11 31Dec14 31Dec15
As a % of NPLs 52.2%49.5% 53.7%

Road to 2018: financial targets
2014Target20182015
Fully implemented CET1 ratio 7.8% 10.2%
Phased-in CET1 ratio 11.7%
≥11%
13.3%
Loans to Deposits 108% <100%102%
21
Cost-core income 64.0% <50%55.4%
Cost of risk 194 bp <75 pb150 bp
ROE* -6.5% >11%5.3%
Cost-income 51.7% <43%44.2%
* Consistent with a 11% CET1 ratio.
Summary
1. Portuguese macroeconomic update
2. Overview of Millennium bcp
3. Strategic Plan
A. Strategic plan metrics
B. Liquidity and Capital
22
B. Liquidity and Capital
4. Investment case
5. Appendix
A. 2015 Earnings
B. Other Information
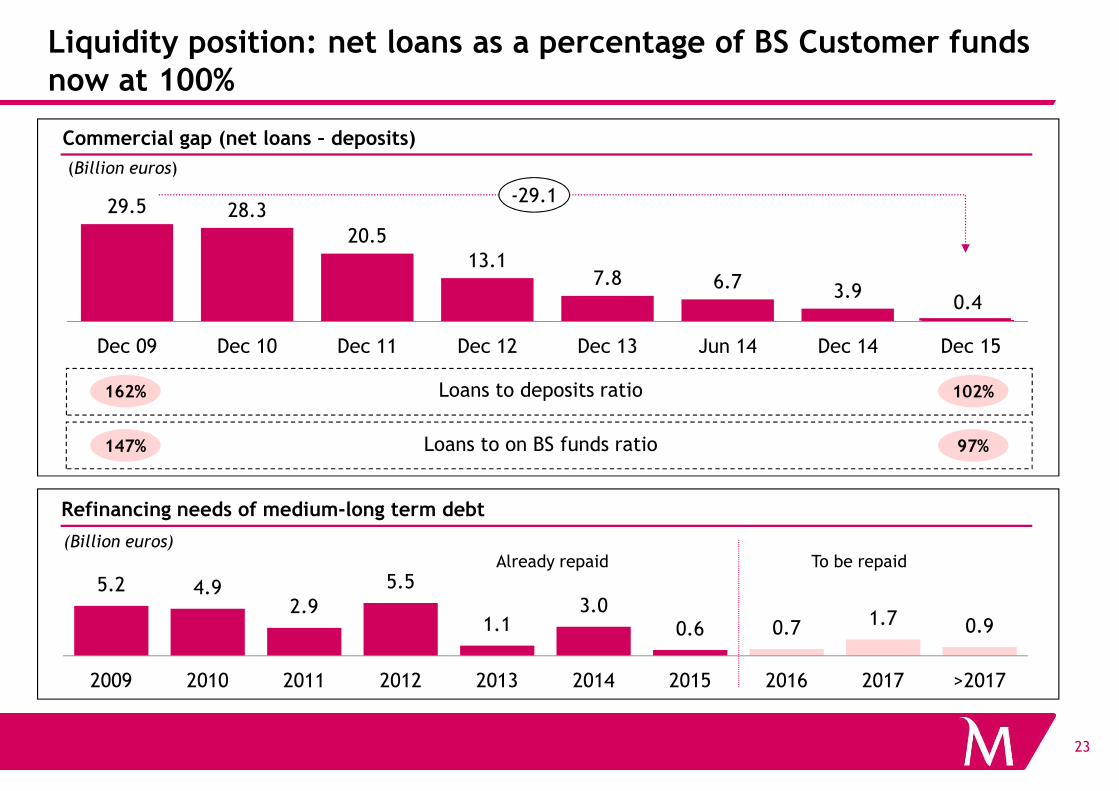
29.5 28.3
20.513.1
7.8 6.7 3.90.4
Dec 09 Dec 10 Dec 11 Dec 12 Dec 13 Jun 14 Dec 14 Dec 15
Liquidity position: net loans as a percentage of BS Customer funds now at 100%
162% Loans to deposits ratio
-29.1
102%
Commercial gap (net loans – deposits)
(Billion euros)
23
162% Loans to deposits ratio
147% Loans to on BS funds ratio
102%
97%
5.2 4.92.9
5.5
1.13.0
0.6 0.7 1.7 0.9
2009 2010 2011 2012 2013 2014 2015 2016 2017 >2017
Refinancing needs of medium-long term debt
Already repaid(Billion euros)
To be repaid
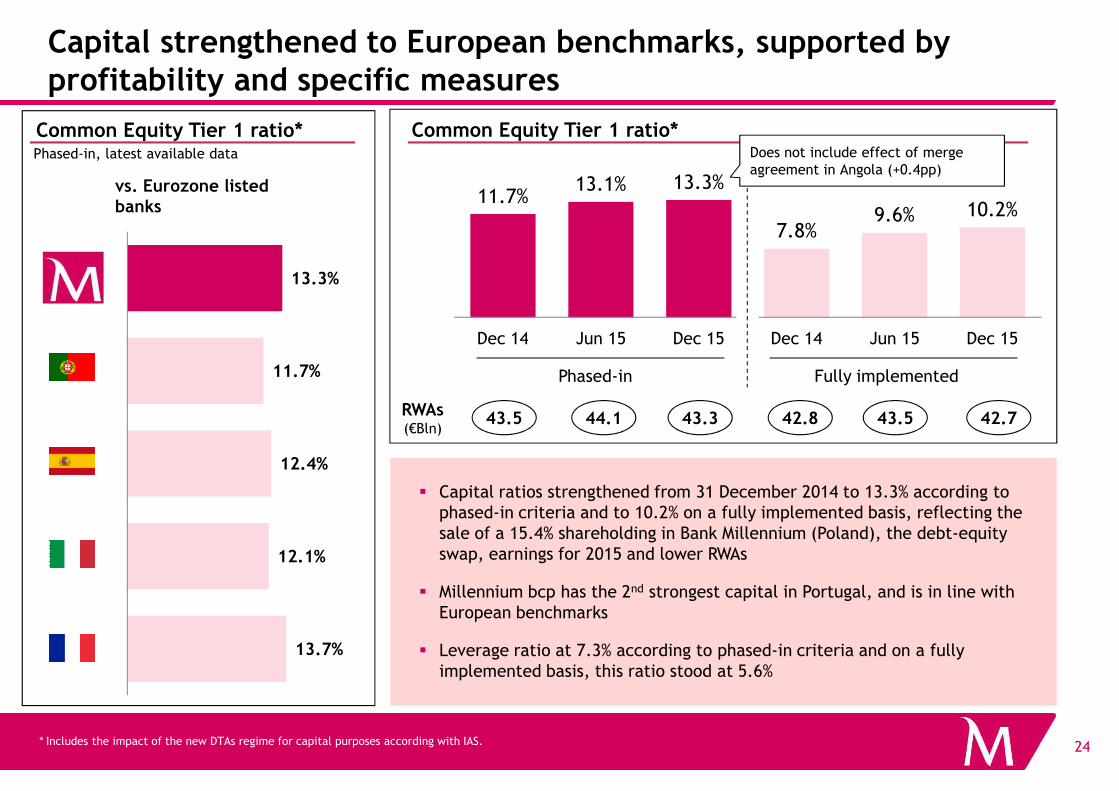
11.7%13.1% 13.3%
7.8%9.6% 10.2%
Dec 14 Jun 15 Dec 15 Dec 14 Jun 15 Dec 15
Capital strengthened to European benchmarks, supported by profitability and specific measures
Common Equity Tier 1 ratio*Phased-in, latest available data
vs. Eurozone listed banks
Common Equity Tier 1 ratio*
Phased-in Fully implemented
Does not include effect of merge agreement in Angola (+0.4pp)
11.7%
13.3%
24
43.5 43.3 42.8 42.7
* Includes the impact of the new DTAs regime for capital purposes according with IAS.
RWAs(€Bln)
� Capital ratios strengthened from 31 December 2014 to 13.3% according to phased-in criteria and to 10.2% on a fully implemented basis, reflecting the sale of a 15.4% shareholding in Bank Millennium (Poland), the debt-equity swap, earnings for 2015 and lower RWAs
� Millennium bcp has the 2nd strongest capital in Portugal, and is in line with European benchmarks
� Leverage ratio at 7.3% according to phased-in criteria and on a fully implemented basis, this ratio stood at 5.6%
44.1 43.5
13.7%
12.1%
12.4%
Summary
1. Portuguese macroeconomic update
2. Overview of Millennium bcp
3. Strategic Plan
A. Strategic plan metrics
B. Liquidity and Capital
25
B. Liquidity and Capital
4. Investment case
5. Appendix
A. 2015 Earnings
B. Other Information
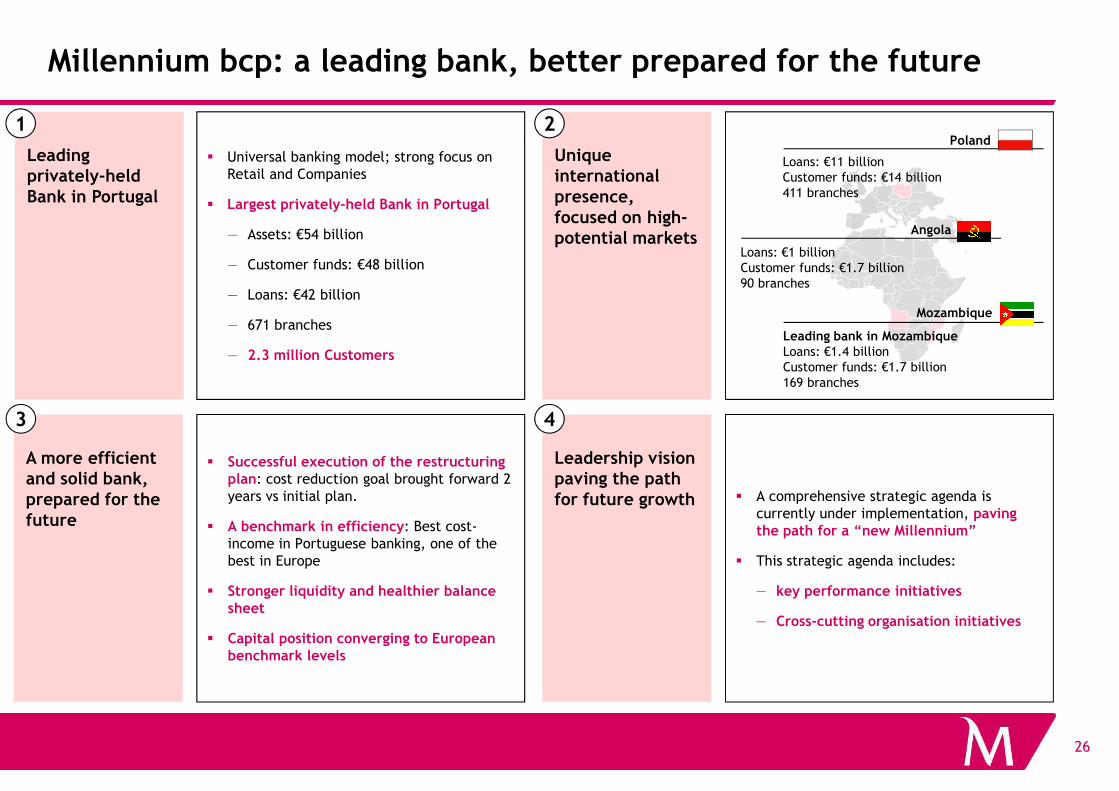
Millennium bcp: a leading bank, better prepared for the future
� Universal banking model; strong focus on Retail and Companies
� Largest privately-held Bank in Portugal
— Assets: €54 billion
— Customer funds: €48 billion
— Loans: €42 billion
— 671 branches
— 2.3 million Customers
Leading privately-held Bank in Portugal
Unique international presence, focused on high-potential markets
Loans: €11 billionCustomer funds: €14 billion411 branches
Poland
Mozambique
Leading bank in MozambiqueLoans: €1.4 billionCustomer funds: €1.7 billion169 branches
Angola
Loans: €1 billionCustomer funds: €1.7 billion90 branches
1 2
26
A more efficient and solid bank, prepared for the future
� Successful execution of the restructuring plan: cost reduction goal brought forward 2 years vs initial plan.
� A benchmark in efficiency: Best cost-income in Portuguese banking, one of the best in Europe
� Stronger liquidity and healthier balance sheet
� Capital position converging to European benchmark levels
3
Leadership vision paving the path for future growth � A comprehensive strategic agenda is
currently under implementation, paving the path for a “new Millennium”
� This strategic agenda includes:
— key performance initiatives
— Cross-cutting organisation initiatives
4
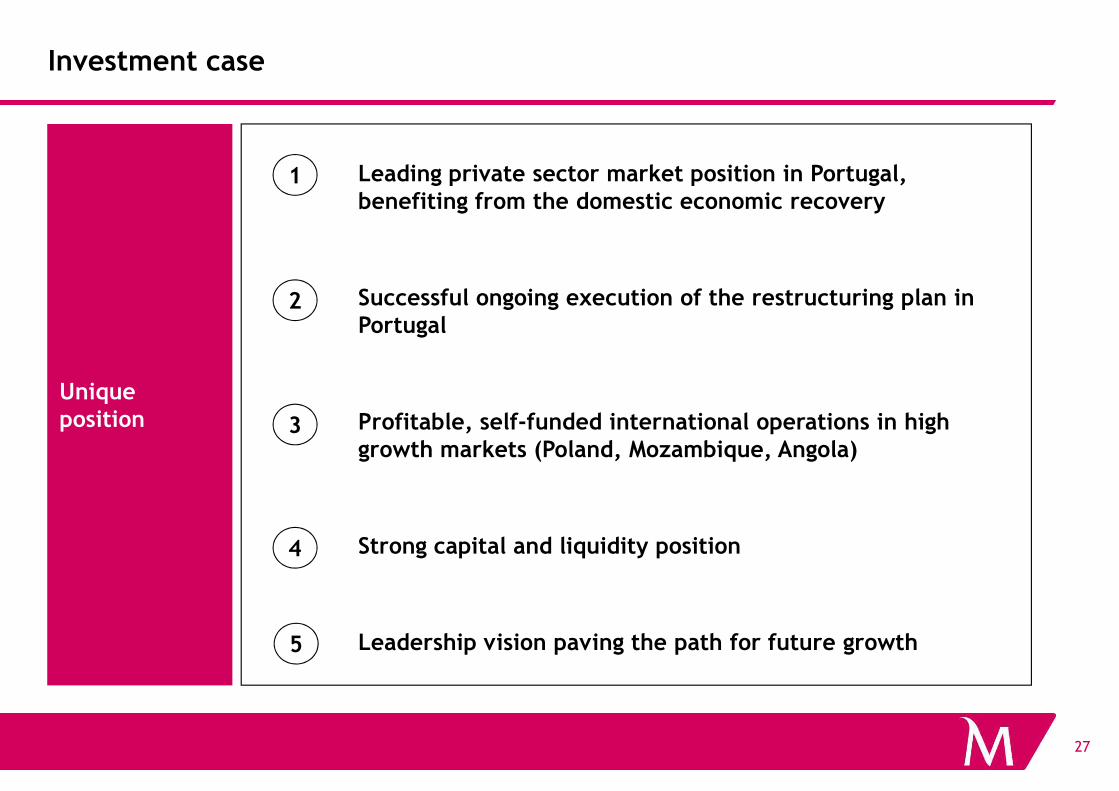
Investment case
Leading private sector market position in Portugal, benefiting from the domestic economic recovery
Successful ongoing execution of the restructuring plan in Portugal
1
2
Unique
27
Profitable, self-funded international operations in high growth markets (Poland, Mozambique, Angola)
Strong capital and liquidity position
Leadership vision paving the path for future growth
3
4
Unique position
5
Summary
1. Portuguese macroeconomic update
2. Overview of Millennium bcp
3. Strategic Plan
A. Strategic plan metrics
B. Liquidity and Capital
28
B. Liquidity and Capital
4. Investment case
5. Appendix
A. 2015 Earnings
B. Other Information
2015 Earnings
� Main Highlights
� Group
• Profitability
Liquidity
29
• Liquidity
• Capital
� Portugal
� International operations
� Conclusions and targets for 2018
Highlights
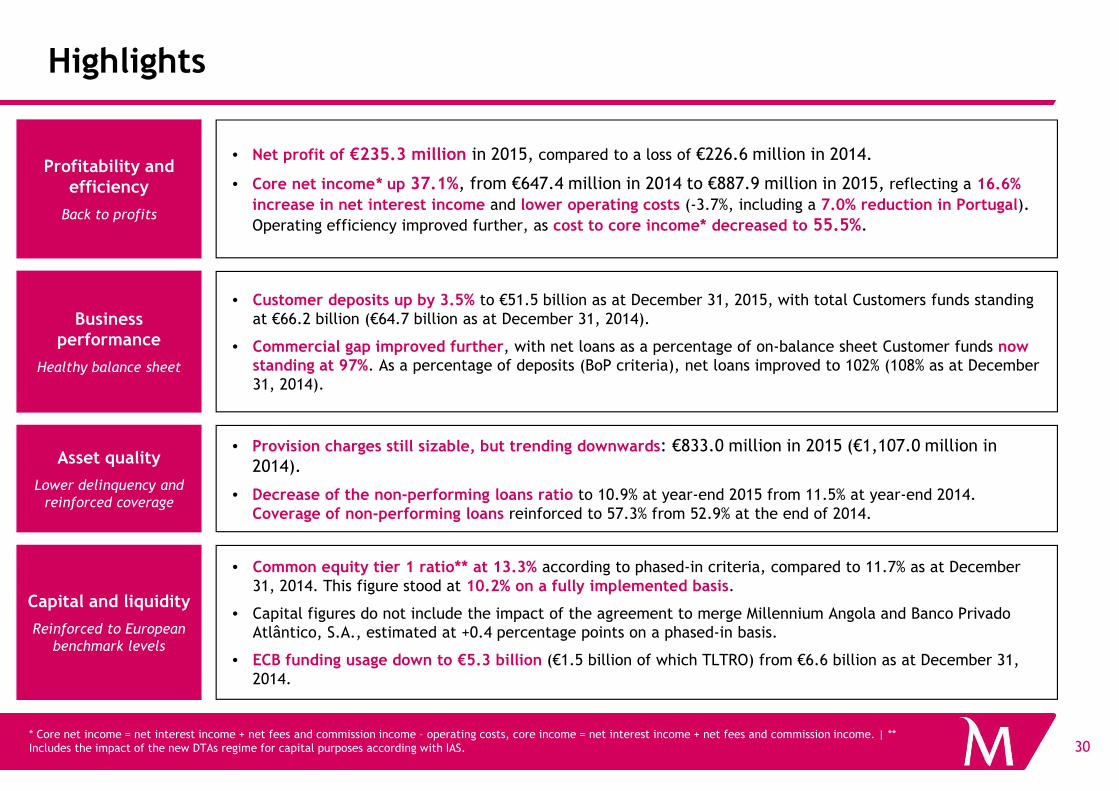
Profitability and efficiency
Back to profits
• Net profit of €235.3 million in 2015, compared to a loss of €226.6 million in 2014.
• Core net income* up 37.1%, from €647.4 million in 2014 to €887.9 million in 2015, reflecting a 16.6%
increase in net interest income and lower operating costs (-3.7%, including a 7.0% reduction in Portugal). Operating efficiency improved further, as cost to core income* decreased to 55.5%.
Business performance
Healthy balance sheet
• Customer deposits up by 3.5% to €51.5 billion as at December 31, 2015, with total Customers funds standing at €66.2 billion (€64.7 billion as at December 31, 2014).
• Commercial gap improved further, with net loans as a percentage of on-balance sheet Customer funds now standing at 97%. As a percentage of deposits (BoP criteria), net loans improved to 102% (108% as at December 31, 2014).
30
Capital and liquidity
Reinforced to European
benchmark levels
• Common equity tier 1 ratio** at 13.3% according to phased-in criteria, compared to 11.7% as at December 31, 2014. This figure stood at 10.2% on a fully implemented basis.
• Capital figures do not include the impact of the agreement to merge Millennium Angola and Banco PrivadoAtlântico, S.A., estimated at +0.4 percentage points on a phased-in basis.
• ECB funding usage down to €5.3 billion (€1.5 billion of which TLTRO) from €6.6 billion as at December 31, 2014.
Asset quality
Lower delinquency and
reinforced coverage
• Provision charges still sizable, but trending downwards: €833.0 million in 2015 (€1,107.0 million in 2014).
• Decrease of the non-performing loans ratio to 10.9% at year-end 2015 from 11.5% at year-end 2014. Coverage of non-performing loans reinforced to 57.3% from 52.9% at the end of 2014.
* Core net income = net interest income + net fees and commission income – operating costs, core income = net interest income + net fees and commission income. | ** Includes the impact of the new DTAs regime for capital purposes according with IAS.
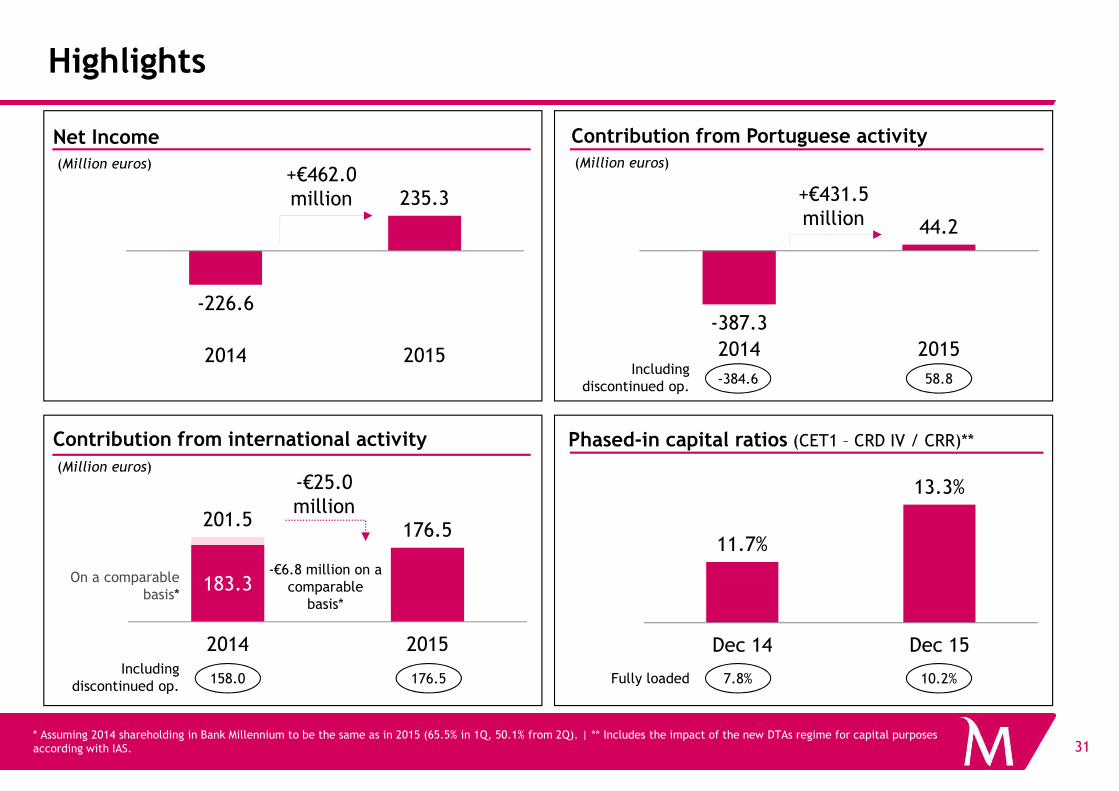
Highlights
Net Income
(Million euros)
Contribution from Portuguese activity
(Million euros)
-226.6
235.3
2014 2015
-387.3
44.2
2014 2015
+€431.5million
+€462.0million
58.8Including
discontinued op.-384.6
31* Assuming 2014 shareholding in Bank Millennium to be the same as in 2015 (65.5% in 1Q, 50.1% from 2Q). | ** Includes the impact of the new DTAs regime for capital purposes according with IAS.
183.3
201.5176.5
2014 2015
Contribution from international activity
(Million euros)
Phased-in capital ratios (CET1 – CRD IV / CRR)**
11.7%
13.3%
Dec 14 Dec 15
-€25.0million
-€6.8 million on a comparable
basis*
On a comparable basis*
176.5Including
discontinued op.7.8% 10.2%Fully loaded158.0
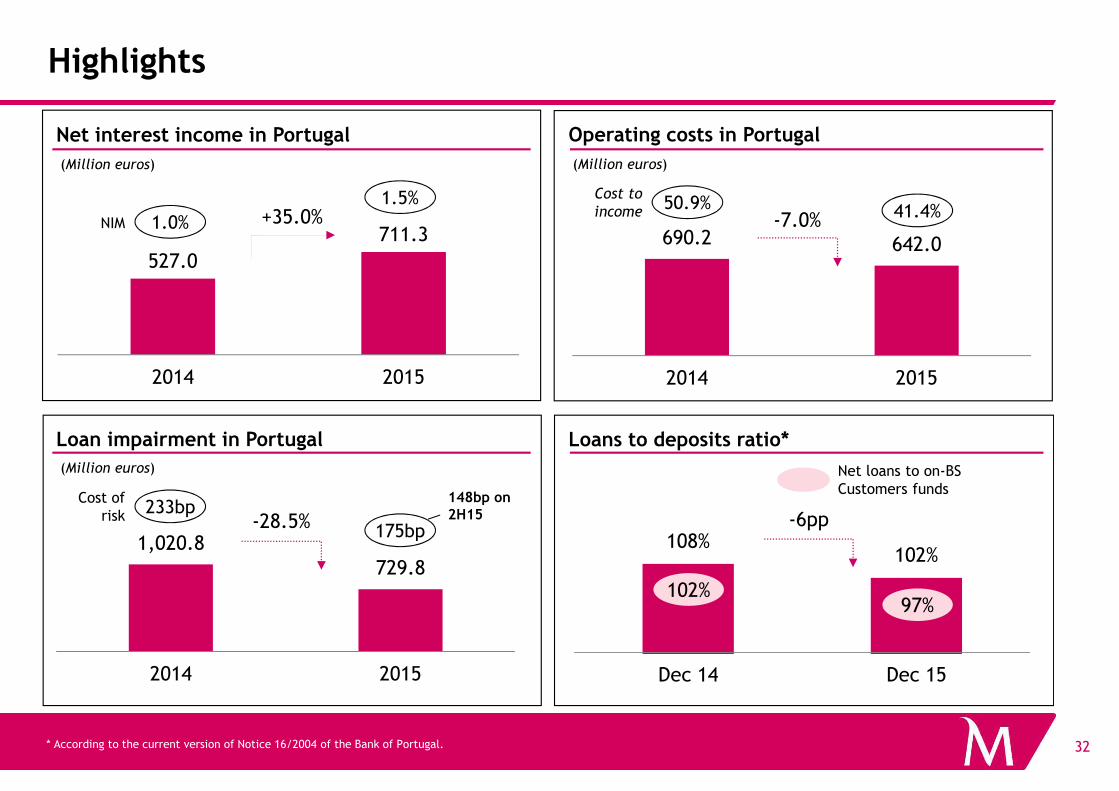
Highlights
Operating costs in Portugal
(Million euros)
Net interest income in Portugal
(Million euros)
690.2 642.0
2014 2015
-7.0%
527.0
711.3
2014 2015
+35.0%1.0%
1.5%
NIM
50.9% 41.4%Cost to
income
32* According to the current version of Notice 16/2004 of the Bank of Portugal.
1,020.8729.8
2014 2015
108%102%
Dec 14 Dec 15
Loans to deposits ratio*Loan impairment in Portugal
(Million euros)
-28.5%
102%97%
Net loans to on-BS Customers funds
-6pp233bp
175bp
Cost of risk
148bp on 2H15
Highlights
Retail Companies and Corporate
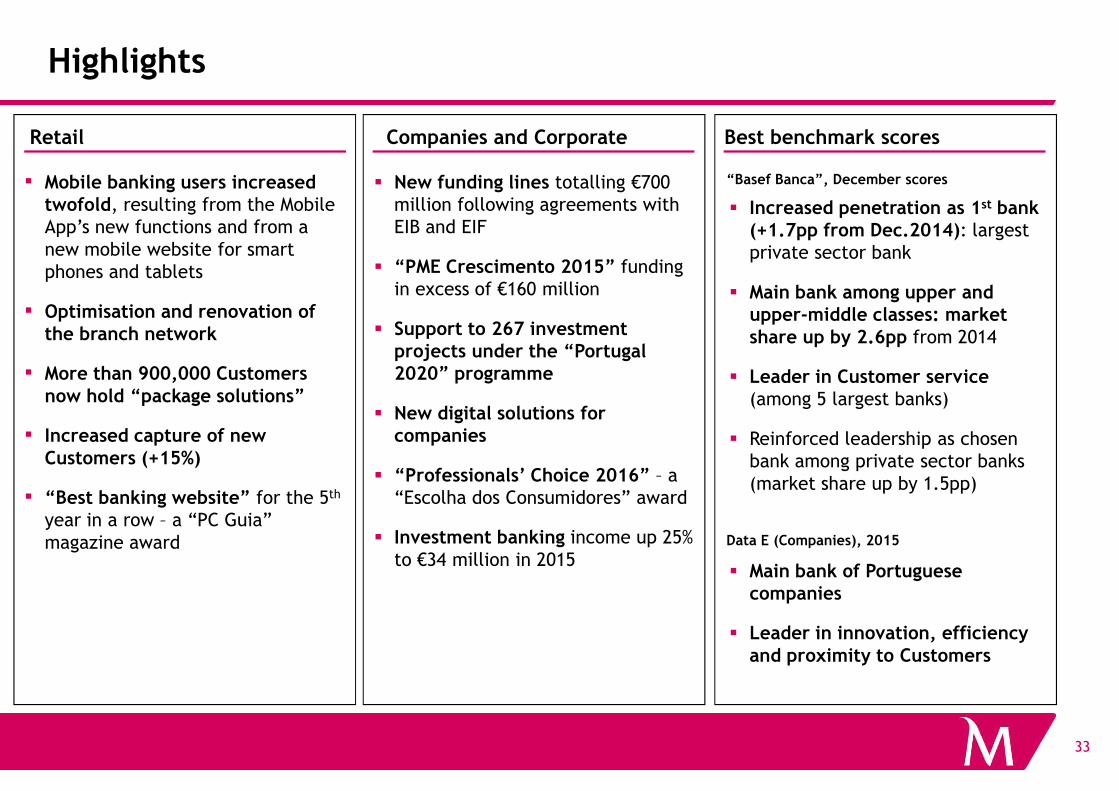
▪ Mobile banking users increased twofold, resulting from the Mobile App’s new functions and from a new mobile website for smart phones and tablets
▪ Optimisation and renovation of the branch network
▪ More than 900,000 Customers now hold “package solutions”
� New funding lines totalling €700 million following agreements with EIB and EIF
� “PME Crescimento 2015” funding in excess of €160 million
� Support to 267 investment projects under the “Portugal 2020” programme
Best benchmark scores
“Basef Banca”, December scores
� Increased penetration as 1st bank (+1.7pp from Dec.2014): largest private sector bank
� Main bank among upper and upper-middle classes: market share up by 2.6pp from 2014
� Leader in Customer service (among 5 largest banks)
33
now hold “package solutions”
▪ Increased capture of new Customers (+15%)
▪ “Best banking website” for the 5th
year in a row – a “PC Guia” magazine award
� New digital solutions for companies
� “Professionals’ Choice 2016” – a “Escolha dos Consumidores” award
� Investment banking income up 25% to €34 million in 2015
Data E (Companies), 2015
(among 5 largest banks)
� Reinforced leadership as chosen bank among private sector banks (market share up by 1.5pp)
� Main bank of Portuguese companies
� Leader in innovation, efficiency and proximity to Customers

2015 Earnings
� Main Highlights
� Group
• Profitability
Liquidity
34
• Liquidity
• Capital
� Portugal
� International operations
� Conclusions and targets for 2018
2015 earnings: profitability affirmed…
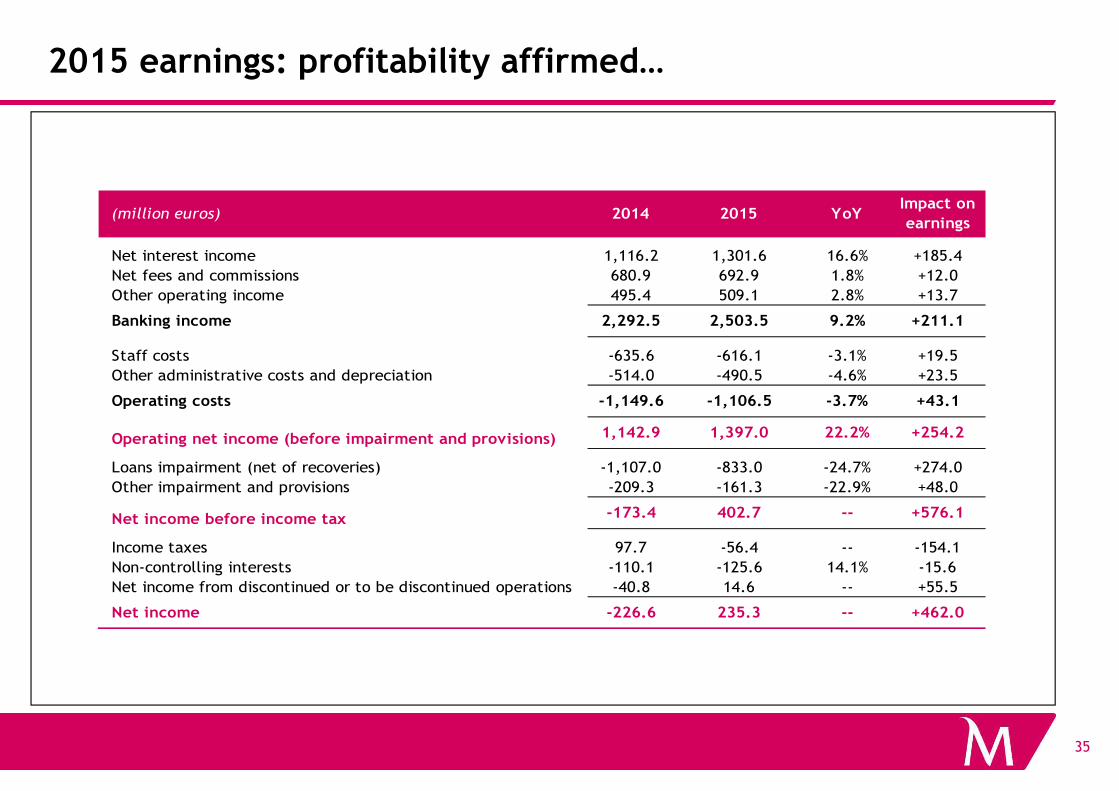
(million euros) 2014 2015 YoYImpact on
earnings
Net interest income 1,116.2 1,301.6 16.6% +185.4
Net fees and commissions 680.9 692.9 1.8% +12.0
Other operating income 495.4 509.1 2.8% +13.7
Banking income 2,292.5 2,503.5 9.2% +211.1
Staff costs -635.6 -616.1 -3.1% +19.5
Other administrative costs and depreciation -514.0 -490.5 -4.6% +23.5
Operating costs -1,149.6 -1,106.5 -3.7% +43.1
35
Operating costs -1,149.6 -1,106.5 -3.7% +43.1
Operating net income (before impairment and provisions) 1,142.9 1,397.0 22.2% +254.2
Loans impairment (net of recoveries) -1,107.0 -833.0 -24.7% +274.0
Other impairment and provisions -209.3 -161.3 -22.9% +48.0
Net income before income tax -173.4 402.7 -- +576.1
Income taxes 97.7 -56.4 -- -154.1
Non-controlling interests -110.1 -125.6 14.1% -15.6
Net income from discontinued or to be discontinued operations -40.8 14.6 -- +55.5
Net income -226.6 235.3 -- +462.0
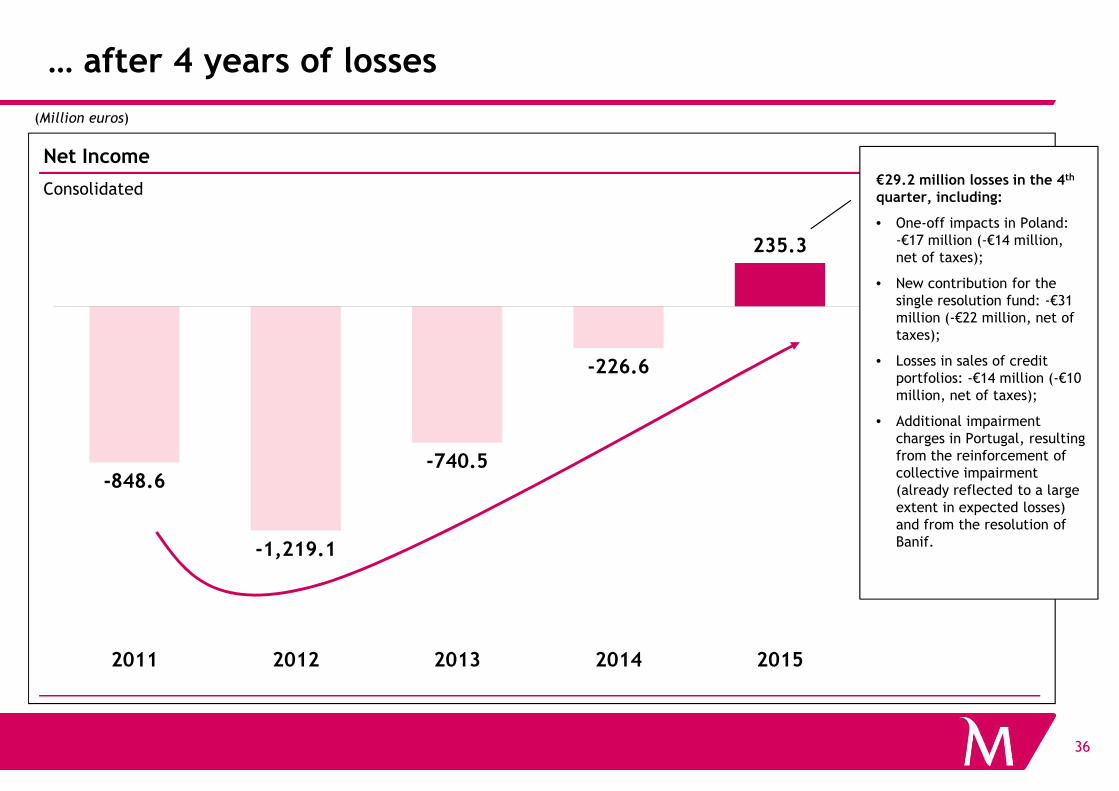
… after 4 years of losses
-226.6
235.3
Net Income
Consolidated
(Million euros)
€29.2 million losses in the 4th
quarter, including:
• One-off impacts in Poland: -€17 million (-€14 million, net of taxes);
• New contribution for the single resolution fund: -€31 million (-€22 million, net of taxes);
• Losses in sales of credit portfolios: -€14 million (-€10 million, net of taxes);
36
-848.6
-1,219.1
-740.5
2011 2012 2013 2014 2015
million, net of taxes);
• Additional impairment charges in Portugal, resulting from the reinforcement of collective impairment (already reflected to a large extent in expected losses) and from the resolution of Banif.
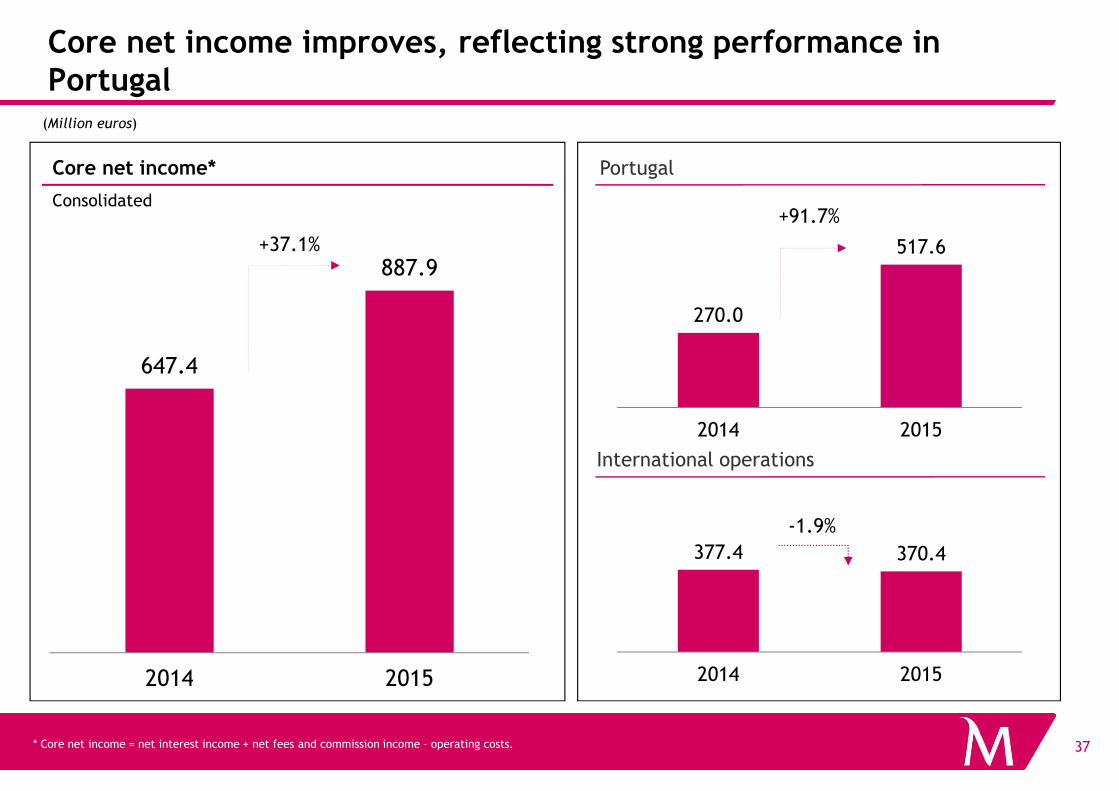
647.4
887.9
Core net income improves, reflecting strong performance in Portugal
(Million euros)
Core net income*
Consolidated
Portugal
270.0
517.6
+91.7%
+37.1%
37
2014 2015
* Core net income = net interest income + net fees and commission income – operating costs.
International operations
377.4 370.4
2014 2015
2014 2015
-1.9%
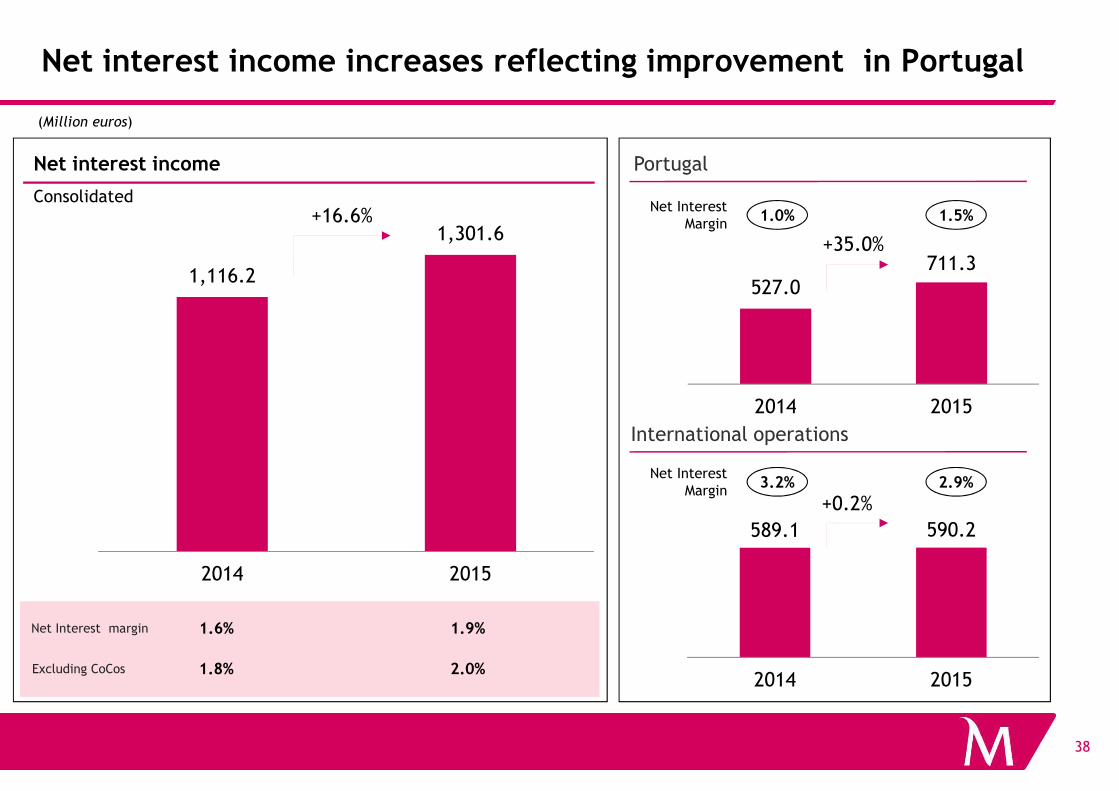
Net interest income increases reflecting improvement in Portugal
1,116.2
1,301.6
(Million euros)
Net interest income
Consolidated
Portugal
+16.6%
527.0711.3
2014 2015
+35.0%
Net Interest Margin
1.0% 1.5%
38
2014 2015
International operations
589.1 590.2
2014 2015
+0.2%
2014 2015
Net Interest margin
Excluding CoCos
1.9%1.6%
2.0%1.8%
Net Interest Margin
3.2% 2.9%
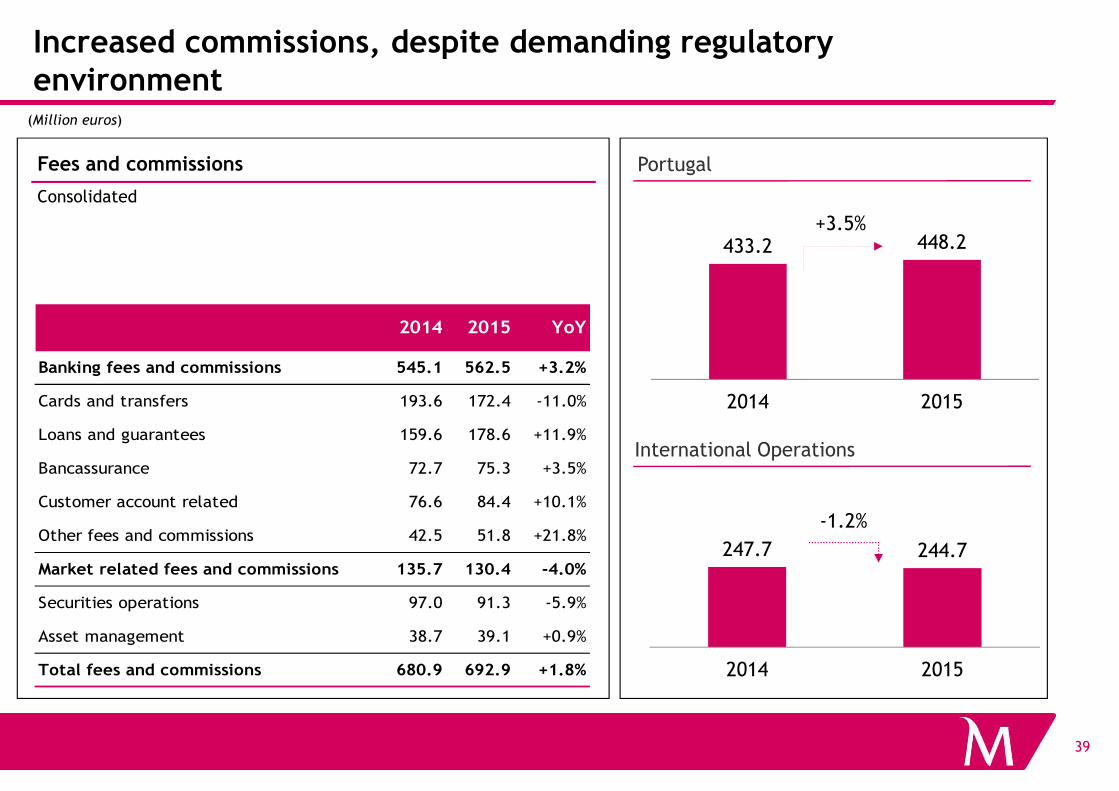
Increased commissions, despite demanding regulatory environment
(Million euros)
433.2 448.2
2014 2015
Fees and commissions
Consolidated
Portugal
+3.5%
2014 2015 YoY
Banking fees and commissions 545.1 562.5 +3.2%
Cards and transfers 193.6 172.4 -11.0%
39
2014 2015
247.7 244.7
2014 2015
-1.2%
International Operations
Cards and transfers 193.6 172.4 -11.0%
Loans and guarantees 159.6 178.6 +11.9%
Bancassurance 72.7 75.3 +3.5%
Customer account related 76.6 84.4 +10.1%
Other fees and commissions 42.5 51.8 +21.8%
Market related fees and commissions 135.7 130.4 -4.0%
Securities operations 97.0 91.3 -5.9%
Asset management 38.7 39.1 +0.9%
Total fees and commissions 680.9 692.9 +1.8%
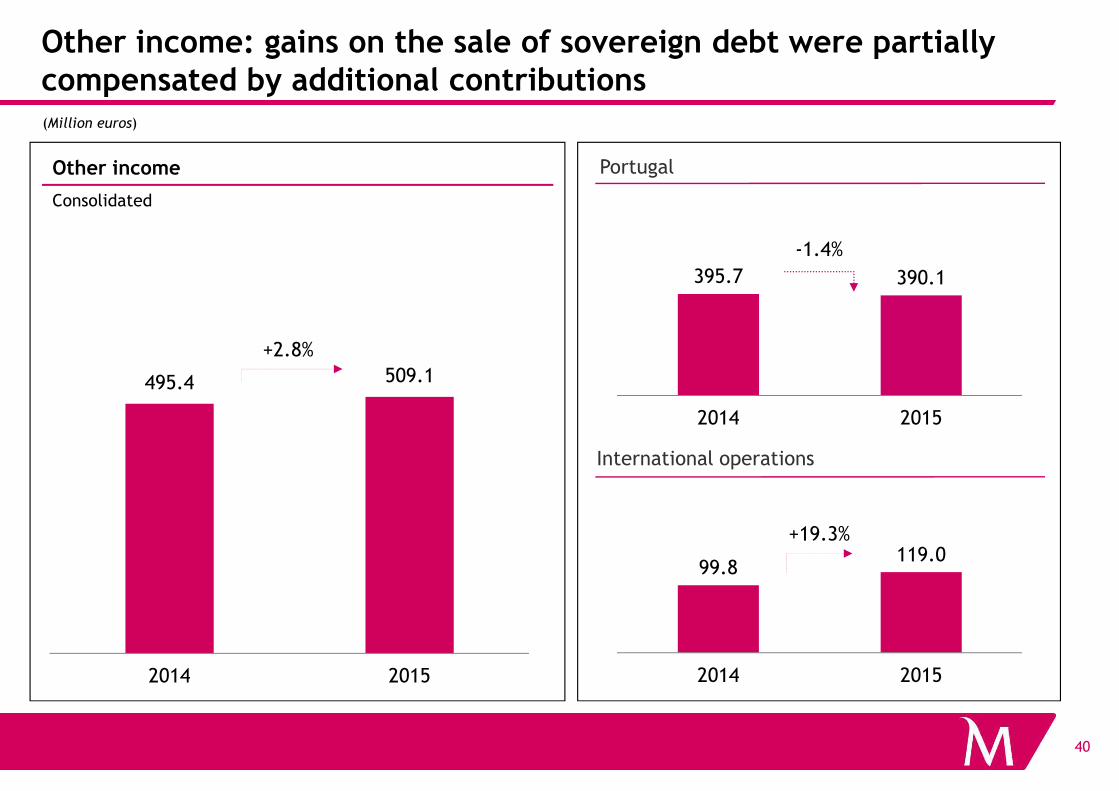
Other income: gains on the sale of sovereign debt were partially compensated by additional contributions(Million euros)
Other income
Consolidated
Portugal
395.7 390.1
-1.4%
495.4 509.1
+2.8%
40
International operations
99.8119.0
2014 2015
2014 2015
+19.3%
2014 2015
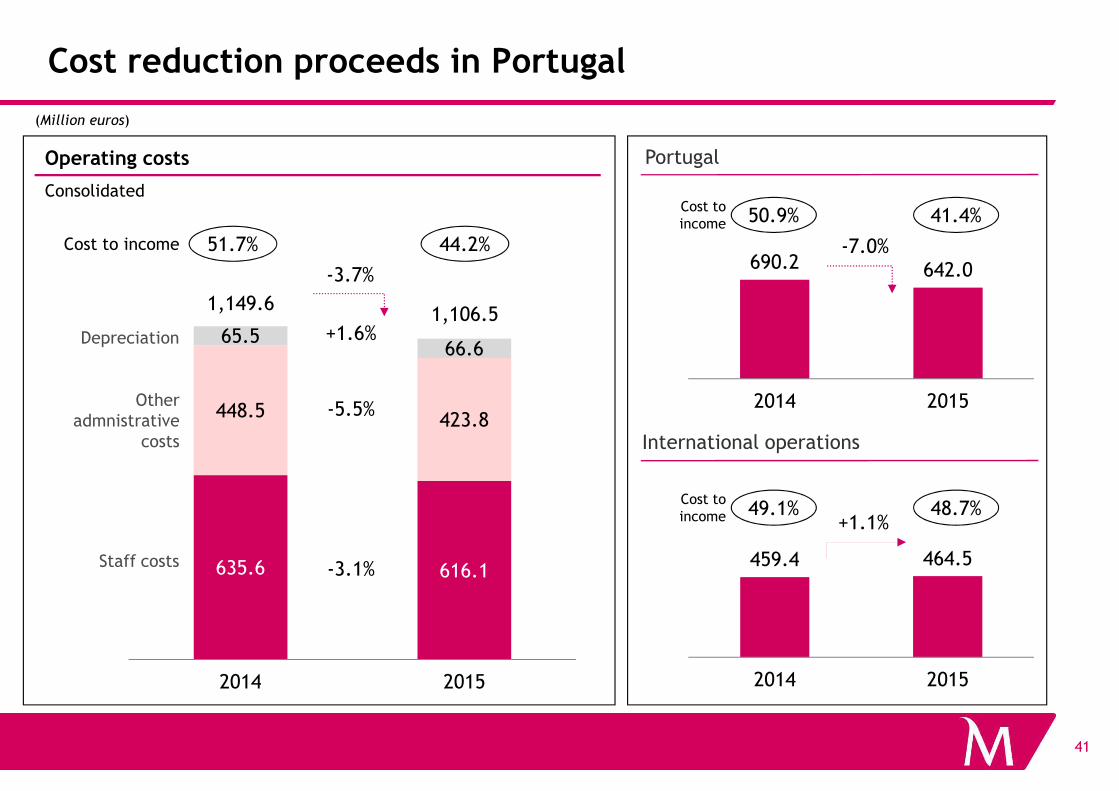
Cost reduction proceeds in Portugal
(Million euros)
Operating costs
Consolidated
690.2 642.0
2014 2015
-7.0%
Portugal
65.566.6
+1.6%
-3.7%
1,149.61,106.5
Other
Depreciation
Cost to income 50.9% 41.4%
Cost to income 51.7% 44.2%
41
2014 2015
459.4 464.5
2014 2015
+1.1%
International operations
635.6 616.1
448.5 423.8
2014 2015
-5.5%
-3.1%Staff costs
Other admnistrative
costs
Cost to income 49.1% 48.7%

Millennium bcp is one of the most efficient banks in Portugal and in the Eurozone
Cost to core income*Cost to core income*
Bank 1
Latest available data
110.3%
71.9%
55.5%
2013 2014 2015
vs. peers in Portugalvs. Eurozone listed banks
-55pp
83%
55%
57%
55%
42* Core Income = net interest income + net fees and commissions.
� Millennium bcp is the most efficient bank in Portugal and is among the most efficient in the Eurozone, with a cost to core income* of 55% in 2015.
� Millennium bcp is also the most improved bank in Portugal in terms of cost to core income* in recent years: 55pp down from 2013
Bank 2
Bank 3
Bank 4
71%
57%
69%
80%
72%
97%
67%
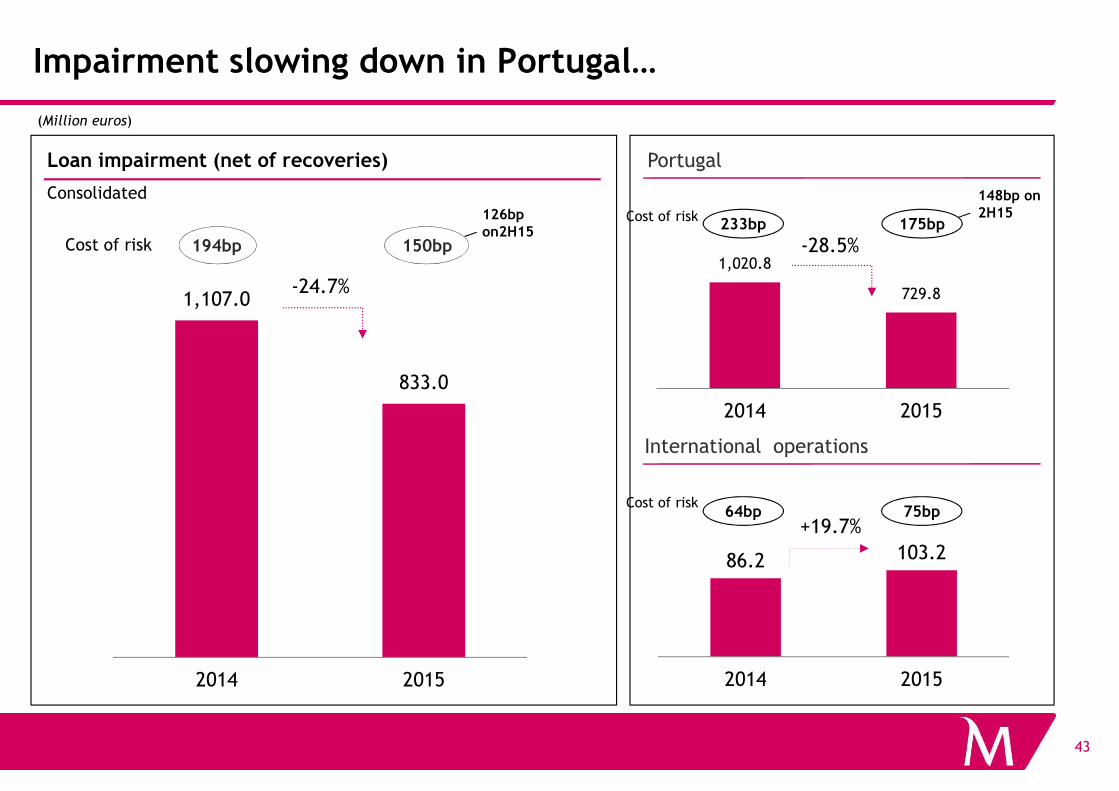
Impairment slowing down in Portugal…
Loan impairment (net of recoveries)
Consolidated
1,107.0
833.0
Cost of risk 194bp 150bp
(Million euros)
Portugal
1,020.8
729.8
-28.5%
-24.7%
126bp on2H15
Cost of risk233bp 175bp
148bp on 2H15
43
2014 2015
86.2 103.2
2014 2015
+19.7%
International operations
2014 2015
Cost of risk64bp 75bp
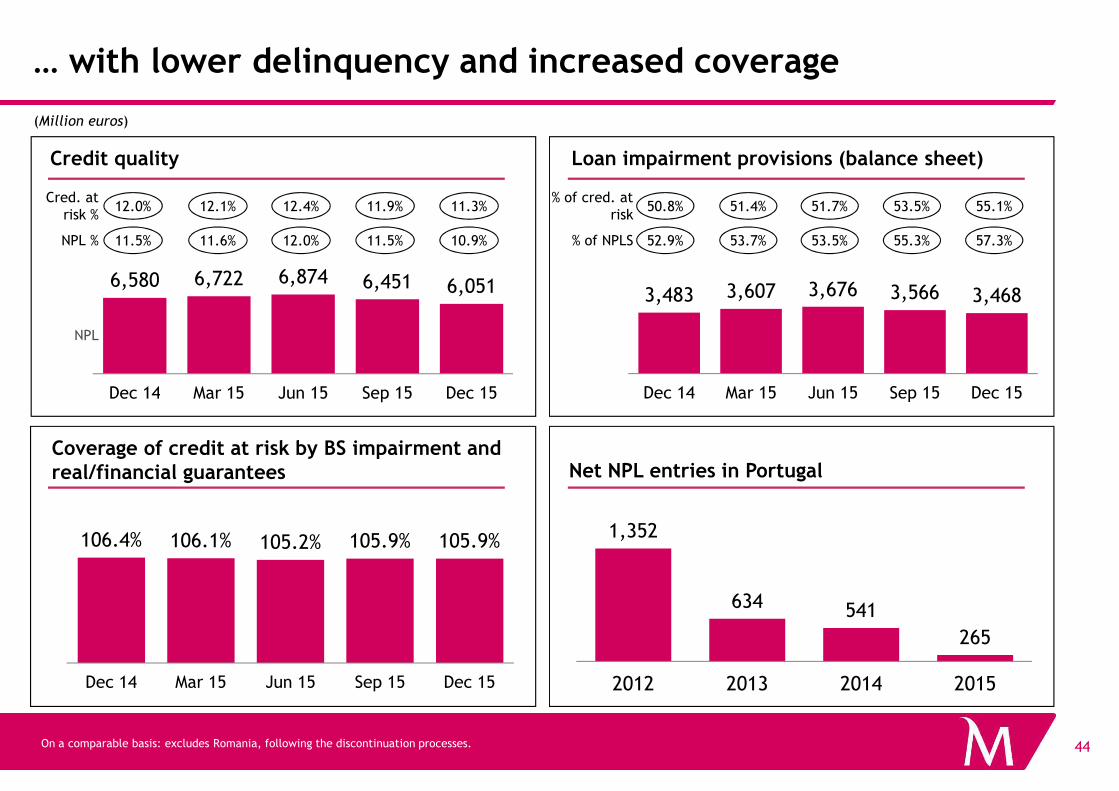
… with lower delinquency and increased coverage
(Million euros)
Loan impairment provisions (balance sheet)Credit quality
6,580 6,722 6,874 6,451 6,051
Dec 14 Mar 15 Jun 15 Sep 15 Dec 15
NPL
3,483 3,607 3,676 3,566 3,468
Dec 14 Mar 15 Jun 15 Sep 15 Dec 15
NPL %
Cred. atrisk %
11.5% 11.6% 12.0% 11.5% 10.9%
12.0% 12.1% 12.4% 11.9% 11.3%% of cred. at
risk
% of NPLS
50.8% 51.4% 51.7% 53.5% 55.1%
52.9% 53.7% 53.5% 55.3% 57.3%
44
1,352
634 541
265
2012 2013 2014 2015
On a comparable basis: excludes Romania, following the discontinuation processes.
Net NPL entries in PortugalCoverage of credit at risk by BS impairment and real/financial guarantees
106.4% 106.1% 105.2% 105.9% 105.9%
Dec 14 Mar 15 Jun 15 Sep 15 Dec 15
Dec 14 Mar 15 Jun 15 Sep 15 Dec 15 Dec 14 Mar 15 Jun 15 Sep 15 Dec 15
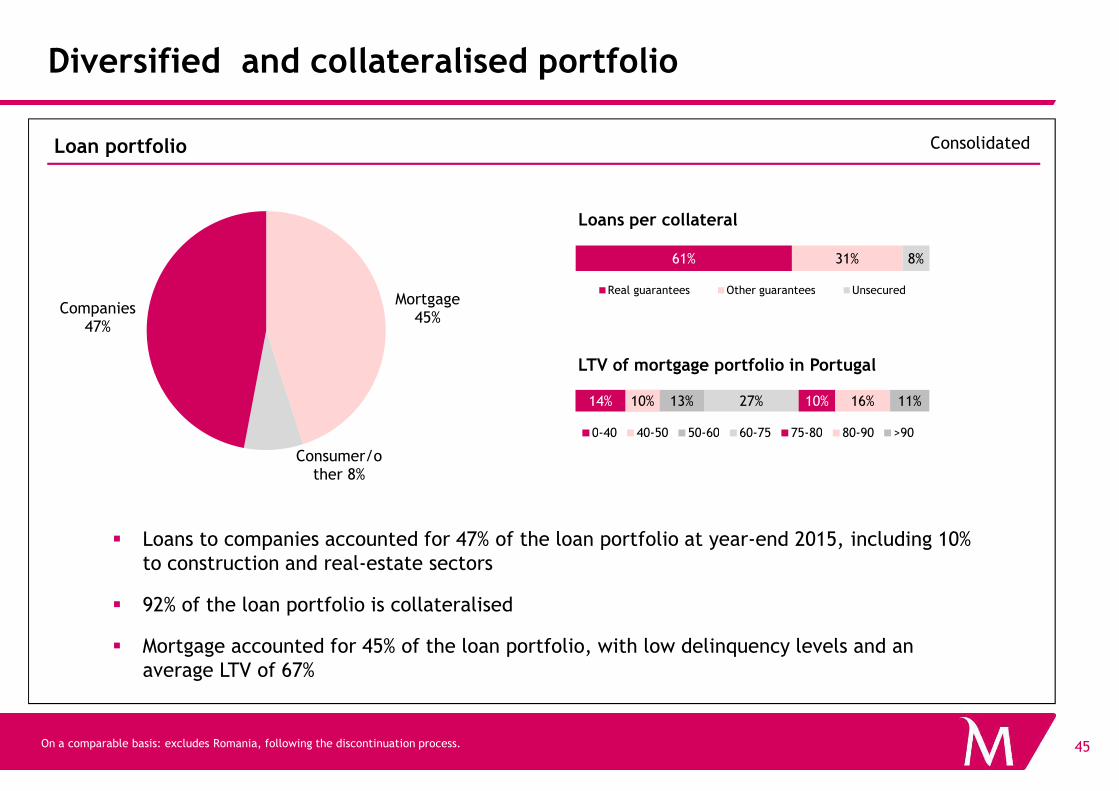
Diversified and collateralised portfolio
Mortgage 45%
Companies 47%
61% 31% 8%
Real guarantees Other guarantees Unsecured
Loan portfolio
Loans per collateral
Consolidated
LTV of mortgage portfolio in Portugal
14% 10% 13% 27% 10% 16% 11%
45On a comparable basis: excludes Romania, following the discontinuation process.
Consumer/other 8%
� Loans to companies accounted for 47% of the loan portfolio at year-end 2015, including 10% to construction and real-estate sectors
� 92% of the loan portfolio is collateralised
� Mortgage accounted for 45% of the loan portfolio, with low delinquency levels and an average LTV of 67%
14% 10% 13% 27% 10% 16% 11%
0-40 40-50 50-60 60-75 75-80 80-90 >90
2015 Earnings
� Main Highlights
� Group
• Profitability
Liquidity
46
• Liquidity
• Capital
� Portugal
� International operations
� Conclusions and targets for 2018
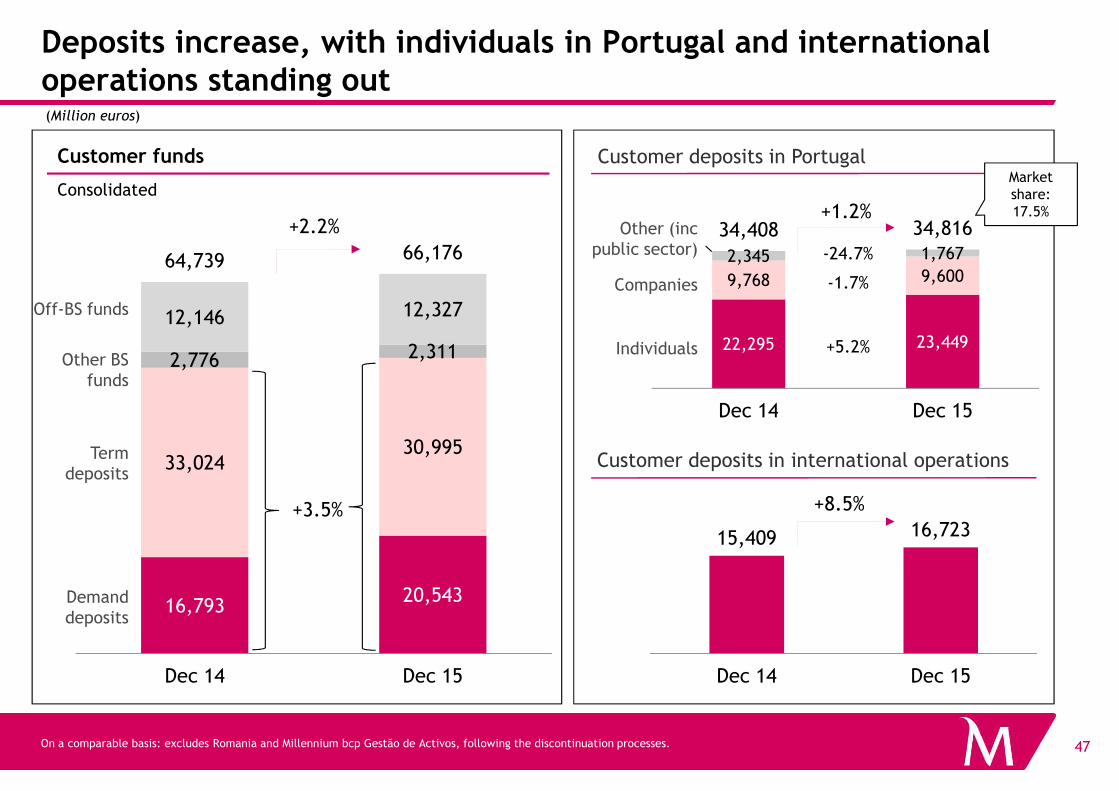
Deposits increase, with individuals in Portugal and international operations standing out(Million euros)
Customer deposits in Portugal
22,295 23,449
9,768 9,6002,345 1,767
34,408 34,816
+5.2%
-1.7%
+1.2%
-24.7%
2,776 2,311
12,146 12,327
64,739 66,176
+2.2%
Customer funds
Consolidated
Other BS funds
Off-BS funds
Individuals
Companies
Other (inc public sector)
Market share: 17.5%
47On a comparable basis: excludes Romania and Millennium bcp Gestão de Activos, following the discontinuation processes.
Customer deposits in international operations
15,409 16,723
Dec 14 Dec 15
+8.5%
Dec 14 Dec 15
16,79320,543
33,02430,995
Dec 14 Dec 15
+3.5%
Demand deposits
Term deposits
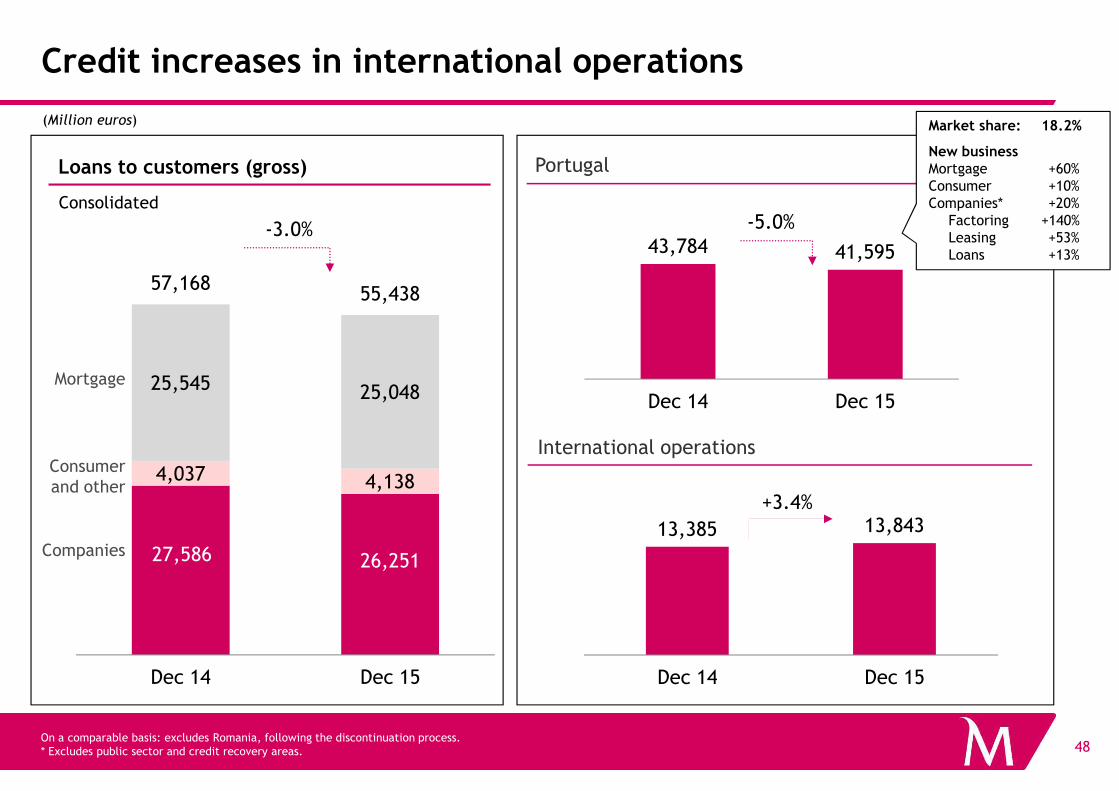
Credit increases in international operations
(Million euros)
Loans to customers (gross)
25,545 25,048
57,16855,438
-3.0%
Portugal
Consolidated
Mortgage
43,784 41,595
Dec 14 Dec 15
-5.0%
Market share: 18.2%
New businessMortgage +60%Consumer +10%Companies* +20%
Factoring +140%Leasing +53%Loans +13%
48On a comparable basis: excludes Romania, following the discontinuation process. * Excludes public sector and credit recovery areas.
27,586 26,251
4,037 4,138
25,048
Dec 14 Dec 15
International operations
13,385 13,843
Dec 14 Dec 15
+3.4%
Companies
Consumer and other
Dec 14 Dec 15
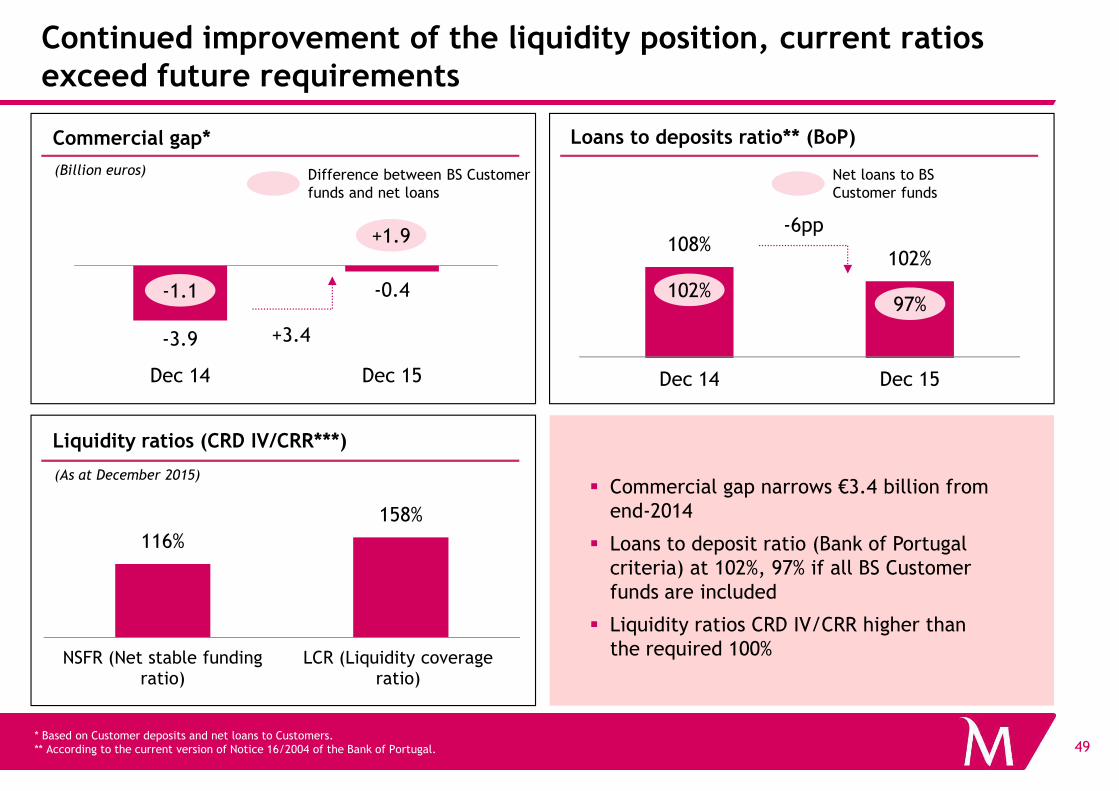
Continued improvement of the liquidity position, current ratios exceed future requirements
Commercial gap* Loans to deposits ratio** (BoP)
(Billion euros)
108%102%
Dec 14 Dec 15
102%97%
Net loans to BS Customer funds
-6pp
-3.9
-0.4
Dec 14 Dec 15
+3.4
-1.1
+1.9
Difference between BS Customer funds and net loans
49* Based on Customer deposits and net loans to Customers. ** According to the current version of Notice 16/2004 of the Bank of Portugal.
Liquidity ratios (CRD IV/CRR***)
� Commercial gap narrows €3.4 billion from end-2014
� Loans to deposit ratio (Bank of Portugal criteria) at 102%, 97% if all BS Customer funds are included
� Liquidity ratios CRD IV/CRR higher than the required 100%
(As at December 2015)
116%
158%
NSFR (Net stable funding ratio)
LCR (Liquidity coverage ratio)
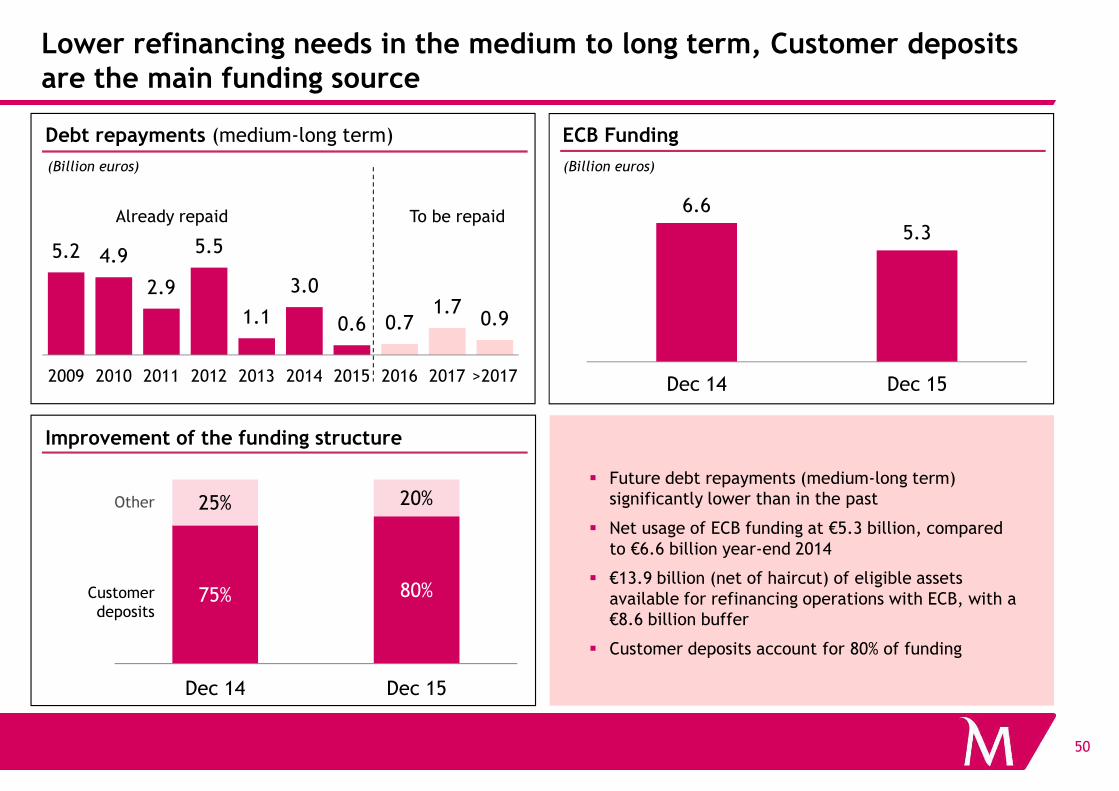
Lower refinancing needs in the medium to long term, Customer deposits are the main funding source
5.2 4.9
2.9
5.5
1.1
3.0
0.6 0.71.7
0.9
2009 2010 2011 2012 2013 2014 2015 2016 2017 >2017
Debt repayments (medium-long term)
Already repaid
(Billion euros)
To be repaid6.6
5.3
Dec 14 Dec 15
ECB Funding
(Billion euros)
50
Improvement of the funding structure
75% 80%
25% 20%
Dec 14 Dec 15
Customer deposits
Other
� Future debt repayments (medium-long term) significantly lower than in the past
� Net usage of ECB funding at €5.3 billion, compared to €6.6 billion year-end 2014
� €13.9 billion (net of haircut) of eligible assets available for refinancing operations with ECB, with a €8.6 billion buffer
� Customer deposits account for 80% of funding
2015 Earnings
� Main Highlights
� Group
• Profitability
Liquidity
51
• Liquidity
• Capital
� Portugal
� International operations
� Conclusions and targets for 2018

11.7%13.1% 13.3%
7.8%9.6% 10.2%
Dec 14 Jun 15 Dec 15 Dec 14 Jun 15 Dec 15
Capital strengthened to European benchmarks, supported by profitability and specific measures
Common Equity Tier 1 ratio*Phased-in, latest available data
vs. Eurozone listed banks
Common Equity Tier 1 ratio*
Phased-in Fully implemented
Does not include effect of merge agreement in Angola (+0.4pp)
11.7%
13.3%
52
43.5 43.3 42.8 42.7
* Includes the impact of the new DTAs regime for capital purposes according with IAS.
RWAs(€Bln)
� Capital ratios strengthened from 31 December 2014 to 13.3% according to phased-in criteria and to 10.2% on a fully implemented basis, reflecting the sale of a 15.4% shareholding in Bank Millennium (Poland), the debt-equity swap, earnings for 2015 and lower RWAs
� Millennium bcp has the 2nd strongest capital in Portugal, and is in line with European benchmarks
� Leverage ratio at 7.3% according to phased-in criteria and on a fully implemented basis, this ratio stood at 5.6%
44.1 43.5
13.7%
12.1%
12.4%
Pension fund
Pension fundKey figures
Assumptions
(Million euros) Equities 21%
Bonds 42%
Property 9%
Loans to banks,
other 28%Dec 14 Jun 15 Dec 15
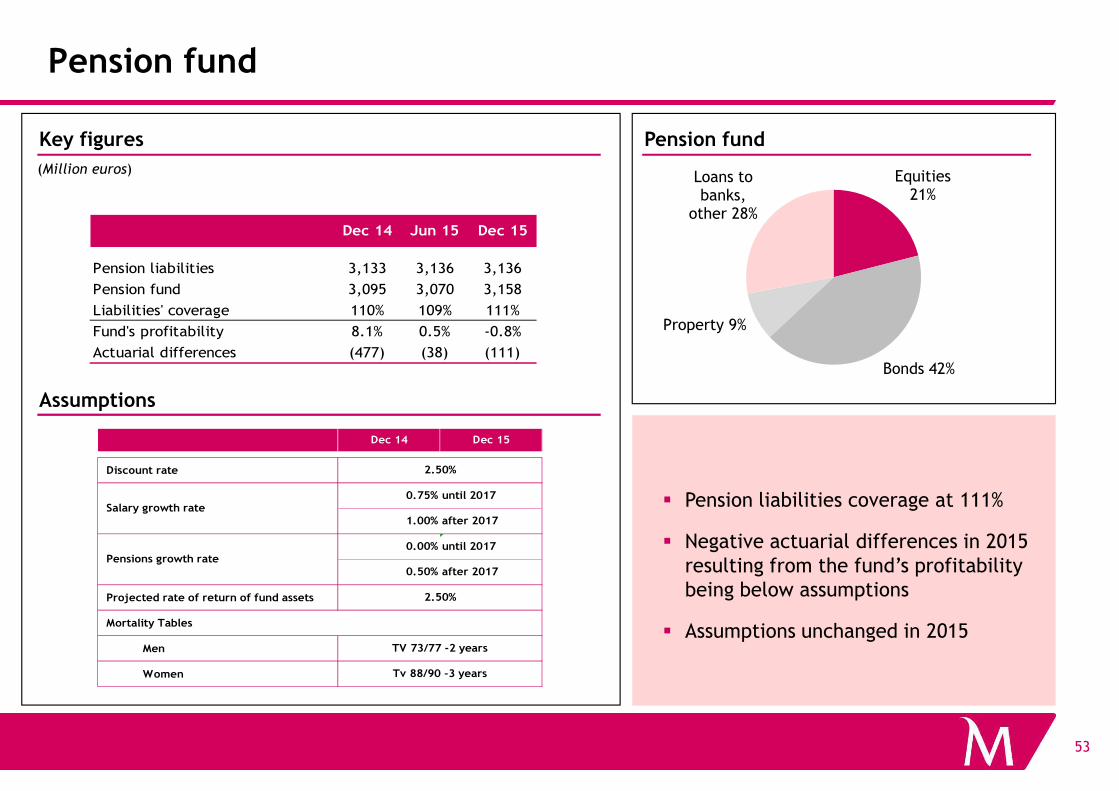
Pension liabilities 3,133 3,136 3,136
Pension fund 3,095 3,070 3,158
Liabilities' coverage 110% 109% 111%
Fund's profitability 8.1% 0.5% -0.8%
Actuarial differences (477) (38) (111)
53
� Pension liabilities coverage at 111%
� Negative actuarial differences in 2015 resulting from the fund’s profitability being below assumptions
� Assumptions unchanged in 2015
Assumptions
Discount rate
Projected rate of return of fund assets
Mortality Tables
Men
Women
until 2017
after 2017
until 2017
after 2017
0.75%
1.00%
0.00%
0.50%
Dec 15
TV 73/77 -2 years
Tv 88/90 -3 years
Dec 14
2.50%
2.50%
Salary growth rate
Pensions growth rate
2015 Earnings
� Main Highlights
� Group
• Profitability
Liquidity
54
• Liquidity
• Capital
� Portugal
� International operations
� Conclusions and targets for 2018
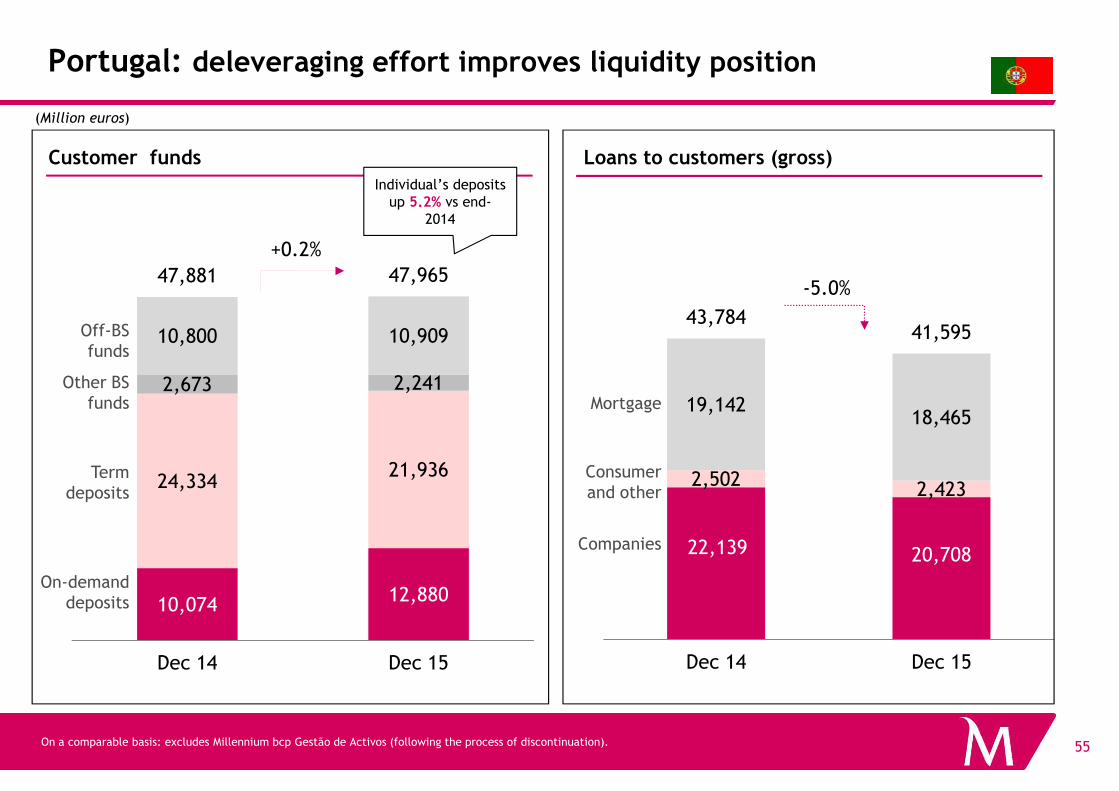
2,673 2,241
10,800 10,909
47,881 47,965
Portugal: deleveraging effort improves liquidity position
(Million euros)
Loans to customers (gross)Customer funds
+0.2%
19,142
43,78441,595
-5.0%
Individual’s deposits up 5.2% vs end-
2014
Other BS funds
Off-BS funds
Mortgage
55
10,074 12,880
24,33421,936
2,673
Dec 14 Dec 15
On a comparable basis: excludes Millennium bcp Gestão de Activos (following the process of discontinuation).
22,139 20,708
2,5022,423
19,14218,465
Dec 14 Dec 15
On-demand deposits
Term deposits
funds
Companies
Consumer and other
Mortgage
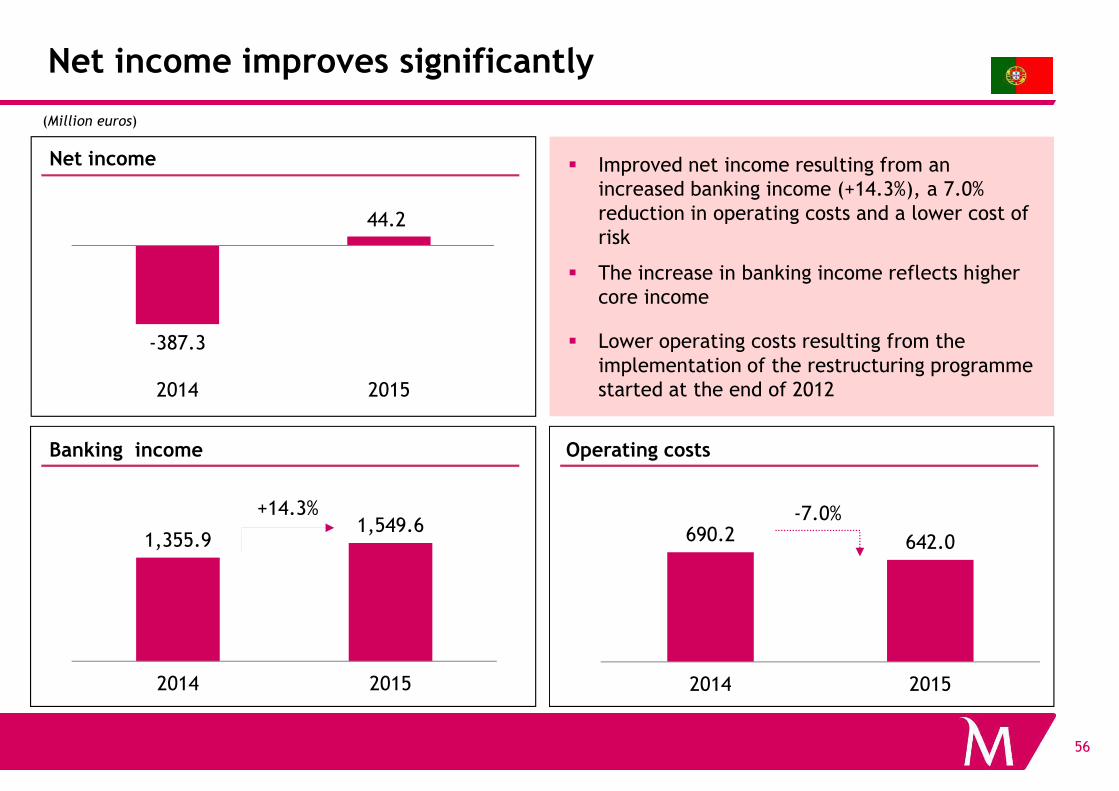
Net income improves significantly
-387.3
44.2
2014 2015
(Million euros)
Net income � Improved net income resulting from an increased banking income (+14.3%), a 7.0% reduction in operating costs and a lower cost of risk
� The increase in banking income reflects higher core income
� Lower operating costs resulting from the implementation of the restructuring programme started at the end of 2012
56
2014 2015
1,355.91,549.6
2014 2015
690.2 642.0
2014 2015
+14.3% -7.0%
Banking income Operating costs
started at the end of 2012
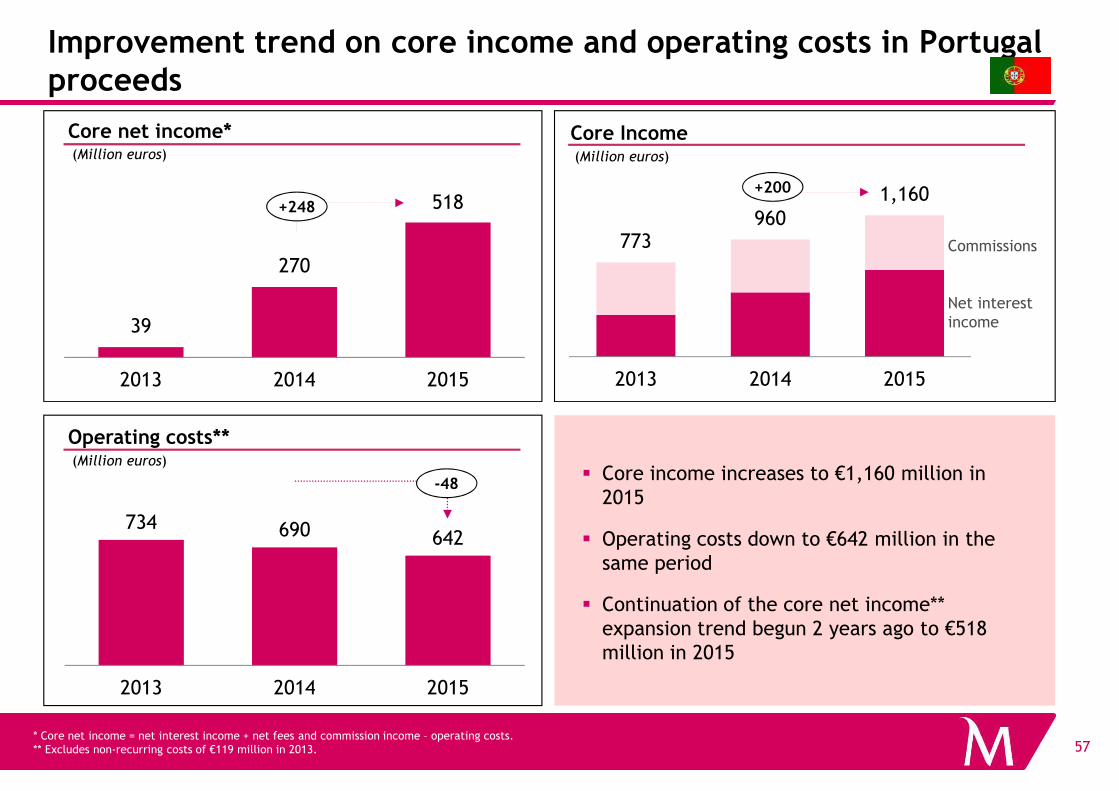
Improvement trend on core income and operating costs in Portugal proceeds
Core Income(Million euros)
773960
1,160
2013 2014 2015
Commissions
Net interest income
Core net income*(Million euros)
39
270
518
2013 2014 2015
+200
+248
57* Core net income = net interest income + net fees and commission income – operating costs.** Excludes non-recurring costs of €119 million in 2013.
� Core income increases to €1,160 million in 2015
� Operating costs down to €642 million in the same period
� Continuation of the core net income** expansion trend begun 2 years ago to €518 million in 2015
Operating costs**(Million euros)
734 690 642
2013 2014 2015
-48
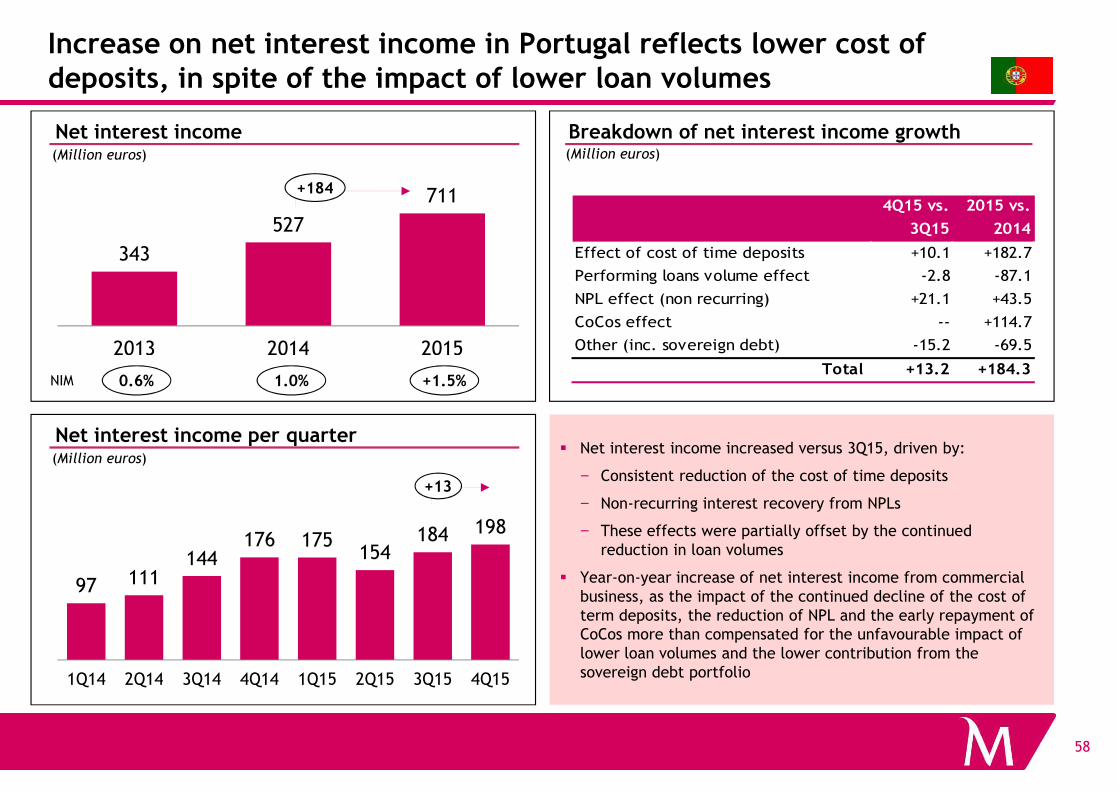
Increase on net interest income in Portugal reflects lower cost of deposits, in spite of the impact of lower loan volumes
Net interest income(Million euros)
Breakdown of net interest income growth(Million euros)
4Q15 vs.
3Q15
2015 vs.
2014
Effect of cost of time deposits +10.1 +182.7
Performing loans volume effect -2.8 -87.1
NPL effect (non recurring) +21.1 +43.5
CoCos effect -- +114.7
Other (inc. sovereign debt) -15.2 -69.5
Total +13.2 +184.3
343
527
711
2013 2014 2015
+184
1.0% +1.5%0.6%NIM
58
Net interest income per quarter(Million euros)
� Net interest income increased versus 3Q15, driven by:
− Consistent reduction of the cost of time deposits
− Non-recurring interest recovery from NPLs
− These effects were partially offset by the continued reduction in loan volumes
� Year-on-year increase of net interest income from commercial business, as the impact of the continued decline of the cost of term deposits, the reduction of NPL and the early repayment of CoCos more than compensated for the unfavourable impact of lower loan volumes and the lower contribution from the sovereign debt portfolio
97 111144
176 175154
184 198
1Q14 2Q14 3Q14 4Q14 1Q15 2Q15 3Q15 4Q15
+13
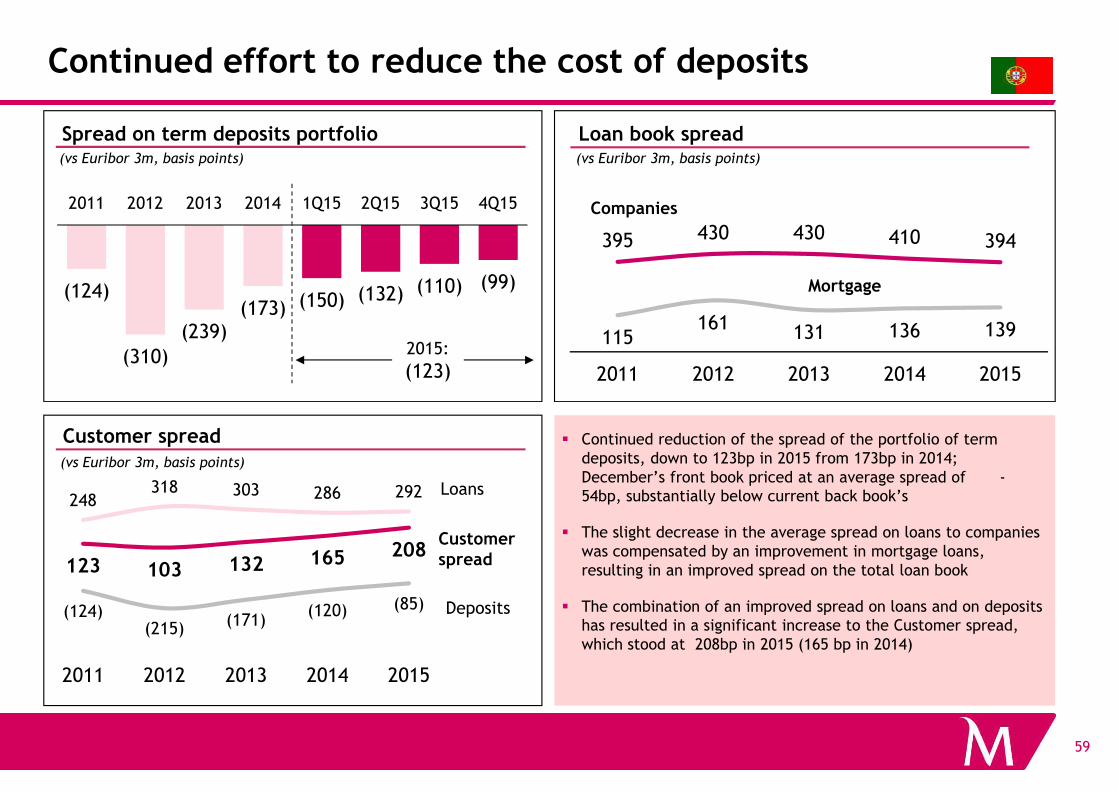
Continued effort to reduce the cost of deposits
Loan book spread
115161 131 136 139
395 430 430 410 394
2011 2012 2013 2014 2015
(124)
(310)(239)
(173) (150) (132) (110) (99)
2011 2012 2013 2014 1Q15 2Q15 3Q15 4Q15 Companies
Mortgage
(vs Euribor 3m, basis points)
2015:
(123)
Spread on term deposits portfolio (vs Euribor 3m, basis points)
59
� Continued reduction of the spread of the portfolio of term deposits, down to 123bp in 2015 from 173bp in 2014; December’s front book priced at an average spread of -54bp, substantially below current back book’s
� The slight decrease in the average spread on loans to companies was compensated by an improvement in mortgage loans, resulting in an improved spread on the total loan book
� The combination of an improved spread on loans and on deposits has resulted in a significant increase to the Customer spread, which stood at 208bp in 2015 (165 bp in 2014)
248318 303 286 292
(124)(215) (171)
(120) (85)
123 103 132 165 208
2011 2012 2013 2014 2015
Customer spread
(vs Euribor 3m, basis points)
Loans
Deposits
Customerspread
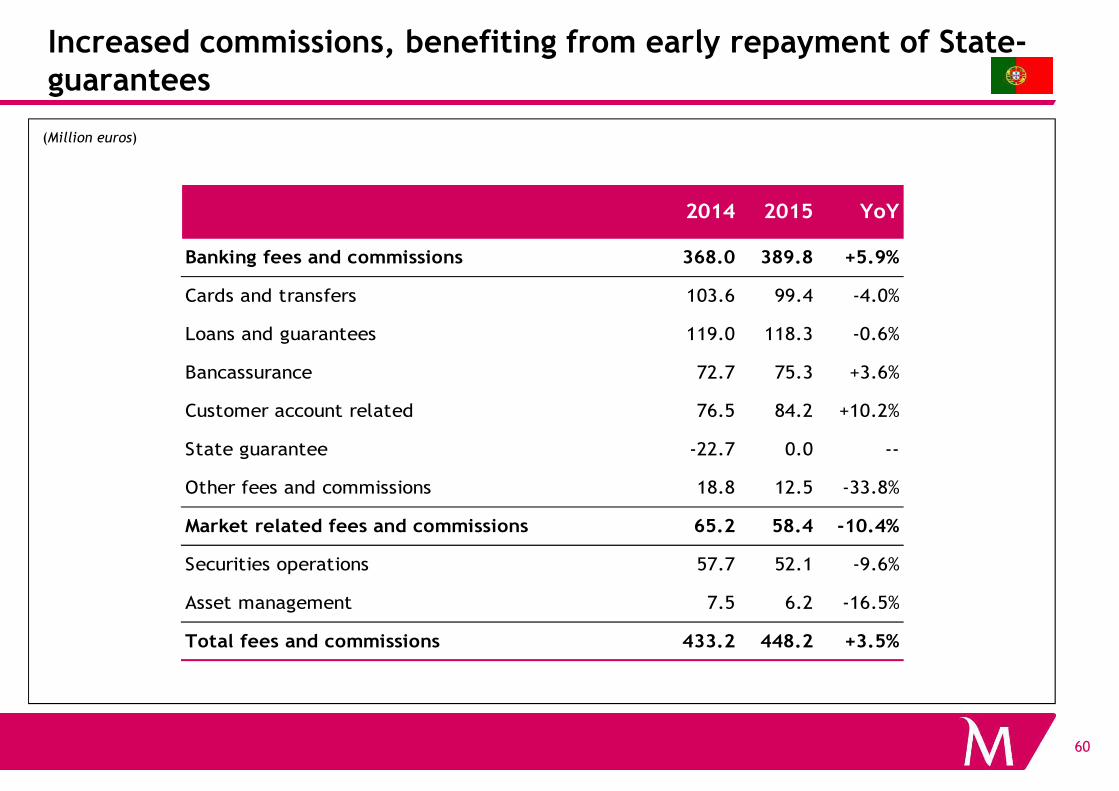
Increased commissions, benefiting from early repayment of State-guarantees
(Million euros)
2014 2015 YoY
Banking fees and commissions 368.0 389.8 +5.9%
Cards and transfers 103.6 99.4 -4.0%
Loans and guarantees 119.0 118.3 -0.6%
Bancassurance 72.7 75.3 +3.6%
60
Customer account related 76.5 84.2 +10.2%
State guarantee -22.7 0.0 --
Other fees and commissions 18.8 12.5 -33.8%
Market related fees and commissions 65.2 58.4 -10.4%
Securities operations 57.7 52.1 -9.6%
Asset management 7.5 6.2 -16.5%
Total fees and commissions 433.2 448.2 +3.5%
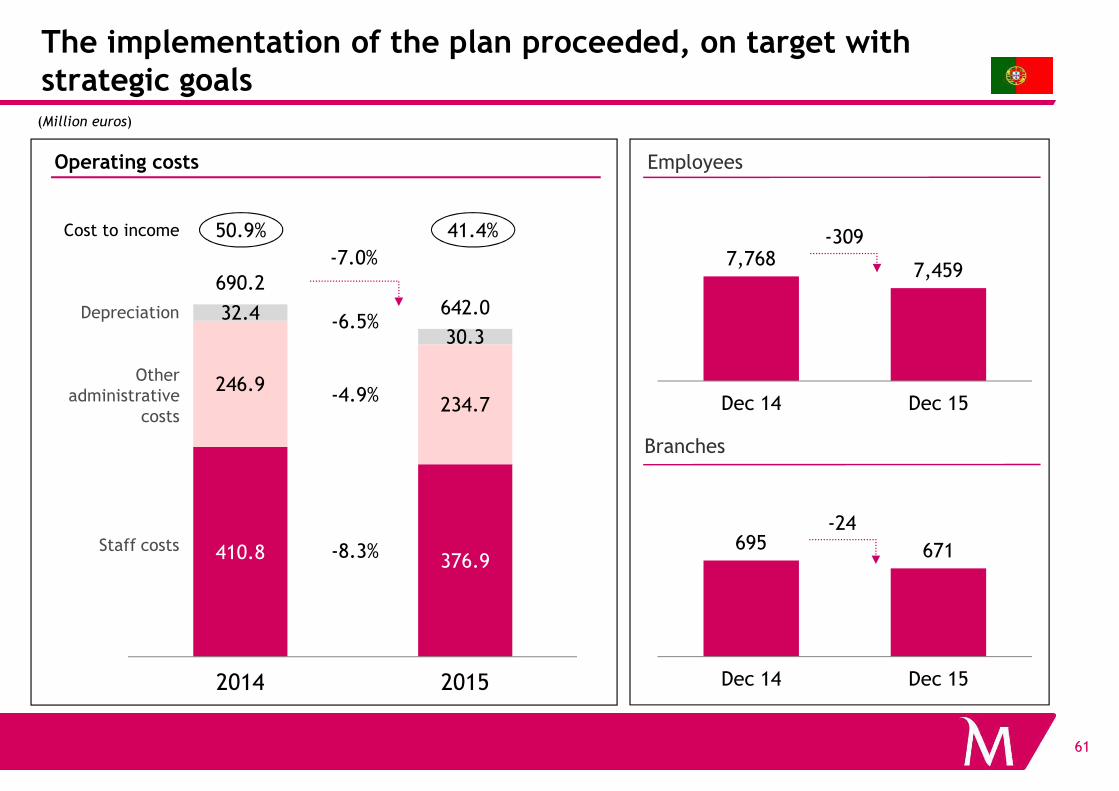
The implementation of the plan proceeded, on target with strategic goals
Employees
(Million euros)
246.9234.7
32.430.3
690.2642.0
-6.5%
-4.9%
-7.0%
Operating costs
7,7687,459
Dec 14 Dec 15
-309
Other administrative
Depreciation
Cost to income 50.9% 41.4%
61
Branches
410.8 376.9
246.9234.7
2014 2015
-4.9%
-8.3% 695 671
Dec 14 Dec 15
-24
Dec 14 Dec 15
Staff costs
administrative costs
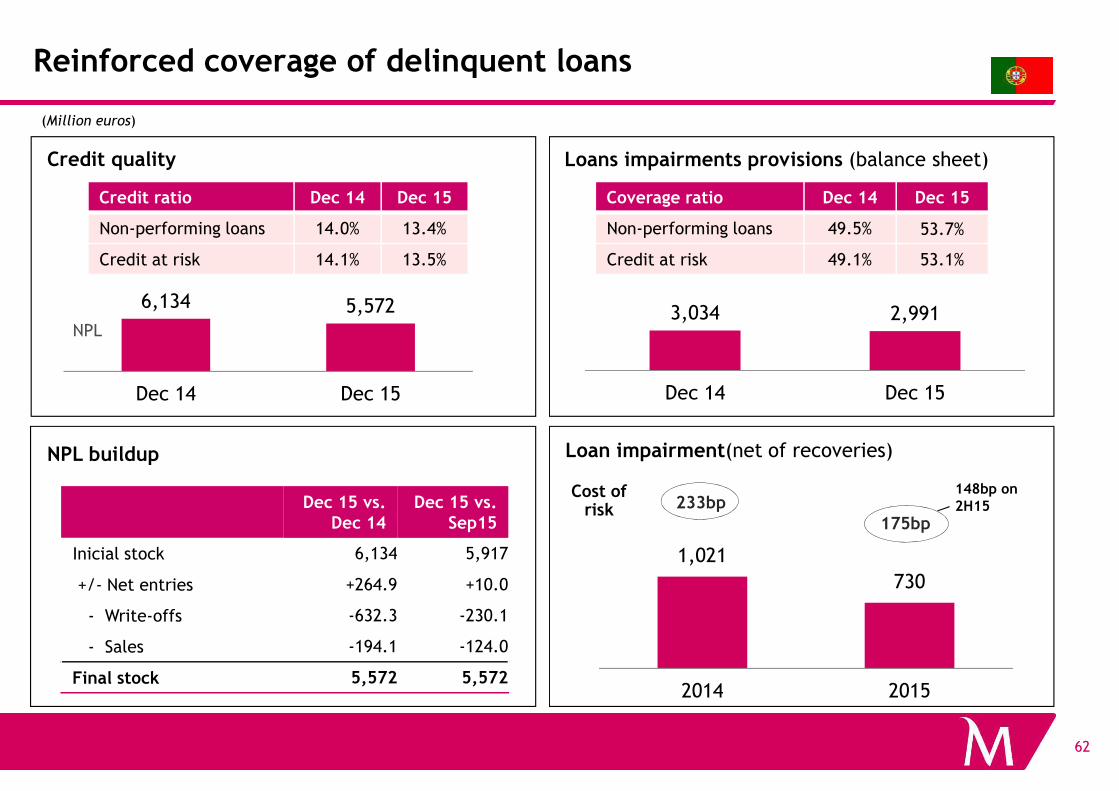
Credit ratio Dec 14 Dec 15
Non-performing loans 14.0% 13.4%
Credit at risk 14.1% 13.5%
Coverage ratio Dec 14 Dec 15
Non-performing loans 49.5% 53.7%
Credit at risk 49.1% 53.1%
Reinforced coverage of delinquent loans
(Million euros)
3,034 2,991
Dec 14 Dec 15
Credit quality
6,134 5,572
Dec 14 Dec 15
Loans impairments provisions (balance sheet)
NPL
62
Dec 14 Dec 15Dec 14 Dec 15
1,021
730
2014 2015
233bp
175bp
Loan impairment(net of recoveries)
Dec 15 vs. Dec 14
Dec 15 vs. Sep15
Inicial stock 6,134 5,917
+/- Net entries +264.9 +10.0
- Write-offs -632.3 -230.1
- Sales -194.1 -124.0
Final stock 5,572 5,572
NPL buildup
148bp on 2H15
Cost of risk
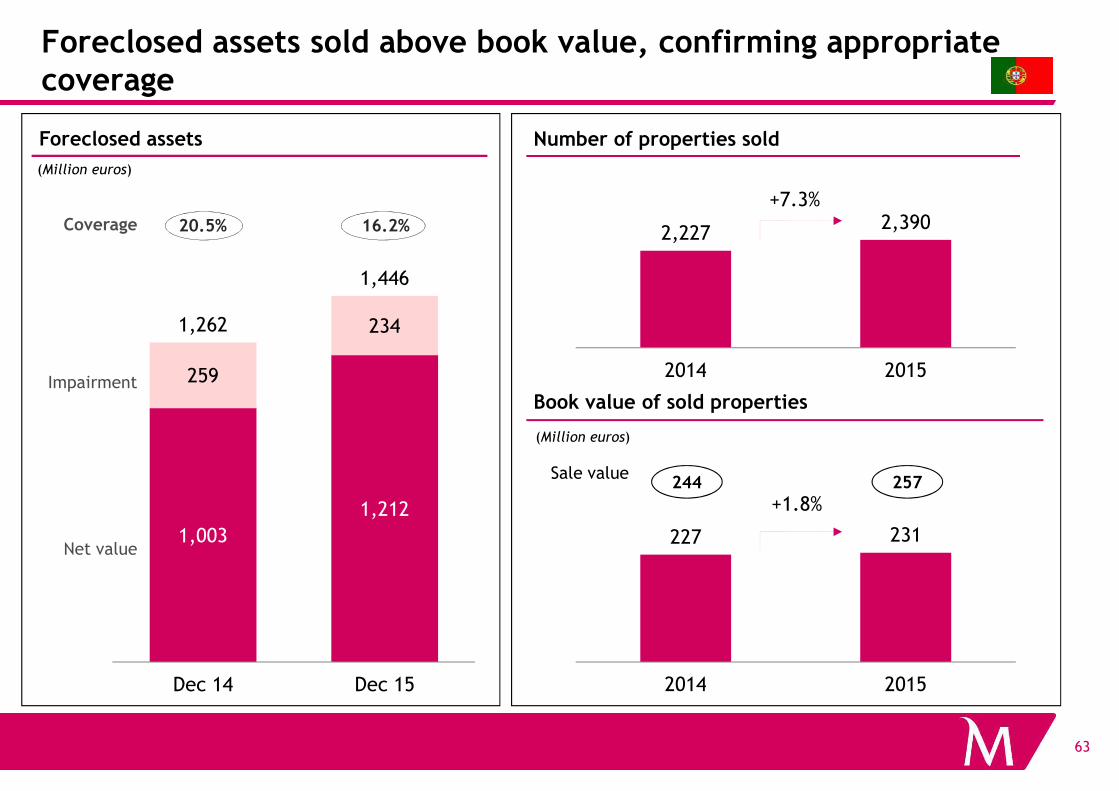
Foreclosed assets sold above book value, confirming appropriate coverage
(Million euros)
Foreclosed assets Number of properties sold
259
2341,262
1,446
20.5%
Book value of sold properties
16.2%
Impairment
Coverage 2,2272,390
2014 2015
+7.3%
63
1,003
1,212
Dec 14 Dec 15
Book value of sold properties
(Million euros)
Sale value
Net value227 231
2014 2015
+1.8%244 257
2015 Earnings
� Main Highlights
� Group
• Profitability
Liquidity
64
• Liquidity
• Capital
� Portugal
� International operations
� Conclusions and targets for 2018
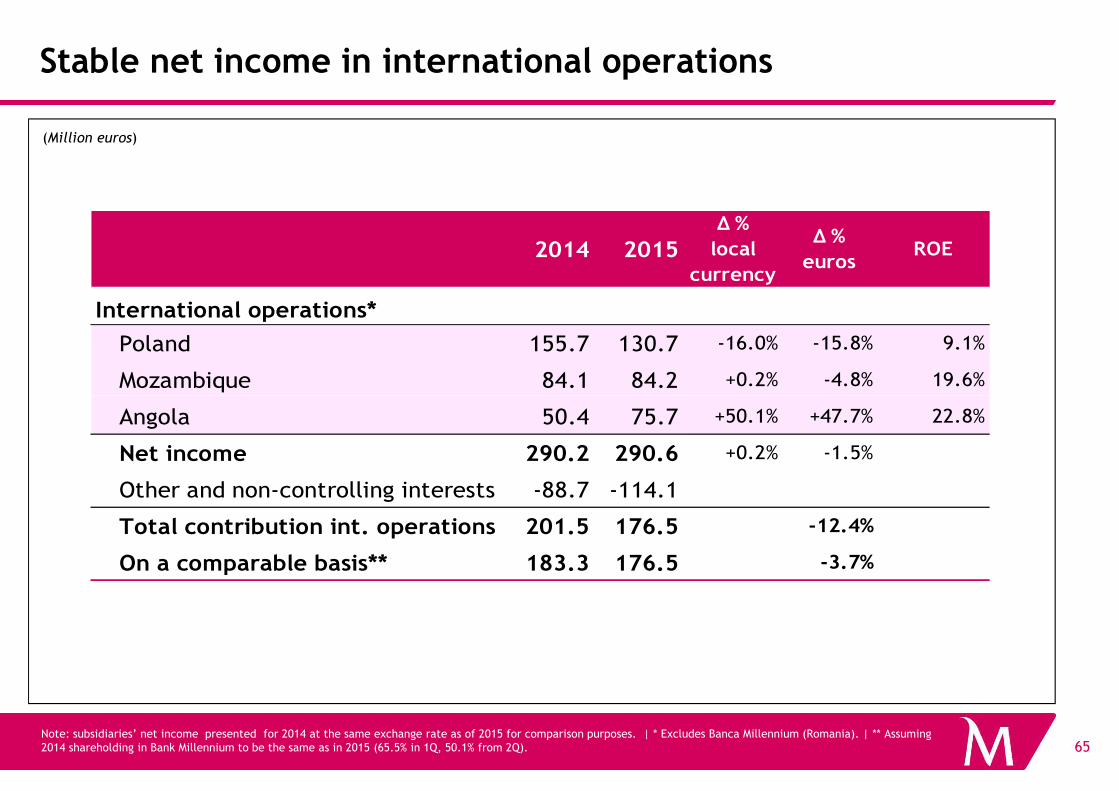
Stable net income in international operations
(Million euros)
2014 2015
Q %
local
currency
Q %
eurosROE
International operations*
Poland 155.7 130.7 -16.0% -15.8% 9.1%
Mozambique 84.1 84.2 +0.2% -4.8% 19.6%
65Note: subsidiaries’ net income presented for 2014 at the same exchange rate as of 2015 for comparison purposes. | * Excludes Banca Millennium (Romania). | ** Assuming 2014 shareholding in Bank Millennium to be the same as in 2015 (65.5% in 1Q, 50.1% from 2Q).
Angola 50.4 75.7 +50.1% +47.7% 22.8%
Net income 290.2 290.6 +0.2% -1.5%
Other and non-controlling interests -88.7 -114.1
Total contribution int. operations 201.5 176.5 -12.4%
On a comparable basis** 183.3 176.5 -3.7%
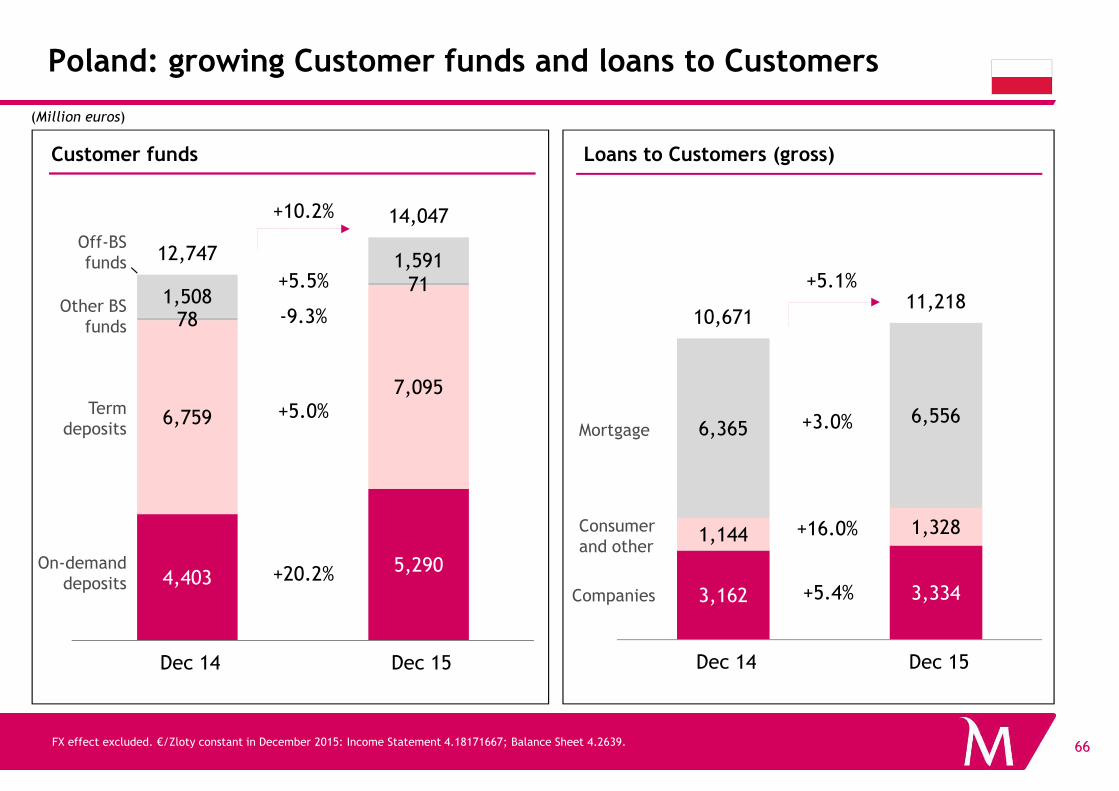
Poland: growing Customer funds and loans to Customers
10,67111,218
+5.1%
(Million euros)
Loans to Customers (gross)Customer funds
7,095
78
711,508
1,59112,747
14,047Off-BS funds
+10.2%
-9.3%
+5.5%Other BS
funds
66FX effect excluded. €/Zloty constant in December 2015: Income Statement 4.18171667; Balance Sheet 4.2639.
3,162 3,334
1,144 1,328
6,3656,556
Dec 14 Dec 15
+3.0%
+16.0%
+5.4%4,403
5,290
6,759
7,095
Dec 14 Dec 15
+20.2%
+5.0%
On-demand deposits
Term deposits
Companies
Consumer and other
Mortgage
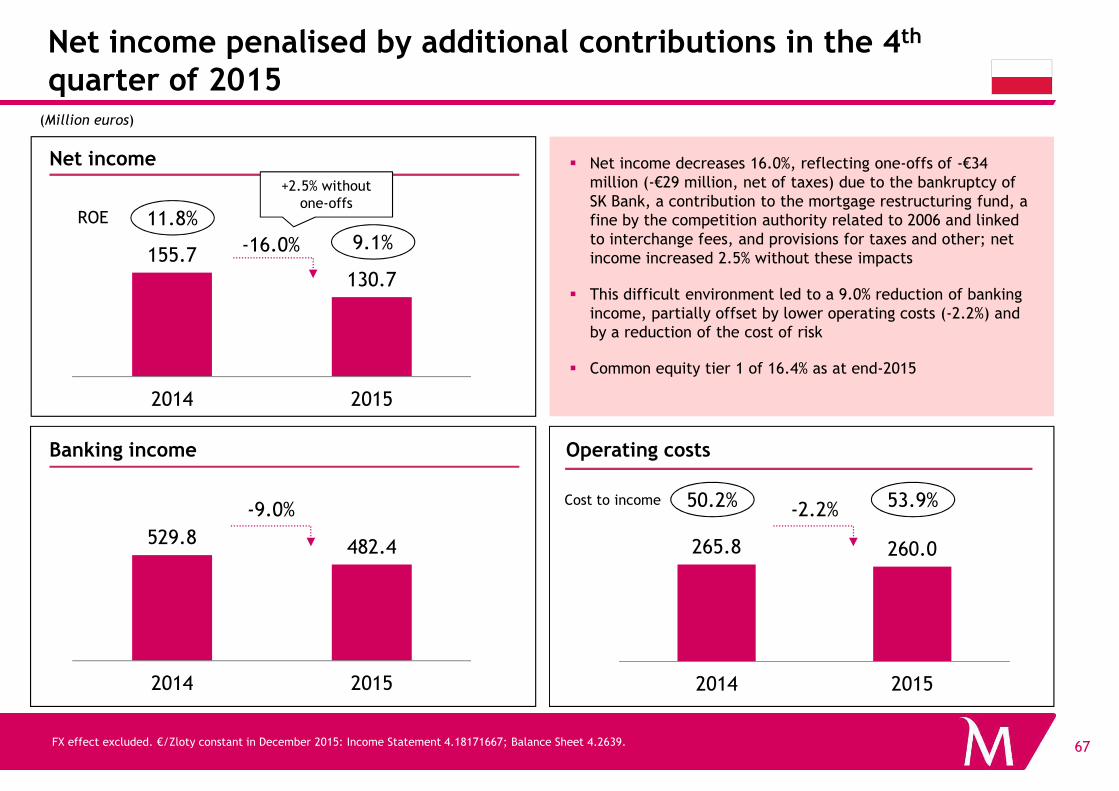
Net income penalised by additional contributions in the 4th
quarter of 2015
155.7130.7
2014 2015
-16.0%
(Million euros)
Net income
ROE 11.8%9.1%
� Net income decreases 16.0%, reflecting one-offs of -€34 million (-€29 million, net of taxes) due to the bankruptcy of SK Bank, a contribution to the mortgage restructuring fund, a fine by the competition authority related to 2006 and linked to interchange fees, and provisions for taxes and other; net income increased 2.5% without these impacts
� This difficult environment led to a 9.0% reduction of banking income, partially offset by lower operating costs (-2.2%) and by a reduction of the cost of risk
� Common equity tier 1 of 16.4% as at end-2015
+2.5% without one-offs
67
265.8 260.0
2014 2015
-9.0% -2.2%
2014 2015
Banking income Operating costs
FX effect excluded. €/Zloty constant in December 2015: Income Statement 4.18171667; Balance Sheet 4.2639.
Cost to income 50.2% 53.9%
529.8 482.4
2014 2015
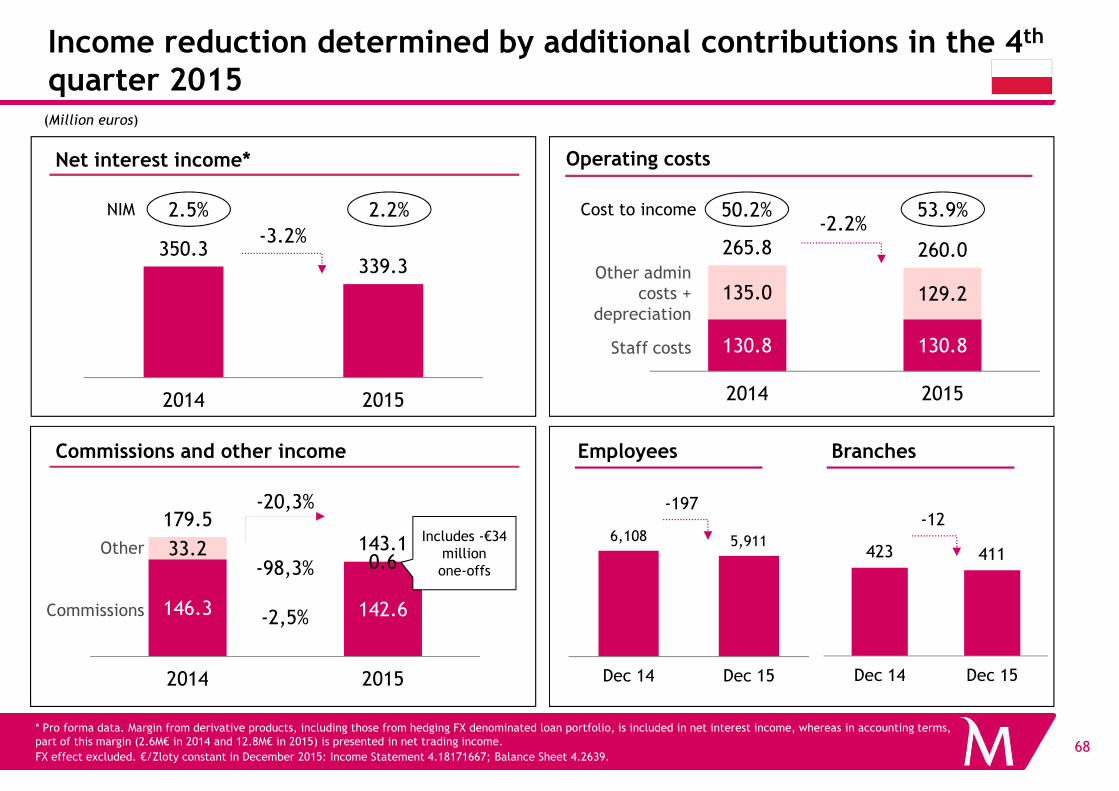
Income reduction determined by additional contributions in the 4th
quarter 2015
130.8 130.8
135.0 129.2
265.8 260.0
2014 2015
Net interest income* Operating costs
-2.2%350.3
339.3
2014 2015
-3.2%
(Million euros)
NIM 2.5% 2.2% Cost to income 50.2% 53.9%
Staff costs
Other admin costs +
depreciation
68
* Pro forma data. Margin from derivative products, including those from hedging FX denominated loan portfolio, is included in net interest income, whereas in accounting terms, part of this margin (2.6M€ in 2014 and 12.8M€ in 2015) is presented in net trading income.
FX effect excluded. €/Zloty constant in December 2015: Income Statement 4.18171667; Balance Sheet 4.2639.
2014 2015
Commissions and other income BranchesEmployees
423 411
Dec 14 Dec 15
6,108 5,911
Dec 14 Dec 15
-197-12
2014 2015
Commissions
Other
146.3 142.6
33.20.6
179.5143.1
2014 2015
-2,5%
-98,3%
-20,3%
Includes -€34 millionone-offs
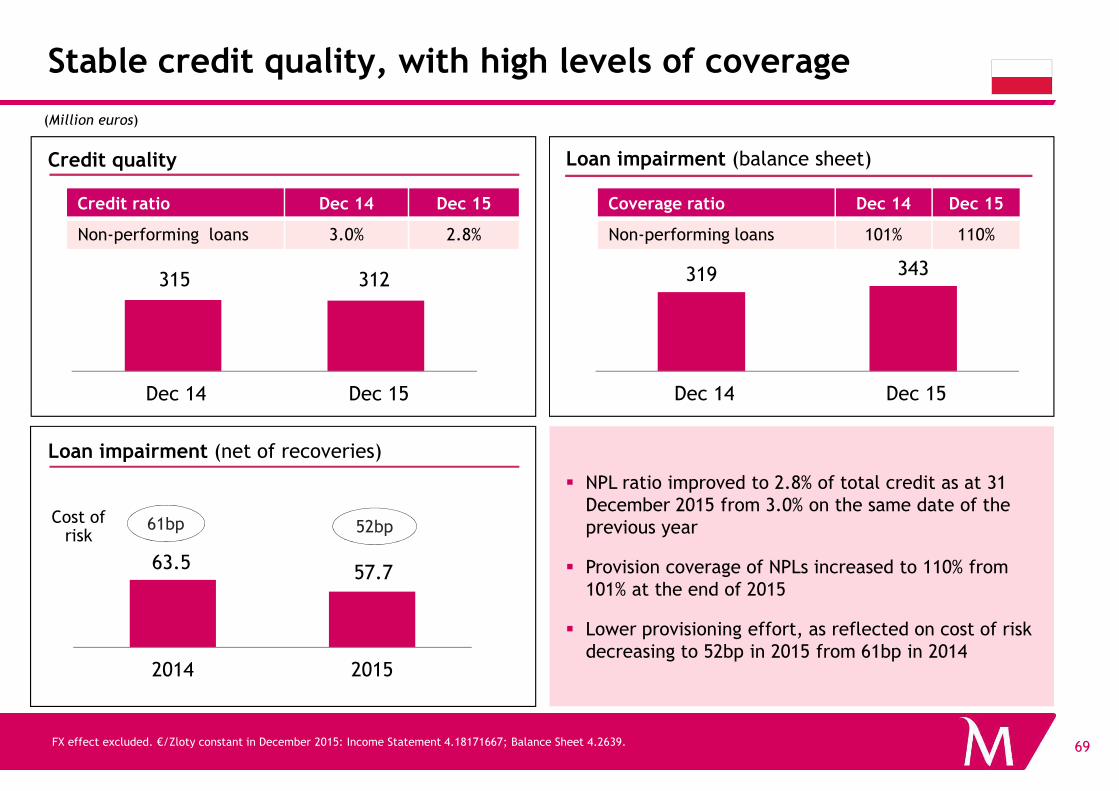
Stable credit quality, with high levels of coverage
Credit quality Loan impairment (balance sheet)
(Million euros)
Credit ratio Dec 14 Dec 15
Non-performing loans 3.0% 2.8%
Coverage ratio Dec 14 Dec 15
Non-performing loans 101% 110%
319 343
Dec 14 Dec 15
315 312
Dec 14 Dec 15
69FX effect excluded. €/Zloty constant in December 2015: Income Statement 4.18171667; Balance Sheet 4.2639.
Loan impairment (net of recoveries)
� NPL ratio improved to 2.8% of total credit as at 31 December 2015 from 3.0% on the same date of the previous year
� Provision coverage of NPLs increased to 110% from 101% at the end of 2015
� Lower provisioning effort, as reflected on cost of risk decreasing to 52bp in 2015 from 61bp in 2014
Dec 14 Dec 15Dec 14 Dec 15
Cost of risk
61bp 52bp
63.5 57.7
2014 2015
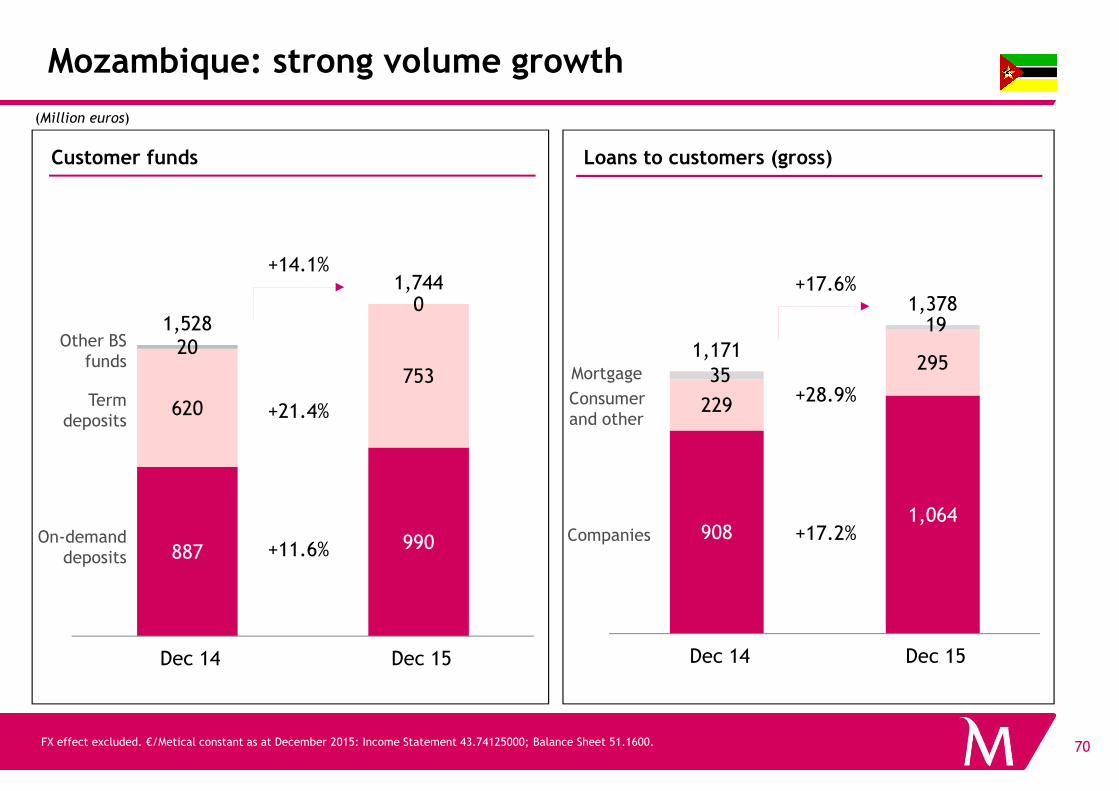
229
29535
19
1,171
1,378
Mozambique: strong volume growth
+17.6%
+28.9%
(Million euros)
Loans to customers (gross)Customer funds
620
753
20
01,528
1,744+14.1%
Term
Other BS funds
Consumer
Mortgage
70
9081,064
229
Dec 14 Dec 15
+28.9%
+17.2%887 990
620
Dec 14 Dec 15
+11.6%
+21.4%
FX effect excluded. €/Metical constant as at December 2015: Income Statement 43.74125000; Balance Sheet 51.1600.
On-demand deposits
Term deposits
Companies
Consumer and other
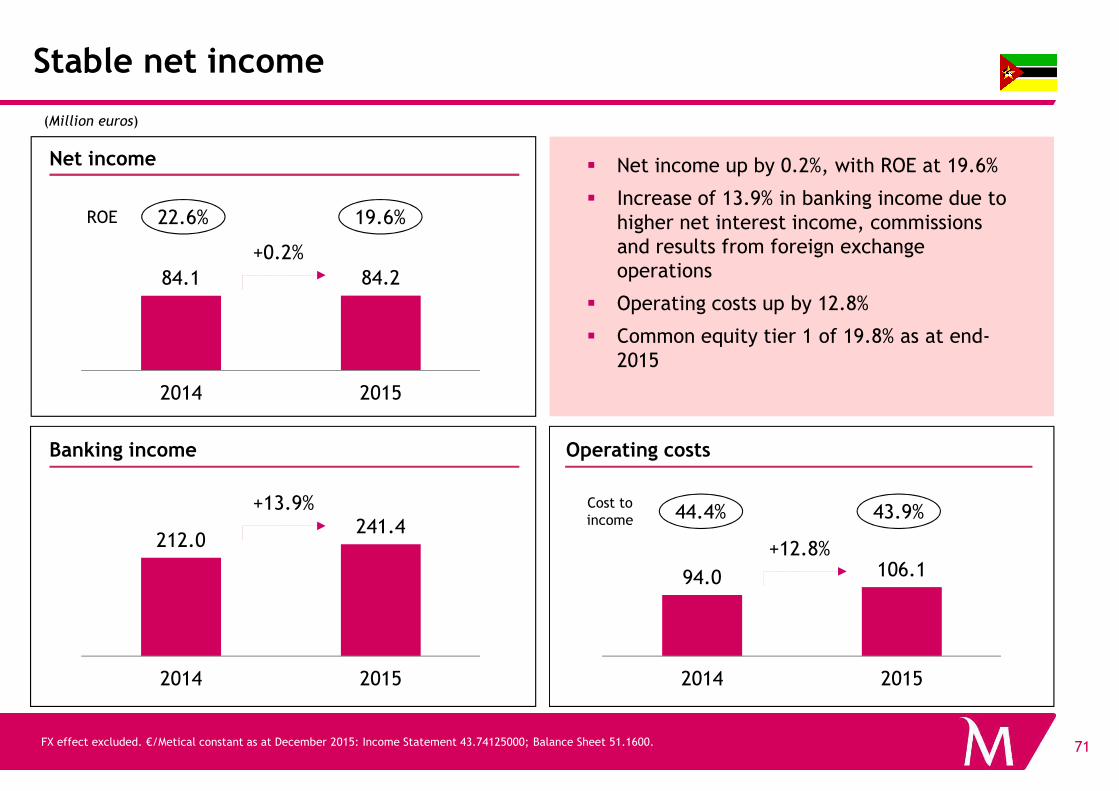
Stable net income
84.1 84.2
2014 2015
+0.2%
(Million euros)
Net income � Net income up by 0.2%, with ROE at 19.6%
� Increase of 13.9% in banking income due to higher net interest income, commissions and results from foreign exchange operations
� Operating costs up by 12.8%
� Common equity tier 1 of 19.8% as at end-2015
ROE 22.6% 19.6%
71
2014 2015
Banking income Operating costs
FX effect excluded. €/Metical constant as at December 2015: Income Statement 43.74125000; Balance Sheet 51.1600.
212.0241.4
2014 2015
+13.9%
94.0 106.1
2014 2015
+12.8%
Cost to income 44.4% 43.9%
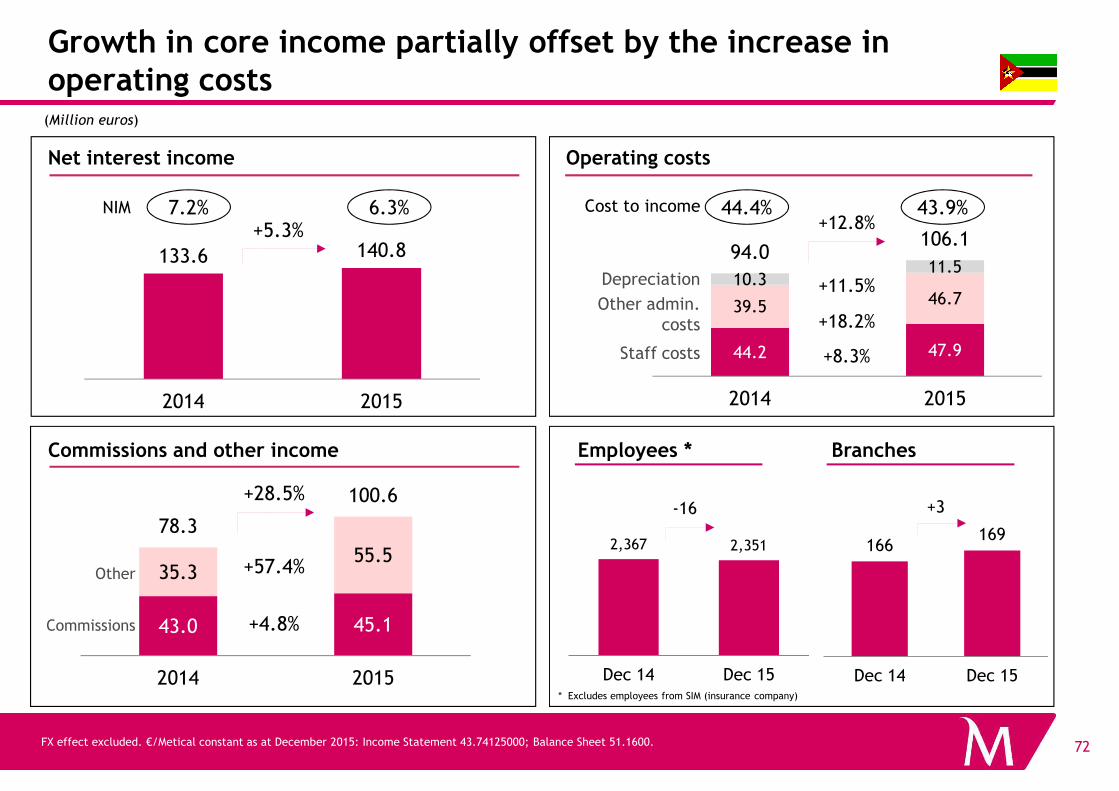
Growth in core income partially offset by the increase in operating costs
44.2 47.9
39.5 46.710.3
11.594.0
106.1
2014 2015
+12.8%
(Million euros)
Net interest income Operating costs
Staff costs
Other admin. costs
Depreciation
133.6 140.8
2014 2015
+5.3%
+8.3%
+18.2%
+11.5%
NIM 7.2% 6.3% Cost to income 44.4% 43.9%
72
2,367 2,351
Dec 14 Dec 15
2014 2015
* Excludes employees from SIM (insurance company)
Commissions and other income BranchesEmployees *
FX effect excluded. €/Metical constant as at December 2015: Income Statement 43.74125000; Balance Sheet 51.1600.
2014 2015
166169
Dec 14 Dec 15
-16 +3
Commissions
Other
43.0 45.1
35.355.5
78.3
100.6
2014 2015
+28.5%
+4.8%
+57.4%
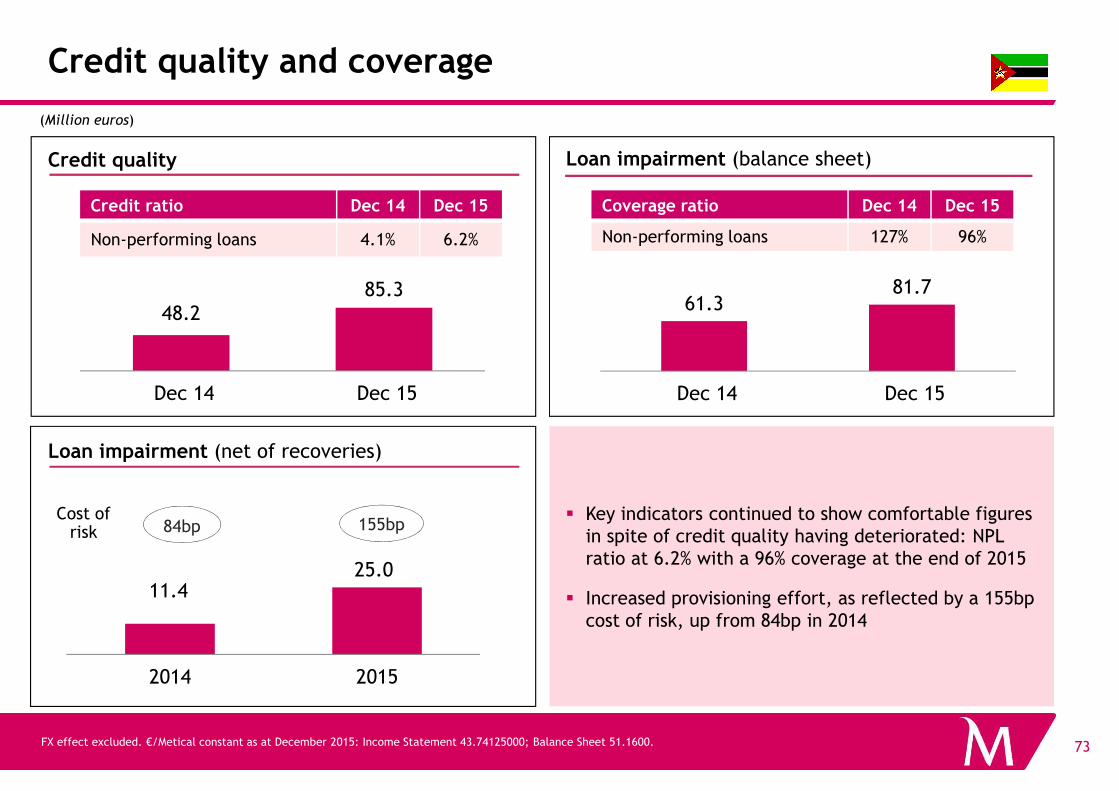
Credit quality and coverage
Credit quality Loan impairment (balance sheet)
(Million euros)
Credit ratio Dec 14 Dec 15
Non-performing loans 4.1% 6.2%
Coverage ratio Dec 14 Dec 15
Non-performing loans 127% 96%
61.381.7
Dec 14 Dec 15
48.285.3
Dec 14 Dec 15
73
Loan impairment (net of recoveries)
� Key indicators continued to show comfortable figures in spite of credit quality having deteriorated: NPL ratio at 6.2% with a 96% coverage at the end of 2015
� Increased provisioning effort, as reflected by a 155bp cost of risk, up from 84bp in 2014
FX effect excluded. €/Metical constant as at December 2015: Income Statement 43.74125000; Balance Sheet 51.1600.
Dec 14 Dec 15Dec 14 Dec 15
Cost of risk 84bp 155bp
11.425.0
2014 2015
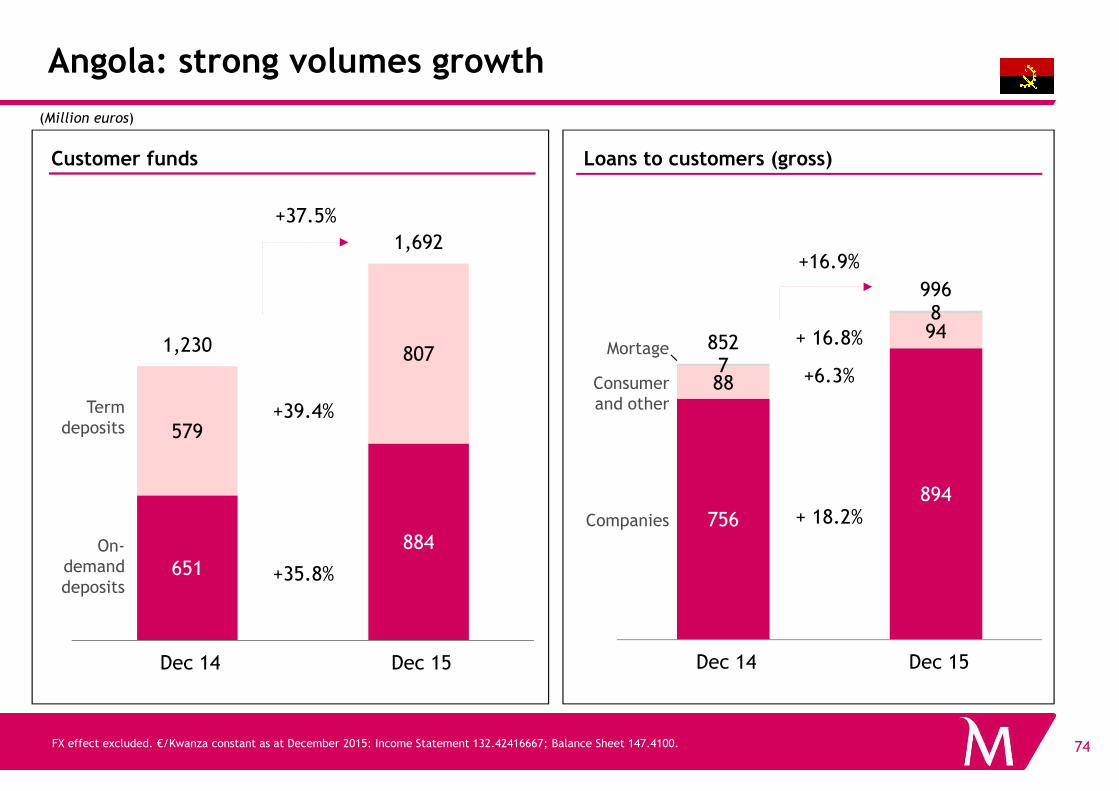
88
94
7
8
852
996
8071,230
1,692
Angola: strong volumes growth
+37.5%
+16.9%
(Million euros)
Loans to customers (gross)Customer funds
+6.3%
+ 16.8%
Consumer and other
Mortage
74
756894
Dec 14 Dec 15
651
884
579
Dec 14 Dec 15
FX effect excluded. €/Kwanza constant as at December 2015: Income Statement 132.42416667; Balance Sheet 147.4100.
+35.8%
+39.4%
+ 18.2%
On-demand deposits
Term deposits
Companies
and other
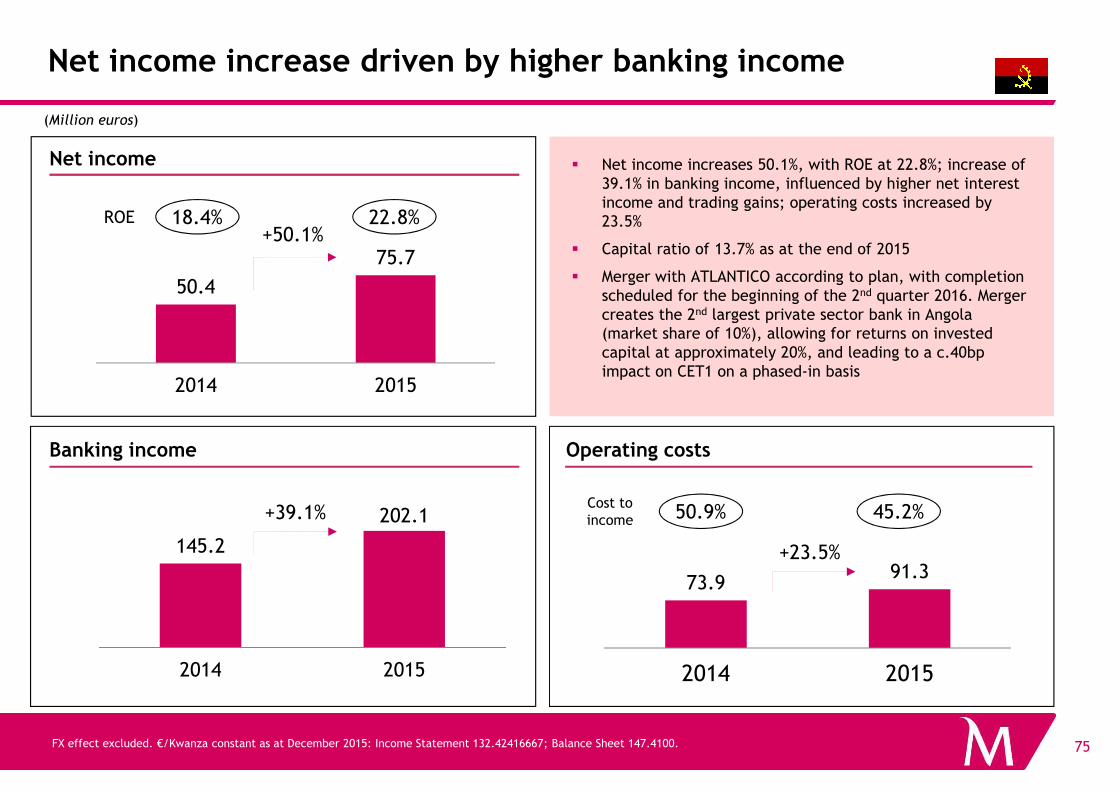
Net income increase driven by higher banking income
� Net income increases 50.1%, with ROE at 22.8%; increase of 39.1% in banking income, influenced by higher net interest income and trading gains; operating costs increased by 23.5%
� Capital ratio of 13.7% as at the end of 2015
� Merger with ATLANTICO according to plan, with completion scheduled for the beginning of the 2nd quarter 2016. Merger creates the 2nd largest private sector bank in Angola (market share of 10%), allowing for returns on invested capital at approximately 20%, and leading to a c.40bp impact on CET1 on a phased-in basis
(Million euros)
Net income
50.4
75.7
2014 2015
+50.1%ROE 18.4% 22.8%
75FX effect excluded. €/Kwanza constant as at December 2015: Income Statement 132.42416667; Balance Sheet 147.4100.
Banking income Operating costs
73.991.3
2014 2015
2014 2015
145.2
202.1
2014 2015
+39.1%
+23.5%
Cost to income 50.9% 45.2%
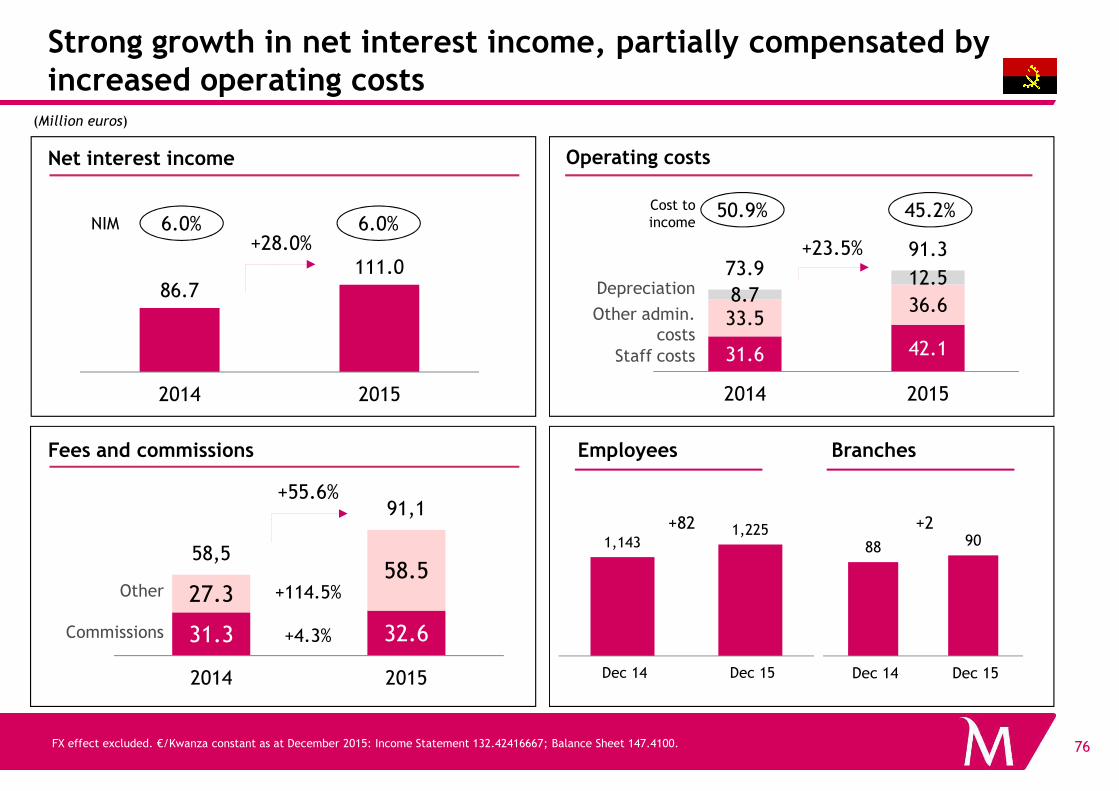
Strong growth in net interest income, partially compensated by increased operating costs
(Million euros)
Net interest income Operating costs
Staff costs
Other admin. costs
Depreciation86.7111.0
2014 2015
31.6 42.1
33.536.6
8.712.573.991.3
2014 2015
+23.5%+28.0%
Cost to income
50.9% 45.2%NIM 6.0% 6.0%
76FX effect excluded. €/Kwanza constant as at December 2015: Income Statement 132.42416667; Balance Sheet 147.4100.
88 90
Dec 14 Dec 15
+21,143
1,225
Dec 14 Dec 15
Fees and commissions BranchesEmployees
+82
2014 2015 2014 2015
31.3 32.6
27.358.5
58,5
91,1
2014 2015
+55.6%
Commissions
Other
+4.3%
+114.5%
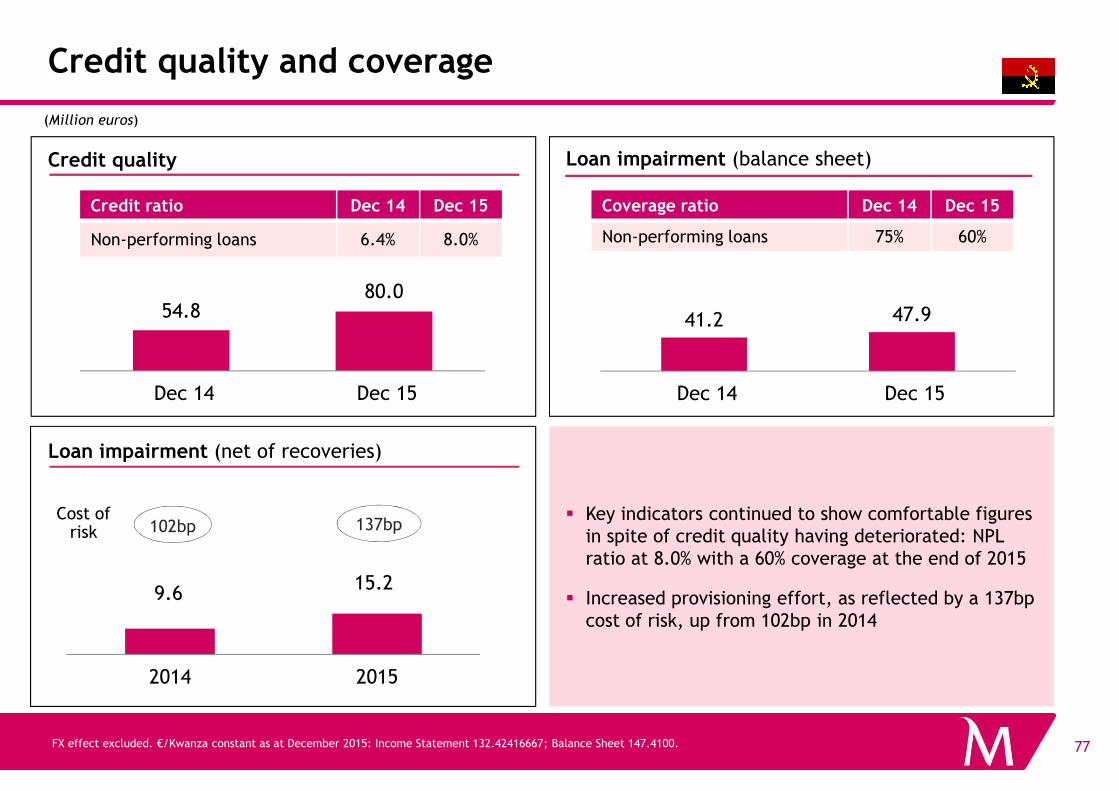
Credit quality and coverage
(Million euros)
41.2 47.9
Dec 14 Dec 15
54.880.0
Dec 14 Dec 15
Credit quality Loan impairment (balance sheet)
Credit ratio Dec 14 Dec 15
Non-performing loans 6.4% 8.0%
Coverage ratio Dec 14 Dec 15
Non-performing loans 75% 60%
77FX effect excluded. €/Kwanza constant as at December 2015: Income Statement 132.42416667; Balance Sheet 147.4100.
Dec 14 Dec 15Dec 14 Dec 15
102bp 137bp
9.615.2
2014 2015
Loan impairment (net of recoveries)
� Key indicators continued to show comfortable figures in spite of credit quality having deteriorated: NPL ratio at 8.0% with a 60% coverage at the end of 2015
� Increased provisioning effort, as reflected by a 137bp cost of risk, up from 102bp in 2014
Cost of risk
2015 Earnings
� Main Highlights
� Group
• Profitability
Liquidity
78
• Liquidity
• Capital
� Portugal
� International operations
� Conclusions and targets for 2018
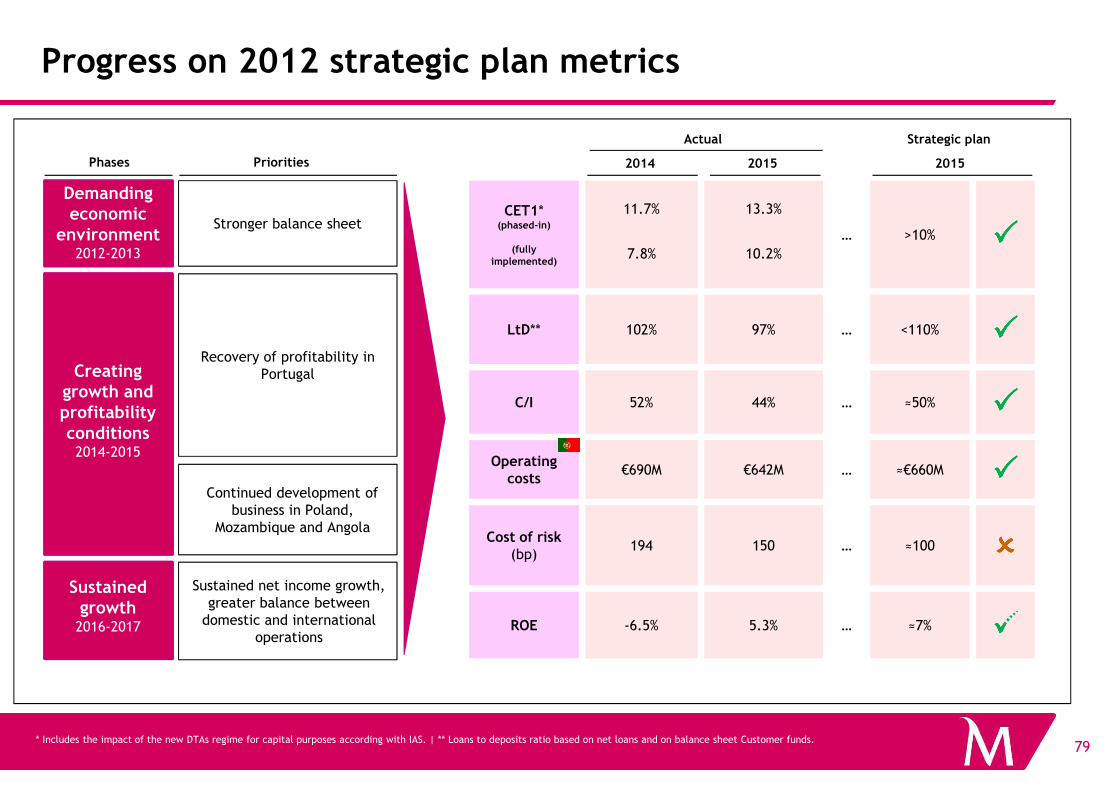
Progress on 2012 strategic plan metrics
Recovery of profitability in PortugalCreating
growth and
Stronger balance sheetCET1*
(phased-in)
(fullyimplemented)
11.7%
7.8%
13.3%
10.2%
… >10% ��������
LtD** 102% 97% … <110% ��������
C/I 52% 44% … ≈50% ��������
Demanding economic
environment2012-2013
Phases Priorities 2015
Strategic plan
2014 2015
Actual
79
Sustained net income growth, greater balance between
domestic and international operations
growth and profitability conditions
2014-2015
Sustained growth
2016-2017
Continued development of business in Poland,
Mozambique and Angola
C/I 52% 44% … ≈50% ��������
Operatingcosts
€690M €642M … ≈€660M ��������
Cost of risk(bp)
194 150 … ≈100 ��������
ROE -6.5% 5.3% … ≈7% ��������
* Includes the impact of the new DTAs regime for capital purposes according with IAS. | ** Loans to deposits ratio based on net loans and on balance sheet Customer funds.

Significant transformation of Millennium bcp over the last years, since the 2008 crisis
2015
Capital
Liquidity
Past
Capital ratio 13.3%CET1 phased-in
4.2%Core Tier 1 BoP, Mar 08
Loans to Deposits 101%175%Mar 09
0.4Commercial gapbillion euros
32.5Mar 09
5.3ECB funding usagebillion euros
15.4Sep 11
Cost-income 76.5%6M13
44.2%Cost-core income: 55.5%
80
Costs
Asset quality
Profitability
Branches in Portugal 920Set 08
671
Cost of risk in Portugal 243 bp9M14
175 bp
7.4Jun 12
5.6Credit at risk in Portugalbillion euros
-35.4%2012
5.3%ROE
-1,2192012
+235Net incomemillion euros
642Operating costs in Portugalmillion euros
1,0312008
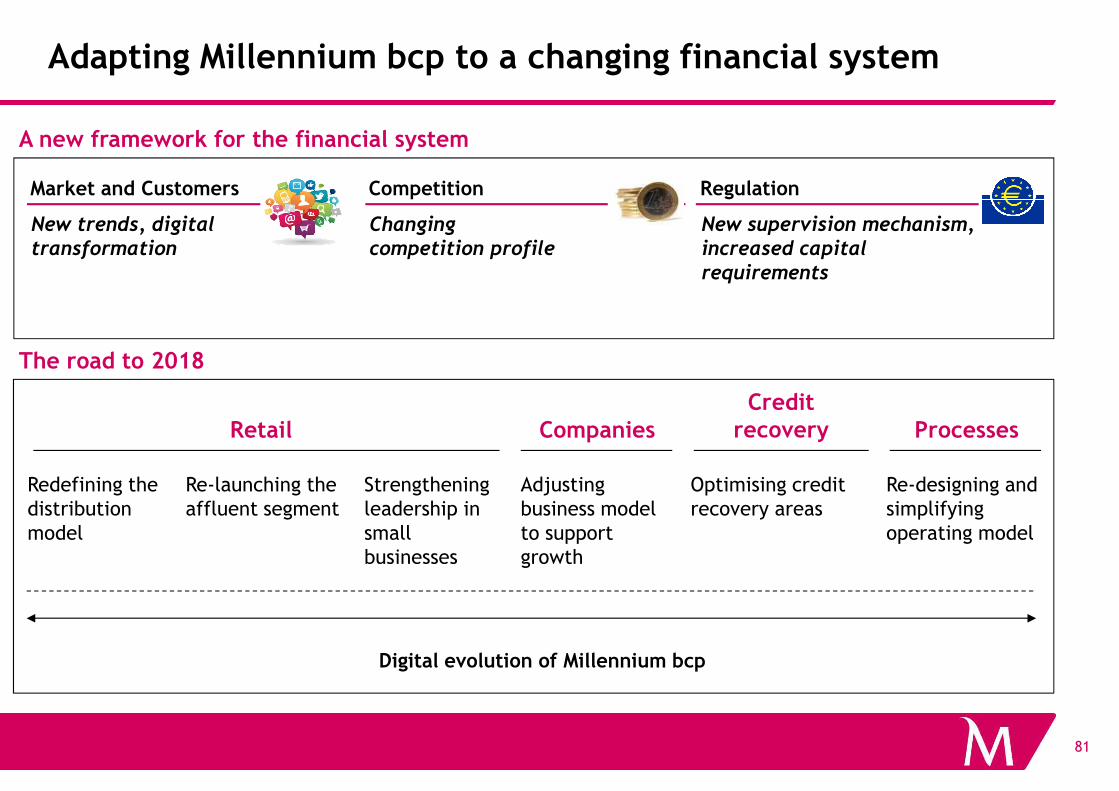
Adapting Millennium bcp to a changing financial system
Market and Customers Competition Regulation
New trends, digital transformation
Changing competition profile
New supervision mechanism, increased capital requirements
Credit
A new framework for the financial system
The road to 2018
81
Companies Processes
Re-designing and simplifying operating model
Redefining the distribution model
Re-launching the affluent segment
Retail
Strengthening leadership in small businesses
Credit recovery
Optimising credit recovery areas
Adjusting business model to support growth
Digital evolution of Millennium bcp
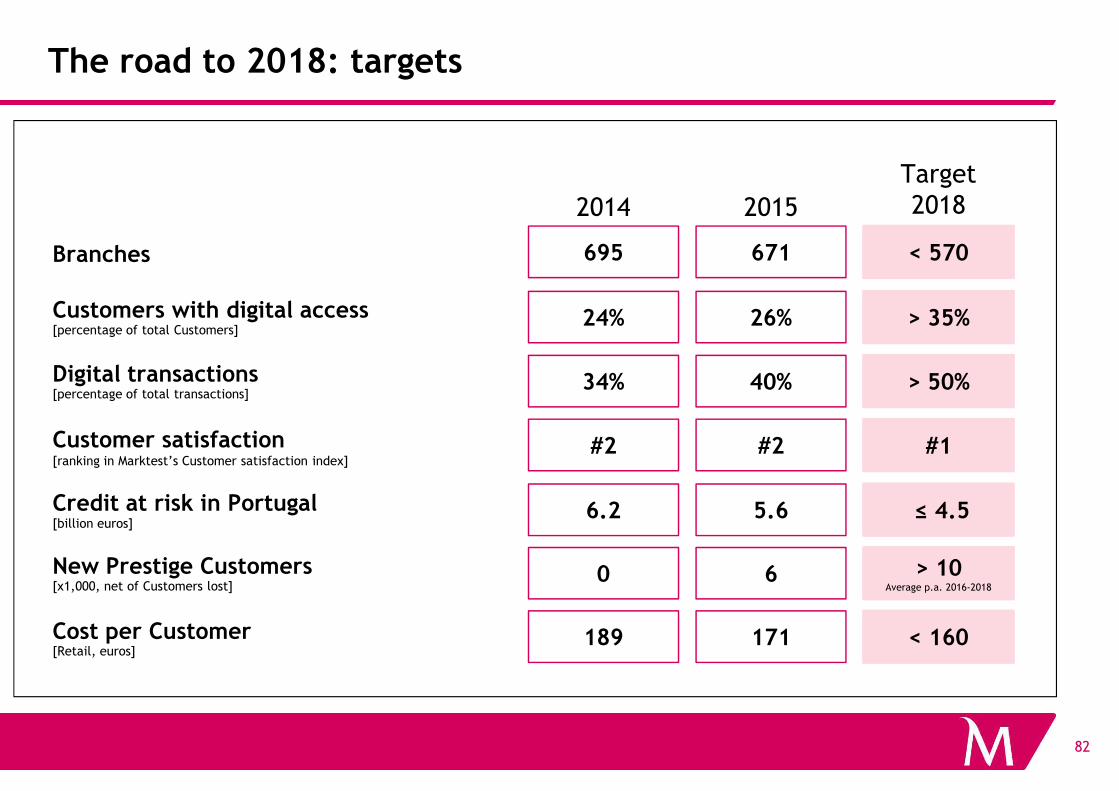
The road to 2018: targets
2014 2015
Target2018
Branches 695 671 < 570
Customers with digital access[percentage of total Customers]
24% 26% > 35%
34%Digital transactions[percentage of total transactions]
40% > 50%
82
Cost per Customer[Retail, euros]
189 171 < 160
Credit at risk in Portugal 6.2 5.6 ≤ 4.5
Customer satisfaction[ranking in Marktest’s Customer satisfaction index]
#2 #2 #1
[percentage of total transactions]
New Prestige Customers[x1,000, net of Customers lost]
0 6 > 10Average p.a. 2016-2018
[billion euros]
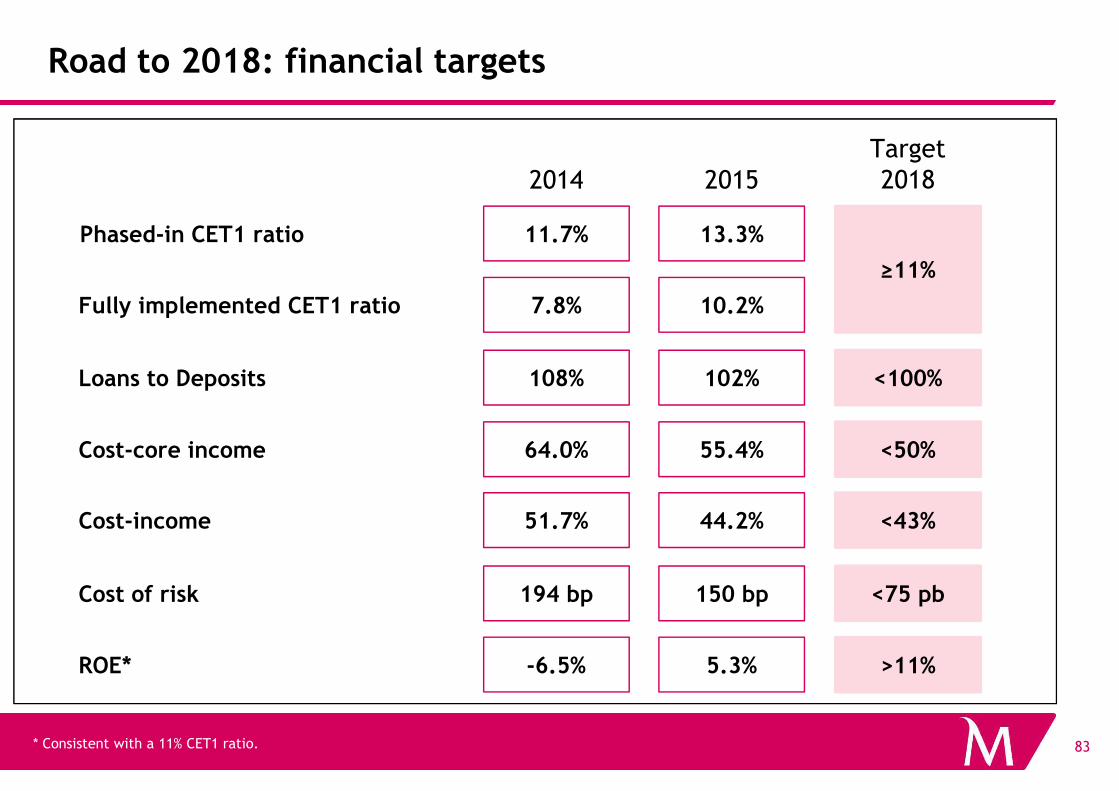
Road to 2018: financial targets
2014Target20182015
Fully implemented CET1 ratio 7.8% 10.2%
Phased-in CET1 ratio 11.7%
≥11%
13.3%
Loans to Deposits 108% <100%102%
83
Cost-core income 64.0% <50%55.4%
Cost of risk 194 bp <75 pb150 bp
ROE* -6.5% >11%5.3%
Cost-income 51.7% <43%44.2%
* Consistent with a 11% CET1 ratio.
Appendix
84
Appendix
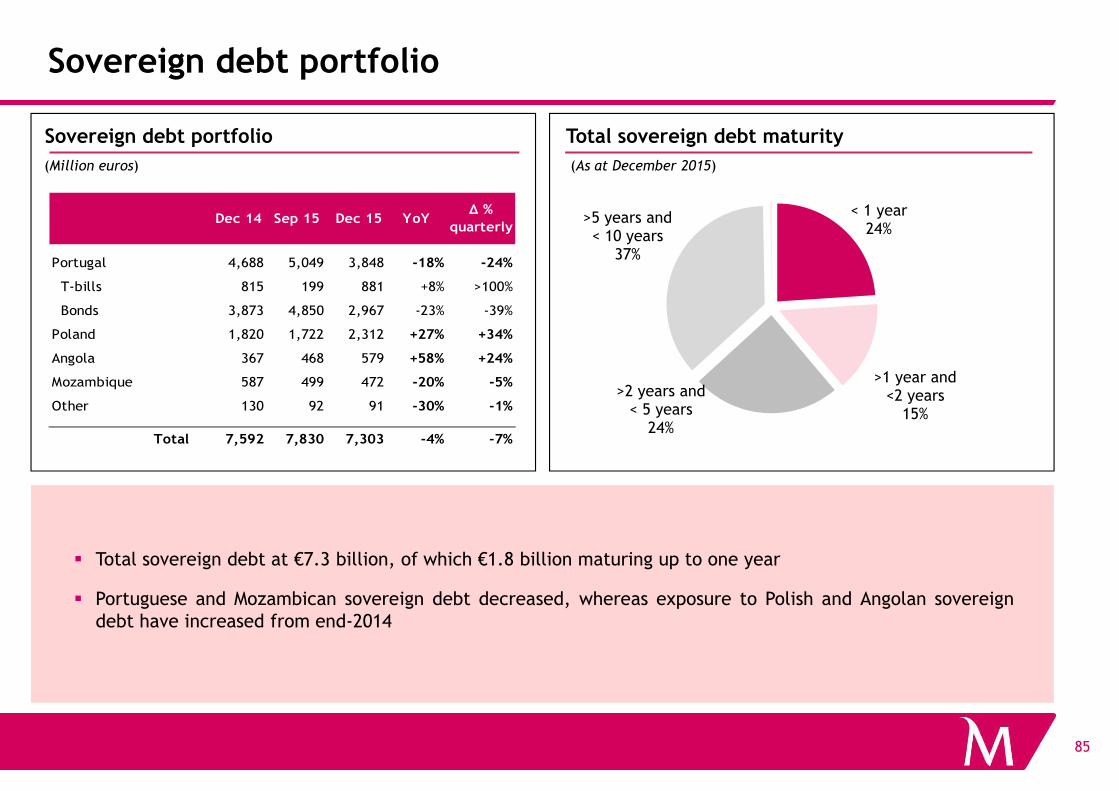
Sovereign debt portfolio
(Million euros)
Total sovereign debt maturitySovereign debt portfolio
< 1 year24%
>1 year and<2 years>2 years and
>5 years and< 10 years
37%
(As at December 2015)
Portugal 4,688 5,049 3,848 -18% -24%
T-bills 815 199 881 +8% >100%
Bonds 3,873 4,850 2,967 -23% -39%
Poland 1,820 1,722 2,312 +27% +34%
Angola 367 468 579 +58% +24%
Mozambique 587 499 472 -20% -5%
Q %
quarterly Dec 14 Dec 15 YoYSep 15
85
� Total sovereign debt at €7.3 billion, of which €1.8 billion maturing up to one year
� Portuguese and Mozambican sovereign debt decreased, whereas exposure to Polish and Angolan sovereigndebt have increased from end-2014
<2 years15%
>2 years and< 5 years
24%
Other 130 92 91 -30% -1%
Total 7,592 7,830 7,303 -4% -7%
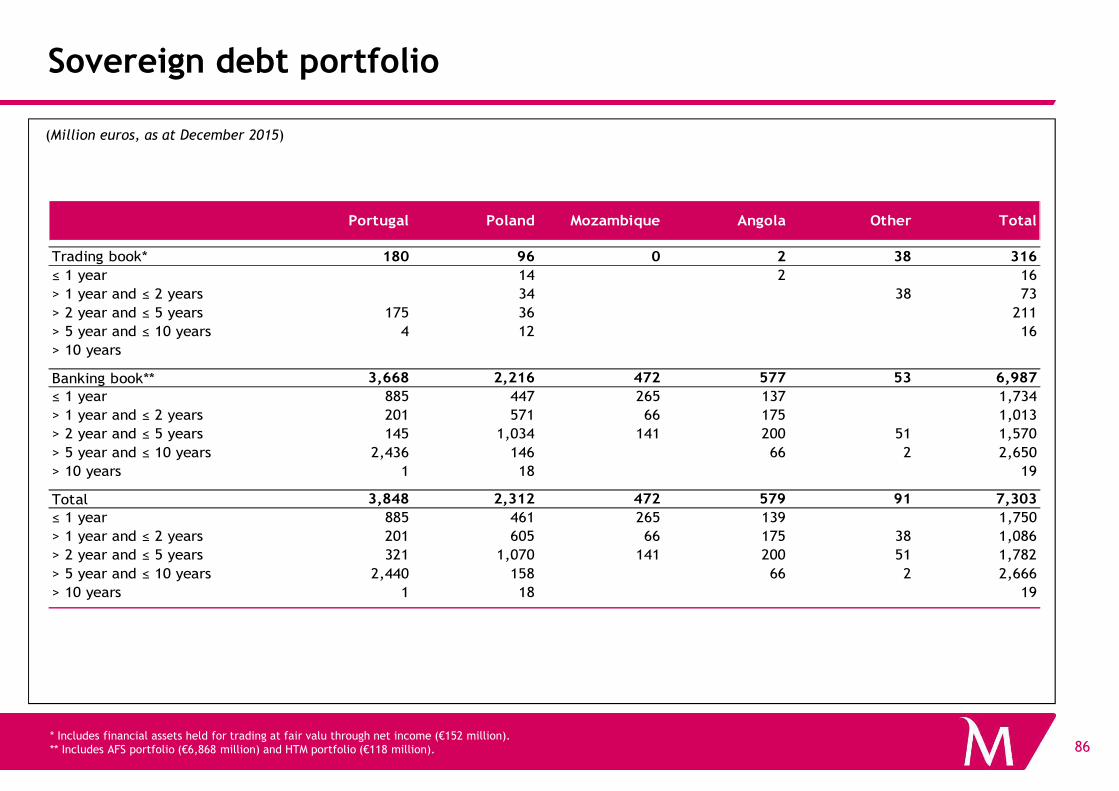
Sovereign debt portfolio
(Million euros, as at December 2015)
Portugal Poland Mozambique Angola Other Total
Trading book* 180 96 0 2 38 316
≤ 1 year 0 14 0 2 0 16
> 1 year and ≤ 2 years 0 34 0 0 38 73
> 2 year and ≤ 5 years 175 36 0 0 0 211
> 5 year and ≤ 10 years 4 12 0 0 0 16
> 10 years 0 0 0 0 0 0
Banking book** 3,668 2,216 472 577 53 6,987
≤ 1 year 885 447 265 137 0 1,734
86* Includes financial assets held for trading at fair valu through net income (€152 million).** Includes AFS portfolio (€6,868 million) and HTM portfolio (€118 million).
≤ 1 year 885 447 265 137 0 1,734
> 1 year and ≤ 2 years 201 571 66 175 0 1,013
> 2 year and ≤ 5 years 145 1,034 141 200 51 1,570
> 5 year and ≤ 10 years 2,436 146 0 66 2 2,650
> 10 years 1 18 0 0 0 19
Total 3,848 2,312 472 579 91 7,303
≤ 1 year 885 461 265 139 0 1,750
> 1 year and ≤ 2 years 201 605 66 175 38 1,086
> 2 year and ≤ 5 years 321 1,070 141 200 51 1,782
> 5 year and ≤ 10 years 2,440 158 0 66 2 2,666
> 10 years 1 18 0 0 0 19
Financial Statements
87
Financial Statements
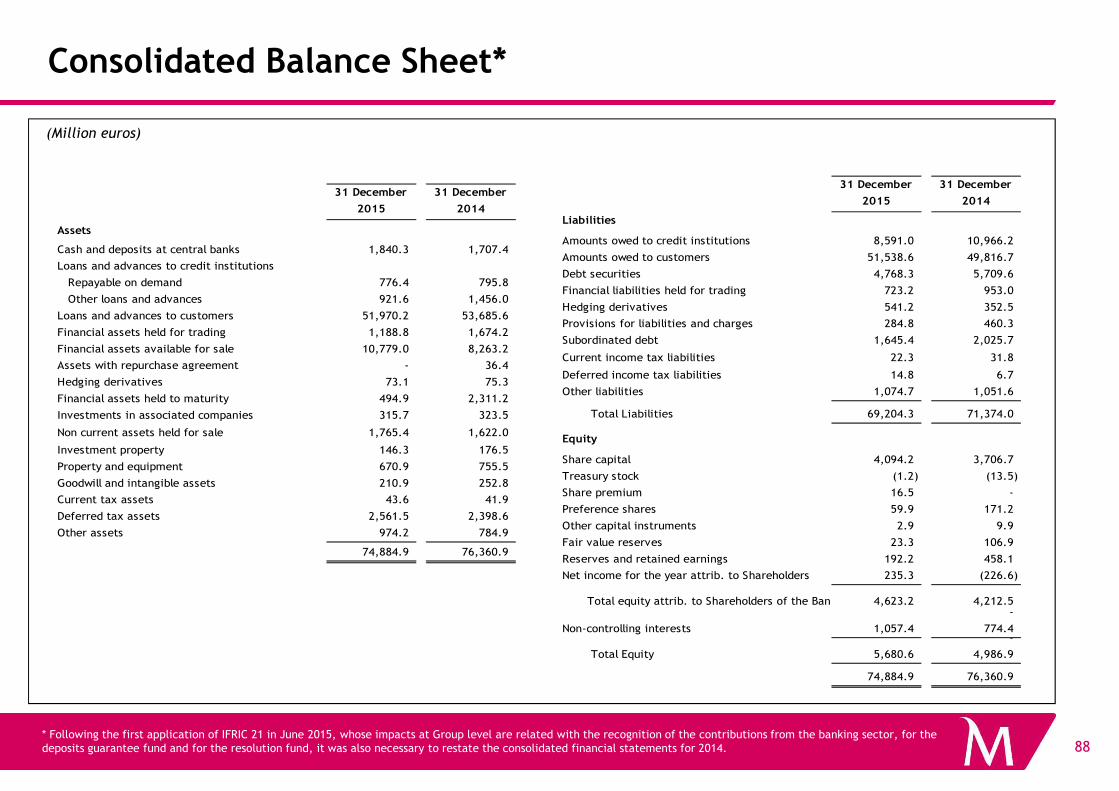
Consolidated Balance Sheet*
(Million euros)
31 December
2015
31 December
2014
Assets
Cash and deposits at central banks 1,840.3 1,707.4
Loans and advances to credit institutions
Repayable on demand 776.4 795.8
Other loans and advances 921.6 1,456.0
Loans and advances to customers 51,970.2 53,685.6
Financial assets held for trading 1,188.8 1,674.2
Financial assets available for sale 10,779.0 8,263.2
Assets with repurchase agreement - 36.4
Hedging derivatives 73.1 75.3
Financial assets held to maturity 494.9 2,311.2
31 December
2015
31 December
2014
Liabilities
Amounts owed to credit institutions 8,591.0 10,966.2
Amounts owed to customers 51,538.6 49,816.7
Debt securities 4,768.3 5,709.6
Financial liabilities held for trading 723.2 953.0
Hedging derivatives 541.2 352.5
Provisions for liabilities and charges 284.8 460.3
Subordinated debt 1,645.4 2,025.7
Current income tax liabilities 22.3 31.8
Deferred income tax liabilities 14.8 6.7
Other liabilities 1,074.7 1,051.6
88* Following the first application of IFRIC 21 in June 2015, whose impacts at Group level are related with the recognition of the contributions from the banking sector, for the deposits guarantee fund and for the resolution fund, it was also necessary to restate the consolidated financial statements for 2014.
Financial assets held to maturity 494.9 2,311.2
Investments in associated companies 315.7 323.5
Non current assets held for sale 1,765.4 1,622.0
Investment property 146.3 176.5
Property and equipment 670.9 755.5
Goodwill and intangible assets 210.9 252.8
Current tax assets 43.6 41.9
Deferred tax assets 2,561.5 2,398.6
Other assets 974.2 784.9
74,884.9 76,360.9
Other liabilities 1,074.7 1,051.6
Total Liabilities 69,204.3 71,374.0
Equity
Share capital 4,094.2 3,706.7
Treasury stock (1.2) (13.5)
Share premium 16.5 -
Preference shares 59.9 171.2
Other capital instruments 2.9 9.9
Fair value reserves 23.3 106.9
Reserves and retained earnings 192.2 458.1
Net income for the year attrib. to Shareholders 235.3 (226.6)
Total equity attrib. to Shareholders of the Bank 4,623.2 4,212.5 -
Non-controlling interests 1,057.4 774.4 -
Total Equity 5,680.6 4,986.9
74,884.9 76,360.9
(Million euros)
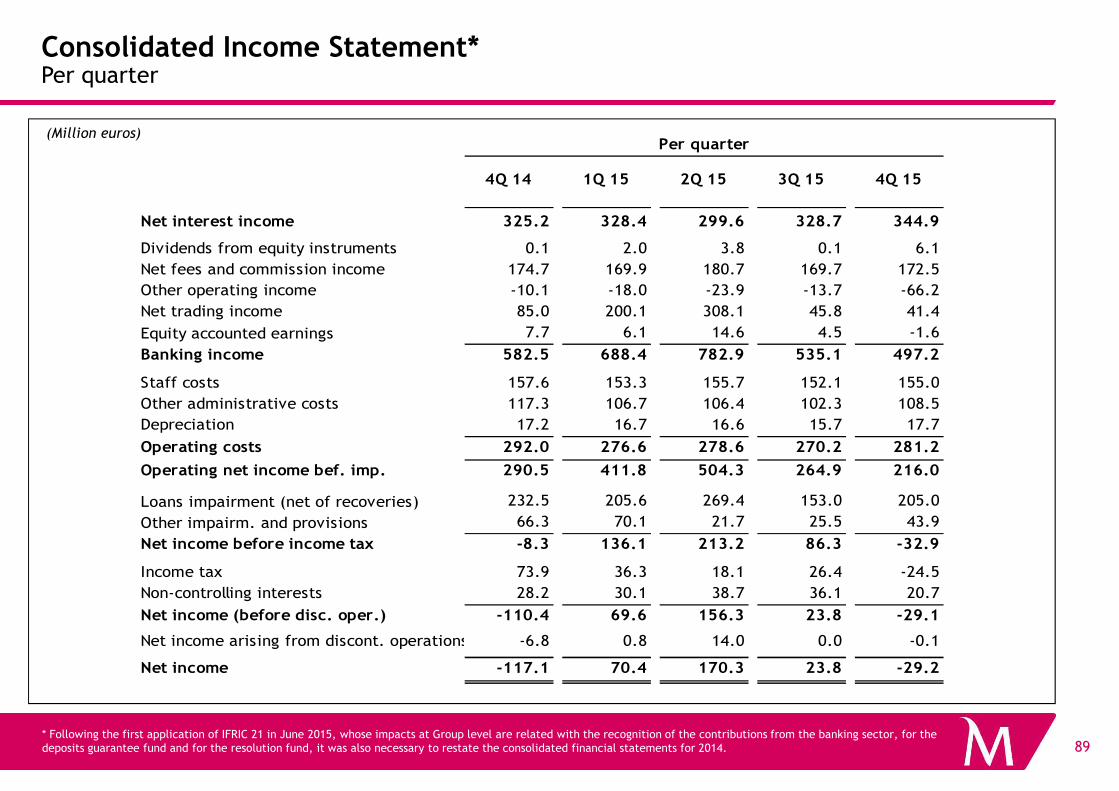
Consolidated Income Statement*Per quarter
Net interest income 325.2 328.4 299.6 328.7 344.9
Dividends from equity instruments 0.1 2.0 3.8 0.1 6.1
Net fees and commission income 174.7 169.9 180.7 169.7 172.5
Other operating income -10.1 -18.0 -23.9 -13.7 -66.2
Net trading income 85.0 200.1 308.1 45.8 41.4
Equity accounted earnings 7.7 6.1 14.6 4.5 -1.6
Banking income 582.5 688.4 782.9 535.1 497.2
Staff costs 157.6 153.3 155.7 152.1 155.0
Other administrative costs 117.3 106.7 106.4 102.3 108.5
Per quarter
4Q 14 4Q 153Q 152Q 151Q 15
89* Following the first application of IFRIC 21 in June 2015, whose impacts at Group level are related with the recognition of the contributions from the banking sector, for the deposits guarantee fund and for the resolution fund, it was also necessary to restate the consolidated financial statements for 2014.
Other administrative costs 117.3 106.7 106.4 102.3 108.5
Depreciation 17.2 16.7 16.6 15.7 17.7
Operating costs 292.0 276.6 278.6 270.2 281.2
Operating net income bef. imp. 290.5 411.8 504.3 264.9 216.0
Loans impairment (net of recoveries) 232.5 205.6 269.4 153.0 205.0
Other impairm. and provisions 66.3 70.1 21.7 25.5 43.9
Net income before income tax -8.3 136.1 213.2 86.3 -32.9
Income tax 73.9 36.3 18.1 26.4 -24.5
Non-controlling interests 28.2 30.1 38.7 36.1 20.7
Net income (before disc. oper.) -110.4 69.6 156.3 23.8 -29.1
Net income arising from discont. operations -6.8 0.8 14.0 0.0 -0.1
Net income -117.1 70.4 170.3 23.8 -29.2
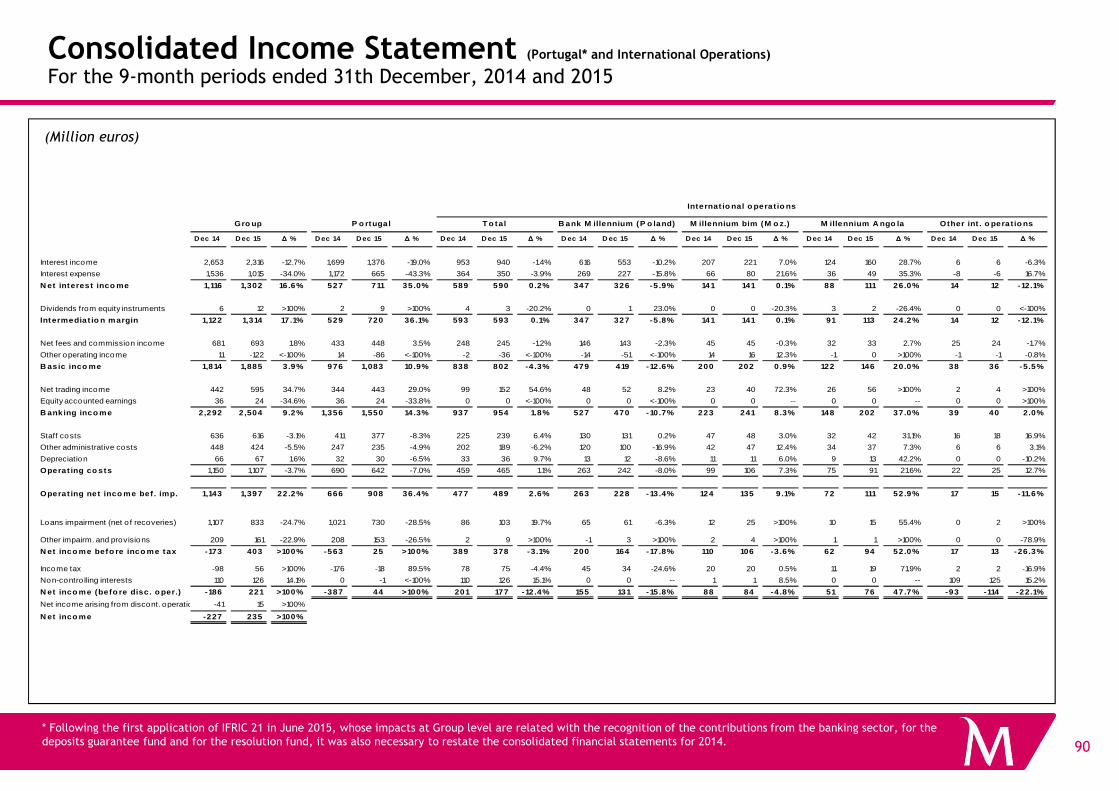
Consolidated Income Statement (Portugal* and International Operations)
For the 9-month periods ended 31th December, 2014 and 2015
(Million euros)
D ec 14 D ec 15 ∆ % D ec 14 D ec 15 ∆ % D ec 14 D ec 15 ∆ % D ec 14 D ec 15 ∆ % D ec 14 D ec 15 ∆ % D ec 14 D ec 15 ∆ % D ec 14 D ec 15 ∆ %
Interest income 2,653 2,316 -12.7% 1,699 1,376 -19.0% 953 940 -1.4% 616 553 -10.2% 207 221 7.0% 124 160 28.7% 6 6 -6.3%
Interest expense 1,536 1,015 -34.0% 1,172 665 -43.3% 364 350 -3.9% 269 227 -15.8% 66 80 21.6% 36 49 35.3% -8 -6 16.7%
N et interest inco me 1,116 1,302 16.6% 527 711 35.0% 589 590 0.2% 347 326 -5 .9% 141 141 0.1% 88 111 26.0% 14 12 -12.1%
Dividends from equity instruments 6 12 >100% 2 9 >100% 4 3 -20.2% 0 1 23.0% 0 0 -20.3% 3 2 -26.4% 0 0 <-100%
Intermediat io n margin 1,122 1,314 17.1% 529 720 36.1% 593 593 0.1% 347 327 -5 .8% 141 141 0.1% 91 113 24.2% 14 12 -12.1%
Net fees and commission income 681 693 1.8% 433 448 3.5% 248 245 -1.2% 146 143 -2.3% 45 45 -0.3% 32 33 2.7% 25 24 -1.7%
Other operating income 11 -122 <-100% 14 -86 <-100% -2 -36 <-100% -14 -51 <-100% 14 16 12.3% -1 0 >100% -1 -1 -0.8%
B asic inco me 1,814 1,885 3.9% 976 1,083 10.9% 838 802 -4 .3% 479 419 -12.6% 200 202 0.9% 122 146 20.0% 38 36 -5.5%
Net trading income 442 595 34.7% 344 443 29.0% 99 152 54.6% 48 52 8.2% 23 40 72.3% 26 56 >100% 2 4 >100%
M illennium bim (M o z.)
Internat io nal o peratio ns
Gro up P o rtugal T o tal B ank M illennium (P o land) M illennium A ngo la Other int . o peratio ns
90
* Following the first application of IFRIC 21 in June 2015, whose impacts at Group level are related with the recognition of the contributions from the banking sector, for the deposits guarantee fund and for the resolution fund, it was also necessary to restate the consolidated financial statements for 2014.
Equity accounted earnings 36 24 -34.6% 36 24 -33.8% 0 0 <-100% 0 0 <-100% 0 0 -- 0 0 -- 0 0 >100%
B anking inco me 2,292 2,504 9.2% 1,356 1,550 14.3% 937 954 1.8% 527 470 -10.7% 223 241 8.3% 148 202 37.0% 39 40 2.0%
Staff costs 636 616 -3.1% 411 377 -8.3% 225 239 6.4% 130 131 0.2% 47 48 3.0% 32 42 31.1% 16 18 16.9%
Other administrative costs 448 424 -5.5% 247 235 -4.9% 202 189 -6.2% 120 100 -16.9% 42 47 12.4% 34 37 7.3% 6 6 3.1%
Depreciation 66 67 1.6% 32 30 -6.5% 33 36 9.7% 13 12 -8.6% 11 11 6.0% 9 13 42.2% 0 0 -10.2%
Operat ing co sts 1,150 1,107 -3.7% 690 642 -7.0% 459 465 1.1% 263 242 -8.0% 99 106 7.3% 75 91 21.6% 22 25 12.7%
Operat ing net inco me bef. imp. 1,143 1,397 22.2% 666 908 36.4% 477 489 2.6% 263 228 -13.4% 124 135 9.1% 72 111 52.9% 17 15 -11.6%
Loans impairment (net o f recoveries) 1,107 833 -24.7% 1,021 730 -28.5% 86 103 19.7% 65 61 -6.3% 12 25 >100% 10 15 55.4% 0 2 >100%
Other impairm. and provisions 209 161 -22.9% 208 153 -26.5% 2 9 >100% -1 3 >100% 2 4 >100% 1 1 >100% 0 0 -78.9%
N et inco me befo re inco me tax -173 403 >100% -563 25 >100% 389 378 -3.1% 200 164 -17.8% 110 106 -3 .6% 62 94 52.0% 17 13 -26.3%
Income tax -98 56 >100% -176 -18 89.5% 78 75 -4.4% 45 34 -24.6% 20 20 0.5% 11 19 71.9% 2 2 -16.9%
Non-contro lling interests 110 126 14.1% 0 -1 <-100% 110 126 15.1% 0 0 -- 1 1 8.5% 0 0 -- 109 125 15.2%
N et inco me (befo re disc. o per.) -186 221 >100% -387 44 >100% 201 177 -12.4% 155 131 -15.8% 88 84 -4 .8% 51 76 47.7% -93 -114 -22.1%
Net income arising from discont. operations -41 15 >100%
N et inco me -227 235 >100%
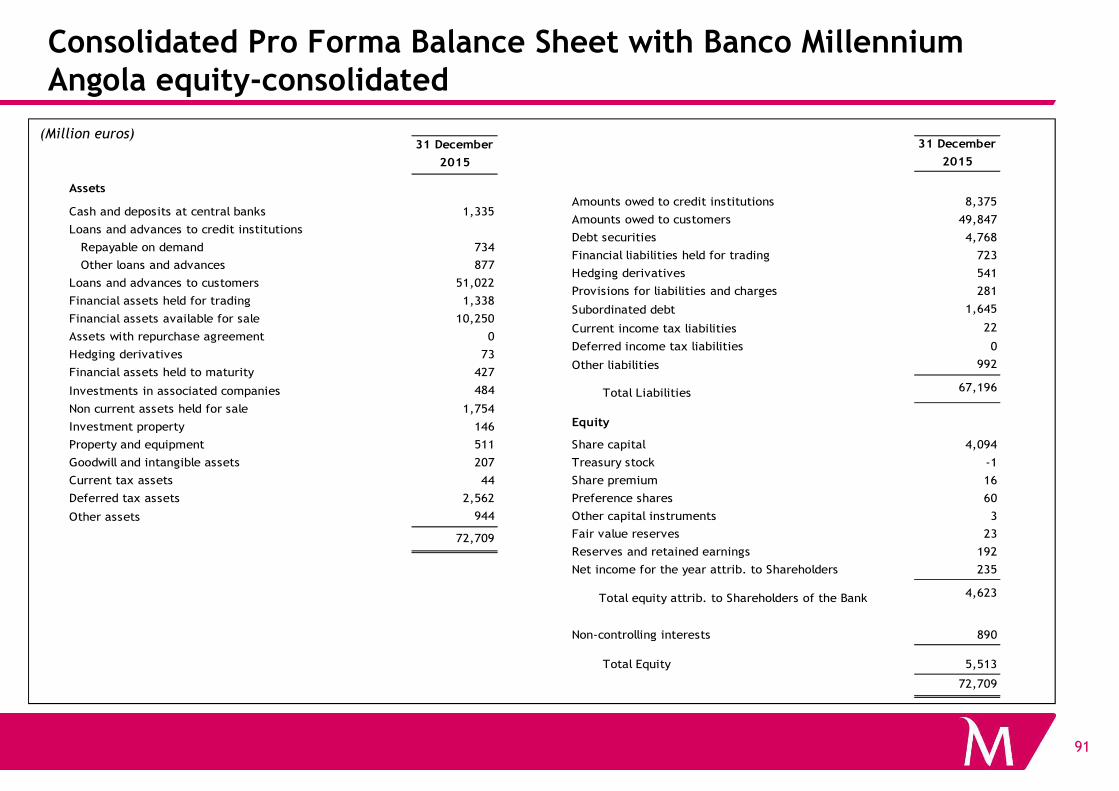
Consolidated Pro Forma Balance Sheet with Banco Millennium Angola equity-consolidated
(Million euros)31 December
2015
Assets
Cash and deposits at central banks 1,335
Loans and advances to credit institutions
Repayable on demand 734
Other loans and advances 877
Loans and advances to customers 51,022
Financial assets held for trading 1,338
Financial assets available for sale 10,250
Assets with repurchase agreement 0
Hedging derivatives 73
Financial assets held to maturity 427
Investments in associated companies 484
31 December
2015Liabilities
Amounts owed to credit institutions 8,375
Amounts owed to customers 49,847
Debt securities 4,768
Financial liabilities held for trading 723
Hedging derivatives 541
Provisions for liabilities and charges 281
Subordinated debt 1,645
Current income tax liabilities 22
Deferred income tax liabilities 0
Other liabilities 992
Total Liabilities 67,196
91
Investments in associated companies 484
Non current assets held for sale 1,754
Investment property 146
Property and equipment 511
Goodwill and intangible assets 207
Current tax assets 44
Deferred tax assets 2,562
Other assets 944
72,709
Total Liabilities
Equity
Share capital 4,094
Treasury stock -1
Share premium 16
Preference shares 60
Other capital instruments 3
Fair value reserves 23
Reserves and retained earnings 192
Net income for the year attrib. to Shareholders 235
Total equity attrib. to Shareholders of the Bank 4,623
Non-controlling interests 890
Total Equity 5,513
72,709
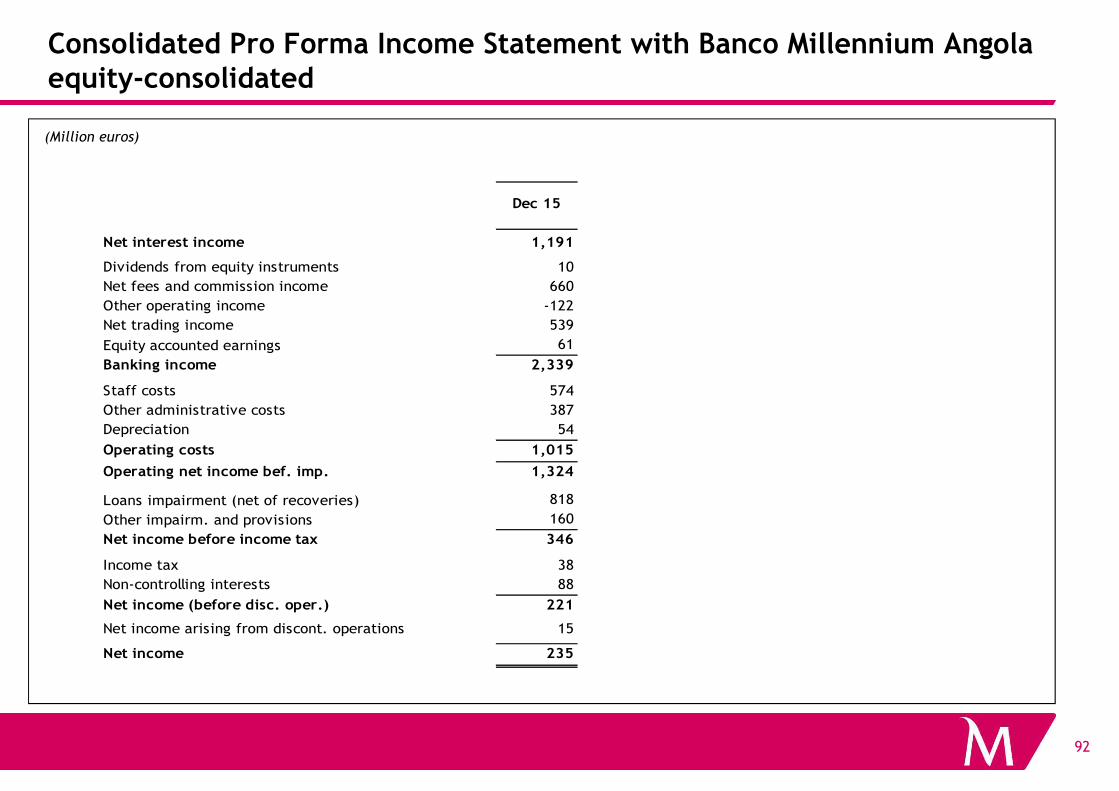
Consolidated Pro Forma Income Statement with Banco Millennium Angola equity-consolidated
(Million euros)
Net interest income 1,191
Dividends from equity instruments 10
Net fees and commission income 660
Other operating income -122
Net trading income 539
Equity accounted earnings 61
Banking income 2,339
Staff costs 574
Dec 15
92
Staff costs 574
Other administrative costs 387
Depreciation 54
Operating costs 1,015
Operating net income bef. imp. 1,324
Loans impairment (net of recoveries) 818
Other impairm. and provisions 160
Net income before income tax 346
Income tax 38
Non-controlling interests 88
Net income (before disc. oper.) 221
Net income arising from discont. operations 15
Net income 235
Summary
1. Portuguese macroeconomic update
2. Overview of Millennium bcp
3. Strategic Plan
A. Strategic plan metrics
B. Liquidity and Capital
93
B. Liquidity and Capital
4. Investment case
5. Appendix
A. 2015 Earnings
B. Other Information
884
1
45166
Canada
Luxemburg
UKGermany
Spain
France
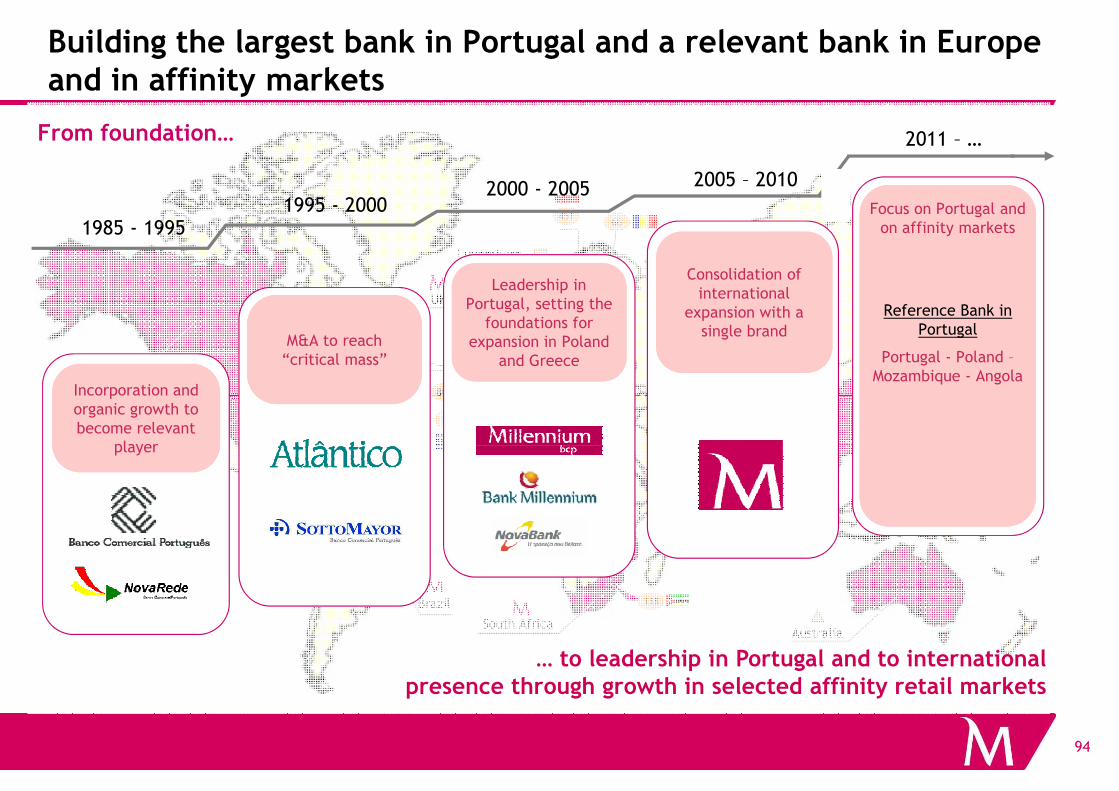
December 2011
Incorporation and
M&A to reach “critical mass”
Leadership in Portugal, setting the
foundations for expansion in Poland
and Greece
Consolidation of international
expansion with a single brand
Focus on Portugal and on affinity markets
Reference Bank in Portugal
Portugal - Poland –Mozambique - Angola
1985 - 19951995 - 2000
2000 - 2005 2005 – 2010
2011 – …
Building the largest bank in Portugal and a relevant bank in Europe and in affinity markets
From foundation…
94
138
61
1
120
884
U.S.A.
Australia
China
Venezuela
Brazil
South Africa
Incorporation and organic growth to become relevant
player
… to leadership in Portugal and to international presence through growth in selected affinity retail markets
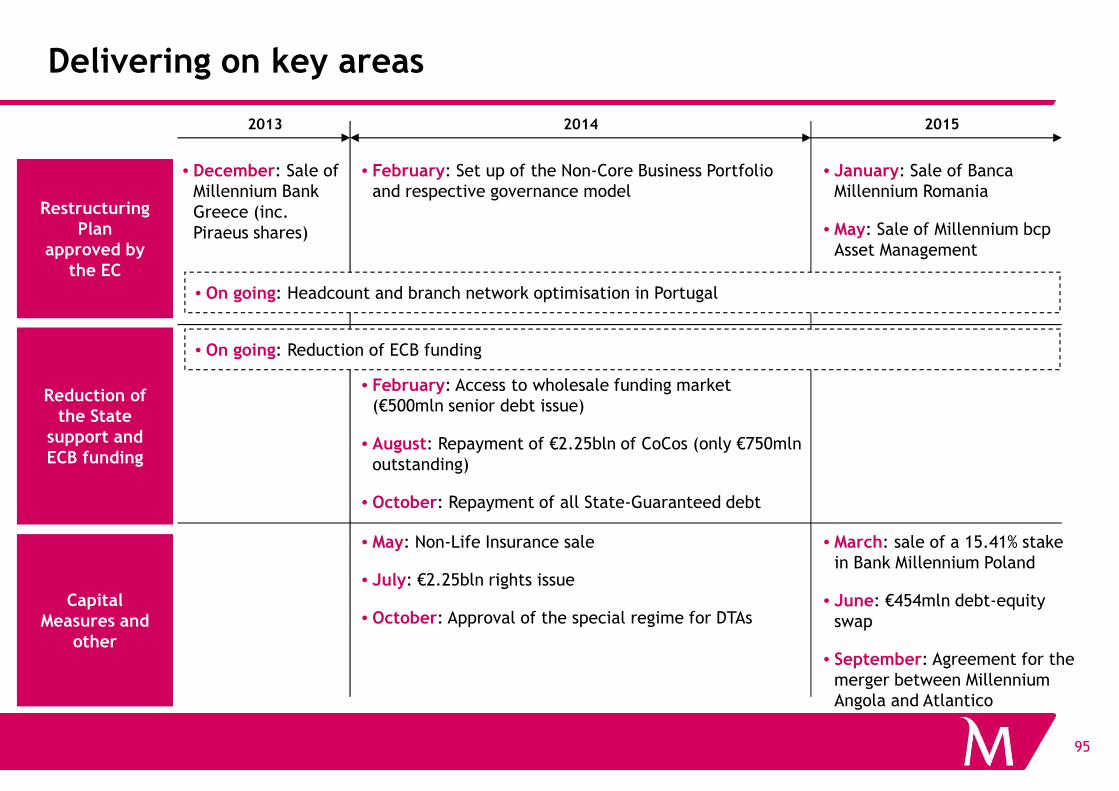
• February: Access to wholesale funding market (€500mln senior debt issue)
Delivering on key areas
2014 20152013
Reduction of
Restructuring Plan
approved by the EC
• December: Sale ofMillennium BankGreece (inc. Piraeus shares)
• February: Set up of the Non-Core Business Portfolio and respective governance model
• January: Sale of Banca Millennium Romania
• May: Sale of Millennium bcp Asset Management
• On going: Reduction of ECB funding
• On going: Headcount and branch network optimisation in Portugal
95
(€500mln senior debt issue)
• August: Repayment of €2.25bln of CoCos (only €750mln outstanding)
• October: Repayment of all State-Guaranteed debt
Reduction of the State
support and ECB funding
Capital Measures and
other
• May: Non-Life Insurance sale
• July: €2.25bln rights issue
• October: Approval of the special regime for DTAs
• March: sale of a 15.41% stake in Bank Millennium Poland
• June: €454mln debt-equity swap
• September: Agreement for the merger between Millennium Angola and Atlantico
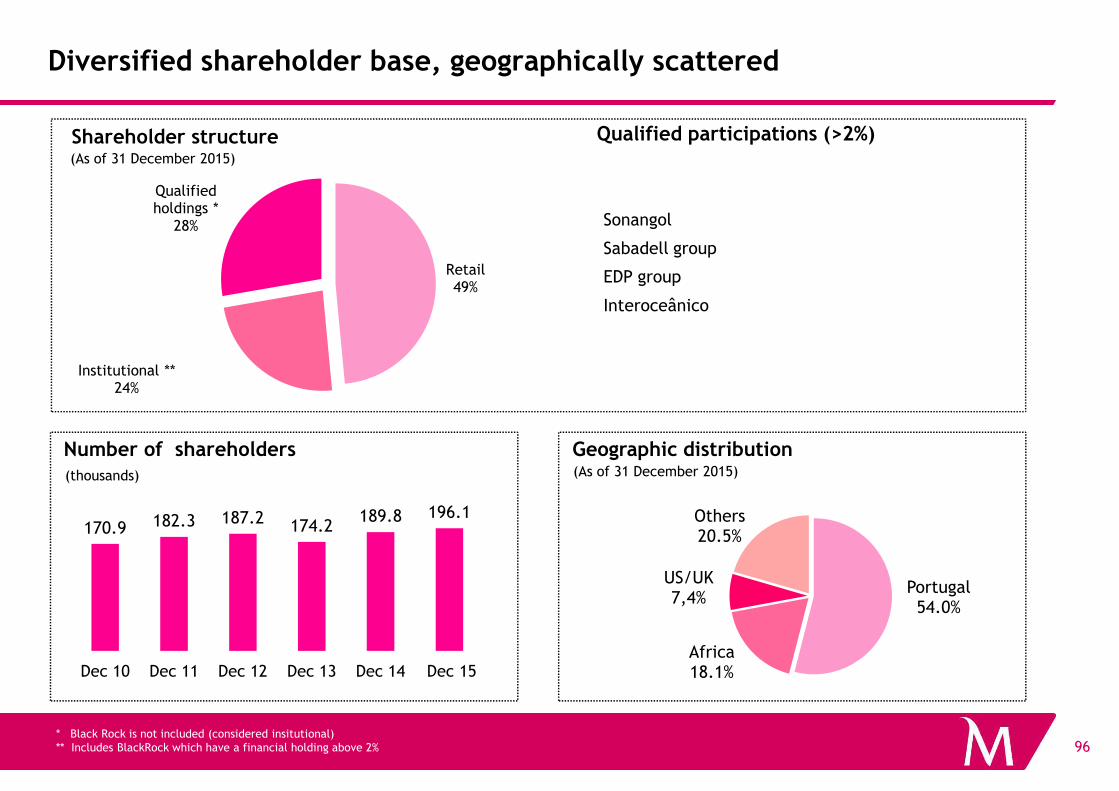
Retail49%
Institutional **24%
Qualified holdings *
28%
Diversified shareholder base, geographically scattered
Shareholder structure Qualified participations (>2%)
Sonangol
Sabadell group
EDP group
Interoceânico
(As of 31 December 2015)
96
24%
(thousands)
170.9 182.3 187.2 174.2189.8 196.1
Dec 10 Dec 11 Dec 12 Dec 13 Dec 14 Dec 15
Portugal 54.0%
Africa 18.1%
US/UK 7,4%
Others 20.5%
(As of 31 December 2015)
* Black Rock is not included (considered insitutional)** Includes BlackRock which have a financial holding above 2%
Number of shareholders Geographic distribution
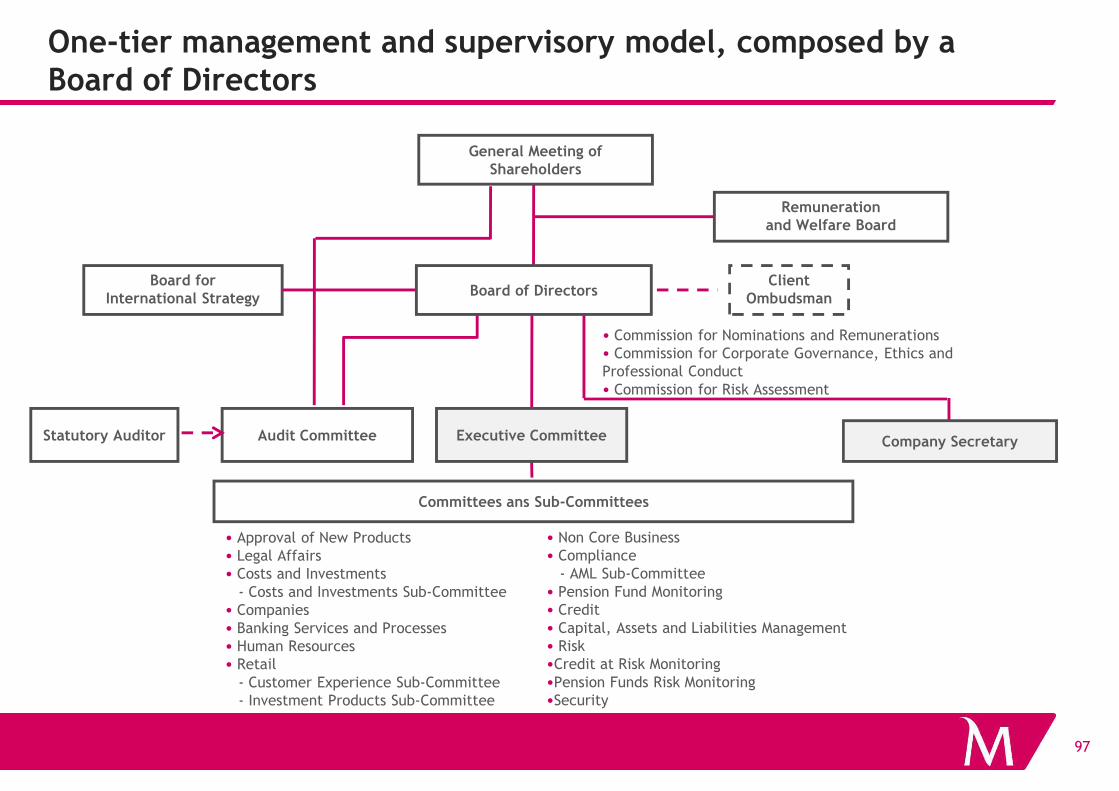
One-tier management and supervisory model, composed by a Board of Directors
Board forInternational Strategy
Remunerationand Welfare Board
• Commission for Nominations and Remunerations• Commission for Corporate Governance, Ethics and Professional Conduct• Commission for Risk Assessment
Client Ombudsman
General Meeting ofShareholders
Board of Directors
97
• Approval of New Products• Legal Affairs• Costs and Investments
- Costs and Investments Sub-Committee• Companies• Banking Services and Processes• Human Resources• Retail
- Customer Experience Sub-Committee- Investment Products Sub-Committee
Statutory Auditor Audit Committee
Committees ans Sub-Committees
• Non Core Business• Compliance
- AML Sub-Committee• Pension Fund Monitoring• Credit• Capital, Assets and Liabilities Management• Risk•Credit at Risk Monitoring•Pension Funds Risk Monitoring•Security
• Commission for Risk Assessment
Executive Committee Company Secretary
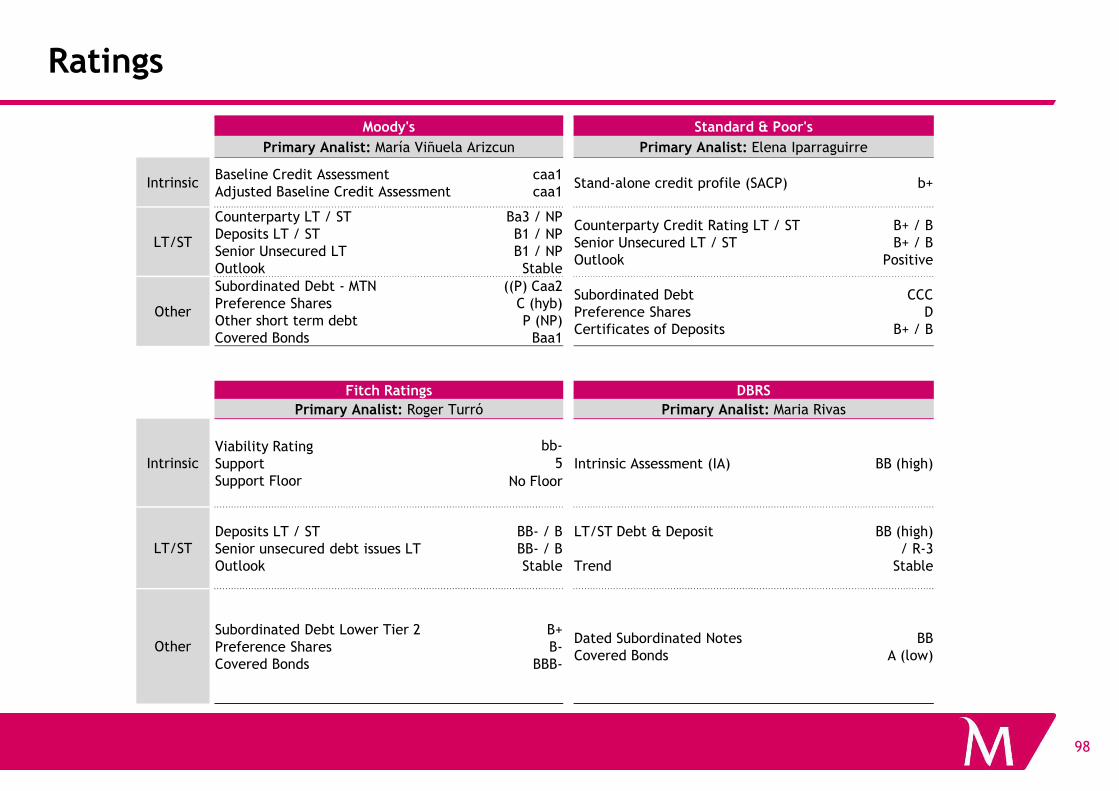
Ratings
Moody's Standard & Poor's
Primary Analist: María Viñuela Arizcun Primary Analist: Elena Iparraguirre
IntrinsicBaseline Credit Assessment Adjusted Baseline Credit Assessment
caa1caa1
Stand-alone credit profile (SACP) b+
LT/ST
Counterparty LT / STDeposits LT / STSenior Unsecured LTOutlook
Ba3 / NPB1 / NPB1 / NPStable
Counterparty Credit Rating LT / STSenior Unsecured LT / STOutlook
B+ / BB+ / B
Positive
Other
Subordinated Debt - MTNPreference SharesOther short term debtCovered Bonds
((P) Caa2C (hyb)P (NP)
Baa1
Subordinated DebtPreference SharesCertificates of Deposits
CCCD
B+ / B
Fitch Ratings DBRS
98
Fitch Ratings DBRS
Primary Analist: Roger Turró Primary Analist: Maria Rivas
IntrinsicViability RatingSupportSupport Floor
bb-Intrinsic Assessment (IA) BB (high)5
No Floor
LT/STDeposits LT / STSenior unsecured debt issues LTOutlook
BB- / BBB- / BStable
LT/ST Debt & Deposit
Trend
BB (high)/ R-3
Stable
OtherSubordinated Debt Lower Tier 2Preference SharesCovered Bonds
B+B-
BBB-
Dated Subordinated NotesCovered Bonds
BB A (low)
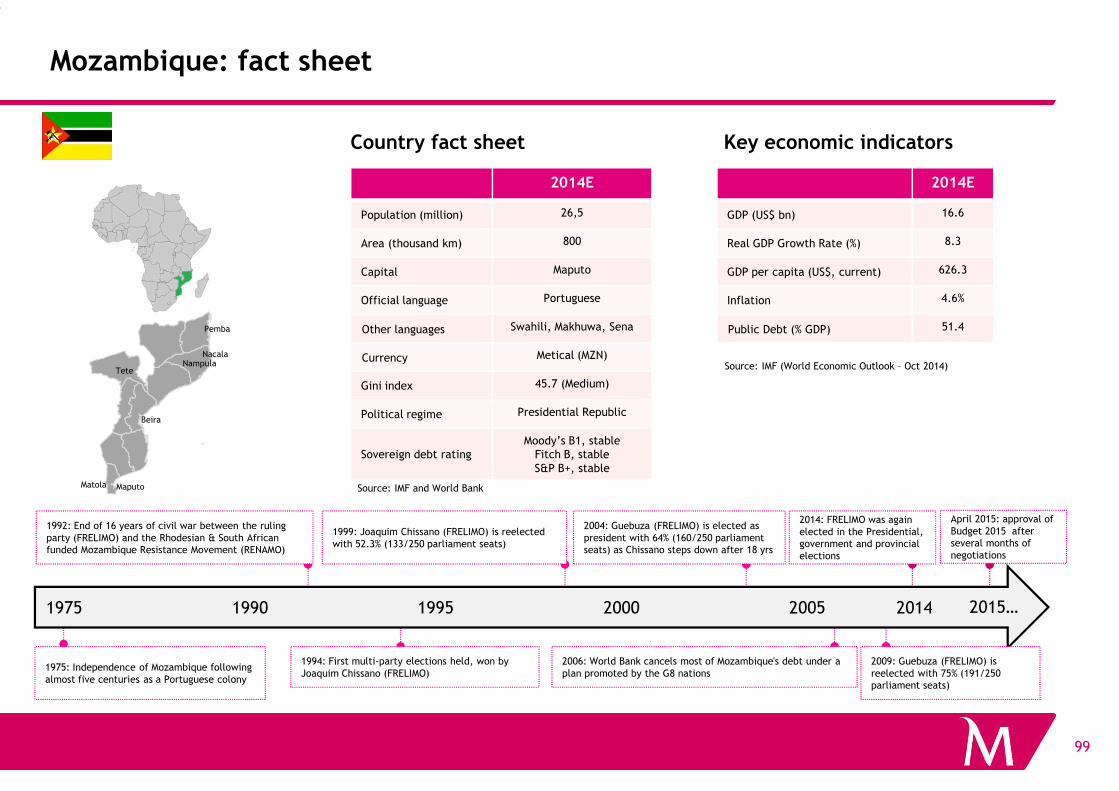
Mozambique: fact sheet
NampulaTete
Nacala
Pemba
Country fact sheet Key economic indicators
Source: IMF (World Economic Outlook – Oct 2014)
2014E
Population (million) 26,5
Area (thousand km) 800
Capital Maputo
Official language Portuguese
Other languages Swahili, Makhuwa, Sena
Currency Metical (MZN)
Gini index 45.7 (Medium)
2014E
GDP (US$ bn) 16.6
Real GDP Growth Rate (%) 8.3
GDP per capita (US$, current) 626.3
Inflation 4.6%
Public Debt (% GDP) 51.4
99
1992: End of 16 years of civil war between the ruling party (FRELIMO) and the Rhodesian & South African funded Mozambique Resistance Movement (RENAMO)
2004: Guebuza (FRELIMO) is elected as president with 64% (160/250 parliament seats) as Chissano steps down after 18 yrs
2014: FRELIMO was again elected in the Presidential, government and provincial elections
1999: Joaquim Chissano (FRELIMO) is reelected with 52.3% (133/250 parliament seats)
1975: Independence of Mozambique following almost five centuries as a Portuguese colony
1975 20141990 1995 2000 2005
1994: First multi-party elections held, won by Joaquim Chissano (FRELIMO)
2006: World Bank cancels most of Mozambique's debt under a plan promoted by the G8 nations
2009: Guebuza (FRELIMO) is reelected with 75% (191/250 parliament seats)
MaputoMatola
Beira
Source: IMF and World Bank
Political regime Presidential Republic
Sovereign debt ratingMoody’s B1, stable
Fitch B, stableS&P B+, stable
2015…
April 2015: approval of Budget 2015 after several months of negotiations
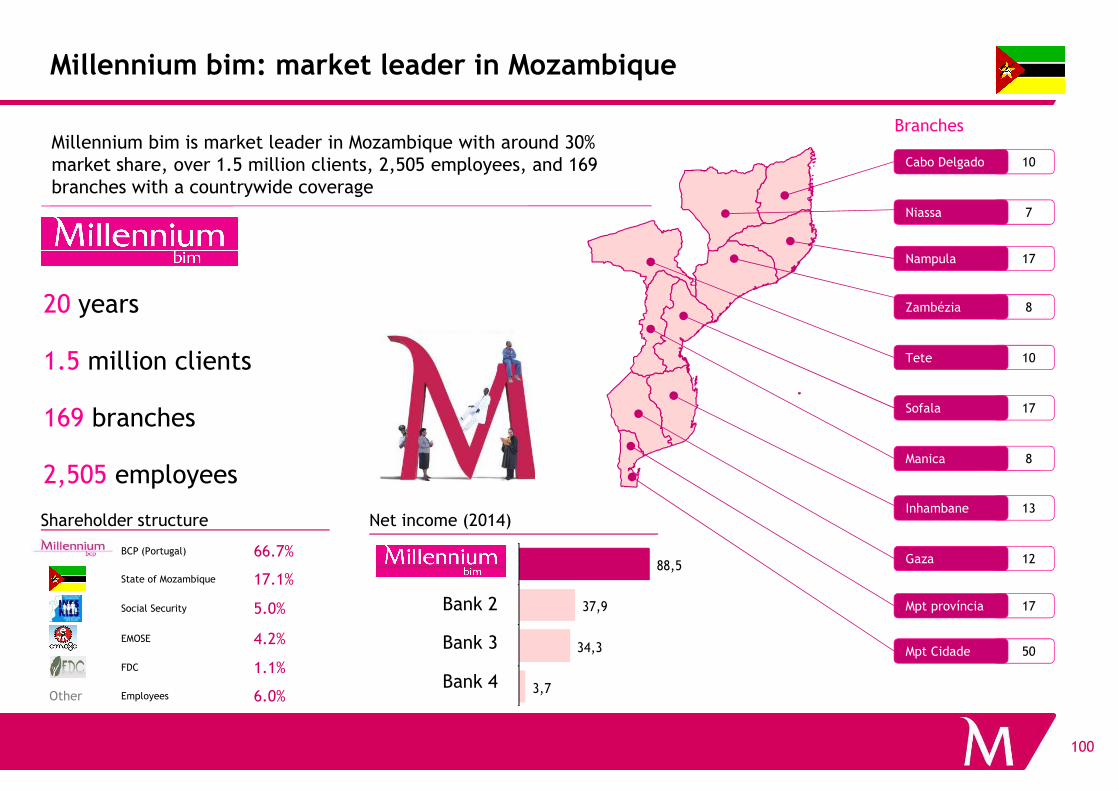
10
7
17
8
10
Millennium bim is market leader in Mozambique with around 30% market share, over 1.5 million clients, 2,505 employees, and 169 branches with a countrywide coverage
20 years
1.5 million clients
Cabo Delgado
Niassa
Nampula
Zambézia
Tete
Branches
Millennium bim: market leader in Mozambique
100
17
8
13
12
17
50
169 branches
2,505 employees
Net income (2014)
Sofala
Manica
Inhambane
Gaza
Mpt província
Shareholder structure
FDC 1.1%
EMOSE 4.2%
State of Mozambique 17.1%
Social Security 5.0%
Other Employees 6.0%
BCP (Portugal) 66.7%
3,7
34,3
37,9
88,5M i l l e n n i um b im
Mpt Cidade
Bank 2
Bank 3
Bank 4
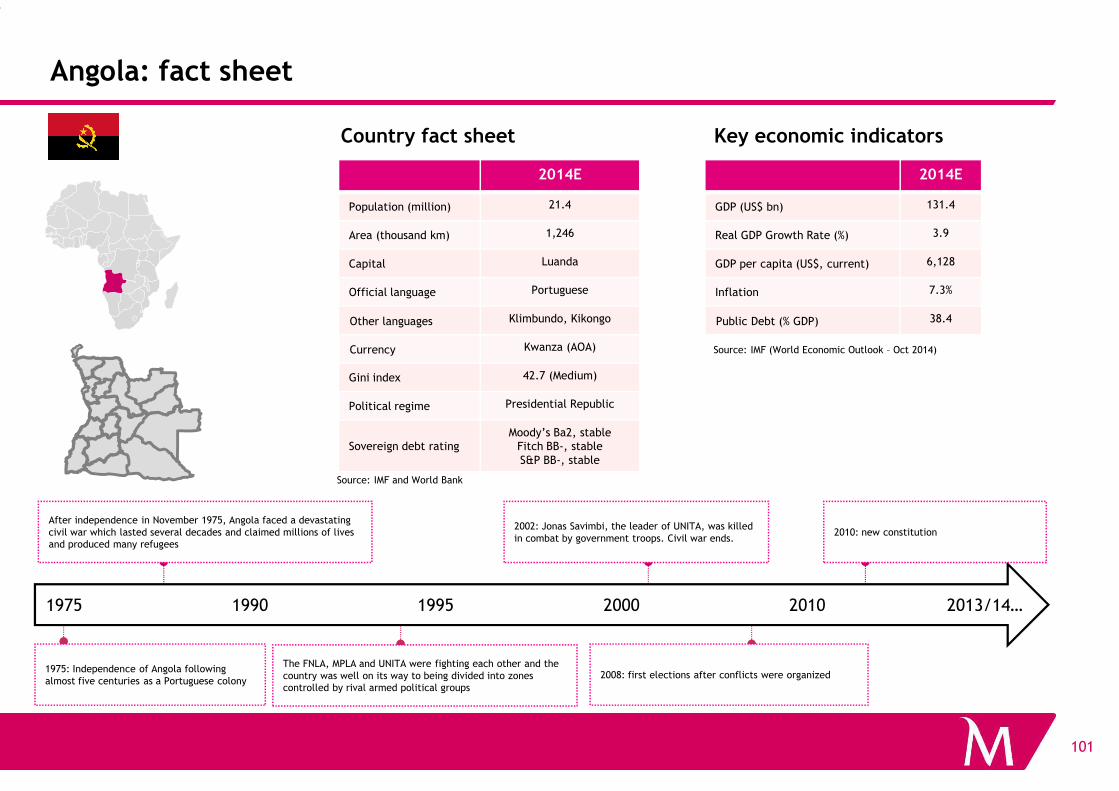
Angola: fact sheet
Country fact sheet Key economic indicators
Source: IMF (World Economic Outlook – Oct 2014)
2014E
Population (million) 21.4
Area (thousand km) 1,246
Capital Luanda
Official language Portuguese
Other languages Klimbundo, Kikongo
Currency Kwanza (AOA)
Gini index 42.7 (Medium)
2014E
GDP (US$ bn) 131.4
Real GDP Growth Rate (%) 3.9
GDP per capita (US$, current) 6,128
Inflation 7.3%
Public Debt (% GDP) 38.4
101
After independence in November 1975, Angola faced a devastating civil war which lasted several decades and claimed millions of lives and produced many refugees
2002: Jonas Savimbi, the leader of UNITA, was killed in combat by government troops. Civil war ends.
2010: new constitution
1975: Independence of Angola following almost five centuries as a Portuguese colony
1975 2013/14…1990 1995 2000 2010
The FNLA, MPLA and UNITA were fighting each other and the country was well on its way to being divided into zones controlled by rival armed political groups
2008: first elections after conflicts were organized
Source: IMF and World Bank
Political regime Presidential Republic
Sovereign debt ratingMoody’s Ba2, stable
Fitch BB-, stableS&P BB-, stable
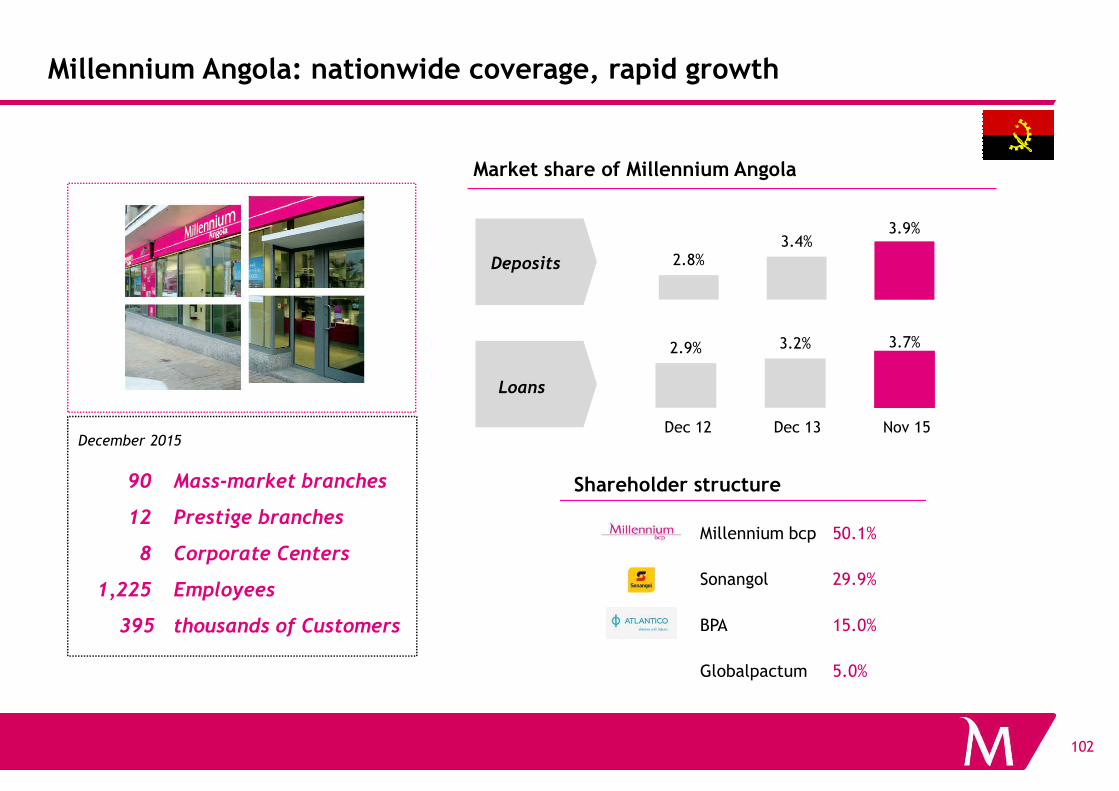
2.9% 3.2% 3.7%
Millennium Angola: nationwide coverage, rapid growth
Deposits
Loans
2.8%3.4%
3.9%
Market share of Millennium Angola
102
Dec 12 Dec 13 Nov 15
90 Mass-market branches
12 Prestige branches
8 Corporate Centers
1,225 Employees
395 thousands of Customers
December 2015
Loans
Shareholder structure
Globalpactum 5.0%
Sonangol 29.9%
BPA 15.0%
Millennium bcp 50.1%
103