bbr - university of texas at austin
TRANSCRIPT

This repor t was funded by the P r e si de n t’s Of f ic e of th e Un i v e r si t y Of te x a s at aU st i n • For the te x a s as s O c i at iOn Of a f r ica n-a m e r ica n ch a m be r s Of cOm m e rc e (ta a acc) • Conducted by the bU r e aU Of bU si n e s s r e se a rc h at the ic 2 i n st i t U t e of th e Un i v e r si t y Of te x a s at aU st i n • Under the super v i sion of
dr. brUc e K e l l i s On, dr. JOh n si bl ey bU t l e r, and dr. m at t K e rw icK
Survey ofTexas Black-Owned Businesses
BBR

2
Survey ofTexas Black-Owned Businesses
BBR
Table of ContentsAcknowledgments …………………………………………………………… 3
About this Report ……………………………………………………………… 4
Executive Summary …………………………………………………………… 5
Part 1: Background Data from the 2007 Business Census ………………… 5
Part 2: Results from the BBR Survey of Black-Owned Businesses ………… 5
Conclusions: Improving Black-Owned Business Performance in Texas …… 8
Part 1: Background Data from the 2007 Business Census ……………………… 11
BOBs represent a growing segment of the Texas economy ……………… 11
Economic parity ………………………………………………………… 12
Part 2: BBR Survey Results: Texas Black-Owned Businesses …………………… 15
Characteristics of Texas Black-owned businesses ………………………… 15
Demographics of the Black business owner ……………………………… 26
Training needs …………………………………………………………… 30
Procurement opportunities ……………………………………………… 32
Racially diversified customers and employees …………………………… 35
Major challenges facing Black-owned businesses ………………………… 38
Skills of Black-owned business owners …………………………………… 40
Conclusions: Improving Black-Owned Business Performance in Texas ………… 42
Bibliography ………………………………………………………………… 45
Appendix: Sample Characteristics and Survey Methodology ………………… 47

3
Nearly 1,000 Texas Black business owners took time away from running their businesses to respond to
our survey, and each of them deserves our thanks. Hundreds more contacted our office with questions
about the survey and its goals and offered to help in other ways to identify key training needs and
barriers to growth faced by Texas Black-owned businesses.
Dr. Veronica Inchauste and her team at the Office of Survey Research at the Annette Strauss Institute,
The University of Texas at Austin, skillfully administered the survey for the Bureau of Business Research
(BBR) and patiently shepherded the results to us for analysis. We are grateful, in particular, to Dr. Elsie
Echeverri-Carroll, Senior Research Scientist at the IC2 Institute, who shared with us her expertise and
wisdom from her own research on Hispanic- and women-owned firms. Yeolib Kim, BBR Graduate
Research Assistant, professionally managed the survey results and tabulated the findings for the
research team. Matias Pasch, Undergraduate Research Assistant at the BBR, coded the open-ended
survey responses and served as an in-house resource on Census Bureau data.
The Bureau of Business Research at the IC2 Institute, The University of Texas at Austin, was founded in
1926 “to promote the industrial development of Texas and gather important business data to be used
by businessmen locating industry in Texas.” Today, the Bureau’s publications and research focus on
high technology, entrepreneurship, and international trade (especially with Mexico), as well as other
economically relevant sectors for the State. Please visit our website at www.ic2.utexas.edu/bbr for
more information on our activities, services, and research.
For more information:
Dr. Bruce Kellison
Associate Director
Bureau of Business Research/IC2 Institute
(512) 475-7813
Dr. Matt Kerwick
Research Scientist
Bureau of Business Research/IC2 Institute
(512) 475-8919
Acknowledgments

4
The Office of the President of The University of Texas at Austin sponsored The Survey of Texas
Black-owned Businesses. The Bureau of Business Research (BBR) at the IC2 Institute, The University
of Texas at Austin, directed the survey and analysis. Dr. Bruce Kellison, Dr. Matt Kerwick, and
Dr. John Sibley Butler served as co-Principal Investigators and authored the report.
The survey explored:
• Business owner demographics
• Business characteristics
• Training needs
• Ease in doing business with the government and the private sector.
Four databases with a combined non-duplicative total sample size of 6,993 Black-owned firms
in Texas were used as the surrey’s sampling frame. All were mailed a questionnaire in the fall of 2013.
The response rate to the survey instrument is estimated to be 15.9%1.
Our analysis is presented in two parts:
• Part 1 provides background information on Black-owned business trends from the 2007 U.S. Census Bureau Survey of Business Owners
• Part 2 contains results from the BBR survey on the characteristics of Black-owned businesses with paid employees in Texas.
An executive summary precedes the detailed analysis.
1 The response rate is estimated as the number of valid responses received from businesses owned by a person who self-identified as a Black person and who reported owning 51 percent or more of his/her business, divided by the number of surveys mailed to Black-owned businesses with correct addresses. The BBR mailed a total of 6,993 surveys, of which 597 were returned with a bad address, 512 were neither minority- nor majority-owned Black businesses, 117 were not majority-owned (>51 percent) by a Black person, nine were from an invalid business like a non-profit, and seven were blank. We received 914 valid survey responses. Thus, the response rate is estimated to be 15.9 percent (914/5751).
About this Report

5
Part 1: Background Data from the 2007 Business Census
Black-owned businesses (BOBs) represent a growing segment of the economic environment in Texas
• According to the 2007 U.S. Census Bureau’s Survey of Business Owners (SBO), Black-owned
businesses accounted for 7 percent of all businesses in Texas (154,283 out of 2.1 million), up
from 5 percent in 2002.
• The number of Black-owned businesses in Texas increased from 88,768 in 2002 to 154,283 in 2007,
a 74 percent increase. The total number of Texas businesses (including BOBs) rose 25 percent in
that time period.
• Most of the growth in the number of Texas BOBs and the percentage of Texas BOBs among all
Texas businesses has been among businesses with no paid employees other than the owner.
More than 95 percent of Texas BOBs are solo practitioners with no employees, which is up from
93 percent in 2002.
BOBs in Texas trail average Texas businesses in economic terms
• SBO data from 2007 show that Black-owned businesses in Texas on average employ 10 workers,
while the average business in Texas employs 23 workers.
• The average business in Texas had $1.2 million in sales, whereas the average BOB had $60,000 in
sales in 2007.
• If the ratio of Texas Black-owned employer businesses to the Texas Black population were the
same as the ratio of Texas employer businesses to the entire Texas population, there would be
46,000 Black-owned businesses with employees in Texas, not 7,205 in 2007.
Part 2: Results from the BBR Survey of Black-owned BusinessesThe findings presented below highlight the general results and analyses performed on data collected from the BBR survey.
Texas BOB Characteristics
• Employer Status: Slightly less than one-third of the survey respondents reported that they were
non-employer firms, in other words, those without any paid employees other than the owner.
While this is a lower percentage than the 2007 SBO reported, Texas BOBs in the BBR survey are
small enterprises. Eighty-four percent of respondents reported that their businesses employ ten
or fewer workers.
Executive Summary

6
• Longevity: Despite their relatively small size, many BOBs in the survey have been able to remain
in business for years, with about 50 percent of the survey respondents reporting that they have
been in business for more than 10 years. Previous research has found that the longer a business is
operating, the less likely it is that the business will fail (Brock and Evans 1986).
• Age of business and size: Non-employer firms make up a decreasing percentage of BOBs as the
age of the business increases. When BOBs are 5 years of age or less, non-employer firms constitute
43 percent of such organizations. For BOBs in existence more than 15 years, the non-employer
proportion drops to 22 percent, a level that continues to decline further as the business ages.
In contrast, the age distribution of employer firms remains relatively stable over time except
for businesses with 100 or more employees. These larger BOBs are more likely to have been in
business for more than 25 years.
• Start-ups vs. Acquisitions: More than 90 percent of the survey respondents are entrepreneurs,
having started their business rather the having acquired it by other means. This is very consistent
with the findings from other minority-owned business surveys, including the experiences of
Hispanic-owned firms, which confirm that most of these businesses are begun by entrepreneurs
and not purchased or otherwise acquired.
• Business Sectors: Most BOBs in the survey belong to a service industry (72 percent), with the
Professional-Scientific-Technical Service sector being the most common at 28 percent. Twenty-
two percent of the businesses are in the construction sector.
• Certifications: Minority set-aside business programs can provide significant market access for
minority-owned firms. Survey respondents were asked about the types of minority business
certifications they hold, if any, among the variety of local, state, federal, and private certifications
available to minority-owned firms. Almost 65 percent of the respondents are certified through the
State of Texas historically underutilized business (HUB) program, while 44 percent said they are
certified through a city or county program, and 19 percent are federally certified. Fully a quarter
of the respondents did not list any certifications. One-third of respondents only had a single
certification. Businesses with employees have significantly more local and federal certifications
than businesses without employees.
• Access to Capital: A common challenge for any small business is access to capital. The survey
respondents reported that on average 75 percent of the capital used when they started or
purchased their business came from their personal savings. Further, 61 percent of the respondents
utilized only personal savings. An additional 29 percent utilized personal savings along with other
sources. In total, 90 percent of the survey respondents utilized personal saving to start or acquire
their business. Access to working capital via a business loan or line of credit can help sustain or
grow a small business that cannot finance its daily operations through cash flow. The survey
found that 28 percent of the respondents had applied for and received a loan. Over 50 percent of
the respondents had never applied for a loan. And almost 20 percent of the respondents replied
that they had applied for a loan but had never received one.
Executive Summary, continued …

7
Executive Summary, continued …
Texas BOB Demographics
• Educational Attainment: About 67 percent of the business owners surveyed reported
having a bachelors or graduate degree and 91 percent had at least some college. Overall,
the Black business owners in the sample have more education than the general Black
population aged 25 years and older in Texas. Census data show that only 21 percent of Texas
Blacks have a bachelor’s degree or higher, while 57 percent have some college education,
with or without a degree.
• Experience in business: About 47 percent of the business owners in the BBR survey had
more than 20 years of experience in their current industry.
Texas BOB Opinions and Perceptions
• Training Needs: Black owners of businesses in Texas were asked an open-ended question about
their top three training needs, and to rank them in order of importance. Their responses were
coded by type of training need. Survey respondents listed Accounting/finance training more
often than any other response (16 percent) among those listed first, as their top training need,
followed by technology (10 percent) and management/leadership (10 percent).
• Profitability: Survey respondents were asked how their business performs compared to others
in their particular industry segment (on a five-point Likert-type scale from much less profitable, to
about average, to much more profitable). The results show a notably large cluster of respondents
perceive themselves to be much less profitable than others in their industry, especially among
non-employer firms.
• Procurement: A majority of the respondents agreed or strongly agreed that understanding
the political system is a critical factor in the success of their business, and that they have less
access than other businesses to government decision makers for the purposes of procurement
opportunities. A majority of the respondents also agreed or strongly agreed that BOBs were
unfairly excluded from participating in government contracting opportunities (63 percent) and
private sector contracting opportunities (70 percent).
• Major Challenges: Survey respondents were asked in an open-ended question to rank the
top three major challenges facing their business. BBR research staff coded the answers and
grouped them by topic. The most frequently mentioned topic area encompassed funding, cash
flow, and finances (26 percent of responses). Bidding for and winning contracts was the second
most frequently mentioned top-ranked challenge area to their firm (12 percent). The third most
frequently mentioned challenge area was marketing and sales (8 percent).
• Skills: Texas Black-owned business owners perceive themselves to be highly proficient across a
range of business skills. The skills for which the most BOBs assessed themselves as at least “very

8
Executive Summary, continued …
good” include problem solving and analysis (86 percent and 84 percent, respectively). Team
management, team building, and motivating employees were rated as at least “very good”
by the fewest number of BOBs, but even those skills garnered percentages for “very good” and
“excellent” close to 70 percent. However, BOBs who perceive themselves to be less profitable
than other businesses in their industry are significantly less likely to assess themselves to be
“very good” or “excellent” on all business skills covered by the BBR survey.
Other findings
• Customers: The BBR survey asked whether the majority of the respondents’ customers were
primarily Black, an equal mixture of Black and non-Black, or primarily non-Black. About 40 percent
of the respondents reported that their customers were an equal mixture, and 44 percent said they
had primarily non-Black customers. Only 16 percent of the businesses in this survey sold goods or
services predominantly to Blacks. These results suggest that BOBs are fairly well integrated into
mainstream business environment and that there is little evidence of an “enclave” phenomenon
in which BOBs are selling goods and services primarily to Black customers.
• Employees: Among Texas Black-owned businesses with employees, a slight plurality (43 percent)
responded that the majority of employees in their business were Black. Just over 41 percent
reported that they employ an equal mixture of Black and non-Black employees. More than
15 percent responded that they have a majority of non-Black employees.
Conclusions: Improving Black-owned Business Performance in TexasThis survey highlighted a number of aspects of the business climate in which owners of Black-owned Texas businesses work.
• The number of Black-owned businesses in Texas is growing (according to Census data, up
74 percent between 2002 and 2007).
• Most Texas BOBs are small and smaller than the average Texas firm. Among BBR respondents,
85 percent reported that their businesses employ ten or fewer people. Census data indicate that
non-employer firms constitute 95 percent of Black-owned businesses in Texas.
• Black owners of businesses who responded to the BBR survey are much more educated
(>90 percent have some college) than Blacks in the general population over 25 years of age
(57 percent).
• Most BOBs in the survey belong to a service industry (72 percent) with the Professional-Scientific-
Technical Service sector being the most common at 28 percent. Twenty-two percent of the
businesses are in the construction sector.

9
• Texas Black-owned business owners in the survey believe they are highly proficient across a
range of business skills. However, BOBs who perceive themselves to be less profitable than other
businesses in their industry are significantly less likely to assess themselves to be “very good” or
“excellent” across all business skills covered by the BBR Survey.
• Twenty-eight percent of the respondents had applied for and received a business loan. Over
50 percent of the respondents had never applied for a loan. And almost 20 percent of the
respondents reported that they had applied for a loan but had never received one.
• Seventy-five percent of Black-owned businesses in the survey had at least one HUB or other
minority business certifications. However, about one-third of respondents only had a single
certification. In general, non-employer firms in the survey lag employers relative to HUB and other
minority business certifications, achieving parity only with state certifications. Employers have
significantly more local and federal certifications than do non-employer firms.
• A majority of the respondents agreed or strongly agreed that understanding the political
system is a critical factor in the success their businesses (76 percent), that BOBs, in general, have
less access than other firms to government decision makers for the purposes of procurement
opportunities (79 percent), and that BOBs were unfairly excluded from participating in
government contracting opportunities (63 percent) and private sector contracting opportunities
(70 percent).
• In general, survey respondents believe their businesses to be less profitable than their peers in
the same industry. This perception is significantly more common among non-employer firms than
among those with employees.
• The top training needs and biggest current challenges to the respondents’ businesses are related
to accounting and finance. Sales and marketing is another function mentioned as both a training
need and a business challenge.
Despite confidence in their skills as business people and relatively high levels of educational attainment, Black owners of businesses in the BBR survey still perceive significant barriers to growing their firms and achieving the profitability level of their industry peers. This is especially true for non-employer firms, who constitute 95 percent of Black-owned businesses in Texas.
Key challenges and barriers to growth emerged from the survey that policy makers and business leaders should address in order to improve the growth and performance of Black-owned businesses in Texas:
♦ Goal 1: Focus policy on improving access to financial capital and financial training for Black
entrepreneurs.
Executive Summary, continued …

10
♦ Goal 2: Encourage Black entrepreneurs planning new businesses to do so with a level of
capitalization and scope that allows them to start their business as a team with employees
rather than starting out as solo practitioner without employees.
♦ Goal 3: Target BOBs in the service sector (including professional, scientific, and technical services)
and construction with information about obtaining financial capital and continuing educational
opportunities in business topics (finance, accounting, management, sales, and marketing) as well
as notifications about local and federal HUB/minority certifications.
This survey hopefully will contribute to the strengthening of Black-owned business performance in Texas by highlighting important aspects of the conditions, barriers, and opportunities facing them.
Executive Summary, continued …

11
Part 1: Background Data
Part 1: Background Data from the 2007 Business CensusThe United States Census Bureau collects data on Black-owned businesses (BOBs) every five years in the Survey of Business Owners (SBO). The 2007 SBO is the latest data available from the Census Bureau.
BOBs represent a growing segment of the Texas economy
The U.S. Census Bureau’s Survey of Business Owners is one of the best sources for state- and national-level data on the racial and ethnic composition of businesses in the United States. The 2007 SBO data (2012 data are scheduled for release in 2015) identified more Black-owned businesses in Texas than ever before. Black-owned businesses accounted for 7.1 percent of all businesses in Texas (154,283 out of 2.1 million) in 2007, and that percentage increased from 5.1 percent in 2002. And encouragingly, this growth rate among BOBs exceeded the growth rate among all Texas businesses between 2002 and 2007. The total number of BOBs grew 74 percent between 2002 and 2007, while the total number of all Texas businesses grew 25 percent.
On the other hand, much of this growth between 2002 and 2007 was by BOBs without employees. The 2007 SBO data show that 95 percent of all Texas BOBs have no employees other than the owner (non-employer firms), and that percentage has increased since 2002 (up from 93 percent). The research on new-firm formation shows that businesses that start as non-employers are far less likely to ever have employees than are businesses that start with employees (Davis et al. 2007; Headd and Saade 2008; Désiage et al. 2011), so scaling these non-employer firms may be a challenge if they begin as businesses without employees. What is more, among all Texas firms, according to 2007 SBO figures, 96 percent of sales come from businesses with employees, but for BOBs, only 66 percent of sales come from businesses with employees. This means that non-employers account for a greater share of all of the economic activity of Texas BOBs than do non-employers among all Texas firms.
Generally speaking, the average Black-owned Texas business is smaller in size, by number of employees and by annual sales, than the average firm. A comparison of employers from the two groups reveals dramatic differences. Figure 1 and Figure 2 compare BOBs with employees to all businesses with employees in Texas. In Figure 1, the average BOB employed fewer people than the average firm among all Texas firms. Figure 2 shows that for average yearly gross receipts, the average BOB with employees generated a fraction of what the average firm with employees among all Texas businesses did in the 2007 SBO ($60,000 compared to $1.2 million for the average employer firm in the state).

12
Part 1: Background Data, continued …
Figure 1. Average number of employees
23
10
0
5
10
15
20
25
All TX firms avg. # of employees TX BOBs avg. # of employees
Source: U.S. Census Bureau 2007 Survey of Business Owners.
Figure 2. Average sales of businesses with employees
$1,210,922
$60,153
$-
$200,000
$400,000
$600,000
$800,000
$1,000,000
$1,200,000
$1,400,000
All TX firms avg. sales TX BOB avg. sales
Source: U.S. Census Bureau 2007 Survey of Business Owners.
Economic ParityThe main economic driver, among small businesses, is employer firms. So what would approximate economic parity look like between all businesses in Texas with employees and Black-owned businesses with employees, in economic terms, if the ratio of Texas Black-owned businesses with employees to the Texas Black population were the same as the ratio of Texas businesses with employees to the entire Texas population? According to 2012 Census population statistics, Black Texans constitute 12.3 percent of the Texas population (3.19 million out of 26 million).

13
Figures 3, 4, and 5, respectively, illustrate the change needed in order for BOB employers to reach economic parity in terms of the number of firms, total sales, and the total number of employees. For each metric, the associated figure displays 2007 SBO data for all Texas businesses with employees, data for BOBs with employees, and what the metric would need to reach for BOBs with employees under economic parity. These figures show that the number of BOB employers would increase from 7,205 to 46,120, their sales would increase from $6.1 million to $311 million, and that the number of workers employed by those firms would increase from 72,652 to 1.1 million.
Figure 3. Number of businesses, parity between BOBs and all Texas businesses
375,902
7,205
46,120
-
50,000
100,000
150,000
200,000
250,000
300,000
350,000
400,000
ALL businesses w/ paid employees BOBs w/ paid employees BOBs w/ paid emplyees if at parity w/ ALL businesses
Source: U.S. Census Bureau 2007 Survey of Business Owners, and BBR calculation.
Figure 4. Total sales, parity between BOBs and all Texas businesses (1,000 $)
$2,535,642
$6,148
$311,104
$0
$500,000
$1,000,000
$1,500,000
$2,000,000
$2,500,000
$3,000,000
ALL businesses w/ paid employees BOBs w/ paid employees BOBs w/ paid emplyees if at parity w/ ALL businesses
Source: U.S. Census Bureau 2007 Survey of Business Owners, and BBR calculation.
Part 1: Background Data, continued …

14
Figure 5. Total employees, parity between BOBs and all Texas businesses
8,700,000
72,652
1,067,423
-
1,000,000
2,000,000
3,000,000
4,000,000
5,000,000
6,000,000
7,000,000
8,000,000
9,000,000
10,000,000
ALL businesses w/ paid employees BOBs w/ paid employees BOBs w/ paid emplyees if at parity w/ ALL businesses
Source: U.S. Census Bureau 2007 Survey of Business Owners, and BBR calculation.
Nationally, the 3 to 1 ratio of White to Black entrepreneurship rates has remained constant for 100 years (Fairlie 2005). The literature explains why minority-owned firms, especially BOBs, lag in comparison to all businesses (Fairlie 2005). Low levels of assets, especially financial assets but also family, business, and human capital, all work to limit new business formation among Blacks. The same drawbacks also cause higher business failure rates, lower sales and profits, and less employment among minority-owned firms. In addition, a disadvantaged business background can limit rates of self-employment among minorities. Studies have shown that the probability of self-employment is much higher among the children of self-employed minority business owners (Fairlie 2005). Working for a family business increases the chances both of business entry and success for young minorities. There is little doubt in the research literature that consumer and lending discrimination continues to discourage new firm creation among Blacks, and that such discrimination leads to higher rates of business failure. The economic impact of addressing these large, systemic problems and improving Black-owned business performance in Texas would be large. Even approaching parity with averages for all Texas businesses would yield large gains in jobs and wealth creation.
Part 1: Background Data, continued …

15
Part 2: BBR Survey Results: Texas Black-owned Businesses
Some of the figures in this section include Census data for comparison, but most of them contain data from the BBR survey of Black-owned businesses (BOBs) in Texas. Thus, most figure titles reflect items in the questionnaire used in the BBR survey.
Characteristics of Texas BOBs
Most Texas BOBS are small
Slightly less than one-third of the respondents to the survey reported that they were single-person enterprises (those without any employees other than the owner). This is a much higher percentage than the 2007 SBO reported2. Nevertheless, Texas BOBs are small enterprises. Figure 6 shows the distribution of businesses among respondents, by the number of employees. Almost 85 percent of the respondents reported that their businesses employ ten or fewer people.
Figure 6 Number of Employees
29.9%
41.5%
12.0%
5.4%
5.8%
3.8%
1.6%
0% 10% 20% 30% 40% 50%
1 (only yourself )
2 to 5
6 to 10
11 to 15
16 to 30
31 to 99
100 or more
Source: BBR Survey
22This perhaps is because the sampling frame relied heavily on lists of businesses obtained from Texas State government historically underutilized business programs and on the member lists of the Texas Association of African American Chambers of Commerce.

16
Characteristics, continued …
Black business profits
Survey recipients were asked how their business performs compared to others in their particular industry segment (on a five-point Likert-type scale from much less profitably, to about average, to much more profitably). Figure 7 shows perceived firm profitability across all BOBs and reveals a notable cluster of respondents that perceive themselves to be much less profitable than others in their industry. Figure 8 shows that this perception is significantly more common among non-employer firms than employer firms (43 percent vs. 25 percent). Among BOBs overall, only about 1 in 7 respondents stated that they were more profitable than their industry peers (Figure 7).
Figure 7. Perceived relative profitability
30.2%
15.2%
40.6%
9.2%
4.8%
0% 10% 20% 30% 40% 50%
Much less profitable
Less profitable
About average
More profitable
Much more profitable
Source: BBR Survey
Figure8. Perceived relative profitability, employers vs. non-employers
24.9%
15.4%
42.1%
11.3%
6.3%
42.9%
14.7%
37.2%
4.1%
1.1%
0% 10% 20% 30% 40% 50%
Much less profitable
Less profitable
About average
More profitable
Much more profitable
Employer firms
Non-employer firms
Source: BBR Survey

17
Years in Business
Despite the relatively small sizes of the businesses surveyed, there is some indication that BOBs in the sample have been in business for many years. Previous research found that the longer a business is operating, the less likely it is that the business will fail (Brock and Evans 1986). Figure 9 shows that about 50 percent of the BOBs in the BBR survey have been in business for more than 10 years.
Figure 9. Number of years since business was originally established
26.2%
25.3%
16.2%
10.8%
8.7%
13.0%
0% 10% 20% 30%
5 years or less
6 to 10 years
11 to 15 years
16 to 20 years
21 to 25 years
26 years or more
Source: BBR Survey
Non-employer firms tend to be younger than business with multiple employees, with 38 percent indicating that they have been in business for less than five years compared to 21 percent of BOBs with employees (Figure 10).
Figure 10. Number of years since business was originally established, employer vs. non-employer
21.3%
24.6%
16.6%
11.9%
10.3%
15.2%
37.5%
26.8%
15.1%
8.1%
4.8%
7.7%
0% 10% 20% 30% 40%
5 years or less
6 to 10 years
11 to 15 years
16 to 20 years
21 to 25 years
26 years or more
Employer firms
Non-employer firms
Source: BBR Survey
Characteristics, continued …

18
Scalability
As seen in Figure 11, non-employer firms make up a decreasing proportion of BOBs as the age of the business increases. When BOBs are five years of age or less, non-employer firms constitute 43 percent of such organizations. For BOBs in existence more than 15 years, that non-employer proportion drops to 19 percent, a level that continues to decline further as the business ages. In contrast, the age distribution of other business sizes remains relatively stable over time except for businesses with 100 or more employees. These larger BOBs are more likely to have been in business for more than 25 years.
As noted earlier in this report, non-employer firms are less likely to transition into employer status than businesses that start with employees are to add additional employees (Davis et al., 2007; Headd and Saade, 2008; Désiage et al., 2011). This trend among non-employer firms does track closely with survival rates published in the U.S. Census Bureau’s Business Dynamics Statistics (See especially Haltiwanger, J., et al., 2010.)
Figure 11. Distribution of businesses size by years in business
42.9%
31.7%
27.9%
19.0%
50.0%
52.6%
49.7%
58.6%
7.1%
15.2%
20.4%
18.6%
0.0%
0.4%
2.0%
3.7%
0% 10% 20% 30% 40% 50% 60% 70%
5 years or less
6 to 10 years
11 to 15 years
16 or more years
1 (only yourself )
2 to 10
11 to 99
100 or more
Source: BBR Survey
Characteristics, continued …
Number of employees

19
Ownership structure
Black-owned businesses in the BBR survey have a variety of legal ownership statuses. Taken together, some form of corporation (corporation or S-corporation) was the most common status indicated by respondents, at a combined 39 percent. Sole proprietorships and limited liability companies were next most common. Figure 12 shows the distribution of ownership types.
Figure 12. Legal status of ownership of business
30.1%
27.6%
20.3%
18.8%
2.6%
0.7%
0% 10% 20% 30% 40%
Sole proprietorship
LLC
Corporation
S-Corporation
Partnership
Other
Source: BBR Survey
Sole proprietorships accounted for 30 percent of the businesses in the BBR survey. With a sole proprietorship, a business owner does not have protection from personal liability if his/her business is sued. The business may be the only occupation of an individual or it could be owned by an individual who works full time for someone else.
Partnerships (including Limited Liability Companies—LLCs) accounted for over 30 percent of the businesses in the BBR survey. These were unincorporated businesses with more than one owner who actively engages in the management of the company.
As expected, while half of non-employer firms are organized as sole proprietorships, a quarter are LLCs. In contrast, employers are more uniformly distributed across the range of ownership types (see Figure 13).
Characteristics, continued …

20
Figure 13. Legal status of ownership of business, Employer vs. Non-Employer
20.3%
27.6%
26.3%
21.4%
3.5%
0.8%
52.8%
27.7%
6.3%
12.5%
0.4%
0.4%
0% 10% 20% 30% 40% 50% 60%
Sole proprietorship
LLC
Corporation
S-Corporation
Partnership
Other
Employer firms
Non-employer firms
Source: BBR Survey
Entrepreneurship
The BBR survey asked respondents about whether they started their business themselves, or purchased or inherited it. The vast majority of respondents are entrepreneurs (people who launched their businesses themselves). Figure 14 demonstrates the preponderance of entrepreneurship among survey respondents and compares responses between employers and non-employer firms. This is very consistent with the findings from other minority-owned business surveys, including the experiences of Hispanic-owned firms, which confirm that most of these businesses have been created by entrepreneurs and not purchased or otherwise acquired.
Characteristics, continued …

21
Figure 14. How business was acquired
91.9%
5.2%
0.9%
0.6%
1.3%
96.7%
1.1%
1.1%
0.7%
0.4%
0% 20% 40% 60% 80% 100%
Started business
Purchased business from non-family source
Purchased business from family source
Inherited the business
Other
Employer firms
Non-employer firms
Source: BBR Survey
Businesses in service sectors predominate
Most BOBs in the survey belong to a service industry (72 percent), with the Professional-Scientific-Technical Service sector being the most common at 28 percent. Twenty-two percent of the businesses are in the construction sector. Many respondents indicated their businesses were in an unspecified “Other Services” category, typical of small businesses everywhere.
Figure 15. Sector to which business belongs
Note: Respondents could choose, in their responses, to belong to multiple sectors.
28.3%
22.0%
9.7%
9.3%
8.4%
7.9%
7.1%
5.8%
5.5%
4.2%
3.9%
23.3%
0% 5% 10% 15% 20% 25% 30%
Professional-Scientific-Technical Service
Construction
Finance-Insurance-Real Estate
Health Care-Social Assistance Services
Retail Trade
Information Service
Transportation-Warehousing
Wholesale Trade
Education Services
Accommodation-Food Services
Manufacturing
Other Services
Source: BBR Survey
Characteristics, continued …

22
Minority business certifications
Survey recipients were asked about the types of minority business certifications they hold, if any. Figure 16 shows the variety of local, state, federal, and private certifications they hold. Almost 65 percent of the respondents participate in the State of Texas historically underutilized business (HUB) program, whereas 44 percent said they participate in a city or county program, and 19 percent are federally certified. Fully a quarter of the respondents did not list any certifications. Just under one-third (32 percent) listed a single certification and 17 percent reported that they had more than two certifications.
Figure 16. Minority business certifications held by BOBs
44.6%
64.4%
19.1%
9.2%
25.2%
0% 10% 20% 30% 40% 50% 60% 70%
Local
State
Federal
Private Sector
None/missing
Source: BBR Survey
Characteristics, continued …

23
Characteristics, continued …
In general, as shown in Figure 17, non-employer firms lag employers relative to the percentage with certifications, achieving parity only with state certifications. Employers have significantly more local and federal certifications than do non-employers.
Figure 17. Minority business certifications held by BOBs, Employers vs. Non-Employers
48.2%
64.1%
21.1%
10.1%
25.4%
36.3%
65.2%
14.7%
7.0%
24.5%
0% 10% 20% 30% 40% 50% 60% 70%
Local
State
Federal
Private Sector
None/missing
Employer firms
Non-employer firms
Source: BBR Survey

24
Access to capital
The survey respondents reported that on average 75 percent of the capital used when they started or purchased their business came from their personal savings (Figure 18). Further, 61 percent of the respondents utilized only personal savings. An additional 29 percent utilized personal saving along with other sources. In total, 90 percent of the survey respondents utilized personal saving to start or acquire their business.
Figure 18. Percentage of funds by source utilized to start or acquire business, Average Percent
75.4%
7.3%
5.8%
5.0%
5.3%
0% 20% 40% 60% 80%
Personal savings
Credit cards
Formal investors
Family and friends
Other
Source: BBR Survey
Access to working capital through a business loan or line of credit can help sustain or grow a small business that cannot finance its daily operations through cash flow. Figure 19 provides a snapshot into whether BOBs are using business loans to finance their operations. Only 28 percent of respondents had applied for and received a loan. Over 50 percent of respondents had never applied for a loan. And almost 20 percent of BOBs indicated that they had applied for a loan but had never received one.
Figure 19. Has this business applied for a business-related loan?
19.8%
27.9%
52.3%
0% 10% 20% 30% 40% 50% 60%
Applied for a loan but never received one
Applied for a loan and received at least one
Never applied for a loan
Source: BBR Survey
Characteristics, continued …

25
The percentage of funds utilized from personal savings to start or acquire the survey respondents’ businesses did not differ substantively across the respondent’s loan status. Figure 20 shows that the respondents who applied for and received a loan obtained about 70 percent of their funds from personal savings. By comparison those who applied and did not receive a loan and those who never applied obtained about 76 percent from personal savings.
Figure 20. Percentage of funds from personal savings utilized to start or acquire business, by loan status, average percent of personal savings
76.1%
69.5%
75.6%
0% 20% 40% 60% 80% 100%
Applied for a loan but never received one
Applied for a loan and received at least one
Never applied for a loan
Source: BBR Survey
Figure 21 reveals that non-employer firms are significantly less likely to have applied for a loan compared to employers, and further, among those who have applied, non-employers are less likely to have received a loan.
Figure 21. Has this business applied for a business-related loan? Employers vs. non-employers
22.6%
34.5%
42.9%
0% 10% 20% 30% 40% 50% 60% 70% 80%
Applied for a loan but never received one
Applied for a loan and received at least one
Never applied for a loan
Employer firms
Non-employer firms
22.6%
34.5%
42.9%
0% 10% 20% 30% 40% 50% 60% 70% 80%
Applied for a loan but never received one
Applied for a loan and received at least one
Never applied for a loan
Employer firms
Non-employer firms
17.7%
26.5%
55.8%
22.6%
34.5%
42.9%
0% 20% 40% 60% 80%
Applied for a loan but never received one
Applied for a loan and received at least one
Never applied for a loan
Employer firms
Non-employer firms
Source: BBR Survey
Characteristics, continued …
26
Demographics of the Black business owner
Black business owners are well educated
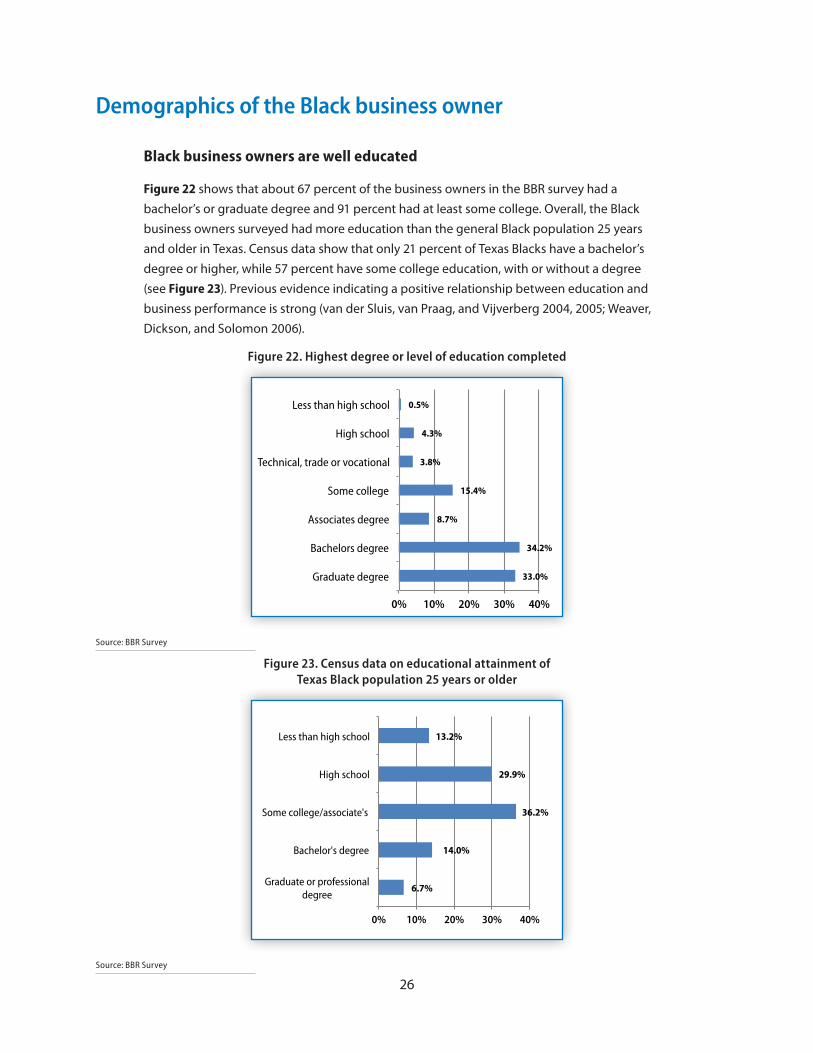
Figure 22 shows that about 67 percent of the business owners in the BBR survey had a bachelor’s or graduate degree and 91 percent had at least some college. Overall, the Black business owners surveyed had more education than the general Black population 25 years and older in Texas. Census data show that only 21 percent of Texas Blacks have a bachelor’s degree or higher, while 57 percent have some college education, with or without a degree (see Figure 23). Previous evidence indicating a positive relationship between education and business performance is strong (van der Sluis, van Praag, and Vijverberg 2004, 2005; Weaver, Dickson, and Solomon 2006).
Figure 22. Highest degree or level of education completed
0.5%
4.3%
3.8%
15.4%
8.7%
34.2%
33.0%
0% 10% 20% 30% 40%
Less than high school
High school
Technical, trade or vocational
Some college
Associates degree
Bachelors degree
Graduate degree
Source: BBR Survey
Figure 23. Census data on educational attainment of Texas Black population 25 years or older
13.2%
29.9%
36.2%
14.0%
6.7%
0% 10% 20% 30% 40%
Less than high school
High school
Some college/associate's
Bachelor's degree
Graduate or professional degree
Source: BBR Survey

27
Black business experience
Figure 24 shows that about 47 percent of the business owners in the BBR survey had more than 20 years of experience in their current business. Notable, however, in Figure 25 is that owners of non-employer firms are significantly less likely to have that much experience in their current business (24 percent vs. 37 percent). In fact, 15 percent of non-employer owners have five or fewer years with their current business compared to approximately eight percent of employers.
Figure 24. Total years of experience in current business
1.2%
8.8%
11.6%
15.3%
16.3%
13.8%
33.1%
0% 10% 20% 30% 40%
Less that 1 year
1 to 5 years
6 to 10 years
11 to 15 years
16 to 20 years
21 to 25 years
26 years or more
Source: BBR Survey
Figure 25. Total years of experience in current business, Employers vs. Non-Employers
0.3%
7.4%
11.8%
13.3%
15.4%
14.7%
37.1%
3.3%
12.2%
11.1%
19.9%
18.5%
11.4%
23.6%
0% 10% 20% 30% 40%
Less that 1 year
1 to 5 years
6 to 10 years
11 to 15 years
16 to 20 years
21 to 25 years
26 years or more
Employer firms
Non-employer firms
Source: BBR Survey
Demographics, continued …

28
Black immigrant business owners
The BBR survey asked respondents about their origin of birth to examine the extent of Black immigrant business ownership in Texas. Black immigrant business owners were defined as individuals of any origin, identifying as primarily Black, born outside the United States (first generation1), and currently owning a business in Texas. Native or U.S.-born Black business owners were defined as Black individuals who were born in the United States (second generation and beyond2) and own a business in Texas. While it was expected that most respondents would be fourth generation (or more), almost 17 percent were first-generation immigrants born outside the U.S., indicating a significant population of Black-owned immigrant businesses in Texas.
Figure 26. What generation of Black American are you?
16.9%
3.1%
13.0%
67.0%
0% 20% 40% 60% 80% 100%
First generation
Second generation
Third generation
Fourth generation or more
Source: BBR Survey
1 A first-generation immigrant business owner is defined as someone born outside the U.S. and who can be a naturalized U.S. citizen, legal immigrant, or undocumented immigrant.
2 A second-generation business owner is defined as someone born in the U.S. with at least one foreign-born parent. A third-generation business owner is defined as someone born in the U.S. with both parents born in the U.S.
Demographics, continued …

29
Figure 27 shows the distribution of responses to the question about country of origin for those who responded that they were first- or second-generation immigrants. African nations, especially Nigeria, appear frequently.
Figure 27. Country of origin
45.8%
13.3%
9.6%
4.8%
4.8%
4.8%
26.5%
15.7%
9.6%
16.9%
0% 10% 20% 30% 40% 50%
Nigeria
Jamaica
Ghana
Kenya
Mexico
Cameroon
Other North/South/Central America
Other Africa
Other
USA
Source: BBR Survey
Demographics, continued …

30
Survey respondents were asked about their top three training needs, and to rank these needs in order of importance, with the first listed being the most important, the second the next-most important, and the third being the next-most important. Because the question was open-ended, responses were coded by type of training need. The training needs most frequently listed first by respondents (of highest importance) are presented in Figure 28. Survey respondents listed accounting and finance training more often than any other response among those listed first (listed first by 16 percent of respondents). The next most-frequently cited first-mentioned training needs were technology (10.5 percent) and management and leadership (10 percent).
Figure 28. Top training needs (first mentioned)
16.0%
10.5%
10.0%
8.9%
8.8%
6.3%
3.2%
19.5%
17.0%
0% 10% 20% 30% 40% 50%
Accounting/Finance
Technology
Management/Leadership
Business/Consumer Relations/Sales
Marketing/Advertising
Government
Communication
Other
No Response/None
Source: BBR Survey
Training needs

31
Figure 29 lists the frequency of all training needs mentioned by respondents, in any priority. Again, it shows that accounting/finance training needs appear most frequently among needs mentioned, mentioned in any rank position by almost 32 percent of those surveyed, followed by management/leadership (27 percent) and business/consumer relations/sales training needs. Training needs mentioned within the “Other” category in Figures 25 and 26 include, for example, safety, time management, various industry-specific training, and general/nonspecific training. Although the respondents were asked about their top-three training needs, on average, they provided 1.8 responses.
Figure 29. Frequently mentioned training needs, all mentions, any priority
31.8%
27.1%
24.5%
20.5%
19.4%
10.6%
7.0%
37.7%
17.0%
0% 5% 10% 15% 20% 25% 30% 35% 40% 45% 50%
Accounting/Finance
Management/Leadership
Business/Consumer Relations/Sales
Marketing/Advertising
Technology
Government
Communication
Other
No Response/None
Source: BBR Survey
Training Needs, continued …

32
Figure 30 shows that 76 percent of the survey respondents agreed/strongly agreed that understanding the political system (local, state, and federal) was a critical factor in the success of their businesses. About 10 percent disagreed or strongly disagreed with this statement, while about 14 percent did not have an opinion or were neutral.
Figure 30. Understanding the political system is a critical factor in the success of this business
0.9%
2.5%
4.5%
14.2%
37.8%
40.2%
0% 20% 40% 60% 80% 100%
No opinion
Strongly disagree
Disagree
Neither agree nor disagree
Agree
Strongly agree
Source: BBR Survey
Survey recipients were asked if Black-owned businesses have less access than other businesses to important decision makers for government contracting (procurement) opportunities. Figure 31 displays broad agreement with that statement, with 79 percent agreeing/strongly agreeing, and only 7 percent disagreeing/strongly disagreeing.
Procurement opportunities

33
Figure 31. Black-owned businesses have less access than other firms to important decision makers on government contracting opportunities
0.9%
2.5%
4.5%
14.2%
37.8%
40.2%
0% 20% 40% 60% 80% 100%
No opinion
Strongly disagree
Disagree
Neither agree nor disagree
Agree
Strongly agree
Source: BBR Survey
More survey respondents agreed/strongly agreed (62.5 percent) than disagreed/strongly disagreed (11 percent) that Black-owned businesses were unfairly excluded from participating in government contracting (procurement) opportunities more often than non-Black-owned businesses (see Figure 32).
Figure 32. Black-owned businesses are unfairly excluded from participating in government contracting opportunities
more often than non-Black-owned businesses
1.1%
2.5%
8.4%
25.5%
29.5%
33.0%
0% 20% 40% 60% 80% 100%
No opinion
Strongly disagree
Disagree
Neither agree nor disagree
Agree
Strongly agree
Source: BBR Survey
Procurement Opportunities, continued …

34
Figure 33 shows that the private sector was an important customer for Black-owned businesses in Texas. Indeed, 85 percent of the survey respondents indicated that they had done business with the private sector in the past year. This is in contrast to those who indicated they had done business with local government (48 percent), state government (37 percent), or federal government (25 percent).
Figure 33. All sectors you have done business with since January 2012 (multiple responses allowed)
85.1%
47.6%
37.5%
25.3%
4.1%
0% 20% 40% 60% 80% 100%
Private sector
Local government
State government
Federal government
Foreign markets
Source: BBR Survey
Figure 34 shows that more survey respondents agreed/strongly agreed (70 percent) than disagreed/strongly disagreed (8 percent) that Black-owned businesses were unfairly excluded from participating in private sector contracting (procurement) opportunities more often than non-Black-owned businesses.
Figure 34. Black-owned businesses are unfairly excluded from participating in private sector contracting opportunities more often than non-Black-owned businesses
1.4%
2.4%
5.9%
20.3%
35.4%
34.6%
0% 20% 40% 60% 80% 100%
No opinion
Strongly disagree
Disagree
Neither agree nor disagree
Agree
Strongly agree
Source: BBR Survey
Procurement Opportunities, continued …

35
Black-owned businesses have racially diversified customers
The BBR survey asked whether the majority of the respondents’ customers were primarily Black, an equal mixture of Black and non-Black, or primarily non-Black. Figure 35 shows that about 40 percent of the respondents reported that their customers were an equal mixture, and 44 percent said they had primarily non-Black customers. Only 16 percent of the businesses in this survey sold goods or services predominantly to Blacks. These results indicate that BOBs are fairly well integrated into the mainstream business environment and that there is little evidence of an “enclave” phenomenon in which BOBs are selling goods and services primarily to Black customers.
Figure 35. The majority of the customers of business are:
15.9%
39.6%
44.4%
0% 10% 20% 30% 40% 50%
Primarily Black
Equal mixture of Black and non-Black
Primarily non-Black
Source: BBR Survey
However, non-employer firms are somewhat less integrated into the mainstream business environment than employers. As seen in Figure 36, the distribution for non-employers includes proportionately more businesses with primarily Black customers (22 percent vs. 14 percent) and fewer businesses with primarily non-Black customers (36 percent vs. 48 percent).
Figure 36. The majority of the customers of business are: (by Employer vs. Non-Employer)
13.5%
38.5%
48.0%
21.7%
42.3%
36.0%
0% 20% 40% 60%
Primarily Black
Equal mixture of Black and non-Black
Primarily non-Black
Employer firms
Non-employer firms
13.5%
38.5%
48.0%
21.7%
42.3%
36.0%
0% 20% 40% 60%
Primarily Black
Equal mixture of Black and non-Black
Primarily non-Black
Employer firms
Non-employer firms
Source: BBR Survey
Black-owned businesses have racially diversified customers and employees

36
Black-owned businesses hire mainly black employees
Among Texas Black-owned businesses with employees (n=635), a slight plurality (43 percent) responded that the majority of employees in their business were Black (Figure 37). Nearly 42 percent reported that they employ an equal mixture of Black and non-Black employees.
Figure 37. The majority of employees of this business are:
42.8%
41.6%
15.6%
0% 10% 20% 30% 40% 50%
Primarily Black
Equal mixture of Black and non-Black
Primarily non-Black
Source: BBR Survey
Is a Black-owned business whose employees are primarily Black more likely to have primarily Black customers? Figure 38 shows the cross tabulation of responses to the question about BOBs’ racial identity of employees and customers. Among BOBs with mostly non-Black employees, the vast majority of customers are non-Black (75 percent). Among businesses with primarily Black employees, the distribution of customers is much more uniform, but the percentage with primarily Black customers is lower than those with a mixed or primarily non-Black customer base. While it is difficult to correlate the two variables, it seems clear that BOBs serve a broad base of customers that extends beyond a Black enclave.
Figure 38. Majority of employees and majority of customers
25.7%
3.8%
6.2%
38.1%
46.7%
18.6%
36.2%
49.4%
75.3%
0% 20% 40% 60% 80%
Primarily Black employees
Equal mixture of Black and non-Black employees
Primarily non-Black employees
Primarily Black customers
Equal mixture of Black and non-Black customers
Primarily non-Black customers
Source: BBR Survey
Employee and Customer Ethnicity, continued …

37
At the same time, the data show immigrant Black business owners (first- or second-generation) are a bit more aggressive in selling products or services to a mainstream customer base than third- or fourth-generation Black business owners. Figure 39 reveals that fewer businesses owned by first-generation and second-generation immigrants sell goods and services to a primarily Black customer base (about 11 percent) than do their more established peers (about 17 percent).
Figure 39. Customer base by respondent’s generational status
11.6%
11.1%
17.4%
17.1%
50.3%
25.9%
47.8%
35.9%
38.1%
63.0%
34.8%
46.9%
0% 10% 20% 30% 40% 50% 60% 70%
First generation
Second generation
Third generation
Fourth generation or more
Primarily Black customers
Equal mixture of Black and non-Black customers Primarily non-Black customers
Source: BBR Survey
Employee and Customer Ethnicity, continued …

38
BOB survey respondents were asked in an open-ended question to rank the top three major challenges facing their business. BBR research staff coded the answers and grouped them by topic. Figure 40 presents the first-mentioned responses (highest ranked).
Figure 40. Major challenges facing BOBs, ranked by 1st mention
26.5%
12.3%
8.1%
6.1%
5.4%
3.5%
2.6%
2.5%
2.0%
1.9%
1.0%
0.9%
0.9%
0.7%
0.5%
12.1%
13.1%
0% 10% 20% 30% 40% 50%
Funding, Cash Flow, Finances
Bidding for/Winning Contracts
Marketing & Sales
Race
Employees: Retaining, Finding
Legal/Regulatory
Competition/Market Share
Ability to Grow/Expand Business/Size
Good Ol' Boy Network/Informal Networking
Bonding/Insurance
Location/Property
Tech/IT
Economic Conditions
Experience/Training
Succession
Other*
No Response/None
* No responses in the “Other” category were mentioned by more than 1 percent of the respondents.
Source: BBR Survey
The most frequently mentioned response concerned issues related to funding, cash flow, and finances (26 percent of responses). Understandably, typical challenges mentioned here included “access to loans” and “lines of credit.”
Bidding for/winning contracts was the second-most frequently mentioned top-ranked challenge to their firm (12 percent). Respondents frequently reported a lack of opportunities provided by local and state governments for pursuing both public and private contracts, as well as issues related to sub-versus prime contracting. Responses such as “excluded from procurement from City of ____,” “procuring government contracts,” and “unable to become the major contractor, only sub,” are a sample of a broad selection of similar responses.
The third-most frequently mentioned challenge was marketing/sales (8 percent). Responses in this category often mentioned “marketing” and “sales” and others that related to reaching more customers.
Also of note were such responses as “growing/diversifying client base.”
Major challenges facing Black-owned businesses

39
Respondents also mentioned “race” as a top- ranked challenge (6 percent), while others illuminated the various permutations of the racial issue faced by BOBs, including “ability to compete on jobs (token bid invites),” “profiling (stereotyping),” and “not given the opportunity to bid because prime contractors don’t look at us.”
While responses related to the “good ol’ boy network” and informal networking were relatively less frequent than other categories of responses, what was particularly notable about them was their homogeneity. The majority of this category of response either featured “good ol’ boy system,” “political connections,” or “access to decision makers,” and many responses featured all of them.
Figure 41 ranks all responses to the challenges question, in any position (1st, 2nd, or 3rd). Responses related to funding/cash flow/finances again appear of most concern to respondents, as they did in Figure 40.
Among all mentions, funding/cash flow/finances constituted 42 percent of all responses. Bidding for/winning contracts appeared in 26 percent of the responses, followed by finding and retaining employees (17 percent) and marketing and sales (16 percent). Although the respondents were asked about their top-three challenges, on average, they provided 1.9 responses.
Figure 41. Major challenges to your business (all mentions)
42.1%
26.4%
17.2%
16.5%
11.7%
8.5%
8.0%
7.9%
6.6%
5.0%
3.2%
3.0%
2.8%
2.1%
1.0%
26.3%
13.1%
0% 5% 10% 15% 20% 25% 30% 35% 40% 45%
Funding, Cash Flow, Finances
Bidding for/Winning Contracts
Employees: Retaining, Finding
Marketing & Sales
Race
Legal/Regulatory
Good Ol' Boy Network/Informal Networking
Ability to Grow/Expand Business/Size
Competition/Market Share
Bonding/Insurance
Tech/IT
Location/Property
Experience/Training
Economic Conditions
Succession
Other*
No Response/None
* No responses in the “Other” category were mentioned by more than 1 percent of the respondents.
Source: BBR Survey
Major Challenges, continued …

40
Texas Black-owned business owners perceive themselves as being highly proficient across a range of business skills. Figure 42 shows the percentage of respondents that rated themselves as either “very good” or “excellent” with other possible choices of “good,” “fair,” or “poor.” The skills for which the most owners of Black businesses in the survey assessed themselves as at least “very good” included problem solving and analysis (86 percent and 84 percent, respectively). Team management, team building, and motivating employees were rated as at least “good” by the fewest BOBs, but even those skills garnered percentages for “very good” and “excellent” close to 70 percent.
Figure 42. Self-assessed skill levels
86.0%
83.5%
77.9%
72.8%
71.9%
71.4%
70.5%
70.0%
0% 10% 20% 30% 40% 50% 60% 70% 80% 90% 100%
Problem solving
Problem analysis
Oral presentation
Writing skills
Developing personal business relationships
Team management
Team building
Motivating employees
Source: BBR Survey
Skills of Black-owned business owners

41
Figure 43 reveals, however, that BOBs who perceive themselves to be less profitable than other businesses in their industry are significantly less likely to assess themselves to be “very good” or “excellent,” a pattern that holds for all business skills covered by the BBR survey.
Figure 43. Self-assessed skill levels, by perceived profitability (Percent Very Good or Good)
93.6%
90.5%
89.7%
84.6%
77.6%
76.8%
77.0%
75.8%
86.2%
82.4%
78.7%
74.1%
73.2%
71.1%
69.9%
70.4%
83.8%
82.3%
74.0%
68.7%
68.7%
70.1%
69.0%
67.3%
0% 20% 40% 60% 80% 100%
Problem solving
Problem analysis
Oral presentation
Writing skills
Developing personal business relationships
Team management
Team building
Motivating employees
More Profitable
Average
Less Profitable
Source: BBR Survey
Skills of Owners, continued …

42
Conclusions: Improving Black-Owned Business Performance in Texas
This survey highlighted a number of aspects of the business climate in which owners of Black-owned Texas businesses work. From the BBR survey findings:
• The number of Black-owned businesses in Texas is growing (according to Census data, up 74 percent between 2002 and 2007).
• Most Texas BOBs are small and smaller than the average Texas firm. Among BBR respondents, 85 percent reported that their businesses employ ten or fewer people. Census data indicate that Non-employer firms constitute 95 percent of Black-owned businesses in Texas.
• Black owners of businesses who responded to the survey are much more educated (>90 percent have some college) than Blacks in the general population over 25 years of age (57 percent have some college) in the state.
• Most BOBs in the survey belong to a service industry (72 percent), with the Professional-Scientific-
Technical Service sector being the most common at 28 percent. Twenty-two percent of the
businesses are in the construction sector.
• BOBs are well integrated into their local economies. They report hiring a mix of non-Black and Black employees, and selling to a mix of non-Black and Black customers.
• Despite their relatively small size, many BOBs in the survey have been able to remain in business for years, with about 50 percent of the survey respondents reporting that they have been in business for more than 10 years.
• Non-employer firms make up a decreasing proportion of BOBs as the age of the business increases. When BOBs are five years of age or less, non-employers constitute 43 percent of such organizations. For BOBs in existence more than 15 years, that non-employer proportion drops to 22 percent, a level that continues to decline further as the business ages. This is consistent with other business research that shows that businesses that start out with employees have a higher probability of survival than businesses that begin without employees.
• Texas Black-owned business owners perceive themselves to be highly proficient across a range of business skills. However, the BOBs who perceive themselves to be less profitable than other businesses in their industry are significantly less likely to assess themselves to be “very good” or “excellent” across all business skills covered by the BBR survey.

43
• Twenty-eight percent of the respondents had applied for and received a business loan. More than 50 percent of the respondents had never applied for a loan. And almost 20 percent of the respondents reported that they had applied for a loan but had never received one. Furthermore, non-employer firms are significantly less likely to have applied for a loan compared to employers, and further, among those who have applied, non-employers are less likely to have received a loan.
• Seventy-five percent of Black-owned businesses in the survey had at least one HUB or other minority business certifications. However, about one-third of respondents only had a single certification. In general, non-employer firms in the survey lag employers relative to HUB and other minority business certifications, achieving parity only with state certifications. Employers have significantly more local and federal certifications than do non-employer firms.
• A majority of the respondents agreed or strongly agreed that understanding the political system is a critical factor in the success their businesses (76 percent) and that BOBs, in general, have less access than other firms to government decision makers for the purposes of procurement opportunities (79 percent). Further, a majority of the respondents also agreed or strongly agreed that BOBs were unfairly excluded from participating in government contracting opportunities (63 percent) and private sector contracting opportunities (70 percent).
• In general, survey respondents believe their businesses to be less profitable than their peers in the same industry. This perception is significantly more common among non-employer firms than among those with employees.
• The top training needs and biggest current challenges to the respondents’ businesses are related to accounting and finance. Sales and marketing is another function mentioned as both a training need and a business challenge.
Despite confidence in their skills as business people and relatively high levels of educational attainment, Black owners of businesses in the BBR survey still perceive significant barriers to growing their firms and achieving the profitability level of their industry peers. This is especially true for non-employer firms, who constitute 95 percent of Black-owned businesses in Texas.
Conclusions, continued …

44
Key challenges and barriers to growth emerged from the survey that policy makers and business leaders should address in order to improve the growth and performance of Black-owned businesses in Texas:
➲Goal 1: Focus policy on improving access to financial capital and financial training for
Black entrepreneurs.
➲Goal 2: Encourage Black entrepreneurs planning new businesses to do so with a level of
capitalization and scope that allows them to start their business as a team with employees
rather than starting out as solo practitioner without employees.
➲Goal 3: Target BOBs in construction and the service sector (including professional, scientific, and
technical services) with information about obtaining financial capital and continuing educational
opportunities in business topics (finance, accounting, management, sales, and marketing) as well
as notifications about local and federal HUB/minority certifications.
This survey hopefully will contribute to the strengthening of Black-owned business performance in Texas by highlighting important aspects of the conditions, barriers, and opportunities facing them.
Conclusions, continued …

45
Austin, A. Uneven pain—Unemployment by metropolitan area and race. Economic Policy Institute. 2010. http://www.epi.org/publication/ib278/
Bates, T. “Minority Entrepreneurship.” Foundations and Trends® in Entrepreneurship 7.3(4):151‐311. 2011.
Blanchflower, D. “Minority Self-Employment in the United States and the Impact of Affirmative Action Programs.” Working Paper 13972. Washington: Nat’l Bureau of Economic Research. 2008.
Bogan, V and W. Darity Jr., “Culture and entrepreneurship? African American and immigrant self-employment in the United States” The Journal of Socio-Economics 37(5):1999-2019. 2008.
Bradford, W. “The Wealth Dynamics of Entrepreneurship for Black and White Families in the U.S.” Review of Income and Wealth 49(1). 2003.
Brown, C. “Making An Investment In Black Business.” Black Enterprise 31(1):52. 2000.
Butler, J. S.. “Black Entrepreneurship, The Sequel.” Inc 18(14):31. 1996.
———. “Myrdal Revisited: The Negro In Business.” Daedalus 124(1):1999. 1995.
———. “Race, Entrepreneurship, And The Inner City.” USA Today Magazine 123(2596):26. 1995.
———.”Race, Self-Employment And Upward Mobility.” Social Forces 77(4): 1627-1629. 1999.
Butler, J. S,, and C. Herring. “Ethnicity and Entrepreneurship in America: Toward An Explanation Of Racial And Ethnic Group Variations In Self-Employment.” Sociological Perspectives 34(1):79. 1991
Butler, J. S. and P. G. Greene. “Ethnic entrepreneurship: The continuous rebirth of American entrepreneurship.” In Entrepreneurship 2000, edited by D. L. Sexton and R. W. Smilor, 267-289. Chicago: Upstart. 1997.
Cole, R. “Credit Scores and Credit Market Outcomes: Evidence from the Survey of Small Business Finances and the Kauffman Firm Survey.” U.S. S.B.A. Office of Advocacy, Jan. 2014. Web. 20 May 2014. http://www.sba.gov/advocacy/7540/791501.
Davis, S. J., J. Haltiwanger, R. S. Jarmin, C. J. Krizan, J. Miranda, A. Nucci, and K. Sandusky. “Measuring the dynamics of young and small businesses: Integrating the employer and nonemployer universes.” Working Paper 13226. Cambridge: Nat’l Bureau of Economic Research. 2007.
Désiage, L., R. Duhautois and D. Redor. “A study of young firm dynamics: The transition from zero to one or more employees.” March 2011. From paper presented at the Demography of Businesses and Industries Int’l Conference, Université Paris–Est Créteil, Jan. 21, 2011. http://cournot.u-strasbg.fr/users/ENEF/program/papers/DesiageDuhautoisRedor-Transition-ENEF2011-2.pdf
Fairlie, R. W. “Minority entrepreneurship,” in The Small Business Economy 2005: A Report to the President, U.S. SBA. Washington: U.S. Gov. Printing Office. 2005
———. “Entrepreneurship among disadvantaged groups: An analysis of the dynamics of self-employment by gender, race, and education.” July 2005. http://people.ucsc.edu/~rfairlie /papers/published/springer percent202006 percent20- percent20handbook percent20article.pdf (accessed Aug. 13, 2012.
———. “Earnings Growth Among Disadvantaged Business Owners,” in Small Business Research Summary, U.S. SBA. Washington: U.S. Gov. Printing Office, 2001.
———. “Disparities in Capital Access between Minority and Non-Minority-Owned Businesses” U.S. Department of Commerce, Minority Business Development Agency. Washington: U.S. Gov. Printing Office, 2010.
Bibliography

46
Bibliography, continued …
Fairlie, R. W. and Robb A. M. Race and Entrepreneurial Success. Cambridge: MIT Press. 2010.
Hackler, D. and H. Mayer “Diversity, Entrepreneurship, and the Urban Environment” Journal of Urban Affairs 30(3). Blackwell Publishing Inc. 2008.
Haltiwanger, J., R. S. Jarmin, and J. Miranda “Who Creates Jobs? Small vs. Large vs. Young” Center for Economic Studies Discussion Paper (CES–WP–10–17). 2010.
Headd, B and Saade R. Do business definition decisions distort small business research results? Washington: U.S. SBA Office of Advocacy. 2008. http:ssrn.com/abstract=1228536
Köllinger, P., and M. Minniti. “Not For Lack Of Trying: American Entrepreneurship In Black And White.” Small Business Economics 27(1):59-79. 2006.
Ndofor, A. H. and R. L. Priem. “Immigrant entrepreneurs, the ethnic enclave strategy, and venture performance,” Journal of Management 37(3):790-818. 2011.
Ogbolu, M., and R. Singh. “Researching Black Entrepreneurship: Exploring The Challenge Of Response Bias.” Journal Of Developmental Entrepreneurship 18(4). 2013.
Robb, A. “Access to Capital among Young Firms, Minority-owned Firms, Women-owned Firms, and High-tech Firms.” U.S. S.B.A. - Office of Advocacy, Apr. 2013. Web. 20 May 2014. http://www.sba.gov/advocacy/7540/58493.
Singh, R., and M. Crump. “Educational Attainment: A Key Factor For Improving The Lagging Rate Of Black Entrepreneurship.” Review Of Black Political Economy 34(3/4):217-229. 2007.
Singh, R., E. Knox, and M. Crump. “Opportunity Recognition Differences Between Black And White Nascent Entrepreneurs:: A Test Of Bhave’s Model.” Journal Of Developmental Entrepreneurship 13(1):59-75. 2008.
Texas State Data Center. Update on Texas Demographic Characteristics and Trends. Presented by Lila Valencia, Office of the State Demographer, Jan. 26, 2012. http://txsdc.utsa.edu/ Presentations/Index.aspx
U.S. Bureau of Labor Statistics. Current Population Survey (CPS). 2011. http://www.bls.gov/cps/
Weaver M., P. Dickson and G. Solomon. “Entrepreneurship and education: What is known and not known about the links between education and entrepreneurial activity.” In The Small Business Economy for Data Year 2005: A Report to the President, Ch. 5, U.S. S.B.A. Office of Advocacy. 2006. http://archive.sba.gov/advo/research/sb_econ2006.pdf
Wray, S. “Everyone’s business: Building minority businesses to scale,” Greater Philadelphia Regional Review, Fall 2008.
Young, M. “An examination of information sources and assistance programs available to minority-owned small business,” Journal of Developmental Entrepreneurship 7(4):429-445. 2002.

47
Appendix: Sample Characteristics and Survey Methodology
The methodology employed in the BBR survey consisted of standard, accepted research procedures, methods, and techniques (including obtaining survey approval from the University’s Institutional Review Board). Consequently, subject to the research design parameters, survey results should be considered reliable, valid, and generalizable to the targeted universe of Black-owned businesses.
Sampling FrameData were collected by means of questionnaires mailed to the owners and chief executives of a sample of Texas businesses designated as being Black-owned. Four different databases constituted the collective sampling frame containing 6,993 (non-duplicated) businesses. All of these businesses were mailed a questionnaire in the late fall of 2013. A brief description of each of the four databases is presented below.
• Database 1 was provided by the Texas Statewide Historically Underutilized Business (HUB)
Program of the Office of the Texas Comptroller of Public Accounts.
• Database 2 was provided by the Texas Department of Transportation.
• Database 3 was provided by InfoGroup, a national data and aggregator list company that licenses
databases from a wide variety of different sources.
• Database 4 was the member directory of registered Black-owned businesses in the Beaumont,
Colin County, Abilene, San Antonio, Houston, Odessa-Permian Basin, Dallas, and Austin areas
provided by the Texas Association of African-American Chambers of Commerce (TAAACC).
In preparing addresses in each database for use in the survey, information was compiled regarding business name, full address (street address, city, and zip code), and full contact information (contact person, telephone number) for each business.
Questionnaire Development The questionnaire was developed in two stages. First, the BBR team developed and produced a first draft of the questionnaire. Certain questions similar to those from the Census Bureau’s Survey of Business Owners were included so that possible sample bias could be assessed. Second, TAAACC’s directors reviewed the questionnaire draft. In each stage, analyses of the draft questionnaire were undertaken and changes made to improve it.
Self-administered Mail SurveyThe BBR mailed a questionnaire to 6,993 Black-owned businesses, but 1,235 were returned by mail because of incorrect addresses (out of scope), were out of business, were businesses not minority- or majority-owned by a Black person, or were non-profit organizations. Thus, 5,758 surveys were mailed to businesses in the target population for this survey. The University’s Office of Survey Research carried out all mailing logistics.

48
Survey ProcedureThe mail-out/mail-back phase of the BBR survey of Black-owned businesses in Texas began in November 2013 (with the first questionnaire mail-out), and continued through December of 2013. The first mailing consisted of an introductory cover letter, a questionnaire, and a pre-paid (addressed) business reply envelope. This was followed by a reminder post-card and a reminder cover letter, questionnaire, and pre-paid (addressed) business-reply envelope. Thus, three communications were directed at the sampled businesses.
In general, firm-related communications focused on the importance of the survey and the need for a response, the sponsoring institution, and the confidentiality of responses.
ResponseThe response rate for the survey is estimated to be 15.9 percent. The response rate is estimated as the number of valid responses received from businesses owned by a person who self-identified as a Black person and who reported owning 51 percent or more of the company, divided by the number of surveys mailed to Black-owned businesses with correct addresses. The BBR mailed a total of 6,993 surveys, of which 597 were returned to us with a bad address, 512 were not minority- or majority-owned Black businesses, 117 were not majority-owned (51 percent or greater) by a Black person, and nine were from an invalid business like a non-profit. Additionally, seven surveys were returned blank. We received 914 valid survey responses. In general, then, the response rate is estimated to be 15.9 percent (914/5751).
AnalysisCompleted questionnaires were checked for consistency and redundancy, and responses entered into a database for analysis. Codes used for open-end question responses were derived following development of a comprehensive categorization scheme. The resulting data were analyzed using standard statistical techniques.
Appendix, continued …


50
Survey ofTexas Black-Owned Businesses
BBR 2815 San Gabriel • Austin, Texas 78705 • 512.475.8900 • www.ic2.utexas.edu/bbr • June, 2014