basics of analysis copyright ©2007 thomson south-western, a part of the thomson corporation....
Post on 21-Dec-2015
220 views
TRANSCRIPT
Basics of Analysis
COPYRIGHT ©2007 Thomson South-Western, a part of the Thomson Corporation. Thomson, the Star logo, and South-Western are trademarks used herein under license.
Chapter 5
Copyright 2007 by Thomson South-Western, a part of The Thomson Corporation. All rights reserved.Chapter 5, Slide #2
Ratio Analysis
• Liquidity– Measures a firm’s ability to meet its current obligations
• Leverage (borrowing capacity)– Measures the degree of protector for long-term creditors
• Profitability– Measures the earning ability of a firm
• Cash flow– Indicate liquidity, borrowing capacity, and profitability
Copyright 2007 by Thomson South-Western, a part of The Thomson Corporation. All rights reserved.Chapter 5, Slide #3
Ratio Analysis
• A ratio alone means nothing• Must compare ratios to other ratios such as:
– Prior ratios– Competitor ratios– Industry ratios– Predetermined standards
Copyright 2007 by Thomson South-Western, a part of The Thomson Corporation. All rights reserved.Chapter 5, Slide #4
Complexities and Context
• Use of average data from balance sheet accounts– Necessary when comparing against income
statement data– Does not
• Eliminate cyclical or seasonal variations• Capture changes that occur unevenly throughout the year
Copyright 2007 by Thomson South-Western, a part of The Thomson Corporation. All rights reserved.Chapter 5, Slide #5
Common-Size Analysis
• The use of percentages is usually preferable to the use of absolute amounts
• Vertical analysis– All amounts of a year expressed as a percentage of
a base amount (e.g., net sales revenue, total assets)
• Horizontal analysis– Amounts for comparative years are expressed as a
percentage of the base year amount
Copyright 2007 by Thomson South-Western, a part of The Thomson Corporation. All rights reserved.Chapter 5, Slide #6
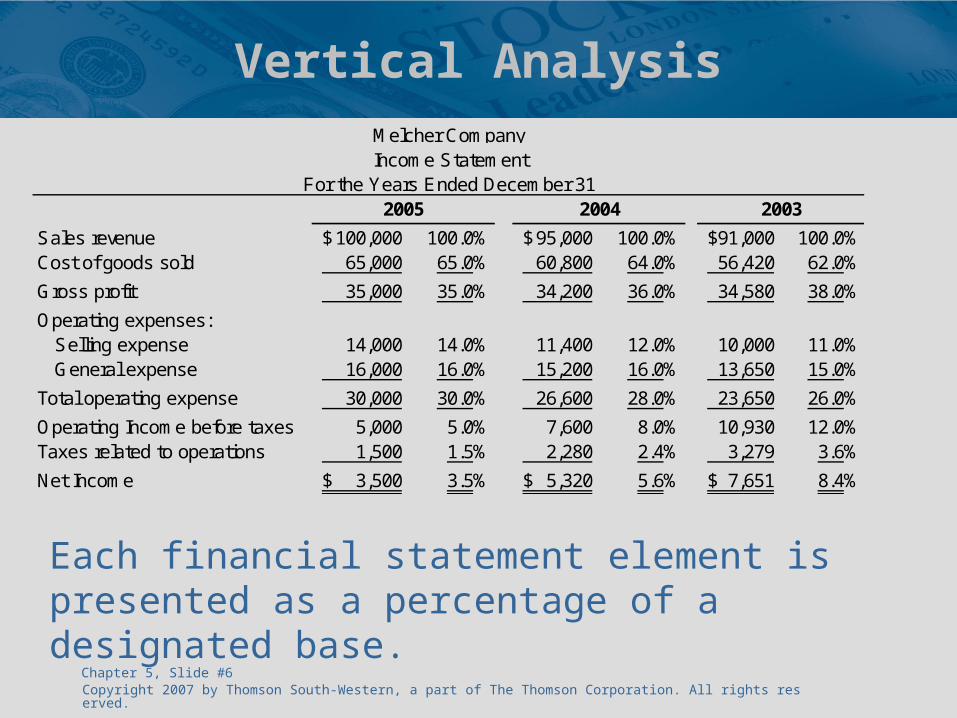
Vertical Analysis
Sales revenue 100,000$ 100.0% 95,000$ 100.0% 91,000$ 100.0%Cost of goods sold 65,000 65.0% 60,800 64.0% 56,420 62.0%
Gross profit 35,000 35.0% 34,200 36.0% 34,580 38.0%
Operating expenses:Selling expense 14,000 14.0% 11,400 12.0% 10,000 11.0%General expense 16,000 16.0% 15,200 16.0% 13,650 15.0%
Total operating expense 30,000 30.0% 26,600 28.0% 23,650 26.0%
Operating Income before taxes 5,000 5.0% 7,600 8.0% 10,930 12.0%Taxes related to operations 1,500 1.5% 2,280 2.4% 3,279 3.6%
Net Income 3,500$ 3.5% 5,320$ 5.6% 7,651$ 8.4%
Melcher CompanyIncome Statement
2005 2004 2003For the Years Ended December 31
Each financial statement element is presented as a percentage of a designated base.
Copyright 2007 by Thomson South-Western, a part of The Thomson Corporation. All rights reserved.Chapter 5, Slide #7
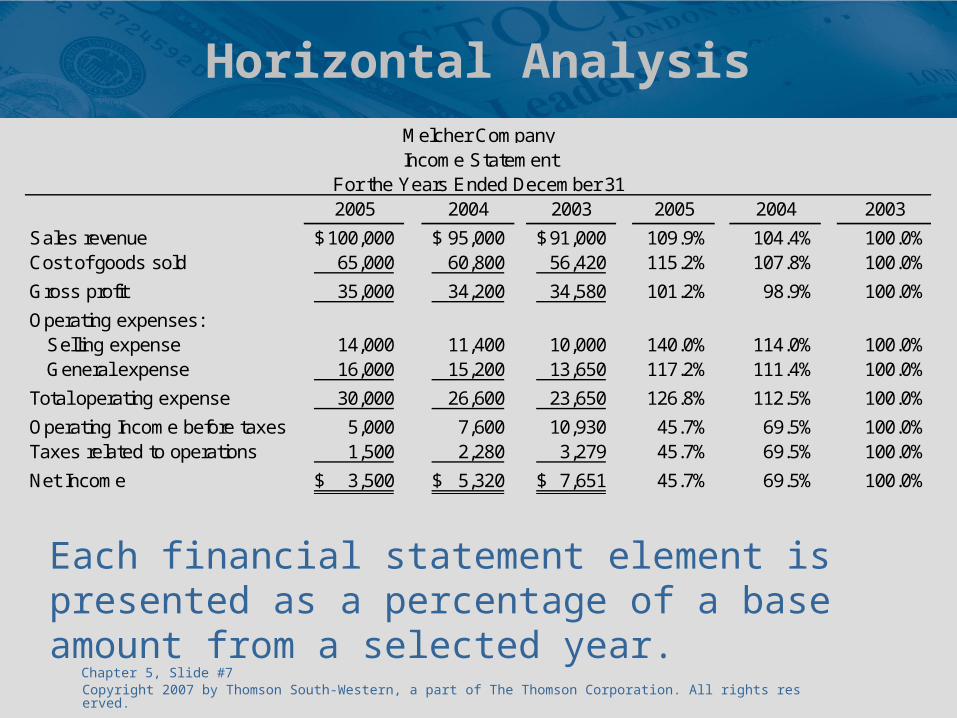
Horizontal Analysis
2005 2004 2003 2005 2004 2003
Sales revenue 100,000$ 95,000$ 91,000$ 109.9% 104.4% 100.0%Cost of goods sold 65,000 60,800 56,420 115.2% 107.8% 100.0%
Gross profit 35,000 34,200 34,580 101.2% 98.9% 100.0%
Operating expenses:Selling expense 14,000 11,400 10,000 140.0% 114.0% 100.0%General expense 16,000 15,200 13,650 117.2% 111.4% 100.0%
Total operating expense 30,000 26,600 23,650 126.8% 112.5% 100.0%
Operating Income before taxes 5,000 7,600 10,930 45.7% 69.5% 100.0%Taxes related to operations 1,500 2,280 3,279 45.7% 69.5% 100.0%
Net Income 3,500$ 5,320$ 7,651$ 45.7% 69.5% 100.0%
Melcher CompanyIncome Statement
For the Years Ended December 31
Each financial statement element is presented as a percentage of a base amount from a selected year.
Copyright 2007 by Thomson South-Western, a part of The Thomson Corporation. All rights reserved.Chapter 5, Slide #8
Year-to-Year Change Analysis
• Guidelines:– When an item has value in the base year and none
in the next period, the decrease is 100%– A meaningful percent change cannot be computed
when one number is positive and the other number is negative
– A percent change is incomputable when there is no figure for the base year.
Copyright 2007 by Thomson South-Western, a part of The Thomson Corporation. All rights reserved.Chapter 5, Slide #9
Industry Variations
• Financial components vary by type of industry• Merchandising
– Inventory is a principal asset– Sales may be primarily for cash or on credit
• Service– Inventory is low or nonexistent
• Manufacturing– Large inventory holdings– Substantial investment in plant assets
Copyright 2007 by Thomson South-Western, a part of The Thomson Corporation. All rights reserved.Chapter 5, Slide #10
Comparisons
• Common types– Trend analysis– SIC: Standard Industrial Classification– NAICS: North American Industry Classification
System– Industry averages; competitor comparisons
Copyright 2007 by Thomson South-Western, a part of The Thomson Corporation. All rights reserved.Chapter 5, Slide #11
Comparisons: Trend Analysis
• A study of the financial history of a firm• Longitudinal ratio comparison
– Falling– Rising– Relatively constant
• Highlight– Effective management– Evidence of problems
Copyright 2007 by Thomson South-Western, a part of The Thomson Corporation. All rights reserved.Chapter 5, Slide #12
SIC
• Classifies business by industry
• Defines industries in accordance with the composition and structure of the economy
• Reported in SEC registrant filings
Copyright 2007 by Thomson South-Western, a part of The Thomson Corporation. All rights reserved.Chapter 5, Slide #13
NAICS
• Joint creation of NAFTA partners: Canada, U.S., and Mexico
• Industry is defined by similar production processes
Copyright 2007 by Thomson South-Western, a part of The Thomson Corporation. All rights reserved.Chapter 5, Slide #14
Comparisons: Industry
• Industry comparison complicated by highly diversified companies
• Financial services– Base their analysis on industry placement– Provide composite industry data
Copyright 2007 by Thomson South-Western, a part of The Thomson Corporation. All rights reserved.Chapter 5, Slide #15
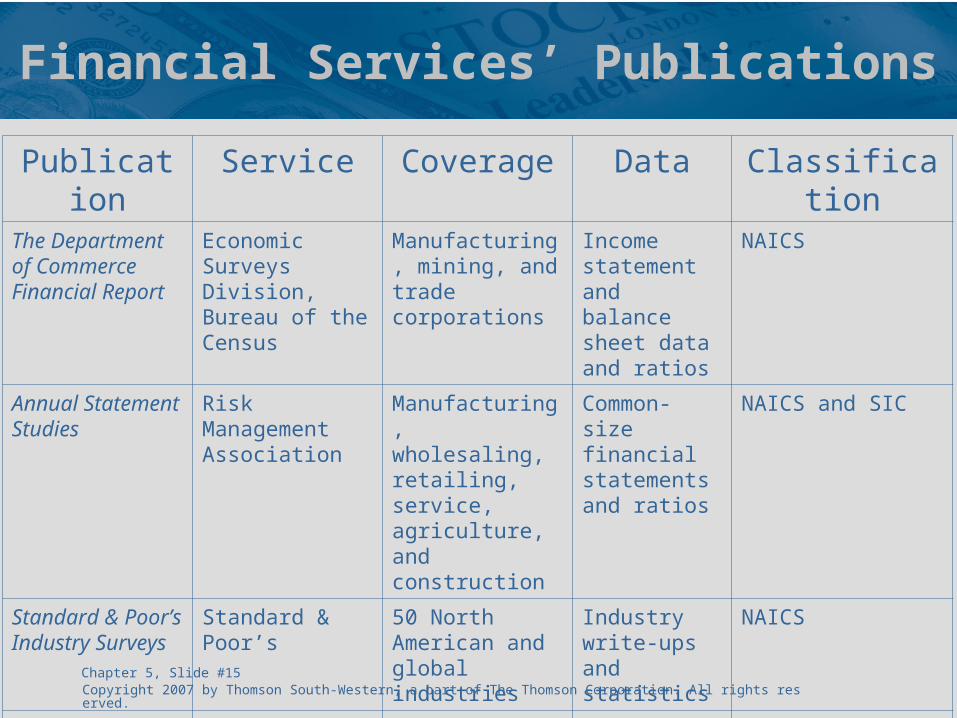
Financial Services’ Publications
Publication Service Coverage Data ClassificationThe Department of Commerce Financial Report
Economic Surveys Division, Bureau of the Census
Manufacturing, mining, and trade corporations
Income statement and balance sheet data and ratios
NAICS
Annual Statement Studies
Risk Management Association
Manufacturing, wholesaling, retailing, service, agriculture, and construction
Common-size financial statements and ratios
NAICS and SIC
Standard & Poor’s Industry Surveys
Standard & Poor’s
50 North American and global industries
Industry write-ups and statistics
NAICS
Almanac of Business and Industrial Financial Ratios
CCH, Inc. 192 industries Corporate tax return data
NAICS
Copyright 2007 by Thomson South-Western, a part of The Thomson Corporation. All rights reserved.Chapter 5, Slide #16
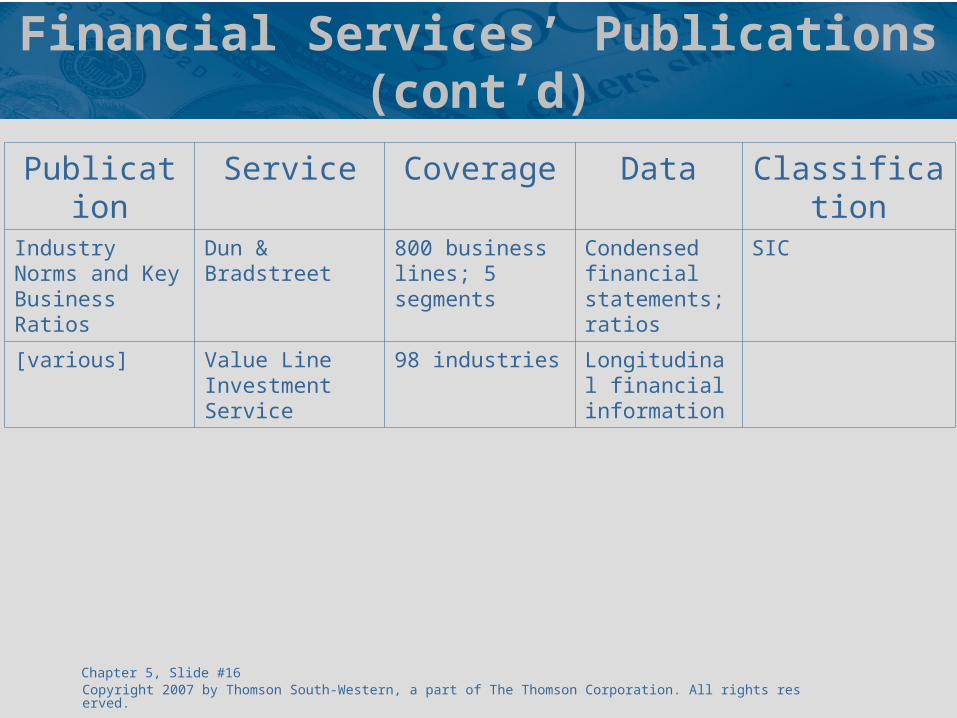
Financial Services’ Publications (cont’d)
Publication Service Coverage Data ClassificationIndustry Norms and Key Business Ratios
Dun & Bradstreet 800 business lines; 5 segments
Condensed financial statements; ratios
SIC
[various] Value Line Investment Service
98 industries Longitudinal financial information
Copyright 2007 by Thomson South-Western, a part of The Thomson Corporation. All rights reserved.Chapter 5, Slide #17
Comparisons: Caution
Ratios are subject to variance from:• Differing data• Inconsistent formula construction• Optional (elective) accounting treatment• Different fiscal year-ends• Varying financial policies• Inconsistent basis (before or after tax)
Copyright 2007 by Thomson South-Western, a part of The Thomson Corporation. All rights reserved.Chapter 5, Slide #18
Users of Financial Statements
• Management– Analyze information from the perspective of both
investors and creditors
• Investors– Analysis of past and present information to project
the future prospects of the entity
• Creditors– Short-term: focus is on current resources– Long-term: consider the future prospects of the firm