barry callebaut annual report 2013/14
DESCRIPTION
Barry Callebaut significantly grows volume and profitTRANSCRIPT
Annual Report 2013/14

0
100
200
300
500
400
13/1412/1311/1210/1109/10
0
50
100
150
200
250
300
13/1412/1311/1210/1109/10
0
1,200
2,400
3,600
4,800
6,000
13/1412/1311/1210/1109/10
0
400,000
800,000
1,200,000
1,600,000
2,000,000
13/1412/1311/1210/1109/10
Sales revenuein CHF million
Sales volumein tonnes
EBITin CHF million
Net profitfrom continuing operations in CHF million
Sales volume by Regionin tonnes
Sales volume by Product Groupin tonnes
■ Stand-alone ■ Acquired cocoa business
■ Stand-alone ■ Acquired cocoa business
Food Manufacturers Products1,072,750
63%
Gourmet & SpecialtiesProducts171,926
10%
Cocoa Products472,090
27%
Europe735,204
43%
Americas445,150
26%
GlobalCocoa472,090
27%
Asia Pacific64,322
4%
■ Stand-alone ■ Acquired cocoa business
Total Group ■ Total Group
3
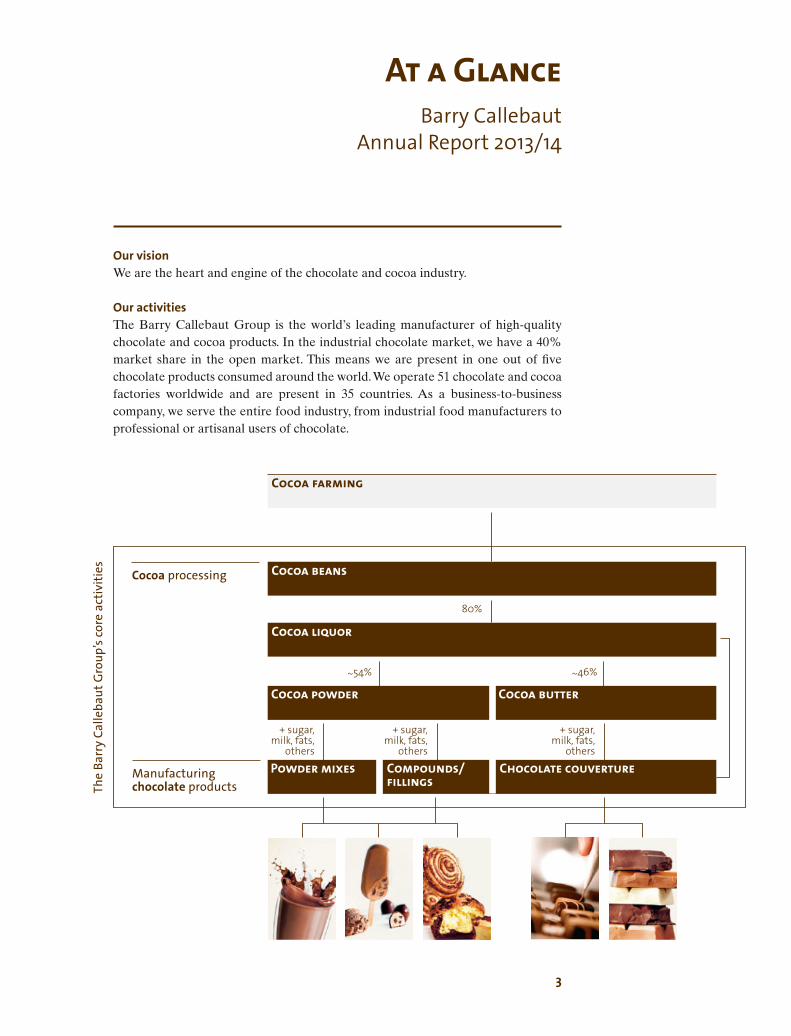
Our visionWe are the heart and engine of the chocolate and cocoa industry.
Our activities The Barry Callebaut Group is the world’s leading manufacturer of high-quality chocolate and cocoa products. In the industrial chocolate market, we have a 40% market share in the open market. This means we are present in one out of five chocolate products consumed around the world. We operate 51 chocolate and cocoa factories worldwide and are present in 35 countries. As a business-to-business company, we serve the entire food industry, from industrial food manufacturers to professional or artisanal users of chocolate.
At a GlanceBarry Callebaut
Annual Report 2013/14
Cocoa liquor
Cocoa beansCocoa processing
The
Barr
y Ca
lleba
ut G
roup
’s co
re a
ctiv
ities
Manufacturing chocolate products
Cocoa farming
Chocolate couverturePowder mixes Compounds/ fillings
Cocoa powder Cocoa butter
+ sugar, milk, fats,
others
+ sugar, milk, fats,
others
+ sugar, milk, fats,
others
~54% ~46%
80%

4
At a GlanceBarry CallebautAnnual Report 2013/14
We are the world’s leading, fully integrated chocolate manufacturer with a global presence and mastering every step from cocoa processing up to the manufacturing of chocolate products. Our value creation starts with the procurement of high-quality raw materials such as cocoa, sugar, dairy products, fats, nuts, dried fruits and other ingredients as well as packaging materials.
As the Barry Callebaut Group does not own any cocoa plantations, we source our most important raw material directly through our well-established presence in cocoa origin countries from cooperatives, intermediaries and government bodies.
We transform the cocoa beans – together with the other key ingredients – into a broad offering of high-quality, innovative cocoa and chocolate products. To accom-modate price fluctuations, most of our business is based on a cost-plus pricing system, that passes on raw material costs directly to our customers.
The integration of the cocoa business acquired from Petra Foods in June 2013 made us also the largest manufacturer of cocoa products.
Everything the Barry Callebaut Group does has deep and strong roots in the com-pany’s five core values – customer focus, passion, entrepreneurship, team spirit and integrity. These are visible in every part of our chain of activity – from the sourcing of raw materials to the fulfillment of our responsibility towards all our stakeholders.
Our values represent a mindset and way of doing business that is committed to generating sustainable earnings over time and creating of long-term value for all our stakeholders. Our way of working is characterized by strong teamwork throughout the organi-zation. This includes not just employees, but extends to producers, suppliers, customers, consumers through to the communities where we operate and to our shareholders.

5
StrategyBarry Callebaut
Annual Report 2013/14
The Barry Callebaut Group aims to outperform the global chocolate market. Its ambitious growth strategy is based on four pillars:
The Barry Callebaut Group wants to strengthen its position in the main markets of Western Europe and North America. The Group aims to unlock the full potential of emerging markets, and continuously evaluates how to enter new emerging markets. Implementing existing outsourcing volumes and strategic partnerships, as well as securing further outsourcing deals with regional and local food manufacturers, is an essential part of the business strategy. In parallel, the Group intends to further accelerate the growth of its Gourmet business.
The Barry Callebaut Group is recognized as the reference for innovation in the industry. From its global innovation centers in Wieze (chocolate) and Louviers (cocoa), the Group focuses on developing unique capabilities and expertise in four discover areas: 1. Cocoa Science; 2. Authenticity and Permissibility; 3. Structure, Texture and Sensory; 4. New Process Technology. These are the areas that give the Group a competitive edge in the development of new product solutions and help the company to shape industry trends, anticipate and respond to customer needs.
Cost Leadership is an important reason why, for example, industrial customers outsource their chocolate production to the Barry Callebaut Group. The Group is continuously improving its operational efficiency by upgrading technology and achieving higher scale effects through better capacity utilization, the optimization of product flows, logistics and inventory management, in addition to reducing energy consumption and lowering fixed costs.
To safeguard the future of its business, the Barry Callebaut Group must contribute to making cocoa farming viable and attractive to farmers, today and tomorrow. The Group believes that cocoa production will only be sustainable when farmers earn an equitable income, engage in responsible labor practices, safeguard the environ-ment and can provide for the basic health and education needs of their families. Sustainable Cocoa consists of three action areas: Farmer Practices to train farmers how to improve their yields, Farmer Education to teach the next generation of cocoa farmers, and Farmer Health to improve access to basic health care and education services.
Expansion
Innovation
Cost Leadership
Sustainable Cocoa

Five reasons to invest in Barry Callebaut
4.Recognized innovation leader
2.Superior growth opportu-nities through strong positioning in outsourcing and long-term strategic partnerships with major food companies
5.Strong track record of sustainable and consistent earnings and cash flow generation
3.Leader in emerging markets with growing presence
1.World leader in high-quality chocolate and cocoa products with a proven, focused and long-term oriented strategy

We are shaping the world of chocolate and cocoa.
One in five chocolate products consumed
around the world contains products from
the Barry Callebaut Group – even though
our name is not mentioned.
8
Stand-alone Income Statement 7
for the fiscal year ended August 31, 2013/14 2012/131,2
Change (%)in local
currenciesin CHF
Sales volume Tonnes 2.9% 1,541,654 1,498,632
Sales revenue CHF m 13.0% 10.0% 5,231.2 4,756.4
Operating profit (EBIT) CHF m 7.6% 5.6% 392.8 372.1EBIT per tonne6 CHF 4.6% 2.6% 254.8 248.3
1 All key figures are based on the continuing operations except for net profit for the year, total assets and cash flow related key figures.
2 Following the revision of IAS 19 (Employee Benefits), certain comparatives have been restated to conform to the current period’s presentation.
3 EBIT + depreciation of property, plant and equipment + amorti zation of intangibles (all from continuing operations).
4 Incl. non-controlling interest.5 Operating cash flow before working capital changes. 6 EBIT / sales volume (from continuing operations).7 Stand-alone numbers are consolidated figures adjusted for comparability reasons
by the effects of the transaction and contribution of the cocoa business acquired from Petra Foods.
8 Includes current assets, liabilities and provisions related to commercial activities.9 Total equity attributable to the shareholders of the parent company.10 EBIT / basic shares outstanding.11 Based on the net profit from continuing operations attributable to the
shareholders of the parent company / basic shares outstanding. 12 Operating cash flow before working capital changes / basic shares outstanding.13 Dividend out of paid-in capital reserves as proposed by the Board of Directors
to the General Assembly of Shareholders. 14 EBIT x (1-effective tax rate) / average capital employed.
Otheras of August 31, 2014 20131
Employees 9,319 8,658
Consolidated Ratiosfor the fiscal year ended August 31, 2013/14 2012/131,2
Economic Value Added (EVA) CHF m 6.9% 84.5 79.0Return on invested capital (ROIC)14 % (3.9%) 10.5% 10.9% Return on equity (ROE) % (4.9%) 14.7 % 15.4%Debt to equity ratio % 11.2% 100.7% 90.6%
Consolidated Balance Sheet Sharesfor the fiscal year ended August 31, 2013/14 2012/131,2
Share price end of fiscal year CHF 28.5% 1,125.0 875.5EBIT per share10 CHF 15.8% 75.9 65.5Basic earnings per share11 CHF 4.6% 46.0 44.0Cash earnings per share12 CHF 0.1% 86.3 86.2Payout per share13 CHF 6.9% 15.5 14.5
as of August 31, 2014 20131,2
Total assets CHF m 14.2% 5,167.5 4,526.9Net working capital8 CHF m 24.4% 1,674.6 1,345.7 Non-current assets CHF m 5.0% 2,175.6 2,071.9Net debt CHF m 18.2% 1,803.5 1,525.2 Shareholders’ equity9 CHF m 6.4% 1,790.7 1,682.5
Key figuresBarry CallebautAnnual Report 2013/14
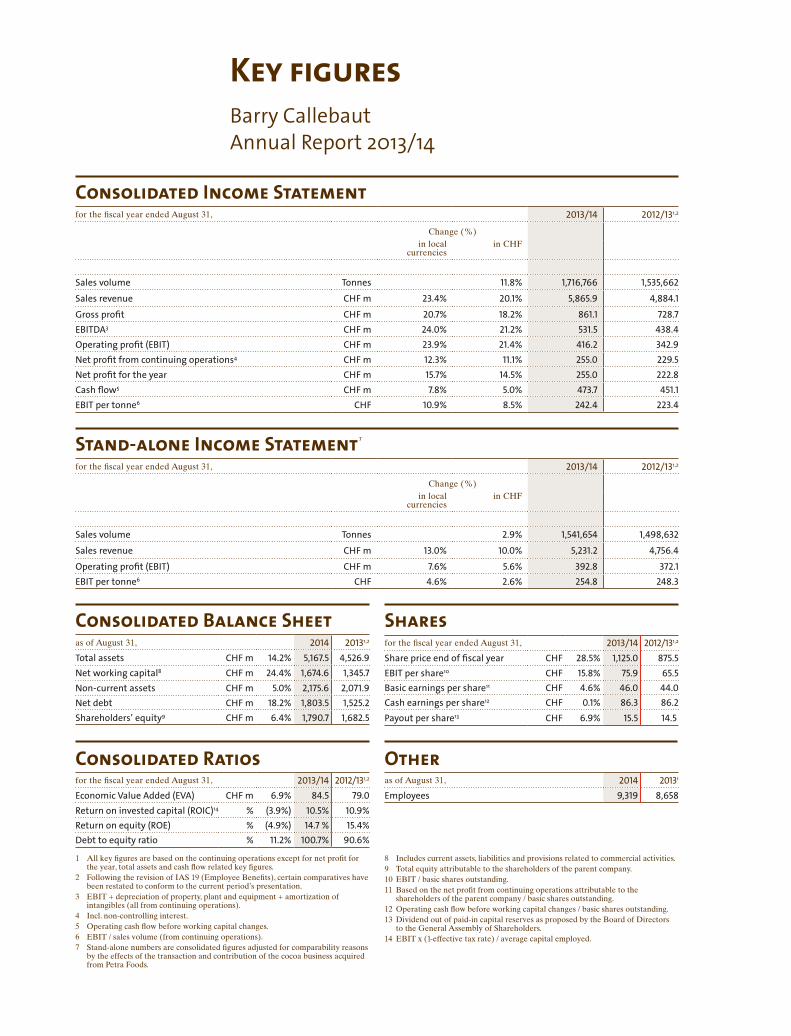
Consolidated Income Statementfor the fiscal year ended August 31, 2013/14 2012/131,2
Change (%)in local
currenciesin CHF
Sales volume Tonnes 11.8% 1,716,766 1,535,662
Sales revenue CHF m 23.4% 20.1% 5,865.9 4,884.1
Gross profit CHF m 20.7% 18.2% 861.1 728.7 EBITDA3 CHF m 24.0% 21.2% 531.5 438.4 Operating profit (EBIT) CHF m 23.9% 21.4% 416.2 342.9Net profit from continuing operations4 CHF m 12.3% 11.1% 255.0 229.5Net profit for the year CHF m 15.7% 14.5% 255.0 222.8Cash flow5 CHF m 7.8% 5.0% 473.7 451.1 EBIT per tonne6 CHF 10.9% 8.5% 242.4 223.4

Sept. 09 Sept. 10 Sept. 11 Sept. 12 Sept. 13 Sept. 14
1,250
1,000
750
500
250
Barry Callebaut AGSwiss Market Index Mid-Cap (SMIM)Swiss Performance Index (SPI)Euro Stoxx Food & Beverage Index
Share price development Barry Callebaut vs. IndicesRebased (in CHF)
The Barry Callebaut Group is organized into different regions: Region Europe (incl. Middle East and Africa), Region Americas and Region Asia Pacific. The globally managed Global Cocoa is, like a Region, reported as a separate segment. The figures under the respective Regions show all chocolate sales, while the figures reported under Global Cocoa include all sales of cocoa products to third-party customers in all Regions.
The Group’s business can also be separated into three different Product Groups: Food Manufacturers Products, Gourmet & Specialties Products and Cocoa Products.
Feb. 05 Feb. 06 Feb. 07 Feb. 08 Feb. 09 Feb. 10 Feb.11 Sep. 10 Sep. 11 Sep. 12 Sep. 13 Sep. 14Sep. 09
Cocoa priceLondon Cocoa Terminal Marketin GBP/tonne
Europe
Americas
Asia Pacific
Global Cocoa
Food Manufacturers, Gourmet & Specialties
Food Manufacturers, Gourmet & Specialties
Food Manufacturers, Gourmet & Specialties
Cocoa Products
43 % of consolidatedsales volume
26% of consolidatedsales volume
4% of consolidatedsales volume
27% of consolidatedsales volume
Volume growth vs. prior year (1.2%) +5.4% +9.3% +52.1%EBIT growth vs. prior year(in CHF)
+5.3% +17.5% +0.4% +95.7%

Number of employees
Number of factories
Number of new recipes launched
Tonnes of sus-tainable cocoa sourced from our programs
Number of R&D projects
Farmers trained in good agricultural practices
9,319
2,914
99,000
51
1,154
84,000

The Barry Callebaut Group is the world’s
leading, fully integrated chocolate manufacturer
with a global presence mastering every step
from cocoa processing up to the manufacturing
of chocolate products.

14 Interview with the Chairman and the CEO 20 Board of Directors and Executive Committee 22 Employees 28 Region Europe 31 Region Americas 33 Region Asia Pacific 35 Global Cocoa 37 Operations & Supply Chain 38 Innovation
41 Sustainability
50 Interview with the CFO 53 Financial Review 56 Consolidated Financial Statements 134 5-Year Overview 136 Financial Statements of Barry Callebaut AG
146 Corporate Governance
168 Glossary 170 Contacts, Financial calendar and
Forward-looking statements

14
Interview with the Chairman and the CEOBarry CallebautAnnual Report 2013/14
A big leap in sales volume and profit
The Barry Callebaut Group achieved another record year. The focus was on profitability which improved at a double-digit rate. A priority was the successful global integration of the cocoa business acquired in 2013 which boosted sales volume and already made a profit contribution in the first year. A lot of effort also went into structural investments, building the platforms that are necessary to successfully drive a larger and more global company.
How would you assess the performance of Barry Callebaut in fiscal year 2013/14?
Andreas Jacobs, Chairman (AJ) We achieved a convincing result with strong top- and bottom-line growth. Strategically, the global integration of the cocoa business acquired in 2013 was a clear priority for us. Our journey towards becoming one company started with 181 global milestones; one year later, only 19 remain open. We also managed to turn the operating loss of the acquired cocoa business into a profit. We have not lost any key people or key customers, and the identified synergies started mate-rializing. Of course, we need to further improve the profitability of this business. But we are on track.
Juergen Steinemann, CEO (JBS) Our sales volume was boosted by the cocoa acquisition. But it was also well supported by our three growth drivers which are emerging markets, Gourmet and strategic partnerships, and reached 2.9% on a stand-alone basis against a global market growth of 2.3%1. Capacity constraints, primarily in Western Europe, somewhat restricted our full growth potential. Recent investments in pro-duction capacity will now allow for further growth. Our increased focus on margin improvements has resulted in strong EBIT and net profit growth. I am very satisfied with this performance and grateful to our team of over 9,300 dedicated people for their tremendous work.
AJ I would like to join Juergen and thank all our colleagues for their outstanding performance as well as our customers and shareholders for their continued trust.
1 Source: Nielsen, September 2013 – August 2014 (volume growth; chocolate confectionery market).

15
“Our annual strategy review concluded that our four-pillar strategy based on Expansion, Innovation, Cost Leadership and Sustainable Cocoa still fits us. Actually, if we sharpen our focus, it will serve as a platform for further growth”.
Andreas Jacobs, Chairman of the Board of Directors
“I am very satisfied with our performance and grateful to our team of over 9,300 dedicated people for their tremendous work”.
Juergen Steinemann, Chief Executive Officer

16
Interview with the Chairman and the CEOBarry CallebautAnnual Report 2013/14
The acquisition of the cocoa business from Petra Foods has added more than 1,800 new colleagues and 7 factories on 4 continents. How are you managing this much larger and more global company?
JBS Indeed, our company has become more global with about one in two of our colleagues working in emerging markets, or a cocoa origin country, and serving a worldwide customer base. Hence, we are introducing more global standards across our businesses. In parallel, we have embarked on a number of global platform activities to strengthen our core. One example is project “Spring” which we imple-mented over the last three years in Western Europe with the aim of enhancing our leadership in customer service. Another example is “HR for Growth”, a strategic project focused on attracting, developing and empowering talented people in our organization.
Do you see the need to adapt your corporate strategy?
AJ Our annual strategy review concluded that our four-pillar strategy based on Expansion, Innovation, Cost Leadership, and Sustainable Cocoa still fits us. Actu-ally, if we sharpen our focus, it will serve as a platform for further growth. We have defined “ongoing initiatives”, such as the continued push for growth in emerging markets, further strengthening our sustainability programs, or investing in our talent development programs. Beyond these, we came up with a number of “shaping initiatives” – strategic actions that are partly new and partly require a renewed effort, like differentiating our core products and services, growing in compounds and fillings or becoming the preferred cocoa products supplier.
Is outsourcing still one of your growth drivers?
JBS Absolutely, the trend is ongoing. We gained various long-term partnership agree-ments with regional leaders around the world, have expanded existing supply agreements, and see future opportunities, especially in emerging markets. Out-sourcing strengthens our volume expansion. Gourmet, on the other hand, boosts our profitability. The emerging markets show far stronger growth rates in the consumption of chocolate and cocoa products than the developed markets. Our growth is based on the combination of these three main drivers.
17
Cocoa prices increased around 25% during the year. What is the impact of these price hikes?
JBS Good harvests in the two most important origin countries, Côte d’Ivoire and Ghana, turned the 2013/14 season into a slight surplus. Regardless, the bullish momentum prevailed. It has been fuelled by fears related to the outbreak of Ebo-la in some West-African countries bordering Côte d’Ivoire and Ghana, El Niño forecasts and a potential cocoa shortage by 2020, as well as financial speculation. As we pass on raw material prices to customers for the majority of our business in line with our cost-plus model, the impact on our profitability is limited. But the higher cocoa prices have inflated our net working capital.
Cocoa sustainability is firmly embedded in your corporate strategy. Can you see progress?
AJ We need to make cocoa farming sustainable, and we will. The first CHOCO-VISION stakeholder conference initiated by us in 2012 has inspired the senior business leaders of the world’s largest cocoa and chocolate companies to coordi-nate and align their cocoa sustainability efforts under the umbrella of the World Cocoa Foundation in order to increase their impact. This resulted in Cocoa- Action, a commitment by industry and cocoa producing country governments to work together towards a truly sustainable cocoa industry. I am personally very pleased that Barry Callebaut is a driving force behind CocoaAction, and I fully support our CEO in his new role as Vice Chairman of the World Cocoa Foundation.
JBS What we need is more impact. Our global sustainability team of nearly 60 people has just redesigned our own initiatives such as the Quality Partner Pro-gram, modeling them on the two main pillars of CocoaAction, the “productivity package” and the “community package”. In alignment with CocoaAction, we will monitor and report on the impact achieved, so that we will meet our collec-tive industry commitment to bring 300,000 farmers to a successful professional level. In addition, we will expand our own programs.
Interview with the Chairman and the CEOBarry Callebaut
Annual Report 2013/14

18
Interview with the Chairman and the CEOBarry CallebautAnnual Report 2013/14
What is your outlook amid increased geopolitical risks and decreasing global economic forecasts?
JBS We are cautiously optimistic. Based on our proven strategy, the structural invest-ments we have made and the global platforms we have built, we see many opportu-nities along our three growth drivers: The first outsourcing volumes from Chile and from other new or extended outsourcing agreements will come in. Gourmet remains a strong profit growth contributor. The emerging market growth story is intact. We will keep a strong focus on tight cost controls and margin improvements. And let’s not forget our strongest assets – our people. Together, we are striving to continue to outperform the global chocolate market. All this gives us the confidence to confirm our mid-term guidance1.
1 As of consolidation of the acquired cocoa business: 6–8% average volume growth per year, and EBIT per tonne restored to pre-acquisition level by 2015/16 (CHF 256 per tonne) – barring any major unforeseen events.

After the integration of the acquired cocoa
business from Petra Foods into the Barry Callebaut Group in June 2013, we are now the undisputed
global leader for chocolate and cocoa
products.

20
Jakob Baer Timothy E. Minges
Board of Directors and Executive CommitteeBarry CallebautAnnual Report 2013/14
Board of Directors
Nicolas Jacobs
Andreas JacobsChairman
Andreas SchmidVice Chairman
Additional information:www.barry-callebaut.com/organization www.barry-callebaut.com/board
Fernando Aguirre
Ajai Puri(until December 10, 2014)
James L. Donald
The Board of Directors proposes to the Annual General Meeting of Shareholders that Juergen Steinemann be elected as new member and Vice Chairman of the Board of Directors. Furthermore, the Board of Directors proposes Ms. Wai Ling “Winnie” Liu as new member of the Board of Directors, succeeding Ajai Puri who will step down.

21
Board of Directors and Executive CommitteeBarry Callebaut
Annual Report 2013/14
Executive Committee
Additional information:www.barry-callebaut.com/executivecommittee
Massimo GaravagliaPresident Western Europe
Steven RetzlaffPresident Global Cocoa
Dirk PoelmanChief Operations Officer
David S. JohnsonCEO and President Americas
Juergen SteinemannChief Executive Officer
Peter BooneChief Innovation & Quality Officer
Victor BalliChief Financial Officer

22
EmployeesBarry CallebautAnnual Report 2013/14
Growing talent
As our Graduate Trainee Program celebrates its 10th anniversary with record applications, the Barry Callebaut Group continues to attract, nurture and empower the best talent and ensure the right people are in the right place at the right time.
Graduate Trainee ProgramBarry Callebaut’s Graduate Trainee Program is a key element of the company’s strategy to attract young talent from universities and fuel its talent pipeline. In 2014, the Graduate Trainee Program celebrated its 10th anniversary. In the last 10 years, the program has gone from strength to strength not just in attracting talent, but also growing globally minded employees for the company. The Barry Callebaut Group has so far successfully attracted 31 different nationalities to the program, and maintained a healthy male to female ratio of 1:1.
As part of our employer branding efforts, we launched the program on various Social Media platforms and received a record number of applications, approximately 2,500. We also reached out to universities across Europe, Asia, and the Americas to further promote the program. The Barry Callebaut Group will continue to increase its geographic reach and expand it to additional strategic functions.
HR for growth As part of “HR for Growth”, a strategic project focused on attracting, developing and empowering talented people in our organization, we successfully rolled out the new Barry Callebaut People Management Platform, SuccessFactors, across 76 entities and 32 countries.
It introduces new tools to facilitate quick and effective hiring of talent to drive business value and enables access to state-of-the-art technology. The new process focuses on identifying individual development needs, improving feedback quality and strengthening leadership skills.
The implementation of the new Barry Callebaut People Management Plat-form will bring consistency and transparency to the whole company and allow us to further develop today’s workforce, understand our talent needs for tomorrow and prepare for the future.
Employees per function:from continuing operations
53%
36%
11%
11%
41%
26%
22%
Employees per geographic region: from continuing operations
Europe 3,844Americas 2,386Asia Pacific 2,071Africa 1,018Number of employees 9,319
Management 1,005Office staff 3,383Production 4,931Number of employees 9,319

23
Average seniority in years:
Europe 8.92Americas 8.04Asia Pacific 4.01Africa 9.20
EmployeesBarry Callebaut
Annual Report 2013/14
Reaching the next levelThe Barry Callebaut Group completed the first talent identification review with a one-day session with the Executive Leadership team to discuss global talent within our organization.
A structured assessment approach using “TalentQ”, allows us to assess people and their capabilities when making hiring and promotion decisions. The “TalentQ” combined with an in-depth career discussion has provided the basis to termine individual development and career plans. At present, 55% of Management roles are filled internally.
In 2013, the Gourmet & Specialties Product Group provided a platform to us to test the Barry Callebaut competency model. This is now being rolled out to the wider organization. 200 managers have been trained to use the competency model, in order to professionalize recruitment interviews, performance management discussions and individual development.
Mobility is an important pillar of the Talent Management agenda. Conse-quently, the company is committed to ensuring that employees can gain the right experiences and that the right people are in the right place at the right time. It is imperative that our employees can develop and share best practices, are aware of cultural diversity and gain a better understanding of the markets in which we oper-ate. We implement this in an equitable, consistent, compliant and transparent way. In fiscal year 2013/14, 85 employees were on international assignments in all regions.
MARBACH PROGRAMS 2013/14Training programs offeredLeadership programs Management skills workshops Functional & skills workshops
Executive Leadership Being the Boss Business CommunicationsLeadership Challenge Delegation & Coaching Customer FocusStrategic Leadership Project Management FinanceSource NegotiationTeam Leadership
3 locations
Marbach (Germany) 15 programsChicago (USA) 4 programsSingapore (Singapore) 2 programsTotal 2013/14 21 programs
391 participants (38% women) from 46 sites and 25 countries
1,000
2,000
3,000
4,000
Nu
mb
er
of
em
plo
ye
es
5,000
Office
staff
Managem
ent
Productio
n
■ Male■ Female
Gender of employees:
1,000
2,000
3,000
4,000
Nu
mb
er
of
em
plo
ye
es
Office
staff
Managem
ent
Productio
n
5,000
■ < 30■ 30–50■ > 50
Age of employees:

Joe LeahManager Corporate Quality
For his enormous contribu-tion to tightening the quality management system across the Americas, and for bringing structure and discipline to the search for quality improvements each and every day across our network.
Dhruv BhatiaManaging Director India
For his instrumental role in building up and leading our business in India, for his passionate and hard work, and never-say-no attitude.
For the third time, a “Team Excellence Award” was
handed over, this year to America’s Supply Chain
team for their outstanding performance in delivering a highly effective and efficient
supply chain, and strong quality performance across
the board with product complaints down –57% and
service complaints down to only 1.6%.
Nicole AllenDirector Customer ServicePieter CoolDirector Supply ChainKen CotichVice President OSCOChris DimambroDirector Manufacturing North AmericaMarc LaddDirector EngineeringDoug MiscikowskiVice President Quality Assurance
24
Excellence Award 2014 Rewarding peak performance The Excellence Award recognizes managers and their teams who are willing to go the extra mile, who are putting all their passion into their work and, thus, have made a positive impact on the company in the past fiscal year. The six Excellence Award 2014 winners were nominated by their Presidents.

Lucas QuekCommercial Executive Cocoa Asia Pacific
For significantly contributing to our volume growth during a challenging year for our cocoa business, and for passionately sharing his knowledge within the company.
25
Nic SchraepenRegion Controller Western Europe
For his extraordinary dedication in successfully implementing the new job of Commercial Analyst for Region Western Europe alongside his normal job, and building up a strong team of commercial analysts in the sub-regions.
Matthias MayCocoa Plant Manager Hamburg
For coping with all aspects of what the past year was all about – integration, growth, innovation, cost leadership and being a leader and ambassador, whilst also being at the helm of a newly formed management team.
Tom Van de Vyver Head of Global Treasury
For successfully implement-ing the expansion of our financing programs and for successfully managing all global currency exposures, along with his team.

Fabrizio Piscia Verbania-Intra, Italy
Katia Renard Louviers, France
Chairman’s Award
2014The annual Chairman’s Award recog-nizes employees who have been with Barry Callebaut for a number of years and have demonstrated outstanding performance at work, as well as a strong social commitment in their local communities. They are individuals who embody the Barry Callebaut values of customer focus, passion, entrepre-neurship, team spirit and integrity. The Chairman’s Award was inaugu-rated in 1995 by late Klaus Jacobs, the former Chairman of Jacobs Holding AG and founder of Barry Callebaut. Since then, the Chairman’s Award has been given to a selected number of employees each year. In 2014, 13 Barry Callebaut employees from 11 countries received the award and were invited together with their spouses or partners to come to Switzerland to be handed over the award by Chairman Andreas Jacobs and CEO Juergen Steinemann.
Customer focus. Passion.
Entrepreneurship. Team spirit.
Integrity.
Every Barry Callebaut employee is an ambas-sador of our company. The reputation of our company, as well as our success in achieving our strategic goals, depends on each one of us.
We expect all employees to show responsibility and good citizenship in business dealings, and to behave in ways that demonstrate our company values. These values and our belief that the best working environment is one built on mutual respect and trust are reflected in the Barry Callebaut Code of Conduct.
Steven De Vriendt Wieze, Belgium
Mustari Sujangi Port Klang, Malaysia
Agata Baldwin Łódź, Poland
Roger Baur Zurich, Switzerland

Vallérie Trottier St. Hyacinthe, Canada
27
Gabriela Magalhães São Paulo, Brazil
Odirley Enock Itabuna, Brazil
Arman Faiman Wahab Port Klang, Malaysia
Werner Weber Hamburg, Germany
Yanuar Dony Gunawan Bandung, Indonesia
Terri Fanz-Falzone Eddystone, USA

28
Region EuropeBarry CallebautAnnual Report 2013/14
Strong profit performance through focus on margin and product mix
Sales volume decreased as a result of the Group’s strong focus on product margins in our industrial business as well as capacity constraints. Again, the Gourmet business delivered a strong per-formance in a challenging market environment. Overall, operating profit (EBIT) kept its strong growth momentum.
735,204tonnes
Sales volume
–1.2%
2,573.3CHF m
Sales revenue
+9.4%
268.1CHF m
EBIT
+5.3%

29
Region EuropeBarry Callebaut
Annual Report 2013/14
Volume growth of the chocolate confectionery market in Western Europe was flat at +0.1%1.
Total sales volume in the Food Manufacturers Products business decreased as a result of the Group’s focus on optimizing customer and product segmentation, and further improving product margins. In contrast, we achieved double-digit volume growth in the business with specialty products driven by ASM Foods which we acquired last year, by higher sales of sustainable, certified chocolate products and by increased customer requests for reformulated products (with less sugar and less fat).
The Gourmet business achieved strong volume growth, driven by a double-digit increase of our Gourmet brand Callebaut®. The business significantly outperformed the rather sluggish market in Western Europe. This successful growth was fuelled by a combination of market share gains, opening up the foodservice market as well as the introduction of new, innovative products (e.g. Cacao Barry®’s “Purity from Nature” range of couverture chocolates). In order to support future growth, the new flagship Callebaut® CHOCOLATE ACADEMY™ center in Wieze was opened last June. With the new academy, we expect the number of people trained each year in Wieze to rise from 300 to 1,000. Our first CHOCOLATE ACADEMY™ center in Cologne, Germany, will be inaugurated in February 2015.
The Group’s Beverage business delivered a strong performance with growth of both top-line volume and bottom-line profitability. In a flat market, this was achieved thanks to increased market share and the introduction of innovative new products.
In order to mitigate the capacity constraints faced early in the year, manufacturing capacities at our site in Wieze (Belgium), the largest chocolate factory in the world, were extended, as were our factories in Łódz (Poland), Banbury (UK), Vic (Spain) and Norderstedt (Germany). In total, we added nearly 10% new liquid chocolate capacity. Additional investments will be made in the next fiscal year to further increase both our liquid and molding capacities to prepare for future volume growth.
1 Source: Nielsen, September 2013 – August 2014 (volume growth; chocolate confectionery market).
Additional information:www.barry-callebaut.com/foodmanufacturerswww.barry-callebaut.com/gourmetwww.barry-callebaut.com/beverageswww.callebaut.comwww.cacao-barry.comwww.caprimo.comwww.vanhoutendrinks.com

30
Region EuropeBarry CallebautAnnual Report 2013/14
Chocolate confectionery markets in the EEMEA region (Eastern Europe, Middle East and Africa) grew +3.7%1 , i.e. faster than a year ago.
In a rather challenging market environment towards the end of the fiscal year, both our Food Manufacturers Products and Gourmet & Specialties Products businesses again achieved double-digit volume growth.
In the industrial business, volume growth slowed down somewhat in the second half of the fiscal year due to general political and economic uncertainties in the region, particularly in Russia. In contrast, the business grew strongly throughout the year in the Middle East, Africa and Southeast Europe. Overall, we saw good growth with the Group’s global customers.
The Gourmet business performed particularly well in the Middle East, Africa, Turkey and Russia. In Russia, our imported Gourmet brands were not affected by the sanctions imposed on imported EU foodstuffs. Growth was driven by our Belgian Gourmet brand Callebaut®. This good growth was achieved against a back-ground of a weaker currency situation and price list increases in key markets due to higher cocoa bean prices.
To further strengthen and broaden the Group’s footprint within the region, we increased the liquid chocolate capacity at our factory in Eskisehir (Turkey), opened last September, in response to high customer demand. We also started to install new liquid capacity in Chekhov (Russia) to be operational by mid of 2015. In Dubai, the Group is building a new CHOCOLATE ACADEMY™ center to be opened at the end of 2014. This Gourmet training center will help to further grow our market share in the Middle East.
1 Source: Nielsen, September 2013 – August 2014 (volume growth; chocolate confectionery market).
Additional information:www.barry-callebaut.com/foodmanufacturerswww.barry-callebaut.com/gourmet
Key figures for Region EuropeChange % 2013/14 2012/131
in local currencies in CHF
Sales volume Tonnes (1.2%) 735,204 744,078Sales revenue CHF m 10.4% 9.4% 2,573.3 2,352.5EBITDA CHF m 7.2% 6.9% 306.0 286.2Operating profit (EBIT) CHF m 5.5% 5.3% 268.1 254.6
1 Following the revision of IAS 19 (Employee Benefits), certain comparatives have been restated to conform to the current period’s presentation.

31
Region AmericasBarry Callebaut
Annual Report 2013/14
Continued strong growth momentum, top- and bottom-line
Region Americas continued to show a strong performance on both top- and bottom-line level. Growth has been achieved within all Product Groups and across all markets. Main drivers of the good result were the Group’s global accounts and its Gourmet business.
445,150tonnes
Sales volume
+5.4%
1,287.3CHF m
Sales revenue
+8.8%
126.5CHF m
EBIT
+17.5%

32
Region AmericasBarry CallebautAnnual Report 2013/14
Chocolate confectionery markets in the Americas grew by 2.8%. North America increased by 2.1%, whereas in South America markets expanded 7.0%1.
In North America, the business with food manufacturers performed well above overall market growth, supported by both the Group’s global and regional accounts. Despite very harsh conditions last winter, affecting restaurant traffic and transportation routes, our Gourmet business contributed to the growth, mainly through the two imported global brands Callebaut® and Cacao Barry®.
In response to the growing demand for our chocolate products in North America, we strengthened our existing footprint and increased manufacturing capacities in Canada (St. Hyacinthe and Chatham) as well as in the U.S. (St. Albans, American Canyon, and Hendersonville) by around 10%.
Again, Mexico performed strongly with a double-digit volume growth, driven by the Group’s global accounts and the Gourmet business. Volumes based on the long-term agreement with Grupo Bimbo were further implemented and will be fully integrated within the next year.
In South America, both the industrial and Gourmet businesses recorded double-digit growth despite some capacity constraints in our chocolate factory in Extrema (Brazil). Investments in capacity extensions will be made in the coming year.
We successfully started deliveries from our newly built chocolate and compound factory in Santiago de Chile. This further expands our footprint in Latin America and will help us to serve a variety of food manufacturers and confectionery compa-nies located not only in Chile, but also in Argentina, Uruguay, Paraguay and Peru.
1 Source: Nielsen, September 2013 – August 2014 (volume growth; chocolate confectionery market).
Additional information:www.barry-callebaut.com/foodmanufacturerswww.barry-callebaut.com/gourmetwww.callebaut.comwww.cacao-barry.comwww.vanleerchocolate.com
Key figures for Region AmericasChange % 2013/14 2012/131
in local currencies in CHF
Sales volume Tonnes 5.4% 445,150 422,380Sales revenue CHF m 13.8% 8.8% 1,287.3 1,182.7EBITDA CHF m 16.0% 12.3% 145.2 129.3Operating profit (EBIT) CHF m 20.8% 17.5% 126.5 107.7
1 Following the revision of IAS 19 (Employee Benefits), certain comparatives have been restated to conform to the current period’s presentation.

33
Region Asia PacificBarry Callebaut
Annual Report 2013/14
Acceleration of sales volume growth
Sales volume growth accelerated in Region Asia Pacific driven by the industrial business. Operating profit (EBIT) was impacted by weaker currencies, a slower Gourmet business and further investments to strengthen our manufacturing footprint.
64,322tonnes
Sales volume
+9.3%
249.1CHF m
Sales revenue
+12.2%
27.0CHF m
EBIT
+0.4%

34
Region Asia PacificBarry CallebautAnnual Report 2013/14
Chocolate markets across Asia Pacific expanded at a slightly slower pace: +8.3%1. This is still well above world market growth and mainly nurtured by a steadily growing middle-class in South East Asia and China.
Growth in the Food Manufacturers Products business accelerated, achieving a double-digit increase. The business performed particularly well with the Group’s global accounts served from within the Region. Overall, our Gourmet sales declined due to weaker currencies in main markets and new import restrictions into India. Our marketing and distribution efforts contrib-uted to the growth of our global brands in key markets such as China and Australia. We enlarged our manufacturing capacities in order to cope with the fast growth in the Region: We expanded our chocolate factory in Singapore where we faced the biggest capacity constraints. This included the installation of a 2,000 m2 warehouse for both raw materials and finished goods to reduce the costs of using external warehousing. Further capacity extension in Singapore will follow next year. The Group also ramped up its capacity in the new Takasaki factory in Japan. To strengthen our market position, we opened a new R&D center for bakery and pastry applications in Port Klang (Malaysia). One important focus of innovation is on improving the heat resistance of compound products. We also see a growing trend for products with health benefits, product reformulations (less sugar, low in saturated fats) and sustainable compounds in the Region.
1 Source: Nielsen, September 2013 – August 2014 (volume growth; chocolate confectionery market).
Additional information:www.barry-callebaut.com/foodmanufacturerswww.barry-callebaut.com/gourmetwww.callebaut.comwww.cacao-barry.comwww.van-houten-professional.com
Key figures for Region Asia PacificChange % 2013/14 2012/131
in local currencies in CHF
Sales volume Tonnes 9.3% 64,322 58,832Sales revenue CHF m 19.0% 12.2% 249.1 222.0EBITDA CHF m 5.8% 3.6% 33.7 32.5Operating profit (EBIT) CHF m 1.1% 0.4% 27.0 26.9
1 Following the revision of IAS 19 (Employee Benefits), certain comparatives have been restated to conform to the current period’s presentation.

35
Global Cocoa Barry Callebaut
Annual Report 2013/14
Successful global integration of acquired cocoa business
With the first year of full integration of the cocoa business acquired in June 2013, Global Cocoa’s sales volume increased by over 50%. The new business made an important contribution to the operating profit (EBIT); expected synergies for the first year were overachieved.
472,090tonnes
Sales volume
+52.1%
1,756.2CHF m
Sales revenue
+55.8%
82.0CHF m
EBIT
+95.7%

36
Global Cocoa Barry CallebautAnnual Report 2013/14
The acquired cocoa business brought the business segment Global Cocoa to a new level, with additional third-party sales of 175,000 tonnes and 7 cocoa factories. The global integration into the Barry Callebaut Group has been mostly completed. Responsibility for reaching the remaining milestones has now been transferred to the regional divisions of Global Cocoa. Largely in line with our business plan, the new business contributed CHF 26.7 million on EBIT level for the first year of its consolidation.
Cocoa prices rose to their highest levels in three years, closing at GBP 2,017 on August, 31, 2014, or plus 25% compared to prior year. Despite strong crop arrivals from the two most important origin countries, Côte d’Ivoire and Ghana, the bullish momentum in the market prevailed, fuelled by fears related to El Niño, a potential cocoa shortage by 2020 and the outbreak of Ebola in countries bordering Côte d’Ivoire and Ghana. The combined cocoa ratio overall had a neutral effect on the Group’s profitability, with variances in the different regions.
The world sugar market was characterized by high volatility – driven by both funds’ activities and weather expectations. Prices closed at their lowest levels since May 2010, nearly 20% lower than at the beginning of the fiscal year. European sugar prices steadily decreased as a result of a good supply situation; in total, they went down by around 25%. High market prices encouraged global milk production. Demand for milk powder lagged behind the good supply, resulting in decreasing prices since March 2014 – on both the world and the European market. Prices closed around 35% lower than prior year. The Barry Callebaut Group applies a cost-plus pricing model to about 70% of its sales volume, i.e. customers are charged current (raw material) market prices when contracting their business. Thus, raw material price fluctuations have a limited effect on the Group’s profitability.
Key figures for Global Cocoa Change % 2013/14 2012/131
in local currencies in CHF
Sales volume Tonnes 52.1% 472,090 310,372Sales revenue CHF m 61.4% 55.8% 1,756.2 1,126.9EBITDA CHF m 81.2% 73.2% 131.1 75.7Operating profit (EBIT) CHF m 106.3% 95.7% 82.0 41.9
1 Following the revision of IAS 19 (Employee Benefits), certain comparatives have been restated to conform to the current period’s presentation.
European combined cocoa ratio6 months forward
Sept. 09 10 11 12 13 14
3.5
3.3
3.1
2.9
2.7
2.5
3.7
3.9
Cocoa priceLondon Terminal Market6 month forward pricesin GBP/tonne
Sept. 09 10 11 12 13 14
2,000
1,750
1,500
1,250
1,000
750
2,250
2,500
Additional information:s.a. Cocoa Sustainability Report 2013/14.
37
Operations & Supply ChainBarry Callebaut
Annual Report 2013/14
Continuously optimizing our global footprint
Our size and global footprint, vertical integration and “focused” factory approach 1, give us valuable competitive advantages. To maintain our position, we further invested in our Operations & Supply Chain.
Our cost competitiveness is an important reason why our customers outsource the capital-intensive parts of their chocolate production to the Barry Callebaut Group. Through continuous operational improvements at our currently 35 chocolate & specialties and 16 cocoa factories worldwide, we aim to reduce overall manufactur-ing costs per tonne by 2% every year. On a like-for-like basis, the factory perfor-mance improved by 0.6% this year.
We also continued to make progress in terms of energy savings. Once again, we used 2% less energy per tonne of activity on a comparable basis.
In fiscal year 2013/14, capacity utilization of the Barry Callebaut Group in choco-late was 87% (target: 82–85%) and in cocoa processing 84% (target: 90–92%).
We further invested in our manufacturing footprint to eliminate existing capacity constraints. In total, we approved around CHF 80 million in major upgrades or capacity extensions in 13 existing factories, with a focus on Western Europe. More-over, we built a new chocolate factory in Paine, close to Santiago de Chile. We enlarged and relocated our Japanese activities to a newly built facility in Takasaki, and opened our first factory in Turkey. Overall, we invested around CHF 190 mil-lion in CAPEX to be prepared for additional growth.
1 The Barry Callebaut Group has a “focused” factory approach: Standard products are made close to our customers and are interchangeable among sites. Specialty products are centralized in a limited number of sites, allowing us to limit complexity per site and achieve scale effects.
Additional information:s.a. Environment chapter, page 46.

38
InnovationBarry CallebautAnnual Report 2013/14
Creating competitive advantages to enable further profitable growth
The focus on bigger and bolder innovation projects showed first results: Our project success rate increased to a new record high of 59%. With more than 20 new product introductions, we proved to be the industry reference for innovation – for individual artisans and food manufacturers alike.
The worldwide rollout of “Purity from Nature”, a new generation of Cacao Barry® couverture chocolate based on our own Controlled Fermentation method, was one of our most successful product launches in the Gourmet area. It is a perfect example of our ability to combine our comprehensive scientific knowledge with evolving customer requirements.
Further, we launched many new products ranging from chocolates with longer shelf life (Anti-Bloom Barrier to avoid fat bloom), to reformulated chocolates (such as sugar-/fat-reduced products) all the way to inclusions with multi-flavor or multi-texture sensations.
The European Food Safety Authority published a positive Scientific Opinion in May to also extend our health claim to cocoa extract products. Upon final approval by the EU Commission, we will be allowed to offer new applications in which the beverages, nutraceutical and supplement industries are already showing strong interest.
To strengthen our leadership position, we expanded the cooperation with the Jacobs University and launched the six-year project COMETA. It is aimed at pre-cisely analyzing and classifying the 100,000 chemical components of the cocoa bean. The knowledge gained will be used to develop new quality tests for our most important raw material. In addition, we extended our strategic cooperations by starting new Open Innovation projects with universities, research institutes, labs and scientists, including our customers and suppliers.
Additional information:www.barry-callebaut.com/innovation

We combine trend insights from around the
world, with science and knowledge to create a full
pipeline of novel chocolate and cocoa products.
Our goal is to help our customers grow
their business through differentiation, while meeting the needs of
today’s and – particularly – tomorrow’s consumers.

41
SustainabilityBarry Callebaut
Annual Report 2013/14
Our approach to Sustainability
Sustainability is about generating value for our business as well as for all our stakeholders – producers, suppliers, customers, shareholders, employees and communities.
With the integration of the acquired cocoa business, the Barry Callebaut Group is now the world’s leading chocolate and cocoa company. As our business grows, expectations rise, too.
Our sustainability strategy addresses our three main areas of impact: sustain-able cocoa, environmental protection and employee development.
Due to the importance of cocoa as a raw material, we made Sustainable Cocoa the fourth pillar of our growth strategy, alongside Expansion, Innovation and Cost Leadership. Working together with stakeholders, we aim to make cocoa farming a profitable livelihood today and for future generations. At the same time, we aim to secure the volumes and quality of cocoa needed for our growth while meeting the growing demand among customers and consumers for responsibly produced chocolate.
Our environmental protection programs focus on reducing the impacts of our production and transport. Since carbon emissions from our operations form the largest part of our environmental footprint, this is our primary focus.
Our employees are the actors of our business success, and are also key in implementing sustainability initiatives successfully. We develop and promote them, so that they can fulfill their potential. We also offer a workplace that is fair, safe and positive.
Our commitment to sustainability is enshrined in the Barry Callebaut Group Code of Conduct. In addition, our values guide how we do business and are the basis of how we engage in our sustainability initiatives.
This section highlights the key sustainability activities and achievements for fiscal year 2013/14. Further details on our CSR indicators can be found in the 2013/14 GRI report available online. Our Governance is also described in the Sustainability Report 2012/13.
Additional information:www.barry-callebaut.com/csrwww.barry-callebaut.com/codeofconduct

42
Sustainable cocoa: increased productivity for a better life
Cocoa is typically produced by smallholder farmers in remote equatorial areas. Most of the world’s cocoa volume comes from West Africa, the area that faces the industry’s most vital sustain-ability challenges.
The demand for cocoa grows year-on-year, while cocoa production worldwide re-mains relatively flat. To safeguard the future of cocoa, we must make cocoa farming more attractive and profitable to farmers.
Our approach to sustainable cocoaOur mission is to improve the livelihoods of cocoa farmers and their communities through the promotion of sustainable, entrepreneurial farming, improved produc-tivity, and community development.
The Barry Callebaut Group believes that cocoa production is sustainable when farmers:• earn an equitable income;• engage in responsible labor practices;• safeguard the environment; and• can provide for the basic health and education needs and well-being of their families.
Additional information:www.qualitypartnerprogram.com www.barry-callebaut.com/qualitypartnerprogramwww.barry-callebaut.com/cocoa-horizonss.a. Cocoa Sustainability Report 2013/14
SustainabilityBarry CallebautAnnual Report 2013/14

43
Cocoa Horizons Cocoa Horizons is our 10-year, CHF 40 million initiative launched in 2012 to im-prove farm productivity. The Barry Callebaut Group’s cocoa sustainability team comprises 58 colleagues globally, of which 35 are in Côte d’Ivoire alone. It includes trainers, ecologists, agronomists, geographers, controllers, and auditors. The team works with cooperatives to organize training and support for their farmers and their communities.
BiolandsThe Biolands Group, as a direct sourcing and farm services entity, is dedicated to sourcing sustainably produced cocoa beans from 63,000 farmers across Tanzania, Sierra Leone, and Côte d’Ivoire. It works directly with farmers and village coordi-nators to provide training, inputs such as fertilizers, financial services, support and assistance in the production of certified cocoa. Biolands applies a bottom-up co-operation model, working with smallholder farmers to ensure fair prices are paid to the farmers and to improve cocoa quality, yields, and farmer livelihoods. This farmer-centric, village-to-port approach enables full traceability for every bag of cocoa.
CocoaActionCocoaAction is an unprecedented industry strategy to modernize the cocoa sector, announced in May 2014. This platform has been developed by the world’s leading cocoa and chocolate companies committed to rejuvenating the cocoa sector under the umbrella of the World Cocoa Foundation. It outlines a set of actions to provide cocoa farmers with a combination of productivity enhancements and community development interventions. We are one of the 12 founding members of Cocoa- Action.
CHOCOVISION 2014Together with industry partners, the Barry Callebaut Group has organized the second CHOCOVISION, the only business-for-business conference in the cocoa value chain in June 2014. It brought together nearly 200 key stakeholders from around the world, from the cocoa farmer to the consumer. Industry leaders pre-sented the CocoaAction program to the other stakeholders in the cocoa and choco-late industry and confirmed their ambition to rejuvenate cocoa farming, starting with the two largest cocoa producers, Côte d’Ivoire and Ghana.
SustainabilityBarry Callebaut
Annual Report 2013/14
44
SustainabilityBarry CallebautAnnual Report 2013/14
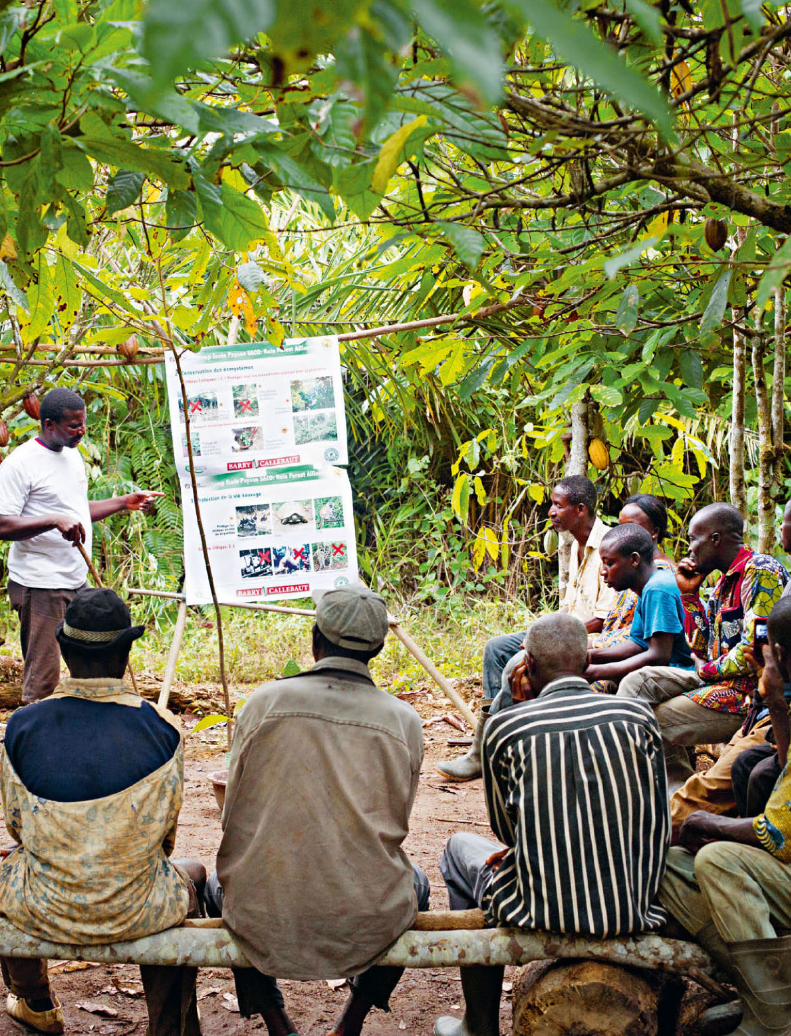
Improving farmer practicesThe future of the cocoa sector depends on the improvement of productivity on cocoa farms. In order to disseminate good agricultural practices to the many farm-ers spread across the cocoa growing areas of Côte d’Ivoire, we have put in place a robust training infrastructure.
Our Cocoa Center of Excellence trains the trainers who teach good agricul-tural practices at hundreds of farmer field schools. In addition to the training facility, the center has a tree nursery, a composting facility, and ten demonstration plots to show optimal farm management practices, including advanced techniques for increasing crop yields and quality.
During fiscal year 2013/14, we conducted 550 farmer field schools, 496 in Côte d’Ivoire and 54 in Cameroon. In addition, we have set up 23 model farms which allow farmers to see best practices firsthand. These activities build on previous experiences of our Quality Partner Program and are aligned with CocoaAction.
Farmers who have applied the learning from our field schools and model farms can further develop the productivity of their farms through our Yield Enhancement Services (YES). These services cover a broad spectrum of topics including the use of fertilizers, provision of plant material, effective pest and disease management, and the importance of biodiversity.
Across all our programs, 99,000 farmers were trained in good agricultural practices.
Community developmentMany cocoa farmer families, especially in Africa, face enormous challenges in their daily lives, as their communities often lack basic infrastructure and social services. The economic and social development of cocoa communities is vital to ensuring a sustainable cocoa sector.
We work to improve access to education and foster the development of the next generation of cocoa farmers. In Cameroon, we built a three-room classroom block for 210 pupils. In Côte d’Ivoire, we funded the construction of a fourth class-room block at Akoupé College. Two primary schools are under construction that will bring the total across Côte d’Ivoire to 36 classrooms at 10 rural primary schools, enabling 1,800 children to attend school.
Ensuring that children are not harmed in cocoa production is fundamental, and we work to increase awareness of child labor issues in our farmer training and community sensitization activities, as well as active participation in industry-wide initiatives.

45
The Barry Callebaut Group aims to address the health needs of our communities, focusing on access to clean water and sanitation. In Ghana, we provided latrines with hand-washing facilities for 600 pupils at two junior high schools. We also offer assistance in health facilities and services. Our Biolands operations in Tanzania and Côte d’Ivoire support an innovative health insurance program for more than 45,000 registered farmers and their families.
The Barry Callebaut Group’s new Cocoa Horizons Truck is a multipurpose mobile unit that brings farmer training, education, awareness and medical attention to cocoa farming cooperatives and communities. By August 2014, the truck has traveled 6,618 km through 46 villages, reaching 21,127 people and providing medical attention to 2,644 individuals.
In total, 73,600 people were reached by our community development activities.
Sustainable cocoa productsCustomer demand for responsibly sourced cocoa continues to grow. To respond to customer requests for sustainable cocoa products, we offer either cocoa products from certified sources (mainly UTZ Certified and Rainforest Alliance) or cocoa products stemming from our own cocoa sustainability activities. In fiscal year 2013/14, the volume sourced from our sustainability programs amounted to about 84,000 tonnes; the total volume of sustainable cocoa and chocolate products sold was about 13% of our global sales volume.
The new Quality Partner ProgramThe Barry Callebaut Group established the Quality Partner Program in 2005 to enable farmers to grow cocoa in a sustainable and responsible way, increase yields, and improve farmer family livelihood through farmer training and improved access to education and basic healthcare services. Many industrial customers in Europe now use chocolate made with Quality Partner Program cocoa. Furthermore, all products under the Callebaut® Gourmet brand are made from Quality Partner Program cocoa, reaching hundreds of thousands of Gourmet customers worldwide.
Building on past experiences from this program, and integrating the height-ened expectations of our customers, we are reinforcing the specifications of Quality Partner Program chocolate to include eight activities. These are designed to drive cocoa farming sustainability.
More information can be found in our Cocoa Sustainability Report 2013/14, avail-able on our website.
SustainabilityBarry Callebaut
Annual Report 2013/14
SustainabilityBarry CallebautAnnual Report 2013/14
Environmental protection: reducing our carbon footprint
Our Environmental Policy defines our priorities for reducing envi-ronmental impacts of our operations. We focus on decreasing our energy usage and greenhouse gas emissions, and also work to improve water conservation, waste disposal and transport.
The integration of the aquired cocoa operations significantly impacted our environ-mental KPIs. As a consequence, our CO2 emissions jumped 34% to 304,418 tonnes, while the relative CO2 emissions per tonne of activity increased 25%. On a like-for-like basis, the CO2 emissions would have decreased 2%. The total energy use increased by 7% while the relative energy use per tonne of activity decreased 0.4%. We are improving key production processes, optimizing their energy use and installing more energy-efficient equipment.
Almost 20% of the energy we consume comes from renewable energy sources. In our factories in Ghana, Côte d’Ivoire, Cameroon and Brazil, we are using waste cocoa shells as biomass to fuel our production of steam. This reduces the gas or fuel consumption at those sites by up to 100%.
The Barry Callebaut Group participates in the Carbon Disclosure Project to measure and report carbon emissions using the Greenhouse Gas Protocol method-ology.
Water consumption is closely monitored at all our plants. Total water consump-tion increased 3%, while the relative water use per tonne of activity dropped 4%, just short of our target of a 5% annual reduction.
Waste reduction is integrated into our continuous improvement program “One+”. We focus on our main waste streams, since this is where the greatest improve-ment can be realized. We reduce the total amount of waste generated while seeking alternative uses for waste that cannot be avoided. Waste generation increased 2% in absolute terms and dropped 5% in relative terms.
We are working to reduce carbon emissions from transport, too, by optimizing the flow of raw materials and finished goods.
Additional information:s.a. Operations & Supply Chain, page 37
46

47
SustainabilityBarry Callebaut
Annual Report 2013/14
Employee development: enabling our workforce to grow
We promote talent and create a safe, fair, healthy and inspiring work environment in which our employees can develop, in order to fill more leadership positions from within.
As described under Employees (pages 22 – 23), the Barry Callebaut Group is committed to the development of its employees. We focus on responding to employees’ development needs via job enrichment, coaching and training.
A fair and safe workplaceThe Barry Callebaut Group is committed to providing equal employment and promotion opportunities to all our employees, and do not tolerate any form of discrimination. We support freedom of association in line with local laws and regu-lations. Approximately 60% of permanent contract employees are covered by a union or a collective bargaining agreement and 66% of the total workforce is represented in health & safety committees. In origin countries, we also offer HIV/AIDS education to employees and their families. In fiscal year 2013/14, the frequency rate of accidents dropped by 32% and the severity rate dropped by 29%.
In cocoa growing regions, our assistance programs provide a broad range of services to our employees, including medical care, transportation, housing and education:Coverage of employee support services in cocoa origin countries
Doctor/nurse on-site 55% Warm meals on factory premises 89%Medical exams 100% Home ownership opportunity 31%Vaccinations 79% Transportation to/from work site 46%HIV/AIDS education and support 46% Education support/school fees 47%Health insurance or other medical care 100% Sports activities 83%
Winning TogetherWe foster team spirit through programs that engage employees in active lifestyles and community development. Our global Winning Together initiative, set up in 2005, encourages employees to support our development activities in cocoa communities in origin countries. The focus of this year’s initiative, called “Water for Life…for All”, is to improve access to safe, clean water for farmer families.
Additional information:s.a. Employee, page 22–23


Financial Review
50 Interview with the CFO 53 Financial Review 56 Consolidated Financial Statements 133 Report of the Statutory Auditor on the Consolidated Financial Statements 134 5-Year Overview

50
Interview with the CFOBarry CallebautAnnual Report 2013/14
CFO’s view on Group performance
How do you rate the Group’s performance in fiscal year 2013/14?
Overall I am pleased: Our volume increased by 11.8%, mainly driven by the acquisition and reaching a new record level of 1.7 million tonnes. On a stand-alone basis, we grew slightly above the market. I am particularly satisfied with the effect of our increased focus on product margins, which translated into a significant improvement of our EBIT.
Does this mean that you can only achieve higher profit at the expense of lower volume growth?
In our company, we see three important growth drivers. However, two of these – outsourcing & strategic partner-ships and emerging markets – tend to be somewhat margin- dilutive. We have to offset this effect by pushing higher value products, in particular gourmet and specialty prod-ucts, and by striving for continuous efficiency improvements. Thanks to this, we were able in the past, on average, to grow our operating result in line with the volume. There are years when one of the components outperforms the other, but in the long run we focus on profitability while significantly outperforming the market growth.
“I am particu-larly satisfied with the effect of our increased focus on product margins, which translated into a significant improvement of our EBIT”. Victor Balli, Chief Financial Officer

51
Interview with the CFOBarry Callebaut
Annual Report 2013/14
Talking about the acquired cocoa business: Do you consider the integration a success, and where do you stand on the planned synergies of CHF 30–35 million by year 4 of the integration, i.e. at the end of fiscal year 2015/16?
The integration has been a key focus of our company over the last year, and we have managed to grow together as one company. We did not lose any key customer or key people, and we reached most of the major global milestones we targeted. In terms of synergies all related projects are progressing well, and we are continuing to look for more. For this year, we exceeded the targeted synergies of CHF 5 mil-lion. Also, largely in line with our initial business plan, the acquired business significantly contributed to our Group EBIT with CHF 26.7 million (excluding transaction and integration costs), despite very challenging cocoa product markets.
Could you give us an update on the impact of the combined cocoa ratio? Why did it perform worse than expected this fiscal year, and what is the expectation for next year?
The combined cocoa ratio is an indicator for the profitability of the cocoa pressing operations. We said at the beginning of this fiscal year that we expected the ratio to improve. However, the oversupply in the market, in particular for cocoa powder, and a slowdown in emerging markets drove cocoa powder prices to historically low levels. At the same time, cocoa butter prices increased significantly, keeping the combined ratio and therefore profitability flat, albeit at a low level. Recently, butter prices softened, but cocoa powder prices have not yet recovered. I therefore expect the cocoa result to remain below average for at least the first six months of the coming year.
While the profitability improved significantly, the cash flow did not follow. Why?
We had two important cash outflows: Once again, we invested in new factories and expanded existing ones to cope with growth way above the market and to prepare for future expansion, particularly in emerging markets. This year, the cocoa bean prices rose very strongly. Although the volumes in our inventories remained constant, despite the growth of the company, the average value of the products in stock was much higher. This resulted in a cash outflow at CHF 279 million for the increased working capital. Our possibilities to avoid such effects from price volatility are limited. However, we have long prepared the company for such a situation, and our strong balance sheet and ample credit lines allow us to operate in such markets without losing flexibility. Nonetheless, we will intensify the focus on free cash flow generation and CAPEX discipline in our company for the next year.

52
Interview with the CFOBarry CallebautAnnual Report 2013/14
What is your outlook for the coming year?
We are somewhat cautious on the global economy. We expect a slowdown in most regions. Higher raw material and therefore retail prices will likely affect confectionery consumption, at least at the beginning of the year. A very low combined cocoa ratio and fears about Ebola are not helping either. However considering the longer-term industry dynamics and based on our four-pillar strategy combined with our unique position in the industry, we remain optimistic for another good year in our business. Our main focus will be on volume expansion, margin improvements, high cost discipline, cash flow generation and the realization of the announced synergies within the cocoa business.
Could you elaborate on the higher cost discipline, what does it mean and why now?
During the last two years, we have significantly invested into new structures and expansions. This led to a double-digit growth of our fixed costs. This phase is now completed. Therefore, and also given a rather weak economic environment, we decided to keep overall fixed costs at the prior year level. We will put special emphasis on becoming more efficient and standardized in our processes to make more with less.

53
Consolidated Income StatementExplanatory comments to the Consolidated Financial Statements: On June 30, 2013, the Group closed the acquisition of the Cocoa Ingredients Division from Petra Foods Ltd., Singapore (referred to hereinafter as “acquired cocoa business”). The Consolidated Financial Statements of the fiscal year 2012/13 and of the fiscal year under review contain one-off transaction costs related to this acquisition as well as the operating results since its completion. For comparability reasons, certain key figures are provided excluding these effects (i.e. “stand-alone”).
In the fiscal year under review, the Group adopted the revised IAS 19 standard (Employee Benefits). It was applied for the first time retrospectively in compliance with the transitional provisions and affected the Consolidated Income Statement, the Consolidated Statement of Comprehensive Income, the Consolidated Balance Sheet and the Consolidated Cash Flow Statement. The retrospective application resulted in the restatement of certain comparative figures.
Sales volume grew significantly by 11.8% from 1,535,662 tonnes to 1,716,766 tonnes (stand-alone by 2.9% to 1,541,654 tonnes). Whereas Region Europe’s volume slightly declined, all other Regions and all Product Groups contributed to this growth.
Revenue from sales and services rose even faster than sales volume, by 20.1% (stand-alone 10.0%) from CHF 4,884.1 million to CHF 5,865.9 million. This is the result of higher average cocoa ingredient prices, which are largely passed on to customers in accordance with the Group’s business model. Adjusted for currency translation effects, revenues from sales and services grew by 23.4% (stand-alone 13.0%).
Gross profit augmented by 18.2% from CHF 728.7 million to CHF 861.1 million (excl. translation effects up 20.7%). On a stand-alone basis, gross profit increased by 10.6%. Despite the continuously low combined cocoa ratio, gross profit showed stronger growth than volume as a result of the Group’s continued focus on margins and on improving its product mix towards more specialties and Gourmet products. Gross profit per tonne increased from CHF 475 in prior year to CHF 502 (stand-alone it increased from CHF 492 to 529).
Marketing and sales expenses grew by 13.2% to CHF 121.0 million compared to CHF 106.8 million last year. The increase is mainly due to the ongoing strengthening of the Group’s global Gourmet brands and to its focus on customer relationships as well as on the further expansion of the distribution and sales network in emerging markets and in the Gourmet business. Marketing and sales expenses also increased as a result of the Group’s acquisitions and its general growth.
General and administration expenses amounted to CHF 329.8 million compared to CHF 283.1 million in prior year, up 16.5%. The increase stems from scope effects related to acquisitions and from the continuation of investments in processes, structures and emerging markets. In addition to effects from the general growth of the Group, the increase also includes a one-time effect related to the Group’s long term incentive plan.
Other income of CHF 18.2 million was recorded, compared to CHF 14.8 million in the prior year. In both years, this position included operating as well as non-sales-related income items, such as income generated by the Group’s Training Center, Schloss Marbach, claims related to insurance companies and suppliers, sales of waste products and some other smaller items.
Other expenses amounted to CHF 12.3 million compared to CHF 10.6 million in the prior year. This position comprises litigation and claims, restructuring and severance costs, impairment charges and some other non-recurring items.
Financial ReviewBarry Callebaut
Annual Report 2013/14
54
Operating profit (EBIT) increased by 21.4% to CHF 416.2 million (23.9% in local currencies), compared to CHF 342.9 million in the prior year. Stand-alone – i.e. excluding the non-recurring, transaction-related costs and the operating results of the acquired cocoa business, which contributed the net amount of CHF 23.4 million to operating profit (EBIT) – EBIT grew 5.6% (7.6% in local currencies). In prior year, the acquired business impacted EBIT by CHF –29.2 million, including significant transaction costs and an operating loss. All Regions and Product Groups contributed positively to operating profit and to EBIT growth of both the Group and the stand-alone business. The largest absolute contribution to EBIT, in terms of geographical area, came from Region Europe and, in terms of Product Group, from Food Manufacturers Products. Global Cocoa was the biggest contributor to EBIT growth thanks to the acquired cocoa business followed by Region Americas. EBIT per tonne increased from CHF 223.4 to CHF 242.4 (stand-alone it increased from CHF 248.3 to CHF 254.8).
Finance income decreased from CHF 14.8 million in prior year to CHF 3.2 million as a result of the absence of the significant hedging gains and exchange results, which affected prior year.
Finance costs amounted to CHF 122.0 million, up from CHF 92.6 million in prior year mainly due to increased interest expenses. The increase is largely attributable to the additional debt assumed for the aforementioned acquisition, including a USD 400 million bond issuance and to increased financing requirements for the net working capital resulting primarily from higher cocoa bean prices.
Share of result of equity-accounted investees, net of tax amounted to CHF –0.1 million compared to CHF 0.0 million in prior year. The position comprises the Group’s share in equity movements of participations in companies over which the Group has significant influence but not control.
Income tax expenses increased from CHF 35.5 million to CHF 42.4 million largely due to the higher profit before tax and, to some extent, due to the adverse effects from the mix of jurisdictions in which the taxable results were achieved. These negative effects were partly offset by an increase of tax deductible expenses not qualifying as expenses for IFRS purposes.
Net profit for the year from continuing operations increased from CHF 229.5 million in prior year by 11.1% to CHF 255.0 million. In local currencies, it grew by 12.3%.
Net result from discontinued operations amounted to CHF –6.7 million in prior year and mainly included the operational result and financial and income tax expenses of the disposed Dijon business up until completion of the transaction. During the financial year under review, no operations were discontinued or disposed.
Net profit for the year (including discontinued operations) amounted to CHF 255.0 million, compared to CHF 222.8 million in prior year. Net profit for the year attributable to the shareholders of the parent company amounted to CHF 252.4 million, compared to CHF 223.5 million in the preceding year.
Basic earnings per share (from continuing operations) increased by 4.6% to CHF 46.00, compared to CHF 43.98 last year. Cash earnings per share, defined as operating cash flow before working capital changes divided by the weighted average number of basic shares outstanding, rose slightly to CHF 86.34 from CHF 86.21 the year before.
Consolidated Balance Sheet and financing structureTotal assets at the end of August 2014 grew by 14.2% to CHF 5,167.5 million, compared to CHF 4,526.9 million at the end of last year. This increase is mainly due to the strong increase in the cocoa bean price resulting in higher working capital and derivative financial assets and, to a lesser extent, due to the Group’s organic business growth and its investments in property, plant and equipment.
Financial ReviewBarry CallebautAnnual Report 2013/14

55
Net working capital increased by 24.4% to CHF 1,674.6 million as at August 31, 2014, compared to CHF 1,345.7 million the year before, primarily due to the higher cocoa bean price strongly affecting product values in inventories and receivables.
Net debt increased from CHF 1,525.2 million in the prior year to CHF 1,803.5 million at August 31, 2014. This again is mainly attributable to additional financing needs for the increased working capital and, to some extent, to investments in property, plant and equipment. The weighted average maturity of the Group’s total debt portfolio declined from 6.3 to 5.3 years.
Equity – including equity attributable to the shareholders of the parent company and non-controlling interests – amounted to CHF 1,795.7 million. This represents an increase of CHF 109.4 million, compared to the CHF 1,686.3 million at the end of August 2013. Equity attributable to the shareholders of the parent company amounted to CHF 1,790.7 million compared to last year’s CHF 1,682.5 million. The prior year’s amounts have been restated due to the first time adoption of the revised IAS 19 – Employee Benefits. The increase versus prior year is mainly due to the net profit, partly offset by the payout to shareholders out of reserves from capital contributions, by currency translation adjustments, by the remeasurement of employee benefit obligations related to the current fiscal year going through equity due to the revised IAS 19, as well as some other items.
Despite the aforementioned overall increase in equity, the debt-to-equity ratio deteriorated from 90.6% to 100.7% due to higher financing requirements for the increased working capital and due to the Group’s growth and its investments in property, plant and equipment. The solvency ratio decreased from 37.2% to 34.7%. The return on invested capital (ROIC) decreased slightly from 10.9% in the prior year to 10.5%.
Consolidated Cash Flow StatementOperating cash flow before working capital changes increased to CHF 473.7 million from CHF 451.1 million in the prior year as a result of the higher operating result. Cash outflow for working capital changes amounted to CHF –279.4 million, compared to CHF –52.0 million in prior year. This is the result of significantly increased working capital due to higher cocoa bean prices and, to a lesser extent, of business growth. Cash outflow for interest was higher due to the increased financing requirements in light of the financing of the acquisition in prior year. Cash outflow for tax was slightly higher as well. Overall, this resulted in a decline in the Net cash flow from operating activities to CHF 52.4 million compared to CHF 293.1 million the year before.
Net cash flow from investing activities amounted to CHF –226.8 million, compared to CHF –1,071.3 million in the preceding year. Last year’s amount was particularly affected by the cash outflow for the acquired cocoa business and two smaller business acquisitions. Similar to last year, the Group made significant investments in property, plant and equipment as well as in intangible assets in the amount of CHF –248.8 million (prior year CHF –223.5 million). The overall position also includes proceeds from the sale of deposits of CHF 14.4 million and proceeds from the sale of assets amounting to CHF 4.9 million (CHF 6.3 million in prior year) as well as some other minor items.
Net cash flow from financing activities amounted to CHF 192.3 million compared to CHF 810.1 million in prior year. The net inflow of the current year mainly stems from the net debt issue of CHF 291.4 million. The prior year cash flow amounted to a net debt issue of CHF 629.6 million, including the issuance of a USD 400 million bond. Additionally, there was a capital increase of CHF 273.1 million last year. Both measures were mainly undertaken to finance the purchase consideration of the acquired cocoa business. Furthermore, this position also includes the dividend distributed to shareholders in the amount of CHF –79.6 million out of paid-in capital reserves (prior year CHF –80.1 million partly out of paid-in capital reserves and partly from a share capital reduction). The cash outflow for the purchase of treasury shares amounted to CHF –18.6 million (prior year CHF –12.3 million).
Financial ReviewBarry Callebaut
Annual Report 2013/14

56
Consolidated Income Statement
for the fiscal year ended August 31, 2013/14 2012/13in thousands of CHF Notes restated1
Revenue from sales and services 5,865,940 4,884,090
Cost of goods sold (5,004,815) (4,155,416)Gross profit 861,125 728,674
Marketing and sales expenses (120,955) (106,847)General and administration expenses (329,842) (283,136)Other income 6 18,189 14,802Other expenses 7 (12,272) (10,639)Operating profit (EBIT) 416,245 342,8542
Finance income 8 3,246 14,750Finance costs 9 (121,964) (92,591)Share of result of equity-accounted investees, net of tax 17 (119) (49)Profit before income taxes 297,408 264,964
Income tax expenses 10 (42,410) (35,508)
Net profit from continuing operations 254,998 229,456
Net loss from discontinued operations, net of tax 2 – (6,691)
Net profit for the year 254,998 222,765 of which attributable to: – shareholders of the parent company 252,383 223,452 – non-controlling interest 25 2,615 (687)
Earnings per share from continuing and discontinued operations Basic earnings per share (CHF/share) 46.00 42.70 Diluted earnings per share (CHF/share) 45.77 42.50
Earnings per share from continuing operations 3
Basic earnings per share (CHF/share) 11 46.00 43.98 Diluted earnings per share (CHF/share) 11 45.77 43.771 Following the revision of IAS 19 (Employee Benefits), certain comparatives have been restated to conform to the current period’s presentation.2 Thereof CHF –29.2 million related to non-recurring acquisition costs and operating result of the Cocoa Ingredients Division acquired from Petra Foods Ltd.
and CHF 372.1 million related to Barry Callebaut Group stand-alone, i.e. before acquisition.3 Based on the net profit from continuing operations attributable to the shareholders of the parent company.
Consolidated Financial StatementsBarry CallebautAnnual Report 2013/14

57
Consolidated Statement of Comprehensive Income
for the fiscal year ended August 31, 2013/14 2012/13in thousands of CHF Notes restated1
Net profit for the year 254,998 222,765
Cash flow hedges 14 (11,567) 11,435Tax effect on cash flow hedges 14 2,765 (4,069)Currency translation differences (38,700) (18,462) thereof recycled into profit or loss related to divesture – 1,686Items that may be reclassified subsequently to the income statement (47,502) (11,096)
Remeasurement of defined benefit plans (16,936) (12,518)Tax effect on remeasurement of defined benefit plans 5,269 676Items that will never be reclassified to the income statement (11,667) (11,842)
Other comprehensive (loss)/income for the year, net of tax (59,169) (22,938)
Total comprehensive income for the year 195,829 199,827 of which attributable to: – shareholders of the parent company 193,570 200,586 – non-controlling interest 2,259 (759)1 Following the revision of IAS 19 (Employee Benefits), certain comparatives have been restated to conform to the current period’s presentation.
Consolidated Financial StatementsBarry Callebaut
Annual Report 2013/14

58
Consolidated Balance Sheet
Assetsas of August 31, 2014 2013 Sept 1, 2012in thousands of CHF Notes restated1 restated1
Current assetsCash and cash equivalents 85,496 65,618 53,898 Short-term deposits 2,152 16,741 659 Trade receivables and other current assets 12 793,784 777,036 570,167 Inventories 13 1,762,114 1,446,387 1,108,171 Current tax assets 12,336 4,934 4,737 Derivative financial assets 14 336,029 144,286 414,183 Total current assets 2,991,911 2,455,002 2,151,815
Non-current assetsProperty, plant and equipment 15 1,178,529 1,085,740 799,758 Equity-accounted investees 17 1,094 5,088 4,573 Intangible assets 18 893,848 882,785 526,525 Deferred tax assets 19 94,974 88,191 87,043 Other non-current assets 7,158 10,106 6,694 Total non-current assets 2,175,603 2,071,910 1,424,593 Total assets 5,167,514 4,526,912 3,576,408
Liabilities and equity as of August 31, 2014 2013 Sept 1, 2012in thousands of CHF Notes restated1 restated1
Current liabilitiesBank overdrafts 20 17,559 14,311 34,287 Short-term debt 20 457,551 229,764 117,277 Trade payables and other current liabilities 21 891,263 793,954 657,605 Current tax liabilities 34,073 32,059 38,282 Derivative financial liabilities 14 322,856 188,974 362,359 Provisions 22 8,635 12,185 12,216 Current liabilities without liabilities directly associated with assets held for sale 1,731,937
1,271,247
1,222,026
Liabilities directly associated with assets held for sale 2 – – 25,292 Total current liabilities 1,731,937 1,271,247 1,247,318
Non-current liabilitiesLong-term debt 23 1,416,060 1,363,460 845,904 Employee benefit obligations 24 146,993 132,555 116,390Provisions 22 7,701 5,055 2,565 Deferred tax liabilities 19 59,664 58,983 53,065 Other non-current liabilities 9,424 9,347 17,590 Total non-current liabilities 1,639,842 1,569,400 1,035,514 Total liabilities 3,371,779 2,840,647 2,282,832
Equity Share capital 25 102,093 102,093 125,114 Retained earnings and other reserves 1,688,557 1,580,429 1,163,800 Total equity attributable to the shareholders of the parent company 1,790,650 1,682,522 1,288,914Non-controlling interest 25 5,085 3,743 4,662 Total equity 1,795,735 1,686,265 1,293,576 Total liabilities and equity 5,167,514 4,526,912 3,576,408
1 Following the revision of IAS 19 (Employee Benefits), certain comparatives have been restated to conform to the current period’s presentation.
Consolidated Financial StatementsBarry CallebautAnnual Report 2013/14

59
Consolidated Cash Flow Statement
Cash flows from operating activitiesfor the fiscal year ended August 31, 2013/14 2012/131
in thousands of CHF Notes restated2
Profit before income taxes from continuing operations 297,408 264,964(Loss)/Profit before income taxes from discontinued operations 2 – (5,250)Adjustments for: Depreciation of property, plant and equipment 15 83,270 70,299 Amortization of intangible assets 18 31,934 25,145 Impairment of property, plant & equipment 15 10 69 Impairment of intangible assets 18 792 767 Loss/(gain) on sale of property, plant and equipment, net (1,087) 106 Foreign exchange (gain)/loss (17,731) 33,780 Fair value (gain)/loss on derivative financial instruments (53,197) (22,285) Write-down of inventories 8,174 4,742 Increase (decrease) of bad debt allowance (166) (4,852) Increase (decrease) of provisions 2,640 (4,715) Increase (decrease) of employee benefit obligations (914) (749) Equity-settled share-based payments 4 12,791 12,332 Share of loss/(profit) of equity-accounted investees, net of tax 17 119 49 (Interest income) 8 (1,734) (540) Interest expenses 111,396 77,245 Operating cash flow before working capital changes 473,705 451,106
(Increase)/decrease in trade receivables and other current assets (32,722) (81,936)(Increase)/decrease in inventories (357,390) (20,954) Increase/(decrease) in trade payables and other current liabilities 114,534 58,470Use of provisions (3,784) (7,588)Cash generated from operating activities 194,343 399,098
(Interest paid) (98,947) (69,004)(Income taxes paid) (42,998) (37,023)Net cash from operating activities 52,398 293,071
1 The Cash Flow Statement includes the cash flow from discontinued operations.2 Following the revision of IAS 19 (Employee Benefits), certain comparatives have been restated to conform to the current period’s presentation.
Consolidated Financial StatementsBarry Callebaut
Annual Report 2013/14

60
Consolidated Cash Flow Statement
Cash flows from investing activitiesfor the fiscal year ended August 31, 2013/14 2012/131
in thousands of CHF Notes restated2
Purchase of property, plant and equipment 15 (209,853) (182,582)Proceeds from sale of property, plant and equipment 4,515 6,315 Purchase of intangible assets 18 (38,924) (40,901)Proceeds from sale of intangible assets 347 10Acquisition of subsidiaries/businesses net of cash acquired 1 (1,815) (823,180)Proceeds from disposal of subsidiaries 2 – (14,789)Proceeds from disposal of financial assets 253 –Purchase of short-term deposits – (16,092)Proceeds from sale of short-term deposits 14,364 –Sale/(Purchase) of other non-current assets 2,607 (607)Interest received 1,741 523Net cash flow from investing activities (226,765) (1,071,303)
Cash flows from financing activitiesfor the fiscal year ended August 31, 2013/14 2012/131
in thousands of CHF Notes restated2
Proceeds from the issue of short-term debt 409,709 121,788Repayment of short-term debt (196,046) (14,878)Proceeds from the issue of long-term debt 227,305 523,862 Repayment of long-term debt (149,553) (1,209)Dividend payment 25 (79,588) (51,165)Capital reduction and repayment 25 – (28,942)Proceeds from capital increase 25 – 273,121Purchase of treasury shares 25 (18,645) (12,324)Dividends paid to non-controlling interests 25 (917) (129)Effect of changes in non-controlling interests 25 – (31)Net cash flow from financing activities 192,265 810,093
Effect of exchange rate changes on cash and cash equivalents (1,268) (165) Net increase (decrease) in cash and cash equivalents 16,630 31,696
Cash and cash equivalents at beginning of year 51,307 19,611 Cash and cash equivalents at end of year 67,937 51,307 Net increase (decrease) in cash and cash equivalents 16,630 31,696
Cash and cash equivalents 85,496 65,618Bank overdrafts 20 (17,559) (14,311)Cash and cash equivalents as defined for the cash flow statement 67,937 51,307 1 The Cash Flow Statement includes the cash flow from discontinued operations.2 Following the revision of IAS 19 (Employee Benefits), certain comparatives have been restated to conform to the current period’s presentation.
Consolidated Financial StatementsBarry CallebautAnnual Report 2013/14

61
Consolidated Statement of Changes in Equity
Attributable to the shareholders of the parent company
Share
capital
Treasury
shares
Retained earnings
Hedging reserves
Cumulative translation
adjustments
Total
Non- controlling
interest
Total
equity
in thousands of CHF
as of September 1, 2012, (as previously reported) 125,114 (2,773) 1,621,701 (5,545) (381,410) 1,357,087 4,662 1,361,749Impact of changes in accounting policies, net of tax1 – – (68,173) – – (68,173) – (68,173)as of September 1, 2012, restated 125,114 (2,773) 1,553,528 (5,545) (381,410) 1,288,914 4,662 1,293,576Currency translation adjustments – – – – (18,390) (18,390) (72) (18,462)Effect of cash flow hedges (note 14) – – – 11,435 – 11,435 – 11,435Tax effect on cash flow hedges (note 14) – – – (4,069) – (4,069) – (4,069)Items that may be reclassified subsequently to the income statement – – – 7,366 (18,390) (11,024) (72) (11,096)Remeasurement of defined benefit plans (note 24)1 – – (12,518) – – (12,518) – (12,518)Tax effect on remeasurement of defined benefit plans (note 19)1 – – 676 – – 676 – 676Items that will never be reclassified tothe income statement – – (11,842) – – (11,842) – (11,842)Other comprehensive income, net of tax – – (11,842) 7,366 (18,390) (22,866) (72) (22,938)Net profit for the year1 – – 223,452 – – 223,452 (687) 222,765Total comprehensive income for the year – – 211,610 7,366 (18,390) 200,586 (759) 199,827Dividend to shareholders (note 25) – – (51,165) – – (51,165) (129) (51,294)Capital reduction and repayment (note 25) (28,952) – 10 – – (28,942) – (28,942)Movements of non-controlling interest (note 25) – – – – – – (31) (31)Capital increase (note 25) 5,931 – 267,190 – – 273,121 – 273,121Purchase of treasury shares – (12,324) – – – (12,324) – (12,324)Equity-settled share-based payments (note 4) – 11,771 561 – – 12,332 – 12,332as of August 31, 2013 102,093 (3,326) 1,981,734 1,821 (399,800) 1,682,522 3,743 1,686,265
Currency translation adjustments – – – – (38,344) (38,344) (356) (38,700)Effect of cash flow hedges (note 14) – – – (11,567) – (11,567) – (11,567)Tax effect on cash flow hedges (note 14) – – – 2,765 – 2,765 – 2,765Items that may be reclassified subsequently to the income statement – – – (8,802) (38,344) (47,146) (356) (47,502)Remeasurement of defined benefit plans (note 24) – – (16,936) – – (16,936) – (16,936)Tax effect on remeasurement of defined benefit plans (note 19) – – 5,269 – – 5,269 – 5,269Items that will never be reclassified tothe income statement – – (11,667) – – (11,667) – (11,667)Other comprehensive income, net of tax – – (11,667) (8,802) (38,344) (58,813) (356) (59,169)Net profit for the year – – 252,383 – – 252,383 2,615 254,998Total comprehensive income for the year – – 240,716 (8,802) (38,344) 193,570 2,259 195,829Dividend to shareholders (note 25) – – (79,588) – – (79,588) (917) (80,505)Purchase of treasury shares – (18,645) – – – (18,645) – (18,645)Equity-settled share-based payments (note 4) – 10,533 2,258 – – 12,791 – 12,791as of August 31, 2014 102,093 (11,438) 2,145,120 (6,981) (438,144) 1,790,650 5,085 1,795,7351 Following the revision of IAS 19 (Employee Benefits), certain comparatives have been restated to conform to the current period’s presentation.
Consolidated Financial StatementsBarry Callebaut
Annual Report 2013/14

62
Summary of Accounting Policies
Organization and business activityBarry Callebaut AG (“The Company”) was incorporated on December 13, 1994, under Swiss law, having its head office in Zurich, Switzer land, at Pfingstweidstrasse 60. Barry Callebaut AG is registered in Switzerland and has been listed on the SIX Swiss Exchange (BARN, ISIN Number: CH0009002962) since 1998. As of August 31, 2014, Barry Callebaut’s market capitalization based on issued shares was CHF 6,175 million (August 31, 2013: CHF 4,805 million). The Group’s ultimate parent is Jacobs Holding AG with a share of 50.11% of the shares issued (August 31, 2013: 50.11%).
Barry Callebaut AG and its subsidiaries (“The Group”) is one of the world’s leading cocoa and chocolate companies, serving the entire food industry, from food manufacturers to artisans and professional users of chocolate such as chocolatiers, pastry chefs or bakers, and products for vending machines. The Group offers a broad and expanding range of chocolate and other cocoa-based products with numerous recipes. It also provides a comprehensive range of services in the fields of product development, processing, training and marketing. The Group is fully vertically integrated along the entire value chain: from sourcing of raw materials to the production of the finest chocolate products.
The principal brands under which the Group operates are Barry Callebaut, Callebaut, Cacao Barry, Carma, Van Leer and Van Houten for chocolate products; Barry Callebaut, Bensdorp, Delfi, Van Houten and Chadler for cocoa powder and Bensdorp, Van Houten, Caprimo, Le Royal and Ögonblink for vending mixes.
The principal countries, in which the Group operates, include Belgium, Brazil, Cameroon, Canada, China, Côte d’Ivoire, France, Germany, Ghana, Indonesia, Italy, Japan, Malaysia, Mexico, the Netherlands, Poland, Russia, Singapore, Spain, Sweden, Switzerland, the United Kingdom and the USA.
Basis of presentationThe Consolidated Financial Statements of the Group have been prepared in accordance with International Financial Reporting Standards (IFRS) and comply with Swiss law.
For consolidation purposes, Barry Callebaut AG and its sub sidiaries prepare financial statements using the historical cost basis as disclosed in the accounting policies below, except for the measurement at fair value of derivative financial instruments and for defined benefit obli gation that is accounted for according to the projected unit credit method.
Changes in accounting policiesExcept for the changes below, the Group has consistently applied the accounting policies set out below to all periods presented in these Consolidated Financial Statements.
The Group has adopted the following amendments to standards, including any consequential amendments to other standards, with a date of initial application of September 1, 2013:
Consolidated Financial StatementsBarry CallebautAnnual Report 2013/14

63
Amendments to IAS 19 – Employee Benefits (amended 2011)The revised IAS 19 standard has eliminated the corridor method that was applied by the Group before fiscal year 2013/14. Based on the amendments, all changes in the present value of the defined benefit obligation and in the fair value of the plan assets are recognized in the financial statements immediately in the period they occur. Any movements in actuarial gains and losses are recognized through other comprehensive income.
The amendments have also replaced the expected return on plan assets and the interest cost on the defined benefit obligation with a single net interest component that is calculated by applying the discount rate to the net defined benefit liability (or asset).
It was applied for the first time retrospectively in compliance with the transitional provisions and affected the Consolidated Income Statement, the Consolidated Statement of Comprehensive Income, the Consolidated Balance Sheet and the Consolidated Cash Flow Statement. The retrospective application resulted in the restatements summarized in the tables below.
Consolidated Income statementfor the fiscal year ended August 31, 2013 as originally
publishedRestatement
IAS 19restated
in thousands of CHF
Cost of goods sold (4,155,638) 222 (4,155,416)Marketing and sales expenses (106,918) 71 (106,847)General and administration expenses (284,528) 1,392 (283,136)Other expenses (12,168) 1,529 (10,639)Operating profit (EBIT) 339,640 3,214 342,854Finance costs (89,583) (3,008) (92,591)Profit before income taxes 264,758 206 264,964Net profit from continuing operations 229,250 206 229,456Net profit for the year 222,559 206 222,765Basic earnings per share from continuing operations (CHF/share) 43.94 0.04 43.98
Consolidated Statement of Comprehensive Incomefor the fiscal year ended August 31, 2013 as originally
publishedRestatement
IAS 19restated
in thousands of CHF
Net profit for the year 222,559 206 222,765
Remeasurement of defined benefit plans – (12,525) (12,525)Tax effect on remeasurement of defined benefit plans – 683 683Items that will never be reclassified to the income statement – (11,842) (11,842)Other comprehensive income / (loss) for the year (11,096) (11,842) (22,938)Total comprehensive income for the year 211,463 (11,636) 199,827 of which attributable to the shareholders of the parent company 212,222 (11,636) 200,586
Consolidated Financial StatementsBarry Callebaut
Annual Report 2013/14

64
Consolidated Balance Sheetas of September 1, 2012 as originally
publishedRestatement
IAS 19restated
in thousands of CHF
Deferred tax assets 87,093 (50) 87,043Other non-current assets 6,864 (170) 6,694Total non-current assets 1,424,813 (220) 1,424,593Total assets 3,576,628 (220) 3,576,408
Employee benefit obligations 47,526 68,864 116,390Deferred tax liabilities 53,976 (911) 53,065Total non-current liabilities 967,561 67,953 1,035,514Total liabilities 2,214,879 67,953 2,282,832
Retained earnings and other reserves 1,231,973 (68,173) 1,163,800Total equity attributable to the shareholders of the parent company
1,357,087 (68,173) 1,288,914
Total equity 1,361,749 (68,173) 1,293,576Total liabilities and equity 3,576,628 (220) 3,576,408
Consolidated Balance Sheetas of August 31, 2013 as originally
publishedRestatement
IAS 19restated
in thousands of CHF
Deferred tax assets 88,245 (54) 88,191Other non-current assets 10,248 (142) 10,106Total non-current assets 2,072,106 (196) 2,071,910Total assets 4,527,108 (196) 4,526,912
Employee benefit obligations 51,351 81,204 132,555Deferred tax liabilities 60,574 (1,591) 58,983Total non-current liabilities 1,489,787 79,613 1,569,400Total liabilities 2,761,034 79,613 2,840,647
Retained earnings and other reserves 1,660,238 (79,809) 1,580,429Total equity attributable to the shareholders of the parent company
1,762,331
(79,809)
1,682,522
Total equity 1,766,074 (79,809) 1,686,265Total liabilities and equity 4,527,108 (196) 4,526,912
Consolidated Financial StatementsBarry CallebautAnnual Report 2013/14

65
Consolidated Cash Flow Statementfor the fiscal year ended August 31, 2013 as originally
publishedRestatement
IAS 19restated
in thousands of CHF
Profit before income taxes from continuing operations 264,758 206 264,964Non-cash items of income and expenses 186,348 (206) 186,142Operating cash flow before working capital changes 451,106 – 451,106Net cash flow from operating activities 293,071 – 293,071Net cash flow from investing activities (1,071,303) – (1,071,303)Net cash flow from financing activities 810,093 – 810,093Net increase (decrease) in cash and cash equivalents 31,696 – 31,696
The amendments to IAS 19 issued in November 2013 did not have any impact on the Group’s Financial Statements.
IFRS 10 – Consolidated Financial Statements (effective for periods beginning on or after January 1, 2013)IFRS 10 provides a single model to be applied in the control analysis for all investees, including entities that currently are in the scope of SIC-12. The Group is deemed to control a company when it is exposed, or has rights, to variable returns from its involvement with that company and has the ability to affect those returns through its power over the company. The consolidation procedures are carried forward from IAS 27. It was applied for the first time retrospectively in compliance with the transitional provisions and did not have any impact on the Group’s Financial Statements.
IFRS 11 – Joint Agreements (effective for periods beginning on or after January 1, 2013)This standard establishes principles for financial reporting by parties to a joint arrangement. This standard principally addresses two aspects: first, that the structure of the arrangement was the only determinant of the accounting and, second, that an entity had a choice of accounting treatment for interests in jointly controlled entities. IFRS 11 improves on IAS 31 by establishing principles that are applicable to the accounting for all joint arrangements. It was applied for the first time retrospectively in compliance with the transitional provisions and did not have any impact on the Group’s Financial Statements.
IFRS 12 – Disclosure of Interests in Other Entities (effective for periods beginning on or after January 1, 2013)This standard addresses the need for improved disclosure of a reporting entity’s interests in other entities when the reporting entity has a special relationship with those other entities. The standard integrates and makes consistent the disclosure requirements for subsidiaries, joint arrangements, associates and unconsolidated structured entities and presents those requirements in a single IFRS as it was observed that the disclosure requirements of IAS 27 – Consolidated and Separate Financial Statements, IAS 28 – Investments in Associates and IAS 31 – Interests in Joint Ventures overlapped in many areas. The new standard resulted in certain extended disclosures in the Group’s Consolidated Financial Statements.
Consolidated Financial StatementsBarry Callebaut
Annual Report 2013/14
66
IFRS 13 – Fair Value Measurement (effective for periods beginning on or after January 1, 2013)This standard defines fair value, sets out in a single IFRS a framework for measuring fair value, and requires disclosures about fair value measurements. It was applied for the first time retrospectively in compliance with the transitional provisions and did not have a material impact on the Group’s Financial Statements.
Use of judgment and estimates The preparation of financial statements requires management to make judgments, estimates and assumptions that affect the application of accounting policies and the reported amounts of assets, liabilities, income and expenses. Actual results may differ from these estimates.
Estimates and underlying assumptions are reviewed on an on going basis. Revisions to accounting estimates are recognized prospectively.
Information about judgments made in applying accounting policies that have most significant effects on the amounts recognized in the Consolidated Financial Statements and assumptions and estimation uncertainties that have a significant risk of resulting in a material adjustment in the year ending August 31, 2014, is included in the following notes:
Note 1 Acquisitions: fair value measurement and contingent assets
Note 18 Intangible assets – Allocation of goodwill to CGU’s/Impairment test: key assumptions underlying recoverable amounts
Note 19 Deferred tax assets and liabilities – Recognition of deferred tax assets: availability of future taxable profits against which tax loss carry-forwards can be utilized
Note 24 Employee benefit obligations – Measurement of defined benefit obligations: key actuarial assumptions
Note 28 Contingent liabilities – uncertainties
Scope of consolidation/subsidiariesThe Consolidated Financial Statements of the Group include all the assets, liabilities, income and expenses of Barry Callebaut AG and the companies which it controls. The Group controls an entity when the Group is exposed to, or has rights to, variable returns from its involvement with the entity and has the ability to affect those returns through its power over the entity. Non-controlling interests are shown as a component of equity in the balance sheet and the share of the net profit attributable to non-controlling interest is shown as a component of the net profit for the year in the Consolidated Income Statement. Newly acquired companies are consolidated from the date control is transferred (the effective date of acquisition), using the acquisition method. Subsidiaries disposed of are included up to the effective date of disposal.
All intragroup balances and unrealized gains and losses or income and expenses arising from intragroup transactions are eliminated in preparing the Consolidated Financial Statements. Unrealized gains arising from transactions with associates and jointly controlled entities are eliminated to the extent of the Group’s interest in the entity. Unrealized losses are eliminated in the same way as un realized gains, but only to the extent that there is no evidence of impairment.
Transactions with non-controlling interestsThe Group applies the policy of treating transactions with non- controlling interest equal to transactions with equity owners of the Group. For purchases from non-controlling interest, the difference between consideration paid and the relevant share acquired of the carrying value of net assets of the subsidiary is recorded in equity. Gains or losses on disposal to non-controlling interest are also recorded in equity.
Consolidated Financial StatementsBarry CallebautAnnual Report 2013/14

67
Interests in equity-accounted investeesInterests in equity-accounted investees comprise investments in associates and joint ventures. Associates are those companies in which the Group has significant influence but not control. This is normally presumed when the Group holds between 20% and 50% of the voting power of another entity. Joint ventures are those entities over whose activities the Group has joint control, established by contractual agreement and requiring unanimous consent for strategic financial and operating decisions. Associates and joint ventures are accounted for using the equity method (equity-accounted investees) and are recognized initially at cost. The Group’s investment includes goodwill identified on acquisition, net of any impairment losses. The Consolidated Financial Statements include the Group’s share of the income and expenses and equity movements of equity-accounted investees from the date that significant influence or joint control commences until the date significant influence or joint control ceases.
Foreign currency transactionsThe functional currency of the Group’s entities is the currency of their primary economic environment. In individual companies, trans actions in foreign currencies are recorded at the rate of exchange at the date of transaction. Monetary assets and liabilities denominated in foreign currencies are translated into respective functional currencies at the exchange rate prevailing at the year-end date. Any resul ting exchange gains and losses are taken to the income statement. If related to commercial transactions or to the measurement of financial instruments in coverage of commercial transactions, such foreign currency gains and losses are classified as cost of goods sold. Otherwise, foreign currency gains and losses are classified as finance income and finance cost.
Foreign currency translationFor consolidation purposes, assets and liabilities of subsidiaries reporting in currencies other than Swiss francs are translated to Swiss francs using year-end rates of exchange. Income and expenses are translated at the average rates of exchange for the year. Diffe rences arising from the translation of financial statements using the above method are recorded as cumu lative translation adjustments in other comprehensive income. When a foreign operation is disposed of, such that control, significant influence or joint control is lost, the cumulative amount in the translation reserve is reclassified to the Consolidated Income Statement as part of the gain or loss on disposal.
Major foreign exchange rates2013/14 2012/13
Closing rate Average rate Closing rate Average rate
EUR 1.2054 1.2226 1.2322 1.2235GBP 1.5165 1.4850 1.4426 1.4620USD 0.9148 0.8984 0.9316 0.9352
Cash and cash equivalentsCash and cash equivalents comprise of cash on hand, checks, bank balances and unrestricted bank deposit balances with an original maturity of 90 days or less. Bank overdrafts that are repayable on demand, forming an integral part of the Group’s cash management, are included as a component of cash and cash equivalents for the purpose of the Consolidated Cash Flow Statement.
Consolidated Financial StatementsBarry Callebaut
Annual Report 2013/14

68
Trade receivables and other current assetsTrade receivables are stated at amortized cost, less anticipated impairment losses. Impairment allowances for receivables represent the Group’s estimates of incurred losses arising from the failure or inability of customers to make payments when due. These estimates are assessed on an individual basis, taking into account the ageing of customers’ balances, specific credit circumstances and the Group’s historical default experience. If the Group is satisfied that no recovery of the amount owing is possible, the receivable is written off and the allowance related to it is reversed.
The Group maintains an asset-backed securitization program for trade receivables, transferring the contractual rights to the cash flows of third-party trade receivables at their nominal value minus a discount. These receivables are derecognized from the balance sheet. The net amount reported under “Other current assets” or “Other current liabilities” is the amount of the discount minus the receivables already collected at the balance sheet date but not yet remitted to the asset-purchasing company (see note 12).
Derivative financial instruments and hedging activities The Group’s purchasing and sourcing center frequently buys and sells cocoa beans for the purpose of generating a profit from short-term fluctuations in price or dealer’s margin. The practice of net cash settlement of cocoa purchase and sale contracts results in these contracts qualifying as derivative financial instruments.
The Group is exposed to the cocoa price risk resulting from its cocoa bean stocks and semi-finished cocoa products (both included in inventory), forecasted cocoa purchases and cocoa forward contracts. In accordance with its risk management policies, the Group therefore hedges its exposure to the cocoa price risk applying fair value hedge accounting.
Furthermore, the Group hedges its exposure to foreign exchange risk and interest rate risk arising from operational, financing and investment transactions.
Derivative financial instruments are accounted for at fair value with fair value changes recognized in the Consolidated Income Statement.
In addition, the Group applies cash flow hedge accounting whereby cocoa bean futures and foreign exchange forward and future contracts are used to hedge the cocoa price risk and foreign exchange risk arising from forecasted cocoa sale and purchase contracts.
Hedge accountingThe operating companies require cocoa beans and semi-finished cocoa products for manufacturing and selling of their products. Thus, the Group is exposed to the cocoa price risk on the purchase side due to increasing cocoa prices, on the sales side and inventory held to decreasing cocoa prices. The Group therefore applies hedge accounting to hedge its fair value risk on inventory and uses commodity futures and forward contracts to manage cocoa price risks (Contract Business – see risk management note 26).
The Group and its subsidiaries enter into sales and purchasing contracts denominated in various currencies and consequently are exposed to foreign currency risks, which are hedged by the Group’s treasury department or – in case of legal restrictions – with local banks. The Group’s interest rate risk is managed with interest rate derivatives.
Hedge accounting is applied to derivatives that are effective in offsetting the changes in fair value or cash flows of the hedged items. The hedge relation is documented and the effectiveness of such hedges is tested at regular intervals, at least on a semi-annual basis.
Consolidated Financial StatementsBarry CallebautAnnual Report 2013/14

69
Fair value hedging – for commodity price risks and foreign currency exchange risks related to the Contract Business Generally, fair value hedge accounting is applied to hedge the Group’s exposure to changes in fair value of a recognized asset or liability or an identified portion of such an asset or liability that is attributable to a particular risk, e.g. commodity price risks, and that could affect profit or loss. For fair value hedges, the carrying amount of the hedged item is adjusted for gains and losses attributable to the risk being hedged, the derivative (hedging instrument) is remeasured at fair value, and gains and losses from both are taken to the Consolidated Income Statement.
For cocoa inventory which is in excess of the cocoa component within sales contracts, a fair value hedge relationship is established. In this hedge relationship, the cocoa inventory is designated as hedged item and the short future contracts are designated as hedging instruments. When cocoa inventory is designated as a hedged item, the sub sequent cumulative change in the fair value of the cocoa inventory attributable to the hedged risk is adjusting the carrying amount of the hedged item (change of inventory cost value) with a corresponding gain or loss in the income statement. The hedging instrument is recorded at fair value under “Derivative financial assets” or “Derivative financial liabilities”, and the changes in the fair value of the hedging instrument are also recognized in the Consolidated Income Statement.
For foreign currency exchange risks related to the firm sales commitments of industrial chocolate (Contract Business), fair value hedge accounting is applied. The hedge relationship is between the unrecognized firm sales commitment (hedged item) and the foreign currency forward sales contract (hedging instrument). The changes in fair value of the hedging instruments are recognized in the income statement. The cumulative change in the fair value of the firm sales commitment attributable to the foreign currency risk is recognized as an asset or liability with a corresponding gain or loss in the Consolidated Income Statement.
Cash flow hedging – for commodity price risks and foreign currency exchange risks arising from forecasted purchase and sales transactions and firm commitmentsThe Group enters into exchange-traded cocoa bean futures to hedge the cocoa price risk arising from forecasted purchases of cocoa beans and forecasted sales of cocoa ingredients, and into foreign exchange forward and futures contracts to hedge the currency risk arising from forecasted purchase of cocoa beans and forecasted sales transactions as well as firm commitments for purchases and sales denominated in foreign currencies.
The related entities apply cash flow hedge (“CFH”) accounting whereby the cocoa bean futures and the foreign exchange forwards and futures are designated as hedging instruments to the underlying forecasted sales or purchase contracts to hedge the variability in cash flow that is attributable to the risk of cocoa bean price movements and to the foreign exchange risk respectively.
The fair value changes of the effective portion of the cocoa bean futures and foreign exchange forwards and futures designated as cash flow hedges are recognized in the cash flow hedge reserve in other comprehensive income and are transferred to profit or loss in the periods when the forecasted transactions are recognized in profit or loss or are no longer expected to occur. The fair value changes of the ineffective portion of these derivatives are recognized immediately in profit or loss.
Consolidated Financial StatementsBarry Callebaut
Annual Report 2013/14

70
Cash flow hedging – for interest rate risksIn general, Barry Callebaut applies cash flow hedge accounting for interest rate derivatives, converting a portion of floating rate borro wings to fixed rate borrowings.
Interest rate derivatives hedging exposures to variability in cash flows of highly probable forecasted transactions are classified as cash flow hedges. For each cash flow hedge relationship, the effective part of any gain or loss on the derivative financial instrument is recognized directly in other comprehensive income. Gains or losses that are recognized in other comprehensive income are transferred to the income statement in the same period in which the hedged exposure affects the Consolidated Income Statement. The ineffective part of any gain or loss is recognized immediately in the Consolidated Income Statement at the time hedge effectiveness is tested.
Hedge accounting is discontinued when the hedging instrument expires or is sold, terminated or exercised, or no longer qualifies for hedge accounting. At that point in time, any cumulative gain or loss on the hedging instrument recognized in other comprehensive income is kept in other comprehensive income until the forecasted transaction occurs. If a hedged transaction is no longer expected to occur, the net cumulative gain or loss recognized in other comprehensive income is immediately transferred to the Consolidated Income Statement.
No hedge accounting designation The Group’s purchasing and sourcing center and the In-house Bank of the Group fair value their derivative financial instruments without applying hedge accounting.
Price List Business commodity risk hedging is based on fore casted sales volume and excluded from hedge accounting, as no derivatives can be clearly designated to the forecasted price list sales. Therefore, these derivatives are carried at fair value with fair value changes recognized in the Consolidated Income Statement.
In respect of the foreign exchange exposure of a recognized monetary asset or liability, no hedge accounting is applied. Any gain or loss on the financial derivative used to eco nomically hedge this risk is recognized in the Consolidated Income Statement, thus compensating the gains and losses that arise from the revaluation of the underlying asset or liability.
InventoriesInventories are measured at the lower of cost and net realizable value. The cost of inventories comprises the costs of materials, direct production costs including labor costs, and an appropriate proportion of production overheads and factory depreciation. For movements in inventories, the average cost method is applied. Net realizable value is defined as the estimated selling price less costs of completion, and direct selling and distribution expenses.
Financial assetsFinancial assets are accounted for in accordance with IAS 39, Fin ancial Instruments: Recognition and Measurement. Accordingly, financial assets are classified into the following categories: at fair value through profit or loss, loans and receivables and available-for-sale. Financial assets acquired principally for the purpose of generating a profit from short-term fluctuations in price are classified as at fair value through profit or loss. All other financial assets, excluding loans and recei vables, are classified as available-for-sale.
All purchases and sales of financial assets are recognized on the trade date. Financial assets are recognized when the Group becomes a party to the contractual provisions and are initially measured at fair value, which is the consideration given for them, plus transaction costs in the case of financial assets and liabilities not at fair value through profit or loss. Available-for-sale and fair value through profit or loss investments are subsequently carried at fair value by reference to their quoted market price at the balance sheet date, without any deduction for transaction costs that the Group may incur on their sale or other disposal.
Consolidated Financial StatementsBarry CallebautAnnual Report 2013/14

71
Gains or losses on measurement to fair value of available-for-sale investments are included directly in equity until the financial asset is sold, disposed of or impaired, at which time the gains or losses are re cognized in net profit or loss for the period.
Financial assets are derecognized, using the weighted average method, when the Group loses control of the contractual rights to the cash flows of the assets or when the Group sells, or otherwise disposes of, the contractual rights to the cash flows, including situations where the Group retains the contractual rights but assumes a contractual obligation to pay the cash flows that comprise the financial asset to a third party. Such control is lost when the rights and benefits specified in the contract are realized, expired, or are surrendered.
Intangible assetsGoodwillGoodwill on acquisitions is the excess of acquisition date fair value of total consideration transferred plus the recognized amount of any non-controlling interest in the acquiree and the acquisition date fair value of assets acquired, liabilities and contingent liabilities assumed. Following initial recognition, goodwill is measured at cost less any accumulated impairment losses. Goodwill is reviewed for impairment annually or more frequently if events or changes in circumstances indicate that the carrying value may be impaired.
Negative goodwill is recognized directly in the income statement. At the acquisition date, any goodwill acquired is allocated to each of the cash-generating units expected to benefit from the combination’s synergies.
Impairment is determined by assessing the recoverable amount of the cash-generating unit to which the goodwill relates. Where the recoverable amount of the cash-generating unit is less than the carrying amount, an impairment loss is recognized. Where goodwill forms part of the cash-generating unit and part of the operation within that unit is disposed of, the goodwill associated with the operation disposed of is included in the carrying amount of the operation when determining the gain or loss on disposal of the operation. Goodwill disposed of in this circumstance is measured on the basis of the relative values of the operation disposed of and the portion of the cash-generating unit retained.
Research and development costsResearch costs are expensed as incurred, whereas product development costs are only expensed as incurred when it is considered im possible to quantify the existence of a market or future cash flows for the related products or processes with reasonable assurance.
Development costs for projects relate to software, recipes and innovation and are capitalized as an intangible asset if it can be de monstrated that the project is expected to generate future economic benefits. Development costs previously recognized as an expense are not recognized as an asset in a subsequent period. Development costs that have been capitalized are amortized on a straight-line basis over the period of their expected useful life. The amortization periods adopted do not exceed eight years.
Brand names, licenses and other intangible assetsOther acquired intangible assets include brand names, licenses, customer relationships, patents and trademarks. Patents and licenses are amortized over their period of validity. All other intangible assets are amortized on a straight-line basis over their anticipated useful life not exceeding 20 years.
Consolidated Financial StatementsBarry Callebaut
Annual Report 2013/14

72
Property, plant and equipmentProperty, plant and equipment are measured at the acquisition or construction cost less accumulated depreciation and accumulated impairment losses. A straight-line method of depreciation is applied through the estimated useful life. Estimated useful lives of major classes of depreciable assets are:
Buildings (including warehouses and installations) 20 to 50 yearsPlant and machinery 10 to 20 yearsOffice equipment, furniture and motor vehicles 3 to 10 years
Maintenance and repair expenditures are charged to the income statement as incurred.The carrying amounts of property, plant and equipment are reviewed at least at each
balance sheet date to assess whether they are recoverable in the form of future economic benefits. If the re coverable amount of an asset has declined below its carrying amount, an impairment loss is recognized to reduce the value of the assets to its recoverable amount. In determining the recoverable amount of the assets, expected cash flows are discounted to their present value.
Borrowing costsBorrowing costs related to the acquisition, construction, or production of a qualifying asset are capitalized in accordance with IAS 23. A qualifying asset is an asset that necessarily takes a substantial period of time to get ready for its intended use or sale.
Leased assetsLeases are classified as finance leases whenever the terms of the lease transfer substantially all the risks and rewards of ownership to the lessee.
Assets held under finance leases are stated as assets of the Group at the lower of their fair value and the present value of the minimum lease payments at inception of the lease, less accumulated depreciation and impairment losses. The corresponding liability to the lessor is included in the balance sheet as a finance lease obligation. Finance costs are charged to the income statement over the term of the relevant lease so as to produce a constant periodic interest charge on the remaining balance of the obligations for each accounting period. Leases where a significant portion of the risks and rewards of ownership are retained by the lessor are classified as operating leases. Rentals pay able under an operating lease are charged to the income statement on a straight-line basis over the term of the lease.
Financial liabilitiesFinancial liabilities are initially recognized at fair value, net of trans action costs, when the Group becomes a party to the contractual provisions. They are subsequently carried at amortized cost using the effective interest rate method. A financial liability is removed from the balance sheet when the obligation is discharged, cancelled, or expires.
ProvisionsProvisions are recognized when the Group has a present legal or constructive obligation as a result of past events and it is probable that an outflow of resources will be required to settle the obligation, and a reliable estimate thereof can be made. Provisions are recorded for identifiable claims and restructuring costs. Restructuring provisions mainly comprise employee termination payments. Specific provisions for restructuring costs are recorded at such time as the management approves the decision to restructure and a formal plan for restructuring is communicated.
Consolidated Financial StatementsBarry CallebautAnnual Report 2013/14

73
Employee benefit obligations/post-employment benefitsThe Group’s net obligation in respect of defined benefit plans is calculated separately for each plan by estimating the amount of future benefit that employees have earned in the current and prior periods, discounting that amount and deducting the fair value of any plan assets.
The calculation of defined benefit obligations is performed annually by a qualified actuary using the projected unit credit method. When the calculation results in a potential asset for the Group, the recognized asset is limited to the present value of economic benefits available in the form of any future refunds from the plan or reductions in future contributions to the plan. To calculate the present value of economic benefits, consideration is given to any applicable minimum funding requirements.
Remeasurement of the net defined benefit liability, which comprise actuarial gains and losses, the return on plan assets and the effect of the asset ceiling, are recognized immediately in other comprehensive income. The Group determines the net interest expense (income) on the net defined benefit liability (asset) for the period by applying the discount rate used to measure the defined benefit liability (asset), taking into account any changes in the net defined benefit liability (asset) during the period as a result of contributions and benefit payments. Net interest expense and other expenses related to defined benefit plans are recognized in profit or loss.
When the benefits of a plan are changed or when a plan is curtailed, the resulting change in benefit that relates to past service or the gain or loss on curtailment is recognized immediately in profit or loss. The Group recognizes gains and losses on the settlement of a defined benefit plan when the settlement occurs.
Some benefits are also provided by defined contribution plans; contributions to such plans are charged to the Consolidated Income Statement as incurred.
Post-retirement benefits other than pensionsCertain subsidiaries provide health care and insurance benefits for a portion of their retired employees and their eligible dependents. The cost of these benefits is actuarially determined and included in the related function expenses over the employees’ working lives. The related liability is also included in the position “Employee benefit obligations”.
Termination benefitsTermination benefits are expensed at the earlier of when the Group can no longer withdraw the offer of those benefits and when the Group recognizes costs for a restructuring. If benefits are not expected to be settled wholly within 12 months of the end of the reporting period, then they are discounted.
Employee stock ownership programFor the employee stock ownership program (called “Deferred Share Plan”, effective 2011–2014), treasury shares are used. In accordance with IFRS 2, the compensation costs in relation with share awards granted under the Deferred Share Plan are re cognized in the income statement over the vesting period at their fair value as of the grant date. In line with the regulation of the Deferred Share Plan, the Group may also have cash-settled share-based payment transactions. In accordance with IFRS 2, liabilities arising from cash-settled share-based payment transactions are recognized against profit or loss over the vesting period and are fair valued at each reporting date until settlement.
Consolidated Financial StatementsBarry Callebaut
Annual Report 2013/14

74
Other long-term employee benefitsOther long-term employee benefits represent amounts due to employees under deferred compensation arrangements mandated by certain jurisdictions in which the Group conducts its operations. Benefit cost is recognized on an actuarial basis in the income statement. The related liability is included in other long-term liabilities.
Share capital/purchase of treasury sharesWhere the Company or its subsidiaries purchase the Company’s shares, the consideration paid, including any attributable transaction costs, is deducted from equity as treasury shares. Where such shares are sub sequently sold or reissued, any consideration received is included in equity.
DividendsDividends on ordinary shares are recognized as a liability when they are approved by the shareholders.
TaxesCurrent income taxes are recognized based on taxable income, whereas other taxes such as non-recoverable taxes withheld on dividends, management fees and royalties received or paid are reported under “Other expenses”. Non-recoverable withholding taxes are only accrued if distribution by subsidiary companies is foreseen.
Income taxes are calculated in accordance with the tax regulations in effect in each country.
The Group recognizes deferred income taxes using the balance sheet liability method. Deferred income tax is recognized on all temporary differences arising between the tax values of assets and liabilities and their values in the Consolidated Financial Statements. Deferred income tax assets are recognized to the extent it is pro bable that future taxable profit will be available against which the temporary differences can be utilized. Deferred income tax assets and liabilities are calculated using tax rates that are expected to apply to the period when the asset is realized or the liability is settled, based on tax rates and laws that have been enacted or substantively enacted at the balance sheet date.
Revenue recognitionRevenues from sales and services consist of the net sales turnover of semi-processed and processed goods and services related to food processing.
Revenues from the sale of goods are recognized when the signi ficant risks and rewards of ownership of the goods have been transferred to the buyer, which is mainly upon shipment. Appropriate provisions are made for all additional costs to be incurred in connection with the sales including the cost of returns. Additionally, gains and losses related to derivative financial instruments used for hedging purposes are recognized in revenues in accordance with the policies set out in this section.
Revenues and costs related to trading of raw materials, which are fair valued, are netted. Interest income is recognized as it accrues on an effective yield basis, when it is determined that such income will flow to the Group. Dividends are recognized when the right to receive payment is established.
Consolidated Financial StatementsBarry CallebautAnnual Report 2013/14

75
Consolidated Financial StatementsBarry Callebaut
Annual Report 2013/14
Government grantsProvided there is reasonable assurance that they will be irrevocably received, grants relating to capital expenditure are deducted from the cost of property, plant and equipment and thus recognized in the income statement on a straight-line basis over the useful life of the asset.
Other grants that compensate the Group for expenses incurred are deferred and recognized in the income statement over the period necessary to match them with the costs they are intended to compensate.
Segment reportingOperating segments are reported in a manner consistent with the internal reporting provided to the Chief Operating Decision Maker. The Operating Decision Maker, who is responsible for allocating resources and assessing performance of the operating segments, has been identified as the Group’s Executive Committee.
Discontinued operationsDiscontinued operations are separately disclosed, if a component of an entity either has been disposed of, or is classified as, held for sale. A component of an entity represents a major line of business or geographical area of operations or is part of a single coordinated plan to dispose of a separate major line of business or geographical area of operations or is a sub sidiary acquired exclusively with a view to resale. A component of an entity can be clearly distinguished operationally and for financial reporting purposes, from the rest of the entity. Discontinued operations are separately disclosed from the continued operations in the Consolidated Income Statement. Prior-year financial figures related to the income statement are adjusted accordingly (as if the operation had been discontinued as from the start of the comparative year) and also separately disclosed. Related assets are presented on the balance sheet under “Assets held for sale” and related liabilities under “Liabilities directly associated with assets held for sale”, whereas in accordance with IFRS 5, no prior-year restatement has been made for these positions. Cash flow information related to discontinued operations are disclosed separately in the notes.

76
Introduction of new standards in 2014/15 and laterThe following standards and amendments to existing standards have been published and are mandatory for the Group’s accounting periods beginning on or after September 1, 2014, and have not been applied in preparing these Consolidated Financial Statements. The impacts on the financial statements of the standards and amendments, which are relevant, are disclosed below the table. With the exception of IFRS 9, the Group does not plan to adopt these standards early.
Effective date Planned application by the Group in fiscal year
New Standards or InterpretationsIFRS 9 Financial Instruments January 1, 2018 Fiscal year 2014/15IFRS 15 Revenue from Contracts with Customers January 1, 2017 Fiscal year 2017/18Revisions and amendments of Standards and Interpretations Offsetting Financial Assets and Financial Liabilities (Amendments to IAS 32) January 1, 2014 Fiscal year 2014/15Investment Entities (Amendments to IFRS 10, IFRS 12, IAS 27) January 1, 2014 Fiscal year 2014/15Recoverable Amount Disclosures for Non-Financial Assets (Amendments to IAS 36)
January 1, 2014
Fiscal year 2014/15
Novation of Derivatives and Continuation of Hedge Accounting (Amendments to IAS 39)
January 1, 2014 Fiscal year 2014/15
Annual Improvements to IFRSs 2010–2012 Cycle July 1, 2014 Fiscal year 2014/15Annual Improvements to IFRSs 2011–2013 Cycle July 1, 2014 Fiscal year 2014/15Accounting for Acquisitions of Interests in Joint Operations (Amendments to IFRS 11)
January 1, 2016 Fiscal year 2016/17
Clarification of Acceptable Methods of Depreciation and Amortization (Amendments to IAS 16 and IAS 38)
January 1, 2016 Fiscal year 2016/17
Amendments to IAS 32 – Financial Instruments: Presentation – Offsetting Financial Assets and Financial LiabilitiesThese amendments clarify when an entity currently has a legally enforceable right to set off financial assets and financial liabilities, and also clarifies the circumstances when gross settlement is equivalent to net settlement. The amendments are to be applied retrospectively. Potential impacts on the Group’s Consolidated Financial Statements were not yet fully assessed.
Consolidated Financial StatementsBarry CallebautAnnual Report 2013/14

77
IFRS 9 – Financial Instruments and related amendments to IFRS 7 regarding transitionThis standard introduces new requirements for the classification and measurement of financial assets, including a new expected credit loss model for calculating impairment and the new hedge accounting model.
All recognized financial assets will be measured at either amortized cost or fair value through other comprehensive income and fair value through profit and loss, depending on its business model for managing those financial assets and the assets’ contractual cash flow characteristics. A fair value option is available as an alternative to amortized cost measurement. All equity investments are to be measured on the Consolidated Balance Sheet at fair value. Only if the equity instrument is not held for trading, an irrevocable election can be made at initial recognition to measure it at fair value through other comprehensive income with only dividend income recognized in profit or loss. All derivatives are required to be measured at fair value.
IFRS 9 includes a “practical expedient” for credit allowances on trade receivables. This will allow: loss allowance equaling lifetime expected credit loss; provision matrix may be used for collective assessment of portfolios of similar receivables; reduced disclosure requirements for trade receivables that are accounted for using the simplified approach. IFRS 9 has a rebuttable presumption that default has occurred once a payment is 90 days past due. Trade receivables past due 90 days are evaluated to determine the need for an individual impairment allowance.
For a financial liability designated as at fair value through profit or loss using the fair value option, the charge in the liability’s fair value attributable to charges in the liability’s credit risk is recognized directly in other comprehensive income, unless it creates or increases an accounting mismatch.
The Group early adopts IFRS 9 as of September 1, 2014. The Group considers that the main impact of the new standard will be on hedge accounting with the main advantage of facilitating a better alignment of hedge accounting with risk management by being able to apply hedge accounting for specific risk components of non-financial items.
IFRS 15 Revenue RecognitionThe standard contains a single model that applies to contracts with customers and two approaches to recognizing revenue: revenue may be recognized over time, in a manner that best reflects the company’s performance, or at a point in time, when control of the good or service is transferred to the customer. For complex transactions with multiple components and/or variable amounts of consideration, or when the work is carried out under contract for an extended period of time, applying the standard may lead to revenue being accelerated or deferred in comparison with current requirements. The model features a contract-based five-step analysis of transactions to determine whether, how much and when revenue is recognized.
Potential impacts on the Group’s Consolidated Financial Statements have not yet been fully assessed.
Consolidated Financial StatementsBarry Callebaut
Annual Report 2013/14

78
Notes to the Consolidated Financial Statements
1 AcquisitionsAcquisition in 2013/14
On February 18, 2014, the Group acquired the remaining 51% of Biolands Group, its long-time supplier of certified cocoa beans from East and West Africa, increasing its shareholding in the Biolands entities (African Organic Produce AG, Biolands International Ltd., Biopartenaire SA, and Bio United Ltd.) to 100%, thus obtaining control. The following table summarizes the major classes of consideration transferred in connection with the acquisitions mentioned above:
in million CHF 2013/14
ConsiderationCash paid and contingent consideration 2.1Fair value of the Group’s previously held equity interest 3.3Total consideration 5.4
The arrangement involves a contingent consideration of CHF 0.3 million.
The Group expensed acquisition-related costs, such as fees for due diligence work, lawyers and valuation services, of less than CHF 0.1 million over the course of the project immediately in the Consolidated Income Statement (included in “General and administration expenses”).
The following purchase price allocation and fair value of assets and liabilities have been determined on a provisional basis:
in million CHF 2013/14
Recognized amounts of identifiable assets acquired and liabilities assumedCurrent assets 3.2Non-current assets 0.6Current liabilities (2.6)Non-current liabilities –Total identifiable net assets 1.2Goodwill 4.2Total consideration at fair value 5.4
The goodwill of CHF 4.2 million arising from the acquisitions is attributable to synergies expected to be achieved from integrating the business in the Group’s existing business and improvements expected from combining the sourcing channels of the acquired businesses with those of the Group. The goodwill has been allocated to Global Cocoa. None of the goodwill recognized is expected to be deductible for income tax purposes.
Consolidated Financial StatementsBarry CallebautAnnual Report 2013/14
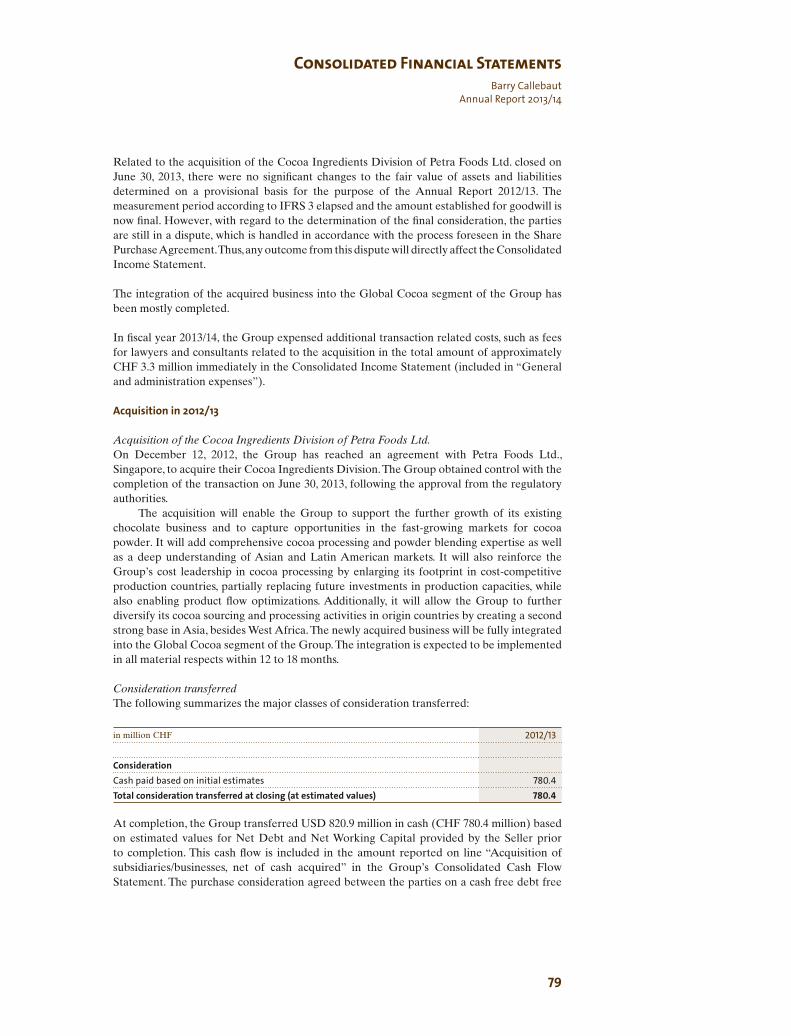
79
Related to the acquisition of the Cocoa Ingredients Division of Petra Foods Ltd. closed on June 30, 2013, there were no significant changes to the fair value of assets and liabilities determined on a provisional basis for the purpose of the Annual Report 2012/13. The measurement period according to IFRS 3 elapsed and the amount established for goodwill is now final. However, with regard to the determination of the final consideration, the parties are still in a dispute, which is handled in accordance with the process foreseen in the Share Purchase Agreement. Thus, any outcome from this dispute will directly affect the Consolidated Income Statement.
The integration of the acquired business into the Global Cocoa segment of the Group has been mostly completed.
In fiscal year 2013/14, the Group expensed additional transaction related costs, such as fees for lawyers and consultants related to the acquisition in the total amount of approximately CHF 3.3 million immediately in the Consolidated Income Statement (included in “General and administration expenses”).
Acquisition in 2012/13
Acquisition of the Cocoa Ingredients Division of Petra Foods Ltd.On December 12, 2012, the Group has reached an agreement with Petra Foods Ltd., Singapore, to acquire their Cocoa Ingredients Division. The Group obtained control with the completion of the transaction on June 30, 2013, following the approval from the regulatory authorities. The acquisition will enable the Group to support the further growth of its existing chocolate business and to capture opportunities in the fast-growing markets for cocoa powder. It will add comprehensive cocoa processing and powder blending expertise as well as a deep understanding of Asian and Latin American markets. It will also reinforce the Group’s cost leadership in cocoa processing by enlarging its footprint in cost-competitive production countries, partially replacing future investments in production capacities, while also enabling product flow optimizations. Additionally, it will allow the Group to further diversify its cocoa sourcing and processing activities in origin countries by creating a second strong base in Asia, besides West Africa. The newly acquired business will be fully integrated into the Global Cocoa segment of the Group. The integration is expected to be implemented in all material respects within 12 to 18 months.
Consideration transferred The following summarizes the major classes of consideration transferred:
in million CHF 2012/13
ConsiderationCash paid based on initial estimates 780.4Total consideration transferred at closing (at estimated values) 780.4
At completion, the Group transferred USD 820.9 million in cash (CHF 780.4 million) based on estimated values for Net Debt and Net Working Capital provided by the Seller prior to completion. This cash flow is included in the amount reported on line “Acquisition of subsidiaries/businesses, net of cash acquired” in the Group’s Consolidated Cash Flow Statement. The purchase consideration agreed between the parties on a cash free debt free
Consolidated Financial StatementsBarry Callebaut
Annual Report 2013/14

80
basis amounted to USD 864.3 million (CHF 821.5 million) and consisted of the cash transferred at closing and short-term debt assumed in the amount of USD 43.4 million (CHF 41.1 million, see table “Identifiable assets acquired and liabilities assumed” below).
The agreements with the Seller neither contain any contingent considerations nor any deferred considerations except for the post-completion consideration adjustments as foreseen in the Share Purchase Agreement (“SPA”). To arrive at such final completion consideration adjustments, the SPA foresees a process, in which the Completion Statements relevant for the calculation of the purchase consideration are set up by the Buyer and agreed upon between the parties, if necessary with the involvement of external arbitration. Due to Petra Foods’ dispute on the Completion Statements submitted by Barry Callebaut, the parties will apply the dispute resolution mechanism foreseen in the SPA. Consequently, the final consideration cannot yet be determined at the time of the publication of these accounts.
For the financing of the acquisition, on June 20, 2013, the Group issued a 5.5% Senior Note with maturity in June 2023 for an amount of USD 400 million (see note 23 – Long-term debt). In addition, the company issued new registered shares on June 14, 2013, for CHF 279 million (resulting in net proceeds of CHF 273 million after deduction of costs) utilizing the authorized share capital as approved by the Extraordinary General Meeting of Shareholders on April 22, 2013 (see note 25 – Equity). The remainder was financed through the partial utilization of an existing bridge loan as well as other available funding sources (see note 20 and 23).
The Group expensed acquisition-related costs, such as fees for due diligence work, lawyers, valuation services, consultants and internal travel and logistic as well as other one-off costs related to the acquisition in the total amount of approximately CHF 17.2 million over the course of the project immediately in the Consolidated Income Statement (included in “General and administration expenses”), all being recognized in the current fiscal period.
Identifiable assets acquired and liabilities assumedThe following purchase price allocation and fair value of assets and liabilities have been determined on a provisional basis:
in million CHF 2012/13
Cash and cash equivalents 7.8Trade receivables and other current assets1 135.6Inventories 286.3Derivative financial assets 5.9Property, plant and equipment 205.2Intangible assets 9.6Deferred tax assets 6.3Other non-current assets 0.5Trade payables and other current liabilities (74.3)Short-term debt (41.1)Deferred tax liabilities (0.8)Derivative financial liabilities (57.5)Provisions (3.0)Other non-current liabilities (4.1)Total identifiable net assets acquired 476.4
1 Including gross contractual amounts of trade receivables of CHF 92.9 million reduced by items not expected to be collected of CHF 0.8 million.
Consolidated Financial StatementsBarry CallebautAnnual Report 2013/14

81
Consolidated Financial StatementsBarry Callebaut
Annual Report 2013/14
GoodwillAt acquisition, the Group has assessed and recorded all related assets and liabilities at their fair values. At this moment, the goodwill on the transaction could not yet be established, as the purchase consideration was not yet finally determined. The difference between the Consideration transferred at closing (amounting to CHF 780.4 million, as calculated by the Seller at estimated values) and the fair value of the assets and liabilities assumed (CHF 476.4 million) amounted to CHF 304.0 million. However, the Seller decided to contest the respective adjustment of USD 98 million claimed by the Group, which resulted in a dispute. This dispute is handled in accordance with the resolution mechanism foreseen in the SPA and is still ongoing at the end of fiscal year 2013/14. According to IFRS 3, the measurement period has meanwhile elapsed. Thus, the amounts established for fair values and goodwill are final. As a result, any outcome from the dispute will directly affect the Consolidated Income Statement. The resulting goodwill arising from the acquisition is attributable to synergies expected to be achieved from integrating the company into the Group’s existing Global Cocoa business. It also reflects economies of scale expected from combining the operations as well as sales and sourcing channels of the Group with the ones of the acquired business. In addition, this value is also attributable to the knowledge of the workforce, which will provide the Group access to new markets and enlarge its footprint in the fast-growing markets particularly for products based on cocoa powder. The final amount of goodwill as mentioned above can only be determined after final assessment of the consideration in accordance with the SPA.
None of the goodwill recognized is expected to be deductible for income tax purposes. The entire goodwill is allocated to segment Global Cocoa.
The revenue included in the Consolidated Income Statement since completion of the transaction contributed by the acquired business was CHF 127.7 million. The business has also contributed a loss after tax of CHF –14.6 million over the same period. This result does not include any finance costs incurred on the financing of the acquisition.
Had the business been consolidated from September 1, 2012, it would have contributed revenue of CHF 854.0 million and net loss after tax for the fiscal year of CHF –77.0 million to the Consolidated Income Statement.
Other individually immaterial acquisitions in 2012/13On June 6, 2012, the Group entered into an agreement with Batory Industries Company to purchase its compound manufacturing business, and obtained its facility in Chatham, Ontario, together with the related inventory and the employees. The Group obtained control with the completion of the transaction on September 7, 2012.
On January 17, 2013, the Group obtained control of ASM Foods AB, a Swedish company active in manufacturing and selling of specialty compound chocolate, fillings and inclusions, by acquiring 100% of the shares and voting interests from Carletti A/S, Denmark. On the same date, the Group also signed an agreement with Carletti A/S, Denmark, for the purchase of its assets related to chocolate and compound production. This transaction took place in May 2013.

82
Consolidated Financial StatementsBarry CallebautAnnual Report 2013/14
The following summarizes the major classes of consideration transferred in combination of the acquisitions mentioned above:
in million CHF 2012/13
ConsiderationCash paid 50.6Total consideration transferred 50.6
The Group expensed acquisition-related costs, such as fees for due diligence work, lawyers and valuation services, of CHF 0.5 million over the course of the project immediately in the Consolidated Income Statement (included in “General and administration expenses”). The vast majority of these costs were recognized in the current fiscal year.
The following table summarizes the recognized amounts of assets acquired and liabilities assumed at the acquisition dates:
in million CHF 2012/13
Recognized amounts of identifiable assets acquired and liabilities assumedCurrent assets 12.9Non-current assets 10.0Current liabilities (5.1)Non-current liabilities (0.9)Total identifiable net assets acquired 16.9Goodwill 33.7Total consideration at fair value 50.6
The goodwill of CHF 33.7 million arising from these acquisitions is attributable to the skills and technical talents of the workforce, synergies expected to be achieved from integrating the businesses in the Group’s existing business and economies of scale expected from combining the operations and sales and sourcing channels of the acquired businesses and the Group. CHF 26.2 million from the goodwill has been allocated to Region Europe and CHF 7.5 million has been allocated to Region Americas. CHF 5.5 million of the goodwill recognized is expected to be deductible for income tax purposes.
The revenue included in the Consolidated Income Statement since the acquisition dates, contributed by the acquired businesses, was CHF 52.3 million. The acquired businesses have also contributed a profit of CHF 3.2 million since acquisition.
Had the businesses been consolidated from September 1, 2012, they would have contributed revenue of CHF 66.1 million and a net profit for the year of CHF 2.9 million to the Consolidated Income Statement.

83
Consolidated Financial StatementsBarry Callebaut
Annual Report 2013/14
2 Discontinued operations and disposals
The Group did not have any discontinued operations and disposals in 2013/14.
Discontinuation of the Dijon operations in 2012/13The Group announced in September 2012 that it intends to sell its factory and the related business in Dijon (France) to “Chocolaterie de Bourgogne” concluding with this the final step to dispose of the consumer activities. The sale has been completed on November 30, 2012.
The net loss from discontinued operations of CHF 6.7 million in the fiscal year 2012/13 includes the net result of the discontinued business until the closing date of the transaction and other cost incurred during the transaction.
Result and cash flow of the discontinued operations and disposalsin thousands of CHF 2012/13
Revenue from sales and services 10,775Operating expenses (15,379)
Operating loss before impairment on assets and other disposal costs (4,604)
Transaction and separation costs (124)Operating loss (EBIT) (4,728)Financial items (522)Income taxes (1,441)Net loss from discontinued operations, net of tax (6,691)
Earnings per share from discontinued operationsBasic earnings per share (CHF/share) (1.28)Diluted earnings per share (CHF/share) (1.27)
Cash flows from discontinued operations (19,121)Net cash flow from operating activities (5,220)Net cash flow from investing activities1 (19,638)Net cash flow from financing activities 5,737
1 The amount in fiscal year 2012/13 mainly consists of the capital increase injected before disposal of the Dijon operations.
Disposal of Barry Callebaut Pastry Manufacturing Ibérica S.L. in 2012/13As of February 28, 2013, the Group sold its subsidiary Barry Callebaut Pastry Manufacturing Ibérica S.L. The disposal does not have a significant impact on the financial statements.
The participation in Barry Callebaut Pastry Manufacturing Ibérica S.L., producing ready-to-use frozen pastry products, was no longer considered part of Barry Callebaut’s core business. Therefore, the Group decided to sell this business. The net assets disposed of amounted to CHF 5.1 million, the related cumulative translation adjustment was recycled from equity into the Consolidated Income Statement in the amount of CHF 1.7 million and the Group realized proceeds of CHF 4.7 million.
The business was sold to Givesco A/S, the parent company of Carletti A/S, Denmark, from which the Group acquired ASM Foods AB and certain assets related to chocolate and compound production in another transaction (see also note 1).

84
Consolidated Financial StatementsBarry CallebautAnnual Report 2013/14
3 Segment informationExternal segment reporting is based on the internal organizational and management structure, as well as on the internal information reviewed regularly by the Chief Operating De cision Maker. Barry Callebaut’s Chief Operating Decision Maker has been identified as the Executive Committee, con sisting of the Group Chief Executive Officer, the Chief Financial Officer and the Presidents of the Regions Western Europe, Americas and Global Cocoa as well as the Chief Operations Officer and the Chief Innovation & Quality Officer.
Financial information by reportable segmentsin thousands of CHF Europe Americas Asia Pacific
2013/14 2012/131 2013/14 2012/131 2013/14 2012/131
Revenues from external customers 2,573,259 2,352,639 1,287,335 1,182,652 249,128 221,954Revenues from transactions with other operating segments of the Group 66,631 62,656 681 461 – 127
Net revenue 2,639,890 2,415,295 1,288,016 1,183,113 249,128 222,081Operating profit (EBIT) 268,097 254,570 126,502 107,600 27,002 26,958
Depreciation and amortization (37,956) (31,592) (18,656) (21,615) (6,662) (5,585)Impairment losses (721) (809) (3) – (16) (27)Total assets 1,294,836 1,171,236 897,696 735,559 122,754 142,617
Additions to property, plant, equipment and intangible assets (71,471) (90,276) (76,312) (55,209) (14,435) (22,368)
1 Following the revision of IAS 19 (Employee Benefits), certain comparatives have been restated to conform to the current period’s presentation.
The Executive Committee considers the business from a geographic view. Hence, Presidents were appointed for each region. Since the Group’s cocoa activities operate independently of the Regions, the Global Cocoa business is reviewed by the Chief Operating Decision Maker as an own segment in addition to the geographical Regions Western Europe, EEMEA (Eastern Europe, Middle East and Africa), Americas and Asia Pacific. For the purpose of the Consolidated Financial Statements, the Regions Western Europe and EEMEA were aggregated since the businesses are similar and meet the criteria for aggregation. Furthermore, the Executive Committee also views the Corporate function independently. The function “Corporate” consists mainly of headquarters services (incl. the treasury and in-house banking function) to other segments. Thus, the Group reports Corporate separately. The segment Global Cocoa is responsible for the procurement of ingredients for chocolate production (mainly cocoa; sugar, dairy and nuts are also common ingredients) and the Group’s cocoa-processing business. The cocoa business acquired from Petra Foods is integrated and reported into this segment. Most of the revenues of Global Cocoa are generated with the other segments of the Group. The business conducted in the regions consists of chocolate production related to the Product Groups “Food Manufacturers’ Products” focusing on industrial customers and “Gourmet & Specialties Products” focusing on products for artisans and professional users of chocolate such as chocolatiers, pastry chefs or bakers as well as products for vending machines.

85
The revenues generated by Global Cocoa with other segments are conducted on an arm’s-length basis, and some of its operational profits are consequently allocated to the Regions which act as major customers of Global Cocoa.
Segment revenue, segment results (operating profit EBIT) and segment assets correspond to the Group’s Consolidated Financial Statements. The segment reporting in fiscal year 2012/13 does not include the result related to the discontinued consumer activities.
Finance income and costs, the Group’s share of result of equity-accounted investees and income taxes are not allocated to the respective segment for internal management purposes. These items can be found below in the table “Reconciliation of the EBIT to the net profit for the year”.
Reconciliation of EBIT to net profit for the year in thousands of CHF 2013/14 2012/13
Operating profit (EBIT) 416,245 342,854Finance income 3,246 14,750Finance costs (121,964) (92,591)Share of profit/(loss) of equity-accounted investees, net of tax (119) (49)Profit before income taxes 297,408 264,964Income tax expenses (42,410) (35,508)Net profit from continuing operations 254,998 229,456Net loss from discontinued operations, net of tax – (6,691)Net profit for the year 254,998 222,765
Consolidated Financial StatementsBarry Callebaut
Annual Report 2013/14
Global Cocoa Total Segments Corporate Eliminations Group
2013/14 2012/131 2013/14 2012/131 2013/14 2012/131 2013/14 2012/131 2013/14 2012/131
1,756,218 1,126,845 5,865,940 4,884,090 – – – – 5,865,940 4,884,090
2,204,104 1,714,876 2,271,416 1,778,120 – – (2,271,416) (1,778,120) – –
3,960,322 2,841,721 8,137,356 6,662,210 – – (2,271,416) (1,778,120) 5,865,940 4,884,09081,951 41,899 503,552 431,027 (87,307) (88,173) – – 416,245 342,854
(49,119) (33,817) (112,393) (92,609) (2,811) (2,835) – – (115,204) (95,444)(27) – (767) (836) (35) – – – (802) (836)
2,866,872 2,432,382 5,182,158 4,481,794 1,481,385 1,094,212 (1,496,029) (1,049,094) 5,167,514 4,526,912
(58,321) (586,330) (220,539) (754,183) (32,925) (31,025) – – (253,464) (785,208)

86
Additional entity-wide disclosuresInformation on geographical regionsBarry Callebaut is domiciled in Switzerland; however, its major revenues are generated in other countries. The following table shows revenues and non-current assets excluding investments in equity-accounted investees, deferred tax assets and pension assets allocated to the entity’s country of domicile and the major countries where the Group is genera ting revenues and/or to those countries where the non-current assets as defined above are material.
2013/14 2012/13 2013/14 2012/13in thousands of CHF Revenues Non-current assets1
USA 905,570 880,669 243,327 237,597Belgium 481,013 438,207 323,598 296,726Germany 453,246 412,342 102,231 100,117France 432,354 386,232 49,139 70,169United Kingdom 411,419 388,397 78,275 43,719Italy 308,908 279,616 25,110 26,079Mexico 272,754 229,027 32,875 33,108Other 2,600,676 1,869,600 1,217,822 1,161,010Total 5,865,940 4,884,090 2,072,377 1,968,5251 Property, plant and equipment + intangible assets.
Information on Product GroupsThe Group has numerous products that are sold to external customers. Therefore, for internal review by the Chief Operating Decision Maker, information on products is aggregated on a Product Group level. The following table breaks down external revenues into Product Groups:
Segment information by Product Groupin thousands of CHF 2013/14 2012/13
Cocoa Products 1,756,218 1,126,845Food Manufacturers 3,247,374 2,971,714Gourmet & Specialties 862,348 785,531Revenues from external customers 5,865,940 4,884,090
In fiscal year 2013/14, the biggest single customer contributed CHF 797.7 million (2012/13: CHF 755.4 million) of total revenues (reported across various regions). No other single customer contributed more than 10% of total consolidated revenues.
Consolidated Financial StatementsBarry CallebautAnnual Report 2013/14

4 Personnel expenses in thousands of CHF 2013/14 2012/13
Wages and salaries (356,639) (326,633)Compulsory social security contributions (78,085) (69,463)Equity-settled share-based payments (12,791) (12,332)Cash-settled share-based payments (10,972) – Expenses related to defined benefit plans (13,538) (12,685)Contributions to defined contribution plans (2,605) (1,276)Increase in liability for long service leave (57) (43)Total personnel expenses (474,687) (422,432)
5 Research and development expenses in thousands of CHF 2013/14 2012/13
Total research and development expenses (21,779) (20,698)
Research and development expenses not qualifying for capitalization are directly charged to the Consolidated Income Statement and are reported under “Marketing and sales expenses” and “General and administration expenses”. The part qualifying for capitalization is reported as addition under development costs in note 18 – Intangible assets.
6 Other income in thousands of CHF 2013/14 2012/13
Gain on disposal of property, plant and equipment 1,162 310 Group training centers, museums, outlets and rental income 3,801 3,561 Sale of shells of cocoa beans and waste 5,659 3,161 Litigations, claims and insurance 3,169 3,789 Release of unused provisions and accruals 490 112 Gain on sale of subsidiary – 1,259Other 3,908 2,610 Total other income 18,189 14,802
7 Other expenses in thousands of CHF 2013/14 2012/13
Restructuring costs (4,099) (1,266)Loss on sale of waste (4) (1,027)Litigations and claims (3,184) (4,242)Costs related to chocolate museums (59) (28)Loss on sale of property, plant and equipment (75) (416)Impairment on property, plant and equipment (note 15) (10) (69)Impairment on other intangibles (note 18) (792) (767)Other (4,049) (2,824)Total other expenses (12,272) (10,639)
Consolidated Financial StatementsBarry Callebaut
Annual Report 2013/14

88
8 Finance income in thousands of CHF 2013/14 2012/13
Interest income 1,734 540 Exchange gains, net – 7,291 Gain on derivative financial instruments 1,512 6,919 Total finance income 3,246 14,750
9 Finance costs in thousands of CHF 2013/14 2012/13
Interest expenses (105,685) (75,497)Structuring fees (3,182) (4,807)Charges on undrawn portion of committed credit facilities (2,380) (4,335)Net interest costs related to defined benefit plans (5,711) (4,316)Total interest expenses (116,958) (88,955)Bank charges and other financial expenses (4,288) (3,636)Exchange losses, net (718) –Total finance costs (121,964) (92,591)
Interest expenses include the net cost of interest rate swaps and result from paying fixed interest rates in exchange for receiving floating interest rates. All interest rate derivative financial instruments are in a cash flow hedge relationship resulting in the fact that changes in fair value are recognized in other comprehensive income.
The increase in interest expenses in fiscal year 2013/14 is mainly attributable to the issuance of the USD 400 million Senior Note in June 2013 as well as to increased working capital requirements.
Structuring fees are mainly attributable to the amortization of fees capitalized for the EUR 350 million Senior Note, issued July 2007, the EUR 600 million Revolving Credit Facility, entered into June 2011 and amended and extended in June 2014, the EUR 250 million Senior Note, issued June 2011, the USD 400 million Senior Note, issued June 2013 and the EUR 175 million Term Loan Facility, entered into October 2013.
The charges on the undrawn portion of the EUR 600 million Revolving Credit Facility amount to CHF 2.4 million for 2013/14 (2012/13: CHF 4.3 million).
Consolidated Financial StatementsBarry CallebautAnnual Report 2013/14
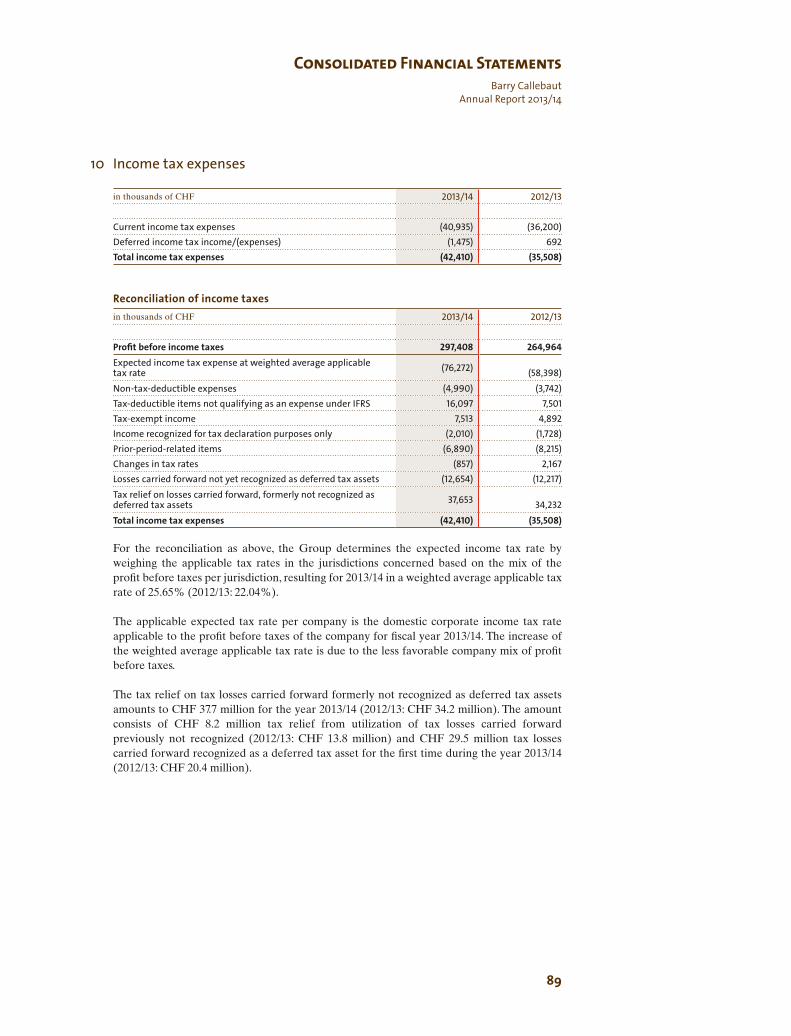
89
10 Income tax expenses in thousands of CHF 2013/14 2012/13
Current income tax expenses (40,935) (36,200)Deferred income tax income/(expenses) (1,475) 692 Total income tax expenses (42,410) (35,508)
Reconciliation of income taxesin thousands of CHF 2013/14 2012/13
Profit before income taxes 297,408 264,964Expected income tax expense at weighted average applicable tax rate (76,272) (58,398)Non-tax-deductible expenses (4,990) (3,742)Tax-deductible items not qualifying as an expense under IFRS 16,097 7,501 Tax-exempt income 7,513 4,892 Income recognized for tax declaration purposes only (2,010) (1,728)Prior-period-related items (6,890) (8,215)Changes in tax rates (857) 2,167 Losses carried forward not yet recognized as deferred tax assets (12,654) (12,217)Tax relief on losses carried forward, formerly not recognized as deferred tax assets 37,653 34,232 Total income tax expenses (42,410) (35,508)
For the reconciliation as above, the Group determines the expected income tax rate by weighing the applicable tax rates in the jurisdictions concerned based on the mix of the profit before taxes per jurisdiction, resulting for 2013/14 in a weighted average applicable tax rate of 25.65% (2012/13: 22.04%).
The applicable expected tax rate per company is the domestic corporate income tax rate applicable to the profit before taxes of the company for fiscal year 2013/14. The increase of the weighted average applicable tax rate is due to the less favorable company mix of profit before taxes.
The tax relief on tax losses carried forward formerly not recognized as deferred tax assets amounts to CHF 37.7 million for the year 2013/14 (2012/13: CHF 34.2 million). The amount consists of CHF 8.2 million tax relief from utilization of tax losses carried forward previously not recognized (2012/13: CHF 13.8 million) and CHF 29.5 million tax losses carried forward recognized as a deferred tax asset for the first time during the year 2013/14 (2012/13: CHF 20.4 million).
Consolidated Financial StatementsBarry Callebaut
Annual Report 2013/14
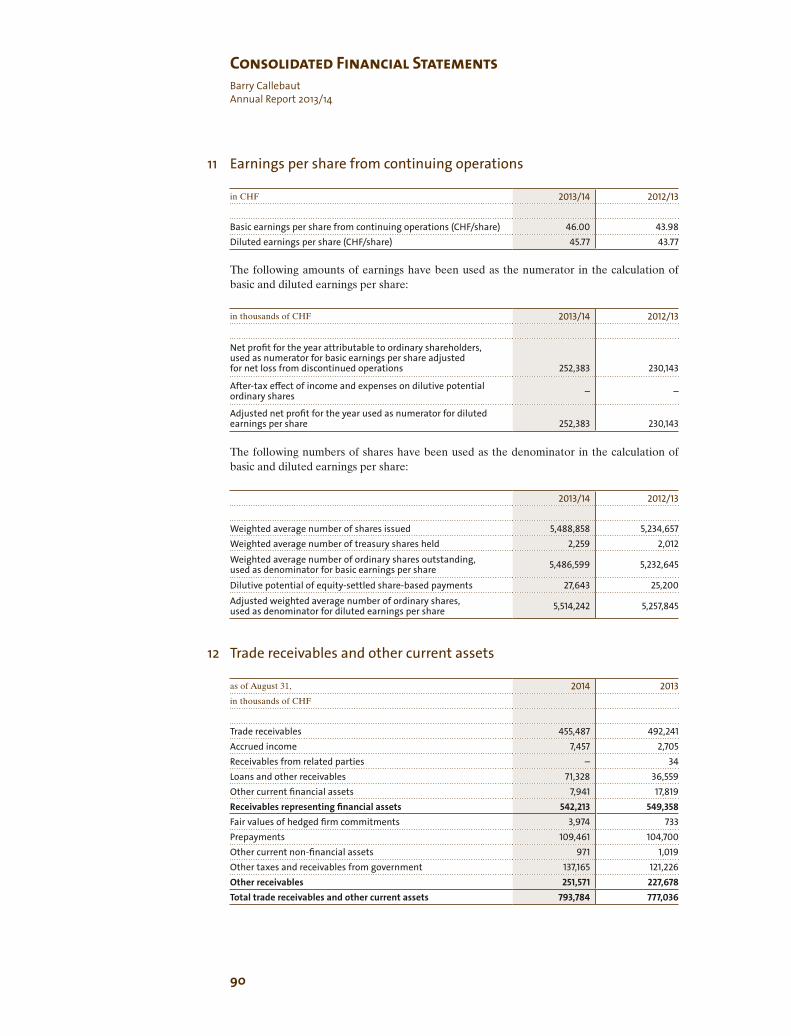
90
11 Earnings per share from continuing operations
in CHF 2013/14 2012/13
Basic earnings per share from continuing operations (CHF/share) 46.00 43.98Diluted earnings per share (CHF/share) 45.77 43.77
The following amounts of earnings have been used as the numerator in the calculation of basic and diluted earnings per share:
in thousands of CHF 2013/14 2012/13
Net profit for the year attributable to ordinary shareholders, used as numerator for basic earnings per share adjusted for net loss from discontinued operations 252,383
230,143
After-tax effect of income and expenses on dilutive potential ordinary shares – –
Adjusted net profit for the year used as numerator for diluted earnings per share 252,383
230,143
The following numbers of shares have been used as the denominator in the calculation of basic and diluted earnings per share:
2013/14 2012/13
Weighted average number of shares issued 5,488,858 5,234,657 Weighted average number of treasury shares held 2,259 2,012 Weighted average number of ordinary shares outstanding, used as denominator for basic earnings per share 5,486,599 5,232,645
Dilutive potential of equity-settled share-based payments 27,643 25,200 Adjusted weighted average number of ordinary shares, used as denominator for diluted earnings per share 5,514,242 5,257,845
12 Trade receivables and other current assets as of August 31, 2014 2013in thousands of CHF
Trade receivables 455,487 492,241Accrued income 7,457 2,705Receivables from related parties – 34Loans and other receivables 71,328 36,559Other current financial assets 7,941 17,819Receivables representing financial assets 542,213 549,358Fair values of hedged firm commitments 3,974 733Prepayments 109,461 104,700Other current non-financial assets 971 1,019Other taxes and receivables from government 137,165 121,226Other receivables 251,571 227,678Total trade receivables and other current assets 793,784 777,036
Consolidated Financial StatementsBarry CallebautAnnual Report 2013/14

91
The Group runs an asset-backed securitization program, whereby trade receivables are sold at their nominal value minus a discount in exchange for cash. The amount of the receivables sold net of discounts is CHF 294.0 million as of August 31, 2014 (2013: CHF 230.6 million), that amount being derecognized from the balance sheet. This amount is the combination of the gross value of the receivables sold (CHF 330.6 million as of August 31, 2014, CHF 255.8 million as of August 31, 2013) and the discount (CHF 36.6 million as of August 31, 2014, CHF 25.2 million as of August 31, 2013).
Net amounts payable to the program amounted to CHF 18.3 million as of August 31, 2014 (2013: CHF 17.1 million), consisting of the balance of receivables collected before the next rollover date of CHF 54.9 million (2013: CHF 42.3 million), less the discount on receivables sold of CHF 36.6 million (2013: CHF 25.2 million). These amounts are included in note 21 – Other payables on a netted basis.
The discount is retained by the program to establish a dilution reserve, a yield reserve, and an insurance first loss reserve.
Interest expense paid under the asset-backed securitization program amounted to CHF 2.9 million in fiscal year 2013/14 (2012/13: CHF 3.1 million) and is reported under interest expenses. Ageing of trade receivablesas of August 31, 2014 2013in thousands of CHF
Total trade receivables 469,963 505,855 Less impairment provision for trade receivables (14,476) (13,614)Total trade receivables 455,487 492,241
Of which:Not overdue 431,546 407,356Impairment provision for trade receivables not overdue (239) (154)Past due less than 90 days 13,311 67,077Impairment provision for trade receivables past due less than 90 days (143) (296)
Past due more than 90 days 25,106 31,422Impairment provision for trade receivables past due more than 90 days (14,094) (13,164)
Total trade receivables 455,487 492,241
The trade receivables are contractually due within a period of 1 to 120 days.
The individually impaired receivables mainly relate to customers, for which recoverability is in question due to their financial situation.
Consolidated Financial StatementsBarry Callebaut
Annual Report 2013/14
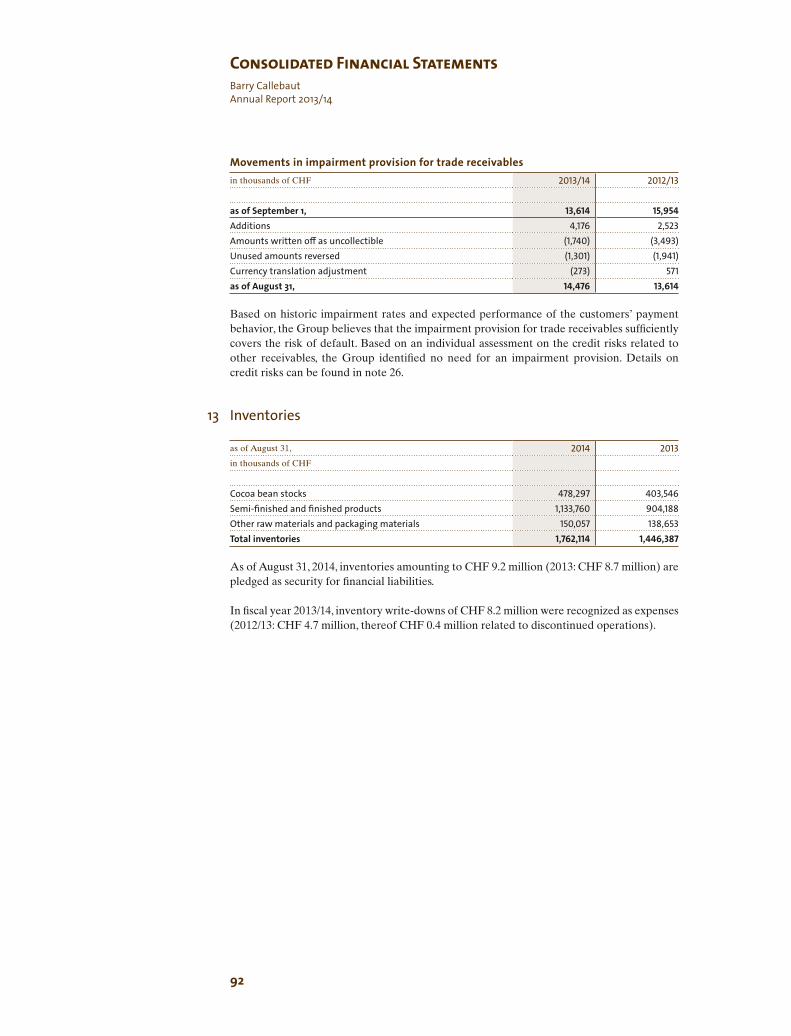
92
Movements in impairment provision for trade receivablesin thousands of CHF 2013/14 2012/13
as of September 1, 13,614 15,954Additions 4,176 2,523Amounts written off as uncollectible (1,740) (3,493)Unused amounts reversed (1,301) (1,941)Currency translation adjustment (273) 571as of August 31, 14,476 13,614
Based on historic impairment rates and expected performance of the customers’ payment behavior, the Group believes that the impairment provision for trade receivables sufficiently covers the risk of default. Based on an individual assessment on the credit risks related to other receivables, the Group identified no need for an impairment provision. Details on credit risks can be found in note 26.
13 Inventories
as of August 31, 2014 2013in thousands of CHF
Cocoa bean stocks 478,297 403,546 Semi-finished and finished products 1,133,760 904,188 Other raw materials and packaging materials 150,057 138,653 Total inventories 1,762,114 1,446,387
As of August 31, 2014, inventories amounting to CHF 9.2 million (2013: CHF 8.7 million) are pledged as security for financial liabilities.
In fiscal year 2013/14, inventory write-downs of CHF 8.2 million were recognized as expenses (2012/13: CHF 4.7 million, thereof CHF 0.4 million related to discontinued operations).
Consolidated Financial StatementsBarry CallebautAnnual Report 2013/14

93
14 Derivative financial instruments and hedging activities
as of August 31, 2014 2013 in thousands of CHF
Derivative financial
assets
Derivative financial
liabilities
Derivative financial
assets
Derivative financial
liabilities
Cash flow hedgesInterest rate risk
Swaps – 12,588 – 7,400 Cocoa price risk
Forward and futures contracts 5,386 3,852 962 815Foreign exchange risk
Forward and futures contracts 746 409 127 28Fair value hedgesForeign exchange risk
Forward and futures contracts 13,782 10,701 7,800 6,610 Other – no hedge accountingRaw materials
Forward and futures contracts and other derivatives 307,913 259,716 120,511 150,730
Foreign exchange riskForward and futures contracts 8,202 35,590 14,886 23,391
Total derivative financial assets 336,029 144,286 Total derivative financial liabilities 322,856 188,974
Derivative financial instruments consist of items used in a cash flow hedging model, items used in a fair value hedging model and fair valued instruments, for which no hedge accounting is applied.
For detailed information on fair value measurement, refer to note 26 – Fair value hierarchy.
Consolidated Financial StatementsBarry Callebaut
Annual Report 2013/14

94
Effect of cash flow hedges on equity in thousands of CHF Cocoa price risk
Foreign exchange risk
Interest rate risk
Total hedging reserve
as of September 1, 2012 – – (5,545) (5,545)
Movements in the period:Gains/(losses) taken into equity (4,871) 2,031 12,904 10,064 Transfer to the Consolidated Income Statement for the period 1,066 946 (562) 1,450 Income taxes 734 (608) (4,195) (4,069)Currency translation adjustment 7 4 (90) (79)
as of August 31, 2013 (3,064) 2,373 2,512 1,821
Movements in the period:Gains/(losses) taken into equity (3,607) (2,788) (6,115) (12,510)Transfer to the Consolidated Income Statement for the period 2,764 (204) (1,517) 1,043Income taxes (254) 425 2,594 2,765Currency translation adjustment (7) (109) 16 (100)
as of August 31, 2014 (4,168) (303) (2,510) (6,981)
Cash flow hedgesIn the course of fiscal year 2013/14, the Group entered into interest rate derivatives (exchanging floating into fixed interest rates) according to the guidelines stipulated in the Group’s Treasury Policy (refer to note 26). In order to avoid volatility in the Consolidated Income Statement, the interest rate derivatives have been put in a cash flow hedge relationship. The following table provides an overview over the periods in which the unwinding of interest rate derivatives and the current cash flow hedges are expected to impact the Consolidated Income Statement (amounts before taxes).
as of August 31, 2014 2013 in thousands of CHF
First year
Second to fifth year
After five years
Expected cash flows
First year
Second to fifth year
After five years
Expected cash flows
Derivative financial assets 1,492 4,695 2,916 9,103 1,525 5,497 3,853 10,875 Derivative financialliabilities (3,194) (9,053) – (12,247) (2,902) (4,595) – (7,497)Total net (1,702) (4,358) 2,916 (3,144) (1,377) 902 3,853 3,378
The Group entered into certain cocoa bean futures as well as foreign exchange forward and futures contracts, which have been put into a cash flow hedge relationship. The amounts recognized within other comprehensive income for these contracts are expected to impact the Consolidated Income Statement within one year.
Fair value hedgesFair value hedges include forward and future contracts designated as the hedging instruments for foreign currency risks.
Consolidated Financial StatementsBarry CallebautAnnual Report 2013/14

95
The fair value of hedged firm commitments is outlined in the table “Hedged firm commitments” below. The balance of these items at balance sheet date is presented under trade receivables and other current assets (see note 12) and trade payables and other current liabilities (see note 21), respectively.
Hedged firm commitmentsas of August 31, 2014 2013in thousands of CHF Assets Liabilities Assets Liabilities
Foreign exchange risk – sales and purchase contracts 3,974 2,127 733 2,357 Total fair value of hedged firm commitments 3,974 2,127 733 2,357
Other – no hedge accountingThis position contains the fair values of derivative financial instruments of the Group’s purchasing and sourcing center and the Group’s Treasury center, which are not designated for hedge accounting.
15 Property, plant and equipment
2013/14
Land and buildings
Plant and machinery
Office equipment,
furniture and motor
vehicles
Under construc-
tion
Total
in thousands of CHF
At costas of September 1, 2013 423,384 1,363,950 95,164 149,713 2,032,211Change in Group structure – acquisitions 78 1 395 – 474Additions 21,678 99,972 14,410 73,793 209,853Disposals (1,262) (3,253) (1,371) (98) (5,984)Currency translation adjustments (7,981) (23,135) (3,327) (4,831) (39,274)Reclassifications from under construction 9,897 69,877 1,131 (89,188) (8,283)as of August 31, 2014 445,794 1,507,412 106,402 129,389 2,188,997
Accumulated depreciation and impairment lossesas of September 1, 2013 169,317 703,730 73,396 28 946,471Depreciation charge 13,892 62,839 6,539 – 83,270Impairment losses 10 – – – 10Disposals (34) (1,934) (588) – (2,556)Currency translation adjustments (2,909) (12,715) (1,103) – (16,727)
as of August 31, 2014 180,276 751,920 78,244 28 1,010,468
Net as of August 31, 2014 265,518 755,492 28,158 129,361 1,178,529
Consolidated Financial StatementsBarry Callebaut
Annual Report 2013/14
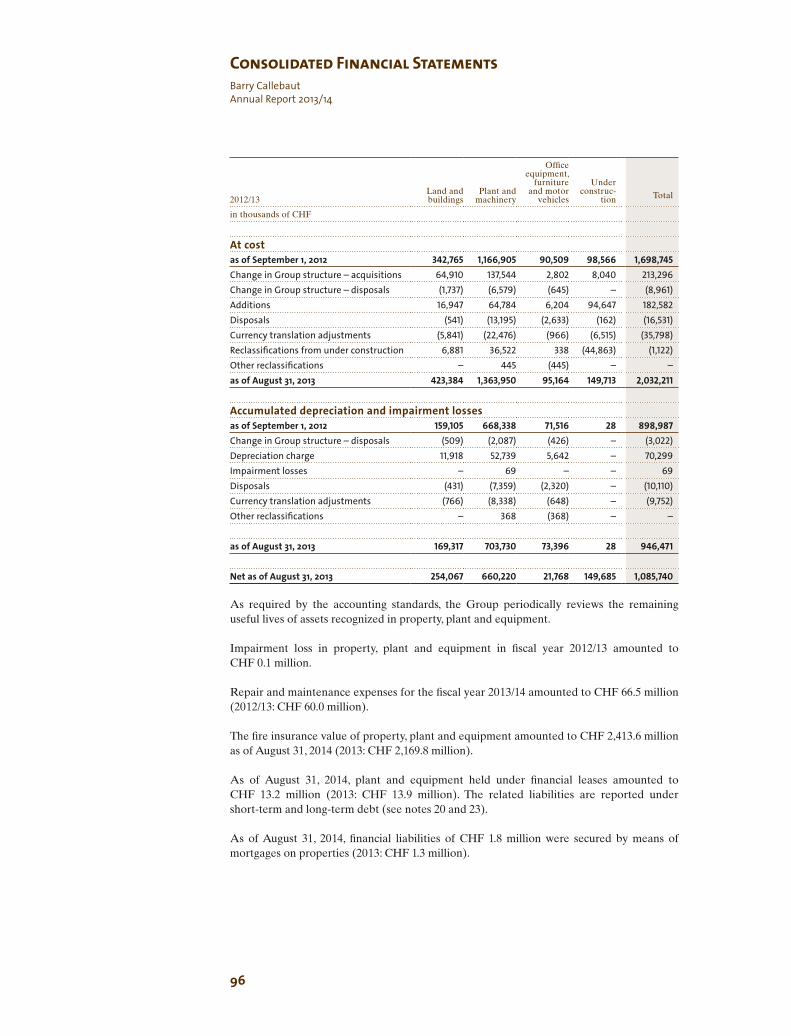
96
2012/13
Land and buildings
Plant and machinery
Office equipment,
furniture and motor
vehicles
Under construc-
tion
Total
in thousands of CHF
At costas of September 1, 2012 342,765 1,166,905 90,509 98,566 1,698,745 Change in Group structure – acquisitions 64,910 137,544 2,802 8,040 213,296 Change in Group structure – disposals (1,737) (6,579) (645) – (8,961)Additions 16,947 64,784 6,204 94,647 182,582 Disposals (541) (13,195) (2,633) (162) (16,531)Currency translation adjustments (5,841) (22,476) (966) (6,515) (35,798)Reclassifications from under construction 6,881 36,522 338 (44,863) (1,122)Other reclassifications – 445 (445) – – as of August 31, 2013 423,384 1,363,950 95,164 149,713 2,032,211
Accumulated depreciation and impairment lossesas of September 1, 2012 159,105 668,338 71,516 28 898,987 Change in Group structure – disposals (509) (2,087) (426) – (3,022)Depreciation charge 11,918 52,739 5,642 – 70,299 Impairment losses – 69 – – 69 Disposals (431) (7,359) (2,320) – (10,110)Currency translation adjustments (766) (8,338) (648) – (9,752)Other reclassifications – 368 (368) – –
as of August 31, 2013 169,317 703,730 73,396 28 946,471
Net as of August 31, 2013 254,067 660,220 21,768 149,685 1,085,740
As required by the accounting standards, the Group periodically reviews the remaining useful lives of assets recognized in property, plant and equipment.
Impairment loss in property, plant and equipment in fiscal year 2012/13 amounted to CHF 0.1 million.
Repair and maintenance expenses for the fiscal year 2013/14 amounted to CHF 66.5 million (2012/13: CHF 60.0 million).
The fire insurance value of property, plant and equipment amounted to CHF 2,413.6 million as of August 31, 2014 (2013: CHF 2,169.8 million).
As of August 31, 2014, plant and equipment held under financial leases amounted to CHF 13.2 million (2013: CHF 13.9 million). The related liabilities are reported under short-term and long-term debt (see notes 20 and 23).
As of August 31, 2014, financial liabilities of CHF 1.8 million were secured by means of mortgages on properties (2013: CHF 1.3 million).
Consolidated Financial StatementsBarry CallebautAnnual Report 2013/14

97
16 Obligations under finance leases
as of August 31, 2014 2013 2014 2013 in thousands of CHF
Minimum lease payments
Present value of minimum lease payments
Amounts payable under finance leases within one year 138 207 112 166 in the second to fifth year inclusive 367 538 335 457 more than five years – – – – Total amount payable under finance leases 505 745 447 623less: future finance charges (58) (122) n/a n/aPresent value of lease obligations 447 623 447 623Amount due for settlement next 12 months (note 20)
112 166
Amount due for settlement after 12 months (note 23)
335 457
The Group entered into finance leasing arrangements for various assets. The weighted average term of finance leases entered into is 6.0 years (2012/13: 5.9 years). The average effective interest rate was 7.1% (2012/13: 6.8%). Interest rates are fixed at the contract date. All leases are on a fixed repayment basis and no arrangement has been entered into for contingent rental payment.
as of August 31, 2014 2013 in thousands of CHF
Net carrying amount of property, plant
and equipment under finance lease
Land and buildings 12,873 13,454 Plant and machinery – 55 Furniture, equipment and motor vehicles 369 415 Total assets under financial lease 13,242 13,924
Consolidated Financial StatementsBarry Callebaut
Annual Report 2013/14

98
17 Equity-accounted investeesThe carrying amount of equity-accounted investees changed as follows:
in thousands of CHF 2013/14 2012/13
as of September 1, 5,088 4,573Additions as part of a business combination – 713Disposal of associates and joint ventures (3,818) –Share of (loss)/profit (119) (49)Exchange rate differences (57) (149)as of August 31, 1,094 5,088
The Group’s investments in equity-accounted investees are attributable to the following companies:
Ownership in % 2014 2013
as of August 31, African Organic Produce AG, Switzerland – 49Biolands International Ltd., Tanzania – 49Shanghai Le Jia Food Service Co. Ltd., China 50 50Nordic Industrial Sales AB, Finland 49 49
On February 18, 2014, the Group’s equity interest in two of its associates, African Organic Produce AG and Biolands International Ltd., increased from 49% to 100% and became a subsidiary since that date (see Note 1). Accordingly, the information presented in the Group’s share of (losses)/ profits in the table below includes the results of the two entities only for the period from September 1, 2013 to February 17, 2014.
Summarized financial information in respect of the Group’s equity-accounted investees is set out below.
in thousands of CHF 2014 2013
Total current assets 4,738 11,846Total non-current assets – 1,131Total current liabilities 2,446 6,460Total non-current liabilities – 186Net assets as of August 31, 2,292 6,331Group’s share of net assets of equity-accounted investees 1,094 5,088
in thousands of CHF 2013/14 2012/13
Total revenue 18,123 19,935Total profit for the year 247 721Other comprehensive income – –Total comprehensive income 247 721Group’s share of (losses)/profits of equity-accounted investees (119) (49)
Consolidated Financial StatementsBarry CallebautAnnual Report 2013/14

99
18 Intangible assets
2013/14
Goodwill
Brand names and licenses
Develop- ment costs
Other
Total
in thousands of CHF
At costas of September 1, 2013 729,988 72,281 273,626 27,555 1,103,450Change in Group structure – acquisitions 4,213 – – – 4,213Additions – 1,113 36,045 1,766 38,924Disposals – – (383) (741) (1,124)Currency translation adjustments (4,455) (284) (4,949) (1,118) (10,806)Reclassified from under construction – – 8,963 (680) 8,283as of August 31, 2014 729,746 73,110 313,302 26,782 1,142,940
Accumulated amortization and impairment lossesas of September 1, 2013 – 37,910 174,761 7,994 220,665Amortization charge – 4,412 24,900 2,622 31,934Disposals – – (267) (510) (777)Impairment losses – – 792 – 792Currency translation adjustments – (97) (3,095) (330) (3,522)
as of August 31, 2014 – 42,225 197,091 9.776 249,092
Net as of August 31, 2014 729,746 30,885 116,211 17,006 893,848
Consolidated Financial StatementsBarry Callebaut
Annual Report 2013/14

100
2012/13
Goodwill
Brand names and licenses
Develop- ment costs
Other
Total
in thousands of CHF
At costas of September 1, 2012 400,524 70,905 232,422 18,431 722,282Change in Group structure – acquisitions 337,718 1,363 1,619 7,729 348,429 Change in Group structure – disposals – (8) (1,430) (36) (1,474)Additions – 25 39,583 1,293 40,901 Disposals – – (24) – (24)Currency translation adjustments (8,254) (4) 334 138 (7,786)Reclassified from under development – – 1,122 – 1,122 as of August 31, 2013 729,988 72,281 273,626 27,555 1,103,450
Accumulated amortization and impairment lossesas of September 1, 2012 – 33,250 156,077 6,430 195,757Change in Group structure – disposals – (2) (1,323) (16) (1,341)Amortization charge – 4,664 19,228 1,253 25,145 Disposals – – (14) – (14)Impairment losses – – 527 240 767 Currency translation adjustments – (2) 266 87 351
as of August 31, 2013 – 37,910 174,761 7,994 220,665 .
Net as of August 31, 2013 729,988 34,371 98,865 19,561 882,785
Additions to development costs amount to CHF 36.0 million in fiscal year 2013/14 (2012/13: CHF 39.6 million). Additions mainly included costs related to various projects of internally generated software, amounting to CHF 31.3 million in fiscal year 2013/14 (2012/13: CHF 33.1 million). Costs related to the development of recipes and innovations of CHF 3.7 million were also capitalized under development costs (2012/13: CHF 4.8 million).
The remaining amortization period for brand names varies between four and ten years, for licenses up to ten years, for software between one and eight years and for other including patents between one and twelve years. The amortization charge is included in the position “General and administration expenses” in the Consolidated Income Statement.
Consolidated Financial StatementsBarry CallebautAnnual Report 2013/14

101
Impairment testing for cash-generating units containing goodwillThe carrying amount of goodwill for the Group amounts to CHF 729.7 million (2012/13: CHF 730.0 million). The allocation to the segments is as follows:
as of August 31, 2014 2013in million CHF
Global Cocoa 447.7 443.2Europe 234.1 238.1Americas 43.4 44.1Asia Pacific 4.5 4.6Total 729.7 730.0
Goodwill acquired in a business combination is allocated to the respective segment that is expected to benefit from the synergies of the combination, at acquisition date. Due to the Group’s fully integrated business in the regions, the segments represent the lowest level within the entity at which the goodwill is monitored for internal management purposes. Thus, the impairment test is performed on a segment level.
For the impairment test, the recoverable amount of a cash-generating unit is based on its value in use and is compared to the carrying amount of the corresponding cash-generating unit. Future cash flows are discounted using a pre-tax rate that reflects current market assessments based on the weighted average cost of capital (WACC).
The Group performs its impairment test during the fourth quarter of the fiscal year. This approach was chosen since the Mid-Term Plan covering the next three fiscal years is updated annually at the beginning of the fourth quarter. The Mid-Term Plan is based on the as sumption that there are no major changes to the Group’s organization. The residual value is calculated from an estimated continuing value, which is primarily based on the third year of the Mid-Term Plan. The terminal growth rate used for determining the residual value does not exceed the expected long-term growth rate of the industry.
Key assumptions used for value-in-use calculations2014 2013
Discount rate
Terminal growth rate
Discount rate
Terminal growth rate
Global Cocoa 5.9% 2.1% 6.6% 2.0%Europe (excluding discontinued operations) 5.4% 1.6% 6.5% 1.5%Americas 6.5% 1.3% 6.6% 1.4%Asia Pacific 6.2% 4.5% 7.4% 4.7%
Based on the impairment tests, no need for recognition of impairment losses in fiscal year 2013/14 has been identified.
The key sensitivities in the impairment test are the WACC as well as the terminal growth rate. The Group has carried out a sensitivity analysis, containing various scenarios. Taking reasonable possible changes in key assumptions into account, no impairment losses have been revealed.
Consolidated Financial StatementsBarry Callebaut
Annual Report 2013/14

102
19 Deferred tax assets and liabilities
Movement in deferred tax assets and liabilities
Inventories
Property, plant, equipment/
intangible assets
Other assets
Provisions
Other
liabilities
Tax loss carry-
forwards
Total
in thousands of CHF
as of September 1, 2012 (8,131) (13,196) (7,522) (589) 11,614 51,802 33,978
Charged to the income statement (continuing operations) 5,854 (9,073) 13,314 (10,184) (13,114) 13,895 692Charged to equity – – (4,111) – 718 – (3,393)Effect of acquisitions – (10,786) 15,744 216 (658) 129 4,645 Effect of disposals – – (75) – – (1,434) (1,509)Currency translation effects (118) 1,111 (3,482) 1,285 (2,831) (1,170) (5,205)as of August 31, 2013 (2,395) (31,944) 13,868 (9,272) (4,271) 63,222 29,208
Charged to the income statement (6,283) (8,566) (19,062) 9,890 19,772 2,774 (1,475)
Charged to equity – (6) 74 – 7,966 – 8,034Currency translation effects 139 366 (940) 84 390 (496) (457)as of August 31, 2014 (8,539) (40,150) (6,060) 702 23,857 65,500 35,310
The effect of acquisitions for fiscal year 2012/13 is related to the fair value measurement at acquisition of the compound manufacturing business of the Batory Industries Company, ASM Foods AB and the Cocoa Ingredients Division of Petra Foods Ltd.
Deferred tax assets and liabilities as of August 31, 2013, and as of August 31, 2012, were restated to reflect the deferred tax impact of the revised IAS 19 standard. This restatement resulted in an increase in net deferred tax assets as at August 31, 2013, by CHF 1.5 million, which was recognized through other comprehensive income. For fiscal year 2013/14, deferred tax income recognized in equity amounted to CHF 8.0 million and relates to the deferred tax impact on remeasurement due to the revised IAS 19 standard (CHF 5.2 million) and to cash flow hedging reserves (CHF 2.8 million).
Recognized deferred tax assets and liabilitiesThe recognized deferred tax assets and liabilities, without taking into consideration the offsetting of balances within the same tax jurisdiction, are attributable to the following:
as of August 31, 2014 2013in thousands of CHF Assets Liabilities Net Assets Liabilities Net
Inventories 4,860 (13,399) (8,539) 4,026 (6,421) (2,395)Property, plant & equipment/intangible assets 36,787 (76,937) (40,150) 37,298 (69,242) (31,944)Other assets 31,642 (37,702) (6,060) 34,350 (20,482) 13,868 Provisions 1,336 (634) 702 54 (9,326) (9,272)Other liabilities 33,147 (9,290) 23,857 9,117 (13,388) (4,271)Tax loss carry-forwards 65,500 – 65,500 63,222 – 63,222 Tax assets/(liabilities) 173,272 (137,962) 35,310 148,067 (118,859) 29,208Set-off of tax (78,298) 78,298 – (59,876) 59,876 –
Reflected in the balance sheet 94,974 (59,664) 35,310 88,191 (58,983) 29,208
Consolidated Financial StatementsBarry CallebautAnnual Report 2013/14

103
Tax losses carried forward excluded from recognition of related deferred tax assetsTax losses carried forward not recognized as deferred tax assets have the following expiry dates:
as of August 31, 2014 2013in thousands of CHF
Expiry:Within 1 year 6,689 4,539After 1 up to 2 years 7,574 646After 2 up to 3 years 5,932 8,538After 3 up to 10 years 98,344 231,896After 10 years 65,240 7,599Unlimited 208,036 180,661Total unrecognized tax losses carried forward 391,815 433,879
Tax losses carried forward are assessed for future recoverability based on a business plan and projection for the related companies. Those are capitalized only if the usage within medium term is probable.
Tax losses carried forward utilized during the year 2013/14 were CHF 74.3 million (2012/13: CHF 74.6 million). The related tax relief amounted to CHF 25.7 million, of which CHF 17.5 million were already recognized as a deferred tax asset in the year before (2012/13: CHF 16.8 million of which CHF 3.0 million were already recognized as a deferred tax asset in the year before).
As of August 31, 2014, the Group had unutilized tax losses carried forward of approximately CHF 581.3 million (2013: approximately CHF 620.2 million) available for offset against future taxable income.
Of the total tax losses carried forward, an amount of CHF 189.5 million has been recognized for deferred taxation purposes resulting in a deferred tax asset of CHF 65.5 million (2012/13: CHF 186.3 million recognized resulting in a deferred tax asset of CHF 63.2 million).
Consolidated Financial StatementsBarry Callebaut
Annual Report 2013/14

104
20 Bank overdrafts and short-term debt
as of August 31, 2014 2013 2014 2013in thousands of CHF Carrying amounts Fair values
Bank overdrafts 17,559 14,311 17,559 14,311 Commercial paper 371,000 130,804 371,000 130,804 Short-term bank debts 85,733 97,751 85,733 97,751 Short-term portion of long-term bank debts (note 23) 706 1,042 706 1,042 Interest-bearing loans from employees – 1 – 1 Finance lease obligations (note 16) 112 166 112 166 Short-term debt 457,551 229,764 457,551 229,764 Bank overdrafts and short-term debt 475,110 244,075 475,110 244,075
Short-term financial liabilities are mainly denominated in EUR, CHF, USD and XAF as shown in the table below:
as of August 31, 2014 2013Split per currency Amount Interest range Amount Interest range
in thousands of CHF from to from to
EUR 244,843 0.31% 3.00% 150,170 0.28% 3.32%CHF 101,513 0.60% 1.50% 3,832 1.50% 1.50%USD 82,582 0.33% 4.25% 67,342 0.36% 4.23%XAF 19,830 2.96% 6.00% 15,762 5.00% 6.00%TRL 8,880 8.69% 8.69% 4,230 10.25% 10.25%CLP 8,393 3.00% 4.00% – n/a n/aBRL 6,093 12.50% 14.00% 637 4.50% 4.50%Other 2,976 0.03% 9.50% 2,102 0.04% 6.50%Total 475,110 0.03% 14.00% 244,075 0.04% 10.25%
as of August 31, 2014 2013in thousands of CHF
Split fixed/floating interest rate: Fixed rate 1,518 4,353 Floating rate 473,592 239,722 Total bank overdrafts and short-term debt 475,110 244,075
Consolidated Financial StatementsBarry CallebautAnnual Report 2013/14

105
21 Trade payables and other current liabilities
as of August 31, 2014 2013in thousands of CHF
Trade payables 604,822 521,507 Amounts due to related parties 1,038 1,400 Accrued expenses 82,329 57,513 Other payables 93,871 113,615 Payables representing financial liabilities 782,060 694,035 Accrued wages and social security 82,241 73,240 Fair value of hedged firm commitments (note 14) 2,127 2,357 Other taxes and payables to governmental authorities 24,765 24,322 Deferred income 70 –Other liabilities 109,203 99,919 Total trade payables and other current liabilities 891,263 793,954
The Group also has payables related to the asset-backed securitization program, see note 12.
Other payables also consist of outstanding ledger balances with commodity brokers.
22 Provisions
2013/14
Restructuring
Litigation & claims
Other
Total
in thousands of CHF
as of September 1, 2013 132 7,304 9,804 17,240Change in Group structure – acquisitions – – 542 542Additions 1,238 1,599 293 3,130Use of provisions (135) (67) (3,582) (3,784)Release of unused provisions – (40) (450) (490)Currency translation adjustments (19) (29) (254) (302)as of August 31, 2014 1,216 8,767 6,353 16,336
of which:Current 1,216 3,921 3,498 8,635Non-current – 4,846 2,855 7,701
Consolidated Financial StatementsBarry Callebaut
Annual Report 2013/14

106
2012/13
Restructuring
Litigation & claims
Other
Total
in thousands of CHF
as of September 1, 2012 452 4,532 9,797 14,781 Change in Group structure – acquisitions – 1,094 2,004 3,098 Additions 27 2,843 6,543 9,413 Use of provisions (357) (495) (6,736) (7,588)Release of unused provisions – – (731) (731)Currency translation adjustments 10 (670) (1,073) (1,733)as of August 31, 2013 132 7,304 9,804 17,240
of which:Current 132 6,259 5,794 12,185 Non-current – 1,045 4,010 5,055
RestructuringAdditions to restructuring provisions in 2013/14 mainly related to plant reorgani zations.
Litigation & claimsThe amount includes provisions for certain litigations and claims that have been set up to cover legal and administrative proceedings that arise in the ordinary course of business. In management’s opinion, after taking appropriate legal advice, the outcome of these legal claims will not give rise to any significant loss beyond the amounts provided as of August 31, 2014.
Other provisions Other provisions relate mainly to amounts that have been provided to cover the negative outcome of onerous contracts and a smaller portion is related to tax matters.
Consolidated Financial StatementsBarry CallebautAnnual Report 2013/14

107
23 Long-term debt
as of August 31, 2014 2013 2014 2013in thousands of CHF Carrying amounts Fair values
Senior notes 1,070,460 1,090,743 1,217,485 1,199,464 Long-term bank debts 338,509 271,826 338,509 271,826 Less current portion (note 20) (706) (1,042) (706) (1,042)Interest-bearing loans from employees 65 70 65 70 Long-term other loans 7,397 1,406 7,397 1,406 Finance lease obligation (note 16) 335 457 335 457
Total long-term debt 1,416,060 1,363,460 1,563,085 1,472,181
On July 13, 2007, the Group issued a 6% Senior Note with maturity in 2017 for an amount of EUR 350 million. The Senior Note has been issued at a price of 99.005% and includes a coupon step-up clause of 0.25% (limited to 1.00% per annum) per downgraded notch per rating agency.
On June 15, 2011, the Group issued a 5.375% Senior Note with maturity in 2021 for an amount of EUR 250 million. The Senior Note has been issued at a price of 99.26% and includes a coupon step-up clause of 0.25% (limited to 1.00% per annum) per downgraded notch per rating agency. As per August 31, 2014, the coupon amounts to 5.625% as a result of a 0.25% step-up.
On June 15, 2011, the Group entered into a EUR 600 million Revolving Credit Facility (as amended and extended as per June 17, 2014) with maturity in 2019.
On June 20, 2013, the Group issued a 5.5% Senior Note with maturity in 2023 for an amount of USD 400 million. The Senior Note has been issued at a price of 98.122% and includes a coupon step-up clause of 0.25% (limited to 1.00% per annum) per downgraded notch per rating agency.
On October 24, 2013, the Group entered into a EUR 175 million Term Loan Facility with maturity in 2016. At the request of the Group, the maturity date can be extended by one year (such a request is to be issued in the course of March and April 2015) and is subject to approval by the participating banks.
The EUR 350 million Senior Note, the EUR 250 million Senior Note, the EUR 600 million Revolving Credit Facility, the USD 400 million Senior Note and the EUR 175 million Term Loan Facility all rank pari passu. The Senior Notes as well as the EUR 600 million Revolving Credit Facility and the EUR 175 million Term Loan Facility are guaranteed by Barry Callebaut AG and certain of its subsidiaries.
Consolidated Financial StatementsBarry Callebaut
Annual Report 2013/14

108
As a result, the maturity profile of the long-term debt can be summarized as follows:
as of August 31, 2014 2013in thousands of CHF
2014/15 – 6,351 2015/16 238,089 250,8882016/17 431,316 433,315 2017/18 3,826 3,923 2018/19 (and thereafter for 2013) 90,021 668,983 2019/20 and thereafter (for 2014) 652,808 –Total long-term debt 1,416,060 1,363,460
The weighted average maturity of the total debt decreased from 6.3 to 5.3 years.
Long-term financial liabilities are to a major extent denominated in EUR and USD and at fixed interest rates.
as of August 31, 2014 2013Split per currency Amount Interest range Amount Interest range
in thousands of CHF from to from to
EUR 1,011,403 1.32% 7.11% 971,231 3.13% 7.11%USD 378,174 3.00% 5.50% 365,840 5.50% 5.50%BRL 13,256 4.50% 8.00% 12,193 8.00% 8.00%JPY 13,215 1.67% 1.67% 14,190 1.42% 1.42%Other 12 6.80% 6.80% 6 6.80% 6.80%Total long-term debt 1,416,060 1.32% 8.00% 1,363,460 1.42% 8.00%
as of August 31, 2014 2013in thousands of CHF
Split fixed/floating interest rate: Fixed rate 1,288,732 1,339,218 Floating rate 127,328 24,242 Total long-term debt 1,416,060 1,363,460
Consolidated Financial StatementsBarry CallebautAnnual Report 2013/14
109
24 Employee benefit obligations
A. Defined benefit plansThe Group operates, apart from legally required social security schemes, a number of independent defined retirement benefit plans and other postretirement or long-term employee benefit plans, which conform to local legal and tax requirements. The majority of the Group’s reported employee benefit obligations relates to plans located in the USA, Belgium, United Kingdom, and Switzerland.
Defined benefit plans cover employees and certain family members in the event of retirement, disability, death in service or termination of employment. Other nonretirement-related defined benefit plans in a small number of Group entities include postretirement benefit plans as well as long-service award plans for active employees. In most cases, these plans are externally funded in vehicles that are legally separate from the employer and operated by external service providers. However, for certain Group entities representing a small minority of the reported employee benefit obligations, no independent plan assets exist for defined benefit plans. For these plans, the related unfunded liability is included in the balance sheet.
The Group’s employee benefit schemes are exposed to changes in legislation and to investment return and matching risks, longevity risks and solvency risks. These risks may all require additional contributions and are therefore reviewed on a regular basis by the companies’ management or by the relevant Board of Trustees as follows:• Changes in legislation: monitoring of country-specific legislation changes• Investment return risk: analysis and optimization of the allocation and performance of
assets as well as monitoring of compliance with investment guidelines• Investment matching risk: analysis and optimization of asset-liability matching and
periodic fair valuation of assets and liabilities• Longevity risk: analysis of mortality assumptions and monitoring of demographic
development• Solvency risk: monitoring of solvency of external solution providers
Employee benefit plans in SwitzerlandThe retirement benefit plans for all Swiss Group entities are defined benefit plans where contributions are expressed as a percentage of the insured actual salary. Members benefit from a guaranteed minimum interest on accrued savings and conversion rates at retirement in accordance with the Swiss Federal Law on compulsory occupational pension plans (BVG). This law defines the minimum pensionable salary and the minimum retirement credits. In addition to retirement benefits, the Swiss retirement benefit plans also provide for temporary partial or total disability benefits as well as for pre-retirement death benefits including widows’ and orphans’ benefits.
The benefit plans are outsourced to external insurance companies, which are responsible for the operation of the plan including the allocation of plan assets. The governance and the supervision as well as the responsibility to make changes in the plan lie with a Board of Trustees. It consists equally of employer and employee nominated representatives.
The applicable regulation requires the retirement benefit plans of all Swiss Group entities to be funded on the basis of employer and employee contributions, including risk premiums and savings contributions. In case of underfunding, recovery measures must be taken, such as additional financing from the employer or from the employer and employees, or reduction of benefits or combination of both.
Consolidated Financial StatementsBarry Callebaut
Annual Report 2013/14

110
Other benefit plansIn the USA, the Group maintains a retirement benefit plan only for pensioners and deferred pensioners related to a discontinued operation. In addition, the Group offers a defined postretirement medical benefit plan for active employees. This plan is governed by a Board of Trustees.
In Belgium, the Group operates defined benefit plans for events of retirement, actual and potential early retirement, temporary and permanent disability and death in service as well as a long-service award plan. The retirement benefit plans are funded by a combination of employer and employee contributions as regulated by the Belgian Pension Act.
In the United Kingdom, the Group operates a defined benefit retirement scheme in which members receive benefits based on the final salary with the contributions paid by the employer and the employees. This plan is, however, closed to new entrants and frozen for the existing beneficiaries as of January 31, 2014. As of February 1, 2014, all eligible employees are covered by a defined contribution plan which is run by a Board of Trustees in accordance with the UK Pension legislation.
For all of its defined benefit plans, the Group expects to pay CHF 13.5 million in employer contributions in fiscal year 2014/15.
The amounts recognized in the Consolidated Balance Sheet are determined as follows:
as of August 31, 2014 2013 2014 2013restated restated
in thousands of CHF
Defined benefit pension plans
Other long-term employment benefit plans
Present value of funded obligations 302,572 269,427 – – Fair value of plan assets (183,017) (163,306) – – Excess of liabilities (assets) of funded obligations 119,555 106,121 – –
Present value of unfunded obligations 10,567 10,256 16,871 16,166 Unrecognized assets – 12 – –
Net employee benefit obligations recognized in the balance sheet 130,122 116,389 16,871 16,166 thereof recognized as an asset – – – – thereof recognized as a liability 130,122 116,389 16,871 16,166
Consolidated Financial StatementsBarry CallebautAnnual Report 2013/14

111
The changes in the present value of the employee benefit obligations are as follows:
2013/14 2012/13 2013/14 2012/13restated restated
in thousands of CHF
Defined benefit pension plans
Other long-term employment benefit plans
Present value of defined benefit obligationas of September 1, 279,683 255,837 16,166 11,121 Current service cost 13,038 10,637 887 555 Past service cost (2,487) 109 – 346 Interest expense 9,565 8,439 745 350 Losses (gains) on curtailment 3 (31) 112 – Total recognized in income statement 20,119 19,154 1,744 1,251Actuarial losses (gains), thereof 23,895 18,656 163 265
Arising from changes in demographic assumptions 2,305 8,264 (85) –
Arising from changes in financial assumptions 16,006 9,447 85 –Arising from experience adjustments 5,584 945 163 265
Total recognized in other comprehensive income 23,895 18,656 163 265
Liabilities assumed in business combination – 75 – 3,970Reclassifications 45 (1) (152) – Exchange differences on foreign plans 282 (2,030) (289) 258Benefits received 3,237 5,053 (664) (458)Benefits paid (14,122) (17,061) (97) (241)Reclassification to held for sale – – – –Total other (10,558) (13,964) (1,202) 3,529Present value of defined benefit obligation as of August 31, 313,139 279,683 16,871 16,166
thereof funded obligations 302,572 269,427 – – thereof unfunded obligations 10,567 10,256 16,871 16,166
Consolidated Financial StatementsBarry Callebaut
Annual Report 2013/14

112
The movement in the fair value of plan assets is as follows:
2014 2013 2014 2013restated restated
in thousands of CHFDefined benefit pension plans
Other long-term employment benefit plans
Opening fair value of plan assets as of September 1, 163,306 150,569 – –
Interest income 4,599 4,473 – –Contributions by employees 3,726 3,247 – –Total recognized in income statement 8,325 7,720 – –Return on plan assets excl. interest income 7,122 6,403 – –Total recognized in other comprehensive income 7,122 6,403 – –
Unrecognized assets 12 (12) – –Contributions by employer 13,168 11,863 – –Exchange differences 782 (2,559) – –Benefits received 3,237 5,053 – – Benefits paid (12,935) (15,731) – –Total other 4,264 (1,386) – –Fair value of plan assets as of August 31, 183,017 163,306 – –
The plan assets consist of the following categories of securities:
as of August 31, 2014 2013 in thousands of CHF
Defined benefit pension plans
Equities 91,538 55,279 Bonds 26,324 27,270 Cash and other assets 65,155 80,757 Total fair value of plan assets 183,017 163,306
The plan assets do not include ordinary shares issued by the Company nor any property occupied by the Group or one of its affiliates.
The amounts recognized in the Consolidated Income Statement are as follows:
2013/14 2012/13 2013/14 2012/13restated restated
in thousands of CHF
Defined benefit pension plans
Other long-term employment benefit plans
restated restated
Current service costs 13,038 10,637 887 555 Net interest expense 4,966 3,966 745 350 Past service cost (2,487) 109 – 346 Losses (gains) on curtailments and settlements 3 (31) 112 – Contributions by employees (3,726) (3,247) – – Total defined benefit expenses 11,794 11,434 1,744 1,251
Actual return on plan assets 11,721 10,876 – –
Consolidated Financial StatementsBarry CallebautAnnual Report 2013/14

113
in thousands of CHF 2013/14 2012/13restated
Total defined contribution expenses (2,605) (1,276)
The defined benefit expenses are recognized in the following line items in the Consolidated Income Statement:
in thousands of CHF 2013/14 2012/13restated
Cost of goods sold (1,206) (3,558)Marketing and sales expenses (1,103) (968)General and administration expenses (4,196) (3,503)Research and development expenses (272) (330)Other income 94 (6)Other expenses (1,144) (4)Finance costs (5,711) (4,316)Total defined benefit expenses recognized in income statement (13,538) (12,685)
Weighted average actuarial assumptions used are as follows:
2013/14 2012/13 2013/14 2012/13 Defined benefit
pension plansOther long-term
employment benefit plans
Discount rate 3.1% 3.7% 4.6% 4.2%Expected rate of pension increase 1.0% 1.0% 0.7% 1.0%Expected rate of salary increase 1.2% 1.6% 1.7% 2.7%Medical cost trend rates 0.0% 0.0% 2.0% 6.9%
Reasonable and possible changes at the reporting date to one of the relevant actuarial assumptions, with all other assumptions held constant, would have affected the defined benefit obligations by the amounts shown below:
as of August 31, 2014 2013 2014 2013 in thousands of CHF Increase Decrease
Discount rate (1% movement) (47,995) (32,687) 47,995 32,687Expected rate of salary increase (1% movement) 13,629 11,697 (13,629) (11,697)
The applicable mortality tables in the Group’s major defined benefit plans and underlying longevity assumptions are summarized in the following table:
Country Mortality table 2014 2013 2014 2013
in years Life expectancy at age 65 for a male member currently aged 65
Life expectancy at age 65 for a female member
currently aged 65
Switzerland LPP 2010 19 19 21 21Belgium MRIFR 18 18 21 21United Kingdom S1NMA / S1NFA 18 18 20 20USA RP-2000 18 18 20 20
Consolidated Financial StatementsBarry Callebaut
Annual Report 2013/14

114
B. Equity compensation benefitsEmployee stock ownership programShare awards are granted to participants according to individual contracts and the current employee stock ownership program (called “Deferred Share Plan”, effective 2011–2014). The Nomination & Compensation Committee determines the number and value of share awards granted at its discretion. In the past, the value for the granted share awards has been zero. The share awards granted entitle the participants to full shareholders rights upon vesting. The vesting periods are ranging between one and three years. In case of resignation or dismissal, the initially granted but not yet vested share awards become forfeited. The Group currently uses treasury shares for this program.
The fair value of the share awards granted is measured at the market price at grant date. 13,598 share awards were granted in fiscal year 2013/14 (14,539 share awards in 2012/13). The average fair value of the share awards granted during the fiscal year 2013/14 amounted to CHF 904 (2012/13: CHF 875). The fair value of the share awards at grant date is recognized over the vesting period as a personnel expense. For 2013/14, the amount recognized (before taxes) was CHF 12.8 million with a corresponding increase in equity (2012/13: CHF 12.3 million).
In addition, each participant was entitled to receive an upside bonus calculated on each share award granted during the Grant Cycle, i.e. over the period 2011–2014. This upside bonus was payable if the average share price over the past three months at the end of the Grant Cycle exceeded a certain hurdle share price defined by the Board of Directors at the onset of the Grant Cycle (3-year compound average growth rate, “CAGR”, of 7%). The rationale for the upside bonus was to compensate the Management for a change from the system of share award grants based on a fixed amount of shares to a system of share award grants based on grant values. As the share price development of Barry Callebaut over the past three years exceeded the hurdle share price defined by the Board of Directors, the participants of the Deferred Share Plan 2011–2014 received an upside bonus, amounting to CHF 10,971,901.
25 Equity
Share capitalas of August 31, 2014 2013 2012in thousands of CHF
Share capital is represented by 5,488,858 (2013: 5,488,858; 2012: 5,170,000) authorized and issued shares of each CHF 18.60 fully paid in (in 2013: 18.60; in 2012: 24.20)
102,093
102,093
125,114
The issued share capital is divided into 5,488,858 registered shares with a nominal value of CHF 18.60 (2013: CHF 18.60). All of the issued shares are fully paid and validly issued and are not subject to calls for additional payments of any kind. The Company has one class of shares, which carries no right to a fixed dividend.
By resolution of the Annual General Meeting on December 11, 2013, the shareholders approved the proposed dividend payment of CHF 14.50 per share, effected through a dividend payment from reserves from capital contributions. The respective payment to the shareholders in the amount of CHF 79,588,441 took place on March 3, 2014.
Consolidated Financial StatementsBarry CallebautAnnual Report 2013/14

115
For fiscal year 2012/13, the payout of CHF 15.50 per share consisted of a dividend of CHF 9.90 per share out of free reserves originating from the remaining reserves from capital contributions combined with a capital repayment of CHF 5.60 per share by way of par value reduction. The respective capital reduction and repayment in the amount of CHF 28,952,000 and the dividend payment in the amount of CHF 51,165,000 took place on March 4, 2013.
The Extraordinary General Meeting of Shareholders held on April 22, 2013, approved authorized share capital up to a maximum of CHF 9.3 million until April 22, 2015 to finance part of the acquisition of the Cocoa Ingredients Division of Petra Foods Ltd. The share capital was increased by CHF 5,930,758.80 to CHF 102,092,758.80 by issuing 318,858 shares with a nominal value of CHF 18.60 each on June 14, 2013. The value of the share issuance wasCHF 279.0 million resulting in net proceeds of CHF 273.1 million after deduction of transaction costs and taxes.
Treasury shares are valued at weighted average cost and, in accordance with IFRS, have been deducted from equity. The book value of the treasury shares as of August 31, 2014 amounted to CHF 11.4 million (2013: CHF 3.3 million). The fair value of the treasury shares as of August 31, 2014 amounted to CHF 11.0 million (2013: CHF 3.3 million).
As of August 31, 2014, the number of outstanding shares amounted to 5,479,102 (2013: 5,485,098) and the number of treasury shares to 9,756 (2013: 3,760). During this fiscal year, 17,287 shares have been purchased, 11,291 transferred to employees under the employee stock ownership program and 0 sold (2012/13: 13,788 purchased; 13,259 transferred and 0 sold).
Retained earningsAs of August 31, 2014, retained earnings contain legal reserves of CHF 31.9 million (2013: CHF 23.7 million), which are not distributable to the shareholders pursuant to Swiss law.
Hedging reserves comprise the effective portion of the cumulative net change in the fair value of cash flow hedging instruments related to hedged transactions that have not yet occurred.
Cumulative translation adjustments comprise all foreign currency differences arising from the trans lation of the financial statements of foreign operations.
Movements in non-controlling interestsin thousands of CHF 2013/14 2012/13
as of September 1, 3,743 4,662Non-controlling share of profits/(losses) 2,615 (687)Dividends paid to non-controlling shareholders (917) (129)Currency translation adjustment (356) (72)Effect of parent increase in Barry Callebaut Pastry Manufacturing Ibérica SL – (31)
as of August 31, 5,085 3,743
The non-controlling interests are individually not material for the Group.
Consolidated Financial StatementsBarry Callebaut
Annual Report 2013/14

116
26 Financial risk managementThe nature of its business exposes the Group to a variety of financial risks including the effects of changes in market prices (commodity prices, foreign exchange rates, interest rates) as well as credit risks and liquidity risks.
The Group’s overall strategy for managing these risks is consistent with the Group’s objectives to maintain cost leadership, reduce earnings volatility in a cost-effective manner and minimize potential adverse effects of such market exposures on the financial performance of the Group. The Group’s risk management continuously monitors the entities’ exposures to commodity price risk, foreign currency risk and interest rate risk as well as the use of derivative instruments.
The Group manages its business based on the following two business models:• Contract Business: Sales contracts for industrial or gourmet chocolate, where Barry
Callebaut has entered into contracts with customers to deliver fixed quantities at fixed prices. These contractually fixed prices are generally based on the forward market prices of the raw material components valid at the contract date for the forward delivery date, at which the chocolate is planned to be delivered to the customers.
• Price List Business: Barry Callebaut sets price lists for certain gourmet products. These price lists are normally updated at intervals of six to twelve months. Customers buy products based on the issued price lists without fixed commitments on quantities.
Commodity price risksThe Group’s purchasing and sourcing center operates as an integral part of the Group, but also acts as a broker-trader in the sense that it makes sourcing and risk management decisions for cocoa beans and semi-finished cocoa products based on market expectations, separate from the manufacturing business and its third-party sales commitments. Its objectives are to generate profits from fluctuations in cocoa prices or broker-trader margins. Additionally, the manufacturing of the Group’s products requires raw materials such as cocoa beans, sweeteners, dairy, nuts, oil and fats. Therefore, the Group is exposed to price risks relating to the trading business as well as to the purchase and sale of raw materials.
The fair value of the Group’s open sales and purchase commitments and inventory changes are continuously in line with price movements in the respective commodity markets. It is the Group’s policy to hedge its commodity price risk resulting from its inventory, commodity derivatives and purchase and sales contracts. The cocoa price risk in inventory is hedged with short futures applying fair value hedge accounting. The Group also applies cash flow hedge accounting whereby the cocoa price risk and foreign exchange risk from forecasted cocoa sale and purchase contracts is hedged with cocoa bean futures and foreign exchange forward and future contracts. The related accounting treatments are explained in the section “Summary of Accounting Policies” under the caption “Derivative financial instruments and hedging activities”.
The Group Commodity Risk Committee (GCRC) is a committee consisting of key risk management stakeholders of the Group who meet on a regular basis (at least every six weeks) to discuss Group Commodity Risk Management issues. The GCRC monitors the Group’s Commodity Risk Management activities and acts as the decision-taking body for the Group in this respect. The members of the GCRC include the Group’s Chief Executive Officer (CEO), the Group’s Chief Financial Officer (CFO) – acting as Chairman of the committee –, the President of Global Cocoa, and the Head of Group Controlling & Risk Management (GRM).
Consolidated Financial StatementsBarry CallebautAnnual Report 2013/14

117
The GCRC reports via the GRM to the Group’s Audit, Finance, Risk, Quality & Compliance Committee (AFRQCC) and must inform the latter about key Group Commodity Risk issues and the key mitigation decisions taken. The AFRQCC reviews and approves GCRC requests and makes sure that the commodity risk management strategy is consistent with the Group’s objectives. It also sets the Group’s Value at Risk (VaR) limit for the major raw material components. The AFRQCC makes recommendations to the Board of Directors if deemed necessary and advises the Board of Directors on important risk matters and/or asks for approval.
In order to quantify and manage the Group’s consolidated exposure to commodity price risks, the concept of historical VaR is applied. The VaR concept serves as the analytical instrument for assessing the Group’s commodity price risk incurred under normal market conditions. The VaR indicates the loss which, within a time horizon of 10 days for raw materials, will not be exceeded at a confidence level of 95%, using 7 years of historical market prices for each major raw material component. The VaR is complemented through the calculation of the expected shortfall and worst cases as well as the use of stress test scenarios. However, liquidity and credit risks are not included in the calculation, and the VaR is based on a static portfolio during the time horizon of the analysis. The GCRC breaks down the Group VaR limit into VaR limits for Global Cocoa and for Global Sourcing. The heads of Global Cocoa and Global Sourcing allocate limits in metric tons to the related risk reporting units. The Board of Directors is the highest approval authority for all Group Commodity Risk Management (GCRM) matters and approves the GCRM Policy as well as the Group VaR limit.
The VaR framework of the Group is based on the standard historical VaR methodology; taking 2,000 days (equivalent to 7 years) of the most recent prices, based on which the day-to-day relative price changes are calculated. This simulation of past market conditions is not predicting the future movement in commodity prices. Therefore, it does not represent actual losses. It only represents an indication of the future commodity price risks. VaR is applied to materials with prices considered to exceed certain volatility levels (e.g. cocoa beans, dairy products, sweeteners, oils, and fats). As of August 31, 2014, the Group had a total VaR for raw materials of CHF 24.9 million (2013: CHF 18.5 million) well within the Group limit.
Foreign currency risksThe Group operates across the world and consequently is exposed to multiple foreign currency risks, albeit primarily in EUR, GBP and USD. The Group actively monitors its transactional currency exposures and consequently enters into currency hedges with the aim of preserving the value of assets, commitments and anticipated transactions. The related accounting treatment is explained in the section “Summary of Accounting Policies” under the caption “Derivative financial instruments and hedging activities”.
All risks related to foreign currency exposures of assets and liabilities, certain unrecognized firm commitments and highly probable forecasted purchases and sales are centralized within the Group’s In-house Bank, where the hedging strategies are defined.
Accordingly, the consolidated currency exposures are hedged in compliance with the Group’s Treasury Policy, mainly by means of forward currency contracts entered into with financial institutions of a high credit rating. The Group’s Treasury Policy imposes a dual risk control framework of both open position limits and near-time fair valuation of the net currency exposures. Both levels of control are substantially interlinked, avoiding excessive net currency exposures and substantial volatility in the Consolidated Income Statement.
Consolidated Financial StatementsBarry Callebaut
Annual Report 2013/14

118
The Group’s Treasury department is supervised by the Group Finance Committee, which meets on a monthly basis. The Group Finance Committee monitors the Group’s foreign currency risk position and acts as a decision-taking body for the Group in this respect. The Group Finance Committee consists of the Group’s CFO, the Head of Group Controlling & Risk Management, the Group’s Head of Treasury, the Head of Group Accounting, Reporting & Tax, and other Group Finance stakeholders.
The Group’s Treasury Policy, giving guidance on treasury risk management including foreign currency and interest rate risks, is approved and annually reviewed by the AFRQCC. The Group’s Risk Management department reviews the consistency of the Group’s treasury management strategy with the Group’s Treasury Policy and reports the status to the Group’s CFO periodically. The AFRQCC is informed by the CFO about the status and important matters in their quarterly meetings and approves requests of the Group’s Finance Committee on important treasury risk matters including foreign currency risks for recommendation to the Board of Directors. The Board of Directors is the highest approval authority for all Group Treasury Risk Management matters.
The table below provides an overview of the net exposure of EUR, GBP and USD against the main functional currencies in the Group. According to the Group’s Treasury Policy, foreign exchange exposures are hedged as from identification on an intra-day basis in line with the approved exposure limits. In case of deviation from the agreed foreign exchange exposure limits, approval has to be sought from the Group’s Finance Committee. Companies with the same functional currency are shown in one group.
Net foreign currency exposuresas of August 31, 2014 2013Net exposure in thousands of EUR / GBP / USD
EUR
GBP
USD
EUR
GBP
USD
EUR – (1,172) 933 – (6,630) 2,633 CHF 503 1,599 2,312 (1,563) 930 2,457 CAD (145) – (96) (278) – (85)USD (3,720) (338) – 2,790 (1,218) –BRL (1,379) – 2,951 (658) – (5,391)SGD (85) (17) (735) 83 (12) (2,009)CNY (3) – (1,083) – – (3,728)MYR (329) (281) 1,890 (326) 273 (955)RUB (3,645) – 582 275 – 427 SEK – – – (800) 8 (59)JPY (154) (56) (1,656) (322) (45) (762)Total (8,957) (265) 5,098 (799) (6,694) (7,472)
In order to quantify and manage the Group’s consolidated exposure to foreign currency risks, the concept of historical VaR has been implemented. The VaR concept serves as the analytical instrument for assessing the Group’s foreign currency risk incurred under normal market conditions. The VaR indicates the loss, which, within a time horizon of 1 day, will not be exceeded at a confidence level of 95% using 7 years of historical market prices for each major currency pair. The VaR is complemented with the calculation of the expected shortfall and worst cases. The VaR is based on static exposures during the time horizon of the analysis. The simulation of past market conditions is not predicting the future movement in foreign currency rates. Therefore, it does not represent actual losses. It only represents an indication of future foreign currency risks. As of August 31, 2014, the Group had a VaR of CHF 1.0 million (2013: CHF 0.6 million).
Consolidated Financial StatementsBarry CallebautAnnual Report 2013/14

119
Value at Risk per main exposure currenciesas of August 31, 2014 2013Value at Risk on net exposures in thousands of CHF Total for the Group and per main exposure currencies
Total Group 978 638
CHF 14 29EUR 1,004 597USD 63 92GBP 19 71Others 37 119Diversification effect 14% 30%
Interest rate risksThe Group is exposed to changes in interest rates through its short- and long-term debt obligations mainly located in and centralized at the Group’s In-house Bank. The Group’s In-house Bank provides the necessary liquidity in the required functional currency towards all companies of the Group. Consequently, the Group’s debt obligations are adjusted with the real currency mix of the Group’s liabilities in order to reflect the correct exposure to interest rates.
It is the Group’s policy to manage its interest cost using an optimal mix of fixed and floating rate debt. This is achieved by entering into interest rate derivative instruments, in which it exchanges fixed and floating interest rates.
As described in the caption “Foreign currency risks”, the Group’s Finance Committee, which meets on a monthly basis, monitors the Group’s interest risk positions and acts as a decision-taking body for the Group in this respect.
The Group’s Treasury Policy also covers the management of interest rate risks. As for foreign currency risks, the Group’s Risk Management department supervises the compliance of the treasury interest rate risk management strategy with the Group’s Treasury Policy and reports the status periodically to the Group’s CFO, who informs the AFRQCC in their quarterly meetings. The AFRQCC approves requests from the Group Finance Committee on important treasury matters, including interest rate risks, and provides recommendations thereon to the Board of Directors, which is the highest approval authority for all Group treasury matters.
The following schedule provides an overview of all interest bearing items per year-end closing.
as of August 31, 2014 2013in thousands of CHF
Fixed interest bearing itemsCarrying amount of financial liabilities 1,109,435 1,127,931Reclassification due to interest rate derivative 180,815 215,640Net fixed interest position 1,290,250 1,343,571
Floating interest bearing itemsCarrying amount of financial assets (87,648) (82,359)Carrying amount of financial liabilities 781,735 479,604Reclassification due to interest rate derivative (180,815) (215,640)Net floating interest position 513,272 181,605
Consolidated Financial StatementsBarry Callebaut
Annual Report 2013/14

120
Sensitivity analysis on interest rate risksThe following table shows the impact of a parallel shift of interest rates by 100 basis points (bps) up and 10 bps down (2013: 25 bps down) on the Group’s equity and income statement, net of tax. The calculation is performed on both, the portion of the outstanding debt (excluding the asset-backed securitization program; see note 12) at floating interest rates and the outstanding derivatives exchanging floating into fixed interest rates at the respective year-end. This sensitivity analysis only indicates the potential impact for the respective fiscal year at the prevailing conditions in the financial markets. Consequently, it does not represent actual or future gains or losses, which are strictly managed and controlled, as clearly indicated in the Group’s Treasury Policy.
as of August 31, 2014 2013Impact on Income statement Equity Income statement Equity
in thousands of CHF
100 bps increase
10 bps decrease
100 bps increase
10 bps decrease
100 bps increase
25 bps decrease
100 bps increase
25 bps decrease
Floating rate bearing items (3,850) 385 – – (1,362) 341 – – Interest rate swaps – – 7,767 (785) – – 7,743 (2,016)Total interest rate sensitivity (3,850) 385 7,767 (785) (1,362) 341 7,743 (2,016)
Credit risk and concentration of credit riskCredit risk, i.e. the risk of counterparties defaulting, is controlled by the application of credit approvals, limits and monitoring procedures. As of August 31, 2014, the largest customer represents 9% (2013: 5%) whereas the 10 biggest customers represent 23% (2013: 23%) of trade receivables. Due to the diverse geographic and large customer base, the Group has no material credit risk concentration.
The extent of the Group’s credit risk exposure is represented on the one hand by the aggregate balance of amounts receivable, reduced by the effects of netting arrangements with counterparties. The maximum nominal credit risk exposure in the event all other parties fail to perform their obligation was CHF 874.0 million as of August 31, 2014 (2013: CHF 751.6 million). The Group has insured certain credit risks through a credit insurance policy. A number of customers with significant outstanding amounts are covered by that policy.
On the other hand, the Group’s credit risk also arises from derivative financial instruments, i.e. foreign exchange derivatives, interest rate derivatives, and commodity (cocoa) derivatives. The Group has foreign exchange and interest rate derivatives with 10 –15 banks acting on an international scale and having sound credit ratings. In case of commodity derivatives, the Group enters into future deals in the New York and the London terminal markets, mainly with 5–6 counterparties, and the open positions per counterparty offset each other to a large extent leading to limited minimal open balances (as also represented by the similar value of derivative financial assets and liabilities on the balance sheet).
Liquidity riskLiquidity risk arises through a surplus of financial obligations over available financial assets due at any point in time. The Group’s liquidity is ensured by means of regular Group-wide moni toring and planning of liquidity coordinated by the In-house Bank. For extraordinary financing needs, adequate credit lines with financial institutions have been arranged (see note 23).
Consolidated Financial StatementsBarry CallebautAnnual Report 2013/14

121
Contractual maturitiesThe table below provides an overview of contractual maturities for financial liabilities and derivatives.
as of August 31, 2014
In the
first year
In the second to the
fifth year
After
five years
Contractual
amount
in thousands of CHF
Non-derivative financial liabilities Bank overdrafts (17,559) – – (17,559) Short-term debt (457,551) – – (457,551) Trade payables (605,860) – – (605,860) Long-term debt (152,798) (879,381) (782,867) (1,815,046) Other liabilities (176,200) – – (176,200)Derivatives Interest rate derivatives (3,194) (9,052) – (12,246) Currency derivatives Inflow 5,366,038 104,113 – 5,470,151 Outflow (5,277,080) (102,994) – (5,380,074) Commodity derivatives (gross settled) Inflow 1,199,909 63,954 – 1,263,863 Outflow (2,008,522) – – (2,008,522) Commodity derivatives (net settled) Inflow 59,275 – – 59,275 Outflow (158,591) – – (158,591)Total net (2,232,133) (823,360) (782,867) (3,838,360)
Consolidated Financial StatementsBarry Callebaut
Annual Report 2013/14

122
as of August 31, 2013
In the
first year
In the second to the
fifth year
After
five years
Contractual
amount
in thousands of CHF
Non-derivative financial liabilities Bank overdrafts (14,311) (14,311) Short-term debt (229,764) (229,764) Trade payables (522,907) (522,907) Long-term debt (62,930) (926,934) (838,269) (1,828,133) Other liabilities (171,128) (171,128)Derivatives Interest rate derivatives (2,903) (4,596) 41 (7,458) Currency derivatives Inflow 3,735,867 261,078 3,996,945 Outflow (3,760,975) (266,753) (4,027,728) Commodity derivatives (gross settled) Inflow 934,131 14,483 948,614 Outflow (1,209,379) (1,209,379) Commodity derivatives (net settled) Inflow 6,257 6,257 Outflow (48,681) (48,681)Total net (1,346,723) (922,722) (838,228) (3,107,673)
Fair value of financial instrumentsThe following methods and assumptions are used to estimate the fair value of financial instruments:
Cash and cash equivalentsThe carrying value of cash and cash equivalents approximates fair value due to the relatively short-term maturity of these financial instruments.
Bank overdraftsThe carrying value approximates fair value because of the short period to maturity of these financial instruments.
Short-term depositsThe carrying value approximates fair value because of the short period to maturity of these financial instruments.
Short-term debtThe carrying value approximates fair value because of the short period to maturity of these financial instruments.
Long-term debtIn calculating the fair value of long-term debts, future principal and interest payments are discounted at market interest rates.
Other receivables and payables representing financial instrumentsThe carrying value approximates fair value because of the short-term maturity of these financial instruments.
Consolidated Financial StatementsBarry CallebautAnnual Report 2013/14
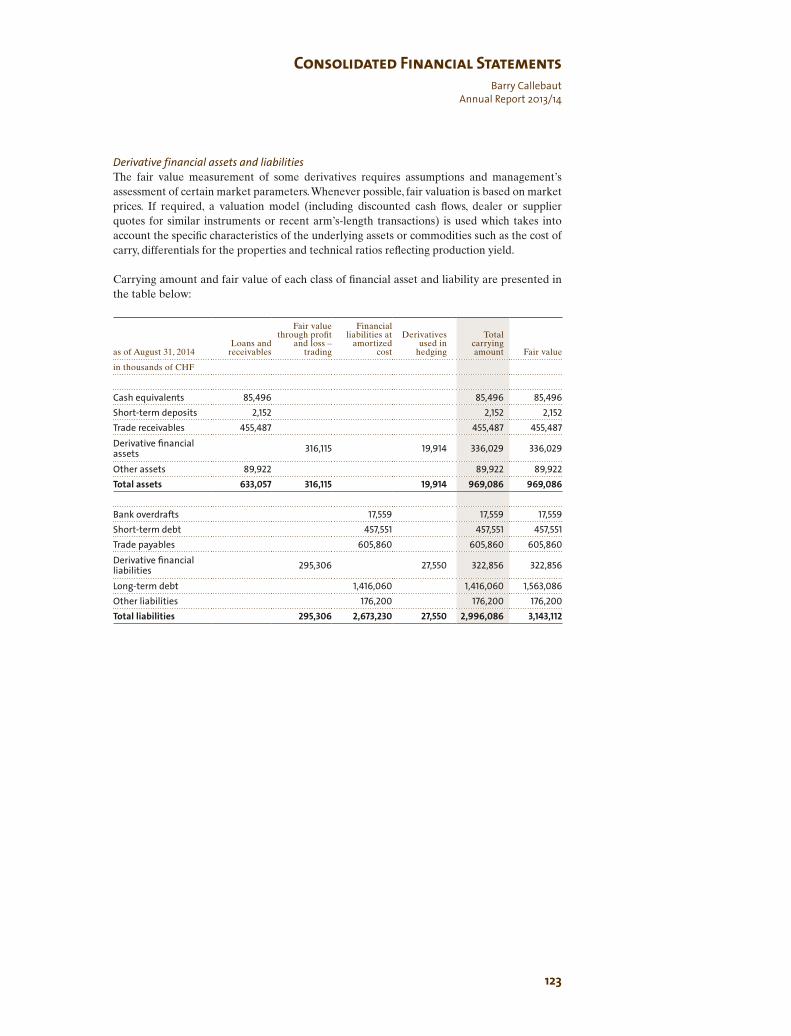
123
Derivative financial assets and liabilitiesThe fair value measurement of some derivatives requires assumptions and management’s assessment of certain market parameters. Whenever possible, fair valuation is based on market prices. If required, a valuation model (including discounted cash flows, dealer or supplier quotes for similar instruments or recent arm’s-length transactions) is used which takes into account the specific characteristics of the underlying assets or commodities such as the cost of carry, differentials for the properties and technical ratios reflecting production yield.
Carrying amount and fair value of each class of financial asset and liability are presented in the table below:
as of August 31, 2014
Loans and receivables
Fair value through profit
and loss – trading
Financial liabilities at
amortized cost
Derivatives
used in hedging
Total
carrying amount
Fair value
in thousands of CHF
Cash equivalents 85,496 85,496 85,496Short-term deposits 2,152 2,152 2,152Trade receivables 455,487 455,487 455,487Derivative financial assets 316,115 19,914 336,029 336,029
Other assets 89,922 89,922 89,922Total assets 633,057 316,115 19,914 969,086 969,086
Bank overdrafts 17,559 17,559 17,559Short-term debt 457,551 457,551 457,551Trade payables 605,860 605,860 605,860Derivative financial liabilities 295,306 27,550 322,856 322,856
Long-term debt 1,416,060 1,416,060 1,563,086Other liabilities 176,200 176,200 176,200Total liabilities 295,306 2,673,230 27,550 2,996,086 3,143,112
Consolidated Financial StatementsBarry Callebaut
Annual Report 2013/14
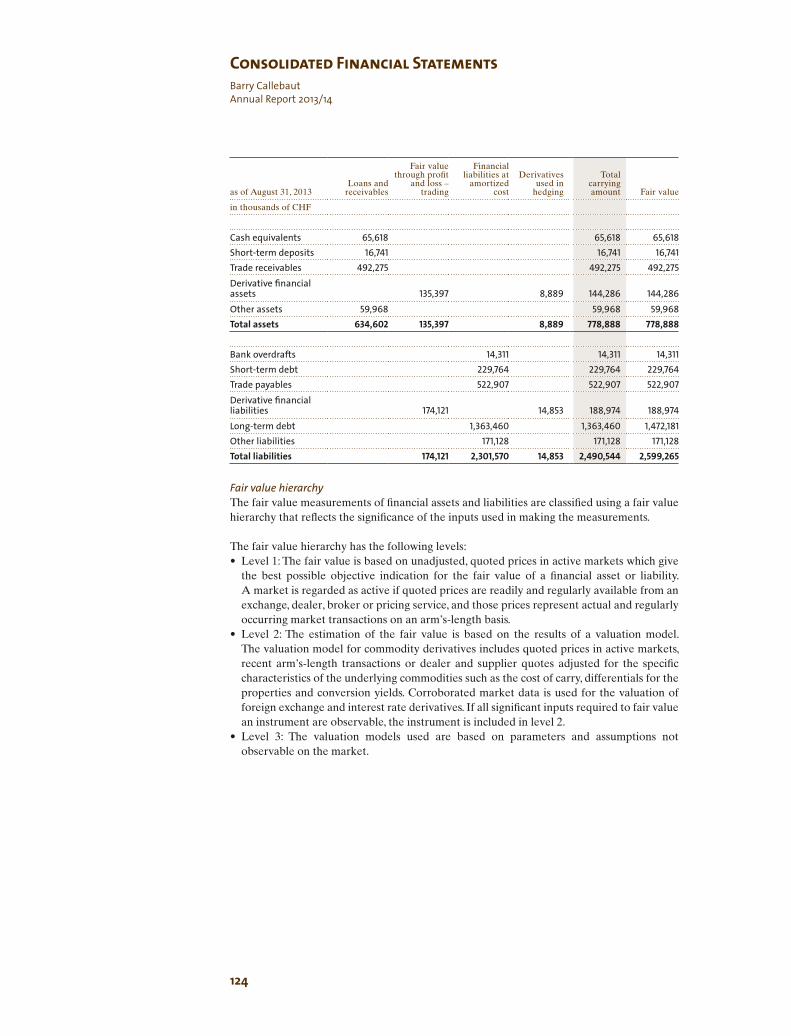
124
as of August 31, 2013
Loans and receivables
Fair value through profit
and loss – trading
Financial liabilities at
amortized cost
Derivatives
used in hedging
Total
carrying amount
Fair value
in thousands of CHF
Cash equivalents 65,618 65,618 65,618 Short-term deposits 16,741 16,741 16,741Trade receivables 492,275 492,275 492,275 Derivative financial assets 135,397 8,889 144,286 144,286 Other assets 59,968 59,968 59,968Total assets 634,602 135,397 8,889 778,888 778,888
Bank overdrafts 14,311 14,311 14,311 Short-term debt 229,764 229,764 229,764 Trade payables 522,907 522,907 522,907 Derivative financial liabilities 174,121 14,853 188,974 188,974 Long-term debt 1,363,460 1,363,460 1,472,181 Other liabilities 171,128 171,128 171,128 Total liabilities 174,121 2,301,570 14,853 2,490,544 2,599,265
Fair value hierarchyThe fair value measurements of financial assets and liabilities are classified using a fair value hierarchy that reflects the significance of the inputs used in making the measurements.
The fair value hierarchy has the following levels:• Level 1: The fair value is based on unadjusted, quoted prices in active markets which give
the best possible objective indication for the fair value of a financial asset or liability. A market is regarded as active if quoted prices are readily and regularly available from an exchange, dealer, broker or pricing service, and those prices represent actual and regularly occurring market transactions on an arm’s-length basis.
• Level 2: The estimation of the fair value is based on the results of a valuation model. The valuation model for commodity derivatives includes quoted prices in active markets, recent arm’s-length transactions or dealer and supplier quotes adjusted for the specific characteristics of the underlying commodities such as the cost of carry, differentials for the properties and conversion yields. Corroborated market data is used for the valuation of foreign exchange and interest rate derivatives. If all significant inputs required to fair value an instrument are observable, the instrument is included in level 2.
• Level 3: The valuation models used are based on parameters and assumptions not observable on the market.
Consolidated Financial StatementsBarry CallebautAnnual Report 2013/14

125
The following table summarizes the use of level with regard to financial assets and liabilities which are measured at fair value:
as of August 31, 2014 Level 1 Level 2 Level 3 Total
in thousands of CHF
Derivative financial assets 38,544 297,485 – 336,029
Derivative financial liabilities 40,501 282,355 – 322,856
Long-term debt – 1,563,086 – 1,563,086
as of August 31, 2013 Level 1 Level 2 Level 3 Total
in thousands of CHF
Derivative financial assets 4,312 139,974 – 144,286
Derivative financial liabilities 8,514 180,460 – 188,974
Long-term debt – 1,472,181 – 1,472,181
There have been no transfers between the levels during the fiscal years 2013/14 and 2012/13.
Capital managementThe Group continues to apply its policy to maintain a sound capital base to support the continued development of the business. The Board of Directors seeks to maintain a prudent balance between debt and equity. In compliance with bank covenants, there is also a minimum Tangible Net Worth value (Equity – Intangible assets) set at CHF 500 million.
The target payout ratio to shareholders is set at 30–35% of the net profit in the form of a share capital reduction and repayment or dividend. The target ratio and the form of the payout recommended by the Board are reviewed on an annual basis and are subject to the decision of the Annual General Meeting of Shareholders.
The Group’s subsidiaries have complied with applicable local statutory capital requirements.
Consolidated Financial StatementsBarry Callebaut
Annual Report 2013/14

126
Offsetting financial assets and financial liabilitiesThe following financial assets and liabilities are subject to offsetting, enforceable master netting arrangement and similar agreements.
Related amounts not set off in the balance sheet
as of August 31, 2014
Gross amounts of recognized
financial assets / liabilities
Gross amounts of recognized
financial liabilities / assets
set off in the balance sheet
Net amounts of financial assets /
liabilities pre-sented in the
balance sheetFinancial
instruments
Cash collateral received or
depositedNet amount
in thousands of CHF
Derivative financial assets 581,657 (245,628) 336,029 (24,648) (3,666) 307,715
Derivative financial liabilities 568,484 (245,628) 322,856 (24,648) (44,223) 253,985
Related amounts not set off in the balance sheet
as of August 31, 2013
Gross amounts of recognized
financial assets / liabilities
Gross amounts of recognized
financial liabilities / assets
set off in the balance sheet
Net amounts of financial assets /
liabilities pre-sented in the
balance sheetFinancial
instruments
Cash collateral received or
depositedNet amount
in thousands of CHF
Derivative financial assets 354,266 (209,980) 144,286 (1,224) (1,228) 141,834
Derivative financial liabilities 398,954 (209,980) 188,974 (1,224) (6,577) 181,173
For the financial assets and liabilities subject to enforceable master netting arrangements or similar arrangements above, each agreement between the Group and the counterparty allows for net settlement of the relevant financial assets and liabilities when both elect to settle on a net basis. In the absence of such an election, financial assets and liabilities will be settled on a gross basis, however, each party to the master netting agreement or similar agreement will have the option to settle all such amounts on a net basis in the event of default of the other party. Per the terms of each agreement, an event of default includes failure by a party to make payment when due; failure by a party to perform any obligation required by the agreement (other than payment) if such failure is not remedied within periods of 30 to 60 days after notice of such failure is given to the party; or bankruptcy.
The cash collateral received and deposited are reported on lines “Trade payables and other current liabilities” and “Trade receivables and other current assets” in the Consolidated Balance Sheet.
Consolidated Financial StatementsBarry CallebautAnnual Report 2013/14

127
27 Related partiesThe following shareholders hold a participation of more than 3% of the issued share capital of the Group’s ultimate parent Barry Callebaut AG:
as of August 31, 2014 2013
Jacobs Holding AG, Zurich, Switzerland 50.11% 50.11%Renata Jacobs 8.48% 8.48%Massachusetts Mutual Life Insurance Company1 3.05% – 1 Including all subsidiaries controlled by the parent company. For further details, see the respective notification published
on May 6, 2014 via SIX Exchange Regulation: http://www.six-exchange-regulation.com/obligations/disclosure/major_shareholders_en.html
Significant transactions and balances between the Group and related parties are as follows:
in thousands of CHF Nature of cost/revenue 2013/14 2012/13
Sales to related parties – 18 Pastelería Totel, S.L. Revenue from sales and services – 18
Purchases from related parties (6,361) (8,281) African Organic Produce AG 1 Cost of goods sold (6,361) (8,281)
Operating expenses charged by related parties (5,092) (6,239)
Jacobs Holding AG Management services (1,535) (1,541) Adecco Group Human resources services (3,456) (4,409) Other (101) (289)
Trade receivables from related parties
– 34
Other – 34
Trade payables to related parties 1,038 1,400 Jacobs Holding AG 7 139 Adecco Group 887 1,076 Other 144 185
Debt instruments due to related parties 99,367 –
Jacobs Holding AG 99,367 –1 On February 18, 2014, the Group acquired the remaining 51% of Biolands Group, including its entity African Organic
Produce AG, and thus fully consolidates all Biolands entities as of this date. Purchases from African Organic Produce AG in the financial year until the time of the acquisition are therefore reported as purchases from related parties.
Transactions with related parties were carried out on commercial terms and conditions at market prices. All receivables from related parties are non-interest-bearing and their col lection is expected within the next 12 months.
Consolidated Financial StatementsBarry Callebaut
Annual Report 2013/14

128
Consolidated Financial StatementsBarry CallebautAnnual Report 2013/14
Compensation of key management personnelThe key management personnel are defined as the Board of Directors and the Executive Committee. Key management compensation consists of the following:
in million CHF 2013/14 2012/13
Short-term employee benefits 16.8 9.6Post-employment benefits 1.7 1.5Share-based payments 9.8 9.4Total 28.3 20.5
Further details related to the requirements of the Swiss Transparency law (Art. 663bbis and 663c Swiss Code of Obligations) are disclosed in note 6 in the Financial Statements of Barry Callebaut AG.

129
Consolidated Financial StatementsBarry Callebaut
Annual Report 2013/14
28 Commitments and contingencies
Capital commitmentsas of August 31, 2014 2013in thousands of CHF
Property, plant & equipment 12,368 7,866 Intangible assets 3,093 5,135 Total capital commitments 15,461 13,001
Operating lease commitmentsOperating lease commitments represent rentals payable by the Group for certain vehicles, equipment, buildings and offices. Equipment and vehicle leases were negotiated for an average term of 2.4 years (2012/13: 2.7 years).
The future aggregate minimum lease payments under non-cancelable operating leases are due as follows:
as of August 31, 2014 2013in thousands of CHF
In the first year 17,579 16,675 In the second to the fifth year 38,610 43,094 After five years 23,215 28,867 Total future operating lease commitments 79,404 88,636
in thousands of CHF 2013/14 2012/13
Lease expenditure charged to the statement of income 18,198 14,339
ContingenciesGroup companies are involved in various legal actions and claims as they arise in the ordinary course of the business. Provisions have been made, where quantifiable, for probable outflows. In the opinion of management, after taking appropriate legal advice, the future settlements of such actions and claims will not have a material effect on the Group’s financial position.
Regarding the acquisition of the Cocoa Ingredients Division of Petra Foods Ltd., there is a contingent asset related to the determination of the final purchase consideration (see also note 1).

130
29 Group entities The principal subsidiaries of Barry Callebaut as of August 31, 2014, are the following:
Country Subsidiary Municipality of registration % owned Currency Capital
Switzerland Barry Callebaut Sourcing AG Zurich 100 CHF 2,000,000Barry Callebaut Schweiz AG Dübendorf 100 CHF 4,600,000Barry Callebaut Cocoa AG Zurich 100 CHF 100,000Barry Callebaut Management Services AG Zurich 100 CHF 100,000African Organic Produce AG Zurich 100 CHF 100,000
Belgium Barry Callebaut Services N.V. Lebbeke-Wieze 100 EUR 929,286,000Barry Callebaut Belgium N.V. Lebbeke-Wieze 100 EUR 61,537,705International Business Company Belgium B.V.B.A. Kortrijk (Heule) 100 EUR 65,000Pierre Iserentant SA Thimister-Clermont 100 EUR 260,908
Brazil Barry Callebaut Brasil SA São Paulo 100 BRL 71,600,810Cameroon Société Industrielle Camerounaise des Cacaos SA Douala 78.35 XAF 1,147,500,000
SEC Cacaos SA Douala 100 XAF 10,000,000Canada Barry Callebaut Canada Inc. St.-Hyacinthe 100 CAD 2,000,000Chile Barry Callebaut Chile SpA Santiago 100 CLP 3,001,000,000China Barry Callebaut (Suzhou) Chocolate Co., Ltd. Suzhou 100 USD 27,000,000
Barry Callebaut (Suzhou) Chocolate R&D Center Co., Ltd. Suzhou 100 USD 2,000,000Côte d’Ivoire Société Africaine de Cacao SA Abidjan 100 XAF 25,695,651,316
Barry Callebaut Négoce SA Abidjan 100 XAF 3,700,000,000Biopartenaire SA Yamoussoukro 100 XAF 200,000,000
Czech Republic Barry Callebaut Czech Republic s.r.o. Prague-Vinohrady 100 CZK 200,000Denmark Barry Callebaut Denmark ApS Hostebro 100 DKK 125,000Ecuador Barry Callebaut Ecuador SA Guayaquil 100 USD 50,000France Barry Callebaut Manufacturing France SAS Hardricourt 100 EUR 6,637,540
Barry Callebaut France SAS Hardricourt 100 EUR 67,900,000Barry Callebaut Nord Cacao SAS Gravelines 100 EUR 3,037,000
Germany Barry Callebaut Deutschland GmbH Norderstedt 100 EUR 51,129C.J. van Houten & Zoon Holding GmbH Norderstedt 100 EUR 72,092,155Schloss Marbach GmbH Öhningen 100 EUR 1,600,000Barry Callebaut Manufacturing Norderstedt GmbH & Co. KG Norderstedt 100 EUR 50,000Barry Callebaut Cocoa Germany GmbH Hamburg 100 EUR 25,000
Ghana Barry Callebaut Ghana Ltd. Tema 100 USD 9,204,219Great Britain Barry Callebaut Manufacturing (UK) Ltd. Banbury, Oxfordshire 100 GBP 15,467,852
Barry Callebaut (UK) Ltd. Banbury, Oxfordshire 100 GBP 3,200,000Barry Callebaut Vending UK Ltd. Chester 100 GBP 40,000
Hong Kong Van Houten (Asia-Pacific) Ltd. Hong Kong 100 HKD 2India Barry Callebaut India Private Ltd. Maharashtra 100 INR 208,400,000Indonesia P.T. Barry Callebaut Comextra Indonesia Makassar 60 IDR 68,175,000,000
P.T. Papandayan Cocoa Industries Bandung 100 USD 10,000,000Italy Barry Callebaut Italia S.p.A. Assago 100 EUR 104,000
Barry Callebaut Manufacturing Italy Srl. Milano 100 EUR 2,646,841Dolphin Srl. Milano 100 EUR 110,000
Japan Barry Callebaut Japan Ltd. Amagasaki 100 JPY 1,260,000,000
Consolidated Financial StatementsBarry CallebautAnnual Report 2013/14

131
Country Subsidiary Municipality of registration % owned Currency Capital
Malaysia Barry Callebaut Malaysia Sdn Bhd Petaling Jaya 100 MYR 36,000,000Selbourne Food Services Sdn Bhd Petaling Jaya 100 MYR 2,000,000Barry Callebaut Services Asia-Pacific Sdn Bhd Petaling Jaya 100 MYR 500,000Delfi Cocoa (Malaysia) Sdn Bhd Johor Bahru 100 MYR 16,000,000
Mexico Barry Callebaut Mexico Distributors SA de CV Escobedo N.L. 100 MXN 117,196,530Barry Callebaut Servicios SA de CV Escobedo N.L. 100 MXN 50,000Barry Callebaut Mexico, S. de R.L. de CV Monterrey 100 MXN 13,027,200Barry Callebaut Cocoa Mexico SA de CV Monterrey 100 MXN 100,000Barry Callebaut Management Services Mexico de CV Monterrey 100 MXN 100,000
Philippines Cocoa Ingredients (Philippines) Inc. Makati City 100 PHP 8,114,000Poland Barry Callebaut Manufacturing Polska Sp. z o.o. Łódź 100 PLN 10,000,000
Barry Callebaut Polska Sp. z o.o. Łódź 100 PLN 50,000Russia Barry Callebaut NL Russia LLC Moscow-Chekhov 100 RUB 922,510,182
Gor Trade LLC Moscow-Chekhov 100 RUB 58,000,000Serbia Barry Callebaut South East Europe d.o.o. Belgrade 100 RSD 1,185,539Sierra Leone Bio United Ltd. Freetown 100 SLL 114,000,000Singapore Barry Callebaut Asia Pacific (Singapore) Pte Ltd. Singapore 100 SGD 100,000,000
Barry Callebaut Cocoa Asia Pacific Pte Ltd. Singapore 100 USD 244,242,738Cocoa Ingredients Holdings Pte Ltd. Singapore 100 USD 1Barry Callebaut Europe Holding Pte Ltd. Singapore 100 EUR 95,400,000
Spain Barry Callebaut Ibérica SL Barcelona 100 EUR 25,000Barry Callebaut Manufacturing Ibérica, S.A.U. Gurb 100 EUR 987,600La Morella Nuts S.A. Castellvell del Camp 100 EUR 344,554
Sweden Barry Callebaut Sweden AB Kågeröd 100 SEK 100,000ASM Foods AB Mjölby 100 SEK 2,000,000
Tanzania Biolands International Ltd. Moshi 100 TZS 40,000,000Thailand Siam Cocoa Products Co., Ltd. Bangkok 100 THB 125,000,000The Netherlands Barry Callebaut Nederland B.V. Zundert 100 EUR 21,435,000
Barry Callebaut Decorations B.V. Zundert 100 EUR 18,242Hoogenboom Benelux B.V. Zundert 100 EUR 18,152Dings-Décor B.V. Nuth 70 EUR 22,689Barry Callebaut Cocoa Netherlands B.V. Zaandam 100 EUR 18,000
Turkey Barry Callebaut Eurasia Gida Sanayi Ve Ticaret Ltd. Sti. Istanbul 100 TRL 29,000,000USA Barry Callebaut Cocoa USA Inc. Chicago, IL 100 USD 7,663
Barry Callebaut North America Holding Inc. Wilmington, DL 100 USD 100,001,000Barry Callebaut USA LLC St. Albans, VT 100 USD 100,190,211
Barry Callebaut has some dormant companies which are not enclosed as principal subsidiaries, e.g. Barry Callebaut Manufacturing Germany GmbH, Barry Callebaut Holding (UK) Ltd, Barry Callebaut Nigeria, Adis Holding Inc., Barry Callebaut USA Holding, Inc., BC USA Service company Inc., Omnigest SAS, Alliance Cacao SA
Consolidated Financial StatementsBarry Callebaut
Annual Report 2013/14

132
Consolidated Financial StatementsBarry CallebautAnnual Report 2013/14
30 Risk assessment disclosure required by Swiss lawGroup Risk ManagementBarry Callebaut’s Group Risk Management (GRM) is a corporate function responsible for the group wide Enterprise Risk Management (ERM) process under the direction and as approved by the Audit, Finance, Risk, Quality and Compliance Committee (AFRQCC) of the Board of Directors. The Group’s ERM Framework is designed to create an aggregate view on all existing major risks, enabling the Group to systematically evaluate, prioritize and control the Group’s risk portfolio.
The ERM is based on the framework of the Committee for Sponsoring Organizations (COSO) and classifies risks into the following major risk categories: Strategic, Operational, Financial and Compliance risks. The Group’s ERM is multidimensional in the form that risks are identified, assessed and controlled at the level of Regions and also at the level of specialized Corporate Functions, such as Quality Assurance, Group Finance, Operations & Supply Chain Organization (OSCO), Information Management, Global Human Resources, Innovations, Research and Development and Group Legal. Risk management activities are in the responsibility of Regions and Corporate Functions but overseen and controlled by GRM. Thus, events and risks on all levels can be identified, addressed and managed efficiently and effectively. Financial risk management is described in more detail in note 26.
The results of the Group’s ERM are presented to the Executive Committee and the AFRQCC annually or immediately in case of emergency events or risks.
31 Subsequent eventsApproval of the Financial StatementsThe Consolidated Financial Statements were authorized for issue by the Board of Directors on November 3, 2014 and are subject to approval by the Annual General Meeting of Shareholders on December 10, 2014.
There are no subsequent events that would require any modification of the value of the assets and liabilities or additional disclosures.

KPMG AG/SA, a Swiss corporation, is a subsidiary of KPMG Holding AG/SA, which is a member of the KPMG network of independent firms affiliated with KPMG International Cooperative (“KPMG International”), a Swiss le-gal entity.
Member of the Swiss Instituteof Certified Accountants and Tax Consultants
KPMG AG Audit Badenerstrasse 172 P.O. Box Telephone +41 58 249 31 31 CH-8004 Zurich CH-8026 Zurich Fax +41 58 249 44 06 Internet www.kpmg.ch
Report of the Statutory Auditor to the General Meeting of Shareholders of
Barry Callebaut AG, Zurich
Report of the Statutory Auditor on the Consolidated Financial Statements
As statutory auditor, we have audited the accompanying consolidated financial statements of Barry Callebaut AG which comprise the income statement, statement of comprehensive income, balance sheet, cash flow statement, statement of changes in equity and notes on pages 56 to 132 for the year ended August 31, 2014.
Board of Directors’ ResponsibilityThe board of directors is responsible for the preparation of the consolidated financial statements in accordance with International Financial Reporting Standards (IFRS) and the requirements of Swiss law. This responsibility includes designing, implementing and maintaining an internal control system relevant to the preparation of consolidated financial statements that are free from material misstatement, whether due to fraud or error. The board of directors is further responsible for selecting and applying appropriate accounting policies and making accounting estimates that are reasonable in the circumstances.
Auditor’s ResponsibilityOur responsibility is to express an opinion on these consolidated financial statements based on our audit. We conducted our audit in accordance with Swiss law and Swiss Auditing Standards as well as International Standards on Auditing. Those standards require that we plan and perform the audit to obtain reasonable assurance whether the consolidated financial statements are free from material misstatement.
An audit involves performing procedures to obtain audit evidence about the amounts and disclosures in the consolidated financial statements. The procedures selected depend on the auditor’s judgment, including the assessment of the risks of material misstatement of the consolidated financial statements, whether due to fraud or error. In making those risk assessments, the auditor considers the internal control system relevant to the entity’s preparation of the consolidated financial statements in order to design audit procedures that are appropriate in the circumstances, but not for the purpose of expressing an opinion on the effectiveness of the entity’s internal control system. An audit also includes evaluating the appropriateness of the accounting policies used and the reasonableness of accounting estimates made, as well as evaluating the overall presentation of the consolidated financial statements. We believe that the audit evidence we have obtained is sufficient and appropriate to provide a basis for our audit opinion.
OpinionIn our opinion, the consolidated financial statements for the year ended August 31, 2014 give a true and fair view of the financial position, the results of operations and the cash flows in accordance with International Financial Reporting Standards (IFRS) and comply with Swiss law.
Report on Other Legal RequirementsWe confirm that we meet the legal requirements on licensing according to the Auditor Oversight Act (AOA) and independence (article 728 CO and article 11 AOA) and that there are no circumstances incompatible with our independence.
In accordance with article 728a paragraph 1 item 3 CO and Swiss Auditing Standard 890, we confirm that an internal control system exists, which has been designed for the preparation of consolidated financial statements according to the instructions of the board of directors.
We recommend that the consolidated financial statements submitted to you be approved.
KPMG AG
Marc Ziegler Patricia BielmannLicensed Audit Expert Licensed Audit ExpertAuditor in Charge
Zurich, November 3, 2014

134
5-Year OverviewBarry CallebautAnnual Report 2013/14
Key figures Barry Callebaut GroupCAGR (%)1 2013/14 2012/132,4 2011/122 2010/112,3 2009/103
Stand-alone5
Stand- alone5
restated
Consolidated Income StatementStand-alone5
Sales volume Tonnes 6.3% 9.1% 1,541,654 1,716,766 1,498,632 1,535,662 1,378,856 1,268,925 1,209,654Sales revenue CHF m 3.7% 6.7% 5,231.2 5,865.9 4,756.4 4,884.1 4,829.5 4,459.9 4,524.5EBITDA6 CHF m 6.4% 531.5 464.7 438.4 434.3 430.3 414.6Operating profit (EBIT) CHF m 3.6% 5.1% 392.8 416.2 372.1 342.9 353.2 362.3 341.1Net profit from continuing operations7 CHF m 1.8% 255.0 229.5 241.1 263.6 237.5Net profit for the year CHF m 0.3% 255.0 222.8 142.6 176.8 251.7Cash flow8 CHF m 0.9% 473.7 451.1 440.2 450.7 457.8EBIT / sales revenue % (0.1%) (1.5%) 7.5% 7.1% 7.8% 7.0% 7.3% 8.1% 7.5%EBIT per tonne9 CHF (2.5%) (3.7%) 254.8 242.4 248.3 223.4 256.2 285.5 282.0
Consolidated Balance SheetTotal assets CHF m 9.7% 5,167.5 4,526.9 3,576.6 3,263.1 3,570.8Net working capital10 CHF m 14.8% 1,674.6 1,083.4 1,345.7 1,039.2 888.1 964.9Non-current assets CHF m 11.5% 2,175.6 2,071.9 1,424.8 1,208.4 1,405.8Net debt CHF m 20.0% 1,803.5 993.1 1,525.2 942.9 789.8 870.8Shareholders’ equity11 CHF m 8.3% 1,790.7 1,682.5 1,357.1 1,217.1 1,302.3Capital expenditure12 CHF m 14.4% 248.8 223.5 217.8 144.6 145.1
RatiosEconomic Value Added (EVA) CHF m (13.0%) 84.5 135.3 79.0 133.5 159.9 147.7Return on invested capital (ROIC)13 % (8.3%) 10.5% 13.8% 10.9% 14.2% 15.6% 14.8%Return on equity (ROE) % (7.0%) 14.7% 18.8% 15.4% 18.7% 20.9% 19.6%Debt to equity ratio % 10.8% 100.7% 69.0% 90.6% 69.5% 64.9% 66.9%Solvency ratio14 % (1.3%) 34.7% 37.2% 37.9% 37.3% 36.5%Interest coverage ratio15 (6.4%) 4.5 5.6 5.8 6.0 5.8Net debt / EBITDA 12.8% 3.4 2.1 3.5 2.2 1.8 2.1Capital expenditure / sales revenue % 7.2% 4.2% 4.6% 4.5% 3.2% 3.2%
SharesShare price at fiscal year-end CHF 12.5% 1,125 876 904 765 703EBIT per share16 CHF 3.5% 75.9 71.1 65.5 68.4 70.1 66.0Basic earnings per share17 CHF 0.1% 46.0 44.0 46.6 51.2 45.9Cash earnings per share18 CHF (0.6%) 86.3 86.2 85.2 87.3 88.6Payout per share19 CHF 2.6% 15.5 14.5 15.5 15.5 14.0Payout ratio % 3.8% 33% 35% 33% 31% 29%Price-earnings ratio at year-end20 12.4% 24.5 19.9 19.4 14.9 15.3Market capitalization at year-end CHF m 14.2% 6,175.0 4,805.5 4,671.1 3,955.1 3,631.9Number of shares issued 1.5% 5,488,858 5,488,858 5,170,000 5,170,000 5,170,000Total payout to shareholders CHF m 5.3% 79.6 80.1 80.1 72.4 64.6
OtherEmployees 5.4% 9,319 8,658 6,100 5,972 7,550Beans processed Tonnes 13.3% 940,621 671,183 574,021 537,811 569,875Chocolate & compound production Tonnes 7.1% 1,254,241 1,207,025 1,102,431 999,879 954,0731 Compound annual growth rate for the 5-year period.2 All key figures are based on the continuing operations except for net profit for the
year, total assets and cash flow related key figures.3 To conform to the presentation of subsequent years, certain comparatives
related to the Consolidated Income Statement have been restated. Restatements were mainly related to the discontinuation of the consumer activities. Balance Sheet and Cash Flow Statement related values and number of employees have not been restated.
4 Following the revision of IAS 19 (Employee Benefits), certain comparatives have been restated to conform to the current period’s presentation.
5 Stand-alone numbers are consolidated figures adjusted for comparability reasons by the effects of the transaction and contribution of the cocoa business acquired from Petra Foods.
6 EBIT + depreciation of property, plant and equipment + amortization of intangibles (all from continuing operations).
7 Incl. non-controlling interest.8 Operating cash flow before working capital changes.
9 EBIT / sales volume (of the continuing operations).10 Includes current assets, liabilities and provisions related to commercial activities.11 Total equity attributable to the shareholders of the parent company.12 Capital expenditure for property, plant and equipment and intangible assets.13 EBIT x (1-effective tax rate) / average capital employed.14 Total equity attributable to the shareholders of the parent company / total assets.15 EBITDA / net finance costs.16 EBIT / basic shares outstanding. 17 Based on the net profit from continuing operations attributable to the
shareholders of the parent company / basic shares outstanding.18 Operating cash flow before working capital changes / basic shares outstanding.19 2013/14 dividend totally paid out of paid-in capital reserves as proposed by the Board of
Directors to the Annual General Meeting. 2012/13 and 2010/11 dividend totally paid out of paid-in capital reserves. 2011/12 dividend partly paid out of paid-in capital reserves and partly by a capital reduction through par value repayment. 2009/10: capital reduction / par value repayment instead of a dividend.
20 Share price at year-end / basic earnings per share.

Financial Statements of Barry Callebaut AG
136 Income Statement 137 Balance Sheet 138 Notes to the Financial Statements 143 Report of the Statutory Auditor for the Financial Statements
of Barry Callebaut AG

136
Financial statements of Barry Callebaut AGBarry Callebaut AGAnnual Report 2013/14
Income Statement
for the fiscal year ended August 31, 2013/14 2012/13in CHF
IncomeDividend income 43,500,000 75,500,000Finance income 882,102 22,011,073License income 39,928,580 36,443,346Management fees 32,619,948 26,876,200Other income 24,042,542 18,721,907Total income 140,973,172 179,552,526
ExpensesPersonnel expenses (50,993,301) (40,866,798)Finance costs (9,795,021) (13,632,620)Depreciation of property, plant and equipment (436,361) (425,250)Amortization of intangible assets (3,971,765) (3,911,670)Unrealized loss on treasury shares (615,138) –Other expenses (40,247,295) (77,967,148)Total expenses (106,058,881) (136,803,486)
Profit before income taxes 34,914,291 42,749,040Income taxes (555,066) (752,591)Net profit for the year 34,359,225 41,996,449
Retained earningsin CHF 2013/14 2012/13
Retained earnings as of September 1, 1,406,242,319 1,364,771,720Dividend on treasury shares 87 17,820Decrease/(increase) of reserve for treasury shares (8,112,192) (553,750)Capital reduction on treasury shares – 10,080Net profit for the year 34,359,225 41,996,449Retained earnings as of August 31, 1,432,489,439 1,406,242,319

137
Financial statements of Barry Callebaut AGBarry Callebaut AG
Annual Report 2013/14
Balance Sheet
Assetsas of August 31, 2014 2013in CHF
Current assetsCash and cash equivalents 208,890 39,589Treasury shares 10,820,867 3,323,814Accounts receivable from Group companies 31,064,593 45,594,503Short-term loans granted to Group companies 49,311 25,639Other current assets 2,515,073 2,389,641Total current assets 44,658,734 51,373,186
Non-current assetsProperty, plant and equipment 1,247,605 1,337,965Investments 2,250,912,768 2,250,912,768Intangible assets Trademarks 1,609,947 4,341,537 Patents/Product development costs 1,710,399 2,156,711 Other 626,983 910,812Total non-current assets 2,256,107,702 2,259,659,793Total assets 2,300,766,436 2,311,032,979
Liabilities and shareholders’ equityas of August 31, 2014 2013in CHF
Current liabilitiesBank overdrafts 1,572,897 852,590Accounts payable to third parties 2,378,338 2,674,893Accounts payable to Group companies 9,103,773 37,762,960Accounts payable to shareholders 7,125 137,502Short-term loans from Group companies 488,938,491 433,846,734Accrued liabilities 38,993,041 30,836,383Accrued taxes 449,219 369,236Total current liabilities 541,442,884 506,480,298
Total non-current liabilities – –Total liabilities 541,442,884 506,480,298
Shareholders’ equityShare capital 1 102,092,759 102,092,759Legal reserves Reserves from capital contributions 187,703,159 267,291,600 Other legal reserves 25,600,070 25,600,070Reserve for treasury shares 11,438,125 3,325,933Retained earnings 1,432,489,439 1,406,242,319Total shareholders’ equity 1,759,323,552 1,804,552,681Total liabilities and shareholders’ equity 2,300,766,436 2,311,032,9791 The share capital as of August 31, 2014 consists of 5,488,858 fully paid-in shares at a nominal value of CHF 18.60
(August 31, 2013: 5,488,858 fully paid-in shares at a nominal value of CHF 18.60).

138
Notes to the Financial Statements
1 Liens, guarantees and pledges in favor of third partiesThe Company is a co-debtor for bank loans of max. EUR 775 million (CHF 934.2 million; 2012/13: CHF 739.3 million) obtained by Barry Callebaut Services N.V., Belgium, whereof the maximal liability is limited to the freely distributable retained earnings (CHF 1,432.5 million less 35% withholding tax). Furthermore, the Company is also a co-debtor to the Senior Notes of EUR 350 million (CHF 421.9 million; 2012/13: CHF 431.3 million) issued by Barry Callebaut Services N.V., Belgium, on July 13, 2007, to the Senior Notes of EUR 250 million (CHF 301.4 million; 2012/13: CHF 308.1 million) issued by Barry Callebaut Services N.V., Belgium, on June 15, 2011, as well as to the Senior Notes of USD 400 million (CHF 365.9 million; 2012/13: CHF 372.6 million) issued by Barry Callebaut Services N.V., Belgium, on June 20, 2013. Additionally, the Company issued several guarantees for various facilities granted to direct and indirect subsidiaries for an amount of up to CHF 1,140.4 million (2012/13: CHF 987.1 million).
The Swiss Barry Callebaut entities form a VAT subgroup and, hence, every company participating in the subgroup is liable for VAT debt of other subgroup participants.
2 Fire insurance value of property, plant and equipment
as of August 31, 2014 2013in CHF
Fire insurance value of property, plant and equipment 8,100,00 7,900,000
Financial statements of Barry Callebaut AGBarry Callebaut AGAnnual Report 2013/14

139
3 Investments
as of August, 31 2014 2013Name and domicile Municipality of registration Share capital Purpose Percentage of investment
ADIS Holding Inc., Panama Panama City
CHF 41,624,342
Dormant
100%
100%
Barry Callebaut Belgium N.V., Belgium Lebbeke-Wieze
EUR 61,537,705
Production, sales
99.99%
99.99%
Barry Callebaut Cocoa AG, Switzerland Zurich
CHF 100,000
Sales
100%
100%
Barry Callebaut Decorations B.V., The Netherlands Zundert EUR 18,242
Production, sales 100% 100%
Barry Callebaut Management Services AG, Switzerland Zurich
CHF 100,000
Management services
100%
100%
Barry Callebaut Nederland B.V., The Netherlands Zundert
EUR 21,435,000
Holding
100%
100%
Barry Callebaut Nigeria Ltd., Nigeria Lagos
NGN 10,000,000
Sales
1%
1%
Barry Callebaut Schweiz AG, Switzerland Dübendorf
CHF 4,600,000
Production, sales
100%
100%
Barry Callebaut Services N.V., Belgium Lebbeke-Wieze
EUR 929,286,000
In-house bank, management
services
99.99%
99.99%
Barry Callebaut Sourcing AG, Switzerland Zurich
CHF 2,000,000
Sourcing
100%
100%
C.J. van Houten & Zoon Holding GmbH, Germany Norderstedt
EUR 72,092,155
Holding
100%
100%
Schloss Marbach GmbH, Germany Öhningen
EUR 1,600,000
Conference and training center
100%
100%
Investments are stated at cost less any allowance for impairment.
4 Treasury sharesThe Company held 9,756 treasury shares as of August 31, 2014 (2013: 3,760). In 2013/14, the Company bought 17,287 shares at an average price of CHF 1,078.55 per share (2012/13: 13,788 shares at an average price of CHF 893.83) and transferred 11,291 shares at an average price of CHF 932.84 per share (2012/13: 13,259 shares transferred at an average price of CHF 887.73). In both years, the Company did not sell any treasury shares. Treasury shares are measured at the lower of cost or market. As of August 31, 2014, the treasury shares have been measured at an average price of CHF 1,109.15 per share (2012/13: average price of CHF 884.56 per share).
Financial statements of Barry Callebaut AGBarry Callebaut AG
Annual Report 2013/14
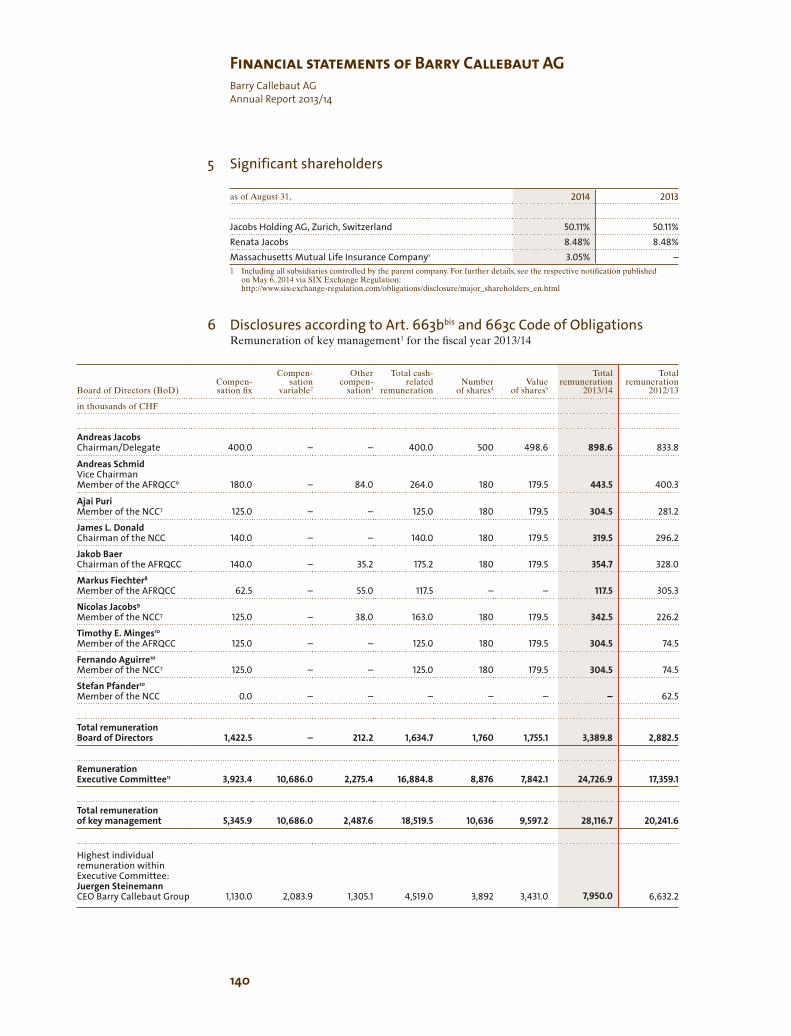
140
5 Significant shareholders
as of August 31, 2014 2013
Jacobs Holding AG, Zurich, Switzerland 50.11% 50.11%Renata Jacobs 8.48% 8.48%Massachusetts Mutual Life Insurance Company1 3.05% –1 Including all subsidiaries controlled by the parent company. For further details, see the respective notification published
on May 6, 2014 via SIX Exchange Regulation: http://www.six-exchange-regulation.com/obligations/disclosure/major_shareholders_en.html
6 Disclosures according to Art. 663bbis and 663c Code of ObligationsRemuneration of key management1 for the fiscal year 2013/14
Board of Directors (BoD)
Compen- sation fix
Compen- sation
variable2
Other compen-
sation3
Total cash- related
remuneration
Number
of shares4
Value
of shares5
Total remuneration
2013/14
Total remuneration
2012/13
in thousands of CHF
Andreas JacobsChairman/Delegate 400.0 – – 400.0 500 498.6 898.6 833.8
Andreas SchmidVice ChairmanMember of the AFRQCC6 180.0 – 84.0 264.0 180 179.5 443.5 400.3
Ajai PuriMember of the NCC7 125.0 – – 125.0 180 179.5 304.5 281.2
James L. DonaldChairman of the NCC 140.0 – – 140.0 180 179.5 319.5 296.2
Jakob Baer
Chairman of the AFRQCC 140.0 – 35.2 175.2 180 179.5 354.7 328.0
Markus Fiechter8
Member of the AFRQCC 62.5 – 55.0 117.5 – – 117.5 305.3
Nicolas Jacobs9
Member of the NCC7 125.0 – 38.0 163.0 180 179.5 342.5 226.2
Timothy E. Minges10
Member of the AFRQCC 125.0 – – 125.0 180 179.5 304.5 74.5
Fernando Aguirre10
Member of the NCC7 125.0 – – 125.0 180 179.5 304.5 74.5
Stefan Pfander10
Member of the NCC 0.0 – – – – – – 62.5
Total remuneration Board of Directors 1,422.5 – 212.2 1,634.7 1,760 1,755.1 3,389.8 2,882.5
Remuneration Executive Committee11 3,923.4 10,686.0 2,275.4 16,884.8 8,876 7,842.1 24,726.9 17,359.1
Total remuneration of key management 5,345.9 10,686.0 2,487.6 18,519.5 10,636 9,597.2 28,116.7 20,241.6
Highest individual remuneration within Executive Committee:Juergen SteinemannCEO Barry Callebaut Group 1,130.0 2,083.9 1,305.1 4,519.0 3,892 3,431.0 7,950.0 6,632.2
Financial statements of Barry Callebaut AGBarry Callebaut AGAnnual Report 2013/14

141
There were no termination payments or payments to former members of the Board of Directors or Executive Committee during the fiscal year. As of August 31, 2014, no loans or credits to members of the Board of Directors or Executive Committee or parties related to them are outstanding.
Holdings of shares and options12
Number of shares as of August 31, 2014 2013
Board of DirectorsAndreas Jacobs (Chairman)13 3,260 2,760Andreas Schmid (Vice Chairman) 7,678 8,738Ajai Puri 360 180James L. Donald 900 720Markus Fiechter n/a 60Jakob Baer 540 360Nicolas Jacobs 159,179 158,999Timothy E. Minges 116 –Fernando Aguirre 116 –
Executive CommitteeJuergen Steinemann, CEO Barry Callebaut Group 8,063 5,931Victor Balli, CFO Barry Callebaut Group 729 400Massimo Garavaglia, President Western Europe 233 –David S. Johnson, President Americas 2,261 3,202Steven Retzlaff, President Global Cocoa 628 465Dirk Poelman, Chief Operations Officer 1,274 1,331Peter Boone, Chief Innovation & Quality Officer – –1 Key management is defined as Board of Directors (BoD)
and Executive Committee.2 Includes upside bonus pursuant to the deferred share plan
2011–14, which led to an extraordinary payout of CHF 6.7 million to the Executive Committee as a result of the over-performance of the share price versus target share price over the past three fiscal years.
3 Including social security and pension contributions as well as other benefits.
4 Number of shares granted in relation to the fiscal year under review; vesting subject to meeting service and/or performance conditions. Grants to BoD are based on the calendar year.
5 Value defined as closing share price at grant date, which might be historical rates before the fiscal year under review.
6 Audit, Finance, Risk, Quality & Compliance Committee.7 Nomination & Compensation Committee.8 Services rendered by Markus Fiechter as a member of the
BoD until and including October 2012 were covered by the service fee charged by Jacobs Holding AG (see also note 27 of the Consolidated Financial Statements of Barry Callebaut Group). As from November 2012, he received the regular compensation for the members of the BoD. At the General Assembly held on December 11, 2013, Markus Fiechter resigned.
9 Nicolas Jacobs was elected as member of the BoD at the General Assembly held on December 5, 2012. At the same time, Stefan Pfander, who was formerly serving as BoD member and member of the NCC, resigned.
10 At the Extraordinary General Assembly held on April 22, 2013, Timothy E. Minges and Fernando Aguirre were elected members of the BoD.
11 Disclosure relates to the Executive Committee as in place on August 31, 2014, i.e.: Juergen Steinemann, Victor Balli, Massimo Garavaglia, David S. Johnson, Steven Retzlaff, Dirk Poelman and Peter Boone.
12 Including shares of related parties to the individual BoD/ Executive Committee member.
13 Excluding the 50.11% participation held by Jacobs Holding AG (see note 5).
Financial statements of Barry Callebaut AGBarry Callebaut AG
Annual Report 2013/14
142
7 Risk assessment disclosuresBarry Callebaut AG as the ultimate parent of the Barry Callebaut Group, is fully integratedinto the Group-wide Risk Management (GRM) process and the respective Enterprise Risk Management Model.
The Group’s general Risk Management process and the Financial Risk Management in particular are described in the Group’s Consolidated Financial Statements in notes 26 and 30, respectively.
8 Subsequent eventsThere are no subsequent events that would require any modification of the value of the assets and liabilities or additional disclosures.
9 Appropriation of available earnings and reservesThe Board of Directors proposes the following appropriation of retained earnings and reserves:
9.1 Allocation from reserves from capital contributions to free reservesin the amount of CHF 85,077,299.
9.2 Dividend payout of CHF 15.50 per share out of the free reserves as per note 9.1 in the amount of CHF 85,077,299.
9.3 Carry-forward of the balance of retained earnings of CHF 1,432,489,439.
Financial statements of Barry Callebaut AGBarry Callebaut AGAnnual Report 2013/14

KPMG AG/SA, a Swiss corporation, is a subsidiary of KPMG Holding AG/SA, which is a member of the KPMG network of independent firms affiliated with KPMG International Cooperative (“KPMG International”), a Swiss le-gal entity.
Member of the Swiss Instituteof Certified Accountants and Tax Consultants
KPMG AG Audit Badenerstrasse 172 P.O. Box Telephone +41 58 249 31 31 CH-8004 Zurich CH-8026 Zurich Fax +41 58 249 44 06 Internet www.kpmg.ch
Report of the Statutory Auditor to the General Meeting of Shareholders of
Barry Callebaut AG, Zurich
Report of the Statutory Auditor on the Financial Statements
As statutory auditor, we have audited the accompanying financial statements of Barry Callebaut AG, which comprise the income statement, balance sheet and notes on pages 136 to 142 for the year ended August 31, 2014.
Board of Directors’ ResponsibilityThe board of directors is responsible for the preparation of the financial statements in accordance with the requirements of Swiss law and the company’s articles of incorporation. This responsibility includes designing, implementing and maintaining an internal control system relevant to the preparation of financial statements that are free from material misstatement, whether due to fraud or error. The board of directors is further responsible for selecting and applying appropriate accounting policies and making accounting estimates that are reasonable in the circumstances.
Auditor’s ResponsibilityOur responsibility is to express an opinion on these financial statements based on our audit. We conducted our audit in accordance with Swiss law and Swiss Auditing Standards. Those standards require that we plan and perform the audit to obtain reasonable assurance whether the financial statements are free from material misstatement.
An audit involves performing procedures to obtain audit evidence about the amounts and disclosures in the financial statements. The procedures selected depend on the auditor’s judgment, including the assessment of the risks of material misstatement of the financial statements, whether due to fraud or error. In making those risk assessments, the auditor considers the internal control system relevant to the entity’s preparation of the financial statements in order to design audit procedures that are appropriate in the circumstances, but not for the purpose of expressing an opinion on the effectiveness of the entity’s internal control system. An audit also includes evaluating the appropriateness of the accounting policies used and the reasonableness of accounting estimates made, as well as evaluating the overall presentation of the financial statements. We believe that the audit evidence we have obtained is sufficient and appropriate to provide a basis for our audit opinion.
OpinionIn our opinion, the financial statements for the year ended August 31, 2014 comply with Swiss law and the company’s articles of incorporation.
Report on Other Legal RequirementsWe confirm that we meet the legal requirements on licensing according to the Auditor Oversight Act (AOA) and independence (article 728 CO and article 11 AOA) and that there are no circumstances incompatible with our independence.
In accordance with article 728a paragraph 1 item 3 CO and Swiss Auditing Standard 890, we confirm that an internal control system exists, which has been designed for the preparation of financial statements according to the instructions of the board of directors.
We further confirm that the proposed appropriation of available earnings complies with Swiss law and the com pany’s articles of incorporation. We recommend that the financial statements submitted to you be approved.
KPMG AG
Marc Ziegler Patricia BielmannLicensed Audit Expert Licensed Audit ExpertAuditor in Charge
Zurich, November 3, 2014


146 Corporate Governance
168 Glossary 170 Contacts, Financial calendar and Forward-looking statements

146
Corporate Governance
The information that follows is provided in accordance with the Directive on Information Relating to Corporate Governance issued by the SIX Exchange Regulation (DCG). The principles and rules of Corporate Governance as practiced by Barry Callebaut are laid down in the Articles of Incorporation, the Internal Regu-lations of the Board and the Charters of the Board Committees. These are reviewed regularly by the Board of Directors and adapted as needed.
Group structure and shareholdersAs of November 6, 2014, the organization of the Barry Callebaut Group is divided into the following Regions: Europe, consisting of Western Europe and EEMEA (i.e. Eastern Europe, Middle East & Africa), Americas, consisting of North and South America, and Chocolate Asia Pacific. Global Cocoa is treated like a Region and includes Cocoa Asia Pacific, which is centrally steered by Global Cocoa, but operationally organized as a separate Region.
Corporate GovernanceBarry CallebautAnnual Report 2013/14
Global Human ResourcesBarbara Becker
1 AFRQCC: Audit, Finance, Risk, Quality & Compliance Committee. 2 NCC: Nomination & Compensation Committee.3 Member of the Executive Committee. 4 Eastern Europe, Middle East, Africa.
Board of DirectorsChairman: Andreas Jacobs
CEOJuergen Steinemann 3
Western EuropeMassimo Garavaglia 3
EEMEA 4
Filip De Reymaeker
AmericasDavid S. Johnson 3
AFRQCC 1
Chairman: Jakob Baer
Internal AuditMarkus Mayer
Global Cocoa Steven Retzlaff 3
Cocoa Asia PacificEdmund EE Kim Seng
Chocolate Asia PacificMikael Neglen
NCC 2
Chairman: James Donald
General Counsel & Corporate SecretaryRoland Maurhofer
Corporate CommunicationsGaby Tschofen
GourmetPascale Meulemeester
Chief Operations OfficerDirk Poelman 3
Chief Innovation & Quality Officer Peter Boone 3
CFOVictor Balli 3

147
The structure of the financial reporting is explained in note 3 to the Consolidated Financial Statements on pages 84–86.
Barry Callebaut AG (the “Company”) was incorporated on December 13, 1994 under Swiss law, having its head office in Zurich, Switzerland, at Pfingstweidstrasse 60. Barry Callebaut AG is registered in Switzerland and has been listed on the SIX Swiss Exchange (BARN, ISIN Number: CH0009002962) since 1998. Barry Callebaut AG has not requested the admission to trading of its shares on any other stock exchange. As of August 31, 2014, the total amount of issued shares of Barry Callebaut AG was 5,488,858 and thus Barry Callebaut’s market capitalization based on issued shares was CHF 6,175 million (August 31, 2013: CHF 4,805 million). The Group’s ultimate parent is Jacobs Holding AG with a share of 50.11% of the shares issued (August 31, 2013: 50.11%).
The principal subsidiaries of Barry Callebaut AG are listed in note 29 to the Consolidated Financial Statements on pages 130–131. The significant shareholders of Barry Callebaut AG are listed in note 27 to the Consolidated Financial State-ments on page 127. There are no cross-shareholdings equal or higher than 5% of the issued share capital.
Capital structureThe information required by the DCG regarding the capital structure is provided in note 25 (share capital, movements in the share capital) to the Consolidated Financial Statements on pages 114–115. The Company has no convertible bonds outstanding. The Extraordinary General Meeting of April 22, 2013 created autho-rized share capital of a maximum nominal amount of CHF 9.3 million for the purpose of financing the acquisition of the Cocoa Ingredients Division from Petra Foods Ltd. The Board of Directors of Barry Callebaut AG subsequently decided to increase the share capital by issuing 318,858 newly created shares (approx. 6% of the existing shares) in June 2013 for the aforementioned purpose. No further shares have been issued since then.
Corporate GovernanceBarry Callebaut
Annual Report 2013/14
Additional information:www.barry-callebaut.com/board www.barry-callebaut.com/regulations
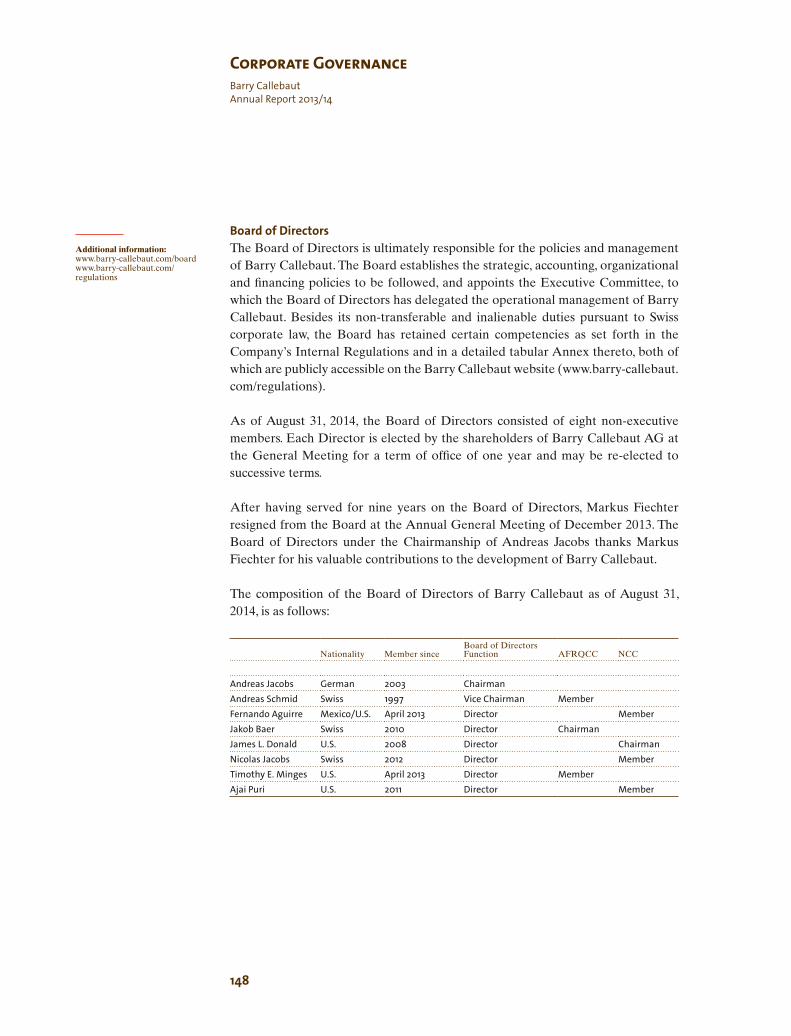
148
Board of DirectorsThe Board of Directors is ultimately responsible for the policies and management of Barry Callebaut. The Board establishes the strategic, accounting, organizational and financing policies to be followed, and appoints the Executive Committee, to which the Board of Directors has delegated the operational management of Barry Callebaut. Besides its non-transferable and inalienable duties pursuant to Swiss corporate law, the Board has retained certain competencies as set forth in the Company’s Internal Regulations and in a detailed tabular Annex thereto, both of which are publicly accessible on the Barry Callebaut website (www.barry-callebaut.com/regulations).
As of August 31, 2014, the Board of Directors consisted of eight non-executive members. Each Director is elected by the shareholders of Barry Callebaut AG at the General Meeting for a term of office of one year and may be re-elected to successive terms.
After having served for nine years on the Board of Directors, Markus Fiechter resigned from the Board at the Annual General Meeting of December 2013. The Board of Directors under the Chairmanship of Andreas Jacobs thanks Markus Fiechter for his valuable contributions to the development of Barry Callebaut.
The composition of the Board of Directors of Barry Callebaut as of August 31, 2014, is as follows:
Nationality Member sinceBoard of Directors Function AFRQCC NCC
Andreas Jacobs German 2003 ChairmanAndreas Schmid Swiss 1997 Vice Chairman MemberFernando Aguirre Mexico/U.S. April 2013 Director MemberJakob Baer Swiss 2010 Director ChairmanJames L. Donald U.S. 2008 Director ChairmanNicolas Jacobs Swiss 2012 Director MemberTimothy E. Minges U.S. April 2013 Director MemberAjai Puri U.S. 2011 Director Member
Corporate GovernanceBarry CallebautAnnual Report 2013/14
Additional information:www.barry-callebaut.com/board www.barry-callebaut.com/regulations

149
Andreas Jacobs (1963) was appointed Chairman of the Board of Barry Callebaut AG in December 2005. He had served as a member of the Board of Barry Callebaut since 2003.
Andreas Jacobs studied law at the Universities of Freiburg im Breisgau, Munich and Montpellier and subsequently obtained a postgraduate degree in European competition law (Dr. iur.) from the University of Freiburg im Breisgau. Afterwards he obtained a MBA from INSEAD in Fontainebleau.
From 1991 to 1993, Andreas Jacobs worked as a consultant and project man-ager at The Boston Consulting Group in Munich. Since 1992, Andreas Jacobs has been an independent entrepreneur with a stake in several companies plus minority interests in several other companies.
Andreas Jacobs serves as Executive Chairman of Jacobs Holding AG, Chairman of Triventura AG and Minibar AG, as well as Vice Chairman of the Board of Adecco S.A., all in Switzerland. Furthermore, he is President of Niantic Holding GmbH, Germany, and Member of the Board of Directors of various small private companies. Andreas Jacobs is also a Member of the Advisory Board of Dr. August Oetker KG, Germany, and has several non-profit memberships, e.g. at INSEAD where he was appointed Chairman in October 2014, Young Presidents’ Organization (YPO), Groupe D’Ouchy, Avenir Suisse.
Andreas Schmid (1957) was appointed CEO of Jacobs Holding AG in 1997. In 1999, he became Chairman of the Board and CEO of Barry Callebaut AG. In June 2002, he handed over the CEO function but continued to assume the responsibility of Chairman until December 2005. Since then he has been Vice Chairman of the Board.
He started his career in 1984 at Union Bank of Switzerland. Following a position as assistant to a Swiss industrialist, he was CEO and Managing Director of Kopp Plastics (PTY) Ltd. in South Africa from 1989 to 1992. He then worked for the Jacobs Group in various staff and line functions until 1993. From 1993 to 1997, Andreas Schmid was President of the Mövenpick Consumer Goods Division and a member of the worldwide Group Executive Board of Management. Between December 2007 and May 2011, Andreas Schmid was Chairman of the Supervisory Board of Symrise AG, and between 2002 and 2006 he chaired the Board of Kuoni Travel Holding AG. He was a member of the Board of Adecco S.A. from 1999 to 2004 and a member of the Advisory Board of the Credit Suisse Group from 2001 to 2007, before the Advisory Board was dissolved.
Andreas Schmid is Chairman of Oettinger Davidoff Group, Chairman of the Board of Directors of Flughafen Zurich AG and Chairman of the Board of Directors of gategroup Holding AG. In 2010, he was appointed a member of the Board of Directors of Wirz Partner Holding AG and the Advisory Board of Allianz Global Corporate Specialty AG. He has also been a member of the Board of Directors of
Andreas JacobsChairman of the Board since 2005, member of the Board since 2003, German national
Andreas SchmidVice Chairman, member of the Board since 1997, Swiss national
Corporate GovernanceBarry Callebaut
Annual Report 2013/14

150
Karl Steiner AG since 2008 and a member of the Board of Directors of Badrutt’s Palace Hotel AG since 2006. Furthermore, Andreas Schmid is Chairman of the Board of Trustees of the Swiss foundation “avenir suisse”, a think tank for social and economic issues.
Andreas Schmid holds a Master’s degree in law and studied economics at the University of Zurich.
Fernando Aguirre (1957) served as the Chairman and CEO of Chiquita Brands Inter-national Inc., a leading international food manufacturer, from 2004 until 2012. Prior to Chiquita, Fernando Aguirre worked in various management positions for more than 23 years at The Procter & Gamble Co, such as President of Special Projects, President of the Global Feminine Care business unit, Vice President of Global Snacks and U.S. Food Products business units, Vice President of Laundry & Cleaning Products, Latin America, and Regional Vice President, Latin America, North.
At present, Fernando Aguirre is a member of the Board of Directors of Aetna Inc., a Fortune 100 publicly held company mainly focused on health care benefits and insurance, where he serves on the Audit Committee and also on the Nominating and Governance Committee. He was recently elected to serve on the board of Coveris, a privately held company which is an international manufacturer and distributor of flexible packaging. Fernando Aguirre also served on the board of Levi Strauss & Co. from 2010 to 2014, he served on the board of Coca-Cola Enterprises from 2005 to 2010, and as a member of the International Board of the Juvenile Dia-betes Research Foundation from 2006 to 2012. He was recently named to the board of the Procter & Gamble Alumni Association and is also a member of the Advisory Council of the Bechtler Museum of Modern Art in Charlotte, North Carolina.
Fernando Aguirre holds a Bachelor of Science in Business Administration from Southern Illinois University Edwardsville and earned Harvard Business School graduate status in 2009.
Jakob Baer (1944) started his career in 1971 at the Federal Finance Administration. From 1975 until 1991, he was with Fides Group, where he held various positions (as Consultant, Head of Legal Department, Branch Office Manager Zurich, Member of the Division Management Advisory Services). During 1991/1992, Jakob Baer led the planning and execution of the management buyout of the Advisory Services unit of Fides Group, which became part of KPMG Switzerland. He was a member of the Executive Committee of KPMG Switzerland from 1992 until 1994. From 1994 to 2004, he held the position of Chief Executive Officer of KPMG Switzerland and was a member of KPMG’s European and International Leadership Boards. Jakob Baer was Counsel at Niederer Kraft & Frey AG, attorneys at law, Zurich,
Fernando AguirreDirector since 2013,Mexican/U.S. national
Jakob BaerDirector since 2010, Swiss national
Corporate GovernanceBarry CallebautAnnual Report 2013/14

151
Switzerland, from 2004 to 2009. He served as a member of the Board of Directors of Adecco S.A. from 2004 until April 2012, of SwissRe and of Allreal Holding AG, each from 2005 until April 2014.Jakob Baer is Chairman of Stäubli Holding AG and member of the Board of Direc-tors of Rieter Holding AG and IFBC AG, all in Switzerland.
He was admitted to the bar (1971) and subsequently obtained a doctorate degree in law (Dr. iur.) from the University of Berne, Switzerland.
James “Jim” L. Donald (1954) has been Chief Executive Officer of Extended Stay, a large U.S.-based hotel chain, since February 2012.
He served as President and CEO of Haggan, Inc., a 33-store Pacific Northwest grocery company based in Bellingham, from September 2009 until March 2011. Jim Donald was also President & Chief Executive Officer of Starbucks Corporation from April 2005 to January 2008. From October 2002 to March 2005, he served as President of Starbucks, North America. Under his leadership, Starbucks experi-enced strong growth and performance.
From October 1996 to October 2002, Jim Donald served as Chairman, Presi-dent & Chief Executive Officer of Pathmark Stores, Inc., a USD 4.6 billion regional supermarket chain located in New York, New Jersey and Pennsylvania. Prior to that time, he held a variety of senior management positions with Albertson’s, Inc., Safeway, Inc. and Wal-Mart Stores, Inc. From 2008 until June 2013, Jim Donald also served as a member of the Board of Rite Aid Corporation, one of the leading drug-store chains in the U.S. with more than 4,900 stores in 31 states.
Jim Donald graduated with a Bachelor’s degree in Business Administration from Century University, Albuquerque, New Mexico.
Nicolas Jacobs (1982) started his career at Goldman Sachs in 2006. In 2007, he joined Barry Callebaut as a Trader in the Global Sourcing & Cocoa business unit. In 2008, he was assigned to Barry Callebaut Brazil as Project Leader StrategicProjects Brazil and was then responsible for the cocoa and the chocolate operations of South America. From 2011 until 2014, Nicolas Jacobs served for Burger King Corporation as a Senior Director for Global M&A and Development, with responsibilities for strategic projects and the expansion of Burger King within EMEA. Furthermore, Nicolas Jacobs has been a member of the Board of Jacobs Holding AG since 2008. Since 2014, he has been Managing Partner and Member of the Board of Consumer Investment Partners AG, Zug, a venture capital and private equity company.
Nicolas Jacobs holds a Master’s degree in law from the University of Zurich, a Master of Finance of London Business School and a Master of Business Administration from INSEAD in Fontainebleau.
James L. DonaldDirector since 2008, U.S. national
Nicolas JacobsDirector since 2012,Swiss national
Corporate GovernanceBarry Callebaut
Annual Report 2013/14

152
Timothy E. Minges (1958) is currently Senior Vice President Chief Customer Officer, PepsiCo North America Beverages and a member of PepsiCo’s Executive Committee. He has been working with PepsiCo for the past 31 years and was, until 2013, responsible for the entire PepsiCo operations throughout greater China. He joined PepsiCo in 1983 in the finance department of Frito-Lay North America and was promoted to a series of roles in finance, sales and general management. Timothy Minges moved to Asia in 1994 as General Manager of Frito-Lay Thailand and later assumed a series of roles, including President Asia-Pacific from 1999 to 2003.
Timothy Minges serves on the board of directors of the North American Coffee Partnership, a PepsiCo joint venture with Starbucks. He formerly served on the Boards of Tingyi-Asahi Beverage Holding Co Ltd, Calbee Foods Japan, as well as of two listed companies, Pepsi-Cola Philippines and Serm Suk Thailand.
Timothy Miniges holds a Bachelor of Science in Accounting from Miami University, Oxford, Ohio, and has completed the Pepsi Executive Development Program at Yale School of Management.
Ajai Puri (1953) has been a member of the Supervisory Board of Nutreco N.V., the Netherlands, a leading global animal nutrition and aquaculture company, since April 2009. Additionally, he serves as a Non-Executive Director on the Board of Britannia Industries Limited, India’s largest independent food group, and as member of the Board of Directors of Tate&Lyle (United Kingdom), a global provider of distinctive, high-quality ingredients and solutions to the food, beverage and other industries.
Ajai Puri has a broad know-how and experience in the fields of Management, R&D/Innovation, Marketing and Manufacturing, Product Safety and Quality Assurance which he gained during his assignments with the companies Cadbury Schweppes PLC, The Minute Maid Company/The Coca-Cola Company and latest with Royal Numico N.V. in the Netherlands. During his career, Ajai Puri has held a variety of positions of global scope including that of Senior Vice President Tech- nical (Science and Technology) at The Minute Maid Company in the U.S., and President Research, Development and Product Integrity at Royal Numico in the Netherlands. Ajai Puri is furthermore co-founder of P.A.N.I., a self-funded charitable foundation dedicated to improving the lives of the underprivileged in India. The focus of the foundation is education for children and women, and cleft lip surgical corrections.
Ajai Puri holds a PhD in Food Science from the University of Maryland and an MBA from the Crummer Business School, Rollins College, Florida.
Timothy E. MingesDirector since 2013,U.S. national
Ajai PuriDirector since 2011, U.S. national
Ajai Puri will not be available for re-election to the Board of Directors at the next Annual General Meeting of Shareholders on December 10, 2014.
Corporate GovernanceBarry CallebautAnnual Report 2013/14

153
Functioning of the BoardThe Board of Directors constitutes itself at its first meeting subsequent to the Annual General Meeting of the Shareholders, with the exception of the Chairman and the members of the Compensation Committee who are elected by the Annual General Meeting pursuant to the “Ordinance against Excessive Compensation at Listed Joint-Stock Companies” (“OaEC”). The Board elects one or more Vice Chairmen. It meets as often as business requires, but at least four times per fiscal year. The meetings usually take place in Zurich. If possible, the Board meets once per year at one of the Barry Callebaut production sites and combines this meeting with a visit of the local operation. During this fiscal year, the Board of Directors met six times. Three meetings lasted for eight hours, one of three hours and two meetings lasted for one hour. The two latter meetings took place in the form of conference calls. In the year under review, the Board held one of the regular meetings in the context of a three-day visit to Brussels and the Group’s operations in Wieze, Belgium.
The Chairman invites the members to the meetings in writing, indicating the agenda and the motion for resolution thereto. The invitations are sent out at least ten business days prior to the meeting. Each member of the Board can request the Chairman to call a meeting without undue delay. In addition to the materials for meetings, the Board members receive monthly financial reports.
At the request of one member of the Board, members of the Executive Committee shall be invited to attend meetings. The Board of Directors can deter-mine by majority vote that other third parties, for example external consultants, may attend part or all of the meetings. In the fiscal year under review, the CEO, the CFO and, depending on the agenda items, other members of the Executive Committee or management were present at all Board and Committee meetings, with the exception of a short closed discussion by the Board of Directors at the end of each physical Board meeting.
Resolutions are adopted by a simple majority of the Board members present or represented. Members may only be represented by a fellow Board member. In the event of a tie vote, the proposal is deemed to be not resolved. Resolutions made at the Board meetings are documented through written minutes of the meeting.
Directors may request any information necessary to fulfill their duties. Outside of meetings, any Director may request information from members of the Executive Committee concerning the Group’s business development. Requests for information must be addressed to the Chairman of the Board.
Corporate GovernanceBarry Callebaut
Annual Report 2013/14

154
The Board of Directors has formed the following committees:Audit, Finance, Risk, Quality & Compliance CommitteeJakob Baer (Chairman), Andreas Schmid and Timothy E. Minges.
The role of the AFRQCC is to assist the Board of Directors in carrying out its responsibilities. The Board of Directors has not delegated any decision power to the AFRQCC. The primary task of the Audit, Finance, Risk, Quality & Compliance Committee (AFRQCC) is to assist the Board in carrying out its responsibilities and make recommendations regarding the company’s accounting policies, financial reporting, internal control system, legal and regulatory compliance and quality management. In addition, the AFRQCC reviews the basic risk management principles and guidelines, the hedging and financing strategies as well as the bases upon which the Board of Directors determines risk tolerance levels and limits for exposures of raw material positions. For details of the risk management system, see note 7 to the Financial Statements of Barry Callebaut AG on page 142 and notes 26 and 30 to the Consolidated Financial Statements on pages 115–126 and 132.
The AFRQCC further assists the Board of Directors in fulfilling its oversight responsibility of the external auditors. The AFRQCC recommends the external auditors, reviews their qualification and independence, the audit fees, the external audit coverage, the reporting to the Board and/or the Audit Committee, and assesses the additional non-audit services as well as the annual financial statements and the notes thereto. The external auditors attended one meeting of the Audit, Finance, Risk, Quality & Compliance Committee in fiscal year 2013/14; further-more, the Chairman of the AFRQCC met the lead external auditor three times outside AFRQCC meetings.
Barry Callebaut has its own Internal Audit Department. The Internal Audit function reports to the Chairman of the AFRQCC. The scope of internal auditing encompasses the examination and evaluation of the adequacy and effectiveness of the organization’s system of internal control and the quality of performance in carrying out assigned responsibilities. Significant findings of the Internal Audit Department as well as the respective measures of the Management are presented and reviewed in the meetings of the AFRQCC and of the Board of Directors. The AFRQCC reviews the annual plan of the Internal Audit Department based on a risk assessment. In the last fiscal year, the Internal Audit Department was supported on two projects by third-party experts.
Pursuant to the Group’s “Fraud Response and Whistleblowing Policy”, the Fraud Committee, chaired by the Group’s General Counsel, evaluates and, as the case may be, investigates alleged violations of the Code of Conduct under the supervision of the Chairman of the AFRQCC. The Fraud Committee reports all pending cases to the AFRQCC on a regular basis.
Corporate GovernanceBarry CallebautAnnual Report 2013/14
155
The AFRQCC meets as often as business requires, but at least three times per fiscal year. The meetings usually take place in Zurich. In the last fiscal year, the committee met six times. The meetings lasted two to three hours. One of the meetings took place in the form of a conference call and one in the context of the Board’s three-day visit to Brussels/Wieze, Belgium.
Nomination & Compensation CommitteeJames L. Donald (Chairman), Fernando Aguirre, Nicolas Jacobs, Ajai Puri
The role of the Nomination & Compensation Committee (NCC) is to assist the Board of Directors in carrying out its responsibilities. The Board of Directors has not delegated any decision power to the NCC. The responsibilities of the NCC are to make recommendations to the Board with respect to the selection, nomination, compensation, evaluation, and, when necessary, the replacement of key executives. The NCC establishes jointly with the CEO a general succession planning and development policy. The committee also reviews and recommends the remuneration to be paid to members of the Board of Directors and the Execu-tive Committee. It also ensures a transparent Board and Executive Committee nomination process and evaluates potential conflicts of interest involving executive management and Board members. The NCC monitors the developments of the regulatory framework for compensation of the top management and the Board of Directors on an ongoing basis and develops suggestions for the respective adapta-tions of Barry Callebaut’s compensation system, e.g. the changes necessary for the implementation of the requirements of the Swiss Federal Council’s “Ordinance against Excessive Compensation at Listed Joint-Stock Companies” (“OaEC”). For the implementation of the OaEC, the NCC was assisted by an ad hoc committee consisting of the Chairman and the Vice Chairman of the Board of Directors, Jakob Baer and the Group CFO (“OaEC”-Committee). The OaEC-Committee held three meetings of two hours during the last fiscal year.
The NCC meets as often as business requires, but at least three times per fiscal year. The meetings usually take place in Zurich. Last year, the committee met five times, one of which was in the form of a conference call. The meetings lasted for two hours. One of the meetings took place in the context of the Board’s three-day visit to Brussels/Wieze, Belgium.
Corporate GovernanceBarry Callebaut
Annual Report 2013/14

156
Executive CommitteeThe Executive Committee consists of seven functions and is headed by the Chief Executive Officer. For external activities of each member of the Executive Committee, see the respective curriculum vitae.
Name Function Nationality Member since
Juergen Steinemann Chief Executive Officer German 2009Victor Balli Chief Financial Officer Swiss 2007Peter Boone Chief Innovation & Quality Officer Dutch 2012Massimo Garavaglia Western Europe Italian 2004David S. Johnson Americas U.S. 2009Dirk Poelman Chief Operations Officer (COO) Belgian 2009Steven Retzlaff Global Cocoa U.S./Swiss 2008
Juergen Steinemann (1958) was appointed Chief Executive Officer of Barry Callebaut AG in August 2009.
Before joining Barry Callebaut, Juergen Steinemann served as a member of the Executive Board of Nutreco and as Chief Operating Officer since October 2001. Nutreco, quoted on the Official Market of Euronext Amsterdam, is a leading global animal nutrition and aquaculture company, headquartered in the Netherlands.
From 1999 to 2001, Juergen Steinemann served as Chief Executive Officer of Unilever’s former subsidiary Loders Croklaan, which produced and marketed specialty oils and fats for the chocolate, bakery and functional foods industry. Between 1990 and 1998, Juergen Steinemann was with the former Eridania Béghin-Say Group, where he held various senior positions in business-to-business marketing and sales, ultimately in the “Corporate Plan et Stratégie” unit at the head office in Paris.
Since April 2014, Juergen Steinemann has been member of the Board of Directors of Lonza Group AG, Switzerland. Since 2014, he is also Vice Chairman of the World Cocoa Foundation.
Juergen Steinemann graduated from his economics/business studies at the European Business School in Wiesbaden (Germany), London, and Paris in 1985.
Juergen SteinemannChief Executive Officer, German national
Corporate GovernanceBarry CallebautAnnual Report 2013/14

157
Victor Balli (1957) was appointed Chief Financial Officer and member of the Executive Committee of Barry Callebaut AG in February 2007.
Before joining Barry Callebaut, Victor Balli was with Minibar since 1996. He began his career at Minibar as Chief Financial Officer and additionally held the position of Chief Executive Officer EMEA as of 2005. During this time, he also served as executive director and board member of several group companies of Niantic, a family investment holding. From 1991 to 1995, he worked as a Principal with Adinvest AG, a corporate finance advisory company with offices in Zurich, San Francisco, New York, and London. From 1989 to 1991, Victor Balli served as Director of Corporate Finance with Marc Rich & Co. Holding in Zug. He started his professional career in 1985, working as a Financial Analyst& Business Develop-ment Manager with EniChem International SA in Zurich and Milan.
Victor Balli holds a Master’s degree in Economics from the University of St. Gallen and a Master’s degree in Chemical Engineering from the Swiss Federal Institute of Technology, Zurich.
Massimo Garavaglia (1966) was appointed President Western Europe in June 2009 and is a member of the Executive Committee of Barry Callebaut AG. Prior to this, he served as President Region Americas for three years.
From 1990 to 1992, Massimo Garavaglia was sales manager for an Italian food products importer. He joined Callebaut Italy S.p.A. in 1992 as country manager for Italy. After the merger between Callebaut and Cacao Barry in 1996, he was Barry Callebaut’s country manager in Italy until 2003. From 2003 until September 2004, he headed the region consisting of the Mediterranean Countries/Middle East/ Eastern Europe. From September 2004 until 2006, he was President Food Manu-facturers.
Massimo Garavaglia holds a Master’s degree in Economics and Business Administration from Bocconi University, Milan.
Victor BalliChief Financial Officer, Swiss national
Massimo GaravagliaPresident Western Europe, Italian national
Corporate GovernanceBarry Callebaut
Annual Report 2013/14

158
David S. Johnson (1956) was appointed Chief Executive Officer and President Americas in May 2009, and is a member of the Executive Committee of Barry Callebaut AG.
Before joining Barry Callebaut, David Johnson served as Chief Executive Officer and member of the board of Michael Foods, Inc., a food processor and distributor headquartered in Minnetonka, Maine, U.S.
From 1986 to 2006, David Johnson was with Kraft Foods Global, Inc. At Kraft Foods, where he held several senior positions in different divisions, including marketing, strategy, operations, procurement and general management. His last position was President Kraft North America and Corporate Officer Kraft Foods Global, Inc. He started his career in 1980 at RJR Nabisco.
David Johnson is a member of the Board of Directors of Arthur J. Gallagher & Co., an international insurance brokerage and risk management company with headquarters in Itasca, Illinois, U.S.
David Johnson holds both a Bachelor’s and a Master’s degree in business from the University of Wisconsin.
Dirk Poelman (1961) was appointed Chief Operations Officer (COO) in September 2006 and member of the Executive Committee in November 2009, as well as Chief Innovation Officer (CIO) ad interim from June to December 2012. Since 1984, he has been working with Callebaut – which merged with Cacao Barry in 1996 – in various positions and countries: first as Engineering Manager, then as Production Manager, Operations Director and Chief Manufacturing Officer.
In 1997, Dirk Poelman became Executive Vice President Operations, respon-sible for the operations of the Group, and a member of the Senior Management Team. In 2004, he was appointed Vice President Operations and Research & Development.
Dirk Poelman holds an industrial engineering degree in electromechanics from the Catholic Industrial High School in Aalst, Belgium.
David S. JohnsonCEO and President Americas, U.S. national
Dirk PoelmanChief Operations Officer, Belgian national
Corporate GovernanceBarry CallebautAnnual Report 2013/14
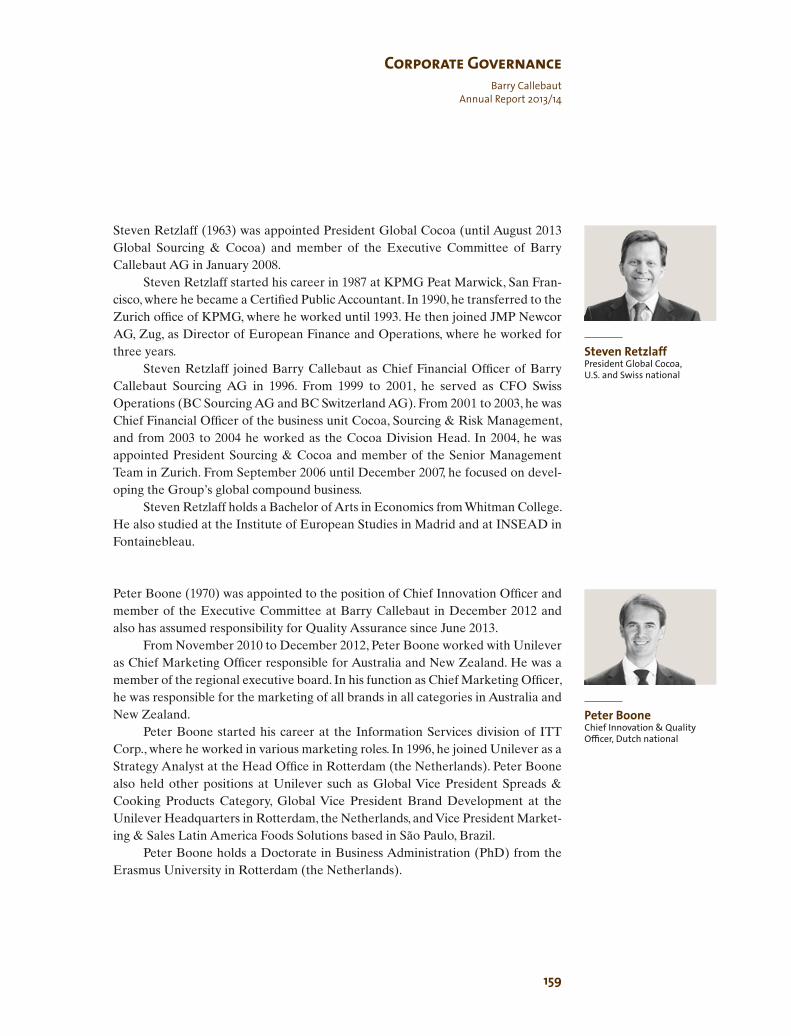
159
Steven Retzlaff (1963) was appointed President Global Cocoa (until August 2013 Global Sourcing & Cocoa) and member of the Executive Committee of Barry Callebaut AG in January 2008.
Steven Retzlaff started his career in 1987 at KPMG Peat Marwick, San Fran- cisco, where he became a Certified Public Accountant. In 1990, he transferred to the Zurich office of KPMG, where he worked until 1993. He then joined JMP Newcor AG, Zug, as Director of European Finance and Operations, where he worked for three years.
Steven Retzlaff joined Barry Callebaut as Chief Financial Officer of Barry Callebaut Sourcing AG in 1996. From 1999 to 2001, he served as CFO Swiss Operations (BC Sourcing AG and BC Switzerland AG). From 2001 to 2003, he was Chief Financial Officer of the business unit Cocoa, Sourcing & Risk Management, and from 2003 to 2004 he worked as the Cocoa Division Head. In 2004, he was appointed President Sourcing & Cocoa and member of the Senior Management Team in Zurich. From September 2006 until December 2007, he focused on devel-oping the Group’s global compound business.
Steven Retzlaff holds a Bachelor of Arts in Economics from Whitman College. He also studied at the Institute of European Studies in Madrid and at INSEAD in Fontainebleau.
Peter Boone (1970) was appointed to the position of Chief Innovation Officer and member of the Executive Committee at Barry Callebaut in December 2012 and also has assumed responsibility for Quality Assurance since June 2013.
From November 2010 to December 2012, Peter Boone worked with Unilever as Chief Marketing Officer responsible for Australia and New Zealand. He was a member of the regional executive board. In his function as Chief Marketing Officer, he was responsible for the marketing of all brands in all categories in Australia and New Zealand.
Peter Boone started his career at the Information Services division of ITT Corp., where he worked in various marketing roles. In 1996, he joined Unilever as a Strategy Analyst at the Head Office in Rotterdam (the Netherlands). Peter Boone also held other positions at Unilever such as Global Vice President Spreads & Cooking Products Category, Global Vice President Brand Development at the Unilever Headquarters in Rotterdam, the Netherlands, and Vice President Market-ing & Sales Latin America Foods Solutions based in São Paulo, Brazil.
Peter Boone holds a Doctorate in Business Administration (PhD) from the Erasmus University in Rotterdam (the Netherlands).
Steven RetzlaffPresident Global Cocoa, U.S. and Swiss national
Peter BooneChief Innovation & Quality Officer, Dutch national
Corporate GovernanceBarry Callebaut
Annual Report 2013/14
160
Shareholders’ participationEach share of Barry Callebaut AG carries one vote at the General Meeting. Voting rights may be exercised only after a shareholder has been registered in the Barry Callebaut AG share register as a shareholder with voting rights.
No shareholder holding more than 5% of the share capital may be registered as a shareholder with voting rights with respect to the shares such shareholder holds in excess thereof. For purposes of the 5% rule, groups of companies and groups of shareholders acting in concert or otherwise related are considered to be one shareholder.
Shareholders may register their shares in the name of a nominee approved by Barry Callebaut AG and may exercise their voting rights by giving instructions to the nominee to vote on their behalf. However, a nominee holding more than 3% of the share capital will be registered as nominee for shareholders with voting rights only if it discloses the identity of each beneficial owner of shares claiming 0.5% or more of the share capital. No nominee holding more than 8% of the share capital may be registered as a shareholder with respect to the excess shares. The Board of Directors may, however, on a case-by-case basis, permit some or all of the excess shares to be registered with voting rights. In fiscal year 2013/14, no such exception was requested.
A resolution passed at the General Meeting with a majority of at least two thirds of the shares represented at such meeting is required to lift the restrictions on the transferability of registered shares. Shareholders may be represented at the General Meeting by another shareholder or the independent proxy pursuant to the OaEC. The Articles of Incorporation follow the majority rules and the provisions on convocation prescribed by the Swiss law concerning general meetings of share-holders. Shareholders with voting rights holding shares representing in total at least 0.25% of the share capital or the voting rights have the right to request in writing – giving at least 60 days’ notice – that a specific proposal be discussed and voted upon at the next General Meeting.
Shareholders registered in the share register with voting rights at the date specified in the invitation will receive an invitation to the General Meeting. Barry Callebaut is offering its shareholders to register with the online platform “Sherpany” and thus the possibility to submit their voting instructions to the inde-pendent proxy in an efficient manner. The published disclosures on significant shareholders of Barry Callebaut AG are accessible via the disclosure platform of SIX Exchange Regulation: www.six-exchange-regulation.com/obligations/disclosure/ major_shareholders_en.html.
Change of control and defense measuresAn investor who acquires 33.33% of all voting rights has to submit a take over offer for all shares outstanding, according to the Swiss Stock Exchange Law. Barry Callebaut has not elected to change or opt out of this rule.
Corporate GovernanceBarry CallebautAnnual Report 2013/14

161
The employment contracts of the members of the Executive Committee are open-ended and contain notice periods of 6 to 12 months, during which they are entitled to full compensation.
External auditorsAt the Annual General Meeting of Shareholders of Barry Callebaut AG on December 8, 2005, the shareholders voted to appoint KPMG AG, Zurich, as statu-tory auditors. The statutory auditors are appointed annually by the General Meeting for a one-year term of office. The current auditor in charge has exercised this function since fiscal year 2011/12. Pursuant to the Swiss regulations, he remained in this function until and including the fiscal year under review.
For the fiscal year 2013/14, the remuneration for the audit of the accounting records and the financial statements of Barry Callebaut AG, and the audit of the consolidated financial statements, amounted to CHF 2.6 million. This remuneration is evaluated by the AFRQCC in view of the scope and the complexity of the Group. The performance of the auditors is monitored by the AFRQCC, to which they pre-sent a detailed report on the result of the audit of the Group. Prior to the presenta-tion to the AFRQCC, the lead auditor reviews the audit findings with the Chairman of the AFRQCC without the presence of any members of the management.
KPMG received a total amount of CHF 0.2 million for additional services, i.e. for transaction and other advisory (incl. due diligence). Adequate measures for the avoidance of potential conflicts of interests between the different services provided by KPMG were observed.
Information policyBarry Callebaut is committed to continuous and open communication with its shareholders, potential investors and other stakeholders based on the principles of transparency and equal treatment, i.e. simultaneous provision of price-sensitive information and no selective disclosure.
The Group provides detailed information on its business activities and financial performance in its Annual and Half-year reports and press releases, at conferences for media and financial analysts as well as at the Annual General Meeting of Shareholders. Further, representatives of the Group regularly meet (current and potential) investors in personal meetings and present Barry Callebaut at industry events and investor conferences.
Presentations are also made available on the Group’s website, which is up-dated continuously. The financial calendar for the fiscal year 2013/14 and contacts are given on page 170.
The published media releases of Barry Callebaut are accessible via www. barry-callebaut.com/51. To subscribe to Barry Callebaut’s electronic news alerts, please go to: www.barry-callebaut.com/55.
Corporate GovernanceBarry Callebaut
Annual Report 2013/14

162
Corporate GovernanceBarry CallebautAnnual Report 2013/14
Report on Top Management Compensation General remarks regarding the executive remuneration at Barry CallebautThis section of the Corporate Governance Report has been established pursuant to the Directive on Information Relating to Corporate Governance issued by the SIX Exchange Regulation. The rules of the “Ordinance against Excessive Compen-sation with respect to Listed Stock Corporations” will only become applicable to Barry Callebaut’s compensation report for the fiscal year 2014/15.
The Board of Directors has the final responsibility for the remuneration of the Directors and the Executive Committee. The Nomination & Compensation Committee assists the Board in fulfilling its responsibility by evaluating the remu-neration strategy and proposing individual compensation packages for the Executive Committee members and other key members of the management.
The Board of Directors, following the review and recommendation of the Nomination & Compensation Committee, approved a revised Executive Total Reward Policy in September 2014, which aims to offer an overall remuneration package which is aligned with corporate and individual value contribution and market practice, in order to attract and retain Directors and Executives with the necessary skills.
Remuneration of the Board of DirectorsThe remuneration structure of the Board of Directors is determined at the discre-tion of the Board of Directors and not linked to any external benchmarks. It is comprised of fixed directors’ fees and grants of Barry Callebaut AG share awards. The share awards granted to the members of the Board of Directors vest after one year and the respective shares are transferred without further restrictions.
For the disclosure of the compensation of the Board of Directors in the fiscal year 2013/14, please see note 6 to the Financial Statements of Barry Callebaut AG on pages 140–141, and reproduced on the following page.

163
Corporate GovernanceBarry Callebaut
Annual Report 2013/14
Board of Directors (BoD)
Compen- sation fix
Compen- sation
variable
Other compen-
sation3
Total cash- related
remuneration
Number
of shares4
Value
of shares5
Total remuneration
2013/14
Total remuneration
2012/13
in thousands of CHF
Andreas JacobsChairman/Delegate 400.0 – – 400.0 500 498.6 898.6 833.8
Andreas SchmidVice ChairmanMember of the AFRQCC6 180.0 – 84.0 264.0 180 179.5 443.5 400.3
Ajai PuriMember of the NCC7 125.0 – – 125.0 180 179.5 304.5 281.2
James L. DonaldChairman of the NCC 140.0 – – 140.0 180 179.5 319.5 296.2
Jakob Baer
Chairman of the AFRQCC 140.0 – 35.2 175.2 180 179.5 354.7 328.0
Markus Fiechter8
Member of the AFRQCC 62.5 – 55.0 117.5 – – 117.5 305.3
Nicolas Jacobs9
Member of the NCC7 125.0 – 38.0 163.0 180 179.5 342.5 226.2
Timothy E. Minges10
Member of the AFRQCC 125.0 – – 125.0 180 179.5 304.5 74.5
Fernando Aguirre10
Member of the NCC7 125.0 – – 125.0 180 179.5 304.5 74.5
Stefan Pfander10
Member of the NCC 0.0 – – – – – – 62.5
Total remuneration Board of Directors 1,422.5 – 212.2 1,634.7 1,760 1,755.1 3,389.8 2,882.5
3 Including social security and pension contributions as well as other benefits.
4 Number of shares granted in relation to the fiscal year under review; vesting subject to meeting service and/or performance conditions. Grants to BoD are based on the calendar year.
5 Value defined as closing share price at grant date, which might be historical rates before the fiscal year under review.
6 Audit, Finance, Risk, Quality & Compliance Committee.7 Nomination & Compensation Committee.
8 Services rendered by Markus Fiechter as a member of the BoD until and including October 2012 were covered by the service fee charged by Jacobs Holding AG (see also note 27 of the Consolidated Financial Statements of Barry Callebaut Group). As from November 2012, he received the regular compensation for the members of the BoD. At the General Assembly held on December 11, 2013, Markus Fiechter resigned.
9 Nicolas Jacobs was elected as member of the BoD at the General Assembly held on December 5, 2012. At the same time, Stefan Pfander, who was formerly serving as BoD member and member of the NCC, resigned.
10 At the Extraordinary General Assembly held on April 22, 2013, Timothy E. Minges and Fernando Aguirre were elected members of the BoD.

164
Corporate GovernanceBarry CallebautAnnual Report 2013/14
Remuneration of the Executive CommitteeThe current top executive remuneration scheme is not linked to any external benchmarks. The individual packages are determined at the discretion of the Board of Directors based on the Executive Total Reward Policy as defined by the Board of Directors and considering market data from various sources, position size, the profile of and the negotiations with the respective manager. The remuneration framework for the Executive Committee of Barry Callebaut consists of four com-pensation elements: a fixed annual base salary, an annual short-term cash bonus pursuant to the Company’s Short-Term Incentive Plan, a long-term incentive comprised of a share grant pursuant to the Company’s Long-Term Incentive Plan and other benefits.
Short-term incentive plan (STIP)Pursuant to Barry Callebaut’s Executive Total Rewards Policy, the short-term bonus under the STIP has a target weight in the total remuneration of the members of the Executive Committee of 25–35%, and in the case of the CEO of 20–30%. The target short-term bonus is 100% of the fixed annual base salary of each Executive Committee member. The short-term bonus payout is linked to meeting certain performance criteria with respect to one fiscal year. The maximum payout to the members of the Executive Committee is capped at 150% of the target payout, depending on the achievement of the performance criteria. These performance criteria for the members of the Executive Committee have been defined by the Board of Directors upon evaluation and recommendation of the NCC. For the current fiscal year, the bonus of the Executive Committee depends to 20% for the Group CEO and CFO, and to 25% for the other Executive Committee members respectively, on the achievement of individual strategic targets and to 80%, and 75% respectively, on the achievement of financial business targets. The financial business targets are divided into the following sub-targets (the percentage figures indicating the weight of the respective target within the respective financial business targets):
CEO/CFO Presidents COO/CIO
Group EBIT 25% 20% 40%Group EBIT/MT 15% – 15%Group volume 20% – 25%EVA 20% – –Earnings per share 20% – –
Regional EBIT – 35%*20%** –
Regional EBIT/MT – 15%** –Regional volume – 25% –Working capital – 20% 20%* President Global Cocoa ** Presidents Western Europe/Americas

165
Corporate GovernanceBarry Callebaut
Annual Report 2013/14
Long-Term Incentive Plan (LTIP)Pursuant to Barry Callebaut’s Executive Total Reward Policy, the long-term incenti-vation shall have a weight in the total remuneration of the members of the Executive Committee of 30–50%, and in the case of the CEO of 40–60%. In the fiscal year under review, the Board of Directors with the assistance of the NCC and external advice from consultants of Mercer and EY has developed a new LTIP to be imple-mented in the fiscal year 2014/15.
Deferred Share Plan 2011–14: The granting of shares to management for the past three fiscal years has been regulated by a Deferred Share Plan 2011–14. For this period (the “Grant Cycle”), an annual share value has been determined by the Board of Directors for each individual plan participant. The number of share awards to be granted to each participant with respect to each fiscal year was calculated by dividing the annual share grant value by the average closing price of Barry Callebaut shares during the last three months of the previous fiscal year. The granted share awards vested according to the following schedule: 30% after one year, 30% after two years and 40% after three years. Actual shares were transferred upon vesting of the share awards. The vesting was subject to service criteria but not subject to any performance criteria. However, in addition, each participant was entitled to receive an upside bonus calculated on each share award granted during the Grant Cycle, i.e. over the past three years. This upside bonus was payable if the average share price over the past three months at the end of the Grant Cycle exceeded a certain hurdle share price defined by the Board of Directors at the onset of the Grant Cycle (which is defined as the share price at the onset multiplied with a 3-year, “CAGR”, of 7%). The rationale for the upside bonus was to compensate the Management for a change from the system of share award grants based on fixed amount of shares to a system of share award grants based on grant values. As the share price development of Barry Callebaut over the past three years exceeded the hurdle share price defined by the Board of Directors, the participants of the Deferred Share Plan 2011–14 received an upside bonus, amounting to CHF 10,971,901 of which CHF 6,708,526 were paid out to the Executive Committee. The respective amounts are included under “Compensation variable” in the remuneration of the Executive Committee in note 6 to the Financial Statements of Barry Callebaut AG on pages 140–141, reproduced on the following page. Thus, on average, the members of the Executive Committee each received retroactively an additional variable compensation of CHF 319,453 per year for the past three years in view of the share price over-per-formance of Barry Callebaut. During the same period, a total shareholder return of CHF 1,362 million was created.

166
Corporate GovernanceBarry CallebautAnnual Report 2013/14
Executive Committee
Compen- sation fix
Compen- sation
variable2
Other compen-
sation3
Total cash- related
remuneration
Number
of shares4
Value
of shares5
Total remuneration
2013/14
Total remuneration
2012/13
in thousands of CHF
Remuneration Executive Committee11 3,923.4 10,686.0 2,275.4 16,884.8 8,876 7,842.1 24,726.9 17,359.1
Highest individual remuneration within Executive Committee:Juergen SteinemannCEO Barry Callebaut Group 1,130.0 2,083.9 1,305.1 4,519.0 3,892 3,431.0 7,950.0 6,632.2
2 Includes upside bonus pursuant to the deferred share plan 2011–14, which led to an extraordinary payout of CHF 6.7 million to the Executive Committee as a result of the overperformance of the share price versus target share price over the past three fiscal years.
3 Including social security and pension contributions as well as other benefits.
4 Number of shares granted in relation to the fiscal year under review; vesting subject to meeting service and/or performance conditions. Grants to BoD are based on the calendar year.
5 Value defined as closing share price at grant date, which might be historical rates before the fiscal year under review.
11 Disclosure relates to the Executive Committee as in place on August 31, 2014, i.e. Juergen Steinemann, Victor Balli, Massimo Garavaglia, David S. Johnson, Steven Retzlaff, Dirk Poelman and Peter Boone.
Long-term Incentive Plan 2014: As from the current fiscal year, the long-term incen-tivation of the top management is based on the new Long-term Incentive Plan 2014 (“LTIP”) which the Board of Directors approved in September 2014. The LTIP is an open-ended deferred share plan. The granting of the shares is unchanged to the previous plan, i.e. the granting is based on a grant value determined by the Board of Directors annually for each plan participant in a discretionary manner within the framework of the Board’s Executive Total Reward Policy. The grant value for each LTIP participant is divided by the average share price during the last three months of the preceding fiscal year, which determines the total number of share awards granted to each LTIP participant in view of the services of the LTIP participant of the respective year. These defined share awards vest in three tranches over three years, i.e. 30% after one year, 30% after two years and 40% after three years from the granting date. The first two 30%-tranches are only subject to the LTIP participant continuing to be employed by Barry Callebaut. The final 40% tranche is also subject to meeting a performance criterion, which is defined as the relative performance (three-year CAGR) of the Barry Callebaut share versus the share performance of a peer group. The relevant share prices are calculated as average closing price over the three months preceding the fiscal year end. The peer group consists of three sub-groups of chocolate, fast moving consumer goods and ingredi-ents companies. The reference share price is calculated as the equally weighted

167
Corporate GovernanceBarry Callebaut
Annual Report 2013/14
performance of the sub-groups’ average share performance. The amount of share awards to vest from the final tranche may be higher or lower than the originally granted number of share awards, depending on the relative over- or under-perfor-mance of the Barry Callebaut share versus the benchmark share price of the peer group. There is a cap on the maximum number of shares (at 5% per annum relative share price over-performance) and a floor (at –5% per annum under-performance) for the number of share awards to vest. Share price over-performance is incentiv-ized by an accelerator of 2.25. Therefore, considering the maximum variance of the vesting from the performance-related final tranche, each LTIP participant may eventually receive, subject to continued employment, a number of shares which corresponds to a minimum of 75% and a maximum of 150% of the originally granted total number of share awards for the respective year. Shares are only transferred upon the vesting of the respective share awards. Once the shares are transferred, they are free of any sales restrictions.
Other benefitsOther benefits awarded to the top management of Barry Callebaut depend on the level of benefits pursuant to market practice, mandatory benefits of the jurisdiction applicable to the respective employment relationship and the composition of the respective overall package.
Consideration paid for services of the majority shareholderIn line with the practice of the past years, Barry Callebaut AG and Jacobs Holding AG, Zurich, have entered into an auxiliary services agreement, under which Jacobs Holding AG offers to Barry Callebaut AG certain management and consultancy ser-vices. In the fiscal year 2013/14, the total compensation paid by Barry Callebaut AG under this agreement amounted to CHF 1.5 million (excl. VAT). The contract is renewable annually.

168
GlossaryBarry CallebautAnnual Report 2013/14
A ACTICOA™A process developed by Barry
Callebaut which conserves to a very high degree the polyphenols naturally present in the cocoa bean, that may otherwise be destroyed during the chocolate production process.
B ButterRefers to cocoa butter, the fat of
the cocoa bean.
British Retail Consortium (BRC) BRC is one of the five food safety standards recognized by the Global Food Safety Initiative, a platform that groups global retailers and a large number of food manufacturers.
C Cocoa butter ratioPrice of 1 tonne of cocoa butter
relative to the price of 1 tonne of cocoa beans.
Cocoa HorizonsIn 2012, Barry Callebaut launched its CHF 40 million cocoa sustainability initiative to boost farm productivity, increase quality and improve family livelyhoods in key cocoa producing countries over the next ten years.
Cocoa powder ratioPrice of 1 tonne of cocoa powder rela-tive to the price of 1 tonne of cocoa beans.
Combined cocoa ratioCombined sales prices for cocoa butter and cocoa powder relative to the cocoa bean price.
CompoundConsists of a blend of sugar, vegetable oil, cocoa liquor, powder and other products. Vegetable oil is substituted for cocoa butter to reduce product cost and to develop special melting profiles.
ConcheA large tank with a powerful stirring device inside that kneads the choco-late mixture slowly over a long time. Contact with air, heat and friction results in several different physical and chemical processes, necessary for the final taste and mouthfeel of the chocolate.
Controlled FermentationBarry Callebaut developed a way to “control” and optimize cocoa fermen-tation. With the so-called Controlled Fermentation method, defined micro-organisms provide a consistent, pre-dictable and 100% “superior grade” cocoa bean quality. This in turn leads to improved flavor characteristics, zero default cocoa beans, enhanced levels of functional components (e.g. flava-nols), and improved processability.
CriolloCriollo is known as the prince among cocoa trees. This variety is fragile and produces small harvests. It grows primarily in South and Central Amer-ica, and accounts for only 10% of the world crop. The cocoa has a pale color and a unique aroma. It is used in the production of high-quality chocolate and for blending.
D Dark chocolateDark chocolate is chocolate that
contains more than 43% cocoa solids coming from cocoa liquor and butter. This is the chocolate most often used for premium chocolate confections. Besides cocoa ingredients, it contains sugar, vanilla, and often lecithin.
DryingAfter fermentation, the beans still contain 60% moisture, which must be reduced to 8% or less in order to ensure optimum conservation during storage and transportation. Drying can either be done by spreading the beans out in the sun or by placing them on a heated surface or by hot air. Thorough drying avoids the formation of molds.
DutchingA treatment used during the making of cocoa powder in which cocoa solids are treated with an alkaline solution to neutralize acidity. This process darkens the cocoa and develops a milder choc-olate flavor.
E EBITOperating profit (Earnings Before
Interest and Taxes).
EBITDAOperating profit before depreciation and amortization (Earnings Before Interest, Taxes, Depreciation and Amortization).
EVAEconomic Value Added or EVA, is an estimate of a firm’s economic profit – being the value created in excess of the required return of the company’s investors (being shareholders and debt holders). In other words: EVA is the profit earned by the firm less the cost of financing the firm’s capital.
F FermentationFermentation is a delicate stage in
cocoa bean processing. Beans and pulp are heaped in piles, covered with banana leaves or put in boxes and left to ferment for several days. During fermentation, the beans lose their natural bitterness and astringency.
FlavanolA specific type of polyphenol, known for its antioxidant activity.
ForasteroForastero are the most commonly grown and used cocoa beans. Com-pared to Criollo, Forastero is a stronger tree that is easier to cultivate and produces higher yields. They make up about 90% of the world’s production and are grown mainly in West Africa. The cocoa has a pungent aroma.

169
GlossaryBarry Callebaut
Annual Report 2013/14
G Global Reporting Initiative (GRI)The Global Reporting Initiative
(GRI) is a non-profit organization that promotes economic, environmen-tal and social sustainability. GRI’s Sustainability Reporting Framework enables all companies and organiza-tions to measure and report their sus-tainability performance. By reporting transparently and with accountability, organizations can increase the trust that stakeholders have in them, and in the global economy.www.globalreporting.org
I Industry ProtocolAlso known as Harkin-Engel Pro-
tocol. The Protocol was signed in 2001 by cocoa and chocolate manufactur-ers, industry and trade associations, government organizations and NGOs in response to reports of children working under abusive labor condi-tions on cocoa farms in West Africa. The signatories condemned abusive labor practices, in particular the worst forms of child labor as defined by the International Labor Organization (ILO), and committed to work together to address the issue. Barry Callebaut is a signer of the Protocol.
L LiquorAlso known as cocoa liquor or
cocoa mass. The thick liquid paste that is produced in the grinding process.
M Milk chocolateChocolate with at least 25%
cocoa solids coming from cocoa liquor and butter to which powdered milk, sugar, vanilla, and lecithin has been added. Good milk chocolate contains 30% chocolate liquor. Premium milk chocolate contains even more.
MoldingThe process of creating figures and shapes out of chocolate. Chocolate is melted to 45°C, then cooled below its crystallization point, then heated again to 30°C. Following this temper-ing process, the chocolate is poured onto the inner surface of the molds, also heated to 30°C. After cooling, the final product is unmolded to reveal a glossy chocolate figure.
N NibThe cocoa bean without shell.
P PolyphenolsCocoa beans contain polyphenols
of unusually high quality and effective-ness. Some display antioxidant prop-erties. By inhibiting oxidation, they protect body cells from damage caused by the oxidative effects of free radicals, which contribute to the aging process and to certain heart and brain diseases.
PowderRefers to cocoa powder and is the product that remains when a large part of the cacao butter is removed from the cocoa liquor.
R RoastingRoasting is a heating process
aimed at developing the chocolate aroma. Roasting certain foods not only makes them more digestible, but also more aromatic. Cocoa beans are roasted to a greater or lesser extent depending on what they are being used for. Cocoa powder needs more intense roasting, whereas chocolate re-quires finer roasting.
S Semi-finished productsExamples include cocoa liquor,
cocoa butter and cocoa powder. Also called cocoa products.
T TrinitarioTrinitario beans are a cross of
Criollo and Forastero cocoa. It has characteristics of both: The trees are easy to cultivate, and the cocoa beans have a strong, but relatively refined aroma.
V ViscosityThe measure of the flow charac-
teristics of a melted chocolate.
Vegetable fatsSometimes used as a less expensive alternative to cocoa butter in choco-late products.
W White chocolateWhite chocolate is made from
cocoa butter (at least 20%), powdered milk, sugar, and vanilla. It contains no cocoa liquor, which explains the ivory color of white chocolate.

InformationBarry CallebautAnnual Report 2013/14
Contacts
Barry Callebaut head officeBarry Callebaut AGWest-ParkPfingstweidstrasse 608005 Zurich, SwitzerlandPhone +41 43 204 04 04Fax +41 43 204 04 00www.barry-callebaut.com
Investor RelationsEvelyn NassarHead of Investor RelationsPhone +41 43 204 04 23Fax +41 43 204 04 19investorrelations@ barry- callebaut.com
MediaRaphael WermuthHead of Media RelationsPhone +41 43 204 04 58Fax +41 43 204 04 [email protected]
Address changesShareCommServices AGEuropastrasse 298152 Glattbrugg, SwitzerlandPhone +41 44 809 58 52Fax +41 44 809 58 59
Forward-looking statement
Certain statements in this Letter to Investors regarding the business of the Barry Callebaut Group are of a forward-looking nature and are therefore based on management’s current assump-tions about future developments. Such forward-looking statements are intended to be identified by words such as “believe”, “estimate”, “intend”, “may”, “will”, “expect”, “project” and similar expressions as they relate to the company. Forward-looking state-ments involve certain risks and uncertainties be-cause they relate to future events. Actual results may vary materially from those targeted, expected or projected due to several factors. The factors that may affect the Barry Callebaut Group’s future financial results are discussed in the Annual Report 2013/14. Such factors are, among others, general economic conditions, foreign exchange fluctuations, competitive product and pricing pressures, as well as changes in tax regimes and regulatory develop-ments. The reader is cautioned to not unduly rely on these forward-looking statements that are accu-rate today, November 6, 2014. The Barry Callebaut Group does not undertake to publish any update or revision of any forward-looking statements.
Financial calendar
December 10, 2014Annual General Meeting of Shareholders 2013/14, Zurich
January 21, 20153-month key sales figures 2014/15
April 1, 2015Half-year results 2014/15, Zurich
July 8, 2015 9-month key sales figures 2014/15
November 4, 2015Full-year results 2014/15, Zurich
December 9, 2015Annual General Meeting of Shareholders 2014/15, Zurich
Imprint
PublisherBarry Callebaut AG West-Park Pfingstweidstrasse 60 8005 Zurich Switzerland
Conception hilda design matters, Zurich, Switzerland
PhotographyMarcel GigerDavos, Switzerland
Jos SchmidZurich, Switzerland
Werner TschanBern, Switzerland
Prepress / Print
Linkgroup, Zurich, Switzerland
This Annual Report is published in German and English.
Printed by Linkgroup without impacting the climate.
This Annual Report is printed on FSC-certified paper.


Barry Callebaut AG (head office)West-Park Pfingstweidstrasse 60 8005 Zurich Switzerland
Phone +41 43 204 04 04 Fax +41 43 204 04 [email protected]