bankruptcy and low cost carrier expansion in the airline industry
TRANSCRIPT
Bankruptcy and Low Cost Carrier Expansion in the Airline Industry
Hwa Ryung Lee
Department of Economics, UC Berkeley
This version: September 28, 2009
Preliminary, Please Do Not Cite.
Abstract
Entering chapter 11 can allow an airline to shed costs. Do bankrupt airlines harm rivals by increasing
competitive pressure, as is often claimed? Do bankruptcies signal a depressed market uninviting to entry
and expansion? Analysis of fare and capacity on the 1,000 most popular domestic routes from 1998-
2008 uncovers no evidence of such e¤ects. Although bankrupt legacy airlines do reduce fares, they also
reduce capacity signi�cantly. Competitive pressure on low-cost carrier (LCC) rivals appears reduced in
that they do not match the fare cut and they expand capacity by 13-18% above trend growth. In short,
bankruptcies creates growth opportunities for LCC rivals. The LCC expansion during rivals�bankruptcy
is even greater when we consider the 200 most popular airports instead of the 1000 most popular routes.
During legacy airlines�bankruptcies, non-LCC rivals reduce capacity on the 1,000 most popular routes
while they show a sign of increase in capacity at the 200 most popular airports. A likely explanation
for this result is that non-LCCs avoid "bankrupt" routes as more competitive pressure is expected with
increasing presence of LCCs but they are picking up the resources, e.g. terminals, time slots, etc., given
up by the bankrupt airlines. On balance total capacity on the 1000 route sample shows only a modest
decrease during bankruptcy and eventually recovers. The pattern that bankrupt legacy airlines�capacity
is replaced by LCCs suggests that allocative e¢ ciency in production improves as the capacity mix changes
in favor of more e¢ cient �rms.
1

1 Introduction
This paper studies two separate but related topics by examining airline bankruptcies: one is the link
between �nancial distress and market competition and the other is sticky market shares and new entrants�
growth. In particular, we are interested in how bankrupt airlines behave, how their rivals respond, and
how the industry changes as a result in the periods surrounding bankruptcies. The changes in competition
and market structure over the course of bankruptcies inform how �nancial distress a¤ects the strategic
decisions of bankrupt airlines and their rivals and how the incumbent airlines�bankruptcies a¤ect the
growth decision of rivals.
We begin by studying whether bankrupt airlines operating under protection harm their rivals and the
industry. In the United States, �rms entering bankruptcy choose between two options, Chapter 11 or
Chapter 7. Unlike the liquidation bankruptcy of Chapter 7, Chapter 11 permits bankrupt �rms to keep
operating as a going-concern while reorganizing themselves under protection from creditors. Chapter 11
has been more of a rule than an exception in the airline industry. Critics have alleged that Chapter
11 allows ine¢ cient airlines to survive and, possibly harm even their healthier counterparts, by lowering
fares below what rivals charge and keeping capacity that otherwise would have been eliminated. That is,
(1) bankrupt airlines enjoy cost reductions by renegotiating contracts and lower costs to put competitive
pressure on their rivals and, (2) if those bankrupt airlines were to have been liquidated immediately, the
chronic overcapacity problem of the industry would have been resolved. The ideas behind these arguments
are more detailed in Section 2. We focus on the potential harms of bankrupt airlines to rivals, especially by
those of legacy carriers�bankruptcies to their LCC rivals, and examine whether those harms are realistic.
In particular, we investigate whether bankrupt airlines are cutting fares or expanding, putting competitive
pressures on rivals to match the lower fares or shrink operations and whether outright liquidation would
have solved the overcapacity problem, if any.
To evaluate the e¤ect of own bankruptcies and the e¤ect of the exposure of airlines to rivals�bank-
ruptcies, we use an event study approach with panel data of fare and capacity on the 1000 most travelled
routes for 42 quarters from 1998Q1 to 2008Q2. First, we examine how fares and capacities set by bank-
rupt airlines and their rivals change in pre-, during-, and post-bankruptcy periods, starting three quarters
prior to a bankruptcy �ling. In addition, we take it into account evidence that bankrupt airlines tend to
reduce capacity signi�cantly (to cut total expenses), by cutting services on routes and by withdrawing
from routes altogether. To account for the exit of bankrupt airlines from routes, we also examine how
fares and capacities change after bankrupt airlines exit a route.
Second, we examine whether total route capacity changes over the course of bankruptcies. Most of
airline bankruptcies were Chapter 11 �lings. Many of large legacy airlines�bankruptcies occurred after
2000 and all of those bankrupt airlines �led for Chapter 11. While the data does not directly show the
e¤ect of Chapter 7, especially for the bankruptcies of large airlines, we can expect what would have
happened under Chapter 7 by looking at what actually happened under Chapter 11 as bankrupt airlines,
even when not liquidated, cut their capacity signi�cantly. That is, how total route capacity changes when
2

bankrupt airlines reduce operations will inform us about how it would have changed if those bankrupt
airlines were to have been liquidated immediately.
The empirical model is based on the assumptions that (1) the percentage changes in fare and capacity
set by bankrupt airlines are homogenous on all routes where those airlines are serving, and (2) the
percentage changes in those set by bankrupt airlines�rivals are proportional to the degree of bankrupt
airlines�market presence on a route in normal times, which allow for the e¤ect to be di¤erent depending
on the degree of exposure to rivals�bankruptcies. Likewise, we assume that (3) the percentage changes in
total route capacity are proportional to the market presence of bankrupt airlines on the route in normal
times. We also divide the cases based on whether bankrupt airline is a legacy carrier or not and whether
bankrupt airline�s rival is a LCC or not.
We �nd that (1) bankrupt airlines cut capacity and the reduction continues even after reemergence
in the case of legacy airlines�bankruptcies; (2) LCCs replace the reduced capacity by bankrupt airlines,
especially when legacy carriers are bankrupt, and the replacement of bankrupt airlines�capacity by LCCs
is greater on the routes where a bankrupt airline used to have a larger market share; (3) non-LCC rivals
tend to shrink on the routes where legacy carriers are bankrupt but expand at the airports where legacy
carriers are bankrupt, indicating that they are picking up the resources the bankrupt airlines are giving
up but avoiding competition on "bankrupt" routes. A likely explanation for this behavior probably due to
is the expectation of rising competition with increasing LCC presence on those routes; (4) while bankrupt
airlines cut fares signi�cantly prior to the actual �ing and they keep lower fares throughout bankruptcy
procedures, rivals cut fares only in the quarter of bankruptcy �ling and quickly returns to normal fares; (5)
all airlines keep lower fares eventually in the post-bankruptcy periods after bankrupt airlines�reemergence
than in the absence of bankruptcies, indicating toughened competition after, not during, bankruptcies. A
likely explanation for this result is the increased presence of LCCs, and lastly; (6) the route total capacity
shows modest decrease in terms of the number of available seats while the number of scheduled �ights are
mostly una¤ected and even increasing in the post-bankruptcy periods, implying the replacement of large
airplanes with smaller ones. This means outright liquidation may provide a temporary resolution of the
overcapacity problem, but it will not be permanent as other airlines will expand to �ll the gap.
The �ndings are largely consistent with the previous studies although previous research does not focus
on the di¤erences between bankrupt airlines and their rivals. Borenstein and Rose (1995) �nd that fare
cuts by bankruptcy-�ling airlines start prior to the actual �ling but dissipate quickly during bankruptcy,
and their rivals do not change fare signi�cantly during the same period. Recently Ciliberto and Schenone
(2008) looked at the changes in fare and capacity during and after Chapter 11 bankruptcies. They �nd
that bankrupt airlines� rivals do not cut fares to match bankrupt airlines� fare. They also report that
bankrupt airlines reduce capacity but their rivals marginally reduce or even increase capacity. Another
paper by Borenstein and Rose (2003) �nd no signi�cant e¤ect of bankruptcy on total services at small
and large airports and, even at medium sized airports, the reduction is not large. Lastly, the surveys in
the U.S. General Accounting O¢ ce (2005) report that, when dominant airlines reduce capacity for some
reasons such as �ling for bankruptcy or dropping hub airports, the reduced capacity is quickly �lled by
other airlines.
3

The main lesson from the �rst question is that LCCs expand while bankrupt legacy airlines reduce
capacity. The pattern of LCCs�replacing bankrupt legacy airlines has two important implications. First,
the relative e¢ ciency of LCC rivals that replace bankrupt legacy airlines� capacity result in improved
allocative e¢ ciency in production as the capacity composition changes in favor of LCCs. Moreover,
LCC expansion during legacy rivals�bankruptcy raises another interesting question about new entrants�
growth; what is the factor that limits e¢ cient entrants�growth? Our �ndings suggest that the immediate
and substantial capacity reduction by bankrupt airlines presents new opportunities for e¢ cient airlines to
expand, which indicates the existence of entry barriers that have limited LCC growth, aside from product
heterogeneities. This approach is di¤erent from previous literatures on LCCs that usually focus on how
incumbents respond to LCC entry. This study rather asks how LCCs would respond when incumbents
contract under the extreme form of �nancial distress, and thereby highlights the resilience of incumbents
and the factors stimulating LCC expansion.
In the airline industry, LCC growth has been only modest and rather limited considering the substan-
tial cost advantages over incumbent legacy airlines and the long history since deregulation in 1978. LCCs
have grown mostly by creating and accommodating price-elastic demands that have not been served by
incumbent airlines. Does the limited growth mean LCCs are inferior to legacy carriers, with cheap fare
and comparable cheap services? The growth of LCCs during legacy rivals�contraction suggests that entry
barriers have hindered e¢ cient entrants from taking markets away from incumbents. The entry barriers
can be �xed resources, such as ground facilities and time slots, long-term contracts on the use of the
resources, or consumer inertia from switching costs established by various loyalty programs. These entry
barriers could make it di¢ cult for e¢ cient new entrants to challenge incumbents with a substantial market
share. Patterns of past growth of LCCs can be useful in assessing the factors that spur or limit it. This
leads us to the �nal question: how large is the fraction of LCC growth spurred by rivals�bankruptcies
and capacity reduction associated with them? The magnitude of the estimates will be informative of how
high the entry barriers are.
We attempt to quantify the growth e¤ect from rivals�bankruptcy. Based on the event study results,
the fraction of LCC capacity growth occurred during bankrupt rivals� bankruptcies is estimated. For
the entire sample of bankruptcies, we estimate the fraction of LCC growth from rivals�bankruptcies as
13-18% of the LCC growth in 1998Q1 through 2008Q2 (the data period). In particular, legacy airlines�
bankruptcies explain about 11-17% of the growth and other (non-legacy) airlines�bankruptcies explain
about 1% of the growth. Our most conservative estimate, i.e. lower bound estimate for bankruptcy e¤ect
of legacy rivals is over 10% of the growth. This means that the rivals�bankruptcy e¤ect accounts for a
signi�cant portion of the growth, indicating entry barriers are not negligible.
The remainder of this paper proceeds in the following steps. Section 2 speci�es the background and
motivation for the paper. Section 3 describes data sources and sample. Section 4 outlines a conceptual
framework, identi�cation strategy, and potential biases. Section 5 presents econometric speci�cations and
Section 6 discusses estimation results. Section 7 calculates the fraction of the LCC growth spurred from
rivals�bankruptcies. Finally, Section 8 concludes.
4

2 Background
This section introduces the background and motivation for the paper. There have been almost two
hundred bankruptcy �lings in the airlines industry. Most of the bankruptcies have been Chapter 11
�lings by small, new entrants which ended up with liquidation. It is only after 2000 that large legacy
carriers �led for bankruptcy.1 Unlike the bankruptcies by small airlines, those of large network carriers
can have a much stronger and wide-reaching e¤ect on the industry. This paper investigates what airline
bankruptcy means to competitors of the bankrupt airline, that is, how bankruptcy a¤ects rivals�strategic
decisions on fare, capacity, and growth. We focus especially on legacy carriers�bankruptcies and LCCs�
responses.
We begin with the question if bankrupt airlines hurt rivals, especially e¢ cient ones characterized by
low cost structure, and the industry e¢ ciency and pro�tability deteriorate as a result. The following
quote summarizes the worries over the potential harm of bankrupt airlines operating under Chapter 11.
What�s wrong with Chapter 11? It may keep ailing businesses going, but it distorts the
airline industry: Chapter 11 businesses end up with unfair competitive advantages over com-
petitors, thanks to their ability to renegotiate contracts, cut costs and dump debts. Worse, the
most basic problem in the industry is excess capacity �too many seats and too few customers,
something Chapter 11 doesn�t help: all too often it lets airlines restructure without cutting
back capacity. This means the core problem is never resolved.
Moneyweek, Dec 12, 2005 2
Basically, some people suggest that entering Chapter 11 will blow ine¢ cient �rms to shed costs and the
bankrupt airlines will put competitive pressure on rivals. In particular, (1) bankrupt airlines may trigger
a fare war that squeezes other airlines�pro�t margins and �nancial health and (2) overcapacity problem
would have been resolved if the bankrupt airlines were to have been liquated right away. We will focus
on those two aspects of airline bankruptcies. We do not take overcapacity problem as given. Regardless
of whether overcapacity problem exists or not, we can see whether and how total route capacity level is
a¤ected by bankruptcies. As presented in the later sections, empirical results are not consistent with the
accusation of potential harm to rivals and the industry. In fact, the reduced presence of bankrupt airlines
seems to open the windows of opportunity to rivals, providing immediate growth opportunities, which
leads to our next question: who replaces bankrupt airlines and how large the fraction of the growth of
replacing airlines can be attributed to rivals�bankruptcies? We will come back to this question later in
this section.
In order to predict bankrupt airlines�behavior and their rivals�responses, we need to understand the
incentives they have. Let us think about the fare side �rst. Why would bankrupt airlines want to trigger
a fare war? First, �nancially distressed �rms� incentive to cut price has been theorized and examined
empirically. Financially distressed �rms may discount future pro�ts more heavily as liquidation is more
1United States General Accounting O¢ ce (2005) GAO-05-945: pp. 12-13.2"US airlines hit turbulence - again", By Simon Wilson, Moneyweek, Dec 12, 2005(http://www.moneyweek.com/investment-advice/us-airlines-hit-turbulence� again.aspx)
5
likely. Theories of tacit collusion predict that lower discount factor can lead to a larger incentive to defect
and initiate a price war. In addition, when a �rm�s survival is at risk, the �rm may engage in a price
war in order to secure survival at the expense of pro�t maximization. Hendel (1996) built a model in
which �nancially distressed �rms use aggressive pricing as a source of internal �nancing to raise liquidity.
The tendency to trigger a fare war under �nancial distress in the airline industry is reported by Busse
(2002). Cost advantages achieved in bankruptcy protection may enhance the incentive to cut fare even
more. Bankrupt airlines may be able to achieve signi�cant reduction in labor, pension, and other costs by
rewriting contracts. The cost reduction may enable them to cut fare below market rates and even below
their "normal" cost level in production, which is similar to predatory pricing. In this case, as prices are
strategic complements, the fare cut initiated by bankrupt airlines may put competitive pressure on rivals
to follow suit. Then, even low-cost competitors may �nd it hard to match the fare cut without hurting
their own �nancial health. Thus, downward pricing pressures may take a large toll on bankrupt airlines�
rivals
However, would bankrupt airlines be able to put competitive pressure on rivals? Bankruptcy usually
weaken the airlines�competitiveness. Whether bankrupt airlines�fare cut will lead to tougher competition
is uncertain. Consumers may discount bankrupt airlines for safety issues, inconvenience, a less valuable
frequent �yer program, or other negative perceptions about bankruptcy. Therefore, the fare discount by
bankrupt airlines may not be so e¤ective that pushes others to match the fare cut. On the other hand,
healthy rivals may even initiate aggressive pricing so as to eliminate the weakened bankrupt airlines that
cannot a¤ord to cut fare against them. Therefore, we need to see whether and when bankrupt airlines
and rivals engage in signi�cant fare cut and whether fares go up after bankrupt airlines exit the market.
Besides, it is not obvious that bankrupt airlines will take advantage of cost reductions achieved under
bankruptcy protection to engage in aggressive pricing. Bankrupt airlines usually manage to cut expenses
in the process but the cost of debt will rise when raising funds. That is, bankruptcy may also have an
opposite e¤ect on cost as bankrupt airlines will have to face higher cost of debt when raising money because
investors require higher return on investment to compensate heightened risk. So, whether bankrupt airlines
will cut fare will depend in part on how managers de�ne their cost level when setting fares.
Now, let us move to the other side of competition, capacity setting. Some argue that bankrupt airlines
should have been liquidated to resolve the industry�s chronic overcapacity problem of too may seats for
two few passengers. Outright liquidation will solve overcapacity on the condition that remaining airlines
do not �ll the slack after bankrupt airlines are gone. The condition will hold only if the products of
bankrupt airlines are irreplaceable or other airlines do not have an incentive to expand. It is unlikely that
bankrupt airlines�services are unique and cannot be substituted by other airlines.
Furthermore, the nature of competition in the airline industry may induce the tendency for overcapacity-
building. Morrison and Winston (1995) pointed out cyclical demand and forecast error as a main source
for overcapacity. For example, airlines must order airplanes much ahead of the time when the airplanes
are used, and they are more likely to order more of them when business is better than normal. Airlines
6

also have economic reasons for tendency for overcapacity. The combination of huge �xed cost and in-
signi�cant marginal cost leads airlines to supply seats as long as the fare covers variable costs, even up to
the unpro�table, excessive level. The mobility of capacities between routes may worsen the problem as
airlines may be able to respond to high demand shock by transferring the capacities to popular routes,
leading to crowded market even for the high demand. Since network size and �ight frequencies are qual-
ities that may a¤ect consumers�willingness to pay, economies of scale and scope give airlines additional
reason to expand. Moreover, capacity can be used as a strategic device to deter entry. These incentives
for overcapacity are not restricted to bankrupt airlines. Also, the airplanes, terminals, and slots remain
even after the owner airline disappears. Therefore, the problem will not be solved even after some airlines
disappear because others will enter or expand to �ll the slack.
Our empirical results show that bankrupt airlines, even when not liquidated, start to cut back on
capacity as they are near bankruptcy, either by withdrawing services from routes altogether or by reducing
seat supply (with smaller airplanes or less frequent �ight schedules). LCCs expand capacity while their
rivals, especially legacy airlines are in bankruptcy. As a result, the route total capacity does not seem to
change in the long term.
The �ndings on capacity have two implications, one on the allocative cost e¢ ciency and the other on
LCC growth. First, if total capacity level remains una¤ected but rivals replace bankrupt airlines�capacity,
then the composition of capacity will change. In this case, who would replace the capacity is an important
question. If replacing airlines are relatively more e¢ cient than bankrupt airlines, then allocative e¢ ciency
of production will improve as market shares change in favor of more e¢ cient �rms. The replacement
pattern would depend on substitutability with bankrupt airlines�products and the rivals�ability to add
capacity at low costs. Under the competition with di¤erentiated products, the closest competitors will
bene�t most from bankrupt airlines�contract. If competition is more about price, then the most e¢ cient
competitors with low cost structure are more likely to bene�t. Our empirical results show that LCC
expansion is prominent while their rivals, especially legacy rivals, contract in bankruptcy, suggesting that
allocative e¢ ciency in production of the industry improves.
Second, LCCs can be substitutes for bankrupt airlines and moreover they are willing to and can a¤ord
to expand, which raises our next question: what has been holding LCCs back from expanding more
quickly? In other words, what would be the factor that spurs e¢ cient airlines�growth? Figure 1 shows
the unit cost (excluding fuel cost3) di¤erential between carrier groups. LCC�s unit cost level is about
50-70% of that of legacy airlines. If fuel cost is included, the cost di¤erential will be even bigger.
Even with the signi�cant cost advantages over legacy airlines, LCCs have recorded a slower and
rather limited growth than expected given the long history of airline industry deregulation since 1978. In
general, market shares are sticky and market dominance is quite persistent. The airline industry was not
an exception. Until recently, LCC expansion has been focused on niche markets and demands that have
3CASM excluding fuel costs between carrier groups have been compared as fuel cost may be a¤ected more by externalshock than by endogenous managerial or operational e¢ ciency, which also shows a signi�ant cost di¤erence between carriergroups.
7

not been served by incumbent airlines and unpopular, secondary airports. That is, LCC growth has been
mostly done in a limited range.
Figure 1: CASM (cost per available seat mile) Excluding Fuel Costs (Source: Author�s calculation based on
the Airline Data Project established by the MIT Global Airline Industry Program)
In the airline industry, we can think of three reasons why LCCs have not expanded that quickly, in
other words, why LCC expansion has been limited. The reasons can be product di¤erentiation, slower
growth in demand for newer products, or entry barriers. If travellers regard legacy carriers�services as
superior to LCCs�(due to, for example, preference for extensive network, more frequent �ights, or other
extra services), then LCCs would not have been able to take large markets away from legacy carriers.
Switching costs from the Frequent Flyer Program (FFP) can act as an arti�cial entry barrier as in Farrell
and Klemperer (2004). Goolsbee and Syverson (2004) �nd the evidence consistent with incumbents�
incentive to cut fare and build consumer loyalty when Southwest entry gets more likely. Moreover, the
resources essential for airline operations such as airport terminals, gates, and time slots are �xed at least
in short term. Long-term contracts on the use of the resources can be a factor that limits LCC growth
as in Aghion and Bolton (1987). Therefore, it is hard to get the access to the facility if incumbents are
not giving up their shares locked in long-term contracts.
The �ndings that LCCs replace bankrupt legacy airlines�capacity suggest that the obstacle for the
growth is more likely to be the existence of entry barrier. Lower cost alone does not guarantee for entrants
to take markets from less e¢ cient incumbents. Discrete capacity cutback by incumbents motivated by
bankruptcy or near-bankruptcy �nancial distress may present immediate growth opportunities for those
e¢ cient airlines. For one, when a legacy carrier is bankrupt and reducing operations, the usual customers
to the carrier will have to choose other airline. For those customers, other legacy carriers and LCCs may
be thought of as providing homogenous products and LCCs are now facing competition without switching
cost. In this case, LCCs will be able to capture many those customers with low price. Also, new physical
resources may become available for LCCs as bankrupt airlines are giving up those resources. The fraction
of LCC growth spurred by rivals�bankruptcies will be quanti�ed in Section 7. The magnitude of the
fraction will inform us about how high the entry barrier would have been.
8
3 Data
There are two main data sets used in the analysis: the Airline Origin and Destination Survey Data Bank
1B (DB1B) and the Air Carrier Statistics database (T-100 data bank). Both are available from the
Bureau of Transportation Statistics of the U.S. Department of Transportation.4 First, the Airline Origin
and Destination Survey DB1B is a 10% sample of airline tickets from reporting carriers collected by the
O¢ ce of Airline Information of the Bureau of Transportation Statistics. The quarterly data set includes
origin, destination and other itinerary details such as ticket price, number of passengers transported,
ticketing (i.e. marketing) carrier, operating carrier, distance of the itinerary, number of stops (number of
coupons used in a itinerary), whether the ticket is a round trip, etc.5
Second, we restrict our attention to U.S. domestic passenger airlines6 and domestic markets and so
we use T-100 Domestic Market (U.S. Carriers) and T-100 Domestic Segment (U.S. Carriers) data from
the Air Carrier Statistics database. The "market" data includes a monthly air carrier passenger tra¢ c
information by enplanement for operating carrier, origin, destination combination each time period. The
"market" data records the passengers that enplane and deplane between two speci�c points, regardless
of the number of stops between the two points. This market de�nition is comparable to the origin
and destination pair in DB1B. On the other hand, the "segment" data contains the number of seats
available, the number of scheduled departures and departures performed, by operating carrier, origin,
and destination. Unlike in the "market" data, the "segment" is composed of a pair of points served or
scheduled by a single stage.7
A route is de�ned as a pair of origin and destination (on an airport basis) and each route is regarded
as a market. A route is treated in a direction-manner in the sense that, if origin and destination airports
are switched, it is considered to be a di¤erent route. Direction matters because demand conditions can be
di¤erent even between the same two endpoints, depending on which way passengers are heading.8 Using
the T-1000 Domestic Market database, we pick the 1000 largest routes in each quarter from 1998Q1 to
2008Q2, based on passenger enplanements. The 1000 routes represent a signi�cant portion of airline
market demand. For instance, in 2007, the number of passengers who travelled the 1000 largest routes
is about 60% of the total demand. In addition, we pick the 200 most popular airports (in terms of the
number of passengers �ying out of the airport) in the same way. The 200 airports covers over 99% of the
total number of originating passengers.
We mainly rely on the "route sample" that includes the quarterly 1,000 most travelled routes for forty
two quarters from 1998Q1 through 2008Q2. The "airport sample" which covers the 200 most popular
4http://www.transtats.bts.gov/5The data is recorded when a ticket is used, not when it is purchased, so the timing of the change in an airline�s competitive
behavior and the market outcome may not be exact. However, if most people buy tickets within one or two monthes aheadof an actual �ight date, this may not be a big problem.
6Airlines used in the study are the scheduled passenger airlines. Thus charter, fright and taxi airlines etc. are excluded.7For example, if Southwest operates only connecting �ights from San Francisco airport (SFO) to Chicago Midway airport
(MDW), the �ights will be recorded in DB1B and the "market" data but not in the "segment" data.8For example, when Superbowl is held in Tampa, Florida, demands for tickets going to and coming from Tampa would
be di¤erent.
9
airports will be also used to con�rm and supplement the �ndings from the main sample. The route
sample will inform us about the change in market competition. The airport sample, on the other hand,
will better-represent the �xed physical facilities that should be allocated between airlines. The route
sample include fare, capacity, market share, and so on, while the airport sample includes only capacity
data. Capacity is mostly measured by the number of available seats but scheduled departures will also
be analyzed as another capacity measure.
As for the local economic conditions, we include employment, personal income, and population. Sup-
plemental data on local economic conditions comes from the Regional Economic Accounts at the Bureau
of Economic Analysis.9 However, the data set is rather limited. First, the data set covers only Metropol-
itan Statistical Areas (MSA) on a yearly basis so it does not include Puerto Rico, Virgin Islands, and
numerous cities in Hawaii or Alaska, which are in the main sample. In the main sample, the portion of
data on routes where both of the two endpoints of the route is MSA is about 96%. In addition, the most
recent observation available is for 2007. We report the estimation results both with and without local
economic condition variables.
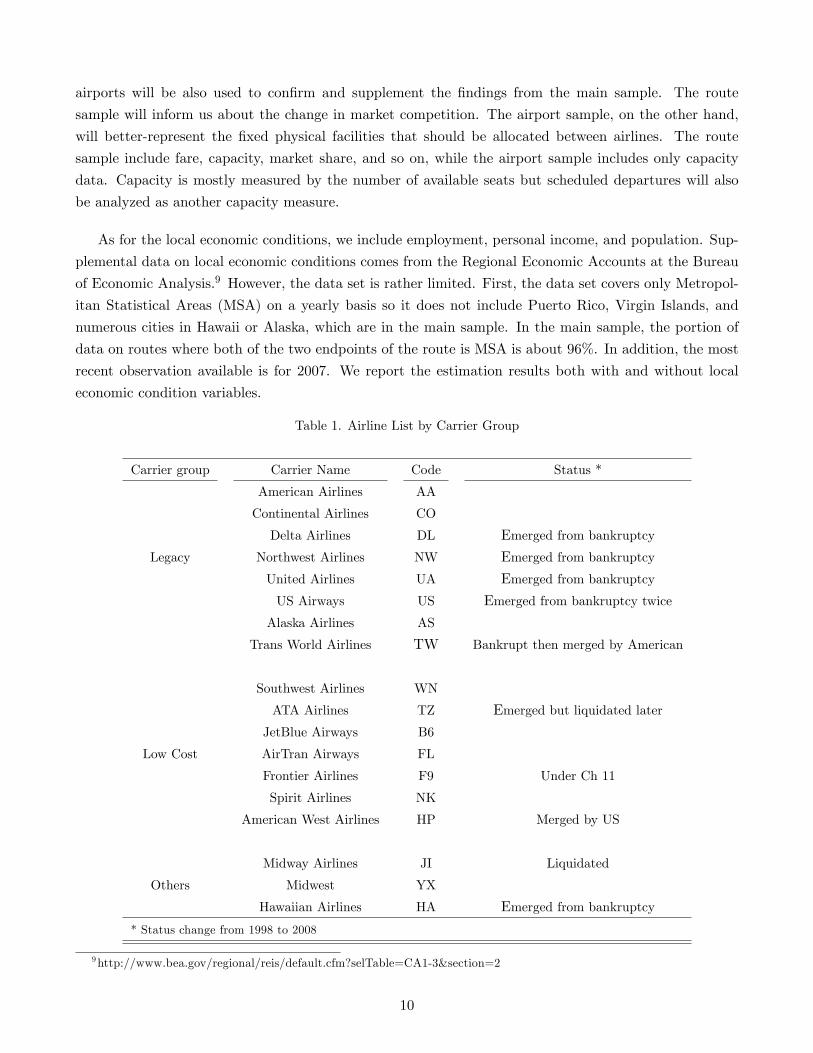
Table 1. Airline List by Carrier Group
Carrier group Carrier Name Code Status *
American Airlines AA
Continental Airlines CO
Delta Airlines DL Emerged from bankruptcy
Legacy Northwest Airlines NW Emerged from bankruptcy
United Airlines UA Emerged from bankruptcy
US Airways US Emerged from bankruptcy twice
Alaska Airlines AS
Trans World Airlines TW Bankrupt then merged by American
Southwest Airlines WN
ATA Airlines TZ Emerged but liquidated later
JetBlue Airways B6
Low Cost AirTran Airways FL
Frontier Airlines F9 Under Ch 11
Spirit Airlines NK
American West Airlines HP Merged by US
Midway Airlines JI Liquidated
Others Midwest YX
Hawaiian Airlines HA Emerged from bankruptcy
* Status change from 1998 to 2008
9http://www.bea.gov/regional/reis/default.cfm?selTable=CA1-3§ion=2
10

The observation unit in DB1B is itinerary level. We aggregate the data to carrier level using the
number of passengers as a weight. As a result, we have one observation for a (ticket) carrier10 on a route
(or in an airport) in a given time (pair of year and quarter) in the �nal data set. In the route (airport)
-level analysis, itinerary level observations are aggregated to route (airport) -level so that we have one
observation for a route in a given time. Again, observations are weighted by number of passengers. In
addition, we drop tickets if a carrier has less than 1% passengers on a route (or 1% capacity in an airport)
in a given time, fare is less than 20 dollars, or an itinerary has more than three connections. All market
fares used in analysis are in�ation adjusted in 2000 dollars.11 Table 1 is the list of main airlines in the
�nal data set by carrier group. These eighteen carriers account for about 98% of the sample.12
Table 2. Airline Bankruptcy Filings
Date of Date of Date of
Carrier Name Filing Ch. Emergence Service Cessation
Kiwi International (KP) Mar 23, 1999 11 Dec 8, 1999
Eastwind Airlines (W9) Sep 30, 1999 7
Tower Air (FF) Feb 29, 2000 11 Dec 7, 2000
Pro Air (P9) Sep 19, 2000 11 Sep 19, 2000
National Airlines (N7) Dec 6, 2000 11 Nov 6, 2002
Midway Airlines (JI) Aug 14, 2001 11 Oct 30, 2003
Trans World Airlines (TW)* Jan 10, 2001 11 Dec 1, 2001
Sun Country Airlines (SY)** Jan 8, 2002 7 April 15, 2002
Vanguard Airlines (NJ) July 30, 2002 11 Dec 19, 2004
United Airlines (UA) Dec 9, 2002 11 Feb 2, 2006
US Airways (US) 1st Aug 11, 2002 11 Mar 31, 2003
Hawaiian Airlines (HA) Mar 21, 2003 11 June 2, 2005
ATA Airlines (TZ) 1st Oct 26, 2004 11 Feb 28, 2006
US Airways (US) 2nd Sep 12, 2004 11 Sep 27, 2005
Aloha Airlines (AQ) 1st Dec 30, 2004 11 Feb 17, 2006
Delta Airlines (DL) Sep 14, 2005 11 April 25, 2007
Northwest Airlines (NW) Sep 14, 2005 11 May 18, 2007
Independence Air (DH) Nov 7, 2005 11 Jan 5, 2006
Aloha Airlines (AQ) 2nd Mar 31, 2008 7
ATA Airlines (TZ) 2nd April 3, 2008 11 April 3, 2008
Frontier Airlines (F9) April 10, 2008 11
* Trans World is merged by American,
** Sun Country�s bankruptcy procedure was converted from Ch.7 to Ch.11
10A ticket carrier and an operating carrier can be di¤erent for the same itinerary. We choose a ticket carrier over anoperating carrier because a ticket carrier sets a price even though other carrier may actually operate the service.11Consumer Price Index - All Urban Consumers is available from http://data.bls.gov/cgi-bin/surveymos.12For the LCC list, refer to Darin Lee�s webpage (http://www.darinlee.net/data/lccshare.html).
11

To identify bankruptcy events, we rely on Lynn M. LoPucki�s Bankruptcy Research Database (BRD)13 and "U.S. Airline Bankruptcies & Service Cessations" listed on Air Transportation Association (ATA)
website.14 The BRD contains Chapter 11 �lings of public companies with assets over $100 million that
are required to �le a form 10-K with SEC. The list of bankruptcy �lings on ATA web page includes
both Chapters 7 and 11, regardless of the size of a bankrupt airline. However, it says the list is "loose,
uno¢ cial". When the dates of bankruptcy �ling, reemergence, or service cessation do not match between
the two sources, we searched for news articles on a speci�c bankruptcy event on the web and picked
the more accurate one. From these sources, we construct the history of airline bankruptcies that we are
interested in. Table 2 shows all bankruptcy events that we will cover in the analysis. There are twenty one
bankruptcy �lings in the sample. Among them, bankruptcy �ling airlines emerged in ten cases,15 went
out of business after bankruptcy protection in nine cases, and ceased services right away in two cases. It
is noteworthy that only one legacy airline out of six cases has been liquidated.16
XXX: ADD SUMMARY STATISTICS HERE XXX
4 Conceptual Framework
This section outlines a conceptual framework of the paper and raises identi�cation issues. We are inter-
ested in evaluating the e¤ect of bankruptcies on airlines. In particular, the change in fares and capacities
set by bankruptcy-�ling airlines in the periods surrounding bankruptcies and the e¤ect of the exposure of
rival airlines to the bankruptcies on their fares and capacities during the same period will be of the main
interest in this paper. The central questions are, �rst, how bankrupt airlines change fare and capacity,
second, how bankrupt airlines�rivals change fare and capacity in response, and lastly, how total route
capacity level changes (or does not change) as a result. The �rst two questions are intended to answer
whether bankrupt airlines harm rivals and the last question is to see whether the overcapacity problem,
if any, would have been resolved with outright liquidation instead of bankruptcy protection.
We depend on the average treatment e¤ect on the treated to describe a conceptual framework of
empirical analysis. We begin by de�ning the potential outcomes with and without bankruptcy. In fare
and capacity analysis for bankrupt airlines and their rivals, an individual is de�ned as a carrier-route-time
combination labelled with irt and the outcome of interest is fare or capacity set by a carrier i on a route
r at time t (Yirt). Airlines can be involved in bankruptcy in two ways: either they �le for bankruptcy
themselves or they are competing against bankrupt airlines. There are two potential outcomes depending
on whether an airline is bankrupt or not (bankrupt-carrier indicator: Dit = 1 if a carrier i is bankrupt
at time t and 0 otherwise). Also, there are two potential outcomes depending on whether an airline is a
rival to bankrupt airlines or not (bankruptcy indicator: Wrt = 1 if bankrupt airlines are serving route r
at time t and 0 otherwise). Bshrrt is the market presence of bankrupt airlines on a route r at time t,
13http://www.webbrd.com/bankruptcy_research.asp14http://www.airlines.org/economics/specialtopics/USAirlineBankruptcies.htm15Frontier Airlines �led for bankruptcy in the second quarter of 2008 and are still under bankruptcy protection. The case
is regarded as an emergence case in the analysis. However, treating this case as liquidation does not change the results.16Trans World Airlines �led for bankruptcy protection for three times and ended up being liquidated at the �nal attempt.
12

that is, how dominant the bankrupt airlines are on the route at that time. For rivals, we include Bshrrtto allow for the e¤ect to vary depending on the degree of exposure to bankruptcies. For instance, when
an airline used to be dominant on a route, its bankruptcy may have larger e¤ects on rivals competing on
the route. Basically, we want to estimate the relative di¤erence between the actual and counterfactual
fare or capacity. To be more speci�c, we are interested in identifying the relative change in Yirt upon
bankruptcy:
�Bankrupt � E
�log
Yirt(Dit = 1)
Yirt(Dit = 0)j Dit = 1
�= E[log Yirt(Dit = 1)� log Yirt(Dit = 0) j Dit = 1]
for bankrupt airlines and
�Rival(b) � E
�log
Yirt(Wrt = 1)
Yirt(Wrt = 0)j Wrt = 1; Bshrrt = b
�= E[log Yirt(Wrt = 1)� log Yirt(Wrt = 0) j Wrt = 1; Bshrrt = b]
for the rivals competing against the bankrupt airlines.
As the log di¤erence is approximately the same as the percentage change, �Bankrupt is interpreted as
the percentage change in Y from own bankruptcy and �Rival is regarded as the percentage change in Y
from rivals�bankruptcies. The rationale for choosing relative change over absolute change is that fare or
capacity levels will be di¤erent on di¤erent routes and the airlines are expected to change the fare and
capacity proportionally to the usual level on a route rather than by the same amount on every route.17
Ideally, we want to know measure fare and capacity with and without bankruptcies for an identical
unit, that is, the same airline on the same route at the same time period. In that case, we can simply
compare the averages of two outcomes (fare or capacity) with and without bankruptcy. For example,
a simple di¤erence between the fare/capacity averages with and without bankruptcy will represent the
bankruptcy e¤ect. Unfortunately, we can observe only what has been realized and we do not have data
on potential outcomes unrealized. That is, we either observe fare/capacity of an airline i on a route r at
time t with bankruptcy or that without bankruptcy. This is where unconfoundedness assumption plays a
part. Unconfoundedness can be expressed as
Dit jj Yirt(Dit = 1); Yirt(Dit = 0) jXirtWrt jj Yirt(Wirt = 1); Yirt(Wirt = 0) jXirt
where Xirt is a set of covariates that can a¤ect the outcomes, fare or capacity. The condition means
that own bankruptcy (Dit = 1) and rivals� bankruptcies (Wirt = 1) are randomly assigned given the
17Though not reported here, the same analysis has been done to esitmate absoulte change instead of relative change andthe results are not di¤erent qualitatively.
13

observables, Xirt. In other words, given Xirt, the bankrupt-carrier indicator and the bankruptcy indicator
are exogenous and there are no confounding factors that are associated with both Y (fare and capacity)
and the bankrupt-carrier and bankruptcy indicators, Dit and Wrt. This enables us to identify �Bankruptand �Rival. The validity of the unconfoundedness assumption will depend on how e¤ectively we can
control for potential endogeneity. To assure confoundedness, we exploit the panel structure of the data
set by employing a �xed-e¤ect model. In this way, time-invariant individual e¤ects will be accounted for.
If endogeneity and selection bias are restricted to time-invariant components, conditioning on individual
�xed e¤ects will be su¢ cient for the condition to hold. Otherwise, we will need to control for other
time-variant factors responsible for endogeneity and selection bias, which will be discussed later in this
section.
Under the unconfoundedness assumption, we can rewrite the bankruptcy e¤ects as follows:
�Bankrupt = E [E[log YirtjDit = 1; Xirt]� E[log YirtjDit = 0; Xirt]]
�Rival(b) = E [E[log YirtjWrt = 1; Bshrrt = b;Xirt]� E[log YirtjWrt = 0; Xirt]]
where the outer expectation is taken with respect to the distribution of Xirt.
To model fare and capacity for parametric estimation, we assume that (1) the percentage change in
fares and capacities set by bankrupt airlines are homogenous on all routes where those airlines are serving,
(2) the percentage change in fares and capacities set by bankrupt airlines�rivals are proportional to the
degree of bankrupt airlines�market presence/dominance on a route, (3) the e¤ect of covariates in Xirt is
the same regardless of bankruptcy, and (4) the log-transformed outcome log Yirt can be expressed as a
linear function. Then, we have
log Yirt = �0 + �1Dit + �2WirtBshrrt +Xirt� + "irt
where f�0, �1, �2, �g is a set of parameters to be estimated and "irt is a random error with mean
zero conditional on RHS variables. Then, the estimands of interest are simpli�ed to:
�Bankrupt = �1
�Rival(b) = �2b
which can be estimated consistently by regressing log Yirt on 1, Dit, and WirtBshrrt.
Likewise, we want to identify
�Route(b) � E
�log
�Yrt(Wrt = 1)
Yrt(Wrt = 0)
�j Wrt = 1; Bshrrt = b
�= E[log(Yrt(Wrt = 1))� log(Yrt(Wrt = 0)) j Wrt = 1; Bshrrt = b]
14

for total route capacity where Yrt is the total route capacity on route r at time t and Wrt and Bshrrtare the same as de�ned as before. We will call the routes where bankruptcy �ling airlines are serving
as "bankrupt" routes. We are interested in how total route capacity changes (or does not change) over
the course of bankruptcy. Similarly with carrier-level fare and capacity, we assume that the percentage
change in total route capacity on "bankrupt" routes is proportional to the degree of bankrupt airlines�
presence on the route and model the log-transformed value of total route capacity as a linear equation
accordingly:
log Yrt = 0 + 1WirtBshrrt + Zrt�0 + "rt
where Zrt is a set of route characteristics that may be associated with total route capacity and
bankruptcy of a carrier serving on route r (to assure the validity of uncounfoundedness assumption), f 0, 1, �0, �1g is a set of parameters to be estimated, and "rt is a random error with mean zero conditional
on RHS variables. Combined with the unconfoundedness assumption (Wrt jj Yrt(Wirt = 1); Yrt(Wirt =
0)) jZrt), the model enables us to identify the change in total route capacity with and without bankruptcy,i.e.
�Route(b) = 1b
by regressing log Yrt on 1, WirtBshrrt, and Zrt.
In addition, we look at the exit of bankrupt airlines from a route to see how the exit a¤ects rivals.
The empirical results and anecdotal evidence suggest that bankrupt airlines shrink operations either by
reducing capacity on a route or by withdrawing services from a route altogether. The exit event will give
us the opportunity to expect what would have happened if a bankrupt airline is liquidated instead of
entering Chapter 11 protection. The e¤ect of bankrupt airlines�exit from a route can be expressed in the
same way as the bankruptcy e¤ects are represented above. The exit events are not a random experiment
on liquidation e¤ect on rivals because a bankrupt airline made the decision to withdraw from the market
or creditors found the airline unpro�table to keep operating. However, it will inform us of what actually
happens when a bankrupt airline is gone, supplementing the evidence from the comparison between actual
and counterfactual behaviors of airlines a¤ected by bankruptcies.
So far, we did not divide bankrupt airlines and rivals depending on which carrier group they belong
to for a simple presentation of the identi�cation problem. In empirical analysis, we will separate the
bankruptcy �lings depending on whether a bankrupt airline is a legacy carrier or not. We will then
divide bankrupt airlines�rivals depending on whether the rival is a LCC or not. Moreover, we allow for
the bankruptcy e¤ects to vary over the course of bankruptcy by estimating the changes in each event
period separately (starting from pre-bankruptcy periods near bankruptcy to post-bankruptcy periods
after reemergence, if applicable, from bankruptcy). This division of bankruptcy cases and periods does
not change the implication of the identi�cation problems and models stated above. The speci�c variable
constructions are detailed in Section 5.1. and the empirical speci�cations are presented in Section 5.2.
Su¢ cient number of observations una¤ected by bankruptcy will allow us to estimate the counterfactual
15
patterns of fare and capacity set by airlines. The sources for estimating the counterfactuals are from two
data; the data from the periods una¤ected by bankruptcy (prior to bankruptcy) and the data from routes
where no airline is bankrupt. For bankrupt airlines, we compare fare and capacity set by the physically
identical carriers at di¤erent times (one before and the other after a¤ected by bankruptcy). For their
rivals, the comparison will be done for identical carriers both over time and cross-sectionally (between
the routes where some rivals are bankrupt and those where no airline is bankrupt). We have at least
�ve quarters ahead of bankruptcy �ling and, for most of bankruptcy cases, we have more than two years
ahead of bankruptcy �lings. Among the quarterly 1000 most popular routes used in the analysis, at least
some routes are not a¤ected by bankruptcy (which is true for the quarterly 200 popular airports used for
supplementary analysis).
We adopt the event study approach for empirical analysis. The basic idea is that we compare fare
or capacity for bankruptcy-a¤ected airlines and routes (bankrupt airlines, their rivals, and "bankrupt"
routes) to the normal counterparts una¤ected by bankruptcy. The normal counterparts refer to the
counterfactuals absent bankruptcy events. The key to the identi�cation is unbiased estimation of the
counterfactuals in absence of bankruptcies. As stated previously, we add individual �xed e¤ects, thinking
that time-invariant individual heterogeneities are responsible for potential endogeneity.
Now, we will discuss �ve issues that may lead to potential biases in estimating counterfactuals absent
bankruptcies and the best available options to lessen the potential biases one by one. First, as bankruptcy
�ling airlines will begin to experience �nancial distress at some point prior to actual bankruptcy �ling, this
may alter the airlines�behavior even prior to the actual bankruptcy �ling. Kennedy (2000) examined the
operating performance of bankruptcy �ling �rms and their rivals and found that the majority of declines
in performances of bankrupt �rms and their competitors occur in the periods close to the �ling or in the
early stage of bankruptcy. So, treating pre-bankruptcy periods as normal times may bias the estimates
of bankruptcy e¤ects downwards. In this case, separate estimation of pre-bankruptcy periods will solve
the problem. Thus, we track bankrupt airlines and their rivals starting three quarters prior to the actual
bankruptcy �ling.
E¤ects in post-bankruptcy periods will also be treated separately to see whether bankruptcy has a
temporary or permanent e¤ect on airlines and the industry. The signi�cance and size of estimates on
fare and capacity change in post-bankruptcy periods will show us whether the e¤ect, if any, is persistent.
Bankrupt airlines may go back to the original strategies before they su¤ered from �nancial distress. On
the other hand, bankrupt airlines may continue to keep their strategies in bankruptcy even after they
reemerge. There is also the possibility that the airlines become an even stronger threat to rivals once
they exit bankruptcy and with lower debt and cost level, engage in aggressive strategies to win some
market share lost in bankruptcy. If bankrupt airlines�behavior can change in post-bankruptcy periods,
not considering those possibilities will bias the estimates on bankruptcy e¤ects.
Second, it is noteworthy that bankruptcies often coincide with deteriorated demand conditions. The
trend in demand, if exists, matters as it may complicate the problem due to the fact that total route
capacity will decline with diminishing popularity of travelling the route and the decreasing demand
16

may push some airlines to �le for bankruptcy. The change in demand may result in a false causal
relationship between bankruptcy and total capacity level. Dealing with the endogeneity, however, depends
on our view of whether the endogeneity is local or not. Ciliberto and Schenone (2008) argued that since
airlines serving routes with diminishing demand may be more likely to �le for bankruptcy, the downward
demand trend can complicate the estimated fare/capacity change upon bankruptcy to be biased in negative
direction. As a measure to lessen the bias, they include origin and destination speci�c linear time trends
in their econometric models (on fare, number of available seats, or load factor). If there is the positive
relationship between bankruptcy and diminishing time trend of demand, removing linear time trend
will be appropriate. However, removing the origin and destination speci�c linear time trend could be
problematic for several reasons.
Rather, the demand or supply shocks pushing airlines to �le for bankruptcy may be economy-wide
than market-speci�c. That is, airlines, especially big ones, will not be forced to �le for bankruptcy just
because demand is decreasing on some routes that they serve. Also, bankrupt airlines do not choose to be
bankrupt on some unpro�table routes where demand is in downward trend. Thus, it can be misleading
to conclude that bankrupt routes are more likely to have been su¤ering from diminishing demand. In
addition, if the decline in demand is severe and expected to continue on some routes, then airlines will
adjust their route structure by moving out of declining routes and entering into �ourishing routes. That
is, airlines will not stay in declining routes to �le for bankruptcy.
Moreover, an important question when it comes to including time trends is whether there actually
are speci�c linear time trends on bankrupt routes in the �rst place. If we look at some routes where a
dominant carrier is bankrupt, it is hard to say that demand is declining on those routes as compared
to other routes. If there is no speci�c demand time trend before any of the airlines serving the route
�les for bankruptcy and we include a linear time trend variable to control for the non-existing "trend",
then the estimated "trend" will be picking up all the bankruptcy-related e¤ects and we will have biased
estimates. For example, if fare or capacity is cut even prior to bankruptcy �ling and the cut continues
over the bankruptcy proceedings, then the linear time trend variable will pick up this negative e¤ect
of bankruptcy on fare or capacity level and the estimated bankrupt e¤ect will be biased upward. The
bias from including "non-existing" linear time trends has been explored by Wolfers (2006) on the e¤ect
of unilateral divorce laws on divorce rates. In this study, instead of including market-speci�c linear
time trends, time-speci�c dummy variables will be used to take account of economic shocks common to
airlines and routes and the e¤ect from local economy conditions will be controlled by personal income or
employment conditions for origin and destination.
Third, a source of potential bias comes also from the possible pre-existing trend of growth of LCC
or decline of legacy carriers. Since the deregulation, LCCs have grown slowly but steadily. In this case,
the LCC expansion in the periods surrounding rivals�bankruptcy may be a mere rati�cation of the pre-
existing trend that would have continued even without bankruptcy. In fact, the increasing presence of
LCCs may have even pushed other airlines further into bankruptcy. In that case, legacy airlines would
have been experiencing reduction in operations, which might have triggered bankruptcy �lings. If the
17

pre-existing trends are not controlled for, it will lead to overestimation of bankruptcy e¤ects on capacity
setting.
We include carrier-speci�c linear time trends in addition to pre- and post-bankruptcy periods to
account for systematic patterns in fare and capacity set by each carrier. To disentangle pre-existing
growth trend from bankruptcy e¤ect, it would be ideal to know the individual airline�s growth plan
and how it has been changed upon rivals�bankruptcies. Without knowledge of this, however, the best
assumption would be that the pre-existing trend would have continued, were it not for rivals�bankruptcies.
Including pre- and post-bankruptcy periods will control, at least partially, for the trend that may exist
on a route a¤ected by bankruptcy. In their research on the impact of workers� job losses on earnings,
Jacobson, LaLonde, and Sullivan (1992) added a set of worker-speci�c linear time trends to take account
of individual-speci�c rates of earnings growth. With su¢ cient observations for the time before being
a¤ected by bankruptcy, we can estimate the pre-existing growth trend of each carrier, if any. If we
include carrier-speci�c linear time trends, the estimates of bankruptcy e¤ect on rivals will capture the
rivals� capacity growth (or decline) as compared to the normal periods prior to bankruptcy as well as
other routes una¤ected by bankruptcy.
However, caution is needed here, as in the inclusion of market-speci�c time trends. Without such
pre-existing trends, the inclusion of individual-carrier-speci�c time trends may pick up all the bankruptcy
e¤ects, leading to underestimation. This can be more serious for bankrupt airlines than for their rivals
because a large part of change in fare and capacity in bankruptcy can be taken out as a "trend". So, we
take the estimates with carrier-speci�c time trends as our conservative estimates for bankruptcy e¤ects.
Fourth, di¤erent carrier groups may be a¤ected di¤erently by even the same demand and supply shock.
That is, relative attractiveness or relative e¢ ciency between carrier groups may change over time, even
after carrier-speci�c time trends are controlled for. These changes may mean a decline of one carrier group
but an opportunity for other carrier group. For example, recession may lead to a higher price-sensitivity
of travellers and hence LCCs may �nd it easy to attract passengers with low fares. Also, spike in fuel
costs may a¤ect legacy airlines more seriously than LCCs. Since bankruptcies are often associated with
recessions and fuel cost increases, this will lead to overestimation of LCC expansion during legacy rivals�
bankruptcies. On the other hand, a sudden decrease in demand may reduce congestion problems, which
may a¤ect the value of connected �ights positively while the value of direct �ights are left una¤ected.
Since legacy airlines tends to adopt hub-and-spoke system while LCCs tends to adopt point-to-point
system, the same negative demand shock will a¤ect legacy and low-cost airlines di¤erently.
We add carrier-group-speci�c time e¤ects to account for the heterogenous e¤ects of the shocks in
the same time period for di¤erent carrier groups, legacy, low-cost, and other carriers. The inclusion
of year-quarter e¤ects for each carrier group alleviates the potential bias from the changes in relative
attractiveness or relative e¢ ciency between carrier groups.
Fifth, there can be a selection bias. LCCs�choice with limited resources upon rivals�bankruptcy may
bias the estimation. It may take some time for airlines to increase the stock of airplanes and employees
18
when they see the opportunity to expand. In this case, the airlines will instead reallocate the limited
resources to more promising routes/airports in the short term. For example, if the airlines �nd bankrupt
routes/airports pro�table, then they will transfer their capacity from other routes to the bankrupt routes,
leading to overestimation of capacity expansion of non-bankrupt airlines during rivals�bankruptcy. The
reverse can be true if bankruptcy hurts rivals. Here, the self-selection issue arises not because LCCs
are not identical on bankrupt and non-bankrupt routes but because the identical airline can redistribute
the constrained capacity between bankrupt and non-bankrupt routes. That is, the source of bias is the
dependency between routes.
However, the bias will become negligible in the long term. After all, the short-term �xed capacity of
an airline will become �exible in the long term. So, the estimated bankruptcy e¤ects in the later period of
bankruptcy will become less vulnerable to the potential bias as an airline adjusts its total capacity level.
In addition, we conduct airport-level analysis as well as route-level analysis as they are complementary.
Airport-level analysis will be relatively free from the bias because the transfer of capacity between airports
will be less active than that between routes.
Other time-variant confounding factors that may a¤ect fares and capacities are included. In particular,
we include the presence of LCCs, network size of a carrier, the portion of direct �ights. As we will see
later, bankruptcy of a carrier serving a route may attract LCCs to enter and the entry of LCC has been
reported to a¤ect fare level negatively. Also, bankrupt airlines often shrink network size, which may have
negative impact on fares as they cannot command premium for extensive networks. On the other hand,
we add the presence of LCCs that may confound capacity change from LCC entry with bankruptcy e¤ect
as the entry of LCC are often linked to capacity increase as fares are lowered.
5 Empirical Model
5.1 Variable Construction
We will build empirical models based on the conceptual framework from the previous section. We are
interested in how bankrupt airlines near, during, and after bankruptcy, how their rivals respond, and how
the total capacity level changes as a result. Thus, the bankruptcy-related variables are constructed in a
manner so that we can capture how a bankrupt �rm�s and its competitors�behaviors change over time in
the periods surrounding bankruptcy. Table 3 shows how the bankruptcy-related variables are constructed.
The event dates of interest include a series of quarters from three quarters prior to bankruptcy �ling to
post-bankruptcy periods (if a bankrupt airline reemerged) or liquidation date (if a bankrupt airline ends up
being liquidated). The quarters before and after a bankrupt airline exits from a market during bankruptcy
procedures will also be considered to see whether outright liquidation will help rivals improve pro�tability
by softening competition and removing excess capacity. To our knowledge, the exit of bankrupt airlines
from markets have not been covered in previous studies on airline bankruptcies. If a bankrupt airline
disappeared from the route that it served at some point in a year prior to bankruptcy �ling and then does
not show up in the data for at least for four consecutive quarters after they �rst disappeared, we regard
19

the event as a bankrupt airline�s exit from the route. If liquidation of bankrupt airlines would bene�t
rivals by preventing bankrupt airlines from cutting fare below others� fare level and eliminating excess
capacity, then we will be able to �nd signs of improvement in rivals�pro�tability and reduction in total
capacity.
Table 3. Variable List: Bankruptcy-Related Variables
Carrier Route
Event period (k) Bankrupt airline Rivals "Bankrupt" route
Pre- [TB-3]
bankruptcy [TB-2] D[k]mit W [k]
mirt�Bshr[B]
mrt W [k]
mrt�Bshr[B]
mrt
[TB-1]
During [TB ]
bankruptcy [TB+1] D[k]mit W [k]
mirt�Bshr[B]
mrt W [k]
mrt�Bshr[B]
mrt
[TB+2~TRE ]
Post- [TRE+1]
bankruptcy [TRE+2] D[k]mit W [k]
mirt�Bshr[B]
mrt W [k]
mrt�Bshr[B]
mrt
[TRE+3~]
Pre-exit [TEX -2] W [k]mirt�Bshr[E]
mrt W [k]
mrt�Bshr[E]
mrt
[TEX -1]
After-exit [TEX ]
[TEX+1] (No Observations) W [k]mirt�Bshr[E]
mrt W [k]
mrt�Bshr[E]
mrt
[TEX+2~]
Superscript m = Legacy if legacy bankruptcies, Oth if others.
TB : Quarter of bankruptcy �ling, TRE : Last quarter in bankruptcy
TEX : Quarter of a bankrupt airline�s exit from a route
We divide bankruptcy �lings into two groups based on which carrier group the �ling airline belongs
to. If a bankrupt airline is a legacy carrier, we denote it as "legacy" bankruptcy. In other cases, the
bankruptcy is denoted as "other" bankruptcy. The same set of variables will be constructed for two groups,
respectively. The study is more interested in legacy bankruptcies than others since, �rst, it informs us of
the impact of large incumbent airlines�bankruptcies on their rivals and, second, the bankruptcy will a¤ect
a large number of routes so we have many observations to get more reliable estimates on bankruptcy e¤ects
as compared to other bankruptcies that involve smaller carriers so the a¤ected markets and competitors
are rather limited.
The "bankrupt" routes and the "rivals" to bankrupt carriers can be de�ned in two ways depending on
whether a bankrupt airline has direct �ights on a route or not. A bankrupt airline can be present on a route
either by operating its own direct �ights or by providing connected �ights or marketing tickets with other
airlines through code-sharing. Our de�nition is based on whether a bankrupt airline is selling tickets on a
route. This de�nition emphasizes consumer perception rather than �xed resources/facilities. So, we allow
for the possibility that connected �ights are good substitutes for direct �ights. In addition, the de�nition
based on whether to provide direct �ights can involve measurement error in identifying bankruptcy e¤ects
since connected �ights can be a large portion of services especially for network carriers.
20

We regard a route as a "bankrupt" route if a bankrupt airline�s market share is not less than 1%. The
competitors selling a ticket on the "bankrupt" route are considered as "rivals" to bankrupt carriers. Since
we consider market share of a bankrupt airline as will be explained later, the potential bankruptcy e¤ect
will depend on the presence of the bankrupt airline. The robustness checks using the other de�nition,
though not reported here, are not qualitatively di¤erent from the results presented in this paper. This
is because an airline is very likely to be providing direct services on a route where its market share is
signi�cant. In the supplemental analysis with the airport sample (Section 6.3), bankruptcy-a¤ected routes
and rivals only when a bankrupt airline is operating at the airport. That is, for airport analysis, an airport
will be considered as "bankrupt" only when a bankrupt airline is physically present.
In particular, we �rst construct bankruptcy-related dummy variables as an interaction between carrier
identity (based on whether bankrupt or not and whether legacy carrier or not) and the indicator of time
intervals (pre-, during, post-bankruptcy periods, or pre- and post-exit periods). Bankruptcy indicators are
a series of dummy variables for a bankruptcy �ling carrier in each event quarter k from three quarters prior
to the �ling through the carrier�s last quarter in the sample, as listed in the column labelled "Bankrupt
airlines" in Table 3, i.e. k 2 fTB � 3, TB � 2, TB � 1, TB, TB + 1, TB + 2~TRE , TRE + 1, TRE + 2,TRE + 3~; TEX � 2, TEX � 1, TEX , TEX + 1, TEX + 2~g where TB is the quarter of bankruptcy �ling,TRE is the last quarter in bankruptcy before reemergence from bankruptcy if applicable, and TEX is the
quarter of bankrupt airlines�exit from a route. D[k]lgit is a bankrupt-carrier indicator that takes one if
t = k where t is calendar quarter while k is event quarter. So, D[TB]lgit , for example, takes a value of
one if an airline i is a legacy carrier and it �les for bankruptcy in the current quarter t. D[TRE + 1]othit is
triggered if an airline i is not a legacy carrier and it reemerged from bankruptcy last quarter.
The bankruptcy indicators (W [k]�irt) are the counterparts of bankrupt-carrier indicators for each event
quarter k. W [k]�irt takes a value of one if an airline i is competing with bankrupt airlines on route r at t = k;
that is, if there are bankrupt airlines serving route r at t = k. We then multiply the bankruptcy indicators
for the leads and lags of bankruptcy �ling dates with the average market share of bankrupt airlines for the
previous year from four quarters prior to the bankrupt �ling (� Bshr[B]�rt =14
PTB�4t=TB�7Mkt_sharert
where TB is the quarter of bankruptcy �ling and Mkt_sharert is the market share of bankrupt airlines
on route r at time t). Similarly, the bankruptcy indicators before and after a bankrupt airline�s exit is
multiplied with the average market share of the bankrupt airline for the one year prior to four quarters
before the bankrupt airline exits the market (� Bshr[E]�rt = 14
PTEX�4t=TEX�7Mkt_sharert where TEX is the
quarter of bankrupt airline�s exit from route r and Mkt_sharert is the same as before).
We interact bankruptcy indicators with the market share of a bankrupt airline to take account of the
possibility that bankrupt airlines�rivals�responses are di¤erent depending on the market presence of the
bankrupt airline as each market can be exposed to di¤erent levels of bankruptcy e¤ects. For instance, even
though a bankrupt airline changes capacity at the same rate in all markets, the impact of the behavior to
competing airlines may be larger in the market where the bankrupt airline used to be dominant. Here,
the market shares from the periods before a¤ected by bankruptcy are chosen to avoid endogeneity issues
and measure the bankruptcy airlines�presence in the market when una¤ected by bankruptcy. We take a
one-year average since it is a more reliable measure than one-time market share which is vulnerable to
21

time-speci�c shock. The rivals will then be divided into two groups based on whether the airline is LCC
or not.
The last column of Table 3 is route-level bankruptcy-related variables. Route-level analysis is in-
tended to see the capacity change in total on bankruptcy-a¤ected routes, as a result of �nancial distress,
bankruptcy, reemergence, or bankrupt airlines�exit from the market. The comparison group is the routes
where no carrier is bankrupt. Bankruptcy indicators, W [k]rt is again interacted with the average market
share of bankrupt airlines serving the route for a year from three quarters prior to bankruptcy �ling.
Table 4 is the list of other variables used in the empirical analyses.
Table 4. Variable List: Other Variables
Variable Unit Description
Price Med_fareirt 2000$ Median fare of a carrier i on route r at time t
Q1_fareirt 2000$ 25% percentile fare of a carrier i on route r at time t
Q3_fareirt 2000$ 75% percentile fare of a carrier i on route r at time t
Capacity N_seatsirt 1,000 # available seats by a carrier i on route r at t
N_seats_allrt 1,000 # available seats on route r at t
N_flights_allrt 1,000 # scheduled departures on route r at t
ASMiat 1,000 Available seat miles by a carrier i at airport a at t
seat mile
Share Mkt_shareirt 1 Share of a carrier i on route r at t in terms of passenger enplanement
Seat_shareirt 1 Share of a carrier i on route r at t in terms of available seats
Route LCCinrt 1 if LCC serves route r at time t, 0 otherwise
Characteristics SWinrt 1 if Southwest serves route r at t, 0 otherwise
Local Inc_originrt 2000$ Personal income in a origin city of route r at t
Economic Inc_destrt 2000$ Personal income in a destination city of route r at t
Conditions Pop_originrt 1,000 Population in a origin city of route r at t
Pop_destrt 1,000 Population in a destination city of route r at t
Emp_originrt 1,000 Total employment in a origin city of route r at t
Emp_destrt 1,000 Total employment in a destination city of route r at t
Carrier Networkit 1/1000 # routes a carrier i is serving at t
Characteristics Net_originirt 1/1000 # destinations carrier i is �ying out of the origin airport of route r at t
Net_destirt 1/1000 # origins carrier i is �ying into the destination airport of route r at t
Directirt 1 Percentage of direct �ights in all tickets of a carrier i on route r at t
5.2 Empirical Model
We begin with fare and capacity as dependent variables as price and quantity are the main strategic tools
that �rms use to compete. We then see the change in market and capacity shares of bankrupt airlines
and their rivals in the periods surrounding bankruptcies. Consistently with the conceptual framework,
we will use the following econometric speci�cation:
22

log Yirt =Xk2K1
D[k]lgit�k +Xk2K1
D[k]othit �k
+X
k2K1[K2W [k]lgirt �Bshr[k]
lgrt � (1�D_lcci) nlcck +W [k]lgirt �Bshr[k]
lgrt �D_lcci lcck
+X
k2K1[K2W [k]othirt �Bshr[k]othrt � (1�D_lcci) �nlcck +W [k]othirt �Bshr[k]othrt �D_lcci �lcck
+D_timet � �1 +D_fl; qtrrt � �2 +Xirt � �
+Di � Trendt �i +Xg2G
D_groupg �D_timet � !g + uirt
where an observation unit is a carrier i on a route r at time t (= 1998Q1, 1998Q2,� � � , 2008Q2), log Yirtis a dependent variable after log-transformation of variables of interest, logMed_fareirt, logN_seatsirt,
K1 and K2 are the set of lead and lag quarters of bankruptcies and bankrupt airlines�exit, respectively
(K1 = fTB � 3, TB � 2, TB � 1, TB, TB +1, TB +2~TRE , TRE +1, TRE +2, TRE +3~g, K2 = fTEX � 2,TEX � 1, TEX , TEX + 1, TEX + 2~g), bankruptcy-related variables are as de�ned in the previous sectionwith Bshr[k] = B_shr[B] if k 2 K1 and B_shr[E] if k 2 K2, D_lcc is an indicator of a LCC, Xirt isa set of a constant, local economic conditions e.g. log-transformed value of personal income, population,
and total employment in origin and destination cities, and other control variables such as LCCin, SWin,
Network, and direct if a dependent variable is logMed_fare and LCCin and SWin if a dependent
variable is logN_seats,18 D_timet is a set of time-speci�c dummies for year-quarter pair, D_fl; qtrrt is
a set of quarter dummies for Florida route,19 Di is an indicator of a carrier i (2 I = set of all carriers),
Trend is a linear time trend (=1 if 1998Q1, � � � , =42 if 1998Q1), Di is an indicator of a carrier i (2 I =set of all carriers), D_groupg is an indicator of a carrier group that has one if i belongs to group c
(2 C = fLegacy, LCC, Otherg), and uirt is the combination of time-invariant route-carrier �xed e¤ect(�ir) and random shock to a carrier-route pair at time t (�irt), i.e. uirt = �ir + �irt.
The strength of data set is the panel structure that enables us to control for time-constant individual
heterogeneities. We will exploit this by employing a �xed e¤ect model with a carrier-route pair as a panel
ID. The �xed e¤ect model is chosen to allow an individual e¤ect to be correlated with other explanatory
variables including bankruptcy-related variables. We assume that the e¤ect of a speci�c carrier-route pair
on fare/capacity level has a time-invariant component (�ir) and random shock component (�irt). While
the time-invariant component is captured by carrier-route dummies, the random component varies over
time and thus are treated as usual normal error terms (i.e. �irt~N(0; �2)).20
In the basic econometric speci�cation, the panel ID is a carrier-route pair. Airline market, however,
is often characterized by seasonality (.e.g. demand conditions in the �rst quarter di¤er form those in the
third quarter), a carrier-route-quarter combination may be another appropriate candidate for the panel
18See Table 4 for the description of variables. Some control variables, such as network variables, fraction of direct �ightsand round trips, seems to be related to a fare premium or discount but not to quantity level. So, those variables are droppedin quantity equations.19As for the quarter dummies for Florida route, see the paragraph on panel ID below.20We report Eiker-White Robust Standard Errors clustered in a panel ID to account for potential heterogeneity.
23

ID. There is a trade-o¤ between these two choices of the panel ID. If we choose carrier-route-quarter
combination, we can control for seasonal adjustment. However, we will have much shorter data periods21
that we can use to estimate "but for" fare/capacity level, which may lead to a biased estimation of
counterfactual patterns. On the other hand, though choosing carrier-route pair has disadvantage that we
do not control for quarterly adjustment by a carrier on a route, it allows us to have much longer data
periods22 that we can depend on to estimate counterfactual fare/capacity level but for bankruptcy events.
This study chooses A carrier-route pair as a panel ID over a carrier-route-quarter combination. We
instead include quarter dummies if origin or destination airports are in Florida in addition to time speci�c
dummy variables (from 1998Q2 to 2008Q2: base.= 1998Q1). The time-speci�c dummy variables are
intended to control for aggregate demand/supply shocks common to all routes and carriers or common
quarterly movement in fare or capacity. Quarter dummy variables for the route originated from or
destined to Florida region are included because quarterly pattern is similar for most of routes (demand
highest in the third quarter and lowest in the �rst quarter) but the pattern is reversed in Florida region
(demand lowest in the third quarter and highest in the �rst quarter). As we will see later in this section,
the estimated coe¢ cients for time speci�c dummies and Florida quarter dummies show the expected
pattern.23
The key variables are bankruptcy-related variables. The estimates of coe¢ cients on bankruptcy in-
dicators, that is, a series of dummy variables for bankruptcy �ling carriers (D[k]) captures the average
impact of �nancial distress on the airlines. On the other hand, the estimated coe¢ cients on interaction
between rivals�bankruptcy and the bankrupt airlines�market share (W [k]�Bshr) show the e¤ect of bank-ruptcy on rivals which are allowed to vary with di¤erent level of exposure to the bankruptcy. Bankrupt
airlines�rivals fall into one of the two groups, either LCCs or. non-LCCs. The di¤erence (or similarity)
in the behavior of the two groups will help us understand how airlines have been competing (or not).
Since the dependent variable is log-transformed, the estimated coe¢ cients are interpreted as a semi-
elasticity, i.e. % change in Y , e.g. fare or capacity, in response to a unit change of RHS variable. In this
model, after accounting for carrier-route individual (�xed) e¤ects, the estimates for bankruptcy-related
variables are interpreted as the change in dependent variable of the same airline on the same route when
a¤ected by bankruptcy.
All other empirical analyses are a modi�cation of the basic empirical model. For the airport sample,
the same econometric speci�cation is used except that a panel ID is now carrier-airport pair. The empirical
model for total route capacity is as follows:
21Then the panel data becomes yearly data set for each carrier-route-quarter combination. So, we have eleven years ofobservation at most.22The panel data is a quarterly data set for carrier-route pair. So, we have fourty two quarters of observation at most.23The estimation results do not change qualitatively even if we do not include quarterly dummies for Florida region.
Choosing carrier-route-quarter combination changes the estimation results a bit in the sense that the fare change is largerbefore �ling for bankruptcy than during bankruptcy procedures. Other than that, the estimation results are similar.
24

log Yrt =X
k2K1[K2W [k]lgrt �Bshr[k]
lgrt�
lgk +W [k]
othrt �Bshr[k]othrt �othk
+Zrt � �2 +D_timet � �2 + urt
where an observation unit is a route r at time t (= 1998Q1, 1998Q2,� � � , 2008Q2), log Yirt is a log-transformed value of capacity such as logN_seats_allrt and logN_flights_allrt;W [k]�rt is the indicator
that bankruptcy �ling airlines are serving the route as detailed in section 5.1, Bshr�rt and D_timet are
the same as before, Zrt is the set of a constant, local economic conditions and other control variables
LCCin, SWin, and, lastly, urt is the combination of time-invariant route �xed e¤ect (�r) and random
shock to a route r at time t (�rt), i.e. urt = �r + �rt. In this model, a panel ID is a route.
6 Results
This section reports and discusses the estimation results. Do bankrupt airlines harm rivals by increasing
competitive pressure, as is often claimed? Do bankruptcies signal a depressed market uninviting to entry
and expansion? We examine whether bankrupt airlines under protection harms their competitors by
triggering a fare war with unfair cost advantage and keeping or expanding capacity. The results do not
support the accusation of potential harm of bankruptcy protection on rivals, especially on LCC rivals.
The fare cut by bankrupt airlines is not so e¤ective that pushes others to follow suit and the slack from
bankrupt airlines�capacity cut is �lled by other airlines eventually, leaving the total capacity level largely
una¤ected. In particular, we �nd that LCCs expand while bankrupt rivals reduce capacities. That is,
the services that used to be provided by bankrupt airlines are now replaced by LCCs after they reduced
operations. The route sample analysis shows how market competition plays out in the periods surrounding
airline bankruptcies.
The airport sample analysis supplements the �ndings in the sense that it informs about how the
�xed facilities and time slots at airport are redistributed between airlines in the periods surrounding
bankruptcies. For example, if bankrupt airlines reduce capacity but toughen price competition at the
same time, rivals may choose to use the newly available facilities from the reduction to increase services
on other routes una¤ected by bankruptcies. From the route sample analysis, we found that LCCs expand
whereas non-LCC rivals are reducing services on the "bankrupt" routes. The airport sample analysis
in section 6.2 shows that rivals expand while bankrupt airlines are shrinking. The expansion during
the period is more prominent for LCCs. The results suggest that bankrupt airlines� capacity cutback
gives new openings for their rivals on average but non-LCC competitors avoid bankrupt routes and use
the newly available facilities/slots to expand services on other routes, possibly because LCCs�presence
is growing and so is the competitive pressure on the bankrupt routes. That is, LCC expansion during
rivals�bankruptcies, rather than the presence of bankrupt airlines on a route per se, may toughen the
competition on the "bankrupt" routes.
25

6.1 Do Bankrupt Airlines Harm Rivals?
We begin with fare and capacity change as price and quantity setting are the basic tools to compete. In
particular, we present the event study graphs in the periods surrounding airline bankruptcies.
Figure 2: % Median Fare Change in the Periods Surrounding Bankruptcy, Bankrupt Airlines
(Model F1: N=182,437, R2=0.1129, Model F2: N=182,437, R2=0.1528, Model F3: N=169,430, R2=0.1564
T(B)=Quarter of bankruptcy �ling, T(RE)=Last quarter in bankruptcy
* if signi�cant at 10%, ** if signi�cant at 5%, and *** if signi�cant at 1%)
Figure 2 reports the estimation results on median fare. Model F1 includes LCCin, SWin, Network,
Direct, and dummy variables for year-quarter-pairs for controls. Model F2 adds carrier-speci�c linear
time trends and year-quarter dummy variables for each carrier group (legacy, LCC, or other) to account
for heterogeneities between carriers. We consider Model F2 as our conservative and main model for
bankruptcy e¤ects and thus the right estimate is expected to be between the estimates between Model
F1 and Model F2. Model F3 includes local economic conditions, personal income, employment, and
population. The samples used in Models F1, F2 and Model F3 do not match exactly (see the sample size
N) due to the lack of available data set on recent local economic conditions. In particular, Model F3 do
not cover non-MSAs and the quarters in 2008. Also, the analysis with Model F3 does not cover the second
bankruptcies of Aloha and ATA Airlines (which ends up with liquidation) and the bankruptcy of Frontier
airline. Considering these bankrupt events compose a large portion of samples for "other" bankruptcies,
the di¤erence may be caused by the di¤erence in bankruptcy events covered in the analysis.
T (B) is the quarter of bankruptcy �ling, T (RE) is the quarter of reemergence from bankruptcy, that
is, the last quarter in bankruptcy, and T (EX) is the quarter of exit by a bankrupt airline from a route.
For bankrupt airlines, the fare change is measured by dummy variables indicating each period surrounding
bankruptcy, which would capture an average change. The estimated coe¢ cients are labeled and marked
with * if signi�cant at 10%, ** if signi�cant at 5%, and *** if signi�cant at 1%. Throughout this section,
26

we do not label estimates for the model with local conditions because the estimates are not dramatically
di¤erent from the model without those local conditions in most cases.
The �rst graph shows the fare change for legacy carriers in bankruptcy. Fares decrease about 3-5%
even prior to bankruptcy �ling. Once a legacy airline �les for bankruptcy, the median fare is even lower,
over 7% in the �rst two quarters in bankruptcy and about 4.4% later, as compared to normal periods
before they are at risk of bankruptcy. This fare cut is not negligible even as compared to average quarterly
fare change, which is about 3%. The bankrupt airlines�fare shows a modest upward trend after the early
periods in bankruptcy, though it does not return to the original level. The second graph shows the fare
change for other non-legacy bankrupt airlines (low-cost or regional airlines). Although it shows a sign of
fare decrease, the decrease is not statistically signi�cant in Model F2 and Model F3. The median fare is
signi�cantly lower in the quarter of bankruptcy than normal and the size of fare decrease is even larger
during bankruptcy.
The bankrupt airlines�fare cut appears to be initiated by �nancial distress prior to actual bankrupt
�ling and the size of fare cut becomes larger in bankruptcy. Bankrupt airlines tend to maintain low fare
level even after reemergence. Unlike the previous �ndings reported by Borenstein and Rose (1995), the
fare cut does not dissipate after bankruptcy �ling in legacy bankruptcies. Therefore, we cannot say that
�nancial distress explains all the fare cut by bankrupt airlines. The deep discount upon bankruptcy �ling
indicates that bankruptcy �ling itself has some e¤ect on fare level; consumers may discount bankrupt
airlines, bankruptcy procedure may push the airline to cut fare somehow, and/or their rivals cut fare to
hurt the weakened airlines in bankruptcy and even chase them out of a market.
For the competitors to bankrupt airlines, we use the interaction between bankrupt airlines�presence
(average market share in the past one year una¤ected by bankruptcy or una¤ected by bankrupt airlines�
exit: Bshr as de�ned in Section 5.1) and the bankruptcy indicator as detailed in Section 5.1. The
bankrupt airlines�normal market share is considered to allow for di¤erent level of e¤ects depending on
di¤erent degree of exposure to rivals�bankruptcy. The estimates labelled in the graphs are the coe¢ cient
estimates from regression and average market share of bankrupt airlines on a route in each case ("legacy"
or "other" bankruptcy, legacy or other bankrupt airlines�exit). The "bankrupt" share is about 25% on
average on "bankrupt" routes for both "legacy" and "other" bankruptcy and its distribution is right-
skewed. The average "bankrupt" share on routes where bankrupt airlines exit is about 5% for "legacy"
bankruptcy and about 10% for "other" bankruptcy. Thus, the graph shows the e¤ect of exposure to rivals�
bankruptcy measured at average "bankrupt" share (i.e. Bshr). For example, the estimated change in fare
of bankrupt airlines�rivals when bankrupt airlines�share is 25% is the estimated coe¢ cient multiplied by
0.25. Figure 3 reports the estimation results for "legacy" bankruptcy and Figure 4 shows the results for
"other" bankruptcy.
Prices are strategic complements. So the fare cut by bankrupt airlines may push others to follow
suit. In case of "legacy" bankruptcy, non-LCC rivals seem to follow the bankrupt airlines�fare cut in the
previous quarter of bankruptcy �ling and the �rst two quarters of bankruptcy while LCC rivals�median
fare is cut in the quarter of bankruptcy �ling but the fare is una¤ected in the rest of periods in the
27

bankruptcy. Even the fare cut by rivals upon "legacy" bankruptcy are not signi�cant as compared to
that of bankrupt airlines. Thus, bankrupt airlines�fare cut does not appear to put competitive pressure
on their rivals to match the substantial fare cuts. In the post-bankruptcy periods after reemergence,
however, bankrupt legacy airlines keep lower fares and the median fares eventually decrease for both
LCC and non-LCC rivals. The lowered fares for all airlines in the long term may indicate the toughened
competition after, not during, bankruptcy.
Figure 3: % Median Fare Change in the Periods Surrounding "Legacy" Bankruptcy, Rivals
(T(B): Quarter of bankruptcy �ling, T(RE): Last quarter in bankruptcy, T(EX): Quarter of bankrupt airlines�exit
* if signi�cant at 10%, ** if signi�cant at 5%, and *** if signi�cant at 1%)
If an outright, immediate liquidation of a large carrier would have improved pro�tability for remaining
airlines, as is often claimed, we are expected to see the sign of fare increase after a bankrupt airline
withdraws all the services from a route ("After Exit"). The results do not support this view. The changes
in rivals�fare in the periods surrounding legacy airlines�bankruptcy are mostly not statistically signi�cant.
28

The fare of non-LCC rivals have increased until the quarter of bankrupt airline�s exit (T (EX)) but it
quickly decreased after. The median fare of LCC rivals, on the other hand, shows signs of decrease after a
bankrupt carrier exits a route. As we will see in the capacity change analysis, this may be because LCCs
have expanded after a bankrupt airlines are gone and competitive pressure has increased with it, as seen
on "bankrupt" routes. In addition, it is noteworthy that the Trans World Airlines (TW) is merged by
American Airlines (AA) and hence its exit from a route may indicate the transfer of its assets to American
Airlines. So, the merged airline may have tried to raise fare but the fare increase did not last long due to
the increased competitive pressure from LCC growth on the route.
In sum, while legacy airlines engage in signi�cant fare cuts in bankruptcy, their rivals�fares do not
change signi�cantly during the same period, which indicates that the bankrupt airlines�fare cut is not
as e¤ective as often argued. Rather, their fares decreased in the post-bankruptcy periods. This result
suggests that competition may have got toughened as LCCs expanded during legacy rivals�bankruptcy
and those legacy carriers managed to cut cost levels and became a more e¢ cient and stronger competitor.
In case of other (non-legacy) bankruptcies, competitors seem to set lower fares in the pre-bankruptcy
periods and the quarter of bankruptcy �ling, but not in the rest of periods in bankruptcy. The pattern
suggests the possibility that not bankrupt airlines but their rivals may have put price competitive pressure,
as an attempt to push the weakened airline under �nancial distress to bankruptcy, and hopely even to
liquidation. During bankruptcy after bankruptcy �ling, the fare change is negligible for both LCC and
non-LCC rivals. In the post-bankruptcy periods, however, the rivals seem to keep their fares lower than
usual in the long term. The fare of LCC rivals is signi�cantly lower than normal right before a bankrupt
airline exits a market but it rises after the exit. The fare of non-LCC rivals is higher than usual near and
right after reemergence but the fares decrease in the later periods.
The estimated coe¢ cients on other variables seem to make sense. First of all, in the fare equation
Model F1, when LCCs are present on a route (LCCin = 1), the median fares are lower by 9.1% (Est.=-
0.0905, SE=0.0065). If the low-cost airline is Southwest (SWin = 1), the fare is even lower by 9.3%
(Est.=-0.0932, SE=0.0086) so the total fare cut under the presence of Southwest is huge, about 18.4%.
The number of routes a carrier is serving (Network) is positively correlated with median fare level so
the fare is higher by 1.9% with 1,000 routes (Est.=0.0185, SE=0.0283). The portion of direct �ights
(Direct) is positively related to median fare level: 3% higher with 1 percentage point more direct �ights
(Est.=0.0299, SE=0.0116). The results from Model F2 are mostly the same for those variables except
for Network (Est.=-0.0886, SE=0.0064 for LCCin, Est.=-0.0820, SE=0.0085 for SWin, Est.=-0.0226,
and Est.=0.0348, SE=0.0113 for Direct). The estimated e¤ect of network size increase signi�cantly
to 9.3% (Est.=0.0931, SE=0.0287). In the results from Model F3, the log-transformed values of em-
ployment and personal income are statistically signi�cant with positive e¤ects on median fares while
the estimates on population variables are insigni�cant (Est.=0.1643, SE=0.0903 for logEmp_origin,
Est.=0.1572, SE=0.0880 for logEmp_dest, Est.=-0.1132 SE=0.0525 for log Inc_origin, Est.=-0.1086,
SE=0.0499 for log Inc_dest, Est.=0.0361, SE=0.0834 for logPop_origin, and Est.=0.0270, SE=0.0832
for logPop_dest).
29

Figure 4: % Median Fare Change in the Periods Surrounding "Other" Bankruptcy, Rivals
(T(B): Quarter of bankruptcy �ling, T(RE): Last quarter in bankruptcy, T(EX): Quarter of bankrupt airlines�exit
* if signi�cant at 10%, ** if signi�cant at 5%, and *** if signi�cant at 1%)
The same analysis on the 25% percentile and 75% percentile fares, though not reported here, show
the similar pattern. One thing to note is that 25% percentile fares change less while 75% percentile fares
change more than median fares. In particular, 25% percentile fares set by LCCs change little during
legacy rivals�bankruptcies whereas 75% percentile fares of bankrupt legacy airlines decrease substantially
and those of their LCC rivals decrease in the �rst two quarters of those legacy rivals�bankruptcies. The
results suggest that bankruptcy a¤ects the upper percentiles of fare rather than lower percentiles.
Now, let�s look at the other side of competition: capacity setting. The results on median fares raise
other questions on capacities. First, are bankrupt airlines keeping capacity to make up the low fare with
volume? Second, are their rivals reducing operations to support the fare level? Next three graphs, Figure
30
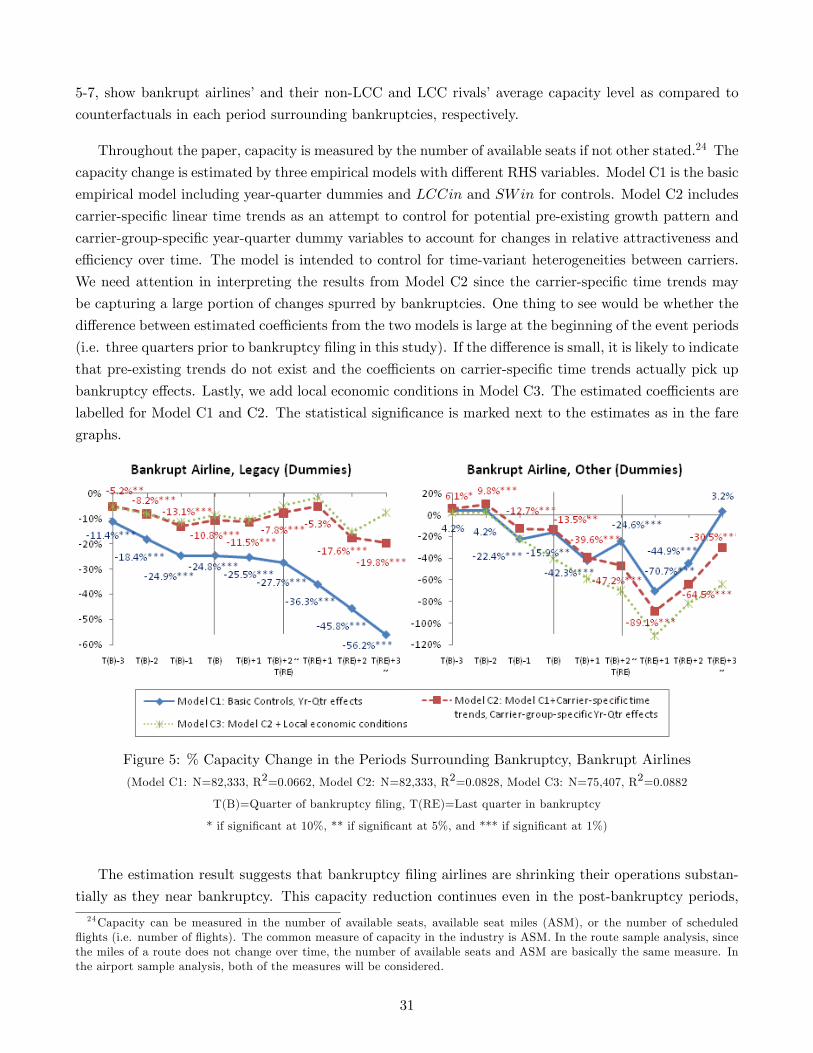
5-7, show bankrupt airlines�and their non-LCC and LCC rivals�average capacity level as compared to
counterfactuals in each period surrounding bankruptcies, respectively.
Throughout the paper, capacity is measured by the number of available seats if not other stated.24 The
capacity change is estimated by three empirical models with di¤erent RHS variables. Model C1 is the basic
empirical model including year-quarter dummies and LCCin and SWin for controls. Model C2 includes
carrier-speci�c linear time trends as an attempt to control for potential pre-existing growth pattern and
carrier-group-speci�c year-quarter dummy variables to account for changes in relative attractiveness and
e¢ ciency over time. The model is intended to control for time-variant heterogeneities between carriers.
We need attention in interpreting the results from Model C2 since the carrier-speci�c time trends may
be capturing a large portion of changes spurred by bankruptcies. One thing to see would be whether the
di¤erence between estimated coe¢ cients from the two models is large at the beginning of the event periods
(i.e. three quarters prior to bankruptcy �ling in this study). If the di¤erence is small, it is likely to indicate
that pre-existing trends do not exist and the coe¢ cients on carrier-speci�c time trends actually pick up
bankruptcy e¤ects. Lastly, we add local economic conditions in Model C3. The estimated coe¢ cients are
labelled for Model C1 and C2. The statistical signi�cance is marked next to the estimates as in the fare
graphs.
Figure 5: % Capacity Change in the Periods Surrounding Bankruptcy, Bankrupt Airlines
(Model C1: N=82,333, R2=0.0662, Model C2: N=82,333, R2=0.0828, Model C3: N=75,407, R2=0.0882
T(B)=Quarter of bankruptcy �ling, T(RE)=Last quarter in bankruptcy
* if signi�cant at 10%, ** if signi�cant at 5%, and *** if signi�cant at 1%)
The estimation result suggests that bankruptcy �ling airlines are shrinking their operations substan-
tially as they near bankruptcy. This capacity reduction continues even in the post-bankruptcy periods,24Capacity can be measured in the number of available seats, available seat miles (ASM), or the number of scheduled
�ights (i.e. number of �ights). The common measure of capacity in the industry is ASM. In the route sample analysis, sincethe miles of a route does not change over time, the number of available seats and ASM are basically the same measure. Inthe airport sample analysis, both of the measures will be considered.
31

so the capacity level is more than cut by about 20% for legacy bankrupt airlines and about 40% for other
bankrupt airlines in the long term (in our conservative model, Model C2). Since it is likely that carrier-
speci�c time trends will be picking up a large portion of bankruptcy e¤ects, the reasonable estimates will
be between Model C1 and Model C2. Adding local conditions to Model C2 (i.e. Model C3) does not
change the result much.
Figure 6: % Capacity Change in the Periods Surrounding "Legacy" Bankruptcy, Rivals
(T(B): Quarter of bankruptcy �ling, T(RE): Last quarter in bankruptcy, T(EX): Quarter of bankrupt airlines�exit
* if signi�cant at 10%, ** if signi�cant at 5%, and *** if signi�cant at 1%)
During the same period, how are rivals setting capacity? Figure 6 presents capacity change for rivals in
the periods surrounding legacy carriers�bankruptcy. Interestingly, the estimation result shows that LCCs
tend to expand whereas non-LCCs rather shrink during rival�s bankruptcy. In particular, non-LCC rivals�
capacity show a steep decrease while a legacy carrier is in bankruptcy, by around 15% at largest measured
at average "bankrupt" share (=25%). The capacity seems to bounce back with rivals�reemergence but
goes down again in the long term.
32

On the other hand, LCC rivals show an upward trend in capacity while a legacy carrier is bankrupt
in all models. After controlling for heterogeneities between carriers, the estimated coe¢ cient on the
period three quarters prior to legacy carriers�bankruptcy becomes negative and signi�cant. This may
indicate that including carrier-speci�c time trends may be over-capturing the potential growth trend. In
other words, this may suggest that the growth of LCCs may have been rather slower on bankrupt routes
than other una¤ected routes before legacy carriers�bankruptcy and then expedited as the legacy rivals
near bankruptcy. Thus the LCC growth spurred by legacy rivals�bankruptcy would be larger than the
estimates from Model C2. We can see that most of the LCC growth from pre-bankruptcy periods occurred
during, rather than post- rivals�bankruptcy.
Bankrupt airlines�capacity cut can be interpreted as an e¤ort to reduce total expenses quickly and
regain proper liquidity level. This e¤ort would not stop at reducing services. They also drop relatively
unpro�table routes as means to reduce capacity and hence costs. The "After Exit" graph shows the
responses of remaining airlines to bankrupt airlines�exit from a market. Throughout the periods sur-
rounding the exit, non-LCC rivals seem to maintain fewer seats than normal but show the sign of increase
though the estimates are not statistically signi�cant. In the long term, the capacity level does not seem
di¤erent from the usual level. During the same period, LCC rivals increase capacity, which leads to about
10% more seats than usual in the long term if the bankrupt airline used to hold 5% market share (which
is the average "bankrupt" share on routes where a bankrupt legacy carrier exited). Though not reported
here, the results do not change when we use the number of scheduled departures (number of �ights)
instead of the number of available seats as a measure of capacity.
Figure 7 reports the capacity change for rivals in the periods surrounding "other (non-legacy)" bank-
ruptcy. Unlike in "legacy" bankruptcy, the growth pattern is not much di¤erent between LCC and non-
LCC rivals. Throughout the periods, both LCC and non-LCC show the sign of increase in capacity. The
results seem to be consistent with that the bankrupt airlines have been signi�cant competitors although
ended up with bankruptcy and their weakened market presence gives all other rivals the opportunities to
expand.
In the regression results from Model C1, the presence of a LCC (LCCin=1) does not have a signif-
icant relationship with capacity level whereas Southwest is positively and signi�cantly related to total
capacity at 6.7% signi�cant level (Est.=0.0175, SE=0.0210 for LCCin, and Est.=0.0669, SE=0.0327
for SWin). After controlling for time-variant heterogeneities between carriers (Model C2), the esti-
mated coe¢ cients are higher and more signi�cant (Est.=0.0293, SE=0.0223 for LCCin, and Est.=0.0794,
SE=0.0349 for SWin). Including local economic conditions do not change the estimates on the two vari-
ables. The employment in destination city and personal income in origin city are positive and signi�cant
at 1% and 5%, respectively (Est.=0.5618. SE=0.3996 for logEmp_origin, Est.=1.1403, SE=0.4215 for
logEmp_dest, Est.=0.5360, SE=0.2267 for log Inc_origin, Est.=0.2745, SE=0.2433 for log Inc_dest,
Est.=0.1194, SE=0.3745 for logPop_origin, and Est.=-0.2483, SE=0.3894 for logPop_dest).
33

Figure 7: % Capacity Change in the Periods Surrounding "Other" Bankruptcy, Rivals
(T(B): Quarter of bankruptcy �ling, T(RE): Last quarter in bankruptcy, T(EX): Quarter of bankrupt airlines�exit
* if signi�cant at 10%, ** if signi�cant at 5%, and *** if signi�cant at 1%)
Then, how are market and capacity shares would change in the periods surrounding bankruptcy?
Figure 8-13 present the estimated change in the two measures of market presence in those periods. Market
share is de�ned as a carrier�s share on a route in terms of passenger enplanements whereas capacity share
is measured as a carrier�s share in terms of seats available. Model MS1 and Model CS1 do not account
for time-variant heterogeneities between carriers as they only includes year-quarter dummy variables to
control for aggregate shocks common to all carriers. Meanwhile, Model MS2 and Model CS2 include
carrier-speci�c time trends and year-quarter dummy variables for each carrier group.
34
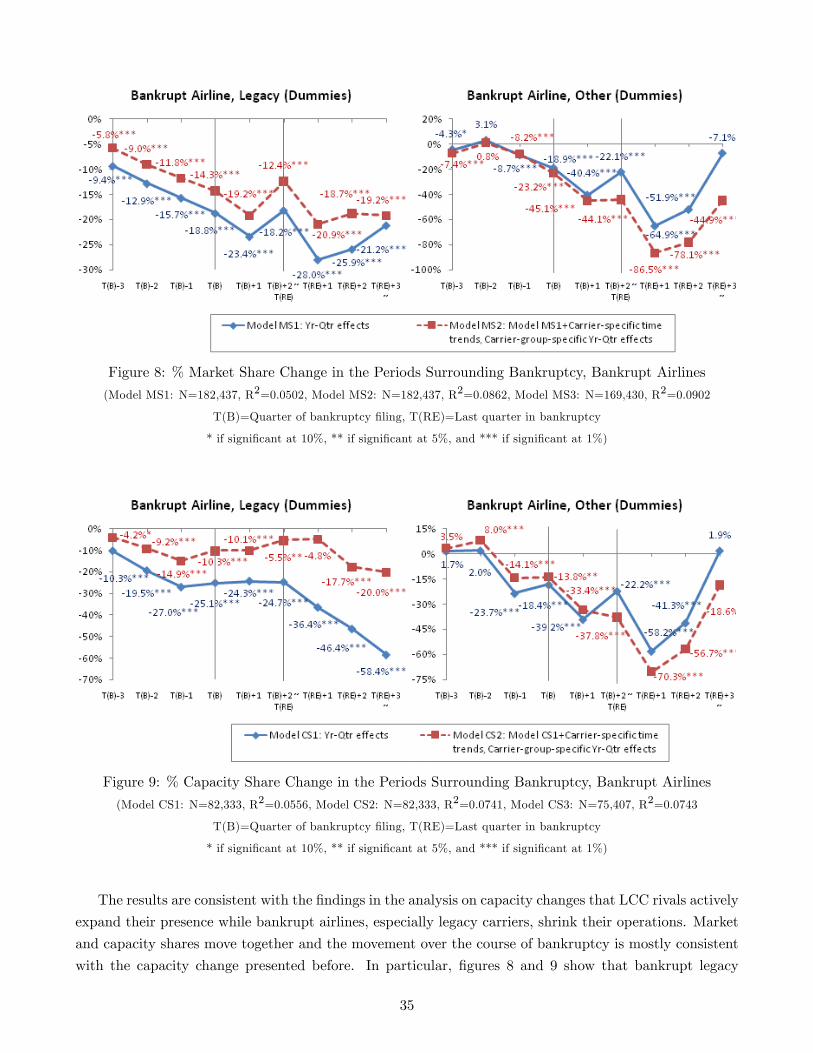
Figure 8: % Market Share Change in the Periods Surrounding Bankruptcy, Bankrupt Airlines
(Model MS1: N=182,437, R2=0.0502, Model MS2: N=182,437, R2=0.0862, Model MS3: N=169,430, R2=0.0902
T(B)=Quarter of bankruptcy �ling, T(RE)=Last quarter in bankruptcy
* if signi�cant at 10%, ** if signi�cant at 5%, and *** if signi�cant at 1%)
Figure 9: % Capacity Share Change in the Periods Surrounding Bankruptcy, Bankrupt Airlines
(Model CS1: N=82,333, R2=0.0556, Model CS2: N=82,333, R2=0.0741, Model CS3: N=75,407, R2=0.0743
T(B)=Quarter of bankruptcy �ling, T(RE)=Last quarter in bankruptcy
* if signi�cant at 10%, ** if signi�cant at 5%, and *** if signi�cant at 1%)
The results are consistent with the �ndings in the analysis on capacity changes that LCC rivals actively
expand their presence while bankrupt airlines, especially legacy carriers, shrink their operations. Market
and capacity shares move together and the movement over the course of bankruptcy is mostly consistent
with the capacity change presented before. In particular, �gures 8 and 9 show that bankrupt legacy
35

carriers show a signi�cant decline in both market share and capacity share on a route near bankruptcy.
We have seen that a large portion of capacity reduction by bankrupt airlines has occurred in the pre-
bankruptcy periods, which is consistent with the patterns of market and capacity share change. While
the market and capacity shares of bankrupt legacy carriers are even lower after reemergence than during
bankruptcy, those shares of bankrupt non-legacy carriers record the lowest point right after reemergence
but appears to regain the shares, although not up to the normal levels.
Figure 10: % Market Share Change in the Periods Surrounding "Legacy" Bankruptcy, Rivals
(T(B): Quarter of bankruptcy �ling, T(RE): Last quarter in bankruptcy, T(EX): Quarter of bankrupt airlines�exit
* if signi�cant at 10%, ** if signi�cant at 5%, and *** if signi�cant at 1%)
36

Figure 11: % Capacity Share Change in the Periods Surrounding "Legacy" Bankruptcy, Rivals
(T(B): Quarter of bankruptcy �ling, T(RE): Last quarter in bankruptcy, T(EX): Quarter of bankrupt airlines�exit
* if signi�cant at 10%, ** if signi�cant at 5%, and *** if signi�cant at 1%)
The loss in market and capacity shares of bankrupt airlines is signi�cant. Then, who are the bankrupt
airlines losing their market and capacity shares to? Figures 10 and 11 show the change in market and
capacity shares for bankrupt legacy airlines�rivals. Non-LCC rivals tend to have the same or lower market
and capacity shares in the periods of interest as compared to normal times whereas LCC rivals have won
both market and capacity shares on "bankrupt" routes throughout the periods. The growth pattern of
LCCs is even more prominent if we look at capacity share, which indicates that the actual operations are
increasing faster than market shares.
Once a bankrupt airline exits from a route, other airlines, especially low cost carriers, seem to win
market share at least in the later periods. Non-LCC rivals�market share shows a jump upon bankruptcy
airlines�exit. Part of the jump is likely to be caused by a merger of TWA by American Airlines. The
37

capacity and market shares of LCC rivals tend to be higher in pre- and post- exit of bankrupt airlines than
normal. Therefore, bankruptcy of legacy carriers appears to rather present new growth opportunities at
least for their e¢ cient rivals, LCC rivals.
Figures 12 and 13 reports the estimation results for "other" bankruptcy. In this case, both non-LCC
and LCC rivals show the tendency of increase in market and capacity shares as in the analysis of capacity
change, although the patterns are not as robust as in "legacy" bankruptcy.
Figure 12: % Market Share Change in the Periods Surrounding "Other" Bankruptcy, Rivals
(T(B): Quarter of bankruptcy �ling, T(RE): Last quarter in bankruptcy, T(EX): Quarter of bankrupt airlines�exit
* if signi�cant at 10%, ** if signi�cant at 5%, and *** if signi�cant at 1%)
38

Figure 13: % Capacity Share Change in the Periods Surrounding "Other" Bankruptcy, Rivals
(T(B): Quarter of bankruptcy �ling, T(RE): Last quarter in bankruptcy, T(EX): Quarter of bankrupt airlines�exit
* if signi�cant at 10%, ** if signi�cant at 5%, and *** if signi�cant at 1%)
So far we have seen carrier-level changes in fare, capacity, and market/capacity shares in the periods
surrounding bankruptcy. The main �ndings are that bankrupt airlines cut fare as well as capacity in those
periods and, during the same periods, LCC rivals do not match the fare cut and expand capacity and
market presence. In addition, these patterns are even more prominent when a bankrupt airline is a legacy
carrier and its market share used to be higher on a route in the near past. Therefore, bankrupt airlines�
fare cut is not as e¤ective enough to hurt their competitors as often claimed. Moreover, bankrupt airlines
do reduce capacity over the course of bankruptcy and their disappearance from a market does not seem
to help others to increase pro�tability in legacy bankruptcies.
The rivals�fare cut in the post-bankruptcy periods rather suggest that, though bankrupt carriers may
have triggered fare cut in the beginning, it could be their capacity cut that increases price competition by
39

allowing for LCCs to expand. The LCC expansion raises price competitive pressure for not only legacy
carriers but also LCCs themselves as average competitors are getting stronger. In sum, bankrupt airlines
operating under protection per se do not seem to harm rivals�pro�tability. Instead, the increasing exposure
to LCCs can be more signi�cant. In particular, e¢ cient airlines with low cost structure are reaping the
bene�ts from bankrupt airlines�capacity cut and expand, leading to even �ercer competition. In other
words, the industry transition in favor of more e¢ cient and stronger players may have been facilitated by
bankruptcy �lings and capacity cut that followed. The LCCs pro�t today as bankrupt rivals are shrinking
but the competition seems to get tougher as they are competing against stronger counterparts.
6.2 Using the Airport Sample
This is a supplementary section that con�rms the �ndings in the previous sections and highlights how
capacities are redistributed between airlines during bankruptcies, given �xed facilities and slots of airport.
It is hard to see an airport as a market. We rather see it as a set of �xed resources. In this sense, the route
sample analysis shows how market competition plays out in the periods surrounding airline bankruptcies
while the airport sample analysis focuses rather on the supply side that essential physical resources are
limited that could have limited e¢ cient �rms from growth. In this case, bankrupt airlines� capacity
cutback would provide room for other airlines to expand. The growth of e¢ cient airlines at an airport
spurred by bankruptcy of rivals that have been operating at the airport will indicate the existence of
entry barrier due to �xed facilities and slots (at least for the short term).
Figure 14: % Capacity Change at Airport in the Periods Surrounding Bankruptcy, Bankrupt Airlines:
Capacity Measured in Available Seat Miles (ASM)
(Model AC1: N=59,359, R2=0.0807, Model AC2: N=59,359, R2=0.1750, Model AC3: N=51,950 R2=0.1987
T(B)=Quarter of bankruptcy �ling, T(RE)=Last quarter in bankruptcy
* if signi�cant at 10%, ** if signi�cant at 5%, and *** if signi�cant at 1%)
For the airport sample, the same empirical models will be used as for the route sample, except we
replace route with airport and dependent variables will be capacity measured in available seat miles
40

(which is the most common measure of airline capacity) and airport market share. First, �gures 14-16
are the event study graphs from estimation results for airline capacity change at "bankrupt" airports.
Model AM1-Model AM3 are comparable to Model C1-Model C3 used for the estimation of airline capacity
change on "bankrupt" routes. Although not reported here, the analyses using other measures of capacity
such as the number of available seats and number of scheduled �ights led to similar conclusions.
Figure 15: % Capacity Change at Airport in the Periods Surrounding "Legacy" Bankruptcy, Rivals:
Capacity Measured in Available Seat Miles (ASM)
(T(B): Quarter of bankruptcy �ling, T(RE): Last quarter in bankruptcy, T(EX): Quarter of bankrupt airlines�exit
* if signi�cant at 10%, ** if signi�cant at 5%, and *** if signi�cant at 1%)
As in the route sample analysis, the estimation result using the airport sample shows the pattern that
LCCs expand while bankrupt airlines shrink. The di¤erence is that non-LCC rivals also show signs of
increase in capacity during the same period, although the LCC expansion is greater. Considering that
non-LCC rivals tend to reduce capacity while a legacy carrier is in bankruptcy, the result suggests that
41
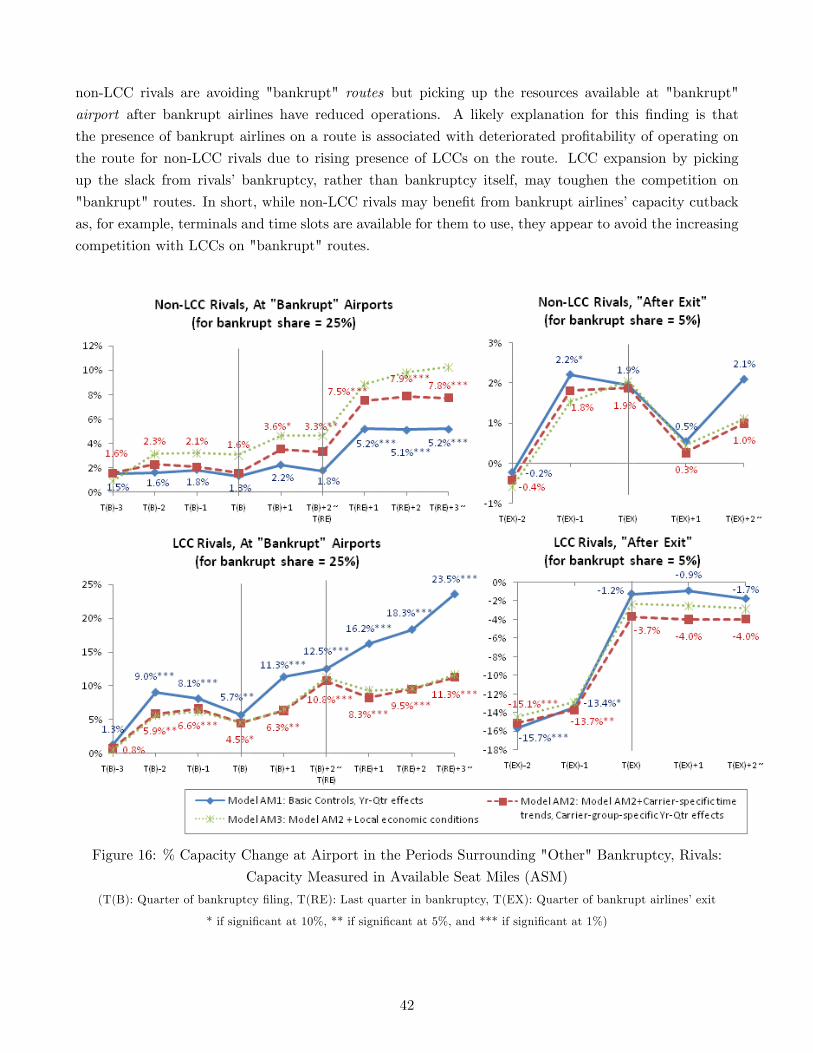
non-LCC rivals are avoiding "bankrupt" routes but picking up the resources available at "bankrupt"
airport after bankrupt airlines have reduced operations. A likely explanation for this �nding is that
the presence of bankrupt airlines on a route is associated with deteriorated pro�tability of operating on
the route for non-LCC rivals due to rising presence of LCCs on the route. LCC expansion by picking
up the slack from rivals� bankruptcy, rather than bankruptcy itself, may toughen the competition on
"bankrupt" routes. In short, while non-LCC rivals may bene�t from bankrupt airlines�capacity cutback
as, for example, terminals and time slots are available for them to use, they appear to avoid the increasing
competition with LCCs on "bankrupt" routes.
Figure 16: % Capacity Change at Airport in the Periods Surrounding "Other" Bankruptcy, Rivals:
Capacity Measured in Available Seat Miles (ASM)
(T(B): Quarter of bankruptcy �ling, T(RE): Last quarter in bankruptcy, T(EX): Quarter of bankrupt airlines�exit
* if signi�cant at 10%, ** if signi�cant at 5%, and *** if signi�cant at 1%)
42

In the regression results from Model AM1, the presence of a LCC (LCCin=1) has a signi�cant neg-
ative relationship with capacity level whereas the estimate on the presence of Southwest (SWin=1) is
positive and insigni�cant (Est.=-0.0386, SE=0.0212 for LCCin, and Est.=0.0272, SE=0.0228 for SWin).
Controlling for time-variant heterogeneities between carriers (Model AM2) do not change the estimates
signi�cantly (Est.=-0.0305, SE=0.0160 for LCCin, and Est.=0.0142, SE=0.0177 for SWin). After includ-
ing local economic conditions, we get more negative and signi�cant relationship between LCCin and ASM
while the estimate on SWin remains the same (Est.=-0.0507, SE=0.0163 for LCCin, and Est.=0.0142,
SE=0.0170 for SWin). Personal income at airport city has a positive and signi�cant relationship with
airline capacity at 1% signi�cance level whereas employment and population at the airport city do not
have a statistically signi�cant relationship with airline capacity (Est.=0.3735, SE=0.3092 for logEmp,
Est.=0.4742, SE=0.1535 for log Inc, and Est.=0.4535, SE=0.3257 for logPop).
Figures 17-19 show the estimation results on airport market share change in the periods surrounding
bankruptcy. Airport market share is measure in terms of passengers originated from the airport. Model
AMS1 and Model AMS2 are comparable to Model MS1 and Model MS2 (or Model CS1 and Model CS2)
used for market share change using the route sample. Although not reported here, the analyses using
other measures of market presence, the share of available seats, the share of available seat miles, or the
share of scheduled departures led to similar results.
Figure 17: % Airport Market Share Change in the Periods Surrounding Bankruptcy, Bankrupt Airlines
(Model AMS1: N=59,359, R2=0.0856, Model AMS2: N=59,359, R2=0.1770, Model AMS3: N=51,950 R2=0.1874
T(B)=Quarter of bankruptcy �ling, T(RE)=Last quarter in bankruptcy
* if signi�cant at 10%, ** if signi�cant at 5%, and *** if signi�cant at 1%)
Figure 17 show that bankrupt airlines maintain lower market share than normal throughout the
periods of interests although the market share shows a sign of recovery in the long term. The market
share change for rivals during a legacy carrier is consistent with the result from airline capacity change at
"bankrupt" airports. In particular, both LCC and non-LCC rivals saw the increase in market share over
legacy airlines�bankruptcy. The market share increase is greater for LCC rivals.
43

Figure 18: % Airport Market Share Change in the Periods Surrounding "Legacy" Bankruptcy, Rivals
(T(B): Quarter of bankruptcy �ling, T(RE): Last quarter in bankruptcy, T(EX): Quarter of bankrupt airlines�exit
* if signi�cant at 10%, ** if signi�cant at 5%, and *** if signi�cant at 1%)
In �gure 18, it is noteworthy that the di¤erences between estimates from Model AMS1 and Model
AMS2 for rivals are noticeable only after a legacy carrier �led for bankruptcy. The pattern is even
more prominent for LCC rivals. This suggest that the carrier-speci�c time trends are over-capturing the
potential systematic changes in market shares. Thus, the market share increase for LCCs will be higher
than the estimates from Model AMS2 and close to those from Model AMS1 without the time trends.
In "other" bankruptcy, both LCC and non-LCC rivals show an upward trend in market share over
the course of bankruptcy. However, the increase is now greater for non-LCC rivals. This may be in part
because some bankrupt non-legacy airlines are merged by legacy airlines or because LCCs may have a
substantial presence already on those routes a¤ected by "other" bankruptcy.
44

Figure 19: % Airport Market Share Change in the Periods Surrounding "Other" Bankruptcy, Rivals
(T(B): Quarter of bankruptcy �ling, T(RE): Last quarter in bankruptcy, T(EX): Quarter of bankrupt airlines�exit
* if signi�cant at 10%, ** if signi�cant at 5%, and *** if signi�cant at 1%)
6.3 Does Total Route Capacity Change?
We have seen that bankrupt airlines tend to reduce capacity over the course of bankruptcy. If outright
liquidation is to eliminate costly excess capacity kept by bankrupt airlines and improve pro�tability for
other airlines, we should be able to �nd the sign of decrease in total capacity level as bankrupt airlines
cut capacity or exit from a market. However, the tendency of capacity increase by LCC rivals not-in-
bankruptcy while bankrupt airlines�capacity cut suggests that this may not be true. That is, even when
bankrupt airlines are reducing capacity, LCCs may take this as an opportunity to add their capacity,
leaving the total capacity level intact. The estimated total capacity change in the periods surrounding
bankruptcy is presented in �gures 20 and 21.
45

The total route capacity change is estimated in using three di¤erent models and the results are reported
in �gure 20. Model R1 is the basic speci�cation with time-speci�c, year-quarter dummy variables and
Model R2 includes the presence of LCC and Southwest (LCCin and SWin) for controls. Local economic
conditions are added in Model R3 so the model covers only MSAs, 1998Q1 through 2007Q4. As detailed
in section 5.1, the bankrupt-route indicators (whether there is a bankrupt airline serving the route)
are multiplied by the average market share of the bankrupt airlines in normal times to take account of
potential heterogeneities of e¤ects depending on the di¤erent degrees of exposure to bankruptcy.
Figure 20: % Total Route Capacity Change in the Periods Surrounding Bankruptcy
(Model R1: N=41,993, R2=0.0814, Model R2: N=41,993, R2=0.1116, Model R3: N=38,677, R2=0.1160
T(B): Quarter of bankruptcy �ling, T(RE): Last quarter in bankruptcy, T(EX): Quarter of bankrupt airlines�exit
* if signi�cant at 10%, ** if signi�cant at 5%, and *** if signi�cant at 1%)
46

In "legacy" bankruptcy, total route capacity measure in the number of available seats increases right
before the bankruptcy �ling and then drops until the end quarter of bankruptcy in the results from Model
R1 and Model R2. Although the capacity is decreased over the course of bankruptcy, given that the
average bankrupt share is about 25%, the estimated decline is around 1%. Even when bankrupt share
is 50%, it is only about 2%. which is no larger than average quarterly change in the capacity in the
sample routes, 4.8%. The standard deviation of quarterly capacity adjustment is about 1.9%. Borenstein
and Rose (2003) reported that capacity change for two quarters before and after bankruptcy �ling is no
larger than quarterly usual capacity adjustment. The result con�rms their �ndings. The decrease in the
capacity is statistically signi�cant but economically insigni�cant. Besides, aggregate demand shock such
as September 11 (2002Q3) led to over 10% route capacity reduction on average in the sample so it has
a much larger impact on capacity level. Moreover, after reemergence, the route capacity level seems to
recover. In addition, considering that LCCs expanded during rivals�bankruptcies, the increase in the pre-
bankruptcy period can be due to the transfer of capacity of LCCs from other routes, as it would be hard
to increase capacity immediately and so LCCs may raise capacity on a bankrupt route by redistributing
the given capacity from other routes to bankrupt routes in the short term.
In other bankruptcies, the total route capacity seems to even increase with larger "bankrupt" share.
The capacity drops steeply right after reemergence but it returns to the normal level in the long term.
When a bankrupt airline exits from the market, the total route capacity drops substantially with higher
market share of bankrupt airlines both in legacy and other bankruptcies. However, the capacity level
seems to rebound to the normal level eventually.
Aside from the bankruptcy e¤ects, the presence of a LCC and/or Southwest on a route has a signi�cant
and positive relationship with the total route capacity level. In Model R2, the capacity is about 10% higher
when a LCC is in and the presence of Southwest is related to additional 15% higher capacity level, meaning
25% capacity increase in total when Southwest is in (Est.=0.1015, SE=0.0133 for LCCin, Est.=0.1545,
SE=0.0241 for SWin). Including local economic conditions do not change the estimates on the two
variables meaningfully (Est.=0.1113, SE=0.0149 for LCCin, Est.=0.1345, SE=0.0242 for SWin). Among
local economic conditions, only the employment in origin and destination cities are signi�cant (at 1%)
(Est.=0.6911, SE=0.2103 for logEmp_origin, Est.=0.6536, SE=0.2066 for logEmp_dest, Est.=0.0614,
SE=0.1246 for log Inc_origin, Est.=0.0875, SE=0.1153 for log Inc_dest, Est.=-0.0089, SE=0.1841 for
logPop_origin, and Est.=0.0066, SE=0.1857 for logPop_dest).
Moreover, the scheduled departures show little change as compared to available seats. Figure 21 shows
that the number of scheduled �ights even tends to increase over the course of bankruptcy where Model
RD1 - Model RD3 are comparable to Model R1 - Model R3. The result indicates that large aircrafts are
being replaced by smaller ones on bankrupt routes during the period. As a side discussion, this suggests
that a large carrier would not internalize the congestion problem they cause because their reduction in
schedules would be �lled by other airlines, leaving the total congestion level una¤ected.
47

Figure 21: % Total Route Capacity Change in the Periods Surrounding Bankruptcy:
Capacity Measured in Scheduled Departures
(Model R1: N=41,992, R2=0.0598, Model R2: N=41,992, R2=0.0877, Model R3: N=38,678 R2=0.1853
T(B): Quarter of bankruptcy �ling, T(RE): Last quarter in bankruptcy, T(EX): Quarter of bankrupt airlines�exit
* if signi�cant at 10%, ** if signi�cant at 5%, and *** if signi�cant at 1%)
As in the estimation results on total route capacity measured in the number available seats, estimation
on total route capacity measured in the number of �ights show that the presence of a LCC and/or South-
west on a route has a signi�cant and positive relationship with the total route capacity level (Est.=0.1182,
SE=0.0139 for LCCin and Est.=0.1269, SE=0.0234 for SWin in Model RD2, Est.=0.0978, SE=0.0143
for LCCin and Est.=0.1527, SE=0.0233 for SWin in Model RD3). Among local economic conditions, the
employment and personal income in origin and destination cities are positive and signi�cant (Est.=0.7999,
SE=0.1970 for logEmp_origin, Est.=0.7498, SE=0.1904 for logEmp_dest, Est.=0.2650, SE=0.1173 for
log Inc_origin, Est.=0.3001, SE=0.1086 for log Inc_dest, Est.=0.0151, SE=0.1762 for logPop_origin,
48

and Est.=0.0189, SE=0.1754 for logPop_dest).
In sum, there is a sign of capacity decrease in the periods surrounding bankruptcies, which may
indicate that bankrupt airlines keep capacity that would otherwise been eliminated. The size of the
decrease, however, is neither economically meaningful nor persistent on a bankrupt route. Moreover, even
when bankrupt airline actually cease operation on a route, the total route capacity does not show a sign of
decrease. That is, overcapacity problem does not seem to get worse as a result of bankruptcy protection.
These results are non consistent with the argument that bankrupt airlines are keeping the capacity that
would otherwise been liquidated.
Although the total capacity does not change meaningfully, the composition of capacity has been
changed because bankrupt airlines reduce capacity and other airlines �ll the gap and thus the industry is
improving in productive e¢ ciency. We have seen the replacement of bankrupt airlines�capacity by their
rivals. For consumers�perspective, who provides �ight services may not be important as long as there
is some airlines that would serve them. The composition of capacity, however, could matter in terms
of allocative e¢ ciency. If bankrupt airlines are relatively ine¢ cient and they are forced to cut back on
capacity, then relatively e¢ cient airlines may take the openings as an opportunity to expand. This is
what we have found in the previous section. This replacement will lead to lower average cost level and
higher e¢ ciency industrywide. The growth of LCCs spurred by rivals�bankruptcy, especially legacy rivals�
bankruptcy, leads us to the next question: how large the fraction of LCC expansion can be attributed to
rivals�bankruptcy? Section 7 quanti�es the e¤ects for the quarterly 1000 most popular routes during the
data period (1998Q1-2008Q2).
7 Calculating the Fraction of LCC Growth from Rivals�Bankruptcies
Given the long history of the airline industry since deregulation in 1978, LCCs, even with substantial cost
advantage over legacy carriers, have not expanded as rapidly and extensively as expected (see Figure 22).
For example, LCCs�passenger share is less than 5% in 1990. This raises a question: what does it take for
e¢ cient airlines to take markets from less e¢ cient incumbents?
Airline industry is easy to lead to sticky market shares. Incumbent, legacy airlines can be very adverse
to reducing capacity for various reasons. For one, capacity reduction will not be easily reversible so it
may be hard to get terminals or other airport facilities back once they lose them to other airlines. Or,
since they have extra aircraft anyway, they can add capacity at very low marginal costs. These reasons
may be holding back the incumbent airlines from reducing capacity in normal times when they do not
need any dramatic change immediately. In addition, the facilities and time slots are �xed at least in the
short term in the airline industry. Even if LCCs can provide comparable services to legacy airlines, it
may be hard for them to get the access to the �xed assets necessary to operate as long as incumbents
are not giving them up. The discrete capacity reduction by incumbents then will provide an immediate
expansion opportunities for those e¢ cient airlines whose growth has been limited.
49

9/11, for example, was the event that urged incumbent airlines to cut capacity signi�cantly and
discretely. LCCs also retreated capacity in the aftermath of 9/11. However, the retreat did not last long.
LCCs soon expanded by picking up the slack from large network airlines�capacity cutback. Although
bankruptcy is not as exogenous as 9/11 shock, the risk of being liquidated may urge the airlines to cut
back on capacity as substantially and discretely as 9/11. The empirical results with the route sample
indicated that LCCs �lled the vacuum from bankrupt airlines�retreat, suggesting that rivals�bankruptcy
can be a factor that spurs LCC expansion.
Figure 22: Domestic Market Share of Southwest and LCC, 1984-2005 (Source: Borenstein and Rose (2007)
"How Airline Markets Work. . . Or Do They" Figure 7)
Figure 23 shows the quarterly route capacity change by carrier group, as compared to the �rst quarter
of 1998, on quarterly 1000 most travelled routes. There is a clear pattern of decline in legacy airlines�
capacity and rise in LCCs�capacity in 2000�s. The correlation of the quarterly changes between legacy
airlines and LCCs is about -0.8. The highly negative correlation between legacy and low cost airlines
shows the possibility that at least part of legacy airlines�capacity is being replaced by low cost airlines.
Figure 23: % Capacity Change by Carrier Group on Quarterly 1000 Most Popular Routes (base: 98q1)
50
The reverse causality is plausible: competitive pressures from LCC expansion pushes legacy carriers
to �le for bankruptcy. However, we try to control for the pre-existing trend of LCC expansion, if any, by
adding carrier-speci�c time trends. Even after removing the systematic growth trend of each carrier, LCCs
show the pattern of replacing bankrupt airlines�capacity. That is, whatever the reason for the bankruptcy
is, bankruptcy seemed to prompt LCC rivals�expansion even further as LCCs take the openings from
bankrupt airlines�capacity cut upon imminent danger of liquidation as an opportunity to expand. Then
how large is this e¤ect? That is, how large is the fraction of LCC growth from rivals�bankruptcies?
Here we want to quantify the fraction of LCC growth spurred by rivals�bankruptcies. We will restrict
out attention to the growth achieved during rivals� bankruptcies in particular. This will be called as
"bankruptcy e¤ect" in this paper. Based on the estimation results from Model C1-Model C3, we can
calculate the fraction as we take the following steps.
First, we want to focus on the capacity change for LCCs during rivals�bankruptcies. So the changes
in pre- and post- bankruptcy periods will not be included to quantify the fraction of LCC growth spurred
by rivals� bankruptcies. That is, the bankruptcy e¤ect we will estimate includes the change in the
periods in rival�s bankruptcy or after bankrupt rival�s exit (Kduring � fTB, TB + 1, TB + 2~TRE , TEX ,TEX +1, TEX +2~g). We begin with calculating counterfactual capacity level of each LCC absent rivals�bankruptcies. We use the estimates from the regression on capacity with the main route sample. In
particular, the estimated coe¢ cients on LCCs during rivals�bankruptcies will be used (see Figures 6 and
7). For each combination of a LCC i, route r, and time t, the counterfactual capacity level of the LCC
absent rivals�bankruptcies at that time ( ^Capacityi;r;t) can be calculated from:
^Capacityi;r;t =1
1 +Pk2K1[K2(
d�%lgk;r;t +d�%othk;r;t) � Capacityi;r;twhere d�%lgk;r;t � b lcck Bshr[k]lgrt, d�%othk;r;t � b�lcck Bshr[k]othrt , Capacityi;r;t is the actual capacity of LCC i
on route r at time t, and K1, K2 are the same as de�ned earlier. The total bankruptcy e¤ect until time
t is then easily calculated by taking the di¤erence between actual and counterfactual capacity level:
Capacityi;r;t � ^Capacityi;r;t =Pk2K1[K2(
d�%lgk;r;t +d�%othk;r;t)1 +
Pk2K1[K2(
d�%lgk;r;t +d�%othk;r;t) � Capacityi;r;tCalculating the fraction of growth occurred during rivals�bankruptcies takes a few more steps. As
mentioned before, the bankruptcy e¤ect of inducing LCC expansion on each route will come either from
bankrupt airlines�capacity reduction while staying on route or from those airlines�exit from route. Thus,
we need to identify the �nal period of each bankruptcy b on route r (� T (b; r)):
T (b; r) =Maxft s.t. k(t) 2 Kduringg
where k(t) is the function that maps from calendar date to event period from pre-bankruptcy to
post-bankruptcy. If bankruptcy ended during the data period, which is almost always the case, the �nal
51

period will fall into either [TB + 2~TRE ] or [TEX + 2~]. Then the bankruptcy e¤ect accumulated from
pre-bankruptcy periods (� Blg for legacy bankruptcies and Both for other bankruptcies) can be calculatedfrom summing the individual LCC growth induced until the end of rival�s bankruptcy on a route over all
LCCs (i), routes (r), and bankruptcies (b):
Blg =Xb
Xr
Xi
d�%lgk(T );r;T � ^Capacityi;r;T
Both �Xb
Xr
Xi
d�%othk(T );r;T � ^Capacityi;r;T
where T = T (b; r) and k(T ) is the event period at t = T (which is either [TB + 2~TRE ] or [TEX + 2~]
in most cases). Next step is to take out the changes in pre-bankruptcy periods to capture the rivals�-
bankruptcy-motivated LCC growth occurred during rivals�bankruptcies:
�Capacitylg = Blg �Xb
Xr
Xi
d�%lgk(TB(b)�1);r;TB(b)�1 � ^Capacityi;r;TB(b)�1
�Capacityoth = Both �Xb
Xr
Xi
d�%othk(TB(b)�1);r;TB(b)�1 � ^Capacityi;r;TB(b)�1
where TB(b) is the quarter of �ling for bankruptcy b (so TB(b) � 1 is the last period prior to actualbankruptcy �ling of bankruptcy event b). Finally, the fraction of LCC growth during the data time periods
spurred by rivals�bankruptcy then can be calculated by dividing the estimated bankruptcy e¤ects by the
actual LCC growth during the same period:
Fractionlg =�CapacitylgP2008Q2
t=1998Q1
Pr
Pi(Capacityi;r;t � Capacityi;r;t�1)
Fractionlg =�CapacityothP2008Q2
t=1998Q1
Pr
Pi(Capacityi;r;t � Capacityi;r;t�1)
Sum of the two fractions can be interpreted as the bankruptcy e¤ect from all rival bankruptcies. Table
6 shows the estimated bankruptcy e¤ects. The estimated fraction of LCC growth explained by responses
to rivals�bankruptcy ranged from 13 to 18% depending on which model to use. If we disentangle the e¤ect
into legacy bankruptcies and other bankruptcies, most of the LCC growth during rivals�bankruptcies are
from legacy bankruptcies. In particular, the fraction explained by legacy rivals�bankruptcies is ranged
from 15.5 to 16.9%. We can see that the fraction is signi�cant, suggesting that entry barrier is not
negligible in the airline industry.
52

Table 6. Fraction of LCC Growth from Rivals�Bankruptcy
Bankruptcy Model C1 Model C2 Model C3
(98q1 - 08q2) (98q1 - 08q2) (98q1 - 07q4, MSA only)
Legacy 16.88% 11.26% 11.10%
Other 1.18% 1.48% -2.40%
Total 18.06% 12.74% 8.70%
Model C1 : Basic (Yr-Qtr speci�c time e¤ects, LCCin, SWin)
Model C2 : Model C1+ Carrier-speci�c time trends, Carrier-group-speci�c Yr-Qtr e¤ects
Model C3 : Model C2 + Local economic conditions
8 Conclusion
The paper investigates two separate but related questions on airline bankruptcies. First, we ask whether
bankrupt airlines harm rivals by engaging in aggressive pricing and contributing to overcapacity problem.
We found little evidence supporting that bankruptcy protection harms the e¢ cient rivals and the industry
since bankrupt airlines underprice other competing against them and they are holding on to capacity that
would otherwise have been liquidated. Bankrupt airlines cut fares but also cut capacity, non-bankrupt
rivals cut fares a little but expand capacity, and LCCs among non-bankrupt rivals do not cut fare and
increase capacity. So e¢ cient airlines with lower cost are not negatively a¤ected by bankrupt airlines�
pricing and increase their presence. They replace the bankrupt airlines�ine¢ cient capacity and possibly
improve industry e¢ ciency. So bankruptcy protection does not harm the industry in the sense that
bankrupt airlines do not harm industry pro�tability and �nancial health of e¢ cient rivals. However, if
the bankrupt airlines were liquidated immediately and LCCs can expand at low cost, then the e¢ cient
carriers�growth might have been bigger. In this sense, the rational for Chapter 11 will depend on the
capability of bankrupt airlines to cut costs down to the level comparable to LCCs.
The second question is naturally followed from the answer to the �rst question. The main lesson from
the �rst question is that LCCs are growing at the expense of rivals� bankruptcies, especially those of
legacy carriers. This pattern suggests the existence of entry barriers that have limited LCC growth. The
immediate and substantial capacity reduction that bankrupt airlines are forced to take will present new
opportunities for e¢ cient airlines to expand. Section 7 quanti�ed the fraction of LCC growth spurred by
rivals�bankruptcies. The estimated fraction ranged from 13 to 18% and moreover most of the growth has
been achieved during legacy rivals�bankruptcies. As we �nd LCCs expand at the expense of bankrupt
legacy airlines, the competitive pressure will rise. If bankrupt airlines reemerge as a nimbler and stronger
competitor with lower cost structure, they will add more competitive pressure. So it is natural to expect
more competition after, rather than during,.bankruptcies, which is shown in the results from fare analysis.
The results are interesting in two areas of research. First, the �rst part of the paper not only examines
the potential harm of Chapter 11 but also gives us a lesson on the link between �nancial conditions and
53

market competition in the process. Second, the �nding of pattern of LCCs replacing bankrupt, incumbent,
legacy airlines contributes to the literatures on entry barrier, persistence of market structure, and �rm
growth.
While the paper suggests no special harm of bankruptcy protection on e¢ cient rivals, we need more
caution when it comes to drawing policy implications. We are not comparing the actuals directly with
the counterfacutals when Chapter 11 option is not available and every bankrupt airline were to have been
liquidated immediately. We are comparing the actuals with the counterfactuals when these bankrupt
airlines were operating as in normal times and thereby draws implications about the existence of the
airlines operating under protection is harmful to rivals and the industry. So, if the elimination of Chapter
11 changes �rms�behavior somehow even when they are not under �nancial distress, the paper does not
provide an answer to the question of in what direction the e¤ect would go.
References
Aghion, Philippe and Patrick Bolton. 1987. "Contracts as a Barrier to Entry", American Economic
Review, 77(3): 388-401.
Ben-Yosef, Eldad. 2005. "The Evolution of the US Airline Industry. Theory, Strategy, and Policy",
XXX
Borenstein, Severin. 1989. �Hubs and High Fares: Dominance and Market Power in the US Airline
Industry�, RAND Journal of Economics, 20: 344-365.
Borenstein, Severin and Joseph Farrell. 1998. "Competition and Productive E¢ ciency", Working
Paper. University of California, Berkeley.
Borenstein, Severin and Nancy L. Rose. 1995. �Bankruptcy and Pricing in U.S. Airline Markets�,
American Economic Review, 85(2): 397-402.
_____. 2003. "Do Airline Bankruptcies Reduce Service?", NBER Working Paper 9636.
Busse, Meghan. 2002. "Firm Financial Condition and Airline Price Wars", RAND Journal of Eco-
nomics, 33(2): 298-318.
Chevalier, Judith. 1995. � Capital Structure and Product Market Competition: Empirical Evidence
from the Supermarket Industry�, American Economic Review, 85(3): 415-435.
Ciliberto, Federico and Carola Schenone. 2008. "Bankruptcy and Product-Market Competition:
Evidence from the Airline Industry", Working Paper. University of Virginia.
54

Farrell, Joseph and Carl Shapiro. 1990. �Horizontal Mergers: An Equilibrium Analysis�, American
Economic Review 80(1): 107-126.
_____ and Paul Klemperer. 2004. "Coordination and Lock-In: Competition with Switching Costs
and Network E¤ects", in Michael Armstrong and Robert Porter, eds., Hanbook of Industrial Organization,
Vol. 3, Amsterdam: North-Holland.
Goolsbee, Austan and Chad Syverson. 2004. "How Do Incumbents Respond to the Threat of Entry
on Their Networks? Evidence from the Major Airlines", Working Paper #04-04. University of Chicago
& Networks, Electronic Commerce, and Telecommunications Institute. XXX
Greenstone, Michael, Richard Hornbeck, and Enrico Moretti. 2008. �Identifying Agglomeration
Spillovers: Evidence from Million Dollar Plants�, NBER Working Paper 13833.
Hendel, Igal. 1996. "Competition Under Financial Distress", Journal of Industrial Economics, 44(3):
309-324.
Hofer, Christian, Martin E. Dresner b, and Robert J. Windle. "The Impact of Airline Financial
Distress on US Air Fares: A Contingency Approach", Transportation Research Part E XXX
Imbens, Guido W. and Je¤erey M. Wooldridge. 2009. "Recent Developments in the Econometrics of
Program Evaluation", Journal of Economic Literature, 47(1): 5-86.
Ito, Harumi and Darin Lee. 2003. "Low Cost Carrier Growth in the U.S. Airline Industry: Past,
Present, and Future", Working Paper No. 2003-12. Brown University.
Jacobson, Louis S., Robert J. LanLonde, and Daniel G. Sullivan. 1993. "Earnings Losses of Displaced
Workers", American Economic Review, 83(4): 685-709.
Kennedy, Robert E. 2000. �The E¤ect of Bankruptcy Filings on Rivals� Operating Performance:
Evidence from 51 Large Bankruptcies�, International Journal of the Economics of Business, 7(1): 5-26.
Lederman, Mara. 2008. "Are Frequent-Flyer Programs a Cause of the �Hub Premium�?", Journal of
Economics & Management Strategy, 17(1): 35�66
McCrary, Justin. 2007. "The E¤ect of Court-Ordered Hiring Quotas on the Composition and Quality
of Police", American Economic Review, 97(1): 318-353.
Morrison, Steven A. and Cli¤ord Winston. 1995. "The Evolution of the Airline Industry", The
Brookings Institution, Washington, DC
Rosenbaum, P.R. and Rubin D.B. 1983. �The Central Role of the Propensity Score in Observational
Studies for Causal E¤ects�, Biometrika, 70: 41-55.
Shleifer, Andrei and Robert W. Vishny. 1992. "Liquidation Values and Debt Capacity: A Market
Equilibrium Approach", Journal of Finance, 47(4): 1343-1366.
55

Staiger Robert W. and Frank A. Wolak. 1992. "Collusive Pricing with Capacity Constraints in the
Presence of Demand Uncertainty", RAND Journal of Economics, 23(2): 203-220.
United States General Accounting O¢ ce. 2004. "Commercial Aviation: Legacy Airlines Must Further
Reduce Costs to Restore Pro�tability", GAO-04-836.
_____ 2005. "Commercial Aviation: Bankruptcy and Pension Problems Are Symptoms of Under-
lying Structural Issues", GAO-05-945.
Verbeek, Marno and Theo Nijman. 1992. "Testing for Selectivity Bias in Panel Data Models",
International Economic Review, 33(3): 681-703.
Wolfers, Justin. 2006. "Did Unilateral Divorce Laws Raise Divorce Rates? A Reconciliation and New
Results", American Economic Review, 96(5): 1802-1820.
Wooldridge Je¤rey M. 2001. "Econometric Analysis of Cross Section and Panel Data", MIT Press.
Cambridge, MA.
56