1 1 june, 2014. aeromexico: mexico’s premium revenue carrier business loungesbusiness class...
TRANSCRIPT

11
June, 2014
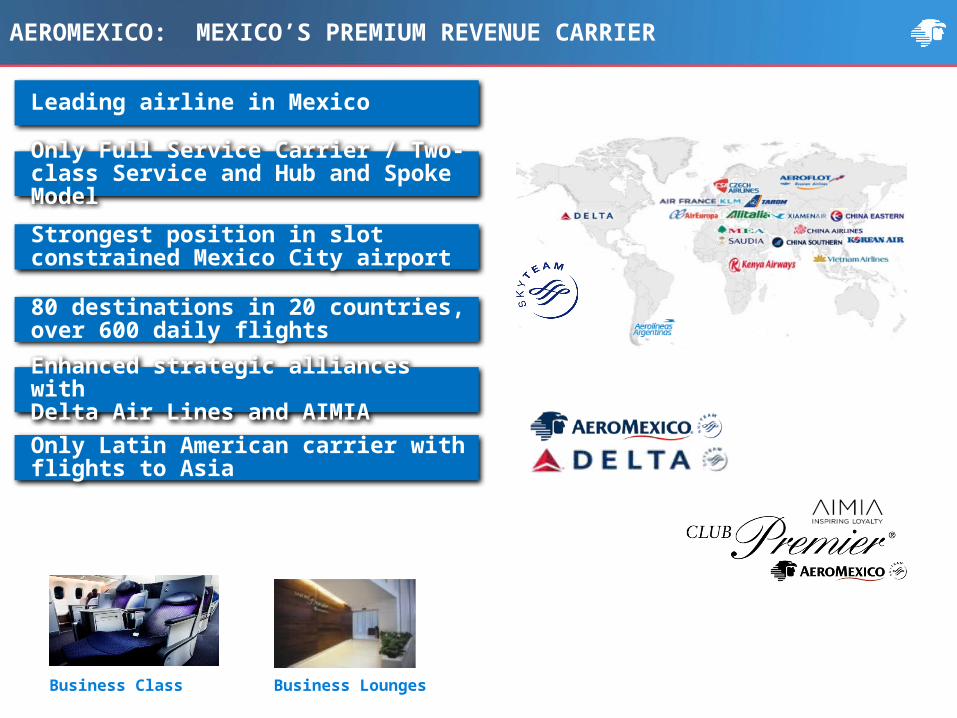
AEROMEXICO: MEXICO’S PREMIUM REVENUE CARRIER
Business LoungesBusiness Class
Leading airline in Mexico
Only Full Service Carrier / Two-class Service and Hub and Spoke Model
Enhanced strategic alliances with Delta Air Lines and AIMIA
Strongest position in slot constrained Mexico City airport
80 destinations in 20 countries, over 600 daily flights
Only Latin American carrier with flights to Asia
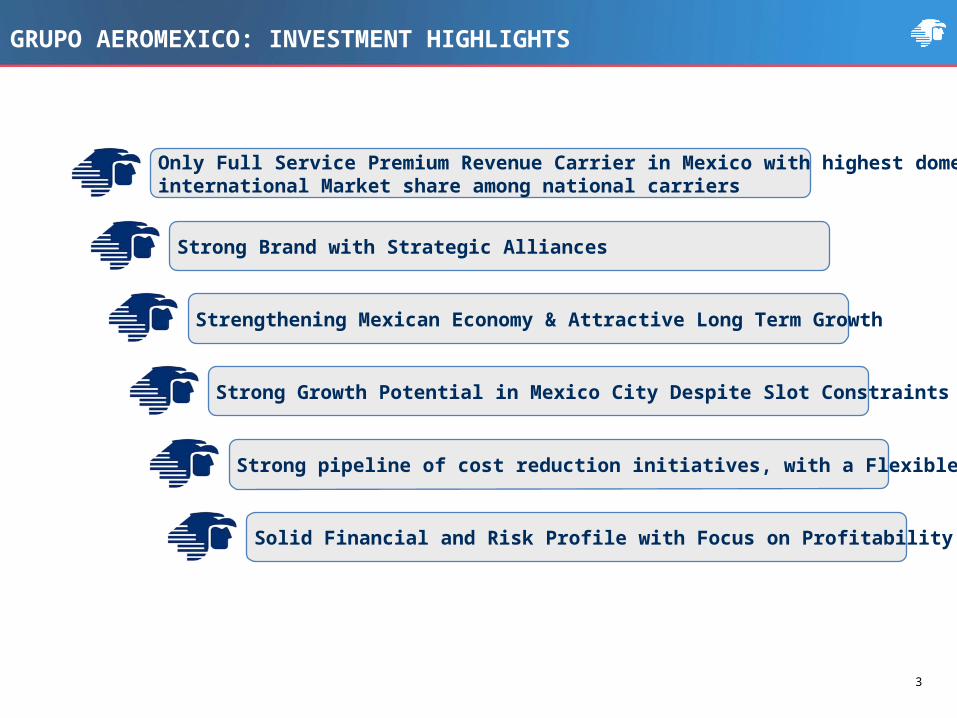
GRUPO AEROMEXICO: INVESTMENT HIGHLIGHTS
3
Strengthening Mexican Economy & Attractive Long Term Growth
Strong Brand with Strategic Alliances
Strong pipeline of cost reduction initiatives, with a Flexible and Modern Fleet
Solid Financial and Risk Profile with Focus on Profitability
Only Full Service Premium Revenue Carrier in Mexico with highest domestic and international Market share among national carriers
Strong Growth Potential in Mexico City Despite Slot Constraints

STRENGTHENING MEXICAN ECONOMY
Growth Opportunities for Mexican Economy(1) Air Traffic Penetration
Mexico China Brazil Europe US
0.6 0.60.8
1.4
2.4
Flights Per Capita for Middle & Upper Class Population (>$15K)+0.8%-1.7% GDP growth
2014 2017 2018 2019
6.0%
2015 2016E E E E E E
5.0%
4.0%
3.0%
2.0%
1.0%
Millions
(1) Boeing Current Market Outlook as of June 2013.Source: : CONAPO, INEGI, SHCP, Criterios generales de Política Económica 2014. IMF World Economic Outlook – October 2012; Company filings.
2010 2025E
0%
20%
40%
60%
80%
100%
26% 20%
35%
25%
17%30%
14% 17%
7% 8%
D/E D+ C C+ AB
Percent
Favorable Demographics
Growing Middle Class Favorable Demographic Trends
Middle Class
6 4 2 0 2 4 6
0-4
10-14
20-24
30-34
40-44
50-54
60-64
70-74
80-84
90-95
6 4 2 0 2 4 6
0-4
10-14
20-24
30-34
40-44
50-54
60-64
70-74
80-84
90-95
WomenMen
49mm 70 mm
(2010 – Demographics in Million) (2050 – Demographics in Million)
4

OUR FLIGHT PLAN
PRODUCTIVITY & COST CONTROL
STRATEGIC PARTNERSHIPS
OPERATIONALEXCELLENCE
COMMERCIALVALUE CREATION
PROFITABLE AND SUSTAINABLE GROWTH
Uniquely Positioned to Deliver Profitable and Sustainable Growth5
FINANCIAL STRENGTH AND RISK PROFILE
99.9% 99.7% 99.6% 99.6% 99.5% 99.3% 99.0% 99.0% 99.0% 98.2%
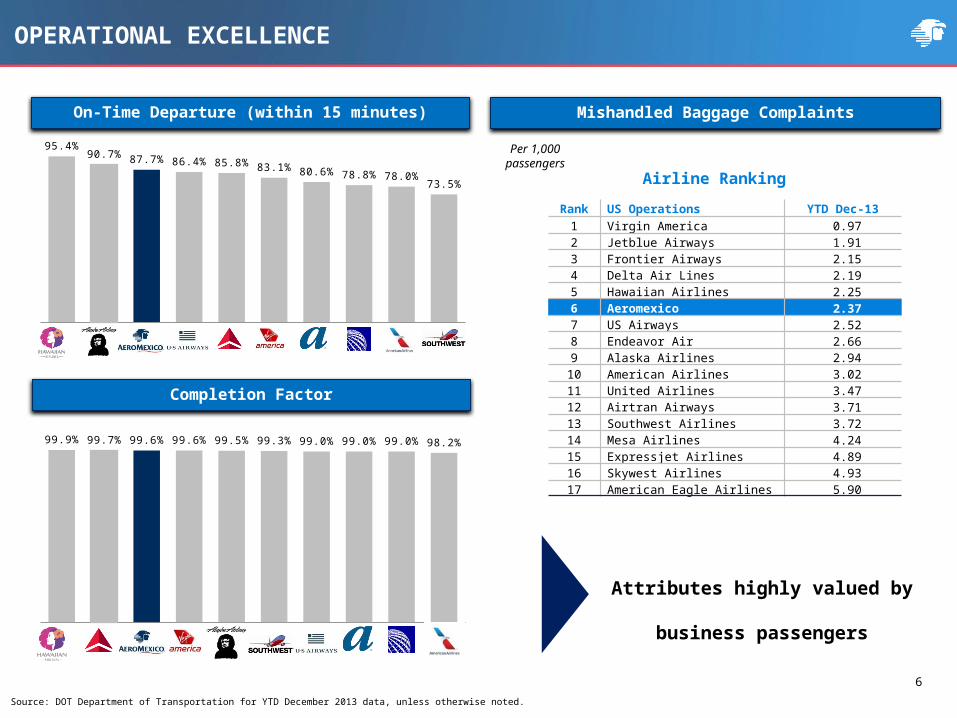
OPERATIONAL EXCELLENCE
On-Time Departure (within 15 minutes)
Source: DOT Department of Transportation for YTD December 2013 data, unless otherwise noted.
Airline Ranking
Mishandled Baggage Complaints
Completion Factor
95.4%90.7% 87.7% 86.4% 85.8% 83.1% 80.6% 78.8% 78.0%
73.5%
Per 1,000 passengers
Rank US Operations YTD Dec-131 Virgin America 0.972 Jetblue Airways 1.913 Frontier Airways 2.154 Delta Air Lines 2.195 Hawaiian Airlines 2.256 Aeromexico 2.377 US Airways 2.528 Endeavor Air 2.669 Alaska Airlines 2.94
10 American Airlines 3.0211 United Airlines 3.4712 Airtran Airways 3.7113 Southwest Airlines 3.7214 Mesa Airlines 4.2415 Expressjet Airlines 4.8916 Skywest Airlines 4.9317 American Eagle Airlines 5.90
Attributes highly valued by business passengers
6
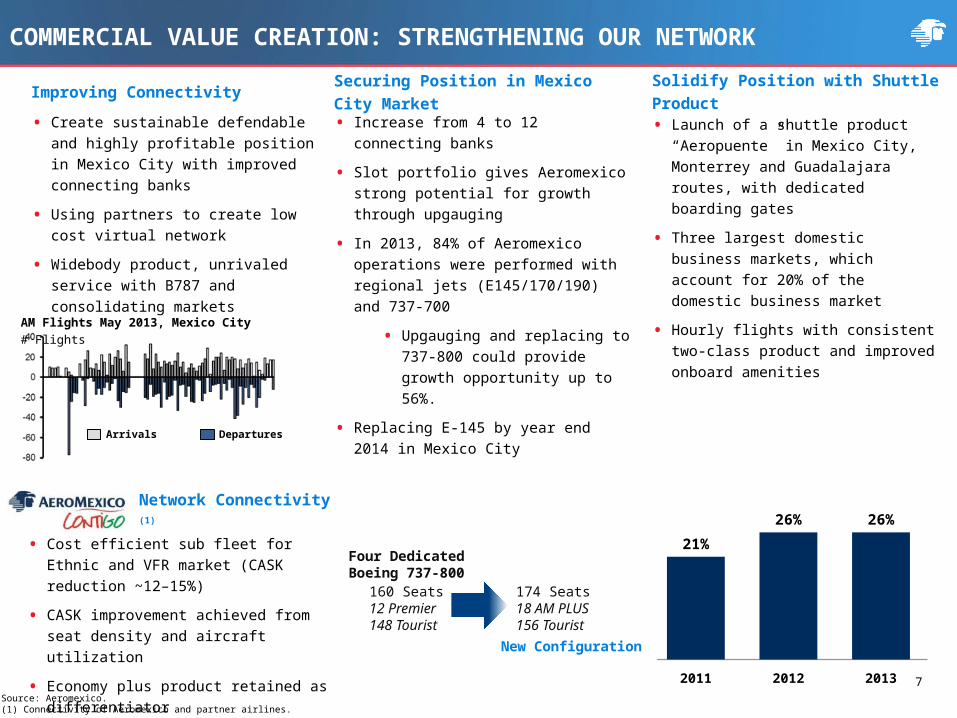
Source: Aeromexico.(1) Connectivity of Aeromexico and partner airlines.
2010 2011 2012 2013
21% 21%
26% 26%
• Create sustainable defendable and highly profitable position in Mexico City with improved connecting banks
• Using partners to create low cost virtual network
• Widebody product, unrivaled service with B787 and consolidating markets
COMMERCIAL VALUE CREATION: STRENGTHENING OUR NETWORK
Network Connectivity (1)
Improving Connectivity Securing Position in Mexico City Market Solidify Position with Shuttle Product
• Increase from 4 to 12 connecting banks
• Slot portfolio gives Aeromexico strong potential for growth through upgauging
• In 2013, 84% of Aeromexico operations were performed with regional jets (E145/170/190) and 737-700
• Upgauging and replacing to 737-800 could provide growth opportunity up to 56%.
• Replacing E-145 by year end 2014 in Mexico City
• Launch of a shuttle product “Aeropuente” in Mexico City, Monterrey and Guadalajara routes, with dedicated boarding gates
• Three largest domestic business markets, which account for 20% of the domestic business market
• Hourly flights with consistent two-class product and improved onboard amenities
7
• Cost efficient sub fleet for Ethnic and VFR market (CASK reduction ~12–15%)
• CASK improvement achieved from seat density and aircraft utilization
• Economy plus product retained as differentiator
160 Seats12 Premier148 Tourist
Four DedicatedBoeing 737-800
174 Seats18 AM PLUS156 Tourist
New Configuration
Arrivals Departures
AM Flights May 2013, Mexico City# Flights
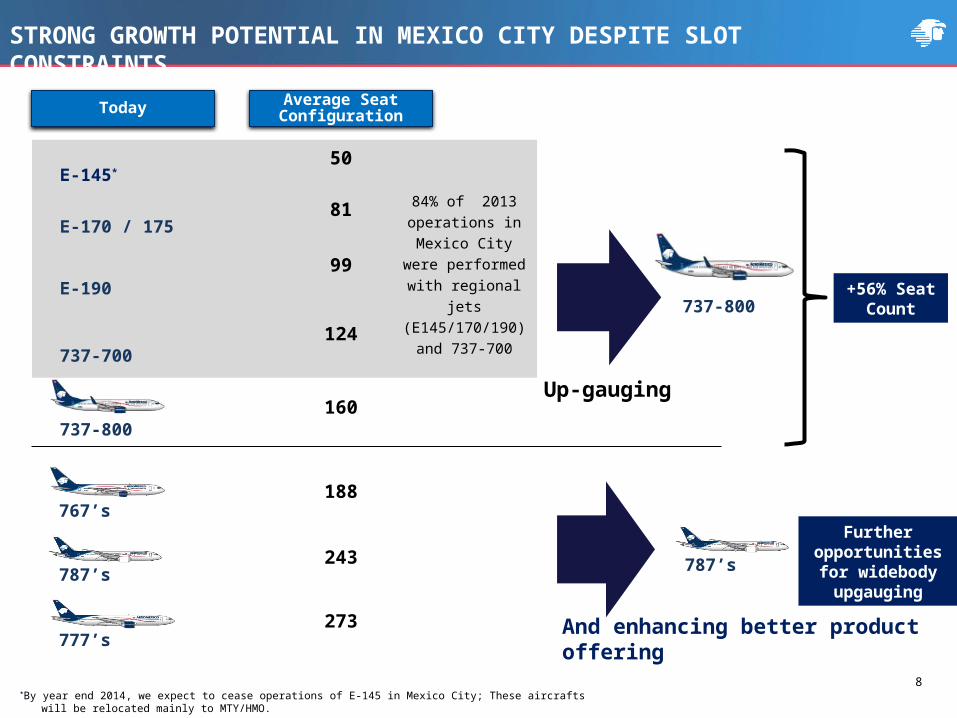
STRONG GROWTH POTENTIAL IN MEXICO CITY DESPITE SLOT CONSTRAINTS
Today Average Seat Configuration
767’s
777’s
787’s
E-145*
E-170 / 175
737-700
737-800
E-190
50
81
99
124
160
188
243
273
737-800+56% Seat
Count
Up-gauging
Further opportunities for
widebody upgauging
787’s
8
*By year end 2014, we expect to cease operations of E-145 in Mexico City; These aircrafts will be relocated mainly to MTY/HMO.
And enhancing better product offering
84% of 2013 operations in Mexico City were performed
with regional jets (E145/170/190) and
737-700
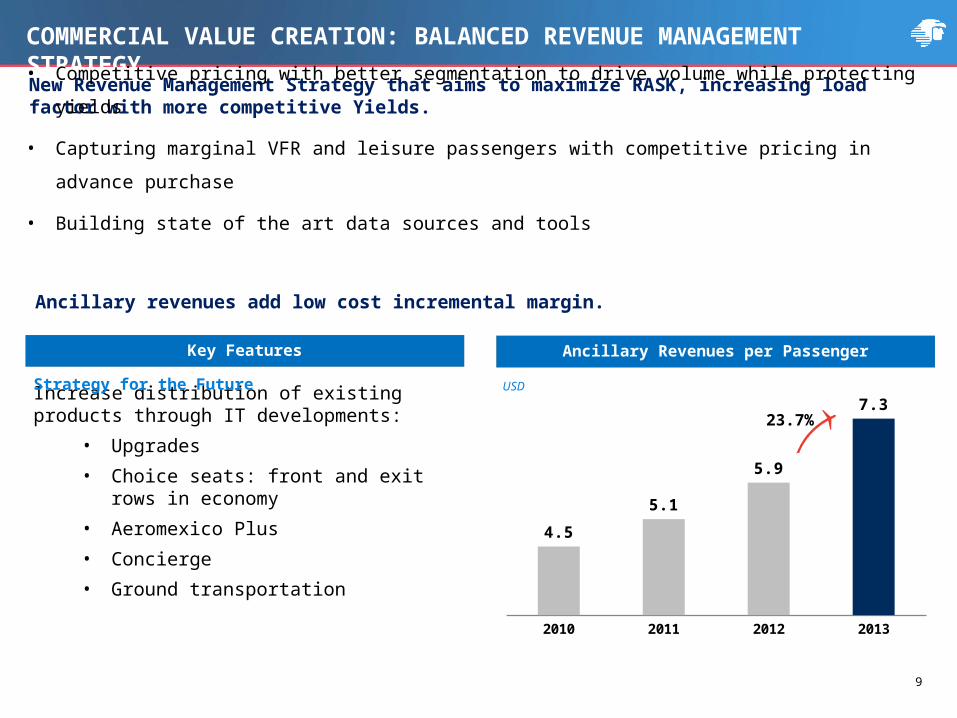
2010 2011 2012 2013
4.5
5.1
5.9
7.3
Ancillary revenues add low cost incremental margin.
USD
Key Features Ancillary Revenues per Passenger
Increase distribution of existing products through IT developments:
• Upgrades
• Choice seats: front and exit rows in economy
• Aeromexico Plus
• Concierge
• Ground transportation
Strategy for the Future
9
COMMERCIAL VALUE CREATION: BALANCED REVENUE MANAGEMENT STRATEGY
New Revenue Management Strategy that aims to maximize RASK, increasing load factor with more competitive Yields.
• Competitive pricing with better segmentation to drive volume while protecting yields
• Capturing marginal VFR and leisure passengers with competitive pricing in advance purchase
• Building state of the art data sources and tools
23.7%
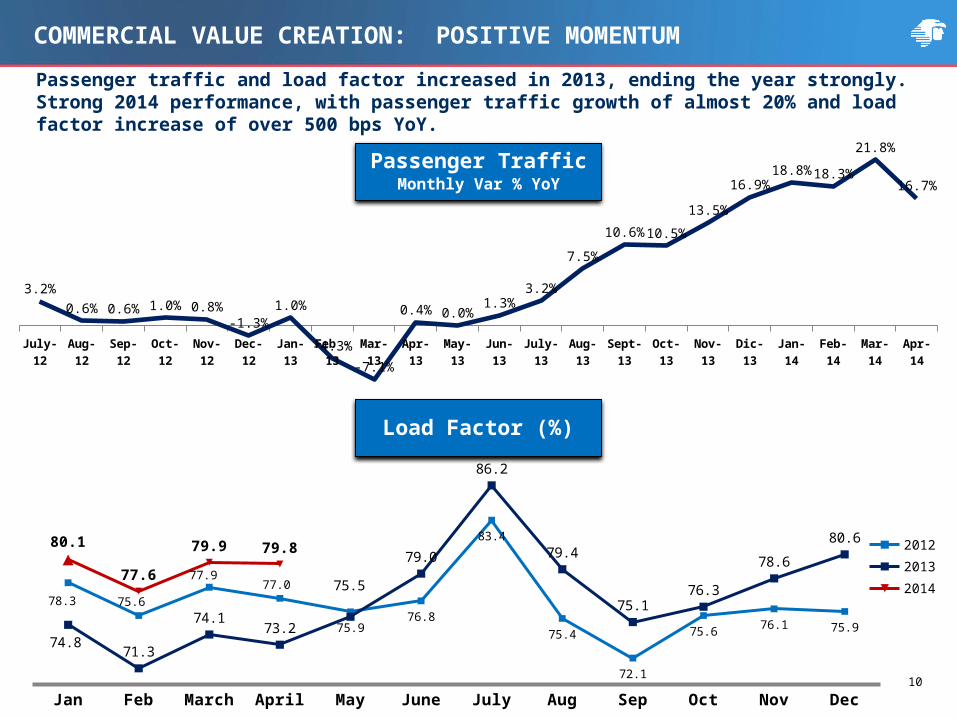
Passenger TrafficMonthly Var % YoY
Load Factor (%)
10
COMMERCIAL VALUE CREATION: POSITIVE MOMENTUM
Passenger traffic and load factor increased in 2013, ending the year strongly. Strong 2014 performance, with passenger traffic growth of almost 20% and load factor increase of over 500 bps YoY.
July-12 Aug-12 Sep-12 Oct-12 Nov-12 Dec-12 Jan-13 Feb -13 Mar-13 Apr-13 May-13 Jun-13 July-13 Aug-13 Sept-13 Oct-13 Nov-13 Dic-13 Jan-14 Feb-14 Mar-14 Apr-14
3.2%0.6% 0.6% 1.0% 0.8%
-1.3%1.0%
-4.3%
-7.1%
0.4% 0.0%1.3%
3.2%
7.5%
10.6% 10.5%
13.5%
16.9%18.8% 18.3%
21.8%
16.7%
Jan Feb March April May June July Aug Sep Oct Nov Dec
78.3 75.6
77.977.0
75.976.8
83.4
75.4
72.1
75.6 76.1 75.974.8
71.3
74.173.2
75.5
79.0
86.2
79.4
75.176.3
78.6
80.680.1
77.6
79.9 79.8 201220132014
11
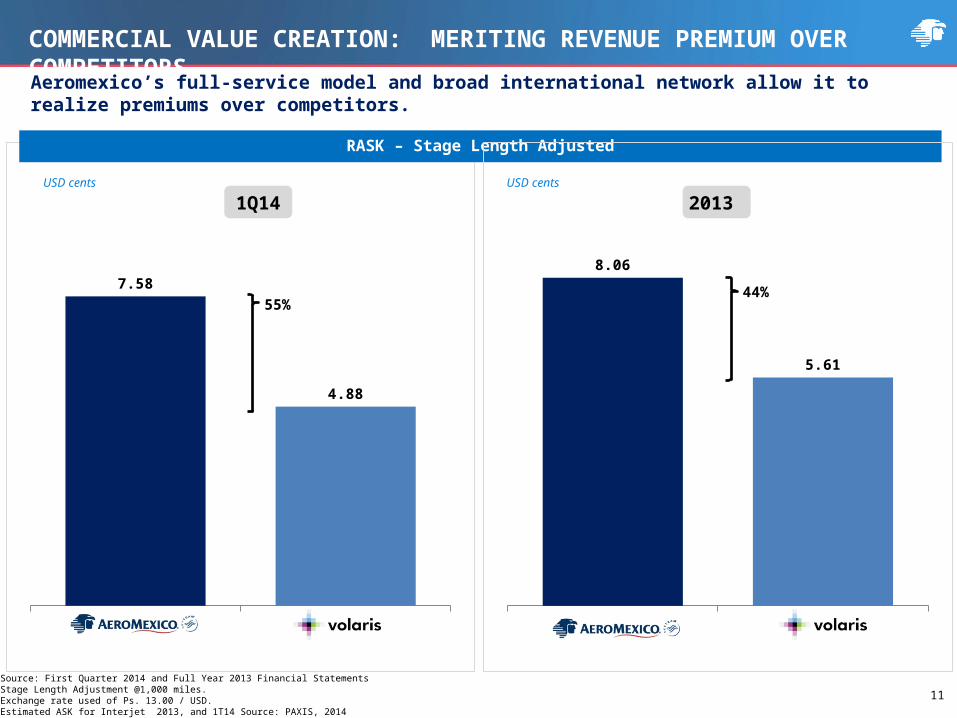
Aeroméxico Volaris
7.58
4.88
55%
COMMERCIAL VALUE CREATION: MERITING REVENUE PREMIUM OVER COMPETITORS
RASK – Stage Length Adjusted
USD cents
Aeromexico’s full-service model and broad international network allow it to realize premiums over competitors.
1Q14USD cents
Aeroméxico Volaris
8.06
5.61
44%
2013
Source: First Quarter 2014 and Full Year 2013 Financial StatementsStage Length Adjustment @1,000 miles. Exchange rate used of Ps. 13.00 / USD.Estimated ASK for Interjet 2013, and 1T14 Source: PAXIS, 2014
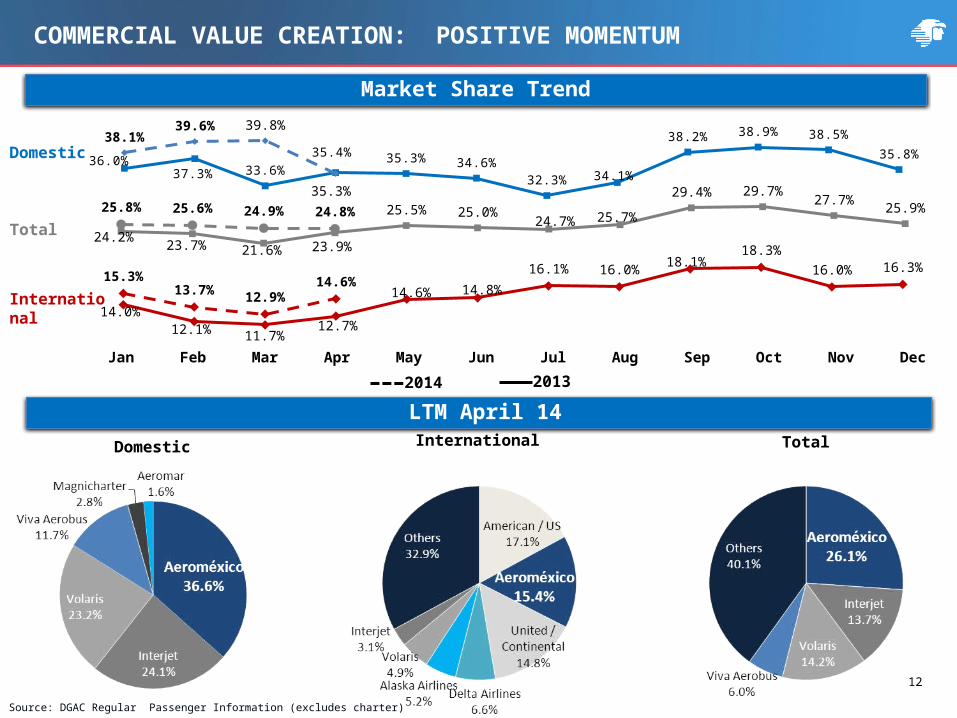
24.2%23.7% 21.6% 23.9%
25.5% 25.0% 24.7% 25.7%
29.4% 29.7%27.7% 25.9%25.8% 25.6% 24.9% 24.8%
36.0%37.3% 33.6%
35.4%35.3% 34.6%
32.3% 34.1%
38.2% 38.9% 38.5%
35.8%38.1%
39.6% 39.8%
35.3%
14.0%12.1% 11.7%
12.7%
14.6% 14.8%16.1% 16.0%
18.1%18.3%
16.0% 16.3%15.3%
13.7% 12.9%14.6%
International
Jan Feb Mar Apr May Jun Jul Aug Sep Oct Nov Dec
12
Market Share Trend
Domestic Total
LTM April 14
Source: DGAC Regular Passenger Information (excludes charter)
COMMERCIAL VALUE CREATION: POSITIVE MOMENTUM
Total
International
Domestic
2014 2013
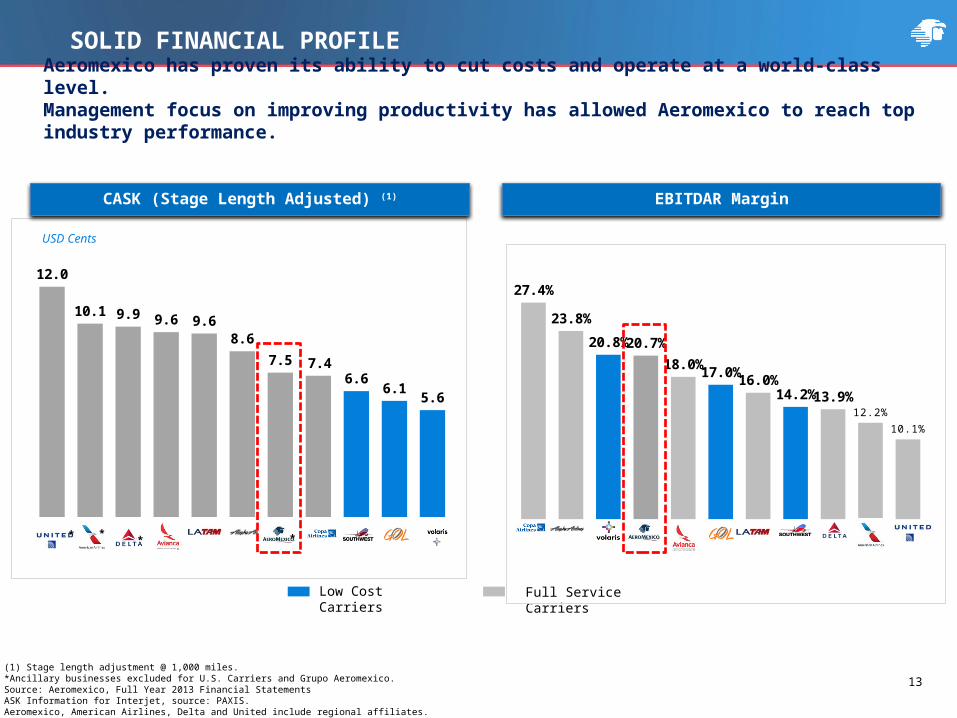
Aeromexico has proven its ability to cut costs and operate at a world-class level. Management focus on improving productivity has allowed Aeromexico to reach top industry performance.
12.0
10.1 9.9 9.6 9.68.6
7.5 7.46.6
6.15.6
SOLID FINANCIAL PROFILE
CASK (Stage Length Adjusted) (1)
USD Cents
Low Cost Carriers Full Service Carriers
EBITDAR Margin
27.4%
23.8%
20.8% 20.7%
18.0% 17.0% 16.0%14.2% 13.9%
12.2%
10.1%
13
** **
(1) Stage length adjustment @ 1,000 miles.*Ancillary businesses excluded for U.S. Carriers and Grupo Aeromexico.Source: Aeromexico, Full Year 2013 Financial StatementsASK Information for Interjet, source: PAXIS.Aeromexico, American Airlines, Delta and United include regional affiliates.

•New contracts with pilots, flight attendants and ground staff
•Restructuring and Integration of AM/AM Connect
•Maintenance Process Reengineering
•Increase fleet utilization
•ERP and Shared Services Centre
•Improving Distribution Costs
•Co-location in Airports
•Fleet Renewal
•Balance between Owned and Leased Aircrafts
•Unique Fleet Plan Flexibility
14
Strong pipeline of cost reduction initiatives.
Operational , Administrative & Sales Efficiencies Fleet StrategyLabor Costs
PRODUCTIVITY AND COST CONTROL INITIATIVES

Owned:(25%)USD 682mm
Leased:(75%)USD
$2.0bnSource: Aeromexico, Avitas Bluebook 2nd Half 2013.Aeromexico estimates as of 2013.(1) B767-2 and B787 data for: Mex-Mad. B737-7 and B737-8 / ERJ145,
ERJ190 and ERJ170 data for Mex-Mty.(2) Fleet proportion of leased vs. owned depends on fleet value.(3) On July 2013, Aeromexico announced the pricing of an offering of USD$117.4 million of 2.537% secured
notes guaranteed by the Export-Import Bank of the United States.
EJ170 & E190ERJ145 B737-8B737-7 B787B767
E145 E170 E190 B737-7 B737-8 B767 B787
100
84
77
100
86
100
81
(16%) (19%)
(9%)
(14%)
Estimated CASK Reduction (1)
Today 2018
E-145
E-170/175/190
737 – 700’s/800’sNG
767’s
787’s
777’s
E-170/190
737 – 800’sNG/MAX
787’s
Fleet Plan
Leased vs. Owned
Fleet Plan renewal provides CASK efficiencies, maintaining flexibility and reducing ownership cost.
PRODUCTIVITY AND COST CONTROL INITIATIVES: FLEET STRATEGY
Leased Owned
Annual Cost of Financing
4% to 6% (2)
10%-12%
USD $108M– USD $162Mcost savings due to ownership
Fleet Value: USD 2.7 billion(3)
Fleet Value
15
16
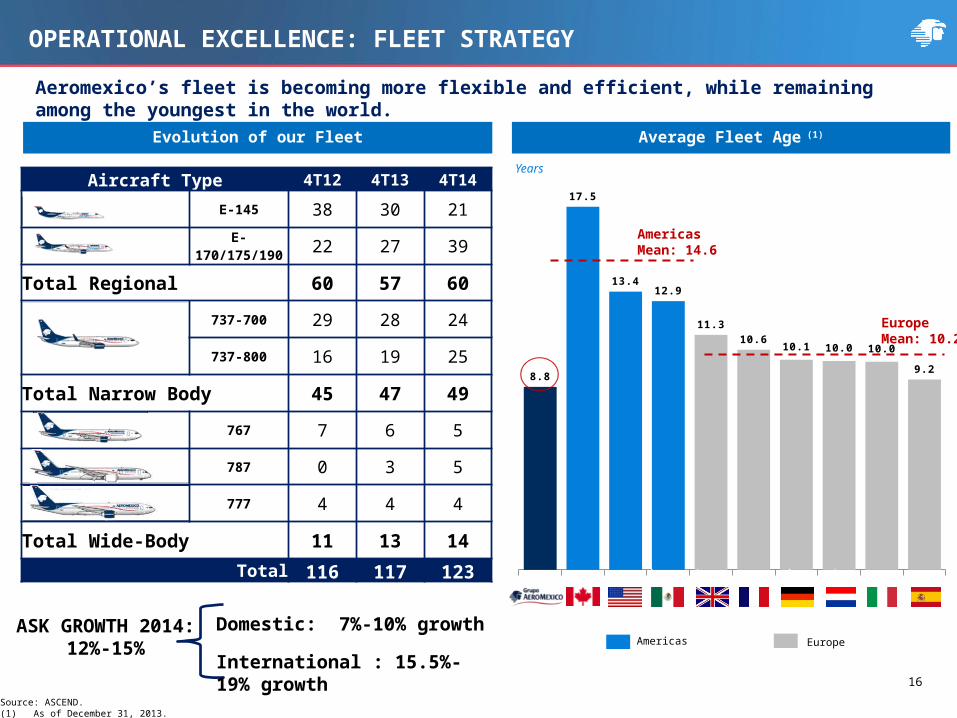
ASK GROWTH 2014:12%-15%
Domestic: 7%-10% growth
International : 15.5%-19% growth
Aircraft Type 4T12 4T13 4T14
E-145 38 30 21
E-170/175/190 22 27 39
Total Regional 60 57 60
737-700 29 28 24
737-800 16 19 25
Total Narrow Body 45 47 49
767 7 6 5
787 0 3 5
777 4 4 4
Total Wide-Body 11 13 14
Total 116 117 123
Average Fleet Age (1)
8.8
17.5
13.412.9
11.3
10.610.1 10.0 10.0
9.2
AmericasMean: 14.6
Europe Mean: 10.2
Years
Americas Europe
Aeromexico’s fleet is becoming more flexible and efficient, while remaining among the youngest in the world.
Source: ASCEND.(1) As of December 31, 2013.
Evolution of our Fleet
OPERATIONAL EXCELLENCE: FLEET STRATEGY
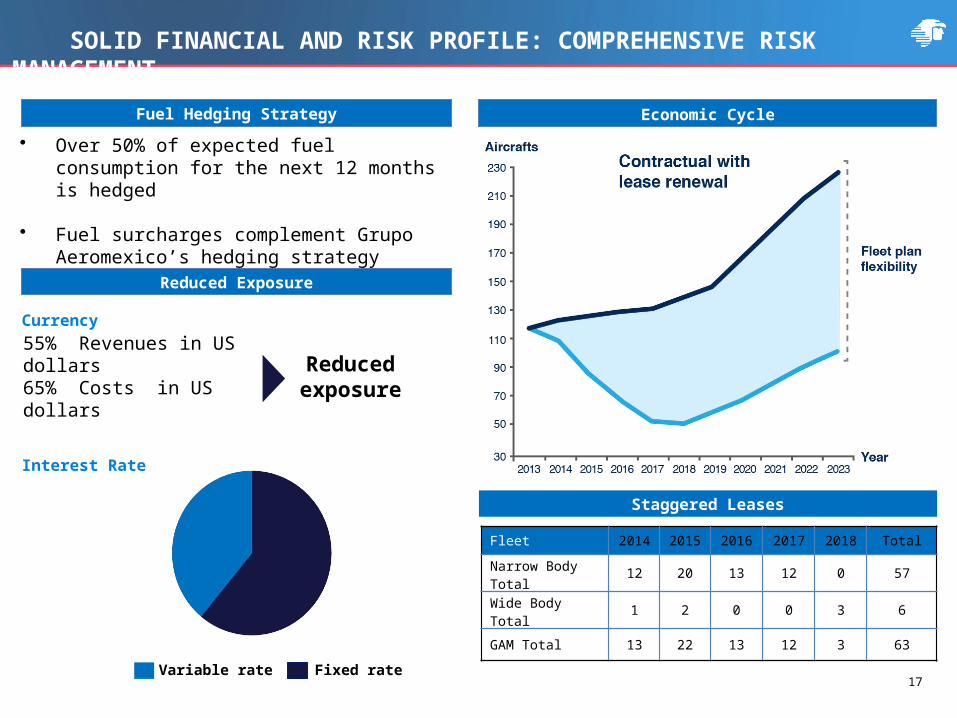
• Over 50% of expected fuel consumption for the next 12 months is hedged
• Fuel surcharges complement Grupo Aeromexico’s hedging strategy
Reduced Exposure
61% @ Fixed Rate
39%
55% Revenues in US dollars65% Costs in US dollars
Reduced exposure
61%
39%
Fuel Hedging Strategy
61% @ Fixed Rate
Fixed rate
58%
42%
Variable rate
Total
17
SOLID FINANCIAL AND RISK PROFILE: COMPREHENSIVE RISK MANAGEMENT
Economic Cycle
Staggered Leases
Fleet 2014 2015 2016 2017 2018 Total
Narrow Body Total 12 20 13 12 0 57
Wide Body Total 1 2 0 0 3 6
GAM Total 13 22 13 12 3 63
Currency
Interest Rate

18
2014 2015 2016 2017 2018+
36 36 37 35
228
43 26 41 63
129
SOLID FINANCIAL DEBT PROFILE
Debt Maturity Profile (1)
(1) Information as of March 2014(2) Last 12 months EBITDAR AS OF March 2014. Source: First Quarter 2014 Financial Statements, except GOL and Avianca (with latest available information of Full Year
2013)* Considers Adjusted EBITDAR
USD millions
11.7% 9.3% 11.5% 14.6% 52.9%
Benchmark Financial Net Debt / Adjusted EBITDAR (2)
Adjusted EBITDAR 2013: USD 622 M
Volaris GOL LATAM Avianca AeroMexico United American Delta Copa
6.5x5.8x 5.2x
4.2x 4.07x 3.6x 3.2x2.3x
0.9x
Low Cost Carriers Full Service Carriers
*
*
19Source: First Quarter 2014 and Full Year 2013 Financial Statements and Company Filings
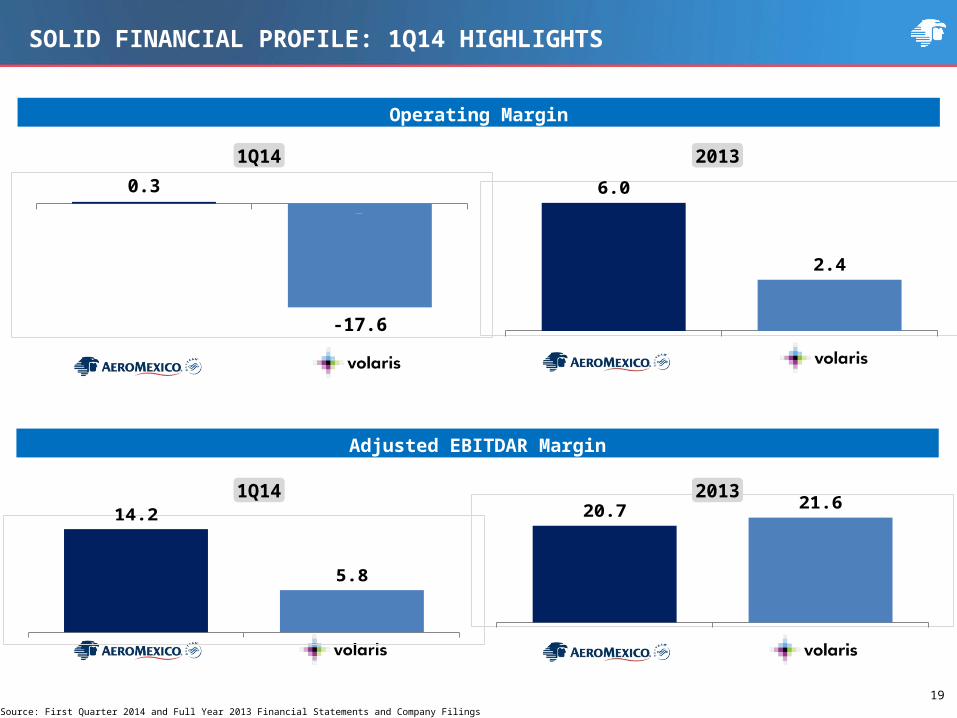
Operating Margin
1Q14 2013
A ero méxico V o laris
0.3
-17.6A ero méxico V o laris
6.0
2.4
Adjusted EBITDAR Margin
A ero méxico V o laris
14.2
5.8
A ero méxico V o laris
20.7 21.61Q14 2013
SOLID FINANCIAL PROFILE: 1Q14 HIGHLIGHTS
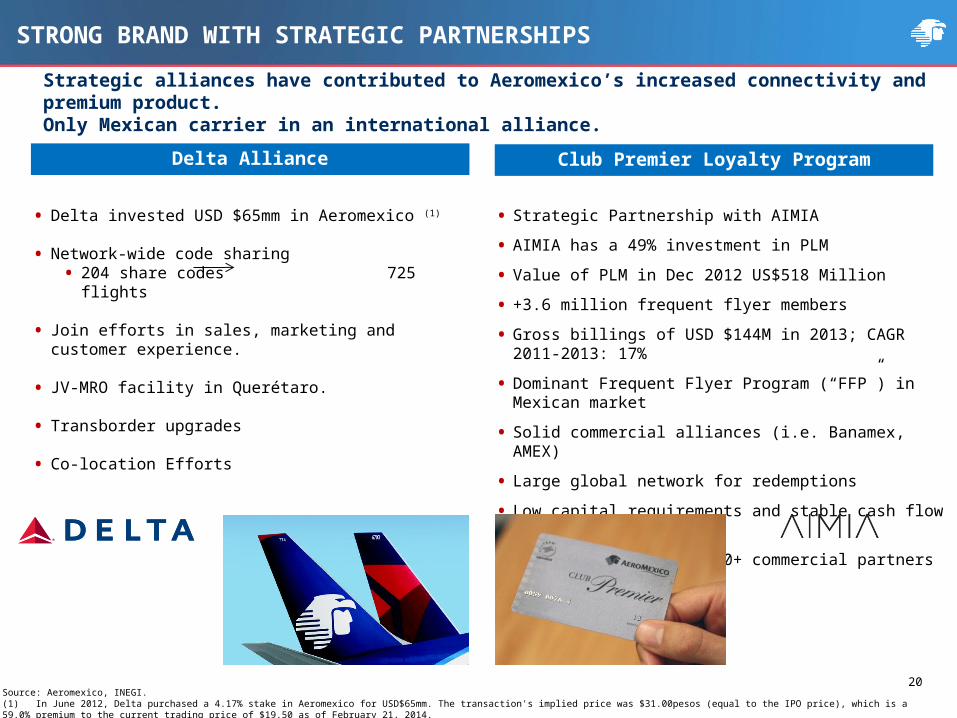
• Strategic Partnership with AIMIA
• AIMIA has a 49% investment in PLM
• Value of PLM in Dec 2012 US$518 Million
• +3.6 million frequent flyer members
• Gross billings of USD $144M in 2013; CAGR 2011-2013: 17%
• Dominant Frequent Flyer Program (“FFP”) in Mexican market
• Solid commercial alliances (i.e. Banamex, AMEX)
• Large global network for redemptions
• Low capital requirements and stable cash flow generation
• Earn kilometers with 90+ commercial partners
Source: Aeromexico, INEGI.(1) In June 2012, Delta purchased a 4.17% stake in Aeromexico for USD$65mm. The transaction's implied price was $31.00pesos (equal to the IPO price), which is a 59.0% premium to the current trading price of $19.50 as of February 21, 2014.
• Delta invested USD $65mm in Aeromexico (1)
• Network-wide code sharing• 204 share codes 725 flights
• Join efforts in sales, marketing and customer experience.
• JV-MRO facility in Querétaro.
• Transborder upgrades
• Co-location Efforts
Delta Alliance Club Premier Loyalty Program
STRONG BRAND WITH STRATEGIC PARTNERSHIPS
Strategic alliances have contributed to Aeromexico’s increased connectivity and premium product. Only Mexican carrier in an international alliance.
20

DISCLAIMER
This presentation is neither an offer for sale nor a request to buy any securities. Such offer or request may only be made through an offering memorandum containing the description of the terms and conditions of such offer and shall include detailed information of the company and its management, as well as the financial statements of Grupo Aeromexico, S.A. de C.V. (“Grupo Aeromexico”), in terms of the Securities Market Law (Ley del Mercado de Valores) (“LMV”) and the General provisions applicable to securities issuers and other securities market participants (Disposiciones de carácter general aplicables a las emisoras de valores y a otros participantes del mercado de valores) (the “Provisions”).
The information contained herein is confidential and shall not be reproduced in whole or in part or shared with third parties without the previous consent of Grupo Aeromexico.
This presentation contains information obtained from diverse sources and, despite it contains truthful information, no representation is hereby made by Grupo Aeromexico as to the accuracy, integrity and sufficiency of such information. Additionally, Grupo Aeromexico makes no representation in respect of the sufficiency or truthfulness of the assumptions, estimations, projections, hypothetical behavior analysis or in respect of other financial information included in the results of the financial models contained or used herein.
The results contained herein may substantially vary. Nothing herein shall be understood or construed as a representation or warranty as to future performance of the securities referred to herein.
The information included in this presentation has not been audited and it does not provide information on the company’s future performance. Aeromexico’s future performance depends on many factors and it cannot be inferred that any period’s performance or its comparison year-over-year will be an indicator of a similar performance in the future.
Thank You
Investor Relations Contact Information [email protected] (+52) 55 9132 4257
Daniel [email protected]