baltic sea environment proceedings no. 36 seminar on
TRANSCRIPT

BALTIC SEA ENVIRONMENT PROCEEDINGS
No. 36
SEMINAR ON NUTRIENTS REMOVALFROM MUNICIPAL WASTE WATER
4-6 September 1989Tampere, Finland
BALTIC MARINE ENVIRONMENT PROTECTION COMMISSION- HELSINKI COMMISSION -

BALTIC SEA ENVIRONMENT PROCEEDINGS
No.36
SEMINARONNUTRIENTSREMOVALFROMMUNICIPALWASTEWATER
4-6 September 1989Tampere, Finland
BALTIC MARINE ENVIRONMENT PROTECTION COMMISSION- HELSINKI COMMISSION -
JULY 1990

This publication has been technically edited by the host countryof the Seminar, Finland
For bibliographic purposes this document should be cited as:Baltic Marine Environment Protection Commission
- Helsinki Commission -1990
Seminar on Nutrients Removal from Municipal Waste Water4-6 September 1989, Tampere, Finland
Baltic Sea Environment Proceedings No. 36
Copyright by the Baltic Marine Environment ProtectionCommission - Helsinki Commission
ISSN 0357-2994
Helsinki 1990 - Government Printing Office
CONTENTS
PREFACE
CONCLUSIONS OF THE SEMINAR
NATIONAL REPORTS ON RESEARCH AND DEVELOPMENTON PHOSPHORUS AND NITROGEN REMOVAL
DENMARK, REPORT - Tage V. Andersen
FEDERAL REPUBLIC OF GERMANY
FINLAND, REPORT - Markku Makela
GERMAN DEMOCRATIC REPUBLIC
POLAND, REPORT - Pawel Blaszczyk
SWEDEN, REPORT - Lars Eklund
USSR, PHOSPHORUS REMOVAL TECHNOLOGYFOR MUNICIPAL WASTE WATER TREATMENT- Nina A. Zaletova and Eduvard S. Razumovsky
MEASURES USED IN NUTRIENT REMOVAL FROMWASTE WATERS IN ESTONIA - U. Asmus
ACTIVITIES OF THE HELSINKI COMMISSION ON MATTERSRELATED TO NUTRIENT DISCHARGES FROM URBAN AREAS- Vassili Rodionov
SIMULTANEOUS PRECIPITATION - Risto Saarinen
FLOTATION-FILTRATION - A METHOD OF UPGRADINGPHOSPHORUS REMOVAL - H.J. Kiuru
NUTRIENTS REMOVAL IN MUNICIPAL WASTEWATERRECLAMATION SYSTEM - Jerzy Kurbiel
PHOSPHORUS REMOVAL IN SMALL TREATMENT UNITS- Ragnar Storhaug
PRE- AND POST PRECIPITATION - Ingemar Karlsson
3
3
8
21
24
27
35
42
51
64
73
82
90
99
118
1 402336x

TUBE FLOCCULATION - CHEAP AND EFFECTIVE METHODFOR PHOSPHORUS REMOVAL - Arto Iatvala
TEMPERATURE EFFECTS ON BIOLOGICAL NITROGEN REMOVAL- S&en NBhr B a k
LONG TERM EXPERIENCE WITH NITROGEN REMOVAL- Erik Bundgaard
EXPERIENCES IN THE SWEDISH NITROGEN PROJECT- Jan-Erik Haglund
CRITICAL FACTORS FOR NITROGEN REMOVAL - REPORT ONSIX YEARS FULL SCALE OPERATION IN FALKENBERG- Lars Gunnarsson
CARBON SOURCES FOR DENITRIFICATION OF WASTEWATER- Mogens Henze
MATHEMATICAL MODELLING OF NITROGEN AND PHOSPHORUSREMOVAL - Rene DuPont
STUDY ON NITROGEN REMOVAL AT THE HELSINKI WATERAND WASTEWATER AUTHORITY - Ari Kangas
LIST OF PARTICIPANTS
BALTIC SEA ENVIRONMENT PROCEEDINGS
137
145
158
175
196
214
237
260
275
282

1
PREFACE
The Ninth Meeting of the Helsinki Commission in February 1989 ap-proved a Finnish invitation to a’seminar on Nutrients Removal fromMunicipal Waste Water to be held in Tampere 4-6 September 1989.The seminar was arranged under the auspices of the Helsinki Commis-sion and the Nordic Council of Ministers and organized jointly bythe Finnish Ministry of the Environment and the National Board ofWaters and the Environment. About 50 people took part in the seminarand in the excursion to the municipal wastewater treatment plantsof the cities of Hameenlinna and Hyvink@l. Experts from Denmark,Finland, the German Democratic Republic, the Federal Republic ofGermany, Norway, Poland, Sweden and the Union of Soviet SocialistRepublics attended the program.
Dr. Tapani Kohonen of the Finnish Ministry of the Environmentopened the seminar and stressed the need of seminars for fulfilmentof the scientific-technological co-operation provided by the Article16 of the Helsinki Convention. In the position of the vice-chairmanof the Scientific-Technological Committee, he also reminded that theimplements of some HELCOM Recommendations and the MinisterialDeclaration demand precise information about the possibilities ofreducing load of nutrients entering into the marine environment.
The participants were pleased with the high quality of the presen-tations and with the lively and professional discussions resulted inthe conclusions of the seminar. They agreed on the need of furtherinformation on the results of ongoing investigations to be consideredby the next meeting of the experts in 1990 in Karlskrona.
The authors are considered to be responsible for the contents of theirpapers. The Helsinki Commission and The Nordic Council of Ministersare not responsible for any statements made or opinions expressed inthis publication.

2
CONCLUSIONS OF THE SEMINAR
According to the papers and information presented in the seminar,nutrient removal is considered very important in all Baltic Sea Statesand Norway, and a lot of research is going on.
It appears from some of the reports presented that 50-80 % nitrogenreduction as an annual average is technically and in practice possiblewith the activated sludge processes used at present for nitrogenremoval.
The experience in Denmark indicates that the goal of 8 mgN/l in theeffluent can be achieved.
For practical reasons, such as possibilities to adopt the proper processcombinations at the existing treatment plants, and the need for furtherresearch to develop optimal removal methods, the implementation oftimetables and final goals need further consideration.
At present, measures to remove phosphorus are intensified all aroundthe Baltic Sea.
An effluent concentration of less than 1 mgP/l can be achieved by acombination of biological methods and different precipitation methodsor by plain chemical treatment without any biological phases andsimultaneous-, pre- or postprecipitation. Simultaneous precipitation,especially, can be easily adapted at activated sludge plants withoutconsiderable construction and running costs.
In Finland and Sweden the goal of 1.5 mgP/l given by HELCOM Re-commendation 9/2 (1988) has already widely been achieved.
It was pointed out by the Seminar that a proper running and operationof treatment plants are an essential part in achieving the reductiontargets.
Further exchange of information on research and results achieved isnecessary.

3
NATIONAL REPORT ON RESEARCH AND DEVELOPMENT ON PHOSPHORUS
NITROGEN REMOVAL
DENMARK
Dr. Tage V. Andersen
National Agency of Environmental Protection
AND
1 The Action plan against pollution of the Danish marine environment by nutrients.
The pollution of the aquatic environment with nutrient salt has
the las decades changed from being a local pollution of rivers, lakes
and coastal areas to a more general and a much more severe prob-
lem for all aquatic areas.
As a consequence of this problem the Danish Parliament in January
1987 in the so called Action Plan against pollution of the Danish
marine environment by nutrients, decided before 1993 to reduce
the nitrogen discharges by 50 % and to reduce the phosphorus
discharges by 80 % to the levels shown below.
Nitrogen
AgricultureMunicipalwastewater plants
Directindustrial discharges
Total
Discharge Discharge whenreported 1984 plan completed
tonnes/year tonnes/year
260 000 133 000
25 000 10 000
5 000 2 000
290 000 145 000
Phosphorus
AgcricultureMunicipalwastewater plants
Directindustrial discharges
Total
Dischargereported 1984
tonnes/year
4 400
7 200
3 400
15 000
Discharge whenplan completed
tonnes/year
400
2 000
600
3 000

4
For the municipal wastewater plants, which is main topic of this
seminar, nitrogen removal shall be done down to 8 mg/l (annual
average) for all plants greater than 15 000 person -equivalents (p.e.)
and phosphorus removal shall be done down to 1,5 mg/l (annual
average) for all plants greater than 5 000 p.e.
In 1990 it will be decided whether nutrients removal also shall be
required for smaller plants.
The cost of the extension and the improvement of the municipal
wastewater plants, which are covered by the demands in the Action
Plan, are approximately 7 400 million Danish crowns. A great part
(about the half) should yet have been paid anyway according to the
normal rules in the Danish Environmental Protection Act.
The work with the extension and the improvement of the municipal
wastewater plants is well started. Until1 now about 40 % of the
total investments have been disposed, and at the end of 1989 more
than 75 % will have been disposed.
2 Research and Development on Phosphorus and Nitrogen removal in Denmark
As a support to the implementation of the Action Plan, the Govern-
ment has started and given money to several research and develop-
ment programmes of which those clearly relating to nutrients remo-
val are listed below.
Programme Public supportin millionDanish Crowns
Period
Pollution from agriculture(nitrogen, phosphorus,organic matter)
50 1986-1990
Marine environment 60 1989-1991
Municipal wastewater 35 1988-1991
Technology relation toaquatic environment
30 1988-1989

5
For the nutrients removal from municipal wastewater, which is the
main topic of this seminar, ‘especially the two ilast mentioned prog-
rammes have interest. Even if they are handled by two different
ministries (The Ministry of Environment and The Ministry of Indust-
ry) have been administrated as one common programme with the
shown 6 main areas:
1. Process automation and regulation
2. Process techniques
3. Measuring equipment and sensors.
4. Problems of industrial wastewater for the municipal wastewater
plants.
5. Sludge.6. Renewal of sewer networks.
In these main areas 80-85 projects have been started with a public
support of 65 million Danish Crowns and a private financing of 23
million Danish Crowns.
These projects have been organized in the following 12 coordination
groups:
1 Control, regulation and monitoring of
purification plants and sewer systems (11 projects)
2 Regulation of rainwater runoff (11 projects)
3 Databases/standards/norms (4 projects)
4 Measuring equipment and sensors (7 projects)
5 Purification methods and better operationof municipal purification plants (11 projects)
6 Pretreatment of industrial wastewater (5 projects)
7 Low-technology plants (8 projects)

6
8 Purification for heavy metals,
substances alien to the environment, oils
and dyes
9 Sludge treatment
10 Sludge applicatios
11 Renewal of sewer networks
12 Production management/testing/Danish
produces equipment/export markets
(7 projects)
(9 projects)
(7 projects)
(7 projects)
(5 projects)
(Some projects is in more than 1 group).
The projects have been described in the publication “Research and
Development Projects in the Fields of Waste Water Treatment and
Aquatic Environment Technology in Denmark 1988-1991”, which can
be ordered at the national Agency of Environmental Protection,
Strandgade 29, DK 1401 Copenhagen K, Att.: The Information.
In relation to the topic of the seminar, I think the projects in
coordination group nr. 5: I’Purification networks and better operati-
on of municipal purification plants” will be of special interest.
The titles of the 11 projects in this group are:
Nitrogen stripping from reject water in purification plants.
Improvement of the beach water quality by reduction of the quantity
of rainwater runoff.
Pre-precipitation with integrated liming of sludge.
The importance of the anaerobe pre-tank for biological removal of
phosphorus.
Biological nitrification in purification plants with simultaneous
precipitation.

Light-weight sludge.
Wastewater purification with fluid filters.
Precipitation properties of activated sludge in plants for removal
of nutritive salts.
Hygienic quality of effluent from purification plants with removal
of nutritive salts.
Winter operation of purification plants with nitrogen removal.
Optimization of contact filter system for removal of phosphorus etc.
Some of the projects will be presented in more details later on in
this seminar, so therefor I don’t want to go in deeper details here.
Most of the projects will be finished late in 1990 or early in 1991.
In connection to the descriptions of the projects there are also
the address and the phonenumber of the contactpersons of the pro-
jects, so that it will be possible to establish a direct contact to
those, who work on the projects.
I hope in this way to have given a contribute to make it easier to
the people, who make research and development in this field to get
in contact to people in Denmark, who work in this field, in the
hope, that this will result in a better water quality in the Baltic
See and the countries around it.

8
NATIONAL REPORT ON RESEARCH AND DEVELOPMENT ON PHOSPHORUS
NITROGEN REMOVAL
AND
FEDERAL REPUBLIC OF GERMANY
1 S i tua t ion
In the field of nutrient removal from municipal waste water, comp-
rehensive research has been done for many years. The results and
experiences were partly realised. For example, in the catchment
area of Lake Constance covered by parts of Southern Germany,
Switzerland and Austria the first phosphorus removing waste water
treatment plants became operational in the mid-sixties.
systematic nitrification and fewer ones with systematic
tion are being operated particularly in areas with small
matic waters.
Plants with
denitrifica-
and proble-
Aware of the importance of nutrients in respect to eutrofication,
the Federal Government planned to amend the appropriate admini-
strative regulation on minimum requirements for the discharge of
municipal waste water into waters by adding new requirements for
phosphorus and nitrogen. This comparatively progressive amendment
became obsolete because of the events in the North and Baltic Seas
in the early summer of 1988. Consequently the Federal Minister
for the Environment set up a lo-Point-Action-Programme on intensi-
fied measures for the protection of the North and Baltic Seas con-
taining inter alia a tightening of the above mentioned requirements
on municipal waste water discharged into waters. This will be poin-
ted out in section 2.1.
2 Legal measures
2.1 Amendment of the First General Administrative Regulation on Minimum Re-
quirements for the Discharge of Waste Water from Communities into Waters
The more rigorous amendment of this administrative regulation will
shortly be published and shall enter into force by 1 January 1990.
According to the lo-Point-Action-Programme, phosphorus and nitro-
gen among others shall be limited in the following way:
9
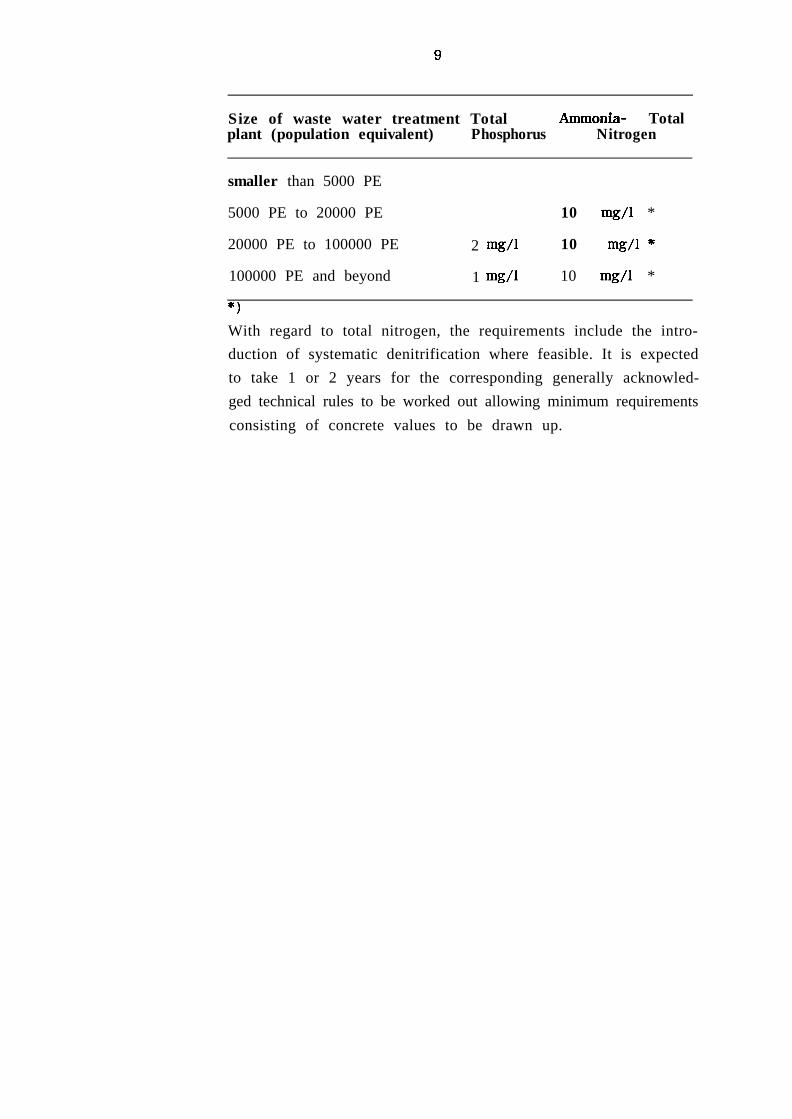
Size of waste water treatment Total Ammonia- Totalplant (population equivalent) Phosphorus Nitrogen
smaller than 5000 PE
5000 PE to 20000 PE 10 mg/l *
20000 PE to 100000 PE 2 mg/l 10 mg/l *
100000 PE and beyond
*1
1 mg/l 10 mg/l *
With regard to total nitrogen, the requirements include the intro-
duction of systematic denitrification where feasible. It is expected
to take 1 or 2 years for the corresponding generally acknowled-
ged technical rules to be worked out allowing minimum requirements
consisting of concrete values to be drawn up.

10
The effect of these requirements is shown in figure 1 which gives
the proportion of the number of plants in comparison with their
size.
F i g u r e 1
S I Z E O F P L A N T[PEI

11
It is estimated that the above mentioned amendment will reduce
the input of phosphorus by municipal waste water by about 75 %.
In respect of nitrogen, similar effects are expected.
2.2 Amendment to the Waste Water Charges Act
According to the Waste Water Charges Act the waste water charge
depends on the content of certain pollutants in the waste water
and is calculated on the basis of the discharge values authorised
in the official notices relating to water legislation, taking diffe-
rently evaluated pollutants and groups of pollutants as its base.
The lo-Point Action Programme for the protection of the North and
Baltic Seas includes a proposal to make phosphorus and nitrogen
subject to the waste water charge. An according bill will enter
into force by 1991. This will provide an additional incentive for
necessary investments in waterprotection measures in order to
reduce phosphorus and nitrogen inputs as quickly as possible. The
possibility of deducting these investments from the waste water
charge for a limited period of time will act as an added incentive
to accelerate the construction of new sewage treatment plants and
the expansion of existing ones equipped for phosphorus and nitrogen
elimination.
2.3 Washing and Cleansing Agents Act
The detergents industry, for its part, has responded to the stricter
requirements and has increasingly developed phosphatefree deter-gents. At the beginning of 1988, two thirds of all detergents were
already phosphatefree. The supply of these detergents and the
phosphate reduction resulting from the Ordinance on Maximum
Amounts of Phosphates in Washing and Cleansing Agents meansthat sewage treatment plants and water bodies in the Federal Re-
public have been relieved of considerable amounts of phosphate. It
is expected that washing and cleansing agents will contribute only10 to 50 % of the overall phosphorus input into the water bodies of
the Federal Republic of Germany by the end of 1988.

12
3 Research and Development Activities
3.1 General
Due to the necessary briefness of this report on activities in theFederal Republic, it is only possible to look very roughly at oneor two aspects. Thus the report cannot go into any great detail.The statements represent an extract from the current reports inspecial periodicals and those of seminars. Thus it may be that thisreport is incomplete and not representative in some parts, particu-larly in this section.
In order to define the generally acknowledged technical rules, aworking group consisting of several Universities set up a seriesof cooperative meetings. First results of these joint conventionsappear in special periodicals and in seminars and contain recommen-dations for designing waste water treatment plants in order toremove nitrogen by nitrification and denitrification. An algorithmfor designing those plants is derived from these available reportsand is shown in section 3.2. Furthermore, according to those reportsit seems to be an indisputable fact that
- an adequate N-removal requires an intensivation of plant controland management providing the use of improved measuring techni-
ques,
- primary and simultaneous denitrification are preferable to seconda-ry denitrification,
- in spite of certain reservation, it seems that there is no longerany great need for research on P-removal by precipitation,
- since legal requirements will cause both of N- and P-removal inall plants with 20 000 PE or more, research also puts emphasis onquestions that might appear in this respect.

13
3.2 Nitrification and Denitrification
The experts’ discussion is also aimed at formulating recommendations
for the designing of N-removing treatment plants. Based on current
publications on design rules, particularly set up by Kayser in 1983,
the following proposed algorithm for nitrification and denitrifica-
tion was derived. It must be admitted that it is merely a suggestion
of the lecturer and thus cannot consider all possible conditions.
Nevertheless this algorithm might give a basic outline of the ques-
tion. It includes a graphical method which enables even the non-
computerized designer (or proving water authority) to get results
quickly and with sufficient accuracy.
Algorithm nitrification
The following abbreviations have been used:
T PC) water temperature required for sufficient N-removal
F ( - ) growth rate of nitrosomas etc. depending on temperature
BI (gBOD/m3) BOD-concentration of influent
MI (kg/m3) mixed liquor suspended solids of influent
SL (kg BOD/kg MI d) sludge loading per day
C(- ) auxiliary calculation factor
MA (kg/m3) mixed liquor suspended solids in aeration tank
s ( - ) margin of safety
X ( - ) rate of active sludge
ES (kg/d m3) excess sludge
A (d) sludge age
AR (d) required sludge age resulting from growth rate
I (m3/d) influent
VN (m3) aerated volume required for nitrification
SLR (kg BOD/kg d) relevant sludge loading
2 4w335x

14
f
67(1+8)?
1
I ,SL,=O,15
ES,,,=O,6*MA. SL,,+ 1+ $1 -D.D72$jMA-F
tMA\/ ) %/2= ES,,,
d d dB I
SL,SLR e- I 81 (kg BOD/kg d)?
;
VNa IMA.SLR I I
I II I
0Known or estimated parametersALGORITHM NITRIFICATION
--- ;__--__IIPIII
------
1
13141516I7

15
Algorithm denitrification
The following abbreviations have been used:
VD (m3) volume required for denitrification
DN nitrogen to be removed
NI nitrogen influent
NES nitrogen removed via excess sludgeNE nitrogen influent
OPN (kg 0,/m3d) oxygen production by denitrification
oc ( ” ) oxygen consumption
OCI ( ” ) intensified oxygen consumption by primary denitri-f ication
i (-1 coefficient regarding intensivation of oxygen con-sumption by primary denitrification
0,35 N/OX-rate0,75 rate of denitrifying organism

16
dDN*J
* oPN1.~~3=0.35.Q75-VD,,~3I
,
DN=NI-(NE+NES) -
t
J.BIsLW= MA.(VN +VD,,2,j) -
- 0C,,22=D,5’SL1,2,3.MA+0,24.X,,2.3.M
1
V DV N + V D
J
II-
t OCI ,OPN( kg02/m3 d)
VD 0,3 -VD =VN*m
* 03*
007 -
V DVN
A L G O R I T H M DENTRIFICATION

17
3.3 Biological Phosphorus Removal
The classical methods of P-removal by precipitation are well known.
Now the biological P-removal is being subject to research. According
to preliminary results, it seems that this method may be applicable
for plants which have to meet the 2 mg/l value.
The main advantages of biological P-removal are:
- no additional salt input by precipitants
- no additional excess sludge.
Up until now, the biological P-removal has not been completely
explored. But it seems to be based on the fact that some micro-or-
ganisms are able to incorporate phosphate. The alternating change
of an anaerobic environment to an aerobic one seems to be advanta-
geous to these micro-organisms, which can thus grow faster than
others. In the anaerobic zone the micro-organisms release incorpora-
ted phosphate whereas is incorporated in the aerated zone. The
incorporation exceeds the amount released. The incorporation/relea-
se-rate increases with the phosphate release as shown in figure 2.

18
Figure 2
- concentration in thesurrounding water
P-elimination
anaerobic conditions aerobic conditions
dentrificat ion----_ -- ---- .-: =- - .2-r’:. .__GE- - -;~-:_* . . - - --a. _ . . . . . -* - --- --__.:.: ---- -__’ ---- _---__--A-
--__--- ---._-- - ‘> . . -Po-~Ii- -----a:-..:5--_._ _ - -- _ :.‘,
. . ._ .----- _-.:- -- : _- -* : --
.-A_
- -- -_-
dissolving = release re-dessolving=incorporationof PO4 of PO4

19
Further pre- conditions for biological P - removal are
- the presence of easily degradable organic substrate- the presence of organic acid- the absence of NOJNO, (i.e. denitrification provided)- sufficient aeration detention time.
The outlined substantials and these pre - conditions might lead tothe following configurations of plants:
Figures 3a and 3b
AnyFkbic Aeration tank
recycle sludae
Aeration tank Find settling tank
ntrating
Precipitation sludge

20
It must be taken into account that the process of biological P-removal is reversible. Thus the dissolving of PO, could occur inthe final settling tank or during sludge treatment. Beyond that theneeded long sludge age for nitrification, causing a low excess sludgeproduction might limit the biological P-removal depending on ahigher excess sludge production.
4 Conclusion
This report describes the legal measures in the Federal Republicand their expected impact on the reduction of nutrient dischargesinto waters. Later, the report points out briefly current activities,notably in the field of biological P-removal as derived from currentpublications at hand. For designing a N-removing waste water treat-ment plant by nitrification and denitrification an algorithm is sug-gested.

21
NATIONAL REPORT ON RESEARCH AND DEVELOPMENT ON PHOSPHORUS AND
NITROGEN REMOVAL
FINLAND
Dr. Markku Make&iNational Board of Waters and the Environment
ABSTRACT
Present level of municipal wastewater treatment
The public sewerage systems serve 3.7 million people which corres-
ponds to 74 % of the total population of Finland. The wastewaters
of 1.7 million people are discharged to coastal waters.
Phosphorus is an important growth limiting factor for algae in all
inland water bodies and coastal waters. As much as 99 % of munici-pal wastewaters is treated by applying chemical phosphorus removal,in most cases simultaneous precipitation, achieving 90 % reductionand concentration of less than 1 mg P/l as the weighted annual
average values of all wastewaters. The total treatment results in
inland and coastal areas are almost equal.
Nitrogen is also considered an important factor in algal growth insome areas, especially on the southern coast. So far, however, no
requirements exist concerning total nitrogen removal. The best
results have been achieved at nitrifying plants by utilizing denit-
rification in order to reduce running costs. There are some ten
nitrification-denitrification plants with 50-60 % removal of nitro-
gen.
At present, slightly less than 500 tons of phosphorus and 15,000
tons of nitrogen are discharged annually to inland water bodiesand coastal waters from the public sewers.
Future goals of nutrient removal
On 6 October 1988, the Finnish Council of State issued a decision-in-principle on a programme of objectives for water protection to

22
be achieved by 1995. In the programme, Finland’s international
commitments concerning the reduction of loading to the Baltic Sea
and its Gulfs have been taken into account.
According to the programme, a treatment efficiency of at least 90
% in the removal of phosphorus is required on average. Removal of
95 % of phosphorus (corresponding to an effluent concentration of
0.3-0.5 mg P/l) is required when the receiving water body is of
particular significance. As far as nitrogen is concerned, a feasibi-
lity study will be made into more effective nitrogen removal, parti-
cularly when the nitrogen load produces a significant increase in
eutrophication. The required measures to improve nitrogen removal
will be taken.
In practice, phosphorus removal will be further improved by proper
operation and management of existing treatment plants. In 1995,
the phosphorus concentration of all wastewaters, discharged from
the public sewer systems, will be near 0,6 mg P/l as a weighted
annual average value.
On the basis of the present plans, effective nitrogen removal should
be adopted first in the largest communities on the southern coast.
The preliminary target is about 70 % reduction within lo-15 years.
Research
A study on the need for nitrogen removal and a study on removal
technology were initiated this year. Both projects are financed by
the Ministry of the Environment and the National Board of Waters
and the Environment.
As a first step of the study on the need for nitrogen removal, a
compilation will be made during this year of the earlier studies
on the effect of nitrogen on the eutrophication of coastal waters.
The study on nitrogen removal technology will last three years.
Most of the earlier studies have primarily been based on the need
to reduce the running costs of nitrifying plants by means of denit-
rification. At present, the most important case study on the removal

23
of total nitrogen is carried out by the Helsinki city sewage worksin co-operation with the Espoo city sewage works in order to finduseful methods for nitrogen removal in the region of the capitalwhere the wastewaters of 800 000 people are discharged to the Gulf
of Finland.

24
NATIONAL REPORT ON RESEARCH AND DEVELOPMENT
ON PHOSPHORUS AND NITROGEN REMOVAL
GERMAN DEMOCRATIC REPUBLIC
In pursuance of the Declaration on the Protection of the Marine
Environment of the Baltic Sea Area adopted on 15 February 1988 on
the occasion of the 9th Meeting of the Helsinki Commission as well
as the Helcom Recommendation 9/2 concerning measures aimed at
the reduction of discharges from urban areas by the use of effective
methods in waste water treatment, the efforts undertaken by the
GDR in the field of research and development related to the removalof P and N from municipal waste water have been intensified consi-
derably taking into account likewise the values on limitations given
in the documents referred to above and an optimization of economi-
cal necessities.
The position of the delegation of the GDR to the 9th Meeting of
the Helsinki Commission regarding the state of affairs of the reduc-tion of discharges of nutrients that had been already achieved bythen and the targets of the GDR till 1990 formed the starting point
for all national institutions involved now in research, development,
design and construction, above all within the VEB Kombinat Wasser-
technik und Projektierung Wasserwirtschaft and its partners in other
areas of the national economy.
Long-term plans have been worked out to minimize the nutrient di-scharges, among them N and P into the water bodies bearing fully
in mind the size of the national catchment area of the Baltic Sea
which is approximately 22 000 km2, i.e. l/5 of the territory of the
GDR. These plans being based on the Water Law of the GDR as
adopted in 1982 and allowing for example the most recent stipula-
tions regarding the conditions of discharges by industry, agricultu-
re and urban areas are characterized by qualitative and quantitative
limiting values; they demand to continue working on the basis of
specific programmes on rational use of water and pollution abate-
ment.

25
Prerequisits have been created to tackle the objectives of the Decla-
ration and the recommendation 9/2 with regard to a further reducti-
on of landbased pollution including Phosphorus and Nitrogen by
likewise constructing, reconstructing or extending waste water
treatment plants of the industry and the municipal sector; among
them are new biological sewage treatment plants as in Neubranden-
burg, Pasewalk, Kiihlungsborn, Malchin-Stavenhagen, Giistrow, Al-
tentreptow und Teterow.
Till 1995 additional 25 plants will be constructed respectively imple-
menting the most progressive knowledge. The main project in this
respect is the extension of the sewage treatment plant in Restock
in order to achieve there a reduction of waste load of 300 000 P.E..
Within the last 3 years results could be obtained in developing and
successfully running the first sewage works with biological phospho-
rus removal. We consider this to be an interim solution on our way
to a combined P- and N-removal. In order to accelerate the research
and the development of the most modern technologies of a combined
P- and N-removal in the GDR at present one examines carefully
the direct applicability of internationally known technologies or their
further development in accordance with the specific conditions on
the spot including such problems as the environmentally-sound
utilization of the sewage sludge.
It appears to be obvious that a close cooperation of all parties to
the Helsinki Commission is to the best advantage to achieve the
targets given concerning the removal of P and N. In this connection
it is as well essential to make full use of all technological possi-
bilities that are available at national level as to have access to
any better solution of the other parties to the Commission, particu-
larly in promoting the comprehensive employment of e.g. the most
modern instrumentation and control systems, adjustable stirring
devices and aerators and also computer-aided operation control.
Therefore, the GDR would like to profess its full support for the
initiative of Finland to organise the Seminar on Nutrient Removal
from Municipal Waste Water, 1989. We expect to receive important
impulses and as many as possible relevant perceptions which will

26
enable us to force the national projects in the interest of the BalticSea.

27
NATIONAL REPORT ON RESEARCH AND DEVELOPMENT ON PHOSPHORUS AND
NITROGEN REMOVAL
POLAND
Prof. Pawel Blaszczyk
Institute of Environmental Protection
1 Decreasing of loads of biogenic compounds of nitrogen and phospho-
rus discharged to the Baltic Sea is one of very important resolutions
of the Convention on the Protection of the Marine Environment of
the Baltic Sea Area/Helsinki Convention/signed by Baltic States on
12th March 1974 and ratified by Poland in April 1977.
This resolution was described with full particulars among other with
regard to municipal waste water in recommendations to the above-
mentioned Convention/Helcom Recommendations/.
Necessity of limitation of biogenic pollution loads was also under-
lined by co-signatory states of the Convention in “Declaration on
the Protection of the Marine Environment of the Baltic Sea Area”
signed in February 1989.
According to “First Baltic Sea Pollution Compilation” /Helsinki 1986/
from territory of Poland the biggest from Baltic States load of
biogens and very big load of organic pollution are discharged. Essen-
tial part of this load comes from point sources: towns and settle-
ments and industrial plants discharging waste water to Vistula and
Odra rivers.
This is why limitation of these loads is very important with a view
to protection of Baltic Sea against pollution being at the same time
very important economic problem for Poland. Therefore introducing
of high-effective processes and technologies of treatment enabling
removal of biogenic compounds to level determined in Helcom Re-
commendations/l,5 gP/m3, 15g N/m3/ to Polish waste water treat-
ment plants must be preceded by choice of the most appropriate
technologies of treatment, motivated in respect of energy-consumpti-
on, material consumption index and economics of solutions.

28
Table 1
Compilation of loads after “First Baltic Sea Pollution Load Compila-
tion”, Helsinki 1986 and verified loads for Poland
Country BOD, Nitrogen/thous.T/year/
Phosphorus
DenmarkFinlandGDRFRGa/Poland
b/SwedenUSSR
159,7 69,l 935249,8 69,5 494
13,3 396 09422,7 16,4 2,4
392,6 109,9 19,l
358,4 231,8 18,0361,6 129,5 699504,7 130,3 599
a/load after “First Baltic Sea Pollution Load Compilation”b/verified load
Table 2
Compilation of pollution loads discharged to the Baltic Seafor 1 inhabitant
Country Number of BOD, Nitrogen Phosphorusinhabitants /kg/inhab.in Sea x year/catchmentarea /mln/
Denmark 4,041 39,5 17,l 2,35Finland 4,512 55,4 15,4 0,98GDR 2,072 6,4 1,7 0,19FRG 1,101 20,6 14,9 2,18Poland 39,700x’ 9,0 5,8 0,45Sweden 7,203 50,9 6,7 0,30USSR 19,500 25,9 6,7 0,30
x/ including 0,6 from GDR and 0,97 from Czechoslovakia

29
2
3
In order to introduce into practice the most appropriate processes
and technologies of removal of biogenic compounds from municipal
and industrial waste water it was considered necessary to elaborate
proper guidelines and principles of design on the base of research
carried out in different scales including demonstration projects in
pilot treatment plants. Ministry of Environmental Protection and
Natural Resources charged Institute of Environmental Protection
with this task/2/.
In 1988 “Technological guidelines of high-effective methods of waste
water treatment” were elaborated in the Institute of Environmental
Protection.
Aforenamed guidelines comprise:
- application of fluidized beds for denitrification of waste water,
- treatment of small quantities of waste water in ponds,
- application of ponds for removal of biogenic compounds,
- simultaneous precipitation of phosphorus in the most popular in
Poland package treatment plants,
- application of filters for ultimate treatment of waste water.
It is foreseen that in 1990 this elaboration will be completed with
a supplement containing guidelines concerning processes and techno-
logies, which are now subjects of investigations of research insti-
tutes, universities and producers of equipment.
It should be noticed that processes and technologies recommended
in elaboration of 1988 year and results of actually conducted re-search concern as well protection of the Baltic Sea against eut-
rophication and protection of the waters of lakes in Poland.
The object of investigations carried out in Poland in years 1986-90
is to evaluate new methods of removal of biogenic compounds in
respect of technological effects of their application with utilization,
for this aim, of available in Poland coagulants as well as ways and
cost of their implementation /l/.
3 402336X

30
These research works are carried out in two main directions:
- removal of phosphorus from municipal waste water by methods
of reacting substance with application of activated sludge or trick-
ling filter as basic processes of treatment,
- removal of nitrogen and phosphorus from waste water by biological
methods.
In a result of research with application of aluminium sulfate as
reacting substance conducted on a pilot plant in large scale feeded
with waste water from town agglomeration with composition charac-
teristic for other Polish towns, it was found that the effect of
phosphorus removal to the level determined in Helcom Recommenda-
tions can be achieved irrespective of the way of leading the process.
The conditions are that the dose of aluminium sulfate is adjusted
to pollution of waste water /molar ratio Al /P>2,3 and full biological-treatment is made. Application of filtration as final stage of treat-
ment improves effects obtained.
Research including precipitation of phosphorus by application of
FeSO, conducted in the same conditions as preceding and with dose
Fe/P>2,3 has shown that only methods of preliminary and simul--taneous precipitation can be taken into consideration. Method of
final precipitation cannot be used because of too little utilization
of dosed reacting substance, which goes to outflow and cannot be
eliminated from it even with application of filtration.
In a result of research including precipitation of phosphorus by
lime applied only in final phase of the process of treatment it was
shown that effects can be comparable with precipitation by alu-
minium sulfate or preliminary and simultaneous precipitation by
iron salts but doses must be much bigger.
Quantities of sludge originating when salts of aluminium and iron
were used, have been from 75 to 100 % greater than in the process
of conventional activated sludge and when lime was used - even
2,5 times greater. Mixed sludge with participation of products of

31
precipitation by iron can be dewatered well in comparison withmixture with content of aluminium.
It is considered that implementation of chemical precipitation ofphosphorus should be carried on in an elastic way according tostandards of protection of the receiver, means in disposition andlocal conditions.
As the first method - the less expensive and using up waste pro-ducts /FeSO, - preliminary and simultaneous precipitation by cheapand easily available in Poland FeSO, can be used. Examined in pilotimplementations equipment for preparation and dosing of coagulantsplaced in mobile containers finds full employment in treatment plantsfrom 10 to 15 thous.m3/d/4/. As the demands, concerning standardsof discharges exceeding actually recommendations of Helcom, grow-it is considered motivated to introduce additional final precipitationby aluminium sulfate and eventual filtration. However these solutionsare expensive because of necessity of construction of additionalobjects for waste water treatment and processing of difficult intreatment sludge.
In a result of research on chemical precipitation of phosphorus intreatment plants with trickling filters it was found that the besteffects of process are obtained when the dose is devided into twopoints of dosage: ahead of the filter and after the filter. The biggerdose of FeSO, before the filter -the greater effects of phosphorusremoval in the filter. Yet the danger of silting up the filter doesnot allow to direct the whole dose before the filter. It was deter-mined the most proper division offilter and 40 % after filter /5/.
the dose: 60 % of FeSO, before
Unfortunately in treatment plants with trickling filters it was notsucceeded to achieve standards of Helcom in the runoff even withdoses reaching Fe/P = 2,3. Maximal effect of precipitation was nothigher than 1,9 gP/m3 of waste water in the discharge of the treat-ment plant.
Presence of iron compounds in outflow creates also a limitation ofthis technology.

32
Research on removal of nitrogen compounds from waste water was
undertaken first of all in connexion with the process of low loaded
activated sludge and prolongated aeration, especially widespread in
Poland in treatment plants of medium size. In this process integrati-
on of removal of carbon, nitrogen and phosphorus from waste water
by creating alternating aerobic and anaerobic conditions was a
thieved /6/.
In this technology 90 % removal of ammonia nitrogen and total
nitrogen and 60-80 % limitation of BOD, and phosphorus compounds
can be achieved. Common changes of carbon, nitrogen and phospho-
rus consist in simultaneous oxidation of carbon, processes of nitrifi-
cation and denitrification and fixing the phosphorus under biological
way in combination with biosorption and sorption, intensification
of which was following transition from anaerobic to aerobic zone.
Process of removal of phosphorus goes better if the relation of
BOD, to P in waste water conveyed to treatment plant is higher.
Course of process depends very much on the temperature. When
temperature comes down to 1 O-l 2°C speed of nitrification deminishes
by 50 % and speed of denitrification by 80 %.
Parameters of chambers for anaerobic zones are determined as fol-
lows:
Anaerobic chamber:
- retention time: 2 h,
- recirculation : 200 %
- content of oxygen dissolved in chamber: 0 g 0,/m3.
Aeration chamber:
- retention time: 6-7 h,
- loading of activated sludge: O,l-0,2 kg BOD,/kg,d,
- content of oxygen dissolved: 2 g 0,/m3.

33
Zone of secondary denitrification:
- working periodically: capacity of chamber = 20 % of capacity of
aeration chamber,
- content of oxygen dissolved below 0,5-0,8 g 0,/m3,
- secondary settling tank with retention time at least 2 h.
Obtaining of high effectiveness of the process in winter is condi-
tioned by isolation of the system of treatment plant from the exte-
rior.
Discussed research works which have been conducted in pilot scale
are being verified now in full technical scale in small treatment
plants and in plants with flow capacity 20 thous.m3/d.
Also conducted is research concerning optimization of process of
nitrogen and phosphorus compounds removal by activated sludge
method in multiphase reactors including combination of biological
and chemical methods.
Criteria of optimization are: effectiveness of process, energy con-
sumption and expenditure of money for construction and exploita-
tion of objects /7,8/.
It is foreseen that results of these research will find application
in construction of biological part of treatment plant Gdansk-East
and modernization of treatment plant in Cracow.
The results of research which have been obtained hitherto create
sufficient base to implement in engineering practice the technologies
prepared for Polish conditions.
The basic obstacles in implementation conducted on a large scale
in municipal waste water treatment plants are economic conditions
of the country, lack of financial means for investments in budgets
of local authorities and in water supply and sewerage companies
dealing with exploitation of sewerage systems in towns.

34
LITERATURE
/l/B&szczyk P., Expected Results of R&D Works Realized in years
1986-90 in the Field of Foundations of Municipal Waste Water
Economy. Foundations of Water and Waste Water Economy in Towns
and Settlements. IOS, Warsaw 1989 /in printing/.
/B/Bernacka J. et al., Technological Guidelines of High-Effective
Methods of Waste Water Treatment. Foundations of Water and Waste
Water Economy in Towns and Settlements. IOS, Warsaw 1989 /in
printing/.
/S/PrzewIocki J., Kojewska C., Guidelines of Application of Chemical
Dephosphatation of Municipal Waste Water. IOS, Warsaw 1989 /not
published/.
/4/Telezynski A., Sadowska E., Concept of Technology of Simul-
taneous Precipitation of Phosphorus in Waste Water Treatment Plant
Kartuzy. IOS, Warsaw 1988 /not published/.
/5/Poznanska K. et al., Technological Guidelines of Precipitation of
Phosphorus in Treatment Plants with Low Loaded Beds. Poznan
Technical University, Poznan 1989 /not published/.
/G/Bernacka J., Integration of Removal of Carbon, Nitrogen and
Phosphorus in the Process of Low Loaded Activated Sludge, IKS,
Warsaw 1985.
/7/Rybinski J. et al., Optimization of the Process of Phosphorus
and Nitrogen Elimination by Activated Sludge Method in One-Sedi-
ment Process with Simultaneous Precipitation by Reactive Substance.
IMGW, Gdansk 1989 /not published/.
/8/Kurbiel J., Mucharska A., Zeglin K., Integration of Processes of
Biogenic Substances Removal in Multiphase reactors... Cracow Tech-
nical University, Cracow 1987 /not published/.

35
NATIONAL REPORT ON RESEARCH AND DEVELOPMENT ON PHOSPHORUS AND
NITROGEN REMOVAL
SWEDEN
Mr. Lars Eklund
The National Swedish Environment Protection Board
Summary
The research and development work in Sweden concerning nitrogen
reduction is for the most part conducted at wastewater treatmentplants. From 1988 to 1991 municipalities will be investing at least
SEK 70 million in nitrogen projects, of which a minimum of SEK 25
million represents follow-up and evaluation costs. Research carried
out at universities and institutes of higher education directed atprocess technology turns over something like SEK 2-3 million per
year. The Swedish research and development work on nitrogen
reduction is at present entirely focused on biological processes.
Background
In June 1988, the Swedish Parliament decided that treatment plants
which discharge into certain coastal areas that are particularly
sensitive to pollution should have at least 50 % nitrogen reduction
(< 15 mg N/l) by 1992 at the latest. The ambition shall also be
that treatment plants with discharges to other coastal areas from
Strijmstad (the Norwegian border) up to and including the Stockholm
archipelago should have the same degree of nitrogen reduction
before the year 1995. Certain inland treatment plants may also be
affected by these requirements. The technical and economic precon-
ditions for additional nitrogen reduction up to about 75 % (< 8 mg
N/l) shall be investigated.
The treatment plants at Laholm Bay on the south-west coast of
Sweden is covered by a special Government decision which means
that the ambition shall be to achieve approximately 75 % nitrogen
reduction by 1992 at the latest.

36
An updated review is currently being made at the Environment
Protection Board of the sources of nutrient salt loads on coastal
regions and what measures it is possible to take in order to reduce
the loads. This work will probably not lead to any changes in the
above level of ambition with regard to nitrogen reduction at munici-
pal wastewater treatment plants. On the other hand, it can be
expected that the phosphorous requirements will be made more
stringent for the large coastally-based plants so that discharges in
the future may be at the most 0,3 mg of total phosphorus per litre
in the discharge.
Targets for the research and development work
On the basis of the attitudes adopted by politicians and authori-
ties, we can distinguish a number of requirement levels that re-
search and development work must be directed at during the imme-
diate future. The various requirement levels are shown in Table 1.
Table 1. Requirements to be met by the discharge from Swedish
treatment plants
Nitrogen Phosphorus BOD7 Treatment plant sizemg tot-N/l mg tot-P/l ms/l pe
i Cl5 co.5 cl5 10 000-50 000ii <15 co.3 Cl5 >50 000iii < 8 co.5 Cl5 10 000-50 000iv <8 co.3 Cl5 >50 000
Each of the four requirement levels may lead to a special strategy
for how the tasks are to be solved from the point of view of pro-
cess engineering, Another factor that is also of crucial importance
is, of course, the design of and load on each individual treatment
plant today. It should be an overriding goal for the requirements
to be met at as low a cost as possible.

37
Research and development work at treatment plants
With the Government decision regarding Laholm Bay and the Na-
tional Environment Protection Board’s action plan against sea pollu-
tion in Spring 1987, it became clear to the municipalities that re-
quirements for nitrogen reduction in treatment plants could be
imposed within the very near future.
Extensive activity commenced among municipalities in connection
with planning nitrogen experiments at the same time as demands
were made for government support. Today, some 30 full-scale pro-
jects are in progress, six of which have received support from the
Environment Protection Board.
All of the projects involve biological nitrogen reduction. The objec-
tives vary, but most of them are directed in the first instance at
achieving a 50 % nitrogen reduction. Four of the five projects with
government support shall, however, investigate the technical and
economic preconditions of achieving 80 % nitrogen reduction.
The systems for biological nitrogen reduction that are being studied
are:
- Activated sludge, pre-denitrification, l- sludge systems.
- Activated sludge, post-denitrification, l- or Z- sludge systems.
- Trickling filter, pre-denitrification, l- or 2- sludge systems.
- Trickling filter, post-denitrification, l- or 2- sludge systems.
- The SBR system.
A large part of the work involves the adaptation of known techno-
logy to Swedish treatment plants and Swedish conditions. However,
as a whole the municipal projects represent an extensive volume
of development work with features of research.
With the aim of optimizing the system with regard both to economic
and operational factors, special studies of varying extent and quality
are being conducted at the plants. The most extensive studies are
being made within the following areas:

38
Nitrogen reduction in separate reject water treatment stages.Different internal and external carbon sources during denitrificati-on.
Optimization of the anoxic-aerated zone ratio.The importance of pre-treatment for the nitrification and denitri-fication processes.Control, regulation and instrumentation of the nitrogen process.Factors that influence sludge properties.Fixed bed processes.New types of aerators.
The costs for a full-scale experiment are in many cases difficultto determine because certain costs cannot be distinguished fromthe normal operating costs. Table 2 shows a budget for the sixprojects that have received government support.
Table 2. Costs for nitrogen reduction experiments with Governmentsupport.
Treatment plant Gov.grant Follow-upcost Total costSEK M SEK M SEK M
MalmG 2.0 2.0 6.0Halmstad 4.4 2.3 13.2Laholm 1.35 1.2 2.7Karlskrona 1.25 1.7 4.1NorrkGping 0.7 2.4 3.1Kdppala 1.32 1.4 4.4
Total 11.0 11.0 34.5
The total cost of these six projects is thus SEK 34 million andthe follow-up cost approximately a third, or SEK 11.0 million.
On the basis of these figures, it can be estimated that from 1988to 1991 Swedish treatment plants will spend at least SEK 70 millionin nitrogen reduction experiments. The proportion that is utilizedfor follow-up and evaluation of the experiments is at least SEK 25million.

39
Research at Swedish universities and institutes of higher education in the field of
water supply and sewerage
For many years, only a limited amount of research work has been
carried out at Swedish universities and institutes of higher educa-
tion on water supply and sewerage, with a focus on process techno-
logy. However, there has been an increase in recent years, primarily
as a result of the cooperation that has been established between
municipalities and universities/institutes. There are at present at
least five research students at different universities and institutes
who are in some way linked with the experimental work being
carried out at a treatment plant, three of whom with a direct focus
on nitrogen reduction.
A list is given below of those research projects of a more tradi-
tional character, having a direct or indirect link with nitrogen and
phosphorus reduction, that are either in progress or to be started
shortly:
- Optimization of l-sludge systems for biological nitrogen reduction
with the aid of added organic matter (Chalmers University of
Technology (CTH), Gothenburg and the Royal Institute of Techno-
logy, Stockholm (KTH) 1.
- Nitrogen reduction in the reject water. (KTH)
- Improvement of sludge properties in order to permit biological
nitrogen reduction in existing wastewater treatment plants. (KTH)
- Studies of the connection between sludge properties and discharges
of suspended solids from the activated sludge process. (YKl)
- Secondary settler dynamics for controlling the activated sludge
process. (CTH)
- Modular model systems for the simulation and regulation of treat-
ment plants (Lund Institute of Technology (LTH)).

40
- Biological phosphorus removal. (LTH)
- Biological phosphorus removal with the SBR process. (Lulea)
Funds for research carried out at universities and institutes of
higher education are granted in the first instance by the National
Board for Technical Development (STU). The subsidy that is princi-
pally used for this purpose is for the current year SEK 1.3 million.
A special one-off subsidy of some SEK 2 million is this year and
next year being allocated for research directed towards nutrient
salt reduction at municipal treatment plants.
The Nitrogen Project
In Sweden there is also a scheme referred to as “The Nitrogen Pro-
ject”, which is financed jointly by the Swedish Water and Wastewa-
ter Works’Association (VAV), the National Environment Protection
Board (SNV) and STU. The budget is SEK 1.8 million over a three-
year period and the objectives of the project are:
- To initiate and coordinate municipal nitrogen projects through
advisory services and by collecting, processing and spreading
information from full-scale experiments for nitrogen reduction at
Swedish treatment plants.
- To produce basic data on which to base continued technical deve-
lopment.
The project board includes representatives of VAV, SNV and STU.
The project management consists of representatives of VAV and
SNV.
The project has no power to allocate funds, but the project manage-
ment can be said to function as a body to which proposed measures
are submitted for comment in connection with both applications for
Government support for full-scale experiments and applications for
research grants from STU.

41
The project’s own funds will in the first instance be used for the
compilation and distribution of experience from the research work
carried out by the municipalities.

42
PHOSPHORUS REMOVAL TECHNOLOGY OF MUNICIPAL WASTE WATER TREAT-
MENT
USSR
Nina A. Zaletova and Eduard S. Razumovsky,
Municipal Water Supply and Treatment Research Institute
Academy of Municipal Economy
In the USSR the most popular method of municipal waste water
treatment is traditional biological treatment. The method allows
removal of basic pollutants, but it does not provide sufficient
phosphorous removal compared with present more stringent require-
ments. Of course population growth and the more extensive use of
washing agents in every day life inevitably lead to excess phospho-
rus concentrations in municipal waste water. This is why USSR
Municipal Water Supply and Treatment Research Institute has during
several years carried out experiments to identify methods of
phosphorus removal from municipal waste water. First of all, attenti-
on has been paid on application of reagents at biological treatment
plants as the most simple technology to be used on the plants.
Preliminary results obtained from the investigations have been
reported in a seminar held in Sweden/l/. The investigations indica-
ted that the dose of iron vitriol, while introduced into the aeration
tank, should be limited to avoid the negative influence of the rea-
gent on biological treatment in the aeration tank. Moreover the
MLSS in the aeration tank should be kept on a higher level than
usual. The required dosages of reagent depend on the quantity of
organic matter in treated water, the phosphorus concentration in
the raw water and the quality criteria of effluent phosphorus con-
centration.
The effluent phosphorus concentration 1,5 mg P/l recommended by
HELCOM in the Baltic Sea catchment area was reached within the
applicable range of reagent dosages. The investigations were con-
tinued and further developed in semi full-scale conditions at a waste
water treatment plant in Tikhvin in the Leningrad area. /2/. The
experiments were carried out in an independent waste water treat-

43
ment line side by side with the main line of the waste water treat-
ment facilities of the town. The capacity of the experimental plant
was 4 500 m3/day. The experimental line contains two sand traps
of 2 m diameter with circular water flow, a vertical primary clarifier
of 10 m diameter, an aeration tank with three compartments (length
63, width 5,2 and construction height 3 m) and two vertical secon-
dary clarifiers of 10 m diameter. One similar clarifier was equipped
with air and technical water supply in order to prepare reagent
solution. The solution was made of standard pure aluminum sulphate
which is used in water treatment.
Based on average daily observations of influent to the aeration tank
the waste water had following characteristics: BOD loo-120 mg/l,
COD 200-300 mg/l, suspended solids SS loo-150 mg/l, total phospho-
rus 5-7 mg P/l, phosphates 2-3 mg P/l.
Before the experiments on biological-chemical treatment aeration
was put into operation with the following aeration basin parameters:
MLSS 3 g/l, activated sludge load of organic matter 100 mg BOD/-
g/day, sludge index 200 - 225 cm3/g and sludge ash content 33-
34 %. The removal of organic matter was very effective and total
phosphorus was removed by 40 %.
The concentration of phosphates was practically not changed. Simul-
taneously effective nitrification took place accompanied by dischar-
ge of gas bubbles in secondary clarifiers. The result was an increase
of suspended solids concentration in the effluent and frequent dis-
charge of secondary sludge from secondary clarifiers. So the prere-
quisites of effective biological treatment were established resulting
in a sufficiently high degree of purification including nitrification
and non stabilized operation of secondary clarifiers.
As soon as the reagent was introduced to the aeration tank the
discharge of secondary activated sludge stopped in spite of gas
bubbling. At that time the ash content of sludge was up to
39-41 % due to addition of insoluble compounds. Also sludge return
flow was increased. The changes of activated sludge properties led
to better sedimentation of sludge and the consequent improvement
of secondary clarifier operation. In spite of the increased MLSS up
44
to 4 - 5 g/l the active sludge was trapped in the infiltration zone
of secondary clarifiers and the whole system of biological treatment
operated in a stable manner.
However, turbidity due to small flocks occurred. The presence of
created sludge flocks was also revealed by a suspended solids con-
centration of 20 - 35 mg/l in the effluent which exceeds the permis-
sible level of biological treatment plant effluents. That is why the
experimental treatment line was equipped with an additional tank
for preparation and metering of polyacrylamide (PAA) flocculant.
A 0,5 - 1 mg/l PAA dose simultaneously with a 20 mg/l reagent
dose provided a stable 12 - 17 mg/l concentration of suspended
matters in the effluent which is in line with the quality require-
ments of treated water on suspended matters.
Biological-chemical treatment with addition of aluminum sulphate
provided a 75 per cent and 90 per cent removal efficiency of
phosphates with reagent doses of 9 and 14 mg/l (AL,O,) respective-
ly. A dose of 16-17 mg/l increased the removal of phosphates to
95 per cent as the residual phosphate concentrations were reduced
to O,l-0,2 mg/l. Total phosphate removal depends on reagent dose
and presence of suspended matter in treated water. The concentrati-
on of total phosphorus was reduced by 75-80 per cent with a 16-
17 mg/l (AL,O,) aluminum sulphate dose and the content of suspen-
ded matters in treated water was 12-17 mg/l. Without changing
the operation parameters of aeration tanks but with a 30-35 mg/l
concentration of suspended matter in the effluent, total phosphorus
removal was reduced to 50 per cent.
The modified biological treatment with alternating aerobic and
anaerobic conditions in the sludge provides a possibility to reduce
the required quantity of reagents or to even eliminate their use
completely. One of the possible technologies of effective phosphorus
removal is to use traditional biological treatment facilities. Biological
sludge from secondary clarifiers is exposed to anaerobic treatment
in special tanks. After that the sludge is returned to aeration where
it provides effective phosphorus removal from waste water.

45
Some facilities of the above mentioned technology have been tested
in the Municipal Water Supply and Treatment Research Institute
including contact and flowing conditions in pilot and full scale
plants. /3/. Activated sludges from various modes of biological
treatment were tested for their ability to release soluble phosphates.
The tests were carried out in 75 mm diameter 1,5 m high glass
columns allowing the possibility to take samples along the columns
to analysis. The modes of operation were extended aeration, heavily
loaded activated sludge process including reduced aeration periods
and separation of sludge mixtures by gravity and flotation and
thickening and, finally, the nitrification-denitrification process.
The phosphate release intensity was found to vary depending on
sludge type. It was connected with different oxygen conditions of
waste water treatment process and also with the availability of
combined oxygen in nitrates in the system. The most considerable
phosphate release was found with sludges of highly loaded treatment
with gravity thickening and the smallest with sludges from the
nitrification-denitrification process. The increase of phosphate con-
centration took place only in the sludge compaction zone. The clear
water preserves its initial phosphorus contamination. When mixed
the phosphate concentration is even in the total volume. During
further settling the phosphate release is going on in the sludge
compaction zone.
The method of biological waste water treatment with alternating
aerobic and aerobic conditions of sludge has been studied in labora-
tory pilot plants. Preliminary settled sludge mixture was taken from
an aeration tank in operation and poured into a laboratory tank.
Treated waste water was added to the same tank. The mixture was
aerated for 4 hours, then it was allowed to settle for 2 hours.
Supernatant was decanted and the sludge was left in peace until it
was released. Next morning all consecutive actions were repeated.
The aim of the investigations was to reach an elevated phosphorus
removal effect. The experiment went on continuously for two weeks.
As a result phosphorus removal increased during the first seven
days from 0 to 55 per cent. Then the process became stable and
the phosphorus removal remained on the level of 60 per cent.
4 402336X

46
Technical parameters of aerobic-anaerobic biological treatment ofwaste water with effective phosphorus removal were investigatedalso in a small full-scale plant. The plant consisted of a distribution
tank providing a possibility to regulate the incoming flow of waste
water, an aeration tank and a secondary clarifier and a tank for
phosphate release. Sludge was pumped with airlifts. Sludge recycled
from the secondary clarifier was directed to the phosphate release
tank and then returned back to the aeration tank. The plant was
operated on real waste water with the following characteristics:
BOD 60-120 mg/l, COD 170-235 mg/l, total phosphorus (P03-J lo-
23 mg/l, phosphates P03, 5-22 mg/l, ammonium salt 17-34 mg/l.
Technical evaluation of phosphorus removal was done based on the
following parameters characterizing the operation -of single units
Waste water flow 0,6-3,7 m3/hour
Sludge MLSS in the aeration tank 1,6-6,7 g/l
Sludge load 115-7 13 mg BOD/g sludge a day
Aeration period 1,6-4,6 hours
Sedimentation period in secondary
clarifier, 5-2,0 hours
Release periods of phosphate 2,2-6,5 hours
The results of phosphate release from the sludge in the aerobic
zone showed that the efficiency of the process is characterizedwith two parameters: time of phosphate release and organic load
of sludge. The last parameter determines the availability of combined
oxygen in the system and controlled degree of treatment on BOD.
Within an increased period of phosphate release in studied conditions
the efficiency of total phosphorus removal was elevated from 40 to
80 per cent.
Change of period of phosphate release had an influence on the
efficiency of ammonification and nitrification processes in the aera-
tion tanks. Within an increased period of sludge detention in theaerobic zone and under similar loads on active sludge, removal of
ammonia was poor with consequently smaller formation of nitrates.

47
With a 6 hour period of phosphate release and with a low load of
aeration close to complete oxidation there was no release of phos-
phate in aerobic conditions and there was practically no phosphate
removal in the aeration tank. Total phosphorus removal was not
more than 40 per cent.
Relatively stable and higher total phosphorus removal of 72-86 per
cent, and phosphates on average of 85 per cent, have been reached
with a 6 hour release period with heavily loaded aeration and wit-
hout nitrates in treated water. However, under these circumstancesremoval of organic matter was found to be inadequate or even poor
compared with traditional biological treatment.
With average loads the quality of effluent was as follows: BOD lo-
15 mg/l and COD 35-60 mg/l, content of suspended matters 24-28
mg/l, NO, 0,l mg/l, NH, 14-17 mg/l. In these conditions a very
high quality effluent was produced regarding phosphorus (2,5-4,0
mg/l, total phosphorus removal was about 80 per cent) and the
content of phosphates in treated water was 0,2-0,5 mg/l, (removal
efficiency 90-97 per cent).
The technical parameters of the experimental plant applying the
above mentioned conditions have been adopted as the basic design
principles of an experimental full scale plant project in order to
carry out further investigations on biological phosphorus removal.
REFERENCES
1. Zaletova N.A. Municipal Waste Water Treatment to control eut-
rophication of Water Bodies. Conference on the Baltic Sea Area
and its environment. “The Baltic sea, an environment worth pro-
tecting”, Karlskrona Kommun, 1987, pp. 225 231.
2. Zaletova N.A. Sharygin Y.M., Zaytsev A.V. Biological Chemicalmethod of waste water treatment. “Vodosnabzhenie i sanitarnayatekhnika” No 10, 1986 p.7 9.
3. Zaletova N.A. Removal of biogenic matters from municipal was-tewater.

48
Reports Publication, 5th Symposium “Technical progress in sewera-ge and municipal wastewater and industrial wastewater treatment”,Vama, 1988, V.3 pp. 22 25. Sophia, 1988 pp.135 148.Izdatelstvo “Stroitelstvo i arkhetiktura”.

49
Mineral addition in biolog ical treatment
process

50
Nutrient removal in biological treatmentprocesses
Rimmeters

51
MEASURES USED IN NUTRIENT REMOVAL FROM WASTE WATERS IN ESTONIA
U. Asmus, State Design Institute “Eesti Projekt”, Tallinn
In the 60ies, certain principles were agreed upon in Estonia for
initial measures to be taken concerning the processing of waste
waters and their discharge to water bodies. Scientific research was
started on the pollution of sea and rivers and their self-purification.
A worldwide practice assumes that sea water bodies apparently have
huge reception capacity of only partially treated waste waters. This
assumption has often been adopted by big enterprises and cities.
In the long run such pollution loads grew, due to big industrial
enterprises favored in our country, to such dimensions that they
damaged the self-purification ability of water bodies. The impor-
tance of nutrients increased inevitably. It has been shown that the
main origin of nutrients is agriculture (washed out mineral fertilizers
and liquid manure of highly concentrated big farms). All this has
caused the critical state of eutrophication of the Gulf of Riga and
Parnu, Vainamere and Peipsi Lake. Big industries have turned several
rivers into sewage channels (North-East Estonia).[ 11
The first unique and substantial measures to be used in Estonia
were, by 1975, two 3 km long sea outfall lines for sewage. At first
mechanical treatment was considered sufficient to maintain the self-
purification ability of big water bodies (i.e. Parnu and Tallinn). A
third similar sea outfall was put into operation by the end of year
1988 in Kohtla-Jarve industrial center where previously a 2-step
biological treatment plant had been constructed. Biological treatment
has been in operation for 20 years in the town of Narva where
waste waters flow into the Gulf of Finland via the big river (earlier
important for fishing industry). The plant is overloaded.
The Convention on the Protection of the Marine Environment of
the Baltic Sea signed in Helsinki in 1974 considerably enhanced
water protection measures in Estonia. From 1976 up to 1986 water
protection measures amounted to 156 mil. rubles in Estonia. Over
800 medium size or small treatment units of altogether 1.5 mil. m3

52
capacity per day were put in operation in the republic. The inten-
tion is to enlarge the existing treatment plants of Tallinn. Kures-
saare and Parnu by chemical-biological stages. The last two ones
are subject to specific processing due to meat and dairy indust-
ries which cause high nutrient concentrations and loads in the waste
water.
At present a new biological treatment plant is under construction
in Tartu, our university town, (75 000 m3/per day), in Kuressaare,
Saaremaa’s capital, in a district in Viljandi and in the town of
Rakvere (in collaboration with the impressive pollution role of the
new meat combinate)(Fig. 1). An extension is expected together
with an improvement in purification in the treatment equipment of
Narva District (up to 140 000 m3/day) and Kohtla-Jarve District’s
industrial center (up to 110 000 m3/day) and the biological treatment
facilities of V&-u, Polva, Paide and Haapsalu (each of them up to
10 000 m3/day) where dairy waste waters are dominating.[8]
In all these locations the waste waters have high nutrient content
and nutrient removal is thus envisaged, at the author’s initiative,
only at 4-5 biggest plants. [1,51
On the whole, as in Scandinavia, Estonia has dealt with the removal
of phosphorus for more than ten years. Reagent methods were
introduced with the aid of Moscow in Tallinn in 1985 (when ferrous
chloride dosage was 120-150 mg/l) and planned for Tartu, Parnu
and Narva and by our Finnish colleagues (by turn-key delivery) to
Rakvere. Ferrous chloride dosage has been envisaged after biologi-
cal treatment as post-coagulation with a dosage up to 15 mg/l.
Scientists at Tallinn Technical University have introduced a biologi-
cal method of phosphorus removal (anaerobic zone) which has proved
very promising. Besides, since the phosphate concentration is relati-
vely low in Tallinn, one should consider replacing the use of rea-
gents by other methods.181
Scientists have shown that water eutrophication cannot be comple-
tely avoided by removal of phosphates from waste waters (even
up to 0.5 - 1.0 mg/ll. It is also necessary to reduce nitrogen com-
pounds which is very expensive. [21 Total nitrogen removal should

53
according to HELCOM recommendations be achieved with special
treatment down to the level of 15 mg/l and scientific studies made
during three years to find out the practical possibilities of nitrogen
removal down to the level of 12 or 8 mg/l. On the author’s initiati-
ve, such a goal has been set in the uppgraded treatment plants in
Parnu (since 1984, 30 000 m3/day)(Fig. 2) and Kuressaare (since
1989, 6 000 m3/day, Fig. 3). In the new treatment plant in Narva
it is planned (to reach 140 000) to be constructed in 1990. The
Moscow Communal Academy is engaged in this research. Several
scientists and the author of this paper drafted recently regulations
for settling the water treatment plant issue in Kohtla-Jarve (50 %
is made up by urban waste water). The proposal envisages biological
treatment of industrial waste water, where local phenol removal
has been carried out, in parallel with a municipal water treatment
line. Both lines should have nitrogen removal by nitrification-denitri-
fication. The latter will test this method in the near future in the
1st section (Fig. 4)(in Parnu in full scale).
Successful application of the above mentioned method makes use
of mechanical mixing equipment. As such equipment is not manu-
factured in our country, we drafted in 1988 an agreement on joint
collaboration with the Swedish company “Flygt” for testing unique
submersible mixers and for more extensive deliveries to the first
objects (in Parnu, Kuressaare, Kohtla-Jarve etc.). The Estonian SSR
Ministry of Communal Services signed this agreement. The applica-
bility of the given method and mixers to remove nitrogen and
phosphorus was tested in a model state farm named after J. Gaga-
rin and in EKSEKO pig farm’s liquid manure handling plant, where
the author tried to introduce this method for the first time in the
USSR (taking as an example the urban waste water treatment). Later
on the contribution of VODGEO scientists helped to achieve even
better results. After manure decanting by reagent method and one-
stage primary anoxic zone with the Menzel circulation system the
content of ammonia in aeration tanks was reduced from 1500 mg/l
to lo-20 mg/l.(Fig. 51. Yet the final content of nitrates stayed over
50-100 mg/l in denitrification because of insufficient organic matter,
Ten submersible mixers of the company “Flygt” were used, with a
pitch diameter of 60 cm (N = 13,5 kW). The results can be conside-
red fairly good since it is so difficult to treat such waste waters.

54
While expanding treatment equipment in Narva and Kohtla-Jarve,
we are planning to introduce analogous Menchel-type circulationaeration tank where the water flow (velocity being 0.4-0.5 m/s)
will be created by the company’s “Flygt” multidimensional and low-
gear pitch flow makers.(Fig. 6). It helps to save electrical energy
to a great extent which is a must at that locality. Here the anoxiczone with a low oxygen content environment will be created in
the reactor’s inner circular channel which receives raw water toget-
her with recycling activated sludge from final sedimentation basin.
The first such reactor tank will be constructed for this purpose inthe town of Rakvere for their water treatment complex (20 000
m3/day). Additional savings of electrical energy will be achieved
by recirculation from the outer circular corridor into the inner
one which will noticeably reduce the pumping energy via the final
sedimentation basin. I think that in such a way the existing aeration
tanks, when being reconstructed, should be applicable in the new
treatment process (extensive experience in Sweden), but using the
Flygt low head PP-mixers for inner recirculation.
As far as small types of treatment plants are concerned, the Tallinn
Technical University has tried to test the anoxic-aerobic method
(using the example of Denmarkl.171. The system seems to have
reached perfection, thanks also to the consulting company “VIAK”
in Sweden. We would very much welcome joint collaboration with
this company!
Collaboration on a consultation basis has started with the Danish
company “Kruger” for the adjustment of the real “Danish inventi-
on”, on the author’s initiative, in Parnu sewerage works and in
EKSEKO plant (treating pig manure, were denitrification was solved
by me more economically) (Fig. 5).
We hope that this joint venture will also form a foundation formanufacturing some equipment jointly (cap aerators, jet aerators,submersible mixers). This would make it possible first of all to
deliver such equipment to Estonia and other Baltic countries in
order to guarantee the necessary treatment measures for the protec-tion of the Baltic Sea (nitrogen removal has become increasingly
55
important). The companies “Flygt”, “VIAK” (prefers jet aerators
and SB reactors) and “Seikone OY” (using bio-rotors technology)
have proposed scientific-technical and manufacturing cooperation
to enhance modern waste water treatment in small Estonian treat-
ment plants. As far as dewatered sludge handling is concerned, one
Finnish company has proposed an idea (of Japanese origin) of joint
manufacturing of cornposting mixers. We also have technical coopera-
tion with the company “Humboldt” in the field of centrifuges (a.
ACM), started 10 years ago.
The above mentioned joint ventures will assist us in reaching the
environmental protection goals to be introduced in our IME (“Self-
supporting Estonia” -program). At the same time we hope to guaran-
tee, in collaboration with others states, protection of the Baltic
Sea from anthropogenic violence. With the described measures Esto-
nia can by 1995 contribute in reducing the pollution load of indust-
ries and municipalities to the Baltic Sea. Thus the Estonian share
of the entire load might be as follows: organic - 13 %: nitrogen-
12 %; phosphorus - 9-10 %. These figures are significant when we
consider the fact that we are a very small republic with the popula-
tion of a million.
The author’s opinion is that the attitudes towards consideration
of “sewage treatment plant or deep-sea outfalls” have changed also
due to technical-economical motivations. Therefore we should always
abandon the idea of erecting expensive sea outfalls. Instead, resour-
ces should be directed to effective waste water treatment in order
to protect eutrophication of the coastal areas of the sea and to
avoid overloading of the sea with nutrients.( Fig. 7).
LITTERATURE
1. Asmus, U. Parnu kanalisatsioonirajatiste too tohusus kuurordi
sanitaarse seisundi parandamisel.
“Keskkonnakaitse” 1984, nr. 1.
2. Bundgaard, E. Methods for removal of nutrients from wastewa-
ter. Seminar on progress in water protection measures. Hanasaari
Cultural Center. Espoo, Finland, 17-21 act. 1983.

56
3. Christensen, M.H. Laboratory experiments with denitrification.Rep. 73-l. Dep. of San. Engn. Techn. Univ. Denmark. 1973
4. Kayser R. Braunschweig T. Ein Ansatz zur Bemessung einstut-tiger Belebungslagen fur Nitrifikation-Denitrifikation. Gwf-Wasser/-Abwasser 124; 1983. nr. 9.
5. Kommunaalveevarustuse ja veepuhastuse TUI “Lahtenoouded Parnukanalisatsiooni puhastusseadmete projekteerimiseks” Moskova. 1983.
6. Krauth, Kh., Kapp. H. Veranderung des Stickstoffs im Abwasserdurch seine Behandlung in biologischen Klarenanlagen. Gewasser-schutz. Wasser/Abwasser. Bd 69. Aachen. 1985.
7. Molder. H. Reoveest biogeensete ainete korvaldamine. “Tehnikaja Tootmine” 1985. nr. 6.
8. Asmus. U. Molder. H. L&nmastiku intensiivarastusest kanalisatsi-ooni puhastusseadmeil. “Keskkonnakaitse” 1987. nr. 5.
9. Schlegel. S. Bemessung und Leistungsvermijgen von Nitrifikat-sions-Denitrifikatsionsanlagen. BD 69. Aachen. 1985.
10. Kangas. A. Kylasaaren DN-typenpoistoselvitys Helsingin vesi javiemarilaitos. 1989.

--r i
I I1 II II I
I I
I I
I I
I I
L J---
Fig.1 MENZEL AEROTANKS IN RAKVEREPLANT
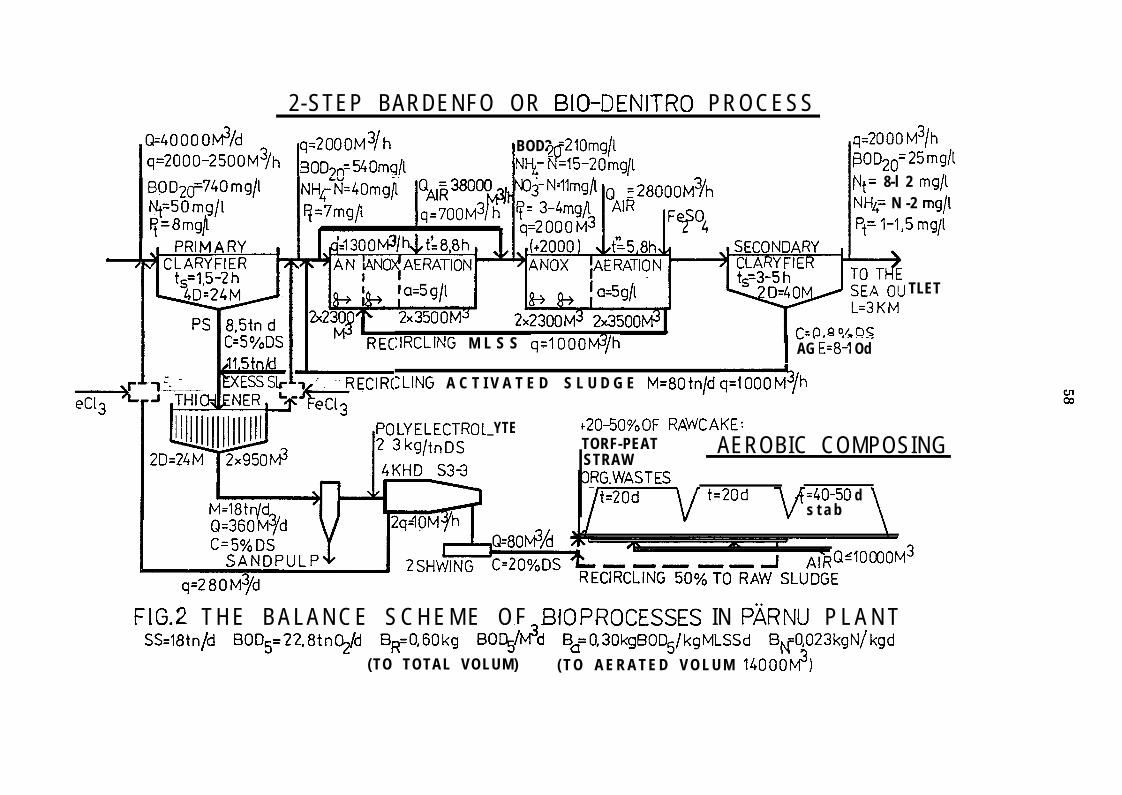
2-STEP BARDENFO OR BIO-DENITRO PROCESS
Q=4000 0M3/d
1 q=2000_25OOM3/hq=2000M3/hIB()D.,n= sOmg/[
BOD2 -2lOmg/\
I ifNHL- =15-20mg/l
BOD2@74Omg/lNt=50 mg/lFf=Smg/
= 28000M3/h
q=ZOOO M3/hBOD20=25 mg/lNt= 8-l 2 mg/lNH4= N -2 mg/lPt= l-1,5 mg/I
:IRCLING M L S S q~lOOO~/h I-,- ,“--
AG E=8-1 Od
ZLING A C T I V A T E D S L U D G E M=80tn/d q=1000M5/h
TLET
_YTE t20-5O%OF RAWCAKE:TORF-PEATSTRAW
AEROBIC COMPOSING
t=ZOd =40-50 ds t a b
FlG.2 THE BALANCE SCHEME OF BIOPROCESSES IN P;iRNU P L A N TSS=18tn/d BOD5=22,8tn0.$d BR=0,60kg BOl&&?d B,=0,30kgBOD5/kgMLSSd BrO,023kgN/kgd
(TO TOTAL VOLUM) ( T O A E R A T E D V O L U M 14000M3)

I
I!
-I-
I!v
$&zsh-___ _ - - ---
FjGJiHE BUANCESCHEME OF WASTE WA-TER-HANDLING IN KURESAARE PLANT

60
7
_ .
!
I

61
EFFiURvT TO THE 5k?+‘iX’&DS
5 4JJ2336x

62
_I
-I

Fig. 7 MINIMIZING REDUCED COSTS OF PLANT
N = 0.4 mtn. &Oinhabit ants
7,oCsS=250mgll
;$$znded 6,0
4 ,0Organicingradients3,0
C(mln. roubles)Capital costo f t reatment
p lan t
Presented10.0
example:9.0
Q=Q3mln.m3/d
LSS (km)C
LBOD (kmI2.0E2
I
II stage treatm.
level/
Advancedleve l for presentremoval o f nut r ients
them biol. treatm.?fudge in ciner?G
artal. biol. treatm. mech.treatmentludgodr)e;;al * mech. slud e -
dewater in BI I I I I I I
80 60 40 20
RImIn. roubles)Reduced costsper year
R=O,12C+O 1
0 -0perat ional cost5per year
380
C-cap i ta t cos tsper year
For advanced treatmerlevel : Et= 95%2,o for BOD, NH4 ,P
Loutl.=2,1 km
Treatment efficiencyI I I I 1 1 I
,o I3.0 4,o
I5.0 6,O
I Outlet ( by SS >
3.0 4.0 50 Outlet length( by BCDeffluent)
64
ACTIVITIES OF THE HELSINKI COMMISSION ON MATTERS RELATED TO NUT-RIENT DISCHARGES FROM URBAN AREAS
Vassili RodionovTechnological SecretaryBaltic Marine Environment Protection Commission- Helsinki Commission -
First of all, I wish to convey to all participants the most cordialgreetings of the Executive Secretary of the Commission, CommanderFleming Otzen, and his wishes for a successful meeting.
In the strategy adopted by the Commission the value of seminarsdealing with technical advance in the Baltic Sea Area is stressedand the Baltic Sea States are encouraged to host seminars in thefield of technology. Such seminars convened on a regular basis underthe umbrella of the Helsinki Commission make valuable practicalcontribution to further development of cooperation and promotefruitful exchange of information.
The Convention on the Protection of the Marine Environment ofthe Baltic Sea area (Helsinki Convention), concluded in 1974 andin force since 1980 is the basic foundation of cooperation amongthe Baltic coastal states. This Convention is the first internationalinstrument to deal with all different sources of pollution in res-pect of a given maritime region.
The great importance and need for further steps to reduce the subs-tances most harmful to the ecosystem of the Baltic Sea was under-lined in the Declaration on the Protection of the Marine Environ-ment of the Baltic Sea Area adopted and signed during the ninthmeeting of HELCOM in February 1988 by the Ministers of the BalticSea States responsible for the environmental protection. In thisenvironmental-political document the ministers declared, inter alia,their firm determination to reduce substantially heavy metals, toxicor persistent organic substances and nutrients in the order of 50% out of the total discharges of each of them as soon as possiblebut not later than 1995. Taking into account this serious goal,
65
consideration of all available and possible technical means is quite
necessary.
Therefore, the exchange of information and knowledge on environ-
mental technologies including preferential treatment is emphasized
in the Declaration.
In the framework of the Commission the problems of reduction of
nutrient discharges are dealt with on the branch-oriented basis
and comprise:
- municipalities
- agriculture
- industry
- fish farming.
The aim of this presentation is to outline the activities of the
Commission in the area of nutrient problems in urban areas, i would
like to show how these items have been dealt within the whole
scope of reduction of land-based pollution.
The principles and obligations in the work concerning land-based
pollution are formulated in Article 6 of the Convention, the first
paragraph of which is very simple and clear:
“The Contracting Parties shall take all appropriate measures to
control and minimize land-based pollution of the marine environment
of the Baltic Sea Area.”
Goals, criteria and measures concerning the prevention of land-based
pollution are specified in Annex III to the Convention:
“In accordance with the provisions of Article 6 of the present
Convention the Contracting Parties shall endeavour to attain the
goals and apply the criteria and measures enumerated in this Annex
in order to control and minimize land-based pollution of the marine
environment of the Baltic Sea Area.

66
1. Municipal sewage shall be treated in an appropriate way so that
the amount of organic matter does not cause harmful changes in
the oxygen content of the Baltic Sea Area and the amount of nut-
rients does not cause harmful eutrophication of the Baltic Sea Area.
2. Municipal sewage shall also be treated in an appropriate way to
ensure that the hygienic quality, and in particular epidemiological
and toxicological safety, of the receiving sea area is maintained at
a level which does not cause harm to human health, and in a way
that under the given composition of the sewage no significant
amount of such harmful substances as are listed in Annexes I and
II of the present Convention is formed.
3. The polluting load of industrial wastes shall be minimized in an
appropriate way in order to reduce the amount of harmful substan-
ces, organic matter and nutrients.
4. The means referred to in Paragraph 3 of this Annex shall in
particular include minimization of production of wastes by processing
techniques, re-circulation and re-use of processing water, developing
of water economy and improvement of qualifications for water
treatment. In the treatment of waste water mechanical, chemical,
biological and other measures, according to the quality of the waste
water, and as required to maintain or improve the quality of the
recipient water, shall be applied.
5. The discharge of cooling water from nuclear power plants or
other kinds of industries using large amounts of water shall be
effected in a way which minimizes the pollution of the marine
environment of the Baltic Sea Area.
6. The Commission will define pollution control criteria, objectives
for reduction of pollution and objectives concerning measures,
including processing techniques and waste treatment, to reduce
pollution of the Baltic Sea Area.”
The Commission, already at its interim stage established a working
group, under the Scientific-Technological Working Group (STWG)
and later on the STC, to consider various aspects and to make
67
relevant proposals, which might be necessary to fulfil1 the obliga-
tions of Article 6 of the Convention. This group is known as the
WGS (Working Group on Criteria and Standards for Discharges of
Harmful Substances into the Baltic Sea Area).
During 1980-1985 the Commision adopted more than 10 Recommenda-
tions concerning hazardous and noxious substances listed in Annexes
I and II of the Convention.
The First Periodic Assessment of the State of the Marine Environ-
ment of the Baltic Sea, covering the five-year period from 1980 to
1985 (BSEP No. 171, showed that there had been progress in the
state of the marine environment compared with the state of the
Baltic evaluated in 1980 (BSEP No. 5). Concentrations of toxic subs-
tances like DDT, PCBs and mercury in living organizms and seawater
were decreased. Unfortunately, the trends of nutrient content in
the Baltic Sea and the oxygen conditions in its deep basins turned
to be still discouraging. Investigations made revealed an urgent
need to take all appropriate measures to treat municipal sewage
and industrial wastewater with special emphasis on the reduction
of discharges of nutrients.
In the Medium-Term Plan adopted in 1984 as HELCOM Resolution
5/A, the Commission gave high priority, inter alia, to evaluation
of effects and elaboration of proposals for appropriate action against
discharges of nutrients and oxygen-consuming substances into the
marine environment. Special emphasis was made on improvement of
technologies for reduction of nitrogen compounds. At the same time
it was pointed out that branch-wise approach should be established
for elaboration on criteria and standards taking into account the
varying need for reduction measures within the different branches.
As a first step HELCOM Recommendation 6/7 was adopted by the
Commission in March 1985. It was declared that:
a) appropriate criteria and measures be applied to sewage discharges
in order to control and minimize land-based pollution and eutrophi-
cation of the marine environment of the baltic Sea Area. In the
treatment of the wastewater mechanical, chemical, biological and
other measures, according to the quality of the wastewater, and as
68
required to maintain or improve the quality of the recipient water,
shall be applied;
b) where nutrient removal is of primary concern appropriate treat-
ment should be carried out, for example, by replacing or combining
biological treatment with chemical precipitation or other methods
of equal efficiency; and
c) where nitrogen removal is found more necessary than phosphorus
removal, the treatment described above should be replaced by or
combined with nitrogen removal methods.
First branch-oriented projects were established in late 1985. One
of them was the project for matters related to discharges from
urban areas, Sweden as Lead Country. The main task of the project
was to promote the development of methods for collection and
treatment of sewage and stormwater from urban areas.
The project worked successfully during its initiative stage resul-
ting in recommendations adopted by the Commission in 1986 (HEL-
COM Recommendations 7/3, 7/4 and 7/5). According to HELCOM
Recommendation 7/3 the sewerage systems should be renewed in
such a way that infiltration and exfiltration be minimized, a separa-
ted or a semi-separated sewerage system should be selected for
new developments. HELCOM Recommendation 7/4 invisaged that
those parts of urban wastewater which are of industrial origin and
contain heavy metals or other harmful substances which cannot be
reduced in a central treatment plant to the environmentally accepta-
ble level, should be pretreated on the spot of their formation, i.e.
before entering the sewerage system. Recommendation 7/5 concerning
reduction of discharges from urban areas by the treatment of
stormwater, indicated that measures should be taken already at the
source and the first flush of stormwater especially from heavily
polluted industrialized urban areas be purified. (The Recommendation
was later superseded by Recommendation 9/9 containing specific
limits for overflows).
69
Since the tasks given for the project were fulfilled, in 1986 a new
project on urban areas was established to deal with:
- combined sewer overflows;
- pretreatment of industrial wastes before discharge into municipal
sewerage systems;
- control programmes;
- implementation of nitrogen reduction in municipal wastewater
treatment.
To stress again the importance of seminars it is fair to recall that
the activity of the project was favoured by the ideas provided by
the Visby Seminars 1986 and 1987.
The work of the project resulted in a draft Recommendation concer-
ning measures aimed at the reduction of discharges from urban areas
by the use of effective methods in wastewater treatment. It was
discussed and adopted by the Commission in two steps: in 1987
(HELCOM Recommendation 8/3) and in 1988 (HELCOM Recommenda-
tion 9/2). It was declared that:
a) urban wastewater deriving from households or industrial enter-
prises should be collected and treated before being discharged into
water bodies; by-passes may only be used in emergency cases;
b) domestic sewage or wastewater of similar type which is collected
in a central sewerage system and treated in wastewater treatment
plants, loaded with more than 10 000 person equivalents, should be
treated as soon as possible and not later than 1998 by biological
methods or other methods giving equivalent results, so that the
treatment should result in:
- at least 90 % reduction of BOD,; and
- at most a concentration BOD, in the effluent of the treatment
plant of 15 mg/l;
- annual average values of total phosphorus below 1,5 mg P/l.
Since no consensus could be reached upon an effluent concentration
of nitrogen, it was decided that, as a start, each Contracting Party

70
should start research and evaluation projects with a purpose to
give a basis for further recommendations for nitrogen removal within
three years. The projects should, inter alia, include studies of pro-
cess technology and costs for nitrogen removal to reach the targets:
(i) 12 mg total nitrogen/l in the effluent water or 50 % reduction
of total incoming nitrogen;
(ii) 8 mg total nitrogen/l in the effluent water of 75 % reduction
of total incoming nitrogen.
The results of the research and evaluation projects should be repor-
ted at annual seminars held within the auspices of the Helsinki
Commission.
The first specialist meeting of this series was the Fourth Karlskro-
na Conference on the Health of the Seas (7-9 June 19881, which
concluded, inter alia, that:
- the development and application of more efficient and cost-effec-
tive techniques to reduce the load of nutrients should be encoura-
ged;
- research on microbial and other processes governing nutrient
removal in industrial and municipal wastewater treatment plants
should be encouraged with the aim of developing reliable design
and operation strategies, e.g. as regards nitrogen removal techni-
ques;
- measures should be taken to substantially reduce discharges from
industrial point sources by means of best available technology;
- measures should be taken to connect all urban areas to sewage
treatment plants utilizing advanced techniques for nitrogen and
phosphorus removal. For example, precipitation could be applied
rapidly at all major sewage treatment plants, which at present
have only mechanical or biological treatment, in the catchment
area of the North Sea and the Baltic Sea.

71
This Tampere seminar is expected to be an important step in theexchange of relevant information among the experts, and implemen-tation of the decision of the Commission. It would be of great valueif the seminar could agree upon certain actions that might be takento facilitate the formulation of future HELCOM Recommendations.
The adoption of more stringent Recommendations is not the aim initself. Protection measures recommended should lead to improvementof the marine environment. In this respect the prerequisite forfuture decisions by the Commission is the better knowledge of thestate and changes in the marine environment. The results of theevaluation are important tools for decision-making. Comprehensivemonitoring programmes and assessments play a key role in the workof the Commission. The IIId stage of the Baltic Monitoring Prog-ramme (BMP) started from 1 January 1989. The preparation of theIInd Periodic Assessment is in its final stage. In January 1990 thedata collecting for the IInd Pollution Load Compilation will beginaccording to the Guidelines adopted by HELCOM 10.
Special emphasis is given to the follow-up on implementation ofHELCOM Recommendation and the Ministerial Declaration by theeach Contracting Party. The Commission has initiated the workaimed to collect, in harmonized way, information on action takenand results achieved by each country on the basis of the adopteddecisions. The information collected at regular intervals (each 3years) will be considered by the Commission with a view to prepara-tion of new Recommendations, revision of existing ones or any otheraction necessary. The new reporting system was established byHELCOM 10 for this purpose.
Successful work of the Commission requires not only multinationalcooperation but bilateral and individual efforts as well. There is apositive trend that environmental aspects are also now involvingcooperation between twin-cities, universities, enterprises aroundthe Baltic.
Since the problems in the Baltic Sea Area have much in commonwith those appearing in other sea areas, e.g. the North Sea, strengt-hening of cooperation with other international organizations, prima-

72
rily with the Paris Commission is essential. In the HELCOM strategy
such cooperation is stressed as an important item, because it not
only generates new ideas for the work but also is of benefit in
harmonizing activities and goals in specific questions.
To complete, I would like to wish once again all success to the
Seminar and its participants.

73
SIMULTANEOUS PRECIPITATION
Mr. Risto Saarinen
The Water Protection Association of the Vantaa River and Helsinki District
INTRODUCTION
Simultaneous precipitation is a major concept in municipal wastewa-
ter treatment plants in Finland. In the end of 1987 75 % of the
water was treated by simultaneous precipitation process ferrous
sulphate being the chemical used for phosphorus removal. This paper
covers recent data and the experiences we have gained in Finland
using ferrous sulphate for two decades.
FERROUS SULPHATE - POTENTIAL FOR PHOSPHORUS REMOVAL
Ferrous sulphate is a by-product of titanium dioxide production.
Roughly when you get a kg of TiO, you also get 3-4 kg of FeSO,
x7H,O. Titanium dioxide production in Europe is rather high and
ferrous sulphate is easily available. Also other by products such as
pickling waste liquor can be used for phosphorus precipitation.
Annual ferrous sulphate amount from TiO, production in Europe is
roughly 1,6 million tonnes per year. Assumed that the product inclu-
des 18 % iron the production equals phosphorus amount of 300 000
kg/d with molar ratio 1,5 mol Fe/l mol P. This means that existing
TiO, plants could serve treatment plant of 100 000 000 p.e. if we
assume a 3 g P/person/day load. The hypothetic calculations above
don’t include the acid solution of TiO, production nor the pickling
liquor from metal industry.
Ferrous sulphate is available in Finland as heptahydrate, a product
which reminds wet snow. Drier forms of the chemical are also
produced. Tetrahydrate and even more monohydrate are free flowing
and are available. Drying of the product is an economical matter
not a technological problem.

74
Table 1. Ferrous sulphate production in Europe
Methods of use and disposal of wastes from titanium dioxide productionin selected ECE member countries (Replies to ECE questionnaire)
(Thousands of tonnes per year)
I Disposal and utilisation 1I I of acid solutions
Belgium (E)CzechoslovakiaFinlandFranceFed.Rep. of GermanyItalyNetherlandsNorwayPolandSpainUnl ted Kingdom (E)
Discharge to Recycling orsea or river other uses
140
3;; 0272: 15100,511937,3
67+9,8220
25,O90
_994,O
3522,83
Neutrallzatlon
27,5
Disposal and utilizationof ferrous sulphate
Water Pigment Dischargetreatment production to sea
Belgium (E)CzechoslovakiaFinlandFranceFed.Rep. of GermanyItalyNetherlandsNorwayPolandSpainUnited Kingdom (E)
ii!74,7
374,57
81
28,07
65 278 4
96,6
2614,6442,8
172,55
Storage
48263,4
10,o
E I estimated values

75
REACTIONS OF IRON AND PHOSPHORUS
Iron if ferrous sulphate is in bivalentic form (Fez’). Phosphorus
in wastewater is detected mainly as ortho-, poly- and other
phosphates and organic phosphoric compounds. Roughly one half of
the phosphorus is in the form of orthophosphate and the rest of it
tends to be degraded to ortophosphate by hydrolysis during the
activated sludge process.
The following, simplified reactions take part in the process:
Fe2* Fe3’ + e- [ll
Fe2* + 2 OH- Fe(OH), ElFe3* + 3 OH- FeW-0, 131
3 Fe2’ + 2PO,3- Fe,(PO,l, [41
Fe3’ + PO,3- Fe PO, [51
The speed of oxydation of ferrous iron to ferric iron [ 1 I is favoured
by higher pH and oxygen concentration and presence of activated
sludge.
Ferrous hydroxyde and ferrous phosphate formations [21 141 are slow
reactions and the stability of the products is very low. Only in
very narrow pH range ferrous iron stays in the precipitated form.
Thus the main reactions are ferrous iron oxydation [l] and ferric
hydroxyde and phosphate precipitation reactions [33 [5].
Theoretically 1 mol (56 g) iron is needed for the precipitation of
1 mol (31 g) phosphorus. The iron consumption in practise is inc-
reased by side reactions (hydroxydes etc.), redissolving of phospho-
rus, load from sludge treatment and the lack of the load vs. dosage
control. The consumption is decreased by adsorption to the activated
sludge and the precipitation caused by the iron, aluminium and
calsium in the raw wastewater. The evaluation of these factors
hasn’t been done thoroughly. A molar ratio (Fe/P) of 1,5 -2,0 has
shown good results.

76
Based on the theory above ferrous sulphate can be added in one
point, but it’s more economical to use two or sometimes even three
adding points.
Ferrous sulphate is generally dosed according to the flow changes
or on a steady chemical flow basis. Even once-a-day adding is used.
Iron is bound to the activated sludge floe and can build a storage
of chemical. However, most accurate and economical results are
reached if the feeding follows the phosphorus load.
FULL SCALE EXPERIENCES
In the following some results are given of the Finnish simultaneous
precipitation plants and three plants are described more detailed.
Whole country
In the end of 1987 there were 578 municipal wastewater treatment
plants in Finland. 392 of them had simultaneous precipitation as
the treatment concept. 42 of these plants had a load of 10 000 p.e.
or more. The results of these plants are shown in pictures la -Id.
The plants are put in order according to the phosphorus mass flow
to the plant. The average phosphorus concentrations (stressed with
the flow) of the influent and effluent were 7,4 and 0,69 mg/l.
Phosphorus reduction in these plants was 91 %.
The concentration limits set by the authority varied between 0,8
and 1,5 mg/l. Reduction efficiency limits varied between 80 and 90
%. These conditions were met in most cases. Some exceptions exis-
ted, but clear solutions to the problems can usually be found: 1)
Soluble phosphorus concentration could easily be reduced till the
level of 0,l - 0,3 by using 10 - 30 % more ferrous sulphate. In
addition, the chemical is advised to be dosed in two points, for
instance 80 % to the pre-aeration and 20 to the end of the aeration
basin. 2) Suspended solids concentration can also be reduced to
one half by adding polyelectrolytes to the outlet of the aeration
basin. Polyelectrolytes help as well plants with high as plants with
low solids concentration. The dosage varies mostly between O,l-

77
1,0 g/m3 wastewater. Usually the consumption is between one to two
thirds of the amount used in sludge conditioning.
Some problems in phosphorus removal have occured in plants with
nitrification need. Due to the cold climate sludge age has to be
even 20 - 25 days which causes problems in capturing the solids inthe final clarifier. Denitrification in the clarifier and lack of alka-
linity in some cases have shown to make the problem even worse.
However, if the plant is well designed and operated, a good result
should be obtained by simultaneous precipitation.
Detail examples
The operation conditions and results of one small and two medium
size treatment plants are shown in table 2 and picture 2.
Tuusula plant is a small and simple plant treating 3 500 p.e. load.
It consists of screen, aeration and sedimentation. The sludge isthickened with lime and transported to be treated elsewhere. Hyvin-
kaa plant treats 19 600 p.e. load. It consists of screen, pre-aera-tion, primary clarification, aeration with anoxic part of 40 % and
secondary clarification. The sludge is thickened with lime and driedwith belt filter presses. Riihimaki plant treats 22 300 p.e. load. It
consists of screen, pre-aeration, primary clarification, two Carrousel
type aeration basins and two secondary clarifiers. Diary wastewater
(5 - 10 % of the inflow) is pre-aerated separately and led directlyto the aeration basins. The sludge is thickened, digested anaerobical-
ly, dried with belt filter press or centrifuge and composted.
6 402336x

ExEhlent quality
Removal efficiency
Phosphorus reduction
V&water flow

79
Table 2. Operation conditions in Tuusula, HyvinkM and RllhlmIlkiplants in 1988.
Ferrous sulphate (FeS04x7H20) Lime (Ca(OH)2)
Process Process Sludge tr.
t/a g/m3 gFe/gP molFe/molP t/a g/m3 t/a
TUU 40 200 4,7 286 0 0 11HYV 455 150 4,2 293 54 17 180RI1 484 110 2,7 1,5 + + 0
Polyelektrolyte 1
I I Process Sludge treatment
Energy
HWh/a kWh/m3 kWh/BODi kWh/BODr
TUU 170 0,30 6,3 6,8HYV 1190 0,37 3,4 3,4RI1 1850 0,41 1,8 1,8
Plants8 TUU I Tuusula HYV - Hyvlnk&li
Meanflow
m3/d
t
TUU 570HYV 8700RI1 12240
RI1 I RllhlmCLkl
BODi = BOD in the plantBODr = BOD removed in the whole process

.._Ia
- -_-__
<=?‘I,- - - ---- --_v 4. . >_ _ _ _ - - - - -
-;1’. .QJ mJ s. 9 g-.& rJ- g
-_- _
\
\.
a $4 5 $
C
5Id 8
/a
IF--4-4-
-im\-
-
,i
an 0
Picture 2. Phosphorus removal rerulta in Tuurula, EyvinkM and Rilhl-mllkl plantr in 1988

81
LITERATURE:
Arvin E., Observation supporting phosphate removal by biologically
mediated chemical precipitation - a review, Water Sci. Technol.
15( 1983), 43-63.
Arvin E. and Skaarup J., An equilibrium model for the removal of
soluble phosphate with ferrous iron in simultaneous precipitation
plants, Vatten 35(1979):2, 125-137.
ECE/CEM/65, Use and Disposal of Wastes from Phosphoric Acid and
Titanium Dioxide Production, Economic Comission of Europe, United
Nations, 1988
Ghassemi M. and Recht H., Phosphate precipitation with ferrous
iron, EPA, Wat.Poll.Contr.Res.Ser. 17010, EKI 09,71, 64 p.
Grohman A. et.al., Geschwindichkeit der Phosphatfallung mit Eisen( I-
II)-Salzen und der Einfluss von Calsiumionen, Vom Wasser 62( 1984),
172-189.
Lijklema L., Interaction of orthophosphate with iron(II1) and alu-
minium hydroxides, Envir. Sci. Technol. 14( 1980):5, 537-41.
Niemela A., The optimation of the control of simultaneous precipi-
tation process, University of Technology, Espoo, 1987
Theis T. and Singer P., Complexation of iron(I1) by organic matter
and its effect on iron(II)oxygenat Envir. Sci. Technol. 8( 1974):6,
569-573.
Valve M., Combined nitrogen and phosphorus removal from wastewa-
ters, Publications of the Water Research Institute, No. 58, pp. 28-
54 National Board of Waters, Helsinki, 1985

82
FLOTATION-FILTRATION - A METHOD OF UPGRADING PHOSPHORUS REMOVAL
Dr. H. J. Kim-u
Ahlstrom Aquaf low Oy
INTRODUCTION
Simultaneous precipitation has proved to be a serviceable method
for phosphorus removal in waste water treatment. In Finland, for
instance, it is widely used, and nowadays the values of total pho-
sphorus P,, = 0.5 - 0.8 mg/l treated water are easily met when
simultaneous precipitation is applied in an activated sludge plant.
When an extremely low content of phosphorus is required, say
Ptot = 0.1 - 0.3 mg/l, combined to BOD,-value less than 10 mg/l
or even 5 mg/l, a conventional solution throughout the world has
been to have a tertiary stage with filtration in a treatment plant.
Using flotation filters instead of plain filters in the tertiary stage
is a new process combination in advanced waste water treatment.
Over five years’ full-scale experience with a medium-size activated
sludge plant with simultaneous precipitation in Savonlinna, Finland
which is fitted with tertiary flotation filters shows that really good
operational results including total phosphorus P,, < 0,3 mg/l can
be continuously achieved in this way with a lower overall cost than
by using plain filters in tertiary treatment.
FLOTATION FILTER - A MONOLITHIC COMPOSITION OF TWO UNIT OPERATIONS
The standard model of flotation filter containing a conventional
downflow sand filter and an inlet shaft fitted with dispersion equip-
ment for flotation, which is carried out in the head above the filter
bed (fig. 11, was developed in Sweden in the 1960’s and patented
in most western countries. During the last 25 years flotation filters,
which save a lot of construction cost, have become very popular
for water treatment plants in Finland, where in fact it has never
been patented.
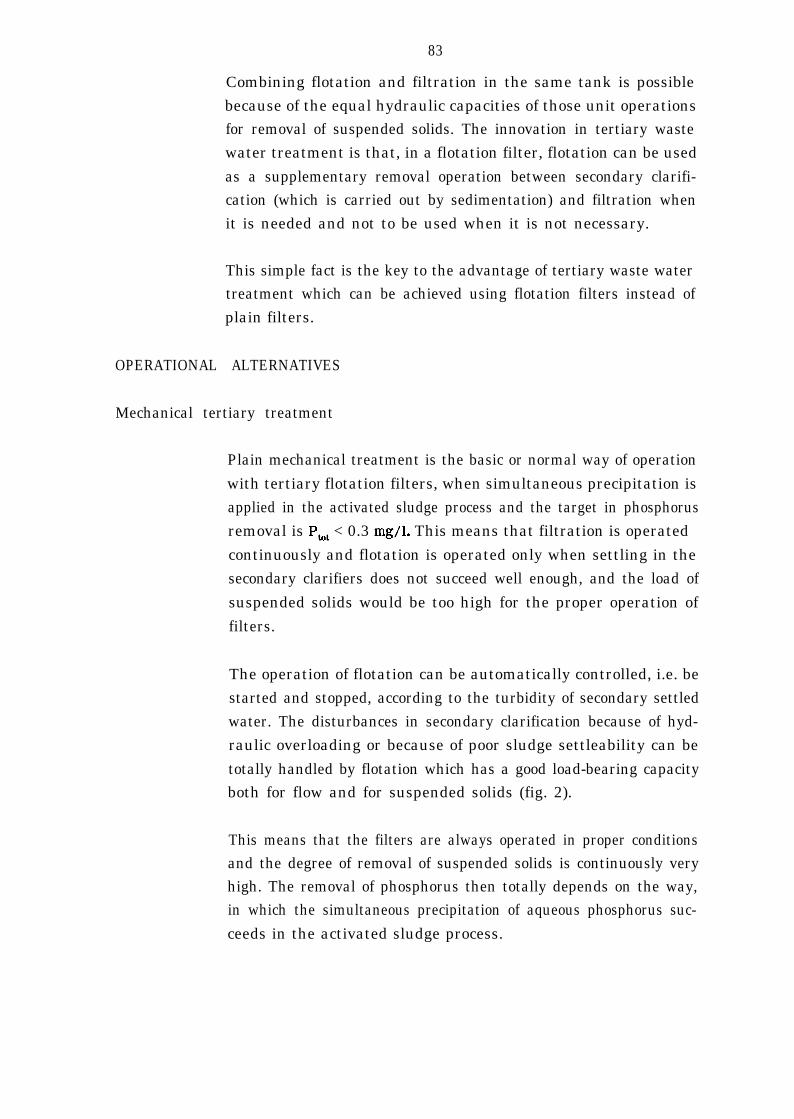
83
Combining flotation and filtration in the same tank is possible
because of the equal hydraulic capacities of those unit operationsfor removal of suspended solids. The innovation in tertiary waste
water treatment is that, in a flotation filter, flotation can be used
as a supplementary removal operation between secondary clarifi-cation (which is carried out by sedimentation) and filtration when
it is needed and not to be used when it is not necessary.
This simple fact is the key to the advantage of tertiary waste watertreatment which can be achieved using flotation filters instead of
plain filters.
OPERATIONAL ALTERNATIVES
Mechanical tertiary treatment
Plain mechanical treatment is the basic or normal way of operation
with tertiary flotation filters, when simultaneous precipitation is
applied in the activated sludge process and the target in phosphorus
removal is P,, < 0.3 mg/l. This means that filtration is operated
continuously and flotation is operated only when settling in the
secondary clarifiers does not succeed well enough, and the load of
suspended solids would be too high for the proper operation of
filters.
The operation of flotation can be automatically controlled, i.e. be
started and stopped, according to the turbidity of secondary settled
water. The disturbances in secondary clarification because of hyd-
raulic overloading or because of poor sludge settleability can be
totally handled by flotation which has a good load-bearing capacityboth for flow and for suspended solids (fig. 2).
This means that the filters are always operated in proper conditionsand the degree of removal of suspended solids is continuously veryhigh. The removal of phosphorus then totally depends on the way,in which the simultaneous precipitation of aqueous phosphorus suc-
ceeds in the activated sludge process.

84
Experience shows (Table 1) that when simultaneous precipitation isoperated properly (PO,-P < 0.1 mg/l, the value of total phosphorus-P,, less than 0.3 mg/l in treated water can be continuously ac-hieved.
Table 1 Pihlajaniemi Waste Water Treatment Plant
(Savonlinna, Finland)Operational results as monthly averages(analysis from 24 hrs collection samples)
Month/year BOD7 Ptot NH4-N SS
mg/l mg/l mg/l mg/l
June
JulyAugustSeptemberOctoberNovemberDecemberJanuaryFebruaryMarchApril
May
1989II
5 0.34 0.1 33 0.26 0.1 54 0.21 0.8 43 0.15 0.1 23 0.16 0.1 34 0.10 0.4 15 0.30 0.5 24 0.17 0.4 23 0.14 0.1 22 0.14 0.7 29 0.37 1.0 59 0.36 0.4 5
The operational reliability of the treatment plant is clearly seenfrom the values of suspended solids in the table. The monthly avera-ges are from 24 hrs collection samples taken daily.
A good total load-bearing capacity of the flotation filter tertiarystage given by flotation also means that the whole process can bewell controlled in all circumstances and no bypassings of the secon-dary stage will happen when snow melts or in rainy weather.
When the bypass arrangements of the unit operations are adequateand a crossover between the secondary clarifiers and the flotation

85
filters is possible, the secondary clarifiers and the flotation filters
can even be operated side by side. This doubles the hydraulic capa-
city of the treatment plant and the total treatment standard willstill be moderately maintained even when exceptional high flows of
waste water have to be treated.
Because of a good load-bearing capacity of the whole process, thetreatment plant and all unit operations can optimally be dimensio-
ned. This means that the construction cost of a waste water treat-
ment plant fitted with tertiary flotation filters is very reasonable
(Fig. 3).
The operating cost of a treatment plant fitted with tertiary flota-
tion filters is also moderate when plain mechanical treatment with
flotations filters is applied. The operating cost of flotation filters
is very low, because flotation is effectively used only when needed,
and filtration can be operated in optimal conditions, which means
long filter runs and a low consumption of backwash water. One
must remember that a conventional single-medium filter with coarse
sand (grain size d 2-3 mm) is correct for tertiary flotation filters
in order to achieve an equally low content of suspended solids intreated water with tertiary multi-media filters.
Contact filtration
When really low values of total phophorus, say P,, = 0.1 mg/l,
are required in treated waste water, the precipitation of aqueous
phosphorus can be boosted by introducing with a minute dosage oftrivalent iron or aluminium (Me3’/P0,-P < 1.5 -2.5) into the secon--dary settled water.
This means that filtration in the flotation filters is operated so
called “contact filtration” which is a widely used method with ter-
tiary filters in Switzerland, for instance. However, the operationalprinciple of the flotation filters is still the same as it is in
mechanical tertiary treatment. Full-scale trials in Savonlinna have
shown that contact filtration can easily be applied with tertiary
flotation filters. Results in phosphorus removal have been fullycomparable to those achieved in Switzerland with tertiary filters.
86
The amount of chemical sludge in contact filtration coming fromfilters into the backwash water is so little that it does not causeany problem in the activated sludge process or in sludge dewateringwhen the backwash water with possible flotation sludge is returnedin the primary clarification and taken out of the water processtogether with primary sludge.
Together with a small amount of coagulant, this means that theoperating cost of the tertiary treatment with flotation filters ap-plying contact filtration is only a slightly higher than whenmechanical treatment is applied.
Post-precipitation
In order to ensure the best possible operational results, post-precipi-tation is also easily applied in tertiary treatment with flotationfilters. The dosage of aluminium or ferric sulphate into the seconda-ry settled water must then be quite large, 80 - 120 g/m3. No floccu-lation tanks are needed, because a flocculation sufficient for f lotati-on can easily be carried out in the inlet chamber connecting theflotation filters.
Flotation must be operated continuosly in post-precipitation toremove the floes created by chemical precipitation so that onlythe smallest ones (6 10 urn) can reach the filter bed and be removedby filtration. The huge amount of chemical sludge removed fromwater by flotation cannot be returned to the primary clarificationwith the filter backwash water. It must be separately taken off fromthe surface of the flotation filters and individually treated for wastedisposal.
Experience from full-scale trials in Savonlinna has shown thatresults in phosphorus removal with tertiary flotation filters arenot significantly better in post-precipitation than in contact filtrati-on. The average value of total phosphorus has been aboutPtot NN 0.1 mg/l. It has also been found out that in post-precipita-tion almost the whole reduction of phosphorus as well as other

87
impurities occurs in flotation, and the significance of filtration asthe last removal operation is negligible.
Because the operating cost of the tertiary treatment with flotationfilters applying post-precipitation is many times higher than byapplying mechanical treatment or contact filtration, post-precipita-tion is not a reasonable operational variation when the activated
sludge process is working normally.
The possibility to apply post-precipitation in tertiary treatment
with flotation filters is important, because it can be brought into
use when there are bad operational disturbances in the biological
activity of the activated sludge process or when it is totally out
of operation. In these situations, which are not unusual in practi-
ce, tertiary treatment with flotation filters will preserve the treat-
ment standard when post-precipitation is applied.
SUMMARY
Adding a tertiary treatment with flotation filters to a waste water
treatment plant using the activated sludge process fitted with simul-
taneous precipitation is a very effective method to carry out a
highgrade phosphorus removal with reasonable cost.
It is just the coexistence of flotation, the possibility to use flotation
between the secondary clarifiers and tertiary filters, which results
in flotation filters being much more efficient than plain filters in
tertiary treatment.
As a removal operation for suspended solids which has a good load-
bearing capacity both for flow and for suspended solids, flotation
ensures the proper operation of the treatment plant in all circums-
tances. Phosphorus removal can be boosted either by a light chemi-cal treatment, socalled “contact filtration”, or when need arises by
a full chemical treatment, post-prepicitation.
The flexibility of operation reached by using flotation filters in
the tertiary stage is such an important advantage that it can onlybe realized by a person who has operated or been in operational

88
response of such a plant in difficult circumstances caused, forinstance, by great variations in hydraulic and BOD-loading.
REFERENCES
Kiuru, H.J. (1988).Korkea-asteisen jatevedenpuhdistuksen toteuttaminen flotaation jasuodatuksen avulla - High-grade wastewater treatment with flotationand filtration (English summary). Helsinki University of Technology,Laboratory of Sanitary and Environmental Engineering, Report 1.

89
Fig. 1 FLOTATION FILTER
PLANE
DISPERSION WATER
.m...‘-,.c-......... . . . . . . . . . . . . . . . . . . . .. . . ..:..:_.. . . . . . . ..i.~...~.~.
SECTION

90
NUTRIENTS REMOVAL IN MUNICIPAL WASTEWATER
RECLAMATION SYSTEM
Prof. Jerzy Kurbiel
Cracow Technical University
INTRODUCTION
A new approach to water management, already implemented in
several countries, involves reclaiming water from municipal sewage
for industrial and commercial reuse.
Wastewater reclamation has multiple benefits including water conser-
vation and supplementing available water resources. This would also
result in a significant improvement of water quality in the recei-
ving streams.
The scarcity of the usable water in some regions of Poland makes
it necessary to search for such unconventional sources of water as
municipal sewage. Water reuse should become an important element
of the water management system, especially in the southern Poland:
Silesia and the Cracow region.
To solve an acute water shortage in the Upper Silesian industrial
region, water reuse technology has been studied since 1975. The
water reuse system that has been developed for this region includes
19 wastewater reclamation plants with a total capacity of 9 m3/s.
The implementation of these plants is included in future central
water planning 151.
The most commmon planned application of reclaimed water for
industrial purposes is to supply cooling systems. This amounts to
about 78 % of reclaimed water reuse; the others are: boiler make-
up water, washing of industrial products and water as a direct
products of manufactured products.
Nitrogen and phosphorus compounds are among the most important
constituents of municipal wastewater contamination. Both these
substances are obviously the main nutrients controlling biological

91
growth in the aquatic environment. Besides, the presence of anexcess nutrients results also in a poor water quality making waterunsuitable for the prospective municipal and industrial users.
The latter becomes particularly significant in the industrializedregions of the Southern Poland where the wastewater reclamationsystems are planned. Both nutrients: nitrogen and phosphorus arethe parameters limiting water quality with respect to applicationof reclaimed wastewater as an industrial water almost in all bran-ches of industry, particularly in industrial cooling systems. There-fore, the nutrients removal technology is an important part ofwastewater reclamation systems. It has also some unique featuresas a result of interrelation of nitrogen and phosphorus removaland other tertiary processes involved in complex wastewater recla-mation technology [31.
QUALITY REQUIREMENTS FOR NUTRIENTS IN RECLAIMED WATER
Both nutrients considered: nitrogen and phosphorus are not decisivefactors of water usefulness for industrial purposes in case of usingnatural water resources. River or lake water intakes are commonlycharacterized by a low concentration of nutrients; usually muchbelow the level which is harmful for the industrial processes. Forthat reason some industries did not even include nutrients into theirwater quality requirements [71. The problem of nutrients as qualityparameters is growing bigger when the reclaimed wastewater isconsidered as an industrial water source. Therefore, the permissibleconcentration of nutrients and degree of their removal needed tobe established separately for some industries.
Table i comprises the maximum recommended concentrations of nut-rients determined for the industrial users of reclaimed wastewaterin the South Poland. Values given for a cooling system refer tothe concentration of the circulating water; a level of nutrients inthe make-up water should be two times less then for the circula-ting water [2].

92
Table 1. Maximum required concetrations of nutrients for industrial
reuse of reclaimed wastewater [5, 71
Reclaimed water users NH,-N NO,-N PO,
gN/m3 gN/m3 g/m3
Metallurgy - surface coolingcirculating water with heatload:
lo6 kJ/m2.h105 ”104 ”
Steel melting shop and rollingmillsurface cooling, withwater alkalinity:
0.8 - 1.5 meq/dm31.5 - 2.0 ”4.0 II
Foundry - moulding massproduction
Machinery industry - platingand heat treatment of metals
Power plant - cooling cycle- heating cycle
Ceramic industry
Petrochemical industry
1.0-3.0x 4O.5-O.8x 43.5-6.0x 4
1.4-2.62.6-3.57.0
444
10.0
2 52.0
3-53
3 12 2.5
40 8
Xhigher numbers refer to short term deterioration
DEGREE OF TREATMENT
The degree to which wastewater is renovated is determined by theselection, combination and operation of unit processes. The selecti-on of advanced treatment processes to be used in wastewater recla-mation plant depends on the type and strength of wastewater availa-ble and the quality requirements of the uses considered for renova-
ted water.
All wastewater classes’ effluents coming from the conventionalsecondary treatment plants operating in the South Poland have beendivided into both types and classes. The two types differentiate

93
wastewater according to their inorganic content; within every typeof effluent two classes were established with different levels of or-ganics, suspended solids and nutrients (Table 2).
Table 2. Two classes of wastewater used for selection of wastewater
reclamation processes [51
Parameter Maximum values, g/m3
class 1 /full treat- class 2 /highratement/ treatment/
Suspended solids 20 50COD 40 100BOD, 20 50NH,-N 10 40Total N 20 60Phosphates 5 10
Assigning the effluent to either class helps to choose a proper
wastewater reclamation technology.
Water users category
Since different types of industrial plants employ the same or simi-
lar process technologies, the process water required in those manu-
facturing departments has the same water quality standards. It will
result in applying the similar water reclamation processes for certain
groups of process water which have been defined as follows [5].
Group I - high quality demineralized water used as boiler make-upwater or process and rinsing water in electroplating plants
Group II - cooling water used for surface cooling systems working
at high and medium heat load in steel plants
Group III - cooling water used in power plants for surface cooling.
This group also includes cooling water for surface cooling at low
heat load in steel plants and coke plants
7 402336x

94
Group IV - water for blast-furnace gas cooling, process water in
building industry, rinsing water in paint shops
Group V - water of the poorest quality used for slag granulation
hydraulic transport of slag and cinders in steel and coke plants
and foundry.
To meet the quality requirements in the first three groups of uses,
removal of nutrients is needed. Degree of treatment for ammonia
nitrogen is within the range of 50 % to 90 %. Group I reguires
ammonia concentration in reclaimed water to be less than 0,5 g
N/m3, which is practically very difficult to maintain on a continuous
basis; also a high degree of denitrification is essential in this group
of reclaimed water uses.
Phosphorus, another important nutrient which limits biological
growth in closed cooling water systems, should also be controlled
by proper, advanced wastewater treatment. A degree of phosphorus
removal for reclaimed wastewater required to prevent the develop-
ment of algae and slime producing organisms in cooling water circu-
lating through cooling towers is not attainable in the conventional
biological treatment processes; it requires more effective biological
or chemical methods 161.
PROCESS CONFIGURATION
A specific character of nutrients removal technology, being a part
of wastewater reclamation systems, results from: interrelation of
other tertiary treatment processes involved, complexity of the objec-
tives to be accomplished in the course of reclamation and importan-
ce of reclaimed water quality for its users.
Particular features that distinguish the nutrients removal processes
in a wastewater reclamation system compared to those aimed at
natural waters protection are:

95
- higher reliability and consistency of nutrients removal imposed
by the importance of industrial production requirements; as a resultof it double, two-stage or complementary processes are often desig-
ned.
- possibility of utilization of nutrients removal potential existingin other types of wastewater renovation processes provided to cont-rol another refractory contaminants; it improves technical andeconomical feasibility as well as the removal efficiency of the whole
treatment system.
- operation of whole or at least a final part of the wastewaterreclamation processes, under constant flow conditions.
- equalization of diurnal variation of nutrients in a final effluentsince reclaimed water is usually stored for a day before pumpingit to the users.
Process configuration for nitrogen and phosphorus removal, basedon updated practical experiences might be applied as three options:
a) three-stage, physical-chemical processes based on lime treatmentresult in phosphates precipitation and rise of pH in the 1st stageand removal of ammonia gas in a stripping process applied in the2nd stage. Break-point chlorination at the end of a technologicalscheme may operate as a complementary process for residual ammo-
nia removal
b) biological nitrogen removal combined with enhanced removal ofphosphorus in a multiphase biological reactor. This treatment tech-
nology, although implemented in full scale plants, is not yet reliableenough for wastewater reclamation for industrial systems.
c) combined biological and chemical process configuration. It con-sists of chemical precipitation as a 2nd stage of phosphorus removalfollowing biological treatment in a multiphase reactor as in optionb). Filtration and final chlorination, usually applied for other rea-
sons at the final part of the technological scheme, may be utili-zed as the complementary processes to improve removal efficiency

96
of both nutrients. The treatment option c) has been estimated as
the most feasible technology for implementation in the South Poland
141.
EXAMPLES OF MUNICIPAL WASTEWATER RECLAMATION VENTURES IN SOUTH
POLAND COMPRISING NUTRIENTS REMOVAL
The idea of municipal wastewater reclamation for industrial reuse
has emerged in Krakow in 1985 because of high salinity of Vistula
river water unsuitable for supplying the industrial cooling systems.
The research works that have been started in 1987 are aimed at the
selection of wastewater reclamation technogies and developing the
design criteria. The total capacity of the full scale plant is planned
to reach 2.3 m3/s.
The technology of the experimental pilot-scale units (Fig.1) at
existing municipal wastewater treatment plant has been developed
based on the experiences of the other countries, local wastewater
characteristics and required water quality with respect to the coo-
ling system requirements.
The unit processes comprise: biological nutrients removal supplemen-
ted by coagulation with alum, ferrous sulphite or lime alternativelytested, filtration and chlorination.
The efficient removal of nutrients takes place in consecutive, comp-
lementary biological-chemical and physical unit processes.
An example of a wastewater renovation plant projected within the
Silesian system of water reclamation with fully developed pilot-scaletechnology experiments and design work is located at Tychy [2].
The existing conventional activated sludge facility has a capacity
of 39 000 m3/d. The advanced multistage process designed for was-
tewater reclamation is expected to obtain 15 000 m3/d of water
for mashinery industry supply. The optimum flow diagram of thisplant is shown in Fig.2.

97
Icoagulant
scrccncdwastewaters
ANA
7to 0 cooling watermodel system
PC- prlmory c la r i f i e r SM-slow miring took
TH - thickener RM - ropid miring tank
ANA-onocrobic zone TC - tertiary cloriticr
ANOX- onoxic zone Duf-dual medio tilttr
AER- aerobic zone C F - c o n t a c t filtration
SC-sccondory clarifier P- pump
bed
FIG. 1 . S C H E M E O F T H E E X P E R I M E N T A L P I L O T U N I T S F O R C R A C O W
W A S T E W A T E R R E C L A M A T I O N .
H
2 C’z ClI2Cl. I
--a I ? -lI I
iIO
I I
;E :
; 1’;I z 2I I-l?I I I-i
I- t II ;
tI I
hcondory ! Reclaimedwater
- -cflluent
Gtrilication-denltrilicotion
Rapidmiring Flocculation Two stag* Dual media Activaied
CO2 removal t i l t rat ion carbonsedimentation and pH control adsorption
!I
and _
F I G . 2 . O P T I M U M F L O W D I A G R A M O F WASTEWAT,ER R E C L A M A T I O N S Y S T E M
S E L E C T E O F O R F U L L S C A L E P L A N T A T T Y C H Y .

98
REFERENCES
1. Van Haute A., Municipal wastewater reuse for various application.
Public Health Reviews 11/2/, 1982, pp. 135-176.
2. Bolek K., Kurbiel J., Patocka J., Polomski B., Styka W., Techno-
logical basis of water reclamation conception from municipal waste-
water at Tychy. Proc. of the 3rd Int. Symp. on Advanced Wastewater
Treatment, Krakow Sept. 1981.
3. Kurbiel J., Research and development in phosphorus and nitrogen
removal from municipal wastewater in Poland. Paper presented at
the 2nd Seminar on Wastewater Treatment in Urban Areas. Visby,
Sweden 6-8 Sept. 1987.
4. Kurbiel J., Zeglin K., Stojek R., Pilot plant study on municipal
wastewater reclamation technology for a steel plant cooling system.
Proc. of the 5 th Symposium on Technical Progress in Sewerage and
Treatment of Municipal and Industrial Wastewaters, Varna, Bulgaria
22-25 Sept. 1988.
5. Kurbiel J., Juszczak J., Mucharska A., Galuszka K., Sapulak A.;
Design guidelines for wastewater reclamation technology (in Polish).
Unpublished report, Gov. Research Project, Cracow Technical Uni-
versity 1985.
6. Mucharska A., Zeglin K., Kurbiel J., Integrated removal of car-
bon, nitrogen and phosphorus in the activated sludge process. Proc.
of the 5th Symposium on Technical Progress in Sewerage and Treat-
ment of Municipal and Industrial Wastewaters. Varna, Bulgaria 22-
25 Sept. 1988.
7. Water Quality Criteria. USEPA Washington 1975.

99
PHOSPHORUS REMOVAL IN SMALL TREATMENT UNITS
Mr. R. Storhaug
Aquateam, Norwegian Water Technology Centre A/S
INTRODUCTION
The primary goal for chemical treatment is to remove phosphorus
from the wastewater. Chemical treatment has mostly been used as
a supplement to the biological process (simultaneous or post precipi-
tation). However several treatment plants with only chemical precipi-
tation are in operation. This paper covers results and operational
experiences with regard to phosphorus removal in small wastewater
treatment plants in Norway.
In this paper “small treatment unit” is defined as treatment plants
with a design capacity equal or less than 1000 pe. Treatment plants
serving one single house or a group of houses are named “mini-
plants”. The mini-plants are normally owned and operated by the
residents. The small treatment plants are owned by municipalities
and privat institutions e.g. hotels or nursing homes. In the munici-
palities, the plants serve small neighbourhoods. Usually the influent
flow and composition of wastewater fluctuate widely. Usually the
plants are placed inside buildings, concequently they are very com-
pact. The final result is a very small and sensitive treatment sys-
tem. These plants require high professional quality of the operators
and the supervisors. The main operating costs for these plants are
salaries for the operators, energy costs for heatling and ventilation
of the buildings and costs for transport of sludge to the dewatering
plants (Johansen, 1982 1.
For a municipality it is very expensive to have a permanent staff
of process experts. To solve this problem, several publicly owned
operating companies have been established. These companies employ
the necessary process experts, and support the local owners of the
plants.

100
REMOVAL OF SOLUBLE PHOSPHORUS
At the small chemical treatment plants aluminium sulphate, ferricchloride or slaked lime, are the most common flocculants. The reac-tions between Al”’ or Fe**+ and soluble phosphorus are briefly
described by the following equations:
lu2(S04)3 18H20 + 2PO43’ UlPO4 t 3S042- t l8H2O
AL~(S04)3 l8ii2O t 611Co3- Ul.(0Ii)3 t 6CO2 + 3SO42- + 181120
FGI.~ 6~~0 t PO4 ~0~0~ t 3a- + 6~~0
1wx3 6t120 t 311c03- E’e(OH)3 t 3c02 t 3a- t 6H20
1)
2)
3)
4)
Equations 1) ans 3) show that 1 mol of Me (Al or Fe) combineswith 1 mol of PO, to form 1 mol of MePO,. Equations 2) and 4)show that the flocculants also neutralize the alkalinity in the was-tewater to form MetOH), and CO,. Equations 11, 21, 3) and 4) aresimplified The actual reaction process is a combination of precipita-tion, adsorption and ion exchange.
Two criteria have to be met in the operation of small chemical
wastewater plants that use Al- or Fe-salts as flocculants.
1. Addition of flocculants to achieve a molar ratio, p$? 12. Addition of flocculants to lower the pH value to the range wherethe solubility of the PO,-complex is at a minimum (figure 1).

101
Figure 1 Solubility diagrams for solid phosphate phases (Leckie
and Stumm, 1970)
Equation 5) describes the reaction between lime (Ca(OH),) and PO,.Equation 6) describes the reaction between lime and the alkalinity.
5Ca2* + 40H- + 3HPOa2- Ca,OH(PO,), + 3H,O 5)Ca2’ + HCO, + OHCaCO, + H, 6)
Figure 1 shows that at pH values higher than 9.5, all of the calciumphosphate complexes have reached the solubility minimum. Thecomplexes have poor settling properties. To improve the settlingcharacteristics the pH value has to be raised to 11.0 or higher toform CaCO, and Mg(OH),. Magnesium hydroxide has a gelatinouscharacter that improves the flocculation process.
For operation of chemical treatment plants that use lime Ca(OH),as flocculant, one criterion has to be met:
1. Addition of CatOH), to reach a pH value higher than 11.0.
If the Mg-concentration in increased by addition of seawater, thetarget pH value is in the range 9.5-10.0. Table 1 shows pH rangesfor optimal precipitation.

102
Table 1 Typical pH Ranges for Otimat Precipitation (aegaard, 1988)
FlocculB.nt Practical pH rangeAluminium sulphate 5.5-6.5Fer14.c chloride 5.040Lime 11.0-12.0
For simultaneous precipitation plants the optimal pH range is 6.5-
7.5. The drinking water in Norway is mainly supplied from lakes,
consequently the alkalinity in the municipal wastewater is low,
typically 2-3 meq/l. When nitrification occurs in the biological
treatment step, the alkalinity in the wastewater is consumed. The
addition of coagulants consumes the alkalinity too; as a result the
pH in the chemical treatment step drops too low to obtain satisfac-
tory precipitation of phosphorus. To counteract this reaction sodium
bicarbonate (NaHCO,) or lime (CaOH,) are added to the biological
treatment step on many plants.
FLOCULANT DOSING CONTROL SYSTEMS
At plants that are uning Al or Fe salts, pH is the most important
process parameter. Normally the dosing of congulants are controlled
by one of three methods.
1. Flow- proprotional control
The flocculant is added on a constant rate according to the flow
through the plant. The quality of the wastewater is regarded as
constant. Practical experience shows that this is not true. In pe-
riods with rain and snowmelting the alkalinity changes and the pH
becomes too low to obtain optimal precipitation of phosphorus.
2. Flow - proportional control combined with pH feed - back control
The pH is monitored after addition of coagulants. If the pH value
differs from the optimal value, a regulator changes the dose of
coagulants added. Practical experience shows that it is difficult

103
to adjust the regulator, resulting in pH fluctuations. This is aspe-
cially true on small wastewater treatment plants.
3. Flow proportional control combined with alkalinity feed - fore-
ward control.
At many plants there is a linear relationship between alkalinityand conductivity. This relationship is used to control the flocculantaddition. The conductivity in the wastewater prior to the additionof flocculants is monitored. If the alkalinity in the wastewaterdecreases, the conductivity decreases too. The necessary dose offlocculant to reach the optimal pH range has to be roducod. So farthe practical experiences with this control system are very good.
PROCESS LAY-OUT ON MINIPLANTS FOR PHOSPHORUS REMOVAL
Phosphorus removal in plants that are serving one single house isuncommon. However in some areas in Norway for instance, thePollution Control Authorities require phosphorus removal on themini-plants as well. Figure 2 shows a miniplant for chemical treat-
ment.
Figure 2 Mini-plant (WALLAX) for chemical treatment
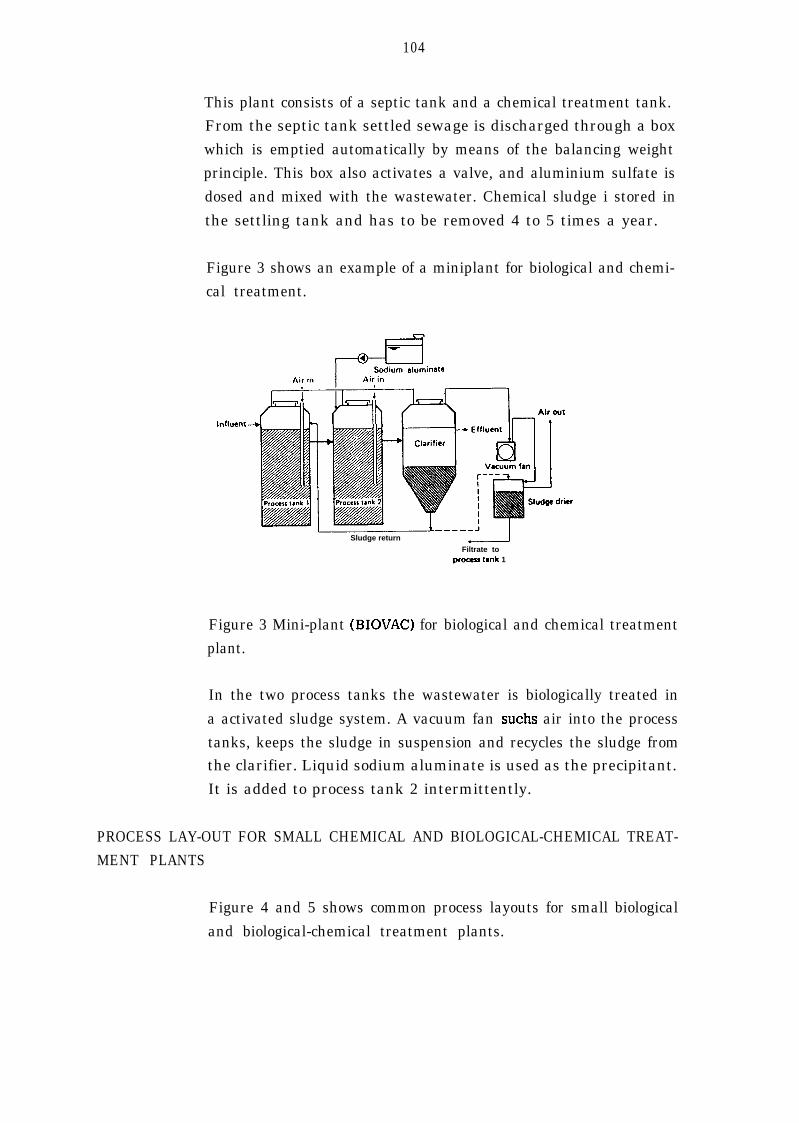
104
This plant consists of a septic tank and a chemical treatment tank.From the septic tank settled sewage is discharged through a box
which is emptied automatically by means of the balancing weight
principle. This box also activates a valve, and aluminium sulfate is
dosed and mixed with the wastewater. Chemical sludge i stored in
the settling tank and has to be removed 4 to 5 times a year.
Figure 3 shows an example of a miniplant for biological and chemi-
cal treatment.
Sludge return
Filtrate toprocan tank 1
Figure 3 Mini-plant (BIOVAC) for biological and chemical treatment
plant.
In the two process tanks the wastewater is biologically treated in
a activated sludge system. A vacuum fan suchs air into the process
tanks, keeps the sludge in suspension and recycles the sludge fromthe clarifier. Liquid sodium aluminate is used as the precipitant.
It is added to process tank 2 intermittently.
PROCESS LAY-OUT FOR SMALL CHEMICAL AND BIOLOGICAL-CHEMICAL TREAT-
MENT PLANTS
Figure 4 and 5 shows common process layouts for small biological
and biological-chemical treatment plants.

105
FbCCUkWtladdicimn
Screen
Gril-chamber
Type B InllusnlFbcculanladdition
Transpon IOdewalterIng plant
Figure 4 Process layout small chemical treatment plant.

106
Flocculanl addilion
Gril chamber
-P---+Screen
Aeralion lank Final Seltling tank
b b
Simultaneous precipitationSludge slorago lank
Flocculanl addilionRDC I
Grit chambor
-N+Screen
FHjjJ I, f&k’@ _ Final setting fankl
BiologIcal and chemical sludge
Combined precipitation
1 1eked slud(.~ ’
Sludge storage lank.
Fiocculanl addillon
Grif chamber Acralion lank
Relurn sludge
Post precipitation I ISludge slorago lank
Figure 5 Process combination for biological and chemical treatment

107
The pretreatment of the wastewater consists of a bar screen and
grit chamber, or a septic tank. The septic tank is used as a com-
bination of pretreatment unit and sludge storage tank.
The flocculants are added by a dosing pump or a dry feeder to a
continuously operating dissolving unit. The flocculator is divided
into 2 or 3 separate chambers with vertical paddlers. Sludge from
the settling tanks is pumped to a separate sludge storage tank or
to a septic tank. From the storage tanks, the sludge is transported
to a larger plant for dewatering.
Table 2 Effluent Standards for Small Treatment Plants
Process Annuil average (g/m3)tot-p BOD7
Iani-plants:
Chemical
Halo#cal chemicti
1.5
1.0 20
_ ~~ ~~ ~
Chemical treatment
Sbmiltaneous precipLtation
Combined pred@tation andpost precipitation
0.5 60
1.0 30
0.5 15
Undoubtedly all process combinations are available to meet the ef-
fluent standards. However, an number of factors influence the per-
formance stability of the plants.
TREATMENT RESULTS
It is of great importance to have reliable information concerning
the performance of the treatment plants, because the investment and

108
Mini-plants
operating costs are considerable, and the plants play an important
role in the protection of the inland waters.
Treatment results from the mini-plants are very scarce. In Norway
all mini-plants have to pass an approval system. In this system theplants are tested for half a year.
The treatment plants that are shown in figure 4 (WALLAX) havebeen tested. For three plants the average effluent concentration
for tot-P was 0.8 mgP/l. Minimum and maximum values were 0.4
and 1.9 mg P/l.
Two BIOVAC plants (figure 4) have been tested and the average ef-
fluent concentration for tot-P was 0.6 mg P/l. Minimum and maxi-mum values were 0.1 and 2 mg P/l.
A signed service contract is required in order to get permission to
install a mini-plant. The operating experience shows that the service
contract is the most important factor to obtain reliable treatment
results.
Chemical treatment plants
The treatment process is normally monitored by frequent analysesof PO,-P in the effluent and measurements of the pH value and
secchi depth. This is done by the operator. The pollution control
authorities sample for discharge control 4-6 times per year. Normal-
ly, flow proportional one day composite samples are taken. Table 3
gives some basic information on 17 small chemical treatment plants
in Norway and Sweden.

109
Table 3 Basic Information on 17 small Chemical Treatment Plants
Name of No Des@ ActualAverage Type of Average Type ofthe pIant P0 Pe flOW floccu- dose wastewater
@/dw) ht (g/m3
Ostby 1 700 360 72 Al-sulphate 247 MutlicipelStrandlykkja 2 160 9 Lknilphate 177 MUtliCiptClSjusj0en 3 1000
v3A*,173 Al-sulphate 245 Recr.area
FagerfjeU 45 600
- 59 Al-miL/Fe-cL- HotelFleaberg 230 89 Ahmlphate 150 MLlEiCLpalsonh0gda 6 100 varies - Al-Fdphate 140 MunicipalTyrifjorden 7 - - 19 Ill-s-hate 200 NurahomeMYtig
i%E
; - - - Fe-chloride - Hotel
10 400 220 110 100 ;; Al-sulphate Al-sulphate 230 170 MUtllCipel MUI3iCips.lVrsIlgfoss 11 600 4:: 170 Al-sulphate 133 MuniCipalSvenseid 12 380 25 Al-sulphate 275 Mdpa;lAkkerhaugen 13 900 500 '73 Al-sulphate 81 MUIXIdpelWand 14 400 100 - Iilme 500 MllddplDrangaen 15 190 100
2:IiLule 820 Mtidpsl
K&nge 16 360 210 Lime 284 MUIliCLpllFegered 17 300 40 29 L;Lme 486 MUliCipal
Ortho-P in the influent is not a routine analysis, but based on
previous experience (Eikum et al., 1979) the soluble phosphorus
corresponds to 60 % of the total phosphorus. The molar ratio Al or-Fe is in the range 3 to 4. This is due to high alkalinity in the
wastewater and less than optimum utilization of flocculants.
The annual average influent and effluent
P from 17 small chemical treatment plants
in figure 6.
concentrations for total
are computed and shown
8 402336x

110
Plant 1-13: Annual average 1988Plant 14: Annual average 1984-1985Plant 15-l 7: Annual average 1982-l 984
_I 2 3 4 5 6 7 8 9 10 11 12 13 14 I:, 16 17
Plant numberWB lntluent m Effluent
Figure 6 Annual averages for influent and effluent concentrationsof tot-p from 17 chemical treatment plants.
Biological-chemical treatment plants
In 1985 an investigation of the effluent concentrations from alltreatment plants in Norway was conducted. The investigation inclu-des information about 174 small (design capacity 50 to 1000 pe)biological-chemical treatment plants. The most important characteris-tics for the process combinations are shown in table 4.

111
Table 4 Background Data for the Treatment Plants Included in
the Survey
Tot&L AverageProcess Number Median number o f eaalrik3 nlJJnber o f earntie
o f Dedgn Actual Years in totP B O D 7 SS totp BOD7 SSplants cap. load operation
(PE) X (yeare)
slmiltaneouspre&dtatiorl
Activated sludge 88 300 62 a 403 349 239 4.58 3.97 2.72
Combinedprecipitation
RBC 36 400 50 6 163 149 26 4.52 4 . 1 4 0 . 7 2
Poet predplbtationActivated sludge 49 500 48 6 234 165 152 4.77 3.37 3.10
Table 4 shows that simultaneous precipitation plants are the largest
group. Fifty percent of the plants have a design capacity equal or
less than 300 PE. The simultaneous precipitation plants have been
in operation for a longer period of time compared to the combined
and post precipitation plants. This is due to the fact that many of
the simultaneous precipitation plants are former biological treatment
plants. Consequently the plants are not designed for phosphorus
removal.
Suspended solids (SS) is normally not a part of the discharge permit,
consequently the number of SS data is small compared to the number
of tot-P and BOD, data.
For each plant the annual average (1985) was computed for tot-P,
BOD, and SS. The annual averages for the plants are shown in
cumulative frequency plots in figure 7 and figure 8. Table 5 shows
average and median concentration, and average removal efficiency
for each process combination.
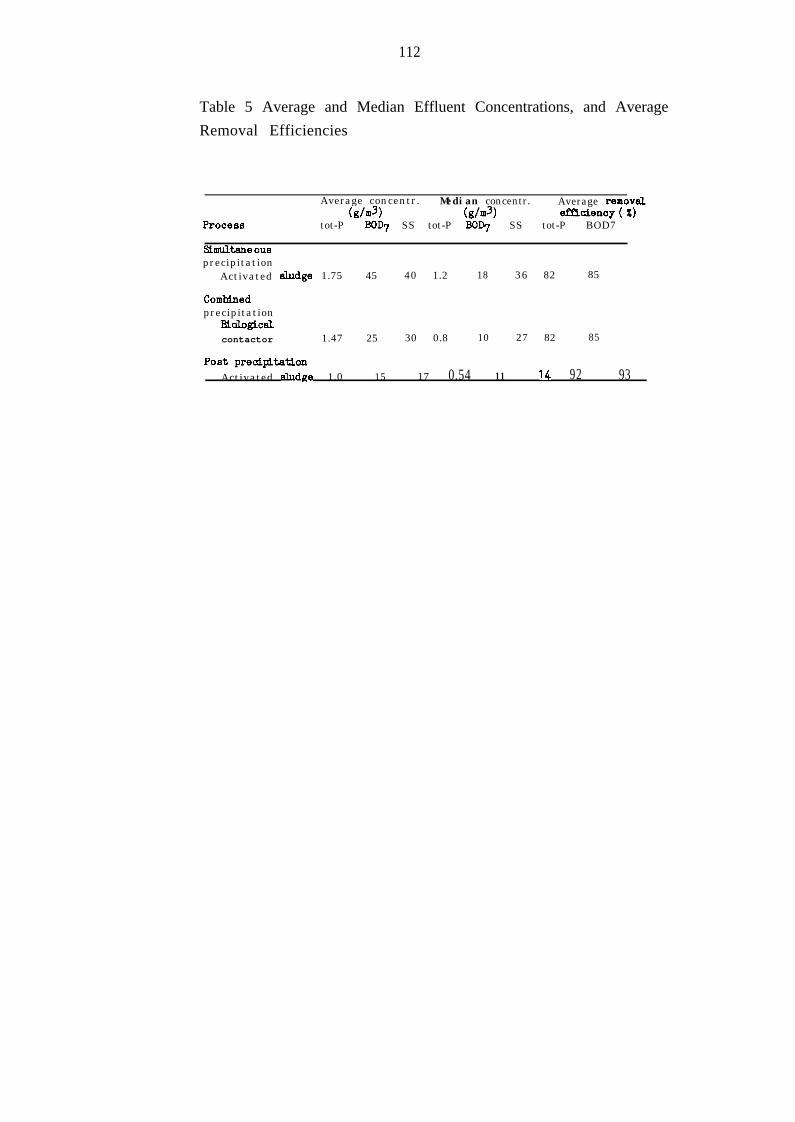
112
Table 5 Average and Median Effluent Concentrations, and Average
Removal Efficiencies
Average concentr. Median concentr.Wm3) (g/m31
Average removilemclency ( X)
Proceee tot-P BOD7 SS tot-P BOD7 SS tot-P BOD7
Sinrultene OUBprecipitation
Activated sludge 1.75 45 40 1.2 18 36 82 85
Co&bedprecipitation
EU.OgiCELl
contactor 1.47 25 30 0.8 10 27 82 85
Poet precLpLt.ationActivated sludge 1.0 15 17 0.54 11 14 92 93
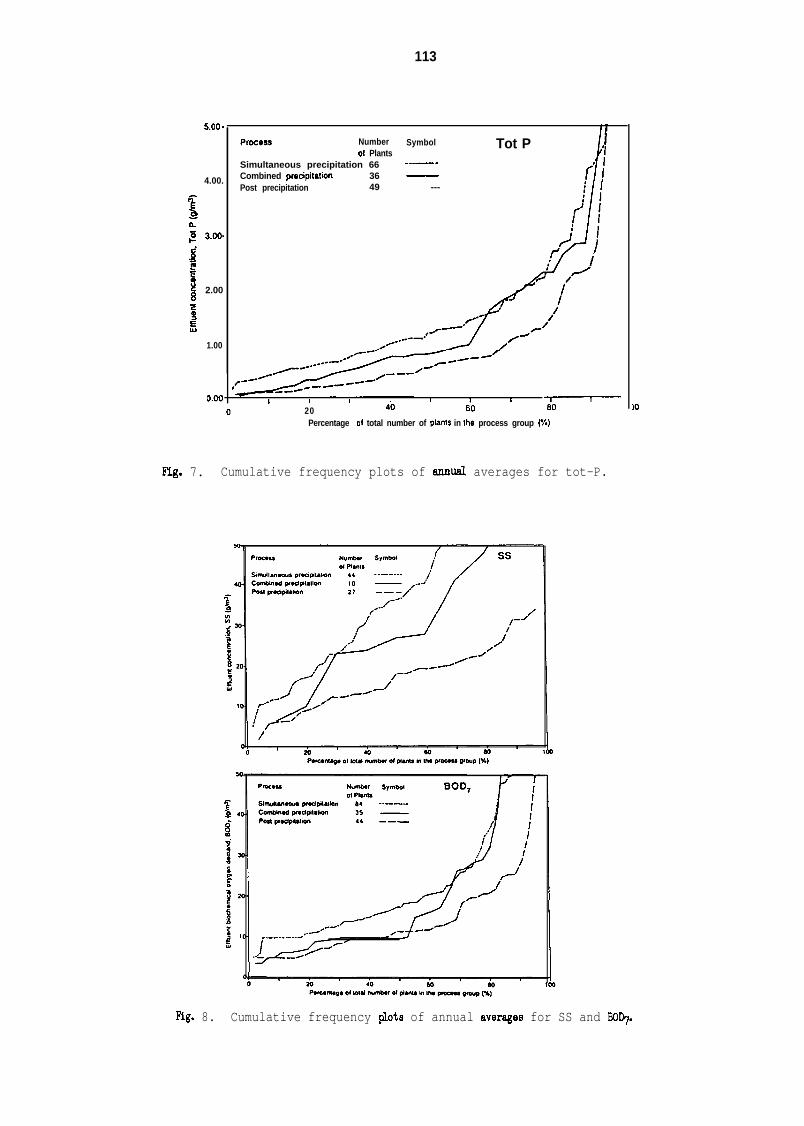
113
5.00 -
4.00.
5n.z 3.00.
s%
1 2.00
EfE
1.00
o,oo Y-J-~-“‘---I I I
4’0I 1 I
0 20 60 7
PnJCesS Number Symbol01 Plants
Simultaneous precipitation 66 __.-_-
Combined precipilation 36 -Post precipitation 49 ---
Tot P
_‘.’____-___A-
Percentage ot total number of planls in lhe process group (%)
Fig. 7. Cumulative frequency plots of annual averages for tot-P.
10
Fig. 8. Cumulative frequency plots of annual average8 for SS and BOD7.

114
Figure 7, figure 8 and table 5 clearly show that the process com-
binations have different levels of performance. Simultaneous precipi-
tation has the highest concentrations for tot-P, BOD, and SS. Fifty
percent of the post precipitation plants meet the effluent standard
for phosphorous removal and 70 % meet the effluent standard for
removal of BOD,. Thirty percent of the combined precipitation
plants meet the effluent standard for phosporous removal and 60 %
meet the standard for removal of BOD,. Forty percent of the simul-
taneous preicipitation plants meet the standard for phosporous
removal and 75 % meet the standard for removal of BOD,.
The frequency plots for SS (figure 81 show that the difference in
effluent concentrations between the process combinations is partly
due to the variation in the removal of particles. The separate sett-
ling tank for biological sludge on the post precipitation plants is
very favorable. Consequently the chemical treatment step acts as a
trap for biological sludge that escapes from the biological settling
tank. In most instances flocculation prior to floe separation will
improve separation on fine particles ((Megaard, 1987 1. The difference
in effluent concentrations between simultaneous precipitation and
combined precipitation supports this observation, Combinedprecipita-
tion and simultaneous precipitation shows the same removal efficien-
cy. This is partly due to higher influent concentrations on the
simultaneous precipitation plants. Many of the simultaneous precipi-
tation plants do not use automatic sampling units for the influent
samples. The influent concentrations are consequently based on grab
samples.
FACTORS THAT HAVE INFLUENCE ON THE TREATMENT PLANT PERFORMANCE
There are many factors that influence the effluent concentration
at treatment plants apart from the basic differences in process.
Table 6 shows the factors that were judged by the local water
authorities and plant owners in the investigation in 1985 as the
most important critical factors.

115
Table 6 Factors that Negatively Influence Treatment Plant Perfor-
mance
Factor sxmultaIleoue Combined Poet Totalprecipitation precipitation
x xprecipl~ti0r.l (illgroupa)
x
Lou quality of thesewer syetem 33 42 27 33
Unsatisfactory designof the @ant 38 22 4 25
Low hydrauUc andorganic loading 7 11 10 9
Highhydraulicandorganic lo&g 9 17 6 10
Bad maintenance 7 8 4 6
EquipmentbrW3kdO~ 13 19 6 12
OrganisatLonalprObleUi8 25 22 8 20
Induet&&effluents 6 14 0 6
Miscslleneous 8 17 6 9
Usually more than one factor is regarded as responsible for theproblems on the plants that do not meet the effluent standards,consequently the columns in the table add up to more than 100 %.
In most cases it is a combination of several factors that cause the
problems. Table 4 shows that several factors are regarded as veryimportant. These are:
Low quality of the sewer system
Precipitation and snowmelting cause the influent flow to increaseconsiderably owing to leakage into the sewer system. This is espe-cially important for the simultaneous precipitation plants, becausesludge is lost in the effluent.
116
Unsatisfactory design of the treatment plants
Many of the simultaneous precipitation plants were not originally
designed for phosphorus removal. The area of the final settling
tank is too small, censequently the hydraulic surface load is too
high. Mechanical problems with the RBC units are important factors
causing many of the combined precipitation plants to exceed the
effluent standards. Some of the problems are due to overloading of
the first step of the RBC unit, causing excessive growth and prob-
lems with the bearings and shaft as a consequence (@legaard, 1983).
Organizational problems
The small treatment plants are owned by local communities or
private institutions. Generally the operators are well trained to dothe daily routine tasks. However, supervisors at the next level in
the community do not always seem to give treatment plant operationhigh priority. This is primarily due to lack of understanding regar-
dling treatment plants operation. Managing of treatment plant opera-tion is only a minor part of the supervisors daily work, consequently
other tasks got a higher priority.
Table 6 shows that the remaining factors that negatively influence
the treatment plant performance are regarded as almost equally
important.
CONCLUSIONS
1: Low quality of the sewer system, unsatisfactory design of the
plants and organizational problems are the main factors that cause
small wastewater treatment plants not to meet the effluent stan-dards.
2: Better flow equalization and particle separation are the basic
demands to achieve lower effluent concentrations of tot P and
BOD,.

117
3: To meet the goals of our effort in pollution control, operationalmanagement is just as important as the design and qualityof eachindividual plant. Advanced treatment systems should mainly be usedfor larger treatment facilities where the necessary operational
knowledge exists.
REFERENCES
Bjdrnson S., @legaard H., (1988) Erfaringer med dykket biofilter.Prosjektrapport 75/88, NTNFs program for VAR-teknikk, Trondheim,
Norway.
Johansen O.J., (1982) Driftskostnader for kloakkrenseanlegg. Pros-jektrapport 35/82, NTNFs Utvalg for drift av renseanlegg, Oslo,Norway.
Storhaug R., (1987) Renseresultater ved norske renseanlegg. SFT-rapport, Oslo, Norway.
@legaard H., (1983) Norwegian experiences with combined biologi-cal/chemical treatment in Biodisc, Proceedings EWPCA-IAWPR-Se-minar on Rotating Biological Discs, Fellbach, W.Germany, Oct. 6-8,213-232.
$%legaard H., (1987) Particle separation in wastewater treatment.Proceedings 7 EWPCA-Symposium, Munich, May 19-22, 351-400.
118
PRE- AND POST PRECIPITATION
Mr. Ingemar KarlssonKemira Kemi Ab - Water Treatment
INTRODUCTION
In Sweden we have had considerable experience of chemical precipi-
tation as phosphorus reduction demands were introduced in the
country some 15-20 years ago. Fig 1 shows treatment developments
in Sweden up to the present day.
For phosphorus reduction the mechanical and biological treatment
processes have mostly been supplemented by the addition of a third
stage - a chemical post-precipitation stage - which has made it
possible to achieve total phosphorus effluent values of 0.5 mg/l
and below. Biological phosphorus removal has had not great success
in Sweden because it is difficult to achieve total values below 2mg of phosphorus per litre of water. On the other hand, chemicalpost-precipitation has not achieved great success outside the Scan-dinavian countries because of the high investment cost it involves.
Simultaneous precipitation processes are not common in Sweden wit-
hout a complementary reduction stage.
Post precipitation is often combined with two points dosing or
return sludge pumping of the chemical sludge to the primary or
secondary treatment stage.
POST PRECIPITATION
Post precipitation is a method when very strict phosphorus demands,
below 0,3 mg P,, per litre, has to be obtained. It gives very stable
results even at different hydraulic loads.
The post precipitation process gives very low concentrations of
dissolved phosphorus and is of course depending on an efficient
separation stage, which can be sedimentation, flotation or filtrati-
on.

119
For an efficient precipitation and flocculation effect the pH isimportant. Different precipitants show different pH optimum.
(Fig 2)
To reach the optimal pH age excess of the metal salt can be dosed.
100 mg/l of Kemira AVR or 150 g of Kemira JKL consumes 0,6mekv/l of the alcalinity. This method to regulate the pH is simplebut the sludge production increases.
Another way is to dose an acid for example H,SO,. 30 mg/l ofH,SO, consumes 0,6 mekv alcalinity. Sulphuric acid gives no sludgebut it is necessary to use two chemicals.
A third way to reach an optimal pH is to produce the I-I+ by nitrifi-cation. Oxidation of 4,5 mg/l N decreases the alcalinity 0,6 mekv/l.
From an economical point of view the cost for 100 g AVR is about6 Finnish pennies. For 30 g H,SO, about 1,5 pennies and for nitrifi-cation the energy cost only about 0,5 pennies.
A new generation of chemicals the poly-metal salts, for instance
Kemira PAX, are less sensitive for pH. A good floe formation andseparation is possible at a higher PH.
The precipitation of phosphorus requires about 1,5 mol Me3’ to reactwith 1 mol HPOb2-. That is 15 g Kemira AVR per gram P. In practi-ce a higher dosage is necessary when the precipitated phosphorusfloe is very small and difficult to separate. The fluffy hydroxid floegives through sweep coagulation and a bigger floe good separationpossibilities. If a filter is used for separation, the floe formationis not that important.
The post precipitation process is also very efficient in removal ofsuspended solids. It serves as a very good complement to a highloaded biological stage.
Chemical treatment removes particles down to 0,l urn. This meansthat bacteria and virus are removed almost totally. (Fig 3)

120
The third stage can also serve as a guard for hydraulic peaks and
pick up loss of MLSS. The sludge age and nitrification can be saved.
An industrial discharge can inhibit the biological activity, the post
precipitation stage can protect the recipient.
In many cases it is very favourable to pump the chemical sludge
back to the influent and take it out together with the mechanical
sludge or the biological excess sludge. It improves the thickening
and dewatering process at the plant but it also reduces the phospho-
rus content in the biological effluent before the chemical post
precipitation step. (Fig 4)
This pre-reduction of phosphorus results in a lower concentration
of phosphorus in the sludge from the chemical stage, if the same
dosage is used with and without sludge pumping. The effluent is
then less sensitive to suspended solids. A two point dosing has the
same influence.
For pre-precipitation and simultaneous precipitation processes wit-
hout a third stage the concentration of phosphorus in the suspen-
ded solids in the effluent is very important for the total removal
efficiency.
If simultaneous precipitation is used compared to pre-precipitation
shows that 20 mg SS in the effluent gives 1 and 0,44 mg respective-
ly P per litre only as suspended phosphorus (Fig 5). Total phospho-
rus in these examples will be higher.
PRE-PRECIPITATION
It is generally known that trivalent metal salts are good at remo-
ving suspended solids from a turbid water. In the process used to
treat surface water, to produce potable water, aluminum salts are
often used to destabilize and flocculate the pollutants. Some times,
highly charged metal ion complexes such as polyaluminum sulphate
or polyaluminum chloride is used because it is more effective in this
process than a salt with a lower valence.

121
The organic matter in sewage water not removed by the gravity over
primary tank is in stable suspension, consisting of particles smal-
ler than 0.1 mm. This stable suspension may be destabilized by using
the low molecular, highly charged metal salts mentioned earlier.
These salts are also able to form fluffy hydroxide floes that can
arrest the destabilized particles through general sweep coagulation.
Large aggregates capable of being sedimentated are formed. Dissol-
ved compounds like phosphorus are precipitated at the same time.
Fig 6 shows that with an effective precipitant and with good initial
mixing and flock formation, particles down to 0.1~ may be destabili-
zed, coagulated and removed from the waste water.
Measured in terms of organic substance these correspond to a total
reduction of some 75 % or even more for normal municipal sewage.
Phosphorus reduction then often exceeds 90 %.
The size distribution of particles between 0.6 to 9 u in sewage water
has been studied in our laboratory.
The volume of the particles was measured in 13 different size ran-
ges.
The sewage water then was precipitated with different chemicals atdifferent dosages. A maximum peak of particles was found in the
size range 0,5 - 1,5 p. (Fig 7)
The percent removal for particles down to about 2 p was very effec-
tive by chemical treatment, about 90 % was removed.
The smaller particles, size about 1 u, the removal efficiency was
related to the chemical dosage. This removal differs between 50-80
%. (Fig 8)
A good example of a direct precipitation plant is the large VEAS
treatment plant outside Oslo, see fig 3, which has been designed
to handle about 400 000 m3 a day. (Fig 9)
The retention time in this plant is only 3 hours. In Norway with
direct precipitation more than 50 sewage plants show a reduction

122
efficiency of more than 75 % for BOD and more than 90 % for total
phosphorus. (Fig 10)
NITRIFICATION
In Scandinavia we are now facing a new situation concerning nitro-
gen. Our coast line waters in northern Europe show very serious
problems with algae blooms and anaerobic bottom conditions. We
must decrease the discharge of nitrogen to our sea waters. For
our sewage plants this is a problem because most of them have
too small biological volumes and retention times to achieve nitrifica-
tion and denitrification in existing volumes. We have to increase
the volumes according to today’s technical knowledge. Here chemical
pre-treatment and unloading with pre-precipitating technique is
very favourable. To build up a nitrifying system it is necessary to
increase the sludge age high enough to let the slow growing autot-
rophics not be washed out from the biological system. Especiallyduring winter with our low water temperatures, often below 10°C,
it is necessary to have a high sludge age. The rate of nitrification
is very low at low water temperatures.
With an increasing sludge age it is possible to maintain the same
degree of nitrification even at low water temperatures.
In a trickling filter the nitrifiers start to grow when most of the
organic matter is consumed and the number of the fast growing
hetrotrophics start to decrease. Big volumes and surface are neces-
sary if the BOD/N-ratio is high. The lower BOD/N-ratio, the smaller
surface in the trickling filter to achieve nitrification. (Fig 11)
For an activated sludge process the sludge age is one of the most
important parameters for nitrification. For cool water a very high
sludge age is necessary.
An increased removal of organic matter and suspended solids over
the primary tank with 100 %, which can be expected when pre-
precipitation is introduced, will also double the sludge age if the
same tank volume and sludge concentration is used. Of course simul-

123
taneous precipitation decreases the sludge age because of the sludgeproduction of the chemical in the biological stage. (Fig 12)
Sewage water from chemical treatment contains normally just about25 % of the original organic content. The organic matter is mainlyin a dissolved readily degradable form. Next figure 13 shows thechemical oxidation rate of different fractions of the sewage water.
(Fig 13)
The remaining part after chemical treatment shows the highestoxidation rate, about four times higher compared to some part ofthe effluent from primary treatment.
To use the chemical treated water in a compact biological processwith a biological fixed film system can be of a great interest, asthis combination can be volume saving.
When sewage water passes the fixed biological film soluble organicand nutrients diffuse into the biofilm together with oxygen. In thisoxidation process it is an advantage if the organic matter is in asoluble form, because it can penetrate the bacterial membrane di-rectly.
Organic matter in collodial and in bigger particulate form are adsor-bed on the biofilm’s surface and solubilized by enzymatic activitybefore it can penetrate the bacterial membrane and serve as anelectron donor.
The pre-precipitation gives a water with a very low content ofparticles which should be an advantage in combination with a fixedfilm biosystem. The possibility to increase the sludge content toget-her with a high oxidation rate of the organic matter is volumesaving and sludge age increasing compared to conventional biologi-cal treatment.
Pilot plant tests to study fixed film system with and without pre-precipitation have been carried out at Helsingborg’s waste waterplant.

124
With pre-precipitation it was possible to operate the plant with
100 % nitrification at twice the hydraulic load compared to the
presettled line. For simultaneous precipitation the retention time
was four times longer compared to the pre-precipitated.
DENITRIFICATION
Denitrification may be carried out using either one or two main
principles: pre-denitrification or post-denitrification. The latter
process takes place downstream of the nitrification stage, the former
upstreams. To utilize the nitrate the environment must be anoxic,
i.e. without dissolved oxygen. A degradable carbon source is also
required, unless endogenous respiration is used, which requires very
long retention times. Methanol is a conceivable source of carbon
that provides a high rate of oxidation but it costs about FIM 0.06
per gram reduced nitrogen. Thus, the methanol cost of total nitrogen
reduction in a denitrification process is about FIM 24 per person
per year. This high expense and the toxicity problems of methanol
makes it important to use a cheap carbon sources, e.g. industrial
waste products or internal carbon sources. The use of primary sludge
is possible, but the oxidation rate is low for unprocessed sludge,
in addition to which, the quantity in conventional treatment is
barely enough. To remove BOD upstream of a nitrification stadge
and then return the BOD to the denitrification stage as a source of
carbon is an interesting process alternative. The quantity of organic
substance precipitated consists of particles down towards 0.1 u.
The biological oxidation rate of the fraction added through pre-
precipitation is higher than that of normally primary sludge, and it
is also possible to hydrolyse the sludge to increase further the
availability. The higher oxidation rate the carbon source shows,
the smaller denitrification volume is necessary.
BOD influent = 200 g BOD, primary effluent is 130 measured as BOD
and 70 g BOD per m3 primary sludge is produced. If 5 g BOD is re-
quired per gram reduced nitrogen and all primary sludge can be
used, it is sufficient to reduce 14 g of nitrogen. It is very doubtful
whatever this will work as a large part of this BOD is difficult
to degrade. With normal pre-precipitation 75 % of the influent BOD
is removed over the primary tanks, which involves a fraction of
125
BOD that is readily degradable compared to the normal primary
sludge. The amount 150 g BOD should be enough for a reductionof 30 g of nitrogen.
If the anoxic zone upstream of the nitrification stage is construc-
ted, the influent waste water may serve as a source of carbon. The
nitrate is returned by the return sludge and possibly by a separate
return operation. Pre-precipitation has the advantage that only the
most readily degradable part of the BOD is present. The anoxic
zone can be utilized in terms of volume and retention time. For
the best efficiency an utilization of the waste water’s internal
carbon sources, pre- and post-denitrification should be combined.
ECONOMICAL ASPECTS
The Swedish Water Work’s Association (VAV) has made an economi-
cal study for a Swedish sewage plants to reach 75 % of nitrogen
removal. The size of the plant is 100 000 pe and the flow 40 000
m3/day. The retention time in the activated stage has to be inc-
reased, aeration and anoxic zones, to 12 hours. The total cost to
build 1 m3 of aeration tank volume is estimated to FIM 2040. The
capital cost, 12 % rate of interest, depreciation 20 years buildings,
10 years machinery, gives FIM 0.44 per m3 of treated water for 12hours retention time in the aeration tank. With pre-precipitation it
is possible to double the sludge age without tank expansion. For
denitrification the volume saving is more difficult to predict, when
both pre- and post-denitrification is used. The difference in the
systems is the distribution of particles between 100 micron and 1micron which have a low oxidation rate, see fig 13.
In the pre-precipitation process this organic matter is extractedover the primary tanks, hydrolyzed and used in the post- or pre-
denitrification process. In the conventional system this organic partis not used in the pre-denitrification stage if the volume is not
very big because the retention time is too short. It is oxidized in
the aerobic stage. This organic matter, about 25 % of the influent,
represents for a municipal sewage water a value of FIM 0.06 per
m3 if it substitutes methanol or FIM 10 per pe and year. This will
9 402336x
126
pay for the precipitant in the pre-precipitation, which normally
costs about the same.
The volume savings for nitrification can be halved. Also for denit-rification with hydrolysed sludge some volume savings can be expec-ted compared to a system with internal carbon source. With a volu-me saving of 4 hours’ retention time, the capital cost is decreasedin the mentioned example with more than 20 FIM per pe and year.

127
Sewage treatment in Sweden 79654906Percent of the population In urban areas*
1965 1970 1975 1980 1985
l Urban areas, > 200 Inhabllmls and < 200 m dlelancr belwaen bulldlngs. - 85% 01 lolal populallon.
Fig. 1
IO0 r
Fig. 2

128
‘I* oi
99.99
99.c
90.0
75.0
SO.0
250
10.0
I.0
go1
Virusrmoval by chemical coagula tiorr(M. Chaudirufi, R. Engelbrecht)
J-10 50 100Alumlniniumsulphale dosage PPM
Fig. 3
,E VALUES LESS 1HAN SlATED VALUE
EFFLUENT CONCENIRAllONCONCEN lRAllON AFTER BIOLOGICALWITH 1REATMENl WllHRECIRCULAIION RECIRCULATION
E!engt HultmnFosforreduktion vid kcmunalareningsverk
INFLUENTCONDITION
EFFLUENl CONCENIRAIIONCONCENIRAllON AFTER BIOLOGICALWlniOUT TREATMENT WllHOUlRECIRCULATION RECIRCULATION
1 I 1 I b02 4S ‘,O 2.0 5.0
TOTAL PHOSPHORUS (mg P/I)
0 RECIRCULATION
A NO RECIRCULAI
Fig. 4

129
sltm.TANEws
Influent
BOO: 200
P: 8
Biosludge:
Chemical sludge:
PRE
800: 200
P: 8
S&sludge:
Chemical sludge:
Fig. 5
COD:
chcliul ooragc 320 mm01
Primary effluent Secondary effluent
140 10
6
1 0 \ P In sludqa: 5\
50
SS - 20 gives 1 pp. P
00
1
45
IO
40 \ P in sludge: 2,2\
5
ss - 20 gives 0,44 ppa P
0
:,I , I II
II I
I I1
II
*I 1
II
lamlr,
0.001”I
O.OllJ O.lr IU 0.01 mm at mm lmm 1Omm
CdD:25% ’
Fig. 6

Fig. 7
too..
6 0 .
30.
20.
IO-
Fig. 8
_---- 300
++++++ 4so
m......-- . . ..I 6 0 0
.1 1 J 4 S 6 TO

131
Direct PrecipitationWAS
Mea+
0 = 300.000 m3/d I?Dosage: _ 6 I/IT? 5%TS430 m mol Me3?m3 4 +--- + 30g CaO/m3
lnfluent Effluent 570 g/m337% TSmg/l mgn
BOO 140 30ss 110 10P tot 3.5 0.2N tot 15 11
Fig. 9
Number ss Boo a COD T0T.PProcsm of
plants In out X in out X In out w In out Ye
PP 2 3 172 27 04.3 216 4 2 80.6 3 1 3 8 2 7O.a 5 . 5 0.54 W . 2
SP 3 3 2 1 8 22 09.9 238 3 8 84.9 404 7 4 81.0 7.1 0.50 83.0
PP & SP 60 307 24 87.6 229 3 9 8 3 . 0 3 5 0 8 3 70.9 6.2 0.52 91.8
1985 yearly average treatment results obtained in 56chemical, non- biological treatment plants in Norway,ranging in size from 2.000 - 750.000 PE.
Fig. 10

132
Number of nitrifying organisms
, I I I I 1 I I 1
1 2 3 4 5 6 7 8 9
BODTTKN-ratio
ical treatment
Fig. 11
Sludge ageSludge quantity in the procesr
productlon of sludge
Conventional BOO x 0.7 1000biological 200 x 0.78 140 x6-= 7treatment
Simultaneous BOD 8 OJ+chem.sludgeprecipitation 200 x 0.7+50= 190
E!!!=190 5. .
Pre-precipitation
BOD x 0.72
2ot? Oo7 =70
100070= 14
Fig. 12

133
Table 1Carrposltlon of Organic Materials In Wa9tcwatue
Item
solubls
Classlflcatlon
C o l l o i d a l Supracolloldal Sgttleable
Site range (km) <0.08 0.08 - 1.0
COO (X of total) 2s ls
TOC (X of total) 51 14
Organic constituents(X of total solids)
Grease 12 EPtoteln 4Carbohydrates 4 7
Biochemical oxldatlonrate, k, d-l(base 10) 0.39 0.22
a Adapted In part from Reference 2.10.18.
l-100
26
24
244511
0.09
>lfxJ
34
31
i.z2b
0.08
F i g . 13

134
Separation of organic matter in aconventional biological treatment
Outgoingwater 7 g
Biologicaltreatment 43 g
Incoming sewage water- 75 g B0Dlpe.d Mechanical
treatment 25 g
Energy consumption for biological treatment1 kg BOD = 1.3 kWh43gBOD = 0.056 kWh/pe - 20 kWh/peannum
Fig. 14
Separation of organic matter inoptimal pre-precr’pitation
Outgoingwater 7 g Biological
treatment 12 g
Incoming sewage waterMechanical-chemical
an
- 75 g B0Dlpe.d/
treatment 56 g
I
Energy consumption for biological treatment1 kg BOD = 1.3 kWh0.02 kWh/ped - 7 kWh/psannum (-75%)
Fig. 15

135
METHANOL - 2 FIWKG
-3 CJ per gram reduced N
for 100.000 pe (40.000 m3)
1gN 87.600 FIM/year
15 g N 1.314.000 FIM/year
3 g methanol z 3 g hydrolyzed "BOD"
P R E - P R E C I P I T A T I O N
200 g BOD
I75%
150 g BOD
I 35% is hydrolyzed
53 g BOD is worth
1.545.000 FIM as C-source

136
NITRIFICATION - DENITRIFICATION
100.000 pe PLANT (40.000 m3/d)
CONVENTIONAL P R E - P R E C I P I T A T I O N
V O L U M E
Nitrification 8 h -*4h
Denitrification 4 h ?sh
* 0,44 FIM per m3 0,29 FIM per m3
-64 FIM per pe year -42 FIM per pe year
A 2 2 FIM
Organic matter d(O,l 1-1 - 100 fi) = 25%= 50 g r30D
1 g methanol = 1 g BOD = 2 FIM1000
Value 14 FIM per pe and year
* 1 Id = 2000 FIM 12% rate of interest
10 years machineryDepreciation
c 20 years building

137
TUBE FLOCCULATION - CHEAP AND EFFECTIVE METHOD FOR PHOSPHORUS
REMOVAL
Mr. Arto Latvala
National Board of Waters and the Environment
INTRODUCTION
In many areas of the world there are increasing problems in pro-
tecting e.g. the lakes and seas against pollution. The polluting loads
may be still growing because of the lack of money for environmental
protection purposes. This year we have heard alarming news from
the coastal Mediterranean tourist areas. E.g. in Italy there has been
reported mass appearance of algae. The time may not be far away
when we have similar problems in coastal areas of the Baltic. The
intention of this paper is to discuss a cheap and effective phospho-
rus, suspended solids and particulate biochemical oxygen demand
removal method, that can be used in different phases of the imple-
mentation of wastewater treatment plant systems.
SMALL SEWAGE WORKS
As a first example the system used for small sewage works should
be mentioned. In Finland there are now more than twenty plants of
this type (fig. 1). They are mostly situated near the Arctic circle
in Lapland. Some of the plants are renewed from conventional types
and some are totally new. The size of these plants are from a few
dozen to a few hundred as person equivalents.
The treatment process is as follows:
- primary sedimentation that is also working as an equalizing basin
- feeding of chemicals by the chemical pump to the suction openings
of the wastewater pump
- pumping the wastewater and the chemical solution together by the
wastewater pump, that also functions at the same time as the
rapid mixing equipment of the chemical solution
- flocculation in pipes that have been built under the ground floor
inside the wastewater treatment building

138
- secondary sedimentation so that the same basin is working as
sludge blanket clarification, and also as sludge storage at the
same time.
In the last phase the wastewater is directed to the bottom of the
secondary sedimentation basin via a settling pipe, from where it
flows through the sludge blanket. By this method it is possible also
to retain very small particles from the wastewater, due to the filte-
ring effect of the sludge blanket.
-Influent
!Ii
Flocculation tube
sedimentation
Fig. 1. The chemical tube flocculation wastewater treatment plant
of the Saarenketo type.
The results of this kind of plant and experiment have been earlier
reported (Latvala 1989). To summarize them briefly it may be stated
that by this method it has been possible to obtain 70 % reductionin BOD,, 99 % reduction in particulate BOD, and 94 % reduction
in total phosphorus with a molar ratio of 2.6 mol/mol of coagulating
Me and phosphorus. Compared with conventional chemical sewage
treatment systems the implentation costs of this system have been
about one half less. The maintenance of the plants is also quite
simple because the machinery consists only of chemical feeding and
wastewater pumping.

139
UPGRADING THE EXISTING SEWAGE WORKS
In order to obtain better performance and better results at existing
sewage works the processes may be changed. As a case, for example,sewage treatment at Luhanka, south of Jyvaskyla, is discussed.
At Luhanka the sewage of about 160 people is conducted via apressure pipe in Lake Paijanne to the wastewater treatment plant.
The treatment of sewage has been effected by the activated sludge-
simultaneous precipitation method (fig. 2) up to April 1988, when the
process was changed to direct chemical precipitation with flocculati-
on in a pipe (fig. 3).
1. P u m p i n g s t a t i o n2 . G r i d3 . P r i m a r y s e d i m e n t a t i o nL A e r a t i o n
5. S e c o n d a r y s e d i m e n t a t i o n6 . EffIuent
Fig. 2. The Luhanka sewage treatment plant process during the
period 1979 - 1988.
When considering the purification results (fig. 4) we can recognize
that the BOD,-values of the treated wastewater have decreased by
the some amount, about 25 %, and the effluent phosphorus values
have decreased substantially by about 87 %; compared to the ef-
fluents before process change (table 1).

1 4 0
Table 1. Effluent mean values of BOD, and phosphorus calculatedfrom fig. 4 before and after the process change.
Effluent Biological-chemical Chem. process withprocess tube flocculation
BOD, mg l-l -1 65,8 48,4P mg 1 7,13 0,92
_ -._--..- .---- --
1. P u m p i n g s t a t i o n2 . G r i d3. P r i m a r y s e d i m e n t a t i o n4 . P u m p i n g w i t h c h e m i c a l f e e d i n g5. F l o c c u l a t i o n p i p e6. S e c o n d a r y s e d i m e n t a t i o n s7. E f f l u e n t
Fig. 3. The Luhanka sewage treatment plant process after alterationn April 8th 1988.
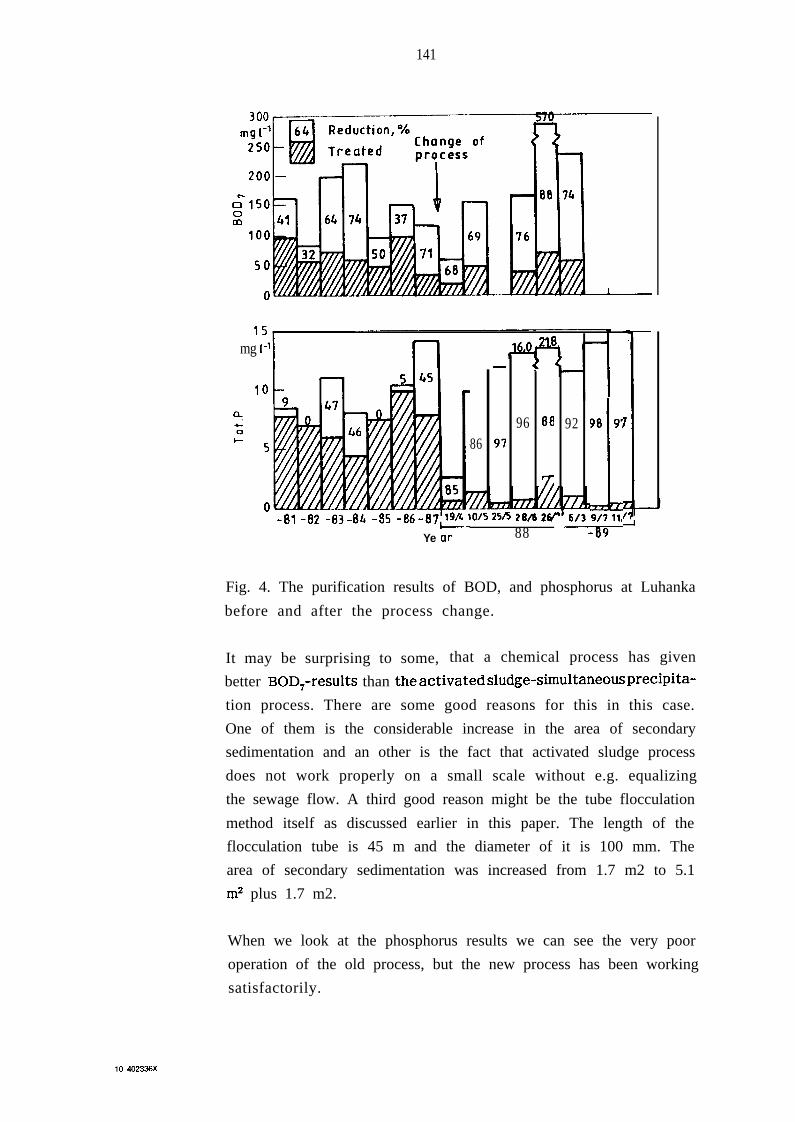
141
mg I-’I
8696
28n26,
Ye or 88
92 98 9:1l-
6/3 9/lllr
-89
-
Fig. 4. The purification results of BOD, and phosphorus at Luhanka
before and after the process change.
It may be surprising to some, that a chemical process has given
better BOD,-results than theactivatedsludge-simultaneousprecipita-
tion process. There are some good reasons for this in this case.
One of them is the considerable increase in the area of secondary
sedimentation and an other is the fact that activated sludge process
does not work properly on a small scale without e.g. equalizing
the sewage flow. A third good reason might be the tube flocculation
method itself as discussed earlier in this paper. The length of the
flocculation tube is 45 m and the diameter of it is 100 mm. The
area of secondary sedimentation was increased from 1.7 m2 to 5.1
m2 plus 1.7 m2.
When we look at the phosphorus results we can see the very poor
operation of the old process, but the new process has been working
satisfactorily.
10 402336x
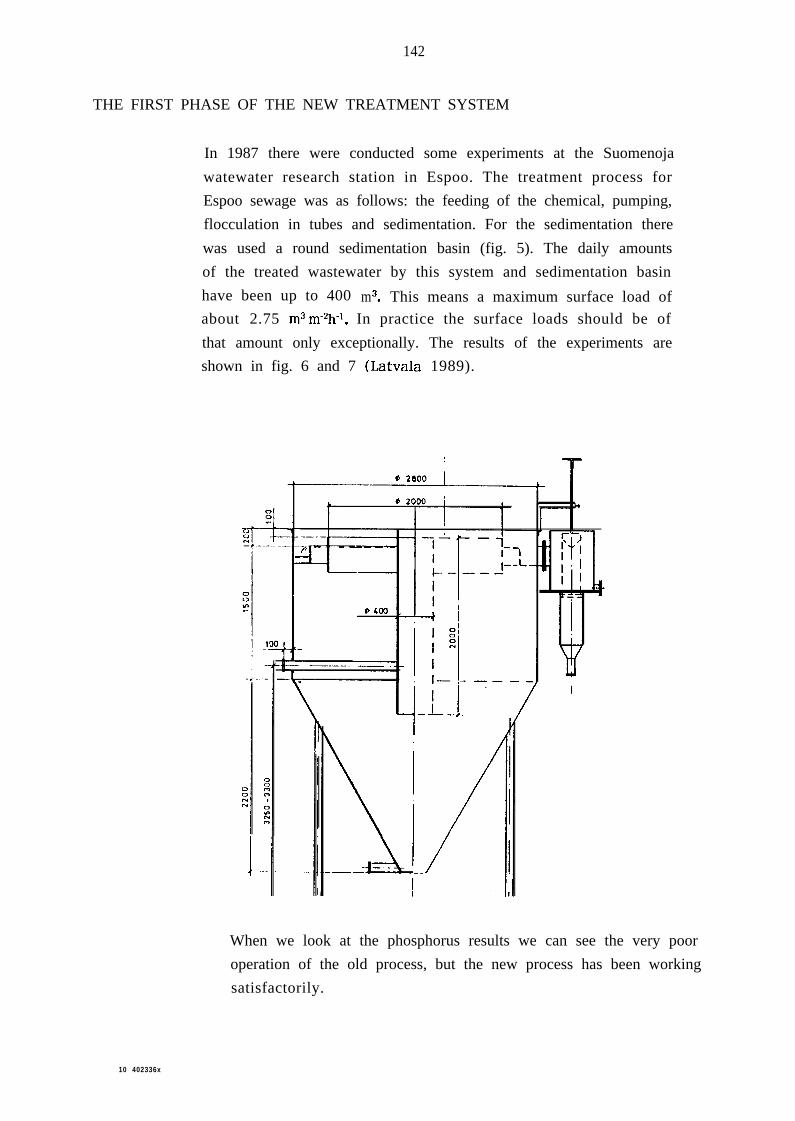
142
THE FIRST PHASE OF THE NEW TREATMENT SYSTEM
In 1987 there were conducted some experiments at the Suomenoja
watewater research station in Espoo. The treatment process for
Espoo sewage was as follows: the feeding of the chemical, pumping,
flocculation in tubes and sedimentation. For the sedimentation there
was used a round sedimentation basin (fig. 5). The daily amounts
of the treated wastewater by this system and sedimentation basin
have been up to 400 m3. This means a maximum surface load of
about 2.75 m3 rne2h-l. In practice the surface loads should be of
that amount only exceptionally. The results of the experiments are
shown in fig. 6 and 7 (Latvala 1989).
When we look at the phosphorus results we can see the very poor
operation of the old process, but the new process has been working
satisfactorily.
10 402336x

143
1Cm914
12
Flocwlation tube 6m Fbcculation tube Gm
82
6 - - - ___- - - ___ - - - ___- - -___ ___
L --- ---___ _ _ ___--- - - -
01 2 3 7 8 9 IL 15 16 17 21 22 23 21 28 29 3 0 1 8 d
September 1987 October
Fig. 6. The total phosphorus before and after treatment by the
flocculation tube length of 8 m and 45 m.-_- suspended phosphorus before treatment.
260,Flocculation tube 6m
6 0
LO
2 0
012 3 7 0 9 11 15 16 17 21 2
SeDtember 1987
-Flocculation
I-I-ii
23 21 2 8 29 30 1 6 dOctober
Fig. 7. The biochemical oxygen demand BOD, before and after treat-
ment by the flocculation tube lengths of 8 m and 45 m.-_- soluble BOD, before treatment.

144
DISCUSSION
Most engineers agree that in sewage treatment we should have both
biological and chemical phases. In Finland we mostly havesimultaneous precipitation with ferrous iron associated with an
activated sludge method. In small sewage works we know in practice
that the results have been poor with all the methods.
In the case of Luhanka the change to chemical tube flocculation
method improved the results e.g. in respect to total phosphorus andbiochemical oxygen demand. In the Suomenoja experiments it has
also been possible to obtain good phosphorus and particulate BOD,results with tube flocculation and sedimentation.
This method is cheap to build, because only chemical feeding, waste-
water pumping, flocculation in tubes and sedimentation are needed.
The sedimentation basins may be those intended later on for primary
sedimentation, when the treatment process will be effected in a
biological phase.
With the technical advance of chemical sewage treatment by tube
flocculation methods the times of better and cheaper sewage treat-
ment are drawing - I hope - a little nearer.
CONCLUSION
The chemical tube flocculation method is an effective and profitable
first phase wastewater treatment system that might later on be
accompanied by some biological treatment e.g. for nitrogen oxidation.
REFERENCES
Latvala, A. 1989. Advanced chemical treatment with flocculation inpipes. International Specialized Conference on Design and Operationof Small Wastewater Treatment Plants. Trondheim, Norway 26 - 28June 1989. Preprints p. 211 - 218.

145
TEMPERATURE EFFECTS ON BIOLOGICAL NITROGEN REMOVAL
- Nitrification under Danish Climate Conditions
Mr. S&en NBhr Bak and Mr. Jes la Cour Jansen
Water Quality Institute
INTRODUCTION
In 1987 the Danish Parliament passed legislation requiring all exis-
ting wastewater treatment plants larger than 15 000 PE and all new
plants greater than 5 000 PE to establish extended nitrogen removal.
The general requirement concerning the nitrogen concentration in
the effluent is a maximum of 8 g N/m3. It is however possible to
set up more stringent effluent requirements for discharge to sensiti-
ve waters such as long fjords and lakes. The effluent requirements
concerning ammonia are determined by the local county authorities
and are in most cases put at 2 g NH,-N/m 3 in the summer and 4
gNH,,/m3 in the winter months (Jansen, 1989b). The difference in the
requirements concerning the NH, effluent concentration between
summer and winter is due to the difficulties in achieving nitrificati-
on in the cold season.
The Danish climate can be characterized as a temperate coastal
climate with an average yearly temperature of 8°C. During the
winter, the temperature is normally around O’C, but varies a lot
with occasionally very low temperatures below -10°C during high-
pressure periods with easterly wind.
The winter temperature is an important design criterion for Danish
wastewater treatment plants. In order to achieve nitrification, plants
are normally designed according to the graph in Fig. 1.
It can be seen from Fig. 1 that a relatively small increase in tempe-
rature (below 10’33 results in a large decrease of the aerobic sludge
age necessary. Thus an increase in temperature from 6” to 8°C will
result in a 25 % reduction of the aerobic sludge age.
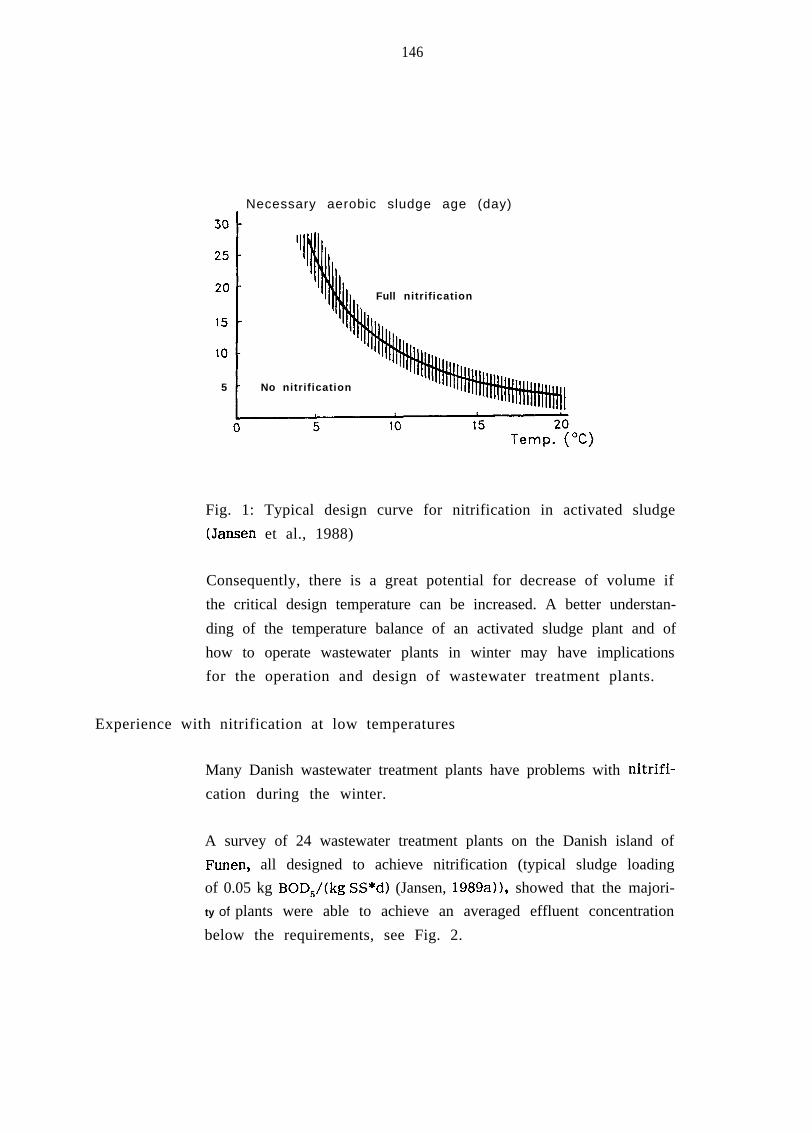
146
Necessary aerobic sludge age (day)
Full nitrification
5 No nitrification
Fig. 1: Typical design curve for nitrification in activated sludge
(Jar-men et al., 1988)
Consequently, there is a great potential for decrease of volume if
the critical design temperature can be increased. A better understan-
ding of the temperature balance of an activated sludge plant and of
how to operate wastewater plants in winter may have implications
for the operation and design of wastewater treatment plants.
Experience with nitrification at low temperatures
Many Danish wastewater treatment plants have problems with nitrifi-
cation during the winter.
A survey of 24 wastewater treatment plants on the Danish island of
Funen, all designed to achieve nitrification (typical sludge loading
of 0.05 kg BOD,/(kg SS*d) (Jansen, 1989a)), showed that the majori-
ty of plants were able to achieve an averaged effluent concentration
below the requirements, see Fig. 2.

147
Plants
1 2
10
8 .
6 .
4.
2 .
o- : *
1Ammonium(averaged)
123456 mg/l
Fig. 2: Distribution of averaged NH,-N effluent concentrations for
24 wastewater treatment plants on Funen
The 24 plants could be divided into 4 groups after the pattern of
their ammonia effluent concentration:
1) Plants with a constant low effluent concentration, possibly with
a few peaks.
2) Plants with smaller increase during some winters.
3) Plants with higher ammonia effluent concentrations during most
winters.
4) Plants with generally high ammonia effluent concentrations all
the year round.
It can be seen that many plants have winter problems, but are
nevertheless able to achieve an averaged concentration under the
requirements. However, it could not be determined on the basis of
the data material whether the winter problems are caused by inc-

148
reased loading, lower temperature, toxic substances, bad operating
practice, plant design, etc.
2.
Fig. 3: Distribution of ammonia effluent pattern for 24 wastewater
treatment plants on Funen (Jansen et al., 1988)
Fig. 4 shows the variations in temperature and NH,-N concentrations
for a plant designed to achieve extended nitrogen removal. It can
be seen that the plant failed to nitrify during the winter and spring
of 1987, but soon regained its ability when the temperature rose
in May. During the autumn, occasional high ammonia concentrations
also occurred more frequently. According to the measurements of
the county authorities, however, the plant’s average NH,-N effluent
concentration has been below 2 gNH,-N/m3 for a period of several
years (Jansen, 1989a).

149
SplholtNH4 cont. and temp. as 15 d.
running average
OC gNH4 N/m3
18
16
14
12
10
8
6
4
2
0121 2 3 4 5 6 7 8 9 lo " l2 Month
Fig. 4: NH,-N effluent concentration and 15 days’ running average
temperature for Sdholt wastewater treatment plant from 12 th Jan.
-1986 to 1st Jan. 1988
Temperature variations
In order to evaluate the influence of temperature on nitrogen remo-
val it is important to know the actual temperature variations and
what factors influence the temperature.
Fig. 5 shows the variations in the process temperature at two nitro-
gen removal plants over period of three years. The two plants are
of different designs, so that the surface area/volume ratio is much
larger for SBholt than for Frederikssund. It can be seen that the
variations in temperature during the years are very similar for the
two plants.

150
15
10
. Saholt
11 I , , , + ,Fred;;ysund
Jon-65 Jon-66 Jon-87
Fig 5: Process temperature variations at Sdholt and Frederikssund
wastewater treatment plants (Jansen et al., 1988)
From Fig. 6 it can be seen that the water temperature increases
when passing the Frederikssund plant in the summer and decreases
when passing Sdholt during the winter. This means that the design
of the plant influences the water temperature, and it is therefore
important to establish which design elements are of particular im-
portance.
. Saholt+ Frederikssund
-5 ! 1
Jon-65 Jan-66 Jan-07 Jon-08
Fig. 6: Change in temperature when passing Sdholt and Frederiks-
sund wastewater treatment plants (Jansen et al., 1988)

151
Temperature model
The energy balance of a wastewater treatment plant is influenced
by many factors. The most important ones are shown on Fig. 7.
In
Short woveradiation
Convective heat
7//////f
fluent
/////I/
0 Process energyl Mecanical energy
E f f l u e n t
AGeothermal heat
Fig. 7: Factors influencing the temperature in a wastewater treat-
ment plant (Jansen et al., 1988)
These factors are not equally important. It was found that the follo-
wing were the most important ones:
Influent/effluent
Convective heat transport
Evaporation
Net shortwawe radiation
Energy from the process
The calculation also showed that the influent temperature has a
great influence on the process temperature, so that little can be
done to change the process temperature during snow melting.
Using the model, a calculation has been made for Sdholt wastewater
treatment plant, and relevant data concerning the plant and local
climate have been collected. The model was then calibrated for the
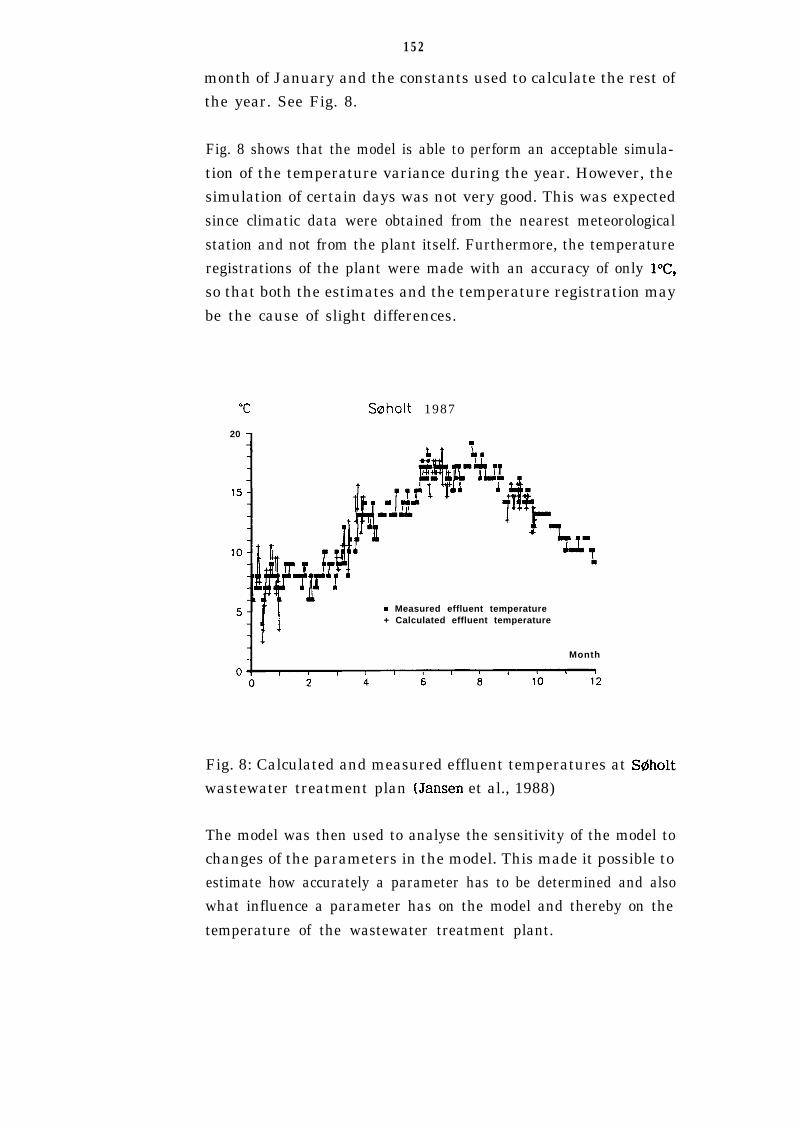
152
month of January and the constants used to calculate the rest of
the year. See Fig. 8.
Fig. 8 shows that the model is able to perform an acceptable simula-
tion of the temperature variance during the year. However, the
simulation of certain days was not very good. This was expected
since climatic data were obtained from the nearest meteorological
station and not from the plant itself. Furthermore, the temperature
registrations of the plant were made with an accuracy of only l°C,
so that both the estimates and the temperature registration may
be the cause of slight differences.
“C
20 -
Sohoit 1987
m Measured effluent temperature+ Calculated effluent temperature
Month
Fig. 8: Calculated and measured effluent temperatures at SBholt
wastewater treatment plan (Jansen et al., 1988)
The model was then used to analyse the sensitivity of the model to
changes of the parameters in the model. This made it possible to
estimate how accurately a parameter has to be determined and also
what influence a parameter has on the model and thereby on the
temperature of the wastewater treatment plant.

153
The sensitivity analysis was carried out with data from Sdholt
wastewater treatment plant averaged monthly, thereby simulating
the cycle of the seasons.
The sensitivity analysis showed that wind velocity and surface area
were important parameters. When designing new plants, it is possibleto control these parameters, and wind velocity may be changed in
connection with existing plants.
It can be seen from Fig. 9 that a decrease in wind velocity will
increase the process temperature. The effect of reducing the velocity
will be less significant in summer. It appears that the wind velocity
must be predicted fairly accurately in order to get good model pre-dictions. This means that the wind data should be obtained from the
plant itself.
SaholtWind ve loc i ty
Temp. difference fromnormal year in ‘C
-0.8 !1 2 3 4 5 6 7 a 9 10 11 12
Fig. 9: Sensitivity analysis showing differences in temperature whenchanging wind velocity parameter
A reduction of the surface area will reduce the energy exchangebetween the water and the air. Thus the water temperature increases
during the winter and decreases during the summer.

154
SerholtSurface area
Temp. difference fromnormal year in OC
1.611.41.2
10 .80.60.4
0.20
- 0 . 2- 0 . 4- 0 . 6- 0 . 8
- 1 th- 1.2
1 2 3 4 5 6 7 8 9 10 11 12
Fig. 10: Sensitivity analysis showing difference in temperature when
changing the surface area parameter
The analysis showed that increases in the critical winter temperature
can be obtained by altering the design of wastewater treatment
plants. For an existing plant, reduction in the wind velocity, for
example by covering the reactors or by making a shelter round
the plant will improve the process temperature. When designing
future wastewater treatment plants, reduction of the surface area-
to-volume ratio will establish the potential for a higher critical
winter temperature.
Ongoing research program
On a small wastewater treatment plant (Hammersholt) consisting of
two oxidation ditches operated in alternate switch mode, extensive
temperature registrations have been carried out. The plant has re-
cently been covered with a black tarpaulin, which makes it very
interesting with regard to the temperature model investigation. The
cover will reduce the wind velocity to zero. The temperature is
registered at four points: Influent water, effluent water, air under
the tarpaulin, and air in shadow.

155
The data logging has recently been started and is supposed to con-
tinue so that the effect of covering the plant in winter can be esta-
blished. The weather during the logged period was very warm and
sunny, with day temperatures in the high 20s. When studying the
data already at hand, see Fig. 11, it is interesting to note the great
dynamics of the system. It can already now be concluded that in
order to get a true picture of the temperature variation of a plant
it is necessary to register the temperature at the same time every
day.
Hammersholt June/JulyInf. and eff. temperature
Degree Celcius
16
ll-
InDay
I” 24 25 26 27 28 29 30 1 2 3 4 5
Fig. 11: Influent and effluent temperature at Hammersholt
The peak of the influent on the 27th July was due to rain, but
since the day was otherwise sunny, it did not have any significant
influence on the effluent temperature. The general temperature dec-
rease from the 28th to the 29th July can be related to changes in
the weather, see Fig. 12, where the temperature under the tarpaulin
drops. From the 30th July, there is a general tendency towards an
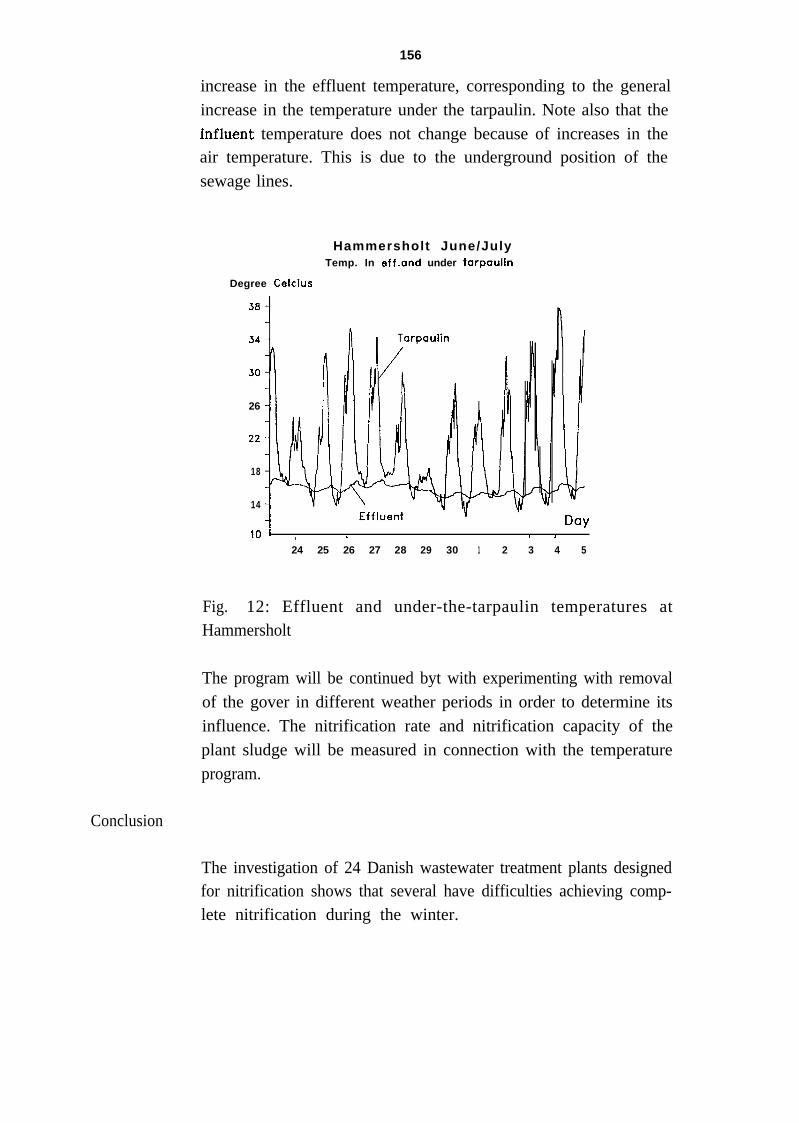
156
increase in the effluent temperature, corresponding to the generalincrease in the temperature under the tarpaulin. Note also that theinfluent temperature does not change because of increases in theair temperature. This is due to the underground position of thesewage lines.
Hammersholt June/JulyTemp. In eff.and under tarpaulin
Degree Celcius
26
18
14
101 , I I I
24 25 26 27 28 29 30 1 2 3 4 5
Fig. 12: Effluent and under-the-tarpaulin temperatures atHammersholt
The program will be continued byt with experimenting with removalof the gover in different weather periods in order to determine itsinfluence. The nitrification rate and nitrification capacity of theplant sludge will be measured in connection with the temperatureprogram.
Conclusion
The investigation of 24 Danish wastewater treatment plants designedfor nitrification shows that several have difficulties achieving comp-lete nitrification during the winter.

157
Analyses of two different plants indicate that temperature changes
when passing the plants can be related to the physical design of the
plants.
The influent temperature was identified as the most important factor
influencing the process temperature, so that low influent temperature
in winter and during snow melting will result in low process tempe-
ratures. Modelling the temperature balance of a wastewater treat-
ment plant results in identification of wind velocity and surface
area as two important parameters in the temperature balance. Reduc-
tion of both parameters will reduce the temperature loss at the
plant in winter.
Acknowledgements:
The project was financed by the Danish Agency for Environmental
Protection, but does not necessarily reflect the Agency’s view of the
subjects discussed.
REFERENCES:
Jansen, Jes la Cour, Kristensen, G. Holm, Laursen, Karin Dahlgren
& Jdrgensen, Lone ( 1988): Temperature relationships in Danish Was-
tewater Treatment Plants (in Danish). Stads- og havneingenidren
10, p. 9.
Jansen, Jes la Cour (1989a): Nitrification in activated sludge plant
in Denmark (in Danish). Vand & Miljd 3, p. 185.
Jansen, Jes la Cour (1989b): Erfahrungen mit nitrifizierenden Bele-
bungsanlagen in Danemark. GWF-Wasser/Abwasser (in press).
11 402336X
158
LONG TERM EXPERIENCE WITH NITROGEN REMOVAL
Mr. Erik Bundgaard
Mr. Jan Pedersen
I. Kruger AS
BACKGROUND
Already in the beginning of the 197Os, the first steps were taken
to establish plants for nitrogen removal in Denmark. During the
following 15-20 years, those plants that were originally dimensioned
on the basis of partly empirical dimensioning rules have been further
developed. At the same time, a better theoretical basis and unders-
tanding of each process step have been achieved through extensive
development work performed by I. Kruger AS in cooperation with
the Department of Environmental Engineering at the Technical
University of Denmark.
Today, more than 30 wastewater treatment plants designed for
nitrogen removal are in operation in Denmark, and as a result of
the Danish action plan on the aquatic environment a much larger
number of plants are either at the planning stage or under construc-
tion. The operating experience gained from some of the existing
treatment plants is very well-documented, and this is utilized to a
high extent for the new plants, both as regards dimensioning and
establishment of control systems and operating strategies.
CHOICE OF PROCESS
As previously mentioned, Denmark is today faced by the necessity
of extending a very large number of highly different wastewater
treatment plants to incorporate nitrogen removal. In this connection,
it should be emphasized that there is not one particular treatment
process that is the best suited for all conditions.
Most essential to any plant extension is to ensure optimum comp-
liance with the demands required for obtaining satisfactory func-

159
tioning of the various biological processes. The basis for an extensi-
on of a plant will always differ in respect of wastewater composi-
tion, plant design etc. The final design of 2 practically similar plants
may therefore end up being widely different.
The following presentation will, however, primarily focus on the Da-
nish developed Bio-Denitro process.
THE BIO-DENITRO PROCESS
Development
The Danish environmental legislation has for many years been ahead
concerning requirements degradation of nitrogen in wastewater
treatment plants. Already in the 196Os, it became normal to require
full nitrification in treatment plants having water courses or lakes
as recipients. This paved the way for introduction of the oxidation
ditch system in Denmark, a system ensuring full nitrification and
sludge stabilisation due to a long treatment period - and in some
cases also a very high degree of nitrogen removal (60-70 %).
Through systematic investigation and optimization of these plants,
the Bio-Denitro process was developed. Fig. 1 shows the first oxida-
tion ditch types and how they can be extended for the Bio-Denitro
process which is described in the following. Other types of tanks
and aeration equipment may however also be applied in those cases
where it will be more economical or practical to do so.

160
Oxldatlon ditch pw Oxldatlon ditch plant wllh nitrogen removal
A E -Dllch
D - Dtlch
DE - Datch
T -Dllch
Fig. 1 Extension of Oxidation Ditches to Bio-Denitro Plants with
Nitrogen Removal
Plant Design and Operation
For the Bio-Denitro method - the most widely used process for
nitrogen removal in Denmark - two tanks are used which are inter-
connected by means of a pipe or through a hole in a common wall.
The tanks can be operated with denitrification under agitation and
intake of wastewater or with nitrification including aeration. The
wastewater is distributed between the two tanks via a mechanical
inlet distributor and the effluent is discharged in turns via
mechanical outlet weirs installed in both tanks. The direction of
flow through the plant from inlet to final clarifier can thus be

161
controlled by adjustment of the inlet distributor and the outlet
weirs. In this way, a simple design is obtained in combination with
a flexible control of the plant.
The operating mode consists of 4 phases with a total duration of
3-6 hours, during which both the direction of flow through the
plant and the process conditions in the tanks are controlled automa-
tically to obtain the correct process conditions. Fig. 2 shows a flow
and phase diagram for a Bio-Denitro plant.
P H A S E A
PHASE C PHASE 0
Fig. 2 Flow and Phase Diagram for a Bio-Denitro Plant
In phase A, wastewater is introduced into tank 1 where mixing takes
place under anoxic conditions. This causes a denitrification of the
nitrate nitrogen formed and accumulated in the previous phases.
At the same time, activated sludge flows from tank 1 to tank 2
concurrently with the inflow of raw wastewater and return sludge.
Tank 2 is operated with aeration, i.e. under aerobic conditions, this
resulting in nitrification and removal of any organic matter
remaining from the denitrification. During phase A, the nitrate
concentration is reduced in tank i and increased in tank 2. The

162
duration of phase A corresponds to the period of time required for
removing the nitrate in tank 1. Due to the flow of wastewater into
tank 1, the ammonia concentration rises in this tank.
Phase B is a short intermediate phase with aeration in both tanks
during which the wastewater is only led through tank 2. The durati-
on of phase B corresponds to the period of time required for ob-
taining aerobic conditions and partial nitrification in tank 2.
Phase C is the second main phase. The flow is now directed from
tank 2 to tank 1 and the function of the two tanks is interchanged.
Phase D is the second intermediate phase which corresponds to
phase B.
Monitoring and Process Control
All functions of the inlet distributor, outlet weirs, aerators and
agitators are monitored automatically according to programmes
adapted to each plant. When commissioning new plants, random
samples are taken on a running basis over a couple of days after
which it is possible to establish the optimum operating programme.
:,,\\
Besides the dissolved oxygen set points, the most essential parameter
that can be changed is the duration of the denitrification phases (A
and C) in relation to the nitrification phases (B and D). A typical
programme operates with aerobic conditions approx. 66 % of the time
and anoxic conditions approx. 34 % of the time, this applying to
both tanks. The use of several different programmes in the control
system has turned out to be advantageous, facilitating the changing
of this parameter either towards a larger nitrification capacity or
a larger denitrification capacity. This will be elaborated in the
following section.
OPERATING EXPERIENCE FROM TREATMENT OF MUNICIPAL WASTEWATER
Normally, Bio-Denitro plants can be dimensioned on the basis of
information on the wastewater amount and its composition. In those
cases where the nitrogen removal is to be combined with pretreat-
ment processes, biological phosphorus removal, or where several

163
process designs are feasible, pilot studies are often performed in
order to evaluate the relevant processes.
Experience from Pilot Studies
Through pilot studies it is possible to simulate the full-scale situati-
on so well that a basis for determination of design parameters,
such as degradation rates, sludge production, sludge properties etc.,
can be established. The duration of the pilot studies is normally 6-
18 months so that seasonal variations can also be investigated.
Table 1 shows the operating results obtained from pilot studies in
one Bio-Denitro plant and two Bio-Denipho plants, the latter being
a Bio-Denitro system extended to include biological phosphorus
removal. The Kolding plant (Bio-Denipho) treats pre-settled wastewa-
ter, primarily from households, whereas the loading of the plants
in Aveddre (Bio-Denitro) and Fredericia (2-stage Bio-Denipho plant)
consists of a considerable volume of industrial wastewater besides
normal domestic sewage.
Table 1 Operating Results Obtained from Pilot Plants with Bio-
Denitro and Bio-Denipho
PLANT I AVEDBRE KOLDIffi FREDERICIA
Capacity, full scale 1 360.000 PE I 125.000 PE I 180.000 PE
Pararneter(mg/l)
Total COODissolved Coo
Total BOODissolved Boo
Total N
Amnonla-N
Nitrate-Nss
BOO/N
Infl. Effl. Infl. Effl. Infl. Effl.
270 60 260 35 495 99208 - 130 - 334 -
100 9 125 9.4 305 9.873 - 73 - 220 -
31 5 29 7 28 3.5
20 1 1 132 2 1 5 <l :::
90 <5 100 6 138 12
3.2 4.3 11.1
164
It appears from the table that optimization of the operation has
been possible for all three plants, thus obtaining a very satisfacto-
ry effluent quality even though the wastewater composition and
operating conditions have been different.
Significant Factors
The results obtained from the existing full-scale plants have shown
that many different factors are decisive for the degree of stability
of nitrogen removal. The parameters of great importance to the
plant function are:
Load
Wastewater composition
Temperature
Variation of these parameters
Furthermore, the function of the treatment plants is highly depen-
dent on the plant operator’s knowledge and commitment.
Another important prerequisite for optimizing the operation of a
plant is performance of the necessary measurements and analyses.
As an example of the above problems, reference can be made to a
small plant in Jutland which was converted to incorporate nitrogen
removal and the suddenly had problems meeting the effluent de-
mands. Around 1st April 1988, the analysis sheet revealed that
something was wrong. The experience documentation available was,
however, far too limited to be able to intervene immediately in
the correct way. Only 3 data sets were available, as shown in Table
2.

165
Table 2 Results of Analyses Covering a S-Month Period for a
Wastewater Treatment Plant with Nitrogen Removal
Flow BOD S S NO3-N NH3-N IQ-N Tot-N Org-N C:N(mod.1
Date3
m /d mg/l mg/l mg/l mg/l mg/l mg/l mg/l calcul.
28/l lnfl. 1503 40 77 1.4 9.1 10.5 4.4effl. 2 5 2.5 0.7 2.0 4.5 1.3
10.2 infl. 1962 80 120 0.9 15 16 5.3effl. 4 6 3.6 0.3 2.0 5.6 1.7
14.3 infl. - 230 220 1.1 35 36 6.5effl. 7 11 13.0 0.2 3.9 16 3.7
If, as so far, the plant should only have removed BOD, ammonia and
suspended matter, this would have been sufficient and satisfactory.
However, when it comes to nitrogen removal, the situation is consi-
derably more difficult.
It appears from the table that the concentrations and amounts of
matter introduced varied by a factor 5, but that certain data are
missing (flow). The carbon-nitrogen ratio (C:N) seems to be satisfac-
tory in this case, but it has not been possible to observe the ef-
fluent demand of 8 mg/l N under all conditions without intervening
in the process control.
Another important variable is the content of organic non-degradable
nitrogen. The table shows that this figure varies considerably (1.3-
3.7 mg/l), but there are normally no direct interventions that can
be performed on the plant to improve this. In this case, an investi-
gation of any industrial discharges should perhaps be carried out.
The only way of obtaining a satisfactory nitrogen removal in a plant
with the above load conditions is by watching the operation careful-
ly and making (daily) measurements of ammonia and nitrate in the
effluent, and subsequent operations adjustments. Such measurements
are easily performed on random samples or 24-hour samples by
means of a simple test kit. Furthermore, it is a condition that the
166
plant operator understands the functioning of the biological proces-
ses and is able to adjust the operation accordingly.
Operating Results
Table 3 shows a survey of the operating results obtained from 17
Danish plants with nitrogen removal. As it appears from the table,
there is a wide spread of the analysis results, but with reference
to the above example it is not possible to make any generalization.
The only common feature is that the most stable effluent quality
is achieved in the well-tended plants.
In the following is given a comment on the results obtained from
6 of the plants in order to illustrate the complexity of operating
analyses. For the 3 plants with effluent values exceeding 10 mg/l
total nitrogen as mean value, the following 3 quite different ex-
planations of the high effluent values can be given.
The plant in Skals has been used for experiments and has been
extended with an anaerobic pretreatment tank, among other things.
Figure 3 shows a plot of the results for the plant obtained over
the last 3 l/2 years. In this period, 3 different operating conditions
have contributed to the high mean value for total nitrogen. The
figure is divided into 3 periods with their respective operating
conditions. In the first period, which was bad, the influent contained
approx. 55 mg BODJl on the average, and it has not been possible
to maintain anoxic conditions in the denitrification phases. In the
second period, with better nitrogen removal, the anaerobic pre-tank
has been put into operation and the agitation in the tanks improved.
In the third period, the content of organic nitrogen has increased
to 4.7 mg/l on the average, resulting in a considerable increase of
total nitrogen.
The plant in Faborg is not operated according to the normal Bio-
Denitro principles and there are no demands for nitrogen removal.
Consequently, no operations adjustments have been performed despite
load variations.

167
The plant in Odense N.0 is a two-stage plant loaded only l/3 of
the dimensioning basis. Consequently, the influent to the secondstage contains practically no organic matter, but has a C:N ratioof less than 2.
Table 3 Mean values of analyses performed on Danish plants withnitrogen removal
Dimenslon- Influent Effluent
Name of Plant Type Ing basis 8005 Total N BDDS Total N ND3-N W3-N N&m- of Data
1000 PE mg/T WI/T non-mod/mod. mg/l Ml W/l infl./effluent
Bording 0Em 6
Engesvang DEAD 5
Flskbck DE/m 494
Hernlng one-tank 18
Jerslev recirc. 3
Karup DEIBD 996
Level recirc. 0.8
Skals DE/MP 3.5
Ddense t&3 Z-st. BDP 30
&Tense NV z-st. E?D 85
Nr. My DVBDP 12,5
Trankm reclrc. 10
Varnen recirc. 0.8
Vejby DE/M 2.2
Ssholt T/BD 105
Fdborg T 105
Frederlkssund DEAD 33
138 31
152 33
280 37
53 17
154 23
210 44
116 25
140/39* 29/22*
238/ * 40/ *
206 25
33O(cDD) 37
216 38
103 16
197 30
346 62
300 36
-15 8.6 0.6 813
-/6 6.3 0.4 513
9/4 8.2 4.6 1.0 23/25
-/6 5.5 1.3 -/30
-/7 6.3 4.4 1.0 6/6
5/- 7.6 6.5 0.4 3/3
10/4 8.3 5.0 1.3 18/27
13/5 11.8 8.4 0.9 24/-
a/- 11.6 7.3 2.8 40145
8/- 7.6 4.1 1.4 43/39
7/- 4.0 2.7 1.0 31/31
-/2 5.6 0.3 ll/ll
8/3 9.6 6.0 1.2 17124
4/- 7.5 6.1 0.9 519
-16 8.3 4.2 2.1 121/119
8/- 11 2.0 44/41
-19 3.5 1.5 0.5 120/118
Explanation of signs and abbreviations: BD = Blo-Denitro, BLIP = Bio-Denipho, 2-st. = 2-stage plants,
* 1st stage/tnd stage

168
Nitrogen (mg/l)204
S k a l s
Fig. 3 Skals Wastewater Treatment Plant - Operating Results Ob-
tainded during 3 Different Periods
Figure 4 shows the results obtained from 2 plants, H$ming and
Ldvel, of which it appears that the reduced effluent quality may
either be attributable to an increased ammonia content (Hdrning)
or an increased nitrate content (Ldvel). In both cases a more detai-
led operations analysis will be required to establish the cause.

169
Nitrogen (w/l)“1
Lsve 1
ate
N i t r o g e n (mg/l) Horn lng
Fig. 4 Effluent Result from L&e1 and Hdrning Wastewater Treat-
ment Plants
Figure 5 shows the analysis results obtained from the Sdholt waste-
water treatment plant in the period 1984-1988 (120 data sets),
presenting curves for ammonia and ammonia + nitrate against totalnitrogen. It appears from the figure that there is some variation
in the content of organic nitrogen (2-4 mg/l). Furthermore, it is
seen that full nitrification is necessary to maintain a content of
organic nitrogen of less than approx. 8 mg/l, i.e. NH,-N < 1.5 mg/l.
When the ammonia content starts increasing, the effluent values
will inevitably exceed the permitted limit value of 8 mg/l N as thenitrate content is rarely below 3-4 mg/l. For this reason, nitrificati-

170
on is always given considerably higher priority than denitrification
in connection with optimizations of operation.
,511
75
70
15
10
s
0
Ndrogen I” eff luent (mq/t 1
Nitrate
Ammonia
25 JOTotal-N in effluent ImgA I
Fig. 5 Analysis Results Obtained from Sdholt Wastewater Treatment
Plant 1984-l 988
Figure 6 shows a quantile diagram of the analysis values for all 17
plants stated in Table 3. It appears from the figure that the mean
value (60 % quantilel for the plants tested is NH,-N = 1.2 mg/l,
NO,-N = 6.0 mg/l, inorganic N = 7.2 mg/l and total N = 8.2 mg/l.
Considering the explanations given for the plants with the poorest
results, there is - on the basis of the experience gained so far-
every reason to expect that Danish wastewater treatment plants
will be able to meet the demands of the action plan.

171
100
on
8 0
10
6 0
I,0
4 n
30
20
IO
0
0 2 3 4 5 6 8
ler cent NH3 N N03--N lotol -N
+ x 0
I x 0
tX 0
+ 0x
L x Q
---+-_--------_---~------
::.L
I
I Q
0x
X
x
x
X 0
0
0 i
0 I
--TT Ni t rogen (mq/l)“. T
9 10 11 12
Fig. 6 Quantile Diagram for 17 Danish Wastewater Treatment Plants
with Nitrogen Removal
Operating Experience from Treatment of Industrial Wastewater
Industries with separate discharge of wastewater must also remove
nitrogen. Many years’ experience has already been gained from
treatment of wastewater from rendering plants. Under controlled
operating conditions and with sufficient amounts of organic matter
in the wastewater, the content of total nitrogen can be reduced
from more than 400 mg/l N to less than 10 mg/l.
This type of wastewater is relatively uncomplicated to treat as long
as a pH-adjustment is ensured to compensate for the acidification
resulting from the nitrification.
The Bio-Denitro method can also be used for more complex types
of wastewater from the chemical industry. For a couple of years,
pilot studies have been carried out on wastewater from the company
Grindsted Products A7S which produces additives for the food and
drug industries. Several of the substances contained in the wastewa-

172
ter have a certain toxic effect on micro-organisms and are quite
heavily degradable. The studies have shown that the degradation
rates for nitrogen in the plant are reduced by approx. 40 % compa-
red with normal domestic sewage, but that complete removal of
the degradable nitrogen in the untreated wastewater is possible.
The nitrogen removal thus corresponds to approx. 300 mg/l N with
NH,-N and NO,-N of 10 mg/l and 2 mg/l, respectively, in the
effluent, at a load of 0.1 kg COD/kg SS x d at approx. 20°C. It
should be noted that the salt content in the wastewater is approx.
3-4000 mg/l.
DEVELOPMENT TRENDS
Besides removal of nitrogen, demands in respect of phosphorus
removal have been made for all Danish wastewater treatment plants
over 5000 PE. Good experience has been gained from phosphorus
removal with simultaneous precipitation and biological phosphorus
removal at the same time as the plant is operated with nitrogen
removal.
The latest trend of developments is towards optimizing the pretreat-
ment processes, such as settling, biosorption and presettling, concur-
rently with hydrolysis of the settled sludge. The liquid from the
hydrolysis is then used as carbon source in the subsequent nitrogen
removing process stage which will thus be considerably smaller in
volume than in the case of a onestage plant. The joint Nordic
EUREKA project HYPRO, among others, deals with this trend.
In connection with the development of design and optimization tools
for plants for biological removal of nutrient salts, dynamic mathe-
mathical models of the type developed within IAWPRC - by Mr. Mo-
gens Henze, among others, ass. professor at the Dept. of Environ-
mental Engineering, the Technical University of Denmark - have
been introduced. These models can calculate the degradation rates
of organic matter and nitrogen in activated sludge plants. A compa-
rison of calculated values with experimental data has shown that
the models can be calibrated to pre-calculate operating results in
connection with plant extensions, operating changes etc.

173
As an example of this, Fig. 7 shows a comparison of experimental
data from the Aveddre pilot plant (Table 1) with modelcalculated
results before and after calibration of the model.
1
00 30 60 90 120 150 160 210 240
Fig. 7 Results Obtained from AvedBre Bio-Denitro Pilot
Compared with Model Data (Uncalibrated and Calibrated)
Plant,
CONCLUSION
Good experience has been gained from 15 years’ operation of a large
number of plants with nitrogen removal, primarily by the use of the
Bio-Denitro process.
Analysis results of 17 plants have shown that the average values (60
% quantile) of the mean values from these plants are approx. 1 mg/l
NH,-N, approx. 6 mg/l NO,-N and approx. 8 mg/l total nitrogen.
The highest mean values have been obtained in plants with quite
special operating conditions and problems. A general effluent demand
of 8 mg/l total nitrogen will therefore normally be observable.
Results obtained from treatment of industrial wastewater from the
food and chemical industries in full-scale and pilot-scale plants have
shown that also for this type of wastewater satisfactory nitrogen
removal can be achieved.
12 402336x

174
The prerequisites for obtaining good operating results are careful
operations monitoring and flexibility of the plants in respect of
design and control to such an extent that the denitrification and
nitrification capacity can easily be changed in relation to the load
variations.
In the years to come, the focus will be on compact processes comp-
rising pretreatment and sludge hydrolysis for production of carbon.
At the same time, mathematical models will be developed which can
be used for dimensioning, operations optimization, control and moni-
toring of the plants.
However, the plant operators will always be important persons the
training and skills of which will be decisive for proper functioning
of the plants.

175
EXPERIENCES IN THE SWEDISH NITROGEN PROJECT
Mr. Jan-Erik Haglund
County Administration of Sodermanland
Mr. Bengt Goran Hellstrom
Himmerfjarden Treatment Plant
Introduction
The extent of object research conducted in the field of water supply
and sewerage at universities and institutes of higher education in
Sweden has been extremely limited in recent years. The money has
instead been invested in other fields. We therefore largely lack the
advance knowledge that is needed now that nitrogen reduction is to
be introduced over a short period of time at a large number of
treatment plants in Sweden. The demand for trained staff within
the process sector has already increased as a result of the fact
that more complicated processes and combinations of processes are
to be introduced. However, the training offered at universities and
institutes of higher education is lagging a long way behind, and
most of the training that is required has to be provided at the
treatment plants. So too must a large proportion of the research
and development work that now has to be conducted with a minimum
of delay as a consequence of the nitrogen reduction requirements
that have been imposed by the Government.
One of the objectives of the Nitrogen Project, which is described
in another Swedish paper, is to collect, process and to spread infor-
mation from the research and development on nitrogen removal
that are conducted at different treatment plants. The idea behind
this is to maximize the efforts that are being made on each treat-
ment plant.
The following is a short review of nitrogen projects currently in
progress in Sweden.

176
Ongoing development work
There has been a significant increase in the interest shown in intro-
ducing nitrogen reduction at Swedish treatment plants during recent
years. The timetable adopted by the authorities for introduction of
nitrogen reduction at plants in particularly sensitive coastal areas
has, however restricted the opportunities for examining a number
of alternatives to nitrogen reduction. The emphasis in the research
and development work has been placed on biological nitrogen reduc-
tion and in particular on pre- and post-denitrification. Today deve-
lopment work in pilot plant and full scale are in progress at appro-
ximately 30-35 different treatment plants. Quite a few results have
come from both pilot and full-scale plants. The interest in research
into alternative methods has also increased, and Table 1 provides a
summary of ongoing activities in Sweden.
Table 1 Nitrogen reduction projects in Sweden
Activated sludge processes
- Pre-denitrification, one-sludgesystem
- Post-denitrification, one andtwo-sludge systems
- Intermittent denitrification,SBR
- Alternating denitrification,Biodenitro
- Fixed-bed processes
- Proportion of anoxic/oxic zones
- Effect of pre-precipitation
approx. 20 treat-ment plants, seeSNV Report 3527 (1)Nitrogen reductionat municipal treat-ment plants
Norrkoping, MalmoHimmerfjbrden,Halmstad, Helsing-berg, Eskilstuna,Goteborg, Laholm
Lund, Gallivare
Laholm
Malmd, Helsingborg,Grebro
The Royal Instituteof Technology,Stockholm (KTH),most plants underpredenitrification
Helsingborg, Halm-stad
Trickling filters
- Pre-denitrification, one andtwo-sludge systems
Lund, Karlskrona

177
- Post-denitrification, one andtwo-sludge systems
- Increase of bed height
- Effect of pre-precipitation
Treatment of sidestreams
- Nitrification/denitrification
Carbon sources
Wastewater (characterization)
Internal carbon sources (primarysludge, hydrolysed sludge)
External carbon sources (methanol,starch, industrial wastewater etc)
Soecial studies
Testing of aeration systems
On-line instrumentation
Automatic control, modelling,knowledge-based systems
Sedimentation, sludge properties
Pre-denitrification
Malmo, Karlskrona,Lund, Varberg
Malmo
Karlskrona
Bromma, Varmdo,Eslov, Norrkoping
The Hypro Project
Lund Institute ofTechnology (LTH),Chalmers Universityof Technology (CTH)Falkenberg,Halm-stad, Laholm,Vaster&, Klippan,Halmo, Oskarshamnthe Hypro Project
Varmdo, Norrkoping,Malmo, Himmer-fjarden, Vasteras,Eskilstuna, Gdte-berg, Halmstad,Helsingborg, Stock-holm, Laholm,Varberg.
Malmo, Henriksdal,Kappala, Himmer-fjarden, Bromma
LTH, VAV (TR43)
LTH, KTH
CTH, KTH, the Ryaplant, Bromma,Kappala, Himmer-.fjarden, Malmo.
Many Swedish treatment plants have relatively long detention times
in the aeration tanks and low sludge loads, which is shown in an
investigation conducted by the National Environment Protection
Board, SNV (2). This frequently leads to spontaneous nitrification

178
at many plants, at least during the summer months. It has therefore
been natural at these plants to in the first instance use pre-denitri-
fication, since this also results in a reduced operating cost owing
to lower oxygen consumption.
The goal has been to achieve 50 % nitrogen reduction with this met-
hod of operation, which is realistic. However, it requires complete
nitrification and a recirculation level of at least 100 %. Accounts of
the operating results have been given both in a number of internal
presentations from several plants and in published material from
Falkenberg (3), Halmstad (41, Himmerfjarden Treatment Plant (5, 6,
7) and Malmo (8, 21).
Falkenberg is the only treatment plant in Sweden with a requirement
for nitrogen reduction, at least 60 % counted as mean annual value
and at least 70 % as the mean value for the period July 1 up to and
including November 30. The plant is equipped with both trickling
filters and activated sludge facilities. The incoming water consists
to a fairly large extent of industrial wastewater and therefore
contains higher concentrations of organic matter than is normally
the case at Swedish plants. This means that a typical reduction in
nitrogen via the plant due to assimilation may be in excess of 30
%. Despite this, here too a carbon source must be added during
the night-time and week-ends in order to optimize the denitrificati-
on process. Primary sludge is used for this purpose in combination
with manual connection and disconnection of one or two trickling
filters. This serves to stabilize operation of the nitrogen reduction
plant. In this way it has been possible to meet the imposed require-
ments.
At Bus&s treatment plant in Halmstad one third of the volume of
the aeration basin have been arranged into an anoxic zone. Since
the spring of 1988 the annual mean value for the nitrogen reduction,
has been approximately 50 %. As in Falkenberg, the incoming water
consists to a large extent of industrial wastewater with leads to a
high C/N-ratio.

179
At Vastra Stranden treatment plant in Halmstad, the possibilities for
nitrogen reduction were investigated during 1986. A summary of the
results of trial operation at a temperature of 16°C shows:
- It was possible to achieve 50 % nitrogen reduction, corresponding
to at most some 4 mg/l of total nitrogen as a mean value in the
water leaving the present treatment plant by raising the sludge
content in the aeration tanks and arranging an anoxic zone in the
first part of each aeration tank. The sludge concentration could be
raised to a high level (3 500 - 4 000 mg/l) without impaired sedi-
mentation.
- In order to increase nitrogen reduction to at least 70 % the
volume of the aeration tanks must be doubled. The total nitrogen
content in the outgoing water will then be at most approximately
8 mg/l of total nitrogen.
Himmerfjarden Treatment Plant has a low proportion of industrial
wastewater and thus fairly low concentrations of organic matter in
the incoming water. Denitrification is restricted during a large part
of the time by the supply of organic carbon. Figure 1 shows how
the carbon/nitrogen ratio and denitrification vary during the day and
week. During the course of measurement, on-line instruments have
been used for COD and total nitrogen. The assimilative nitrogen
removal is normally 10 - 12 % of the incoming nitrogen. In order
to achieve 50 % reduction, it is necessary to add a carbon source
during periods of low load. Pilot trials were therefore carried out
during the summer and autumn of 1988 with a number of carbon
sources: primary sludge, water from primary sludge thickeners, acetic
acid and glycol. An interim report on the results shows that the
rate of denitrification was increased by between 50 and 88 % when
acetic acid and glycol were used. During a two months period using
glycol, the mean value of nitrogen reduction was 72 %.
At Klagshamn Treatment Plant in Malmo, the situation is very
similar to that at the Himmerfjarden plant, a carbon shortage rest-
ricts the denitrification which stops at a level of about 30 %. In
this case, starch has been used as an additional carbon source.

180
These experiments are reviewed under the chapter headed “Carbon
sources”.
Studies at Sjolunda treatment plant in Malmo (21) on pre-denitrifica-tion in combination with a fixed-bed material in the aeration tank,have resulted in a nitrogen reduction of 70 % (mean valve).
Carbon/Nitroqqn-ratio Infl. t o Ll
Total Nitroqen Removal line Ll
1
Fig. 1 Variations in nitrogen reduction at Himmerfjarden TreatmentPlant

181
Post-denitrification
Many Swedish wastewater treatment plants are designed for post-
precipitation. Since the introduction of pre-precipitation and its
optimization, a number of post-precipitation plants have been closed
down or not used optimally. It is possible to use these volumes for
post-denitrification in the way outlined in Figure 2.
SYSTEM FOR BOD- AND P-REMOVAL
SYSTEM FOR BOD-, P- AND N-REMOVAL
Fig. 2 Alternative methods of operating a post-precipitation plant
This concept has been successfully tested in Norrkoping (9). Experi-
ments with a system of sludge recirculation have been in progress
since 1987. The changeover to pre-precipitation with ferrous chloride
made the section for chemical treatment redundant. This section has
subsequently been used for post-denitrification. Hydrolysed starch
has been used as an external carbon source. The results show that
the ingoing nitrate nitrogen concentration to the post denitrificati-
on plant was approximately 12 mg/l and in the outgoing water some
4 mg/l. The consumption of starch corresponds to approximately
1.6 g of carbon per gram of nitrogen removed.
The concept is also being tested in Malmo at the Sjolunda plant.
The water from a pre-denitrification plant is led to two flow lines
in the post-precipitation plant, where the flocculation tanks have

been converted to permit experiments with post-denitrification.
Fixed-bed material with a density of 200 m2/m3 has been applied
in the flocculation tanks, and the system is operated as a non-
recirculated system. Studies are made in connection with the additi-
on of different carbon sources.
182
SYSTEM FOR BOO- AN0 P-REMOVAL
SYSTEM FOR BOD-, P- AN0 N-REMOVAL
Figure 3. Alternative methods of operating a post-precipitation
plant
Post-denitrification experiments have also been carried out at Him-
merfjarden Treatment Plant with the aid of subsidies from the Na-
tional Environmental Protection Board, see Figure 3. These subsidies
are referred to as New Technology Grants (5). The results showed
that the volumes for post-denitrification, in this case the converted
secondary precipitation tanks, were not sufficiently large for the
endogenous respiration to provide an adequate addition of available
organic carbon. In order to achieve a sufficiently high level of
nitrification, methanol has to be added as a carbon source, which
was shown in full-scale trials.

183
Carbon sources
During the biological denitrification, the ratio between organic
carbon and nitrogen in the wastewater is of considerable importance.
As demonstrated by the experiments reviewed above, shortage of
carbon has tended to restrict the denitrification at a number of
plants. There is therefore considerable interest in studying various
external carbon sources, and a number of experiments have been
carried out on a laboratory and pilot scale, as well as several in
full scale. In the full-scale trials, primary sludge has been used as
a carbon source at Falkenberg (3) and Halmstad (41, as well as in
treatment of sidestreams at Bromma (10) and Varmdd (11).
Raw wastewaters from food-processing industries are to be tested
as carbon sources in Laholm and Varberg.
Hydrolysed starch has been used at the Klagshamn plant and the
Sjolunda plant in Malmij (8, 21) and Norrkoping (91, and methanol
at the Himmerfjarden plant (5). Acetic acid, acetate, formate, sac-
charose and glycol have also been studied in experiments on a
laboratory and pilot scale. In connection with the laboratory tests,
a simplified method of measuring the denitrification rate has been
worked out by Anox Ab in Lund, and used in the tests of carbon
sources that have been made in Malmii and Norrkoping.
ANOXIC AEROBIC
ANOXIC AEROBIC
Figure 4. Alternative dosing points for external carbon source

184
Alternative dosing points for the external carbon source have been
investigated at the Klagshamn plant (see Figure 4). If only return
sludge and external carbon are added to the anoxic zone, the con-
centrations of both nitrate and organic carbon will be higher. This
in turn gives higher denitrification rates and double the detention
time in the anoxic zone. The preconditions for a high level of denit-
rification increase. The wastewater is then added after the anoxic
zone. There are many indications to suggest that improved sludge
sedimentation capacity is obtained if there are high contents of
easily-degradable organic material when the sludge flocks are for-
med. In these experiments, it appeared that the starch was not
degradable to a sufficiently rapid extent in order to permit evaluati-
on of the method of operation. Carbon sources of the methanol or
acetic acid type are needed for this purpose. However, this pro-
cess alternative is interesting and will continue to be studied.
The result from the Kalgshamn plant in Malmo, where a hydrolysed
starch was used as the external carbon source in a pre-denitrificati-
on stage, differ significantly from those presented from Norrkoping.
Despite a dosage of starch, the denitrification in the anoxic zone
failed to increase, and nitrate was found to remain in the water
leaving the zone. However, the nitrogen separation increased
throughout the entire plant by approximately 15 %, although this can
be attributed to increased assimilative reduction which manifested
itself in a substantial increase in sludge production. Laboratory tests
has confirmed that starch in this pre-denitrification plant is not
degradable to a sufficiently easy extent. In Norrkoping, starch is
used in a post-denitrification stage with extremely successful results.
The possibilities of producing easily-degradable carbon through the
hydrolysis of sludge have attracted a lot of interest. Experiments
were carried out during 1988 at a pilot plant in Halmstad. The re-
sults show that fats are not broken down under the prevailing
anaerobic conditions. Experiments have therefore been carried out
with a complementary alkaline hydrolysis. The experiments have
been conducted both without heating and at 33 “C, in which context
a study was made of the temperature effects. Since the experiments
gave the anticipated results, a full-scale trial started during the

185
winter of 1988 in a thickener. Also the questions of separation are
being studied. The results have not yet been published.
Similar full-scale experiments are also planned in Vaster-as. There,
however, it is also possible to study the separation between sludge
and water phases in a separate thickener.
Experiments on biological and chemical hydrolysis of pre-precipitated
sludge at a pilot-plant in Helsingborg, has indicated that a conver-
tion of approximately 20 % of the sludge content of COD to easily-
degradable carbon is possible.
In conjunction with experiments concerning biological phosphorus
reduction in a pilot facility at Sjolunda Treatment Plant in Malmo,
the hydrolysis of sludge has been used for the production of easily-
degradable carbon. The experiments have been carried out at room
temperature in a 1.5 m3 tank and various detention times have been
studied. A report on the experiments is currently being drafted.
Sludge hydrolysis is included as part of a Nordic research project
called HYPRO, the Hydrolysis PRoject. Representatives for Sweden
(KEMIRA), Denmark (Kruger, DTH, VKI) and Norway (NTH, Ferri-
klor) are involved in the project, which has Eureka status. It is to
be carried out in two years and have a budget of SEK 18 million.
The two other main parts of the project are chemical precipitation
and biological nitrogen reduction. The project aims at developing a
process for advanced wastewater treatment including extensive treat-
ment of organic matter as well as nitrogen and phosphorus. The
concept is shown in Figure 5.

186
EFFWENT WATER
RAW SEWAGE PRECIp.WATER
I aCHEmxL BIOII)CICAL _PREXIPITATION 0 NITROGEN , 0
REXOVAL
SLUDGE l
0 l POINTS FORCHARACTERUATION
ANAJZROBICS L U D G E
HYDROLYSE SLUDGE WATERF'ROY HYDROLYSEREACTOR
HYDROLYSED
Figure 5. The HYPRO Project
The bological nitrogen reduction is accelerated through the addition
of easily-degradable, organic carbon produced through biological or
chemical hydrolysis of chemically-precipitated sludge. One important
goal of the project is to investigate and characterize the wastewater
in the various process stages. New specific characterization methods
shall be developed for this purpose.
Treatment of supernatant from sludge dewatering
As a complement to pre-denitrification, it may be of interest to
specifically treat more concentrated internal flows. Biological treat-
ment of supernatant from sludge dewatering has been investigated
at Bromma Treatment Plant, Stockholm, Es&, Norrkoping and
Varmdd.
The work at the Bromma plant was carried out as a licentiate task
at the Royal Institute of Technology, Stockholm (10). During the
experiments, a reduction of about 60 % was achieved in the am-
monium content, primarily due to an oxidation of ammonium to
nitrite. Continued oxidation of nitrite to nitrate was probably inhibi-
ted by the low pH value (approx. 5.6 - 6) and the high content of

187
nitrous acid. During the experiments, the alkalinity of the water
dropped from 3 500 - 4 800 mg/l HCO, to 50 - 100 mg/l HCO,.
This shows that the alkalinity may be an important factor which
prevents extensive oxidation of ammonium. A moderate denitrification
(approx. 10 - 20 %) took place in the denitrification zone. The
access to organic carbon was the governing factor in this context.
An addition of external carbon was made in the form of primary
sludge. The denitrification thereby increased by (16 - 28 %) as a
consequence of the addition of primary sludge.
Another study of biological nitrogen reduction in the reject water
has been carried out at Tjustvik Treatment Plant in Varmdo (11).
The plant has a special treatment line for supernatant from sludge-
watering. The idea was that nitrification of the supernatant would
be obtained at the same time as nitrification bacteria from this
plant was used as graft material, and thereby simplified nitrification
throughout the entire plant.
In the supernatant line, an anoxic zone was created in the aeration
tank. During experiments, it was shown that the alkalinity was
usually sufficient for a 50 % denitrification. During denitrification,
the alkalinity increases proportionally to the degree of denitrifica-
tion. In order to permit complete nitrification, hydroxide was added.
The organic matter in the supernatant was only sufficient for lo-
20 % denitrification. The nitrification level was increased to max
70 % by the addition of well sludge. The primary sludge was also
tested on a full-scale basis. In addition, methanol, acetic acid and
hydrolysed starch were tested on a laboratory scale. Methanol pro-
ved to give the highest denitrification rate of the three.
The study in Varmdo will continue on larger scale during 1989.
Hydrolysis of sludge,the ratio between aerobic and anoxic zones,
and fixed-bed materials will also be investigated.
In Norrkopinq a full-scale trial of biological nitrification in superna-
tant from sludge dewatering and return sludge started in december
1988. The purpose is, as in Varmdo, to produce nitrification bacteria,
with are seeded into the water treatment plant during cold seasons.
In order to prevent low pH value in the nitrification process lime

188
is added. The result has been promising. The nitrification in the
water treatment plant started for exampel 30-40 days earlier 1989,
compared to 1988.
Intermittent methods
The intermittent method that has attracted most interest in Sweden
is Sequencing Batch Reactors (SBR).
It has been investigated on municipal water in Lund, where a pilot
plant with two reactors was used. The results have been encoura-
ging, with full nitrification and a high mean level of denitrification.
The average nitrogen reduction during the test period has been 73
% (22). There are now hopes of even better results with an opti-
mization of the sequence periods.
The technique has also been used for the treatment of leachate in
a 500 litre reactor in Varberg, and was shown to work even with
waters as thick as this. The ingoing nitrogen content was 400-450
mg/l and the outgoing content normally 50-60 mg/l. During certain
periods the reduction was over 90 %.
Interest is being shown at several municipal plants in testing the
technique on a full-scale basis. Several experiments will probably be
started during spring 1989. In addition, there is a National Board for
Technical Development (STU) project being conducted at the Uni-
versity of Lulea (13) in which biological phosphorus reduction by
the SBR technique in cold climates will be investigated.
Increase in sludge content
One of the most important factors that affects nitrification is the
sludge age. At a temperature of 20°C, a sludge age of 5 days is
sufficient, whereas it hast to be increased to about 20 days when
the temperature drops to 6 or 7°C. The sludge age is influenced
by the sludge production and quantity of sludge in the system.
It is possible to increase the sludge concentration in the system to
a critical level. Studies of the sludge properties in connection with

189
nitrogen reduction have been made at Kappala Treatment Plant (15,
16) and a major study has been initiated at Bromma Treatment Plant
during 1988. Both tasks are being conducted in cooperation with the
Royal Institute of Technology, Stockholm (KTH). KTH is also running
an STU project entitled “Improvements in sludge properties in order
to permit biological nitrogen reduction at existing wastewater treat-
ment plants in Sweden”. A status report is available on this study
(161.
The function of the sedimentation tanks at the Rya plant in Gothen-
burg has been studied in detail at CTH by Lumley (17).
One way of increasing the sludge concentration in the aeration
tanks is to use a fixed-bed process. An increase of 1.5 in the sludge
concentration to 9 kg/m3 has been reported in the literature. This
corresponds to an increase in the sludge concentration of between
50 and 300 % in a conventional activated sludge facility. Apart from
an increase in sludge concentration, benefits such as a more stable
process and reduced sensitivity to lower temperatures have been
repoded.
Experiments have been carried out on a full scale in &ebro and
Malmo, and on a pilot scale in Helsingborg.
At Sjiilunda Treatment Plant in Malmo, two parallel lines have been
converted for experimental use (8, 21). These lines each treat 10 %
of the total flow. Both the lines have anoxic zones in their inlet
sections (see Figure 6). The zones are separated by wooden walls
and the anoxic zones are fitted with agitators. In one of the lines,
fixed-bed material trate with a density of 150 m2/m3 has been in-
stalled. This takes up approximately 25 % of the total tank volume.
Beneath the fixed-bed, a fine-bubble aeration system covers the
entire floor in order to furnish the oxygen supply and combat
blockage and choking of the fixed-bed. The experiment was initiated
during the summer 1988.
13 402336x

190
TEST BASINS SJdLUNDA PLANT
iAIR ROW
Auf. VALVE tlxrd bad I ’ AIR ROW
I
Aur. VUVE
MOx/OK Am/ox ANox/ox ANOXIOK ox O K ox cp ox .I
I ’ AIR FLOW
Aur. VALVE
Figure 6. Experimental plant at Sjolunda Treatment Plant, Malmij
The results of the study shows that:
- The sludge concentration in the line fitted with fixed-bed material
could be increased to 6 000 mg/l, compared to 3 000 mg/l in the
line without fixed-bed material. The sludge properties of the sludge
from the line with fixed-bed material also where better.
- Sludge production was 50 % lower in the fixed-bed line.
- Nitrification and denitrification rates were 50 % higher in the
fixed-bed line. Total nitrogen reduction was approximaterly 70 %.

191
At Sjijlunda fixed-bed materials also have been tested in anoxic
volumes for post-denitrification. The denitrification rate was inc-
reased dramatically when starch was added, but the fixed-bed mate-
rial got clogged after two weeks due to intensive bacterial growth,
and the experiment was stopped. Inspite of this the experiment
was judged as promising and will be continued with other kinds of
carbon sources.
In Helsingborg experiments have been carried out at a pilot plant
with fixed-bed material (231. This has made it possible to study a
number of different process variations in parallel, including nitri-
fication, pre-nitrification, post-nitrification, the addition of a carbon
source, precipitation and simultaneous precipitation.
Aeration system
Owing to variations in temperature and load, it may be extremely
advantageous to be able to vary the size of the anoxic and aerobic
sections. This has been made possible at several treatment plants by
subdividing the aeration tanks into several sections separated by
walls. In each section there is an aeration system covering the floor
of the tank with a separate air supply. The diffusers are of the
finebubble type with a flexible rubber membrane. It is possible to
use this type of diffusers intermittently. In this way, when necessa-
ry, one zone can be aerated, and on another occasion it can be
closed on and become anoxic without the aerators clogging up. The
efficiency of this type of diffusers has so far proved to be good.
However, one question that still remains is the life-span of the
rubber membrane.
Tests incorporating IFU and Nopol diffusers are being carried out
at Sjolunda, Henriksdal and Himmerfjardplants. In order to evaluate
their efficiency, a test method referred to as the “off-gas” method
is being used. The gas that leaves the aeration tanks is collected
by means of a floating hood. This is referred to as “off-gas” and
its oxygen content is compared with the oxygen concentration in
the air to the aeration system. The method, which is described in
several articles, has proved to be fast and comparatively simple, at
the same time as the analysis results are reliable. The test results

192
are currently being compiled in a joint report from the plants men-
tioned above. All the systems were installed during the spring and
summer of 1988 and thus still have comparatively short operational
histories.
Modelling, simulation and control of treatment plants
A simple design model for one-sludge plants for biological nitrogen
reduction has been developed by Hultman with the help of data from
the literature available on the subject (20). The model is based on
variables that are normally measured at treatment plants. This shall
make it possible to verify the model with the experimental findings
that are now being obtained at pilot and full-scale plants. The model
provides the answer to total detention times in the biological plant
and in the anoxic and aerobic parts.
Research concerning the control of treatment plants has been car-
ried out at the Institution for Automatic Control at the Institute
of Technology, Lund. The interest shown by purchasers in dynamics
and automatic control has increased during recent years. Now that
nitrogen reduction has also become of interest, there will be a
significant increase in the need to understand and improve operation.
A project referred to as “Modular model systems for the simulation
and control of treatment plants” has been started during the autumn
of 1988 at LTH (20). The project incorporates two sub-areas, one
of which comprises the development of a dynamic simulator for
treatment plants and the other knowledge-based systems for the
diagnosis of operational status and operator management in treat-
ment plants.
The object of the first sub-project is to make use of knowledge on
and developed software for dynamic models for activated sludge
plants in order to construct a process simulator. This shall be
utilized in prototypes directly in treatment plants as an advisor
instrument for technicians and process engineers. One way of using
simulations is to test measures in advance, especially manual actions,
the result of which can be shown in an extremely slow time scale.
In addition, the simulator may become valuable training instrument

193
for technicians and process engineers in order to gain a clearer
idea of different sub-processes.
The second sub-project aims at systematizing a set of rules for
diagnosing different operating conditions in the activated sludge
process. This set of rules shall utilize both on-line information as
well as laboratory samples and other observations. This means that
the rules must vary depending on the degree of plant instrumen-
tation. With an expert system or a knowledge-based system, a tech-
nical aid is created which provides a “partner” for the technician
or process engineer in working out the reason for a certain opera-
ting condition. When counter-measures are to be tested the simula-
tor outlined above will be a natural aid.
The demand for continuous measurement sensors will naturally be
greater when the dynamic sequence is to be decided. A working
group within VAV, TR 43, is engaged in reviewing sensors available
on the market that may be of interest in experiments with nitrogen
reduction. A list of the instruments that are available is currently
being compiled. Consequently, an attempt will be made at evaluating
the function, reliability and maintenance requirements based on
instruments in operation at the treatment plants.
References
( 1) Kvavereduktion vid kommunala avloppsreningsverk. Lagesrapport
juli 1988. Naturvardsverkets Rapport 3527, 1988.
(2) Eklund, L., Bearbetning av resultat fran driftundersijkningar vid
kommunala reningsverk, SNV PM 556, 1974.
(3) Lind, J.E., Rybczynski, H. och Johansson, R., Fiirsijk med biolo-
gisk kvavereduktion vid Falkenbergs reningsverk. Rapport over
naturvardsverkets ny-teknik bidrag. Dnr 348-6163-82 Tk, 1985.
(4) Ericsson, B., Kvavereduktion i ett bassangreaktorsystem. Vatten
43, 4, s 302-312, 1987.

194
(5) Bosander, J., Hellstrom, B.G. och Plaza, E., Biologisk kvavereduk-
tion vid Himmerfjardsverket. Rapport till Naturvardsverket. Dnr
505-1324-84 TV, 1986.
(6) Hellstrom, B.G., Bosander, J., and Plaza, E., Experience with
biological denitrification at the Himmerfjarden Plant. Baltic Sea
Environment Proceeding No. 25. Seminar on wastewater treatment
in urban areas, Visby 1986. 99 97-104, 1987.
(7) Plaza, E., Bosander, J., and Hellstrom, B.C., Biological nitrifi-
cation and denitrification in combination with chemical pre-precipi-
tation in a sewage treatment plant, Sweden. Water Supply Vol. 6,
Brussels, pp 107-117, 1987.
(8) Andersson, B., Sewage treatment in Sweden regarding nutrient
removal. Paper presented at the Fourth Conference in Karlskrona
on the Health of the seas, 1988.
(9) Larsson, S-G., Nordh, L., Tjeder, A. och Haglund, A., Kvavere-
duktion vid avloppsverket Slottshagen i Norrkdping. Vatten 44, 2,
s 104-113, 1988.
( 10) Tendaj-Xavier, M., Biologisk behandling av rejektvatten fran
centrifugering av rotslam. Avd. for vattenvardsteknik, KTH, Trita-
Vat-1851.
( 11) B jorlenius, B., Biologisk kvavereduktion i rejektvatten fran
slamrotning. Vatten 44, 3, s 252-255, 1988.
(12) Nordisk forskningsprojekt for langtgaende avloppsvattenrening-
Hypro. Vattenspegeln nr 3, 1988.
(13) Marklund, S. och Morling, S., Biologisk fosforreduktion med
SBR-teknik. STU ansokan Dnr 722-88-2946, 1988.
(14) Lynga, A., Sedimenteringsegenskaper hos slam i samband med
fijrsiik med kvavereduktion. Avd for VA-teknik, Tekniska Hogskolan
i Lulea, 1988:021 E (examensarbete), 1988.

195
(15) Mat&on, B., Matmetoder och orsakssamband for filamentin-
nehall i aktivt slam. Avd. for Va-teknik, Tekniska Hijgskolan i Lulea,
1988:008 E (examensarbete), 1988.
(16) Hultman, B., Forbattring av slamegenskaper for att miijliggiira
biologisk kvavereduktion i befintliga avloppsverk i Sverige. STU
Lagesrapport Dnr 85-04534P, 1988.
(17) Lumley, D. And Balmer, D., Investigations of secondary settling
at a large treatment plant. Paper presented at the International
Workshop on Design and Operation of Large Wastewater Treatment
Plants, Budapest, vol 2, 1987.
(18) Boyle, W.C., Hellstrom, B.G., and Ewing, L., Oxygen transfer
efficiency measurements using off-gase techniques. Paper presented
at the 14th IAWPRC Biennial International Conference, Brighton,
pp 1295-1300, 1988.
( 19) Hultman, B., and Plaza., Modelling and improvments of single
sludge processes for biological nitrogen removal. STU ansijkan Bilaga
2, 1988.
(20) Olsson, G., Modular-t modellsystem for simulering och reglering
av reningsverk. STU ansiikan Dnr 722-88-2110, 1988.
(21) Andersson, B. Aspengren, H. and Gunnarsson, Malmo Gatukon-
tor, Kvaveseminarium 17-18 jan 1989 i Malmo. Konferens dokumenta-
tion, 1989.
(22) Morling, S. and Persson, T. Kallby avloppsreningsverk. Fiirsiik
med biologisk kvavereduktion med SBR-teknik, fijrsiiksperiod 1. VIAK
delrapport 1. Dnr 5810-642158, 1989.
(23) Smith, G. Kvavereduktion i kombination med kemisk fallning vid
Helsingborgs reningsverk. Slutrapport kemiskvattenvard, 1989-04-03.

196
CRITICAL FACTORS FOR NITROGEN REMOVAL - REPORT ON SIX YEARS FULL
SCALE OPERATION IN FALKENBERG
Dr, Lars Gunnarsson, Dr. Bjijrn Rosen and Ms. Halina Rybczynski, Sweden
Anox Ab
INTRODUCTION
Falkenberg is a town on the Swedish west coast with some 40 000
inhabitants. The waste water treatment plant is also receiving waste
water from different industries like brewery, dairy, slaughter house,
distilling plant, metal recovery plant. To be able to treat this mixed
waste water the treatment plant was originally designed for 160 000
population equivalents.
Full scale tests with biological nitrogen reduction took place at Fal-
kenberg waste water treatment plant from July 1, 1983 to June 30,
1984. After this date the treatment plant has been operating with
nitrogen reduction. The permit for the effluent standard was revised
by the Swedish authorities during 1985 and it was required that the
treatment plant should be reconstructed before January 1, 1987 to
permanently achieve not less than 60 % total nitrogen reduction as
a yearly average and not less than 70 % during the period from
July 1 to November 30. The BOD and phosphate limits were decided
to be 25 mg/l and 0.5 mg/l respectively.
The treatment plant was build in 1976 and the process at Falkenberg
comprises mechanical treatment followed by two trickling filters in
parallel after which follows an activated sludge process and finally
chemical treatment.
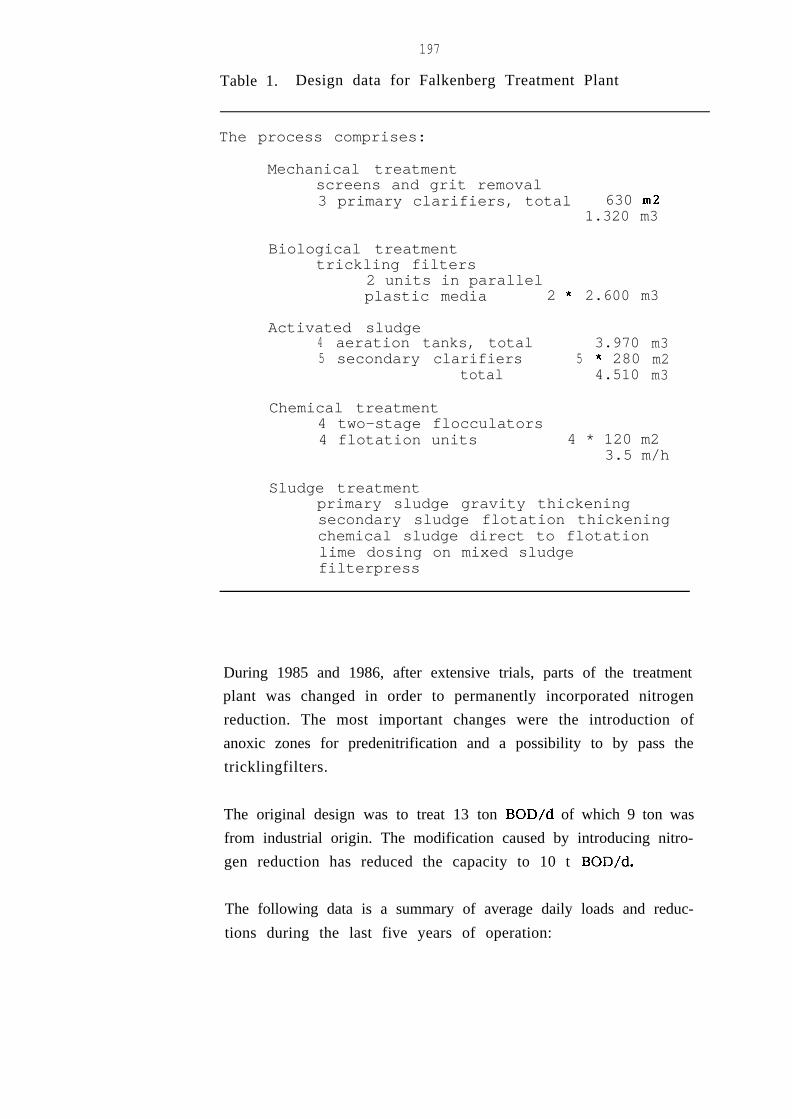
197
Table 1. Design data for Falkenberg Treatment Plant
The process comprises:
Mechanical treatmentscreens and grit removal3 primary clarifiers, total 630 m2
1.320 m3
Biological treatmenttrickling filters
2 units in parallelplastic media 2 * 2.600 m3
Activated sludge4 aeration tanks, total 3.970 m35 secondary clarifiers 5 * 280 m2
total 4.510 m3
Chemical treatment4 two-stage flocculators4 flotation units 4 * 120 m2
3.5 m/h
Sludge treatmentprimary sludge gravity thickeningsecondary sludge flotation thickeningchemical sludge direct to flotationlime dosing on mixed sludgefilterpress
During 1985 and 1986, after extensive trials, parts of the treatment
plant was changed in order to permanently incorporated nitrogen
reduction. The most important changes were the introduction of
anoxic zones for predenitrification and a possibility to by pass the
tricklingfilters.
The original design was to treat 13 ton BOD/d of which 9 ton was
from industrial origin. The modification caused by introducing nitro-
gen reduction has reduced the capacity to 10 t BOD/d.
The following data is a summary of average daily loads and reduc-
tions during the last five years of operation:

198
Table 2. Results from Falkenberg treatment plant, yearly average
Year 1984 1985 1986 1987 1988
Flowm3/d 16720t of design 55
BOD load% of design 30
BOD, effluentmg/l 13
totp, effluentmQ/l 198
SS, effluentmQ/l 23
N loadkg/d 565
N reductiont 64
18548 17495 17624 1871662 58 59 62
41 38 50 47
12
0.75 0,69 0,43 0,35
22 20 6,9 7,8
693 717 680 600
52 55 69 65
7.2 3.4 3
The reconstruction work 1985 and 1986 in the treatment plant
caused lower reduction of nitrogen. During 1984 and three months
in 1985 chemical precipitation of phosphor was not done.
INDUSTRIAL EFFLUENTS
The strong influence of industrial waste waters on the load to the
treatment plant is illustrated in table 3.
Table 3. Waste water composition in Falkenberg
1987 1988industry sewage industry sewage
Flow m3/dI
2380 15244 2499 1621713 a7 13 a7
BOD kQ/d 4085 907 3476 1246f. 82 18 74 26
Total P kg/d 44 108 39 95% 29 71 29 71
Total N kQ/d 292 306% 49 51

199
Different industries contribute varying amounts of different pollu-
tants to the waste water. The major industrial sources for BOD,
and phosphorus are brewery, diary and distilling plant. The single
largest industrial source of nitrogen is an industry which recovers
silver from photographic film. Out of the average daily load of 292
kg N/d of industrial origin during 1988, 188 kg/d came from this
industry alone with a flow of only 8 m3/d.
The are also large variations in industrial waste water composition
between different periods. To some extent on a yearly basis, but
more so between different days of the week, with low amounts
during the weekends.
CARBON SOURCE
In order to reduce nitrate to nitrogen an energy source is necessary.
The theoretical amount of BOD needed for this reduction can be
estimated to be 2,86 gram BOD per gram nitrate-nitrogen reduced.
In most cases, the waste water coming to a treatment plant con-
tains sufficient BOD, but after pretreatment the BOD often turns
out to be limiting, partly because a portion is not accessible in
the time available for predenitrification, but will be oxidized in
the aerobic zone of the process.
The nitrogen reduction varies over the year and the ratio BOD/N
do not give a good correlation with nitrogen reduction, Table 4. In
August there is a high temperature in the aeration tank, the BOD/N
ratio is the lowest in the whole year but the denitrification is at
a peak.

200
Table 4. Monthly average values for the activated sludge plant in
Falkenberg
Sludge ageMonth DNG BOD/N Temp. Aerated Anoxic
t; C d
Jan 24.5 5,8
Feb 9.7 5.3
Mar 21,4 5,7
APT 24,l 5,7
May 42.7 4.6
Jun 45,4 3.2
Jul 57,7 4,2
Au&Z 61.6 2,3
Sep 52,7 3.6
Ott 46,6 4,8
Nov 46,9 4,9
Dee 49,9 4.5
9,4 4.5 0.8
8,3 3.5 0.6
899 6.9 1.2
11.0 9.2 1.6
15,o 7.9 1.3
17,7 793 1.2
18,8 890 l-4
17.6 9,2 1,6
17.6 6-6 1,l
14,6 6,3 1,l
12.7 6.7 1,l
11.1 7.0 l-2
% DNG = % of total nitrogen to activated sludge which is calculated
to be reduced to nitrogen gas
BOD/N = in the waste water to the activated sludge process
The waste water that comes to the treatment plant during the
weekends do not contain as much BOD as during the rest of the
week, and the nitrogen reduction is also much lower during the
weekends, as low as 30 %.

201
Table 5. Variations between days of the week
Day % Nred BOD/N BOD Tota l Nk/d kg/d
Sunday 41 2.7 1528 458
Monday 46 499 3102 588
Tuesday 52 4,3 2667 565
Wednesday 54 396 2069 544
% Nred = % of total nitrogen to the activated sludge removed by
denitrification and excess sludge
Of % Nred approximately 15 % can be attributed to removal with the
sludge, Figure 1.
OPERATION PROCEDURES IN RESPONSE TO VARYING RATIO BOD/N
The load on the treatment plant varies both on a yearly, weekly and
daily basis. To be able to handle these variations and maintaining
a good nitrogen reduction the trickling filters are operated inter-
mittent. When the load is high they, one or both, are taken into
operation in order to maintain a BOD load on the activated sludge
low enough to allow nitrification but the load must be high enough
to achieve anaerobic conditions in the anoxic zones to allow denitri-
fication. The water leaving the trickling filter is almost saturated
with oxygen.
To improve the nitrogen reduction and to make the best use possible
of the available BOD during periods of limiting amount of easily
degradable organic material, two measures has been taken.
First, the high concentrated waste water from the metal recovery
industry, which contained approximately 200 kg N/d, is transported
by truck to the treatment plant and dosed when the operator decide.

202
Secondly, extra carbon is added during the weekends. Several exter-
nal carbon sources has been evaluated, acetate, formiate and locally
available high concentrated waste waters. By adding methanol the
nitrogen reduction during Saturday and Sunday could be increased
from 30 % to 70 %. The same effect was also obtained by using
primary sludge.
The sludge in one of the primary clarifiers is allowed to stay longer
in the clarifier and is pumped out of the clarifier but returned not
far from the outlet from the clarifier. In this way the sludge under-
goes a fermentation and is “washed” before added to the anoxic zone
and the heavy particles is not added to the biological treatment.
This way of producing an easily dagradable carbon source is now
permanently installed, Figure 2.
In practical terms BOD and BOD/N can not be used as an opera-
tional parameter. Control must be based on something that response
reliably and quickly to any change in load. In Falkenberg it has
been found, by experience, that flow, and to measure if oxygen is
present in the anoxic zone, is useful as operational parameters.
OXYGEN CONTROL
By taking the trickling filters in or out of operation, and by the
addition of primary sludge to the anoxic zones during weekends, the
presence of oxygen in the anoxic zone is controlled.
It is also important that the oxygen concentration is controlled in
the nitrification zones to give optimum conditions for ammonium
oxidation, but not to put more oxygen into the waste water than
necessary, to avoid oxygen in the recirculation stream going to the
anoxic zone. It proved impossible to meet these requirements and
at the same time have an economical aeration system, without an
automatic control. Variable speed compressors were therefore instal-
led during 1988.

203
VOLUME OF ANOXIC ZONE
During the trial in 1983 and 1984 the volume of the anoxic zones
were approximately l/3 of the aerated volume. When the process
were introduced permanently the anoxic volume was reduced to
half that size and is today approximately 500 m3, the aerated volume
is approximately 3500 m3.
Table 6. Flow and detention time
Flow 1988 H o u r s i n :m3/d aerated zone anoxic zone
Maximum 39070 291 0,3
Average 18716 4,5 '396
Minimum 10590 7,9 191
The recirculation of nitrified water and return sludge is almost
constant at 4 200 m3/h of which 1 200 m3/h is return sludge. This
recircle ratio allows for 85 % nitrogen reduction by denitrification
at average flow and up to 65 % at maximal flow. At average flow
the detention time for each passage through the anoxic zone is only
6 minutes.
In theory, any oxygen present in the incoming waste water and
recirculation water shall first be depleted and thereafter will nitrate
be reduced. That nitrate is only reduced in the anoxic zone has
not been shown and denitrification is expected to take place also
in the aerated zone, especially immediately after the anoxic zone,
and in the clarifier. To establish anoxic conditions in the anoxic
zone has never the less been shown to be a critical factor for
successful1 nitrogen reduction.

204
CALCULATING NITRIFICATION
Figure 3 shows the nitrification rate during the week calculated in
two different ways. The curve with ope symbols is calculated by
using the total soluble nitrogen in the effluent and curve with the
filled symbols by using total nitrogen. The latter means that suspen-
ded solids in the effluent will influence the calculation and reduce
the calulated rate. This is the recommended way to calculate nitrifi-
cation in Sweden but is to our opinion not the best way. (Suspended
solids influence the calculation since nitrogen not nitrified in the
effluent is taken as the difference between total nitrogen and
nitrate).
SLUDGE ACTIVITY
In table 7, 8 and 9 are data for some key parameters presented. The
general trends in these monthly average values coincide with the
general view of biological nitrogen reduction.
Microbial activity is, among many factors, dependent upon tempera-
ture. In the data below there is a trend of higher activity at higher
temperature, Figure 4. On a shorter term than monthly average, the
activity varies very much but the temperature is changing only
slowly. Therefore, temperature, and the other parameters listed
below, are of limited value as operational parameters for the daily
control of the treatment plant.

205
Table 7. Nitrification data
Month Temp ss NIT N-ox NGC g/m3 kg/d %/kg h t
Jan 994 3834 160Feb a,3 3440 104Mars 8,9 4399 173April 11.0 5807 161May 15.0 6157 307June 17,7 6484 403July ia,a 5150 465Aug Ia,8 5509 470Sep 17.6 5327 354Ott 14,6 4040 301Nov 12,7 4035 277Dee 11,l 4938 325
0.50 450.37 340,47 470,33 400,59 650,74 ai1,09 900,93 910.80 alo,a9 750,82 700,79 71
ss = Suspended substance in activated sludge processNIT = amount of nitrogen nitrifiedN-ox = specific nitrification rateNG = nitrogen nitrified in % of nitrogen possible to nitrifyAerated volume 3.470 m3.
Table 8. Sludge data
Sludge ageMonth Temp. Aerated Anoxic NG sludge load
C d d % g BOD/g SS d
JanFebMarAprMayJunJulAu&SepOttNovDee
994 495 0.88.3 3,5 0968,9 699 1.2
11.0 9,2 1.615.0 799 lP317.7 7.3 19218,8 a,0 1.417.6 9,2 1,617,6 6.6 1,l14,6 6.3 1.112.7 6.7 1,l11.1 7,o 1,2
45 0,1934 0,1747 0,1540 0,0965 0.11ai 0.0890 0,1391 0,06al 0,lO75 0.1570 0,1671 0,14
NG = nitrogen nitrified in % of nitrogen possible to nitrify
14402336x

206
Table 9. Denitrification data
Month Temp ss DEN N-red DNGC q/m3 kg/d g/b h '-
Jan 994 3834 123 2,7 60Feb 873 3440 42 190 30Mars 8,Y 4399 99 1,9 48April ll,o 5807 123 198 67May 15,o 6157 241 3,3 76June 17,7 6484 277 3,6 66July 18,& 5150 355 597 72Aug 18,8 5509 373 5.6 75Sep 17,6 5327 295 4,6 77act 14.6 4040 229 4,7 71Nov 12.7 4035 244 5,O 78Dee 11,l 4938 298 5,O 82
DEN = amount of nitrogen denitrifiedDNG = nitrogen denitrified in relation to how much nitrogen therewas available to denitrifieN-red = specific denitrification rate anoxic volume in calculation;500 m3 _
TEMPERATURE, NUTRIENT
The response of the treatment process depends on many variables
AND FLOW INFLUENCE ON NITRIFICATION
and the personnel at Falkenberg treatment plant has found that a
combination of flow and concentration of nutrients in the waste
water is a useful basis for predictions of nitrogen reduction. Flow,
and nutrient concentration shows a correlation with nitrification.
At high flows the concentrations are lowered and nitrification drops.
Periods of high flow often coincide with low temperature.
In Figures 5, 6, 7 and 8 data found at different nitrification percent
has been put together in such a way that data for flow, temperatu-
re, phosphor and nitrogen concentration corresponding to values of
% nitrification between 0 to 10 %, 10 to 20 %, etc. up to 90 to
100 % has been collected in ten groups and an average value for
each 10 % segment of nitrification were calculated. There are clear
correlation between nitrification, temperature, flow and nutrient
concentrations.

207
Figure 9 and 10 shows the type of daily variation that can be
observed for nitrification, flow and nutrient concentration. An
experienced operator can make use of these variations to predict
changes in the treatment result from day to day.
PERSONNEL AND LABORATORY RESOURCES
Perhaps the most important factor for a successful implementation
of biological nutrient removal is to have trained and skillful people
operating the treatment plants. The importance of this can hardly
be overestimated. It is also important for most plants to have the
ability to analyze nitrogen compounds regularly and to have both
the knowledge and resources to not only supervise but also investi-
gate and control the treatment plant. This will then result in better
treatment performance and that the personnel can produce the
material needed to make decision about how to run the process
and to calculate massbalances of the process. Figure 11.

208
Figure 1X nitrogen reduction in theactivated sludge process
%60
50 -
40 -
30 -
red. by excess sludge
”
Sunday Monday Tuesday Wednesday Thutkday Friday
Fermentation of sludge in primary clarifier

209
8 0
5 0
Figure 3Different ways of calculat ing % nitrification
calculated with soluble nitrogen
calculated with total nitrogen
I I I ISunday Monday Tuesday Wensday Thursday Friday
Figure 4.Nitrification versus temperature,monthly average
20/
18-
IO-RA2 = 0,87 I
300Nitrificetion, kg N per day
-I400 500

210
Figur 572 of nitrogen avaible for nitrificationthat has been nitrified versus temperature
80 -
12 14Temperature, Celsius
too
8 0
Figure 6P. nitrogen avaible that has beenni trified versus flow
18 2 0
Flow, m3/d

211
1
Figure 7X avaible nitrogen that has beennitrified versus total soluble phosphor
80
60
40
20R-z= 0,945
01 2 3 4 5
Total soluble phosphor, mg/l
00
Figure 8X nitrogen avaible that has beenni trified versus total soluble nitrogen
80-
60-
R-2 = 0,94920-
20Total mluble nitrogen, mg/l
30

212
8 0
6 0
Figure 9X nitrification and total soluble phosphor
- NGIB
to aeration, Mars, 1988. --+-- T-P. ,kg/d
80
70
9
20I 3 4 7 8 9 10 II 14 15 16 17 18 19 21 22 23 24 25 28 29 30 31
Date
Figure 10 --+---- NGSB
?2 nitrification and flow i August, 1988. - m3/d
90 -
18
- 16
70 !,.,.,.,.,.,.,-,.,.,.,.,.,.,.,.,.,.,.,.,.,.,.,! 12
I 2 3 4 5 8 9 I0111215161718192223242526293031
Date

Figure 1 1
i3nce of Nitmgen; kg
Pfi=Y excesssludge sludge N2 Sludge
A A A A299 82 189 48
waste ?&’ prelhry ‘591’ Tlickling ;528/ A c t i v a t e d ‘257’ Cbetical ‘zsettling filter
JSludglz treatment
J \ \ J \ Jwater
I I’“’Septic rejectsludge thickening
Iexternalc-souxre
%-reduction : 1.2 1 0 . 5 4 5 . 3 8 . 0
214
CARBON SOURCES FOR DENITRIFICATION OF WASTEWATER
Prof. Mogens Henze
Department of Environmental Engineering
Technical University of Denmark
1 INTRODUCTION
Biological denitrification is based on bacterial respiration with
nitrate. A carbon source is needed in all cases, and in most cases
organic carbon is needed as an energy source for the bacteria. The
exceptions are bacteria that can use hydrogen and sulphur as energy
source. These types of bacteria are not of general interest to waste-
water treatment, but are of more interest for drinking water treat-
ment and processes in groundwater.
Biological denitrification of wastewater has been used in practise for
20 years. The first generation of plants was based on use of exter-
nal carbon sources (primarily methanol1 while the second genera-
tion of processes has been using internal carbon sources (primarily
organic matter in raw wastewater).
Recently, the interest in carbon sources has developed towards the
utilization of carbon sources produced at the treatment plant, either
by-products from other processes (supernatant from digesters and
dewatering equipment) or main products produced from wastewater
or sludge (e.g. by hydrolysis).
2 COD TO NITROGEN RATIO
The organic matter (COD) present in a denitrification process will
in practise be used for 3 purposes:
I. Conversion of nitrate to nitrogen gas
I I. Production of sludge
III. Respiration with oxygen.

215
If the magnitude of all 3 processes are known, then the COD/N-
ratio can be calculated for a given process.
If COD is used for characterization of the organic matter then an
exact calculation of the COD/N-ratio can be made. The use of BOD,
TOC etc. will make the calculations less general and more uncertain.
In Table 2.1 the calculations of COD/N-ratios for the 3 uses of or-
ganic matter are shown. When based on COD, these are exact
stoichiometric calculations, which are true for all wastewater treat-
ment plants.
From table 2.1 the total COD consumption is calculated to
Total COD = 2.86 l ANO, + F,, + F,, (1).
The problem in practise is that ANO,, FSP and F,, are not known,
or only known roughly.

216
Table 2.1 COD uses in denitrification tanks in wastewater treatment.
I. Nitrate to nitrogen gas.
NO, + 1.25 “COD” - %N, + CO,
Based on weight this gives a ratio
COD/N = 1.25 mole COD-(32 g O/mole COD)/(l mole NO,N)
(14 g NO,-N/mole NO,-N) = 2.86 g COD/g NO,-N
Total COD used = 2.86*nNO,
(ANO, = mass of nitrate-nitrogen converted to nitrogen gas
in the plant)
11. . Production of sludge in denitrification.
Total sludge production = F,,
If the sludge production is expressed as kg COD/d then this
directly gives the amount of COD used for this.
The sludge production can be estimated from F,, = Y-Q-AC
where Y= yield kg COD (sludge)/kg COD (organic matter)
Q = flow m3/d
AC = organic matter removal, kg COD/m3.
III. Respiration with oxygen.
If the oxygen used is F,, kg/d, then the COD used is F,, also.

217
TREATMENT PLANT
rawDenitrification
_---wastewater r- 1
II v31 x3
QlI ‘Q A3L-----Jc2Ccoo.1 I coo,2
[TN.1I
/
[TN,2
CNO3,2
treatedwastewater
w
QI,
Ccoo,4
CTN.4
II____-----_ 1 Q5
ccoo,s
cTN,5
Figure 2.1 Denitrifying treatment plant, symbol definitions.
The total amount of nitrate converted isAN0, and the total amount
of nitrogen converted is
Total nitrogen = A NO, + N in sludge
= A NO, + F,, .f, (2)
where f, is nitrogen fraction in sludge, kg N/kg COD
2.1 C/N-ratio theoretically
The theoretical C/N-ratio can be found from equation(l)
and (2):
(C/N)theory = 2.86*ANO, + FSP + F,J(ANO, + FSP.fN) (3)
Equation (3) expresses the amount of COD used per amount of nitro-
gen removed from the wastewater, in the actual treatment process.
2.2 C/N-ratio in practise
Of the total COD consumption in equation (11, the part oxidized by
oxygen, FOX, is the only one influenced by the design and operation

218
of the treatment plant. The two other factors are determined almost
solely by the effluent criteria.
The COD wasted through oxidation by oxygen varies considerably
from plant to plant. Thus an effectiveness factor for COD utilizati-
on, fC,NV can be defined as
fC/N = (2.86*nNO, + F&/2.86 l ANO, + F,, + FOJ
In table 2.2 the optimum C/N-ratios are listed for various carbon
sources, for an effectiveness factor, fC/N = 1. Note that the opti-
mum C/N -ratio is the smallest obtainable. For all practical purposes
the C/N-ratio needs to be higher than the optimum value,
because f C,N <l. In table 2.3 the effectiveness factor for
various denitrification processes is shown, and some of the plant/-
process types are shown in figure 2.2.
The C/N-ratio in practise can be calculated from equation (5).
(C/N) practise = (C/N)optimum/f,,, (5)
As an example the (C/N) practise for a recirculation process using
wastewater organic matter as carbon source and having an effecti-
veness factor, fC,N = 0.4 is
(WNlpractise = 3.2/0.4 = 8 kg COD/kg N
(WNIoptimum = 3.2 kg COD/kg N is taken from table 2.2.
If the above mentioned example has a 80 percent nitrogen removal,
the needed C/N-ratio based on influent values is 0.8*8 = 6.4 kg
COD/kg N.
If The C/N-ratio in a given wastewater is low and internal carbon
sources are intended to be used for denitrification, then a process
with a high effectiveness factor should be selected. Good process
control can increase the effectiveness factor for a given process.

219
Table 2.2 C/N-ratio for denitrification, without carbon source
oxidation by oxygen. (Yield constant 0.4 kg COD/kg COD).
Carbon source (C/N) optimum' for fC/N = la0kg compound/
kq COD/kg N kg N
Wastewater organic
miittxr
4.8
Methanol 3.8 2.5
A c e t i c acid 3.4 3.2
Hydrolysed starch 3.4 3.2
2.3 Oxygen and C/N ratio
The oxygen influence, on the C/N-ratio, F,, in equation (31, derives
from 3 sources:
a. Oxygen input caused by mixing in the denitrification tank.
b. Oxygen input with wastewater.
c. Oxidation of organic matter in non-denitrifying tanks.
In order to save carbon source, the oxygen influence should be kept
as low as possible.
Item a. cannot be avoided, but can be reduced by proper design of
the mixing. Item b. can be reduced by proper design and operation.
Item 3. is inherent in the overall process design, and operation can
increase the effectiveness factor, and thus decrease the overall con-
sumption of organic matter, the C/N-ratio.

220
Table 2.3 Effectiveness factor, fc,N. for various denitrification
plant types.
Plant/process type Effectiveness factor fC/R
titivated sludgeSeparate 0.9-1.0Post denitrification 0.2-0.5Post denitrification withexternal C-source 0.8-O-9Alternating 0.4-0.6Recirculation 0.4-0.6Alternating, one-tank 0.3-0.6Simultaneous 0.3-0.5
F i l t e r sRotating disksPacked stationaryBackwash typeFluidized
0.4-0.70.4-0.70.5-0.80.4-0.7

221
Screen
TWO- SLUDGE SYSTEM WITH METHANOL
BypassDen i t r i f i ca t ion
TWO- SLUDGE SYSTEM WITH BYPASS
SINGLE- SLUDGE SYSTEM WITH RECYCLE
SINGLE- SLUDGE SYSTEM WITH ALTERNATION
Figure 2.2 Various plant/process types for denitrification. /Harre-moes et al. 1985/
15 402336x

222
3 DENITRIFICATION RATES
The volumetric denitrification rates, g NO,-N/(m3*h), that can be
obtained depends upon many factors:
- concentration of sludge
- denitrifying capacity of
- carbon source
- environmental
(biomass)
sludge
available
factors (pH, temperature, oxygen etc.)
3.1 Concentration of biomass
For a given carbon source and for given environmental conditions,
the only way to increase the volumetric denitrification rate is to
increase the sludge concentration. In many cases this is a more
theoretical than practical possibility.
Often, process lay-out puts restrictions on biomass concentrations
(e.g. settler design). Another problem can be mass transfer limita-
tions which means that a doubling of the biomass does not lead to
a doubling of the volumetric denitrification rate. In figure 3.1 two
examples on this is given. The figure shows that for activated sludge
an biomass increase of 10 times does not increase denitrification
rate with a factor 10 but with a factor 2.5. A similar tendency
holds for biofilms.
t
Increase involumetric denitrification rate
act ivatedsludge
Factor ofBiomass increased
Figure 3.1 Increase in volumetric denitrification rate with increase
in biofilm thickness (data from Harremoes et al, 1981) and activated
sludge concentration (data from Jdrgensen, 1988).

223
3.2 Quality of biomass
The biomass present in a given denitrification tank might be more
or less suited for denitrification.
The sludge in a biological treatment process has its origin from two
sources
a. Inocculation with biomass in influent
b. In-situ production in the tank.
Both sources play an important role for the final composition of the
biomass.
Figure 3.2 shows that the denitrification rate obtained with in-situ
produced biomass (centrifuged wastewater) is smaller than the one
obtained when the biomass is dominated by that present in the in-
fluent (raw and raw + extra ssl. In this case the biomass present
in the raw wastewater gives a high denitrification rate. This might
not be a general situation, but it illustrates a factor that can play
an important role for a denitrification process.
!Respiration rate
10 mg N03-N/gVSS . h Type of wastewater:
,a-- Raw+ extra SS (III)
I20
I30
I40
Time daysI W
50
Figure 3.2 Denitrification rated and type of wastewater. /Henze,
1988/
3.3 Carbon Sources
Biological denitrification is widespread among bacteria in nature.
This means that numerous carbon sources can be used in the pro-

224
cess. Table 3.1 lists carbon sources used for denitrification of was-
tewater. There are many more possibilities than those listed in table
3.1.
The important factors with respect to selection of carbonsource are
- denitrification rate obtained
- cost
- sludge production
- handling (dosage, control, storage)
- excess carbon source removal.
The cost is highly variable and will not be dealt with here. The
other items will be discussed below.
Table 3.1 Carbon sources for denitrification - a selection.
internal raw wastewater
sludge (endogenous)
digester supernatant
dewatering supernatant
sludge concentration overflow
methane
internal (produced) hydrolyzed sludge
hydrolyzed sludge supernatant
scredded sludge
hydrolyzed wastewater
external methanol
e than01
acetic acid
hydrolyzed starch
molasses
whey
brewery wastewater
pulp from food industry

225
3.4 Denitrification rates
Denitrification is a respiration process performed by facultative
bacteria. The respiration rate with nitrate, rNo3, and the respirati-
on rate with oxygen,roz are related by equation (5)
=N03 = ?3*=02 (5)
(both rates expressed as electron-equivalents per time unit). The
value of % is typically 0.6-0.8 /Henze et al, 1987/. Converted to
mass units of oxygen and nitrate the equation is changed to
=N03 = 0*35*sg*r02 (6)
where rNo3 is nitrate respiration rate,gN03-N/(g VSS*h)
=02 is oxygen respiration rate,
g 02/(g VSS*h)
qgdenitrifying fraction of oxygenrespiration sludge
Oxygen respiration rates in activated sludge (without nitrification)varies from 4-60 g =O,/(kg VSSh) at 20°C. Conversion to nitrate
by equation (6) gives 1.4-21 g NO,-N/(kg VSSh). Taking the 79
factor into account gives 1-15 g NO,-N/(kg VSSh).
The highest respiration rates are obtained with the most easily
degradable carbon sources. This means that it is difficult to gethigher denitrification rates than those quoted above. Thus there is
no need to look for new external carbon sources, hoping that they
will give higher rates. The only advantage of “new” external carbon
sources can be the cost, handling, control etc.
Table 3.2 groups the various carbon sources, according to the denit-
rification rates that can be obtained in practise, and figure 3.3
shows the effect of temperature on the rates for denitrification
with methanol, raw wastewater carbon and endogenous carbon sour-
ces.

226
The denitrification rate obtained with wastewater carbon sourcesdepends heavily on the detailed composition of the wastewater inquestion. If the easily degradable fraction is high, the overall ratewill be high. The composition of the wastewater depends not onlyon what is entering the sewer system, but also on what happensin the sewer system. Aerated sewers (gravity flow) will reduce theamount of easily degradable material, while anaerobic (septic) sewerswill increase the amount of easily degradable organics due to acidi-fication/hydrolysis. This phenomena is actively utilized in hydro-lysis processes at the treatment plant, see section 4.
Table 3.2 Carbon sources and maximum denitrification rates in fullscale plants
Carbon source Denitrification rates
obtainable, 20°C.
g N03-N/(kg VSS*h)
Methanol
Acetic acidHydrolyzed sludge
Brewery wastewaterDigester supernatant
Hydrolyzed starchEasily degradable part of
raw wastewater
7-20
Ethanol
WheyRaw wastewaterMolasses
l-5
Endogenous
Methane
0.2-0.5
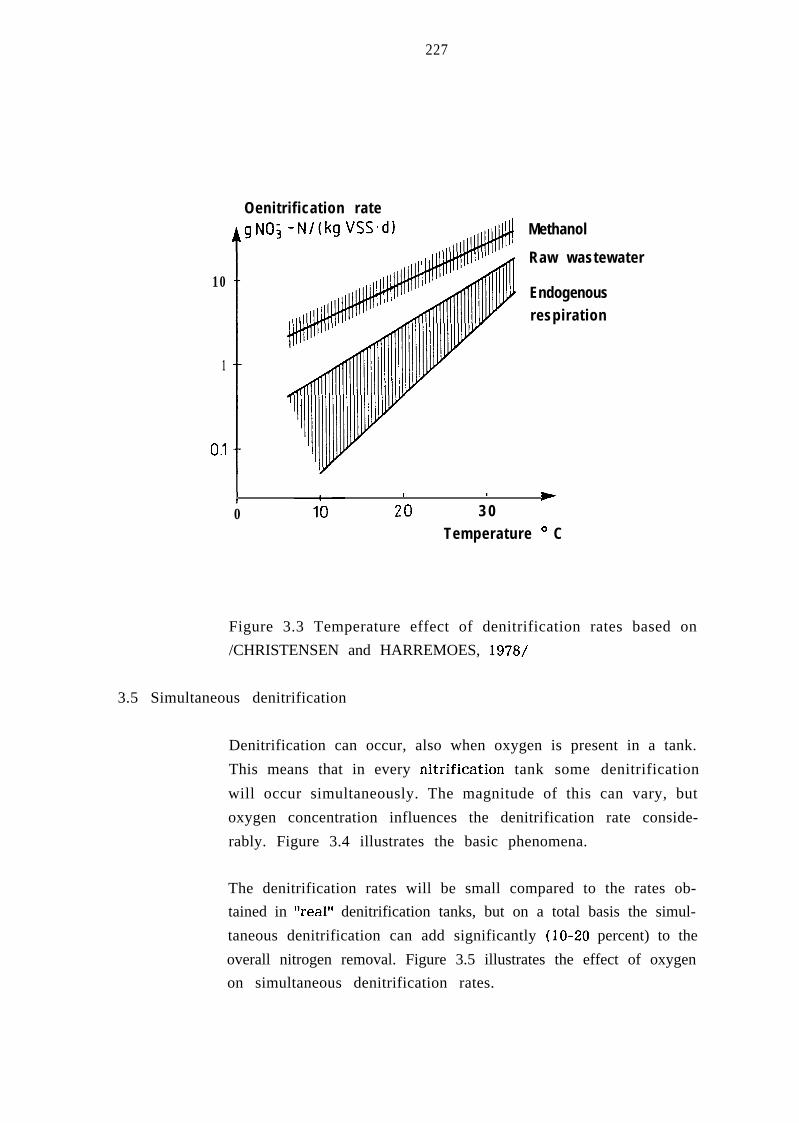
227
Oenitrification rate
10
1
0.1
Methanol
Raw wastewater
Endogenousrespiration
I0
I I e20 3 0
Temperature O C
Figure 3.3 Temperature effect of denitrification rates based on
/CHRISTENSEN and HARREMOES, 1978/
3.5 Simultaneous denitrification
Denitrification can occur, also when oxygen is present in a tank.
This means that in every nitrification tank some denitrification
will occur simultaneously. The magnitude of this can vary, but
oxygen concentration influences the denitrification rate conside-
rably. Figure 3.4 illustrates the basic phenomena.
The denitrification rates will be small compared to the rates ob-
tained in “real” denitrification tanks, but on a total basis the simul-
taneous denitrification can add significantly (lo-20 percent) to the
overall nitrogen removal. Figure 3.5 illustrates the effect of oxygen
on simultaneous denitrification rates.

Denitrification will also occur in one tank nitrification-denitrifi-cation processes - see figure 3.6. In such processes oxygen concent-ration will be low either due to anoxic zones in the tank (spatialvariation) or due to an on-off operation of the oxygen supply (tem-poral variation).
BULK WATER
Figure 3.4 Simultaneous nitrification-denitrification in an activatedsludge floe. A similar phenomena will happen in biological filters.
* Denitrification rate
0.6 -
0.2-0,
0
0 Oxygen concentrationa mg/l-.
i *2 3 4
Figure 3.5 Simultaneous denitrification /KRISTENSEN and JANSEN,
1986/.

229
ONE TANK APPROACH
Simultaneous :
m
Low oxygen, evenly distributed
Spatial variation:
aerobic anoxic
Temporal variation:
+l-74aiI I
t
time
aerobic period
Figure 3.6 One tank nitrification-denitrification processes.
4 PRODUCTION OF CARBON SOURCES FOR DENITRIFICATION AT THE
TREATMENT PLANT
Various methods for production of easily degradable carbon at the
treatment plant are heavily investigated all over the world.
Most processes are based on hydrolysis, either in a separate tank,
as shown on figure 4.1 or in the primary settler.
There are various methods of hydrolysis
- Biological
- Chemical (acid or alkaline)
- Enzymatical
- Heat/pressure

230
Some of the methods can be coupled in order to obtain a higher
yield.
Denitrifi -
Sludge
Figure 4.1 Hydrolysis of sludge in a separate tank.
A Scandinavian Eureka project named HYPRO, studies the various
aspects of hydrolysis in wastewater treatment. The aim of the
project is to improve and study
the characterization of wastewater
preprecipitation with the dual option of removing phosphorus and
producing a sludge well suited for a hydrolysis process
knowledge of the hydrolysis processes and the effect of hydro-
lysis products on biological denitrification.
The Scandinavian partners in the HYPRO project are:
Technical University of Norway, Trondheim
Kemira Water Treatment, Sweden
Water Quality Institute, Denmark
I. Kruger, Denmark
Technical University of Denmark, Copenhagen.
The project has been running since 1988 and will be finished in
1990.
231
For sludge hydrolysis, the fraction of the organic matter that can
be hydrolysed is 5-30 percent, depending upon the method and the
sludge.
The soluble product of the hydrolysis process is what can be charac-
terized as easily degradable material. This means that the denitrifi-
cation rates that can be obtained are high, and comparable to those
obtained by the use of methanol or acetic acid, cfr. table 3.2. The
biological hydrolysis process produces primarily low molecular fatty
acids (acetic acid and propionic acid) which the chemical hydrolysis
process does not produce.
Of the various chemical fractions in the sludge, the fat/grease/oil
fraction seems to be rather unaffected by all hydrolysis process. The
proteins are solubilized by heat/pressure and by chemical hydrolysis,
while the biological hydrolysis seems to act more on the carbonhyd-
rates and partially on the proteins.
The composition of the soluble phase after hydrolysis has considera-
ble interest in the process design for denitrifying treatment plants.
The soluble phase might add some ammonia to the treatment plant
for nitrification-denitrification, but the hydrolysis process will under
most circumstances increase the ratio between easily degradable
carbon and the nitrogen that has to be denitrified. This is shown
in figure 4.2.

232
Rawwastewater
suspended
Hydrolysisof suspendedmatter
IIIIIIIIIIIIIIIIIIII
Raw wastewaterafterhydrolysis
1 suspended1
Figure 4.2 Changes in easily degradable carbon (COD) and ammonia
by hydrolysis of the suspended fraction of raw wastewater.
5 ADDITION OF CARBON SOURCES TO DENITRIFICATION
When wastewater carbon sources are used for denitrification, control
of the dosage is difficult. This is because the carbon source and the
nitrogen to be denitrified are present in the same water volume.
Minor diurnal variations in the C/N-ratio will occur in domestic
and municipal wastewater. This might be exploited through holding
tanks, but this has never been tried out in practise and will be
very complicated.
The addition of internally produced and external carbon sources can
be controlled more easily. Table 5.1 lists various parameters that
could be used to control the addition of these types of carbon sour-
ces.

233
The choice between the various control parameters depends upon the
actual type of process. For a two-sludge process - see figure 2.2,
the nitrate concentration in the influent can be used, while for one-
sludge process the total nitrogen or ammonia concentration in the
influent can be used, but not the nitrate concentration.
The development of reliable sensors for wastewater treatment plants
in these years is believed to improve the process control possibili-
ties in the future.
Table 5.1 Potential parameters to control the addition of internally
produced and external carbon sources:
- Nitrate in effluent
- Total nitrogen (or ammonia) in influent
- Nitrate influent
- Specific nitrate respiration rate
- Enzyme activity
- COD in influent
- Time (diurnal variation in dosage)
5.1 Supportive addition of carbon sources
The denitrification processes that use wastewater carbon sources
might need extra carbon source support occasionally. This could be
due to strong diurnal variations in influent nitrogen, low temperatu-
res, problems which low suspended solids concentration or difficul-
ties to lie up to effluent nitrogen criteria.
Under such circumstances external or internally produced carbon
sources can be added. The main problem in this connection is the
adaption of the sludge to the new carbon source. If the new carbon
source is added frequently, f.ex. each day during some peak hours,
then no adaption problems will be observed. If the addition takes
place infrequently, f.ex. each winter, or every second month, then
an adaption period might be needed. This phenomenon is most pro-
nounced when methanol is added. As methanol is not normally pre-
sent in the process, then the adaption period might be a week or

234
more /Bentsen and Vendrup 1988/. Thus, methanol cannot be used
for immediate action. For acetic acid or acetic acid containing
carbon sources (from hydrolysis, digester supernatant etc.) the
picture varies more. Some raw wastewaters contain significant
amounts of acetic acid and denitrification processes with such types
of wastewater will react rather quick to external addition of acetic
acid.
6 SLUDGE PRODUCTION AND CARBON SOURCES
The carbon source used for denitrification will effect the overall
sludge production in the wastewater treatment plant.
The use of raw wastewater carbon sources will be neutral for a
denitrification process as compared to a nitrification process. The
use of internally produced carbon sources might reduce the sludge
production with up to 10 percent, while the addition of external
carbon sources might increase the sludge production with 20-30
percent. Thus the use of external carbon sources might affect the
overall process economy significantly. It must be studied whether
the smaller tank volumes needed for denitrification will be more
than counterbalanced by the cost of the external carbon source
and the increased cost of sludge treatment.
7 REMOVAL OF EXCESS CARBON SOURCE
The carbon source added to the denitrification might not be oxidized
fully during denitrification in all cases. This extra carbon will add
to the overall effluent concentration of organic matter (BOD, COD,
TOC). A proper process control can reduce this problem, but in some
cases it is still needed to remove excess carbon source.
In activated sludge systems this polishing can be done by a short
aeration of the mixed liquid after the denitrification and before the
sedimentation tank. This will also reduce problems with denitrificati-
on in the final settler (such problems are most effectively reduced
by an effective denitrification process that only leaves minor
amounts of nitrate in the liquid in the effluent).

235
For biofilter systems (and for activated sludge systems as well) an
aerated polishing filter can be used, for example in combination with
a final removal of suspended solids.
8 ALKALINITY AND CARBON SOURCE
For most carbon sources the alkalinity is increased approx. 0.9-1.0
eqv./mole nitrate-nitrogen denitrified. For the acetic acid containing
carbon sources the alkalinity increase is 0.7-0.8 eqv./mole nitrate-
nitrogen. From this must be extracted the negative alkalinity (acidi-
ty) in the external carbon source. For pure acetic acid this corres-
ponds to approx. 0.4-0.5 eqv./mole nitrate-nitrogen. The overall
increase in alkalinity is thus 0.3-0.4 eqv./mole nitrate-nitrogen
denitrified in this case. For wastewater with low alkalinity, this
could create a problem because nitrification removes alkalinity. It
could thus be necessary to add lime to the nitrification-denitrificati-
on process in order to keep the pH in the wastewater at a reasonab-
le high level.
9 CONCLUSIONS
The carbon to nitrogen ratio for denitrification of wastewater is
influenced by the carbon source and especially by the denitrification
process type.
Several carbon sources can be used for denitrification. The producti-
on of easily degradable source (primarily acetic acid) at the treat-
ment plants is under strong development in these years.
The use of external carbon sources will increase the overall sludge
production in the treatment plant.
The denitrification rates that can be obtained varies with varying
carbon source and thus play a role for the overall process economy
(together with the cost of the carbon source, the overall sludge pro-
duction, the alkalinity production and the handling of the carbon
source).

236
LITERATURE
Harremoes, P.E. Arin, M. Henze (1985) Wastewater nutrient removal
-a state of the art review. International Congress - Lake pollution
and recovery, Rome, 15-18 April, 1985.
Henze, M ( 1989) The influence of raw wastewater biomass on activa-
ted sludge oxygen respiration rates and denitrification rates. Water
Sci. Techn, 21, No 6/7, p. 603-608.
Jdrgensen, H (1988) Denitrification rates. Unpublished results. Dep.
Env. Engng, Techn.Univ. Denmark.
Harresmoes, P, I. Sekoulov, L. Bonomo (1981) 5. Europaisches Abwas-
ser - und Abfallsymposium, EAS, Munich 1981, p. 423-451. Edited
by ATV, St.Augustin, BRD.
Kristensen, G.H. og J. Jansen (1986) Nitrogen removal-theories in
practise (in Danish) Stads- og Havneingenidren, 77, nr. 3 s. 52-56.
Christensen, M.H. and P. Harremoes (1978) Nitrification and denitri-
fication in wastewater treatment. In: Water Pollution Microbiology,
Vol.2 (Ed. R Mitchell) John Wiley & Sons, New York.
Bentsen, S and M. Vendrup (1988) Oxygen, acetate and kinetics of
denitrification (in Danish) Report Dep. Envir. Engng, Technical
University of Denmark.

237
MATHEMATICAL MODELLING OF NITROGEN AND PHOSPHORUS REMOVAL.
Mr. Renal DuPont, Prof. Mogens Henze.
Department of Environmental Engineering.
Technical University of Denmark.
ABSTRACT
The purpose of this paper is to describe the development of a
mathematical model for activated sludge including biological phospha-
te removal from the mixed liquid. The paper includes a presentation
of this model and the work done to test this against measured data.
The model presented, is developed, as an extension to the model
developed by the IAWPPRC group for modelling (M. Henze et al,
1987). This model is tested against measured data from Frederiksund
wastewater treatment plant to see if it was possible for the model
to simulate biological phosphate removal. Generally the model ref-
lects the measured date very well, even so there still are discrepan-
cies.
Two possibilities are located, which could make a reasonable
explanation on these discrepancies. At first the problems are caused
by inflexibility in the constants, because that some kinetic cons-
tants, in the present model, are reused intensively in different
processes. Another possible explanation of the problems with fitting
the observed data for nitrate and orthophosphate with the modelled
could be the fact that the model is so complex that the data collec-
ted are not sufficiently detailed or representative to be used for a
fitting procedure.
INTRODUCTION
In the past years there is offered a great deal of effort in both
modelling aspects of waste water and in the research of the biologi-
cal phosphorus removal processes connected to activated sludge
treatment plants.
16 402366X

238
Because of this and because of the increasing interest in Denmark
for construction of waste water treatment plants which includes
biological phosphorus removal, it is obvius to try to develop a
mathematical model which can be used to simulate activeted sludge
with biological phosphorus removal.
The mathematical model presented in this paper is based on the con-
cept of the IAWPRC group for modelling of the activated sludge
process. (M. Henze et al., 1987). This model is then extended to
include processes for biological phosphorus removal.
BIOCHEMICAL MODEL
The bacteria found in wastewater treatment plants able to remove
phosphate are characterized by the ability to accumulate substrate
and store it as PHB (Poly -Hydroxy Butyrate) (Pogieter, 1983.) or
PI-IV (Poly -Hydroxy Valerate) (Comeau et al., 1987.) under anaerobic
conditions, in contrary to other groups of bacteria. The energy for
this uptake is gained from the degradation of polyphosphate stored
in the bacteria. The degraded polyphosphate is released to the
bulkphase as orthophosphate. The storage of the phosphate in the
bacteria as polyphosphate occur under aerobic conditions, where the
energy to this is gained from normal metabolism of external substra-
te.
The main group of bacteria able to accumulate phosphorus are
presumably Acinetobacter sp. (Buchan, 1983), but also other bacteria
sp. are found to play a role in the biological phosphorus removal
process (Brodish and Joyner, 1983 1. So in the rest of this document,
the phosphate accumulating bacteria are for short called Poly- P
bacteria.

239
Figure 1 Pathways for phosphorus and substrate exchange under
respectivly anaerobic and aerobic conditions.
It is seen from the pervious that an essential prerequisite for the
biological phosphorus removal process is the alternating anaerobic/-
aerobic conditions. In fig 1 is shown the process paths under res-
pectively anaerobic and aerobic conditions for the biomass.
The biochemical model which makes the basis for the development
of the mathematical model, and which is described in the following,
is not an attempt to describe all details in the processes involved
with biological phosphorus removal. For example it does not take
into account that the uptake and release of phosphate and substrate
actually is regulated by the internal ATP/ADP and NADH/NAD
ratios. It only reflects the effects of this, on the growth rates for
the bacteria and on the bulk concentrations’ components included
in the model. As a consequence of this, the biochemical model is
rather an empirical model than an exact model. The biochemical
model description is mainly extracted from the work of Wentzel.
(Wentzel, 1988).
Anaerobic conditions:
If there is substrate available in the bulk phase and the Poly-P
bacteria contains stored polyphosphate, then release of phosphate

240
to the bulk phase, as a result of energy production from degradation
of the polyphosphate will occur. The energy produced, are used by
the Poly-P bacteria to accumulate substrate into a store of
PHB/PHV.
If there is no substrate in the bulk phase then there will be some
release of phosphate to the bulk phase, as a result of basic metabo-
lism and eventually decay of the bacteria.
If there is neither stored polyphosphate nor substrate available or
if there is substrate available but no stored polyphosphate, then no
processes regarding excess polyphosphate uptake will occur, and the
Poly-P bacteria behave like other heterotrophic bacteria.
Aerobic conditions:
In case there is an internal PHB/PHV pool but no easily degradable
substrate in the bulk phase then the Poly-P bacteria will use the
stored PHB/PHV for basal metabolism, growth and excess phosphate
uptake. This will normally be the situation in wastewater treatment
plants. If there is external substrate available then the Poly-P
bacteria will not use the stored PHB/PHV, but instead primarily
use the external substrate. Under these conditions one would observe
a simultaneous build up of both a PHB/PHV and a polyphosphate
storage.
If there are neither substrate nor internal PHB/PHV then the Poly-
P bacteria would release phosphate to gain energy for basic metabo-
lism.
Anoxic conditions:
What happens in this zone is still a bit unclear, but it is believed
that both phosphate release can occur, as in the anaerobic zone, and
phosphate uptake as in the aerobic zones. It is believed that a part
of the Poly-P bacteria can make denitrification. The Poly-P bacteria
which are not able to denitrify will act as under anaerobic condi-
tions, and therefore, release phosphate, and take up external subst-
rate if this is available in the bulk phase. The bacteria able to

241
reduce nitrate would act as under aerobic conditions though the
process would be slower, because of the lower energy yield from
nitrate reduction. If the bulk phase is going to be nitrate depleted
then all bacteria will act as under anaerobic conditions. This desc-
ription shows that in some cases one would observe an overall
phosphate uptake in the anoxic zones, and in some cases one would
observe an overall phosphate release in this zone. This depends on
the nitrate concentration, the substrate concentration and the frac-
tion of Poly-P bacteria which are able to reduce nitrate.
MATHEMATICAL MODEL
By studying the biochemical model described in the previous passage,
we have identified the components and processes that we found
should be included in the mathematical model for a phosphorus
removal system. This model is shown in its totality on figure 2.
The model is an extended version of the model proposed by the
IAWPRC task group for modelling of activated sludge. (M.Henze et
al. 1987), and as a consequence it follows the notation used by this
task group.
The model concept consists of a matrix in which the selected model
components are listed as symbols in the upper top row, and descri-
bed by a short description in the bottom row. The processes consi-
dered are listed in the right column of the matrix as kinetic experi-
ments with a short description listed in the leftmost column. These
components and processes are then linked together by the central
part of the matrix, which contains the stoichiometric constants in
the processes. The total reaction rate for a component is found by
taking the stoichiometric constants in the column under the com-
ponent and multiply this with the kinetic expressions on the right
of the stoichiometric constants and sum up these products. To this
one should add the transport terms to get the mass balance equation
for the component in the reactors.


243
The concept of modelling the biological processes in this model, is
based on the death/regeneration concept. This means that by bacte-
rial decay most of the mass in form of COD, nitrogen and phosphate
is recycled back into particulate substrate. This is then hydrolysed
to soluble substrates, which could then be used by the bacteria for
growth. In figure 3 this principle is shown for the polyphosphate
bacteria.
Figure 3 Death / Regeneration princip, shown for Poly-P bacteria.
Notation as inmodel, figure 2.
The components and the processes regarding biological phosphorus
removal are shortly described in the following, even so that it is
not possible to include all details of the model in the description
here. Only components and processes that are new or changed
compared to the original JAWPRC model (M. Henze et al. 1987.)
are included.
New Components
XDp: Phosphorus accumulating bacteria. (Poly-P bacteria)
These are the bacteria responsible for the accumulation of phosphate
from the wastewater. It is assumed that this group of bacteria beha-
ves like other heterotrophic bacteria in all aspects that do not

244
include phosphorus removal. This is especially of interest in the
denitrification processes.
From the biochemical model it is seen that use by the bacteria of
the stored PHB/PHV and poly-p are delayed in time and regulated
by external conditions, like oxygen and substrate concentrations.
Because of this, it was necessary to include two components in
the model concerning the internal PHB/PHV and poly-p concentra-
tions in the bacteria, even these two components are very difficult
to measure in practice.
Xsp: Storage of substrate as PHB/PHV in the phosphorus accumula-
ting bacteria.
Xpp: Storage of phosphate as polyphosphate in the bacteria.
The description of the wastewater composition needed to be exten-
ded to include the phosphorus components, and because the Poly-P
bacteria primarily use the easily biodegradable soluble substrate to
build up their PHB/PHV storage, we had to divide the soluble subst-
rate fraction in the original IAWPRC model into two soluble substra-
te fractions.
Spo: Orthophosphate in the mixed liquid.
XPD: Phosphorus bound to biodegradable particulate substrate.
SPD: Phosphorus bound to biodegradable soluble substrate.
Ip,.X,P(Conc. of bacteria: Phosphorus bound in bacteria as normal
metabolic uptake.
&.X,(Conc. of inert): Phosphorus bound to inert material.
S & Slowly biodegradable soluble substrate.
S&Readily biodegradable soluble substrate. (Such as acetate)
New Processes
In the following the processes in the model, which directly are
included to simulate biological phosphorus removal are shortly desc-
ribed.

245
In the choice of the constant names for the kinetic constants in the
processes, it is tried to reuse the same constants in different pro-
cesses as much as possible. This gives a model with fewer cons-
tants in different processes as mutch as possible. This gives a model
with fewer constants to determine. On the other hand it might lead
to inflexibility of the model, e.g. it is not possible to fit the cons-
tants so that the model reflects the real world properly.
Process 4-7: Growth processes for Poly-P bacteria.
It was necessary to include four growth processes for Poly-P bacte-
ria. Processes 4 and 5 are very similar to the two growth processes
for heterotrophic bacteria and consist of Monod terms for substrate,
oxygen, and ammonia for the aerobic growth process or nitrate for
the anoxic growth rate. The only difference is the name of the
kinetic constants. Processes 6 and 7 differ from processes 4 and 5
only by using internal substrate (PHB/PHV) as substrate source.
Process 8: Decay of Poly-P bacteria.
First order process consisting
bacteria concentration.
of a rate constant multiplied with the
Processes 11, 12 and 13. Uptake and release of phosphate and subst-
rate under different oxygen conditions.
Process 11: Exchange of substrate and phosphorus under anaerobic
conditions.
Kor KNOP ‘SR KSRP ‘PP fiBP
KPl--e--e ‘BP
b~p+sO KNoP+~NO %p +sSR %RP +%P fiBP KPP +‘PP flBP
This process is responsible for simultaneous uptake of substrate and
release of phosphorus under anaerobic conditions. The process is as
shown composed by a rate constant multiplied with 5 Monod terms
and the Poly-P bacteria concentration. The first two Monod terms
are swhitch functions for oxygen and nitrate to insure that the pro-

246
cess will function under anaerobic conditions only. The third Monod
term is the substrate term that ensures that there are enough subst-
rate in the bulk phase available. Otherwise there is nothing to build
a PHB/PHV storage of.
The next Monod term is included to regulate the size of the
PHB/PHV storage in the bacteria, so it will not increase infinitely.
The last Monod term is to insure that there is enough energy in
form of poly-p storage to build up the PHB/PHV storage.
Process 12: Uptake of substrate under aerobic or anoxic conditions.
G2SO KOP ‘NO %R KSRP- + 3h 1 %3P
bP+so bP+‘OP KNOP+SNO hP +SSR %RP +%P BBP
This process ensures that in case there is enough soluble easily
degradable substrate available under aerobic or anoxic conditions,
and the bacteria have energy available in form of a poly-p storage,
then the bacteria build up a PHB/PHV storage. The process then
consists of a rate constant multiplied with a term that ensures that
the process only functions under aerobic and anoxic conditions.
The fourth Monod term deals with easily biodegradable substrate
in the bulk phase. The last Monod term control the size of the
internal PHB/PHV storage.
Process 13: Uptake of phosphate under aerobic and anoxic condi-
tions.
SO YOP ‘NO %R %P ixBP- + ‘lh + ‘IPbP+so %P+sOP KNOP+sNO %P +‘SR KSRP +xsp &P
3
SOP KPP‘BP
KPop +S, Kpp +XPP lxap
This process controls the accumulation of phosphate as polyphospha-
te by the Poly-P bacteria under aerobic conditions. The process is

247
composed by a rate constant multiplied by seven Monod terms and
the bacteria concentration. The first three Monod terms are included
to ensure that these processes will run only under aerobic and
anoxic conditions. The next two Monod terms are included to handle
available substrate, either as internal substrate (PHB/PHV) or as
external soluble readily biodegradable substrate. The next Monod
term slows down the process, if the concentration of phosphate in
the bulk phase is low. The last Monod term is included to control
the size of the poly-phosphate pool in the bacteria.
Process 14: Release of phosphate from Poly-P bacteria durring decay
of the bacteria.
The polyphosphate is released to the bulk phase as orthophosphate.
The process is proportional to the decay process with the ratio of
polyphosphate concentration over Poly-P bacteria concentration.
Process 19 and 20: Hydrolysis of bacterial phosphate
This takes care of the release of phosphate stored in the bacteria
as a result of the normal metabolic process. This phosphate follows
the same scheme of death / regeneration as COD and nitrogen. Se
figure 3.
CALIBRATION OF THE MODEL
The next step after defining the mathematical model is to calibrate
the model. To do this one needs to have good dynamic measurements
of the components in the model from wastewater treatment plant.
The constants can be calibrated, as a combination of extracting the
values, determined from batch experiments and by fitting the model
constants to the measured concentrations. In this case we have
chosen as a start primarily to fit the constants and pay less attenti-
on to constants available from the literature. This is done because
it gives the possibility to test whether we altogether can fit the
model to give reasonable results compared to the measured values.
If not, one needs to review the model and develop new process
terms.

248
The data chosen for calibration is data from Frederiksund wastewa-
ter treatment plant. From this treatment plant there is a very
comprising set of data, measured over a 24 hour period, by Behrens
and Jansen in 1978. (Behrens and Jansen, 1978).
The treatment plant Frederiksund is a well functioning plant of the
biodenitro type. It is originally designed only to remove organics and
nitrogen, but operational data shows that the plant removes excess
phosphate as well. This removal is probably a result of biological
phosphorus removal.
The Frederiksund plant consists of gritchamber, 4 reactors of the
oxidation ditch type, and one sedimentation tank. (Figure 4).
Figure 4 Frederiksund Treatment plant.
The 4 reactors work in two parallel lines, so that the reactors two
and two together always work in the same phase. The Frederiksund
plant does not have the essential anaerobic reactor needed for
biological phosphorus removal. Anyway, it removes phosphate very
extensively. The reason for this is probably because the influent
water contains a high concentration of easily biodegradable soluble
substrate, from a juice factory in the town. This means that there
will be enough substrate available, both for the denitrification
process and for the biological phosphorus removal process.

249
In table 1, the configuration and operational parameters are listed.
Table 1 Operational data for frederiksund treatment plant.
Table 1.Volume : 850 q 3/reactor - 3400 m3 total.Mean values for :
Influent flow : 6630 m3/d.Recirculation : 4970 m3/d.Temperature : 16.3 "C.
Operational cyclus.Reaktor 1,4 Reaktor 2, 3 Time
Phase 1 influent - 02 effluent + 02 1.5 hour.Phase 2 + 02 influent effluent + 02 0.5 hour.Phase 3 effluent + 02 influent - 02 1.5 hour.Phase 4 influent effluent + 02 + 02 0.5 hour.
CHARACTERIZATION OF THE WASTEWATER
Characterization of the incoming wastewater is of major importance
in connection with modelling. It is by no means possible, with the
measuring methods available today, to measure the concentration of
all the model components in the model. One must measure what is
possible with the methods available, and then make a qualified guess
of the concentration of the non measurable components. In table 2
it is listed how we have estimated the concentrations of the non
measurable components.

250
Table 2
----------f4.asur.d data: CC&,
Boo,,worrmd
Tha fraction of rolublr COD of the total COD am dotormlnod by :
%9 - %R - m-w-h- I 2
Th. followinS .r. l intimatedx,S)j - 0.04 l a30xep - 0.04 l ax~,~~x, - 0.02 l am-,-xS * 0.90 l a mvm
The influmt concentrations of nitroam campormnts are ca lcu la ted by lussbalurca far nlt.roSan.
Kjoldbal-l - x, + s, + +) + I,*(X,+x@+J&) + Irr*q +S( ++,
Kjelhal-n. h, SW, I&, I , .r. h a v*lu.a.
Rarby .r. X,,,,, and SNo calculated of :
%D - (I-f(S/t)) l (KJoldahl-ll - S,,” - I,,,,*(Xw+Xw+xgli) - Im’U,+S, ))
S,,,, - ((B/t) l (Kjaldahl-l - S,,” - l,,,*NS,++xgP+XeA) - I,*(X,+S,+XK))
On the mame way are the concmtrationr f o r phomphorua componontr dotramlnedb y help of a marrbmlance.
Total-P - xmt xpp + SW + sm + sm + I@*( & + xep + h) + rp*q + s, + +,
T o t a l - P , h, SW, Iw, I, l r * known valum.
& - (l-f(S/T)) l (Total-P - xw - spp - spg - Iw”& + x, + k, - 1,+(x, + 8, + +,,,
sNo - f(S/T) + (Total-P - Wpp - Spp - SW - I~*Cx, + Xsp + XS,,, - $,,*‘(X, + 8, + +4,,.-__-___ -
In figure 5 is shown the diurnal influent variations for COD, ammo-
nia, nitrate and phosphate. It is seen that the COD concentrations
as expected is rather high.

251
CQDg/m3
2000 -
1800 -9
1600 -=
- COD - PO4 -NH4 --. NO3 Others91m3
T
35
12:oo 16:OO 2o:oo 0:oo 4:oo
Figure 5 Diurnal influent concentrations at mesureing day.
CONSTANTS UDSED IN THE MODEL
woo 12:oo
As values for the stoichiometric and kinetic constants used in the
model, are generally selected values, which are suggested by the
IAWPRC task group for modelling (M Henze et al, 1987) at all places
where this was possible. The rest are, as mentioned earlier in the
chapter, more or less randomly established. These values are then
calibrated by fitting the model in successive runs to the measured
values. The values found in this way are listed in table 3 together
with the same values found by Wentzel (Wentzel, 1988) and the
IAWPRC values.
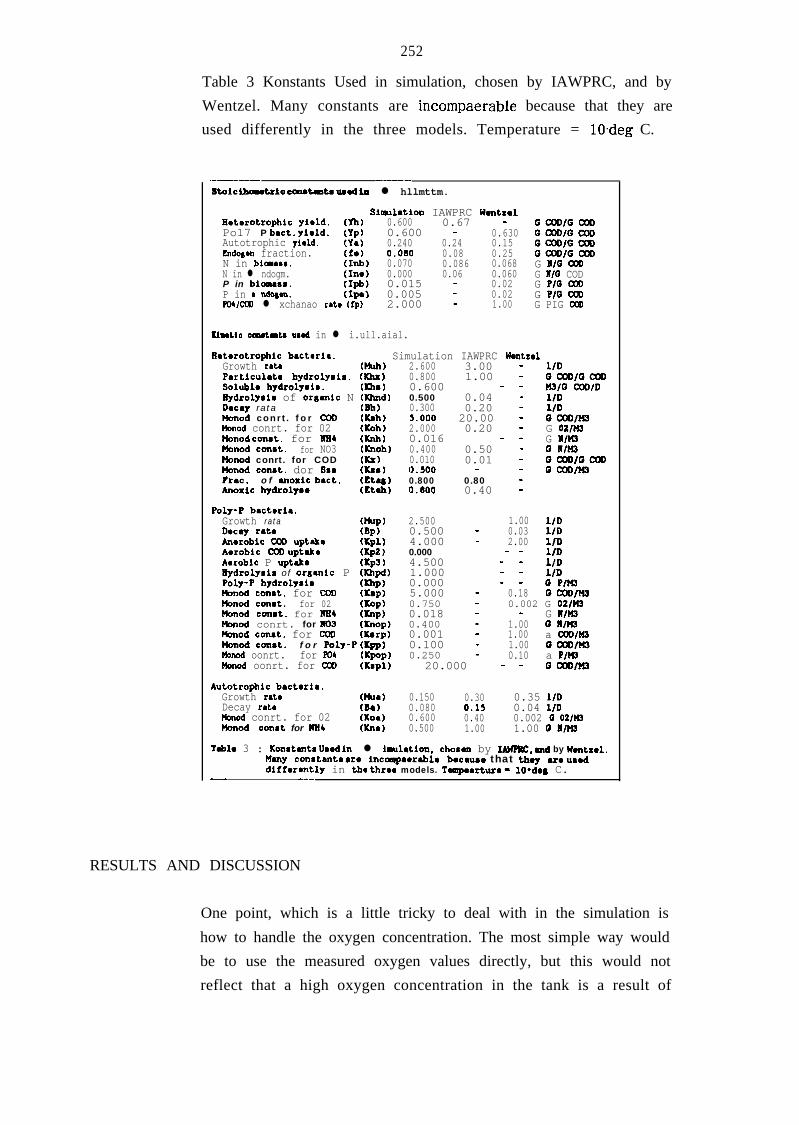
252
Table 3 Konstants Used in simulation, chosen by IAWPRC, and by
Wentzel. Many constants are incompaerable because that they are
used differently in the three models. Temperature = lO.deg C.
.---- --_8taiciblmmtx10 0autwt.m ummd ln l hllmttm.
Simlmtion IAWPRC Wmtz*lRotorotrophic yield. vh) 0.600 0.67 - GooD/GcoDPo17 P bact. yiald. (YP) 0.600 - 0.630 G~IGOODAutotrophic 7ield. (Ya) 0.240 0.24 0.15 GUXVGCODEndoaen fraction. Cf.1 o.ol30 0.08 0.25 GCDDlGCC0N in biamaam. (Inb) 0.070 0.086 0.068 G N/G CGDN in l ndogm. (Ina) 0.000 0.06 0.060 G U/G CODP in bimmr. (Ipb) 0.015 - 0.02 G P/G CooP in l ndo~on. (Ipa) 0.005 - 0.02 G P/G CQDP04lCGD l xchanao r&o (fp) 2.000 - 1.00 G PIG CQD
Kiwtio ormrtot~ usod in l i.ull.aial.
Raterotrophic brctarlr. Simulation IAWPRC WentsolGrowth rate wuh) 2.600 3.00 - L/DPsrticulata hydrolynia. (Khx) 0.800 1.00 - GCOD/GUXISoluble h7droly#i#. (Iha) 0.600 - - U3u/G COD/DBydrolyrl# of organic N (l&d) 0.500 0.04 - l/DDeca7 rata (ml) 0.300 0.20 - l/DMood c o n r t . for COLI (ICmh) s.000 20.00 - GCGDlU3l4mod conrt. for 02 (Kohl 2.000 0.20 - G 02/WMonad conat. for NE4 ah) 0.016 - - G N/&l3Monad const. for NO3 (Knob) 0.400 0.50 - 0 A/n3Honod conrt. for COD ax) 0.010 0.01 - GCGDIGca,kmod conmt. dor Sar (YIs) O.SOO - - GC#/l43trac. o f moxie bact. (Etal) 0.800 0.80 -Anoxic hydrolym mah) 0.600 0.40 -
Pol7-P bectoria.Growth rata mup) 2.500 1.00 l/DDecw rata (BP) 0.500 - 0.03 l/DAnorobic COD uptake (Kpl) 4.000 - 2.00 LIDAerobic CW uptak. (Kp2 1 0.000 - - 110Aerobic P uptake (Kp3) 4.500 - -Bydrolylia of organic P (Khpd) 1.000 - - :::Pol7-P hydrol7sln (Khp) 0.000 - - 0 PI!43Honod conmt. for COD (Kap) 5.000 - 0.18 GCOD/H3Monad con&. for 02 0.750 - 0.002 G 02/U3Monad ennnt. for ME4 :E$ 0.018 - - G II/U3Monad conrt. for HO3 an0p) 0.400 - 1.00 0 N/U3Monod conat. for CGD (Warp) 0.001 - 1.00 a COD/n3mnod cone.. f o r Poly-P CKpp) 0.100 - 1.00 aCGD/u3Plonod oonrt. for W4 (KPOP) 0.250 - 0.10 a P/n3Monad oonrt. for CGD (Kapl) 20.000 - - GalDll43
Autotropbic brctoria.Growth rata wua) 0.150 0.30 0.35 l/DDecay rate (Ba) 0.080 0.1s 0.04 IIDlbnod conrt. for 02 (Koa) 0.600 0.40 0.002 0 02/wHonod oonmt for NH4 v.na) 0.500 1.00 1.00 0 l/u3
T&lo 3 : Komtmtr Uaod ln l iuhtion, charm by IAWFRC, md by Wmtxel.Many conrtantr are incompaorablo because that the7 are umoddiffor@ntly in tha thrm models. fompmarturo - lOado C.
- -_
RESULTS AND DISCUSSION
One point, which is a little tricky to deal with in the simulation is
how to handle the oxygen concentration. The most simple way would
be to use the measured oxygen values directly, but this would not
reflect that a high oxygen concentration in the tank is a result of

253
low biological activity. It would rather reflect that the oxygen is
pumped into the tanks at high level equal to high. Kia value. This
means that a high oxygen concentration would result in higher
biological activity, and not that low biological activity results in
little use of oxygen and thereby higher oxygen concentration. It
would be most correct to use two distinct K,a-values which were
swhitched on or of in shorter or longer periods. But this is rather
difficult to simulate, because that the values of the Kia values and
the period length of operation, need to be estimated independently
and at the same time. Instead it is chosen to simulate the oxygen
concentration by fitting a Kia value at every measuring point. Thus
the different Kia values then reflects the different length of the
periods with a high respectively a low Kia-value.
Figure 6 Oxygen concentrations in reactor 1 to 4.
Malt = Measured. Beregnet = Calculated.
17 402336x
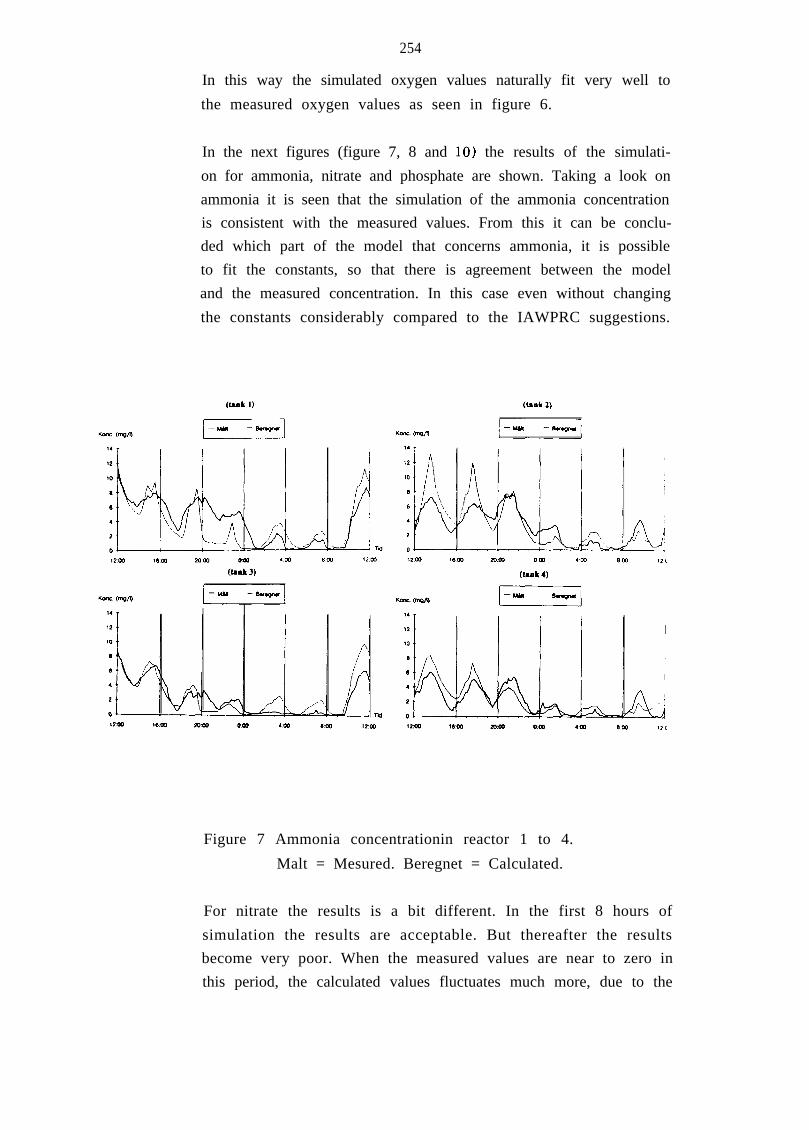
254
In this way the simulated oxygen values naturally fit very well to
the measured oxygen values as seen in figure 6.
In the next figures (figure 7, 8 and 101 the results of the simulati-
on for ammonia, nitrate and phosphate are shown. Taking a look on
ammonia it is seen that the simulation of the ammonia concentration
is consistent with the measured values. From this it can be conclu-
ded which part of the model that concerns ammonia, it is possible
to fit the constants, so that there is agreement between the model
and the measured concentration. In this case even without changing
the constants considerably compared to the IAWPRC suggestions.
(tmk 2)
Figure 7 Ammonia concentrationin reactor 1 to 4.
Malt = Mesured. Beregnet = Calculated.
For nitrate the results is a bit different. In the first 8 hours of
simulation the results are acceptable. But thereafter the results
become very poor. When the measured values are near to zero in
this period, the calculated values fluctuates much more, due to the

255
alternating nature of the system, and it is not possible to calculate
the very low concentration of nitrate with occur in the measured
data. The reason for this, could be connected to the very low con-
centration of easily degradable soluble substrate that occur in the
simulation, as seen in figure 9.
Nltnt (rmk 1) Nitnt (tank 2)
I
Nitnt (tank41
(-ru]
Nllnt (#aok 3)
Figure 8 Nitrate concentration in reactor 1 to 4.
Malt = Mesured. Beregnet = Calculated.
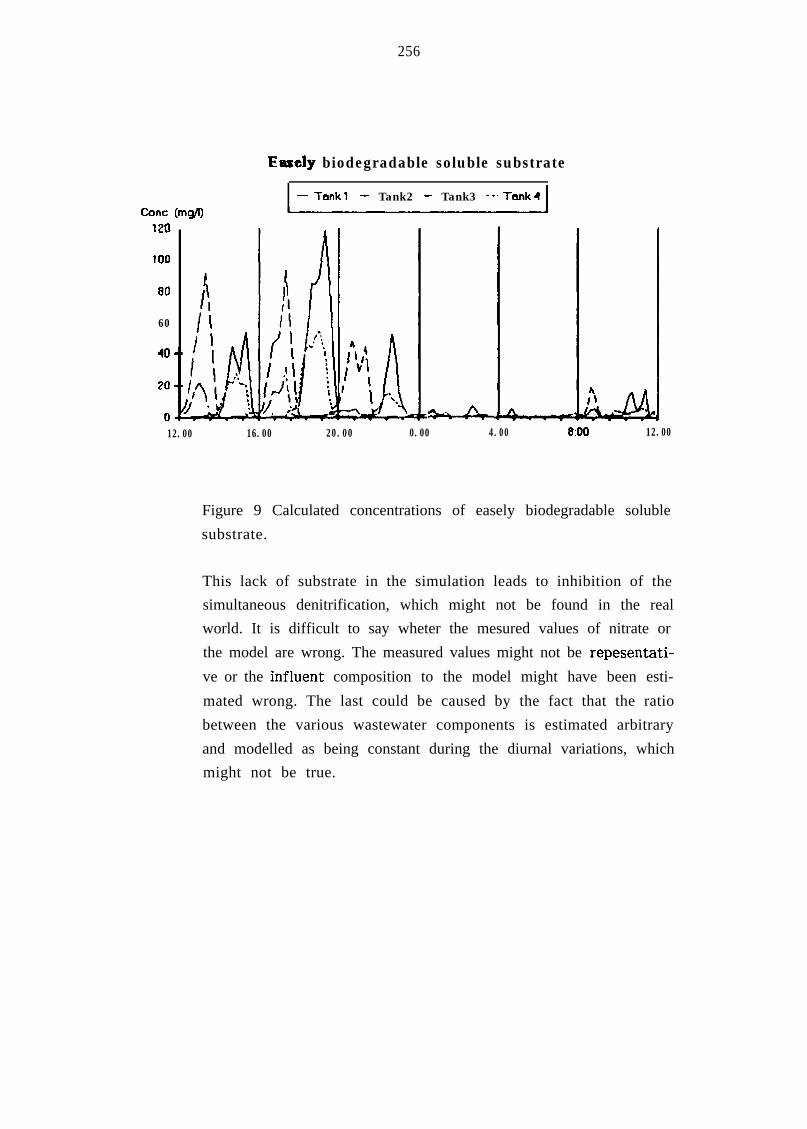
256
Easely biodegradable soluble substrate
Cone (mg/l)- Tank1 - Tank2 - Tank3 --.Tank4
60
sns-12.00 16.00 20.00 0.00 4.00 COO 12.00
Figure 9 Calculated concentrations of easely biodegradable soluble
substrate.
This lack of substrate in the simulation leads to inhibition of the
simultaneous denitrification, which might not be found in the real
world. It is difficult to say wheter the mesured values of nitrate or
the model are wrong. The measured values might not be repesentati-
ve or the influent composition to the model might have been esti-
mated wrong. The last could be caused by the fact that the ratio
between the various wastewater components is estimated arbitrary
and modelled as being constant during the diurnal variations, which
might not be true.

257
Foolor (tank 2)
Figure 10 Phosphate concentration in reactor 1 to 4.
Malt = Mesured. Beregnet = Calculated.
The curves for the last component, phosphate, give reasonable re-
sults, but there is some discrepancy between the measured and the
calculated values. Two things leap into the eyes. The high level of
the calculated concentrations during the last part of the simulation,
similar as for nitrate, and the slowly decrease of phosphate uptake
in the aerobic zones. The first discrepancy is probably again due to
the very low calculated easy degradable soluble substrate which
makes it impossible for the bacteria to take up phosphate in the
aerobic phases. The second discrepancy is more likely a model error
caused by inflexibility of the model, caused by the reuse of cons-
tants in different processes. This might be corrected, by making
the kinetic constants for substrate in the phosphate/substrate ex-
change processes independent of the same constants in the growth
processes. The last is being tested at the moment.

258
CONCLUSION
A model for biological phosphorus removal is developed, as an exten-
sion to the model developed by the IAWPRC group for modelling
(M.Henze et al, 1987). This model is tested against measured data
from Frederiksund wastewater treatment plant to see if it was
possible for the model to simulate biological phosphorus removal.
Generally the model reflects the measured date very well, even so
that there still are discrepancies.
Two possibilities are located, which could make a resonable
explanation on these discrepancies. At first the problems are caused
by inflexibility in the constants, because that some kinetic cons-
tants, in the present model, are reused intensively in different
processes. Another possible explanation of the problems with fitting
the observed data for nitrate and orthophosphate with the modelled
could be the fact that the model is so complex that the data collec-
ted are not sufficiently detailed or representative to be used for a
fitting procedure.
LITERATURE
Behrens, J.C., Jansen, J. 1 .C. ( 1979). Waste Water Treatment - Results
of Full Scale Experiment. Research report no. 1, IMSOR, DTH,
Lyngby.
Brodisch, K.E.J. and Joyner, S.J. (1983). The role of microorganisms
other than acinetobacter in biological phosphate removal in activated
sludge process. Wat. sci. Tech. 17, 89-97.
Buchan, L. ( 1983). Possible biological mechanism of phosphorus remo-
val. Wat. Sci. Tech. 15, 87-103.
Comeau, Y. Oldham, W.K. and Hall, K.J. ( 1987). Dynamics of carbon
reserves in biological dephosphation of wastewater. Advances in
Water Pollution Control. Biological Phosphate Removal from Waste-
waters. Rome. R. Ramadori. Pergamon press. Great Britain 39-55.

259
DuPont, R. (1987). Program for simulation of activated sludge treat-
ment plants with alternating operation. Master thesis at the Depart-
ment of environmental engeneering, DTH, Lyngby. (In Danish.)
Henze, M., Grady, C.P.L. Jr., Gujer, W., Marais, G.v.R. and Matsuo,
T. (1987). Activated Sludge Model No. 1. IAWPRC, Scientific and
Technical Reports No. 1, IAWPRC, London.
Lotter, L.H. (1985). The role of bacterial phosphate metabolism in
enhanced phosphorus removal from the activated sludge process. Wat.
Sci. Tech. 17, 127-138.
Potgieter, D.J.J., Evans, B.W. (1983). Biochemical changes associated
with luxury phosphate uptake in a modified phoredox activated
sludge system. Water Sci Technol, 15 (3/4) 105-115.
Wentzel, M.C., Lotter, L.H., Loewenthal, R.E., Marais, G.v.R. ( 1986)
Metabolic Behaviour of Acinctobacter Spp. in Enhanced Biological
Phosphorus Removal - A Biochemical Model. Water S.A. 12, (4) 209-
224.

260
STUDY ON NITROGEN REMOVAL AT THE HELSINKI
WATER AND WASTEWATER AUTHORITY
Mr. Ari Kangas
CITY OF HELSINKI
WATER AND WASTEWATER AUTHORITY
No nitrogen treatment is required at the wastewater treatment
plants now in operation in Helsinki. The designs for the new central
wastewater treatment plant, at present under construction at Viikin-
maki, had to make the incorporation of nitrogen removal possible
if future effluent quality requirements should demand this. Thus it
was necessary to conduct a feasibility study on nitrogen removal
on a plant scale at &e Kylasaari wastewater treatment plant (300 ‘_
000 P.E.). One of the Kylasaari process lines was modified for use
as a study line for nitrification and denitrification.
The purpose of the study was to find out if a conventional treat-
ment plant, using simultaneous precipitation and operating at normal
loads, could be modified into a nitrogen-removal plant using the
single-sludge DN-process, and what the conditions for such operation
would be. The study began in the autumn of 1986 and will continue
at least up to the end of 1990. The study is carried out in coopera-
tion with the City of Espoo water and wastewater utility. The
results will be used in the process designs for the Viikinmaki plant
going on stream in the 1990s. The costs for modifying the study
line have so far amounted to approximately FIM 300 000.
Test Set-Up
One of the twelve process lines at Kylasaari was modified for nitri-
fication and denitrification (DN-line). Preliminary wastewater treat-
ment - i.e. screening, grit removal, and pre-aeration - is the same
throughout the plant, but the aeration basin was rebuilt as shown
in Appendix 1 for a single-sludge DN-process. Denitrification takes
place in the anoxic zone in the first quarter of the basin.
Mechanically treated wastewater constitutes the carbon source for

261
denitrification. The dimensioning values for the test set-up are
shown in Appendix 2. Phosphorus removal as simultaneous precipita-
tion with ferrous sulphate is again the same throughout the plant.
Propeller agitators were installed in the anoxic zone to prevent
sludge settling when aeration is switched off. The fine bubble dif-
fusers in this zone were coated with a rubber membrane to prevent
aerator plate clogging when aeration is not used. An additional
turbine aerator was installed in the first quarter of the basin to
improve aeration capacity during nitrification start-up (Appendix
3). Nitratecontaining sludge is recirculated to the anoxic zone both
as return sludge and through two anoxic zone both as return sludge
and through two centrifugal pumps with fixed yields installed at
the end of the aeration basin. Recirculation from secondary sedimen-
tation depends on the recirculation pumping rhythm of the whole i
plant; thus the recirculation ratio cannot be altered for the DN-
line alone.
The operation of the DN-line is continually monitored. In addition,
samples are taken twice a week. Samples from primary sedimentation
and from biological treatment are collected as daily composites. The
DN-line contains continuously operating pH-meters at the beginning
and end of the aeration basin, and temperature and flow monitors.
Oxygen concentration is continually monitored from points at the
beginning and end of the aerobic zone. The aeration regulation
system keeps the oxygen concentration at 2 mg/l.
In addition to technical ferrous sulphate used for phosphorus remo-
val, lime is added to the DN-line to compensate for loss of alka-
linity. Lime (Ca(OH),) feed was introduced in May 1988.
Test Runs
The construction of the DN-line was completed in the summer of
1987, and the first test runs for nitrification start-up began in
August. Nitrification got under way, but because of a drop in alka-
linity (0.1-0.5 mmol/l) the process was disturbed and denitrification
could not be started.

262
A lime feed apparatus was installed on the line and, after snow-melt
peak flows had passed, nitrification was started again together with
a dosage of finegrained industrial lime (Ca(OH),) in the spring of
1988. During the summer of 1988 nitrification stabilized so much
with the lime feed, that the first denitrification test run could be
started on July 12. This period lasted until September 30, although
denitrification had to be interrupted for the period July 29-August
10 because nitrification was being intensified by using the total
aeration basin capacity. The DN-test had to be interrupted when
flooding due to heavy rains flushed away the sludge and halted
nitrification. The results for the two denitrification phases are
shown in Appendices 4, 5, and 6.
Results in 1988
Nitrification reached a level of 70 % on the average during the test
period, but showed a wide range of variation. This effected the
whole nitrogen removal process, as poor nitrification did not produce
enough nitrate for denitrification. Clogged aerators, which made
oxygen concentrations drop below the required level, and an irregu-
larly operating lime feed were contributing factors in irregular
nitrification. However, the principal reason for poor nitrification
results was that sludge age could not be retained at a sufficiently
high level.
Because of high wastewater temperatures (18-20°C) in the summer,
the sludge age required is only 5-6 d, but should be 7-9 d to allow
for flow variations. With present volumetric loads (0.38 kg/m”d) this
would lead to such high sludge concentrations that the sludge would
not be retained in the aeration-clarification system, but would be
flushed on from secondary sedimentation during peak flows. It is
even more difficult to achieve nitrification in the winter and spring
with low wastewater temperatures.
The problems encountered with low alkalinity levels in 1987 could
be compensated with lime dosage. Periodic interruptions occurred
in the lime feed, and the dose used ( 40 g/m”) was calculated as
an average over a long period due to the absence of fine adjustment
in the feed.

263
Recirculation pumping of activated sludge and the carbon-to-nitrogen
ratio in aeration basin influent were factors limiting denitrification.
Return and recirculation pumping gave a 2.35 coefficient of recir-
culation, at which level denitrification would at most have reached
70 %. Complete denitrification with the carbon-to-nitrogen ratio
present in the wastewater would have required a 1.5-hour deten-
tion time in denitrification. The theoretical detention time, calcu-
lated from discharges, was approximately 45 minutes. Because of
complete agitation actual detention time was much less, however:
tracer test showed a through time of only fifteen minutes for maxi-
mum tracer concentrations in the anoxic zone (Appendix 7).
With denitrification in progress lime demand dropped somewhat. A
roughly calculated feed was 30 g/m”.
Total nitrogen reduction amounted to approximately 45 % in the test
line and to approximately 20 % in the control lines.
Plans for Test Set-up Improvements
As it is of primary importance that nitrification be improved, steps
had to be taken to maintain a longer activated sludge age. The
alternatives available were either controlling high sludge concentra-
tions in the aeration basin or lowering the incoming load. Lowering
the load with pre-precipitation, for instance, would have interfered
with nitrogen removal, as it would haved reduce the amount of
carbon needed for denitrification.
A carrier material test program was planned in order to find a
suitable method of controlling high sludge concentrations in the
aeration basin. The support material chosen was small cubes of foam
plastic in free suspension. The cubes are prevented from entering
secondary sedimentation and recirculated to the beginning of the
aerobic process. According to calculations, the sludge concentration
need was 12 kg/m”. In order to determine the quantity of sludge
on the surface of the carrier material and the amount of carrier
surface necessary, test runs will first be carried out on a pilot
plant scale at the test facility operated by the National Board of

264
Waters and the Environment as a joint project with the Board’s
Technical Research Bureau.
Test Runs in 1989
The plant scale test line was redesigned, and test runs continued in
the summer of 1989.
Detention time in denitrification was extended by constructing baf-
fles between the agitators in order to prevent short-circuiting and
to change the flow into more of a plug flow type.
Plans were also drawn up for raising the alkalinity of the process
with a feed of lime sludge residue left over from the production of
lime water in the water treatment process.
Because test runs in 1988 had showed that the fine bubble aerators
clogged easily, probably due to the joint effects lime, iron, and high
sludge concentrations, all aerators along the test line were replaced
with a type covered with a rubber membrane.
Results in 1989
The average value for nitrification reached 80 %, and the process
was more stable than in 1988. Total nitrogen reduction rose to 54
% because the denitrification zone functioned better than previously.
Nitrogen reduction in the control lines remained at 20 %.
There was no need to start a feed of lime sludge residue because
improved denitrification prevented alkalinity from falling too much.
The results for 1989 are shown in Appendices 8, 9, and 10.

KVL~SAAW!l DN-prm@8a
w_ ----21m ~
AERATED ZONE
IAERATED ZONE RECIRCULATION
OF ACTIVATEDSLUDGE
aerat ion basin~__--_--_-----.-_-_---___--____-___~~
42 m
$4 m
dimensions of aeration basin
secondarysedimentation
6 m-----w

266
Appendix 2
It i

fromprim.-_sed.
KYL;?;SAARI D N - p r o c e s s
1 5 0 0 - 2 0 0 0 mS/h
- -:: 4 2 0 : 2-li:: ::
,oooooooooooeoooooooooo* 0.00..~--------_--.__._____---._--..---_-____. _____..._~L_.____- _________~ -.. -----
LG . . . . . e- . . . . .,- . . . . . F l o e o e o e m m o o o o e e o_
‘i i__---Z : I
192: :T 1 4 4 : -”
0
:eeeeeeeeeaeaeeeeeea*e:l :l o e e e e e e e e o e o e e e e e o e e e e- --__~.-.--.--._-.~__ --._-- -.--
3. zone_~~z?.z.cz~___-._-___-.__. ---.-__
4. zone recirculation--____---.----___--~- _ - -- ~ - secondary
5 0 0 - 9 0 0 m3/h 150 % sedimentation
aeration basin
9 0 0 m3/h1. zone @=====I
Membrane aerators1. zone 500 m3, 0,088 m2/m2, 2,8 m3/h aera to r Pmix= 4j5 W/m3
2. zone 500 m3, 0,l 15 m2/m2, 3,6-4,8 m3/h aera to r
3. zone 500 m3, 0 ,053 m2/m2, 1,5-2,7 m3/h aera to r
4. zone 500 m3, 0 ,039 m2/m2, 1,5-2,7 m3/h aera to r

268
Appendix 4
. ./...::..
,_,....”
. .
/
*.
. . .

269
Appendix 5
ZI
0%t-
16 402336X

Q = 8 6 0 0 m3/d
BOD7 = 90 mg/lS S = 1 0 0 mg/lt o t - N = 31 mg/l
NH4--N = 27mg/lalkal. = 2,9 mmol/l
KYLhSAARI D N - p r o c e s s 1 9 8 8
Return sludge 85 %BOD, = 9 mg/tSS =L 28 mg/lt o t - N = 17 mg/t
NH4-N = 9 mg/lN03-N = 6 mg/lN-red. = 45 ZIalkal. = 2,l mmol/l
Temperature = 21 “c
Sludge age = 6 d
Detention time = 4.2 h
F/M = 0.1 1 kgBOD/kgMLSSd
Volumetric loading = 0.37 kgBOD/rn3d
BOD/N = 2.8
C a - d o s e = 3 0 gCa/m3Nitrification rate = 54 gN/kgMLVSS(aer )d
Denitrification rate = 68 gN/kgMLVSS(anox)d (20 % of nitrogen in excess sludge)
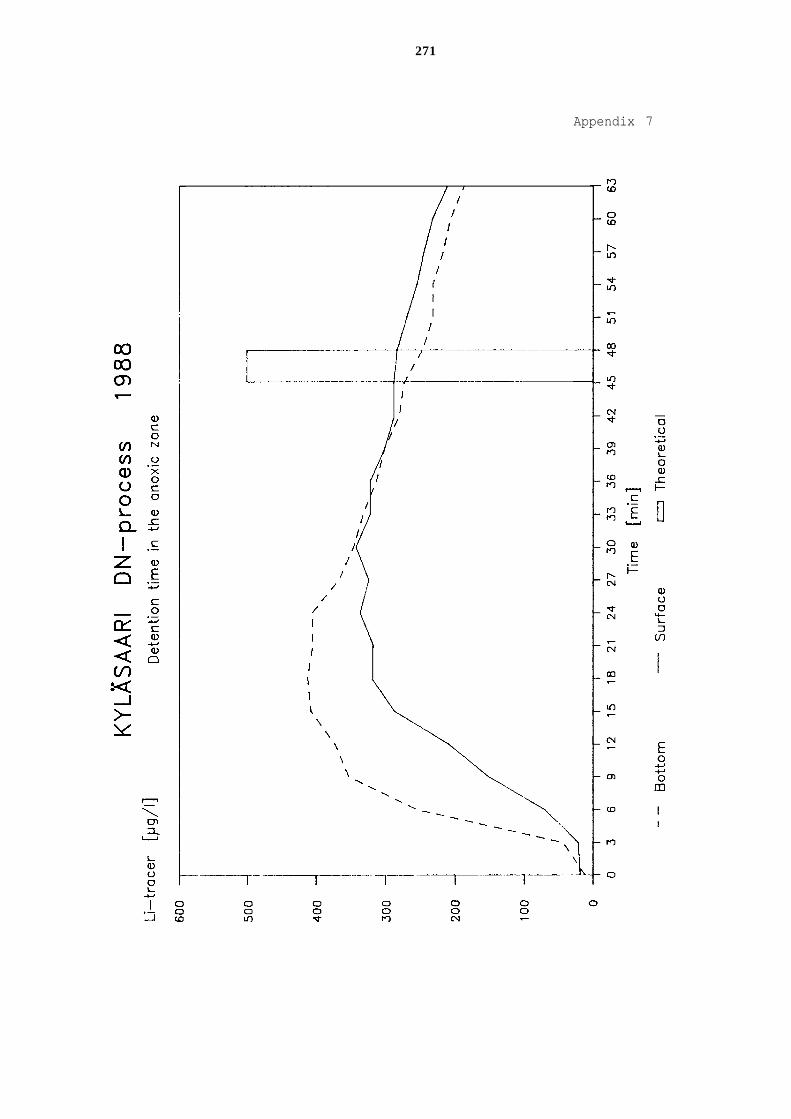
271
Appendix 7
~--- ----_____
___~_. -II
/
I/
//
//
//III
III\\\
\\\ \ . . \. \
-. -_ \--\ ‘\-_
-_ \_--T- .._______.___. __,-__
--------T---1\

90
80
60
KVL~SAARI DN-p rocess 1 9 8 9
-~-~-__-i_-l_~___~l_-~__.-_.-~-I-Nitrification
T o t a l - N -
1.8. 3.8. 6.8. 9.8. 14.8. 17.8. 20.8. 22.8. 28.8. 30.8. 5.9.

273
Appendix 9
__.__‘__~~.-.T- _..~ -.-
I 1I ’
\
I /
5’‘\‘1\ \
-.-,-\:\,.
0 0
19 402336X

KYLi’iSAARI D N - p r o c e s s 1 9 8 9
Q = 7800 rn3,'d
BOD7 = 80 mg/iS S z 100 mg/lt o t - N = 34 mg/l
NH4--N = 2 7 mg/lalkal. = 3,0 mmol/l
Temperature
Sludge age
Detent ion t ime
F/MVolumetr ic loading
BOD/N
C a - d o s eNitrification r a t e
Denitr i f icat ion rate
j 1IMLVSS 1,8 g/l] \__..--_-_-_--I p-----_- _ -_-/
Return sludge 85 %B O D 7 = 4 mg/lSS = 11 mg/lt o t - N = 1 6 mg/I
21 “c NH4-N E 7 mg/l
5dN03-N = 7 mg,A
N- red . = 54 z4.7 h alkal. = 1 ,20.1 1 kgBOD/kgMLSSd
mmoi/l
0.31 kgBOD/m3d
2.4
0 gCa/m377 gN/kgMLVSS(aer )d
1 17 gN/kgMLVSS(anox)d (20 % of nitrogen in excess sludge)

275
LIST OF PARTICIPANTS
LECTURERS:
Mr. Tage V. AndersenMinistry of the EnvironmentS trandgade 29DK-1401 COPENHAGENDENMARK
Mr. Peter DihlmannFederal Ministry for the EnvironmentNature Conservation and Nuclear SafetyPostfach 120629D-5300 BONN 1WEST-GERMANY
Dr. Markku MakelaNational Board of Waters and the EnvironmentP.O. Box 250SF-00101 HELSINKIFINLAND
Dr. Pawel BlaszczykInstitute of Environmental Protection00-548 WARSAW, krucza 5/11POLAND
Mr. Jan-Erik HaglundStatens NaturvardsverkBox 1302S-171 25 SOLNASWEDEN
Ms. N.A. ZaletovaZagrantechkommunstrojB. Khmelnitsky 2/15101000 MOSKOWUSSR
Mr. Udo AsmusRPI Esti ProjectTallinn 200105LENIN1 PST. 8USSR
Mr. Vassili RodionovHelsinki CommissionMannerheimintie 12 ASF-00100 HELSINKIFINLAND

276
Mr. Risto SaarinenVantaanjoen ja Helsingin seudunvesiensuojeluyhdistysIlmalantori 1 aSF-00240 HELSINKIFINLAND
Dr. H.J. KiuruVesihuoltoliittoAlbertinkatu 34 BSF-00180 HELSINKIFINLAND
Prof. Jerzy KurbielPolitechnika KrakowskaUl. Warzawska 2431-155 KRAKOWPOLAND
Mr. Ragnar StorhaugAquateam ASPostboks 6326ETTERSTADNORWAY
Mr. Ingemar Karlsson Boliden KemiKungstensgatan 38S-l 13 59 STOCKHOLMSWEDEN
Dr. Arto LatvalaNational Board of Waters and the EnvironmentP.O. Box 250SF-00101 HELSINKIFINLAND
Mr. S&en Ndhr BakVKIAgern alle 11DK-2970 HmSHOLMDENMARK
Mr. Erik BundgaardI. Kruger asGladaxevej 363DK-2860 SmORGDENMARK
Dr. Lars GunnarssonAnox ABS-223 70 LUNDSWEDEN
277
PARTICIPANTS:
Civil EngineerAndersen LotteCounty of FunenAmtsgardenobaekvej 100DK-5220 ODENSEDENMARK
M. SC.Eilersen Ann MarieTechnical University of Denmark, Dept. of EnvironmentalEngineering, Build. 115DK-2800 LYNGBYDENMARK
EnigneerHelgesson IvanLerum CommuneTekniska KontoretS-443 80 LERUMSWEDEN
Senior AssistantIsoaho SimoTampere University of TechnologyP.O. Box 527SF-33101 TAMPEREFINLAND
EngineerJokinen OssiLZlnsi-Uudenmaan vesiensuojeluyhdistys ry.P.O. Box 51SF-08101 LOHJAFINLAND
Doctor of ScienceJdrgensen KirstenNational Board of Waters and the EnvironmentP.O. Box 250SF-00101 HELSINKIFINLAND
Civil engineerEnglund GrazynaNorsk Institut for VannforskningP.O. Box 33Blindem0313 OSLONORWAY

278
EngineerHolmstrom HansVAVRegeringsgatan 86S-11 1 39 STOCKHOLMSWEDEN
M. SC . (EnglJantunen AijaAir-Ix SuunnitteluP.O. Box 52SF-20781 KAARINAFINLAND
ChemistJappinen MaijaCity of Espoo, Water and Wastewater AuthorityHyljeluodontie 5SF-02270 ESPOOFINLAND
M. SC . (ENG)Kaloinen JormaNational Board of Public BuildingP.O. Box 237SF-00531 HELSINKIFINLAND
M. SC. (Tech)Saarinen RaimoCity of Helsinki, Water and Wastewater AuthorityIlmalantori 1 aSF-00240 HELSINKIFINLAND
Design EngineerSundholm ImmoAir-Ix OyP.O. Box 453SF-33101 TAMPEREFINLAND
M. SC . (ENG)Wirola HannuTampere Water and Environment DistrictP.O. Box 297SF-33 10 1 TAMPEREFINLAND
Scientific ManagerVirtanen AnneliMaj and Tor Nessling FoundationPohj. Hesperiankatu 3 A 4SF-00260 HELSINKIFINLAND

279
Jokinen SimoKemiraFINLAND
Emsis Dr.Ministry of the Environmentof Latvian SSRUSSR
2 .V. DavidovaZagrantechkommunstrojB. Khmelnitsky 2/1510100 MOSCOWUSSR
M. SC. (Eng)Salis InrekTallinn University of TechnologyUSSR
Lit. Tech.Valve MattiNational Board of Waters and the EnvironmentP.O. Box 250SF-00101 HELSINKIFINLAND
M. SC. (Eng)Virta MarkettaHelsinki Water and Environment DistrictP.O. Box 58SF-00421 HELSINKIFINLAND
EngineerVuorivirta KaarinaCity of HelsinkiWeather and Wastewater AuthorityKylasaarenkatu 8SF-00580 HELSINKIFINLAND
Nasarow Mr.Riga City CouncilUSSR
Grinberg Dr.Ministry of the Environmentof Latvian SSRUSSR
M. SC. (eng)Keski-Saari OlliAir-Ix OyP.O. Box 453SF-33101 TAMPEREFINLAND
280
Chief InspectorKohonen TapaniMinistry of the EnvironmentP.O. Box 399SF-00121 HELSINKIFINLAND
Chief InspectorKrogerus KirstiNational Board of Waters and the EnvironmentP.O. Box 250SF-00101 HELSINKIFINLAND
Area ManagerLuhtala HannuKemira Water TreatmentP.O. Box 902S-251 09 HELSINGBORGSWEDEN
ChemistMakinen Ritva-LiisaCity of Turku, Wastewater Treatment PlantRuissalontie 14- 18SF-20200 TURKUFINLAND
Nimz EberhardKombinat Wassertechnik undProjektierung WasserwirtschaftDDR
M. SC. (Eng)Rantala PenttiAir-Ix OyP.O. Box 453SF-33101 TAMPEREFINLAND
Chief of LaboratoryKhvat VictorAll-Union Scientific ResearchInstitute for Water ProtectionBakoulin Str. 6310141 KHARKOVUSSR
Civil EngineerKorup YvonneCounty of Funen AmtsgardenIZkbaekvej 100DK-5220 ODENSEDENMARK

281
M. SC . (Eng)Kujala-Raty KatriinaNational Board of Public BuildingP.O. Box 237SF-00531 HELSINKIFINLAND
EngineerMuotka BrittKemira Water TreatmentP.O. Box 902S-251 09 HELSINGBORGSWEDEN
Process ChemistNiemela AriPlancenter LtdOpastinsilta 6SF-00520 HELSINKIFINLAND
Prof.Paal LeopoldTallinn University of TechnologyUSSR
Riechert DieterWasserwirtschaftdirektionKusteDDR

2 8 2
BALTIC SEA ENVIRONMENT PROCEEDINGS
No. 1 JOINT ACTIVITIES OF THE BALTIC SEA STATES WITHIN THE FRAMEWORKOF THE CONVENTION ON THE PROTECTION OF THE MARINE ENVIRONMENTOF THE BALTIC SEA AREA 1974-1978(1979)*
No. 2 REPORT OF THE INTERIM COMMISSION (IC) TO THE BALTIC MARINEENVIRONMENT PROTECTION COMMISSION(1981)
No. 3 ACTIVITIES OF THE COMMISSION 1980- Report on the activities of the Baltic Marine Environment
Protection Commission during 1980- HELCOM Recommendations passed during 1980(1981)
No. 4 BALTIC MARINE ENVIRONMENT BIBLIOGRAPHY 1970-1979(1981)
No. 5A ASSESSMENT OF THE EFFECTS OF POLLUTION ON THE NATURAL RESOURCESOF THE BALTIC SEA, 1980PART A-l: OVERALL CONCLUSIONS(1981)*
No. 5B ASSESSMENT OF THE EFFECTS OF POLLUTION ON THE NATURAL RESOURCESOF THE BALTIC SEA, 1980PART A-l: OVERALL CONCLUSIONSPART A-2: SUMMARY OF RESULTSPART B: SCIENTIFIC MATERIAL(1981)
No. 6 WORKSHOP ON THE ANALYSIS OF HYDROCARBONS IN SEAWATERInstitut fiir Meereskunde an der UniversitPt Kiel, Department ofMarine Chemistry, March 23 - April 3, 1981(1982)
No. 7 ACTIVITIES OF THE COMMISSION 1981- Report of the activities of the Baltic Marine Environment
Protection Commission during 1981 including the ThirdMeeting of the Commission held in Helsinki 16-19 February1982
- HELCOM Recommendations passed during 1981 and 1982(1982)
No. 8 ACTIVITIES OF THE COMMISSION 1982- Report of the activities of the Baltic Marine Environment
Protection Commission during 1982 including the FourthMeeting of the Commission held in Helsinki 1-3 February 1983
- HELCOM Recommendations passed during 1982 and 1983(1983)
___--------___
* out of print
283
No. 9
No. 10
No. 1 1
No. 12
No. 13
No. 14
No. 15
No. 16
No. 17A
No. 17B
SECOND BIOLOGICAL INTERCALIBRATION WORKSHOPMarine Pollution Laboratory and Marine Division of the NationalAgency of Environmental Protection, Denmark, August 17-20,1982, RBnne, Denmark(1983)
TEN YEARS AFTER THE SIGNING OF THE HELSINKI CONVENTIONNational Statements by the Contracting Parties on theAchievements in Implementing the Goals of the Convention on theProtection of the Marine Environment of the Baltic Sea Area(1984)
STUDIES ON SHIP CASUALTIES IN THE BALTIC SEA 1979-1981Helsinki University of Technology, Ship HydrodynamicsLaboratory, Otaniemi, FinlandP. Tuovinen, V. Kostilainen and A. H%nPllinen(1984)
GUIDELINES FOR THE BALTIC MONITORING PROGRAMME FOR THE SECONDSTAGE(1984)
ACTIVITIES OF THE COMMISSION 1983- Report of the activities of the Baltic Marine Environment
Protection Commission during 1983 including the FifthMeeting of the Commission held in Helsinki 13-16 March 1984
- HELCOM Recommendations passed during 1983 and 1984(1984)
SEMINAR ON REVIEW OF PROGRESS MADE IN WATER PROTECTION MEASURES17-21 October 1983, Espoo, Finland(1985)
ACTIVITIES OF THE COMMISSION 1984- Report of the activities of the Baltic Marine Environment
Protection Commission during 1984 including the SixthMeeting of the Commission held in Helsinki 12-15 March 1985
- HELCOM Recommendations passed during 1984 and 1985(1985)
WATER BALANCE OF THE BALTIC SEAA Regional Cooperation Project of the Baltic Sea States;International Summary Report(1986)
FIRST PERIODIC ASSESSMENT OF THE STATE OF THE MARINEENVIRONMENT OF THE BALTIC SEA AREA, 1980-1985; GENERALCONCLUSIONS(1986)
FIRST PERIODIC ASSESSMENT OF THE STATE OF THE MARINEENVIRONMENT OF THE BALTIC SEA AREA, 1980-1985; BACKGROUNDDOCUMENT(1987)

No. 18
No. 19
No. 20
No. 21
No. 22
No. 23
No. 24
No. 25
No. 26
No. 27A
No. 27B
284
ACTIVITIES OF THE COMMISSION 1985- Report of the activities of the Baltic Marine Environment
Protection Commission during 1985 including the SeventhMeeting of the Commission held in Helsinki 11-14 February1986
- HELCOM Recommendations passed during 1986(1986)"
BALTIC SEA MONITORING SYMPOSIUMTallinn, USSR, lo-15 March 1986(1986)
FIRST BALTIC SEA POLLUTION LOAD COMPILATION(1987)"
SEMINAR ON REGULATIONS CONTAINED IN ANNEX II OF MARPOL 73/78AND REGULATION 5 OF ANNEX IV OF THE HELSINKI CONVENTIONNational Swedish Administration of Shipping and Navigation;17-18 November 1986, Norrkoping, Sweden(1987)
SEMINAR ON OIL POLLUTION QUESTIONS19-20 November 1986, Norrkoping, Sweden(1987)
ACTIVITIES OF THE COMMISSION 1986- Report on the activities of the Baltic Marine Environment
Protection Commission during 1986 including the EighthMeeting of the Commission held in Helsinki 24-27 February1987
- HELCOM Recommendations passed during 1987(1987)"
PROGRESS REPORTS ON CADMIUM, MERCURY, COPPER AND ZINC(1987)
SEMINAR ON WASTEWATER TREATMENT IN URBAN AREAS7-9 September 1986, Visby, Sweden(1987)
ACTIVITIES OF THE COMMISSION 1987- Report on the activities of the Baltic Marine Environment
Protection Commission during 1987 including the NinthMeeting of the Commission held in Helsinki 15-19 February1988
- HELCOM Recommendations passed during 1988(1988)
GUIDELINES FOR THE BALTIC MONITORING PROGRAMME FOR THE THIRDSTAGE; PART A. INTRODUCTORY CHAPTERS(1988)
GUIDELINES FOR THE BALTIC MONITORING PROGRAMME FOR THE THIRDSTAGE; PART B. PHYSICAL AND CHEMICAL DETERMINANDS IN SEA WATER(1988)
-_-------_____
* out of print

285
GUIDELINES FOR THE BALTIC MONITORING PROGRAMME FOR THE THIRDSTAGE; PART C. HARMFUL SUBSTANCES IN BIOTA AND SEDIMENTS(1988)
No. 27C
No. 27D
No. 28
No. 29
No. 30
No. 31
No. 32
No. 33
No. 34
No. 35A
No. 35B
GUIDELINES FOR THE BALTIC MONITORING PROGRAMME FOR THE THIRDSTAGE; PART D. BIOLOGICAL DETERMINANDS(1988)
RECEPTION OF WASTES FROM SHIPS IN THE BALTIC SEA AREA- A MARPOL 73/78 SPECIAL AREA(1989)
ACTIVITIES OF THE COMMISSION 1988- Report on the activities of the Baltic Marine Environment
Protection Commission during 1988 including the TenthMeeting of the Commission held in Helsinki 14-17 February1989
- HELCOM Recommendations passed during 1989(1989)
SECOND SEMINAR ON WASTEWATER TREATMENT IN URBAN AREAS6-8 September 1987, Visby, Sweden(1989)
THREE YEARS OBSERVATIONS OF THE LEVELS OF SOME RADIONUCLIDES INTHE BALTIC SEA AFTER THE CHERNOBYL ACCIDENTSeminar on Radionuclides in the Baltic Sea29 May 1989, Restock-Warnemiinde, German Democratic Republic(1989)
DEPOSITION OF AIRBORNE POLLUTANTS TO THE BALTIC SEA AREA 1983-1985 AND 1986(1989)
ACTIVITIES OF THE COMMISSION 1989- Report on the activities of the Baltic Marine Environment
Protection Commission during 1989 including the EleventhMeeting of the Commission held in Helsinki 13-16 February1990
- HELCOM Recommendations passed during 1990(1990)
STUDY OF THE RISK FOR ACCIDENTS AND THE RELATED ENVIRONMENTALHAZARDS FROM THE TRANSPORTATION OF CHEMICALS BY TANKERS IN THEBALTIC SEA AREA(1990)
SECOND PERIODIC ASSESSMENT OF THE STATE OF THE MARINEENVIRONMENT OF THE BALTIC SEA, 1984-1988; GENERAL CONCLUSIONS(in print)
SECOND PERIODIC ASSESSMENT OF THE STATE OF THE MARINEENVIRONMENT OF THE BALTIC SEA, 1984-1988; BACKGROUND DOCUMENT(to be printed before the end of 1990)
--__----______
* out of print

Baltic Marine EnvironmentProtection Commission- Helsinki Commission -Mannerheimintie 12 ASF-00100 Helsinki
ISSN 0357-2994