proceedings of international seminar on biological sciences
TRANSCRIPT

Proceedings of International Seminar on Biological Sciences
“The Role of Biological Research in the Development of Science, Technology and Sustainability of Natural
Resource Management”
17th October 2015 North Sumatera, Medan
Indonesia
Published and Organized by Department of Biology,
Faculty of Mathematics and Natural Sciences University of Sumatera Utara
2016
USU Press Art Design, Publishing & Printing Building F, Center for Information Systems (PSI) Campus USU Jl. University No. 9 Medan 20155, Indonesia Telp. 061-8213737; Fax 061-8213737 usupress.usu.ac.id © USU Press 2016 This book, or parts thereof, may not be reproduced in any form or by any means, electronic or mechanical, including photocopying, recording or any information storage and retrieval system now known or to be invented, without written permission from the Publisher. ISBN 979 458 879 2 Perpustakaan Nasional: Katalog Dalam Terbitan (KDT)
Proceedings of International Seminar on Biological Sciences / Department of Biology, Faculty of Mathematics and Natural Sciences, University of Sumatera Utara --Medan: USU Press 2016. ix, 133 p. ; ilus.: 29 cm Bibliografi ISBN: 979-458-879-2

International Seminar on Biological Sciences (ISBS - 2015) iii
Preface
The Biology Department at the University of Sumatera Utara sponsored an International Seminar on Biological Sciences on 17 October 2015. The one-day conference entitled, “The Role of Biological Research in the Development of Science, Technology and Sustainability of Natural Resource Management“was held at the luxurious SantikaDyandra Hotel and Convention Center in the heart of downtown Medan, Sumatera. The conference included 5 keynote addresses from speakers throughout the world including the USA, UK, Indonesia, and Germany. In the afternoon, there were concurrent sessions with speakers from throughout Indonesia and Thailand.
North Sumatera is the ideal location to hold an international scientific conference focused on the biological sciences. Some of the world’s most diverse rain forests are located on Sumatra, which is the world’s third largest island and home to thousands of unique species. I think one of the key highlights for me was hearing from Dr. Ian Singleton and Matt Novak of the Sumatran Orangutan Conservation Programme. They specialize in the protection of primates in Sumatra and they are the world’s leading authorities on Orangutans and other primates on the island. We all learned that much of Sumatra’s biodiversity is threatened by habitat destruction (particularly for palm oil and pulp or paper concession), and human persecution and this needs to stop immediately to protect the region’s biodiversity.
This is an unfortunate situation that the international community is watching and that could be rectified with assistance and pressure from the scientific community. There is an urgent need to stop the decline of loss of critical native forested regions on Sumatera. This is a key educational issue for young biologists in Sumatera, thus there a pressing need for scientific community to gather to learn about issues facing biodiversity in North Sumatera and other regions of Indonesia. This recent international conference was an important gathering to continue the education of the nation’s biological community. It was a chance for biologists from around the world to interact with young scientists from North Sumatera.
There were a number of highlights of the conference for me. First, I was amazed the grandeur of the opening ceremonies. I have never been to a meeting where the conference was initiated by such spectacular, graceful dancers in exquisite, colorful costumes – it was pomp and circumstances that I will never again experience at that level in my lifetime. Second, the members of the audience were attentive and seemed to be extremely interested in all the talks. Third, all the students in the audience were excited about the chance to take a photo with all the speakers – I do not think I have ever had my photo taken so many times as I did with students from North Sumatera.
There were 22 papers that were submitted as written proceedings for this conference. One of my roles as an active participant in the conference was to critically evaluate some of these papers. This is standard practice at international conferences to have the proceeding peer-reviewed. All papers were written in

iv International Seminar on Biological Sciences (ISBS - 2015)
English. I can only imagine the challenges of trying to write an article in another language, but for the papers I read the author’s did an excellent job. The authors were articulate, and wrote about some interesting research they were conducting. The range of topics was covered by the talk was immense – ranging from studies of the distribution and abundance of mosquito larvae in villages near Medan to a summary of local wisdom for the managing mangroves. Thus, the conference represented a broad spectrum of biologists and topic areas from throughout the region.
Overall, the conference was a grand experience and something that I will never forget. It was a chance for biologists from throughout the region to interact, a chance for young scientists to learn about pressing issues facing Indonesia and the planet, a chance for biologists to gain experience presenting in front of an international audience in English – so that in the future they can present at other international conferences outside of Sumatera. The citizens of Indonesia are fortunate to live in such a beautiful country with such a unique biological heritage. Few places in the world have Orangutans living in nearby forests. I hope that the local scientific community continues to understand and protect their unique biodiversity – generations in the future will applaud your efforts.
Dr. Peter Paton Chief Editor
Professor Department of Natural Resources Science
University of Rhode Island Kingston RI 02881

International Seminar on Biological Sciences (ISBS - 2015) v
Preface
Assallamuailaikum warahmatullahi wabarakatu, peace for all of us. I am grateful to God, the Almighty God for allowing us to attend the this very noble meeting Then, to the Dean of Faculty and their representatives, the Chairman of the Department in Faculty of Mathematics and sciences and also the Committee of International Seminar of Biological Sciences 2015 at Medan, I congratulate you all for the implementation of this seminar. It will carry the name USU not only in Indonesia but also worldwide level, to exchange experiences among researchers and practitioners in the relevant field of sciences.
Further, to all the keynote speakers, Prof. Dr. Peter Paton and Dr. Jason Kolbe from the University of Rhode Island, USA, we are very apreciate for your readiness to be a keynote speaker in this seminar. They came in the framework of the follow-up cooperation between USU and URI. Then, to Dr. Ian Singleton and Mathew G. Nowak of Sumatran Orangutan Conservation Programme, PAN Eco-YEL, North Sumatra, Indonesia, I also say thank you very much for your cooperation. Finally, to Prof. Anja Meryandini from Bogor Agricultural Institute (IPB) Bogor, we are very glade for sharing experiences with us. Whole elements of USU highly expressed our gratitude for your willingness to come to the field to share the experience of biology that gives freshness to the knowledge to all participants of the seminar. Welcome to the city of Medan, may be you able to enjoy all the good things here.
Furthermore, to all seminar participants I welcome all of you in this seminar held at Medan. Without a strong desire from all of you, this event would not be a realization. This one-day seminar was organized to exchange experiences among researchers and practitioners from around the world in the field of biology and related fields. About 180 participants in which most of them were came from different province of Indonesia beside having other participants from Malaysia and Thailand.
Finally, our hope to all participants, can take the valuable benefits of this and eager to join future agenda of this kind of activity. We hope that this event can be held back with better preparation and structured in the future.
Prof. Ir. Zulkifli Nasution, M.Sc., Ph.D. Vice Rector for Academic Affairs
University of Sumatera Utara Medan Indonesia 20155

vi International Seminar on Biological Sciences (ISBS - 2015)
Foreword
This volume of seminar proceedings contains a collection of research papers presented at the International Seminar on Biological Sciences 2015 with themed The role of Biological Research on Development of Sciences and Technology and Sustainable Management of Natural Resources. This international seminar organized by Department of Biology, Faculty of Mathematics and Natural Sciences, University of Sumatera Utara (USU), Medan - Indonesia, held in Medan on 17th October 2015.
A special thanks to our keynote speakers and also to all our speakers, authors and delegates for making the seminar successful. We sincerely hope you find the conference proceedings enriching and thought-provoking.
Prof. Dr. Ing. Ternala Alexander Barus Chairman of Committee
Department of Biology Faculty of Mathematics and Natural Sciences
University of Sumatera Utara Medan Indonesia 20155

International Seminar on Biological Sciences (ISBS - 2015) vii
Editorial Boards
Chief Editor
Prof. Dr. Peter Paton Department of Natural Resources Science
University of Rhode Island United States of America
Members
Prof. Shih-Yen Lo Department of Laboratory Medicine
and Biotechnology Tzu Chi University
Taiwan
Assoc. Prof. Dr. Yaya Rukayadi Department of Food Science
Universiti Putra Malaysia Malaysia
Prof. Dr. Erman Munir, M.Sc Department of Biology
University of Sumatera Utara Indonesia
Dr. Isnaini Nurwahyuni, M.Sc Department of Biology
University of Sumatera Utara Indonesia
Dr. It Jamilah, M.Sc Department of Biology
University of Sumatera Utara Indonesia

viii International Seminar on Biological Sciences (ISBS - 2015)
TABLE OF CONTENTS The Effect of Dosage of Arbuscular Mycorrhizal Fungi and Watering Intervals on Oil Palm in Ultisol Anhar, A., Syahrizal, Fikrinda, Arabia, T. and N.F. Mardatin ..................................................... 1 Mass Rearing of Phragmatoecia castaneae Hubner (Lepidoptera: Cossidae) on Artificial Diets Dongoran, E. S., Tobing, M. C. and S. F. Sitepu ........................................................................... 7 Morphological Changes of Binahong Plant (Anredera cordifolia (Ten) Steenis) Induced by Mutagen Colchicine Bayu, E. S, Diana, S. H., Rosida, M. and A. H. Olivia. .............................................................. 15 Composition of Macroalgae in Kasiak Gadang Island, Nirwana Beach, Padang, West Sumatra, Indonesia Hadi, F., Zakaria, I. J. and Z. Syam ............................................................................................. 18 Local Wisdom of Coastal Community in Managing Mangrove Ecosystem in East Coast of North Sumatera Aulia, F., Badaruddin, Harahap, R. H., and B. Utomo ................................................................ 26 Rooting of in vitro Pineapple (Ananas comosus L.) With Naphtalene Acetic Acid Plant Growth Regulator and Sucrose Treatment Harahap, F. and Nusyirwan ......................................................................................................... 31 Arbuscular Mycorrhizal Fungi Association on Oil Palm Rhizosphere In Smallholder Farmer Plantation at Aceh Tamiang Fikrinda, Anhar, A., Arabia, T., Mardatin, N.F., Ritaqwin, Z., and Syakur ................................. 37 Potency of Phyllosphere Bacteria of Ornamental Plants (Dieffenbachia maculata., Spathiphyllum comutatum and Syzigium oleina) in Inhibiting Potential Pathogenic Bioaerosol Microbial from Hospital Environment Sonia, G., Jamilah, I. and N. Priyani. .......................................................................................... 43 The Use of Various Sugarcane Stem Powders as Artificial Diet for Mass-rearing Chilo sacchariphagus Boj (Lepidoptera: Crambidae) Lestari, H., Tobing, M.C. and D. Bakti. ...................................................................................... 48 Prospects of Using Tropical Plant Biomass Resources for Potential Benefits in Sustainable Biotechnology Punnapayak, H., Prasongsuk, S., Bankeeree, W. and P. Lotrakul................................................ 56 Potential of Phyllosphere Bacteria of Ornamental Plants To Inhibit Potential Pathogenic Bioaerosol Microorganism of Hospital Environment Margaretha, I., Jamilah, I. and D. Suryanto. ............................................................................... 63 Malaria Attributable-Fever based on Rapid Diagnostic Test (RDTs) in Primary Health Care : Detection of Asymptomatic malaria as a Problems in Malaria Ellimination Siahaan, L. .................................................................................................................................. 70
International Seminar on Biological Sciences (ISBS - 2015) ix
Biological Aspect of Coccinella transversalis Fabricus (Coleoptera: Coccinellidae) as Potential Predator on Aphid in Karo Highland Sidauruk, L. and E. Panjaitan .......................................................................................................74 Genetic diversity of Andaliman (Zanthoxylum acanthopodium DC.) germplasm in Indonesian based on OPD-13 and OPI-20 primers Putri, L. A. P. and I. M. S. Sembiring ..........................................................................................78 Characteristics Composts Biochar With and Without Addition of Chicken Manure Havena, M. and S. Mayly ............................................................................................................81 In Vitro Technique for Establishment of Celosia Culture as Betalain Resources Mastuti, R. ....................................................................................................................................86 Distribution and Abundance of Mosquito Larvae in Villages Sei Kera Hilir I, Medan Perjuangan, Medan North of Sumatera, Indonesia Panggabean, M. ...........................................................................................................................92 The Spawning Period of Anadara granosa (Bivalvia: Arcidae) Population in the Lhokseumawe Mudflat Khalil, M. ....................................................................................................................................97 Distribution and Abundance of Trees on the Green Belt in Medan City: An Effort to Mitigate Climate Change Patana, P., Latifah, S., and Rahmawaty .....................................................................................106 In Searching of Trees Natural Vibration Frequency Based on Granular Particles Interactions and Vibration Viridi, S., Patana, P., Subrata, S. A., Hertiasa, H. and M. Abdullah ........................................... 113 Antibacterial Activity of Bay Leaves Extract (Syzygium polyanthum Wight.) Against Nosocomial Pathogenic Bacteria Ismail, Y. S., Yulvizar, C. and A. D. T. S. Azwin .......................................................................123 Effect Of Different Biochar Type And Dose On Soybean Seed Germination In Soil-Less Petridish Bioassay Zamriyetti, Parinduri, S. and S. Mayly .....................................................................................129


International Seminar on Biological Sciences (ISBS - 2015) 1
The Effect of Dosage of Arbuscular Mycorrhizal Fungi and Watering Intervals on Oil Palm in Ultisol
Anhar, A*1., Syahrizal1, Fikrinda1, Arabia, T1. and N. F. Mardatin2
1)Agriculture Faculty, Syiah Kuala University, Jl. Hasan Krueng Kalee No. 3 Banda Aceh 23111, Aceh, Indonesia
*E-mail: [email protected] 2)Bogor Agricultural Institute, Jl. Raya Darmaga Kampus IPB Darmaga, Bogor 16680
West Java, Indonesia
ABSTRACT Individually, arbuscular mycorrhizal fungi (AMF) and drought stress can alter plant performance. AMF can improve water relations and colonization by root symbioses, and may increase the host’s tolerance of drought. However, the number of AMF in rhizosphere also affects the AMF performance. This research was aimed to characterize the role of AMF on oil palm seedling grown under different levels of drought stress in Ultisol in Aceh. This randomized complete design (two-way anova) study examined four different dosages of AMF (0, 5, 10, and 15 g/polybag) and three watering intervals (watered every 1, 3, and 5 day) on oil palm seedlings grown in polybag filling with Ultisol in main nursery. Dosage of AMF significantly affected the height of oil palm seedlings 60, 75 and 90 DAP (days after planting), shoot wet weight, shoot dry weight and root length of oil palm seedling 90 DAP, but did not significantly affect stem diameter 60, 75 and 90 DAP, and root wet weight 90 DAP. Watering intervals significantly affected shoot wet weight and shoot dry weight of oil palm 90 DAP. There were no significant interactions between Dosage of AMF and watering intervals on all parameters observed, thought application of 5 g/polybag improved oil palm growth even under 3 and 5 days watering interval. Overall results suggested that AMF colonization positively affected on growth of oil palm and thereby alleviated the stress imposed by water. Keywords: drought stress, main nursery, mycorrhiza, oil palm, ultisol INTRODUCTION Aceh Government through “Aceh Green” vision sets the dual purpose of development in Aceh, i.e. to achieve economic growth and to sustain environmental management. Smallholder oil palm plantation areas and production have significantly increased in the last eight years to 198,246 ha and 355,366 ton in 2013 (BPS, 2014) from 89,199 ha and 126,403 ton in 2007 (BPS, 2008), respectively. However, more than 65% of the smallholder oil palm areas in Aceh are carried out in marginal land, such as Ultisol and Histosol. In Aceh, Ultisol covers more than 2.763.298 ha (Bappeda Aceh, 2009). The main issue of Ultisol is the low nutrient availability. The land can be potentially utilized for agricultural, as long as better management provided and the existing constraints and the climate taken into account (Hardjowigeno, 1996). Weak capital of farmers providing agricultural inputs, especially fertilizers result in less productivity of smallholder oil palm plantations than estate plantations. One of the alternatives that can be carried out in the development of sustainable agriculture in marginal land is to utilize arbuscular mycorrhizal fungi (AMF). Arbuscular Mycorrhizal Fungi (AMF) are abundant and ubiquitous in almost all natural communities and can form associations with over 80% of vascular plants (Harley and Smith, 1983; Smith and Read, 1997). AMF have the potential not only to increase conventional agricultural productivity, but also to sustain the functioning of agricultural ecosystems. Oil palm is a plant that naturally symbiotic with AMF (Widiastuti and Kramadibrata, 1993). Several AMF symbioses with oil palm have been reported, i.e. Inoculation of AMF on oil palm increased

2 International Seminar on Biological Sciences (ISBS - 2015)
fertilizer efficiency (Blal et al., 1990; Widiastuti et al., 1998), increased oil palm growth and nutrient uptake (Widiastuti and Tahardi, 1993), and improved potential plant growth seedling from in vitro culture (Schultz et al., 1999). But, their maximum symbiosis effectively varied from one to the others. Oil palm is a perennial plant woody monocot and has different root types compare to seasonal crops. Oil palm has shallow root type that generally is not tolerant to drought, which severely limits growth and production. Oil palm is susceptible to water deficits and in years with very severe deficits can damage vegetative growth, even result in palm death (Nouy et al. 1999). The ability of the oil palm to extract and use water has become a very important issue in zones with marginal rainfall (Cornaire et al., 1994). Other studies have also shown that mycorrhizal colonization and drought interact in modifying free amino acid and sugar pools in roots (Auge et al., 2004). Finally, a greater osmotic adjustment has recently been reported in leaves of mycorrhizal plants than in non-mycorrhizal ones during a period of lethal drought (Kubikova et al. 2001). Therefore, in order to obtain optimal growth of oil palm, symbiosis between the AMF and oil palm seedlings needs to be optimized. One thing that affects AMF symbiosis is the dosage of inoculum. Inoculum dosage affects the effectiveness of the inoculation. This study aims to find out the optimum dosage of AMF at various time intervals of watering to get the optimum symbiosis of oil palm seedlings in various drought stress conditions. MATERIALS AND METHODS The experiment was conducted in the screen-house of Agriculture Faculty Syiah Kuala University, Banda Aceh, Indonesia, from April until July 2015. Materials used in the form of oil palm seeds (DxP) were derived from the Oil Palm Research Center, Medan, and sterile Ultisol as a planting medium was derived from the Pulo Tiga, Tamiang District, Aceh. Soil sterilization was done with the oven at 110 0C for three times with an interval of one night. The soil texture analysis was done by gravimetric method. The pH was measured in water (soil:water ratio 1:2.5) with a digital pH meter. Organic carbon was determined by the Walkley–Black acid digestion method (Walkley and Black 1934). Total N was measured by Kjeldahl method. Available P was extracted according Bray 1 method. Cation exchange capacity (CEC) was extracted by 1 N ammonium acetate at pH 7 was measured using atomic absorption spectrophotometry. The physicochemical characteristics of soil were: Soil texture is silty clay loam, pH 5.63, organic C 1.73%, N 0.17%, P 12.76 mg kg−1 soil, and cation exchange capacity 16.65 cmol (+) kg−1 soil. Before being used as a planting material in the main-nursery, oil palm seeds were grown in polybags 10 cm x 15 cm containing 1.5 kg of sterile soil for 90 days in pre-nursery. Watering was done daily. Oil palm seedlings aged 90 days were moved into polybags 40 cm x 60 cm containing 13 kg sterile Ultisol. AMF used was an indigenous AMF from the same location and is a collection Soil Biology Laboratory. AMF inoculum was multiplied with pot culture using corn as a host plant. Inoculum propagules were in the form of a mixture consisting of spores, infected root and hyphae. Inoculum colonization percentage was over 75%, and the density was arround 3 spores per gram of inoculum. Watering plants was conducted using tap water in the afternoon until field capacity in accordance with the treatment under study. Inoculation was done at the time of transfer to the polybag in the main-nursery by mixing with medium soil. Plant height and stem diameter were recorded at 60, 75 and 90 DAP in Main-nursery. The plants were harvested at 90 DAP in main-nursery. The root, and leaf samples were oven-dried separately at 70°C to a constant weight in an air-ventilated oven. The dry weights of roots, leaf, and stem samples were recorded separately. The study was conducted to test the 12 combination treatments, consisting of two factors, i.e. dosage of AMF (0; 5; 10; and 15 g/polybag) and watering intervals (watered to field capacity every 1, 3 or 5 day). The experimental design used was completely randomized factorial design (two-way anova) with three replications. If a significant difference was
International Seminar on Biological Sciences (ISBS - 2015) 3
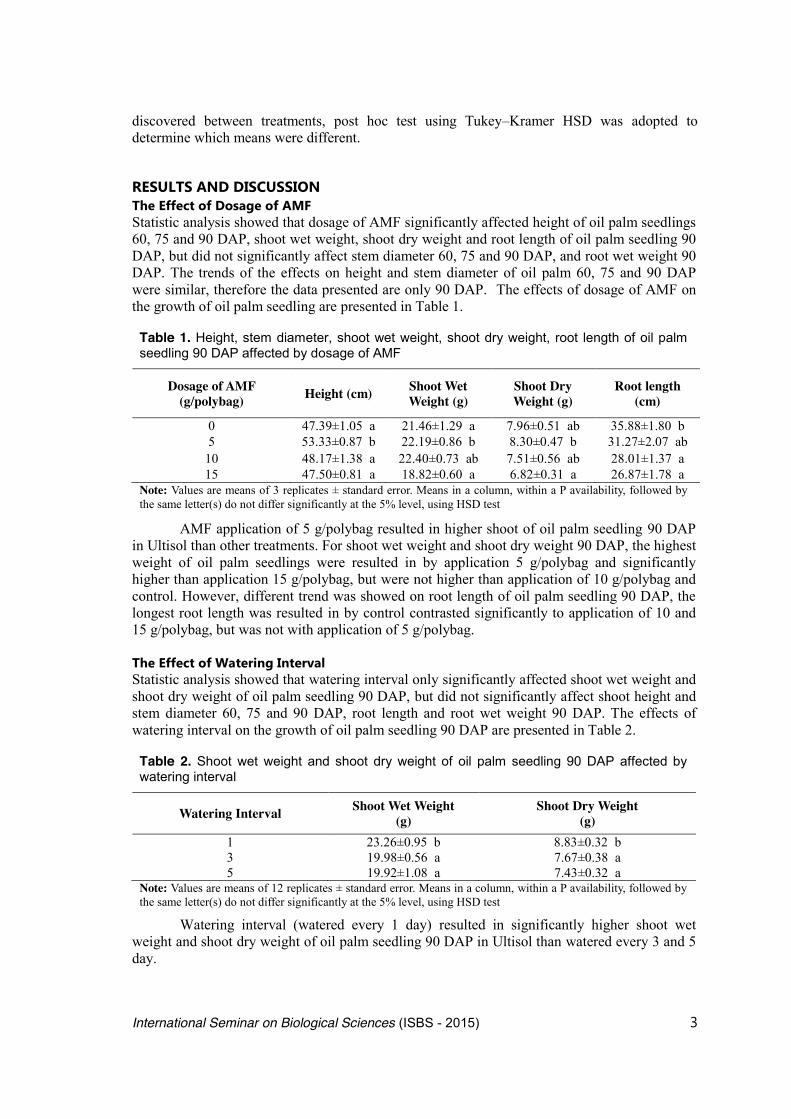
discovered between treatments, post hoc test using Tukey–Kramer HSD was adopted to determine which means were different. RESULTS AND DISCUSSION The Effect of Dosage of AMF Statistic analysis showed that dosage of AMF significantly affected height of oil palm seedlings 60, 75 and 90 DAP, shoot wet weight, shoot dry weight and root length of oil palm seedling 90 DAP, but did not significantly affect stem diameter 60, 75 and 90 DAP, and root wet weight 90 DAP. The trends of the effects on height and stem diameter of oil palm 60, 75 and 90 DAP were similar, therefore the data presented are only 90 DAP. The effects of dosage of AMF on the growth of oil palm seedling are presented in Table 1.
AMF application of 5 g/polybag resulted in higher shoot of oil palm seedling 90 DAP in Ultisol than other treatments. For shoot wet weight and shoot dry weight 90 DAP, the highest weight of oil palm seedlings were resulted in by application 5 g/polybag and significantly higher than application 15 g/polybag, but were not higher than application of 10 g/polybag and control. However, different trend was showed on root length of oil palm seedling 90 DAP, the longest root length was resulted in by control contrasted significantly to application of 10 and 15 g/polybag, but was not with application of 5 g/polybag. The Effect of Watering Interval Statistic analysis showed that watering interval only significantly affected shoot wet weight and shoot dry weight of oil palm seedling 90 DAP, but did not significantly affect shoot height and stem diameter 60, 75 and 90 DAP, root length and root wet weight 90 DAP. The effects of watering interval on the growth of oil palm seedling 90 DAP are presented in Table 2.
Watering interval (watered every 1 day) resulted in significantly higher shoot wet weight and shoot dry weight of oil palm seedling 90 DAP in Ultisol than watered every 3 and 5 day.
Table 2. Shoot wet weight and shoot dry weight of oil palm seedling 90 DAP affected by watering interval
Watering Interval Shoot Wet Weight (g)
Shoot Dry Weight (g)
1 23.26±0.95 b 8.83±0.32 b 3 19.98±0.56 a 7.67±0.38 a 5 19.92±1.08 a 7.43±0.32 a
Note: Values are means of 12 replicates ± standard error. Means in a column, within a P availability, followed by the same letter(s) do not differ significantly at the 5% level, using HSD test
Table 1. Height, stem diameter, shoot wet weight, shoot dry weight, root length of oil palm seedling 90 DAP affected by dosage of AMF
Dosage of AMF (g/polybag) Height (cm) Shoot Wet
Weight (g) Shoot Dry Weight (g)
Root length (cm)
0 47.39±1.05 a 21.46±1.29 a 7.96±0.51 ab 35.88±1.80 b 5 53.33±0.87 b 22.19±0.86 b 8.30±0.47 b 31.27±2.07 ab
10 48.17±1.38 a 22.40±0.73 ab 7.51±0.56 ab 28.01±1.37 a 15 47.50±0.81 a 18.82±0.60 a 6.82±0.31 a 26.87±1.78 a
Note: Values are means of 3 replicates ± standard error. Means in a column, within a P availability, followed by the same letter(s) do not differ significantly at the 5% level, using HSD test
4 International Seminar on Biological Sciences (ISBS - 2015)
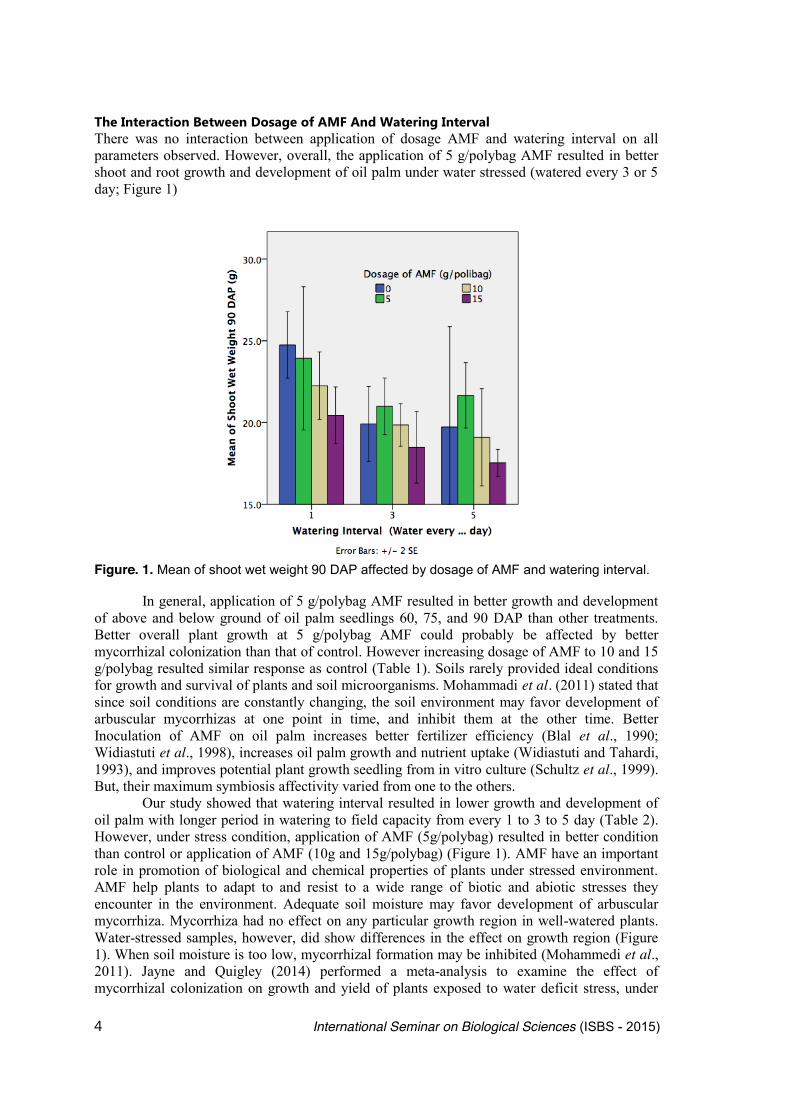
The Interaction Between Dosage of AMF And Watering Interval There was no interaction between application of dosage AMF and watering interval on all parameters observed. However, overall, the application of 5 g/polybag AMF resulted in better shoot and root growth and development of oil palm under water stressed (watered every 3 or 5 day; Figure 1)
Figure. 1. Mean of shoot wet weight 90 DAP affected by dosage of AMF and watering interval. In general, application of 5 g/polybag AMF resulted in better growth and development of above and below ground of oil palm seedlings 60, 75, and 90 DAP than other treatments. Better overall plant growth at 5 g/polybag AMF could probably be affected by better mycorrhizal colonization than that of control. However increasing dosage of AMF to 10 and 15 g/polybag resulted similar response as control (Table 1). Soils rarely provided ideal conditions for growth and survival of plants and soil microorganisms. Mohammadi et al. (2011) stated that since soil conditions are constantly changing, the soil environment may favor development of arbuscular mycorrhizas at one point in time, and inhibit them at the other time. Better Inoculation of AMF on oil palm increases better fertilizer efficiency (Blal et al., 1990; Widiastuti et al., 1998), increases oil palm growth and nutrient uptake (Widiastuti and Tahardi, 1993), and improves potential plant growth seedling from in vitro culture (Schultz et al., 1999). But, their maximum symbiosis affectivity varied from one to the others. Our study showed that watering interval resulted in lower growth and development of oil palm with longer period in watering to field capacity from every 1 to 3 to 5 day (Table 2). However, under stress condition, application of AMF (5g/polybag) resulted in better condition than control or application of AMF (10g and 15g/polybag) (Figure 1). AMF have an important role in promotion of biological and chemical properties of plants under stressed environment. AMF help plants to adapt to and resist to a wide range of biotic and abiotic stresses they encounter in the environment. Adequate soil moisture may favor development of arbuscular mycorrhiza. Mycorrhiza had no effect on any particular growth region in well-watered plants. Water-stressed samples, however, did show differences in the effect on growth region (Figure 1). When soil moisture is too low, mycorrhizal formation may be inhibited (Mohammedi et al., 2011). Jayne and Quigley (2014) performed a meta-analysis to examine the effect of mycorrhizal colonization on growth and yield of plants exposed to water deficit stress, under

International Seminar on Biological Sciences (ISBS - 2015) 5
water-deficit conditions, plants colonized by mycorrhizal fungi had better growth response than those that were not. Water shortage was likely to have an effect on mycorrhizal development (Bolgiano et al. 1983), and it was also among the factors most limiting plant growth. Faber et al. (1991) demonstrated the improved transport of water by mycorrhizal hyphae. In other study Ruiz-lozano et al. (1995) reported that the arbuscular mycorrhizal symbiosis benefits plants in terms of morphological growth when exposed to low-water conditions and reveal variations in those effects within differing contexts. The arbuscular mycorrhizal symbiosis may alleviate plant responses to moderate moisture deficit by several mechanisms including increased water uptake from the soil by hyphae, altered hormonal levels, causing changes in stomatal conductance, increased turgor by lowering leaf osmotic potential, improved nutrition of the host, and improved plant recovery after drought by maintaining the soil-root continuum (Entry et al., 2002). This may be due to a greater investment in persistent roots and recurring shoots oil palm seedling. Acknowledgment We acknowledge Ministry of Research, Technology and Higher Education for funding the study under MP3EI scheme
References Auge, R.M., Schekel, K.A. and Wample. R.L. (2004): Greater leaf conductance of well-watered VA
mycorrhizal rose plants is not related to phosphorus nutrition." New Phytologist 103: 107-116.
BAPPEDA Aceh. (2009): Peta jenis tanah Provinsi Aceh skala 1:1700000. Peta Adm. Prov. Aceh, AGDC/Aceh Geospasial Data Centre.
Blal, B., Morel, C. Gianinazzi-Pearson, V. Fardeau J.C. and Gianinazzi. S. (1990): Influence of vesicular-arbuscular mycorrhizae on phosphate fertilizer efficiency in two tropical acid soils planted with micropropagated oil palm (Elaeis guineensis Jacq). Biol. Fertil. Soils 9:43-48.
Bolgiano, N.C., Safir, G.R. and Warncke, D.D. (1983): Mycorrhizal infection and growth of onion in the field in relation to phosphorus and water availability. J Am Soc Hort Sci 108:819–825.
BPS. (2008): Aceh dalam angka. Badan Pusat Statistik Aceh, Banda Aceh. BPS. (2014): Aceh dalam angka. Badan Pusat Statistik Aceh, Banda Aceh. Cornaire, B., Daniel, C., Zuily-Fodil, Y., and Lamade, E. (1994): Le comportement du palmier à
huile sous stress hydrique. Données du problème, premiers résultats et voies de recherche. Oléagineux 49:1–12.
Entry, J.A., Rygiewicz, P.T. Watrud, L.S. and Donnelly, P.K. (2002): Influence of adverse soil conditions on the formation and function of Arbuscular mycorrhizas. Adv. Environ. Res. 7: 123-138.
Faber, B.A., Zasoski, R.J., Munns, D.N. an, Shackel, K. (1991): A method for measuring hyphal nutrient and water uptake in mycorrhizal plants. Can J Bot 69:87–94
Hardjowigeno, S. (1996): Pengembangan lahan gambut untuk pertanian suatu peluang dan tantangan. Orasi Ilmiah Guru Besar Tetap Ilmu Tanah. Fakultas Pertanian, Institut Pertanian Bogor.
Harley, J.L. and Smith, S. E. (1983): Mycorrhizal Symbiosis. Academic Press, London. Jayne B, Quigley M (2014): Influence of arbuscular mycorrhiza on growth and reproductive
response of plants under water deficit: a meta-analysis. Mycorrhiza 24:109–119. Kubikova, E., Moore, J.L., Ownlew, B.H., Mullen, M.D. and Auge, R.M. (2001): Mycorrhizal impact
on osmotic adjustment in Ocimum basilicum during a lethal drying episode. J Plant
6 International Seminar on Biological Sciences (ISBS - 2015)
Physiol 158:1227–1230. Mohammadi, K., Khalesro, S., Sohrabi, Y.and Heidari, G. (2011): A Review: Beneficial effects of the
mycorrhizal fungi for plant growth. J. Appl. Environ. Biol. Sci. 1(9):310-319. Nouy B, Baudouin L, Djégui N, Omoré A (1999): Oil palm under limiting water supply conditions.
Plantations Rech Développement 6(1):31–40. Ruiz-Lozano, J. M., Azcon, R. and Gomez, M. (1995): Effects of arbuscular– mycorrhizal Glomus
species on drought tolerance: physiological and nutritional plant responses. Appl Environ Microbiol 61:456–460
Schultz, C., Subronto, Latif, S., Moawad, A.M. and Vlek, P.L.G. (1999): Peranan mikoriza vesikuler-arbuskuler (MVA) dalam meningkatkan penyesuaian diri planlet kelapa sawit terhadap kondisi lingkungan tumbuh alami. J. Penelitian Kelapa Sawit, 7, 145-156.
Smith, S.E. and Read. D.J. (1997): Vesicular arbuscular mycorrhizas: Growth andcarbon economy of VA mycorrhizalplants. In Mycorrhizal Symbiosis. 2nded. New York, Acad. Press. p.105-125.
Widiastuti, H. and Kramadibrata, K. (1993): Identifikasi jamur mikoriza bervisikula arbuskula di beberapa kebun kelapa sawit di Jawa Barat. Menara Perkebunan, 61(1):13-19.
Widiastuti, H. and Tahardi, J.S. (1993): Effect of vesicular-arbuscular mycorrhizal inoculation on the growth and nutrient uptake of micropropagated oil palm. Menara Perkebunan, 61(3): 56-60.
Widiastuti, H., Darmono T.W. and Goenadi, D.H. (1998): Respons bibit kelapa sawit terhadap inokulasi beberapa cendawan AM pada beberapa tingkat pemupukan.
Menara Perkebunan, 66(2):36-46.
International Seminar on Biological Sciences (ISBS - 2015) 7
Mass Rearing of Phragmatoecia castaneae Hubner (Lepidoptera: Cossidae) on Artificial Diets
Dongoran, E. S.*, Tobing, M. C. and S. F. Sitepu
Department of Agroecotechnology, Agriculture Faculty, University of Sumatera Utara. Jl. Prof. A. Sofyan No.3 Kampus USU, Medan-20155
*E-mail: [email protected]
ABSTRACT P. castaneae is an important stem borer pest that has destroyed sugarcane in North Sumatera. It also a host of some parasitoids. This research aimed to study the biology of P. castaneae on artificial diets. Non factorial Randomized Complete Design was used as statistical design for this reseach. Treatment were artificial diets of sugarcane shoot powder variety PS 862 8.6 g, mixture of sugarcane stem and shoot powder variety VMC 76-16 4.3:4.3 g and mixture of sugarcane stem and shoot powder variety PS 862 4.3:4.3 g by 10 replications.The results showed that larval phase was >125 days with 10 instars. Mixture of sugarcane stem and shoot powder variety PS 862 4.3 : 4.3 g was the best treatment which had significantly different influence to the body length of larvae at 3rd instar (± 6.00 mm) and 4th instar (± 8.1mm). Duration of larvae phases at 1st instar (± 6.1 days) , 2nd instar (± 8.9 days) and 3rd instar (± 11.5 days). The percentage of larvae mortality at 1st instar (0%), 4th (20%), 5th (25%), 6th (30%), 7th (30%), 8th (35%), and 9th (35%). This is the first ever conduct and further research is needed so that this species could rear in laboratory.
Keywords: artificial diets, mass rearing, Phragmatoecia castaneae, sugarcane powder INTRODUCTION Since 2008 until 2011, sugarcane production has decreased about 17.30% dropping into 155,362 tonnes / year. In 2015 productivity of sugarcane is predicted to shrink 2.87% from 70.8 tonnes / ha to 68.7 t / ha in Indonesia. Total production of sugarcane from 2.58 million tons in 2014 and 2.54 million tonnes in 2015. If compared to the major sugar production countries in the world, Indonesia is in 11th position (2.54 million tones / years) after Brazil (> 35 million tonnes / year), India (> 25 million tonnes / year) and the EU ( > 15 million tonnes / year) in 2014-2015. Thus globally, Indonesia still lags behind in terms of production of sugar as compared to the major sugar-producing countries (PDIP, 2015; CPS, 2015).
Based on a Decree of the Minister of Agriculture (Kepmentan No. 38 / Kpts / HK.060 / 1/2006/ issued on January 27th 2006), Phragmatoecia castaneae was declared as an A2 quarantine pest. P. castaneae (Lepidoptera: Cossidae) commonly known as the giant cane borer (PBR) has caused serious damage to sugarcane crops in North Sumatera and West Sumatera. The loss of sugar yield for each internode which demaged was about 0.75 to 1.3%. This borer often attacks the shoots of plants that causing the navel to die and can not produce well (Saragih et al., 1986). The research conducted by the Sugar Industry Research Center in 1977 found that the loss in yield due to the borer attack had reached 60%. In Johor Baru, this borer destroyed about ± 8,222 Ha in 1968, and be an important pest in sugarcane plantations in PTP Nusantara II, North Sumatera (Purnama, 2001). Information about mass rearing of P. castaneae in the laboratory still rare, especially with artificial diet. Artificial diet is considered to produce better fitness insects compared to using natural diet (Blanco et al., 2008).
Until now, there is no suitable composition of artificial diet to rear P. castanneae and research still depends on the wild caught population. A suitable artificial diet, is would allow P. castanneae to be reared in the laboratory, thus facilitating research into its natural enemies.

8 International Seminar on Biological Sciences (ISBS - 2015)
MATERIALS AND METHODS This research was carried out at the Laboratory of the Sei. Semayang Centre for Research and Development of Sugarcane at PTPN II, Medan, North Sumatera with altitude of ± 40 meters above sea level from April to September 2015. This research used non factorial Randomized Complete Design with 10 replications of 3 different treatments in term of powder types: V1 = sugarcane shoots powder (sogolan) variety PS 862 8.6 g V2 = mixture of sugarcane stem and shoot powder variety VMC 76-16 4.3:4.3 g V3 = mixture of sugarcane stem and shoot powder variety PS 862 4.3:4.3 g If the results of the analysis of variance showed an obvious influence, then it was followed up by a different test average based on Duncan's Multiple Range Test at 5% (Steel and Torrie, 1989). Preparation of artificial diet Table 1. Composition of artificial diet for P. castaneae larvae
The compositing of the sugarcane powder was modified according to the treatment used,
while the other ingredients have the same weight for each treatment. The weight of each ingredient were given in Table 1. Initially 80 ml of water was poured into a blender, followed by 75 g mung bean sprouts which had been submerged for 12 hours, the sugarcane powder (8.6 g or 4.3: 4.3 g depending on the treatment) and 8.6 g sucrose. These were followed sequentially by nipagin (0.7 g), yeast (10.7 g), 0.35 g of sodium benzoate and vitamin C 1.1 g. The agar powder (4.4g) was dissolved in 160 ml of hot water and boiled, after which it was poured into the blender containing all the other ingredients and blended, following which 0.12 ml of 40% formalin was introduced by syringe into the blender. The media was poured into tubes, with small tubes containing 2.5 g, and large tubes 15.5 g, after which the tubes containing media were sterilized with UV light for 20 minutes. Provision of P. castaneae larvae Groups of P. castaneae eggs were taken from the mating cage and transferred to test tubes and covered with black cloth until the eggs turned blackish and hatch after 10-12 days. After hatching and aged < 2 days, the larvae were placed in the feeding tubes.
Putting larvae into artificial diet Before larvae were placed on the artificial diet, a small hole or a scratch was first made on the surface of the diet media. Larvae were carefully transferred onto the media until the larvae stuck to the surface of the artificial diet. Two larvae aged < 2 days were placed in each bottle / tube.
Materials Weight Sugarcane powder 8.6 g Mung bean sprouts 75 g Vitamin C 1.1 g 40% Formalin 0.12 ml Yeast (baker's yeast) 10.7 g Methyl p hidroxy benzoate/ Nipagin 0.7 g Sodium Benzoate 0.35 g Sucrose 8.6 g Agar powder 4.4 g Water for agar 160 ml Water for blender 80 ml

International Seminar on Biological Sciences (ISBS - 2015) 9
RESULTS AND DISCUSSION Behavior of larvae Based on the observations, it was determined that the P. castaneae larvae have unique characteristics. There are 10 instars, with each instar showing a different behavior. The duration of the 1st instar stage was 6-10 (± 6.67) days with a length of 4-5 (± 4.47) mm. The 1st instar larvae gathered in groups, were active and attracted to light. Larvae move towards a light, forming a large group of larvae. The larval cuticle was shed after 6-7 days representing the second instar stage (Figure 1c).
The duration of the 2nd instar larvae was 8 - 14 (± 9.83) days with a length of 4-7 (± 5.48) mm . The 2nd instar did not immediately bore into the diet, but bored slowly from the surface, finally entering and gnawing into the medium (Figure 1e).
The duration of the 3nd instar larvae was 9 - 18 (± 12.80) days with a body length of 5 - 12 (± 7.33) mm. The 3rd instar larvae started to form a silken filament (smooth threads) on the surface of the media or under the cap of the tube. These threads were used as protection and a way for the larvae to reach the tube cap. The 3rd instar larvae bored into the diet more actively than the 2nd instar, in accordance with the results of the study by Capinera (2009) which states that third instar of Diatraea saccharalis larvae began to bore.
The duration of 4th instar larvae was 10 - 17 (± 12.40) days with a body length of 8-13 (± 9.50) mm. The 4th instar larvae already active bored, with the surface of the media perforated by holes. The 4th instar larvae also formed smooth threads (Figure 1a) around tube cap and sometimes rose to the surface of the media.
There was not much difference in the behavior of the 5th and 6th instars larvae. They actively bored and more often were under the tube cap which could be seen from the larval cuticle which was left above the surface of the diet and not in the diet. The duration of the 5th instar larvae was 10 - 16 (± 12.60) days with a body length of 10 - 17 (± 12.27) mm, while the 6th instar larval stage was 10 - 18 (± 11.87) days with a body length of 11 -19 (± 13.53) mm.
Figure 1. Smooth threads (silken filaments) made by 4th instar larvae (a), 7th instar larvae turned over to shaped like the letter C in the diet (b), 2nd instar larvae which change the cuticle (c) the hoist hole made by 7th instar larvae (d), 2nd instar bored the diet (e), cuticle of P. castaneae from 1st to 9th instar (f)
The 7th and 8th instar larvae also had similar behaviors and predominantly emerged in
the diet (Figure 1d). This was indicated by the larval cuticle being inside the diet. However, this does not rule out the possibility of larvae emerging on the surface of the diet or under the tube cap. The duration of the 7th instar larvae was 12 - 20 (± 12.47) days with a body length of 14 - 23 (± 15.60) mm, while larval 8th instar was 13 - 18 (± 12.47) days with a body length of 17 - 24 (± 17.13) mm. The movement patterns of these larvae move was very unique besides emerging in the diet while moving forward or backward, the larvae was also turned over to shaped like the letter C (Figure 1b) to reverse direction.
The 9th instar larvae displayed behavior similar to the 6th and 7th instar larvae and spent more time on the surface of the media and under the cap of tube depositing smooth threads (silken filaments) that will protect the larvae when going into a pupae. The duration of the 9th
aa
ba
ca
ca
da
ea
fa
10 International Seminar on Biological Sciences (ISBS - 2015)
instar larvae was 12 - 18 (± 13.4) days with a length of 19 - 27 (± 18.40) mm. The larvae stayed young as indicated by a thin and transparent cuticle, and were very
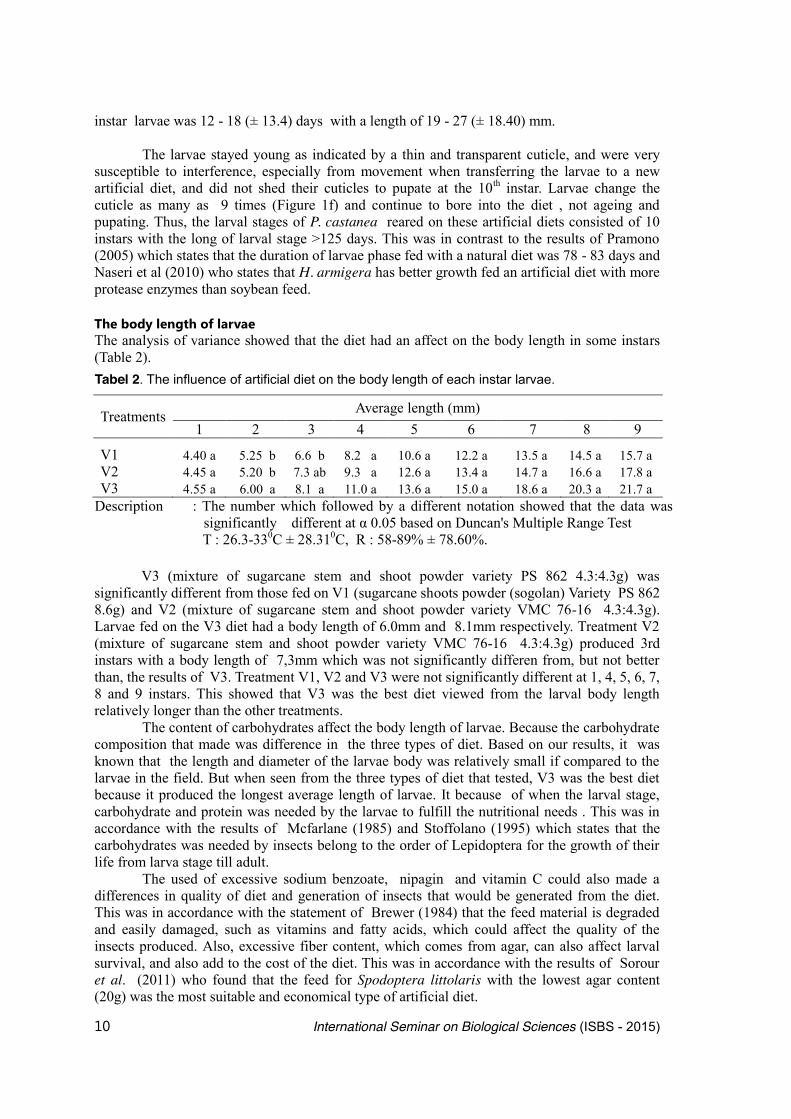
susceptible to interference, especially from movement when transferring the larvae to a new artificial diet, and did not shed their cuticles to pupate at the 10th instar. Larvae change the cuticle as many as 9 times (Figure 1f) and continue to bore into the diet , not ageing and pupating. Thus, the larval stages of P. castanea reared on these artificial diets consisted of 10 instars with the long of larval stage >125 days. This was in contrast to the results of Pramono (2005) which states that the duration of larvae phase fed with a natural diet was 78 - 83 days and Naseri et al (2010) who states that H. armigera has better growth fed an artificial diet with more protease enzymes than soybean feed. The body length of larvae The analysis of variance showed that the diet had an affect on the body length in some instars (Table 2).
From the data in Table 2, it can be seen that the growth of larvae fed on artificial diet
V3 (mixture of sugarcane stem and shoot powder variety PS 862 4.3:4.3g) was significantly different from those fed on V1 (sugarcane shoots powder (sogolan) Variety PS 862 8.6g) and V2 (mixture of sugarcane stem and shoot powder variety VMC 76-16 4.3:4.3g). Larvae fed on the V3 diet had a body length of 6.0mm and 8.1mm respectively. Treatment V2 (mixture of sugarcane stem and shoot powder variety VMC 76-16 4.3:4.3g) produced 3rd instars with a body length of 7,3mm which was not significantly differen from, but not better than, the results of V3. Treatment V1, V2 and V3 were not significantly different at 1, 4, 5, 6, 7, 8 and 9 instars. This showed that V3 was the best diet viewed from the larval body length relatively longer than the other treatments.
The content of carbohydrates affect the body length of larvae. Because the carbohydrate composition that made was difference in the three types of diet. Based on our results, it was known that the length and diameter of the larvae body was relatively small if compared to the larvae in the field. But when seen from the three types of diet that tested, V3 was the best diet because it produced the longest average length of larvae. It because of when the larval stage, carbohydrate and protein was needed by the larvae to fulfill the nutritional needs . This was in accordance with the results of Mcfarlane (1985) and Stoffolano (1995) which states that the carbohydrates was needed by insects belong to the order of Lepidoptera for the growth of their life from larva stage till adult.
The used of excessive sodium benzoate, nipagin and vitamin C could also made a differences in quality of diet and generation of insects that would be generated from the diet. This was in accordance with the statement of Brewer (1984) that the feed material is degraded and easily damaged, such as vitamins and fatty acids, which could affect the quality of the insects produced. Also, excessive fiber content, which comes from agar, can also affect larval survival, and also add to the cost of the diet. This was in accordance with the results of Sorour et al. (2011) who found that the feed for Spodoptera littolaris with the lowest agar content (20g) was the most suitable and economical type of artificial diet.
Tabel 2. The influence of artificial diet on the body length of each instar larvae.
Treatments Average length (mm) 1 2 3 4 5 6 7 8 9
V1 4.40 a 5.25 b 6.6 b 8.2 a 10.6 a 12.2 a 13.5 a 14.5 a 15.7 a V2 4.45 a 5.20 b 7.3 ab 9.3 a 12.6 a 13.4 a 14.7 a 16.6 a 17.8 a V3 4.55 a 6.00 a 8.1 a 11.0 a 13.6 a 15.0 a 18.6 a 20.3 a 21.7 a
Description : The number which followed by a different notation showed that the data was significantly different at α 0.05 based on Duncan's Multiple Range Test
T : 26.3-330C ± 28.310C, R : 58-89% ± 78.60%.
International Seminar on Biological Sciences (ISBS - 2015) 11
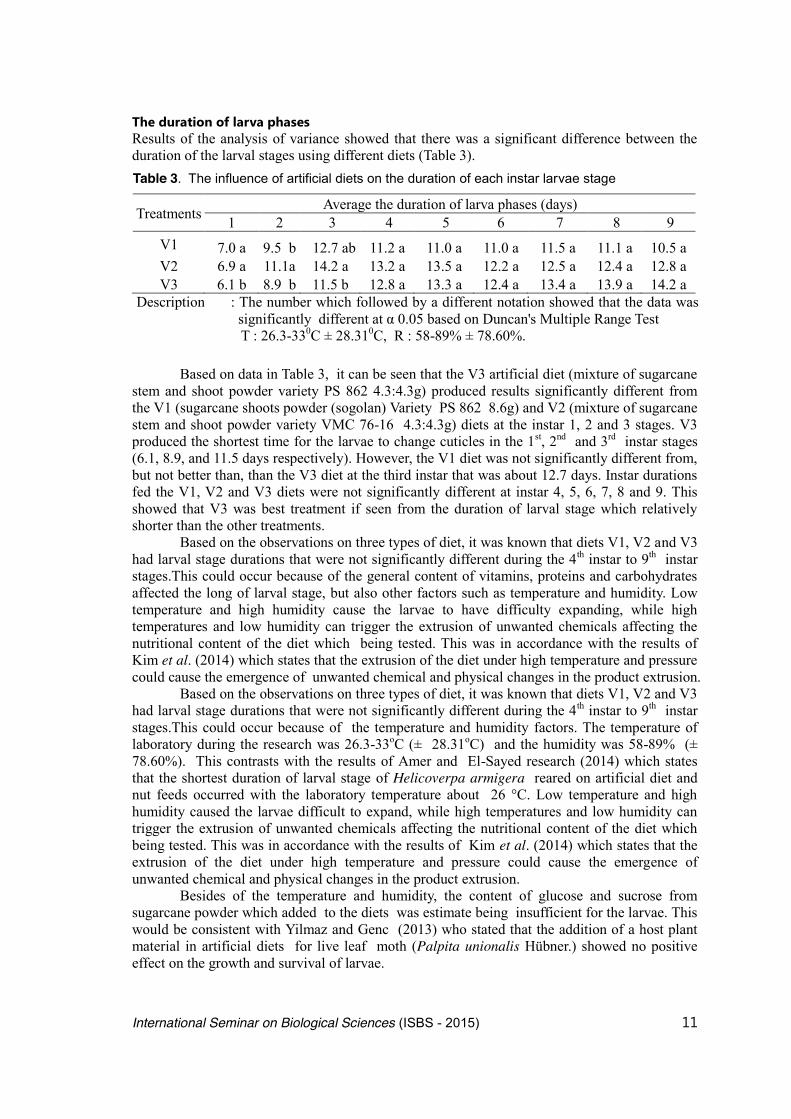
The duration of larva phases Results of the analysis of variance showed that there was a significant difference between the duration of the larval stages using different diets (Table 3).
Based on data in Table 3, it can be seen that the V3 artificial diet (mixture of sugarcane
stem and shoot powder variety PS 862 4.3:4.3g) produced results significantly different from the V1 (sugarcane shoots powder (sogolan) Variety PS 862 8.6g) and V2 (mixture of sugarcane stem and shoot powder variety VMC 76-16 4.3:4.3g) diets at the instar 1, 2 and 3 stages. V3 produced the shortest time for the larvae to change cuticles in the 1st, 2nd and 3rd instar stages (6.1, 8.9, and 11.5 days respectively). However, the V1 diet was not significantly different from, but not better than, than the V3 diet at the third instar that was about 12.7 days. Instar durations fed the V1, V2 and V3 diets were not significantly different at instar 4, 5, 6, 7, 8 and 9. This showed that V3 was best treatment if seen from the duration of larval stage which relatively shorter than the other treatments.
Based on the observations on three types of diet, it was known that diets V1, V2 and V3 had larval stage durations that were not significantly different during the 4th instar to 9th instar stages.This could occur because of the general content of vitamins, proteins and carbohydrates affected the long of larval stage, but also other factors such as temperature and humidity. Low temperature and high humidity cause the larvae to have difficulty expanding, while high temperatures and low humidity can trigger the extrusion of unwanted chemicals affecting the nutritional content of the diet which being tested. This was in accordance with the results of Kim et al. (2014) which states that the extrusion of the diet under high temperature and pressure could cause the emergence of unwanted chemical and physical changes in the product extrusion.
Based on the observations on three types of diet, it was known that diets V1, V2 and V3 had larval stage durations that were not significantly different during the 4th instar to 9th instar stages.This could occur because of the temperature and humidity factors. The temperature of laboratory during the research was 26.3-33oC (± 28.31oC) and the humidity was 58-89% (± 78.60%). This contrasts with the results of Amer and El-Sayed research (2014) which states that the shortest duration of larval stage of Helicoverpa armigera reared on artificial diet and nut feeds occurred with the laboratory temperature about 26 °C. Low temperature and high humidity caused the larvae difficult to expand, while high temperatures and low humidity can trigger the extrusion of unwanted chemicals affecting the nutritional content of the diet which being tested. This was in accordance with the results of Kim et al. (2014) which states that the extrusion of the diet under high temperature and pressure could cause the emergence of unwanted chemical and physical changes in the product extrusion.
Besides of the temperature and humidity, the content of glucose and sucrose from sugarcane powder which added to the diets was estimate being insufficient for the larvae. This would be consistent with Yilmaz and Genc (2013) who stated that the addition of a host plant material in artificial diets for live leaf moth (Palpita unionalis Hübner.) showed no positive effect on the growth and survival of larvae.
Table 3. The influence of artificial diets on the duration of each instar larvae stage
Treatments Average the duration of larva phases (days) 1 2 3 4 5 6 7 8 9
V1 7.0 a 9.5 b 12.7 ab 11.2 a 11.0 a 11.0 a 11.5 a 11.1 a 10.5 a V2 6.9 a 11.1a 14.2 a 13.2 a 13.5 a 12.2 a 12.5 a 12.4 a 12.8 a V3 6.1 b 8.9 b 11.5 b 12.8 a 13.3 a 12.4 a 13.4 a 13.9 a 14.2 a
Description : The number which followed by a different notation showed that the data was significantly different at α 0.05 based on Duncan's Multiple Range Test
T : 26.3-330C ± 28.310C, R : 58-89% ± 78.60%.

12 International Seminar on Biological Sciences (ISBS - 2015)
Overall the duration of larva stage of P.castaneae on artificial diet was > 125 days, and
this is longer to the natural feeding where the durations is only 78-83 days (Pramono, 2005). This is in accordance with the literature of Kashyap et al. (2008) which states that the period of potato tuber moth larvae (Phthorimaea operculella) was longer than the results of the study by Singh and Charles (1977) which states that these differences occur due to differences in reared conditions. Percentage of Larval Mortality Results of the analysis of variance showed that there were a real significant differences in mortality rates among larvae fed the different types of artificial diet at some instar stages (Table 4).
Based on the observation, it can be seen that the lowest percentage of larval mortality
till the 9th instar was in V3 treatment about 35% and the highest was in V1 treatment about 65%. This indicated that the V3 was fit to use as an artificial diet for the propagation of P. castaneae at the larval stage because of the percentage of mortality was relatively low < 50%. However, this diet still need a further research because the larvae were used as the research object did not turn into a pupa despite its age had exceeded the age at natural feed, that was 78-83 days on natural feed (Pramono, 2005) while in the artificial diet, the larvae did not be a pupae though the age of the larvae had reached > 125 days. This was thought to occur because the nutrient composition of the diet that had been made did not appropriate to larvae growth to be a pupa or imago until eventually produce the eggs. There was possibly a nutritional deficiency or excess of either carbohydrates, vitamins, proteins and fatty acids and other chemical substances that caused the larvae stay young and did not want to change into a pupa. This was appropriate with the statement of Ojeda et al. (2003) which states that the diet which had a low water content and low protein positively correlated to the fat content in the larvae, pupae and adults while the diet with a low content of sucrose caused the larvae thin and slim.
Temperature and humidity of the propagation chamber were also factors that affected larval mortality. Low temperatures and high humidity could cause the larvae having difficulty in developing, while high temperatures and low humidity can trigger extrusion of unwanted chemicals, causing changes in the nutritional content of the diet being tested. In addition, if the temperature was too low or too high this could stress the larvae, causing the larvae be increasingly sensitive to the microclimate of the propagation chamber. This would be in accordance Beuzalin (2011) which states that the temperature which reach or more than 340C can cause 95% mortality of larvae.
In conclusion, larval period was >125 days with 10 instars. Mixture of sugarcane stem and shoot powder variety PS 862 4.3 : 4.3 g was significantly different to the body length of larvae was at 3rd (± 6.00) mm and 4th instar (± 8.1) mm, the duration of larvae phases was at 1st
Table 4. The influence of artificial diet on mortality at different instar stages
Treatments Mortality (%) 1 2 3 4 5 6 7 8 9
V1 20 a (n=4)
30 a (n=6)
40 a (n=8)
50 a (n=10)
60 a (n=12)
60 a (n=12)
65 a (n=13)
65 a (n=13)
65 a (n=13)
V2 25 a (n=5)
35 a (n=7)
35 a (n=7)
40 ab (n=8)
45 a (n=9)
45 ab (n=10)
50 ab (n=10)
60 a (n=12)
60 a (n=12)
V3 0 b (n=0)
10 a (n=2)
20 a (n=4)
20 b (n=4)
25 b (n=5)
30 b (n=6)
30 b (n=6)
35 b (n=7)
35 b (n=7)
Description : The number which followed by a different notation showed that the data was significantly different at α 0.05 based on Duncan's Multiple Range Test;
n = Total of mortal larvae from 20 tested larvae T : 26.3-330C ± 28.310C, R : 58-89% ± 78.60%.

International Seminar on Biological Sciences (ISBS - 2015) 13
(± 6,1) days, 2nd (± 8.9) days and 3rd instar (± 11.5) days and the percentage of larva mortality was at 1st (0%), 4th (20%), 5th (25%), 6th (30%), 7th (30%), 8th (35%) and 9th instar (35%). This is the first time that P. castaneae has been laboratory reared on artificial diets to late larval stages, but further research is required to perfect the diet and rearing protocol in order to produce fertile adults. Acknowledgement The author thank to anonymous reviewers for useful suggestions on the earlier version of the manuscript. This research was based partly on the undergraduate thesis of Erick S. Dongoran, supervised by Maryani Cyccu Tobing and Suzanna Fitriany Sitepu and and to all staff official at Sei. Semayang Centre for Research and Development of Sugarcane PTPN II Medan. References Amer, A. E. A. dan A. A. A. El-Sayed. (2014): Effect of Different Host Plant and Artificial Diet on
Helicoverpa armigera Hubner. (Lepidoptera: Noctuidae) Development and Growth Index. J. Acd. Entomol. 10:3923.
Beuzelin, J. M. (2011): Agroecological factors impacting stem borer (Lepidoptera: Crambidae) dynamic in gulf coast sugarcane and rice. Dissertation. Department of Entomology, Louisiana State University.
Blanco, C.A., A.P. Teran-Vargas, C.A. Abel, M. Portilla, M.G. Rojas, J.A. Morales-Ramos, and G.L. Snodgrass. (2008): Plant host effect on the development of Heliothis virescens F. (Lepidoptera: Noctuidae). Environm. Entomol. 37:1538-1547.
Brewer, F. D. (1984): Ingredients for insect diets. Quality assurance, sources, and storage and handling. Advances and challenges in insect rearing, ARS, USDA, New Orleans, Louisiana.45-50.
Capinera, J. L. (2009): Life cycle of Diatraea saccharalis (Fab.) (Insecta: Lepidop- tera: Pyralidae). Entomology and Nematology Departement, University of Florida.
CPS. (2015): Commodity Profile of Sugar for August 2015. Downloaded from http://www.agricoop.nic.in/imagedefault/.../SugarNew29.pdf (18 Agustus 2015).
Kashyap, S., S. K. Chakrabarti, D. Pattanayak, K.P. Chandran, D.C Gautam, V.K. Chandla and P.S. Naik. (2008): A modified of artificial diet for rearing potato tuber moth, Phthorimaea operculella (Zeller). J. Potato. 35(3-4):141-146.
Kim, S., S. Hong., H. Park., Y. Lee, K. Park, W. Choi dan N. Kim. (2014): An artificial diet for the swallowtail butterfly, Papilio xuthus. Int. J. Indust. Entomol. 28(1):1-4.
Mcfarlane, J.E. (1985): Nutrition and digestive organs. (ed). Blum, M.S. Fundamentals of Insect Physiology. Department of Entomologi Macdonald Collage of McGill University Quebec, Canada.. A Willey-Interscience Publication. Canada. 77pp.
Naseri, B., Y. Fathipour, S.Moharramipour, V. Hosseininaveh And A. M. R. Gatehouse. (2010): Digestive proteolytic and amylolytic activities of Helicoverpa armigera in response to feeding on different soybean cultivars. Pest Management Science, 66:1316-1323.
Ojeda, T. A., H. A. Woods and R. A. Raguso. (2003): Effects of dietary variation on growth, composition, and maturation of Manduca sexta (Sphingidae: Lepidoptera). J. of Insect Physiol. 43:293-306
PDIP. (2015): Sugarcane. Brief information of Plantation Commodities. Commodities. Data sector, Field and Information Agriculture Systems Centre. Department of Agriculture, South Jakarta.
Pramono, D. (2005): Series of Processing Integrated Sugarcane Pest. 2. Agricultural series Dioma, Malang.
14 International Seminar on Biological Sciences (ISBS - 2015)
Purnama, A. (2001): Control of Sugarcane Stem Borer (P. castaneae). Deli Tobacco Research section. PT. Nusantara Plantation II. pp.1-3.
Saragih, R., B. Zuraida and Z. Abidin. (1986): Breeding of S. inferens Towns and the ability to parasitiation P. castaneae Hub. Proceedings of the Scientific Meeting of Entomology Indonesia Plantation. Medan. 22 to 24 April 1986. pp.141-146.
Singh., Pritam and J.G. Charles. (1977): An artificial diet for the larvae of potato tuber moth. J. NZ. Zool. 4: 449-51
Sorour, M. A., O. Khamiss, A. S. Abd El-Wahab, M. A.K. El-Sheikh and 3S. Abul-Ela. (2011): An Economically Modified Semi-Synthetic Diet for Mass Rearing the Egyptian Cotton Leaf Worm Spodoptera littolaris J. Acd. Entomol. 4 (3):118-123.
Steel, R. G. D and J. H. Torrie. (1989): Principles and Procedures of Statisties, A Biometrical Approach. Mc. Graw-Hill Kogakusha Ltd., Tokyo.
Stoffolano, Jr. J.G. 1995. Regulation of a Meal in dipteral, Lepidoptera, and Hymenoptera. (ed). Chapman. R.F., and G. de Boer. Regulatory Mechanism in Insect Feeding. Champan and Hall USA. 226pp.
Yilmaz, C dan H. Genc. (2013): The First Attempt to Rear Olive Leaf Moth (Palpita unionalis Hübner. (Lepidoptera: Pyralidae) on Artificial Diet. J. Biol. Environ. Sci. 7(19):25-32.

International Seminar on Biological Sciences (ISBS - 2015) 15
Morphological Changes Of Binahong Plant (Anredera cordifolia (Ten) Steenis) Induced By Mutagen Colchicine
Bayu, E. S*1, Diana, S.H.1, Rosida, M.1 and A. H. Olivia2
1) Department of Agrotechnology, Faculty of agriculture , University of Sumatera Utara, Indonesia, Jl Prof A
Sofyan no 3 Kampus USU, Medan 20155 *E-mail: [email protected]
2) Department of Oral and Maxillofacial, Faculty of Dentistry,University of Sumatera Utara
ABSTRACT Binahong known as a plant haveing spectacular advantages which contains saponin compound on all its part,such as tuber, stem, leaves and roots that could be us as herbal therapy. Medical plant in domestic region become an alternatif treatment for prevention or cureration of various diseases . Binahong plant will become one of potential medical plant as material resouses in phythofarmaco industry. It is low genetic variant of binahong plant, therefore effort is needed to improve the availability of species as well as quality to meet the needs. One of the effort is by using chemical mutagent: colchicine. Therefore, this study aimed to investigate the effect of colchine on morphologycal changes of binahong plant. Colchicine concentration of 0,075% ( K3) and 0.1 % ( K4 ) influenced the number of leaves perform in 4 weeks, increased the roots wet weigh, root dry weight, and shoot weight of binahong plant. At colchicine concentration of 0,05 % ( K2 ) morphology traits better than others.
Keywords : binahong plant, colchicine, mutagen INTRODUCTION Binahong (Anredera cordifolia (Ten) Steenis of the Basellaceae family is one of medicinal plant that grows very well since long time ago. It has been widely cultivated as an ornamental vine in tropical regions of the world. Binahong plant native from Brazil and its common names is Madeira vine or Mignonette vine (Wagner et.al, 1999). Binahong plant have not familiar yet In Indonesia, but this plant was necessary food in Vietnam society (Ferri, 2009) and frequently used as vegetables in Taiwan (Mao-Te et. al, 2007).This plant known to have extraordinary healing, and it has been consumed over thousands years by the nation of China, Korea, Taiwan (Ferri, 2009). Almost all parts of this plants such as bulbs, stems and leaves can be used in herbal therapy (Yuswantina, 2009) and (Ferri, 2009). Mimi Sakinah et. al (2011) reported that the binahong plant had importance distribution of determination saponins compound that potential for treating several diseases. It was widely believe that spontaneous mutation have played a major role in speciation. The discovery of mutagens provided the opportunity to test these hypothesis. Chemical mutagen are generally milder in their effect on plant material. They can be applied easily, without complicated equipment or facilities. The ratio of mutation of undesirable modification is generally higher by cemical mutagen than physical mutagen. Plant breeders often need to manipulate the chromosom number, the most common chemical mutagen used is colchicine, produce gene mutagen and less chromosom damage (Acquaah, 2007). Initial studies on induced mutation were mainly directed to finding optimum combination of mutagen dose to elicit the best response tested in binahong plant which would be critical for mutation breeding work.

16 International Seminar on Biological Sciences (ISBS - 2015)
MATERIAL AND METHODS The plant material used for present investigation were binahong tubers collected at nodes on aerial stem. Aerial tubers are small irregular ‘warty’ light brown or green in colour and variable size from 2,5 to 3 cm in diameter. Plant material growth in nursery box for one week and transplanted in polybag. The polybags placed on block trial consist of six plants per plot with five replication. The doses of colchicine treatment consist of five level (K0: 0%, K1: K1:0,025%)., K2: 0,05%, K3: 0,075%, K4: 0,1%). Application of colchicine has done after two weeks applied to apical meristem of binahong using pipett with 10 ml volume. This application applied two times a day for two days. RESULTS AND DISCUSSION After two months, binahong plants were investigated for morphological change and growth. Figure 1 showed that the morphology of binahong leaves change in size at K2 treatment compared to other control . Figure 1. Morphology of binahong leaves from all colchicine treatment (K0: 0%, K1: 0,1%, K2:
0,075%, K3: 0,05%, K4: 0,025%)
After two months, binahong plants were investigated for morphological change and growth. Figure 1 showed that the morphology of binahong leaves change in size at K2 treatment compared to control, K1, K3 and K4 treatments. Many treated plants showed some disorders in the growth and changes of leaf shape or colour. Survival rate was lower and the growth rate and the rate of development disorders were higher with higher colchicine concentration and more application of solution within a treatment (Astuti et al., 2011). Based on (Jadrna et al. 2010) research, morphological changes of colchicine treated plants were evaluated by comparing the plants with control plants that high uniformity in growth and size, example in binahong tubers.
Table 1. Means of number of leaves, fresh weight of shoot, dry weight of shoot, fresh weight of
root and dry weight of root.
Parameters Concentration of Colchicine K0 (0%) K1 (0,025%) K2 (0,05%) K3 (0,075%) K4 (0,1%) Number of leaves
13,33a 9,20c 11,46b 9,13c 10,00c
Fresh weight of shoot (g)
122,47b 114,59b 147,34a 110,59b 101,05b
Dry weight of shoot (g)
56,27b 50,24bc 72,27a 50,02bc 42,90c
Fresh weight of root (g)
11,12ab 10,37ab 12,31a 8,84b 8,90b
Dry weight of root (g)
5,23ab 4,90ab 6,12a 4,10b 4,24b
Note : Numbers follow by the same notation on the same column non significantly difrent by Duncan’s Multiple Range Test on 5% Table 1 showed that number of leaves at K2 treatment have increased compared to other
K0
K1
K2
K3
K4

International Seminar on Biological Sciences (ISBS - 2015) 17
colchicine treatment although this number of leaves were lower than control treatment. Based on the fresh and dry weight of shoot parameter indicated that K2 treatment gave significantly effect on enhaced fresh and dry weight of shoot growth. Higher colchicine concentration were decresed fresh and dry weight of shoot. The optimum concentration of colchicine at K2 treatment gave the best response on fresh and dry weight of root binahong plant. Wang et al., (1989) stated that the inhibitory effects of colchicine on plantlet showed variations in leaf thickness, leaf colour, bulb size and other atrributes. Higher colchicine concentration were decresed fresh and dry weight of shoot. The optimum concentration of colchicine at K2 (0,05%). Applying colchicine solution on the apices aerial fully tubers binahong plant for two days was succesfully in inducing morphogenetics changes. References Acquaah, G. (2007): Principle of plant genetice and breeding, Black well publishing pp 199-213. Astuti, S. M., Sakinah, M. A.N., Andayani, R. B. N., Ricsh, A. 2011. Determination of saponin
compound from Anredera cordifolia (Ten) steenis plant (Binahong) to potential treatment for several disease. Journal of agricultural science. Vol. 3. No. 4. December 2011.
Ferri Manoi. (2009): Binahong (anredera cordifolia) sebagai obat. Buletin Warta Volume 15, Number 1, April 2009. Penelitian dan pengembangan tanaman industri. Badan penelitian dan pengenbangan pertanian. Pusat penelitian dan pengembangan perkebunan. Indonesia.
Jadrna, P., Plavcova, O., and Kobza, F. (2010): Morphological changes in colchicine-treated pelargonium x hortorum L.H. bailey greenhouse plant. Hort. Sci. (Prague), 37: 27-33.
Mao-Te, Chuang, Yin Shiou Lin and wen-chi. Hou. (2007): Ancorda, the major rhizome protein of madeira-vine with trypsin inhibitory and stimulatory activitice in nitric oxide production. Peptida. Volume 28. Issue 6 Juni 2007. P:1311-1316 Elsevier.
Mimi Sakinah. A. M., Retno Andayani, B. M., Awalludin Risch. (2011): Determination of saponin compound from Anredera cordifolia (Ten) steenis plant (Binahong) to potential treatment for several diseases. Jourla of agricultural science. Vol. 3. No. 4. December 2011.
Wagner, W. L., D. R. Herbst, and S. H. Sohmer. (1999): Manual of the flowering plants of hawai’i. 2 Vols. Bishop museum special publication 83. University of hawai press and bishop museum press. Honolulu, HI.
Wang, Y. F., Xi . Y. L., Wei, Z. C and Lu, W. Z. (1989): The effects of gamma rays and colchicine on mutagenesis in somaclonal of lilium davidii var willmottiae. Jiangsu-journal-of-agricultural-science 5 : 31-37.
Yuswantina, R. (2009): Uji aktivitas penangkap radikal dari ekstrak petroleum ether, etil, acetat, dan ethanol, rhizome binahong (Anredera cordifolia (Tenore) Steen) dengan metode DPPH (2,2-Difenil-1-1 picril hidrazil). Skripsi Fak. Farmasi universitas muhammadyah surakarta, Indonesia.

18 International Seminar on Biological Sciences (ISBS - 2015)
Composition of Macroalgae in Kasiak Gadang Island, Nirwana Beach, Padang, West Sumatra, Indonesia
Hadi, F.*, Zakaria, I. J. and Z. Syam
Department of Biology, Faculty of Mathematic and Natural Science Andalas University, Padang,
West Sumatra, Indonesia, 25163. *E-mail: [email protected]
ABSTRACT This research aimed to know the composition of macroalgae in Kasiak Gadang Island, Nirwana Beach, Padang, West Sumatra, Indonesia. This research was conducted at October to December 2014 using a Line Transect or Belt Transect at 4 stations. There were 5 species of macroalgae detected in Kasiak Gadang Island that consisted of 2 groups, Chlorophyta and Phaeophyta. In the Chlorophyta group, there is Halimeda sp. and Padina minor, Sargassum crassifolium, Sargassum cristaefolium, and Turbinaria decurrens belong to group of Phaeophyta. Keywords: Composition, Chlorophyta, Kasiak Gadang Island, Macroalgae, Phaeophyta. INTRODUCTION Indonesia is an archipelago consisting of 17,508 islands with a total coastline over 81,000 km. It has enormous potential includingsustainable and unsustainable resources that are highlyproductive. One of the sustainable resources is Macroalgae. It canbe used for food and economy to help increasing human prosperity(Bengen, 2000). One of the sustainableresources that has important role for marine life is macroalgae. Macroalgae is a low-level, multicellularplantfrom division Thallophyta.According to Smith (1962),based on pigment of photosynthesis, macroalgaebe divided into 3 divisions: Chlorophyta, Phaeophyta and Rhodophyta. There are 782 speciesknown to occur in Indonesia beaches, but not all of them had been used for human comsumption due to lack of knowledge (Anggadireja et al., 2009).
Macroalgae or seaweeds are similar in form with the higher vascular plants, but the structure and function differs significantly from the higher plants. Macroalgae do not have true roots, steam or leaves. The whole body of the plant (i.e., thallus) consist of the holdfast, stipe and blade. The holdfast resembles the root of higher plants but its function is for attachment and not for nutrients absorption. The stipe resembles the stem of the higher plants but its function is for support the blade for photosynthesis and nutrients absorption. The blade resembles leaves of the higher plant and functions for photosynthesis and nutrients absorption(Dhargalkar, 2004). The holdfast of macroalgae had variable forms, there are discoidal, rhizoidal, and bulbous or branched depending on the substratum it attaches (Dhargalkar, 2004). Types of branching macroalgae include filament, dichotomous, trichotomous, pinnate alternate, pinnate distichous, monopodial, etc (Aslan, 1998). The blades have variable forms that include smooth, perforated, segmented, dented, etc. (Dhargalkar, 2004)
Macroalgae had important roles in the marine environment. Macroalgae is one of the primary producers in marine environment. Presence of this organism can be used as food resource, protector for small plants and animal in the sea such assmall fish and microscopic communities. Historically, macroalgae had been use human consumption, and medicine. Beside that, macroalgae also can be processed and developed into commercial products from any other macroalgae sap like ’pudding’, material of pharmacy industry and cosmetics also non-oil export material (Serediak et al., 2011).Some macroalgae used by humans also have economic value in Indonesia like Gracilaria sp., Gelidium sp., andHypnea sp.(Aslan, 1998). These species has been used as export commodities. There are also some macroalgae that produce gelatin. Macroalgae that can produce carrageenan are Euchema spinosum, Euchema cotonii, Euchema

International Seminar on Biological Sciences (ISBS - 2015) 19
striatum. And macroalgae that can produce alginate are Sargassum sp. Macrocystis sp. dan Lessonia sp. (Aslan, 1998). Currently, some of culinary industry in Japan, Korea, andany other foreigncountries have been increasing and developing the value of the food intake of macroalgae. With this, using macroalgae as material for healthy food keeps increasing, and product development from macroalgae is starting to grow. All of this can happen because mineral wealth and essential elements content in macroalgae is more than terrestrial food plants (Brownlee et al., 2012).
Frequency and density of seaweed is very important to becomeprimary producer, food resources, habit and place for organisms that are looking for food in marine ecosystem such as Crustacea, Mollusca, Echinodermatha, fish and alsoresources for human life. The type of life style for macroalgae is called “rumpun”, which protects for minute marine organisms from areas of high wave action (Campbellet al., 2008).
The distribution of maroalgaeis limited to thelitoral zone and sub-litoral zone where the sunlight still penetrates. This is important because adequatesunlight can be used by macroalge for photosynthesis. Macroalgae occur in the litoral zone due to the presences of stone and rocks. Macroalgaeare less likely to occur in habitats dominated bymud and sand (Connaughey and Zottoli, 1983).Distribution for macoralgae also had been found in some islands at Padang City.
Padang city is a capital city of West Sumatra that located at west coast Sumatra. Padang city had 19 small islands and shoreline. One of this small island is Kasiak Gadang Island. Based on administration, this island had coordinate 1° 1'8.30" South Latitude and 100°21'45.71" East Longitude.The island has an area of approximately 1 ha (Dinas Pariwisata Kota Padang, 2013). In this island had extensive beds ofmacroalgae. During low tide,macroalgaeis evident in coastal waters. However, there are no detailed inventories ofmacroalgaeon this island. This paper describesthe morphologyofseaweeds surrounding Kasiak Gadang Island, Nirwana Beach, Padang, West Sumatra, Indonesia.
MATERIAL AND METHODS This research was conducted at May to November 2014 in Kasiak Gadang Island, Nirwana Beach, Padang, West Sumatra Indonesia (Figure 1). Identification of macroalgae was conducted at theLaboratory of Research for Plants and Animals Ecology at Biology Department, Faculty of Math and Natural Sciense, Andalas University, Padang.The material needed in this research were plastic bags, knife, labelling materials (pencils, pen, labels and marker pens), field note book, long rope (about 50 m long), and quadrant 0.25 m2.
Surveys were conducted using line transect and belt transect method. A line (long rope) was laid perpendicular to the coast from high tide to the low tide. Sampling pointsusing belt transect 0.25 m2 placed systematically along the rope that can be marked depending on the gradient and the expanse of the intertidal area. Sampling point were marked at 5 m intervals along the rope. The island was divided into 4 station sampling areas, with each station was taken 3 line transect(English etal., 1994). All of the Stationsare: Station I at North-East of the Island, Station II at South-East of the Island, Station III at North-West of the Island and Station IV at South-West of the Island (Figure 2).
Samples of macroalgae collected from this island wereidentified using identification keys at species-level morphologically based on Carpenter and Niem (1998).

20 International Seminar on Biological Sciences (ISBS - 2015)
. Figure 1. Location of Kasiak Gadang Island, Nirwana Beach, Padang, West Sumatra, Indonesia
Figure 2. Location of Sampling Stations in Kasiak Gadang Island, Padang
STATION 1
STATION 2
STATION 3
STATION 4

International Seminar on Biological Sciences (ISBS - 2015) 21
RESULTS AND DISCUSSION Table 1. Classification of Seaweeds in Kasiak Gadang Island, Nirwana Beach, Padang.
Division Class Order Family Genus Species Phaeophyta Phaeophyceae Dictyotales Dictyotaceae Padina Padina minor Yamada, 1925
Fucales Sargassaceae Sargassum Sargassum crassifolium J. Agardh, 1848
Sargassum cristaefolium C. Agardh, 1820
Turbinaria Turbinaria decurrens Bory de Saint Vincent, 1828
Chlorophyta Chlorophyceae Bryopsidales Halimedaceae Halimeda Halimeda SP 1.
There were 5 species of seaweeds in Kasiak Gadang Island (Table 1), which were divided into 2 groups. The first group was Chlorophyta that included Halimeda sp.The second group was Phaeophyta that included Padina minor, Sargassum crassifolium, Sargassum cristaefolium and Turbinaria decurrens. On Padina minor was detected at all sampling stations, where Sargassum crassifolium and Halimeda sp. were detected at 50% of stations (Table 2). Table 2. Location of Macroalgae in Kasiak Gadang Island, Nirwana beach, Padang.
Division Species Sampling Station
I II III IV
Phaeophyta Padina minorYamada, 1925 + + + + Sargassum crassifolium J. Agardh, 1848 + + + + Turbinaria decurrensBory de Saint Vincent, 1828 - + + +
Sargassum cristaefolium C. Agardh, 1820 - + - + Chlorophyta Halimeda sp. - + - +
Note: “+” means found, “-“ means not found Here is the description of macroalgae had been found in Kasiak Gadang Island, Nirwana Beach, Padang.
Figure 3. Padina minor Yamada, 1925 (Brown Sea Fan) Description: Thallus fan-shaped. Yellowish brown to light brown. Blade divided into lobes and hardless. Lower surface of blade divided into concentric zone by hairlines. Blade size 62,15 mm (6,25 cm) in height. Attached to solid substrate on reef flat like rocks and boulder.Padina minor is in the group of Phaeophyta because it had colour of yellowish brown. Padina minor had characteristic: thallus is not large and fan-shaped. But sometime this thallus can become large.

22 International Seminar on Biological Sciences (ISBS - 2015)
Thallus is not erect. Blade divided in to lobes and also lower surface of blade divided into concentric zones by hairlines. The colour of this hair lines is black. Blade size 62,15 mm (6,2 cm) in height. Everything in this description is same with Carpenter and Niem (1998). Padina minor had thallus fan-shaped, yellowish brown to light brown. Blade divided into lobes. Lower surface of blade divided into concentric zones by hairlines which are equidistant from each other. The Blade up to 10 cm in height.
Figure 4. Sargassum crassifolium J. Agardh, 1848 (Common Pacific Sargassum) Description: Thallus large. Yellowish brown. Attached to rocky substrates, discoid holdfast. Enlarge at the base. Branches smooth and secondary branches irregularly alternate on the primary branches. Primary and Secondary Blades are vertically attached and hardless. Length of blades around 32,65 – 36,05 mm (3,265 – 3,605 cm). Weidth of blades around 11,85 – 14,75 mm (1,185 – 1,475 cm). Margin of blades coarsely dentate and had not thick duplicate margin. Size of this seaweeds 107,45 mm (10,745 cm). Stalked vesicles round and smooth surface. Stalked vesicles had 5 mm long and no spines.Sargassum crassifolium is also in the group of Phaeophyta because it had colour of yellowish brown. Characteristic of Sargassum crassifolium arethallus large and erect. Enlarge at the base. It attached at rocky substrate with discoid holdfast. It had blades vertically attached and the blades are hardless. It had length of blades around 32,65 – 36,05 mm (3,265 – 3,605 cm). It is also had weidth of blades around 11,85 – 14,75 mm (1,185 – 1,475 cm). It had margin of blades coarsely dentate. It had size 107,45 mm (10,745 cm). Stalked vesicles round and smooth surface. Stalked vesicle had 5 mm long. According to Carpenter and Niem (1998) saidSargassum crassifolium had thallus large, yellowish brown, attached to rocky substrates by a conical, discoid holdfast. Thallus enlarge at the base. Secondary branches are irregularly alternate on the primary branches and smooth. Blades of primary and secondary branches vertically attached. Stalked vesicle sparse with sometimes with short spines. This thallus is up to 45 cm in the height. Margin of blades coarsely dentate.

International Seminar on Biological Sciences (ISBS - 2015) 23
Figure 5. Halimeda sp.
Description: Holdfast discoid. Thallusmoderate to lightly calcified. Thallus erect. Calsified segments flat and small. Size of calsified segments around 4,85 – 5,55 mm long and 3,65 – 5,95 mm wide. Bright green when fresh and cream when dried. 0,4 – 0,6 mm thick. Size up to 45,15 mm height.Halimeda sp. Is a seaweed in the group of Chlorophyta because it had colour of bright green. Attached to rocky substrates with holdfast single and small. Thallusmoderate to lightly calcified. Thallus erect. Size of calsified segments around 4,85 – 5,55 mm long and 3,65 – 5,95 mm wide. Bright green when fresh and cream when dried. 0,4 – 0,6 mm thick. Size up to 45,15 mm (4,515 cm) height. According to Pedrosaet al., (2004)Halimeda sp. had similarity to Halimeda tuna because thallus had small size. Halimeda tuna had Thallus erect, single, and moderate to lightly calcified;color light to dark-green, thallus up to 10 cm long; holdfast single andsmall; basal segments strongly calcified, segments up to 20 mm wideand 12 mm long. For Halimeda sp., we are still need further research to find out this species name.
Figure 6. Sargasum cristaefolium C. Agardh, 1820 (Double-bladed sargassum) Description: Thallus large, hard and erect. Attached to rock by discoid holdfast. Dark brown colour. Thallus up to 120,55 mm (12,055 cm) in height. Size of blades around 17,9 – 19,55 mm long and 12,7 – 12,55 mm wide. Blades had thick duplicate margin on the top and coarsely toothed outer margins. Stalked vesicles had isolated lateral teeth or ridges and had size 5 – 7

24 International Seminar on Biological Sciences (ISBS - 2015)
mm in diameter.Sargassum cristaefolium had some different things than sargassum crassifolium. Characteristic of Sargassum cristaefolium is the blades had thick duplicate margin on the top of the blades and coarsely toothed margins. The blades is harder than the blades of Sargassum crassifolium. Stalked vesicle of Sargassum cristaefolium had isolated lateral teeth or ridges and had size 5 – 7 mm in diameter. Thallus up to 120,55 mm (12,055 cm) in height. Size of blades around 17,9 – 19,55 mm (1,79 – 1,955 cm) long and 12,7 – 12,55mm (1,27 – 1,255 cm) wide. According to Carpenter and Niem (1998) saidSargassum cristaefolium blades had thick duplicate margin and coarsely toothed margins. The blades is hard. Stalked vesicles had isolated lateral teeth or ridges and had size 4 – 11 mm in diameter. Thallus is up to 50 cm in height. The blades had size 2,5 – 3,5 cm long.
Figure 7. Turbinaria decurrens Bory de Saint Vincent, 1828 (Triangular sea bell). Description: Thallus erect. Thallus large and hard. Dark brown. Branched holdfast. Blades characteristically triangular in surface view. Trigonous blades. Blades had size 15,1 – 17,2 mm (1,51 – 1,72 cm) long. Paninculate receptacular branches about 5 mm long, attached at the base of the blade stalk. Thallus had size 94,5 mm in height.Turbinaria decurrens had special characteristic than the other seaweeds. The main character of this seaweeds is the blades triangular from surface view. The others character is it had branched holdfast, dark brown, thallus large, erect and hard. Blades had size 15,1 – 17,2 mm long. Paninculate receptacular branches about 5 mm long, attached at the base of the blade stalk. Thallus had size 94,5 mm in height. According to Carpenter and Niem (1998) saidTurbinaria decurrens had thallus erect, hard, dark to yellowish brown, branched holdfast, blades had size around 11 – 17 mm long. Blades characteristically triangular in surface view. Paniculate receptacular branches about 8 mm long and attached at the base of the blade stalk. This species is distinct from other members of Turbinaria because of its triquetrous blades. Thallus is up to 15 cm in height.
Keys for the identification of macroalgae in Kasiak Gadang Island, Nirwana Beach, Padang
1.a. Thallus had bright green and calsified segments flat and small…...…………....Halimeda sp. 1.b. Thallus had brown colour and non-calsified segments………...……………………………2
2.a. Thallus had Yellowish Brown Colour..……………………………………………………...3 2.b. Thallus had Dark Brown colour……………………………………………………………..4
3.a. Blade divided into lobes and had concentric zone at lower surface……………Padina minor
International Seminar on Biological Sciences (ISBS - 2015) 25
3.b. Blade had coarsely dentate, had not thick duplicate margin, stalked vesicle smooth and round surface………………………………………………………..Sargassum crassifolium
4.a. Blades had thick duplicate margin, stalked vesicles had isolated lateral teeth or ridges and discoid holdfast….…………………………………………………Sargassum cristaefolium
4.b. Blades had trigonous form, non-stalked vesicles and branched holdfast………………………………………………………………...Turbinaria decurrens
In conclusion, although we have rectified some identification problems of the seaweeds species in this island, we realized that this research is based on morphological description. But there is no information about what will happen to this community of seaweeds in this island after affected by port activity near the island. Future research should focus on the effects of human development on this plant community on this island as the port is developed near this island. Acknowledgement Special thanks to Rector of Andalas University who help me with finance so that I can finish this paper. To my mother Dr. Shinta Agustina, my sisters Jasmine Nabilah, Nurul Fadilah and my friend Yuliwan Saputra for their correction about correction in English text and theirmotivation for me to finish this paper. References Anggadireja, J.T., Zatnika, A.Purwoto, H.and Istini. (2009):Seaweeds, Penebar Swadaya, Jakarta. Aslan, L. M. (1998): Rumput Laut-Seri Budi Daya, Kanisius, Yogyakarta. Bengen, D.G. (2000):Synopsis Ecosystem and Coastal Resources, Center of Coastal and Marine
Resource IPB, Bogor. Brownlee, Fairclough, Andrew, Hall, Anna and Paxman. (2012):the potential health benefits of
seaweed and seaweed extract. Nova Science Publishers: 119-136. Campbell, N.A., Reece, J.B. Urry, L.A. Cain, M.L. Wasserman, S.A. Minorsky, P.V. Jackson, R.B.
(2008): Biology, Eighth Edition, San Francisco. Carpenter, K.E. and Niem, V.H. (1998): Fao Species Identification Guide For Fishery Purposes: The
Living Marine Resources of the Western Central Pacific, Vol 1. Seaweeds, Corals, Bivalves and Gastropods, FAO UN, Rome.
Connaughey, H. Mc and R. Zottoli (1983): Introduction of Marine Biology, Mozby Company, London.
Dhargalkar, V.K. (2004): Seaweeds – AField Manual, National Institute of Oceanography, Dona Paula, Goa, New Delhi.
Dinas Pariwisata Kota Padang,(2013): Kota Padang Pariwisata. http://www.padang.go.id/index.php?option=com_content&view=article&id=52&Itemid=2. 17 Januari 2014.
English, Wilkinson and Baker. (1994):Survey Manual for Tropical Marine Resources. Australian Institute of Marine Science. Townsville.
Pedrosa, M. E. B., Pereira, S. M. B., and Oliveira, E. C. (2004): Taxonomy and distribution of the green algal genus Halimeda (Bryopsidales, Chlorophyta) in Brazil. 27 (2): 363-377.
Serediak, N. and Mai-Linh H. (2011): Algae Identification Field Guide. Canada: Agriculture and Agri-Food Canada.
Smith. (1962): Algae and Fungi Cryptgogamic Botani. Vol. I Graw Hill Book Company. New York.

26 International Seminar on Biological Sciences (ISBS - 2015)
Local Wisdom of Coastal Community in Managing Mangrove Ecosystem in East Coast of North Sumatera
Aulia, F.*1, Badaruddin2, R. Hamdani Harahap, R. H.3 and B. Utomo4
1)Natural Resources and Environment Postgraduate School of the University of Sumatera Utara And Faculty of Law, University of Al-Azhar Medan
*E-mail: [email protected] 2) Department of Sociology, Faculty of Social and Political Sciences, University of Sumatera Utara
3) Department of Anthropology, Faculty of Social and Political Sciences, University of Sumatera Utara 4) Department of Forestry, Faculty of Agriculture, University of Sumatera Utara, Jl. Tri Dharma Ujung No.1,
Kampus USU Medan 20155
ABSTRACT Study of the management of mangrove ecosystem and the existence of local communities in the current changing environment (demographic, economic and political) becomes an interesting issue, among others, local communities have a wisdom in forest management, high poverty around the forest, the demands of participatory, food security, climate change and etc. The purpose of this research is to identify the condition of mangrove ecosystem in the coastal area in the east coast of North Sumatera and analyze the patterns of local wisdom used to manage mangrove ecosystem in Langkat regency. This research use cultural ecology theory Steward (1995) as the reference in explaining society’s response concerning environment change in mangrove ecosystem management to coastal community in the east coast of North Sumatera. The condition of mangrove ecosystem has been experiencing a change for two decades; from managing mangrove for economical mean to managing mangrove for conservational tool. The creating of local wisdom in managing mangrove ecosystem didn’t occur because of the previous generation’s tradition, but local wisdom was slowly built up by it self through a study process organized by Paras foundation to create awareness in managing mangrove conservation based on trust, cooperation, honesty, support, and the spirit of mutal assistance. Method used in this research uses the qualitative approach with in-depth interview, observation and participation in Focus Group Discussion Keywords : Mangrove Ecosystem, Local Wisdom, Management of Mangrove Ecosystem INTRODUCTION Developments in the utilization of natural resources of the sea and coast today (catching, cultivation, and extraction of materials for medical purposes) according Ghofar (2004) have become a field of economic activity that is controlled by the market (market driven), especially the types of commodity which are economically so valuable thus encourages exploitative utilizing in considerable intensity.
As a result, there occurs a utilization which is likely to exceed the carrying capacity of resources (over exploitation) and tend to be destructive. This condition causes environment stress and even damage. According to Whitten, et al. (1999) what belongs to the coastal ecosystems includes: coral reefs, mangroves, sea grass beds, coastal areas and open waters. Mangrove ecosystem area along the east coast of North Sumatra stretches from the northern part of Langkat to the southern part of Labuhan Batu District North, covering 38 districts, ie 8 districts in Langkat, 2 Districts in the city of Medan, 4 districts in Deli Serdang, 5 districts in Serdang Bedagai, 7 districts in Batubara, 6 districts in Asahan, 3 districts in Tanjung Balai, 3 districts in Labuhan Batu, and 2 districts in North Labuhan Batu (Nasution., Z., et al. 2012 ). Mangrove ecosystem is a tropical coast vegetation community which dominates several species of mangrove trees able to grow and reproduce in muddy coast areas (Bengen, 2001). The damage of mangrove ecosystem arouse writer’s interest in studying it in term of local wisdom utilization in managing mangrove ecosystem. Local wisdom provides guidance for
International Seminar on Biological Sciences (ISBS - 2015) 27
local people in protecting and preserving the ecological environment to fulfill their needs. Local wisdom is cultural values, knowledge and experience that become an entity of a community that is used by the community in managing the interaction between people and between people and nature (Mitchell, et al., 2003).
There are several communal mechanisms in the utilization of coastal resources that are based on the values of local wisdom, such as: rules of awig awig or pelarem tradition for the fishermen group in Bali. This tradition synergy with the principle of tri hita karana or three sources of the balance of life: God, human and the natural coloring Balinese life. Awig awig and tri hita karana support each other in order to creating a harmonious life in Bali (Amanah, 2005).
The statement of Gadgil et al. cited by Mitchell (2007: 298), that knowledge of local society accumulated throughout history has a very big role in viewing human as a part of nature and the belief system that emphasizes respect for nature is a positive value for sustainable development. Literatures show that the local society is a formidable fortress in stopping negative effects of environmental damages (Mackinnon 1993; Edmuns and Wollenberg 2003). Local society has accountability and commitment in managing resources with the use of adaptation through local wisdom (Korten 1986).
The focus of this research examines the wisdom of local community in adapting to environmental changes. Furthermore, this research also explains how the implications resulted from the adaptation process done by local community against the sustainability of mangrove ecosystems. According to Steward (1955) adaptation mechanism run by a society concerning his environment will be very closely tied to the culture they developed. By adding the concept of socio-cultural adaptation strategy of Bennet (1976), which is combined, with the theory of cultural ecology Steward (1955), it results in the empirical evidence produced based on the preservation of the mangrove ecosystem.
Based on the above description, this research is to identify existing local wisdom as a form of community adaptation to environmental change, and the implication on the sustainability of mangrove ecosystems. In more detail, the problem formulation in this research is:
a. To study the management of mangrove ecosystem on coastal community in Langkat Residence
b. To analyze the forms of coastal community’s local wisdom in managing mangrove ecosystem
MATERIALS AND METHODS Research Approach The research design used in this research is using a qualitative approach. With emphasis on the process, then the data and information investigation diachronically will be done to understand orderly and fully about mangrove ecosystem through the management of mangrove ecosystem based on local wisdom for early stage and continually become a community which is in true mean sustainable; community which is able to overcome various problems independently. Given the essence of qualitative method in observing society as a subject and views of society itself (emic view) that data obtained are honest (Moleong, 2000: 55). Data Collecting Technique Data obtained come from two sources: primary data source and secondary data source Primary data obtained with:
a. In-depth interview b. Participant observation c. Group discussion
Secondary data obtained from related organization like: a. Document about general view of coastal area

28 International Seminar on Biological Sciences (ISBS - 2015)
b. Related instance job range c. Vision-Mission of organizations d. Programs and activities of organizations e. Organization’s administrative note
The Research Location The research location is determined purposively: coastal community with local wisdom in managing mangrove ecosystem in Secanggang District Langkat Regency. Secanggang was chosen as the research location because the management of mangrove ecosystem is done communally with considering conservational aspects.
The Research Informant Determination of the informants in this research is based on a group of key informants which includes:
1. Manager of stakeholder organizations, consist of: founders, advisors, bureaucrats 2. Informal figures, consisting of: religious leaders,society, traditional leaders 3. Elements of the people who have high activity in keeping the mangrove ecosystem
Data Analysis Analysis used on-going analysis method, combined with technical analysis of community empowerment, in which the concepts and theories that are used can be different from the situation in the field. New information’s interferences were withdrawn and used to build and sharpen the questions on the next days. The analysis was done with following the process: data presentation conclusions based on data presentation made during the data collection RESULTS AND DISCUSSION Management of Ecosystem Mangrove in East Coast Continuous management of coastal area by understanding the principles of conservation and welfare needs to be returned in Langkat Regency. In some regions, there is still a coastal area utilization which is by sector exploitative, and exceeding the capacity of the environment. The utilization impact begins to emerge, especially the increasing rate of physical damage to the coastal environment.
Mangrove is a natural ecosystem and it plays an important role for the environment, especially in coastal areas. Mangrove forest conversion in West Brandan has been occurring since 2006.About 1,700 hectares of mangrove forests are now damaged by oil palm plantations, mainly in the village of Lubuk Kertang and Lubuk Kasih. The expansion of oil palm plantations is done by converting mangrove forests, in addition to damaging the mangrove forest that will destroy the entire forest biological wealth of invaluable prices and benefits, will also change the landscape of mangrove forests in total in the district of West Brandan.
Change land use due to the pressure of population, economic activities and illegal acts such as illegal logging for charcoal making. Land degradation that occurs in mangrove areas comes from the same problem, which is the high activity of illegal and excessive exploitation of natural resources. Based on observations and interviews, the disorder is considered to be very dominant form of illegal logging (illegal logging) and encroachment. Illegal logging can be found in the District of Pangkalan Susu, Babalan, West Brandan, Secanggang, Gebang and Tanjung Pura.
Coal factories are most often found in the Saring Jaya village, District Besitang. Eight of they are near by each other. Each factory has already its reservoirs, mostly taken to Medan besides Besitang, coal making activities can be found in the District of Pangkalan Susu, WestBrandan, Gebang, Tanjung Pura and Secanggang. Adding and clearing ponds also contribute significantly to the destruction of mangrove forests.

International Seminar on Biological Sciences (ISBS - 2015) 29
Based on the evaluation of Mangrove Forest Management Department of Forestry, at least 50 percent of mangrove forests in Indonesia are in a damaged condition. The damage is accelerated by mangrove land conversion. Total area of mangrove forests narrowed from 9.3 million hectares to 6.6 million hectares. Meanwhile, 6.6 million hectares of mangrove forest area that exists today, only 4.5 million hectares are covered with mangrove. This is because in Indonesia, the value of mangrove forest utilization is still low because it is still limited to exploitative. In addition, the lack of attention to the preservation of the forest areas of various parties makes deforestation increasingly large-scale and rapid.
Damaging of mangrove areas can be seen from 1) changes in the properties of physics and chemistry, including water temperature, nutrients, salinity, hydrology, sedimentation, turbidity, toxic substances, and soil erosion 2) changes in biological properties , including changes in the dominant species, density, population, and the structure of plants and animals 3) changes in the ecological balance, including regeneration, growth, habitat and food chain, either on the mangrove ecosystem itself and the adjacent coastal areas. (Arief,2003). Mangrove areas in Langkat regency locate in coastal areas. Coastal areas have a strategic significance because it is a transition region (interface) between the terrestrial and marine ecosystems, as well as the potential of natural resources and environmental services which are very rich. Wealth resource raises the attractiveness of the various parties to take advantage of its resources and various agencies to regulate utilization (Ahimsa-Putra, 2001).
Normatively, wealth of coastal resources is controlled by the State to be managed in such a way in order to realize the people's welfare (Article 33, paragraph 3 of the 1945 Constitution), as well as to provide benefits for the current generation without compromising the interests of future generations to utilize coastal resources, in accordance to Article 4 of Law No. 23 of 1997. Local Wisdom in Management of Mangrove in East Coast Ahimsa-Putra (2008) said that local knowledge can be defined as a set of knowledge and good practices derived from previous generations as well as from the experience of dealing with the environment and other communities belonging to a community in a place that is used to resolve proper problems or difficulties. However, local wisdom can be transmitted through a learning process that is carried from one generation to the next generation (Putra, 2008).
Accordingly, the order of local wisdom in several districts in the eastern coastal region is not visible. But knowledge of local people in the 1980s concerning the existence of mangrove is more oriented in the economic utilization rather than its ecological value. There is no local wisdom found in coastal community telling about the importance of keeping the eternity of mangrove. The knowledge of local community concerning the mangrove is only about how to sell the woods of mangroves.
In Langkat, mainly Secanggang district, is seen the importance of economy dominating the management of mangrove rather than the ecology. In the area was found a coal factory which has been operating since 1995. The existence of the coal factory gives a considerably effect concerning the damage of mangrove forest. In the range of five years, mangrove forest has been cut off by local community.
From government’s party has been made a prohibition to chop mangrove forest since 1980. Nature Resource Conservation Office has installed prohibition warnings along coastal areas which cross secen districts in Langkat regency. Local communities who live in the coastal areas have acknowledged the warnings. However, the warnings are taken for granted. Local communities keep on exploitatively utilizing the mangrove forest. In the early 2002-2003, there appeared ideas to rehabilitate the damage along the rivers and even the coasts in Secanggang district. Most of fishermen are very dependent on the coastal life. The damage of mangrove impacts the catching of the fishermen. Various fish that used to be caught without gone to the middle no longer exist. Paras foundation seriously gives lessons to Secanggang people that the case is caused

30 International Seminar on Biological Sciences (ISBS - 2015)
by the damage of mangrove forests along the coast. The meetings between the foundation and locals people resulted in 5 groups that become activator in advocating of mangrove conservation process massively in Secanggang district:
1. Kelompok Ilham 2. Kelompok Tunas Baru 3. Kelompok Keluarga Bersatu 4. Kelompok Maju Bersama 5. Kelompok Nelayan
The local wisdom to keep the eternity of mangrove started with the activity of Paras foundation that is the forming of five groups through the arising local community’s awareness massively and communally to replant mangrove. Manage mangrove did by communal with planting various kinds of mangrove, like: bakau, api-api, berembang, mata buaya, lenggadai along the river to the Malacca strain.Together, local people take care of mangrove forest that it won’t be damaged by felling activity done by individual or not. The groups create rules and sanctions for law-breakers.
The rules do not only apply to the group’s members, but also to the general people.The norms of local wisdom which wasn’t found slowly will appear by itself. Manifestation of the local wisdom is created by trust, cooperation, honesty, support, and the spirit of mutual assistance which become the basic rules for Paras foundation to do a social movement communally and massively based on lessons and experiences of fisherman community. References Ahimsa-Putra, H.S., (2008): Ilmuwan Budaya dan Revitalisasi Kearifan Lokal Tantangan Teoritis
dan Metodologis. Makalah disampaikan pada Rapat Senat Terbuka Dies Natalis ke-62 Faculties Limo Buddy UGM. Yogyakarta.
Amanah, S., (2005): Pengembangan Masyarakat Pesisir Berdasarkan Kearifan Lokal di Pesisir Kabupaten Buleleng di Provinsi Bali. (Disertasi), Tidak Dipublikasikan, Sekolah Pascasarjana IPB, Bogor.
Bennett JW. (1976): The Ecological Transition: Cultural Anthropology and Human Adaptation, Pergamon Press Inc, New York.
Bengen, D.G., (2001): Pedoman Teknis Pengenalan dan Pengelolaan Ekosistem Mangrove. Pusat Kajian Sumberdaya Pesisir dan Lautan – IPB, Bogor.
Edmuns D., Wollenberg E. (2003): Local Forest Management. The Impacts of Devolution Policies. Earthscan Publications. London.
Ghofar, A., (2004): Pengelolaan Sumberdaya Perikanan Secara Terpadu dan Berkelanjutan, Cipayung-Bogor.
Korten DC. (1986): Community Management: Asian Experience and Perpectives. Kumarian Press. Philippines.
Mackinnon (1993): Pengelolaan Kawasan yang Dilindungi di Daerah Tropika. Gadjah Mada University Press. Yogyakarta.
Mitchell, Bruce, B. Setiawan, Dwita H. Rahmi., (2003): Pengelolaan Sumberdaya dan Lingkungan. Edisi Bahasa Indonesia. Judul Asli: Resource and Environmental Management, Gadjah Mada University Press, Yogyakarta.
Moleong, L, J. (2000): Metode Penelitian Kualitatif, Bandung: PT. Remaja Rosdakarya. Nasution, Z. Damanik, B.S.J., Delvian., (2012): Ekologi Ekosistem Wilayah Pesisir Pantai Timur
Sumatera Utara, Dinas Kelautan dan Perikanan Provinsi Sumatera Utara, Medan. Steward JH. (1955): Theory of Culture Change. University Illionis Press. Urbana. Whitten, Tony, Roehayat E. Soeriaatmadja, dan Suraya A. Afif. (1999): Ekologi Jawa dan Bali (The
Ecology of Jawa and Bali) Seri Ekologi Indonesia Jilid II. Alih bahasa Kartika Sari, Tyas Budi Utami dan Agus Widyantoro. Dalhouise University, Canada.
International Seminar on Biological Sciences (ISBS - 2015) 31
Rooting of in vitro Pineapple (Ananas comosus l.) with Naphtalene Acetic Acid Plant Growth Regulator
And Sucrose Treatment
Harahap, F.* and Nusyirwan
Department of Biology, Faculty of Mathematics and Natural Sciences, State University of Medan Jln. Willem Iskandar Pasar V Medan Estate, 20221, Indonesia.
Tel :+6281376817918, Fax : +6261613319, *E-mail: [email protected]
ABSTRACT Pineapple (Ananas comosus L.) is one of subtropical fruit that can be grown well in Indonesia. The purposes of this research are to find the data 1). Contamination, 2). Viability of plantlet, 3). The effect of Naphtalene Acetic Acid’s (NAA) and Sucrose treatment toward pineapple (Ananas comosus L.) rooting. Design of experiment is Completely Randomized Design Factorial. Various concentration of NAA (0, 1, 2 mg/L) and Sucrose (0, 30, 60 g/L) were treated for root induction in MS medium that added with 0.2 mg/L Indole Acetic Acid (IAA). These treatments were repeated until five times. The parameters of this research namely, persentage of contamination, number of dead planlet, number of shoot, number of leave, number of root. The results of this research show that the highest of contamination is 33.3%, get from MS medium + 0.2 mg/L IAA + 2 mg/L NAA + 30 g/L of sucrose treatment. The highest persentage of dead bud is 44.4%, get from 1) MS medium + 0.2 mg/L IAA +1 mg/L NAA + 0 g/L of Sucrose and 2) MS medium + 0.2 mg/L IAA + 2 mg/L NAA + 0 g/L of Sucrose. NAA plant growth regulator did not affected to number of shoots, while sucrose and interaction NAA with sucrose affected to number of shoots. NAA, sucrose treatment and interaction NAA with sucrose affected to number of leave. NAA, interaction NAA with sucrose did not affected to number of root, while sucrose affected to number of root.
Keywords: Ananas comosus L., rooting, NAA, Sucrose, In vitro INTRODUCTION Pineapple (Ananas comosus L.) originate from Latin America (Brazil, Argentina, Peru), has now spread throughout the world. Pineapple (Ananas comosusL.) is one of the subtropical fruits that can be developed well in Indonesia (Ministry of Agriculture, 1999). Indonesia is the third largest pineapple exporter after the Philippines and Thailand.
One of the problems on pineapple cultivation in Indonesia is there is no seedling producers, that can provide seedling pineapple in large numbers and a relatively short time. Propagation is conventionally less effective, because the number of seedlings produced little and take a long time, and not uniform. Until now, farmers develop these plants using crown, buds, divide old plants.
Propagation through tissue culture contributed greatly to solving this problem.For the development of this crops, needed plantlet in large quantities and uniform. One alternative to solve this problem was by tissue culture techniques. This technology has been widely used for get the uniform seedlings especially on horticulture crops (Harahap et al, 2012). This article is continuing research on shoots induction, which obtained the data, namely, Giving of BAP and IAA significantly affected the appearance of shoots, number of leaves except shoots high. The best treatment was a combination of MS + 2 mg/L BAP + 0 mg/L IAA for shoots induction (Harahap, 2015).
The use of plant growth regulator (auxin), to induce rooting urgently needed. In this study, the treatment is done on tissue culture using Murashige and Skoog (MS) with the

32 International Seminar on Biological Sciences (ISBS - 2015)
addition of auxin from the group Non Indole, namely Naphtalene AceticAcid (NAA) in combination with sucrose, with a concentration that is different. MATERIALS AND METHODS The study was conducted from Februari to September 2015 at the YAHDI Tissue Culture Laboratory and Biology Laboratory UNIMED. The materials used were in vitro Pineapple bud, MS medium, sterile distilled water, alcohol (70%, 96%), sucrose and NAA. We use standard tissue culture tools for our research.
In vitro shoot explants were used for root induction. The shoots were rooted on Murashige and Skoog (MS) media with several combinations of Naphtalene Acetic Acid (NAA) and sucrose. Various concentration of NAA (0, 1, 2 mg/L) and Sucrose (0, 30, 60 g/L) were treated for root induction in MS medium that added with 0.2 mg/L IndoleAcetic Acid (IAA) as basic medium.The culture was maintained at 24o C by regulating the room air conditioner, under fluorescent light of 3000 lux, with a photoperiod for 16 hours/day for roots induction method.
The parameters of this research namely 1) percentage of contamination, 2) percentage ofdeadplantlet, 3) number of shoot, 4) number of leave, 5) number of root. Percentage of contamination dan percentage of dead plantlet was observed daily. The number of bud, number of leave, number of rootwere observed weekly from 1until 12 weeks after rooting. We used statistical analysisof Varian factorial analysis and continuous with Duncan multiple rate test (DMRT) was used with significances a 5% . RESULTS AND DISCUSSION Contamination, Viability of Plantlet In this study, in vitrosterile shoots (plantlets) 2 months old, used for in vitro rooting, The observations have been conducted for 12 weeks. The observations showed that, plantlets that experienced the highest contamination (33.3%) were from the 2 mg/L NAA, 30 g/L Sucrose, 0.2 mg/L IAA treatment, followed by other treatments: 0 mg/L NAA , 30 g/L Sucrose, 0.2 mg/L IAA and 1 mg/L NAA, 60 g/L Sucrose, 0.2 mg/L IAA with the average of contamination is 22.2%. Other treatments are not contamination.
Contamination in this study are generally caused by human error, such as a tool (pinset, knife, petridish) that is not sterile and contaminated media. Source plantlets were used entirely sterile. Microorganisms which were major cause of contamination in this study were generally from the class of fungi. Harahap (2015) said contamination on tissue culture techniquesis very high, it can also come from the inside of the explants. Contamination caused by the fungus can be sterilized with NaClO3 with several concentration.
In this study, not the whole of plantlets which are used to grow. Plantlets highest mortality (44.4%) were from treatment 1 mg/L NAA with 0 g/L sucrose and 0.2 mg/L IAA and 2 mg/L NAA with 0 g/L sucrose and 0.2 mg/L IAA. Generally, the cause of shoot death is damaged of plant tissue, due to the tools used is too hot, so that the base of the shoots become mature, damage and eventually cause death shoots. Sterilization by heating is necessary in the tool before use, but if the heating is too long, it will cause damage to plant tissues (Harahap, 2011).
This rooting induction research, several treatments are also experiencing increasing the number of shoots (buds) other than the root, but some treatments did not produce of buds (shoots). Zuraida et al. (2011) reported that a high concentration of BAP in medium induced more shoots in mangosteen explants, than did a low concentration of BAP. The study conducted by Harahap et al. (2012) found that 2 mg/L BAP stimulates the formation of mangosteen shoots from explants 2 cm in size. While in this research, without cytokinin treatment, able to create a new pineapple shoots. It means that, the concentration of endogenous cytokinins on pineapple
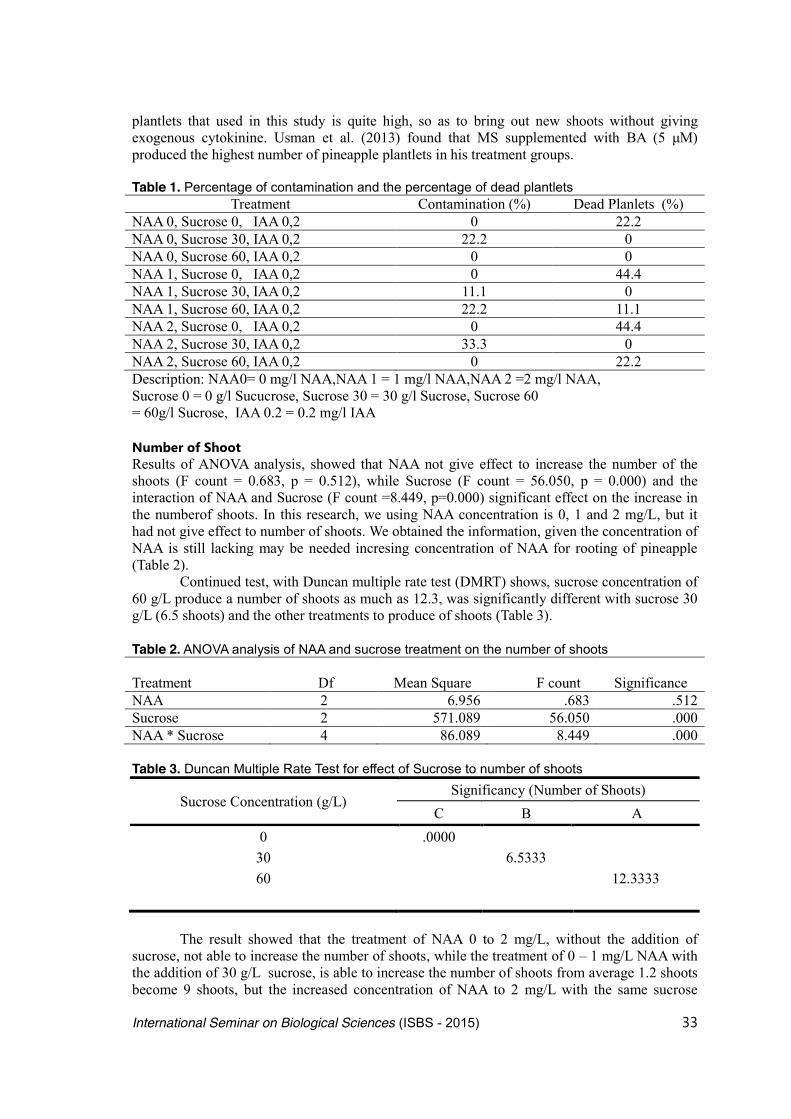
International Seminar on Biological Sciences (ISBS - 2015) 33
plantlets that used in this study is quite high, so as to bring out new shoots without giving exogenous cytokinine. Usman et al. (2013) found that MS supplemented with BA (5 μM) produced the highest number of pineapple plantlets in his treatment groups. Table 1. Percentage of contamination and the percentage of dead plantlets
Treatment Contamination (%) Dead Planlets (%) NAA 0, Sucrose 0, IAA 0,2 0 22.2 NAA 0, Sucrose 30, IAA 0,2 22.2 0 NAA 0, Sucrose 60, IAA 0,2 0 0 NAA 1, Sucrose 0, IAA 0,2 0 44.4 NAA 1, Sucrose 30, IAA 0,2 11.1 0 NAA 1, Sucrose 60, IAA 0,2 22.2 11.1 NAA 2, Sucrose 0, IAA 0,2 0 44.4 NAA 2, Sucrose 30, IAA 0,2 33.3 0 NAA 2, Sucrose 60, IAA 0,2 0 22.2 Description: NAA0= 0 mg/l NAA,NAA 1 = 1 mg/l NAA,NAA 2 =2 mg/l NAA, Sucrose 0 = 0 g/l Sucucrose, Sucrose 30 = 30 g/l Sucrose, Sucrose 60 = 60g/l Sucrose, IAA 0.2 = 0.2 mg/l IAA Number of Shoot Results of ANOVA analysis, showed that NAA not give effect to increase the number of the shoots (F count = 0.683, p = 0.512), while Sucrose (F count = 56.050, p = 0.000) and the interaction of NAA and Sucrose (F count =8.449, p=0.000) significant effect on the increase in the numberof shoots. In this research, we using NAA concentration is 0, 1 and 2 mg/L, but it had not give effect to number of shoots. We obtained the information, given the concentration of NAA is still lacking may be needed incresing concentration of NAA for rooting of pineapple (Table 2).
Continued test, with Duncan multiple rate test (DMRT) shows, sucrose concentration of 60 g/L produce a number of shoots as much as 12.3, was significantly different with sucrose 30 g/L (6.5 shoots) and the other treatments to produce of shoots (Table 3).
Table 2. ANOVA analysis of NAA and sucrose treatment on the number of shoots
Treatment Df Mean Square F count
Significance NAA 2 6.956 .683 .512 Sucrose 2 571.089 56.050 .000 NAA * Sucrose 4 86.089 8.449 .000
Table 3. Duncan Multiple Rate Test for effect of Sucrose to number of shoots
Sucrose Concentration (g/L) Significancy (Number of Shoots)
C B A 0 .0000 30 6.5333 60 12.3333
The result showed that the treatment of NAA 0 to 2 mg/L, without the addition of
sucrose, not able to increase the number of shoots, while the treatment of 0 – 1 mg/L NAA with the addition of 30 g/L sucrose, is able to increase the number of shoots from average 1.2 shoots become 9 shoots, but the increased concentration of NAA to 2 mg/L with the same sucrose

34 International Seminar on Biological Sciences (ISBS - 2015)
concentration (30 g/l) was only able to increase the number of shoots from 9 to 9.4 shoots. Treatment 0, 1, 2 mg/L of NAA with 60 g/L sucrose caused a decrease in the number of
shoots respectively of 12.2 and 16.2 be decreased to 8.6 shoots. The higher concentration of NAA and sucrose, resulting less and less number of shoots. It can be understood, to induce shoots is needed plant growth regulator from the group of cytokines. Harahap (2014) stated, giving of BAP and IAA significantly affected the number of shoots.
The highest number of shoots is produced from treatment 0 mg/L NAA combined with 60 g/L sucrose, the number of shoots produced an average of 16.2 shoots. While thetreatment of 0, 1, 2mg/L NAA without sucrose cannot produce buds/shoots. This research shows that the energy source needed for the formation of new shoots and indicate that the sucrose with optimum doses is needed for the formation of shoots.
. Number of leaves The results of ANOVA on the numberof leaves, found that NAA (F count 7.98, p = 0.001), sucrose (F count 94.54, p = 0.000), and the interaction of NAA and sucrose (F count 7.77, p = 0.000) very significant effect on the number of leaves (table 4).
Table 4. ANOVA analysis of NAA and sucrose treatment on the number of leaves Treatment Df Mean Square F count Significance NAA 2 843.356 7.984 .001 Sucrose 2 9987.089 94.545 .000 NAA * Sucrose 4 821.022 7.772 .000
Further test with DMRT showed, the 60 g/L sucrose concentration resulted in the number of leaves (63.47 leaves) significantly different with 30 g/L sucrose treatment (47.27 leaves) and without sucrose treatment (12.93 leaves). This study shows that, every difference in the concentration of sucrose treatment, showed significant difference with the other treatments. Obtained an increase in the number of leaves, along with increased doses of sucrose (Table 5). Table 5. Duncan Multiple Rate Test for effect of sucrose, NAA to number of leaves
Sucrose Concentration (g/L) Significancy (Number of Leaves) C B A
0 12.9333 30 47.2667 60 63.4667
NAA (mg/L) 0 32.9333 1 43.2000 2 47.5333
Similarly with NAA treatment. Two mg/L NAA, resulting in the average number of
leaves (47.53) did not different with 1 mg/L NAA treatment (43.2 leaves), but different with 0 mg/L NAA treatment with 32.93 leaves (Table 5). The results of this study showed that treatment of NAA without the addition of sucrose, is able to increase the number of leaves.Treatment 0 mg / l NAA with sucrose 30 g / l resulted in the number of leaves of 23.2 leaves.The addition of 1 mg / l NAA concentration with the same sucrose concentration (30 g/l) greatly increases the number of leaves into 65.8 leaves, but if the concentration of NAA increased to 2 mg/l, will decrease the number of leaves into 52.8 leaves. NAA treatment of 0-2 mg/l with sucrose 60 g/l caused a decrease in the number of leaves from an average of 65 leaves to 60 leaves. The highest number of leaves produced from treatment of 1mg/L NAA with 30g/lof sucrose with the numberof leaves produced as much as 65.80 leaves and the lowest was 10.6 leaves resulting from the treatment of 0mg/L NAA and 0g/L sucrose.

International Seminar on Biological Sciences (ISBS - 2015) 35
Root Induction Table 6. ANOVA analysis of NAA and sucrose treatment on the number of root Source Df Mean Square F count Significance NAA 2 17.622 2.224 .123 Sucrose 2 170.422 21.512 .000 NAA * Sucrose 4 19.089 2.410 .067
Results of the Anova analysis indicate, treatment of NAA and interaction NAA and sucrose did not give effect to increase the number of roots (F count = 2.22, p = 0.123 and F count = 2.41, p = 0.067), while sucrose significant effect on increasing the number of root (F count = 21.51, p = 0.000), (Tabel 6). The Duncan multiple rate test (DMRT) analysis shows, the concentration of sucrose 30 g/L produce 7.73 roots, significantly different with the treatment of 60 g/L sucrose which the number of roots 5.27 roots and significantly different with the untreated sucrose (1.07 root). It appears that the best dose is by giving 30g/L sucrose to increase the number of roots. With the addition of sucrose to 60 g/L would decrease the number of roots (Table 7)
Table 7. Duncan Multiple Rate Test for effect of Sucrose to number of roots
Sucrose Concentration (g/L) Significancy (Number of Leaves) C B A
0 1.0667 60 5.2667 30 7.7333
Result of this research show that the treatment of NAA 0 to2mg/L, with the addition of
sucrose, is able to increase the number of roots. The addition of 30 g/L sucrose with NAA 2mg/L produce fewer roots than the 30 g/L sucrose treatments with 1mg/L NAA, which means a decline in the number of roots with increasing doses of NAA in the treatment of 30 g/L sucrose. But not with the addition of 60 g/L sucrose (higher the concentrationof sucrose) combined with the high concentration of NAA will produce a high of roots.
There are conflicting data between the giving 30g/L to 60g/L sucrose combined with NAA. In the treatment of 60g/L sucrose with NAA,increased number of roots with the addition of a higher dose of NAA( 2 mg/L NAA), while with 30g/L sucrose, with 1mg/L NAA, will increase yield and then decrease the number of roots with the addition of 2mg/L NAA. More research is needed, whether the data is a description the actual results or due to an error at the time of observation. The highest number of roots produced from treatment of 1mg/L NAA with 30g/L of sucrose with the numberof roots produced as much as 9.6 and the lowest was 0.2 resulting from the treatmentof 0mg/L NAA and 0g/L sucrose.
Specifically, auxin has been shown to be effective in root induction. NAA is the group of auxin, which is very slowly release by plant cells but very stable on heating with autoclave (Wetter, 1991). In the present research we used NAA with several concentration and 0.2 mg/L IAA for all treatment. NAA are known as auxin that have a slow translocation, high persistent activities, and slow activity so that it required time for rooting (Harahap, 2014).Sucrose is needed as a source of energy for plant growth and development. (Harahap, 2011).
According to Karjadi and Buchori (2007), requires a high ratio of auxin to cytokinin to formation of root. To maximize root length, auxin must be present as an important initiator of root growth, while cytokinin hormone should be reduced or eliminated. Sirchi et al (2008), achieved the best result for mangosteen root formation (90.4%) with explants cultured on one-quarter strength of MS salt medium supplemented with 0.1 mg/L NAA.
Overall, there are high contamination (33.3%), especially from the 2mg/l NAA, 30 g/l Sucrose, 0.2mg/L IAA treatment, followed by other treatment with the lower percentage and other treatment is nothing contamination.

36 International Seminar on Biological Sciences (ISBS - 2015)
The persentage of dead bud is high (44.4%), from 1mg/L NAA with 0g/L sucrose and 0.2mg/L IAA and 2mg/L NAA with 0g/L sucrose and 0.2mg/L IAA treatment, followed by other treatment. Generally, the cause of shoot death is damaged of plant tissue. NAA plant growth regulator did not affected to number of shoots, while sucrose and interaction NAA with sucrose affected to number of shoots. The highest number of shoots produced from treatment0mg/L NAA combined with 60g/L sucrose,with the number of shoots is 16.2 . While the treatment of 0, 1, 2mg/L NAA without sucrose giving can not produce buds.
NAA, sucrose treatment and interaction NAA with sucrose affected to number of leaves. The highest number of leaves produced from treatment of 1mg/L NAA with 30g/L of sucrose with the numberof leaves is 65.80 and the lowest was 10.6 resulting from the treatment of 0mg/L NAA and 0g/L sucrose. NAA, interaction NAA with sucrose did not affected to number of root, while sucrose affected to number of root. The highest number of roots produced from treatment of 1mg/L NAA with 30g/L of sucrose with the number of roots is 9.6 roots and the lowest was 0.2 roots resulting from the treatment of 0mg/L NAA and 0g/L sucrose. Acknowledgement
This study was supported by the Ministry RISTEK DIKTI of Indonesia, Directorate General of Higher Education, DP2M from Fundamental Research Grant, contract number: 062/UN33.8/LL/2014.
References Harahap, F. and Hasruddin Suriani, C (2012): Shootgrowth of in vitro Mangosteen (Garcinia
mangostana L.) results of Benzyl Adenine plant growthregulators and the different explants size. Saintika Journal Vol. 12 No 1 : 1-13.
Harahap, F., Poerwanto, R., Suharsono, Suriani C., Rahayu, S. (2014): In vitrogrowth and rooting of Mangosteen(Garcinia mangostana L.) on medium with different concentrations of plant growth regulator. HAYATI Journal of Biosciences, Vol. 21 No. 4 : 151-158.
Harahap F., Poerwanto, R., Sobir, Hasruddin, Suriani C., Siallagan J. And Rohyana., (2015): Sterilization of Pineapple explant from Sipahutar,North Sumatera, Indonesia (Ananas comosus L.) and in vitro growth induction. Asian Jr. of Microbiol. Biotech. Env. Sc. Vol. 17, No 2 : 469-478
Harahap, F., (2011): Plant Tissue Culture. Unimed Press. Karjadi, A.K. and Buchori, A. (2007): Effect of NAA and BAP on the growth of Garlic meristem
tissue on B5 medium. Jurnal. Hortikultura. Vol 17 : 217-223 Sirchi M.H.T., Kadir M.A., Aziz M.A., Rashid A.A., Rapat A., Javadi M.B. (2008): Plant regeneration
as affected by plant growth regulator (PGR) in Mangosteen (Garcinia mangostana L.). Africant Journal of Biotechnology Vol .7 :2693-2701.
Usman, I.S., Abdulmalik, M.M., Sani, L.A. and Muhammad, A.N. (2013): Development of anefficient protocol formicropropagation of Pineapple (Ananas comosus L. var. Smoothcayenne). African Journal of Agricultural Vol 8 : 2053-2056.
Yuliarti, N. (2010): Tissue Culture, House Hold Scale, Yogyakarta Press. Zulkarnain, (2009): Plant tissue culture. Plant propagation solutions, Bumi Aksara, Jakarta. Zuraida, A.R., Nurul, S., Harteeni, A.H., Roowi, S., Che-Radziah, C.M.Z. and Sreeraman, (2011): A
Novel approach for rapid micropropagation of maspine Pineapple (Ananas comosus L.) shoot using liquidshake culture system. Africant Journal of Biotechnology Vol. 10: 3859-3866.

International Seminar on Biological Sciences (ISBS - 2015) 37
Arbuscular Mycorrhizal Fungi Association on Oil Palm Rhizosphere in Smallholder Farmer Plantation at Aceh Tamiang
Fikrinda*1, Anhar, A.1, Arabia, T.1, Mardatin, N. F.2, Ritaqwin, Z.1, and Syakur1
1)Faculty of Agriculture, Universitas Syiah Kuala, Banda Aceh
*E-mail: [email protected] 2)Research Centre of Biodiversity and Biotechnology, Bogor Agricultural Institute, Bogor
ABSTRACT Arbuscular Mycorrhizal Fungi (AMF) associate with many plants and its occurrence was affected by the plant’s age. A survey was conducted to determine the AMF spore population in rhizosphere and root colonization of oil palm based on four age classes (5 months, 5 years, 10 years, and 20 years) at small holder farmer plantation in Aceh Tamiang.The methods used were direct isolation and trapping culture with maize as a host. The result showed that spore population isolated from trapping culture was higher than that of direct isolation.The 5 year oil palm rhizospere of trapping culture supported the highest population. Glomus was found in the direct isolation method while Glomus and Gigaspora in trapping culture. The highest root colonization percentage was 28% found at 5 year oil palm. Keywords: Direct isolation, Glomus, Gigaspora, trapping culture INTRODUCTION Arbuscular Mycorrhizal (AM) fungi are a major component of soil biofertility. They are fundamental for plant performance, both in natural and agricultural ecosystems. AM fungi penetrate the cortical cells of the plant root and provide a range of benefits to their host in exchange for plant assimilated carbohydrates. Through an exhaustive network of hyphae, plants are provided with mineral nutrients (Urcovicheet al., 2015; Xiao et al., 2014). Besides, they give any benefits for plant by improving water status (Meddichet al., 2015 Omirouetal., 2013), protectingagainst microbial pathogens (Abo-Elyousret al., 2014;Smith and Read 2008), and facilitating the formation and maintenance of soil structure and dynamics (van der Heijdenet al. 2008; Leifheitet al., 2014).
Most terrestrial plants form symbiotic associations with AM are not host specific. They differ in their ability to enhance nutrient uptake and plant growth. Differences in host plants andsoil fertility stimulate different sporulation of AM fungi species in the field (Massenssiniet al., 2015; Penget al., 2015) and spore production is seasonal in several habitats (Egan et al., 2014). However several studies showed that native AMF can perform better in soils from which they are isolated (Armada et al., 2015; Estradaet al., 2013a,b). Arbuscular Mycorrhizal symbiosis is more effective with native than with non-native AMF species (Gargand Pandey, 2015; Liuet al., 2014; Manautet al., 2015).
Oil palm (Elaeis guineensis Jacq.), as one of the main sources of edible oil, is a promising crop to be cultivated. In order to meet the high demand for palm oil annually the oil palm plantation areas have expanded. In Aceh, the plantations at this district are managed either by farmer, private, or government. The smallholder farmers were managed traditionally,thus the productivity is low. Besides, ultisol as soil type in the area having poor quality has also inhibited the productivity of plantation. Therefore, application of indigenous AM fungi is assumed as an alternative to raise the production value. In this study, we analyzed the rootcolonization and the AMF spore communities in oilpalmrhizosphereat the smallholder farmer plantation at Aceh Tamiang.

38 International Seminar on Biological Sciences (ISBS - 2015)
MATERIALS AND METHODS Site study and soil sampling This study was carried out in the four villages of Aceh Tamiang like Tebing Tinggi, Alur Pane 1, Alur Pane 2, and Bandar Khalifa representing each age group of oil palm i.e. 5 months, 5 years, 10 years, and 20 years respectively. In every village, we had 5 randomly samples that were composited from oilpalm rhizosphere. Each sample amounted 1 kg soil. The distance between each soil sampling site in each village was ± 18 m. The root and soil were taken from topsoil (0-20cm depth). Assessment of soil properties The soil samples were carefully collected in polyethylene bags and tied with rubber bands. The soil samples collected were used for the study of status of AMFand physico-chemical characteristics. From each soil sample, a subsample, air dried and sieved was used for determination of physical and chemical properties including soil texture, pH, organic carbon (C), total N, available P, and cation exchange capacity (CEC). The soil texture analysis was done by gravimetric method. The pH was measured in water (soil: water ratio 1:2.5) with a digital pH meter. Organic carbon content was determined by the Walkley–Black acid digestion method. Total N was measured by Kjeldahl method. Available P was extracted according Bray 1 method. Cation exchange capacity (CEC) extracted by 1 N ammonium acetate at pH 7 were measured using atomic absorption spectrophotometry. Trapping culture The soil samples (including roots) were placed in 200 mLpot containing sterile substrate (sandy soil). The trap cultures were kept in screen house with maize as host plant for three months. Pots were daily watered to the point of saturation on alternate days and after sporulation then were isolated. Isolation and identification of AM fungal spores AM fungi spores were enumerated from direct isolation and trapping culture. The isolation used wet-sieving and decanting technique (Brundrettet al., 1996). The air dried sub-samples of soil were suspended in water for 30 minutes. The soil suspension was decanted over a series of sieves 600, 250, 106, 53, and 38 µmsize, then washed with tap water until the water was clear. The contents of 250, 106, 53, and 38 µm size sieves were transferred into 100 ml tubes. Each suspension was then centrifuged for 5 min at 2,000 rpm (Brundrettet al. 1996). After decanting the supernatant, each soil-spore mixture of the pellets was re-suspended in sucrose solution (50%) and centrifuged for 1 min at 2,000 rpm. Rapidly, the supernatant containing spores was sieved onto a 38 µm mesh sieves and washed thoroughly (at least for 1 min).The spores were collected on a filter paper and then transferred into round petri-dish that has gridline marked at the bottom to form 1 cm2and finally counted under a stereo microscope. Spore number was expressed in 50g of soil sample. Only were the healthy and spore with complete accessory counted and identified. Spores were observed, collected and gruped based on morphotypes under dissecting microscope. Spores were mounted in permanent slides in polyvinyl–lacto–glycerol (PVLG). The spore identification was done based on morphological characteristics (spore size, colour, and hyphal attachment) following Schenck and Perez (1990). Assessment of AM colonization Root samples were washed with tap water, then cutted into small pieces (ca. 1 cm). These pieces were cleared in 10% (w/v) KOH solution for 12 hours, and then washed in deionized water several times. As the oil palm roots were highly pigmented, roots were bleached in 3% H2O2 solution before being acidified by 2% HCl. Then the roots were stained in a solution of 5% ink (QuinkParker) in household vinegar (5% acetic acid) for 12 hours. Roots were destained in vinegar for 30 minutes and stored in tap water acidified with some drops of vinegar (modified

International Seminar on Biological Sciences (ISBS - 2015) 39
after Vierheilig et al.,1998). The stained roots were observed under Nikon compound microscope and counted for the colonisation percentage.A root segment was considered mycorrhizal (positively colonized) if there were a hypha, arbuscule or vesicle, or any combination of these characteristic structures of AM fungi, within a single field ofview of the microscope.The extent of colonization by AM fungi was calculated and expressed in percent (Brundrett et al., 1994). Data were analyzed descriptively. RESULTS AND DISCUSSION Soil Characterstics The diversity, abundance, and distribution of AM fungi were affected by soil characteristics such as soil pH, nutrient content, and organic matter (Kumar et al., 2012; Gaidashovaet al., 2012) and soil texture (Moebius-Cluneet al., 2013). The result showed the soil physico-chemical characteristics varied among the sites (Table 1). Table 1. Soil characteristics at different plant ages of oil palm in smallholder farmer plantation at Aceh Tamiang.
Oil palm Age
Organic C (%)
Total N (%)
Available P (ppm)
CEC (cmol.kg-1) pH Texture
5 months 1.93 0.20 44.89 7.55 5.58 Silty clay 5 years 1.73 0.17 12.76 16.65 5.63 Silty clay loam
10 years 0.94 0.15 1.22 27.31 6.28 Silty clay loam 20 years 1.66 0.11 24.72 6.56 6.37 Clay loam
Soil organic C and total N in the oil palm plantations were low (<1% to organic C and
0,1-0,2% to total N) at every sites but in 10 year old oil palm showed very low in organic C. In contrast, the highest available P was found at the rizosphere of 5 month old and 20 year old oil palm. Soil CEC of 5 and 10 years old oil palm were in middle category, while in the 5 month and 20 year old oil palm were low. The soil acidity of the plantations in the various oil palm ages was slightly acid. AMF spore density This study found that AM fungi spore density from trapping culture was higher than that of direct isolation (Table 2). This result is similar to Rodríguez-Morelos et al. (2014) showing Ambisporagerdemanniiand Gigaspora sp. were not found in the natural soil collected, but they were recorded in trap-plant cultures.Therefore, using trap-plants allows the evaluation of the mycorrhizal inoculum potential of soil (Guadarramaet al., 2014). Rodríguez-Morelos et al. (2014) suggested that in order to have a more complete picture of the AMF communities, it is important to collect AMF from rizosphere soil and cultivation using trapplants.
The abundance of AM fungi in an ecosystem is also determined by plant age. Husband et al. (2002) found that the age of the host can determine the composition of AMF populations in tropical ecosystems. Table 2 showed that the highest number of AMF was found at 5 year old oil palm plantation and decreased by age. Kumar et al. (2009) found higher AM spore density in young plants than old trees of maidenhair (Ginkgo biloba L.). AMF species richness This study found eight species of AM fungi in the oil palm smallholder people plantation of Aceh Tamiang belonged to Glomus and Gigaspora. Glomuswas found in both isolation methods, whileGigasporawas only at trap-plant culture. There were six species ofGlomus found in the direct isolation method whereas in the trap-plant culture found six species ofGlomus and one species of Gigaspora. This result similar to Rodríguez-Morelos et al. (2014).The highest

40 International Seminar on Biological Sciences (ISBS - 2015)
species richness of AMF was also in 5 year old oil palm (Table 3). Rodríguez-Morelos et al. (2014) and Wubetet al. (2009) also found more AMspecies in the rhizosphere of mature trees than in seedlings. Table 2. The AM spores density (50 g soil-1 ) in oil palm rhizosphere at smallholder farmer plantation in different plant age Isolation Methods 5 months 5 years 10 years 20 years Direct 11 10 4 6 Trap-plantculture 53 188 27 18 Table 3. AM species distribution under various oil palm age in smallholder farmer plantation of Aceh Tamiang
AMF species 5 months 5 years 10 years 20 years Total Direct isolation
Glomus sp. 1 0 4 0 9 13 Glomus sp. 2 39 22 7 12 80 Glomus sp. 3 7 15 6 1 29 Glomus sp. 5 0 4 2 0 6 Glomus sp. 7 8 5 6 6 25 Glomus sp. 9 0 2 0 0 2
Trapping culture Glomus sp. 1 5 2 0 5 12 Glomus sp. 2 56 15 53 50 174 Glomus sp. 3 155 896 60 23 1134 Glomus sp. 5 29 4 0 1 34 Glomus sp. 7 11 5 0 1 17 Glomus sp.8 6 20 21 9 56 Gigaspora sp.1 2 0 3 0 5 AMF colonization The oil palm colonized either by hyphae, arbuscules or vesicles. The presence of thisassociation in the roots is generally used to determine AMF colonized (Brundrettet al., 1996). This study indicated that 5 month old oil palm had higher root colonization than others (Table 4). Difference in the level of colonization observed among plants may be attributed to abiotic factors, age and phenology, mycorrhizal dependency, rhizosphere soil and genetic variations among tree species, and the capacity of population of mycorrhizalpropagules in the soil to form mycorrhizal association (Gafur, 2014; Smith and Read, 2008). Table 4. Root colonization of oil palm at different oil palm age at smallholder farmer plantation Root Colonization 5 months 5 years 10 years 20 years Oil palm 22 28 16 22 Acknowledgement We are grateful to the project of MasterPlan PercepatandanPerluasanPembangunan Ekonomi Indonesia (MP3EI) No. 303/SP2H/PL/Dit.Litabmas/VII/2013 for financing this study.

International Seminar on Biological Sciences (ISBS - 2015) 41
References Abo-Elyousr, K. A.M., M. E.A. Seleim, K. M.H. Abd-El-Moneem, and F. A. Saead. (2014):
Integrated effect of Glomusmosseae and selected plant oils on the control of bacterial wilt disease of tomato. Crop Protection 66: 67-71
Armada, E., Rosario Azcon, O. M. Lopez-Castillo, M.Calvo-Polanco, and J. M. Ruiz-Lozano. (2015): Autochthonous arbuscularmycorrhizal fungi and Bacillus thuringiensis from a degraded Mediterranean area can be used to improvephysiological traits and performance of a plant of agronomic interest under drought conditions. Plant Physiology and Biochemistry.http://dx.doi.org/10.1016/j.plaphy.2015.03.004
Brundrett, M., N. Bougher, B. Dell, T. Grave and N. Malajezuk. (1996): Working with mycorrhiza in forestry and agriculture. Australian Centre for International Agricultural Research (ACIAR), Canberra.
Egan, C., D-W.Li, and J. Klironomos. (2014):Detection of arbuscular mycorrhizal fungal spores in the air across different biomes and ecoregions. Fungal ecology XXX 1-6.
Estrada, B., R. Aroca, J. Miguel Barea, and J. M. Ruiz-Lozano. (2013a): Native arbuscular mycorrhizal fungi isolated from a saline habitat improved maize antioxidant systems and plant tolerance to salinity. Plant Science 201– 202: 42– 51.
Estrada, B., R. Aroca, C. Azcón-Aguilar, J. M. Barea and J. M. Ruiz-Lozano. (2013b): Importance of native arbuscular mycorrhizal inoculation in the halophyte Asteriscus maritimus for successful establishment and growth under saline conditions. Plant Soil 370:175–185.
Gafur, S. (2014): Contribution of Dynamics of Root Colonisation by ArbuscularMycorrhizal Communities to Ecosystem Function. P. 32-43. In. Z. M. Solaiman, L.K. Abbott. And A. Varma (Eds.). Mycorrhizal Fungi: Use in Sustainable agriculture and land Restoration. Springer-Verlag Berlin Heidelberg.
Gaidashova, S., A. Nsabimana, D. Karamura, P. van Asten, and S. Declerck. (2012): Mycorrhizal colonization of major banana genotypes in six East African environments. Agriculture, Ecosystems and Environment 157: 40-46.
Garg, N. and R. Pandey. (2015): Effectiveness of native and exotic arbuscular mycorrhizal fungi on nutrient uptake and ion homeostasis in salt-stressed Cajanuscajan L. (Millsp.) genotypes. Mycorrhiza. 25:165–180.
Guadarrama, P., S. Castillo, J. A. Ramos-Zapata, L. V. Hernández-Cuevas, and S. L. Camargo-Ricalde. (2014): Arbuscular mycorrhizal fungal communities in changing environments: The effects of seasonality and anthropogenic disturbance in a seasonal dry forest. Pedobiologia 57:87–95.
Husband, R, E.A. Herre, and J. P. W. Young. (2002): Temporal variation in arbuscular mycorrhizal communities colonizing seedlings in a tropical forest. FEMS Microbial Ecol 42:131–136.
Kumar A., S. Singh, and A. Pandey. (2009): General microflora, arbuscularmycorrhizal colonization and occurrence of endophytes in the rhizosphere of two age groups of Ginkgo biloba L. of Indian Central Himalaya. Indian J. Microbiol 49:134-141.
Kumar, S. C. P., Seema HS, and R. H. Garampalli. (2012): Occcurence and distribution of arbuscular mycorrhizal fungi in agricultural fields of Mysore. WJST 2(2): 1-7.
Leifheit, E.F., S. D. Veresoglou, A. Lehmann, E. K. Morris, and M. C. Rillig. (2014): Multiple factors influence the role of arbuscularmycorrhizal fungi in soil aggregation—a meta-analysis. Plant Soil 374:523–537.
Liu, W., C.Zheng, Z. Fu, J.Gai, J. Zhang, P. Christie, and X. Li. (2014): Facilitation of seedling growth and nutrient uptake by indigenous arbuscularmycorrhizalfungiin intensive agroecosytems. BiolFertil Soils 50:381–394.
Manaut, N., H. Sanguin, L. Ouahmane, M. Bressan, J. Thioulouse, E. Baudoin, A. Galiana, M. Hafidi, Y. Prin, and R. Duponnois. (2015): Potentialities of ecological engineering strategy based on native arbuscularmycorrhizal community for improving afforestation

42 International Seminar on Biological Sciences (ISBS - 2015)
programs with carob trees in degraded environments. Ecological Engineering 79: 113–119.
Massenssini, A.M., V.H.A. Bonduki, C.A.D. Melo, M.R. Tótola, F.A. Ferreira,and M.D. Costa. (2015): Relative importance of soil physico-chemical characteristics and plant species identity to the determination of soil microbial community structure. Applied Soil Ecology. 8-15.
Meddich, A., F. Jaitib, W. Bourzikc, A. El Aslid, and M. Hafidie. (2015): Use of mycorrhizal fungi as a strategy for improving the drought tolerance in date palm (Phoenix dactylifera). Scientia Horticulturae 192. 468–474.
Moebius-Clune, D. J., B.N. Moebius-Clune, H.M. van Es, and T.E. Pawloska. (2013): Arbuscular mycorrhizal fungi associated with a single agronomic plant host across the landscape: Community differential along a soil textural gradient. Soil Biology & Biochemistry 64: 191-199.
Omirou, M., I. M. Ioannides, C Ehaliotis. (2013): Mycorrhizal inoculation affects arbuscularmycorrhizal diversity in watermelon roots, but leads to improved colonization and plant response under water stress only. Applied Soil Ecology 63: 112– 119.
Peng, W., W. Yin, S. Bo, L. Jin-Fa and X. Ren-Xue. (2015): Relationships between arbuscularmycorrhizal symbiosis and soil fertility factors in citrus orchards along an altitudinal gradient. Pedosphere 25(1): 160-168.
Rodríguez-Morelos, V.H., A. Soto-Estrada, J.S Pérez-Moreno, A. Franco-Ramíre and P. Díaz-Rivera. (2014): Arbuscular mycorrhizal fungi associated with the rhizosphere of seedlings and mature trees of Swietenia macrophylla (Magnoliophyta: Meliaceae) in Los Tuxtlas, Veracruz, Mexico. RevistaChilena de Historia Natural, 87:9.
Schenck, N. C., and Y. Perez. (1990): Mannual for The Identification of VA Mycorrhizal (VAM) fungi. Univ. of Florida Press, Florida, USA. P. 241.
Smith, S.E. and D.J. Read. (2008): Mycorrhizal symbiosis. 3rded. Academic Press, London. Uibopuu, A., M. Moora, M. Öpik, and M. Zobel. (2012): Temperate forest under storey species
performance is alteredby local arbuscularmycorrhizal fungal communities from stands of different successional stages Plant Soil. 356: 331–339.
Urcoviche, R.C., Z. C. Gazim, D. C. Dragunski, F. G. Barcellos, and O. Alberton. (2015): Plant growth and essential oil content of Menthacrispa inoculated with arbuscular mycorrhizal fungi under different levels of phosphorus. Industrial Crops and Products 67: 103–107.
van der Heijden, M.G.A., R.D. Bardgett, and N.M. Van Straalen, (2008): The unseen majority: soil microbes as drivers of plant diversity and productivity in terrestrial ecosystems. Ecology Letters 11: 296-310.
Vierheilig, H., Coughlan, A.P., Wyss, U., Piché, Y., (1998): Ink and vinegar, a simple staining technique for arbuscularmycorrhizal fungi. Applied and Environmental Microbiology 64, 5004-5007.
Wubet, T, I. Kottke, D. Teketay, and F. Oberwinkler. (2009): Arbuscular mycorrhizal fungal community structures differ between co-occurring tree species of dry Afromontane tropical forest, and their seedlings exhibit potential to trap isolates suited for reforestation. Mycol Prog 8:317–328.
Xiao, J.X., C. Y. Hu, Y. Y. Chen, B. Yang, and J. Hua. (2014): Effects of low magnesium and an arbuscularmycorrhizal fungus onthe growth, magnesium distribution and photosynthesis of two citrus cultivars. Scientia Horticulturae 177: 14–20.
International Seminar on Biological Sciences (ISBS - 2015) 43
Potency of Phyllosphere Bacteria of Ornamental Plants (Dieffenbachia maculata., Spathiphyllum comutatum and Syzigium oleina)
in Inhibiting Potential Pathogenic Bioaerosol Microbial from Hospital Environment
Sonia, G., Jamilah, I.* and N. Priyani
Department of Biology, Faculty of Mathematics and Natural Sciences, University of Sumatera Utara. Jl.
Biotechnologi No. 1 Kampus USU, Medan 20155 *E-mail: [email protected]
ABSTRACT Ornamental plants have several usefulnes for human. One of them is to clean the air environment. Existence of potentially pathogenic bioaerosol microbial in hospital environment may cause the insidance of nosocomial infection. This study aimed to obtain phyllosphere bacteria of several ornamental plants to inhibit the growth of potential pathogen isolated from bioaerosol of hospital environment. Air sampling was taken from several spots in the hospital using settle plate technique. Isolation of phyllosphere bacteria was taken from Dieffenbachia maculata., Spathiphyllum comutatum anod Syzigium oleina plants. The most dominant bioaerosol microbial were selected and identified macroscopically and microscopically, then physiological test was performed based on Bergeys’s Manual Determinative Bacteriology, Ninth edition. The most dominant bioaerosol microbial found were: Bacillus sp., Staphylococcus aureus, Staphylocccus epidermidis, Pseudomonas sp., Escherchia coli, Fusarium sp., Penicillium sp., Aspergillus sp., and Neurospora sp. Antagonistic test was perform between phyllosphere bacteria against bioaerosol microbial. Isolates coded: SO1, DF2 and SP1 were the most potential phyllosphere bacteria in inhibiting the growth of bioaerosol potential pathogens. Identification of the tree phyllosphere isolates showed that they were more similar to Pseudomonas.. Keywords: Bioaerosol, ornamental plants, phyllosphere bacteria. INTRODUCTION All of the components in hospital, including human (the paramedics, patients, health workers and visitors) equipments and rooms must be sterile from pathogen microorganisms. Health service activities, including the act of operating in the hospital need facilities and infrastructure that was sterile from pathogenic microorganisms. Airborne microorganisms originated not only from people (including patients), but are also by various indoor hospital characteristics and outdoor environmental sources. Airborne microorganisms and other sources of contamination in hospitals must be reduced to a minimum, because many of the people passing through hospital rooms could be very sensitive to these hazardous agents (Tahir & Buraerah, 2011). Occurrence of nosocomial infections in Indonesia almost increased every year. Research in 11 hospitals in Jakarta in year 2004 showed that 9.8 percent patients got a new infection during undergoing treatment. In addition, preliminary study of nosocomial infections in Jakarta showed the number of nosocomial infections was 227 of 825 patients (Aisyah, 2012). Qudiesat et al. (2009) report that the air quality in terms of biological contamination in the governmental hospital was worse than that of the private hospital in all units in Jordan. Nearly all studies showed that the level of biocontamination is strongly related to the occupant density as well as other factors such as construction, human activities and environment factors. Many effort has been done to reduce nosocomial infection in hospitals in many countries, including Indonesia. But, little known about using plants to reduce bioaerosol microbials in hospital environment. Indonesia is known as country with megabiodiversity including plants. Ornamental plants for example, are often used to decorate and to reduced the

44 International Seminar on Biological Sciences (ISBS - 2015)
impact of pollution. Bacteria associated with plant leaves, or phyllobacteria, probably employ a range of colonization strategies. Microbe filosfer life on the surface and the endophyte of plant leaves. This microbe comes from soil, water, air, plant, or animal brought by particular insects. Filosfer bacteria found in stomata, along the bone and leaves epidermis cell wall (Beattie & Lindow, 1999 and Kamel et al., 2012). This study aim to isolate and identify potential pathogenic bioaerosol microorganisms from Adam Malik General Hospital, Medan, North Sumatera. Then, to isolate and identify phyllosphere bacteria of ornamental plants Dieffenbachia maculata, Syzigium oleina and Spathiphyllum commutatum. The last was to know the abiliy of potential phyllosphere bacteria of several ornamental plants in inhibiting the growth of potential pathogen of the bioaerosol. MATERIALS AND METHODS Isolation of bioaerosol microorganisms Isolation of bioaerosol used Manitol Salt Agar medium (for Gram positive bacteria), Mac Conkey medium (for Gram negative) and Plate Count Agar medium (total number of colonies) and Sabouraud Dextrose Agar media (for fungus). Opened media are directed into air for 15 minutes, in the three locations which were waiting room, corridor and patient-care. Culture was brought to the laboratory and incubated at of 37 °C for 24-48 hours. Growth colonies were observed and dominant colonies were selected and streak plated for purification. Identification of potentially pathogenic bioaerosol bacteria Pure isolates were characterized by looking at the morphology structure, microscopic examination of Gram staining and biochemical tests, including catalase, coagulase, oxidase, spore, indole, methyl-red, sugar fermentation, voges proskauer, motility and citrate test. Identification was based on Bergey's Manual of Determinative Bacteriology (Holt et al., 1994). The most dominant fungi on SDA medium was identified by observing the macroscopic and microscopic structure and compared to Fungi and Food spoilage identification book (Pit & Hocking 1985). Isolation of pyllosphere bacteria of ornamental plants Phyllosphere bacteria was isolated from Dieffenbachia maculata, Spathiphyllum commutatum and Syzigium oleina. Leaf samples were taken from three different locations, in each locations 10 pieces of plant leaves were taken and put into a sterile plastic bag, then brought to the laboratory. Isolation of phyllosphere bacteria were performed by composite leaves group then measured 1 gram, put in erlenmeyer flask containing 100 mL of aquadest and shaker for 1 hour. It was diluted and spread on plate, incubated for growing inoculated into NA medium, and incubated for 2-4 days at the temperature of 30 oC (Santosa et al., 2003).
Antagonist test phyllosphere bacteria of ornamental plants against potential pathogenic bioaerosol microorganisms Pure cultures of pathogenic bacteria suspended in 10 mL of sterile aquadest concentration of 108 CFU/ml was prepared by compare to tandard dilution of Mc Farland. Pathogenic bacteria was inoculated by cotton bud sterile by applying to all surface on the Mueller Hinton Agar medium (MHA). Phyllosphere bacteria was spotted using the blunt of a toothpick into the MHA medium, incubated for 24-48 hours at room temperature, the formation of a clear zone around a bacterial colony as a positive test. Antagonist test of phyllosphere bacteria against potential pathogenic bioaerosol fungi isolated The inner edge of actively growing fungus cultures was taken by using cork borer and it was inoculated on the middle of MHA medium. Phyllosphere bacteria were taken by using blunt tip

International Seminar on Biological Sciences (ISBS - 2015) 45
of a sterile toothpick in the distance of 3 cm from both side of the fungus spot. Identification of phyllosphere bacteria Pure isolates that have capability as antimicrobial was identified and characterized by morphology based of shape, color, edges , elevation of colonies, Gram staining and biochemical test. Characterization of each isolate was identified using Bergey's Manual of Determinative Bacteriology (Holt et al., 1994). RESULTS AND DISCCUSION The most dominant isolates found were 4 types of Gram-negative , 11 types of Gram-positive bacteria group and 4 isolates of fungi (Table 1). The highest number microorganisms were found in the ward with the number of colonies 488 CFU/m3, while the least was in corridor area with the number of 135 CFU/m3. Table 1. The number of bioaerosol microorganisms isolated from Adam Malik Hospital Medan No Group Colonies count on each location Number of each group
Patient unit (L1) Corridor (L2)
Waiting room (L3)
1 Colonies count 191 (488CFU/m3)
57 (135 CFU/m3)
75 (177 CFU/m3)
-
2 Gram positive 27 37 41 11 3 Gram negative 4 2 4 4 4 Fungi 4 4 2 4
It was found that the index numbers of colonies in three locations was still under limit rquirement standard that was 500 CFU/m3 (Indenesia Health Menistry 1204/Menkes/SK/X/2004). The highest index numbers of microorganisms is 488 CFU/ m3 faund at the patient unit. It was close to the limit of air quality standard, so it needs to be oversight. Although the number of bacteria are still eligible but did not rule out the occurrence of nosocomial infections given the state of the patients hospitalized in the room remains vulnerable or in immunocompromised condition. Four isolates of Gram-negative bacteria group were identified as 3 Pseudomonas and one species of E.coli. Elevent Gram-positive bacteria isolates were identified as 6 Bacillus sp., 4 Staphyllococcus aureus and one Staphylococcus epidermidis, whereas on SDA medium were found six fungi isolates, identified as two Penicillium sp., two Fusarium sp., and one Aspergillus sp. and one Neurospora sp. (Table 2). Almost all bioaerosol microorganism found in this hospital area could be found in patient-care unit such as Bacillus sp., Staphyllococcus aureus, Staphyllococcus epidermidis, Pseudomonas sp., E. coli Penicillium sp., Fusarium sp., Aspergillus sp., and Neurospora sp.. Whereas in waiting room, least number of bioaerosol microbial discovered such as Bacillus sp., and Neurospora sp.. The difference may be due to the patient unit is occupied by saveral Table 2. Types of potential pathogenic bioaerosol microorganisms isolated from bioaerosol of Adam Malik hospital, Medan, North Sumatera.
No Group Species Total count isolates
Location
1 Gram positive
Bacillus sp. Staphyllococcus aureus
Staphyllococcus epidermidis
6 4 1
1* & 3* 1 & 2*
1 2 Gram
negative Pseudomonas sp. Escherichia coli
3 1
1 & 2 2

46 International Seminar on Biological Sciences (ISBS - 2015)
3 Fungi Penicillium sp. Fusarium sp.
Aspergillus sp. Neurospora sp.
2 2 1 4
1 1 2
1, 2 & 3 Note 1* Patien-care unit 2* Corridor 3* Waiting rooms
patients, that allowed the microorganisms from patient spread in the air, such as through coughing, sneezing or from their skin, while in waiting room usualy only healty people visit this area. In addition waiting room is open area, where air circulation is higher than patien-care unit, it might cause bioaerosol microbials more spread, so lower in number. Sitti (2012), Bacillus sp, Staphyllococcus sp. and Pseudomonas sp. were found in patient-care unit in Dr. Wahidin Sudirohusodo hospital.
Several types of bioaerosol microorganisms obtained in the air is most likely carried away by the water, dust and spread in the air and may have potential to spread around the patient's environment, the medicals in the hospital and also visitors so that lead to the occurrence of nosocomial infections (Sien et al., 2013). E. coli and Enterobacter aerogenes in the air associated with human feces or contaminated water which then dries up and carried away by the dust flow into the air. Exposured of these bacteria in patients may cause new diseases or worse situation of patients. Different types of microorganisms can be in the air because it close to human activities such as walking, running or driving.
Another type of Gram-negative bacteria that contaminate the air and can cause harm to the respiratory tract were Klebsiella pneumoniae and Pseudomonas aeruginosa. Pseudomonas genus groups commonly found in soil, water, plants, and animals. These bacteria are often present in the normal intestinal flora and on human skin in small quantities Merlin (2012). Pseudomonas aeruginosa is widespread in nature and is usually found in the moist environment of the hospital. Jawetz et al., (2007), noted these bacteria can cause necrotizing pneumonia when the immune system of the host is abnormal or weak. Tahir & Baureah (2011) states that in surgical wards of dr. Wahiddin Sudirohusudo hospital, Makasar, Staphylococcus aureus was a major cause of bacterial nosocomial infections in respiratory tract. In addition to S. aureus it also found some other bacteria such as Pseudomonas sp., E. coli, Enterobacter sp., Klebsiella sp, and Bacillus sp. Only a few of phyllosphere bacteria were able to inhibit bioaerosol microbial (Table 3). SP2 isolate was the most capable of inhibit Aspergillus sp. followed by DF2 isolat to Penicillium sp. then DF3 to Aspergillus sp. Another potential isolat was SO1 isolate to Aspergillus sp. However, DF1 isolat did not show any inhibition zone to any bioaerosol isolate. Phyllosphere bacteria tend to inhibit the fungus more than bacteria. Table 3. Inhibition zone of phylosphere bacteria against potentially pathogenic bioaerosol microorganisms
No. Pathogenic Microorganism
Diameter of Inhibition Zone (cm) DF1 DF2 DF3 SP1 SP2 SP3 SO1 SO2 SO3
1 Staphylococcus aureus 0 0 0 0,4 0 0 0 0 0,6 2 Staphylococcus
epidermidis 0 0 0 0 0 0 0 0 0
3 Bacillus sp. 0 0 0 0,6 0,5 0,5 0 0 0 4 Pseudomonas sp. 0 0 0 0 0 0 0 0,2 0 5 E. coli 0 0 0 0 0 0 0 0 0 6 Penicillium sp. 0 3,7 0 0 0 0 0 0 0 7 Aspergillus sp. 0 0 3,7 0,5 4,3 0 3,2 0 0 8 Fusarium sp. 0 2,7 0 3,2 2,7 0 0 0 0 Three phyllosphere isolates most able to inhibit potentially pathogenic microorganisms, almost has same characteristics. They were identified as Pseudomonas sp. Santosa et al., (2003) stated

International Seminar on Biological Sciences (ISBS - 2015) 47
that nearly 50% phyllosphere contained of Pseudomonas, Xanthomonas and Azotobacter. Bettie and Lindow (1999) explained that Pseudomonas can grow very well on any substrate even it is very complex. Pseudomonas are also able to survive or are resistant to antibiotics and widely used as a biological control agent.
References Aisyah, Z. 2012. Surgical Site Infection (SSI) based on Surveilans Component in Private Hospital
Surabaya. Jurnal Berkala Epidemiologi. 1(2): 254–265. Athanasios, L., Bonetta, S., & Mosso, S. 2012. Assessment od Microbiological Air Qualiy in Italian
Office Building. Environtmental Monitoring Assessment.161: 473. Beattie, G. A., & Lindow, S. 1999. Bacterial Colonization of Leaves: a Spectrum of Strategies.
Phytopathology. 89(5): 353- 359. Holt, J. G., R. K. Noel, P. H. A., Sneath, T., James, S., & Stanley, S. 1994. Bergey's Manual of
Determinative Bacteriology. 9th edition. The Williams and Wilkins Co. Baltimore. Jawetz. E., Melnick J., & Adelberg, E. 2001. Medical Microbiology. Medicals Book. Jakarta. Kamel, F. H., Ismael, H. M., & Ahmed, A. 2012. Effect of Natural Surface Secretes of Some
Common Ornamental Plants Leaves on Pathogenic Microorganisms. Journal Life Science. 6(2) :1387-1390.
Kepmenkes1204/Menkes/SK/X/2004. Term Of Healthy Of Hospital Environment. Merlin. 2012. Study of Microbiology Air Quality (Fungi) Parameter in patient Room RSUP Dr
Ciptomangunkusumo. [Skripsi]. Jakarta: Universitas Indonesia. Pitt J.I., & Hocking A. D. 1985. Fungi and Food Spoilage. Sydney: Academic Press. Qudiesat, K., Elteen, A., Elkarmi, A., Hamad, L., & Abussaud, M. 2009. Assessment of Airborne
Pathogens in Healthcare Settings. African Journal Of Microbiology Research. 3 (2) : 66-76.
Santosa, Handayani & Iswandi. 2003. Isolation and Select Phyllosphere Bacteria to Growth of Paddy (Oryza sativa l.) Varietas IR-64. Soil and Environtment. 5(1): 7-12.
Sien, L. S., Chuan. C. H., Lihan, S., & Yee, L.T. 2013. Isoaltion and Identification of Airbone Bacteria Inside Swiftlet Houses in Sarawak, Malaysia. Makara Journal Sciences. 17 (3): 105-108.
Sitti, F. 2012. Bacteria and Resistences againts Antibiotic on Water and Air From Instalation RSUP Dr. Wahisin Sudirohusodo Makasar. Farmasi dan Farmakologi Magazine. 16(2): 73-78.
Tahir & Baureah. 2011. Physical Environment and Microbe Rate of Indoor Air of Makasar Haji Public Hospital, South Sulawesi. Journal Health Society . 5(5): 206-210.

48 International Seminar on Biological Sciences (ISBS - 2015)
The Use of Various Sugarcane Stem Powders as Artificial Diet for Mass-rearing Chilo sacchariphagus Boj (Lepidoptera: Crambidae)
Lestari, H.*, Tobing, M. C. and D. Bakti
Department Agroecotechnology, Faculty of Agriculture, University of Sumatera Utara
Jl. Prof. A. Sofyan No. 3 Kampus USU , Medan 20155 *E-mail: [email protected]
ABSTRACT Chilo sacchariphagus is an important pest of sugarcane which can make the damage up to 97%, but they are the host of parasitoids. The objective of the research was to study the best variety of sugarcane stem powders as artificial diet. The research used a Non Factorial Randomized Complete Designed by 4 treatments and 10 replications. The treatment consecutively were 6.42 g stem powder variety VMC 76-16, 8.52 g VMC 76-16, 6.42 g PS 862, and the last 8.52 g PS 862. Aplication of 8.52 g stem powders variety VMC 76-16 was significantly effect to the larval length in the 1st instar (± 3.35 mm), 2nd instar (± 7.25 mm), 3rd instar (± 13.45 mm) and 5th instar (± 23.22 mm), and also to the pupal mortality by 20%. While the 6.42 g stem powder variety VMC 76-16 was significantly influences the larval period in the 1st instar (± 8.70 days), 2nd instar (± 6.30 days), 3rd instar (± 7.45 days), 4th instar (± 8.05 days) and 5th instar (± 11.70 days), and the larval mortality in the 1st, 2nd, 3rd (0.00%), 4th and 5th instar (5.00%), the pupal length (± 12.90 mm) and also the pupal weight (± 66.60 mg). Keywords : artificial diet, C. sacchariphagus, variety of sugarcane, stem powder INTRODUCTION Sugar is an important and strategic commodity in Indonesia. The production of sugar in Indonesia in 2014 was only 2.63 million tons/year, while in 2015 to 2016 it is expected to reach 2.97-3.27 million tons/year (Decree of the Minister of Agriculture, 2014). If compared to the major sugar-producing countries in the world, Indonesia was in the 11th position after Brazil (>35 million tons/ year), India (>25 million tons/year) and the EU (>15 million tons/year). Thus in global terms, Indonesia still lags behind in terms of sugar production as compared to the major sugar-producing countries (PDIP, 2015; CPS, 2015).
One reason the low of sugar production in Indonesia is attacking of pest and disease. C. sacchariphagus is the important pest on sugarcane. Every 1% of the damage caused by C. sacchariphagus can decrease 0.5 % of the sugarcane mass and an attacking of a 2-month-plant can decrease the productivity up to 97% (Meidalima and Ramadhalina, 2014). To control C. sacchariphagus technical culture, mechanical, biological and chemical control can be used, but the chemical control should be avoid because it can accumulate on sugar and affect the sugar quality. Biological control uses the natural enemies, parasitoids such as Cotesia flavipes, Trichogamma spp. Tumidiclava and Sturmiopsis inferens (Tampubolon et al., 2014). The mass-rearing of parasitoids can be conducted in laboratory with a host insect (Grenier, 2009). The problem is that the host of parasitoids which has the same age, size and quality is difficult to be found. The mass-rearing of parasitoids depends on the number of larvae in the field which have been parasites or not. C. sacchariphagus is unable to be rear in the laboratory because of the fungi which make high mortality on larvae stadia. The artificial diet is one method for mass-rearing C. sacchariphagus. Artificial diet is richer on nutrition than the natural diet, although it has the same composition as the natural diet because it conducted in laboratory and is free from any contamination of bacteria or fungus (Bhavani, 2013). The objective of the research was to study the best variety of sugarcane stem powder as artificial diets for mass-rearing C. sacchariphagus.

International Seminar on Biological Sciences (ISBS - 2015) 49
MATERIALS AND METHODS This research was carried out in Laboratorium of Centre for Research and Development of Sugarcane at PTPN II, in Sei Mayang, Medan with an altitude of ± 40 meters above sea level from May to August 2015. Non factorial randomized complete design with 10 replications of 4 different treatments was used in which the type of powder was varied, namely: V1 = 6.42 g of sugarcane stem powder variety VMC 76-16 V2 = 8.52 g of sugarcane stem powder variety VMC 76-16 V3 = 6.42 g of sugarcane stem powder variety PS 862 V4 = 8.52 g of sugarcane stem powder variety PS 862
Analysis of variance showed an obvious influence, so it was followed up by a different test average based on Duncan's Multiple Range Test at 5% (Steel and Torrie, 1989). Provision of C. sacchariphagus Larvae Groups of C. sacchariphagus eggs were taken from the mating cage and transferred to the test bottle and covered with black cloth until the eggs turned blackish and hatched after 10-12 days. After hatching and aged ≤ 2 days, the larvae were placed in the feeding bottle.
Diet Preparations Diet ingredients were prepared in two varieties of sugarcane stem powder and were modified form P3GI standard diet.
Table 1. Artificial diet for sugarcane spotted stalk borer (Chilo sacchariphagus) Ingredients Quantity* Sugarcane shoot powder 20 g Sprout of mung bean 175 g Vitamin C 2.6 g Formalin 40% 0.3ml Yeast 25 g Nipagin 1.6 g Sorbic acid 0.8 g Sukrose 20 g Agar powder 10.2 g Water for agar 350 ml Water for blending 120 ml
(P3GI, 2014), *the compositions for 14 bottles. Table 2. Modification of the ingredients artificial diet Ingredietns Quantity** Sugarcane stem powder VMC 76-16 VMC 76-16 PS 862 PS 862
6.42 g 8.52 g 6.42 g 8.52 g
Sprout of mung bean 75 g Vitamin C 1.1 g Formalin 40% 0.12 ml Yeast 10.7 g Nipagin 0.68 g Sorbic acid 0.34 g Sukrosa 8.56 g Agar powder 4.36 g Water for agar 160 ml Water for blending 60 ml
**the compositions for 10 bottles

50 International Seminar on Biological Sciences (ISBS - 2015)
The mung bean was submerged for 12 hours then put into blender and added with the 60 ml water, then all of ingredients were put into blender except agar powder and formalin 40%. Agar was melted in 160 ml of water and put into blender with all ingredients and mixed it, and the last formalin 40% was adeed. Then the diet was put into the bottles that was sterilized with alcohol 70%. The small bottle contained 2.5 g diet, and large one contained 15.5 g diet. The bottles containing the diet were sterilized by UV light 20 minutes. Putting larvae into artificial diet Before larvae were placed on the artificial diet, a small hole or a scratch was first made on the surface of the diet media. Larvae were carefully transferred into the diet until the larvae stuck to the surface of the artificial diet. Two larvae, <2 days aged were placed in each bottle. Pupa-Adults The pupae which treated with the artificial diet was collected and put in petri dish and put on pupae boxes. The adults was collected and put into mating cages. RESULTS AND DISCUSSION Behaviors of C. sacchariphagus on Artificial Diets The 1st instar of C. sacchariphagus did not immediately feed on the diet and they laid the silken filaments on the top of the bottle or on the lid. The silken filaments could enhance the survival of larvae of 1st instar. Yilmaz and Genç (2013) reported that some larvae of olive leaf month Palpita unionalis Hub. (Lepidoptera: Pyralidae) refused to feed on diet and survived only for 3 days, but some other larvae which fed only for 7-10 days on the diet in laboratory, prepared silken filaments and attached themselves on the diet to feed on and completed their first instar.
The result showed that the 2nd instar larvae began to fall the diet and made a little bore, the 3rd instar began to bore the diet actively and they made such a tunnel entrance on the diet to the 4th instar. Vargas et al. (2015) reported that the 3rd to 5th instar of Diatraea saccharalis bored into the stalk, where they continued to develop. The first and second instar were still very transparent with smooth black spots and blackish brown head, when the instar changed they had whitish head and body, after 2-3 days spots and a head turned dark blackish brown. Capinera (2009) reported that the larvae were whitish with a brown head and a stout hair which originated in each of the spots.
The 5th instar (pre pupa) did not actively feed on the diet. In this phase, some of the larvae began climb to the top or to the lid and made silken filaments for pupation but there are some larvae made pupation in the diet. Yilmaz and Genc (2013) reported that pre pupa P. unionalis would make the silken filaments on the diets near the wall to do pupation, then Marti et al. (2008) reported that when the larvae Cactoblastis cactorum (Lepidoptera: Pyralidae) had entered the phase of pre-pupae, the larvae usually left the diet and moved to the top or to the lid and began to spin the silk as place to do pupation. Mortality of Larvae C. sacchariphagus (%) The mortality of the 1st and 2nd instar were ± 0-35%, the 3rd and 4th instar were ± 0-45%, and the 5th instar was ± 5-55%. The lowest mortality was obtained on 6.42 g of sugarcane stem powder variety VMC 76- 16 (Table 3).

International Seminar on Biological Sciences (ISBS - 2015) 51
Table 3. Mortality of larvae C. sacchariphagus (%)
Treatments Instar 1 2 3 4 5
V1 0.00 (n=0)b 0.00 (n=0)b 0.00 (n=0)b 5.00 (n=1)b 5.00 (n=1)b
V2 0.00 (n=0)b 0.00 (n=0)b 0.00 (n=0)b 0.00 (n=0)b 15.00 (n=3)ab
V3 30.00
(n=6)ab 30.00
(n=6)ab 30.00
(n=6)ab 30.00
(n=6)ab 50.00
(n=10)a
V4 35.00 (n=7)a 35.00 (n=7)a 45.00 (n=9)a 45.00 (n=9)a 55.00 (n=11)a
Means followed by the same letters are not significantly different from each other (α 0.05) using DMRT n= Total of mortal larvae from 20 tested larvae T= 26.40-33.00 0C ± 28.50 0C, RH= 60.00-89.00 % ± 75.81 % The highest mortality was on 5th instar (± 5.00-55.00%) it was caused by the drastical temperature change. The average room temperature was 28.50C and the temperature was increased to 33.000C and it caused many dead larvae. Beuzalin (2011) reported that when temperature reached ≥340C it could cause 95% of larvae death. The mortality of larvae for all treatments tie 1st-4th instar was still low because it is below 50%. Panchal and Kahole (2013) reported that the mortality of larvae was low under laboratory condition. Length of Larvae C. sacchariphagus (mm) The length of larvae on the 1st instar was ± 3.00-3.35 mm, 2nd instar (± 4.40-7.25 mm), 3rd instar (± 8.23-13.10 mm), 4th instar (± 9. 87-17.30 mm) and 5th instar (± 12.85-23.22 mm). The longest of larvae were found in the treatment of 8.52 g of sugarcane stem powder variety VMC 76-16 (Table 4). Tabel 4. The length of larvae C. saccariphagus (mm)
Treatments Instar 1 2 3 4 5
V1 3.30 a 7.05 a 13.10 a 17.30 a 22.50 a V2 3.35 a 7.25 a 13.45 a 16.90 a 23.22 a V3 3.00 a 4.40 b 8.23 b 10.70 b 15.70 ab V4 3.20 a 5.50 ab 9.00 b 9.87 b 12.85 b
Means followed by the same letters are not significantly different from each other (α 0.05) using DMRT T= 26.40-33.00 0C ± 28.50 0C, RH= 60.00-89.00 % ± 75.81 % The variety VMC 76-16 with 8.52 g of sugarcane stem powder is recommended P3GI which is equivalent with 20 g of sugarcane shoot powder. The variety VMC 76-16 a better variety than PS 862. P3GI (2009) reported that the variety VMC 76-16 had an average sugar yield of 10.54%, and PS 862 with an average of 10.37%. The larvae stadia of C. sacchariphagus needed protein which was used for growth and development and little carbohydrate for movement. Mcfarlane (1985) reported that the larvae needed little carbohydrate according to their slow metabolism, Ostrinia nubilalis (Lepidoptera: Crambidae) only required 25% of carbohydrate in the diet. The length of larvae was affected by nutrients on diet. The carbohydrate, protein and proportion of nutrients were estimated to affect the length of larvae. Yilmaz and Genc (2013) reported that there were many factors that affect larval feeding on artificial diet, such as proportion and balance of nutrients, moisture level and texture of diet.

52 International Seminar on Biological Sciences (ISBS - 2015)
Larval Period (days) The period of larvae on 1st instar was ± 8.40-8.70 days, 2nd instar (± 6:10 to 6:50 day), 3rd instar (± 7.00-9.90 days), 4th instar (± 5.30 to 13.38 today) and 5th instar (± 8.10-15.75 day) (Table 5). Tabel 5. Larval period C. saccariphagus (days)
Treatments Instar 1 2 3 4 5
V1 8.70 a 6.30 a 7.45 a 8.05 ab 11.70 ab V2 8.40 a 6.10 a 9.90 a 13.38 a 15.75 a V3 8.60 a 6.50 a 7.40 a 7.11 bc 9.15 bc V4 8.50 a 4.30 a 7.00 a 5.30 c 8.10 c
Means followed by the same letters are not significantly different from each other (α 0.05) using DMRT T= 26.40-33.00 0C ± 28.50 0C, RH= 60.00-89.00 % ± 75.81 %
The lenght of larval period of C. sacchariphagus was caused by different environmental conditions and fields. The result showed that V1 (6.42 g VMC 76-16 sugarcane stem powder) was faster than V2 (8.52 g sugarcane stem powder variety VMC 76-16). The total mean of development of larvae period of the sugarcane spotted stalk borer C. sacchariphagus reared under laboratory condition was (±28.50 0C, 75.81%) raging from ±33.2-50.35 days. Yalawar et al (2010) reported that the C. sacchariphagus larval period lasted for 35 to 54 days. Larvae can have 5 to 6 instars. Kashyap et al. (2008) reported that the larval period of potato tuber moth Phthorimaea operculella was longer than the results of the study by Singh and Charles (1977) which stated that these differences occured due to differences in reared conditions.
Stadia of Pupae The stadia of pupae C.sacchariphagus includes pupal lenght (± 7.25-12.90 mm), pupal weight (± 35.85-66.60 mg), pupal mortality (± 20-70%), and pupal period (± 11.20-13.60 days) (Table 6). Tabel 6. Length, weight, mortality and period of pupae C. sacchariphagus
Treatments Pupae Lenght (mm) Wiegt (mg) Mortality (%) Period (days)
V1 12.90 a 66.60 a 70.00 (n=14)a 12.60 ab V2 11.75 ab 65.91 a 20.00 (n=4)b 11.20 b V3 7.75 b 35.85 b 55.00 (n=11)ab 12.20 ab V4 7.25 b 41.14 ab 55.00 (n=10)ab 13.60 a
Means followed by the same letters are not significantly different from each other (α 0.05) using DMRT n= Total of mortal pupae from 20 tested larvae T= 26.40-33.00 0C ± 28.50 0C, RH= 60.00-89.00 % ± 75.81 % The longest and heaviest pupae was found in V1 (6.42 of sugarcane stem powder variety VMC 76-16) ± 12.90 mm and ±66.60 mg. The lowest pupal mortality was in V2 (8.52 g of sugarcane stem powder variety VMC 76-16). The fastest pupal period was in V2 (8.52 g of sugarcane stem powder variety VMC 76-16) ± 11.20 days.
The pupal period of C. sacchariphagus lasted longer than the field condition. Yalawar et al. (2010) reported that the pupal period of C. sacchariphagus was lasted for ± 8-10 days. It was caused as different conditions. Naidu (2009) reported that Pupation of C. sacchariphagus was usually 8 to 9 days but under low temperature it might last up to 22 days.

International Seminar on Biological Sciences (ISBS - 2015) 53
Stadia of Adults The result showed that the best number of adults, the best period of adults and the number of eggs production of C. sacchariphagus were found in treatment V2 (8.52 g of sugarcane stem powder variety VMC 76-16), the number of male was 9 and female was 7, period of male was ± 3.91 days and female was ± 4.58 days (Table 7). Tabel 7. The number of adult, adult period and eggs production C. saccariphagus
Treatments Number of adult
(tails) Period of adult
(days) Number of eggs production Males Females Males Females
V1 2.00 a 3.00 a 2.66 a 4.5 a 0.00 a V2 9.00 a 7.00 a 3.91 a 4.58 a 0.00 a V3 11.00 a 0.00 a 4.00 a 0.00 a 0.00 a V4 5.00 a 2.00 a 4.00 a 3.00 a 0.00 a
Means followed by the same letters are not significantly different from each other (α 0.05) using DMRT T= 26.40-33.00 0C ± 28.50 0C, RH= 60.00-89.00 % ± 75.81 % Table 7 showed that no there was egg production because there was no copulation between 12 females and 27 males, the highest mortality of pupae and the differences in male and female adult hood. Honey (20%) was provided as adults food. Coskun et al. (2005) reported that temperature and nutrients affected the rise of male and female from pupae Pimpla turionellae. The high provision of amino acids increases the number of female individuals. It is obvious that differences in the diets of the adults affected the reproduction activity. Then Ulhaq et al. (2006) told that carbohydrate was a very important component in adult diet for the insects that had pronounced effect on the egg production. Stoffolano (1995) told that in many adult Lepidoptera, carbohydrate served as important energy sources for flying from oviposition sites. Mcfarlane (1985) told that carbohydrate for adult Lepidoptera were obtained from nectar or honey. The small rise of female adults significant differences in the 5th instar, pupal period, andshort life period of adults (± 3-4.58 days) made copulation less successful. Yalawar et al. (2010) reported that pre mating period lasted for 10-12 hours and mating period lasted for 4-6 hours. Then Ngatimin et al. (2014) told that the artificial diet affected the individuals of Troides helena (Lepidoptera: Papilionidae) had a short living period of about 4-6 hour in their sites. On several T. helena females, few eggs reduction in the ovary was observed (based on the dissection after the death of the butterflies) and this made the females fail to conduct the copulation process.
The adults was raised from mass-rearing on artificial diets had abnormality in wings development. It was caused by imperfect formation in pupal stadia. Ngatimin et al. (2014) reported that the crippling wings phenomenon on T. helena males was assumed to be related to the absence of linseed oil in formulation of the artificial diet. Nutrition in the diet in the larvae stage would affect the development of the larvae to be an adult. Holloway et al. (1991) told that Bicyclus butterflies also had abnormal wings due to less fresh food and linseed oil in the diet.
Figure 1. (a) 4th instar, (b)prapupa on the lid of bottle and their silken filaments, (c)the cuticles of larvae, (d)pupa on the lid and (e)pupa in the artificial diet and (f)the abnormal adults
(a)
(c) (f) (b)
(d)
(e)
54 International Seminar on Biological Sciences (ISBS - 2015)
The best artificial diet was found in the treatment of 8.52 g sugarcane stem powder variety VMC 76-16 with larval lenght (± 3.35-23.22 mm), larval mortality (15%), pupal mortality by 20% and number of adults (15 adults from 20 larvae). The low larval mortality (5-55%) can be used for mass-rearing of C. sacchariphagus as host parasitoids. But, further research is required to perfect the diet and rearing protocol in order to produce fertile adults, normal adults and eggs. To enhance eggs production, a large scale of C. sacchariphagus adults from artificial diet are needed so that copulating process can run smoothly. Acknowledgement The authors thank to anonymous reviewers for useful suggestions on the earlier version of the manuscript all staff in laboratory of Sei Semayang centre for research and development of sugarcane PTPN II, Medan, North Sumatera. This research was based partly on the undergraduate thesis of Herliza Lestari supervised by Maryani Cyccu Tobing and Darma Bakti. References Beuzelin, J.M. (2011): Agroecological factors impacting stem borer (Lepidoptera: Crambidae)
dynamic in gulf coast sugarcane and rice. Dissertation. Dep. Entomology, Louisiana State University.
Bhavani, B. (2013): Studies on the biology of sugarcane early shoot borer, Chilo infuscatellus Snelen on artificial diets in North Coastal region of Andhra Pradesh, India. J. Soc. Scie. Interdisc. Res. 2(9):70-89.
Capinera, J. L. (2009): Life cycle of Diatraea saccharalis (Fabricius) (Insecta: Lepidoptera: Pyralidae). Entomology and Nematology Departement, University of Florida.
Commodity Profile of Sugar for August 2015. Downloaded from http://www.agricoop.nic.in/imagedefault/.../SugarNew29.pdf
Coskun, M., Ozalp, P., Sulanc, M. and Emre, I. (2005): Effects of various diets on the oviposition and sex ratio of Pimpla turionellae L. Inter. J. Agric. Biol. 7(1):129-132.
Direktorat Jendral Tanaman Perkebunan. (2014): The Productivity of Sugarcane based provinces in Indonesia 2010-2014. Jakarta.
Decree of The Minister of Agriculture, (2015): Policy of agricultural development 2015-2019. Musrenbang Regional Kalimantan. www.pertanian.go.id.
Grenier, S. (2009): In vitro rearing of entomophagous insects past and future trend: a minireview. Bull. Insect. 62(1):1-6
Holloway, G.J., Brakefield, P.M., Kofman, S. and Winding, J.J. (1991): An artificial diet for butterflies, including Bicyclus species, and its effect on development period, weight, and wing pattern. J. Res. Lepidoptera. 30(1-2):121-128.
Kashyap, S., Chakrabarti, S.K., Pattanayak, D., Chandran, K.P., Gautam, D.C., Chandla. V.K. and Naik. P.S. (2008): A modified of artificial diet for rearing potato tuber moth, Phthorimaea operculella (Zeller). J. Potato. 35(3-4):141-146.
Marti, O.G., Myers, R.E. and Carpenter, J.E. (2008): Rearing Cactoblastis cactorum (Lepidoptera: Pyralidae) on artificial diet and Opuntia cladoses. J. Entomol. Sci. 43(1):95-106.
Mcfarlane, J.E. (1985): Nutrition and digestive organs. (ed). Blum, M.S. Fundamentals of Insect Physiology. Department of Entomologi Macdonald Collage of McGill University Quebec, Canada.. A Willey-Interscience Publication. Canada. 77pp.
Meidalima, D. and Ramadhalina, R.K. (2014): The potential loss by Chilo sacchariphagus on Sugarcane crops in land laring cinta manis ogan hilir. Proceedings of the National Seminar on Land Suboptimal. 26-27 September 2014 Palembang.
Naidu, P. (2009): Integrated Pest Management in Sugarcane. Assignment part of module B. XII. Ngatimin, S.N.A., Saranga, A.P., Agus, N., Achmad, A. and Ridwan, I. (2014): Two artificial diet
International Seminar on Biological Sciences (ISBS - 2015) 55
formulations for Triodes helena linne larvae (Lepidoptera: Papilionidae) in Bantimurung-Bulusaraung National Park, South Sulawesi. Int. J. Sci. Tech. Res. 3(7):170-173.
Nugroho, B.A. (2009): Pest of shoot borer and controlling. Direktorat Jendral Perkebunan. Jakarta. Panchal, B.M. and Kachole, M.S. (2013): Life cycle of Chilo pertellus (Swinhoe) (Lepidoptera:
Pyralidae) on artificial diets. J. Pl. Anim. Envirom. Sci. 3(4):19-22. Pusat Penelitian Perkebunan Gula Indonesia (P3GI), 2009. Pasuruan. West Java.
www.sugarresearch.org Tampubolon, A., Marheni dan Bakti, D. (2014): The influence of sex ratio Cotesia flavipes Cam.
(Hymenoptera: Braconidae) and the length host of Chilo sacchariphagus Boj. (Lepidoptera : Crambidae) on the resulting fecundity in laboratory. J. Online Agro. 3(1):71-78.
Singh, Pritam and Charles. J.G. (1977): An artificial diet for the larvae of potato tuber moth. New Zealand Journal of Zoology. 4: 449-51.
Steel, R. G. D and J. H. Torrie. (1989): Principles and procedures of statisties, a biometrical approach. Mc. Graw-Hill Kogakusha Ltd., Tokyo.
Stoffolano, Jr. J.G. (1995): Regulation of a Meal in dipteral, Lepidoptera, and Hymenoptera. (ed). Chapman. R.F., and G. de Boer. Regulatory Mechanism in Insect Feeding. Champan and Hall USA. 226pp
Ulhaq, M.M., Sattar, A., Salihah, Z., Farid, A., Usman A. and Khattak, S.U.K. (2006): Effect of different artificial diets on the biology of adult green lacewing Chrysoperla carnea Stephens. J. Sci. Technol. 28(1):1-8
Vargas, G., Gómez, L.A. and Michaud, J.P. (2015): Sugarcane stem borers of the Colombian couca river valley: current pest status, biology, and control. J. Flor. Entomol. 2(98):728-735.
Yalawar S., Pradeep, S., Kumar, M.A.A., Hosamani, V. and Rampure, S. (2010): Biology of sugarcane internode borrer, Chilo sacchariphagus indicus (Kapur). J. Agric. Sci. 23(1):140-141.
Yilmaz, Ç. and Genç, H. (2013): The first attempt to rear olive leaf moth Palpita unionalis Hubner (Lepidoptera: Pyralidae) on artificial diet. J. Biol. Environ. Sci. 7(19):25-32
56 International Seminar on Biological Sciences (ISBS - 2015)
Prospects of Using Tropical Plant Biomass Resources for Potential Benefits in Sustainable Biotechnology
Punnapayak, H.*,Prasongsuk, S.,Bankeeree, W. and P. Lotrakul
Plant Biomass Utilization Research Unit, Department of Botany, Faculty of Science, Chulalongkorn University, Bangkok, 10330, Thailand
*E-mail: [email protected]
ABSTRACT Plant biomass is recognized as the important organic renewable resources. It comprises mainly of cellulose, hemicellulose, lignin and some other components such as cutin and suberin. Fungi capable of the degradation of these biomass components were isolated from various habitats in Thailand. Fungal enzymes responsible for the degradation of these compounds were characterized. These enzymes included cellulase, hemicellulase, ligninases, cutinase, and suberinase. The prospects of using these enzymes and their potential products for benefits in biotechnology were investigated. Beginning with the tropical resources, various weeds were subjected as substrates for bioethanol production. Cattail and guinea grass were found to have the potential of producing ethanol up to 22.36 kg 100 kg-1 and 18.75 kg 100 kg-1, respectively. Aureobasidium pullulans is one of the outstanding epiphytic yeast. It is a good xylanase producer with negligible cellulase activity. Moreover, A. pullulans produced the pullulan polymer and a variety of products with potential applications such as antimicrobial agents and heavy oil. Fusarium solani produced cellulase, cutinase and suberinase. These enzymes have potential application in fabric industry. The products and process from the association and degradation of various tropical plant biomass resources have led to several potential applications for the development of sustainable biotechnology industry which are important for the future progress. Keywords: bioethanol, biomass degradation, ligninocellulolytic enzymes, pullulan INTRODUCTION Plant biomass has played important roles throughout the development of mankind since prehistoric era. More understanding of the plant biomass, respectively in its chemical composition and structure, is a prerequisite for developing effective ways to utilize this renewable resource. Southeast Asian countries are situated in the tropical region and mostly are abundant with biodiversity and plant biomass resource (Gentry 1992). In nature, fungi are important for the biological degradation of plant biomass. They produce key enzymes for the degradation of lignocellulose including cellulase, hemicellulase (xylanase) and ligninase. The association between plant and fungi often lead to the production of potential products for benefit in sustainable biotechnology including biorefinery products such as bioethanol (Punnapayak et al. 1999), biopolymer (Prasongsuk et al. 2007; Lotrakul et al. 2013), and fermentation chemicals(Lotrakul et al. 2009; Prasongsuk et al. 2013). Moreover, some of the potential process could be derived for the green industry and cleaner environment such as textile processing (Prasongsuk et al. 2009) and bioremediation for waste water treatment (Punnapayak et al. 2009; Thongkred et al. 2011). We have compiled and described our discovery of these prospects of plant biomass utilization for potential benefits in this report to show the significance of the tropical plant biomass resources and their utilization. MATERIALS AND METHODS 1. Collection and identification of potential natural resources
1.1 Plants Typha angustifolia (cattail) and Panicum maximum (guinae grass) were collected from
International Seminar on Biological Sciences (ISBS - 2015) 57
central regions of Thailand. Plant materials were dried and analyzed for their compositions by technique of Goering and Van Soest (1970). Theoretical yields of ethanol were estimated from their cellulosic content assuming 100% fermentation yield (Punnapayak and Hoffmann 1994).
1.2 Fungal strains Fungi were isolated from various habitats throughout Thailand including the
northernprovinces (Chiangmai, Chiang Rai, Nan, Loei, Petchaboon, Phitsanulok and Mae Hong Son), southern provinces (Prachuap Khiri Khan, Songkhla, Trang and Pattani), northeastern provinces (Nakorn Ratchasima, Udonthani, Nongkhai and Roi Et), eastern provinces (Sakaew, Chonburi and Rayong), Western region (Kanchanaburi and Ratchaburi) and central provinces (Bangkok, Patumthaniand Phetchaburi).They were identified by both classical microscopic examination of their morphology and molecular techniques using mainly sequences from internal transcribe spacer (ITS) and partial 28 S rDNA (Nimchua et al. 2008), intergenic spacer region (IGS), RNA polymerase II (RPB2), β-tubulin (BT2), translation elongation factor (EF-1α), nuclear large subunit (LSU) rRNA and nuclear small subunit (SSU) rRNA (Manitchotpisit et al. 2009). 2. Enzyme analysis
Enzymes capable of the degradation of lignocellulose were screened, produced and assayed. The following methods were described accordingly cellulase (Punnapayak et al. 1999), xylanase (Manitchotpisit et al. 2009; Bankeeree et al., 2014), ligninase (Punnapayak et al., 2009; Prasongsuk et al. 2009; Thongkred et al. 2011), cutinase and suberinase (Nimchua et al., 2007; Nimchua et al., 2008). 3. Analysis of potential products
3.1 Biopolymers Biopolymers produced from Aureobasidium pullulans were extracted and analyzed by
methods described by Prasongsuk et al. (2007) and Lotrakul et al (2013). 3.2 Antimicrobial agent
The antifungal agent was extracted from A. pullulans according to the method of Lotrakul et al (2009). The antifungal activity against four different Aspergillus species was evaluated using the well diffusion and conidial germination assays (Prasongsuk et al. 2013). Moreover, the structure of the antifungal agent was analyzed using thin layer chromatography (TLC) and 1H-nuclear magnetic resonance (NMR)using a Varian Inova-500 NMR System equipped with a CP/MAS solid state probe and nanoprobe, operating at 500 MHz..
3.3 Heavy oil Droplets of heavy oil were observed accumulating in liquid cultures of A. pullulans
isolates which was extracted by the method of Manitchotpisit et al. (2011b). The properties of these oils were also investigated using fluorescent microscopy, matrix-assisted laser desorption/ionization mass spectrometry (MALDI MS) andmammalian cell culture inhibition method.
RESULTS AND DISCUSSION Natural resources and their potential biotechnology application
1. Plants for bioethanol Tropical weeds including Panicum maximum and Typha angustifolia were found to have
considerable potential as feedstock for bioethanol production in comparison to other weeds in the region with the data from other researchers. P. maximum showed good potential in term of high productivity of 16 t ha-1, low sulfur value and the theoretical ethanol yield up to 22.36 kg 100kg-1 dry weight. T. angustifolia could be perceivably suitable for lowland areas. However, the availability of the vast area for adequate supply of these weeds remains the major challenge, even though the appropriate technology to process these feedstock for biomass conversion such as the simultaneous saccharification and fermentation (SSF), do exist.
2. Fungi Fungi are integral parts of the plant biomass and their environs. List of tropical fungi that we
58 International Seminar on Biological Sciences (ISBS - 2015)
have investigated are summarized in Table 2. Cellulolytic fungi were commonly found associated with plant biomass. Acrophialophora nainiana was notable for being thermotolerant and produced cellulase at 45°C while the commercial strain, Trichoderma reesei QM 9414did not. Bioconversion using the simultaneous saccharification and fermentation (SSF) involving A. nainiana and Saccharomyces cerevisiae gave the ethanol yield of 0.11 g/g (22% conversion) and 0.17 g/g (33% conversion) from Agave sisalana biomass and paper substrate, respectively (Punnapayak et al. 1999). Both Fusarium oxysporum and F. solani were cellulolytic fungi. Moreover, they produced cutinase and suberinase enzymes. These enzymes could be used to modify polyethylene terephthalate (PET) leading to the environmental-friendly scouring process in textile industry to assist dyeing of polyester fabrics. Moreover, the enzymatic reactions could lead to the process of biodegradation of plastic wastes (Nimchua et al. 2007, 2008). Ganoderma lucidum, Phanerochaete chrysosporium and Pycnoporus coccineus were all ligninase producers. They have potential for process development in the bioremediation of polycyclic aromatic hydrocarbons (PAHs), waste water treatment and pulp bleaching process in pulp and paper manufacturing. A. pullulans was the remarkable epiphytic yeast producing not only good quality of xylanase with potential application for pulp bleaching and deinking (Bankeeree et al., 2014), but also for the pullulan biopolymer, heavy oil and antifungal agent. Pullulan is currently used as biofilm for food, pharmaceutical and cosmetics (Leather 2003; Cheng et al. 2011).
In conclusion, tropical plant biomass resources, in association with fungi, have shown great potential for products and process in the sustainable biotechnology development. Southeast Asian countries, such as Indonesia and Thailand, with abundant tropical natural resources could definitely derive benefits from these resources through research, development and net-working for the process and the prosperous future.

International Seminar on Biological Sciences (ISBS - 2015) 59
Table 1. Potential bioethanol production from tropical weeds Weed Dry weight Cellulose Hemicellulose Lignin Sulfur Theoretical ethanol Theoretical ethanol References (t ha-1) (%) (%) (%) (%) yields (kg 100kg-1) yields (t ha-1) Panicum maximum 16.0 39.39 28.31 10.65 0.06 22.36 3.58 This study Typha angustifolia 9.0 33.03 27.66 10.22 1.20 18.75 1.64 This study Cyperu siria NR 33.42 31.00 7.70 NR 18.96 NR Premjet et al. 2012 Mimosa pigra NR 33.55 11.73 15.92 NR 19.05 NR Premjet et al. 2012 Pennisetum polystachyon NR 39.85 29.29 14.6 NR 22.62 NR Tatijarern et al. 2013 Brachiaria ruziziensis 14.1 33.6 34.0 4.6 NR 19.08 2.69 Banka et al., 2015 Pennisetum purpureum 7.7 36.5 32.9 3.6 NR 20.72 1.60 Banka et al., 2015 Vetiveria zizanioides 3.5 34.0 32.6 4.8 NR 19.30 0.68 Banka et al., 2015 *NR = No report
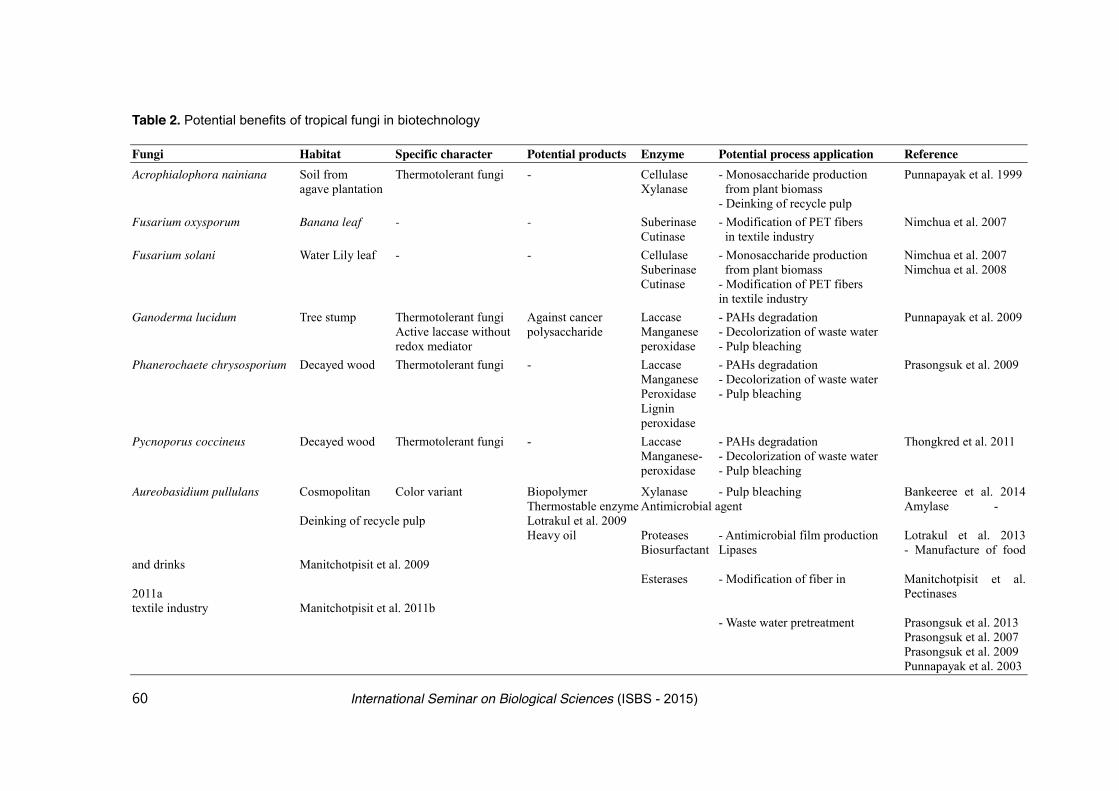
60 International Seminar on Biological Sciences (ISBS - 2015)
Table 2. Potential benefits of tropical fungi in biotechnology Fungi Habitat Specific character Potential products Enzyme Potential process application Reference Acrophialophora nainiana Soil from Thermotolerant fungi - Cellulase - Monosaccharide production Punnapayak et al. 1999 agave plantation Xylanase from plant biomass - Deinking of recycle pulp Fusarium oxysporum Banana leaf - - Suberinase - Modification of PET fibers Nimchua et al. 2007 Cutinase in textile industry Fusarium solani Water Lily leaf - - Cellulase - Monosaccharide production Nimchua et al. 2007 Suberinase from plant biomass Nimchua et al. 2008 Cutinase - Modification of PET fibers in textile industry Ganoderma lucidum Tree stump Thermotolerant fungi Against cancer Laccase - PAHs degradation Punnapayak et al. 2009 Active laccase without polysaccharide Manganese - Decolorization of waste water redox mediator peroxidase - Pulp bleaching Phanerochaete chrysosporium Decayed wood Thermotolerant fungi - Laccase - PAHs degradation Prasongsuk et al. 2009 Manganese - Decolorization of waste water Peroxidase - Pulp bleaching Lignin peroxidase Pycnoporus coccineus Decayed wood Thermotolerant fungi - Laccase - PAHs degradation Thongkred et al. 2011 Manganese- - Decolorization of waste water peroxidase - Pulp bleaching
Aureobasidium pullulans Cosmopolitan Color variant Biopolymer Xylanase - Pulp bleaching Bankeeree et al. 2014 Thermostable enzyme Antimicrobial agent Amylase - Deinking of recycle pulp Lotrakul et al. 2009
Heavy oil Proteases - Antimicrobial film production Lotrakul et al. 2013 Biosurfactant Lipases - Manufacture of food and drinks Manitchotpisit et al. 2009 Esterases - Modification of fiber in Manitchotpisit et al. 2011a Pectinases textile industry Manitchotpisit et al. 2011b - Waste water pretreatment Prasongsuk et al. 2013 Prasongsuk et al. 2007 Prasongsuk et al. 2009 Punnapayak et al. 2003

International Seminar on Biological Sciences (ISBS - 2015) 61
Acknowledgement The authors wish to thank the support by the German Academic Exchange Service
(DAAD) fund, Eveleigh-Fenton Fund (Rutgers University), JSPS (Core-to-Core Program) and Ratchadaphiseksomphot Endowment Fund of Chulalongkorn University. Collaborations with Korea University, Kyoto University, Yamaguchi University and Louisiana State University are highly appreciated. References Banka, A., T. Komolwanich and S. Wongkasemjit (2015): Potential Thai grasses for bioethanol
production. Cellulose. 22(1): 9-29. Bankeeree W., Lotrakul P., Prasongsuk S., Chaiareekij S., Eveleigh D.E., Kim S.W. and Punnapayak H.
(2014): Effect of polyols on thermostability of xylanase from a tropical isolate of Aureobasidium pullulans and its application in prebleaching of rice straw pulp.SpringerPlus. 18(3): 37.
Gentry, A. H. (1992): Tropical forest biodiversity: distributional patterns and their conservational significance.Oikos.19-28.
Goering, H. K. and P.J. Van Soest. (1970): Forage Fiber Analysis (apparatus, reagents, procedures and some applications), Virginia, U.S. Agricultural Research Service.
Leathers, T.D. (2003): Biotechnological production and applications of pullulan.Applied Microbiology and Biotechnology 62.5-6 468-473.
Lotrakul P., Deenarn P., Prasongsuk H. and Punnapayak H. (2009): Isolation of Aureobasidiumpullulans from bathroom surfaces and their antifungal activity against some Aspergilli. African Journal of Microbiol Resource. 3(5): 253-257.
Lotrakul P., Unhapattaratitikul P., Seelanan T., Prasongsuk S. and Punnapayak H. (2013): An Aubasidan-like β-glucan produced by Aureobasidium pullulans in Thailand. ScienceAsia. 39: 363-368.
Manitchotpisit P., Leathers T.D., Peterson S.W., Kurtzman C.P., Li X.L., Eveleigh D.E., Lotrakul P., Prasongsuk S., Dunlap C.A., Vermillion A.E. and Punnapayak H. (2009): Multilocus phylogenetic analyses, pullulan production and xylanase activity of tropical isolates of Aureobasidium pullulans. Mycological Research. 113(10): 1107-1120.
Manitchotpisit P., Skory D.C., Leathers T.D., Lotrakul P., Eveleigh D.E., Prasongsuk S. and Punnapayak H. (2011a): Alpha-amylase activity during pullulan production and a-amylase gene analyses of Aureobasidium pullulans. Journal of Industrial Microbiology & Biotechnology. 38: 1211-1218.
Manitchotpisit P., Price N.P., Leathers T.D., Punnapayak H. (2011b): Heavy oils produced by Aureobasidium pullulans. Biotechnology letters. 33(6):1151-1157.
Nimchua T., Punnapayak H., Zimmermann W. (2007): Comparison of the hydrolysis of polyethylene terephthalate fibers by a hydrolase from Fusarium oxysporum LCH I and Fusarium solani f. sp. pisi. Biotechnology Journal 2(3):361-364.
Nimchua T., Eveleigh D. E., Sangwatanaroj U. and Punnapayak H. (2008): Screening of tropical fungi producing polyethylene terephthalate-hydrolyzing enzyme for fabric modification. Journal of Industrial Microbiology & Biotechnology. 35(8): 843-850.
Prasongsuk S., Berhow M.A., Dunlap C.A., Weisleder D., Leathers T.D., Eveleigh D. E. and Punnapayak H. (2007): Pullulan Production by Tropical Isolates of Aureobasidium pullulans. Journal of Industrial Microbiology & Biotechnology. 34: 55-61.
Prasongsuk S., Lotrakul P., Imai T. and Punnapayak H. (2009): Decolourization of pulp mill wastewater using thermotolerant white rot fungi. ScienceAsia. 35:37-41
Prasongsuk S., Ployngam S., Wacharasindhu S., Lotrakul P., Punnapayak H. (2013): Effects of sugar and amino acid supplementation on Aureobasidium pullulans NRRL 58536 antifungal

62 International Seminar on Biological Sciences (ISBS - 2015)
activity against four Aspergillus species. Applied Microbiology and Biotechnology. 97(17): 7821-7830.
Premjet S., Pumira B. and Premjet D. (2012): Determining the potential of inedible weed biomass for bio-energy and ethanol production. BioResources. 8(1): 701-716.
Punnapayak H.and Hoffmann J.J (1994): "Amsonia spp. As potential fuel crops for arid lands. World Journal of Microbiology & Biotechnology. 10: 290-292.
Punnapayak H., Kuhirun M. and Thanonkeo P. (1999): Cellulolytic Fungi and the Bioconversion of Fiber from Agave sisalina. ScienceAsia. 25: 133-136.
Punnapayak H., Sudhadham M., Prasongsuk S., Pichayangkura S. (2003): Characterization of Aureobasidium pullulans isolated from airborne spores in Thailand. Journal of Industrial Microbiology and Biotechnology. 30: 89-94.
Punnapayak H., Prasongsuk S., Messner K., Danmek K. and Lotrakul P. (2009): Polycyclic aromatic hydrocarbons (PAHs) degradation by laccase from a tropical white rot fungus Ganoderma lucidum. African Journal of Biotechnology. 8(21): 5897-5890.
Tatijarern, P., S. Prasertwasu, T. Komalwanich, T. Chaisuwan, A. Luengnaruemitchai and Wongkasemjit S. (2013): Capability of Thai Mission grass (Pennisetumpolystachyon) as a new weedy lignocellulosic feedstock for production of monomeric sugarBioResources. 143: 423-430.
Thongkred P., Lotrakul P., Prasongsuk S., Imai T., Punnapayaka H. (2011): Oxidation of polycyclic aromatic hydrocarbons by a tropical isolate of Pycnoporus coccineus and its laccase. Science Asia 37: 225-233.
International Seminar on Biological Sciences (ISBS - 2015) 63
Potential of Phyllosphere Bacteria of Ornamental Plants to Inhibit Potential Pathogenic Bioaerosol Microorganism of Hospital
Environment
Margaretha, I, Jamilah , I* and D. Suryanto
Departmen of Biology, Mathematic and Natural Science Faculty, University of Sumatera Utara. Jl.
Biotechnologi No.1 Kampus USU, Medan 20155 *E-mail: [email protected]
ABSTRACT Bioaerosol is a suspension of airborne particles that contain living organisms such as bacteria, fungi and viruses. Bioaerosol in the hospital environment could become a source of desease cause microbial that have a important role in transmission of nosocomial infection. This study aimed to determine the potention of phyllosphere bacteria of ornamental plants in controlling the growth of dominant bioaerosol microorganism that potential as pathogen isolated from ambient air in several locations in Dr. Pirngadi Hospital, Medan, North Sumatera. Isolation media used were Manitol Salt Agar, Mac Conkey, Plate Count Agar and Saboroud Dextrose Agar plate, that exposed to air for 15 minutes. In the meantime phyllosphere bacteria were isolated from three kinds of ornamental plants; Ficus elastica, Philodendron bipinnatifidum and Aglaonema simplex. Bioaerosol bacteria isolated from hospital were Staphylococcus aureus, Staphylococcus sp., Bacillus sp., Streptococcus sp., Pseudomonas sp., Salmonella sp., Shigella sp., and fungi of the genus Aspergillus, Alternaria, Trichoderma, Neurospora, Fusarium and Penicillium. Inhibitory activity test of phyllosphere bacteria against bioaerosol microbes indicated that bacteria of A. simplex (AS2) had the highest inhibitory effect on the growth of bioaerosol fungi, Mucor sp. (the inhibitory zone was 4.2 cm). It followed by bacterial of P. bipinnatifidium (PB2) against Mucor sp (3.7 cm)., while the highest inhibition of bacteria of F. elastica was shown by isolate FE2 against Mucor sp.which was 2.4 cm. All potential phyllosphere isolated bacteria belong to the genus of Pseudomonas. Isolated phyllosphere bacteria of ornamental plants showed better inhibition against bioarosol fungi than bioaerosol bacteria. Keywords : bioaerosol, nosocomial infections, ornamental plants, phyllosphere bacteria INTRODUCTION Bioaerosol of hospital environment could be a transmition of some infection diseases. It can be derived from patient, indoor and outdoor environments, and also paramedic action. Such microorganisms potentially cause infections in susceptible patients and visitors, resulting different diagnosis of diseases than previously suffered by patients when first admitted to hospital. This condition commonly referred as nosocomial infections (Harper, 2013). Several hospital in Indonesia reported that the number of nosocomial infection case were high, for example in RSU dr. Pirngadi, Medan in (2006) reached 32,16 %.
Bioaerosol management to prevent nosocomial infections has been done in various ways. But not every hospital could do it well because of several factors, such as hight cost. One way that is considered potential to minimize pathogen contamination in the air is the cultivation of ornamental plants. The parts of plant inhabiting by microorganisms, located on the ground and direct contact with the air called phyllosphere (Lindow et al., 2003). Bacteria are the most important group that colonize plant leaves, the ranges could be between 106-107 colonies/cm2 of leaf (Hirano and Upper, 2000).`
Previous research by Kamel et al. (2012) showed that bacteria of leave rinsing water of Ficus elastica, Philodendron bipinnatifidium and Aglaonema comutatum were able to inhibit the growth and reduced the number of human pathogens bacteria. Phyllosphere bacteria living on the leaves use organic compounds such as fructose, sucrose, organic acids, amino acids, and

64 International Seminar on Biological Sciences (ISBS - 2015)
vitamins that serve as a source of carbon. Differences of leaf exudates secreted in certain plant species effect different bacteria on the leaves (Widyawati, 2013).
Based on previous research, the question appear about the role of phyllosphere bacteria of ornamental plants in controlling the growth of human pathogenic bioaerosol, especially in the hospital that have most likely potential in transmission of nosocomial infections. MATERIALS AND METHODS Isolation of bioaerosol microorganisms Isolation procedures of bioaerosol microorganism were based on Malaysia veterinary health air quality sampling method (Sine et al, 2013). Some sterile petridisk contained Manitol Salt Agar medium (for Gram positive bacteria), Mac Conkey medium (for Gram-negative) and Plate Count Agar medium (for quantitative count) and Sabouraud Dextrose Agar media (for fungus), were directed into the air for 15 minutes, on three-specified locations around the hospital. Sample was transfered to the laboratory and incubated at 37 °C for 24-48 hours. Growing colonies were observed and then the most dominant colonies were selected for further work. Identification of bioaerosol bacteria Dominat bacteria colonies on MSA and MC medium was characterized for the colonie morphology, Gram staining then identified by biochemical tests, including catalase, coagulase, oxidase, spore, indole, methyl-red, sugar fermentation, voges proskauer, motility and citrate test based on Bergey's Manual of Determinative Bacteriology (Holt et al., 1994). The most dominant fungi on SDA medium was identified by observing the macroscopic and microscopic structure by Fungi and Food Spoilage Identification Book (Pit & Hocking 1985). Isolation of phyllosphere bacteria Isolation of phyllosphere bacteria was taken from ornamental plants; Dieffenbachia maculata, Ficus elastica, Philodendron bipinnatifidium and Aglaonema simplex. Plant leave samples were taken from three different locations. In each location 10 leaves was taken randomly from each plant and kept in a sterile plastic, then brought to the laboratory. Leaves were surface sterilized and weighed, 1 gram was put in the erlenmeyer flask containing 100 mL of aquadest and shakeed for 1 hour. Each group was diluted and pour into NA medium, incubated in ambient temperature for 2-4 days(Santosa et al., 2003). Antagonist test of phylosphere bacteria of ornamental plants against potential pathogenic bioaerosol microorganisms Pure cultures of pathogenic bacteria suspended in 10 mL of sterile aquadest and dilute to get enough cell numbers (±108 cfu/ml) in accordance to Mc Farland standard. Bacteria were inoculated with sterile cotton bud by applying to the surface of MHA medium (Mueller Hinton Agar). Phylosophere bacteria isolate was spotted using the blunt tip of a toothpick into the MHA medium, then incubated for 24-48 hours at room temperature. The formation of a clear zone around a bacterial colony was notified as a positive test. Antagonist test of phyllosphere bacteria against potential pathogenic bioaerosol fungi The inner edge of actively growing fungus cultures was taken by using cork borer and inoculated on the middle of MHA medium. Phyllosphere bacteria isolate was taken by using blunt tip of a toothpick in 3 cm distant from the fungus spotted culture. Identification of phyllosphere bacteria isolate Pure isolates that have the apability of antimicrobial was identified and characterized by morphology examination, continued with Gram staining and biochemical test and identified based on Bergey's Manual of Determinative Bacteriology (Holt et al. 1994).

International Seminar on Biological Sciences (ISBS - 2015) 65
RESULTS AND DISCCUSION Isolation of microorganisms bioaeresol in Pirngadi Hospital, Medan it was obtained 12 dominant colonies of Gram-positive bacteria, 3 colonies of Gram-negative, and 11 colonies of fungi (Table 1). The most numerous colonies were found in the corridor (Area 1) that as many as 214 cfu / m3. This could be due to in the corridor more people passing through freely, both visitors as well as paramedics, so that the microorganisms from outside the hospital can be carried into the room through food or other media that was brought in. The least present of air bacteria was in patients-care area (Area 2) that only as much as 71 cfu/m3. In this area, special handling was applied such as regular floor cleaning and sanitizing, door clossing, limit visitor number and time, to kept hospitalized patients remain in the hygienic condition. Table 1. The number of isolated bioaerosol microorganisms in Pirngadi Hospital, Medan
Microbial Group Number of colony Number of the
dominant colony Corridor (L1) Hospitalized
patient room Waiting room
Total Plate Count 90 (214 cfu/m3) 30 (71 cfu/m3) 65 (154 cfu/m3) - Fungi 14 9 3 11 Gram positive 42 31 27 12 Gram negative 3 3 3 3
Hospital consisted of a variety of spaces with different functions depending on the type of disease and differences in medical action. Difference function of room requires air conditioning of different levels of cleanliness. The density of people in patient room is much less than in the corridor. Human activities such as coughing, sneezing and talking can be a source of indoor air pollutants because it can spread particles of grain air (aerosol). It could increase as densities being higher.
Bacteria index number in Pirngadi hospital still fulfill the requirements of environmental health hospital based on KEPMENKES 1204/Menkes/ SKIX /2004, ie. less than 500 cfu/m3. Although the number of bacteria is relatively low, it is possible to cause nosocomial infections, because of patient retentions are weak. Therefore, inspection and control of bioaerosol conditions routinely is needed. The number of isolates identified were consisted of 12 isolates of Gram-positive (Table 3) and 3 isolates of Gram negative bacteria (Table 4) and 11 fungal bioaerosol. Bioaerosol bacteria obtained consists of 3 genus of Gram-positive bacteria, 3 genus of Gram-negative bacteria, and 7 genus of fungi. The most dominant bioaerosol bacteria was Bacillus sp. as many as 5 isolates. That was possible because Bacillus is sporeforming and widespread in nature, such as soil that could be flying as dust. Spore are able to retain in unfavourable condition for a long time. Setlhare et al. (2014) also found genus Bacillus and Staphylococcus spp. from the air in the hospital kitchen and in some patients. Meanwhile, the most dominant fungi was Aspergillus. High presence of Aspergillus could be caused by cosmopolitan distribution of this fungi that can produce vegetative spores (conidia) in large numbers and have very rapid growth (Ilyas 2007).

66 International Seminar on Biological Sciences (ISBS - 2015)
Table 2. Bioaerosol microorganism found in Pirngadi Hospital, Medan
Phyllosphere Bacteria Isolation of phyllosphere bacteria of ornamental plants; F. elastica, P. Bipinnatifidum and A. simplex, it was found 9 types of morphologically separate colonies of all three types of plants. From F. elastica was obtained 3 isolates coded FE1, FE2, and FE3, from P. bipinnatifidum 3 isolates was found coded PB1, PB2 and PB3. Meanwhile, from A. simplex it was also obtained three isolates with the coded AS1, AS2, and AS3. There were several colony characterizations of isolate obtained. AS2 isolate secreted bioactive compound assigned by formation a clear zone around colonies (Figure 1).
Figure 1. Inhibitory zone AS2 isolatee against Staphylococcus sp. A. phyllosphere bacteria isolate; B. bioaerosol bacteria isolate BP01 (Staphylococcus aureus.); AS2; C. clear zone
Phyllosphere bacterial isolates inhibited the growth of the hyphae of some potentially pathogenic bioaerosol fungi. Isolates AS2, PB2 and FE2 are three selected bacteria that have the greatest inhibition of the test antagonist with fungi (Figure 2).
Group of microorganism Species Number of the most dominant
colony Gram positive bacteria Staphylococcus aureus 2
Staphylococcus sp. 4 Bacillus sp. 5 Streptococcus sp. 1
Gram negative bacteria Pseudomonas sp. 1 Shigella sp. 1 Salmonella sp. 1
Fungi Aspergillus sp. 4 Fusarium sp. 2 Alternaria sp. 1 Mucor sp. 1 Neurospora sp. 1 Tricodherma sp. 1 Penicillium sp. 1
A
C
B

International Seminar on Biological Sciences (ISBS - 2015) 67
Figure 2. Antagonist test of phyllosphere bacteria against bioaerosol fungi: A. AS2 versus
Fusarium sp.; B. FE2 versus Aspergillus sp.; C. PB2 versus Alternaria sp.; D. FE2 versus Fusarium sp.(Negatif); E. AS2 versus Mucor sp.; : bioaerosol fungi; X. Phyllosphere bacteria.
Bioaerosol fungal isolate found were Fusarium, Aspergillus, Mucor and Alternaria.
There were selected for antagonist test. Isolates AS2 (Figure 2E) showed the greatest inhibition zone against mycelial of Mucor sp. Meanwhile, isolate FE2 (Figure 2D) the inhibitory effect was less effective. The ability to inhibit the growth of fungal mycelium indicate that bacteria have inhibitory mechanisms such as antibiotic by producing secondary metabolites such as enzymes. Supriyadi (2006) found that some bacteria are able to produce the enzyme chitinase which is able to degrade chitin contained in cell wall of fungal hyphae into N-acetylglucosamine. Phyllosphere bacteria of ornamental plant tend to inhibit bioaerosol fungal compared to that bacteria. Isolates of AS1, AS2, and AS3 produced the greatest inhibition zone against fungi. AS2 clear zone was 4.2 cm against Mucor sp., followed by AS3 and AS1 as much as 4.0 cm and 3.3 cm against Mucor sp. (Table 3). Table 3. The ability of phllyosphere bacteria of ornamental plant against patogenic bioaerosol microorganism
No Bioaerosol microorganism
Inhibition zone of phylospher bacteria (cm) PB1 PB2 PB3 AS1 AS2 AS3 FE1 FE2 FE3
1 Staphylococcus aureus 0 0 0 0,2 0,8 0 0 0 0 2 Bacillus sp. 0 0 0,1 0,4 0,4 0 0 0 0 3 Salmonellasp. 0 0,1 0 0,3 0,9 0,2 0 0 0,2 4 Streptococcus sp. 0,2 0,2 0 0,6 0,8 0,2 0 0,2 0 5 Alternaria sp. 0 1,6 0 0 1,8 0 0 1,2 0 6 Mucor sp. 3,0 3,7 3,3 3,3 4,2 4,0 0 2,4 2.0 7 Aspergillus sp. 0 1,6 0 1,0 1,8 0 0 1,2 0 8 Fusarium sp. 0 0 0 0 0 0,3 0 0 1,2
Isolates from A. simplex plant showed the the highest ability in inhibiting several
bioaerosol microorganisms than the other two plants. But AS2 isolate showed the highest inhibition zone at the time against Mucor sp., that was 4.2 cm. FE isolates showed a low inhibitory effect against Mucor sp. that was only 2.4 cm. However, no inhibitory activity showed by FE1 isolate.
Data obtained showed that only a few isolates of phylospher bacteria could inhibit
A B
C D E
X

68 International Seminar on Biological Sciences (ISBS - 2015)
bioaerosol microorganism. When phyllosphere bacteria against with bioaerosol bacteria, inhibition zones were relatively low (under 1.0 cm). In this case, AS2 isolate that have the highest inhibition zone against fungi, only have 0.8 cm to bacteria (S. aureus). AS2, PB2 and FE2 isolates have a medium to very strong inhibitory potency particularly against bioaerosol fungi (Table 4). Table 4. Potency of inhibitory zone philosopher bacteria selected against bioaerosol
microorganism
Isolate Source of phylospher bacteria
Bioaerosol microorganism
Diameter of inhibition zone (cm)
Potency
AS2 Aglaonema simplex Mucorsp. 4,2 Strong S.aureus 0,8 Low
PB2 Philodendron. bipinnatifidium
Mucorsp. 3,2 Strong Aspergillus sp 1,6 Medium
FE2 Ficus elastica Mucorsp. 2,4 Strong Aspergillus sp 1,2 Medium
AS2 isolate have strong inhibitory potency against Mucor sp. but the lowest to S.
aureus. PB2 and FE2 isolates only inhibit bioaerosol fungi in strong catagory against Mucor sp, and medium to Aspergillus sp.
The three potential isolates of phyllosphere bacteria were Gram-negative and rod-shaped with monobasil structure (Figure 8). Result of biochemical test showed that all of this bacteria belong to the genus of Pseudomonas (Table 5). Table 5. Characteristic of potential phylospher bacteria
Information: O : Oxidize test IND : Indol G : Gases TSIA : Triple Sugar Iron Agar SIM : Citrate Indole Motility K/A : Alkaline/Acid SCA : Simon Citrate Agar
According to Lindow et al. (2003), an example of phylospher bacteria belong to this group was P. syringaeand P. fluroscens. The phylospher bacteria inhibited fungi by produced a compound known as antifungal, such as siderophores, and other secondary metabolites that are able to inhibit the activity of fungi (Haas and Devago, 2005). The discovery on the genus Pseudomonas both in phyllosphere ornamental plant leaves and bioerosol indicated that the presence of this genus is very cosmopolitan and has a high biodiversity. There are a group of bacteria that are pathogenic or non-pathogenic, so it needs to be test in future studies about pathogenitas bacteria before utilization. References Ducel, G. (2002): Prevention of Hospital-Acquired Infections A Practical Guide. Second Edition. World Health Organization. Department of Communicable Disease: Canada. Hal. 2. Elis, D., Davis, S. & Alexious, H. (2007): Description of Medical Fungi. 2nd ed. Nexus Print
Solution: Australia. Pages 55-58. Griffin, H. D. (1981): Fungal Physiology. John Willey and Sons, Inc: New York. Hlm. 154. Harper, T. A. M., Bridgewater, S., Brown, P & Johnson, A. S. (2013): Bioaerosol sampling for
Code Gram Shape Regulation O TSIA SIM SCA IND H2S G Suspected Genus
AS2 - basil Monobasil + K/A + + - - + Pseudomonas PB2 - basil Monobasil + K/A - - - - + Pseudomonas FE2 - basil Monobasil + K/A + - - - + Pseudomonas
International Seminar on Biological Sciences (ISBS - 2015) 69
airborne bacteria in a small animal veterinary teaching hospital. Infect Eco Epi. 3(1): 20376-99302.
Haas, D. & Devago, G. (2005): Billogical control of soil-borne pathogens byfluorescens Ppseudomonad. Nature Reviews Microbiol .1(2): 1-13
Hirano, S. S & C. D. Upper. (2000): Bacteria in the leaf ecosystem with emphasis on Pseudomonas syringae pathogen, ice nucleus, and epiphyte. Microbiol Mol Biol Rev. 64(1): 642-653.
Holt, J. G., Noel, R. K., Sneath, P.H.A,. James, T. S. & Stanley, T.W. (1994): Bergey's Manual of Determinative Bacteriology. Ninth edition. The Williams and Wilkins Co. Baltimore.
Ilyas M. (2007): Isolasi dan IdentifikasiMikoflora Kapang Pada Sampel Serasah Daun Tumbuhan di Kawasan Gunung Lawu, Surakarta, Jawa Tengah.J. Biodiversitas. 8(2): 334-337.
Kamel, F., Ismael, H. M & Ahmed, A. A. (2012): Effect of natural surface secretes of some common ornamental plants leaves on pathogenic micro-organisms. J Life Sci. 6(2): 1387-1390.
Lindow, S. E & Brandl, M. T. (2003): Microbiology of the phyllosphere. Appl Environ Microbiol. 69(4) :1875–1883.
Madigan, M. T., Martinko, J. M & Parker, B. (2001): Biology of Microorganism. Eight Edition. Prentice Hall International, In: New Jersey. Page 231.
Maier, R. M., Pepper, I.L & Gerba, C. P. (2005): Environmental Microbiology a Laboratory Manual. Edisi Kedua. Elsevier Academic Press: USA. Pages 67-68.
Matar, G., Chaar, M., Araj, G., Srour, Z., Jamaleddine, G & Hadi, U. (2005): Detection of a higly prevalent and pottentially virulent strain of Pseudomonas aeruginosa from nosocomial infections in a medical cener. . biomedical science of microbiology. 5(2): 29-35.
Merlin, (2012): Studi Kualitas Udara Mikrobiologis dengan Parameter Jamur pada Ruangan Pasien Rumah Sakit (Studi Kasus: Ruang Rawat Inap Gedung A Rumah Sakit Umum Pusat Nasional Dr.Ciptomangunkusumo. [Skripsi]. Universitas Indonesia: Jakarta.
Mutfianti, R. D. (2011): Pengantar Vegetasi Landscape Pengelompokan Vegetasi Berdasarkan Pembentuk dan Ornamental Space. Jurusan Arsitektur‐ITATS: Surabaya.
Qudiesat, K., Elteen, K. A., Elkarmi, A., Hamad, M., & Abussaud, M. (2009): Assessment of airborne pathogens in healthcare settings. Afr J Microb Res. 3(2): 66-76.
Santosa, D.A. Handayanf, N., & Iswandil, A. (2003): Isolasi dan seleksi bakteri phyllosphere pemicu tumbuh dari daun padi (Oryza sativa L.) varietas IR-64. J. Ilm Tan Lingk.5(1): 7-12.
Setlhare, G., Malebo, N., Shale, K & Lues, R. (2014): Identification of airbone microbiota in selected areas in health-care setting in South Africa. BMC Microbiology.14(22):100 :1471-2180.
Shehata; Fawzy S & Borollosy AM. (2008): Induction of resistance against Zuccini Yellow mosaic potyvirus and growth enhancement of squash plants using some plant growth promoting Rhizobacteria.AusJ Basic and Applied Sci.2(12):174-182.
Sien, L.S., Chuan, C.H., Lihan, S & Yee, L.T. (2013): Isoaltion and identification of airbone bacteria inside swiftlet houses in Sarawak, Malaysia. Maka J Sci. 17(3): 105-108.
Supriadi. (2006): Analisis resiko agen hayati untuk pengendalian pathogen tanaman. J. Litbang Pertanian. 25(3):75-80.
Widyati, E. (2013): Memahami interaksi tanaman-mikroba. Pusat Penelitian dan Pengembangan Peningkatan Produktivitas Hutan Kampus Balitbang Kehutanan Bogor.Tekno Hutan Tanaman. 1(6): 13–20.
70 International Seminar on Biological Sciences (ISBS - 2015)
Malaria Attributable-Fever based on Rapid Diagnostic Test (RDTs) in Primary Health Care : Detection of Asymptomatic malaria as a
Problems in Malaria Ellimination
Siahaan, L.
Department of Parasitology, Medical Faculty, University of Sumatera Utara E-mail : [email protected]
ABSTRACT Malaria management policies currently recommend that the treatment should only be administered after laboratory confirmation or rapid diagnostic tests (RDTs) when microscopy is not available. In primary health care RDT commonly used to the patient with fever. Asymptomatic malaria, as an untreated malaria could potentially be a source of malaria transmission. The study was undertaken in Batubara district, North Sumatera Province, Indonesia, from May to September 2015. Data was collected from 3 subdistricts that had the highest cases of malaria. Diagnosis of malaria was done based on RDTs. This study aims to find the performance of the RDT as a predictor of malaria-attributable fever. The study samples included 660 patients and the overall sensitivity, specificity, PPV, NPV and malaria attributable fever of the RDTs for diagnosis of any malarial species were 84.5%, 40.9%, 60,6%, 29.0% and 66% respectively. Proportion of asymptomatic malaria is 15.5%. Prevalence of malaria is mainly due to P. vivax (75.8%), P. falciparum (13.7%) and combination of them (10.5%). Fever is not enough as an indicator for malaria screening. Periodic mass blood survey is required to detect asymptomatic malaria. Finding and treatment of asymptomatic malaria is the way to successful malaria elimination. Keywords : fever, RDTs, malaria elimination, asymptomatic malaria INTRODUCTION Malaria is still the most important mosquito-borne disease in Batubara, one of the highest endemic area in North Sumatera Province in Indonesia (Health Ministry, 2015). Currently, the main stay of malaria diagnosis is microscopy, but this is not always available or feasible at low level health care facilities in resource limited settings due to cost, lack of skilled manpower, accessories and reagents required. Rapid diagnostic tests for malaria (RDTs) are potential tools for parasite based diagnosis and treatment of malaria (Noedl et al., 2009, Bisoffi et al., 2009).
Studies to evaluate the efficacy of these RDTs in hyperendemic area have reported efficacy similar to expert microscopy. In addition, RDTs have been shown to be cost effective in treating malaria and potentially saves the cost and time wasted on presumptive treatment (Kyabayinze et al., 2010).
Detection of asymptomatic infection in primary health care has become a crucial element during achievement of malaria elimination program. Considering the challenge of asymptomatic malaria in the elimination program, the aim of this study was to evaluate the presence of asymptomatic malaria based on RDTs in Batubara District, which is one of the main malaria endemic areas in North Sumatera Province of Indonesia. MATERIALS AND METHODS The data in this paper are a part of results in an asymptomatic malaria study. The study was designed to make a model of malaria diagnostic for detecting asymptomatic malaria in hypoendemic area in North Sumatera Province of Indonesia. This study will be held from March 2015 to March 2017 in Batubara district. This first round was done to detect the presence

International Seminar on Biological Sciences (ISBS - 2015) 71
of asymptomatic infection based on RDTs. Data was collected from 4 primary health care centers in 3 subdistricts that had the highest cases of malaria. This round aims to find the performance of the RDT as a predictor of malaria-attributable fever.
This study was conducted in 660 patients (51% female and 49% male), aged from 1 to 70 years old, living in Batubara District. All randomly selected participants were found actively in May to September 2015. An axillary temperature was obtained upon recruitment for all patients. Fever was defined as an axillary temperature ≥ 37.5°C. Pregnant women were excluded from the study.
A random sample of the patients, was submitted to the malaria RDTs. The RDTs used in this study was Monotes Test Device, Malaria Pf/Pv Ag Rapid Test (Whole Blood) Lot 1412040, ISO 13485:2003, expiry dates December 2016). This RDTs had relative sensitivity 100%, relative specificity 98.7% and overall agreement 98.9%. In this paper, the primary aim of the analysis was to estimate how RDTs predict malaria-attributable fever in the primary health care. RDTs sensitivity, specificity, positive predictive value (PPV) and negative predictive value NPV) were estimated for malaria. RESULTS AND DISCUSSION A total of 660 patients were eligible for this study. There were 477 patients with fever and 183 patients without fever. Symptomless patients were the greatest number in patient without fever (Table 1). Almost of the asymptomatic malaria were due to Plasmodium vivax. Table 1. Classification of Asymptomatic malaria
Symptom P falciparum P vivax Mix Total(%) (%) (%) (%)
Cough 0 9.4 0 9.4Weakness 1.9 1.9 0 3.8Diarrhea 0 5.7 0 5.7Vomit 0 9.4 0 9.4Headache 1.9 7.5 1.9 11.3Myalgia 0 3.8 0 3.8Symptomless 3.8 33.9 18.9 56.6
Prevalence of asymptomatic malaria based on RDTs was 15.5%. Malaria attributable-
fever among patients attending this study was 66%. The lowest rate was 22% (Age : 13 - 19). The RDTs was positive in 289/342 (84.5%; sensitivity) fever cases and negative in 130/318 (40.9%; specificity) patient without fever. The positive predictive value (PPV) for malaria infection in patients with fever was 289/477 (60.6%) and the negative predictive value (NPV) was 53/183 (29%). The sensitivity, specificity, PPV and NPV results of RDTs for malaria infection are presented stratified by age group (Table 2).

72 International Seminar on Biological Sciences (ISBS - 2015)
Table 2. Accuracy of Rapid Diagnostic Test Age Proportion of Sensitivity Specificity Positive Predictive Negative Predictive Malaria Attributable-Fever
(Year) Asymptomatic Malaria (%) (%) (%) Value (%) Value (%) (%)
≤ 5 10.0 90.0 29.3 48.2 20.0 68.06 -- 12 10.8 89.2 28.8 55.9 27.6 65.0
13 -- 19 23.9 76.1 30.4 59.3 51.2 22.020 -- 50 12.8 87.2 53.6 69.0 22.1 82.0
≥ 50 23.1 76.9 69.6 58.8 15.8 76.0Total 15.5 84.5 40.9 60.6 29.0 66.0
Previously, presumptive treatment of fever with anti-malarials is widely practised to
reduce malaria attributable morbidity and mortality especially at lower level health facilities. Malaria management policies currently recommend that the treatment should only be administered after laboratory confirmation. Rapid diagnostic tests (RDTs) are the usual alternative when microscopy is not available (Harris et al. 2010; Vinetz and Gilman, 2002).
Nowadays, in rural primary health care, RDTs was used only for patients with fever. Moreover, no formal attempt has been made to estimate RDTs accuracy on malaria-attributable fever. This study aims at estimating the accuracy of a RDT for the diagnosis of malaria-attributable fever.
RDTs for malaria were developed to overcome microscopy limitations and to supplement microscopy as the primary diagnostic modality in malaria endemic countries. RDTs identify plasmodium antigens using immunochromatographic techniques and their performance is influenced by the target antigen used, the incidence of malaria, the degree of parasitaemia and the predominant Plasmodium spp. in the region (Bisoffi et al., 2010; Uzochukwu et al., 2010; Turki et al., 2012).
Many countries are scaling up malaria interventions towards elimination of malaria. This transition changes demands on malaria diagnostics from diagnosing ill patients to detect parasites in all carriers including asymptomatic malaria and infections with low parasite densities (sub-microscopic parasitaemia). In fact, these carriers act as parasite reservoirs in the population and continuously transmit parasite to the anopheline mosquitoes (Mohanna et al., 2007; Suarez et al., 2007).
Although it is expected that asymptomatic infection would mainly be detectable in high endemic areas, there has been other contrary reports from hypoendemic areas of the world that indicated high prevalence of asymptomatic malaria. Therefore, an assessment of the epidemiological characteristics of malaria infections in a certain population, particularly the prevalence and distribution of asymptomatic infections will contribute to the understanding of the requirements of diagnostics in malaria elimination. Various studies had evaluated the presence and prevalence of this infection in the control and elimination phase of malaria using different techniques. Study in Africa have found that in villages where both P. falciparum and P. vivax are common (in about a 1:3 to 1:5 ratio throughout the year), asymptomatic Plasmodium parasitemia appears to be common, comprising up to 30% of parasitemic individuals studied by active surveillance (Vinetz and Gilman, 2002; Gudo et al., 2013)
It should be noted that to achieve successful malaria elimination in any given endemic region, one of the main requirements is active case detection. Periodically, people in endemic area, with or without fever, could be tested by RDTs to detect asymptomatic infection. It could be postulated that, as no asymptomatic malaria cases were found, the malaria elimination program is feasible and can be successfully carried out.(Harris et al. 2010; Vinetz and Gilman, 2002)
International Seminar on Biological Sciences (ISBS - 2015) 73
References Bisoffi Z, Gobbi1 F, Angheben A, Ende JV, (2009): The Role of Rapid Diagnostic Tests in
Managing Malaria : PLoS Medicine 6 (4) Bisoffi Z, Sirima SB, Menten J, Pattaro C, Angheben A, Gobbi F, et al., (2010): Accuracy of a rapid
diagnostic test on the diagnosis of malaria infection and of malaria - attributable fever during low and high transmission season in Burkina Faso : Malaria Journal 9(192)
Gudo ES, Prista A, Jani IV, (2013): Impact of asymptomatic Plasmodium falciparum parasitemia on the imunohematological indices among school children and adolescents in a rural area highly endemic for Malaria in southern Mozambique : BMC Infectious Diseases : 13(244)
Harris I, Sharrock WW, Bain LM, Gray KA, Bobogare A, Boaz L, et al., (2010): A large proportion of asymptomatic Plasmodium infections with low and sub-microscopic parasite densities in the low transmission setting of Temotu Province, Solomon Islands: challenges for malaria diagnostics in an elimination setting : Malaria Journal 9 (254)
Health Ministry, North Sumatera Province, (2015): Monthly Report Malaria Cases, Unpublished. Kyabayinze DJ, Asiimwe C, Nakanjako D, Nabakooza J, Counihan H, Tibenderana JK, (2010): Use
of RDTs to improve malaria diagnosis and fever case management at primary health care facilities in Uganda : Malaria Journal 9 (200)
Mohanna MA, Ghouth AS, Raja’a YA, (2007): Malaria signs and infection rate among asymptomatic schoolchildren in Hajr valley, Yemen, Eastern Mediterranean : Health Journal: 13 (1)
Noedl H, Yingyuen K, Laoboonchai A, Fukuda M, Sirichaisinthop J, Miller RS, (2009): Sensitivity and specificity of an antigen detection ELISA fir malaria diagnosis : Am. J. Trop. Med. Hyg., 75(6) : 1205–1208
Suárez MMC, Cuervo P, Leoratti FM, Moraes ASL, Ferreira AW, Fernandes O, et. al., (2007): Cross sectional study reveals a high percentage of asymptomatic Plasmodium vivax infection in the Amazon Rio Negro area, Brazil : Rev Inst Med Trop Sao Paulo : 49(3):159-64.
Turki H, Zoghi S, Mehrizi AA, Zakeri A, Raeisi A, Khazan H, et. al, (2012): Absence of Asymptomatic Malaria Infection in Endemic Area of Bashagard District, Hormozgan Province, Iran : Iranian J Parasitol: 7 (1) : 36-44
Uzochukwu BSU, Chiegboka LO, Enwereuzo C, Nwosu U, Okorafor D, Onwujekwe OE, et al., (2010): Examining appropriate diagnosis and treatment of malaria: availability and use of rapid diagnostic tests and artemisinin-based combination therapy in public and private health facilities in south east Nigeria : BMC Public Health10 (486)
Vinetz JM and Gilman RH, (2002): Asymptomatic Plasmodium Parasitemia and The Ecology of Malaria Transmission : Am. J. Trop. Med. Hyg., 66(6) : 639–640

74 International Seminar on Biological Sciences (ISBS - 2015)
Biological Aspect of Coccinella transversalis Fabricus (Coleoptera: Coccinellidae) as Potential Predator on Aphid in Karo Highland
Sidauruk, L.* and E. Panjaitan
Department of Agrotechnology, Faculty of Agriculture, Methodist University of Indonesia *E-mail: [email protected]
ABSTRACT The objectives of this research were to study and describe the morphological and biological characteristic of Coccinella sp. as a potential natural enemy of potato pest on Karo Highland. Through knowledge of the biology and morphology of these insects, the conservation of natural enemies on potato ecosystem can be done, so that pest control can occur naturally without using of pesticides. The study was conducted at laboratory of Plant Pests and Diseases Faculty of Agriculture, Methodist University of Indonesia and the sample of insect collected from Kuta Gadung, Berastagi, Kabupaten Karo, North Sumatera. The results showed that egg incubation was 2.4–5.2 days. Larva stage consist of the first, second, third and fourth instar were happened in 2.4 to 3.2, 2.2 to 3.5, 2.2 to 4.4 and 3.0 to 6.0 days respectively. Prepupae and pupae stages were 1.0 to 2.0 and 1.6 to 4.1 days. Adult stage were different between female and male. Period of female stage was 31.0 to 46.0 days and male was 22.0 to 34.0 days. Fecundity of female was 118.4 eggs and hatching percentage was 84.2. Predation potential for aphid at larva stage, female and male were 298.5 to 451.4, 873.67 and 736.11aphids respectively. Keywords : potential predator , Coccinella transversalis INTRODUCTION Coccinelids or lady bird beetles belonging to the family Coccinellidae, are the most commonly known as beneficial insects (Mayadunnage et al., 2007). There are 3000 spesies of the family distributed across the world and the majority of coccinellids are predator on aphids and coccids, some feed on aleurodicus or acarines (Iperti, 1978). Coccinella transversalis Fabricus was one of the spesies of Coccinellids which commonly found feeding on aphids in vegetable crops. They are the most commonly known of all beneficial insects and as important predaceous both in their larval and adult stages on various important crop pests such as aphids, coccids and other soft bodies insects including aphids (Shukla and Jhadav, 2014). The aphid is one of the most destructive pests and its distribution is worldwide. Both adult and nymphs cause damage by sucking the sap from the flowers, buds, pods, tender shoots and reduce the market value of the product. The occurrence of C. transversalis has been reported from countries such as India, Nepal, Sri Lanka, Bangladesh, Indochina, Indonesia, Australia and New Zealand (Poorani, 2002).
Biological control is the major component of Integrated Pest Management (IPM) strategies. The aim of biological control is to reduce pest populations through natural enemies, such as predators, parasitoids and pathogens (Bukero, et al. (2014). For the effective use of predaceous coccinellids in the integrated pest management programme, a complete investigation on their bioecology and predation potential are very important (Singh and Singh, 2014). Many studied showed that both larvae and adult stage of C. transversalis can often be attributed to the same plants and feed on the same insect species (Pervez, and Omkar, 2005). Navodita, et al. (2011) reported that C. transversalis was fed on essential (aphid) and alternative foods. The development was fastest with high larval survival when larvae were fed on aphid than artificial foods.
The study of the biology of C. transversalis on laboratory conditions with asential and artificial foods would help us to know the charachteristic of these predator and then can use this
International Seminar on Biological Sciences (ISBS - 2015) 75
insect of proper biological control. In ecological study, life-table is a most important analytical tool which provides detailed information on population dynamics and generates simple but informative statistics. It also gives a comprehensive description of the survivorship, development, feeding and expectation of life (Ali and Rizvi, 2007).
MATERIALS AND METHODS The experiment was conducted at the Laboratory of the Department of Agrotechnology, Methodist University of Indonesia, Medan, Indonesia, during the period of March, 2015 to July, 2015. The large number of larvae and adult predator of Coccinella transversalis was collected from different localities field at Karo Highland. The culture of predator was established in the laboratory in order to supply necessary insects for the experiment. The standard mass rearing technique for the coccinellid predators as described by Soni et al., (2008) was adopted. Some males and females of the C. transversalis were collected by sweep net from the unsprayed fields and were confined in plastic jars. There are 30 pairs of beetle separated at different pastic jar. The eggs collected every day in the morning by each female, after counted the number of eggs, transferred to petridishes to showed the time of hatching. The time of egg incubation period and hatching percentage were recorded. After hatching of eggs, 10 grubs of the same age transferred to every medium sized petridishes and give aphid and artificial food, there are five replicated done. The data of larvae development period and predatory potential were recorded. Observations on number of alive and dead for every interval of larvae stadia was calculated. The following assumptions were used in the construction of age specific life-table of C. transversalis. The pupae were kept undisturbed in the respective petridishes until the emergence of adult. At the same time pre-pupal and pupal period was recorded. The adult emerged, oviposition, fecundity, mating activity and life table were also recorded. RESULTS AND DISCUSSION Development of Predator C. transversalis laid eggs on the undersurface of jar or under leaf of portulaca grandiflora in the jar. The eggs were usually laid in the groups ranging 5 -26 per group. The freshly laid eggs of C. transversalis were cigar shaped bright yellow in colour with smooth chorion and without any reticulations. The eggs turned blackish with advancement of age and became completely black before hatching. The length of eggs varied from 0.78 to 1.01 mm with an average 0.86, whereas the width varied from 0.23 to 0.42 mm with an average 0.36 mm. The incubation period of eggs ranged from 2.4 to 5.2 days. For the whole egg observed, the percentage of eggs that hatch into larvae of 84.20%. The laying of eggs is generally done at night or sometimes in the morning. Lyla et al. (2008) reported that C. transversalis period under laboratory condition varied from 2 to 5 days with an average 2.70 ± 0.766 days. Incubation period of C. transversalis was found to be 2 days under laboratory conditions at a temperature of 27°C and 79 % relative humidity.
Larvae C. transversalis consists of 4 instar. In the process of hatching eggs into larvae, the larvae visible head out first, then slowly followed by his legs until all parts of the abdomen out of the eggshell. The first instar of larvae coming out black, thorax and abdomen covered with fine spines and dark at head capsule, larvae composed of 9 segments. The second until fourth instar of larvae are black with yellowish spot at fourth and sixth abdominal segment. The third instar larva of C. transversalis was similar in general appearance to second instar larva, except larger in size. In third instar larva the spiny structure were little larger than in second instar. Freshly moulted third instar larva was dark black in colour. The colour pattern was more intensified with additional development of orange transverse patches on mid-dorsal line of other segments except prothorax.
At the time of going to exchange the larvae skin will be gray because the body was

76 International Seminar on Biological Sciences (ISBS - 2015)
covered with a layer of wax. The size of larvae from first instar to pupa gradually increased until achieve the longest size then retracts towards the pupa called stadia prepupa (Table 1). With increasing age of larvae, the spines (seta) also increasingly shortened. The age of every stage insect development presented in Table 1.
The emerged adults were soft bodied, yellowish in colour without any marking which turned shining yellow or warm buff with black spots which developed gradually. The adult was medium sized, red and black coloured ladybird beetle, with elongate oval, convex shaped body and head is black. Males were smaller in size than females. The last abdominal segment of male beetle was roundish, while in case of female it was pointed, for egg laying. The data on measurements of adult body length and width of female and male C. transversalis are presented in Table 1.
Table 1. The size and length of life every stadia of C. transversalis
Stadia Means of size (mm) Period (day) Egg incubation Hatching percentage (%) Lenght of egg Width of egg Larvae instar I Larvae instar II Larvae instar III Larvae instar IV Prepupae Lenght of pupae Width of pupae Lenght of male Width of male Lenght of female Width of female
- 84.2% 0.62 0.18 1.52 2.98 4.52 5.80
- 4.78 2.54 4.78 3.12 5.47 3.32
2.4 - 5.2 - - -
2.4 – 3.2 2.2 – 3.5 2.2 – 4.4 3.0 – 6.0 1.0 – 2.0 1.6 – 4.1
- 22 – 34
- 31 – 46
- It showed that the longest period of live C. transversalis at the imago stage, followed by
a larval stage. Both imago and larvae are predators of pests like aphids. From these data, it can be seen that the predator C. transversalis has good prospects to be developed into mealybug pest control agents, because the active stage to prey is the larval and imago stadia. The potential of females to produce eggs (fecundity) about 118.40 eggs during their lifetime. It is very influenced by the amount and quality of feds. Kalshoven (1981) showed that predator Coccinella sp. capable of producing 150 eggs during the female insect life. Still not achieve the potential of female insects produce eggs allegedly linked to the condition of a plastic jar of maintenance still not up to the development of these predators. Shukla and Jadhav (2014) report that female of C. transversalis can produce 234 – 467 eggs under laboratory condition and natural feed. From all imago generated during maintenance ranging from egg to imago obtained 61 imago, consisted of 36 female and 25 male. So, the sex ratio of C. transversalis obtained 1.0 : 1.44. This result showed that the number of female more higher than male, it means the possibility of population growth can take place quickly because of the imago male can copulate with more than one female imago and each can produce fertile eggs. Predation potential
The predatory response of different immature developmental stages of C. transversalis are difference between larvae and imago. Predatory potential of first, second, third and fourth instars was from 19.0 to 29.0, 37.5 to 55.5, 63.8 to 112.8 and 126 to 245.5 aphids and total larval predatory potential ranged from 298.5 to 451.4 aphids. The adults exhibited more response in feeding compared to grubs. Between sexes, female consumed more aphids than the male. Predatory potential of female and male was 873.67 aphids and 736.11 aphids respectively.

International Seminar on Biological Sciences (ISBS - 2015) 77
Acknowledgement Thanksful to the Directorate General of Higher Education, Ministry of National Education, Republic of Indonesia that had funded this research. This study also supported by Balai Benih Induk Kentang Kutagadung, Berastagi and the Methodist University of Indonesia , Medan. References Ali, A. and Rizvi, P.Q. (2007): Age Specific Survival and Fecundity Table of Coccinella septempunctata L. (Coleoptera: Coccinellidae) on Different Aphid Species. Ann. Pl. Protec. Sci. 15:329-334. Bukero, A., A.G. Lanjar, A.W. Solangi, A.A. Memon, G. Thebo, S.A. Nahyo and Riaz Ali Buriro. (2014): Voracity Rate and Development Period of Coccinella transversalis (Fabricius) on Three Aphid Species. Sci.Int.(Lahore). 26(5),2255-2257 Iperti (1978): Use of Coccinellids. Bulletin Technique d’Information. 332: 437-441. Kalshoven, L.G.E.(1981)): Pests of Crops In Indonesia, PT. Ichtiar Baru- Van Hoeve. Jakarta. Pp. 398- 410. Lyla, K. R. Sheena. and Bhasker, Haseena (2008): Biology and feeding preference of the coccinellid predator, Coccinella transversalis Fab. Insect Environment. 14(2): 75-76. Mayadunnage, S., H.N.P Wijayagunasekara, K.S. Hemachandra and L. Nugaliyadde (2007): Predatory Coccinellids (Coleoptera: Coccinellidae) of Vegetable Insect Pests: A Survey in Mid Country of Sri Lanka. Tropical Agricultural Research 19:69-77. Navodita, M., A.Pervez, A.Kumar and P.W.Ramteke (2011): Duration of Development and Survival of Larvae Of Coccinella transversalis Fed on Essential and Alternative Foods. European Journal of Environmental Sciences 1(1) Pervez, A. and Omkar (2005): Functional Responses of Coccinellid Predators: An Illustration of a Logistic Approach. Journal of Insect Science, 5(5): 6pp . Poorani, J. (2002): An Annotated Checklist of Coccinellidae (Coleoptera) Excluding Epilachninae of Indian Sub Region. J.Oriental Insects. 36:307-383. Shukla, A. and D.S. Jadhav (2014): Biology of Coccinella transversalis (Fabricus) on Different Aphid Species. The Bioscan 9(1):17-22. Singh, K., and N.N.Singh, (2014): Biology and Devouring Propensity of Lady Bird Beetle, Coccinella septempunctata Linnaeus on Repessed Mustard Aphid, Lipaphis erysimi Kaltenbach. African Journal of Agricultural 9(1): 61-64. Soni, R., Deol, G. S. and Brar, K. S. (2008): Feeding potential of Coccinella septempunctata Linnaeus on wheat aphid complex in response to level/intensity of food. J. Insect Sci. 21(1): 90-92.
78 International Seminar on Biological Sciences (ISBS - 2015)
Genetic diversity of Andaliman (Zanthoxylum acanthopodium DC.) germplasm in Indonesian based on OPD-13 and OPI-20 primers
Putri, L.A.P.* and I. M. S. Sembiring
1)Department of Agroecotechnology, Faculty of Agriculture, University of Sumatera Utara,
Jln. Prof. A. Sofyan no 3 Kampus USU, Medan-20155 *E-mail : [email protected]
ABSTRACT We used 2 polymorphic RAPD (randomly amplified polymorphic DNA) markers in Zanthoxylum acanthopodium to characterize 30 accessions from three districts of North Sumatera. Our principal objectives are to study the genetic diversity of andaliman natural population. The RAPD analysis was used with 2 random primers : OPD-13 and OPI-20 markers. The preliminary results showed that 30 accessions of Z. acanthopodium were showed 9 bands from two primers. Two primers OPD-13 and OPI-20 are polymorphic primers for this accessions. From which, we draw preliminary conclusion on this germplasm for breeding purposes. Keywords : genetic diversity, North Sumatera, RAPD marker, Zanthoxylum acanthopodium INTRODUCTION Andaliman (Zanthoxylum acanthopodium DC.) is an indigenous spice and well known in Northern Sumatera. Z. acanthopodium locally known as andaliman is a wild species which is native to region of Toba Samosir and Tapanuli Utara, North Sumatera, Indonesia. Andaliman’s fruits and seeds are employed as an aromatic tonic in fever, dyspepsia, carminative, stomachic, anthelmintlc and expelling roundworms, as the spice in Batak society (arsik), anti-inflammatory activity and antioxidant activity. The volatile oil is employed as an antidiarrehal, antiseptic, deodorant and anticataerhal. The oil has a good tenacity and is appreciated for its fixative qualities. Almost all parts of the plants are aromatic and hence, supposed to possess essential oil. The essential oil composition can provide much more knowledge regarding the medicinal proper-ties and active constituents of this plant.
Availability of germplasm and its genetic diversity information is main base of creating superior plant cultivar. Beside in optimalization of germplasm utilization, use of the technology is able to identify early important plant traits. Assessment of the genetic diversity present within a species is a prerequisite for future sustainable breeding efforts.
Molecular markers provide an important technology for evaluating levels and patterns of genetic diversity and have been utilised in a variety of plant species. Among the various DNA marker methods currently available that can be used to examine genetic diversity at the molecular level. In this study we have utilised primers (OPD-13 and OPI-20) we previously designed to amplify polymorphic RAPDs to study of Z. acanthopodium genetic diversity. MATERIALS AND METHODS All 28 genomic DNA (from 3 regions : Dairi, Simalungun and Karo) was extracted from leaf material using a conventional CTAB procedure with modification (Toruan et al., 1996). Genomic DNA was extracted from 300 mg of fresh leaf using CTAB methods. Genomic DNA concentrations were estimated with spectrophotometer. The yield of DNA per gram of leaf tissue extracted was measured using a UV spectrophotometer at 260 nm. The purity of DNA was determined by calculating the ratio of absorbance at 260 nm to that of 280 nm. DNA concentration and purity was also determined by running the samples on 0.8% agarose gel. DNA amplification was performed in a thermal cycler (Eppendorf). The reaction mix

International Seminar on Biological Sciences (ISBS - 2015) 79
was preheated at 94ºC for four minutes followed by 36 cycles of one minute denaturation at 94ºC one minute annealing at 36ºC and elongation or extension at 72ºC for 2 minutes. After the last cycle, a final extension of five minutes at 72ºC was added to allow complete extension of all amplified fragments. After completion of cycling programme, reactions were held at 4ºC (Setiyo, 2001). The amplified products were mixed with 4 μl of 6X loading dye and resolved in 1.5% agarose gel containing ethidium bromide in a horizontal electrophoresis tank containing 1X TAE buffer (Sambrook et al., 1989). DNA bands were recorded using a gel documentation system and the images were photographed.
The dissimilarity matrix obtained enabled two types of descriptive analysis of diversity: (i) a Principal Coordinates Analysis (PCoA), of the factor analysis type on a dissimilarity table (Perrier and Jacquemoud-Collet 2006) to clearly bring out the main origin groups and (ii) a Neighbour-Joining Tree (NJTree) according to Saitou and Nei (1987) to gain a clearer picture of relations between individuals. These calculations and descriptive analyses were carried out with DARwin5.05 software (Perrier and Jacquemoud-Collet 2006).
RESULTS AND DISCUSSION PCR products of 2 primers (OPD-13 and OPI-20) showed 9 bands, 4 band of OPD-13 and 5 band of OPI-20 (Figure 1). The all locus was perfomed on 100 % polymorphic. Factorial methods aimed mainly to give an overall representation of diversity, are not really interested in individual effects. The Principal Coordinates Analysis (PCoA) identifies several independent axes or eigenvectors that are linear combinations of the characters studied. Our PCoA was performed on the 9 bands revealed by the 2 RAPD lokus loci over the 30 natural accessions. Distinct subgroups were discriminated, with axes 1 (25.53%) and axis 2 (20.84%) explaining 46.37 % of the total molecular variability.
As per Perrier and Jacquemoud-Collet (2006), “tree methods constitute another approach for representating its diversity structure, which tends to faithfully represent individual relations that may be less accurate than factorial analyses on the overall structure.” Our unrooted Neighbour-Joining tree gave a quite nice picture about the relations accessions (Figure 1). Three major clusters were formed: cluster I consisted of accessions K1, K3, S3, D1, D6, D8, D9, D10, D11, D12, D14, D15, D16, and D17, in cluster II consisted of accessions K2, S1, S2, S4, S5, S6, S7, S8, S9, D2, D3, D4, and D13, and the cluster III consisted of accession D7. The accessions from Kabupaten Dairi’s origin (D1, D2, D3, D4, D6, D7, D8, D9, D10, D11, D12, D13, D14, D15, D16, D17) formed broader in three clustering and the accessions from Kabupaten Simalungun’s origin (S1, S2, S3, S4, S5, S6, S7, S8, and S9 ) and Kabupaten Karo’s origin (K1, K2, and K3) formed broader in two clustering.
This preliminary study showed there was three unique accessions ( D7, K2 and S3), which brought some genes somewhat limiting a diversity loss due to the the intra selection of other origins. Assessing genetic diversity analysis from 30 accessions formed three main clustering. Dairi accession D7 had genetic dissimilarity with another Dairi’s accessions , Karo accession K2 had genetic dissimilarity with another Karo’s accessions and in the meanwhile Simalungun accession S3 had genetic similarity with another accessions in Cluster I.

80 International Seminar on Biological Sciences (ISBS - 2015)
Figure 1. Representation of the unrooted Neighbor-Joining tree with RAPD
genotypes using the simple matching distances, under DARwin5 References Orozco–Castillo, K.J. Chalmers, R.Waugh & W. Powell. (1994): Detection of genetic diversity and
selective gene introgression in coffe using RAPD markers, Theor. Appl. Genet. 87: 934 –940.
Perrier X. dan Jacquemoud-Colled J.P. (2006). DARwin Software. http://darwin.cirad.fr/darwin Saitou N and Nei M. (1987): The Neighbor-joining method: a new method for reconstructing
phylogenetic trees, Mol. Biol. Evol. 4 : 406–425 Setiyo, I. E. (2001): Pemetaan dan keragaman genetik RAPD pada kelapa sawit Pancur (RISPA).
Thesis, PPS IPB. Bogor. Siregar, B. L., (2003): Andaliman (Zanthoxylum acanthopodicum DC.) di Sumatera Utara:
Deskripsi dan perkecambahan, J. Hayati. 10(1): 38-40 Toruan-Matius, N., T. Hutabarat., T. Sundari. (1996): Pengaruh pengemasan dan penyimpanan
terhadap DNA tanaman perkebunan untuk analisis RAPD, Menara Perkebunan. 64 (1): 3-12.
І
ІI
ІII
International Seminar on Biological Sciences (ISBS - 2015) 81
Characteristics Composts Biochar With and Without Addition of Chicken Manure
Havena, M.1 and S. Mayly*2
1) Department of Agroecotechnology, Faculty of Agriculture, Pembangunan Panca Budi University, Medan 2)Department of Agroecotechnology, Faculty of Agriculture, Al Washliyah Medan University, Medan,
Indonesia;
*E-mail: [email protected]
ABSTRACT Biochars are low in nutrients, depending on feedstock and pyrolysis temperature. This limited supply of nutrients implies additional fertilization if biochar is applied for agricultural purposes The addition of biochar combined with organic fertilizers such as compost to soil improves C sequestration, soil fertility and plant growth. The objective of this research was to evaluate characteristics compost biochar with and without addition chicken manure. The experimental design used was randomized block design with 2 factors and three replications . The first factor were rice hull biochar, sawdust biochar, oil palm empty fruit bunch biochar, rice straw biochar. The second factor was without and with addition of chicken manure. Compost input material consisted of 25% biochar and 75 % manure. Then compost raw material was added nutrien solution then mixed every two day and composted together for four weeks. Type biochar, chicken manure addition and its interaction had significant effect on compost temperature, compost pH, compost moisture content. The treatment combination from chicken manure addition with each biochar type increased compost temperature and compost pH, but decreased compost moisture contents for all recorded days compared with the combination biochar type with no chicken manure addition. Keywords: Biochar, compost, manure, moisture content, pH, temperature
INTRODUCTION Biochar is a rich product C produced from biomass that is heated at a low temperature (~ 350-600 ° C) in little or no oxygen environment. Biochar characteristics are high cation exchange capacity (CEC, 40-80 cmol kg-1), a high surface area (51-900 m2 g-1), which increase soil pH and improve water-holding capacity, and affinity makro and micro nutrients (Lehmann, 2007; Laird, 2008; Gaunt dan Lehmann, 2008; Cheng et al, 2008.; Novak et al, 2009.; Lehmann dan Joseph, 2009; Roberts et al., 2010).
Agricultural and animal waste is a renewable and valuable waste as rich sources of carbon. In recent years, biochar has been used as a soil amendment to improve soil fertility (Hammes and Schmidt, 2009; Cao and Harris, 2010). Biochar can improve soil fertility and productivity, carbon storage and sequestration, water infiltration into the soil and bind dissolved pollutants (Lehmann and Joseph, 2009).
Biochar is potential to be developed as absorbing and releasing nutrients (fertilizer) because it has a very large surface area, relatively similar to soil colloids and has a high level absorption (adsorption) for material in the form of a solution or vapor. Rice hull biochar and coconut shell biochar has a better potential as a supplementary fertilizer P and K compared with wood biochar and sawdust. Biochar rice hull has ability to provide the highest P- available, while the coconut shell biochar provides highest K-available (Glaser et al., 2002; Kokana et al., 2010).
Rice hull biochar enriched with chicken manure increases the number of productive tillers and upland rice grain yield per plot are higher than rice hull biochar without addition chicken manure. Rice hull biochar application shows constantly upland rice growth and yield better compared than no rice hull biochar application (Mayly and Hidayat, 2012). The paper
82 International Seminar on Biological Sciences (ISBS - 2015)
discusses characteristics compost biochar with and without addition chicken manure. MATERIALS AND METHODS This study was conducted in green house of Growth Centre Kopertis I, Medan District in North Sumatera Indonesia. The study used randomized block design with 2 factors and three replications. First factor was biochar type application: B1 (Rice hull biochar); B2(Sawdust Biochar); B3 (Oilpalm empty bunch biochar); B4 (Rice straw biochar) and second factor was without and with chicken manure.
Feedstocks for biochar material were collected from some area at Sumatera Utara; rice hull was collected from rice mill at Sei Rampah District, oil palm empty bunch from small traders at Sei Rampah District, saw dust from sawmill at Sampali District Medan, rice straw from paddy field at Perbaungan District, and chicken manure from small poultry at Sei Rampah District. The crop residues were cut into smaller size than dried in the sun and converted to biochar using the simple stove. After 4-6 hours biochar was made formed then quenched with water. Raw materials of compost were biochar and chicken manure with weight ratio 1 : 3. Compost raw material weight was 4 kg, consisting of biochar 1 kg and chicken manure 3 kg. For treatment without addition chicken manure, the compost raw was only 4 kilograms of biochar. The materials were placed into paint cans, then watered with water and MOL solution until piles becoming wet and stirred to get uniform mixed. Paint cans were covered with plastic and temperature was measured everyday.
Data were analyzed using Analysis of varience (ANOVA) to separate the main effect of factors as well as their interactions. Thmean comparisons were made using Duncan’s Multiple Range Test (DMRT) at p<0.05 between treatments. RESULTS AND DISCUSSION The analysis of varience showed that biochar type significantly affected compost temperature for 25 days after composting (p<0,05), but it was not significant for 0 and 13 days of composting. The analysis of varience showed that chicken manure addition and interaction between type biochar and chicken manure significantly affected compost temperature for all days recorded (p<0,05). The treatment combination from chicken manure addition with each biochar type like rice hull biochar, sawdust biochar, oil palm empty bunch fruits, rice strover biochar increased compost temperature for all recorded days compared with the combination biochar type with no chicken manure addition, except the combination rice hull biochar and no chicken manure addition (B1M0) at 13 days of composting had higher compost temperature than combination rice hull biochar and chicken manure addition (B1M1). The highest compost temperatures for each recorded day were B2M1 (0 days), B3M1 (13 days), B4M1 (25 days) and the lowest compost temperature for 0 days (B2M0), 13 days (B4M0), and 25 days (B1M0, B2M0, B3M0, B4M0 and B2M1). B4M1 showed significantly different temperature with all other combination treatment and B1M0 had no significant different with B2M0, B3M0, B4M0, B2M1 but had significant different with B4M1, B3M1, B1M1 for 25 days after composting.

International Seminar on Biological Sciences (ISBS - 2015) 83
Figure 1. Effect of Type Biochar and Chicken Manure Addition on Compost Temperature
The analysis of varience showed that biochar type, chicken manure addition and interaction between two factors significantly affected compost moisture contents for all days recorded (p<0,05). The treatment combination of chicken addition with each biochar type decreased moisture contents for all recorded days compared with the combination biochar type with no chicken manure, except the combination oil palm empty bunch biochar and no chicken manure (B3M0) at 0, 13, 25 days after composting which showed higher moisture contents than combination oil palm empty bunch biochar and chicken manure addition (B3M1). The highest compost moisture content for each recorded days was B1M0 and the lowest was B2M1. B1M0 had significantly different moisture with all another combination treatment but B2M1 had no significant different with B4M1, B3M0, B4M0 but significant with B1M1, B2M0, B3M1 for 25 days of composting which can be seen at Figure 2.
Figure 2. Effect of Type Biochar and Chicken Manure Addition on Compost Moisture contents
29.00
29.50
30.00
30.50
31.00
31.50
32.00
32.50
33.00
33.50
B1M0 B1M1 B2M0 B2M1 B3M0 B3M1 B4M0 B4M1
Com
post
Tem
pera
ture
°C
0
13
25
0.00
2.00
4.00
6.00
8.00
10.00
12.00
14.00
16.00
18.00
20.00
B1M0 B1M1 B2M0 B2M1 B3M0 B3M1 B4M0 B4M1
Com
post
moi
stur
e (%
)
0
13
25

84 International Seminar on Biological Sciences (ISBS - 2015)
Biochar type, chicken manure addition and interaction between two factors significantly
affected compost pH for all days recorded (p<0,05). The treatment combination of chicken addition with each biochar type increased compost through the experiment compared with the combination biochar type with no chicken manure addition, except some combinations like B1M0, and B3M0. The highest compost pHs for each recorded days were B4M1 (0 days), B3M0 (13 days), B1M0 (25 days) and the lowest compost pHs were B3M0 (0 days), B2M0 (13 days), and B4M0 (25 days). B4M1 had significantly different with all another combination treatment except B1M1 combination treatment and B4M0 had significant different with all another combination treatment except with B2M0 for 25 days after composting. Compost pH due to biochar type and chicken manure addition can be seen at Figure 3.
Figure 3. Effect of Type Biochar and Chicken Manure Addition on Compost pH
Type biochar, chicken manure addition and its interaction had significant effect on compost temperature, compost pH, compost moisture content. The treatment combination from chicken manure addition with each biochar type increased compost temperature and compost pH, but decreased compost moisture contents for all recorded days compared with the combination biochar type with no chicken manure addition.
The compost showed a rapid rise of temperature during the first days and the thermophilic phase lasted 38 days until ambient temperature was reached. The moisture content stabilized within the first 3 week of composting and the pH values remained alkaline during the composting process. The compost made a little changes in the contents and patterns of benzene polycarboxylic acids of the biochars. The surface area of the biochars declined during the composting process due to the clogging of micropores by sorbed compost-derived materials. Interactions with composting substrate thus enhance the nutrient loads but alter the surface properties of biochars (Prost et al.,2013).Type biochar, chicken manure addition and its interaction had significant effect on compost temperature, compost pH, compost moisture content. The treatment combination from chicken manure addition with each biochar type increased compost temperature and compost pH, but decreased compost moisture contents for all recorded days compared with the combination biochar type with no chicken manure addition.
0.00
1.00
2.00
3.00
4.00
5.00
6.00
7.00
B1M0 B1M1 B2M0 B2M1 B3M0 B3M1 B4M0 B4M1
Com
post
pH
0
13
25

International Seminar on Biological Sciences (ISBS - 2015) 85
Acknowledgement The research was funded by Directorate General of Higher Education, Ministry of Education and Culture under Hibah Bersaing research Grant. References Cao, X., Ma, L., Liang, Y., Gao, B., Harris, W. (2011): Simultaneous immobilization of lead and
atrazine in contaminated soils using dairy-manure biochar. Environ.Sci. Technol. 45, 4884–4889.
Cheng, C., J. Lehmann, J.E. Th ies, and S.D. Burton. (2008): Stability of black carbon in soils across a climatic gradient. J. Geophys. Res. 113:G02027. doi:10.1029/2007JG000642.
Hammes, K., Schmidt, M.W.I., (2009): Changes of biochar in soil. In: Lehmann, J., Joseph, S.(Eds.), Biochar for Environmental Management: Science and Technology. Earthscan,London, pp. 169–181.
Gaunt, J.L., and J. Lehmann. (2008): Energy balance and emissions associated with biochar sequestration and pyrolysis bioenergy production. Environ. Sci.Technol. 42:4152–4158. doi:10.1021/es071361i
Glaser, B., Lehmann, J., Zech, W. (2002). Ameliorating physical and chemical properties of highly weathered soils in the tropics with charcoal – a review Biol Fertil Soils (2002) 35:219–230. doi 10.1007/s00374-002-0466-4
Kookana, R.S., Yu, X. Y., Ying, G.G., (2010): Black is the New Green : The Blue Shades of Biochar. World Congress of Soil Science, Soil Solutions for a Changing World 1 – 6 August 2010, Brisbane, Australia.
Laird, D.A., Fleming, P., Davis, D.D., Horton, R., Wang, B., Karlen, D.L., (2010). Impact of biochar amendments on the quality of a typical Midwestern agricultural soil.Geoderma 158, 443–449.
Lehmann J (2007) Bio-energy in the black. Front Ecol Environ 5:381–387 Lehmann, J., Joseph, S., (2009): Biochar for environmental management: an introduction.
In:Lehmann, J., Joseph, S. (Eds.), Biochar for Environmental Management: Science and Technology. Earthscan, London, pp. 1–12.
Mayly, S., dan Hidayat, B. (2012): Desain Adaptasi Padi Menghadapi Dampak Perubahan Iklim Pada Beberapa Gradien Altitude di Sumatera Utara. Laporan Hasil Hibah Bersaing Tahun 2012. FP UNIVA Medan
Novak J.M., Busscher W.J., Laird D.L., Ahmedna M, Watts D.W.,Niandou M.A.S (2009): Impact of biochar amendment on fertility of a southeastern coastal plain soil. Soil Sci 174:105–112.
Prost, K., N. Borchard, J. Siemens, T. Kautz, J-M. Séquaris, A.Möller, and W.Amelung, (2013): Biochar Affected by Composting with Farmyard Manure J. Environ. Qual. 42:164–172 doi:10.2134/jeq2012.0064
Roberts, K.G., B.A. Gloy, S. Joseph, N.R. Scott, and J. Lehmann. (2010): Life cycle assessment of biochar systems: Estimating the energetic, economic, and climate change potential. Environ. Sci. Technol. 44:827–833. doi:10.1021/es902266r

86 International Seminar on Biological Sciences (ISBS - 2015)
In Vitro Technique For Establishment of Celosia Culture as Betalain Resources
Mastuti, R.
Department of Biology, Faculty of Mathematics and Natural Sciences, Brawijaya University. Jl. Veteran, Malang 65142
*E-mail: [email protected]. id ; [email protected]
ABSTRACT Celosia, member of Amaranthaceae, has a beautiful flower with various colors due to the content of betalain pigment. Betalain is red-violet and yellow-orange pigment which is only produced by some families from Caryophyllales. Pigment biosynthesis is restricted to certain organ or plant physiological age. In vitro technique provides an alternative method to produce secondary metabolite compounds including pigments which can be harvested anytime of the year. Therefore, the goal of the research is to know the dedifferentiation reponses of Celosia leaf, cotyledon and hypocotyle explants to induce callus containing betalain pigments. Explants derived from field were successively sterilized with tap water 60 min, alcohol 70% 30 sec, bayclean 10% 15 min and finally rinsed with aquadest steril three times for five min each. MS solid medium supplemented with combination of auxin and cytokinin were used to induced callus. The results showed that both of leaf and petiole explants were possible to dedifferentiate into high proliferated callus tissues. White, green or red callus indicating the betalaian content was produced in suitable concentration of BAP:NAA. The continue production of Celosia red callus containing betalains pigment will facilitates the availability of safe and healthy natural dyes. Keywords: Amaranthaceae, callus, explants, leaf, petiole INTRODUCTION Plants are enermous sources of secondary metabolites which are economically important such as drugs, flavors, fragrance, dye and pigments, and food additives (Balandrin and Klocke, 1988). Those products which are commercially/frequently used today are modifications or copies of the naturally obtained substances. The changing people’s understanding to natural resources has resulted in the increasing need of plant availability in high number. Biotechnological approaches, specifically, plant tissue cultures, offers not only to provide/prepare cultivated plants but also improving the production of bioactive plant metabolites. The in vitro techniques are found to have potential as a supplement to traditional agriculture in the industrial production of bioactive plant metabolites (Ramachandra Rao and Ravishankar, 2002). It can ultimately provide a continuous, reliable source of natural products. Plant cell and tissue culture technologies can be established routinely under sterile conditions from explants, such as plant leaves, stems, roots, and meristems using artificial medium for plant multiplication and improvement of secondary metabolites (Hussain et al., 2012). Improvement of secondary metabolites can be approached by modification of medium condition, elicitation, establishmnet of hairy root culture etc.
Betalains are natural pigments which in higher plants is restricted to some families of Caryophyllales (Mabry et al., 1963). Betalains of higher plants are in different organs (Rosendal-Jensen et al., 1989). They produced red, pink, purple, yellow, and orange due the sub class of betacyanin and betaxanthin. Based on the function betalains were classified into three groups (Delgado Vargas et al., 2010). The importance of betalain pigments in plant taxonomy and systematic distribution was clear. Betalains and antocyanin are mutual exclusive. It means that both of those pigments are never found in the same individual plants. Betalains also have ecological ang physiological aspects. In flower and fruits the betalains may have a role as
International Seminar on Biological Sciences (ISBS - 2015) 87
attractants for vectors (insects or birds) in the pollination process and in seed dispersal by animals (Piatelli, 1976; Weiss, 1995). Although structurally related to alkaloids, betalains have no toxic effects in the human body since they are present in considerably high amounts in certain foodstuffs, such as red-beet, prickly pear fruits, and Amaranthus seeds (Böhm and Rink, 1988). Betalains also have many pharmacological and physiological activities, such as antioxidant, anti-inflammatory, antiviral, and antimalarial (Azeredo, 2009). Therefore, betalains have been considered as safe natural alternative to some synthetic color additives that are currently in use (Delgado Vargas et al., 2010).
Celosia, member of Amaranthaceae, has a beautiful flower with various colors due to the content of betalain pigment. Celosia has three species namely C. cristata, C. plumosa and C. argentea. In Indonesia Celosia has been widely used for traditional medicine (Wijayakusuma, 2008) especially which is derived from flower in fresh or dry materials (Yuniarti, 2008). However, pigments are only accumulated in specific organ and certain physisological stages. Meanwhile, young and meristematic tissues for any part of plants can be induced to form to form plantlets, somatic embryo or callus tissues. Therefore, the objective of this research is to observe the competence of different types of Celosia explant tissues to dedifferentiate into callus as continuous betalain resources. MATERIALS AND METHODS Plant materials Leaf explants of C. argentea were derived from plants collection grown in garden. While hypocotyle and cotyledon were derived from in vitro seedling germinated seeds. Explants sterilization and callus induction Contaminant elimination from young leaf derived from in vivo plant was began with washing it under running tap water for one hour. Afterwards explants were surface sterilized in alcohol 70 % for 30 second, then in bayclean 10 % for 15 minutes. Finally explants were rinsed three times for five minutes each in sterile aquadest. The sterile leaves were cultured on Murashige and Skoog (1962) basal media supplemented with combination of growth regulator hormone 2,4-D (0.1 mg/L ; 0.25 mg/L; 0.50 mg/L), BAP (1.0 mg/L ; 2.0 mg/L) and NAA 2.0 mg/L, sucrose 30 g/L and solidified with 10 g/L agar. Manipulation of osmotic stress in culture medium Actively growing callus was sub cultured on medium of osmotic stress treatment with modification sucrose concentration. Concentrations of sucrose were 30, 35 and 40 g/L. All callus cultures were incubated with 40 watt fluorescent lamp irradiating continuously at a temperature of 23-24°C. Betacyanin content of Celosia callus grown on osmotic stress medium were measured at three ages of growth, 14, 21 and 28 days after subculture. Quantification of betacyanin Quantification of betacyanin pigments was performed on red callus derived from leaf explants, as well as red and violet flowers in vivo. Samples were crushed in mortar with a pestle. Pigments extracted with the addition of 80% methanol with a ratio of 20 ml / g. The solution was centrifuged at a speed of 3,000 rpm for 15 minutes. Supernatant was taken and separated from the pellets. Betacyanin absorbance in the supernatant was measured at a wavelength of 538 nm. Betacyanin concentration is calculated by Beer-Lambert formula where, A: the absorbance of the sample, ι: 1, MW: 726.6, FP: dilution factor = 10, H: betacyanin molar extension coefficient (amaranthin): 5.66 x 104 cm2 / mol, Vol: extract the final volume = 10 ml.

88 International Seminar on Biological Sciences (ISBS - 2015)
RESULTS AND DISCUSSION Approximately one week after culture explant tissues expanded and become thick (Fig. 1A,E,I). It indicated that dedifferentiation process occured. Afterwards, actively proliferated cells produced amorphous callus at wounding sites (Fig 1B,C,F,J,K) and continue to all part of mother tissues (Fig 1D,G,H,L). Hypocotyle, cotyledon and leaf tissues showed similar respond to the combination of growth regulator tested. All medium tested contained auxin (2,4-D or NAA) and cytokinin (BAP).
Figure 1. Dedifferentiation responses of Celosia hypocotyles, cotyledon and leaf in MS medium in vitro. A-D, hypocotyle explants in MS + 2,4-D 0.25 + BAP 1.0; E-H, cotyledon explants in MS + 2,4-D 0.25 + BAP 1.0; I-L leaf explants in MS + NAA 2.0 + BAP 2.0. A-B, Celosia var. cristata; C-D, Celosia var. Pia; E-L, Celosia argentea.
Hypocotyle and cotyledon explants only produced callus on medium supplemented with 2,4-D 0.25 mg/L and BAP 1 mg/L (Table 1). Lower or higher concentration of 2,4-D had no effect on callus formation although it combined with different concentration of BAP. Combination of BAP and NAA did not induce callus formation in hypocotyle and cotyledon explant tissues. On the contrary, leaf explants showed different respond related to the combination of growth regulated supplemented into the medium. All combination of 2,4-D, NAA and BAP except for 2,4-D 0.25 mg/L and 1.0 mg/L apparently suitable to induce callus. Table 1. Combination of auxin:cytokinin to induce callus derived from several explant types
No Auxin Cytokinin Explant types 2,4-D NAA BAP Hypocotyle Cotyledon Leaf
1 0.1 - 1.0 - - + white friable
2 0.25 - 1.0 +++ red friable
++++ red, white
friable -
3 0.50 - 2.0 - - +++
red, white, friable
4 - 2.0 2.0 - - ++++
red, white, friable

International Seminar on Biological Sciences (ISBS - 2015) 89
Callus is mass of parenchyme tissue consisted of actively proliferated cells. Plants generate unorganized cell masses, such as callus or tumors, in response to stresses, such as wounding or pathogen infection (Ikeuchi et al., 2013). Since in in vitro system explant tissues was separated from synthesis sites of growth hormone in mother plant the balance of ratio between exogenous auxin and cytokinin determine callus formation. Auxin and cytokinin play important role in many aspects of plant growth and development (Su et al., 2011). The interaction between auxin and cytokinin is particularly important to control a few developmental processes. Studies on chemical regulation of growth and organ formation in in vitro plant tissues indicated that excess of zuxin over cytokinin promote root formation (Skoog and Miller, 1957). In this result higher exogenous cytokinin:auxin ratio promoted callus formation. It seems that the concentration is suitable ratio with endogenous hormone.
All callus formed in four culture media showed various color in red, white and green. However red callus was predominantly observed. It showed that medium composition and supplemented growth regulator stimulated biosynthesis of betalain pigments. Many reports showed that kinetin was able to replace the light requirement for betalain production (Piattelli et al., 1971; Giudici de Nicola et al., 1973). Kinetin, like light, acts at two different level namely, gene activation and control of the availability of energy-rich compounds (Piattelli, 1981).
The result of spectrophotometry analysis showed that in vitro callus culture derived from leaf explant produced betacyanin (Figure 2). Betacyanin content of red callus in vitro (0.22 mg / 100 g FW) was almost the same with betacyanin content of violet flowers (0.30 mg / 100 g FW). The most abundant betacyanin was obtained from red flower of C. cristata (0.60 mg / 100 g FW). The pigment content in callus culture showed that condition in vitro system supported Celosia callus to synthesize betacyanin.
Figure 2. Betacyanin content in leaf-derived callus of C. argentea and in vivo flower of C. argentea and C. cristata
The result of sucrose treatment showed that the longer the culture age the betacyanin increased (Figure 3). On the addition of 35 g /L sucrose the content of betacyanin which only reached 0.064 mg / 100 g FW at 14 days after culture increased to 0.073 mg / 100 g FW after 28 days of culture. Even the addition of 40 g / L sucrose the content of betacyanin which only reached 0.058 mg / 100 g FW at 14 days after culture increased to 0.129 mg / 100 g FW after 28 days of culture.

90 International Seminar on Biological Sciences (ISBS - 2015)
Figure 3. Effect of sucrose on betacyanin contents in callus of C. argentea
In this research, sucrose induced osmotic stress increased the betacyanin content. It
shows that Celosia callus relative growth rate increased along with betacyanin biosynthesis. Betacyanin content of Beta vulgaris cell suspension also increased with increasing cell growth during the log phase (Akita, 2000). The carbon source has long been recognized as an important factor in the production of secondary metabolites by plant cell cultures (George et al., 2008). A high concentration of carbon source is often used to induce secondary metabolism. It was assumed that osmotic effect of a high carbon source concentration mimics draught stress which can induce secondary metabolism in plants (Schlatmann et al. 1996). This research showed that in suitable combination of growth regulator the all types of Celosia explant tissues dedifferentiated to form callus which capable to syntesize betacyanin. Therefore callus culture is promising in vitro technique to establish betacyanin resources. References Akita T, Hina, Y. and Nishi, T. (2000): Production of betacyanins by a cell suspension culture of
table beet (Beta vulgaris L.). Biosciense, Biotechnology and Biochemisty. 64(9):1807-12. DOI: http://doi.org/10.1271/bbb.64.1807
Azeredo, H.M.C. (2009): Betalains: properties, sources, applications and stability – a review. International Journal of Food Science and Technology 44: 2365–2376.
Balandrin, M.J. and Klocke, J.A. (1988): Medicinal, aromatic and industrial materials from plants. In .P.S. Bajaj (ed.), Biotechnology in Agriculture and Forestry. Medicinal and Aromatic Plant, vol. 4. Springer-Verlag, Berlin, Heidelberg, pp. 1-36.
Böhm, H. and Rink, E. (1988): Betalains. In: Cell culture and somatic cell genetics of plants. Academic Press, New York, 449–463.
Delgado-Vargas, F., Jimenez, A.R. and Paredes-Lopez, O. (2000): Natural pigments: carotenoids, anthocyanins, and betalains – Characteristics, Biosynthesis, Processing and Stability. Critical Reviews in Food Science and Nutrition 40(3):173-289.
George E.F., Hall M.A. and Jan De Klerck, G. (2008): Plant Propagation by Tissue Culture 3rd Ed. Springer. Netherland. ISBN: 978-1-4020-5005-3, pp:115-173.
Giudici de Nicola, M., Piatelli, M. and Amico, V. (1973): Photocontrol of betaxanthin synthesis in Celosia plumose seedling. Phytochemistry 12(2):353-357.
Hussain, MS., Fareed, S., Ansari, M., Rahman, M.D., Ahmad, I.Z., and Saeed, M. (2012): Curent approaches toward production of secondary plant metabolites. J Parm Bioallied Sci. 4(1):10-

International Seminar on Biological Sciences (ISBS - 2015) 91
20. Ikeuchi, M., Sugimoto, K and Iwase, A. (2013): Plant callus: mechanism of induction and
repression. Plant Cell 25(9): 3159–3173. Mabry, T.J., Taylor, A., and Turner, B.L. (1963): The betacyanins and their distribution,
Phytochemistry, 2: 61–64. Murashige, T. and Skoog, F. (1962): A revised medium for rapid growth and bioassays with
tobacco tissue cultures. Physiologia Plantarum 15:473-497. Piatelli, M., Giudici de Nicola, M. and Castrogiovanni, V. (1971): The effect of kinetin on
amaranthin synthesis in Amaranthus tricolor in darkness. Phytochemistry 10:289-293. Piatelli, M. (1976): Betalains. In: Goodwin, T.W., Ed. Chemistry and Biochemistry of Plant
Pigments. Vol. 1, Academic Press, New York, 560–596. Piatelli, M. (1981): The Betalains: Structure, Biosynthesis and Chemical Taxonomy. In: Stump, P.K.
and Conn, E.E. The Biochemistry of Plants: A Comprehensive Treatise. Academic Press, New York, 557–576.
Ramachandra Rao, S. and Ravishankar, G.A. (2002): Plant cell cultures: Chemical factories of secondary metabolites. Biotechnol. Adv. 20: 101-153.
Rosendal-Jensen, S., Juhl-Nielsen, B. and Dahlgren, R. (1989): Use of chemistry in plant classification, Rev. Latinoamer. Quím. Suppl 1: 66–89.
Schlatmann, J.E., ten Hoopen, H.J.G., Heijnen, J.J. (1996): Large-scale Production of Secondary Metabolites by Plant Cell Cultures. In: Plant Cell Culture Secondary Metabolism Toward Industrial Application, DiCosmo, F. and M. Misawa, (Eds.), CRC Press, Boca Raton Florida, pp: 11-52. ISBN:0-8493-5135-9.
Skoog, F. and Miller, C.O. (1957): Chemical regulation of growth and organ formation in plant tissues cultured in vitro. Symposium Social and Experimental Biology. 54: 118-130
Su, Y.H., Liu, Y.B. and Zhang, X.S. (2011): Auxin-cytokinin interaction regulates meristem development. Molecular Plant 4(4):616-625.
Weiss, M.R. (1995): Floral color change: a widespread functional convergence, Am. J. Bot. 82(2): 167–185.
Wijayakusuma, H.(2008): Ramuan Lengkap Herbal Taklukan Penyakit. Pustaka Bunda. Jakarta. 323 p.
Yuniarti, T. (2008): Ensiklopedia Tanaman Obat Tradisional. MedPress. 439 p.

92 International Seminar on Biological Sciences (ISBS - 2015)
Distribution and Abundance of Mosquito Larvae in Villages Sei Kera Hilir I, Medan Perjuangan, Medan North of Sumatera, Indonesia
Panggabean, M.
Department of Parasitology, Faculty of Medicine, University of Sumatera Utara. Jl. Universitas No.1 Kampus USU, Medan 20155
E-mail: [email protected]
ABSTRACT Mosquitoes are vectors of diseases such as malaria, chikungunya, filariasis, yellow fever, Japanese Encephalitis and dengue fever. The objectives of this study were to determine the density of mosquito larvae in Villages Sei Kera Hilir I, Medan Perjuangan, Medan North of Sumatera, Indonesia, where little is known about their spatial distribution or abundance. Mosquito larva have high detection probabilities, therefore cluster random sampling was used to assess the density of mosquito larvae. Mosquito larvae surveys were conducted with a single larval method. Mosquito larvae were sampled inside and around 100 house at Villages Sei Kera Hilir 1. Samples were examined using a microscope to identify the species Three species of mosquito larvae were detected including Aedes aegypti, Aedes albopictus and Culex sinensis. The density of mosquito larvae were the larva-free rate (LFR) was 34%, Container Index (CI) were 58.8%, House Index (HI) were 66% and Breteau Index (BI) 74% respectively. Therefore, the risk of disease transmission as high within the study area boundaries and effective control measures should be initiated. Keywords:, Breteau Index, Container Index, House Index, Larva-free rate, mosquito larvae INTRODUCTION Mosquitoes (Order Diptera, family Culicidae), transmit many tropical and subtropical diseases such as dengue fever, yellow fever, malaria, filariasis, chikungunya and Japanese encephalitis (Service, 2004). Mosquito-borne diseases cause millions of deaths worldwide every year with a disproportionate impact on children and the elderly. The species of mosquitoes that are the primary disease vectors include Aedes sp, Culex sp, Anopheles sp, and Mansonia sp (Sembel, 2009). Vector control is definitely the best method of protecting the community against the vector-borne diseases (Sharma, 2001). Personal protection from biting mosquitoes is the first choice of defense against the infectious disease (WHO, 2004).
Mosquitoes breed in varied habitats and different genera exhibit specific habitat and breeding preferences. Anopheles spp. are associated with fresh water habitats, whereas Culex species often occur in polluted conditions including septic tanks and Aedes species breeds in domestic waste and other small water collection sites including desert coolers (Parthiban and David, 2007).
Evaluation of larval mosquito habitats in terms of species composition and resources can help in understanding the bio-ecology and related control measures of mosquitoes more appropriately (Aditya et al. 2006). Also, proper identification of different species of mosquitoes and monitoring their distribution and abundance is of a paramount importance for their control. An intelligent information system would help us to control diseases in advance and also provide advice to government and public health professionals to take action (Tsai et al. 2012). For effective larval control of mosquitoes, a sound understanding of the factors responsible for variation in larval production is essential (Kenea et al. 2011). These potential diseased situations can be best tackled by improving the knowledge about the their spatial distribution or abundance vectors and their habitats for control vectors (Kocher and Dipti, 2014).

International Seminar on Biological Sciences (ISBS - 2015) 93
MATERIALS AND METHODS The study area The Villages Sei Kera Hilir I, districts Medan Perjuangan, Medan- North of Sumatera is located along he district East Medan to the north and district Medan Tembung to the south at Medan- North of Sumatera, Indonesia. This villages has a population size of 16,571 with 1,590 houses (Statistic data Districts Medan Perjuangan, 2015). This location were selected for mosquito larvae collection because of their accessibility and abundance of mosquitoes. Larval collection During the period from May 2015 to June 2015 mosquito larvae were collect from all potential breeding sites in the study area, including stagnant water contained in artificial containers (e.g. used plastic, flower vases, old tires), and natural containers (e.g. coconut shell, bamboo segments, tree holes and puddles). Larvae were collected using a plastic pipette 5 ml in a small places such as artificial containers and natural containers. In larger habitats (e.g, puddles, tires) a scoop 500 ml was used to collect larvae. Larvae that were in murky water were collected with the aid of a flashlight. Collected larvae were transferred into sealed plastic container, which was labeled with the location, water pH. Other data that were collected at each larvae breeding site were date, current weather conditions, and habitat type of breeding site. Then mosquito larvae were brought back to laboratory to identification. Whole larvae are preserved by first killing them with hot water (600C). The hot water fixes proteins which prevents later darkening of the specimens. Larvae subsequently identified in the laboratory using microscope, identification books (Service, 20004 and Sembel, 2009) and journals (Rattanarithikul et al., 2005; Rattanarithikul et al., 2010) and pictorial keys. Data Analysis Data were analysis as follow: (a) Larva free rate (LFR), the percentage of houses no larvae mosquitoes detected with
mosquito larva. If LFR > 50% is lower risk of disease and <50% is high risk of disease (Sanchez et al., 2006).
(b) Container Index (CI), the percentage of containers that contained mosquito larva. If CI >50% is high risk of disease transmission and <50% is lower risk of disease (Zulkarnaini and Dameria, 2009).
(c) House Index (HI), the percentage of houses where mosquito larva were detected. If HI >50% is high risk of disease transmission and <50% is lower risk of disease (Sanchez et al., 2006).
(d) Breteau Index (BI), the percentage containers detected mosquito larva with 100 houses collected. If BI >50% is high risk of disease transmission and <50% is lower risk of disease transmission (Zulkarnaini and Dameria, 2009)
. RESULTS AND DISCUSSION During the study period, 100 houses were randomly selected from total of 1590 houses in the village. There were three species of mosquito larvae detected: Aedes aegypti, Aedes albopictus and Culex sinensis. Of these 100 houses, 66 (66%) houses had mosquito larvae and 34 houses no mosquito larvae detected. Habitats where mosquito were detected included puddles, leaf axils, bamboos, plastic containers, tires, water reservoirs in the refrigerator/dispenser and drains that is not cleaned around the house which contained the larvae (Table 1).
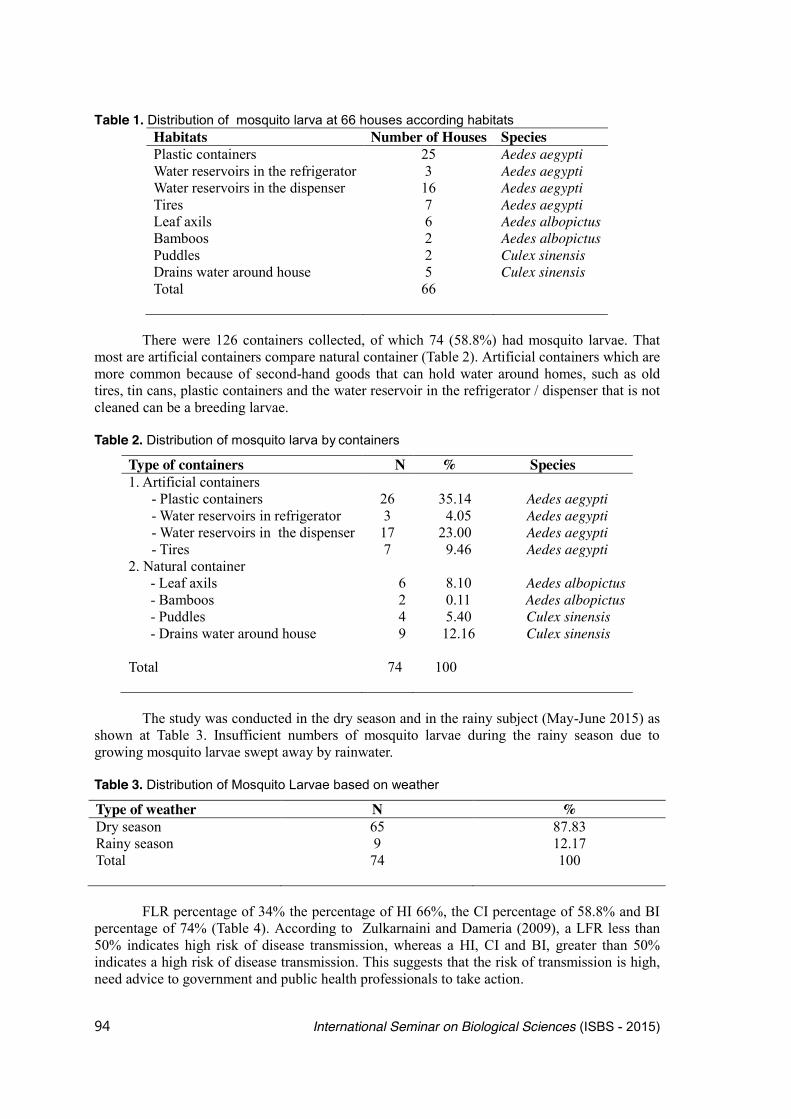
94 International Seminar on Biological Sciences (ISBS - 2015)
Table 1. Distribution of mosquito larva at 66 houses according habitats Habitats Number of Houses Species Plastic containers Water reservoirs in the refrigerator Water reservoirs in the dispenser Tires Leaf axils Bamboos Puddles Drains water around house Total
25 3
16 7 6 2 2 5
66
Aedes aegypti Aedes aegypti Aedes aegypti Aedes aegypti Aedes albopictus Aedes albopictus Culex sinensis Culex sinensis
There were 126 containers collected, of which 74 (58.8%) had mosquito larvae. That most are artificial containers compare natural container (Table 2). Artificial containers which are more common because of second-hand goods that can hold water around homes, such as old tires, tin cans, plastic containers and the water reservoir in the refrigerator / dispenser that is not cleaned can be a breeding larvae.
Table 2. Distribution of mosquito larva by containers
Type of containers N % Species 1. Artificial containers
- Plastic containers - Water reservoirs in refrigerator - Water reservoirs in the dispenser - Tires
2. Natural container - Leaf axils - Bamboos - Puddles - Drains water around house Total
26 3
17 7
6 2 4 9 74
35.14 Aedes aegypti 4.05 Aedes aegypti 23.00 Aedes aegypti 9.46 Aedes aegypti
8.10 Aedes albopictus 0.11 Aedes albopictus 5.40 Culex sinensis 12.16 Culex sinensis 100
The study was conducted in the dry season and in the rainy subject (May-June 2015) as
shown at Table 3. Insufficient numbers of mosquito larvae during the rainy season due to growing mosquito larvae swept away by rainwater. Table 3. Distribution of Mosquito Larvae based on weather
Type of weather N % Dry season Rainy season Total
65 9
74
87.83 12.17 100
FLR percentage of 34% the percentage of HI 66%, the CI percentage of 58.8% and BI
percentage of 74% (Table 4). According to Zulkarnaini and Dameria (2009), a LFR less than 50% indicates high risk of disease transmission, whereas a HI, CI and BI, greater than 50% indicates a high risk of disease transmission. This suggests that the risk of transmission is high, need advice to government and public health professionals to take action.

International Seminar on Biological Sciences (ISBS - 2015) 95
Table 4. Distribution of Mosquito Larvae based on Larvae Index
Larvae Index % Larvae free rate (LFR)
House Index (HI) Container Index (CI) Breateau Index (BI)
34 66
58.8 74
Aedes aegypti, Aedes albopictus and Culex sinensis larvae are more common in the dry
season. According Rattanarithikul et al. (2005), the species has a natural habitat is Aedes albopictus, like leaf axils and bamboos, while the container species that has an artificial habitat like plastic containers, tires, water reservoirs in the refrigerator/dispenser is Aedes aegypty. The species had are puddles and drains habitat are Anopheles sp and Culex sp (Qomariah, 2004). The result showed, Aedes aegypti mosquito larvae found in artificial containers, Aedes albopictus in natural habitat and Culex sinensis in are puddles and drains habitat. Culex sinensis occupy a variety of ground-water and other aquatic vegetation (Rattanarithikul et al. , 2005). Culex sinensis also dominan at South Sumatera Indonesia (Anwar et al. 2015). References Chairil Anwar, C., Ghiffari, A., Kuch, U., and Taviv, Y. The Abundance of Mosquitoes (Family: Culicidae) Collected in an Altitudinal Gradient In South Sumatra, Indonesia. International Conference on Agricultural, Ecological and Medical Sciences(AEMS-2015) Feb. 10-11, 2015 Penang, Malaysia.. 28-30 Aditya, G., Pramanik, M. K. and Saha, G. K. (2006): Larval habitats and species composition of
mosquitoes in Darjeeling Himalayas India. Journal of Vector Borne Diseases. 43: 7-15. Kenea, O., Balkew, M. and Michael, J. M. (2011): Environmental factors associated with larval
habitats of Anopheles mosquito (Diptera: Culicidae) in irrigation and major drainage areas in the middle course of the rift valley, central Ethopia. Journal of Vector Borne Diseases. 48: 85-92.
Kocher, D.K and Dipti. (2014): Population Dynamics of Mosquito Larvae in Village Ponds and its Correlation with Physico-Chemical Parameters. International Journal of Science and Research. Volume 3 Issue 8. 890-894.
Parthiban, M. and David, B. V. (2007): Mosquito. In: Manual of household and public health pests and their control. Namrutha Publications, Chennai, India.
Qomariah, M. (2004): Potential survey Anopheles mosquito as a vector of malaria in the former quarrying village Ijo Bacang Kolong at Pangkal Pinang City. Available from http://eprints.undip.ac.id/5907/ [accessed 6 July 2015]
Rattanarithikul, R., Harrison, B.A., Panthusiri, P., and Coleman, R.E. (2005): Illustrated Keys to the Mosquitoes of Thailand I. Background; Geographic Distribution; Lists of Genera, Subgenera, and Species; and a Key to the Genera. The Southeast Asian Journal of Tropical Medicine. Volume 36 (Supplement 1). 1-80.
Rattanarithikul, R., Harbach R.E., Harrison, B.A., Panthusiri, P., Coleman, R.E. and Richardson, J.H. (2010): Illustrated keys to the mosquitoes of Thailand. VI. Tribe Aedini. The Southeast Asian Journal of Tropical Medicine. Volume 41 (Supplement 1). 1-38.
Sanchez, I., Vanlerberghe, V., Alfonso, L., Marquietti, M.D.C., Gizman, M.G., Juan, B., at al. (2006): Aedes aegypti larval indices and risk for dengue Epidemics. Available at http://www.cdc.gov/eid/article/12/5/pdfs/05-0866.pdf. 12(5). [accessed 20 July 2015]
Sharma, V.P. (2001): Health hazards of mosquito repellents and safe alternatives. Current Science 80 (3): 341–342.
Sembel, D. (2009): Medical Entomology. Yogyakarta. Andi Press.

96 International Seminar on Biological Sciences (ISBS - 2015)
Service, M. (2004): Medical Entomology for students. Cambridge University Press. Statistic data Districts Medan Perjuangan, 2015. Tsai, C. T., Sung, F. C., Chen, P. S. and Lin, S. C. (2012): Exploring the spatial and temporal
relationship between mosquito larvae population dynamics and dengue outbreaks based on climatic factors. Scotland Environmental Research and Risk Assessment. 26: 671- 80.
WHO. 2004. Filaria. World Health Organization, Geneva. Available at http://www.who.int/inf- fs/en/html [accessed 21 July 2015]
Zulkarnaini, S.Y.I and Dameria. (2009): Environmental Sanitation Conditions relationship Households with Dengue Mosquito Larvae in Dumai City at 2008. Journal of Environmental Science. 3: 115 – 122.

International Seminar on Biological Sciences (ISBS - 2015) 97
The Spawning Period of Anadara granosa (Bivalvia: Arcidae) Population in the Lhokseumawe Mudflat
Khalil, M.
Aquaculture Department, Malikussaleh University. Reuleut main campus, North Aceh, Aceh Province, Indonesia.
E-mail: [email protected]
ABSTRACT This study determined the spawning period of blood cockle Anadara granosa and correlation to environmental condition. The condition index (CI) analysis was conducted to evaluating the spawning period of the cockle population. Samples were collected from July 2009 until September 2010 at Lhokseumawe tidal mudflat, whereas environmental parameters were measured periodically. The highest CI was observed in September 2010 (CI: 14.15±3.14), while the lowest CI was found in January 2010 (CI: 6.76±1.13). The results indicated that the spawning period and recruitment in the cockle population at Lhokseumawe are dependent on local environment conditions. A. granosa spawned was dribble or throughout the year (peaked from November 2009 to January 2010). The released gamete in A. granosa was coincided with drastic fluctuations in environmental condition. This research found that the water temperature and salinities were the leading triggers of reproductive events. Keywords: Reproductive biology, Blood cockle, Water quality INTRODUCTION In ecosystems, intertidal species such as bivalvia, exhibit a number of important roles that affect diversity, abundance and productivity of biotas of numerous trophic levels (DFO, 2006). Bivalves affect ecosystem energy flow and nutrient cycling and may affect benthic and pelagic community dynamics and structure. Bivalves play an important role in the ecosystem, both in terms of biomass as well as productivity. Northern Strait of Malacca is an important nursery area for many intertidal organisms, and a feeding area for migrating species. One intertidal species of cockle Anadara granosa predicting to be a keystone species within mangroves in several areas in northern straits of Malacca.
Several studies have investigated the ecological relationships of Anadara in different habitats (Broom, 1985; Suwanjarat and Parnrong, 1990). However, no data are available on the physical, chemical and biological parameters that affecting the population dynamics of Anadara granosa in northern straits of Malacca. Regardless of the geographical area or species under study, population growth and reproduction of most intertidal species is regulated by similar environmental factors such as temperature, salinity and food availability (Bayne 1985, MacDonald & Thompson 1985, Baqueiro-Cardenas & Aldana-Aranda 2000). This study evaluated environment conditions that affected the intertidal population dynamics of cockle Anadara granosa. In particular, few data are available on seasonal variation in spawning, which is correlated with the recruitment process and determines temporal changes in the gross condition of animals. This information can use to help develop management protocols for this species that plays a key ecological role in intertidal habitat. MATERIALS AND METHODS Collection of samples A total of 30 samples of adult A. granosa (size range:38–71mm) were collected monthly from July 2009 until September 2010 from the natural grounds in Lhokseumawe (Figure 1) at the

98 International Seminar on Biological Sciences (ISBS - 2015)
East coast of Sumatera Indonesia (050 9' 38.1"N, 95008‘32.3“E). The sampling area was characterized by muddy areas, relatively no wave action and the mangroves were sheltered and exhibited high salinity. After collecting, the specimens were stored in isotherm containers and immediately transported to the laboratory. The samples were fully removed from bio fouling and other adherences.
Figure 1. Sampling area of Anadara granosa from Lhokseumawe, East Coast Sumatera
Indonesia.
Measurement of environmental parameters and collection of water samples The environmental parameters were recorded in situ and ex situ. Water temperature, salinity, pH, turbidity, and dissolved oxygen were recorded in situ while minimum and maximum water temperature and salinity were recorded daily. Water temperatures were collected at sampling areas daily at the bottom of sea beds during the sampling period. Temperature was measured with a handheld maximum minimum thermometer, and salinity was measured with a hand refractometer. The salinity of the seawater was collected daily at the bottom of sea bed depth. Hydrogen ion concentration (pH) was measured using portable pH meter periodically during the sampling period.
Turbidity consists of organic and inorganic matters held in suspension by turbulence in seawater. The turbidity was measured using a turbidity meter model HACH turbidimeter 2100 AN, while the dissolved oxygen was measured using dissolved oxygen meter model YSI 52. Chemical parameters such as nitrate, nitrite, ammonia, and orthophosphate were measured using spectrophotometry. Phytoplankton density was monitored monthly to determine food ability at the cockle habitat. Condition index (CI) A condition index (C) can be used to determine ecophysiological factors that affect the physiological changes of carbohydrate, glycogen and protein fractions under environment influences. A CI is a reflection of the reproductive biology of bivalves. When the gonad mass increases during maturation, the CI will also increase, whereas the CI will decrease progressively after spawning has occurred (Angell, 1986). The water displacement method was used to determine the condition index. A total of 30 specimens were measured monthly

International Seminar on Biological Sciences (ISBS - 2015) 99
including the: dry flesh weight, wet weight of shell in grams (g) and internal cavity volume (ml). To measure dry flesh weight, the flesh was dried at 1050C for 72 hours until it became a constant weight. These data were used to calculate the condition index using the formula described by Scott & Lawrence (1982):
Condition index = dry flesh weight (gram) x 100 / shell internal cavity volume (cm3)
RESULTS AND DISCUSSION Water quality parameters During the study period, the variation in the daily temperature recorded did not show any significance differences. The highest temperature recorded was 34 0C and the lowest was 170C (Figure 2). There was a drastic fluctuation in temperature in middle of June 2009 until early October 2009, thereafter remaining stable through March 2010 and continuously dropped on August 2010. The variation of turbidity unit shown fluctuation during the sampling period. Turbidity ranged from a high during December 2009 (98.23 NTU) to January 2009 (94.54 NTU) and was lowest in November 2009 (16.14 NTU) when dry season occurred. Salinity fluctuated between 27-33ppt, with highest levels observed in October 2009 until end November 2009, February 2014 to April 2014 and June 2014 to August 2014. The lowest salinities were recorded during the month of October to December 2009 during the highest intensity of rain. The variation of pH, dissolved oxygen, phytoplankton density and other chemical compounds at Lhokseumawe from June 2009 to September 2010 were shown in Figure 3.

100 International Seminar on Biological Sciences (ISBS - 2015)
Figure 2. Seasonal variation in maximum-minimum temperature, salinity, and turbidity at
Lhokseumawe from June 2009 to September 2010.
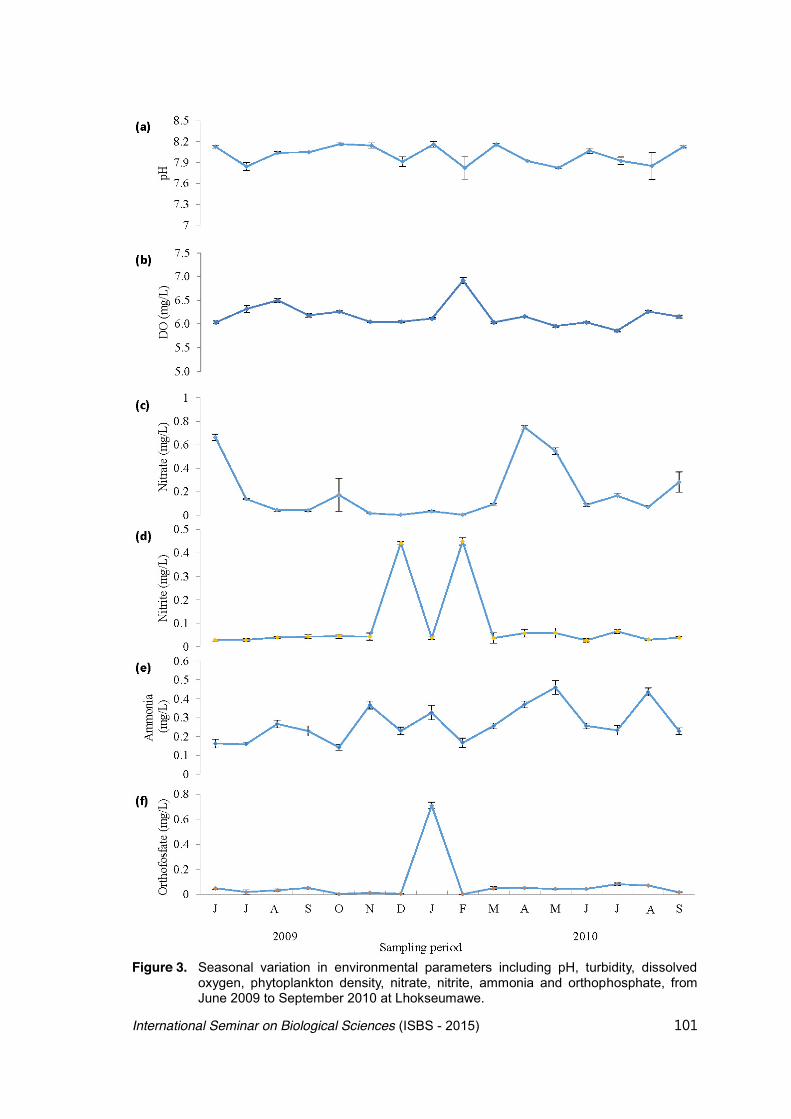
International Seminar on Biological Sciences (ISBS - 2015) 101
Figure 3. Seasonal variation in environmental parameters including pH, turbidity, dissolved
oxygen, phytoplankton density, nitrate, nitrite, ammonia and orthophosphate, from June 2009 to September 2010 at Lhokseumawe.
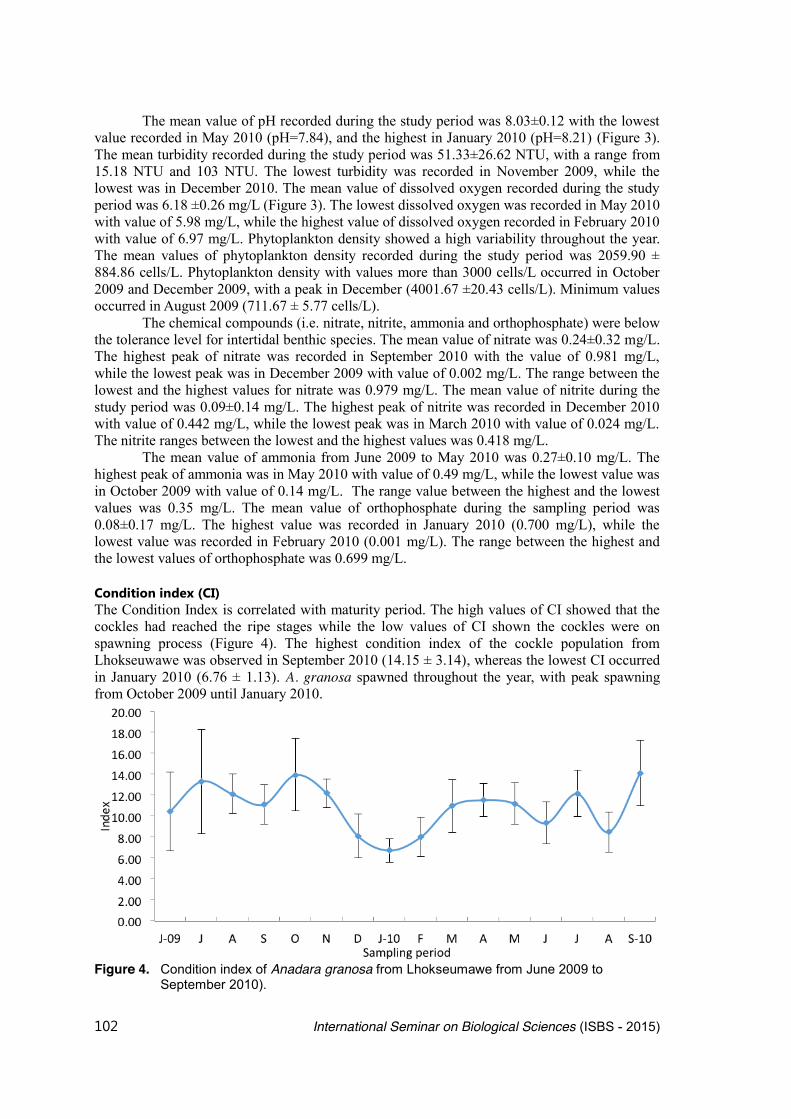
102 International Seminar on Biological Sciences (ISBS - 2015)
The mean value of pH recorded during the study period was 8.03±0.12 with the lowest value recorded in May 2010 (pH=7.84), and the highest in January 2010 (pH=8.21) (Figure 3). The mean turbidity recorded during the study period was 51.33±26.62 NTU, with a range from 15.18 NTU and 103 NTU. The lowest turbidity was recorded in November 2009, while the lowest was in December 2010. The mean value of dissolved oxygen recorded during the study period was 6.18 ±0.26 mg/L (Figure 3). The lowest dissolved oxygen was recorded in May 2010 with value of 5.98 mg/L, while the highest value of dissolved oxygen recorded in February 2010 with value of 6.97 mg/L. Phytoplankton density showed a high variability throughout the year. The mean values of phytoplankton density recorded during the study period was 2059.90 ± 884.86 cells/L. Phytoplankton density with values more than 3000 cells/L occurred in October 2009 and December 2009, with a peak in December (4001.67 ±20.43 cells/L). Minimum values occurred in August 2009 (711.67 ± 5.77 cells/L).
The chemical compounds (i.e. nitrate, nitrite, ammonia and orthophosphate) were below the tolerance level for intertidal benthic species. The mean value of nitrate was 0.24±0.32 mg/L. The highest peak of nitrate was recorded in September 2010 with the value of 0.981 mg/L, while the lowest peak was in December 2009 with value of 0.002 mg/L. The range between the lowest and the highest values for nitrate was 0.979 mg/L. The mean value of nitrite during the study period was 0.09±0.14 mg/L. The highest peak of nitrite was recorded in December 2010 with value of 0.442 mg/L, while the lowest peak was in March 2010 with value of 0.024 mg/L. The nitrite ranges between the lowest and the highest values was 0.418 mg/L.
The mean value of ammonia from June 2009 to May 2010 was 0.27±0.10 mg/L. The highest peak of ammonia was in May 2010 with value of 0.49 mg/L, while the lowest value was in October 2009 with value of 0.14 mg/L. The range value between the highest and the lowest values was 0.35 mg/L. The mean value of orthophosphate during the sampling period was 0.08±0.17 mg/L. The highest value was recorded in January 2010 (0.700 mg/L), while the lowest value was recorded in February 2010 (0.001 mg/L). The range between the highest and the lowest values of orthophosphate was 0.699 mg/L.
Condition index (CI) The Condition Index is correlated with maturity period. The high values of CI showed that the cockles had reached the ripe stages while the low values of CI shown the cockles were on spawning process (Figure 4). The highest condition index of the cockle population from Lhokseuwawe was observed in September 2010 (14.15 ± 3.14), whereas the lowest CI occurred in January 2010 (6.76 ± 1.13). A. granosa spawned throughout the year, with peak spawning from October 2009 until January 2010.
Figure 4. Condition index of Anadara granosa from Lhokseumawe from June 2009 to
September 2010).
International Seminar on Biological Sciences (ISBS - 2015) 103
In this study, condition index (CI) was used to evaluate the tissue quality in the intertidal species A. granosa in Lhokseumawe, Indonesia. The condition index was known to be influenced by many environmental factors, such as temperature (Chipman, 1947, Freites et al., 2010), salinity (Engle, 1957; Haven, 1947), seasonal variations (Rebelo et al., 2005; Sahin et al., 2006), chemical characteristics of the water and sediment (Engel, 1957), crowding and availability of food (Korringa, 1952; Galtsoftt, 1964). In this study, temperature and salinity were the main environmental regulating factors of habitual performance of spawning period in A. granosa in Lhokseumawe, Indonesia. In addition, gonad development proceeded more actively during the periods of drastic fluctuating of temperatures and salinities, from October 2009 through January 2010 (24–340C and 27-32 ppt). This suggests an inverse relation between water temperature, salinities and gametogenesis. The release of gametes by the natural population of A. granosa at Lhokseumawe coincided with the drastic daily fluctuations in temperature and salinity as indicated by rectangle boxes in figure 5.
Spawning periods of the cockle population in Lhokseumawe were highly influenced by the fluctuation of abiotic factors such as temperature and salinity, where in August 2009 until September 2009, maximum and minimum temperatures were actively fluctuating. Similar condition was recorded in salinity, where fluctuation had occurred in August 2009 until December 2009. Both these fluctuations were suggested as factors which have positive correlation in the spawning of bivalve A. granosa in Lhokseumawe.
Based on this study, the condition index of the cockle population in Lhokseumawe was a combination result of the fluctuations on two main environment factors, namely temperature and salinity. Fluctuations in temperature and salinity appear to stimulate fthe spawning activities of the cockle population. Form observations of Condition Index of A. granosa (16 months), high fluctuations in daily temperature were followed by an onset of high fluctuations in salinity that resulted in four spawning periods. The first spawning period occurred from August 2009 to September 2009, the second cycle from November 2009 to January 2010, with a higher interval compared to first cycle, the third occurred from May 2010 to June 2010 and the fourth was in April 2010. Fluctuations in temperature and salinity appear to act as the main trigger and an active response for cockles to initiate their reproductive cycle. High fluctuations of daily temperature and salinity apparently induce gonad development. Once the gonads matured, highest fluctuations in temperature and salinity trigger the spawning process in A. granosa at Lhokseumawe, Indonesia. Salinity is important in determining the distribution of bivalves and able to influence the physiological rates of bivalve including reproductive process (Dame, 1996).

104 International Seminar on Biological Sciences (ISBS - 2015)
Figure 5. Correlation between spawning period of Anadara granosa with changes of
temperatures and salinities from June 2009-September 2010 in Lhokseumawe. Acknowledgement
We would like to thanks Marine Sciences Laboratory Universiti Sains Malaysia, Aquaculture Department, Malikussaleh University Indonesia, Muhammad Rusdi for preparing sampling location map. Indonesian Fisheries Quarantine Service for their continuous support in making this project a success. References Afiati, N. (2007): Gonad Maturation of Two Intertidal Blood Clams Anadara Granosa (L.) And
Anadara Antiquata (L.) (Bivalvia: Arcidae) In Central Java. Journal of Coastal Development, 10, 105-113.
Baqueiro-Cardenas, E. and Aldana-Aranda, D. (2000): A Review of Reproductive Patterns of Bivalve Molluscs from Mexico. Bull. Marine Sciences, 66, 13–27.
Bayne, B. (1985): Responses to environmental stress: tolerance, resistance and adaptation. In: J. S. Gray &M. E. Christiansen, editors. Marine Biology of Polar Regions and Effects of

International Seminar on Biological Sciences (ISBS - 2015) 105
Stress on Marine Organisms. Proc. 18th Europe. Marine Biology. Symposiums, Univ. Oslo, Norway, 331–349 pp.
Broom, M.J. (1985): The Biology and Culture of Marine Bivalve Mollusks of the Genus Anadara. ICLARM Stud. Rev., 12, 37 p. (ISSN 0115-4389, ISBN 971-1022-21-4).
Chipman, W.A. (1947): Seasonal Changes in the Fattening of Oysters. Proceedings of the National Shellfisheries Association. 28-32.
Dame, R. (1996): Ecology of Marine Bivalves: An Ecosystem Approach. Boca Raton, CRC Press, 254 pp.
DFO, (2006): Assessing Habitat Risks Associated with Bivalve Aquaculture in the Marine Environment. DFO Can. Sci. Advis. Sec. Sci. Advis. Rep. 2006/005.
Engle, J.B. (1950): The Condition of Oysters as Measured by the Carbohydrate Cycle, the Condition Factor and the Percent Dry Weight. Proceedings of the National Shellfisheries Association, 41, 20-25.
Freites, L., Montero, L., Arrieche, D., Jose´ M. F. Babarro, J.M.F., Pedro E. Saucedo, P.E., Cordova. C and Garci´A, N. (2010): Influence of Environmental Factors on the Reproductive Cycle of the Eared Ark Anadara notabilis (Röding, 1798) In Northeastern Venezuela. Journal of Shellfish Research, 29, 69–75.
Gosling, E. (2003): Bivalve Molluscs, Biology, Ecology and Culture. Fishing News Books. Blackwell Publishing, UK: 443 pp.
Kastoro, W. (1978): Reproduksi Kerang Bulu, Anadara antiquate (Linnaeus), Suku Arcidae. Oseana Indonesia, 9, 51–59.
Lawrece, D and Scott, G.I. (1982): The Determination and Use of Condition Index of Oysters. Journal of Estuaries, 5, 23-27.
MacDonald, B. A. and Thompson, R. J. (1985): Influence of temperature and food availability on the ecological energetic of the giant scallop Placopecten magellanicus. II. Reproductive output and total production. Marine Ecology Progress Series, 25:295–303.
Mzighani, S. (2005): Fecundity and Population Structure of Cockles, Anadara antiquata L. 1758 (Bivalvia: Arcidae) from a Sandy/Muddy Beach near Dar es Salaam, Tanzania. Western Indian Ocean Journal of Marine Science, 4, 77-84.
Rebelo, M. F., Amaral, M. C. R. and Pfeiffer, W. C. (2005): Oyster Condition Index in Crassostrea rhizophorae (Guilding, 1828) From A Heavy-Metal Polluted Coastal Lagoon. Brazialia. Journal of Biology, 65, 345-351.
Sahin, C., Düzgüne, E. and Okumu, I. (2006): Seasonal Variations in Condition Index and Gonadal Development of the Introduced Blood Cockle Anadara inaequivalvis(Bruguiere, 1789) in the Southeastern Black Sea Coast. Turkish Journal of Fisheries and Aquatic Sciences, 6, 155-163.
Suwanjarat, J. and Parnrong S. (1990): Reproductive cycle of Anadara granosa L. in Jebilung, Satun province. Songklanakarin. Journal Science and Technology, 12, 341-351.
106 International Seminar on Biological Sciences (ISBS - 2015)
Distribution and Abundance of Trees on the Green Belt in Medan City: an Effort to Mitigate Climate Change
Patana, P.*, Latifah, S., and Rahmawaty
Forestry Study Program, Faculty of Agriculture, University of Sumatera Utara,
Jl. Tri Dharma Ujung No. 1 Kampus USU, Medan 20155, Indonesia *E-mail: [email protected]
ABSTRACT Climate change is one of the important issues in North Sumatra, especially in Medan city. In order to mitigate climate change, this study analyzed the number of trees in the green belt and determined the potential role of trees to mitigate climate change in Medan city. This study was conducted in January to May 2015 in 32 sub-districts in Medan City. Surveys were conducted within the green belt on secondary arterial roads in Medan city. Angsana (Pterocarpus indicus) was the most abundant species which were were planted (51.29%), followed by Palem Raja (Oreodoxa regia) (20.60%) and Mahoni (Switenia macrophylla) (18.21%) of the total of tress on the green belt. Angsana trees are able to absorb large amounts of pollution, and also provide service such as shade and as a wind breaker. Mahoni is one of tree that has a high CO2 absorption. In order to mitigate climate change in Medan City, it is important to preserve and protect the trees that are on the green belt to insure the potential role of trees in terms of reduction of emissions to protect and maintain existing carbon stocks and increase the uptake to mitigate climate change. Keywords: Climate change, Green belt, Medan, mitigation INTRODUCTION Medan city has 21 sub-districts and 151 villages, with a large population of 2,109,339 people million. As capital of North Sumatra province, Medan city encompasses 26,510 hectares (265.10 km2), or 3.6% of the total area of the province (BPS, 2014). One of the current principal causes of global climate change are emissions from motor vehicles and some industries that use fossil fuels. Motor vehicles and industries prevalent in Medan City and other urban areas, so urban areas tend to have higher greenhouse gas emission levels than rural areas. One of the efforts to reduce emissions and air pollution in urban areas is create areas of open green space. According to the Regional Regulation of Medan City (Perda Kota Medan) No. 13 (2011), current planning efforts suggested that 30.6% of Medan city should be protected as open green space. In order to utilize the functions of urban forests as a carbon sink, it is necessary to quantify how much carbon can be absorbed and stored (C stock) by the urban forest. In addition, it is important to determine what types of plants that have the greatest potential for carbon storage. This analysis of the urban forest should also estimate how much the forest could absorb CO2 and produce O2 following guidelines suggested by Wahyu et al., (2009). Therefore, the study of urban forest management as an approach to reduce greenhouse gas emissions in the mitigation and adaptation to global warming needs to be completed. This analysis should provide data on the potential biomass, carbon storage and CO2, as well as the optimal area of the city forest to provide services such as shade and wind breaks. Efforts to reduce greenhouse gas emissions, especially carbon dioxide can be done in various ways. This can be done because the principle is the reduction of emissions to protect and maintain existing carbon stocks and increase the uptake through various development programs of urban forests. Therefore, it is important to do research related to the role of urban forests in contributing to the increased uptake of CO2 in the atmosphere. One of the efforts to reduce greenhouse gas emissions believed to contribute significantly in helping solve the

International Seminar on Biological Sciences (ISBS - 2015) 107
problem of improving the quality of the environment in particular adaptation and mitigation of global warming (Herdiansah, 2005). The objectives of this study were to assess the number of trees in the green belt in Medan city and to determine the potential role of trees to mitigate climate change in Medan city. MATERIALS AND METHODS This study was conducted from January to May 2015 on some main lines in 32 sub-districts in Medan City. Sampling was done by selecting the green belt contained in several districts in the city of Medan. A randomly selected street within the green belt in each district of Medan was used to find sample plots using the criteria of arterial roads in Regulation No.13 (2011). The sampling design used in this study also was based on Regulation No. 13 (2011) on Spatial Planning (2011-2031) in order to obtain secondary arterial lines in some districts in Medan City and note how the distribution of plants in the path. To assess the area of the green belt, the length and width of the road was measured. Road length data obtained from the Direktorat Jenderal Bina Marga (1996), while the data width of the road were obtained from the Direktorat Penataan Bangunan dan Lingkungan (2008). This area obtained by multiplying the total road length and average width - flat road. Sampling intensity obtained by dividing green belt research area divided by the total area of green belt in Medan City, then multiplied by one hundred. To map the plants with the green belt, the coordinates of each tree within of the green belt was determined using the Global Positioning System (GPS). Data collected at each sampled tree included: diameter, height, and species of plant. Tree saplings (diameter <10 cm and a height> 1.5 m) to the larger trees were all measured. for palms (diameter> 20 cm) also were measured (Latifah and Sulistyono, 2013). The GPS was used to determine the coordinates of individual trees and the Geographic information system (GIS) was used to map the distribution and abundance of trees throughout the green belt of Medan city. RESULTS AND DISCUSSION Current State of Green Open Space of Medan City The length and width of the green belt on each street varied considerably, with belt length ranging from 0.31 km to 3.8 km and road width ranged from 1 m to 8 m. On the green belt, the length of the green belt on the long road to study almost the same, but the size of the green belt long median differs from research path. Based on these data, it can be obtained by extensive research path. Samples path used can be seen in Table 1. On the edge of the track width is the sum of the width of the right lane and the left lane is usually the same width so as to obtain the width of each lane divided only stayed two. But for the median width different from the width of the edge that needs to be measured. Based on data from the Dinas Bina Marga, Direktorat Penataan Bangunan dan Lingkungan (2008) the largest street in Medan city is 4388.16 Ha. Only take into account the wide street with calculations ignore the alley way and hallwayThe total length and width of the average - the average is 1,567,200.06 m and 28 m. While the sample area is 178.89 ha. So that the sampling intensity obtained for the study of the road is 4.07%. Green belt area in Medan city based on calculations with the help of the Dinas Pertamanan Medan City, Regulation No. 13 (2011) about the Spatial Planning of Medan City (2011-2031), and the Google Earth software then obtained a green belt area, especially on arterial roads and collector is 235.04 ha. While extensive research path of 26.87 Ha, so that the intensity of the sampling for the study was 11.43% as result of dividing broad of arterial roads and collector with research path. Based on the results, it can be seen the percentage of broad green belt in comparison to the existing road in the city of Medan, (235.04 ha : 4,388.16 ha) namely 5.35%. This shows that the green open space can still be developed further by utilizing the vast potential of building demarcation line. Building demarcation line is the line beyond safety limits set out in building
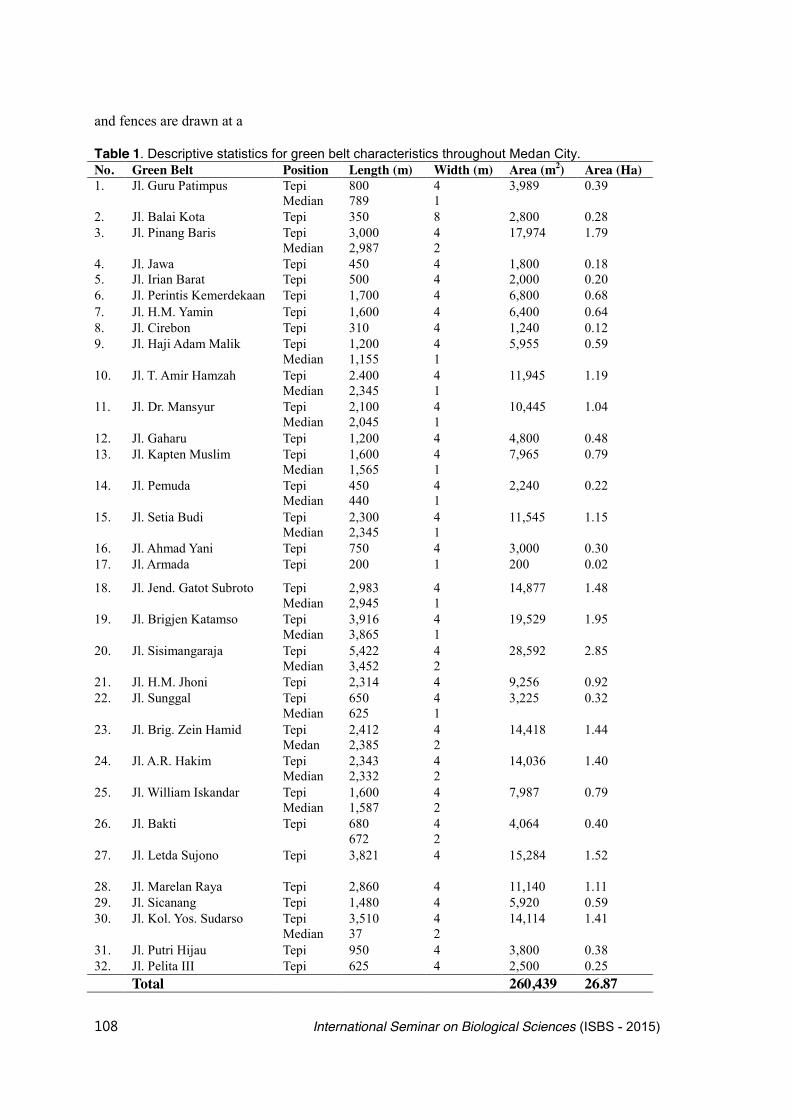
108 International Seminar on Biological Sciences (ISBS - 2015)
and fences are drawn at a Table 1. Descriptive statistics for green belt characteristics throughout Medan City. No. Green Belt Position Length (m) Width (m) Area (m2) Area (Ha) 1. Jl. Guru Patimpus Tepi
Median 800 789
4 1
3,989 0.39
2. Jl. Balai Kota Tepi 350 8 2,800 0.28 3. Jl. Pinang Baris Tepi
Median 3,000 2,987
4 2
17,974 1.79
4. Jl. Jawa Tepi 450 4 1,800 0.18 5. Jl. Irian Barat Tepi 500 4 2,000 0.20 6. Jl. Perintis Kemerdekaan Tepi 1,700 4 6,800 0.68 7. Jl. H.M. Yamin Tepi 1,600 4 6,400 0.64 8. Jl. Cirebon Tepi 310 4 1,240 0.12 9. Jl. Haji Adam Malik Tepi
Median 1,200 1,155
4 1
5,955 0.59
10. Jl. T. Amir Hamzah Tepi Median
2.400 2,345
4 1
11,945 1.19
11. Jl. Dr. Mansyur Tepi Median
2,100 2,045
4 1
10,445 1.04
12. Jl. Gaharu Tepi 1,200 4 4,800 0.48 13. Jl. Kapten Muslim Tepi
Median 1,600 1,565
4 1
7,965 0.79
14. Jl. Pemuda Tepi Median
450 440
4 1
2,240 0.22
15. Jl. Setia Budi Tepi Median
2,300 2,345
4 1
11,545 1.15
16. Jl. Ahmad Yani Tepi 750 4 3,000 0.30 17. Jl. Armada Tepi 200 1 200 0.02
18. Jl. Jend. Gatot Subroto Tepi Median
2,983 2,945
4 1
14,877 1.48
19. Jl. Brigjen Katamso Tepi Median
3,916 3,865
4 1
19,529 1.95
20. Jl. Sisimangaraja Tepi Median
5,422 3,452
4 2
28,592 2.85
21. Jl. H.M. Jhoni Tepi 2,314 4 9,256 0.92 22. Jl. Sunggal Tepi
Median 650 625
4 1
3,225 0.32
23. Jl. Brig. Zein Hamid Tepi Medan
2,412 2,385
4 2
14,418 1.44
24. Jl. A.R. Hakim Tepi Median
2,343 2,332
4 2
14,036 1.40
25. Jl. William Iskandar Tepi Median
1,600 1,587
4 2
7,987
0.79
26. Jl. Bakti Tepi 680 672
4 2
4,064 0.40
27. Jl. Letda Sujono Tepi 3,821 4
15,284 1.52
28. Jl. Marelan Raya Tepi 2,860 4 11,140 1.11 29. Jl. Sicanang Tepi 1,480 4 5,920 0.59 30. Jl. Kol. Yos. Sudarso Tepi
Median 3,510 37
4 2
14,114 1.41
31. Jl. Putri Hijau Tepi 950 4 3,800 0.38 32. Jl. Pelita III Tepi 625 4 2,500 0.25 Total 260,439 26.87

International Seminar on Biological Sciences (ISBS - 2015) 109
certain distance parallel to the road, the outer of the bridge, the river bank, the channel edge, embankment, where the edges are not being allowed to erect buildings. With a width of GSB large enough, the higher the potential development paths for the planted crops.Based on Table 1, the widest green belt is on Jalan Sisimangaraja, Medan Amplas Sub District with an area of 2.85 hectares, while there is a wide green belt on the road Cirebon smallest with an area of 0.12 hectares. In addition to the green path length is not too long because it does not have the road median. This is exactly what causes the Cirebon has broad green lane smallest value compared to other green line. The green line is a very important element in maintaining the balance of the elements of the city. The green pathways was controlling development growth, maintaining green areas as its main elements of vegetation that naturally absorbs pollutants in the form of gas and dust particles through the leaves. Medan city as a metropolitan city that has a very high transport activity is one reason for the importance of urban green belt. Distribution and The Role of Tree Species Based on the results of research that was conducted on 32 green belts from various secondary arterial roads of Medan city, it was known what type of crops planted by Dinas Pertamanan Medan City as an effort to absorb emissions and pollutants from motor vehicles. Types of plants sampled were trees and palms. There are 38 species of plants that were detected in samples of the green line of research (Table 2). Planted species had grown rapidly, provided beauty for the rider as well as provide security and comfort to motorists and pedestrians and trees that stood firm.
Based on data obtained from various samples of the green line on the secondary arterial roads of Medan City, it was known that this type of Angsana tree (Pterocarpus indicus) have the highest total number of individuals that were planted, with 3,097 individuals or approximately 51.29% of the total of individuals who were counted on the green belt. The second type most abundant species was Palem Raja (Oreodoxa regia), with as many as 1,244 individuals or approximately 20.60% and the third most abundant species planted was mahoni (Switenia macrophylla) with as many as 1,100 individuals, or about 18.21%. Species that were rarely detected included guava (Psidium guava), eucalyptus (Eucalyptus deglupta), Lengkeng (Dimocarpus longan), Cemara Gunung (Casuarina junghuniana), Pinus (Pinus merkusii), Pulai (Alstonia scholaris), and dadap (Erythrina crystagalii) each amounting to one individual or approximately 0.01%. Angsana (Pterocarpus indicus), Palem Raja (Oreodoxa regia) and mahoni (Switenia macrophylla) were the most abundant species detected on the green belt. This may because they were suitable for planting and had many benefits on the green line. Mahoni trees (Switenia macrophylla) were suitable as roadside trees because they can grow for decades, were not susceptible to pests and diseases, were not easily uprooted, growing straight up to the canopy high above the height of the vehicle. According to Dahlan (2011), Mahoni (Switenia macrophylla) has a fairly high absorptive capacity was 295.73 kg CO2/tree/year. Likewise with Angsana (Pterocarpus indicus) which is one of the fastest growing species, and is a good absorber of pollution and also serves as a shade and wind breaker. Palem Raja (Oreodoxa regia) serves as a directional view on the road. Especially with the kind of trees that grow straight up without having branches, making it safe for motor vehicle height and the type that is not easily uprooted. The tree species planted in the green belt of Medan City have the planting criteria for roadside plants developed by Direktorat Jenderal Bina Marga (1996). Basically, plants grown in the green belt have certain requirements that are not indiscriminate in plant crops both in the green belt on the edge of the road, the median or the bend. The main requirements in selecting the type of landscape plants placed along roads include roots do not damage the road construction, are easy in maintenance, have stems or branches are not easily broken, and the leaves are not deciduous, and are safe for drivers road users (Direktorat Jenderal Bina Marga, 1996). The results obtained in the field show that there was a green belt where trees were planted on the edge of the road or median. But there was also
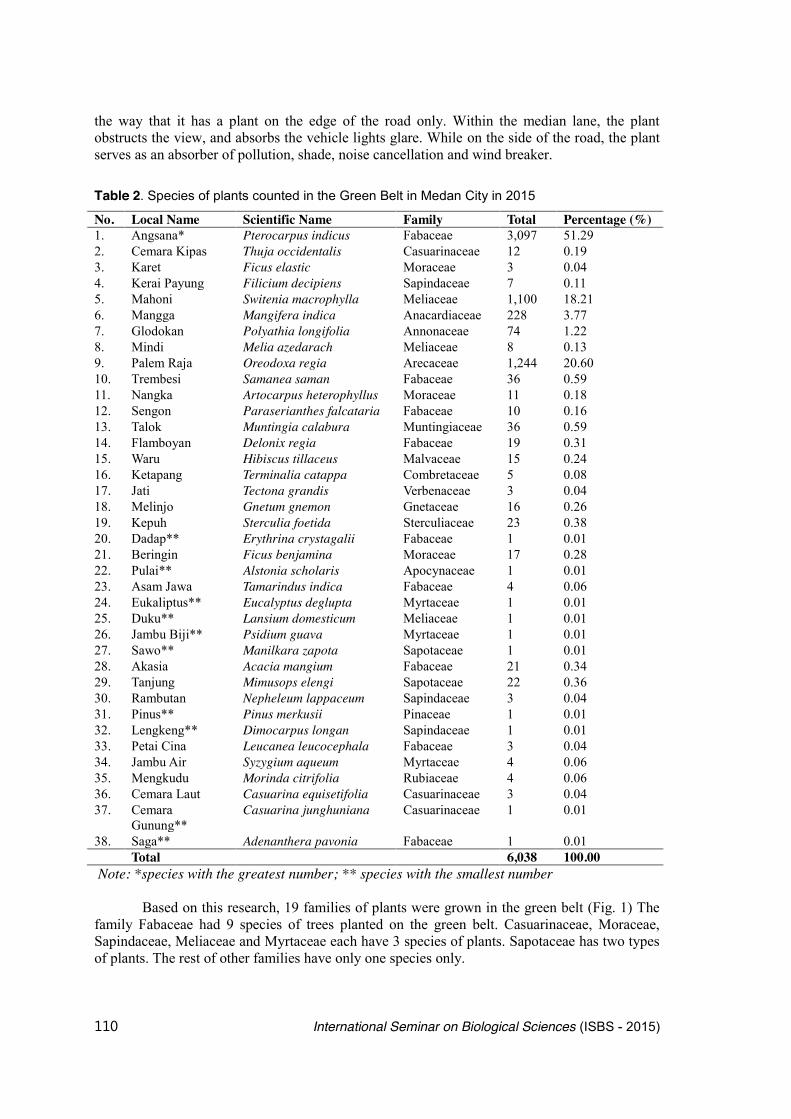
110 International Seminar on Biological Sciences (ISBS - 2015)
the way that it has a plant on the edge of the road only. Within the median lane, the plant obstructs the view, and absorbs the vehicle lights glare. While on the side of the road, the plant serves as an absorber of pollution, shade, noise cancellation and wind breaker.
Table 2. Species of plants counted in the Green Belt in Medan City in 2015
No. Local Name Scientific Name Family Total Percentage (%) 1. Angsana* Pterocarpus indicus Fabaceae 3,097 51.29 2. Cemara Kipas Thuja occidentalis Casuarinaceae 12 0.19 3. Karet Ficus elastic Moraceae 3 0.04 4. Kerai Payung Filicium decipiens Sapindaceae 7 0.11 5. Mahoni Switenia macrophylla Meliaceae 1,100 18.21 6. Mangga Mangifera indica Anacardiaceae 228 3.77 7. Glodokan Polyathia longifolia Annonaceae 74 1.22 8. Mindi Melia azedarach Meliaceae 8 0.13 9. Palem Raja Oreodoxa regia Arecaceae 1,244 20.60 10. Trembesi Samanea saman Fabaceae 36 0.59 11. Nangka Artocarpus heterophyllus Moraceae 11 0.18 12. Sengon Paraserianthes falcataria Fabaceae 10 0.16 13. Talok Muntingia calabura Muntingiaceae 36 0.59 14. Flamboyan Delonix regia Fabaceae 19 0.31 15. Waru Hibiscus tillaceus Malvaceae 15 0.24 16. Ketapang Terminalia catappa Combretaceae 5 0.08 17. Jati Tectona grandis Verbenaceae 3 0.04 18. Melinjo Gnetum gnemon Gnetaceae 16 0.26 19. Kepuh Sterculia foetida Sterculiaceae 23 0.38 20. Dadap** Erythrina crystagalii Fabaceae 1 0.01 21. Beringin Ficus benjamina Moraceae 17 0.28 22. Pulai** Alstonia scholaris Apocynaceae 1 0.01 23. Asam Jawa Tamarindus indica Fabaceae 4 0.06 24. Eukaliptus** Eucalyptus deglupta Myrtaceae 1 0.01 25. Duku** Lansium domesticum Meliaceae 1 0.01 26. Jambu Biji** Psidium guava Myrtaceae 1 0.01 27. Sawo** Manilkara zapota Sapotaceae 1 0.01 28. Akasia Acacia mangium Fabaceae 21 0.34 29. Tanjung Mimusops elengi Sapotaceae 22 0.36 30. Rambutan Nepheleum lappaceum Sapindaceae 3 0.04 31. Pinus** Pinus merkusii Pinaceae 1 0.01 32. Lengkeng** Dimocarpus longan Sapindaceae 1 0.01 33. Petai Cina Leucanea leucocephala Fabaceae 3 0.04 34. Jambu Air Syzygium aqueum Myrtaceae 4 0.06 35. Mengkudu Morinda citrifolia Rubiaceae 4 0.06 36. Cemara Laut Casuarina equisetifolia Casuarinaceae 3 0.04 37. Cemara
Gunung** Casuarina junghuniana Casuarinaceae 1 0.01
38. Saga** Adenanthera pavonia Fabaceae 1 0.01 Total 6,038 100.00 Note: *species with the greatest number; ** species with the smallest number Based on this research, 19 families of plants were grown in the green belt (Fig. 1) The family Fabaceae had 9 species of trees planted on the green belt. Casuarinaceae, Moraceae, Sapindaceae, Meliaceae and Myrtaceae each have 3 species of plants. Sapotaceae has two types of plants. The rest of other families have only one species only.
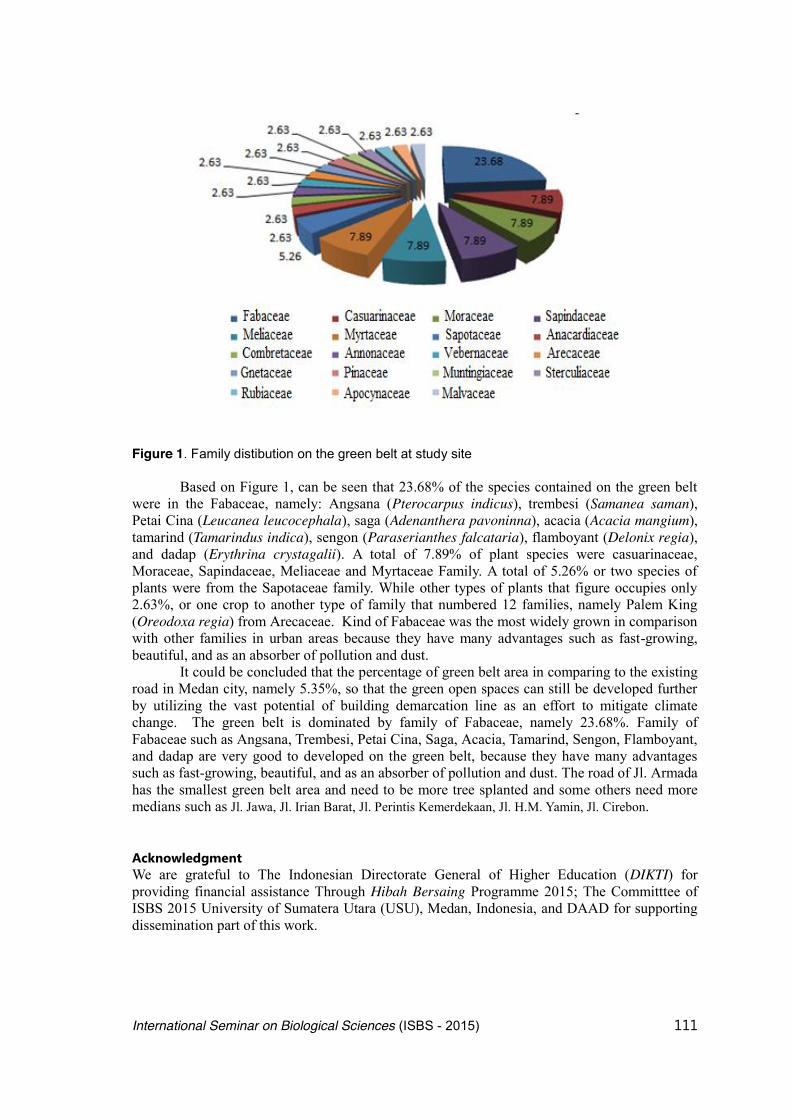
International Seminar on Biological Sciences (ISBS - 2015) 111
Figure 1. Family distibution on the green belt at study site
Based on Figure 1, can be seen that 23.68% of the species contained on the green belt were in the Fabaceae, namely: Angsana (Pterocarpus indicus), trembesi (Samanea saman), Petai Cina (Leucanea leucocephala), saga (Adenanthera pavoninna), acacia (Acacia mangium), tamarind (Tamarindus indica), sengon (Paraserianthes falcataria), flamboyant (Delonix regia), and dadap (Erythrina crystagalii). A total of 7.89% of plant species were casuarinaceae, Moraceae, Sapindaceae, Meliaceae and Myrtaceae Family. A total of 5.26% or two species of plants were from the Sapotaceae family. While other types of plants that figure occupies only 2.63%, or one crop to another type of family that numbered 12 families, namely Palem King (Oreodoxa regia) from Arecaceae. Kind of Fabaceae was the most widely grown in comparison with other families in urban areas because they have many advantages such as fast-growing, beautiful, and as an absorber of pollution and dust.
It could be concluded that the percentage of green belt area in comparing to the existing road in Medan city, namely 5.35%, so that the green open spaces can still be developed further by utilizing the vast potential of building demarcation line as an effort to mitigate climate change. The green belt is dominated by family of Fabaceae, namely 23.68%. Family of Fabaceae such as Angsana, Trembesi, Petai Cina, Saga, Acacia, Tamarind, Sengon, Flamboyant, and dadap are very good to developed on the green belt, because they have many advantages such as fast-growing, beautiful, and as an absorber of pollution and dust. The road of Jl. Armada has the smallest green belt area and need to be more tree splanted and some others need more medians such as Jl. Jawa, Jl. Irian Barat, Jl. Perintis Kemerdekaan, Jl. H.M. Yamin, Jl. Cirebon. Acknowledgment We are grateful to The Indonesian Directorate General of Higher Education (DIKTI) for providing financial assistance Through Hibah Bersaing Programme 2015; The Committtee of ISBS 2015 University of Sumatera Utara (USU), Medan, Indonesia, and DAAD for supporting dissemination part of this work.

112 International Seminar on Biological Sciences (ISBS - 2015)
References Badan Pusat Statistik (BPS).(2014): Sumatera Utara dalam Angka, BPS, Medan Dahlan, E.N. (2011): Kebutuhan Luasan Areal Hutan Kota Sebagai Rosot (Sink) Gas CO2 Untuk Mengantisipasi Penurunan Luasan Ruang Terbuka Hijau di Kota Bogor. Forum Geografi 25( 2): 164-177. Direktorat Penataan Bangunan dan Lingkungan. (2008): Menata Ruang Terbuka Hijau di Kawasan Perkotaan. Direktorat Jenderal Departemen Pekerjaan Umum. Direktorat Jenderal Bina Marga. (1996): Tata Cara Perencanaan Teknik Lansekap Jalan No.033/TBM/1996. Departemen Pekerjaan Umum. Herdiansah. (2005): Penentuan Luasan Optimal Hutan Kota Sebagai Rosot Gas
Karbondioksida (Studi Kasus di Kota Bogor). Skripsi Jurusan Konservasi Sumberdaya Hutan dan Ekowisata Fakultas Kehutanan IPB. Bogor.
Latifah, S and Sulistiyono, N. (2013): Sequestration Potential in Aboveground Biomass of Hybrid Eucalyptus Plantation Forest. Jurnal Manajemen Hutan Tropika (JMHT). 19 (1): 54-62 Peraturan Daerah Kota Medan No. 13. (2011): Tentang Rencana Tata Ruang Wilayah Kota Medan Tahun 2011-2031. Medan. Peraturan Pemerintah Republik Indonesia No. 63 Tahun 2002. (2002): Tentang Hutan Kota. Jakarta. Wahyu, C.A, Ismed, S., Mardi T. R.,Zainal, A., Mukhaidil. (2009): Pendugaan Cadangan Karbon (C-Stock) Dalam Rangka Pemanfaatan Fungsi Hutan Sebagai Penyerap Karbon.

International Seminar on Biological Sciences (ISBS - 2015) 113
In Searching of Trees Natural Vibration Frequency Based on Granular Particles Interactions and Vibration
Viridi, S.*1, Patana, P.2, Subrata, S. A.3, Hertiasa, H.4 and M. Abdullah5
1)Nuclear Physics and Biophysics Research Division, Faculty of Mathematics and Natural Sciences,
Institut Teknologi Bandung, Jl. Ganesha 10, Bandung 40132, Indonesia *E-mail: [email protected]
2)Forestry Department, Faculty of Agriculture, University of Sumatera Utara, Jl. Biotechnologi 1, Kampus USU, Medan 20155, Indonesia
3)Faculty of Forestry, Gadjah Mada University, Jl. Agro 1, Bulaksumur, Yogyakarta 55281, Indonesia
4)Visual Communication and Multimedia Research Division, Faculty of Art and Design, Institut Teknologi Bandung, Jalan Ganesha 10, Bandung 40132, Indonesia
5)Electronic Materials Research Division, Faculty of Mathematics and Natural Sciences, Institut Teknologi Bandung, Jl. Ganesha 10, Bandung 40132, Indonesia
ABSTRACT Inspiring by Leonardo's formula regarding cross section of trees from trunk to branches, Eloy (2011) found that Leonardo's exponent is between 1.8 and 2.3, instead of exact 2. In this work another aspect is investigated, tree branches natural frequency. It is already usual that in a nearly no-windy condition, some branches vibrated alternatively due to wind movement passing their leaves. This could explain why in a very windy situation a tree may survive, while a power line construction not. It could be addressed to their natural vibration frequency. A tree model based on granular particle interaction in Eloy's parameter ranges is developed. Vibration is induced to some parts to investigate which other part will be also vibrated. Few branches trees and many ones give different responses. From the results prevention may be designed to conserve our forestry resources. Keywords: cross section, granular model, natural frequency, tree, vibration.
INTRODUCTION Various branch diameters of a tree are response to winds from its surrounding and also other factors such as rains, snows, fruits, and upper parts of the tree, since a branch must support the stress induced by this loads (Eloy, 2011). How these stresses varied in time also gives different branch diameters variation or in general also morphology of the tree (Dassot et al., 2015). Even in details, angle of individual leaf inclination is under influence of its weight and wind (Tadrist et al., 2014), which also induces the density and strength of the wood (Fournier et al., 2013). Observation of the angles (leaf angle distribution, LAD) is conducted photographically since LAD is important in plant productivity of field crops (Zou et al., 2014). Further investigation on tree damage after a storm can be used to predict the wind velocity (Frelich and Ostuno, 2012). In this work interaction between particles are represented only using push-pull and bending springs, which is usual in molecule model (Allen, 2004). MATERIALS AND METHODS Model Tree model is simplified into a two-dimension system where its solid beam and granular particle interaction (GPI) model is shown in Figure 1. In this GPI model the lower most particles is the largest trunk, where this particle position is fixed.

114 International Seminar on Biological Sciences (ISBS - 2015)
Granular particle i with mass mi and diameter Di has position of ir
& and it will have velocity of
iv& . If a tree is constructed of N granular particles, then its mass will be
¦
N
iimM
1
. (1)
Particle i and j are bound through pull-push spring force. On particle i due to existence of particle j the spring force is
� � ijijijSij rlrcS ˆ�� &
, (2)
with lij is normal distance between particle i and j, cs is spring constant, and
jiij rrr &&&� , (3)
ijijijij rrrr &&&� , (4)
and
ij
ijij r
rr
&
ˆ , (5)
are relative position of particle i from particle j, distance of particle i from particle j, and unit vector pointing to particle i from particle j, respectively. Illustration how Equation (2) can accommodate force in both direction (push and pull) is given in Figure 2.
Referring to Figure 1 normal distance between particle i and j should be
jiij DDl � (6)
for dense configuration of granular particles. In order three particles i, j, and k to have a stable arrangement an interaction in a form of bending torque must be introduced
� �ijkijkBijk c OTW �� , (7)
where cB is bending constant, θijk is angle of the three particles, and λijk is equilibrium angle.
Figure 2. Spring force ijS&
acting on particle i due to existence of particle j for condition of: rij > lij (left), rij = lij (center), and rij < lij (right).
mi
mj lij
ijr�
rij
mi
mj lij
ijr�
rij ijS&
mi mj
lij
ijr�
rij ijS&
Figure 1. A two-dimension tree model: solid beam model (left) and granular particle interactions model (right).

International Seminar on Biological Sciences (ISBS - 2015) 115
All angles, including θijk and λijk are measured from the direction of jkr� in order to obey Equation (7), otherwise the minus sign should be dropped. Then, there will be also other interaction forces, not between particles but from the environment to the particles, i.e. gravitation and wind. The first force from the environment is simply
gmG ii&&
, (8)
where yGecg ˆ� & is the gravity. And the second force will be
� � � �wiFwii vvDcvvDF &&&&&�� �� KS3 (9)
with wv& is wind velocity. In general it can be assumed that � �tvv ww&&
, which can be alternated in time. Back to Equation (7), it does not yet represent the force acting on particle i. This means that the torque ijkW should be represented in term of force
� �ijkijij
ijk rr
B W&&
u ˆ1 , (10)
where direction of Bijk can be found through triple vector product of ijr& , ijr& , and ijkB&
� � � � � � ijkijijkijijijijkijijkijijijkij BrBrrrBrBrrr&&&&&&&&&&&& 2 ��� uu uW . (11)
Cross product of jkr& and ijr& will give direction of θijk
ijjk
ijjkijk rr
rr&&
&&
u
u T̂ , (12)
the value is given by
ijjkijkijjkijk rrrr ˆˆ12ˆˆcos ��|�� TT (13)
for small angle approximation. Last term in Equation (13) holds if the tree is almost straight with 0|ijkO . Using this assumptions Equation (7) can be rewritten as
ijkijjkBijk rrc TW ˆˆˆ12 ��� & . (14)
Substitution of Equation (12) into Equation (14) and then the result into Equation (10) will give
� �»»¼
º
««¬
ª
u
uu¸¸
¹
·
¨¨
©
§ ���
ijjk
ijjkij
ij
ijjkBijk rr
rrrr
rrcB &&
&&& ˆˆˆ12
. (15)
Triple vector product could simplify Equation (15) into
� � � �»»¼
º
««¬
ª
u
�����
ijjk
ijijjkjkijjkjkBijk rr
rrrrrrrcB &&
& ˆˆˆˆˆˆ12 . (16)
Figure 4 shows the relation between bending torque and bending force.
Figure 3. Bending torque ijkW acting on particle i due to existence of particles j and k for: θijk > λijk (left), θijk = λijk (center), and θijk < λijk (right).
mk mj λijk
mi
θijk mk
mj λijk
mi
θijk
τijk
mk mj λijk
mi
θijk
τijk

116 International Seminar on Biological Sciences (ISBS - 2015)
Simulation Molecular dynamics method will used in this work for the simulation. Newton's second law of motion is used to get acceleration of each granular particle and for numerical integration the Euler algorithm is chosen. Particle acceleration is obtained through
� � � � � �> @ � � � �> @ � � � � � �> @^ `̧̧¹
·¨¨©
§����� ¦
zz ikijkjiijkjiijwiF
ii trtrtrBtrtrStvtvDc
mgta
,
,,,1 &&&&&&&&&&& . (17)
In general it can be said that � � � � � � � � � � � � � � � �> @tvtvtrtrtrtrtrgfta wiiiiiii&&&&&&&&&&
,,,,,,, 2112 ���� . Push-pull spring force requires direct neighbor particles, while bending force requires one more neighbor beyond the direct ones. Velocity at time t + Δt is given by
� � � � � � ttatvttv iii '� '�&&&
(18)
and using improved Euler algorithm � � � � � � tttvtrttr iii ''�� '�
&&& (19)
position at the same time can also be obtained. Not all particles are included in calculation of acceleration of particle i as given in Equation (17), but only related neighbors as shown in Figure 5.
Another boundary condition also must be used, i.e. for lower most grain it should be not integrated since its position remains the same and its velocity is always zero. Nomenclature Next step is how to label the particles if there is a branch. Nomenclature in chemistry in naming structure of organic compound (Petrucci et al., 2007) can be used with modification in this work. Figure 6 shows some structure for N = 10 or decatree. Notice that particle index begins with 0 instead of 1 as in organic molecules.
Figure 5. Neighbor particles included in calculation of: gravitation and wind forces (left), push-pull spring force (center) and bending force (right).
mi mi+1
mi -1 1, �iiS
&
1, �iiS&
mi
g& � �tvi&
� �tvw&
iG& iF
&
mi mi+1
mi -1
mi -2
mi+2
2,1, �� iiiB&
2,1, �� iiiB&
Figure 4. Relation between bending torque ijkW and its force ijkB&
through distance rij and angle θijk.
mk mj
mi
θijk τijk
ijkB&
rij

International Seminar on Biological Sciences (ISBS - 2015) 117
Each particle has xi and yi positions, mass mi, and diameter Di, each pair of two particles has push-pull spring constant cs, each pair of three particles has bending constant cB. Input file can be designed as follow NAME 0-ethbranch-3-methbranch-hepttree NPAR 10 0 .. .. .. .. .. 9 .. .. .. .. CS 1E3 CS-PAIRS 9 0 1 1 2 2 3 3 4 4 5 5 6 0 7 7 8 3 9 CB 4E3 CB-PAIRS 9 1 0 7 2 1 0 3 2 1 4 3 2 5 4 3 6 5 4 7 0 1 8 7 0 9 2 1 CF 0.5 CG 10 The input file will be used as input and also output from the program. RESULTS AND DISCUSSION Configurations and parameters Three different configurations are tested for drawing only with N = 30 as given in Figure 7.
Figure 6. Some structures for a decatree: (a) decatree, (b) 2-propabranch-heptatree, and (c) 0-ethabranch-3-methabranch-heptatree; and numbering the particles.
(a)
0 1 2 3 4 5 6 7 8 9
(b)
0 1 2 3 4 5 6
7 8
9
(c)
0 1 2 3 4
5 6
7 8
9
(c)
0 1 2
3 4 5 6
7 8
9

118 International Seminar on Biological Sciences (ISBS - 2015)
Following parameters are used in the simulation as shown in Table 1 if not otherwise stated.
Two configurations are investigated in this work, the first is pentatree and the second is 1-propabranch-hexatree as illustrated in Figure 8.
Figure 8. Investigated configurations in this work: pentatree (left) and 1-propabranch-hexatree (right).
Relaxation process Each configuration is relaxed with certain value of λijk as listed in Table 1. Unfortunately not every value of λijk can give a stable relaxed configuration, since it depends also on number of particle N. Pentatree configuration has N = 5, while 1-propabranch-hexatree has N = 9. Smaller values of λijk give more stable configuration. Samples of stable and unstable configurations are given in Figures 9 and 10, respectively. For tree with branch, e.g. the 1-propabranch-hexatree,
Table 1. Simulation parameters
Parameters Value N 5, 9 cS 105 cB 104 cF 10 cG 1 Δt, Tdata 10-4, 10-2 vw 1, 2, 4, 8, 16, 32, 64 m, l 1, 1 λijk 0.0873 - 0.3927
Figure 7. Three configurations are tested for drawing only with N = 30: triacontatree (left), 9- decabranch-icosetree (center), and 5-pentabranch-9-heptabranch-octadecatree (right).

International Seminar on Biological Sciences (ISBS - 2015) 119
each branch could have different stability as shown in Figure 11.
(a) (b)
(c) (d) Figure 9. Stable configuration of 1-propabranch-hexatree for λijk = 0.0873 at time t: (a) 0, (b) 100, (c) 125, and (d) 150.
(a) (b)
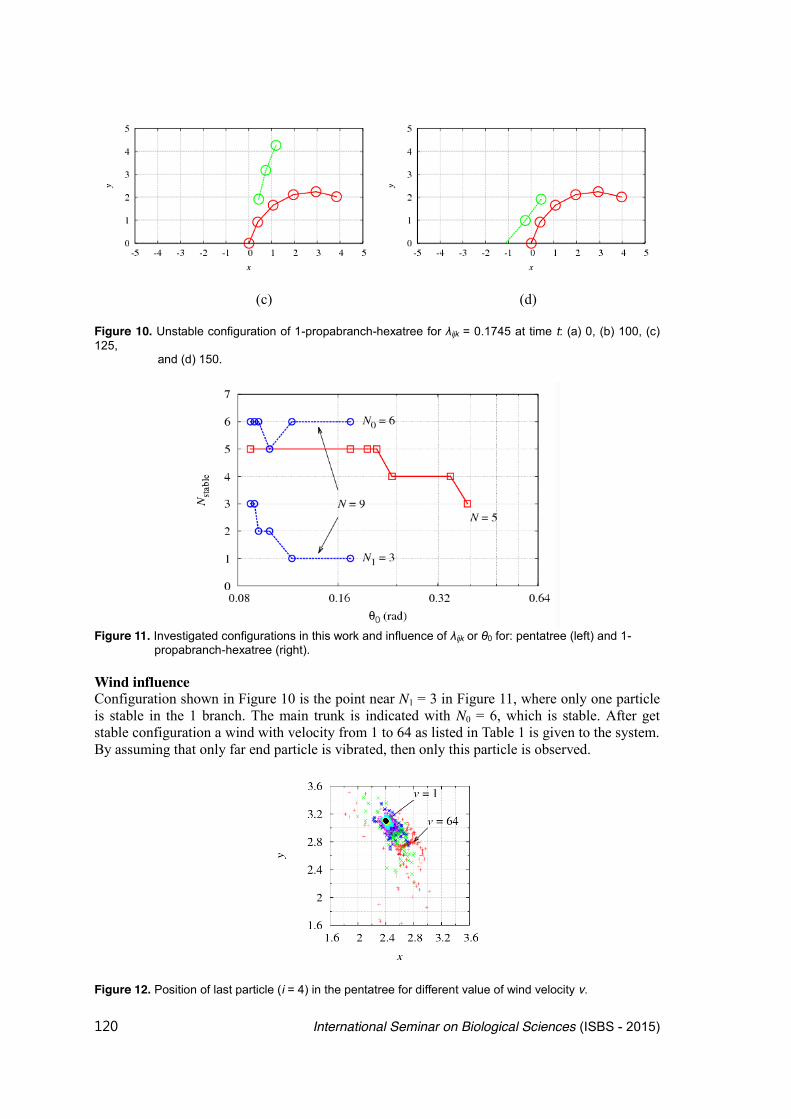
120 International Seminar on Biological Sciences (ISBS - 2015)
(c) (d) Figure 10. Unstable configuration of 1-propabranch-hexatree for λijk = 0.1745 at time t: (a) 0, (b) 100, (c) 125, and (d) 150.
Figure 11. Investigated configurations in this work and influence of λijk or θ0 for: pentatree (left) and 1- propabranch-hexatree (right). Wind influence Configuration shown in Figure 10 is the point near N1 = 3 in Figure 11, where only one particle is stable in the 1 branch. The main trunk is indicated with N0 = 6, which is stable. After get stable configuration a wind with velocity from 1 to 64 as listed in Table 1 is given to the system. By assuming that only far end particle is vibrated, then only this particle is observed.
Figure 12. Position of last particle (i = 4) in the pentatree for different value of wind velocity v.

International Seminar on Biological Sciences (ISBS - 2015) 121
Figure 13. Position of last particle (i = 8, left and i = 5, right) in the 1-propabranch-hexatree for different value of wind velocity v. It can be seen from Figure 12 that the particle vibrate with higher amplitude for high wind velocity, but a periodic vibration is not observed. And for the 1-propabranch-hexatree position of particle in trunk and the first branch is given in Figure 13. Even the configuration is already stable but due to wind velocity through Equation (9), it can be unstable or at least it vibrates. The circular particle path in Figure 13 (left) is about two times of l, which gives information that the last two particles become unstable instead only the last particles. Acknowledgement Authors would like to thank to DAAD and Committee of ISBS I in 2015 for supporting dissemination part of this work and Riset Unggulan Perguruan Tinggi - Desentralisasi Dikti in year 2015 with contract number 310i/I1.C01/PL/2015 for supporting calculation part of this work. References Allen, M.P. (2004): Introduction to Molecular Dynamics Simulation in Computational Soft Matter: From Synthetic Polymers to Proteins, Lecture Notes, N. Attig, K. Binder, H. Grubmüller
and K. Kremer (Eds.), John von Neumann Institute for Computing, Jülich, NIC Series, Vol. 23, pp. 1-28
Dassot, M., Constant, T., Ningre, F. and Fournier, M. (2015): Trees 29(2): 583-591 Eloy, C. (2011): Physical Review Letters: 107(25): 258101 Fournier, M., Dlouhá, J., Jaouen, G. and Almeras, T. (2013): Journal of Experimental Botany. 64(15):
4793-4815 Frelich, L.E. and Ostuno, E.J. (2012): Electronic Journal of Severe Storms Meteorology. 7(9): 1-19 Grubmüller, H., Heller H., Windemuth, A. and Schulten, K. (1991): Molecular Simulation. 6(1-3):
121-142 Hess, B., Bekker, H., Berendsen, H.J.C. and Fraaije, J.G.E. (1997): Journal of Computational
Chemistry. 18(12): 1463-1472 Martyna, G.J., Tobias, D.J. and Klein, M.L. (1994): The Journal of Chemical Physics. 101(5): 4177-
4189 Petrucci, R.H., Harwood, W.S., Herring, F.G. and Madura J.D. (2007): General Chemistry Principles
and Modern Applications. Pearson Education, Inc., Upper Saddle River, 9th Edn., pp. 1076-1078
Rimadhani, D.A. (2015): Studi Pertumbuhan Sel-sel Ragi Berdiameter Koloni Kurang dari Dua Puluh Sel Menggunakan Model Sel Granular Berbentuk Lingkaran, Master Thesis,

122 International Seminar on Biological Sciences (ISBS - 2015)
Institut Teknologi Bandung. Spreiter, Q. and Walter, M. (1999): Journal of Computational Physics. 152(1): 102-119 Tadrist, L., Saudreau, M. and de Langre, E. (2014): Journal of Theoretical Biology. 341(): 9-16 Zou, X., Mõttus, M., Tammeorg, P., Torres, C.L., Takala, T., Pisek, J., Mäkelä P., Stoddard, F.L. and
Pellikka, P. (2014): Agricultural and Forrest Meteorology. 184(): 137-146

International Seminar on Biological Sciences (ISBS - 2015) 123
Antibacterial Activity of Bay Leaves Extract (Syzygium polyanthum Wight.) Against Nosocomial Pathogenic Bacteria
Ismail, Y. S.*, Yulvizar, C., and A. D. T. S. Azwin
Department of Biology, Faculty of Science, Syiah Kuala University, Banda Aceh, Indonesia *E-mail : [email protected]
ABSTRACT Medicinal plants are tremendous natural richness in Indonesia with at least 2039 species from Indonesian forest. Bay leaves (S. polyanthum Wight.) is one of traditional medicine and an Indonesian native plant which are found in the forest. Indonesia people have been used bay leaves to treat diarrhea, cholesterol, hypertension, gastritis, and diabetes mellitus. Bay leaves have active compound such as saponins, tannins, flavonoids, ß-sitosterol and niacin, those can be used as antibacterial. Klebsiella pneumoniae is one of pathogenic bacteria that caused nosocomial infection in hospital environment. This research aimed to study antimicrobial activity of bay leaves extracts against clinical K. pneumoniae isolates. This research used Complete Random Design (CRD), consisting 6 treatments and 4 replications. Treatments used are 4 variations of bay leaves extract concentrations: 35%, 50%, 65% and 80%, and 2 controls (positive control using ciprofloxacin and negative control using methanol). The result showed that methanol extract of bay leaves affected K. pneumoniae growth with inhibition zone forming diameter 11.5 mm at 35% concentration; 12.5 mm at 50%; 8 mm at 65%; and 10.7 mm at 80%, meanwhile positive control showed diameter bigger than 25 mm. Keywords: Syzygium polyanthum Wight., antibacterial, Klebsiella pneumoniae, clinical isolate. INTRODUCTION Klebsiella pneumoniae is a nosocomial bacterium that is found especially in a hospital environment and becomes a serious problem for humans (Newman, 2002). Research conducted by Hidron et al. (2008) reported that K. pneumoniae causes 6% of all nosocomial infections, 6-17% of urinary tract infections, 7-14% of pneumonia, 4-15% of septicemia and 2-4% of wound infections in the United States and Europe. K. pneumoniae is an opportunistic pathogen primarily infects immunocompromise patients who are hospitalized and suffering from severe illness. Patients who use treatment devices such as ventilators, intravenous catheters and patients with the use of certain antibiotics for a long time have a higher risk of nosocomial infection caused by K. pneumoniae (Kramer et al., 2006).
Refdanita et al. (2004) reported that the use of antibiotics is tend to increasingly out of control that triggers increasingly problem of bacterial resistance to antibiotics. The development of pharmaceuticals increased rapidly to resolve these issues and prioritized on the use of ingredients derived from nature. The side effects caused by natural materials are relatively smaller. In addition, Indonesia has almost 40,000 species of plants that are widespread in various areas, but utilization is still less (Mursito, 2004). The use of plants as raw material for medicine also because of the bioactive, that are active compounds in plants. One of the properties of bioactive compounds in plants is as an antibacterial.
Bay plant (Syzygium polyanthum Wight.) is a spice tree which its leaves can be utilized as a food supplement in the Nusantara culinary. Bay leaf contains essential oils and some compounds that have antibacterial activity such as aldehydes, ketones, fatty acids, alcohols and others (Dalimartha, 2000). Such compounds have antibacterial activity by inactivating genetic material and damaging the integrity of cell membranes. Such compounds can be isolated by using methanol. Methanol solution is a polar solvent capable of dissolving the content of secondary metabolites from plants (Khairun et al., 2012).
Research conducted by Khairun et al. (2012), Muhardi et al. (2007) and Henderson et al.
124 International Seminar on Biological Sciences (ISBS - 2015)
(2008) showed that extracts of bay leaves have antibacterial effect against several types of Gram-negative bacteria, such as Shigella dysenteriae, Escherichia coli, Salmonella typhi, and Pseudomonas aeruginosa. Based on the research of Grosvenor et al. (1995), the results of the antibacterial testing using methanol extract of bay leaves to the growth of Stapylococcus aureus was 85% inhibition and to E. coli was 35% inhibition. Khairun et al. (2012) added, a methanol extract of bay leaves have antibacterial effect against S. typhosa growth. So far from literatures, the study of antibacterial activity of methanol extract of bay leaves to the clinical K. pneumoniae bacteria isolates have not been reported. Based on this, the research on the effect of the methanol extract of bay leaves on the growth of K. pneumoniae bacteria obtained from septicemia patients that were treated at the General Hospital of Dr. Zainoel Abidin (RSUDZA) Banda Aceh using Kirby Bauer method needs to be done.
The purpose of this study was to analyze the effect of the optimum concentration of the methanol extract of bay leaves (S. polyanthum Wight.) using the Kirby Bauer method on the growth of clinical K. pneumoniae isolates. MATERIALS AND METHODS The study was done from June to November 2014. Bacterial isolates were obtained from the Microbiology Laboratory, Dr. Zainoel Abidin General Hospital (RSUDZA). The extraction of bay leaves was conducted at the Research Laboratory, Department of Chemistry. Antibacterial testing was conducted at the Microbiology Laboratory, Department of Biology, Faculty of Mathematics and Natural Sciences, Syiah Kuala University, Indonesia.
The equipments used in this research were petri dishes, test tubes, inoculation needle, Bunsen, tweezers, incubator, autoclave, rotary evaporator, calipers, erlenmeyer flasks, and the other standard equipments of microbiology and chemical laboratories. Materials used were bay leaves, methanol, distilled water, filter paper, aluminum foil, Mueller-Hinton Agar (MHA) media, MacConkey Agar (MCA) media, paper discs (6 mm Oxoid, UK), and Klebsiella pneumoniae isolates obtained from the Laboratory of Microbiology, Dr. Zainoel Abidin General Hospital (RSUDZA). MacConkey Agar (MCA) Media Preparation A total of 4.72 g of MCA powder weighed and put into an Erlenmeyer flask, distilled water was added until 100 mL and then heated until dissolved. After that, it was sterilized using an autoclave at a temperature of 121ºC for 15 minutes and allowed to cool at a temperature about 45ºC. Then the solution was poured into sterile petri dishes. Once the agar hardened, the petri dishes were reversely put and stored in the refrigerator.
Mueller Hinton Agar (MHA) Media Preparation A total of 19 g of MHA powder weighed and put into an erlenmeyer flask, distilled water was then added as much as 0.5 L, after that the media was heated until dissolved. Media then sterilized in an autoclave at a temperature of 121ºC for 15 minutes. Then the solution was poured into sterile petri dishes. Once the agar hardened, the petri dish was reversely put and stored in the refrigerator. Research Design This study uses a completely randomized design (CRD), which is divided into 6 treatments with 4 repetitions. It consisted of bay leaves methanol extract groups with a concentration of 35%, 50%, 65%, 80% and 2 control groups i.e positive control groups was given 30 mg ciprofloxacin antibiotics (Torres et al., 2000) and the paper disc containing methanol-only as negative control group. Each group repeated 4 times.

International Seminar on Biological Sciences (ISBS - 2015) 125
Research Parameter The parameters observed in this study was the diameter of the inhibition zone (clear zone) formed around the paper discs of bay leaves methanol extract to the growth of clinical K. pneumoniae isolate that were measured by using a caliper in millimeters (mm). Bay Leaves Extraction Leaves were separated from the stalks, cleaned up, and air-dried. After drying, the results obtained as much as 1 kg of dried bay leaves. The dried bay leaves then crushed and macerated for 3×24 hours with methanol solvent. The extract obtained was then concentrated by rotary evaporator at a temperature of 35-40ºC to obtain a thick extract. Bay leaf extract was then diluted to various concentrations that are: 35%, 50%, 65%, and 80%. Bacteria Regeneration Bacteria from stock culture were taken using an inoculation needle and streaked to the MCA media and incubated for 18-24 hours at a temperature of 35ºC. Colonies were formed, indicating the growth of bacteria. Stock bacteria can be stored in the refrigerator when not in use. The bacteria regenerated once every two weeks in the same manner.
Inhibitory Test of Bay Leaf Methanol Extract Against Clinical K. pneumoniae Isolate Implementation of this antibacterial activity test using agar diffusion method and standardized antibiotic discs (Kirby Bauer method) to determine the sensitivity of bacteria to antibiotics. The suspension of bacteria have been identified to test the sensitivity to antibiotics as recommended by the Clinical and Laboratory Standards Institute (CLSI, 2012).
A colony of K. pneumoniae was taken using a sterile inoculation needle from pure culture of K. pneumoniae which had been previously cultured in MCA media for 24 hours. The inoculum was suspended with 0.9% NaCl as much as 3-5 ml. Then the turbidity was synchronized using a 0.5 MacFarland solution. After reach the same turbidity, sterile cotton stick was dipped into the bacterial suspension, then streaked three round times evenly on the surface of the MHA media. Paper discs that had been spilled by methanol extract of bay leaves with various concentrations (35%, 50%, 65%, 80%) were placed on the media MHA. Ciprofloxacin antibiotics discs as positive control and the paper discs containing methanol as negative control were also placed on MHA media. Those MHA media were incubated at 37°C for 24 h and bacterial growth was observed from the clear zone formed. The diameter of clear zone formed was measured by using a caliper in millimeters (mm).
Data Analysis The results obtained were analyzed descriptively according to inhibitory response. The inhibition zone data of bay leaves methanol extract were analyzed by using Variant Analysis (ANOVA). If there was an influence on each treatment, it will be followed by further tests. Further tests would be used was the Duncan Multiple Range Test. RESULTS AND DISCUSSION Phytochemical screening methanol extract of leaves (S. polyanthum Wight.) shows that it contains alkaloids, flavonoids, steroids and terpenoids. Results show that a dry bay leaves and methanol extracts of leaves with positive alkaloid during Dragendorf reagent is added, whereas when the reagent is added Meyer and Wagner are both not precipitates. A positive sample contains alkaloids although only it reacts with a specific reagent. According to Robinson (1995), that every type of alkaloid has own sensitivity to certain reagents. Because of the alkaloid compounds have distinctive functional groups. According to Harborne (1987), the alkaloids class of compounds generally a semipolar compound. However, most of this class of compounds is a polar. Methanol is a polar, so it will be easier alkaloids soluted in this solvent.

126 International Seminar on Biological Sciences (ISBS - 2015)
Alkaloid showedn to have antibacterial activity against several bacteria (Ahmad, 1986). Phytochemical screening for flavonoid compounds in the dry bay leaves and methanol extracts of leaves have the same result, positive flavonoids with pink mark present when added 0.5 g Mg and drops of 0.5 M HCl. Flavonoids are polyphenols that have chemical properties of phenolic compounds, which are slightly acidic so it can be dissolved in alkaline. Flavonoids also have a number of hydroxyl groups that are generally soluble in polar solvents such as ethanol, methanol, butanol, acetone, water and so on (Cowan, 1999). Based on Finegold and Baron (2007), flavonoids function as an antibacterial by forming complex compounds against extracellular proteins that disrupt the bacterial cell membrane integrity so that the cells become damaged and cannot be repaired due to disruption of membrane integrity. Flavonoids are compounds found in most growing plants. These compounds are found in seeds, fruit peel and fruit. Most herbs contain flavonoids. According to Sabir (2003) flavonoida not only serves as a pigment that gives color to the flowers and leaves, but also very important for the growth, development and plant defense. For example, as inhibitors of the enzyme, the predecessor of toxic materials, protect the plants (bacteria, viruses, free radicals and UV radiation). Several recent studies have shown that flavonoids have an antimicrobial effect, anti-inflammatory, stimulates the formation of collagen, protect blood vessels, antioxidants and anti-cancer. Flavonoids as antibacterial can suppress the bacteria which contaminate the wound so that the infection can be avoided (Dharmayanti and Sulistyowati, 2000). Phytochemical screening for steroid compounds, terpenoids, and saponins between the dry bay leaves and methanol extracts of leaves have different results. Dried bay leaves produce a bluish green color change on the test steroid compounds and red in the second test terpenoid compounds this test drops of reagent Liebermann Burchard, while in the dry bay leaf saponin test did not produce froth when drops of distilled water. The different results in the methanol extract of leaves when testing terpenoids and saponins methanol extract of leaves had negative results, whereas the steroid testing has marked positive results by producing a blue color. Antibacterial Activity Test Results of Bay Leaf Methanol Extracts against Clinical Isolates of Klebsiella pneumoniae Growth The antibacterial activity test results showed that the leaves (S. polyanthum Wight.) have antibacterial properties against K. pneumoniae clinical isolates. This is shown by the formation of a clear zone. The clear zones around each disc are the zones of inhibition that indicate the extent of the test organism’s inability to survive in the presence of the test antibiotic (Figure 4.1).
Figure 1. Results of clear zone formed by concentration of the methanol extract of bay leaves to the growth of Klebsiella pneumoniae clinical isolates Description: (a) Paper disc, (b) Clear zone diameter
a
b
P5 P3
P1 P6
P2
P4
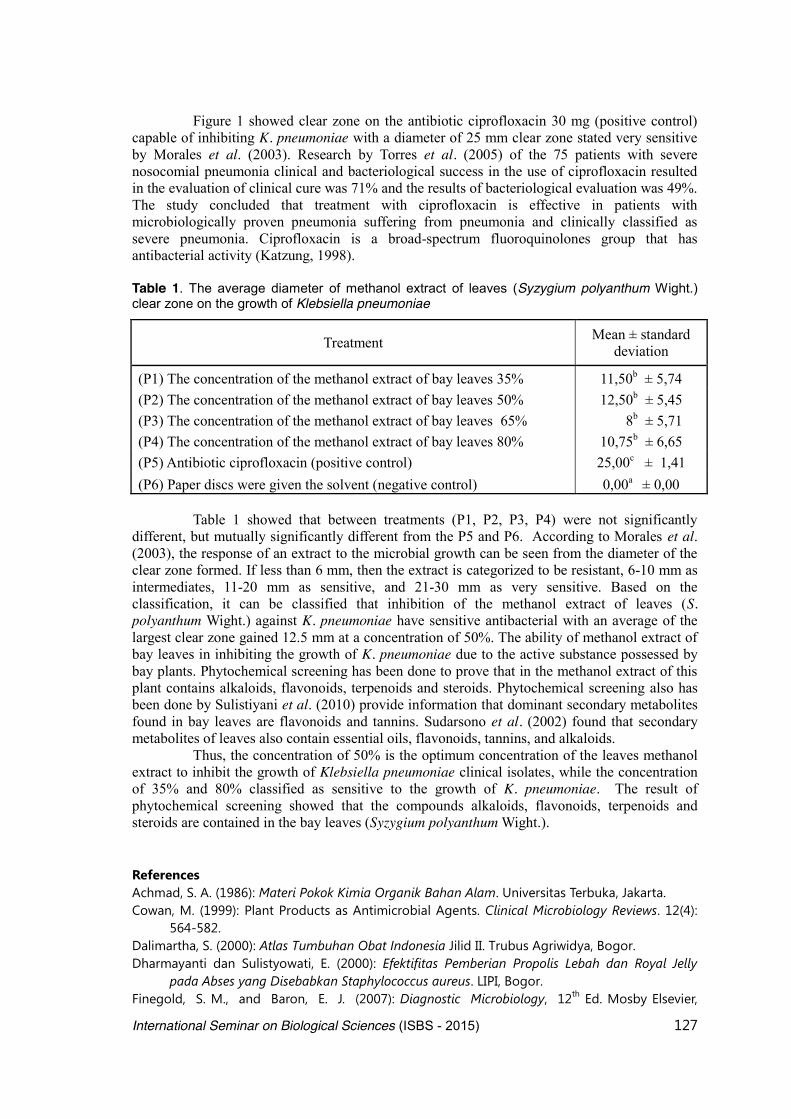
International Seminar on Biological Sciences (ISBS - 2015) 127
Figure 1 showed clear zone on the antibiotic ciprofloxacin 30 mg (positive control) capable of inhibiting K. pneumoniae with a diameter of 25 mm clear zone stated very sensitive by Morales et al. (2003). Research by Torres et al. (2005) of the 75 patients with severe nosocomial pneumonia clinical and bacteriological success in the use of ciprofloxacin resulted in the evaluation of clinical cure was 71% and the results of bacteriological evaluation was 49%. The study concluded that treatment with ciprofloxacin is effective in patients with microbiologically proven pneumonia suffering from pneumonia and clinically classified as severe pneumonia. Ciprofloxacin is a broad-spectrum fluoroquinolones group that has antibacterial activity (Katzung, 1998). Table 1. The average diameter of methanol extract of leaves (Syzygium polyanthum Wight.) clear zone on the growth of Klebsiella pneumoniae
Treatment Mean ± standard deviation
(P1) The concentration of the methanol extract of bay leaves 35% 11,50b ± 5,74 (P2) The concentration of the methanol extract of bay leaves 50% 12,50b ± 5,45 (P3) The concentration of the methanol extract of bay leaves 65% 8b ± 5,71 (P4) The concentration of the methanol extract of bay leaves 80% 10,75b ± 6,65 (P5) Antibiotic ciprofloxacin (positive control) 25,00c ± 1,41 (P6) Paper discs were given the solvent (negative control) 0,00a ± 0,00
Table 1 showed that between treatments (P1, P2, P3, P4) were not significantly different, but mutually significantly different from the P5 and P6. According to Morales et al. (2003), the response of an extract to the microbial growth can be seen from the diameter of the clear zone formed. If less than 6 mm, then the extract is categorized to be resistant, 6-10 mm as intermediates, 11-20 mm as sensitive, and 21-30 mm as very sensitive. Based on the classification, it can be classified that inhibition of the methanol extract of leaves (S. polyanthum Wight.) against K. pneumoniae have sensitive antibacterial with an average of the largest clear zone gained 12.5 mm at a concentration of 50%. The ability of methanol extract of bay leaves in inhibiting the growth of K. pneumoniae due to the active substance possessed by bay plants. Phytochemical screening has been done to prove that in the methanol extract of this plant contains alkaloids, flavonoids, terpenoids and steroids. Phytochemical screening also has been done by Sulistiyani et al. (2010) provide information that dominant secondary metabolites found in bay leaves are flavonoids and tannins. Sudarsono et al. (2002) found that secondary metabolites of leaves also contain essential oils, flavonoids, tannins, and alkaloids. Thus, the concentration of 50% is the optimum concentration of the leaves methanol extract to inhibit the growth of Klebsiella pneumoniae clinical isolates, while the concentration of 35% and 80% classified as sensitive to the growth of K. pneumoniae. The result of phytochemical screening showed that the compounds alkaloids, flavonoids, terpenoids and steroids are contained in the bay leaves (Syzygium polyanthum Wight.). References Achmad, S. A. (1986): Materi Pokok Kimia Organik Bahan Alam. Universitas Terbuka, Jakarta. Cowan, M. (1999): Plant Products as Antimicrobial Agents. Clinical Microbiology Reviews. 12(4):
564-582. Dalimartha, S. (2000): Atlas Tumbuhan Obat Indonesia Jilid II. Trubus Agriwidya, Bogor. Dharmayanti dan Sulistyowati, E. (2000): Efektifitas Pemberian Propolis Lebah dan Royal Jelly
pada Abses yang Disebabkan Staphylococcus aureus. LIPI, Bogor. Finegold, S. M., and Baron, E. J. (2007): Diagnostic Microbiology, 12th Ed. Mosby Elsevier,

128 International Seminar on Biological Sciences (ISBS - 2015)
Missouri. Grosvenor, P. W., Supriono, A., and Gray, D. O. (1995): Medicinal plants from Riau Province,
Sumatra, Indonesia. Part 2: antibacterial and antifungal activity. Journal of Ethnopharmacology 45 (2): 97–111.
Harbone, J. B. (1987): Metode Fitokimia: Penuntun Cara Modern Menganalisis Tumbuhan. Terjemahan dari Phytochemical Methods Kosasih, P. dan Iwang, S. ITB, Bandung.
Hidron, A. I., Edwards, J. R., Patel, J., Horan, T. C., Sievert, D. M., Pollock, D. A.,and Fridkin, S. K. (2008): Antimicrobial-Resistant Pathogens Associated With Healthcare-Associated Infections: Annual Summary of Data Reported to the National Healthcare Safety Network at the Centers for Disease Control and Prevention, 2006-2007. Infection Control and Hospital Epidemiology 29: 966-1011.
Katzung, B. G. (1998): Farmakologi Dasar dan Klinik. Terjemahan dari Basic and Clinical Pharmacology, oleh Agoes, A. EGC, Jakarta.
Khairun N.R., Albert, P., dan Rumondang, BN. (2012): Uji Aktivitas Antibakteri Ekstrak Metanol Daun Salam (Syzygium polyanthum) terhadap Bakteri Eschericia coli dan Salmonella typhi. Jurnal Saintia Kimia 1(1). 35-38.
Kramer, A., Ingeborg, S., dan GünHow. (2006): Nosocomial Pathogens Persist on Inanimate Surfaces: A Systematic Review. BMC Infectious Disease 6:130.
Morales, G., Sierra, P., Manolla, A., Paredes, A., Loyolla, LA., Gallardo, O., and Poorquez J. (2003): Secondary Metabolisme from Four Medicial Plant from Northem Chile : Antimicrobial activity and Biotoxicity Against Artemia Salina. J. Chil. Chem. Soc. 48 (2).
Muhardi., Suharyono A.S., dan Susilawati. (2007): Aktivitas Antibakteri Ekstrak Daun Salam (Syzygium polyanta) dan Daun Pandan (Pandanus amaryllivolius). Jurnal Teknologi dan Industri Pangan 18:17-24.
Mursito, B. (2004): Ramuan Tradisional untuk Kesehatan Anak. Penebar Swadaya, Jakarta. Refdanita, M. R., Nurgani, A., dan Endang, P. (2004): Pola Kepekaan Bakteri Terhadap Antibiotika
di Ruang Rawat Intensif Rumah Sakit Fatmawati Jakarta Timur. Makalah Kesehatan 8: 41-48.
Robinson, T. (1991): Kandungan Organik Tumbuhan Tingkat Tinggi. ITB, Bandung. Sabir, A. (2003): Pemanfaatan Flavonoid di Bidang Kedokteran Gigi. Majalah Kedokteran Gigi
Edisi Khusus Temu Nasional III. Airlangga University Press, Surabaya. Sudarsono, P. N., Gunawan, D., Wahyuono, S., Donatus, I. A., dan Purnomo. (2002): Tumbuhan
Obat II. UGM, Yogyakarta. Torres, A., Bauer, T.T., Léon-Gil, C., Castillo, F., Alvarez-Lerma, F., and Martinez, P. (2000): Treatment
of severe nosocomial pneumonia: a prospective randomised comparison of intravenous ciprofloxacin with imipenem/cilastatin. Thorax 55: 1033-9

International Seminar on Biological Sciences (ISBS - 2015) 129
Effect Of Different Biochar Type And Dose On Soybean Seed Germination In Soil-Less Petridish Bioassay
Zamriyetti1, Parinduri, S.2 and S. Mayly*2
1)Department ofAgroecotechnology, Faculty of Agriculture,Pembangunan Panca Budi University 2)Department ofAgroecotechnology, Faculty of Agriculture, Al Washliyah Medan University,
Medan, Indonesia;
*E-mail: [email protected]
ABSTRACT Biocharvary in physicalcharacteristicscomposition defend on raw material, pyrolisis. Differences in thesebiochar characteristicsaffectthe response of biochar in thesoil, and to plant.The objective of this research was to determine the effect of biochar type and dose on soybean seed germination in soil less petridish bio assay. Thestudy usedrandomized block designwith 2 factors and three replications. First factor were biochar type application: B1(Rice hullbiochar/RHB ); B2(Maize Strover Biochar/MSB); B3 (Rice strawbiochar/RSB);B4 (Bagasse Biochar/BB); B5 (Tapioca residue Biochar/TRB);B6 (Coconutpeatbiochar/CPB). Second Factor were biochar rate application : 0,5 g/petridish (M1); 1,0 g/petridish (M2); 1,5 g/petridish (M3); 2,0 g/petridish (M4). The results of this research showed biochar type and doses of application significantly affected soybean germination and root length total in the soil-less petridish bioassay. Rice hull biochar at 10 t/ha showed the highest soybean germination percentage and tapioca residue at 20 t/ha showed the highest root length total in soil-less petridish bioassay. Ricehull biochar, tapioca residue biochar and baggasse biochar were suitable for seed germination but not for maize strover biochar, rice straw biochar and coconut peat biochar. Keywords: Biochar, rice hull biochar, seed germination, soybean INTRODUCTION Various organic waste forms can be used as raw material in pyrolysis process is manure, municipal waste, crop residues (Roberts et al., 2010), rice hull (Mayly dan Hidayat, 2013), maize, serelalia, wood powder, palm oil, wheat straw, peanuts, and other organic materials. Pyrolysis is the decomposition of biomass from animal and plants origin by heating (>250°C) in a low or no oxygen environment, and pyrolysis process product is biochar (Antal and Grønli, 2003).
Raw materials characteristic and composition affect the physical and chemical properties of biochar, futhermore pyrolysis conditions such as temperature, heat level, combustion time, oxygen levels and pyrolysis reactor type also affects the characteristics and quality of biochar (Goyal et al., 2008; Gaskin et al., 2008). Biochar vary in physical characteristics composition such as C content, ash, volatile matter, pH, composition and chemical structure (Joseph et al., 2010; Spokas, 2010). Differences in these variables affect the response of biochar in the soil, its stability and its effect on soil biological, chemical and physical properties (Spokas and Reicosky 2009; Spokas et al., 2010).
Solaiman et al (2012) has been investigated the effect of biochar type and rate on wheat seed germination in soil less petridish. There were five biochar types like oil mallee, rice husks, new jarrah, old jarrah, wheat chaff and five rates 0, 0.5, 1.0, 2.5, 5.0 g/petridish. The research results that biochar type and rate of application significantly affected wheat seed germination and increased root length of the seedlings in the petridish bioassay.
Several studies have reported the effect of biochar in the early stages of plant growth as the phase of seed germination and seedling growth Nutrient status changes in soil may affect on seed germination and seedling growth. Some compounds in biochar has the potential either to inhibit or stimulate seed germination and seedling growth.. (Solaiman et al (2012).. Stimulation

130 International Seminar on Biological Sciences (ISBS - 2015)
or inhibition of seed germination due to the application of biochar has been investigated for forest plants (Choi et al., 2009; Reyes and Casal, 2006; Tian et al., 2007), the germination of wheat seed increased due biochar paper mills application with a single dose (10 t / ha). Instead, Free et al., (2010) reported that maize seed germination and early growth had no significant effect at various type biochar application. The objective of this research was to determine the effect of biochar type and dose on soybean seed germination in soil less petridish bio assay. MATERIALS AND METHODS This study wasconducted in Laboratory of Growth Centre Kopertis I, Medan District in North Sumatera Indonesia.It was located approximately atLatitude 3°36’39,82”N, Longitude 98°42’48,98”E. Thestudy usedrandomized block designwith 2 factors and three replications. First factor were biochar type application: B1(Rice hullbiochar/RHB ); B2(Maize Strover Biochar/MSB); B3 (Rice strawbiochar/RSB);B4 (Bagasse Biochar/BB); B5 (Tapioca residue Biochar/TRB);B6 (Coconutpeatbiochar/CPB). Second Factor were biochar rate application : 0,5 g/petridish (M1); 1,0 g/petridish (M2); 1,5 g/petridish (M3); 2,0 g/petridish (M4).
Feedstock for biochar material were collected from some area at Sumatera Utara, like rice hull were collect from rice mill at Sei Rampah District, oilpalmemptybunchwerecollectfrom small traders at SeiRampahDistrict, rice strawwascollect from paddy field at Perdagangan District, coconut peat wascollectfrom coconut traders at Bengkok Market Medan. The crop residue were cut into smaller sizes than dried in thesun and convertedtobiocharusingthe simple stove.After4-6 hours biocharwasmadeformedthenquenchedwithwater. All the biochar samples were analyzed the physical dan chemical characteristic like C content, N content, C:N ratio, and pH. A layer of filter paper were placed in 8,5 cm petridish, then moistened with water. Each of six biochars were added at the doses 0, 0.5, 1.0,2.5, 5.0 g/petridish (equivalent to 0, 10, 20, 50, 100 t/ha on a volume basis at 10 cm soil depth) with threereplicates. This germination test was refers to Solaiman et al (2012). Twenty soybean seeds were sown in each petridish. All petridishwere covered with lids and incubated in the dark at25°C for 4 days when germination percentage and rootlength were assessed. Root length of germinated seedswas measured in fresh roots using a ruler, andsummed for each petridish (m/petridish).
Data analyzed using Analysis of varience (ANOVA) to separate the main effect of factors as well as their interactions. Thmean comparisons were made using Duncan’s Multiple Range Test (DMRT) at p<0.05 between treatments. RESULTS AND DISCUSSION All the biochar used in this study had neutral pH (6,71-7,03). Theproperties of biochar varied between types of biochar. The biochar C content was highest in rice hull biochar (24,56 %) andlowest in rice straw biochar (13,27 %). The N content was lowestin maize strover biochar (0,22 %) and highest in coconut peat biochar (1,74%). The highest C : N ratio was maize strover biochar (78,68 : 1) and lowest in rice straw biochar (9,68 : 1).
The analysis of varience showed that biochar type and doses of application significantly affected soybean germination in the soil-less petridish bioassay. Doses of 10 t/ha biochar application showed the highestsoybean germination, whichhad significantlydifferent with doses of 20 t/ha but no significantlydifferent with other doses treatment (5 and 15 t/ha). Rice hull biochar showed the highest soybean germination, which had no statistically significant effects with bagasse biochar, tapioca residue biochar but had significantlydifferent with maize strover biochar, rice straw biochar, and coconut peat biochar.
The treatment combination from doses 10 t/ha with each biochar type like Rice hull biochar,maize strover biochar, tapioca residue biochar, and coconut peat biocharincreased soybean germination and decreased at higher doses application.Rice straw biochar applied at 5

International Seminar on Biological Sciences (ISBS - 2015) 131
t/ha showed the highest soybean germination and decreased when rice straw biocharapplied at higher doses application. Soybean germination was increased with applied the bagasse biocharat 5 and 20 t/ha, but decreased at 10 and 15 t/ha bagasse biocharapplication. Soybean germination due to biochar type and doses application can be seen at Figure 1.
Figure 1.Effect of Type Biochar and Doses Application on Soybean Germination
In generally, combination treatments of rice hull biochar, bagasse biochar and tapioca residue biochar with all doses application showed soybean germination higher than 65 % but combination maize strover biochar, rice straw biochar and coconut peat biochar with doses biochar showed soybean germination lower than 65 %.Soelaiman et al (2012) reported that biochar generally increased wheat seed germination at the lower rates of biochar application (10–50 t/ha) and decreased or had no effect at higher rates of application. Biochar can reduceplantgrowth and yieldbiochars (Deeniket al., 2010) because it may contain undesirablecompounds such as crystalline silica, dioxin,polyaromatic hydrocarbons (PAHs), phenolic compoundsand heavy metals that are harmful to plants,microbes and humans (Cao et al. 2009; Thies andRillig 2009).
Biochar type and doses of application significantly affected root length total in the soil-less petridish bioassay. Tapioca residue biochar showed the highest root length total, which had significantlydifferent with another biochar type application. In the other hand Coconut peat biochar showed the lowest root length total which had no significantlydifferent with maize strover biochar, rice straw biochar treatments.
Rice hull biochar, maize strover biochar, rice straw biochar decreased root length total at higher doses application (> 5 t/ha), on the other hand tapioca residue biochar increased root length total when applied at higher doses application. Root length total was increased with applied bagasse biocharat 5 and 20 t/ha, but decreased at 10 and 15 t/ha bagasse biochar application. Root length total due to biochar type and doses application can be seen at Figure 2.
In generally, combination treatments of rice hull biochar, bagasse biocharand tapioca residue biocharwith all doses application showed root length total higher than 200 cmbut maize strover biochar, rice straw biochar and coconut peat biochar combination treatments showed root length total lower than 200 cm.
Rice hull biochar at 10 t/ha showed the highest soybean germination percentage and tapioca residue at 20 t/ha showed the highest root length total in soil-less petridish bioassay. Ricehull biochar, tapioca residue biochar and baggasse biochar were suitable for seed
0
10
20
30
40
50
60
70
80
90
100
RHB MSB RSB BB TRB CPB
Ger
min
atio
n Pe
rcen
tage
(%)
5
10
15
20
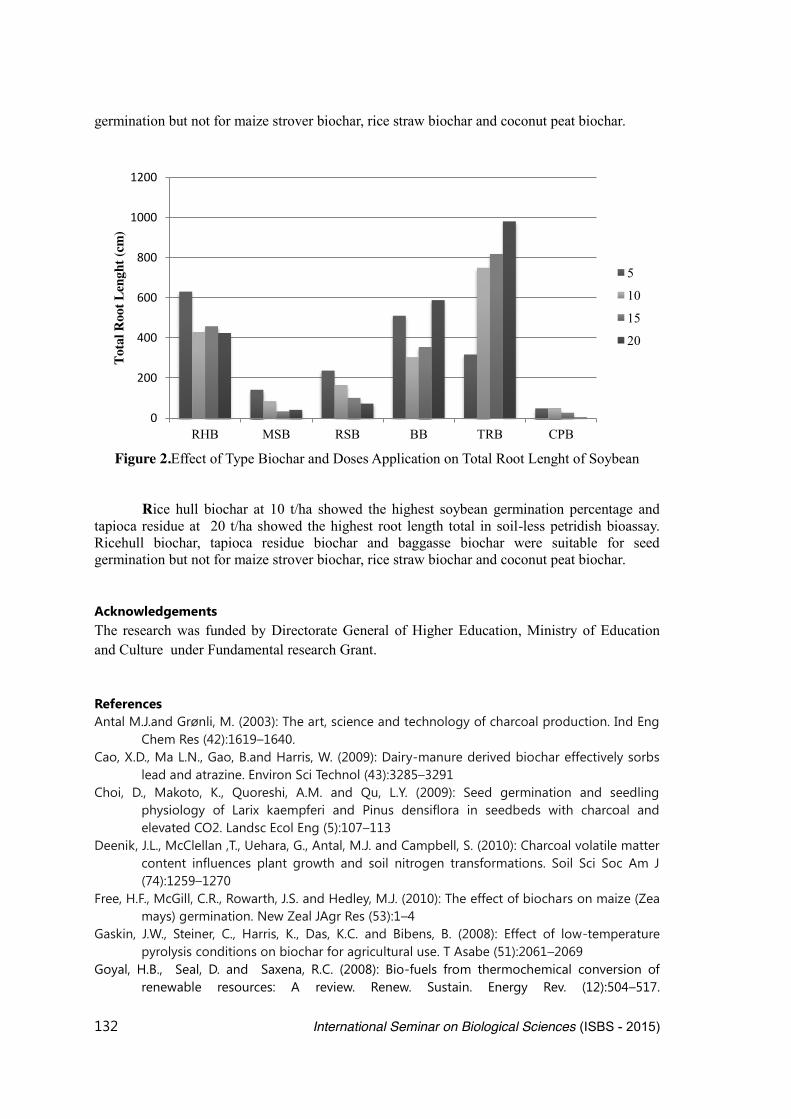
132 International Seminar on Biological Sciences (ISBS - 2015)
germination but not for maize strover biochar, rice straw biochar and coconut peat biochar.
Figure 2.Effect of Type Biochar and Doses Application on Total Root Lenght of Soybean
Rice hull biochar at 10 t/ha showed the highest soybean germination percentage and tapioca residue at 20 t/ha showed the highest root length total in soil-less petridish bioassay. Ricehull biochar, tapioca residue biochar and baggasse biochar were suitable for seed germination but not for maize strover biochar, rice straw biochar and coconut peat biochar. Acknowledgements The research was funded by Directorate General of Higher Education, Ministry of Education and Culture under Fundamental research Grant. References Antal M.J.and Grønli, M. (2003): The art, science and technology of charcoal production. Ind Eng
Chem Res (42):1619–1640. Cao, X.D., Ma L.N., Gao, B.and Harris, W. (2009): Dairy-manure derived biochar effectively sorbs
lead and atrazine. Environ Sci Technol (43):3285–3291 Choi, D., Makoto, K., Quoreshi, A.M. and Qu, L.Y. (2009): Seed germination and seedling
physiology of Larix kaempferi and Pinus densiflora in seedbeds with charcoal and elevated CO2. Landsc Ecol Eng (5):107–113
Deenik, J.L., McClellan ,T., Uehara, G., Antal, M.J. and Campbell, S. (2010): Charcoal volatile matter content influences plant growth and soil nitrogen transformations. Soil Sci Soc Am J (74):1259–1270
Free, H.F., McGill, C.R., Rowarth, J.S. and Hedley, M.J. (2010): The effect of biochars on maize (Zea mays) germination. New Zeal JAgr Res (53):1–4
Gaskin, J.W., Steiner, C., Harris, K., Das, K.C. and Bibens, B. (2008): Effect of low-temperature pyrolysis conditions on biochar for agricultural use. T Asabe (51):2061–2069
Goyal, H.B., Seal, D. and Saxena, R.C. (2008): Bio-fuels from thermochemical conversion of renewable resources: A review. Renew. Sustain. Energy Rev. (12):504–517.
0
200
400
600
800
1000
1200
RHB MSB RSB BB TRB CPB
Tota
l Roo
t Len
ght (
cm)
5
10
15
20
International Seminar on Biological Sciences (ISBS - 2015) 133
doi:10.1016/j.rser.2006.07.014 Joseph, S.D., Camps-Arbestain,M., Lin, Y., Munroe, P., Chia, C.H., Hook, J., Van Zwieten, L.
Kimber, S., Cowie, A., Singh, B.P., Lehmann, J., Foidl, N., Smernik, R.J. and Amonette, J.E. (2010): An investigation into the reactions of biochar in soil. Aust. J. Soil Res. (48):501–515. doi:10.1071/SR10009
Mayly, S. dan Hidayat, B. (2013): Peningkatan Pertumbuhan Padi Gogo Melalui Penggunaan Varietas dan Biochar Sekam Padi di Dataran Rendah. Prosiding Seminar Nasional SPS dengan Program Pasca Sarjana Ilmu Pertanian FP USU.
Reyes, O. and Casal, M. (2006): Seed germination of Quercus robur, Q-pyrenacia and Q-ilex and the effects of smoke, heat, ash and charcoal. Ann Forest Sci (63):205–212
Roberts, K.G., Gloy, B.A., Joseph, S., Scott, N.R. and Lehmann, J. (2010): Life cycle assessment of biochar systems: Estimating the energetic, economic, and climate change potential. Environ. Sci. Technol. (44):827–833. doi:10.1021/es902266r
Solaiman, Z.M., Murphy, D.V. and Abbott, L.K. (2012): Biochars influence seed germination and early growthof seedlings.Plant Soil (353):273–287DOI 10.1007/s11104-011-1031-4
Spokas, K. and D. Reicosky. (2009): Impacts of sixteen diff erent biochars on soil greenhouse gas production. Ann. Environ. Sci. (3):179–193.
Spokas, K.A. (2010): Evaluation of sorbed organics on biochars and potential impacts. In Agron. Abstracts. ASA, CSSA, and SSSA, Madison, WI.
Spokas, K.A., Baker, J.M. and Reicosky, D.C. (2010): Ethylene: Potential key for biochar amendment impacts. Plant Soil (333):443–452. doi:10.1007/s11104-010-0359-5
Tian, Y.H., Feng, Y.L. and Liu, C. (2007): Addition of activated charcoal to soil after clearing Ageratina adenophora stimulates growth of forbs and grasses in China. Tropical Grasslands (41):285–291