balance sheet implications of the czech national bank’s ... · 2 • the paper provides a...
TRANSCRIPT

Balance sheet implications of the Czech National Bank’s exchange rate commitment
Michal Franta, Tomáš Holub, and Branislav Saxa
Research Open DayCzech National Bank, 27 May 2019

2
• The paper provides a quantitative assessment of the balance sheet implications of the CNB’s exchange rate commitment
• CNB’s balance sheet projections 30 years ahead (deterministic, stochastic)
• Various counter-factual scenarios (no exchange rate commitment, earlier exit)
• Policy analysis based on the framework (long-run decline in currency in circulation, resumption of FX income sales)
• Conclusion: The financial and ‘policy’ solvency of the CNB are not endangered
Overview
3
• Stylised facts
• Model of the CNB‘s balance sheet
• Stochastic simulation and median outlook
• Four policy scenarios
• Conclusions and future research
Outline
4
• Stylised facts
• Model of the CNB‘s balance sheet
• Stochastic simulation and median outlook
• Four policy scenarios
• Conclusions and future research
Outline
5
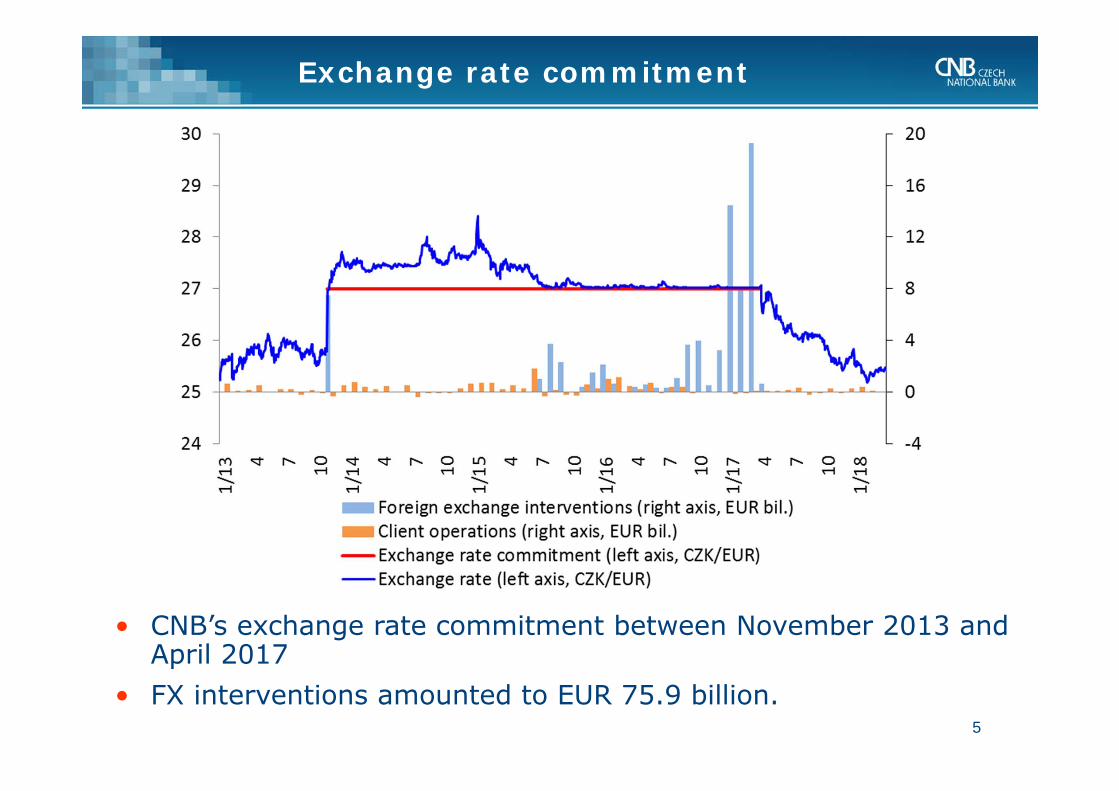
• CNB’s exchange rate commitment between November 2013 and April 2017
• FX interventions amounted to EUR 75.9 billion.
Exchange rate commitment

6
• Balance sheet size of the CNB increased twofold.• Balance sheet size of most central banks has increased, in some
cases significantly so, due to the UMP.
CBs‘ balance sheet expansion
0
20
40
60
80
100
120
140in % of G
DP
Federal Reserve SystemEuropean Central BankBank of JapanSwiss National BankSveriges RiksbankCzech National Bank

7
CNBs‘ balance sheet composition
• FX interventions: CNB purchases EUR, corresponding increase in commercial bank reserves at the central bank.
• CNB‘s assets are traditionally dominated by FX reserves, which are not matched by FX liabilities =>the exchange rate risk (vs. credit risk for CB’s with QE).
• Excess liquidity is being sterilised mainly via 2W reverse repo operations, the volume of which has gone up significantly.
CNB‘s balance sheet structure (in CZK bn.)Assets Liabilities
8
CNB‘s equity
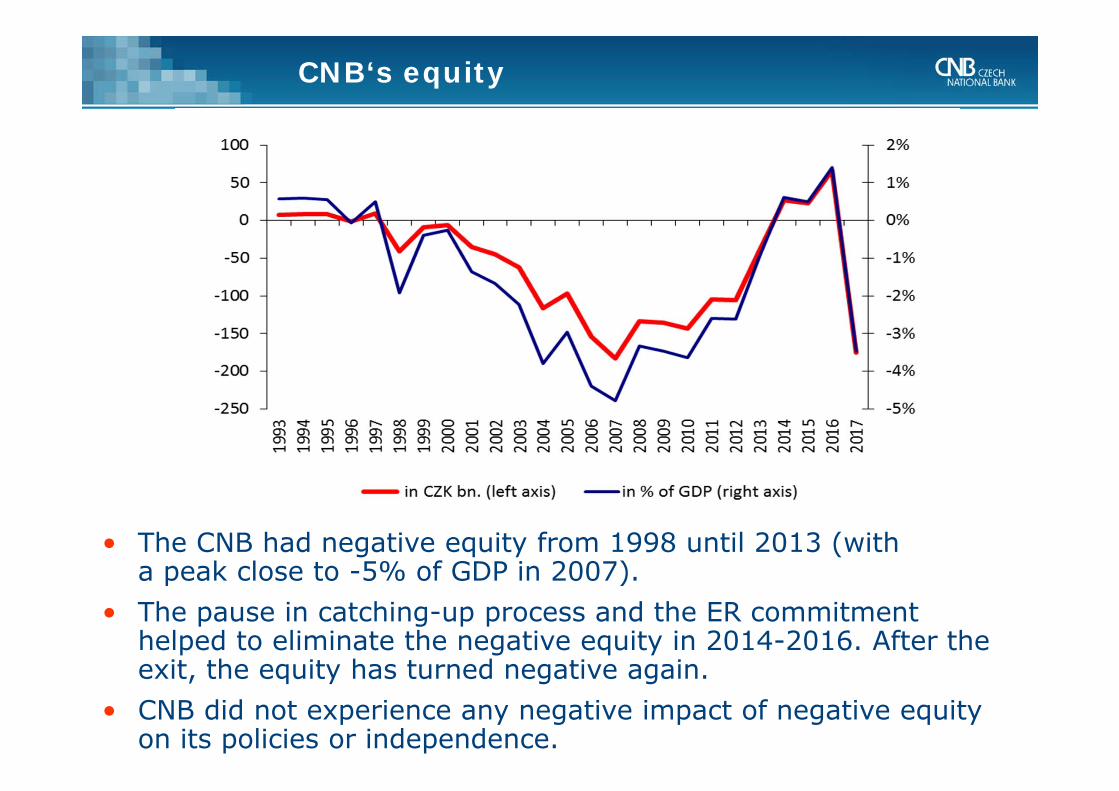
• The CNB had negative equity from 1998 until 2013 (with a peak close to -5% of GDP in 2007).
• The pause in catching-up process and the ER commitment helped to eliminate the negative equity in 2014-2016. After the exit, the equity has turned negative again.
• CNB did not experience any negative impact of negative equity on its policies or independence.
9
CNB‘s major yields and costs
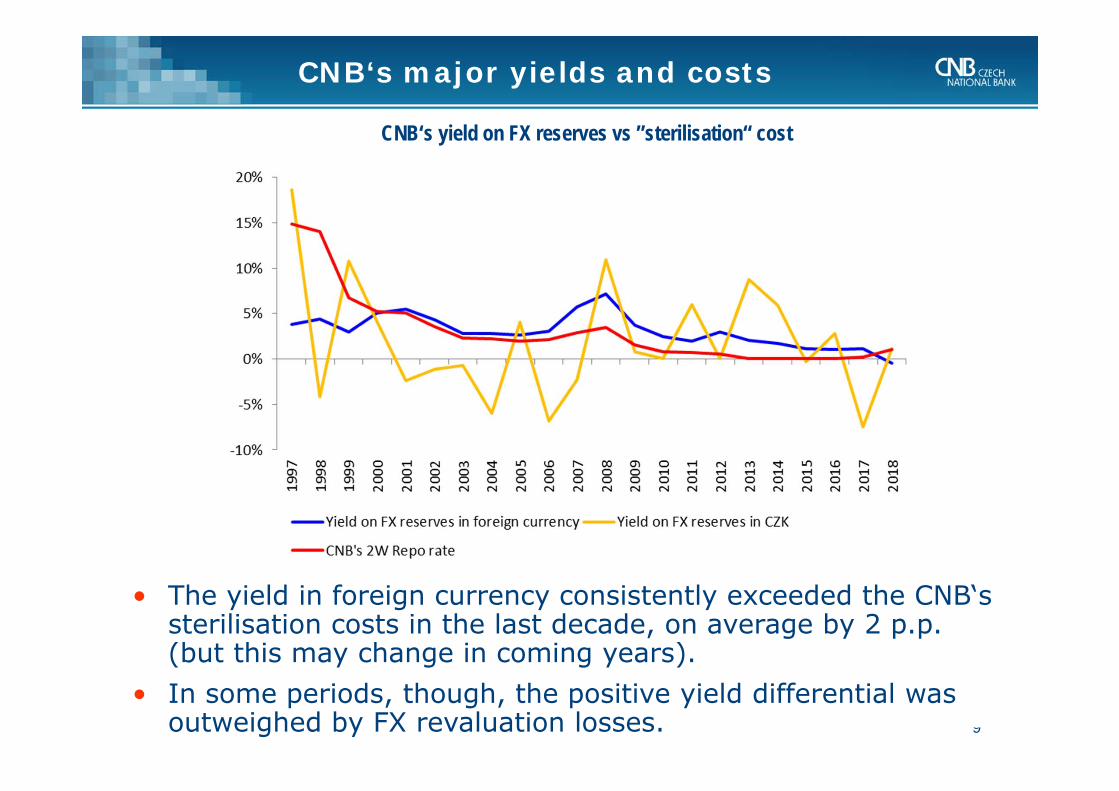
CNB‘s yield on FX reserves vs ”sterilisation“ cost
• The yield in foreign currency consistently exceeded the CNB‘s sterilisation costs in the last decade, on average by 2 p.p. (but this may change in coming years).
• In some periods, though, the positive yield differential was outweighed by FX revaluation losses.

10
• Stylised facts
• Model of the CNB‘s balance sheet
• Stochastic simulation and median outlook
• Four policy scenarios
• Conclusions and future research
Outline

11
Model of the CNB‘s balance sheet
Income, assets:
11 3.07.0 tUSDt
USDtt
EURt
EURtt FXeyieldFXeyieldInc
Expenses, liabilities:tt
CZtt OCDepiExp 1
tttt FXIntExpLiabLiab 1
ttt CashLiabDep 11 ttt CashgCash
Profit, equity:
ttt ExpInc
0.9 0.1 _
12
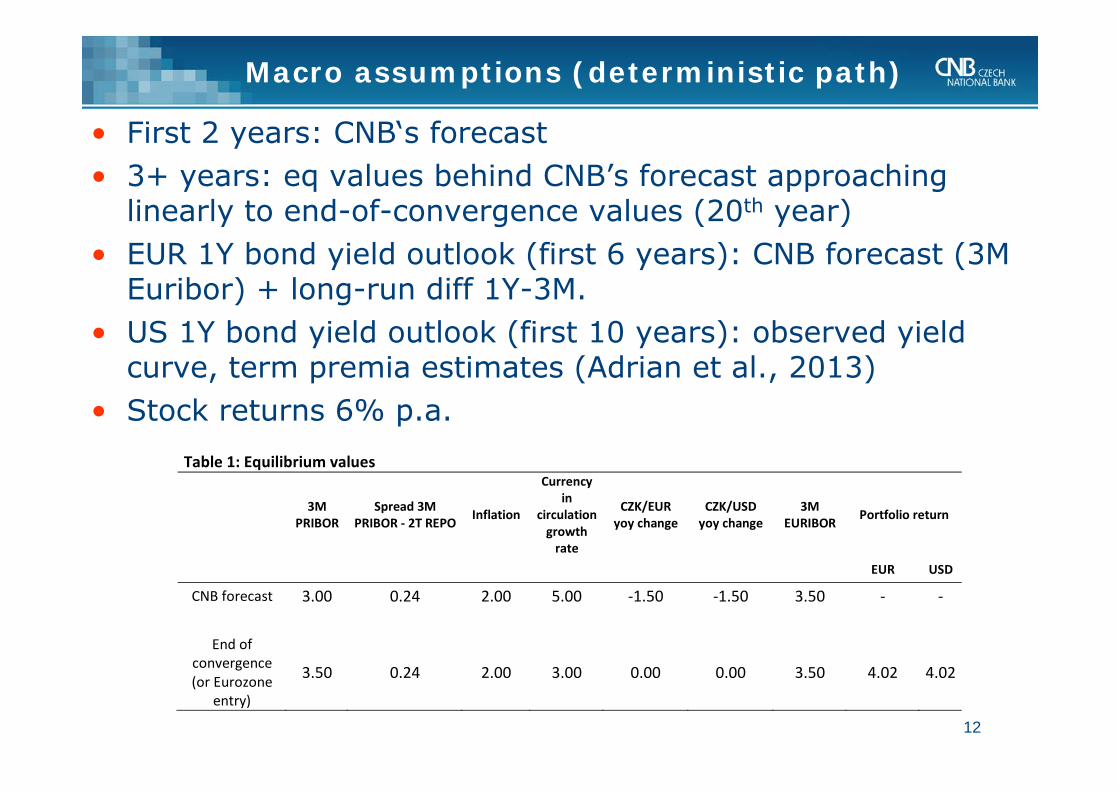
• First 2 years: CNB‘s forecast• 3+ years: eq values behind CNB’s forecast approaching
linearly to end-of-convergence values (20th year)• EUR 1Y bond yield outlook (first 6 years): CNB forecast (3M
Euribor) + long-run diff 1Y-3M.• US 1Y bond yield outlook (first 10 years): observed yield
curve, term premia estimates (Adrian et al., 2013)• Stock returns 6% p.a.
Macro assumptions (deterministic path)
Table 1: Equilibrium values
3M
PRIBOR Spread 3M
PRIBOR ‐ 2T REPO Inflation
Currency in
circulation growth rate
CZK/EUR yoy change
CZK/USD yoy change
3M EURIBOR Portfolio return
EUR USD
CNB forecast 3.00 0.24 2.00 5.00 ‐1.50 ‐1.50 3.50 ‐ ‐
End of convergence (or Eurozone
entry)
3.50 0.24 2.00 3.00 0.00 0.00 3.50 4.02 4.02
13
• Stylised facts
• Model of the CNB‘s balance sheet
• Stochastic simulation and median outlook
• Four policy scenarios
• Conclusions and future research
Outline
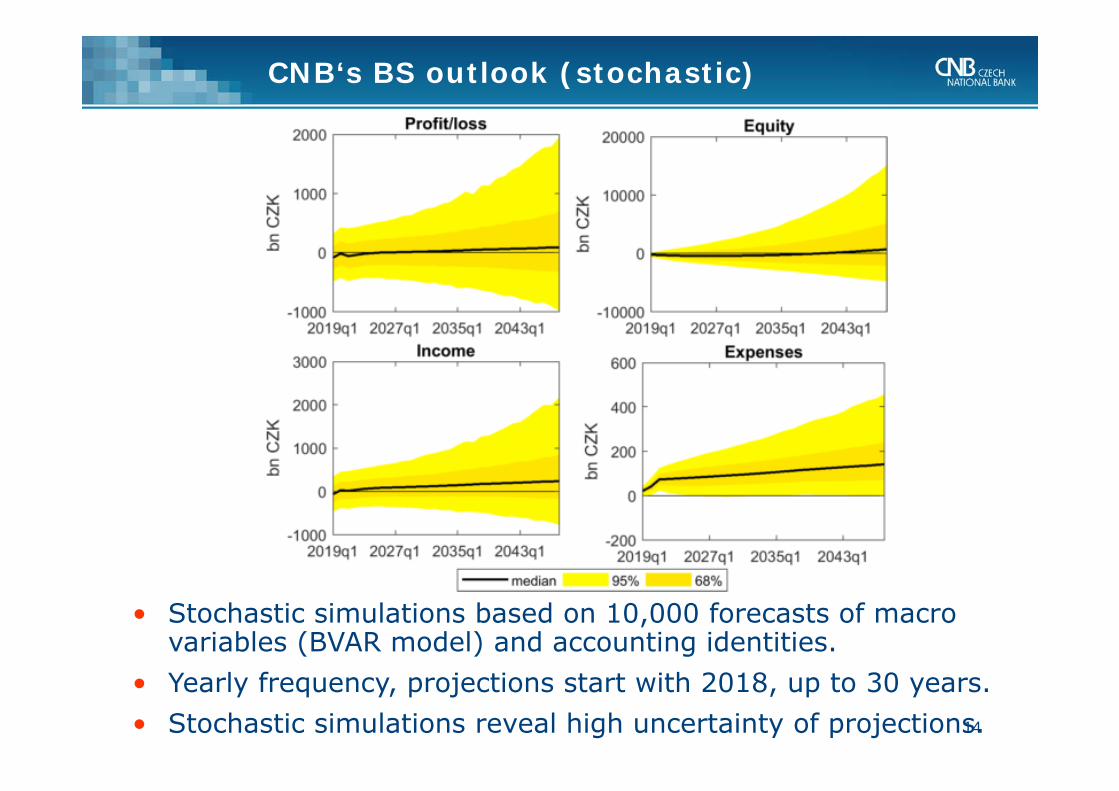
CNB‘s BS outlook (stochastic)
• Stochastic simulations based on 10,000 forecasts of macro variables (BVAR model) and accounting identities.
• Yearly frequency, projections start with 2018, up to 30 years.• Stochastic simulations reveal high uncertainty of projections. 14
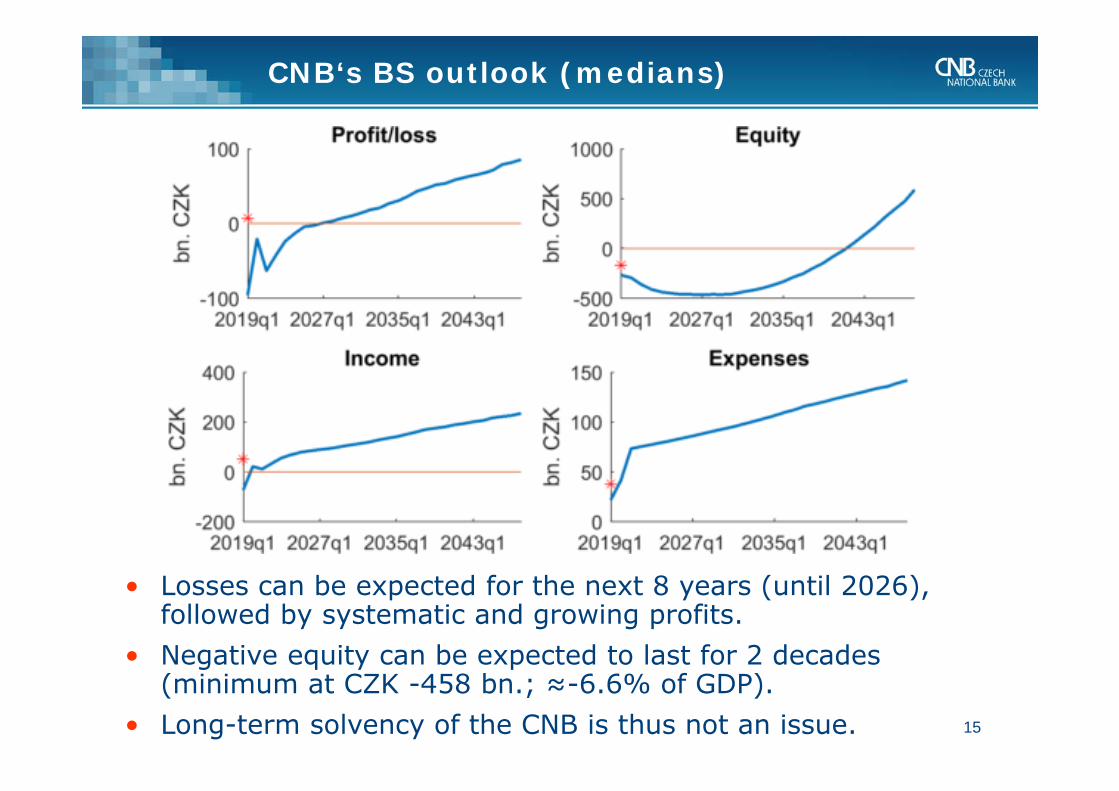
• Losses can be expected for the next 8 years (until 2026), followed by systematic and growing profits.
• Negative equity can be expected to last for 2 decades (minimum at CZK -458 bn.; ≈-6.6% of GDP).
• Long-term solvency of the CNB is thus not an issue.
CNB‘s BS outlook (medians)
15

16
• Stylised facts
• Model of the CNB‘s balance sheet
• Stochastic simulation and median outlook
• Four policy scenarios
• Conclusions and future research
Outline

Counterfactual of no ER commitment
• Assumptions: balance sheet data as of Oct 2013; domestic macro for 2013Q4-2015Q4 from Brůha and Tonner (2017); after that transition to steady-state values; foreign variables: observed values taken for 4 years, then outlooks from 2018Q1
• Equity would have remained negative until 2030, even though at a much lower absolute level than in the baseline case. 17
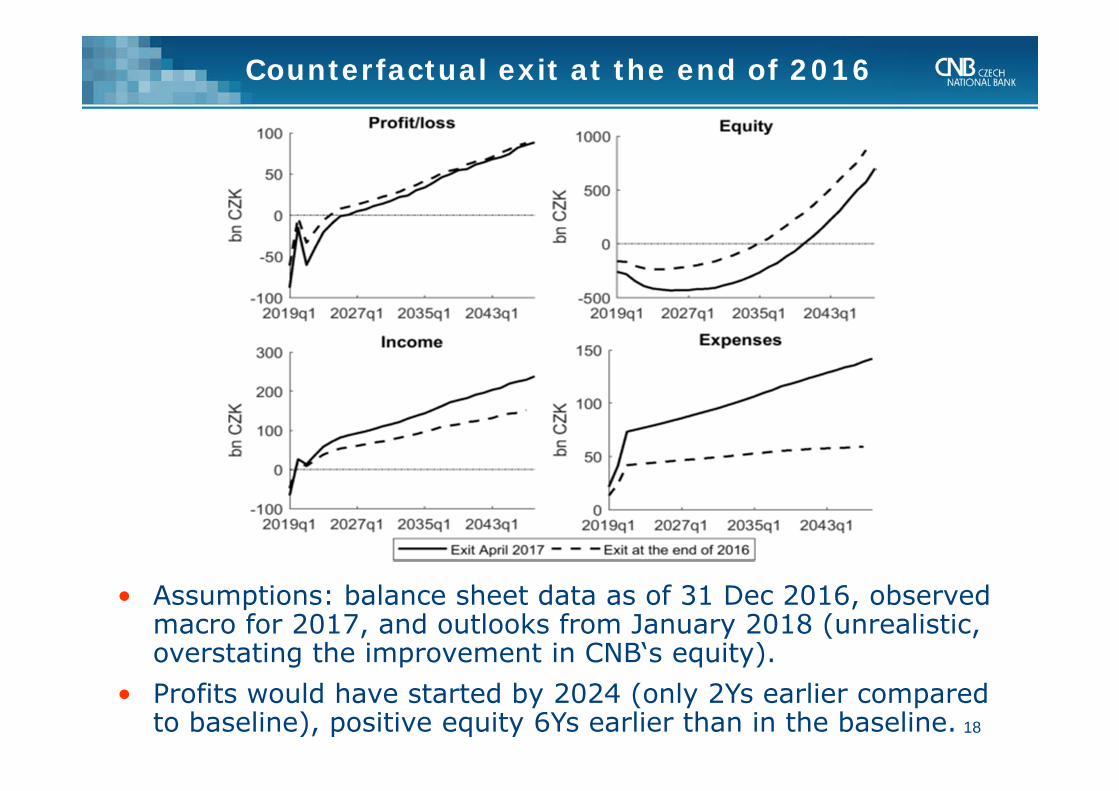
• Assumptions: balance sheet data as of 31 Dec 2016, observed macro for 2017, and outlooks from January 2018 (unrealistic, overstating the improvement in CNB‘s equity).
• Profits would have started by 2024 (only 2Ys earlier compared to baseline), positive equity 6Ys earlier than in the baseline.
Counterfactual exit at the end of 2016
18
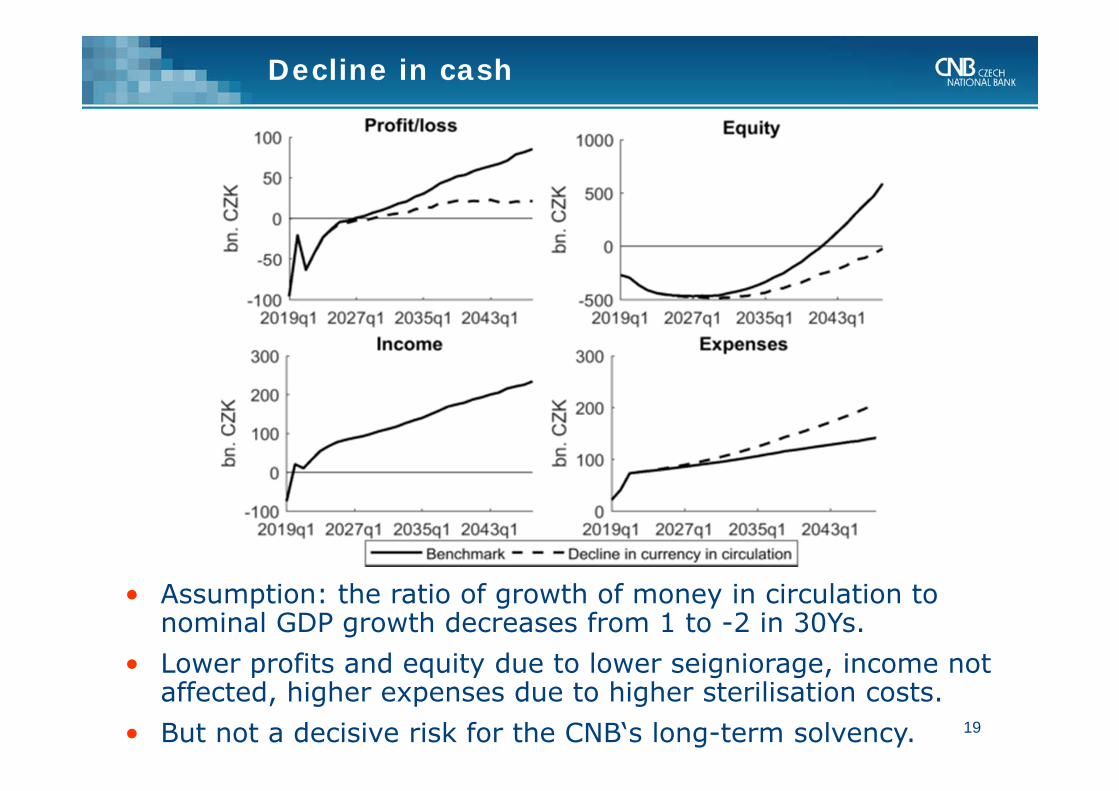
• Assumption: the ratio of growth of money in circulation to nominal GDP growth decreases from 1 to -2 in 30Ys.
• Lower profits and equity due to lower seigniorage, income not affected, higher expenses due to higher sterilisation costs.
• But not a decisive risk for the CNB‘s long-term solvency.
Decline in cash
19

• Assumption: whole income from FX reserves starts being sold after two years from the beginning of simulations.
• Assuming no effect of sales on macro variables (CZK/EUR).• No substantial effect on profits and equity.
Resumed sales of FX yields (i)
20

• Within 30 years the balance sheet size relative to GDP would decline toward the pre-ER commitment level.
• The sales of yields thus can help to manage the balance sheet size, but not to deal with the negative equity issue (even if we assume no impact on the exchange rate appreciation).
Resumed sales of FX yields (ii)
21
22
• Stylised facts
• Model of the CNB‘s balance sheet
• Stochastic simulation and median outlook
• Four policy scenarios
• Conclusions and future research
Outline
23
• The medians of stochastic projections suggest that the balance sheet evolution after the ER commitment will be qualitatively similar to the CNB‘s past experience.
• Earlier exit or no ER commitment at all would have probably not allowed CNB to distribute profits (to government) in the next 13 years anyway.
• Potential fiscal implications of the ER commitment related to CNB‘s profit distribution are thus relatively small and distant in the future.
• When assessing fiscal implications the effect on gov‘t budget through higher revenues and lower debt service costs should be taken into account.
Conclusions

24
• Asset side composition: look at projections with different ratio of stocks vs. bonds.
• Optimal size of the balance sheet: look at the projections with different starting levels/paths of capital and compare central bank ‘profits’.
Future research