fx swaps: implications for financial and economic … swaps: implications for financial and ......
TRANSCRIPT
FX Swaps: Implications for Financial and Economic Stability
Bergljot B. Barkbu and Li Lian Ong
WP/10/55

© 2010 International Monetary Fund WP/10/55 IMF Working Paper Strategy, Policy and Review Department and Monetary and Capital Markets Department
FX Swaps: Implications for Financial and Economic Stability
Prepared by Bergljot B. Barkbu and Li Lian Ong1
Authorized for distribution by Lorenzo Giorgianni and Cheng Hoon Lim
March 2010
Abstract
This Working Paper should not be reported as representing the views of the IMF. The views expressed in this Working Paper are those of the author(s) and do not necessarily represent those of the IMF or IMF policy. Working Papers describe research in progress by the author(s) and are published to elicit comments and to further debate.
The proliferation of foreign exchange (FX) swaps as a source of funding and as a hedging tool has focused attention on the role of the FX swap market in the recent crisis. The turbulence in international money markets spilled over into the FX swap market in the second-half of 2007 and into 2008, giving rise to concerns over the ability of banks to roll over their funding requirements and manage their liquidity risk. The turmoil also raised questions about banks’ ability to continue their supply of credit to the local economy, as well as the external financing gap it could create. In this paper, we examine the channels through which FX swap transactions could affect a country’s financial and economic stability, and highlight the strategies central banks can employ to mitigate market pressures. While not offering any judgment on the instrument itself, we show that the use of FX swaps for funding and hedging purposes is not infallible, especially during periods of market stress. JEL Classification Numbers: E44, F31, F32, F34 Keywords: Balance of payments, Basel Accords, capital adequacy, FX swaps, hedging, IFRS,
international reserves, ISDA. Authors’ E-Mail Address: [email protected]; [email protected]
1 The authors would like to thank Roberto Benelli, Martin Čihák, Antonio Galicia-Escotto, Patrick Iman, Cheng Hoon Lim, Donal McGettigan, Jason Mitchell and Mark Stone for their invaluable comments. Any remaining mistakes are the responsibility of the authors.

2
Contents Page
I. Introduction ............................................................................................................................4
II. Stylized Facts ........................................................................................................................5
III. Financial Stability ................................................................................................................7 A. Capital Charges under the Basel Accords ...............................................................10 B. Liquidity Risk ..........................................................................................................11 C. Transparency under International Financial Reporting Standards ..........................11
IV. Economic Stability.............................................................................................................13 A. Increased Costs of FX Funding and Hedging .........................................................13 B. External Financing Gap ...........................................................................................16 C. Exchange Rate Volatility ........................................................................................17
V. Central Bank Measures to Mitigate Risks from and Shocks to FX Swap markets .............19
VI. Concluding Remarks .........................................................................................................21
References ................................................................................................................................43 Tables A.1. Credit Conversion Factors for Potential Credit Exposure ...........................................29 A.2. Assumptions: FX Spot and Swap Rates ......................................................................30 A.3. Example: Calculation of Margin Calls on FX Swaps ..................................................38 Figures 1. Global Foreign Exchange Market Turnover, by Instrument ..........................................9 2. Global FX Swaps Turnover, by Maturity ......................................................................9 3. Global FX Swaps Turnover, by Location ......................................................................9 4. Cross-Border FX Swaps Turnover, by Counterparty ....................................................9 5. G-10 and Switzerland: Notional Amounts Outstanding of OTC Foreign Exchange
Derivatives, by Instrument .......................................................................................9 6. G-10 and Switzerland: Gross Market Values of OTC Foreign Exchange Derivatives,
by Instrument ...........................................................................................................9 7. U. S. Dollar Basis Spread on the EUR, Implied from 3-Month USD/EUR FX Swap
Contracts ................................................................................................................15 8. U. S. Dollar Basis Spread on the GBP, Implied from 3-Month USD/GBP FX Swap
Contracts ................................................................................................................15 9. U. S. Dollar Basis Spread on the JPY, Implied from 3-Month USD/JPY FX Swap
Contracts ................................................................................................................15 A.1. Advanced Countries and Major Financial Centers: FX Swaps Turnover, 2007 ..........24 A.2. Key Emerging Market Countries: FX Swaps Turnover, 2007 ....................................24 A.3. FX Spot Turnover by Currency, 2007 .........................................................................25 A.4. FX Forwards Turnover by Currency, 2007 ..................................................................25 A.5. FX Swaps Turnover by Currency, 2007 ......................................................................25
3
A.6. Notional Amounts Outstanding of OTC Foreign Exchange Derivatives, by Instrument ..............................................................................................................26 A.7. Notional Amounts Outstanding of Forwards and FX Swaps, by Counterparty ..........26 A.8. Gross Market Values of OTC Foreign Exchange Derivatives, by Instrument ............26 A.9. Gross Market Values of Forwards and FX Swaps, by Counterparty ...........................26 A.10. G-10 and Switzerland: Herfindahl Indices for All OTC Foreign Exchange Derivatives Contracts .............................................................................................26 A.11. Initial Position of Balance Sheet ..................................................................................31 A.12. Position of Balance Sheet Following FX Swap Transaction .......................................32 A.13. Position of Balance Sheet Following Sale of FX on the Spot Market .........................32 A.14. Position of Balance Sheet Following Depreciation of Local Currency .......................33 A.15. Position of Balance Sheet Following Settlement of Swap Contract with Purchase of
FX in Spot Market .................................................................................................34 A.16. Position of Balance Sheet Following Settlement of Swap Contract with Maturing
Assets .....................................................................................................................34 A.17. Position of Balance Sheet Following Forward Transaction ........................................35 Boxes 1. Some Key Features of FX Swaps ..................................................................................8 2. Margin Calls on an FX Swap Contract ........................................................................12 3. The Pricing of an FX Swap ..........................................................................................14 4. How Would Hedging and Speculation Using FX Swaps Affect the Spot Exchange
Rate? ......................................................................................................................18 5. Impact of Central Bank FX Swap Operations on Its Balance Sheet ............................20 A.1. Recording an FX Swap Transaction in the Balance of Payments ...............................41 A.2. Recording an FX Swap in the International Investment Position ................................42 Appendices I. Developments in Global FX Swap Activity ................................................................22 II. How FX Swaps Affect the Capital Adequacy Ratio ....................................................27 III. Calculation of the Credit Risk Charge for FX Swaps ..................................................28 IV. Assumptions of FX Spot and Swap Rates ...................................................................30 V. Closing a Net Open FX Position on the Balance Sheet Using FX Swaps ...................31 VI. An Illustration of How Margin Calls on FX Swaps are Calculated ............................36 VII. Recording of FX Swaps in the Balance of Payments and the International Investment Position ................................................................................................39
4
I. INTRODUCTION
The rising popularity of foreign exchange (“FX”) swaps to obtain FX funding and as a hedging instrument has raised questions about their role in macro-financial stability, in light of developments during the recent global financial crisis. The proliferation of cross-border transactions in FX swaps over time had left this market exposed to the fallout from the international liquidity crunch, despite being among the most liquid in the world. As the turmoil in international money markets spilled over into FX and currency swaps markets in the second-half of 2007, and intensified in the latter-part of 2008 following the collapse of Lehman Brothers, the impact on activity in FX swap instruments became very stark.
During this period, the turbulence in the FX swap markets was initially caused by a shortage of U.S. dollar funding among non-U.S. financial institutions.2 While these institutions were desperately trying to secure U.S. dollars to fund their operations, participants in the interbank market who had erstwhile supplied the currency were hoarding liquidity to support their own funding needs, as well as withholding lending over concerns of rising counterparty risk. The result was that many non-U.S. financial institutions had to obtain U.S. dollar liquidity through FX swap markets, causing the market to become increasingly one-sided.3 As the crisis evolved, some financial institutions with other FX liabilities, notably, the euro and Swiss franc, also faced similar funding difficulties.4 During this period, hedging activity and speculative plays via the FX swap market also increased the volatility in the FX spot market for numerous currencies.
Given the importance of banks as key dealers and users of FX instruments, and as anchors for financial stability and economic activity, disruptions in the FX market in general could have potentially far-reaching consequences.5 As evidenced during the recent crisis, stress in the FX swap market segment, in particular, gave rise to concerns in some countries over the ability of their banks to roll over their funding needs, and consequently, the supply of credit to the local economy and the financing of the balance of payments. The crisis also highlighted the role of central banks in FX swap markets.
2 See Baba and Packer (2009) for a detailed discussion on the shortage in U.S. dollar funding and the illiquidity in FX swap markets during the crisis.
3 Baba, Packer and Nagano (2008) show that the increasingly one-sided order flow during the recent crisis, which was concentrated on U.S. dollar borrowing, resulted in the shift away from covered interest parity conditions for the euro, sterling and yen vis-à-vis the U.S. dollar. Coffey, Hrung, Nguyen, and Sarkar (2009) show that the premium international institutions paid for U.S. dollar funding became persistently large and positive during the crisis, as these institutions struggled to obtain funds.
4 See Ho and Michaud (2008).
5 FX swaps and spots represent the largest transactions traded in international FX markets. FX transactions are estimated at around $4 trillion daily, with the top 10 currency traders accounting for nearly 80 percent of the total volume (www.forexrobotguides.com).
5
The objectives of this paper are twofold. We examine the channels through which FX swap transactions could (i) affect a country’s financial stability; and (ii) their impact on economic stability:
From a financial stability perspective, we show how regulatory requirements under the Basel Accords affect the charge of banks holding FX swaps for funding and/or hedging purposes. We separately demonstrate how the use of FX swaps by banks could have important implications for their liquidity positions, especially during periods of significant market volatility. We also discuss how recent accounting rules have improved the disclosure of FX swaps on banks’ balance sheets.
In economic stability terms, we consider how dislocations in the FX swap market could increase the costs of funding and hedging for banks, with consequences for their lending activity and a country’s balance of payments. FX swap transactions could also cause significant exchange rate volatility during periods of market turmoil, with potential implications for economic activity. We also present the strategies that central banks could employ in mitigating pressures in the FX swap market.
It should be emphasized here that the paper is not intended as a critique of FX swaps. Rather, the aim is to discuss the various ways in which the use of the instrument could have stability implications, in light of the financial crisis. While FX swaps were not an independent source of shock during this crisis, their widespread use in international financial markets may have amplified existing stresses.
The paper is organized as follows. The background on and key features of FX swaps are presented in Section II. Section III demonstrates the ways in which FX swaps could impact financial stability, followed by an examination of how such transactions could affect macroeconomic stability in Section IV. Section V discusses the strategies that central banks could employ to mitigate stress in the FX swap market, and Section VI concludes. The more technical information on the applications and implications of FX swaps is presented in the appendices.
II. STYLIZED FACTS
An FX swap is an agreement between counterparties to exchange one currency for another, at predetermined times, without incurring foreign exchange risk. Put another way, FX swap transactions represent the actual borrowing and lending of currencies on a collateralized basis. It enables the use of the FX market to obtain foreign currency funding, as an alternative to borrowing and lending in the eurodollar and other offshore markets (Box 1). FX swaps are widely used by banks and other financial institutions for managing liquidity and shifting delivery dates. Participants in the FX swap market often find it useful to be able to move temporarily into or out of a particular currency in exchange for another without incurring the exchange rate risk of holding an open position in the currency that they are
6
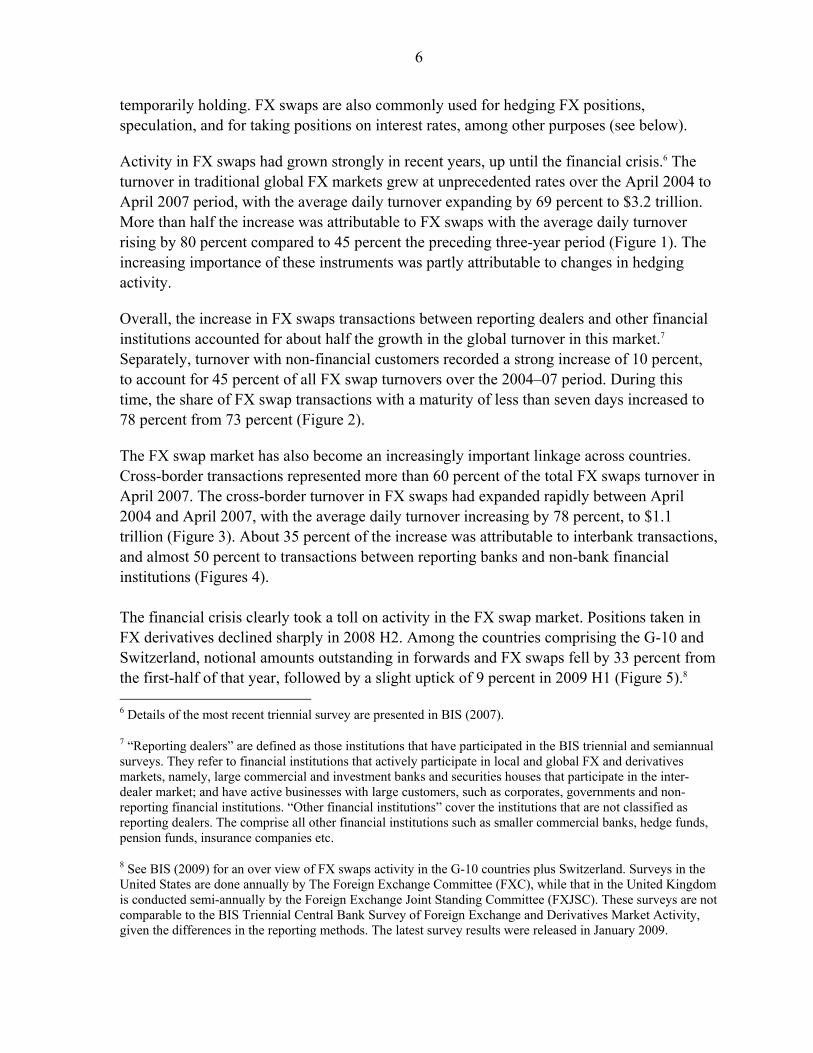
temporarily holding. FX swaps are also commonly used for hedging FX positions, speculation, and for taking positions on interest rates, among other purposes (see below).
Activity in FX swaps had grown strongly in recent years, up until the financial crisis.6 The turnover in traditional global FX markets grew at unprecedented rates over the April 2004 to April 2007 period, with the average daily turnover expanding by 69 percent to $3.2 trillion. More than half the increase was attributable to FX swaps with the average daily turnover rising by 80 percent compared to 45 percent the preceding three-year period (Figure 1). The increasing importance of these instruments was partly attributable to changes in hedging activity.
Overall, the increase in FX swaps transactions between reporting dealers and other financial institutions accounted for about half the growth in the global turnover in this market.7 Separately, turnover with non-financial customers recorded a strong increase of 10 percent, to account for 45 percent of all FX swap turnovers over the 2004–07 period. During this time, the share of FX swap transactions with a maturity of less than seven days increased to 78 percent from 73 percent (Figure 2).
The FX swap market has also become an increasingly important linkage across countries. Cross-border transactions represented more than 60 percent of the total FX swaps turnover in April 2007. The cross-border turnover in FX swaps had expanded rapidly between April 2004 and April 2007, with the average daily turnover increasing by 78 percent, to $1.1 trillion (Figure 3). About 35 percent of the increase was attributable to interbank transactions, and almost 50 percent to transactions between reporting banks and non-bank financial institutions (Figures 4). The financial crisis clearly took a toll on activity in the FX swap market. Positions taken in FX derivatives declined sharply in 2008 H2. Among the countries comprising the G-10 and Switzerland, notional amounts outstanding in forwards and FX swaps fell by 33 percent from the first-half of that year, followed by a slight uptick of 9 percent in 2009 H1 (Figure 5).8 6 Details of the most recent triennial survey are presented in BIS (2007).
7 “Reporting dealers” are defined as those institutions that have participated in the BIS triennial and semiannual surveys. They refer to financial institutions that actively participate in local and global FX and derivatives markets, namely, large commercial and investment banks and securities houses that participate in the inter-dealer market; and have active businesses with large customers, such as corporates, governments and non-reporting financial institutions. “Other financial institutions” cover the institutions that are not classified as reporting dealers. The comprise all other financial institutions such as smaller commercial banks, hedge funds, pension funds, insurance companies etc.
8 See BIS (2009) for an over view of FX swaps activity in the G-10 countries plus Switzerland. Surveys in the United States are done annually by The Foreign Exchange Committee (FXC), while that in the United Kingdom is conducted semi-annually by the Foreign Exchange Joint Standing Committee (FXJSC). These surveys are not comparable to the BIS Triennial Central Bank Survey of Foreign Exchange and Derivatives Market Activity, given the differences in the reporting methods. The latest survey results were released in January 2009.

7
However, significant price movements resulted in sharp variations in gross market values, with forwards and FX swaps doubling to $1.6 trillion in the second-half of 2008 trillion, then almost halving again to $870 billion in 2009 H1 (Figure 6).9
III. FINANCIAL STABILITY
Policymakers have long recognized the riskiness of banks’ FX activities, which tends to heighten during periods of increased volatility in exchange rates. Indeed, the Basel Committee on Banking Supervision (BCBS) had noted some time ago that, “…there are few [activities] in which a bank may so quickly incur large losses as in foreign exchange transactions” (BCBS, 1980). The BCBS further stated that supervisors needed to be vigilant so that the risks from banks’ FX operations never became so large as to threaten their solvency and liquidity, and potentially, the health and stability of the entire banking system.
The promulgation of international standards and regulations attempts to capture the risks posed by the use of FX instruments, and to ensure greater transparency in their disclosure. They include the application of the Basel Accords (Basel I and Basel II), as well as the International Financial Reporting Standards (IFRS). Participants in the market for OTC FX derivatives, among other derivatives instruments, also enter into standardized International Swaps and Derivatives Association (ISDA) contracts with their counterparties, which include provisions for mitigating credit risk.10 In this section, we focus on the risks associated with the use of FX swaps in particular.
9 Gross market values, which measure the cost of replacing all existing contracts, represent a better measure of market risk than notional amounts.
10 ISDA creates industry standards for derivatives and provides legal definitions of terms used in contracts. The ISDA Master Agreement, a bilateral framework agreement, contains general terms and conditions (such as provisions relating to payment netting, tax gross-up, basic covenants, events of default and termination) but does not, by itself, include details of any specific derivatives transactions the parties may enter into. It cannot be amended, except for adding in the names of the parties. However, it also has a separately produced Schedule in which the parties are required to select certain options and may modify sections of the Agreement. Details of individual derivatives transactions are included in Confirmations entered into by the parties to the Agreement; each Confirmation relates to a specific transaction and sets out the agreed commercial terms of that transaction. The Agreement and all the Confirmations entered into under it form a single agreement. The Agreement also provides for the mitigation of credit risk by parties to the contract, by requiring the counterparty which is “out-of-the-money’ to post collateral (usually cash, government securities or highly rated bonds) amounting to that which would be payable by that counterparty were all the outstanding transactions under the relevant Agreement to be terminated. This is typically included as a credit support annex. Collateral other than cash is usually discounted for risk, i.e., the party posting collateral would have to do so in excess of the potential settlement amount.

8
Box 1. Some Key Features of FX Swaps1 The FX swap is a standard instrument that is traded in the over-the-counter (OTC) market. An FX swap has two separate legs settling on two different dates; it provides for one exchange and one re-exchange only (and is not a stream of payments), i.e., one currency is swapped for another for a period of time, and then swapped back. The deal date is the date on which the two counterparties enter into the FX swap contract. The deal date is also referred to as the contract date. The value dates are the dates on which the currencies are exchanged and re-exchanged. Counterparties agree to exchange two currencies at a particular rate on one value date (the “near date” or the “spot value date”) and to reverse payments, almost always at a different rate, on a specified subsequent value date (the “far date”). If both value dates are less than one month from the deal date, it is known as a “short-dated swap”; if one or both value dates are one month or more from the deal date, it is a “forward swap.” The two legs of an FX swap can, in principle, be attached to any pair of value dates. In practice, a limited number of standard maturities account for most FX swap transactions. The first leg usually occurs on the spot value date, and for about three-quarters of all FX swaps the second leg occurs within a week; however, there are also FX swaps with longer maturities of up to several years. Among dealers, most of these are arranged for even or straight dates—e.g., one week, one month, three months—but odd or broken dates are also traded for customers. The cost of an FX swap is determined by the interest rate differential between the two swapped currencies. As with outright forwards, arbitrage and the principle of covered interest rate parity operate to make the cost of an FX swap equal to the FX value of the interest rate differential between the two currencies for the period of the swap (instances of deviations from covered interest parity are discussed later in this paper). The cost of the FX swap transaction is measured in swap points, such that:
11
1///
FX
DCFXDCFXDCFXDC
r
rssf ,
where f is the forward rate, s is the spot rate, r is the interest rate and DC/FX represents quotes in domestic currency per unit of foreign currency. Thus when DCr rises, the swap points for borrowing domestic
currency increases. The counterparty that holds the currency that pays the higher interest rate for the period of the swap will pay the points, neutralizing the interest rate differential and equalizing the return on the two currencies, while the counterparty that holds the currency that pays the lower interest will earn or receive the points. At the outset of the transaction, the present value of the FX swap contract is always zero (excluding the transaction cost). The objective for utilizing an FX swap may be different from that for an outright forward. The latter is typically used to manage the risk inherent in currency markets by enabling the rate and date on which a given amount of FX will be purchased or sold. Although FX swaps are also used to hedge FX exposures—and the FX swap market tends to be much more liquid than the forward market—the most common use of FX swaps is for institutions to fund their foreign exchange balances. The FX swap differs from the interest rate swap, which provides for an exchange of a stream of interest payments in the same currency but with no exchange of principal; it also differs from the currency swap, in which counterparties exchange and re-exchange principal and streams of fixed or floating interest payments in two different currencies. 1 See, for example, http://www.forexhound.com for a more detailed exposition on the mechanics of FX swaps.

9
Figure 1. Global Foreign Exchange Market Turnover, by Instrument 1/ (In billions of U.S. dollars)
Figure 2. Global FX Swaps Turnover, by Maturity 1/
(In billions of U.S. dollars)
0
500
1,000
1,500
2,000
2,500
3,000
3,500
1995 1998 2001 2004 2007
Spot Forwards FX swaps Estimated gaps in reporting
0
200
400
600
800
1,000
1,200
1,400
1,600
1,800
1995 1998 2001 2004 2007
FX swaps up to 7 days FX swaps over 7 days
Figure 3. Global FX Swaps Turnover, by Location 1/
(In billions of U.S. dollars)
Figure 4. Cross-Border FX Swaps Turnover, by Counterparty 1/
(In billions of U.S. dollars)
0
500
1,000
1,500
2,000
1995 1998 2001 2004 2007
Local Cross-border
0
300
600
900
1,200
1995 1998 2001 2004 2007
With reporting dealers With other financial institutions With non-financial customers
Figure 5. G-10 and Switzerland: Notional Amounts Outstanding of OTC Foreign Exchange Derivatives, by Instrument
(In billions of U.S. dollars)
Figure 6. G-10 and Switzerland: Gross Market Values of OTC Foreign Exchange
Derivatives, by Instrument (In billions of U.S. dollars)
0
10,000
20,000
30,000
40,000
50,000
60,000
70,000
Jun-
98
Dec
-98
Jun-
99
Dec
-99
Jun-
00
Dec
-00
Jun-
01
Dec
-01
Jun-
02
Dec
-02
Jun-
03
Dec
-03
Jun-
04
Dec
-04
Jun-
05
Dec
-05
Jun-
06
Dec
-06
Jun-
07
Dec
-07
Jun-
08
Dec
-08
Jun-
09
Forwards and forex swaps Currency swaps Options
0
500
1,000
1,500
2,000
2,500
3,000
3,500
4,000
Jun-
98
Dec
-98
Jun-
99
Dec
-99
Jun-
00
Dec
-00
Jun-
01
Dec
-01
Jun-
02
Dec
-02
Jun-
03
Dec
-03
Jun-
04
Dec
-04
Jun-
05
Dec
-05
Jun-
06
Dec
-06
Jun-
07
Dec
-07
Jun-
08
Dec
-08
Jun-
09
Forwards and forex swaps Currency swaps Options
Source: Bank for International Settlements. 1/ Amounts are the daily average in April of each year.

10
A. Capital Charges under the Basel Accords
A bank’s capital adequacy ratio is derived from regulatory capital and risk-weighted assets. Under the Basel Accords, risk weights are applied to the assets on a bank’s balance sheet (risk-weighted assets) in order to calculate the appropriate capital charges, and thus, determine if a bank is adequately capitalized.11 The use of FX swaps by banks would incur a capital charge for credit risk, but reduce the capital requirements for market risk.
Credit risk FX swaps carry a capital charge for credit risk. Under the Basel Accord, a “credit exposure” for derivatives such as swaps, forwards and options on currency, interest rate, equity and commodity products would be calculated as the sum of the current net replacement value (NRV) plus an add-on component that is supposed to capture future exposure, depending on the tenor and type of contract (Jorion, 2009).12 Counterparty risk weights are then applied to the credit exposure to derive the credit risk charge.13
Market risk FX swaps could be applied to reduce banks’ market risk from existing FX positions. In general, FX positions taken by banks could require capital charges for market risk under Basel II. Specifically, there is a capital charge for FX risk, under Pillar I on Minimum Capital Requirements, so that banks which hold overall net open FX positions on their balance sheets will be subject to a capital charge of 8 percent of the overall net open positions.14 15 Thus, banks have significant incentive to close such exposures through hedge transactions,
11 See Appendix II for a derivation of the capital adequacy ratio and the potential impact of FX swaps.
12 See Appendix III for details on the calculation of capital charges for credit risk associated with FX swaps.
13 Under Basel II, there are three approaches to determining the credit risk weights. They are: (i) the Standardized Approach, which is an extension of Basel I, but with finer classification of categories for credit risk, based on external credit ratings; the 50 percent risk weight cap on derivatives is also removed; (ii) the Foundation International Ratings-Based Approach, where banks estimated the probability of default and supervisors supply other inputs; and (iii) the Advanced Internal Ratings-Based Approach, where banks can supply both the estimated probability of default and other inputs as well. Basel II also takes into account credit risk mitigation techniques, such as collateralization, third-party guarantees, credit derivatives, and netting.
14 See BCBS (2006).
15 Net open short or long currency positions can lead to sizeable losses when exchange rates are volatile, and capital thus needs to be held to cover such open positions.

11
commonly using FX swaps.16 In other words, banks’ use of FX swaps for hedging purposes, despite incurring credit risk, could help to reduce capital charges for market risk.
B. Liquidity Risk
The use of FX swaps could increase the liquidity risk for banks. A bank that is perfectly hedged in terms of its FX exposure would still be exposed to liquidity movements arising from that hedge. Specifically, marking-to-market under ISDA agreements between counterparties—while decreasing credit risk—may instead create liquidity risk (Jorion, 2007). The practice requires more frequent collateral payments as contracts need to be valued on a regular basis and cash exchanged with the counterparty through the margin call process (Box 2).17 Thus, variations in the fair value of an FX swap could potentially drain the bank’s liquidity in volatile market conditions.
Margin calls by a swap counterparty may be triggered in the event of a sharp depreciation of the domestic currency resulting in a large fair value adjustment (FVA). In a situation where the spot domestic currency exchange rate experiences a persistent weakening trend, which places pressure on the corresponding forward rate, margin calls by the counterparty would continue. Any sustained outflow of liquidity from the bank could get to a point where the bank may no longer be able to meet its short-term cash flow obligations and is ultimately faced with a solvency problem.
C. Transparency under International Financial Reporting Standards
In the International Financial Reporting Standards (IFRS), the International Accounting Standard IAS 39 is the main standard for derivatives, and therefore applies to the accounting of FX swaps. The standard prescribes principles for recognizing and measuring financial assets, financial liabilities and contracts for non-financial items, including financial derivatives.18 Traditionally, financial derivatives were accounted for using historical cost accounting. Given that there is usually no initial cost attached to financial derivatives, their presentation in financial statements would usually be in the form of a note to the accounts, which would not fully reveal a company’s real exposures. However, IAS 39 brings derivatives onto financial statements, thus increasing the transparency of exposures.
16 See Appendix IV for assumptions of FX spot and swap rates used in all numerical examples presented in this paper; and Appendix V for an accounting example of how FX swaps could be applied to close a net open FX position.
17 See Appendix VI for an illustration of how margin calls on an FX swap contract could occur.
18 IAS 39.9 defines a derivative as a financial instrument that derives its value from an underlying price or index. Derivatives could be divided into three main categories: (i) forward (futures) contract; (ii) swap; and (iii) option.

12
Box 2. Margin Calls on an FX Swap Contract
FX swaps are bilateral, or OTC, in nature in that they are contractual arrangements between two counterparties. As such, it creates potentially significant counterparty risks in that if one party defaults under the swap agreement, the other could suffer huge losses. These risks typically have very low probability of realization for instruments that trade in a centrally cleared market, where an adequately capitalized clearinghouse assumes the counterparty risk which is mitigated by the posting of initial collateral by participants with the clearinghouse, and the meeting of maintenance margin requirements. In OTC derivatives markets, counterparties may initially trade up to an agreed threshold of exposure (“margin threshold”), and then one counterparty may make a margin call when the amount of its exposure to the other counterparty exceeds the threshold. In order to avoid constant margin calls back and forth, FX swap counterparties in most cases establish a mutually agreed upon margin threshold. The margin threshold is determined on a counterparty by counterparty basis, and is typically based on the credit ratings of the individual parties. FX swaps are typically conducted under some form of negotiated master swap agreement, such as that published by ISDA, which contains an exposure threshold mechanism that allows for the collateralization of counterparty exposures beyond a certain level. However, the potential exists for significant future counterparty exposure in the event of a sharp deterioration in the creditworthiness of one or both counterparties from the time the threshold is negotiated. A margin call is made by a counterparty when its FX swap position is “in the money,” i.e., when the position of the other party is “out of the money.” The margin is collateral that the holder of the out-of-the-money position in the swap contract has to deposit to cover its credit risk. In other words, the swap counterparty who is out-of-the-money must provide a certain level of margin or collateral in case of default. For the counterparty who is in-the-money, the receipt of the margin or collateral would reduce credit risk. The collateral can be in the form of cash or securities, and it is deposited in a margin account. The amount of the collateral is calculated as the difference between the contracted forward exchange rate which must be paid out upon the maturity of the swap contract and the forward exchange rate on the agreed-upon day at which the contract is marked-to-market (e.g., on a fortnightly basis, or on the last day of every month for the duration of the contract), discounted using the market-determined interest rate over that time period to arrive at the net present value, and less the margin threshold. Swap exposures cannot be netted across counterparties (although it may be netted within the same counterparty), which prevents margin calls from being offset across counterparties. For example, say a bank has a negative swap exposure to one counterparty and a positive swap exposure to another counterparty. If the first counterparty is entitled to make a margin call on the bank, it could not instead choose to make a margin call on the other counterparty to the bank. The outcome may be that the bank’s working capital is tied up (if it cannot make a margin call of equivalent amount on the other counterparty) even if its net market exposure turns out to be zero across both counterparties, thus creating a drain on its liquidity.
IAS 39 abolishes the common accounting practice for synthetic instruments which nets hedges in the balance sheet and presents the hedged item and hedge instrument as a single item. Further, all derivatives instruments must be carried at fair value on the balance sheet,

13
for example, through marking-to-market.19 Any change in the fair value should be recognized in the profit and loss statement (and ultimately, the retained earnings item in the balance sheet), that is, by making an FVA. Gains and losses from a hedging instrument cannot be offset against gains and losses in the value of the hedged item.
FX swaps are carried on the balance sheet at fair value. On the day the FX swap is transacted, its fair value is likely to be zero.20 On balance sheet date, the value at which the FX swap reported in the balance sheet may be positive (if the swap is in-the-money and an asset), negative (if the swap is out-of-the-money and a liability) or, possibly zero. The main factor that would cause the fair value of the swap to vary from its assumed initial zero value is the movement in the forward rate relative to the contracted forward exchange rate of the transaction. Upon settlement of the swap contract, the item becomes realized―it is closed out at transaction value and, by definition, drops out of mark-to-market.
IV. ECONOMIC STABILITY
A well-functioning FX swap market tends to support macroeconomic and external stability by allocating FX liquidity in an efficient manner, and reducing the volatility of the spot exchange rate. However, during periods of stress in financial markets, spillovers to the FX swap market could result in illiquidity and significantly increase transaction costs. Consequently, an external financing gap may arise, creating pressure on a country’s currency. In order to mitigate the effects of financial stress and to limit the impact on the real economy, central banks may provide FX swap facilities to market participants.
A. Increased Costs of FX Funding and Hedging
A high reliance on funding through FX swaps could result in severe liquidity shortages during turbulent periods, and consequently, a rise in funding costs (Box 3). During the recent crisis, for example, U.S. dollar funding became scarce, making it increasingly costly to obtain U.S. dollars through FX swaps with the euro, the pound sterling and the Japanese yen (Figures 7–9).21 Prior to August 2007, the U.S. dollar “basis” was close to zero. However, in late-2007, the spread between the two widened, implying a market-based U.S. dollar funding rate that is higher than U.S. dollar LIBOR, i.e., investors had to pay a premium to obtain U.S. dollars in the FX swap market. Furthermore, counterparties who were concerned about liquidity constraints became increasingly reluctant to lend FX over longer periods, leading to a sharp shortening of FX swap maturities and increasingly costly rollover activity.
19 IAS 39 defines fair value as the amount for which an asset could be exchanged, or a liability settled, between knowledgeable, willing parties in an arm’s length transaction.
20 Exceptions occur when the assessment of fair value and tradable value (e.g., off-market trades) are different.
21 The calculation of the FX-swap implied interest rates and its spread vis-à-vis the lending rate is based on the methodology laid out in the technical appendix of Coffey, Hrung, Nguyen and Sarkar (2009).

14
More costly FX swaps can lead to further FX funding strains for banks, which could then impair macroeconomic stability through several channels. First, hedging an existing balance sheet position becomes more expensive for the bank. If the bank cannot hedge an open position, it would incur a regulatory charge on capital (see above). The bank could alternatively decide to shrink its balance sheet position, which could translate into a liquidity squeeze on the domestic economy. Second, obtaining FX funding becomes more expensive, potentially increasing the cost of credit to the economy. Third, an increase in perceived counterparty risk may require lower margin thresholds, and any subsequent margin calls would directly reduce the liquid assets available to the bank that is out-of-the-money, further reducing its ability to provide credit to the economy.
Box 3. The Pricing of an FX Swap
Coffey, Hrung, Nguyen, and Sarkar (2009) provide a concise exposition on the pricing of an FX swap under normal market conditions. The authors use the example of a European investor who is interested in investing euro for three months. The investor has two options: (i) Invest the money in the unsecured euro cash market for three months at the prevailing euro-
denominated interest rate; or (ii) Convert the euro into U.S. dollars through a three-month FX swap and invest the dollars for three
months at the prevailing dollar-denominated interest rate, for example, by purchasing and holding a three-month U.S. Treasury bill. After three months, the investor collects the final payout from the Treasury bill and concludes the FX swap by trading the dollars back for euro.
In an efficient market, these two strategies must provide equal returns at the end of three months. Otherwise, arbitrage would ensure that the less costly option/higher return option is exploited until the two returns are equalized once again. Put another way, the U.S. dollar “basis spread” on another currency is the premium paid by international institutions to obtain dollars in the FX swap market. It is defined as the dollar-denominated interest rate implied from an FX swap with another currency minus a benchmark unsecured U.S. dollar-denominated lending rate such as U.S. dollar LIBOR. Assuming a no-arbitrage condition and using data on the euro-dollar spot and forward rates, as well as the euro LIBOR as a proxy for the European interest rate—the U.S. dollar interest rate implied by euro-dollar FX swaps could be derived. The U.S. dollar basis vis-à-vis the euro would then be calculated as follows:
U.S. dollar basis spread on the euro = Implied FX swap U.S. dollar interest rate – benchmark U.S. dollar interest rate.1
During normal times, the U.S. dollar basis spread on another currency should hover around zero for the major, very liquid currencies. However, during the recent global financial crisis, FX swap-implied U.S. dollar funding rates significantly exceeded the dollar-denominated interest rate on several occasions, when demand for the U.S. dollar far outstripped its supply, even against the major currencies. 1 Depending on the tenor of the FX swap rate and U.S. dollar interest rate used in the calculation, the derived U.S. dollar basis rate would apply to the same tenor term loan.

15
Figure 7. U. S. Dollar Basis Spread on the EUR, Implied from 3-Month USD/EUR FX Swap Contracts (In basis points)
0
200
400
600
800
Jan-00 Jun-07 Dec-07 May-08 Nov-08 Apr-09 Oct-09
-100
0
100
200
300
400
U.S. dollar LIBOR rate
U.S. dollar interest rate implied by USD/EUR FX swaps
U.S. dollar basis spread (RHS)
Figure 8. U. S. Dollar Basis Spread on the GBP, Implied from 3-Month USD/GBP FX Swap Contracts (In basis points)
0
200
400
600
800
Jan-00 Jun-07 Dec-07 May-08 Nov-08 Apr-09 Oct-09
-100
0
100
200
300
400
U.S. dollar LIBOR rate
U.S. dollar interest rate implied by USD/GBP FX swaps
U.S. dollar basis spread (RHS)
Figure 9. U. S. Dollar Basis Spread on the JPY, Implied from 3-Month USD/JPY FX Swap Contracts (In basis points)
0
200
400
600
800
Jan-00 Jun-07 Dec-07 May-08 Nov-08 Apr-09 Oct-09
-100
0
100
200
300
400
U.S. dollar LIBOR rate
U.S. dollar interest rate implied by USD/JPY FX swaps
U.S. dollar basis spread (RHS)
Sources: Bloomberg; and authors’ calculations.

16
B. External Financing Gap
A dysfunctional FX swap market could impair the external stability of a country by creating a financing gap in the Balance of Payments (“BoP”).22 Such a gap could manifest if domestic financial institutions’ demand for external financing through FX swaps is higher than the external supply, a situation that could arise during periods of market stress. The increasing degree of cross-border integration of FX swap markets in recent years (see above) suggests that the potential impact on a country’s external financing needs from disruptions to this market could be significant.
A financing gap in the BoP could materialize in several ways:
In a situation where domestic financial institutions transact with foreign counterparties in FX swaps, any shortening of maturities as a result of concerns about rising counterparty risk essentially front-loads rollover requirements. This, combined with higher costs of using FX swaps would increase the institutions’ external financing needs. Consequently, those financial institutions may find it difficult to meet their rollover requirements and may be forced to close out their FX swap positions and repay their FX obligations. Financial institutions may need to purchase FX in the spot market, placing pressure on the domestic currency. The outcome would be similar where domestic financial institutions transact with foreign counterparties, who rely on FX swaps themselves to fund carry trade plays.
Alternatively, if foreign counterparties are constrained for liquidity or are concerned about counterparty risk, they may decide to cut their exposures to FX swaps and in doing so, reduce the overall external financing available to the country, and thus increase its external financing gap.
Margin calls could also create an external financing gap. If domestic financial institutions or corporates have to honor the margin calls on their FX swap contracts with foreign counterparties, such payments would result in outflows in the country’s financial account. From a macroeconomic perspective, the aggregate outflow could be substantial since margin calls are typically linked to factors such as exchange rate depreciation, which could affect many domestic institutions simultaneously.
The adjustment required to close the external financing gap could have wide-ranging macroeconomic implications. It could create pressure on the exchange rate or the central bank’s international reserves, depending on the country’s exchange rate regime. It could also squeeze FX liquidity in the domestic economy, affecting trade and other economic activity.
22 Appendix VII describes how FX swap transactions affect a country’s BoP.

17
C. Exchange Rate Volatility
A competitive and liquid FX swap market typically helps to smooth any volatility in the exchange rate, as it enables market participants to manage their FX risks and access short-term FX funding. However, FX swap transactions could potentially act to magnify volatility in illiquid markets or during stressful periods. This can occur as a result of either hedging or speculative transactions (Box 4). Market participants who enter into FX swap transactions for hedging purposes typically have open FX positions which they may want to close as part of their risk management strategy; speculators may represent one of the possible counterparties on the other side of these transactions. Such activity in increasingly illiquid markets has the potential to cause volatility in the exchange rate, if they are sufficiently large.
Volatile exchange rates could potentially affect various aspects of economic activity. They generally make economic decisions more difficult because of the increase in exchange rate risk. While the evidence to date has not been conclusive, some empirical findings suggest links to growth, investment, and trade. For instance, Aghion, Bacchetta, Ranciere and Rogoff (2008) find a negative impact from exchange rate volatility on growth in countries with less developed financial sectors, while Furceri and Borelli (2008) show that exchange rate volatility has a negative effect on foreign direct investment in economies with a high level of openness. Clark et. al (2004) note that some of the empirical evidence points to a negative relationship between exchange rate volatility and trade, but that the effect appears fairly small and is by no means robust and universal.
Exchange rate volatility could also complicate monetary policy decisions. Recent empirical evidence points to a positive pass-through of exchange rates to inflation, both in emerging-market and advanced economies (Ca’ Zorzi, Hahn and Sánchez, 2007). Devereux and Yetman (forthcoming) and Choudhri and Hakura (2006) also find evidence of a positive pass-through effect, but suggest that a lower inflationary environment leads to lesser exchange rate pass-through.
Greater exchange rate volatility could also increase the indirect credit risk for the banking system through unhedged borrowers. For example, in several Central and Eastern European countries, firms and households had taken out foreign currency loans prior to the financial crisis to benefit from lower foreign interest rates, relative to those for domestic currency loans.23 If shocks to the economy are accompanied by exchange rate depreciation, the borrowers may have to service rising debts in domestic currency terms. This could lead to a worsening in banks’ asset quality arising from a deterioration in borrowers’ ability to repay their debt.
23 See, for instance, Rosenberg and Tirpák (2008) and Box 2.2 in IMF (2009).
18
Box 4. How Would Hedging and Speculation Using FX Swaps Affect the Spot Exchange Rate?
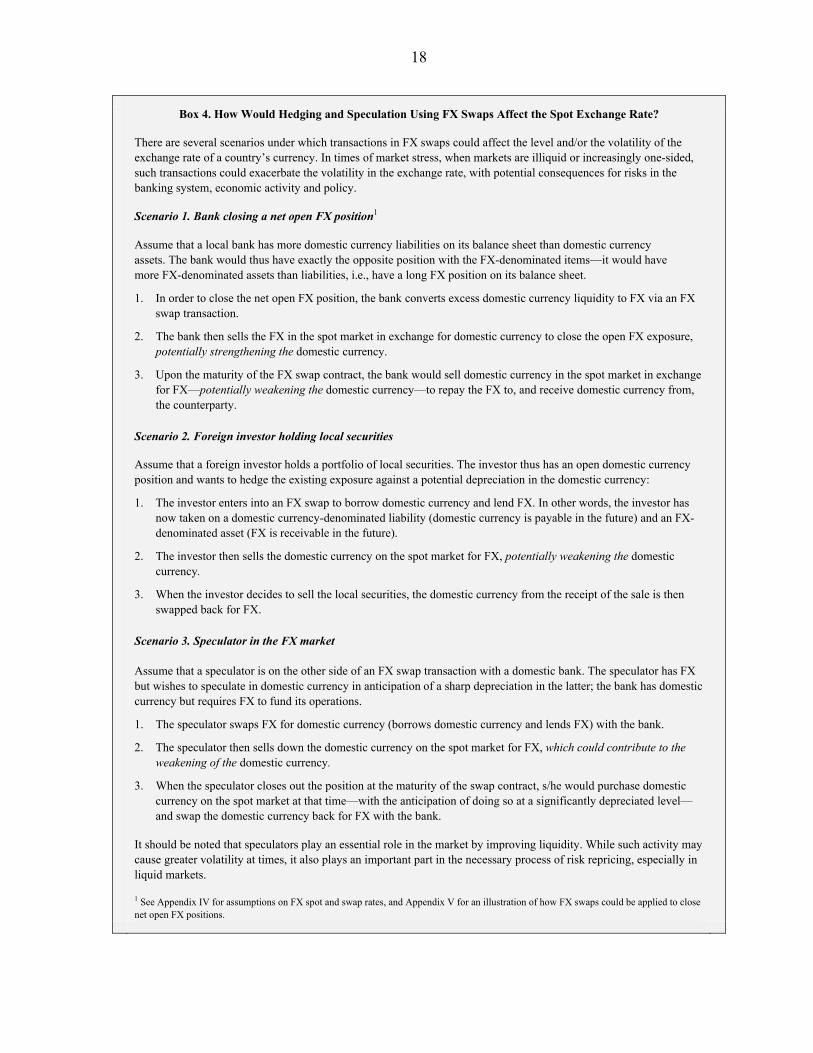
There are several scenarios under which transactions in FX swaps could affect the level and/or the volatility of the exchange rate of a country’s currency. In times of market stress, when markets are illiquid or increasingly one-sided, such transactions could exacerbate the volatility in the exchange rate, with potential consequences for risks in the banking system, economic activity and policy.
Scenario 1. Bank closing a net open FX position1
Assume that a local bank has more domestic currency liabilities on its balance sheet than domestic currency assets. The bank would thus have exactly the opposite position with the FX-denominated items—it would have more FX-denominated assets than liabilities, i.e., have a long FX position on its balance sheet.
1. In order to close the net open FX position, the bank converts excess domestic currency liquidity to FX via an FX swap transaction.
2. The bank then sells the FX in the spot market in exchange for domestic currency to close the open FX exposure, potentially strengthening the domestic currency.
3. Upon the maturity of the FX swap contract, the bank would sell domestic currency in the spot market in exchange for FX—potentially weakening the domestic currency—to repay the FX to, and receive domestic currency from, the counterparty.
Scenario 2. Foreign investor holding local securities
Assume that a foreign investor holds a portfolio of local securities. The investor thus has an open domestic currency position and wants to hedge the existing exposure against a potential depreciation in the domestic currency:
1. The investor enters into an FX swap to borrow domestic currency and lend FX. In other words, the investor has now taken on a domestic currency-denominated liability (domestic currency is payable in the future) and an FX-denominated asset (FX is receivable in the future).
2. The investor then sells the domestic currency on the spot market for FX, potentially weakening the domestic currency.
3. When the investor decides to sell the local securities, the domestic currency from the receipt of the sale is then swapped back for FX.
Scenario 3. Speculator in the FX market Assume that a speculator is on the other side of an FX swap transaction with a domestic bank. The speculator has FX but wishes to speculate in domestic currency in anticipation of a sharp depreciation in the latter; the bank has domestic currency but requires FX to fund its operations.
1. The speculator swaps FX for domestic currency (borrows domestic currency and lends FX) with the bank.
2. The speculator then sells down the domestic currency on the spot market for FX, which could contribute to the weakening of the domestic currency.
3. When the speculator closes out the position at the maturity of the swap contract, s/he would purchase domestic currency on the spot market at that time—with the anticipation of doing so at a significantly depreciated level—and swap the domestic currency back for FX with the bank.
It should be noted that speculators play an essential role in the market by improving liquidity. While such activity may cause greater volatility at times, it also plays an important part in the necessary process of risk repricing, especially in liquid markets.
1 See Appendix IV for assumptions on FX spot and swap rates, and Appendix V for an illustration of how FX swaps could be applied to close net open FX positions.

19
V. CENTRAL BANK MEASURES TO MITIGATE RISKS FROM AND SHOCKS TO FX SWAP
MARKETS
FX swap facilities are standard liquidity management instruments that could be utilized by a central bank for various purposes. Their use represents an open market operation—where the central bank acts as a counterparty to domestic financial institutions (or corporations)—to control liquidity in the system, manage the international reserves of the central bank, or to smooth disorderly fluctuations in the exchange rate. In the event of a shock to FX swap markets, a central bank has several tools at its disposal to address FX funding shortages and any resulting pressure on the exchange rate. It may raise interest rates, to try to attract investors; it may intervene by conducting outright sales of foreign reserves to help meet the funding need and alleviate the pressure on the exchange rate; it may also use existing foreign exchange reserves for FX swap operations with market counterparties.24
From a balance sheet perspective, the provision of FX liquidity through FX swaps could result in either a temporary or permanent drawdown of the liquid FX assets of a central bank. The reduction in FX assets would typically be offset by an increase in FX assets receivable in the future, through a claim on the counterparty arising at the settlement of the FX swap (Box 5). Given the covered nature of FX swap transactions, the central bank would normally not assume any of the underlying FX risk. However, the drawdown of liquid reserve assets associated with the transaction could be permanent if the swap counterparty defaults. Conversely, FX spot sales would permanently draw down a central bank’s reserves.
FX swaps were used as a crisis management tool during the recent crisis. Central banks used FX swap facilities extensively to increase FX liquidity in the system when domestic institutions were faced with FX funding shortages. In situations where domestic financial institutions were unable to roll over their existing FX swaps, central banks’ facilities substituted as counterparties to the private sector. Where reserves in the required foreign currencies were insufficient or (liquid) reserves were limited in those currencies, swap lines with the central banks issuing the foreign currencies in shortage were established to backstop losses of liquid reserves.
The major central banks coordinated their actions to mitigate the transmission of shocks through the global FX swap market and ensure FX liquidity.25 The U.S. Federal Reserve and the European Central Bank opened swap lines with each other and with various other countries amid substantial dollar and euro shortages in December 2007, and at various points
24 Stone, Walker and Yasui (2009) examine the effectiveness of the foreign exchange liquidity providing measures of the Banco Central do Brasil in response to market stresses during the financial crisis.
25 See the report by the Committee on the Global Financial System (CGFS) on central bank actions to address pressures in funding markets and the results of those actions (CGFS, 2008).

20
Box 5. Impact of Central Bank FX Swap Operations on Its Balance Sheet
FX swaps which are executed for monetary policy purposes affect central banks’ balance sheets. Such operations consist of simultaneous spot and forward transactions in the domestic currency (“DC”) against foreign currency. If the central bank wants to absorb domestic currency liquidity from the market and provide FX liquidity at the same time, it will borrow domestic currency and lend FX. Conversely, if it wants to provide domestic currency liquidity and absorb foreign currency, it would lend domestic currency and borrow FX. After receiving bids from counterparties (banks), the central bank would decide on the swap points and allotment to each bank. The details of the transactions depend on the type of auction chosen by the central bank e.g. a single rate (Dutch) or multiple rate (American) auction.
Example. Providing FX Liquidity through FX swaps
Assume that the central bank decides, in a single rate auction, to provide FX liquidity to the market (and absorb domestic currency liquidity) by executing an FX swap on the domestic currency with FX; it allocates FX100 million, equivalent to DC105 million at the current spot rate, priced at 5 forward basis points (or 500 pips) premium (i.e, the forward rate is 1.05 + 0.05 = DC1.10 per unit of FX). At the start of the operation, the central bank provides FX100 million to the market, and absorbs DC105 million. On the maturity date of the operation, the central bank removes the FX100 million and injects DC110 million back into the market.
The balance sheet effects of the central bank’s FX swaps with the banking system are, in principle, the same as those for outright operations. For the spot leg of the transaction, lending FX has a contractionary effect in that it reduces the central bank’s claim on non-residents and banks’ reserves. The monetary base falls, but net domestic assets remain unchanged. The forward leg creates, in this case, a forward domestic liability that is matched by a forward foreign asset. These contingent claims and obligations are, in most cases, recorded initially in off-balance sheet accounts and, subsequently, in on-balance sheet accounts for each receipt or payment.
Spot Leg Transaction Assets Liabilities Net foreign assets -FX100 million Currency in circulation
Net domestic assets Bank reserves -DC105 million =Monetary base -FX 100 million =Monetary base -DC105 million
Forward Leg Transaction
Assets Liabilities Net foreign assets +FX100 million Currency in circulation
Net domestic assets Bank reserves +DC110 million =Monetary base +FX100 million =Monetary base +DC110 million
Since FX swaps create assets and liabilities that are contingent, they are, by definition treated as off-balance sheet items. Therefore, central bank’s FX swap operations would usually have no permanent impact on their balance sheets. The structure of an FX swap, where the terms of the forward leg are set in advance, ensures that these operations do not carry exchange rate or other market risks, although keeping large notional amounts of short positions of FX swaps vis-à-vis the domestic currency could create FX vulnerabilities for the central bank.1 Also, default by a counterparty would affect the composition of foreign and domestic currency in the balance sheet. 1 The data template on International Reserves and Foreign Currency Liquidity provides a tool for assessing the impact of FX swaps on the vulnerability of central banks. The template supplements traditional data on international reserves, that cover largely cross-border and balance-sheet activities, with those on foreign currency positions and off-balance sheet activities. It is a prescribed category of the IMF’s Special Data Dissemination Standard.
21
in 2008. These swap lines augmented the liquid euro and U.S. dollar assets of the receiving central banks, enabling them to credibly commit to providing large amounts of much-needed FX to domestic market participants through their own domestic FX swap facilities.
VI. CONCLUDING REMARKS
The spillover of the liquidity crunch in international money markets into the FX swap market during the recent financial crisis has placed a spotlight on the latter’s potential impact on macro-financial stability. The increasing reliance on FX swaps for FX funding by some market participants and the sharp increase in cross-border transactions in this instrument gave rise to significant concerns when the market faltered during this tumultuous period. Specifically, the role of banks as key dealers and users of FX instruments—and their central importance for financial stability and economic activity—raised worrying questions in some countries about the possible impact of FX swaps on the health of the banking system and real economy.
First, we examine the ways in which FX swaps transactions could affect a country’s financial stability. Capital adequacy requirements under the Basel Accords hold implications for the application of capital charges when these instruments are held by banks, either for speculation purposes, to finance their FX needs and/or to hedge their open FX positions. FX swaps held by banks could also impact their liquidity positions, through margin calls by counterparties, even though they may be fully hedged for FX movements. Encouragingly, the accounting requirements under IFRS are aimed at improving the transparency of reporting by users of these instruments, by bringing them onto the balance sheets of the reporting entities.
Next, we contemplate the stability implications from an economic perspective. We consider how dislocations in the FX swap market could increase the costs of funding and hedging for banks, with attendant consequences for their lending activity to the local economy, and a country’s Balance of Payments. We also discuss how FX swap transactions could potentially exacerbate the volatility in exchange rates when markets are illiquid or under stress, with possible negative implications for the real sector. During the recent crisis, central banks used FX swap facilities extensively to facilitate the rollover of FX swaps by the private sector during the crisis, in some cases, supported by swap lines with other central banks.
We conclude that the application of FX swaps is not infallible, despite their usefulness. That said, this paper is not intended as a critique of FX swaps, but rather, to examine the channels through which FX swaps could affect financial and economic stability, given their increasing popularity leading up to the crisis. As recent events have shown, the use of this instrument could actually exacerbate risks to financial and economic stability during periods of turmoil. Thus, central banks, which typically use FX swaps as a monetary policy tool, and banks, which transact in this instrument for funding, hedging or speculative purposes, need to ensure that they have the necessary measures in place to address the stability problems that could arise from its use.

22
APPENDIX I. DEVELOPMENTS IN GLOBAL FX SWAP ACTIVITY
FX swap activity in advanced countries and major financial centers has dominated global activity in the instrument. By April 2007, the United Kingdom—the global center for FX—had recorded the biggest turnover by far, averaging almost $900 billion daily; the United States was the next largest, at almost $240 billion (Figure A.1). Among advanced countries, the FX swap market in Slovenia has been the least active, with an average daily turnover of only $60 million. The turnover has varied significantly among emerging market countries, with daily averages ranging from $32 million in Brazil to $15 billion in Russia in April 2007 (Figure A.2).
That said, the share of emerging market currencies in FX activity has increased. These currencies were used in almost 20 percent of all transactions in 2007, compared to about 15 percent in 2004 (BIS, 2007). The instruments used to trade different currencies have also varied. FX spot and forward transactions have tended to be dominated by emerging market currencies (Figures A.3 and A.4). Separately, FX swaps have been popular instruments for the currencies of major financial centers, such as Hong Kong and Singapore; in countries where the banking sectors have had a greater reliance on market funding, such as Australia, New Zealand; as well as in important host banking countries, namely, Denmark, Sweden (Figure A.5).
Positions in forwards and FX swaps grew exponentially over the 2004–07 period. Outstanding notional amounts increased by 78 percent, compared to 26 percent in the preceding 3-year period (Figure A.6). The expansion was largely driven by non-financial customers, whose outstanding positions more than doubled during this time, compared to a 33 percent rise between 2001 and 2004 (Figure A.7). However, gross market value increased at a much slower 45 percent over the 2004–07 period, following three previous periods of declines (Figure A.8).26 These increases were predominantly driven by transactions between reporting dealers and other parties (Figure A.9).
However, more recent data show that the financial crisis took a toll on activity in the FX swap market, with positions in FX derivatives falling sharply in H2 200827 Among the countries comprising the G-10 and Switzerland, notional amounts outstanding in forwards
26 Notional amounts outstanding provide information on the structure of the market, but do not measure the riskiness of these positions as they do not reflect the immediate exposure. A more useful measure in this regard may be gross market value, which shows the cost of replacing all open contracts at the prevailing market prices.
27 See BIS (2009) for an over view of FX swaps activity in the G-10 countries plus Switzerland. Surveys in the United States are done annually by The Foreign Exchange Committee (FXC), while that in the United Kingdom is conducted semi-annually by the Foreign Exchange Joint Standing Committee (FXJSC). The latest survey results were released in January 2009. Although similar in nature, these surveys are not comparable to the BIS Triennial Central Bank Survey of Foreign Exchange and Derivatives Market Activity, given the differences in the reporting methods.

23
and FX swaps fell by 33 percent, followed by a slight uptick of 9 percent in H1 2009. The average daily volume in FX swaps at U.S.-based market participants fell by 27 percent in April 2009 compared to a year ago. On a counterparty basis, the average daily volume between surveyed U.S. participants with non-financial customers fell by almost 58 percent over the April 2008–09 period. At the same time, activity by maturity also fell across the board. Consistent with the trend observed in the United States, the turnover in FX swaps in the United Kingdom fell by almost 29 percent during the April 2008 to 2009 period. Activity between surveyed institutions and non-financial institutions fell the most, by 41 percent; activity with all other financial institutions declined by 28 percent during this time.
Overall, market concentration in OTC FX derivatives has increased over time. The Herfindahl index, which measures concentration, shows that the increase in market shares of individual reporting institutions have been more marked in the forwards, FX swaps and currency swaps markets, compared to their shares in the options market (Figure A.10).

24
Figure A.1. Advanced Countries and Major Financial Centers: FX Swaps Turnover, 2007
(In billions of U.S. dollars)
0
50
100
150
200
250
300
Slo
veni
a
Por
tuga
l
Gre
ece
Irel
and
Fin
land
Spa
in
New
Zea
lan
d
Aus
tria
Net
herl
ands
Italy
Lu
xem
bo
urg
Nor
way
Bel
gium
Sw
ede
n
Can
ad
a
Ger
man
y
Den
mar
k
Fra
nce
Aus
tral
ia
Japa
n
Sw
itzer
land
Hon
g K
ong
SA
R
Uni
ted
Sta
tes
Uni
ted
Kin
gdo
m
899
Figure A.2. Key Emerging Market Countries: FX Swaps Turnover, 2007 (In billions of U.S. dollars)
0
2
4
6
8
10
12
14
16
Bra
zil
Col
ombi
a
Bul
gar
ia
Lith
uani
a
Chi
le
Indo
nesi
a
Bah
rain
Chi
na
Phi
lippi
nes
Est
onia
Sau
di A
rabi
a
Mal
aysi
a
Rom
ania
Cze
ch R
epub
lic
Latv
ia
Tur
key
Slo
vak
Rep
ublic
Tha
iland
Hun
gar
y
Isra
el
Pol
and
Sou
th A
fric
a
Mex
ico
Kor
ea
Indi
a
Rus
sia
Source: Bank for International Settlements. Note: Amounts are the daily average in April 2007.

25
Figure A.3. FX Spot Turnover by Currency, 2007 (Percentage shares of average daily turnover)
0
10
20
30
40
50
60
70
80
Ho
ng
Ko
ng
dol
lar
No
rweg
ian
kro
ne
Tha
i bah
t
Sou
th A
fric
an r
and
Pol
ish
Zlo
ty
Sw
edi
sh k
orn
a
Da
nish
kro
ne
Sin
gap
ore
dol
lar
Cze
ch k
oru
na
Au
stra
lian
dol
lar
New
Zea
lan
d d
olla
r
U.S
. dol
lar
Ca
nad
ian
dol
lar
Pou
nd
ste
rlin
g
Hun
gar
ian
forin
t
Eu
ro
Ph
ilipp
ine
pe
so
Mex
ica
n p
eso
Japa
nes
e ye
n
Sw
iss
fra
nc
Ind
ian
rupe
e
Ind
one
sian
rup
iah
Ko
rean
wo
n
Ne
w T
aiw
an
dol
lar
Bra
zilia
n re
al
Ch
ines
e re
nmin
bi
Tu
rkis
h li
ra
Ru
ssia
n r
oub
le
All countries
Figure A.4. FX Forwards Turnover by Currency, 2007 (Percentage shares of average daily turnover)
0
5
10
15
20
25
30
35
40
45
50
Ru
ssia
n r
ou
ble
Ho
ng
Ko
ng
dol
lar
Sin
gap
ore
dol
lar
No
rweg
ian
kro
ne
Pou
nd
ster
ling
Au
stra
lian
dolla
r
Sw
edis
h ko
rna
Sw
iss
fran
c
Da
nish
kro
ne
U.S
. dol
lar
Pol
ish
Zlo
ty
New
Zea
land
do
llar
Tu
rkis
h li
ra
Me
xica
n p
eso
Ca
nad
ian
dolla
r
Eu
ro
Jap
ane
se y
en
Sou
th A
fric
an r
an
d
Tha
i ba
ht
Hun
gar
ian
forin
t
Cze
ch k
oru
na
Ind
ian
rup
ee
Ko
rea
n w
on
Ch
ines
e re
nm
inb
i
Ph
ilip
pin
e p
eso
Ind
one
sian
ru
pia
h
Ne
w T
aiw
an
dolla
r
Bra
zilia
n re
al
All countries
Figure A.5. FX Swaps Turnover by Currency, 2007 (Percentage shares of average daily turnover)
0
10
20
30
40
50
60
70
80
Bra
zilia
n re
al
Ch
ines
e re
nm
inb
i
Ne
w T
aiw
an
dolla
r
Ind
one
sian
ru
pia
h
Ru
ssia
n r
ou
ble
Ko
rea
n w
on
Tu
rkis
h li
ra
Ind
ian
rup
ee
Ph
ilip
pin
e p
eso
Jap
ane
se y
en
Sw
iss
fran
c
Hun
gar
ian
forin
t
Me
xica
n p
eso
Eu
ro
Cze
ch k
oru
na
Pou
nd
ster
ling
Ca
nad
ian
dolla
r
New
Zea
land
do
llar
U.S
. dol
lar
Au
stra
lian
dolla
r
Tha
i ba
ht
Da
nish
kro
ne
Sou
th A
fric
an r
an
d
Pol
ish
Zlo
ty
Sw
edis
h ko
rna
Sin
gap
ore
dol
lar
No
rweg
ian
kro
ne
Ho
ng
Ko
ng
dol
lar
All countries
Source: Bank for International Settlements. Note: Data are for April 2007.

26
Figure A.6. Notional Amounts Outstanding of OTC Foreign Exchange Derivatives, by Instrument
(In billions of U.S. dollars)
Figure A.7. Notional Amounts Outstanding of Forwards and FX Swaps, by Counterparty
(In billions of U.S. dollars)
0
10,000
20,000
30,000
40,000
50,000
60,000
70,000
Jun-95 Jun-98 Jun-01 Jun-04 Jun-07
Forwards and FX swaps Currency swaps Options bought and sold
0
5,000
10,000
15,000
20,000
25,000
30,000
35,000
Jun-95 Jun-98 Jun-01 Jun-04 Jun-07
With reporting dealers With other financial institutions With other non-financial customers
Figure A.8. Gross Market Values of OTC Foreign
Exchange Derivatives, by Instrument (In billions of U.S. dollars)
Figure A.9. Gross Market Values of Forwards and FX Swaps, by Counterparty
(In billions of U.S. dollars)
0
200
400
600
800
1,000
1,200
1,400
1,600
1,800
Jun-95 Jun-98 Jun-01 Jun-04 Jun-07
Forwards and FX swaps Currency swaps Options bought and sold
0
100
200
300
400
500
600
700
800
Jun-95 Jun-98 Jun-01 Jun-04 Jun-07
With reporting dealers With other financial institutions With other non-financial customers
Figure A.10. G-10 and Switzerland: Herfindahl Indices for All OTC Foreign Exchange Derivatives Contracts 1/
0
100
200
300
400
500
600
700
Jun-
98
Dec
-98
Jun-
99
Dec
-99
Jun-
00
Dec
-00
Jun-
01
Dec
-01
Jun-
02
Dec
-02
Jun-
03
Dec
-03
Jun-
04
Dec
-04
Jun-
05
Dec
-05
Jun-
06
Dec
-06
Jun-
07
Dec
-07
Jun-
08
Dec
-08
Jun-
09
Forwards, FX swaps and currency swaps Options
1/ The Herfindahl index is defined as the sum of the squares of the market shares of each individual institution; it ranges from 0 to 10,000. The more concentrated the market, the higher the measure. Source: Bank for International Settlements.

27
APPENDIX II. HOW FX SWAPS AFFECT THE CAPITAL ADEQUACY RATIO
A bank’s transactions in FX swaps could affect its capital adequacy ratio (CAR), the ratio which defines the capacity of the bank to meet its liabilities and absorb risks to its exposures. It is the central feature of the Basel Capital Accord, and is an analytical construct in which regulatory capital is the numerator and risk-weighted assets (RWA) is the denominator:
(A.1) RWA
CapitalRegulatoryCAR .
The minimum ratio of regulatory capital to RWA is set at 8 percent. The core regulatory capital element, also known as Tier I capital, should be at least 4 percent. These ratios are considered the minimum necessary to achieve the objective of securing over time soundly-based and consistent capital ratios for all international banks.28
A bank’s regulatory capital consists of its Tier I and Tier II capital. Tier I capital consists of common shareholders’ equity, retained earnings and non-cumulative preferred stock. Tier II capital consists of undisclosed reserves, revaluation reserves, general loan loss provisions, hybrid debt equity instruments and subordinated term debt.
(A.2) Regulatory Capital = Tier I Capital + Tier II Capital.
Separately, a bank’s total RWA comprise three elements. They are: market risk, operational risk and credit risk. RWA are calculated by multiplying the capital requirements for market and operational risks by 12.5 (i.e. the reciprocal of the minimum capital ratio of 8 percent) and adding the resulting amount to the sum of the RWA for credit risk: (A.3) 512.RisklOperationaRiskMarketquirementsReCapitalRWA
.RiskCreditWeightedRisk
Thus, (A.4) can be derived from (A.1), (A.2) and (A.3):
RiskCreditWeightedRisk.RisklOperationaRiskMarketquirementsReCapital
CapitalIITierITierCAR
512,
where the denominator includes both on- and off-balance sheet RWA. Thus, FX swaps could impact a bank’s CAR to the extent that they change the capital requirements for market risk and credit risk in the denominator in (A.4), and Tier I capital through retained earnings from any impact on the profit and loss.
28 See IMF (2004).

28
APPENDIX III. CALCULATION OF THE CREDIT RISK CHARGE FOR FX SWAPS29 The focus on on-balance sheet items in the past meant that an increasingly important component of the credit risk of the banking system, namely its exposure to derivatives, was largely being overlooked. FX swaps are classified under “other derivatives” among the five broad categories of off-balance sheet items.30 These instruments are typically given “special” treatment because of the complexity of their exposures.
Under the Basel Accords, derivative contracts require adjustments prior to their assignment to the appropriate asset class. These include interest rate, equity, commodity and exchange rate linked contracts. A three-step process is required to derive the proper amount to be allocated to the appropriate asset class. In the case of FX swaps, the following steps would be applied:
1. Determine the credit exposure, also known as the credit equivalent, of the FX swap contract which is equivalent to the notional for a loan. This figure is calculated as the sum of the current, net replacement value (NRV) of the contract—i.e., its marked-to-market value—plus an add-on component that is supposed to capture future or potential exposures:
(A.5) Credit exposure = NRV + Add-on. The add-on factor is computed as follows:
Add-on = Notional × Credit conversion factor × (0.4 + 0.6 × NGR),
where NGR is the net-to-gross ratio or the ratio of current net market value to gross market value, which is always between zero and one.31
The credit conversion factor would depend on the tenor (maturity) and type of contract. It approximates the maximum credit exposure that depends on the volatility of the risk factor and maturity. Since volatility is typically highest for commodities, followed by equity, and then currencies, the credit conversion factor is greater for swap contracts for these
29 A detailed discussion on the calculation of credit risk charges is presented in Jorion (2009) and Berger (2008).
30 The other categories are: (i) instruments that substitute for loans (e.g., guarantees, bankers’ acceptances, and standby letters of credit); (ii) transaction-related contingencies (e.g., performance bonds or commercial letters of credit); (iii) short-term, self-liquidating trade-related liabilities (e.g., documentary credits collateralized by the underlying shipments); and (iv) commitments with maturity greater than a year (such as credit lines), and not-issuance facilities.
31 The NGR reduces the capital requirements for contracts for which there are legally valid netting agreements; otherwise, the NGR could be equal to one. Where NGR = 0, that is, all contracts fully net out, the multiplier for the add-on factor would be equal to a minimum 0.4, to provide a cushion against potential movements in the NGR, which could change over time.

29
instruments than for, say, fixed income instruments; the credit conversion factor also increases with maturity (Table A.1). The relevant credit conversion factors for FX swaps across maturities are presented in the second column of Table A.1.
2. Determine whether an exception applies. The first exception places a maximum 50 percent risk weighting on the credit exposure of a contract. The second exception provides for the exclusion of derivatives contracts traded in exchanges from the risk-based ratio calculation. The former holds for off-balance sheet items such as FX swaps.
3. Calculate the risk-weighted asset (RWA). The calculation of RWA for the credit risk component in an FX swap is effected by applying counterparty-specific risk weights (RW) to the derived credit exposure in equation (A.5):
(A.6)
ii ExposureCredit50RWSwapsFXRWA % .
4. Calculate the credit risk charge (CRC). Banks must hold at least 8 percent of their RWA, as defined in (A.6), to cover their CRC:
SwapsFXRWA8SwapsFXCRC %
ii ExposureCredit50RW8 %% .
Table A.1. Credit Conversion Factors for Potential Credit Exposure (In percent of notional)
Residual Maturity(tenor) Interest Rate Exchange Rate,
GoldEquity Precious Metals Other
Commodities
< 1 year 0.0 1.0 6.0 7.0 10.01–5 years 5.0 5.0 8.0 7.0 12.0> 5 year 1.5 7.5 10.0 8.0 15.0
Contract
Source: BCBS (1995).

30
APPENDIX IV. ASSUMPTIONS OF FX SPOT AND SWAP RATES
All numerical examples in this paper use the assumed FX spot and swap rates presented in Table A.2.
Table A.2. Assumptions: FX Spot and Swap Rates
(In domestic currency per unit of FX)
Time Period tn Spot Exchange Rate FX Swap Rate for t12 as at tn
n=0 1.05 1.10n=1 1.03 1.05n=2 1.01 1.00n=3 0.99 0.98n=4 1.02 1.03n=5 1.08 1.10n=6 1.12 1.15n=7 1.16 1.19n=8 1.20 1.25n=9 1.25 1.31n=10 1.32 1.35n=11 1.38 1.42n=12 1.40 1.45

31
APPENDIX V. CLOSING A NET OPEN FX POSITION ON THE BALANCE SHEET USING FX
SWAPS The following example demonstrates how FX swaps could be used to close net open FX positions on bank balance sheets. Assume that a local bank (domestic bank or local affiliate of foreign bank) has more domestic currency (“DC”) liabilities on its balance sheet than domestic currency assets. The bank would thus have exactly the opposite position with the FX-denominated items—it has more FX denominated assets than liabilities. In other words, the bank has a long FX position on its balance sheet (Figure A.11).32 Specifically, assume that the bank has FX100 million in assets, and no FX liabilities; the spot rate the time of transaction is DC1.05 per unit of FX; the 12-month swap rate is DC1.10 per unit of FX.
Figure A.11. Initial Position of Balance Sheet
DC FX DC FXDC Cash 200 DC Various 305DC Other 50FX Receivables 105 100
DC Capital 50355 355
Equity
Balance Sheet(In millions of DC)
Assets Liabilities
In order to avoid having a net open FX position, the bank could create a synthetic forward hedge by entering into the following transactions:
1. Convert excess domestic currency liquidity to FX via an FX swap transaction (lend domestic currency and borrow FX). Assume that the bank enters into a 12-month contract to swap DC105 million for FX100 million at the near date, i.e., at a rate of DC1.05 per unit of FX, and to swap FX100 million back at a rate of DC1.10 per unit of FX, i.e., for DC110 million, at the far date. The transaction would be recorded as follows:33
DR FX Cash DC105 million (= FX100 million) CR DC Cash DC105 million
DR DC Swap receivable DC110 million
CR FX swap payable DC105 million (= FX100 million) CR Deferred discount DC5 million
32 In the balance sheet examples presented in this appendix, all FX items are denoted in domestic currency equivalents
33 Debit entries are denoted “DR;” credit entries are denoted “CR.”

32
As a consequence of the first leg of this swap transaction, the bank now has a domestic currency-denominated asset, i.e., domestic currency is receivable in the future, and an FX-denominated liability. i.e., FX is payable in the future (Figure A.12).
Figure A.12. Position of Balance Sheet Following FX Swap Transaction
DC FX DC FXDC Cash 95 DC Various 305DC Other 50FX Cash 105 100FX Receivables 105 100DC Swap receivable 110 FX Swap payable 105 100
DC Deferred discount 5
DC Capital 50
465 465
Balance Sheet(In millions of DC)
Equity
Assets Liabilities
2. Sell FX in the spot market in exchange for domestic currency to close the open FX exposure. The bank sells FX100 million on the spot market for DC105 million to close the net open FX position. The transaction would be recorded as follows (Figure A.13):
DR DC Cash DC105 million CR FX Cash DC105 million (= FX100 million)
Figure A.13. Position of Balance Sheet Following Sale of FX on the Spot Market
DC FX DC FXDC Cash 200 DC Various 305DC Other 50FX Cash 0FX Receivables 105 100DC Swap receivable 110 FX Swap payable 105 100
DC Deferred discount 5
DC Capital 50465 465
Equity
Liabilities
Balance Sheet(In millions of DC)
Assets
3. At this point, any depreciation (appreciation) in the domestic currency spot exchange should have no net impact on the amount of the FX assets and liabilities on the balance sheet. Assume that the spot exchange rate moves to DC1.40 per unit of FX at the maturity of the swap contract. The change would be recorded as follows, with movements in the spot rate having the same impact on both the asset and liability sides of the balance sheet, and on profit and loss (Figure A.14):

33
DR Loss on FX transaction DC35 million CR FX Swap payable DC35 million DR FX Receivables DC35 million CR Gain on FX transaction DC35 million
In other words, there would be no net impact on the balance sheet, as the bank has a closed position (Figure A.4): Figure A.14. Position of Balance Sheet Following Depreciation of Domestic Currency
DC FX DC FXDC Cash 170 DC Various 305DC Other 50FX Receivables 140 100
DC Capital 55360 360
Balance Sheet(In millions of DC)
Assets Liabilities
Equity
4. Upon the maturity of the FX swap contract, purchase FX in the spot market to repay FX to the counterparty and receive domestic currency from the counterparty:
The FX is purchased at the spot exchange rate of DC1.40 per unit of FX:
DR FX Cash DC140 million CR DC Cash DC140 million
The discount on the swap is amortized:
DR DC Deferred discount DC5 million CR DC Discount account DC5 million
The swap contract is repaid:
DR FX Swap payable DC140 million CR FX Cash DC140 million DR DC Cash DC110 million CR DC Swap receivable DC110 million
The return to the open FX position means that the bank would have to seek to roll over the swap contract in order to once again close its position (Figure A.15):

34
Figure A.15. Position of Balance Sheet Following Settlement of Swap Contract with Purchase of FX in Spot Market
DC FX DC FXDC Cash 170 DC Various 305DC Other 50FX Receivables 140 100
DC Capital 55360 360
Equity
Balance Sheet(In millions of DC)
Assets Liabilities
5. Alternatively, if the FX Receivables mature at the same time as the swap contract, the receipts could be used to repay the contract:
The discount on the swap is amortized:
DR DC Deferred discount DC5 million CR DC Discount account DC5 million
The receipt of the FX receivables is paid out to the swap counterparty:
DR FX Cash DC140 million CR FX Receivables DC140 million DR FX Swap payable DC140 million CR FX Cash DC140 million DR DC Cash DC110 million CR DC Swap receivable DC110 million
The outcome would be to remove the FX asset from the balance sheet, so that only domestic currency positions remain (Figure A.16):
Figure A.16. Position of Balance Sheet Following Settlement of Swap Contract with Maturing Assets
DC FX DC FXDC Cash 310 DC Various 305DC Other 50
DC Capital 55360 360
Assets Liabilities
Equity
Balance Sheet(In millions of DC)

35
6. Note that the balance sheet position in Figure A.6 is essentially a replication of an outright forward contract. In other words, it is a “synthetic forward” position. In the case of an outright forward transaction, the bank would undertake to pay out FX100 at the maturity of the contract in exchange for domestic currency at the agreed upon forward rate of DC1.10 per unit of FX (Figure A.17):
DR DC Forward receivable DC110 million CR FX Forward payable DC105 million (= FX100 million) CR DC Deferred discount DC5 million
Figure A.17. Position of Balance Sheet Following Forward Transaction
DC FX DC FXDC Cash 200 DC Various 305DC Other 50FX Receivables 105DC Forward receivable 110 FX Forward payable 105 100
DC Deferred discount 5
DC Capital 50465 465
Equity
Balance Sheet(In millions of DC)
Assets Liabilities

36
APPENDIX VI. AN ILLUSTRATION OF HOW MARGIN CALLS ON FX SWAPS ARE
CALCULATED Assume that a bank enters into an FX swap transaction with a counterparty to exchange domestic currency for FX. The transaction takes place at time t0, the maturity of the contract is 12 months, i.e., at time t12:
The bank agrees to provide DC105 million in exchange for FX100 million at time t0;
It agrees to repay FX100 million and receive DC110 million at time t12, i.e., at the swap rate of DC1.10 per unit of FX.
Based on an assessment of the credit risks of both parties, the margin threshold is set at DC5 million for the bank, and FX7 million for the counterparty.
The positions are marked-to-market at the end of every month. In other words, a valuation is conducted at the end of each month to determine the both parties’ positions (receivable or payable).
Depending on the position established, the bank may call for collateral from the counterparty to protect its position, or the counterparty may call on the bank to protect the counterparty’s position.
Assume that in the intervening 12 months (Table A.3): 1. The domestic currency swap rate initially appreciates against the FX, relative to the contracted swap rate, between t0 and t3 so that the bank’s position is “in the money” and the counterparty’s is “out of the money.” In other words, it would have cost the counterparty more FX to purchase DC110 million in order to repay the bank.
2. At t2, the swap rate moves to DC1.00 per unit of FX. The amount by which the counterparty is out of the money exceeds the agreed upon margin threshold for the counterparty of FX7 million, by FX3 million. This represents the margin call that the bank would make on the counterparty.34
3. At t3, the swap rate moves to DC0.98 per unit of FX. At this point, the amount by which the counterparty is out of the money exceeds the agreed upon margin threshold for the counterparty of FX7 million, by a total of FX5.2 million. The bank, having already made a
34 The amount would typically be discounted by the market-determined interest rate over the relevant time period, to arrive at the net present value. For the purpose of this example, and to keep the calculations simple, we assume that the effect of discounting is negligible.

37
margin call of FX3 million on the counterparty at t2, makes another margin call of FX2.2 million.
4. At t4, the domestic currency swap rate begins to depreciate against the FX, to 1.03 DC per unit of FX, albeit still stronger than the contracted swap rate. The counterparty is still out of the money by 6.8 million FX, but by less than its margin threshold of 7 million FX. At that point, the bank repays the counterparty the total margin it had previously called, of 5.2 million FX.
5. At t6, the extent of the depreciation in the domestic currency swap rate to DC1.15 per unit of FX results in the bank being out-of-the-money by DC5 million. Since this amount is equivalent to the agreed up margin threshold for the bank, there is no margin call.
6. At t7, however, the depreciation of the domestic currency swap rate to DC1.19 per unit of FX puts the bank in a position of being DC9 million out-of-the-money, DC4 million more than the margin threshold. The counterparty would make a margin call of DC4 million.
7. At t8, the swap rate weakens further, to DC1.25 per unit of FX, i.e., the bank is out of the money by DC15 million, and a margin call of an additional DC11 million is made by the counterparty.
8. By t12, at the maturity of the contract, the swap rate moves to DC1.45 per unit of FX. The bank is out of the money by a total of DC35 million, and margin calls totaling DC30 million (DC35 million less the margin threshold of DC5 million) would have been paid to the counterparty.
9. At this point, if the bank fulfils its swap contract and repays the counterparty FX100 million in exchange for DC110 million, counterparty risk is extinguished. The total margin called of DC30 million and held by the counterparty in an escrow account is returned to the bank.
The difference between standard accounting requirements and the establishment of valuation lies in the objectives of the two. Accounting entries are for financial reporting purposes—they simply note or disclose the position on the balance sheet. In contrast, establishing valuation at any one point other than as part of the financial cycle is normally done for efficiency/trading or for credit collateral purposes. It should be noted that in a situation where the bank may not have sufficient liquidity to meet the margin calls before the contract expires, its liquidity problem may well become a solvency problem.

38
Table A.3. Example: Calculation of Margin Calls on FX Swaps (In millions of domestic currency units)
Time Spot Exchange
periodtn
Rate(DC per unit of FX)
FX DC Marked-to-Market Liability
In/(Out) of the Money
MarginThreshold
Excess of Margin
Margin Call
(1) (2) (3) (4) = (3)tn*100 (5) = 110 – (4)tn (6) (7) = -(6)tn – (6)tn, IF > 0 (8) = (7)tn - (7)tn-1
n=0 1.05 1.00 1.10 110 0 5 0 0n=1 1.03 1.00 1.05 105 5 5 0 0n=2 1.01 1.00 1.00 100 10 5 0 0n=3 0.99 1.00 0.98 98 12 5 0 0n=4 1.02 1.00 1.03 103 7 5 0 0n=5 1.08 1.00 1.10 110 0 5 0 0n=6 1.12 1.00 1.15 115 (5) 5 0 0n=7 1.16 1.00 1.19 119 (9) 5 4 4n=8 1.20 1.00 1.25 125 (15) 5 10 6n=9 1.25 1.00 1.31 131 (21) 5 16 6n=10 1.32 1.00 1.35 135 (25) 5 20 4n=11 1.38 1.00 1.42 142 (32) 5 27 7n=12 1.40 1.00 1.45 145 (35) 5 30 3
Total 30
Time Spot Exchange
periodtn
Rate(DC per unit of FX)
FX DC Marked-to-Market Liability
In/(Out) of the Money
MarginThreshold
Excess of Margin
Margin Call
(1) (2) (3) (9) = (3)t0/(3)tn* (2)tn (10) = 100 – (9)tn (11) (12) = -(10)tn – (11)tn, IF > 0 (13) = (12)tn - (12)tn-1
n=0 1.05 1.00 1.10 100.0 0.0 7 0.0 0.0n=1 1.03 1.00 1.05 104.8 (4.8) 7 0.0 0.0n=2 1.01 1.00 1.00 110.0 (10.0) 7 3.0 3.0n=3 0.99 1.00 0.98 112.2 (12.2) 7 5.2 2.2n=4 1.02 1.00 1.03 106.8 (6.8) 7 0.0 -5.2n=5 1.08 1.00 1.10 100.0 0.0 7 0.0 0.0n=6 1.12 1.00 1.15 95.7 4.3 7 0.0 0.0n=7 1.16 1.00 1.19 92.4 7.6 7 0.0 0.0n=8 1.20 1.00 1.25 88.0 12.0 7 0.0 0.0n=9 1.25 1.00 1.31 84.0 16.0 7 0.0 0.0n=10 1.32 1.00 1.35 81.5 18.5 7 0.0 0.0n=11 1.38 1.00 1.42 77.5 22.5 7 0.0 0.0n=12 1.40 1.00 1.45 75.9 24.1 7 0.0 0.0
Total 0.0
FX Swap Rate for t12 as at tn Bank (DC)
Counterparty (FX)FX Swap Rate for t12 as at tn
Source: Authors’ calculations.

39
APPENDIX VII. RECORDING OF FX SWAPS IN THE BALANCE OF PAYMENTS AND THE
INTERNATIONAL INVESTMENT POSITION The Balance of Payments (“BoP”) records transactions between residents and non-residents. An FX swap is recorded in the Balance of Payments and the International Investment Position (“IIP”) if it is a contract between residents and non-residents. The treatment of the transactions is consistent across the BoP and the IIP, but the IIP also records valuation changes at given reference dates during the lifetime of the FX swap contract. Balance of Payments The creation of an FX swap contract does not generally involve a transaction in financial derivatives in the financial account, although the underlying flows of currencies should be recorded as transactions in the BoP. At the inception of the contract, there is a spot exchange of currencies and a simultaneous commitment by the counterparties to transact amounts in the future at agreed-upon prices . Hence, risk exposures of equal value are usually being exchanged. Any initial exchange of currencies is a transaction that is recorded, at the exchange rate agreed upon by the counterparties, in the “other investment” category of the financial account. Any commissions or fees paid, for instance to banks, brokers and dealers, are classified as payments for services in the current account, and should be deducted from the value of the financial derivative.
Over the contract period, only transactions related to margin payments and sales in secondary markets should be recorded in the BoP (Box A.1).35 Any change in the value of an FX swap due to exchange rate movements during the contract period is generally treated as holding gains or losses, which is not recorded as a transaction in the BoP. Transactions may be recorded over the contract period only in the following cases:
Margin payments and receipts. A margin payment is recorded as a reduction in financial derivative liabilities only if it is non-repayable; the receipt of non-repayable margin is recorded as a reduction in financial derivative, probably currency and deposits).36
35 Under the fifth and sixth editions of the Balance of Payments Manual, FX swap transactions are recorded as forward contracts under financial derivatives, which is a component of the financial account (IMF, 1993; 2010).
36 A non-repayable margin is a transaction in a derivative paid to reduce a financial liability created under a derivative. The entity that pays non-repayable margin no longer retains ownership of the margin nor has the right to the risks and rewards of ownership, such as the receipt of income or exposure to holding gains and losses. Repayable margins consist of deposits or other collateral deposited to protect a counterparty against default risk, but which remain under the ownership of the unit that placed the margin. Although its use may be restricted, a margin is classified as repayable if the depositor retains the risks and rewards of ownership, such as the receipt of income or exposure to holding gains and losses. At settlement, repayable margins, or the amounts
(continued…)

40
Secondary market transactions. Sales of FX swap contracts in secondary markets, whether on exchanges or over-the-counter, are valued at market prices and recorded in the financial account as a transaction in financial derivatives.
The settlement of an FX swap contract generally gives rise to transactions that are recorded in the financial account. At the time of settlement, the difference between the values (which are measures in the unit of account and at the prevailing exchange rate) of the currencies exchanged are allocated to a transaction in a financial derivative. In other words, if the value of the currency received exceeds that of the currency paid, a reduction in a financial derivative asset―a credit―is recorded. The contra-debit entry is an increase in another assets (in many cases currency and deposits under the other investment category) classified in the financial account. When the value of the currency received is less than that of the currency paid, the opposite applies. That is, a reduction in a financial derivative liability―a debit―is recorded. The contra-credit entry is an increase in another liabilities (again in many cases currency and deposits under the other investment category) classified in the financial account.
International Investment Position The IIP of a country represents the assets and liabilities of a country vis-à-vis the outside world at a reference date. In the IIP, FX swaps are valued at current market prices on appropriate reference dates (Box A.2). It is recommended that data on gross assets and gross liabilities be compiled by summing, respectively, the values of all individual contracts in asset positions and the values of all individual contracts in liability positions. Any variation in a position can generally be attributed to transactions and valuations changes: Transactions. The recording of a transaction related to an FX swap in the IIP is
consistent with that of the financial accounts of the BoP.
Valuations, reflecting price and exchange rate changes. Changes in valuations that do not give rise to a transaction should still be accounted for in the IIP if they reflect variations in market value. For example, a fluctuation in exchange rates during the period between the inception of the contract and the settlement date, will give rise to a different market value of an FX swap, hence a valuation adjustment in the IIP.
Therefore, at any reference date over the contract period of the FX swap, in addition to recording the transactions recorded in the BoP, valuation changes due to exchange rate changes should be recorded in the IIP.
of repayable margins in excess of any liability owed on the derivative, are returned to the depositor. Arrangements for margining can be complex, and procedures differ among countries.

41
Box A.1. Recording an FX Swap Transaction in the Balance of Payments
Assume that a domestic bank swaps DC105 for FX100, with the swap to be reversed 12 months later at the forward price of DC110 to FX100. At the inception of the FX swap, the following transactions in FX would be recorded in the financial account of the BoP:
Debit Credit
Financial account Portfolio investment Financial derivatives Other investment, currency and deposits 100 100
After 12 months, at the settlement of the FX swap contract, the domestic currency has depreciated to DC140 against the foreign currency and more domestic currency will be needed to pay the FX liability, compared to the forward price set at the initiation of the contract. The actual depreciation of the domestic currency is not explicitly shown as that the BoP is recorded in FX. However, it can be deduced that the amount of FX21 (=DC30/1.40) represents the equivalent loss in domestic currency that the bank is incurring as a result of the depreciation in the domestic currency, while the balance of FX79 (DC110/1.40) is the equivalent amount that the bank would have had to pay in domestic currency, if the domestic currency had not depreciated.
Debit Credit
Financial account Portfolio investment Financial derivatives 21 Other investment, currency and deposits 79 100

42
Box A.2. Recording an FX Swap in the International Investment Position
Assume the same example as in Box A.1. A domestic bank swaps DC105 in exchange for FX100, with the swap to be reversed 12 months later at the forward price of DC110 to FX100. At the initiation of the contract there is a spot sale/purchase of currencies reflected in the IIP but no changes in financial derivatives:
Opening Position
Changes in Position Reflecting
Transactions Valuation Closing Position
Portfolio investment Financial derivatives Other investment, currency and deposits
0 100 100
Assume now that after six months, at end-March, the domestic currency has depreciated to 112 against the foreign currency. Due to valuation changes, the IIP has changed:
Opening Position
Changes in Position Reflecting
Transactions Valuation Closing Position
Portfolio investment Financial derivatives -6 -6 Other investment, currency and deposits
100 100
After 12 months, when the FX swap matures, the domestic currency has depreciated to DC140 against the foreign currency and more domestic currency will be needed to pay the FX liability, compared to the forward price set at the initiation of the contract:
Opening Position
Changes in Position Reflecting
Transactions Valuation Closing Position
Portfolio investment Financial derivatives -6 21 -15 0 Other investment, currency and deposits
100 -21 79

43
REFERENCES Abhayawansa, Subhash and Indra Abeysekera, 2005, “IAS 39,” Financial Management
(United Kingdom, December).
Aghion, Philippe, Philippe Bacchetta, Romain Ranciere and Kenneth Rogoff, 2009, “Exchange Rate Volatility and Productivity Growth: The Role of Financial Development,” Journal of Monetary Economics, Vol. 56, No. 4, pp. 494–513.
Baba, Noahiko and Frank Packer, 2009, “From Turmoil to Crisis: Dislocations in the FX Swap Market Before and After the Failure of Lehman Brothers,” unpublished manuscript, Conference on the Global Financial Crisis: Causes Threats and Opportunities (Warwick Business School, April).
Baba, Noahiko, Frank Packer and Teppei Nagano, 2008, “The Spillover of Money Market Turbulence to FX Swap and Cross-Currency Swap Markets,” BIS Quarterly Review (Basel, March).
Bank for International Settlements, 2007, “Foreign Exchange and Derivatives Market Activity in 2007,” Triennial Central Bank Survey (Basel, December).
Bank for International Settlements, 2009, “OTC Derivatives Market Activity in the First Half of 2009” (Basel, May).
Basel Committee on Banking Supervision, 1980, “Supervision of Banks’ Foreign Exchange Positions” (Basel, August).
Basel Committee on Banking Supervision, 1995, “Basel Capital Accord: Treatment of Potential Exposure for Off-Balance Sheet Items” (Basel, April)
Basel Committee on Banking Supervision, 2006, “International Convergence of Capital Measurement and Capital Standards” (Basel, June).
Basel Committee on Banking Supervision, 2009a, “Strengthening the Resilience of the Banking Sector,” Consultative Document (Basel, December).
Basel Committee on Banking Supervision, 2009b, “International Framework for Liquidity Risk Measurement, Standards and Monitoring,” Consultative Document (Basel, December).
Berger, Matthew, 2008, “A Formulaic Approach to the Basel II Accord’s First Pillar,” Hertfordshire Law Journal, Vol. 6, No. 1, pp. 2–13.
Ca’ Zorzi, Michele, Elke Hahn and Marcelo Sánchez, 2007, “Exchange Rate Pass-Through in Emerging Markets,” ECB Working Paper No. 739 (Frankfurt: European Central Bank).

44
Choudhri, Ehsan U. and Dalia S. Hakura, 2006, “Exchange Rate Pass-Through to Domestic Prices: Does the Inflationary Environment Matter?” Journal of International Money and Finance, Vol. 25, No. 4, pp. 614–39.
Clark, Peter, Natalia Tamirisa and Shang-Jin Wei, with Azim Sadikov and Li Zeng, 2004, “A New Look at Exchange Rate Volatility and Trade Flows,” IMF Occasional Paper No. 235 (Washington: International Monetary Fund).
Coffrey, Niall, Warren B. Hrung, Hoai-Luu Nguyen and Asani Sarkar (2009), “The Global Financial Crisis and Offshore Dollar Markets,” Current Issues in Economics and Finance, Vol. 15, No. 6 (Federal Reserve Bank of New York, October)
Committee on the Global Financial System, 2008, “Central Bank Operations in Response to the Financial Turmoil,” CGFS Papers No. 31 (Basel, July).
Devereux, Michael B. and James Yetman, forthcoming, “Price Adjustment and Exchange Rate Pass-Through,” Journal of International Money and Finance.
Foreign Exchange Committee, 2008, “Semi-Annual Foreign Exchange Volume Survey, April 2008” (New York).
Foreign Exchange Committee, 2009, “Semi-Annual Foreign Exchange Volume Survey, April 2009” (New York).
Furceri, Davide and Sara Borelli , 2008, “Foreign Direct Investments and Exchange Rate Volatility in the EMU Neighborhood Countries,” Journal of International and Global Economic Studies, Vol. 1, No. 1, pp. 42–59.
Ho, Corrinne and François-Louis Michaud, 2008, “Central Bank Measures to Alleviate Foreign Currency Funding Shortages,” BIS Quarterly Review (Basel, December).
International Monetary Fund, 1993, Balance of Payments Manual, Fifth Edition (Washington).
International Monetary Fund, 2000, Financial Derivatives, A Supplement to the Fifth Edition (1993) of the Balance of Payments Manual (Washington, May).
International Monetary Fund, 2004, Compilation Guide on Financial Soundness Indicators, Appendix VII: Glossary (Washington).
International Monetary Fund, 2009, Crisis and Recovery, World Economic and Financial Surveys (Washington, April).
International Monetary Fund, 2010 Sixth Edition of the IMF's Balance of Payments and International Investment Position Manual (Washington, January).

45
Jorion, Philippe, 2007, Value at Risk, Third Edition (New York: McGraw-Hill).
Jorion, Philippe, 2009, Financial Risk Manager Handbook, Fifth Edition (Hoboken: John Wiley & Sons, Inc.)
Rosenberg, Christoph, and Marcel Tirpák, 2008, “Determinants of Foreign Currency Borrowing in the New Member States of the EU,” IMF Working Paper No. 08/173 (Washington: International Monetary Fund).
Stone, Mark R., Christopher W. Walker and Yosuke Yasui, 2009, “From Lombard Street to Avenida Paulista: Foreign Exchange Liquidity Easing in Brazil in Response to the Global Shock of 2008–09,” IMF Working Paper No. 09/259 (Washington: International Monetary Fund).
The Foreign Exchange Joint Standing Committee, 2009a, “Results of the Semi-Annual FX Turnover Survey in October 2008” (London, January).
The Foreign Exchange Joint Standing Committee, 2009b, “Results of the Semi-Annual FX Turnover Survey, April 2009” (London, July).