baird global consumer, tech & services conference
TRANSCRIPT

Baird Global Consumer, Tech & Services Conference
June 8, 2021

©2021 ASGN Incorporated. All rights reserved.
Safe Harbor
Certain statements made in this presentation are “forward-looking statements” within the meaning of Section 21E of the Securities Exchange
Act of 1934, as amended, and involve a high degree of risk and uncertainty. Forward-looking statements include statements regarding our
anticipated financial and operating performance.
All statements in this presentation, other than those setting forth strictly historical information, are forward-looking statements. Forward-looking
statements are not guarantees of future performance and actual results might differ materially. In particular, we make no assurances that the
proposed revenue scenarios outlined in this presentation will be achieved. Additional examples of forward-looking statements in this
presentation include, without limitation, statements regarding the expected impact of the COVID-19 global pandemic on our competitive position
and demand for our services; our ability to attract, train and retain qualified staffing consultants, the availability of qualified contract
professionals, management of our growth, continued performance and improvement of our enterprise-wide information systems, our ability to
manage our litigation matters, the successful integration of our acquired subsidiaries, and other risks detailed from time to time in our reports
filed with the SEC, including our Annual Report on Form 10-K for the year ended December 31, 2020, as filed with the SEC on March 1, 2021.
We specifically disclaim any intention or duty to update any forward-looking statements contained in this presentation.
2

©2021 ASGN Incorporated. All rights reserved.
ASGN at a Glance (NYSE: ASGN)
One of the foremost providers of IT consulting
and professional services in the technology,
digital, creative, engineering and life sciences
fields across commercial and government
markets
Our Company
Commercial & Federal Government IT Services
offer industry knowledge and depth, scalable
solutions with expansive geographic reach
Our Markets
Support leading corporate enterprises and
government organizations in developing,
implementing and operating critical IT and
business solutions through an integrated
offering of professional staffing & IT consulting
solutions
Our Customers
• 10,300 customer relationships
• Relationships with ~300 of Fortune 500
• ~51,000 contract professionals placed in 2020
Deep, Trusted Relationships
• ~$4.0 billion in LTM Revenue1
• $444.4 million in LTM Adjusted EBITDA1,2
• $453.9 million in LTM free cash flow1,2
Track Record of Excellence
• U.S. addressable market of $320 billion3
• Additional opportunities in Europe
• Early mover in the “shared economy”
• Favorable tailwinds: digital transformation;
migration of government agencies to the cloud;
applications and project management skillsets
in Agile, Cloud and Enterprise Resource
Planning (ERP)
Growing Addressable Market
3

©2021 ASGN Incorporated. All rights reserved.
Investment Highlights
1. Increasingly IT-Centric
Focus on higher-end, higher-margin IT consulting services and solutions,
particularly those related to digital transformation.
2. Unique Go-To-Market Strategy
Diverse base of commercial and government clients, including large accounts
that are stable sources of revenue and quick adopters of new technologies.
3. Significant Exposure to Federal Government Marketplace
25.1% of Q1 2021 revenues generated from federal and civilian agencies, which
are better insulated from economic uncertainty than commercial companies.
4. Strong Balance Sheet & Liquidity
Solid free cash flow generation provides flexibility to direct funds in best interests
of all stakeholders, including making acquisitions without additional leverage.
5. Flexible Cost Structure
Variable expense structure provides high conversion of free cash flow to Adjusted
EBITDA. Conversion rate of 101.7% in Q1 2021.
6. Strong Track Record in M&A
History of successfully integrating acquisitions that have broadened client base
and added key IT capabilities and contracts.
7. Experienced Management Team
Led by industry experts who have successfully managed the business and its
clients throughout market cycles.
4
Significant
Exposure
to Federal
Government
Marketplace
3
Increasingly
IT-Centric
1
Unique
Go-To-
Market
Strategy
2
Strong Balance
Sheet &
Liquidity
4
Flexible Cost
Structure
5
Strong Track
Record
in M&A
6
Experienced
Management
Team
7

©2021 ASGN Incorporated. All rights reserved.
ASGN: A Leader in High-End IT Services & Solutions
5
Technical Staffing
Service Centers
Systems Deployment(incl. upgrades)
Design
Architecture
Strategy
Federal Government IT
Solutions OfferingsMission-critical IT services
for the Federal Government
Commercial IT
Service OfferingsDigital transformation solutions for
multiple commercial end markets

©2021 ASGN Incorporated. All rights reserved.
Segment Overview
$1,049.3 Million26.3% of Consolidated Revenues
Mission-critical high-end IT solutions
for the Federal Government
Federal Government IT Solutions
$514.0 Million12.9% of Consolidated Revenues
$2,422.5 Million60.8% of Consolidated Revenues
LTM Revenues1
Creative/Digital skills and solutions
Mission-critical IT skills and solutions High-end IT, engineering and life
sciences skills and solutions
Permanent placement solutions, information
technology, engineering, finance & accounting,
healthcare
Commercial IT Services
6

©2021 ASGN Incorporated. All rights reserved.
Summary of Consolidated Financial Data — Q1 2021
7
OPERATING DATA REVENUE MIX CASH FLOW DATABALANCE SHEET & OTHER
Q4 2020 Q4 2019
Cash Flows From Operating
Activities
$119.8 Million +86.9% Y-Y
Free Cash Flow2
$110.5 Million +126.4% Y-Y
Cash used for:
Capital
Expenditures $9.3 Million
Revenues Y-Y SEQ
$1.03 Billion 3.6% 1.4%
Gross Profit
$281.0 Million Flat 1.6%
Gross Margin
27.4% (100 bps) Flat
Net Income
$48.7 Million 11.2% (12.1%)
Adj. Net Income2
$61.6 Million 6.8% (12.1%)
Adj. EBITDA2
$108.6 Million 4.9% (6.6%)
61.4% 68.1%
38.6% 31.9%
Q1 2021 Q1 2020
($ in millions) 3/31/21 3/31/20
Cash & Cash
Equivalents$ 386.5 $ 64.0
Working Capital $ 645.3 $ 428.5
Senior Debt:
Secured Facility $ 483.7 $ 515.5
Unsecured Notes 550.0 550.0
Total Debt $ 1,033.7 $ 1,065.5
Total Stockholders’
Equity$ 1,645.8 $ 1,399.5
Senior Secured Leverage Ratio5
1.13 to 1.0
Availability Under Revolving Credit
Facility6
$250.0 Million
74.9% 78.5%
25.1% 21.5%
Q1 2021 Q1 2020
Assignment4
Federal
Consulting
Commercial
Q1 2021 Q1 2020

©2021 ASGN Incorporated. All rights reserved.
Commercial Business (74% of LTM revenues)
TMTFinancial Services Business & Govt. ServicesHealthcareConsumer & Industrials
• Financial Services: Big Banks, Regional Banks, FinTech, and Insurance Services driving growth; stimulus funding pushed
through commercial banks continues to create a heightened need for IT modernization.
• Consumer & Industrial: Utilities, Consumer Staples, Specialty Retail, E-Commerce showing relative strength; while Airlines,
Energy and Hospitality sectors continue to improve sequentially.
• Healthcare: Demand for digital transformation (mobile/customer experience) and health records modernization
continues to be a longer-term focus, while hospital networks focus on COVID-19 in the near-term.
• TMT: Integration/M&A, COVID-19-related work from home initiatives and re-shoring of IT support capabilities
(Mexico Delivery Center gaining traction). Media & entertainment sector weakness expected near-term.
• Business & Govt. Services: Increased demand for digital transformation, cloud, data analytics, AI and cyber security initiatives.
Tailwinds from State & Local and businesses transitioning to online models.
Cloud Solutions
Cyber Security
Workforce Management
DevOps/Agile
Trends
• Large and expanding
addressable market
• Ample and resilient funding
• Durable, digital
transformation
requirements
• Deep, decades-long
client relationships
8
©2021 ASGN Incorporated. All rights reserved.
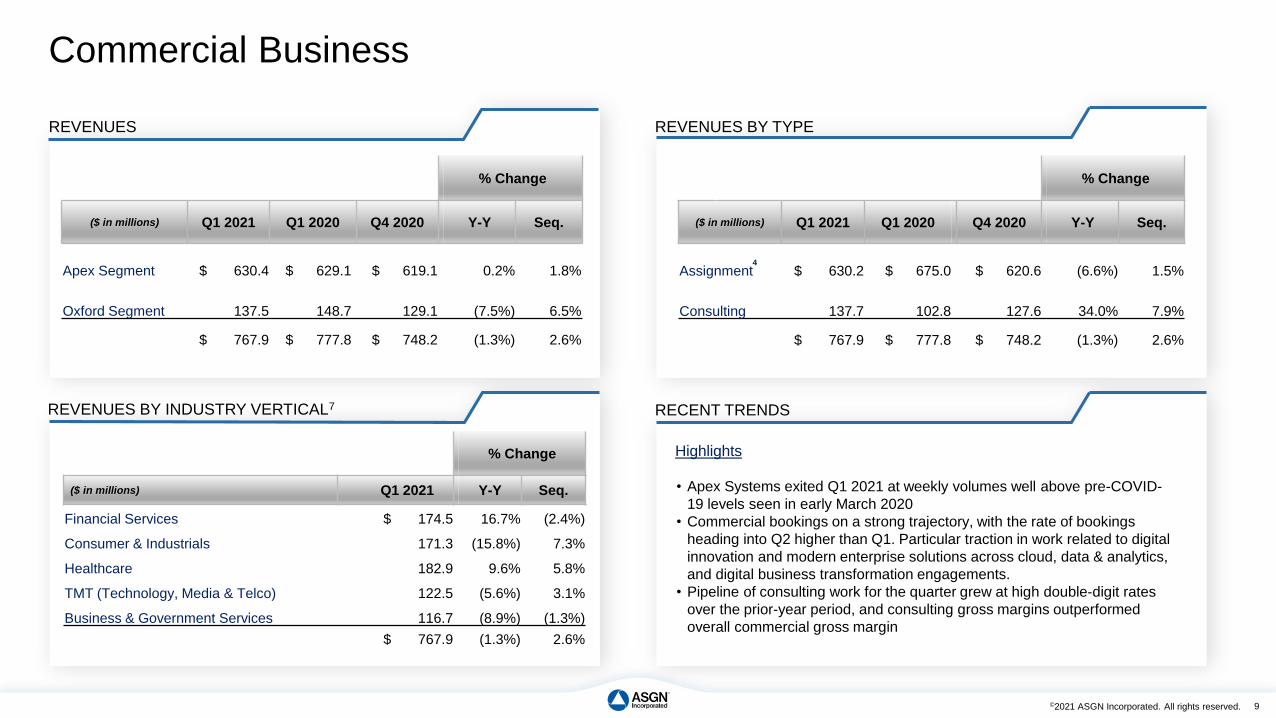
Commercial Business
9
Q4 2020
% Change
($ in millions) Q1 2021 Q1 2020 Q4 2020 Y-Y Seq.
Assignment $ 630.2 $ 675.0 $ 620.6 (6.6%) 1.5%
Consulting 137.7 102.8 127.6 34.0% 7.9%
$ 767.9 $ 777.8 $ 748.2 (1.3%) 2.6%
REVENUES BY TYPE
REVENUES BY INDUSTRY VERTICAL7 RECENT TRENDS
REVENUES
% Change
($ in millions) Q1 2021 Q1 2020 Q4 2020 Y-Y Seq.
Apex Segment $ 630.4 $ 629.1 $ 619.1 0.2% 1.8%
Oxford Segment 137.5 148.7 129.1 (7.5%) 6.5%
$ 767.9 $ 777.8 $ 748.2 (1.3%) 2.6%
% Change
($ in millions) Q1 2021 Y-Y Seq.
Financial Services $ 174.5 16.7% (2.4%)
Consumer & Industrials 171.3 (15.8%) 7.3%
Healthcare 182.9 9.6% 5.8%
TMT (Technology, Media & Telco) 122.5 (5.6%) 3.1%
Business & Government Services 116.7 (8.9%) (1.3%)
$ 767.9 (1.3%) 2.6%
Highlights
• Apex Systems exited Q1 2021 at weekly volumes well above pre-COVID-
19 levels seen in early March 2020
• Commercial bookings on a strong trajectory, with the rate of bookings
heading into Q2 higher than Q1. Particular traction in work related to digital
innovation and modern enterprise solutions across cloud, data & analytics,
and digital business transformation engagements.
• Pipeline of consulting work for the quarter grew at high double-digit rates
over the prior-year period, and consulting gross margins outperformed
overall commercial gross margin
4

©2021 ASGN Incorporated. All rights reserved.
Federal Government Business (26% of LTM revenues)
Defense OtherFederal CivilianIntelligence & National Security
Cloud Solutions
Cyber Security
Artificial Intelligence & Analytics
IT Modernization
Science & Engineering
• Massive addressable market
• Resilient funding with durable
mission and technology
requirements
• Profitable counter-cyclicality
• Excellent free cash flow
generation
10
Trends
• Budget & Funding Tailwinds: Defense budget and spending remains flat while civilian spend is growing; both shifting toward IT
Modernization, and Data Analytics; past performance and decades long relationships within high-demand government funding streams.
• Growing IT Transformation Demand: Legacy system modernization and new requirements driving cloud migration, automation and
innovation. Past performance and elite technology partnerships resulting in positioning as an outcomes-based trusted advisor.
• Expanding Data & Security Needs: Government priorities driving AI and cyber security growth across the Federal landscape.
Solutions portfolio is embedded within critical programs that are relied upon to address security threats domestically and abroad.
• Opportunities to Scale: In-demand market offers opportunities for scaling, diversification, and efficiency gains that drive revenue
growth and margin expansion. As an acquirer of choice, platform positioned for a high-return portfolio-shaping investments.

©2021 ASGN Incorporated. All rights reserved.
Federal Government Business (ECS Segment)
11
Q1 2021 Q1 2020 Q4 2020
Firm-Fixed-Price 23.5% 26.8% 26.9%
Time and Materials 35.2% 34.0% 33.4%
Cost Reimbursable 41.3% 39.2% 39.7%
REVENUES BY CONTRACT TYPE
REVENUES BY CUSTOMER
CONTRACT BACKLOG8
TTM RATIOS
Q1 2021 Q1 2020 Q4 2020
Defense and Intel 55.6% 54.0% 54.7%
Federal Civilian 35.9% 39.8% 35.9%
Other 8.5% 6.2% 9.4%
($ in millions) 3/31/21 12/31/20 3/31/20
Funded Backlog9 $ 458.7 $ 444.5 $ 490.6
Unfunded Backlog10 2,221.3 2,201.7 2,186.7
Total $ 2,680.0 $ 2,646.2 $ 2,677.3
3/31/21 12/31/20 3/31/20
Backlog Coverage Ratio11 2.5x 2.6x 3.0x
TTM Book-to-Bill12 0.9 to 1.0 1.0 to 1.0 2.0 to 1.0
RECENT TRENDS
Recognitions
• Named first Certified Analytics
Professionals Preferred Employer in
federal services space13
• Ranked #1 in the 2021 Top 100 Managed
Security Service Providers (MSSPs) list
conducted by MSSP Alert! and
Channel2E14
• ISO 9000 and 20000 recertification
Recent Significant Contracts
DoD/Intelligence• Awarded contract to provide
comprehensive enterprise and mission-
embedded IT support for Sandia National
Laboratories
• Won recompete of classified Navy IT and
Cybersecurity program
Federal Civilian• 10+ new awards or expansion of
ServiceNow modernization efforts
% Change
($ in millions) Q1 2021 Q1 2020 Q4 2020 Y-Y Seq.
Revenues $ 257.8 $ 212.7 $ 263.2 21.2% (2.1%)
Gross Profit $ 45.0 $ 37.1 $ 42.1 21.3% 6.9%
REVENUES & GROSS PROFIT

©2021 ASGN Incorporated. All rights reserved.
Q1 2018 Q2 2018 Q3 2018 Q4 2018 Q1 2019 Q2 2019 Q3 2019 Q4 2019 Q1 2020 Q2 2020 Q3 2020 Q4 2020 Q1 2021
Revenue Growth Rate Y-Y 9.4% 34.5% 35.9% 36.9% 34.8% 10.7% 10.6% 10.3% 7.2% (3.7%) 0.9% (1.3%) 3.6%
EPS - Diluted:
GAAP $0.55 $0.63 $0.93 $0.86 $0.66 $0.81 $1.08 $0.74 $0.82 $0.92 $0.99 $1.04 $0.91
Adjusted2
$0.83 $1.11 $1.30 $1.14 $0.93 $1.10 $1.31 $1.28 $1.08 $1.17 $1.27 $1.31 $1.15
12
Revenues and EPS – Diluted (GAAP and Adjusted2)
Revenue Growth and EPS – Diluted (GAAP and Adjusted2)
$685
$879 $906 $930 $924 $972 $1,003 $1,025
$991 $937
$1,012 $1,011 $1,026
$0.55$0.63
$0.93 $0.86
$0.66$0.81
$1.08
$0.74 $0.82$0.92 $0.99 $1.04
$0.91
$0.83
$1.11$1.30
$1.14
$0.93$1.10
$1.31 $1.28$1.08
$1.17$1.27 $1.31
$1.15
Q1 2018 Q2 2018 Q3 2018 Q4 2018 Q1 2019 Q2 2019 Q3 2019 Q4 2019 Q1 2020 Q2 2020 Q3 2020 Q4 2020 Q1 2021
Revenues GAAP Diluted EPS Adjusted Diluted EPS
($ in millions, except per share data)
2

©2021 ASGN Incorporated. All rights reserved.
Q2 2021 Financial Estimates
13
($ in millions, except per share data) Low Mid-Point High
Revenues $ 1,058.0 $ 1,068.0 $ 1,078.0
Y-Y Growth Rates 12.9% 14.0% 15.1%
Gross Margin 28.3% 28.4% 28.5%
SG&A Expenses15 200.7 202.1 203.5
Amortization of Intangible Assets 12.1 12.1 12.1
Interest Expense 9.3 9.3 9.3
Net Income
GAAP $ 56.4 $ 58.2 $ 60.1
Adjusted2 $ 68.2 $ 70.0 $ 71.8
EPS (Diluted)
GAAP $ 1.05 $ 1.09 $ 1.12
Adjusted2 $ 1.27 $ 1.30 $ 1.33
Effective Tax Rate 27.0% 27.0% 27.0%
Adjusted EBITDA2 $ 119.0 $ 121.5 $ 124.0
Adjusted EBITDA Margin2 11.2% 11.4% 11.5%
Diluted Shares 53.9 53.9 53.9

Appendix

©2021 ASGN Incorporated. All rights reserved.
ASGN / ESG Reporting Policies
15
OurGuidingPrinciplesASGN’s ESG approach is structured around our five pillars that reflect the opportunitiesthe Company deems most relevant to our business model and key stakeholders:
Identify and address enterprise
security risks. Position ASGN
as the premier provider of
technology, talent, support, and
advice. In the constant
evolution of technology, foster a
culture of innovation.
Maintain robust governance
and oversight, and the
highest standards of honesty,
integrity, and trustworthiness.
Provide and uphold a culture
of ethics and integrity for our
employees, consultants,
clients, and communities that
we serve, and preserve and
enhance our long- term value
for our stockholders.
Provide a highly diverse,
equitable, and inclusive
workplace dedicated to
continual improvement.
Support the growth of our
employees and consultants
through the provision of
robust wellbeing initiatives
and exceptional and
innovative working practices
to deliver excellent results to
our clients.
Create positive impacts for
all stakeholders through
meaningful engagement,
generous and sustained
charitable contributions,
and volunteerism to uplift
communities where many of
our employees are rooted.
Improve our operating
performance by
conserving resources,
reducing waste and our
carbon emissions while
increasing our overall
positive contributions to
society and our shared
environment, and
maintaining high
productivity for our
stakeholders.
I. Data and SecurityV. Environmental
ResponsibilityIII. Our WorkforceII. Responsible
Business
IV. Social
Responsibility

©2021 ASGN Incorporated. All rights reserved.
In 2021:
• We have established a Philanthropy
Committee to help us focus our
CSR efforts.
• Committed to measuring and
establishing a baseline for carbon
usage.
• Developed a Green Leasing Policy
and Sustainable Office Guidelines.
• Dedicated ourselves to advancing
gender equity by having at least
three female directors on our Board
by 2022.
• Joined the United Nations’
Global Compact.
2021 ESG Goals
“To succeed as a company, it is
essential that ASGN maintains
a solid reputation as a strong
and trustworthy partner
who demonstrates
excellence in all aspects
of our business…Our
2020 ESG Report is our
promise to all of our stakeholders
that we will continue to work toward
achieving our goals and then some.”
16
Ted Hanson,President and CEO,
ASGN Incorporated

©2021 ASGN Incorporated. All rights reserved.
Selected Financial Data
17
2021
($ in millions, except per share data) Q1 Q2 Q3 Q4 FY Q1 Q2 Q3 Q4 FY Q1
Revenues - by Type
Assignment 671.5$ 687.9$ 696.5$ 684.4$ 2,740.3$ 675.0$ 600.7$ 612.6$ 620.6$ 2,508.9$ 630.2$
Consulting 84.2 93.8 100.1 107.3 385.4 102.8 96.4 110.7 127.6 437.5 137.7
Commercial (Apex & Oxford Segments - Combined) 755.7 781.7 796.6 791.7 3,125.7 777.8 697.1 723.3 748.2 2,946.4 767.9
Federal Government (ECS Segment) 168.0 190.6 206.1 233.5 798.2 212.7 239.7 288.6 263.2 1,004.2 257.8
Consolidated 923.7$ 972.3$ 1,002.7$ 1,025.2$ 3,923.9$ 990.5$ 936.8$ 1,011.9$ 1,011.4$ 3,950.6$ 1,025.7$
Revenues - by Segment and Type
Apex Segment
Assignment 533.7$ 549.0$ 559.0$ 549.2$ 2,190.9$ 539.5$ 491.6$ 499.5$ 509.7$ 2,040.3$ 512.8$
Consulting 72.4 79.5 85.1 92.1 329.1 89.6 85.3 96.6 109.4 380.9 117.6
606.1 628.5 644.1 641.3 2,520.0 629.1 576.9 596.1 619.1 2,421.2 630.4
Oxford Segment
Assignment 137.8 138.9 137.5 135.2 549.4 135.5 109.1 113.1 110.9 468.6 117.4
Consulting 11.8 14.3 15.0 15.2 56.3 13.2 11.1 14.1 18.2 56.6 20.1
149.6 153.2 152.5 150.4 605.7 148.7 120.2 127.2 129.1 525.2 137.5
Commercial 755.7 781.7 796.6 791.7 3,125.7 777.8 697.1 723.3 748.2 2,946.4 767.9
Federal Government 168.0 190.6 206.1 233.5 798.2 212.7 239.7 288.6 263.2 1,004.2 257.8
Consolidated 923.7$ 972.3$ 1,002.7$ 1,025.2$ 3,923.9$ 990.5$ 936.8$ 1,011.9$ 1,011.4$ 3,950.6$ 1,025.7$
Billable Days 62.00 64.00 63.00 60.50 249.50 63.00 63.75 64.00 60.50 251.25 62.00
Revenues Per Billable Day (Commercial Only) 12.2$ 12.2$ 12.6$ 13.1$ 12.5$ 12.3$ 10.9$ 11.3$ 12.4$ 11.7$ 12.4$
Gross Margin - by Business
Apex Segment 28.9% 29.9% 29.8% 29.7% 29.6% 29.3% 29.6% 29.0% 29.5% 29.4% 28.9%
Oxford Segment 39.4% 40.8% 40.6% 39.6% 40.1% 39.9% 38.6% 40.9% 40.1% 39.9% 39.2%
Commercial 31.0% 32.0% 31.9% 31.6% 31.6% 31.3% 31.1% 31.1% 31.3% 31.2% 30.7%
Federal Government 17.6% 18.3% 18.1% 16.8% 17.7% 17.4% 18.3% 15.9% 16.0% 16.8% 17.5%
Consolidated 28.6% 29.3% 29.1% 28.2% 28.8% 28.4% 27.8% 26.8% 27.4% 27.6% 27.4%
Net income 34.9$ 43.1$ 57.4$ 39.3$ 174.7$ 43.8$ 48.8$ 52.3$ 55.4$ 200.3$ 48.7$
Earnings per share - Diluted 0.66$ 0.81$ 1.08$ 0.74$ 3.28$ 0.82$ 0.92$ 0.99$ 1.04$ 3.76$ 0.91$
Adjusted net income 49.4$ 58.9$ 69.7$ 68.3$ 246.3$ 57.7$ 61.7$ 67.1$ 70.1$ 256.6$ 61.6$
Adjusted earnings per share - Diluted 0.93$ 1.10$ 1.31$ 1.28$ 4.61$ 1.08$ 1.17$ 1.27$ 1.31$ 4.81$ 1.15$
Cash generated from operating activiities 44.0$ 96.5$ 91.3$ 81.4$ 313.2$ 64.1$ 186.1$ 87.6$ 87.0$ 424.8$ 119.8$
Free cash flow 36.5$ 88.1$ 84.4$ 71.5$ 280.5$ 48.8$ 178.8$ 81.9$ 82.7$ 392.2$ 110.5$
Adjusted EBITDA 97.1$ 114.2$ 121.5$ 116.2$ 449.0$ 103.5$ 106.2$ 113.3$ 116.3$ 439.3$ 108.6$
Adjusted EBITDA Margin 10.5% 11.7% 12.1% 11.3% 11.4% 10.5% 11.3% 11.2% 11.5% 11.1% 10.6%
2019 2020

©2021 ASGN Incorporated. All rights reserved.
Reconciliation of GAAP to Non-GAAP Measures
18
2021
($ in millions) Q1 Q2 Q3 Q4 FY Q1 Q2 Q3 Q4 FY Q1
Reconciliation of Net Income to Adjusted EBITDA
Net Income 34.9$ 43.1$ 57.4$ 39.3$ 174.7$ 43.8$ 48.8$ 52.3$ 55.4$ 200.3$ 48.7$
Loss from discontinued operations, net of tax - - 0.1 - 0.1 - - - - - -
Interest expense 14.5 14.0 12.7 11.7 52.9 11.4 9.7 9.3 9.3 39.7 9.2
Write-off of loan cost - - - 18.9 18.9 - - - - - -
Provision for income taxes 13.3 16.2 20.7 11.8 62.0 15.7 17.5 19.3 17.9 70.4 16.9
Depreciation 9.7 10.0 10.3 10.1 40.1 9.3 9.0 9.8 9.9 38.0 9.8
Amortization of intangible assets 13.8 13.1 11.9 12.3 51.1 12.1 12.6 12.9 14.1 51.7 12.2
EBITDA (non-GAAP measure) 86.2 96.4 113.1 104.1 399.8 92.3 97.6 103.6 106.6 400.1 96.8
Stock-based compensation 9.5 13.9 7.7 8.2 39.3 8.7 8.1 7.1 8.4 32.3 10.3
Write-off of intangible assets - 3.3 - - 3.3 - - - - - -
Acquisition, integration and strategic planning expenses 1.4 0.6 0.7 3.9 6.6 2.5 0.5 2.6 1.3 6.9 1.5
Adjusted EBITDA (non-GAAP measure) 97.1$ 114.2$ 121.5$ 116.2$ 449.0$ 103.5$ 106.2$ 113.3$ 116.3$ 439.3$ 108.6$
Reconciliation of Net Income to Adjusted Net Income
Net income 34.9$ 43.1$ 57.4$ 39.3$ 174.7$ 43.8$ 48.8$ 52.3$ 55.4$ 200.3$ 48.7$
Loss from discontinued operations, net of tax - - 0.1 - 0.1 - - - - - -
Write-off of loan costs - - - 18.9 18.9 - - - - - -
Write-off of intangible assets - 3.3 - - 3.3 - - - - - -
Acquisition, integration and strategic planning expenses 1.4 0.6 0.7 3.9 6.6 2.5 0.5 2.6 1.3 6.9 1.5
Tax effect on adjustments (0.4) (1.0) (0.1) (6.0) (7.5) (0.7) (0.1) (0.6) (0.4) (1.8) (0.4)
Non-GAAP net income 35.9 46.0 58.1 56.1 196.1 45.6 49.2 54.3 56.3 205.4 49.8
Amortization of intangible assets 13.8 13.1 11.9 12.3 51.1 12.1 12.6 12.9 14.1 51.7 12.2
Income taxes on amortization for financial reporting
purposes not deductible for income tax purposes (0.3) (0.2) (0.3) (0.1) (0.9) - (0.1) (0.1) (0.3) (0.5) (0.4)
Adjusted net income (non-GAAP measure) 49.4$ 58.9$ 69.7$ 68.3$ 246.3$ 57.7$ 61.7$ 67.1$ 70.1$ 256.6$ 61.6$
Calculation of Free Cash Flow
Cash provided by operating activities 44.0$ 96.5$ 91.3$ 81.4$ 313.2$ 64.1$ 186.1$ 87.6$ 87.0$ 424.8$ 119.8$
Capital expenditures (7.5) (8.4) (6.9) (9.9) (32.7) (15.3) (7.3) (5.7) (4.3) (32.6) (9.3)
Free cash flow (non-GAAP measure) 36.5$ 88.1$ 84.4$ 71.5$ 280.5$ 48.8$ 178.8$ 81.9$ 82.7$ 392.2$ 110.5$
Cash tax savings on indefinite-lived intangible assets
(benefit not included in adjusted net income) 7.0$ 7.0$ 7.0$ 7.1$ 28.1$ 7.3$ 7.4$ 7.4$ 7.5$ 29.6$ 7.5$
2019 2020

©2021 ASGN Incorporated. All rights reserved.
Footnotes
1 Last twelve months as of 3/31/21.
2 This presentation includes non-GAAP financial measures. A description of these non-GAAP
financial measures and the reconciliation from the comparable GAAP measures to the non-GAAP
measures are included in the earnings release for the first quarter of 2021.
3 U.S. Staffing market size from Staffing Industry Analysts’ “US Staffing Industry Forecast, Sept. 10,
2020”. Commercial IT Services from Gartner; Technavio; Comptia; Parthenon-EY Survey (Light
Deliverable Services) and ASGN internal estimates. Government IT Solutions from Deltek
GovWinIQ Federal IT Forecast FY2020 - 2022 and ASGN internal estimates.
4 Permanent placement revenues are no longer significant to our consolidated results for disclosure
purposes. Consequently, we no longer present these revenues separately, but instead they are
included in assignment revenues; all prior periods have been recast for this change in presentation.
5 The ratio of the aggregated principal amount of consolidated indebtedness secured by a Lien on
asset of ASGN or any of its subsidiaries to Lender defined trailing 12-months of EBITDA (Maximum
leverage allowable is 4.0 to 1.0 of borrowings outstanding under revolver).
6 The revolving credit facility available balance is $246.0 million after adjusting for outstanding
letters of credit.
7 Verticals broadly defined as:
• Financial Services: banks, thrifts & mortgage services, consumer finance, capital markets,
financial technology, insurance, and investment firms
• Consumer & Industrials: consumer staples, consumer discretionary, energy, materials, utility &
real estate
• Healthcare: equipment & service providers and payers, health insurance administrators operating
as diversified healthcare companies, biotechnology, pharmaceuticals and life science tools &
services
• TMT (Technology, Media & Telco): software applications & systems, services excluding
consulting & data processing/outsourced services, hardware manufacturing & services,
equipment & electronic manufacturing services, diversified Telco including wired/wireless Telco
services; media, entertainment and interactive media/services
• Business & Government Services: contractors, federal government agencies and state and local
government, aerospace, professional services, human resource & employment, data processing
& outsourced services, IT consulting, and other services
8 Contract backlog represents the estimated amount of future revenues to be recognized under
negotiated contracts and task orders as work is performed. Contract backlog excludes awards
which have been protested by competitors until the protest is resolved in our favor. Contract
backlog is segregated into two categories, funded contract backlog and negotiated unfunded
contract backlog.
9 Funded contract backlog for contracts with U.S. government agencies primarily represents
contracts for which funding has been formally awarded less revenues previously recognized on
these contracts, and does not include the unfunded portion of contracts where funding is
incrementally awarded or authorized by the U.S. government even though the contract may call for
performance over a number of years. Funded contract backlog for contracts with non-government
agencies represents the estimated value of contracts, which may cover multiple future years, less
revenues previously recognized on these contracts.
10 Negotiated unfunded contract backlog represents the estimated future revenues to be earned
from negotiated contract awards for which funding has not been awarded or authorized, and
unexercised priced contract options. Negotiated unfunded contract backlog does not include any
estimate of future potential task orders expected to be awarded under indefinite delivery, indefinite
quantity (IDIQ), U.S. General Services Administration (GSA) schedules or other master agreement
contract vehicles.
11 Backlog coverage ratio is calculated by dividing total contract backlog by trailing twelve months
revenue.
12 Book-to-bill ratio is calculated as the sum of the change in total contract backlog during the period
plus revenues for the period, divided by revenues for the period.
13 Company press release dated 12/10/20.
14 MSSP Alert! and Chanel2E “Top 100 Vertical Market MSPs 2021 Edition”
15 Includes $10.6 million in stock-based compensation and $8.4 million in depreciation. An
additional $1.3 million of depreciation is included in Cost of Services.
19

ASGN Incorporated 4400 Cox Road, Suite 110 | Richmond, VA 23060 888.482.8068 | investors.ASGN.com