average pay tv revenues per subscriber across europe · pdf fileaverage pay tv revenues per...
TRANSCRIPT

Prepared For:
BSkyB
Average Pay TV Revenues per Subscriber across Europe A review of LECG’s empirical study
CRA and Prof. John Van Reenen
Principal authors:
Dr Hugh Wills CRA International 99 Bishopsgate London EC2M 3XD Prof John Van Reenen London School of Economics
Date: 29 October 2007

Review of LECG’s study
29 October 2007 CRA International
Page i
TABLE OF CONTENTS
EXECUTIVE SUMMARY.....................................................................................................2
1. INTRODUCTION AND OVERVIEW.............................................................................6
2. LECG’S ANALYSIS ......................................................................................................7
3. CROSS-COUNTRY VARIATION IN AVERAGE REVENUE REFLECTS VARIATION IN QUALITY AND DISTRIBUTION SYSTEMS............................................................9
4. MAJOR PROBLEMS IN LECG’S ANALYSIS ............................................................11
4.1. OVERVIEW OF PROBLEMS.............................................................................................11 4.2. SCREENDIGEST’S PROGRAMMING EXPENDITURE PER SUBSCRIBER IS A VERY POOR
MEASURE OF QUALITY...................................................................................................13 4.3. LACK OF ADEQUATE CONTROL FOR QUALITY IS EXACERBATED BY THE INCLUSION OF
PROVISION OF FTA VIA CABLE SERVICES IN THE OUTCOME VARIABLE................................15 4.4. MISLEADING “MARKET STRUCTURE” VARIABLES .............................................................16 4.5. SOME PROBLEMS WITH LECG’S MODELLING APPROACH ................................................18 4.6. LECG’S DATA APPEARS TO CONTAIN MATERIAL ERRORS................................................21 4.7. LECG’S ECONOMETRIC RESULTS ARE NOT ROBUST ......................................................22
5. CONCENTRATION INDICES SHOW UK MARKET IS ONE OF THE MOST COMPETITIVE............................................................................................................29
6. CONCLUSIONS .........................................................................................................32
APPENDIX A: DATA..........................................................................................................35
APPENDIX B: REPLICATED REGRESSIONS.................................................................44
APPENDIX C: CONCENTRATION INDICES ...................................................................46
APPENDIX D: ANALYSIS OF THE RELATION BETWEEN PER SUBSCRIBER PROGRAMME EXPENDITURE AND ARPS. ............................................................50
Review of LECG’s study
29 October 2007 CRA International
Page 2
EXECUTIVE SUMMARY
1. We have been asked by BSkyB (“Sky”) to review and comment on an empirical analysis prepared by LECG on pay TV prices in Europe (“Pay TV prices in Europe (1997-2005), an Econometric Analysis”, LECG Europe, 18 June 2007).
2. LECG’s analysis is appended to a complaint (“the complaint”) submitted to Ofcom by a group of competitors (BT, Virgin Media, Setanta Sport and Top Up TV – “the Complainants”) on “the need for a market investigation in the pay TV industry”.1 It forms the basis for claims in the complaint of extensive “consumer harm”, in the form of higher prices paid for pay TV in the UK relative to other countries, resulting from “the combination of the structural characteristics of the pay TV industry and Sky’s conduct at each of the key levels of the supply chain”.
3. The complaint contains extensive claims about “a vicious circle resulting from the control of mutually reinforcing upstream and downstream bottlenecks in pay TV” (also mentioned by LECG at slide 11). Sky’s position at different levels of the supply chain is regarded as responsible for generating these bottlenecks. We examine the “vicious circle theory” in a companion paper (“Sky’s “Incentives” to Foreclose Competition in the UK Pay TV Industry: A response to the complaint by BT et. al.”), and do not return to it here. We note however that LECG’s empirical analysis of the effects of market structure on “pay TV prices” does not include any variable to measure the degree of vertical integration in each country: as such it is entirely incapable of supporting any “vicious circle” argument. Nonetheless, LECG’s empirical analysis is used in the complaint directly to support the claim that “the vicious circle (…) harms consumers as a result of less competition, [in that] they pay higher prices” (Part 4, ¶1.3 of the complaint).
4. This paper focuses entirely on LECG’s empirical analysis. LECG claim to compare “pay TV prices” across a sample of 15 European countries over 9 years – from 1997 to 2005. In fact, they examine average pay TV revenue per subscriber (ARPS), as the “prices” they use in their analysis are in fact prices paid by no one, for packages that do not exist. They find huge variation across ARPS in the sample – ranging between £73.9 per year in Finland and £300.5 per year in the UK.
5. LECG then attempt to explain this variation based on differences in demand factors and in market structure. They find that after taking into account (controlling for) differences in demand and market structure, ARPS in the UK in 2005 is only 9 percent above the European average. However, if they control for differences in demand alone – and not in market structure – the difference increases to 36
1 “Submission to Ofcom on the need for a market investigation into the pay TV industry”, BT plc, Setanta Sport Holdings Ltd, Top Up TV and Virgin Media, 3 July 2007.

Review of LECG’s study 29 October 2007 CRA International
Page 3
percent. LECG (and the Complainants in their submission) interpret this result to suggest that because of the structural characteristics of the market in the UK, consumers in the UK are paying 36 percent more than the European average for pay TV packages of the same quality because of structural problems in the UK industry (Part 4, ¶ 3.3, 3.4 and 3.7 of the complaint).
6. In reviewing LECG’s analysis we have found flaws in the approach, the data and the interpretation of the results they obtain. In consequence we believe that LECG’s econometric study does not provide any reliable grounds for concluding that prices for pay TV packages of similar quality are higher in the UK than in other European countries. As a result, the study does not provide any evidence that the higher ARPS observed in the UK is due to high margins, a lack of competition, and/or special structural issues in the UK market.
7. Pay TV packages are not homogeneous and vary enormously in terms of content and price, both within and across countries and over time. LECG recognise that charges for pay TV services will reflect, among other things, the quality of those services. However there is no adequate control for quality in the LECG model. LECG use information gathered from ScreenDigest on “programme expenditure” in different countries as a control for “quality”. However, according to ScreenDigest, the data on “programme expenditure” only covers expenditure on movie rights for premium movie channels. It therefore excludes expenditures on all other types of programming carried on pay TV channels (most notably sports programming and programming on all basic channels). As a result, the data used by LECG to “control for quality” cover only a small part (about a fifth in the UK) of pay TV companies’ expenditures on content – and is therefore an extremely poor measure of programme quality.
8. As quality varies enormously across countries, and is likely responsible for a significant share of the variation in pay TV prices, failure to control adequately for quality means that LECG’s estimates suffer from a very severe omitted variable bias, and are therefore unreliable.
9. This failure is all the more serious as a result of the fact that in a number of European countries cable is used as the primary distribution method for households that receive free-to-air (FTA)-only services. In the ScreenDigest data used by LECG, payments to cable operators by households who use cable to receive FTA-only services in this way are treated as subscriptions to pay TV services – even though they receive no pay TV channels. The same is not true for FTA services distributed over the air, or via DTH. As a result, the data used by LECG includes as “pay TV subscribers” households taking only FTA services over cable, while households taking FTA services either over the air or on DTH are not classified as being “pay TV” and are therefore excluded. The services covered by the LECG definition of “pay TV” are therefore quite different for different platforms.

Review of LECG’s study 29 October 2007 CRA International
Page 4
10. Given the substantial measurement error in the programme expenditure variable, this has a major effect on LECG’s results: due to the inclusion of households receiving FTA programming as “pay TV” subscribers in countries with universal cable systems, there is enormous variation in the pay TV component in the average package purchased across countries and over time. The evidence indicates that the primary factor in determining the observed variation in ARPS in LECG’s data is variation across countries in the use of cable to distribute FTA programming – a factor that has nothing directly to do with market structure.
11. This is confirmed when we examine the relation between variation over time in programme expenditure and ARPS (LECG’s fixed effects estimation technique only takes account of variation over time and excludes variation across countries). We find that there is no relation between measured programme expenditure and ARPS. As we know that the major factor generating variation in ARPS in LECG’s data is variation across countries in the provision of FTA services via cable, this confirms that the ScreenDigest programme expenditure variable is completely inadequate as an indicator of relative “quality” of pay TV services.
12. A further major problem with LECG’s study is its analysis of the impact of “market structure” on ARPS. LECG’s main evidence to support their claim that prices are affected by market structure is their finding that there is a positive relationship between ARPS and the variable “market share of the largest DTH supplier”. That is, countries where DTH operators are larger appear to pay higher prices for pay TV. But this simply reflects the fact that some countries have greater DTH penetration than others; and where cable is used to deliver FTA-only television services, retailers operating on DTH platforms sell packages with a comparatively greater pay TV component than retailers operating on cable platforms. Hence the “share of DTH” variable is correlated with the omitted “quality” variable, and the correlation between ARPS and “share of DTH” is an artefact of the latter simply picking up the omitted quality variable.
13. We also find that LECG is wrong in claiming that data limitations prevent the calculation of other measures of market structure. We have calculated a range of standard concentration indices for the “pay TV markets” included in LECG’s study, and find that in fact, the market share of the largest DTH supplier is uncorrelated with those indices. Moreover, properly calculated concentration indices for the UK indicate that the UK pay TV market is amongst the least concentrated in Europe.
14. There are also serious data problems with LECG’s analysis. Though we attempted to reconstruct LECG’s data using information from ScreenDigest, we were unable to do so. The results using our data differ significantly from those reported by LECG. While, due to revisions, the data available to us from ScreenDigest are probably not identical to that available to LECG, there is evidence of errors by LECG in the construction of their own data set. At the very least, the fact that minor variations between the two data sets cause significant changes to the results

Review of LECG’s study 29 October 2007 CRA International
Page 5
indicates that LECG’s results are not robust. Insofar as these differences are due to errors in the construction of their data, their results are incorrect.
15. Finally, we find that LECG’s analysis contains many technical errors. As a result of a basic error both their estimation and forecasting techniques are incorrect. Their reliance on fixed effects estimation exacerbates the problems caused by the poor quality of their information on programme expenditure. The econometric model used by LECG also suffers from endogeneity in the right-hand side variables and fails to control for the serial correlation of the errors. This leads to biased estimates and faulty inference – again rendering their results entirely unreliable.
16. We conclude that the ScreenDigest data are consistent with the observed variation in ARPS being explained by variations in the pay TV component of the average packages sold in individual countries. Moreover, when LECG’s specifications are correctly re-estimated using our data, we find that UK ARPS are 3.1 percent below the European average. This contrasts sharply with LECG’s conclusion that there is a 9% UK premium.
17. We must therefore conclude that LECG’s analysis cannot be relied upon to tell us anything about any alleged consumer harm in the UK associated with the competitive state of the pay TV market. It certainly provides no evidence that the higher ARPS observed in the UK is due to high margins and a lack of competition in the market. It therefore provides no basis whatsoever for the “consumer harm” – in the form of higher pay TV prices paid by UK consumers – that is claimed by the Complainants in Part 4 of their submission.

Review of LECG’s study 29 October 2007 CRA International
Page 6
1. INTRODUCTION AND OVERVIEW
18. We have been asked by BSkyB (“Sky”) to evaluate an empirical analysis prepared by LECG comparing pay TV prices across a sample of 15 countries in Europe, and seeking to examine the relationship between revenues per subscriber and market structure (“Pay TV prices in Europe (1997-2005), an Econometric Analysis”, LECG Europe, 18 June 2007).
19. We find LECG’s analysis to be flawed and its conclusions unreliable, as a result of a large number of factors. First, LECG fails to properly control for quality differences in pay TV packages across countries. This problem is rendered most acute by the fact that a number of European countries use cable as the primary distribution method for free-to-air (FTA)-only services, and in the data used by LECG payments to cable operators by households who receive FTA-only services are treated as “pay TV subscriptions” even though they receive no pay TV channels at all. Hence much of the observed variation in ARPS is determined simply by variation across countries in the extent to which households use cable to access FTA services.
20. The same circumstances are also responsible for the observation that ARPS are higher in countries where the “share of the largest DTH operator” is larger: again this is simply a function of the fact that countries where cable is the main method for distributing FTA services have lower DTH penetration and the “average pay TV package” has a lower pay TV component. lower pay TV content. Hence what is being picked up is not a relationship of ARPS with market structure, but with pay TV services purchased. In addition, there are serious data problems with LECG’s analysis, as well as many technical errors, so that it cannot be relied upon to tell us anything about any alleged consumer harm in the UK associated with the state of competition in the pay TV market2.
21. This paper is structured as follows. Section 2 summarises LECG’s approach and their main findings. Section 3 discusses the high level of heterogeneity in pay TV packages, and the implications of LECG’s failure to deal with this issue; section 4 discusses the most important flaws in LECG’s modelling strategy, and section 5 describes the results of our own calculations of concentration indices in the pay TV market across the countries examined by LECG. Section 6 concludes.
2 We use the term “pay TV market” in the standard sense of the sale and purchase of retail pay TV products. Pay TV faces competition for both viewers and advertising from free-to-air television services. Hence we do not use the term in the specialised sense of a well defined antitrust market.

Review of LECG’s study 29 October 2007 CRA International
Page 7
2. LECG’S ANALYSIS
22. The purpose of LECG’s econometric study is to “compare the average pay TV prices observed in different European countries since 1997, taking into account country-specific differences [such as] content quality, income per capita” in order to “investigate whether these price differences can be explained by some observed differences in market structure” (slide 3).3
23. LECG looks at average pay TV revenue per subscriber across 15 European countries over 9 years from 1997 to 2005, in order to “investigate any potential differences between the UK and the other countries in the sample” (slide 5). They describe these as “unconditional pay TV prices”, and find a large range of variation – with averages varying between £73.9 per year in Finland and £300.5 per year in the UK.4
24. LECG describe their “modelling strategy” in two steps: “we examine whether pay TV prices in the UK are greater […] when taking into account differences in demand (content quality and income per capita)”; and then “whether pay TV prices in the UK are greater when taking into account also differences in market structure” (slide 5).5
25. They use six control variables: “expenditure on third party rights per subscriber” and “pay per view presence” are supposed to control in some way for quality; “real per capita income” tries to capture variations in willingness to pay. Given data constraints, they claim they can only develop two measures of market structure: the “number of available platforms” in each country, and the “share of the largest DTH platform”. Finally, they include an indicator variable which divides countries into two groups (where cable had the largest pay TV revenue in every year from 1997 to 2005, and where it did not).
3 LECG refer throughout their study to average revenue per subscriber (ARPS) as the “price” of pay TV. This is misleading: ARPS is a price paid by no one, for a package that does not exist. ARPS is closely related to average revenue per user (ARPU), although conventionally this would also include other revenues apart from pay TV such as from broadband, telephony, advertising and interactive services. ScreenDigest attempts to allocate revenue between pay TV and other services in calculating the ARPS However this allocation is to a considerable degree arbitrary.
4 ARPS is computed for the period 1997-2005, and LECG give annual values in constant (real) GB pounds. The reference date for the currency is not specified. Slide 6 repeated at slide 28.
5 This description is not strictly correct insofar as it implies a sequential approach: all of LECG’s key results are based on a single model (their specification 4, estimated using an instrumental variables estimator), which includes as right-hand side variables both “demand” variables and “market structure” variables.

Review of LECG’s study 29 October 2007 CRA International
Page 8
26. Taking account of the effect of variation both in the demand and market structure variables, LECG find that in 2005, ARPS in the UK is only 9 percent above the European average. However, taking account of the effect of demand variables alone increases the difference to 36 percent. LECG conclude that “differences in market structure account for a large proportion of the price difference between the UK and other European countries” (slide 10) and that the key difference in market structure generating this result is the high “share of the largest DTH supplier” in the UK.
27. LECG further conclude that “these results are consistent with the existence of a vicious circle resulting from the control of mutually reinforcing upstream and downstream bottlenecks in pay TV” (slide 11). The theory of the “vicious circle” is developed by the Complainants in Part 3 of their submission to Ofcom. The complaint also uses LECG’s result – that UK consumers are paying 36% percent more than the European average for pay TV packages of the same quality – to support claims about consumer harm.
28. In technical terms, LECG propose a reduced form model, where average revenue per subscriber is a function of the five time-varying country characteristics and a dummy variable for each country. LECG compiled a database from ScreenDigest data. This is panel data, in other words it follows the same countries for a number of years. LECG estimate their model using a fixed effects framework from 1998 to 20056. We can write their model as:
ctcctct zp εηα ++′= (1)
where ctp is APRS, modelled as a function of ctz – a vector of the control variables – and fixed effects cη . ctε is an error term. There are no time trends or time dummies to control for omitted Europe-wide shocks.
29. In the rest of this report we explain why LECG’s empirical analysis is fundamentally flawed, and its conclusions are unreliable.
6 The instrumental variable estimation procedure that LECG use is closely related to fixed effects estimation.

Review of LECG’s study 29 October 2007 CRA International
Page 9
3. CROSS-COUNTRY VARIATION IN AVERAGE REVENUE REFLECTS VARIATION IN QUALITY AND DISTRIBUTION SYSTEMS
30. Table 1 below reports average pay TV revenue per subscriber (expressed in GBP) for the 15 countries in LECG’s analysis in 2005, based on information supplied to us by ScreenDigest.7 It paints a similar picture to the table on slide 6 of LECG’s report, which shows country averages over the period 1997-2005, and which is also based on ScreenDigest data.
31. There is clearly a huge range of variation in this measure, ranging from £89.4 for Belgium to £360.6 for the UK. The (weighted)8 average across the 15 European countries is £177.1, and the UK ARPS is approximately double that average.
Table 1: Average pay TV revenue per subscriber 2005, GBP
Country ARPS (GBP) Austria 124.7
Belgium 89.4
Denmark 182.0
Finland 92.2
France 237.4
Germany 89.8
Greece 315.3
Italy 286.2
Netherlands 106.3
Norway 205.2
Portugal 182.0
Spain 282.0
Sweden 118.5
Switzerland 109.0
UK 360.6
Average (weighted) 177.1
Source: CRA calculations based on ScreenDigest data
32. Pay TV packages are far from homogeneous, and vary widely in terms of content and price per year.9 The variation in ARPS over time and across countries can be
7 ScreenDigest have revised their information for Italy in 2005, and we have therefore used the revised figures.
8 The weights are the number of subscribers in each country.

Review of LECG’s study 29 October 2007 CRA International
Page 10
broken down into two factors: (i) differences in the price of a pay TV package of a given quality, and (ii) differences in the average quality of the pay TV package purchased.
33. A key source of the extent of variation in the APRS data above arises from the treatment of cable distribution of FTA television services in the ScreenDigest data.
34. TV distribution has developed in different ways in different European countries: some countries have relied on “over the air” transmission as the main method to distribute FTA channels, while others have invested in universal cable networks (often as a matter of government policy) that are used to provide retransmission facilities for FTA channels where “over the air” transmission is either poor or impractical. In the ScreenDigest data FTA services delivered “over the air” or via DTH are not classified as pay TV; however, if they are distributed via cable, they require a subscription and are classified as pay TV despite including no pay TV channels.10 As elsewhere, however, FTA services delivered via cable are financed via advertising revenues and therefore the “subscriptions” paid by cable subscribers to receive TV services this way are low – they comprise a contribution to infrastructure costs rather than a payment for television programming.
35. An example is the Netherlands. Cable infrastructure there is almost universal: in 2005, 97 percent of Dutch households are recorded by ScreenDigest as “subscribing” to pay TV with 94 percent subscribing to cable. The data indicates that by the end of 2005 more than 95 percent of cable subscribers were still using analogue technology and had yet to convert to digital TV. This is consistent with most subscribers using the system to receive FTA services rather than to subscribe to pay TV services. The result is that, according to the ScreenDigest classification, the Netherlands has almost 100 percent “pay TV penetration” but most “subscribers” receive services which include few (if any) pay TV channels.11 ScreenDigest reports that average revenue per cable subscriber in the Netherlands
9 For example, in the UK in 2007 VM sells a package of largely free to air channels bundled with telephone service for £132 per year. VM’s full package including premium channels costs £678 per year (VM’s XL package together with Sky premium sports and movies and bundled phone service) and BSkyB’s Top Tier package is £540 per year (Sky’s 6 mix basic package together with Sky premium sports and movies. The package includes basic broadband access but does not include phone service).
10 Belgium, the Netherlands, Switzerland, Sweden and Norway all have near universal cable provision. Italy, Greece and Spain all have relatively little or no cable infrastructure. The partition discussed here is closely related to LECG’s “cable always largest” variable.
11 Throughout this document we effectively describe receiving FTA channels for a fee as equivalent to “zero quality” pay TV services This is just a technical way of referring to “quality”, and it is not intended to mean that the programming carried on FTA channels is unappealing to viewers. Indeed, such channels usually carry a range of very high quality programming.

Review of LECG’s study 29 October 2007 CRA International
Page 11
was £106 in 2005 compared to £268 in the UK but because many Dutch subscribers get only FTA channels through the cable platform, the price differential cannot be interpreted as evidence that UK consumers are getting a “worse deal”.
36. The result is that the data on Average Revenue Per Subscriber used by LECG contains significantly more variation than if it reflected only the provision of “true” pay TV services (i.e. the provision of pay TV channels to subscribers).
37. Differences in pay TV revenue among countries can also arise due to differences in business models that are unrelated to the impact of competition on subscription charges. For instance:
(i) We would expect that subscription charges partly reflect the strength of the advertising market, and the appeal of pay TV channels to advertisers. Pay TV channel providers operate in a two-sided market: in most cases pay TV channels derive revenue from both carriage fees12 and advertising airtime. As a result, differences in the mix of such revenues across countries can result in substantial differences in ARPS.
(ii) In some countries, subscribers pay the full price of their set top box (and potentially other equipment). In other countries, set top boxes are subsidised by platform providers and the cost recovered over time. A further business model is the rental of set top boxes to consumers. We understand that ScreenDigest does not attempt to allocate revenue to account for subsidised equipment. A given country might therefore come across as offering a less advantageous deal to consumers simply because it has opted for the rental model, and these rental charges inflate pay TV revenues. Hence variations in business models can lead to variations in measured pay TV revenues across countries that do not reflect differences in service (or competition).
4. MAJOR PROBLEMS IN LECG’S ANALYSIS
4.1. OVERVIEW OF PROBLEMS
38. LECG’s analysis suffers from many serious problems, both of data interpretation and of methodology. As a consequence, its results are entirely flawed and cannot be relied upon for drawing any conclusions about whether UK consumers pay a premium for pay TV relative to their European counterparts (everything else being equal). The main problems are
12 Carriage fees are the payments made by pay TV retailers to channel providers for channels.

Review of LECG’s study 29 October 2007 CRA International
Page 12
• The measure of “quality” used by LECG is totally inadequate.
• This inadequacy is exacerbated by the greater variation in dependent variable (ARPS) caused by the inclusion in the ScreenDigest data of cable provision of FTA-only services as “pay TV revenues”.
• Their measures of market structure are misleading.
• Their modelling approach has flaws and multiple technical errors.
• There are serious data construction problems.
39. But even ignoring these problems and taking the data as given, LECG’s econometric analysis is not robust.
40. In our view, the fundamental and irretrievable error in LECG’s analysis is that while it claims to control for quality differences in pay TV across Europe, in practice it fails entirely to do so.
41. First, LECG uses ScreenDigest data on “programme expenditure per subscriber” to control for quality. However this is a seriously inadequate measure. ScreenDigest inform us that this variable only includes expenditure on film rights for premium movie channels. Hence it excludes all other types of spending on pay TV programming, such as spending on in-house programming, sports programming and programming for basic channels.. Sky calculates that the ScreenDigest estimate of pay TV programming expenditure in the UK is about one fifth of their estimate of the cost of content to UK pay TV retailers. As quality varies hugely between countries, and is responsible for much of the variation in pay TV prices, failure to control adequately for this dimension means that LECG’s estimates suffer from severe omitted variable bias, and are therefore unreliable.
42. Secondly, this inadequacy is exacerbated by the additional variation introduced into the ARPS variable by the treatment in the ScreenDigest data used by LECG of payments to cable operators by households that use cable to receive FTA-only services as subscriptions to pay TV services, even though they receive no pay TV channels. Given the inadequacy of LECG’s quality control variable, the result is that the primary factor that determines the observed variation in pay TV ARPS as measured by ScreenDigest across countries is nothing other than the variation in the use of cable to distribute FTA programming, a factor that has nothing directly to do with market structure.
43. Thirdly, LECG’s analysis of the impact of “market structure” on ARPS is also flawed. LECG’s main evidence to support their claim that prices are affected by market structure is the finding that there is a positive relationship between ARPS and the variable “market share of the largest DTH supplier”. That is, countries where DTH

Review of LECG’s study 29 October 2007 CRA International
Page 13
operators are larger appear to pay higher prices for pay TV. But this simply reflects the fact that some countries have greater DTH penetration than others; and where cable is used to deliver FTA-only packages, retailers operating on DTH platforms sell packages with comparatively more pay TV content than retailers operating on cable platforms. Hence the “share of DTH” variable is correlated with the omitted “quality” variable, and the correlation between ARPS and “share of DTH” is an artefact of the “share of DTH” picking up the omitted quality variable.
44. Fourthly, even taken the data as given there are serious problems and technical errors in their modelling approach, which exacerbates all of the problems already discussed.
45. Fifth, although we do not have access to the exact dataset used by LECG the construction of the data also appears to be flawed.
46. Finally, even putting these problems aside and taking the econometric approach and data as given, LECG’s econometric analysis is not robust.
47. We start with a brief summary of their modelling approach, and its flaws, in Section 4.2. Section 4.3 briefly describes problems with LECG’s data. We then expand our discussion of the problems in LECG’s analysis in sections 4.4 through 4.8. Our overall conclusion is that their analysis is wholly unreliable, the problems are so fundamental they simply cannot be fixed, and therefore cannot support any conclusions on whether UK consumers pay a premium for pay TV relative to their European counterparts.
4.2. SCREENDIGEST’S PROGRAMMING EXPENDITURE PER SUBSCRIBER IS A VERY POOR MEASURE OF QUALITY
48. LECG use the variable “pay TV programming expenditure”13 as though it was information on the total expenditure by pay TV retailers on content – and therefore could capture relative “quality” variation across countries. But this is incorrect. The variable does not cover total channel carriage fees, nor (as LECG claim) does it cover “total expenditure on third party rights by all pay TV operators” (LECG slide 20). We are informed by ScreenDigest that it includes only expenditure on film rights for premium movie channels. It excludes all other types of spending on pay TV programming, such as spending on in-house programming, sports programming and programming for basic channels. For instance, in the UK expenditure by Sky on Lost for Sky One is excluded, as is the cost of Sky’s sports channels.
13 The number given is calculated at the country level. Information is not broken down to either the platform or the operator level. Data are only available up to 2004. There are no data for 2005.
Review of LECG’s study 29 October 2007 CRA International
Page 14
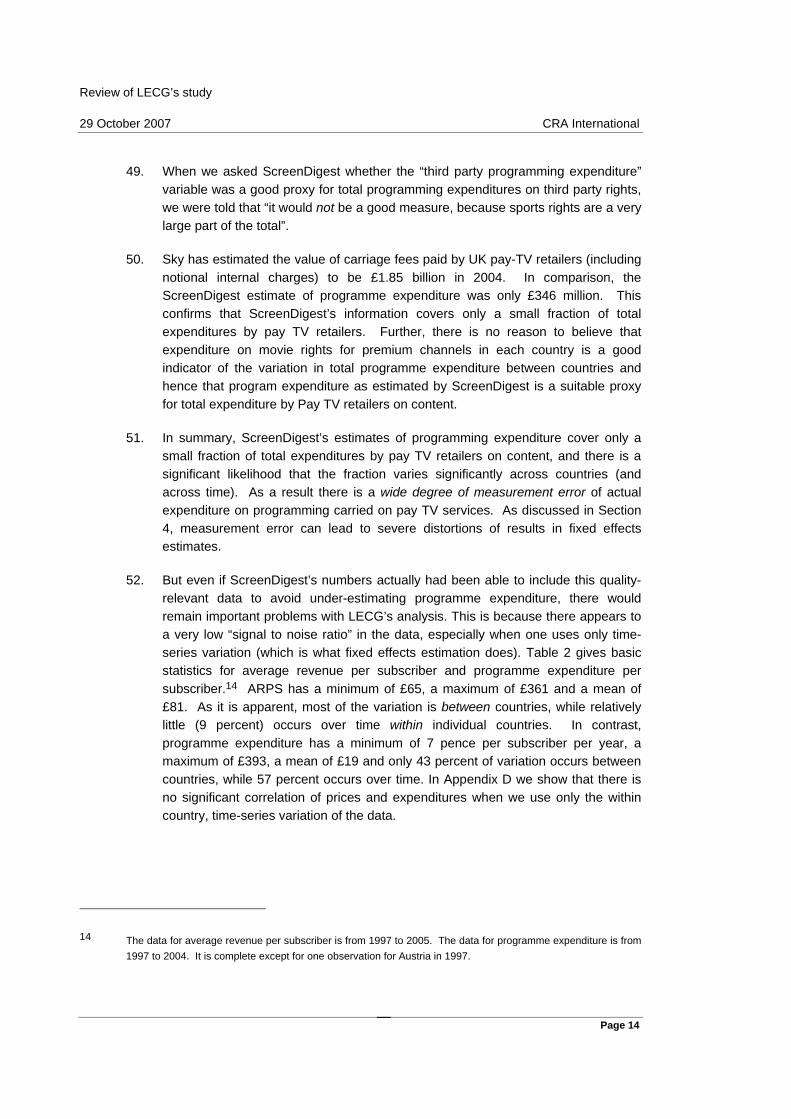
49. When we asked ScreenDigest whether the “third party programming expenditure” variable was a good proxy for total programming expenditures on third party rights, we were told that “it would not be a good measure, because sports rights are a very large part of the total”.
50. Sky has estimated the value of carriage fees paid by UK pay-TV retailers (including notional internal charges) to be £1.85 billion in 2004. In comparison, the ScreenDigest estimate of programme expenditure was only £346 million. This confirms that ScreenDigest’s information covers only a small fraction of total expenditures by pay TV retailers. Further, there is no reason to believe that expenditure on movie rights for premium channels in each country is a good indicator of the variation in total programme expenditure between countries and hence that program expenditure as estimated by ScreenDigest is a suitable proxy for total expenditure by Pay TV retailers on content.
51. In summary, ScreenDigest’s estimates of programming expenditure cover only a small fraction of total expenditures by pay TV retailers on content, and there is a significant likelihood that the fraction varies significantly across countries (and across time). As a result there is a wide degree of measurement error of actual expenditure on programming carried on pay TV services. As discussed in Section 4, measurement error can lead to severe distortions of results in fixed effects estimates.
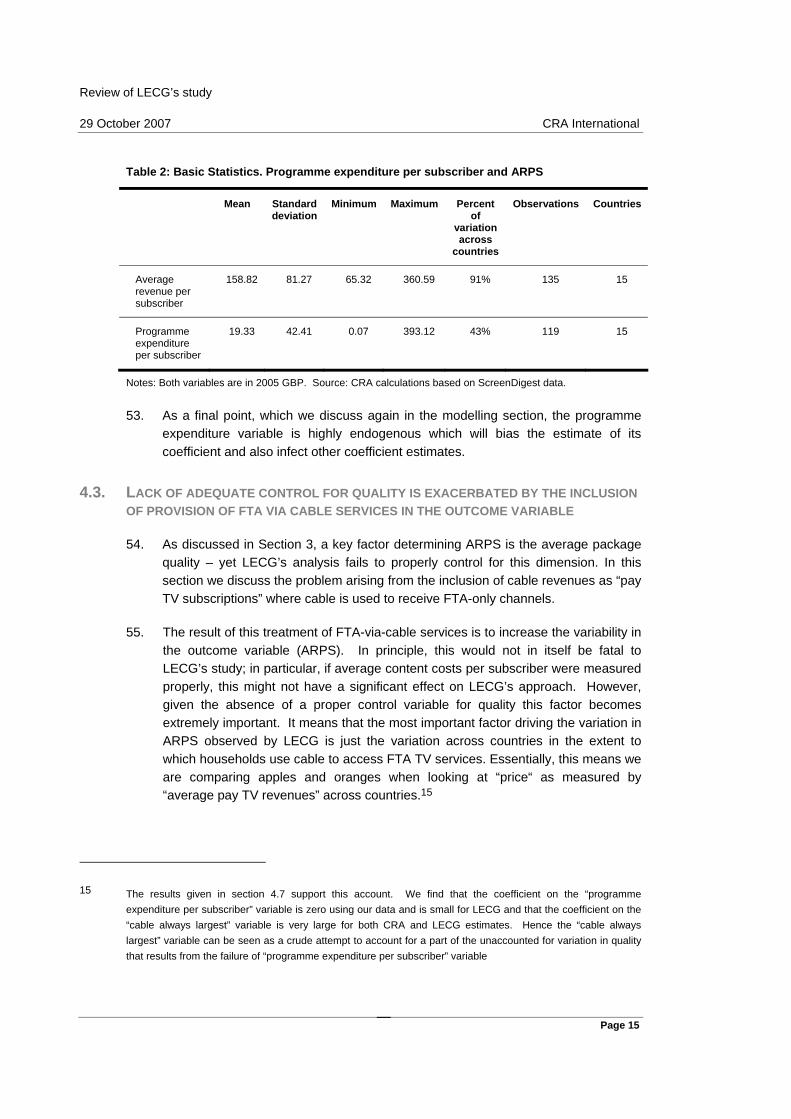
52. But even if ScreenDigest’s numbers actually had been able to include this quality-relevant data to avoid under-estimating programme expenditure, there would remain important problems with LECG’s analysis. This is because there appears to a very low “signal to noise ratio” in the data, especially when one uses only time-series variation (which is what fixed effects estimation does). Table 2 gives basic statistics for average revenue per subscriber and programme expenditure per subscriber.14 ARPS has a minimum of £65, a maximum of £361 and a mean of £81. As it is apparent, most of the variation is between countries, while relatively little (9 percent) occurs over time within individual countries. In contrast, programme expenditure has a minimum of 7 pence per subscriber per year, a maximum of £393, a mean of £19 and only 43 percent of variation occurs between countries, while 57 percent occurs over time. In Appendix D we show that there is no significant correlation of prices and expenditures when we use only the within country, time-series variation of the data.
14 The data for average revenue per subscriber is from 1997 to 2005. The data for programme expenditure is from 1997 to 2004. It is complete except for one observation for Austria in 1997.
Review of LECG’s study 29 October 2007 CRA International
Page 15
Table 2: Basic Statistics. Programme expenditure per subscriber and ARPS
Mean Standard deviation
Minimum Maximum Percent of
variation across
countries
Observations Countries
Average revenue per subscriber
158.82 81.27 65.32 360.59 91% 135 15
Programme expenditure per subscriber
19.33 42.41 0.07 393.12 43% 119 15
Notes: Both variables are in 2005 GBP. Source: CRA calculations based on ScreenDigest data.
53. As a final point, which we discuss again in the modelling section, the programme expenditure variable is highly endogenous which will bias the estimate of its coefficient and also infect other coefficient estimates.
4.3. LACK OF ADEQUATE CONTROL FOR QUALITY IS EXACERBATED BY THE INCLUSION OF PROVISION OF FTA VIA CABLE SERVICES IN THE OUTCOME VARIABLE
54. As discussed in Section 3, a key factor determining ARPS is the average package quality – yet LECG’s analysis fails to properly control for this dimension. In this section we discuss the problem arising from the inclusion of cable revenues as “pay TV subscriptions” where cable is used to receive FTA-only channels.
55. The result of this treatment of FTA-via-cable services is to increase the variability in the outcome variable (ARPS). In principle, this would not in itself be fatal to LECG’s study; in particular, if average content costs per subscriber were measured properly, this might not have a significant effect on LECG’s approach. However, given the absence of a proper control variable for quality this factor becomes extremely important. It means that the most important factor driving the variation in ARPS observed by LECG is just the variation across countries in the extent to which households use cable to access FTA TV services. Essentially, this means we are comparing apples and oranges when looking at “price“ as measured by “average pay TV revenues” across countries.15
15 The results given in section 4.7 support this account. We find that the coefficient on the “programme expenditure per subscriber” variable is zero using our data and is small for LECG and that the coefficient on the “cable always largest” variable is very large for both CRA and LECG estimates. Hence the “cable always largest” variable can be seen as a crude attempt to account for a part of the unaccounted for variation in quality that results from the failure of “programme expenditure per subscriber” variable

Review of LECG’s study 29 October 2007 CRA International
Page 16
56. For example, as set out above, ARPS in the Netherlands was £106 in 2005 compared to £360 in the UK. But a major part of this difference is almost certainly explained by the fact that many Dutch households pay for low-priced cable services with few if any pay TV channels.
57. LECG appear to introduce a variable, “cable always largest”, to try and deal with this issue. Unfortunately this variable has at least two problems. First, it has no time series variation, so it cannot reflect changes over time in the degree to which FTA is accessed via cable. If this is correlated with the other variables (such as market structure) this will generate a bias. Secondly, the variable is simply a zero/one dummy variable, and as such it is very crude and cannot reflect differential rates of cable penetration, and cable use to receive FTA television, amongst countries. For example, a country with cable penetration at 1% would be treated as the same as a country of 49% as “cable always smallest”.
58. A careful reading of LECG’s own figures is revealing. In their estimates using the “cable always largest” variable, the UK “price premium” drops from 28% to 9% on LECG’s own analysis. Furthermore, If one corrects for the misclassification of Norway (see below), the alleged UK price premium drops to a discount of 3% – the UK has lower-than-average prices.
59. LECG manage to reverse this conclusion only because they find a large coefficient on their “market share of largest DTH supplier” variable, and this variable is larger in the UK than elsewhere. But as we discuss in the next section, their measures of market structure are flawed. The absence of proper controls for quality means that the coefficient on “market share of largest DTH firm” will simply reflect the omitted variable of higher quality of content. Thus the impression that “high UK prices” are due to a large “market share of largest DTH firm” is in fact unfounded: they are just more likely to reflect the provision of services which are true pay TV services.
4.4. MISLEADING “MARKET STRUCTURE” VARIABLES
60. LECG introduce two variables as indicators of market structure in their model: the “market share of largest DTH firm”, and the “number of platforms”..
Market share of largest DTH supplier
61. LECG include in their model a variable for the “market share of the largest DTH firm”, measured as the proportion of all pay TV revenues accruing to the largest DTH supplier. This is not a conventional measure of competitiveness, as it ignores the effect of cable firms and other competitors on the overall degree of competition. LECG claim that the ScreenDigest data does not allow them to calculate standard measures of competitiveness. However this is incorrect, and we present a set of standard measures of competitiveness at both the platform and operator levels in Section 5 below.

Review of LECG’s study 29 October 2007 CRA International
Page 17
62. The key question is how this variable (market share of largest DTH firm) is to be interpreted. LECG imply that it gives some indication of the competitive situation (with higher share indicating a less competitive situation). In general this is false. Where the share of the largest DTH supplier is low in a country, it is likely that the share of all DTH suppliers in that country is low, and that the share of cable operators is high.16 A monopoly cable position (and zero share of largest DTH supplier), as in Austria, is in fact the opposite of a highly competitive market structure. Comparing the Netherlands where 95 percent of pay TV viewers buy from cable and 5 percent from IPTV, DTH and DTT, with the UK where DTH has about two thirds of the market and cable about one third, it is not self-evident that the Netherlands is overwhelmingly more competitive than the UK.
63. There is indeed no rationale for focussing only on DTH when looking for measures of market competition. In fact, if one refers to the Complainants’ own arguments, as articulated in their “vicious circle” theory, a vertically integrated dominant cable company would be just as likely to thwart competition as a dominant integrated DTH supplier.
64. And while it is likely that countries with substantial DTH share have higher ARPS, this has nothing to do with competition. In so far as viewers receive an all-FTA package via DTH these are not classified as pay TV in the ScreenDigest data. In contrast, in the same data purchasers of FTA-only packages via cable are included in “pay TV subscriptions”. In 2005, this resulted in the ARPS of a DTH subscription across all 15 European countries being £304, compared to £113 for cable. In light of this, we would expect that countries with a high market share for DTH would have both high ARPS and high average “quality” (in the sense of including the provision of pay TV channels). Consequently, the coefficient on the variable “market share of largest DTH supplier” most likely simply reflects the omitted controls for quality.
Endogeneity of Market share of largest DTH supplier
65. Further, DTH revenue is a function of the prices of DTH subscriptions. But the price of DTH subscriptions is a component of the left-hand side variable – ARPS for all pay TV subscriptions. As a result, by looking at revenue rather than at the number of subscriptions, LECG is in part regressing a variable on itself. This makes DTH revenue endogenous. LECG claim that by lagging the variable by one year this problem is circumvented. This is formally incorrect if there is serial correlation in the errors (which is the case for our estimates of LECG’s regressions).
16 The correlation in our dataset between the share of the largest DTH supplier and the share of DTH is 0.97.
Review of LECG’s study 29 October 2007 CRA International
Page 18
66. It is also the case that if DTH revenues are endogenous then (i) fixed effect estimation on a short panel is not consistent and (ii) the instruments in the LECG instrumental variable estimator are endogenous and this renders the IV estimators inconsistent as well. We would expect that the mechanism described above would cause the estimated coefficients to be biased upwards. These results again indicate that the estimators used by LECG are not in principle valid for their model and data and that there is no reason to believe that the estimates are reliable.
67. In conclusion, the share of the largest supplier of DTH is likely unrelated to the competitiveness of the pay TV market. However due to the fact that unlike cable, DTH is not typically used to supply FTA services for a low fee, we would expect high DTH share to be linked to a higher average “quality” and a higher ARPS. Moreover, by using DTH revenues rather than subscriptions, LECG is using a strongly endogenous variable. This endogeneity would be expected to bias the estimated coefficients upwards, furthering the illusion of a strong positive link between ARPS and the DTH variable. We must therefore conclude that the results obtained by LECG as to the impact of DTH on prices are completely unreliable, and cannot be interpreted as evidence that more extensive use of DTH for the provision of TV services leads to higher quality-corrected prices.
Number of platforms
68. The “number of platforms” is used by LECG as an indicator of the competitiveness of the pay TV market. It is defined as the numbers of platforms used to deliver pay TV in each country, where possible platforms are terrestrial, cable, DTH and IPTV. Hence it counts cable and DTH, technically well-developed and well established platforms, as having a similar competitive effect to IPTV which is subject to ongoing technical development with little market share during the period of the study. It also fails to take account of variations in within-country coverage.17
69. Both LECG and CRA’s information agree that in 2005 the UK had pay TV services on all four platforms, and hence that by this indicator the UK pay TV market is amongst the most competitive in Europe (LECG slide 25).
4.5. SOME PROBLEMS WITH LECG’S MODELLING APPROACH
70. As noted above, LECG propose a reduced form model, where average revenue per subscriber is a function of certain key country characteristics: the average quality of the package purchased, per capita income and market structure (LECG, slide 30).
17 For instance, in the UK cable TV covers about 55 percent of households and IPTV coverage was very limited up to 2005.

Review of LECG’s study 29 October 2007 CRA International
Page 19
We see numerous technical problems associated with this approach. We discuss endogeneity, attenuation bias and dynamics as three of the main issues.
Endogeneity
71. First, the right-hand side variables are likely to be endogenous. LECG observe that programming expenditure per subscriber could be a function of average revenue per subscriber (they term this the “reverse causality problem”, arising “if the current pay TV price is a determinant of the current programme expenditure” (LECG, slide 20)), though they do not spell out the mechanism. A possible mechanism could be that some contracts for content are based on the number of subscribers taking specific content. If subscribers shift to take higher quality packages, then this automatically increases the payments to content providers.
72. The single type of content expenditure included in the ScreenDigest data is precisely of this type: payments for movie rights for premium pay TV channels are typically on the basis of per-subscriber fees. Accordingly, increased subscriber numbers will feed directly into higher programme expenditure costs.
73. LECG claim that by lagging programme expenditure by one year they can avoid this problem. But this can only be true if the equation errors are uncorrelated over time. Our calculations show that they are not.
74. Further if there is “reverse causality”, as is the case here, then programming expenditure is an endogenous variable and then lagged programming expenditure is a lagged endogenous variable. Fixed effect estimation of a regression model with a lagged endogenous variable on a short panel is not consistent18 (for similar reasons the instrumental variable estimates presented by LECG are also inconsistent as some instruments are endogenous). Hence the estimators used by LECG are not in principle valid for their model and data, and there is no reason to believe that the estimates are reliable.
Attenuation Bias
75. Second, even if the time series specification is correct, a further disadvantage of the fixed effects models is that it exacerbates the bias caused by measurement error in the control variables.19 Again this causes the affected estimated coefficient to be biased and attenuated towards zero.
18 Hsiao, C. (1986) Analysis of Panel Data. Cambridge: Cambridge University Press.
19 Griliches, Zvi and Jerry A. Hausman. "Errors in Variables in Panel Data: A Note with an Example," Journal of Econometrics, Vol. 31, pp. 93-118, 1985.

Review of LECG’s study 29 October 2007 CRA International
Page 20
76. The problems of using a fixed effects approach with a badly measured right hand side variables can be illustrated with the “per subscriber programme expenditure” variable. Appendix D shows that the variables has outliers, etc. but even when these are removed, there is very little signal in the year-to year fluctuations of this variable. In particular there is no correlation with ARPS. This again suggests it is a poor measure of the critical quality variable.
Dynamics
77. Third, while we would expect that the right-hand side variables would affect ARPS over time, the timing of this relationship is likely to be complex. Not only are the effects of a change in any of these variables likely to be felt progressively over many periods, but some variables might affect prices more quickly than others. The model should therefore allow for a fairly complex lag structure. Instead, LECG assume a very simple time series structure: that the effect of a change in a right-hand side variable occurs completely, and immediately.20 If this simple specification is not correct, the result is that the coefficient estimates are biased and may well be underestimated.
LECG wrongly state they cannot estimate a key variable
78. LECG state that fixed effects estimation does not allow estimation of the key cable infrastructure variable “cable always largest” (slide 3). This is incorrect. Fixed effects estimation generates estimates of the country effects. The “cable always largest” variable simply partitions countries into one of two groups, “cable always largest” and “cable not always largest”. It is straightforward to re-parameterise the country dummies to estimate a group effect and a residual country effect,21
cgc νδη += where c is in group g
where cη is the full country effect, gδ the group effect and cν the residual country effect. The group effect is defined as the average of the full country effects for each group,
∑∈
=gc
cg
g nηδ 1ˆ for all g
20 For instance, they assume that programme expenditure and share of largest DTH supplier have no immediate effect but that the effect occurs completely with a one year lag.
21 We use a standard analysis of variance approach. Sheffe, H. (1959) The Analysis of Variance. Wiley: New York.

Review of LECG’s study 29 October 2007 CRA International
Page 21
and
gcc δην ˆˆˆ −= where c is in group g
79. This in turn implies the identifying restriction that
0ˆ1=∑
∈gcc
gnν for all g .
80. We present such estimates below. If the complex IV estimation procedure is carried out in a consistent way with a complete set of country effects, then the results are identical to those from the simpler fixed effects procedure.22 As fixed effects estimation is a much simpler procedure, the IV procedure is unnecessary and confusing. It also leads to further errors, discussed below, in the forecast method that LECG use to interpret the results of their model.
4.6. LECG’S DATA APPEARS TO CONTAIN MATERIAL ERRORS
81. LECG claim that their econometric analysis relies on database which is compiled and published by ScreenDigest. We used the ScreenDigest database to compile a similar dataset to LECG as described in their study. Our dataset incorporates all data revisions by ScreenDigest as of 9 August 2007 and contains all the variables used by LECG in their econometric study. A detailed description of the data and comparison with LECG’s data is given in Appendix A.
82. We were not able to reproduce the LECG data exactly. The main reason for this is that ScreenDigest data is revised and updated continuously. Moreover the revision process appears to be retroactive, affecting all the ScreenDigest data, not just the most recent years. In the period since last summer, ScreenDigest has revised the way in which it reports pay-per-view data (it now reports it as part of on-demand services). As a result, the data available to us from ScreenDigest are likely different from the data supplied to LECG.
83. Comparing our data with information reported by LECG we note that:
• Our data on average pay TV revenue per subscriber (in real 2005 GBP) are broadly similar to LECG’s data. However there are considerable discrepancies in the data for Germany, Sweden, Spain and Norway.
22 The LECG specifications are not fully consistent as they omit the full set of country effects and they also claim not to instrument GDP per capita (though other evidence indicates that this may not be correct). There is no explanation as to why they do not instrument for real per capita GDP or for its effects.

Review of LECG’s study 29 October 2007 CRA International
Page 22
• Programming expenditure per subscriber (in real 2005 GBP). This variable shows a wide variation in our dataset. This is primarily driven by a few outliers (Italy 1997-99 and Spain 1997). These outliers do not appear to be present in the LECG dataset. Differences between LECG and CRA data for this variable appear to cause material differences in the results.
• Market share of the largest DTH firm. LECG report the data for this variable in their presentation (LECG slide 11). There are discrepancies between the LECG and CRA values for all countries. Calculations for some countries are similar, but for others (Germany, Italy, Norway and Sweden) there are larger discrepancies. In certain cases, DTH operators also own cable systems. For Norway, LECG appears to have included the cable revenues of Canal Digital/Telenor. However for four other countries (France, Greece, Portugal and Sweden) it has not done so, causing further discrepancies. The evidence is that these differences affect the results significantly.
• Indicator – Cable always largest. Our information indicates that there are ten countries where this is true: Austria, Belgium, Denmark, Finland, Germany, Netherlands, Norway, Portugal, Sweden and Switzerland. The LECG presentation implies that there are only nine, the list above excluding Norway. Again the evidence is that this discrepancy has a significant impact on the results.
4.7. LECG’S ECONOMETRIC RESULTS ARE NOT ROBUST
84. This section replicates LECG’s key calculations, both their estimates and forecasts. After giving our estimates we compare them with those given by LECG and we also interpret them in the light of the discussion above. We confirm that the results that we obtain are entirely as we would expect given the discussion above. We then recalculate the LECG forecasts. We find that effects estimated by LECG are much reduced and in particular that controlling for demand and market structure variables, the predicted UK 2005 ARPS is 3.1 percent below the European average compared to the 9 percent above reported by LECG. If we do not control for market structure, we find that the higher predicted UK 2005 ARPS can be well explained by the higher average quality of services provided by DTH suppliers. There is nothing to support LECG’s conclusion that the higher ARPS observed in the UK is due to high margins or a lack of competition in the UK market.
85. In Table 12, Appendix B we present our best effort at replicating LECG’s fixed effects estimates for all four of their specifications.23 In Table 3, we follow LECG and concentrate on their specification 4. The results for other specifications are consistent with those for specification 4. Table 3 gives results for fixed effects
23 LECG’s results are taken from slide 39.

Review of LECG’s study 29 October 2007 CRA International
Page 23
estimation. Column (1) gives LECG’s results; column (2) gives results using CRA’s data set. The fit using the CRA dataset is marginally worse. There are substantial differences in the estimated coefficients. Using the CRA dataset, programming expenditure goes from having a small effect to having no effect. The effect of the pay per view indicator variable is much smaller and insignificant. The effect of the number of different platforms goes from being positive to negative but is not significant. The effect of the market share of the largest DTH supplier is reduced but is still statistically significant. The effect of “cable always largest” (not reported by LECG) is large, negative and significant. Finally we report a simple residual serial autocorrelation coefficient that is consistent with residual autocorrelation.24 As noted above the presence of serial correlation invalidates the estimation procedure and also indicates problems with the specification.
24 The reported simple autocorrelation coefficient is obtained by regressing the residuals on lagged residuals taking account of the panel structure of the data.

Review of LECG’s study 29 October 2007 CRA International
Page 24
Table 3: Pay TV ARPS, LECG specification 4, fixed effects
LECG CRA (1) CRA (2)
GDP per capita 5.397* 9.526* 8.317*
[1.116] [1.366] [1.218]
Programme exp per subs - lagged one year 0.576* 0.015 0.223*
[0.173] [0.024] [0.029]
Indicator - pay per view presence 13.394* 0.461 2.917
[5.078] [2.816] [2.268]
Number of different platforms 2.585* -2.202 -2.168
[2.713] [2.702] [2.549]
Indicator - Cable always largest n/a -163.752* -147.269*
[11.219] [10.331]
Market share largest DTH supplier - lagged one year 1.179* 0.989* 1.155*
[0.351] [0.144] [0.137]
Constant 0.873* -30.395 -17.201
[15.939] [20.400] [18.444]
Auto correlation n/a 0.620* 0.632*
[0.076] [0.076]
Observations 118 118 118
Number of countries 15 15 15
R-squared (within regression) 0.80 0.73 0.76
Notes: Robust standard errors in brackets, * significant at 5 percent level. Source: LECG / CRA calculations
based on ScreenDigest data.
86. Column (3) gives results using CRA’s data but substituting LECG’s data on the market share of the largest DTH supplier. The results are intermediate between those given by LECG and those using the CRA data on the market share of the largest DTH supplier.
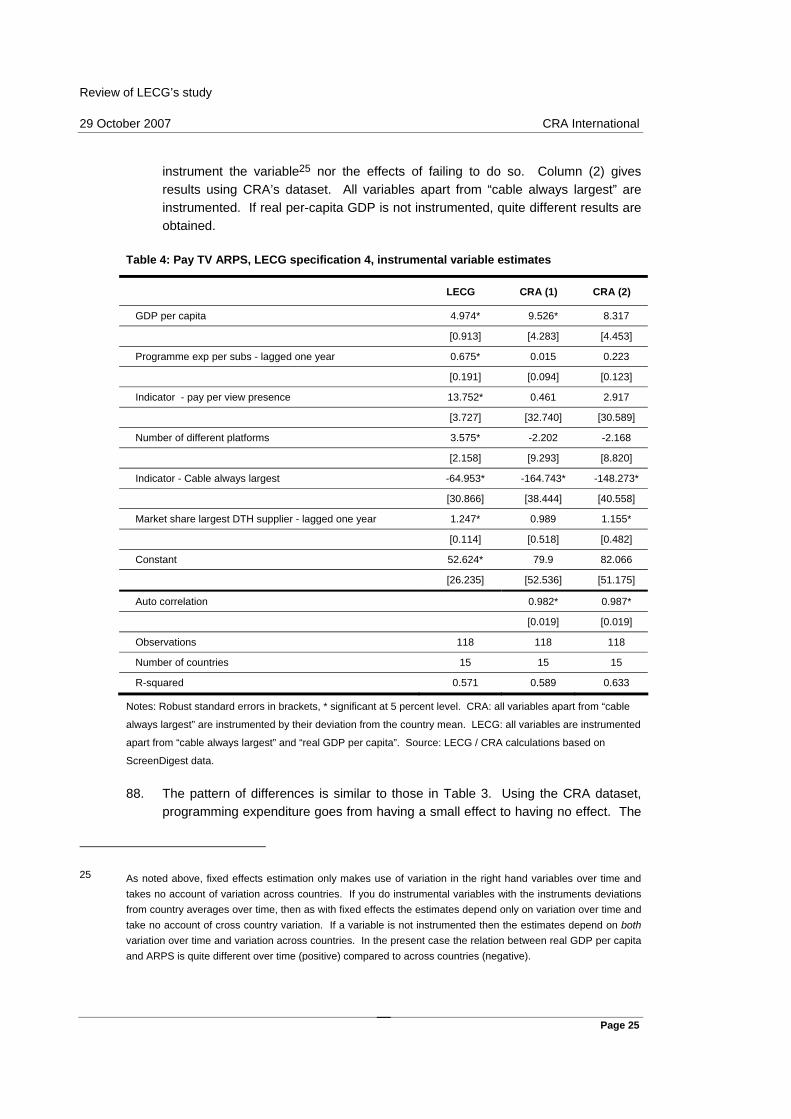
87. In Appendix B we present our best effort at replicating LECG’s IV estimates of all four specifications (LECG, slide 40). Again in the discussion we concentrate on their key specification 4. The results for other specifications are again consistent with those for specification 4. Table 4 gives results for the IV estimation of LECG’s specification 4. Column (1) gives LECG’s results. This specification is the one that LECG uses as the basis for its preferred results. LECG states that they do not instrument the variable real GDP per capita. They do not explain why they do not
Review of LECG’s study 29 October 2007 CRA International
Page 25
instrument the variable25 nor the effects of failing to do so. Column (2) gives results using CRA’s dataset. All variables apart from “cable always largest” are instrumented. If real per-capita GDP is not instrumented, quite different results are obtained.
Table 4: Pay TV ARPS, LECG specification 4, instrumental variable estimates
LECG CRA (1) CRA (2)
GDP per capita 4.974* 9.526* 8.317
[0.913] [4.283] [4.453]
Programme exp per subs - lagged one year 0.675* 0.015 0.223
[0.191] [0.094] [0.123]
Indicator - pay per view presence 13.752* 0.461 2.917
[3.727] [32.740] [30.589]
Number of different platforms 3.575* -2.202 -2.168
[2.158] [9.293] [8.820]
Indicator - Cable always largest -64.953* -164.743* -148.273*
[30.866] [38.444] [40.558]
Market share largest DTH supplier - lagged one year 1.247* 0.989 1.155*
[0.114] [0.518] [0.482]
Constant 52.624* 79.9 82.066
[26.235] [52.536] [51.175]
Auto correlation 0.982* 0.987*
[0.019] [0.019]
Observations 118 118 118
Number of countries 15 15 15
R-squared 0.571 0.589 0.633
Notes: Robust standard errors in brackets, * significant at 5 percent level. CRA: all variables apart from “cable
always largest” are instrumented by their deviation from the country mean. LECG: all variables are instrumented
apart from “cable always largest” and “real GDP per capita”. Source: LECG / CRA calculations based on
ScreenDigest data.
88. The pattern of differences is similar to those in Table 3. Using the CRA dataset, programming expenditure goes from having a small effect to having no effect. The
25 As noted above, fixed effects estimation only makes use of variation in the right hand variables over time and takes no account of variation across countries. If you do instrumental variables with the instruments deviations from country averages over time, then as with fixed effects the estimates depend only on variation over time and take no account of cross country variation. If a variable is not instrumented then the estimates depend on both variation over time and variation across countries. In the present case the relation between real GDP per capita and ARPS is quite different over time (positive) compared to across countries (negative).

Review of LECG’s study 29 October 2007 CRA International
Page 26
effect of the “pay per view” variable is much smaller and statistically insignificant. The effect of the “number of different platforms” goes from being positive to negative and is not significant. The effect of the market share of the largest DTH supplier is again smaller. The effect of the variable “cable always largest” is large, negative and significant for both data sets but it is larger for the CRA dataset. This is likely in part because the CRA dataset includes Norway. The simple residual serial autocorrelation coefficients indicate severe residual autocorrelation. Residual autocorrelation at this level likely indicates an invalid specification.
89. Again column (3) gives results using the CRA dataset but substituting LECG’s data on the market share of the largest DTH supplier. The results are again intermediate between those given by LECG and those using the CRA data on the market share of the largest DTH supplier.
90. The results presented in Table 3 and Table 4 are very similar. This is not surprising, as the estimators are closely related. Indeed for the CRA regressions they are identical but for the absence of a full set of country effects in the IV regressions. The indications are that removing these country effects from the estimated model creates omitted variable bias for the other coefficients and generates severe autocorrelation in the residuals.
Interpretation of the results
91. LECG choose to interpret their results by comparing ARPS forecast by their model for 2005 for the UK and other countries. Before looking at that we review the coefficient estimates. We focus on our preferred estimates of specification (4), the CRA fixed effects results based on our data given in Table 3 and LECG’s preferred estimates given in Table 4.26
92. Because we know that the main source of variation in ARPS is likely due to variations in the average quality of the package, the control for that is crucial. The main control is “per subscriber expenditure on programming”. However we know from ScreenDigest that the reported variable is a poor estimate of the actual total expenditure on programming, as it covers only a small fraction of such expenditure and that fraction is likely to vary across countries. The preliminary data analysis indicates that there is very little relation between “per subscriber programming expenditure” and ARPS over time. The fixed effect (and IV) estimation technique depends only on information about variation over time, and ignores information across countries. As a result it is no surprise that the CRA results indicate that
26 LECG’s fixed effects estimates omit a key variable (cable always largest) and are incorrect. The forecasts (slide 43) based on those estimates are incorrect and misleading.

Review of LECG’s study 29 October 2007 CRA International
Page 27
programming expenditure has no effect, and the LECG results indicate it has only a weak effect.
93. This result implies that either there is almost no quality difference in average pay TV packages across countries; or alternatively, due to data problems, the ScreenDigest data on programming expenditures over time fails to adequately describe these differences. All of the evidence and discussion above strongly indicate the latter. If this is the case then the LECG model contains a major unexplained variable.
94. Further evidence that this is the case arises from the “cable always largest” variable. CRA find that this variable is very large and significant. LECG find that it is also large and significant. Yet the primary purpose of this variable is to pick up uncontrolled effects due to the use of cable to supply FTA-only services. If the programme expenditure variable was a good control for quality, it would explain most of this effect. But the programme expenditure variable is not a good control for quality and consequently it does not explain most of the quality differential across countries as it should.
95. The coefficient estimate that implies that the “cable always largest” variable reduces ARPS by £163 confirms the effect of FTA-only cable subscribers as the main explanation for the observed variation in ARPS.
96. Finally, both the LECG and CRA estimates indicate that the market share of the largest DTH supplier has an effect on ARPS. However we know that the average DTH subscription is both higher quality and higher cost than the average cable subscription. As there is no good control for quality, it is likely that the market share of the largest DTH supplier is acting as a proxy for quality.
Forecasts
97. LECG calculate their forecasts of pay TV ARPS using slightly different methods for the fixed effect regressions and the IV regressions. As all of LECG’s preferred results are based on the IV estimates of their model with all variables included (specification 4), we also focus on the IV estimates of specification 4.
98. LECG’s approach starts from equation (1) substituting estimated parameters and calculating predicted values for alternative values of the control values.
ccc zp ηα ˆˆˆ * +′= , all values for 2005 (2)
99. In applying this approach to the IV estimates, LECG have a problem as the IV model does not generate estimates of the country effects. They circumvent this by estimating country effects from the residuals of the IV regressions. For example, the UK country effect is calculated at the average of the UK residuals. Hence, they

Review of LECG’s study 29 October 2007 CRA International
Page 28
are estimating their model using a two stage procedure. At no point do they justify this procedure nor prove that their estimation procedure is correct for a consistent set of statistical assumptions. We believe that this procedure is wrong, and that LECG should have used estimates for their complete specification from a fixed effects regression as outlined in section 4.5 (which provide all the necessary estimates from a single procedure).
100. LECG make two comparisons (LECG slides 44, 49 and 13). In one comparison (controlling for demand and market structure) they assume that the control variables are the same for all countries, and take on the values observed in the UK in 2005. This means that the first term in (2) is the same for all countries and differences in the forecast ARPS depend only on the estimated country effects.
cUKc zp ηα ˆˆˆ +′= , all values for 2005 (3)
101. The second comparison (controlling for demand) assumes that the values of the “demand” variables (real per capita GDP, programme expenditure, pay per view, and cable always largest) take on the values observed in the UK in 2005 and the remaining “market structure” variables (number of platforms and market share of largest DTH) take on the values actually observed in that country in 2005.
ccUKc zzp ηαα ˆˆˆˆ ,22,11 +′+′= , all values for 2005 (4)
where cz ,1 is the vector of “demand“ variables and cz ,2 is the vector of “market
structure” variables. Hence differences in forecast ARPS depend on both country effects and on the estimated effect of differences in the market structure variables.
102. Table 5 gives CRA calculations based on specification 4 estimated by fixed effects (as reported in Table 3) together with LECG results inferred from slides 44 and 49. Once we control for both "demand” and “market structure” variables, we find that forecast UK ARPS is 3.1 percent below average European ARPS. It is likely that this is due to LECG excluding Norway from the group of countries where cable is always largest. In the context of this data, the magnitude of these differences is relatively small. As noted above, even if the country effects were larger, this would simply indicate model failure - that the LECG model was unable to explain the observed differences. There is nothing to indicate that these differences are due to a lack of competition in the UK market. This is particularly so as LECG does include a crude variable to account for the extent of competition (number of platforms used to distribute pay TV) and this indicates that the UK is amongst the most competitive markets in Europe and (for CRA data) this reduces forecast ARPS in the UK by a small amount.
103. If we do not control for differences in “market structure”, then the UK has ARPS 10.5 percent above the European average. This is likely because the UK has a
Review of LECG’s study 29 October 2007 CRA International
Page 29
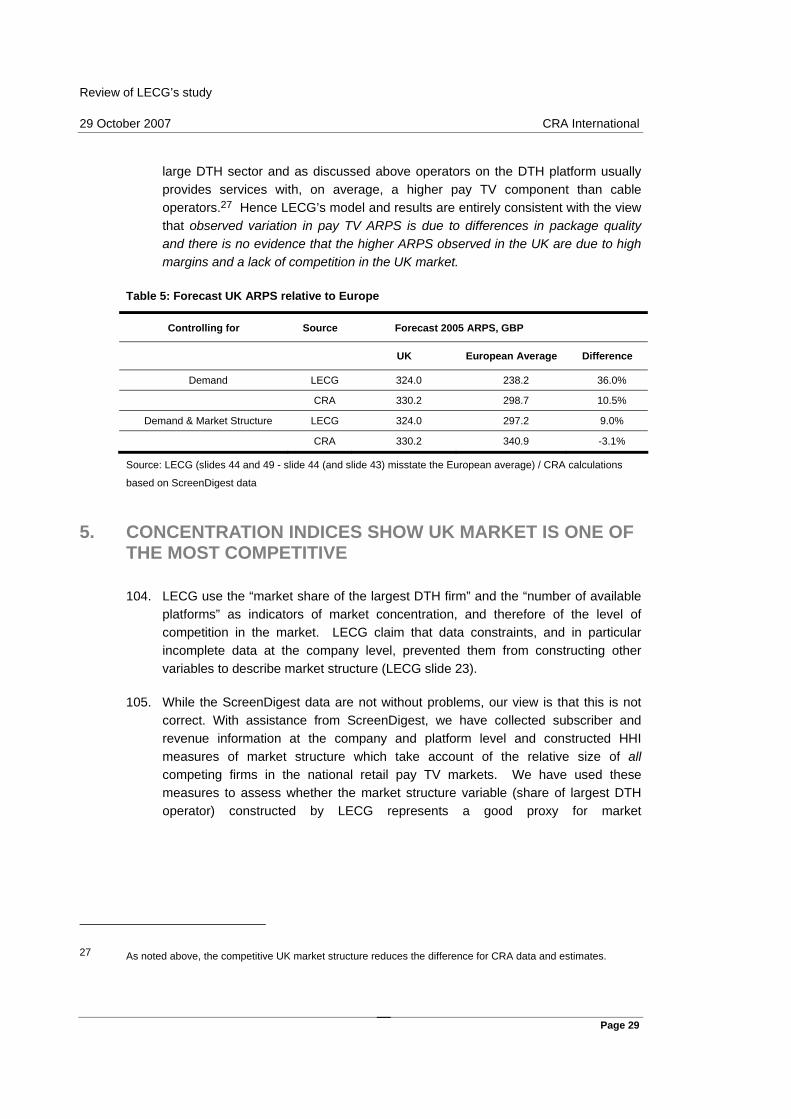
large DTH sector and as discussed above operators on the DTH platform usually provides services with, on average, a higher pay TV component than cable operators.27 Hence LECG’s model and results are entirely consistent with the view that observed variation in pay TV ARPS is due to differences in package quality and there is no evidence that the higher ARPS observed in the UK are due to high margins and a lack of competition in the UK market.
Table 5: Forecast UK ARPS relative to Europe
Controlling for Source Forecast 2005 ARPS, GBP
UK European Average Difference
Demand LECG 324.0 238.2 36.0%
CRA 330.2 298.7 10.5%
Demand & Market Structure LECG 324.0 297.2 9.0%
CRA 330.2 340.9 -3.1%
Source: LECG (slides 44 and 49 - slide 44 (and slide 43) misstate the European average) / CRA calculations
based on ScreenDigest data
5. CONCENTRATION INDICES SHOW UK MARKET IS ONE OF THE MOST COMPETITIVE
104. LECG use the “market share of the largest DTH firm” and the “number of available platforms” as indicators of market concentration, and therefore of the level of competition in the market. LECG claim that data constraints, and in particular incomplete data at the company level, prevented them from constructing other variables to describe market structure (LECG slide 23).
105. While the ScreenDigest data are not without problems, our view is that this is not correct. With assistance from ScreenDigest, we have collected subscriber and revenue information at the company and platform level and constructed HHI measures of market structure which take account of the relative size of all competing firms in the national retail pay TV markets. We have used these measures to assess whether the market structure variable (share of largest DTH operator) constructed by LECG represents a good proxy for market
27 As noted above, the competitive UK market structure reduces the difference for CRA data and estimates.

Review of LECG’s study 29 October 2007 CRA International
Page 30
concentration.28 We find that contrary to LECG’s claim, the UK is one of the most competitive markets in Europe – at least in LECG’s own sense of having a less concentrated market structure.
106. In particular, we used the ScreenDigest data at the company and platform level for all countries and periods to construct three alternative measures of market structure:
• HHIs based on market shares by platform; and
• HHIs based on market shares by operator: given the lack of geographic overlap and competition amongst cable operators, we grouped all cable operators in each country into a single “cable group”. For countries where operators offer both cable and non-cable pay TV services (Belgium, Italy, Norway, Portugal and Sweden), we constructed two alternative measures:
Measure 1 allocates the cable-only services of those multi-platform operators into the single “cable group” and treats their non-cable operations as separate firms; and
Measure 2 allocates both the cable and non-cable services of those firms into the single “cable group”.
107. We have calculated these three measures of market structure based on both revenue and number of subscribers. A comparison of these measures (based on revenues) against LECG’s measure of market structure (share of largest DTH operator) for year 2005 is presented in Table 6. Appendix C presents all three CRA measures in terms of revenues and number of subscribers for the period 1997 to 2005.
28 As noted above, pay TV is paid for by advertising as well as by subscribers and competes with FTA broadcasters for both advertising and viewers. As a result, in countries that use over-air transmission as the primary distribution channel for FTA only packages such as the UK, Italy, Greece and Spain, the concentration indices may overstate the market power (if any) of the pay TV operators.
Review of LECG’s study 29 October 2007 CRA International
Page 31
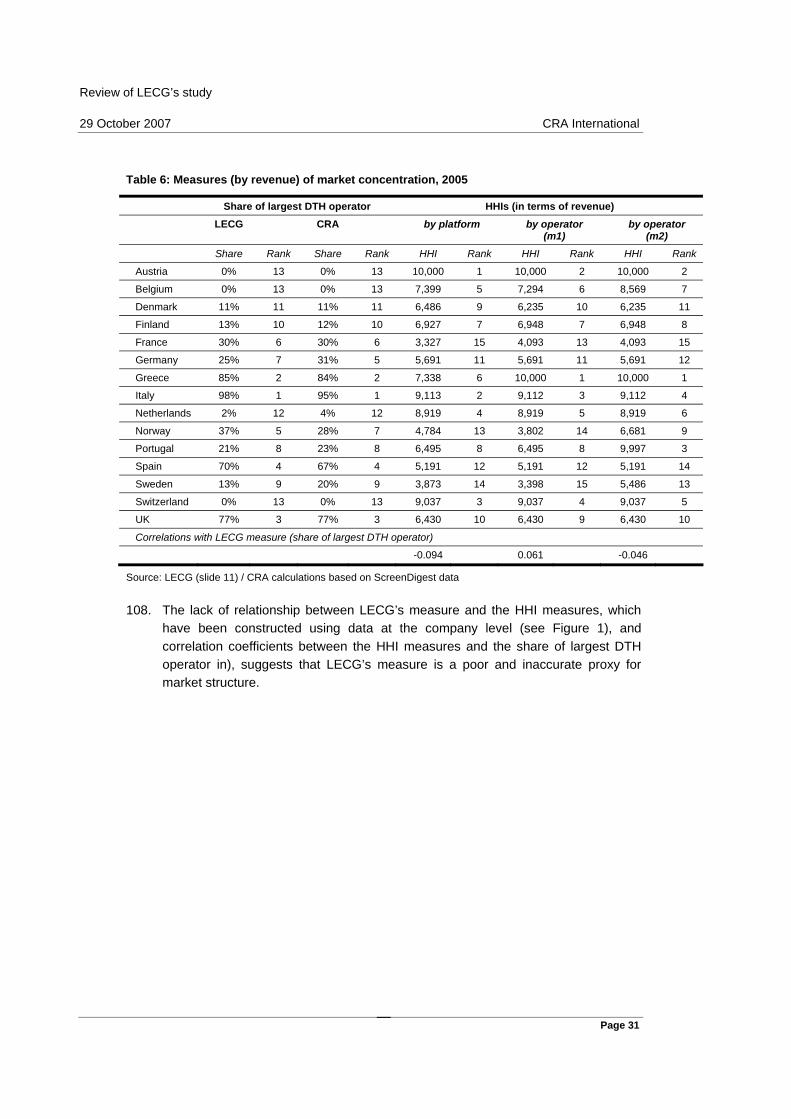
Table 6: Measures (by revenue) of market concentration, 2005
Share of largest DTH operator HHIs (in terms of revenue) LECG CRA by platform by operator
(m1) by operator
(m2) Share Rank Share Rank HHI Rank HHI Rank HHI Rank
Austria 0% 13 0% 13 10,000 1 10,000 2 10,000 2
Belgium 0% 13 0% 13 7,399 5 7,294 6 8,569 7
Denmark 11% 11 11% 11 6,486 9 6,235 10 6,235 11
Finland 13% 10 12% 10 6,927 7 6,948 7 6,948 8
France 30% 6 30% 6 3,327 15 4,093 13 4,093 15
Germany 25% 7 31% 5 5,691 11 5,691 11 5,691 12
Greece 85% 2 84% 2 7,338 6 10,000 1 10,000 1
Italy 98% 1 95% 1 9,113 2 9,112 3 9,112 4
Netherlands 2% 12 4% 12 8,919 4 8,919 5 8,919 6
Norway 37% 5 28% 7 4,784 13 3,802 14 6,681 9
Portugal 21% 8 23% 8 6,495 8 6,495 8 9,997 3
Spain 70% 4 67% 4 5,191 12 5,191 12 5,191 14
Sweden 13% 9 20% 9 3,873 14 3,398 15 5,486 13
Switzerland 0% 13 0% 13 9,037 3 9,037 4 9,037 5
UK 77% 3 77% 3 6,430 10 6,430 9 6,430 10
Correlations with LECG measure (share of largest DTH operator)
-0.094 0.061 -0.046
Source: LECG (slide 11) / CRA calculations based on ScreenDigest data
108. The lack of relationship between LECG’s measure and the HHI measures, which have been constructed using data at the company level (see Figure 1), and correlation coefficients between the HHI measures and the share of largest DTH operator in), suggests that LECG’s measure is a poor and inaccurate proxy for market structure.

Review of LECG’s study 29 October 2007 CRA International
Page 32
Figure 1: Relationship between the share of largest DTH operator and HHIs by operator, 2005
ATBE
FR
GR
IT
NO
PT
ES
SE
CH
UK
DK
FI
DE
NL0%
10%
20%
30%
40%
50%
60%
70%
80%
90%
100%
0 2,000 4,000 6,000 8,000 10,000 12,000
HHI by operator (measure 1)
Shar
e of
larg
est D
TH o
pera
tor
Source: LECG (slide 11) / CRA calculations based on ScreenDigest data
109. The table shows that the three HHI measures of market structure yield similar results. However, these results paint a strikingly different picture of concentration levels across the 15 European countries when compared to LECG’s findings. Using LECG’s measure (share of the largest DTH operator), UK is amongst the most concentrated markets, ranking third after Italy and Greece. In contrast, using all HHI measures, UK is less concentrated when compared to other European countries, ranking ninth or tenth place.
6. CONCLUSIONS
110. Our review of LECG’s empirical analysis finds serious flaws in their approach, the data, the analysis and the interpretation of the results they obtain. As a result we believe that LECG’s econometric study does not provide any reliable evidence that prices for pay TV packages of similar quality are higher in the UK than in other EU countries, nor that the higher ARPS observed in the UK are due to high margins and a lack of competition in the UK market.
111. The key flaw in LECG’s study is the failure to control adequately for package quality. While they recognise that pay TV packages vary widely in quality terms, there is no adequate control for it in the ScreenDigest data they use. The “programme expenditure” variable that is used to control for quality is inadequate,

Review of LECG’s study 29 October 2007 CRA International
Page 33
as it does not cover total channel carriage fees nor (as LECG claim) does it cover “total expenditure on third party rights by all pay TV operators”. According to ScreenDigest it only covers expenditure on movie rights for premium movie channels, and therefore excludes spending on a very wide range of other types of programming. ScreenDigest itself acknowledges that the measure covers only a part of total programme expenditures and that it is a poor measure of the total. (Sky believes that it covers only about a fifth in the UK of pay TV companies’ expenditures on content). LECG’s failure to control adequately for quality means that all their estimates suffer from severe omitted variable bias.
112. These problems are exacerbated by the fact that the ARPS measure used by LECG includes for a number of countries subscription payments to cable operators by households who only receive FTA services, and no pay TV channels. In various European countries cable is used as the near-universal distribution method for FTA-only services; and in the data used by LECG, the (relatively low) payments to cable operators by households who receive FTA-only services are treated as pay TV subscriptions even though they receive no pay TV channels. As a result, a large share of the observed variation in ARPS across countries just depends on variation across countries in the use of cable to distribute FTA services.
113. Because it fails so comprehensively to account for quality, LECG’s analysis cannot therefore be relied upon to capture systematic effects on ARPS arising from differences in “market structure”.
114. Indeed LECG’s attempt to identify the effects of “market structure” on ARPS is also flawed. LECG’s main piece of evidence for the role of market structure affecting pay TV average revenue per subscriber is the positive correlation between the variable “market share of largest DTH operator” and ARPS. But this correlation can be explained by the fact that some countries have greater DTH penetration than others, and due to the use of cable to deliver FTA services, retailers operating on DTH platforms tend to provide services with a greater pay TV component than retailers operating on cable platforms.
115. In addition, LECG’s analysis contains data errors. We attempted to reconstruct LECG’s data using information from ScreenDigest. We were unable to do so. The results using our data are significantly weaker than those reported by LECG. While the data available to us from ScreenDigest are probably not identical to that available to LECG, there is evidence of errors by LECG in the construction of their data set. The fact that these variations between the two data sets cause significant changes to the results indicates that LECG’s results are not robust. In so far as these differences are due to errors in the construction of their data, their results are simply incorrect.
116. Further, LECG’s analysis contains many technical errors. As a result of a basic and fundamental error both their estimation and forecasting techniques are incorrect.
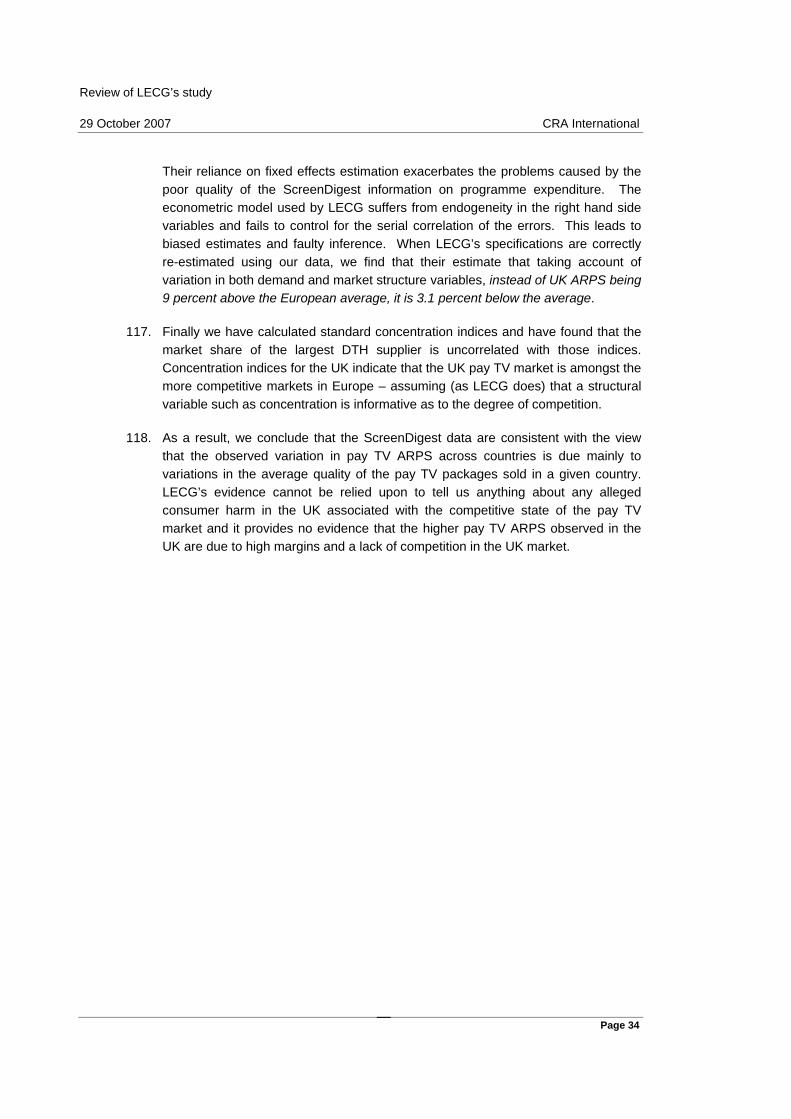
Review of LECG’s study 29 October 2007 CRA International
Page 34
Their reliance on fixed effects estimation exacerbates the problems caused by the poor quality of the ScreenDigest information on programme expenditure. The econometric model used by LECG suffers from endogeneity in the right hand side variables and fails to control for the serial correlation of the errors. This leads to biased estimates and faulty inference. When LECG’s specifications are correctly re-estimated using our data, we find that their estimate that taking account of variation in both demand and market structure variables, instead of UK ARPS being 9 percent above the European average, it is 3.1 percent below the average.
117. Finally we have calculated standard concentration indices and have found that the market share of the largest DTH supplier is uncorrelated with those indices. Concentration indices for the UK indicate that the UK pay TV market is amongst the more competitive markets in Europe – assuming (as LECG does) that a structural variable such as concentration is informative as to the degree of competition.
118. As a result, we conclude that the ScreenDigest data are consistent with the view that the observed variation in pay TV ARPS across countries is due mainly to variations in the average quality of the pay TV packages sold in a given country. LECG’s evidence cannot be relied upon to tell us anything about any alleged consumer harm in the UK associated with the competitive state of the pay TV market and it provides no evidence that the higher pay TV ARPS observed in the UK are due to high margins and a lack of competition in the UK market.

Review of LECG’s study 29 October 2007 CRA International
Page 35
APPENDIX A: DATA
A.1 DESCRIPTION OF THE DATA
119. We compiled a dataset similar to LECG, based on a database compiled by ScreenDigest. This dataset incorporates all data revisions by ScreenDigest as of 9 August 2007 and contains all the key variables used by LECG in their econometric study. The dataset is also supplemented with macro-economic information based on publicly available sources.29
120. In particular, our dataset contains quantitative information on the pay TV market by country on an annual basis for the period 1997 to 2005. We have collected these data for fifteen countries – Austria, Belgium, Denmark, Finland, France, Germany, Italy, Greece, Netherlands, Norway, Portugal, Spain, Sweden, Switzerland and the UK.30 For each country, the ScreenDigest data also contain disaggregated information on pay TV revenues and number of subscribers by platform and operator. A brief description of the key variables is provided below:
• Average pay TV revenue per subscriber (ARPS). These are calculated as the ratio of pay TV revenues and the average number of subscribers:
Pay TV revenues are defined as subscription pay TV revenues (including on demand services).
ScreenDigest reports only year end (Q4) number of subscribers, therefore the average number of subscribers during a given year is calculated as the simple average of the numbers at year-start and year-end.
ARPS has been converted to real 2005 prices using the harmonised index of consumer prices.
ScreenDigest data have been converted to Euros/USD using a fixed exchange rate. We have converted these data back to local currencies
29 These include (a) Eurostat data on harmonised index of consumer prices (HICP) for all European countries except Switzerland; (b) Eurostat data on the consumer price index for Switzerland; (c) Eurostat data on annual exchange rates for all countries; and (d) European Commission data (AMECO database) on Gross Domestic Product per capita for all countries.
30 ScreenDigest also report information for Ireland and Luxembourg but for consistency with the LECG data these are excluded.

Review of LECG’s study 29 October 2007 CRA International
Page 36
(ScreenDigest provided us with the fixed exchange rates) and used annual exchange rates to express all data in Pounds (GBP).
• Penetration ratio. This is calculated as the ratio of the average number of subscribers to the average number of TV households.
Similarly to the data for the number of subscribers, the average number of TV households during a given year is calculated as the simple average of the numbers at year-start and year-end.
• Programme expenditure. It is calculated as the ratio of total expenditure on third party programme and movie rights by all pay TV operators and the average number of pay TV subscribers:
Programme expenditure does not expenditures by foreign channel providers.
Programme expenditure also excludes expenditure on sports rights and programming.
Programme expenditure per subscriber has been converted to real 2005 GBP prices using the harmonised index of consumer prices and annual exchange rates.
• Indicator pay per view presence. This indicator variable equals one if on-demand revenues are positive in a given country and year.
• Cable always largest. The indicator equals to one if cable has been the largest platform (in terms of its share of total pay TV revenues over all platforms) in each year for the period 1997 to 2005. It is fixed for a particular country.
• Share of largest DTH operator. It is calculated as the ratio of pay TV revenues by the largest DTH operator in a year and total pay TV revenues over all platforms:
The largest DTH operator has been selected in terms of revenues during a given year.
Operators offering pay TV service in multiple platforms are treated separately.
• Number of platforms. It measures the number of different pay TV platforms (DTH, cable, DTT, IPTV).

Review of LECG’s study 29 October 2007 CRA International
Page 37
A.2 COMPARISON WITH LECG DATA
121. During the data extraction there have been several data issues with the ScreenDigest data particularly with the disaggregated data at the platform and operator level. In order to ensure accuracy and consistency in the data, ScreenDigest has provided us with our current dataset based on their data sources and includes all data revisions as of 9 August 2007. We have compared this dataset against the LECG dataset as summarised in LECG’s econometric study. However, such comparison is difficult as we have neither a step by step script nor the actual final dataset used by LECG. In particular, the following problems have arisen:
122. In places it is unclear how LECG have generated their data. For example LECG appear to use expenditures expressed in constant (real) GB pounds. However they do not state the year that they use as reference.
123. ScreenDigest data is revised and updated continuously. The revision process appears to affect all the ScreenDigest data not just the most recent years. In the period since the summer ScreenDigest has revised the way in which it reports pay per view data. It now reports it as part of its report for on-demand services. As a result the data available to us from ScreenDigest are likely different from the data supplied to LECG.
124. ScreenDigest provides its information in more than one format. It has become clear that its revision process can result in the data in different formats not being entirely consistent. ScreenDigest has helped us to obtain a dataset that is internally consistent.
125. ScreenDigest uses subtly different measures of the same thing. For example it uses data on the number of end of year pay TV subscribers and the average number of pay TV subscribers over the year. It is not possible to tell which measure was used by LECG.
126. ScreenDigest publishes local currency information converted to Euro using a fixed exchange rate. To convert into a single currency using historic exchange rates requires conversion back into local currency using the ScreenDigest exchange rates and then into pounds using historic exchange rates. It is possible that there have been errors by either ScreenDigest or LECG in this relatively complex process.
127. A comparison between the two datasets is presented below.
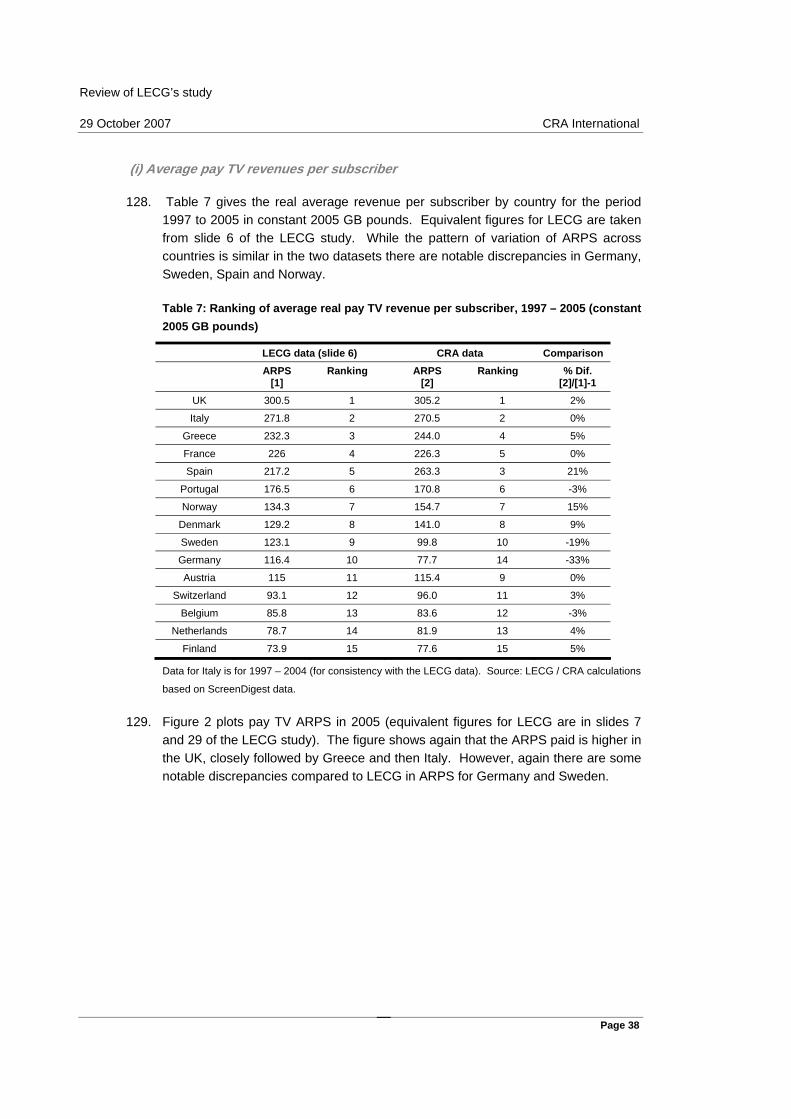
Review of LECG’s study 29 October 2007 CRA International
Page 38
(i) Average pay TV revenues per subscriber
128. Table 7 gives the real average revenue per subscriber by country for the period 1997 to 2005 in constant 2005 GB pounds. Equivalent figures for LECG are taken from slide 6 of the LECG study. While the pattern of variation of ARPS across countries is similar in the two datasets there are notable discrepancies in Germany, Sweden, Spain and Norway.
Table 7: Ranking of average real pay TV revenue per subscriber, 1997 – 2005 (constant 2005 GB pounds)
LECG data (slide 6) CRA data Comparison ARPS
[1] Ranking ARPS
[2] Ranking % Dif.
[2]/[1]-1 UK 300.5 1 305.2 1 2%
Italy 271.8 2 270.5 2 0%
Greece 232.3 3 244.0 4 5%
France 226 4 226.3 5 0%
Spain 217.2 5 263.3 3 21%
Portugal 176.5 6 170.8 6 -3%
Norway 134.3 7 154.7 7 15%
Denmark 129.2 8 141.0 8 9%
Sweden 123.1 9 99.8 10 -19%
Germany 116.4 10 77.7 14 -33%
Austria 115 11 115.4 9 0%
Switzerland 93.1 12 96.0 11 3%
Belgium 85.8 13 83.6 12 -3%
Netherlands 78.7 14 81.9 13 4%
Finland 73.9 15 77.6 15 5%
Data for Italy is for 1997 – 2004 (for consistency with the LECG data). Source: LECG / CRA calculations
based on ScreenDigest data.
129. Figure 2 plots pay TV ARPS in 2005 (equivalent figures for LECG are in slides 7 and 29 of the LECG study). The figure shows again that the ARPS paid is higher in the UK, closely followed by Greece and then Italy. However, again there are some notable discrepancies compared to LECG in ARPS for Germany and Sweden.

Review of LECG’s study 29 October 2007 CRA International
Page 39
Figure 2: Average pay TV revenue per subscriber in 2005
0
50
100
150
200
250
300
350
400
Aus
tria
Bel
gium
Den
mar
k
Finl
and
Fran
ce
Ger
man
y
Gre
ece
Italy
Net
herla
nds
Nor
way
Por
tuga
l
Spa
in
Sw
eden
Sw
itzer
land UK
AR
PS, G
BP
Note: The equivalent chart in the LECG analysis is provided at slide 7, repeated at slide 29 of the LECG study.
Data for Italy for 2005 is ScreenDigest revised data. Source: CRA calculations based on ScreenDigest data.
(ii) Penetration Rates
130. The penetration rates for each country for 2005 are given by LECG (slides 7 and 29). However, discrepancies are also observed in those figures between the LECG and CRA datasets (see Table 8).
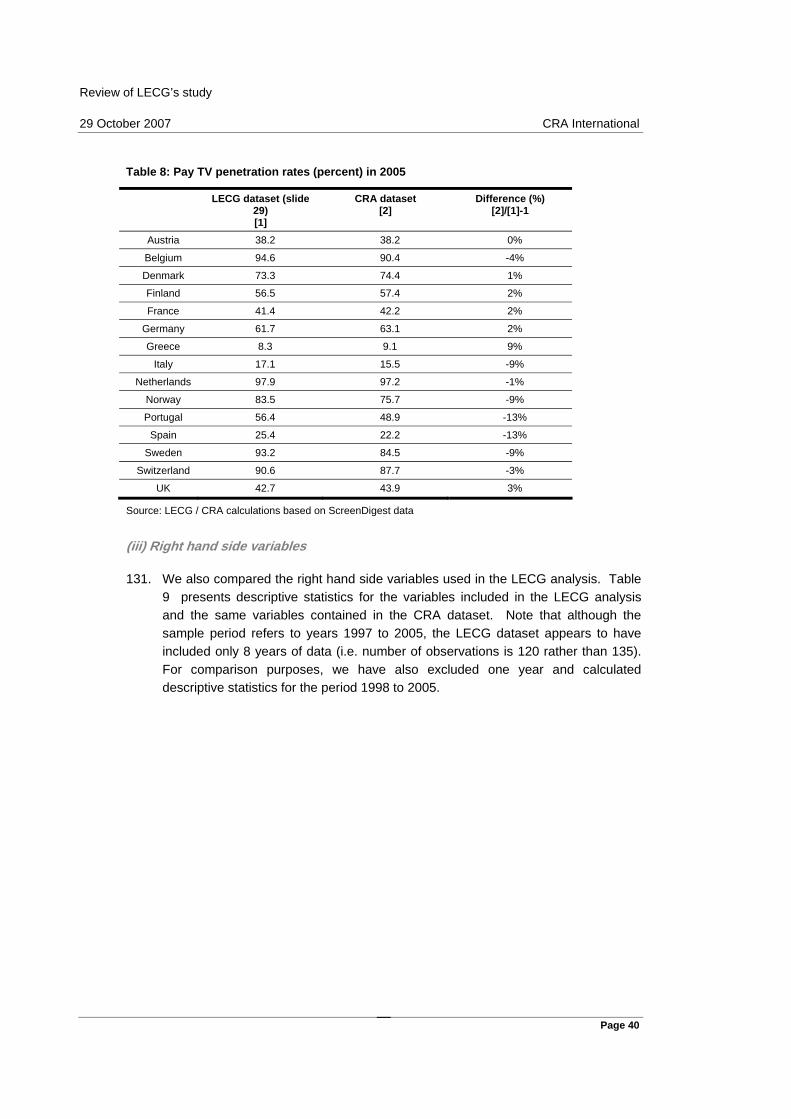
Review of LECG’s study 29 October 2007 CRA International
Page 40
Table 8: Pay TV penetration rates (percent) in 2005
LECG dataset (slide 29) [1]
CRA dataset [2]
Difference (%) [2]/[1]-1
Austria 38.2 38.2 0%
Belgium 94.6 90.4 -4%
Denmark 73.3 74.4 1%
Finland 56.5 57.4 2%
France 41.4 42.2 2%
Germany 61.7 63.1 2%
Greece 8.3 9.1 9%
Italy 17.1 15.5 -9%
Netherlands 97.9 97.2 -1%
Norway 83.5 75.7 -9%
Portugal 56.4 48.9 -13%
Spain 25.4 22.2 -13%
Sweden 93.2 84.5 -9%
Switzerland 90.6 87.7 -3%
UK 42.7 43.9 3%
Source: LECG / CRA calculations based on ScreenDigest data
(iii) Right hand side variables
131. We also compared the right hand side variables used in the LECG analysis. Table 9 presents descriptive statistics for the variables included in the LECG analysis and the same variables contained in the CRA dataset. Note that although the sample period refers to years 1997 to 2005, the LECG dataset appears to have included only 8 years of data (i.e. number of observations is 120 rather than 135). For comparison purposes, we have also excluded one year and calculated descriptive statistics for the period 1998 to 2005.

Review of LECG’s study 29 October 2007 CRA International
Page 41
Table 9: Descriptive statistics
Mean Standard deviation
Minimum Maximum Obs
LECG dataset (slide 24) Pay TV revenue per subscriber (in GBP) 159.8 75.3 57.7 336.3 119
Programme exp. per subs - lagged (in GBP) 14.2 17.3 0.1 66.7 119
GDP per capita (in thousands of GBP) 18.1 5.3 8.4 35.2 120
Market share largest DTH platform – lagged 21.6 24.3 0.0 97.2 120
Indicator - Cable is always largest platform 0.6 0.5 0.0 1.0 120
Number of different platforms 2.5 0.9 1.0 4.0 120
Indicator - Pay per view presence 0.9 0.4 0.0 1.0 120
CRA dataset
Pay TV revenue per subscriber (in GBP) 159.5 81.2 65.3 360.6 119
Programme exp. per subs - lagged (in GBP) 19.3 42.4 0.1 393.1 119
GDP per capita (in thousands of GBP) 18.2 5.4 8.4 35.9 120
Market share largest DTH platform – lagged 22.6 25.9 0.0 95.3 120
Indicator - Cable is always largest platform 0.7 0.5 0.0 1.0 120
Number of different platforms 2.5 0.8 1.0 4.0 120
Indicator - Pay per view presence 0.9 0.3 0.0 1.0 120
All values are in constant 2005 GB pounds. Source: LECG / CRA calculations based on ScreenDigest data.
132. The main discrepancies between the two datasets are summarised below:
• Programming expenditures per subscriber (in GBP) lagged one year: This variable shows a large variation in our dataset. This is mainly driven by a few outliers (Italy in years 1997 to 1999 and Spain in 1997), which are not in the LECG dataset. Other evidence indicates that there are major differences in this variable between the two datasets.
• Market share of largest DTH firm lagged one year: Table 10 gives market share of largest DTH supplier as calculated by CRA and LECG.31 Market share is the percent of revenues going to the largest DTH supplier compared to total pay TV revenues. There are discrepancies between the LECG and CRA calculations for all countries. More specifically the calculations for some countries
31 LECG (slide 11).
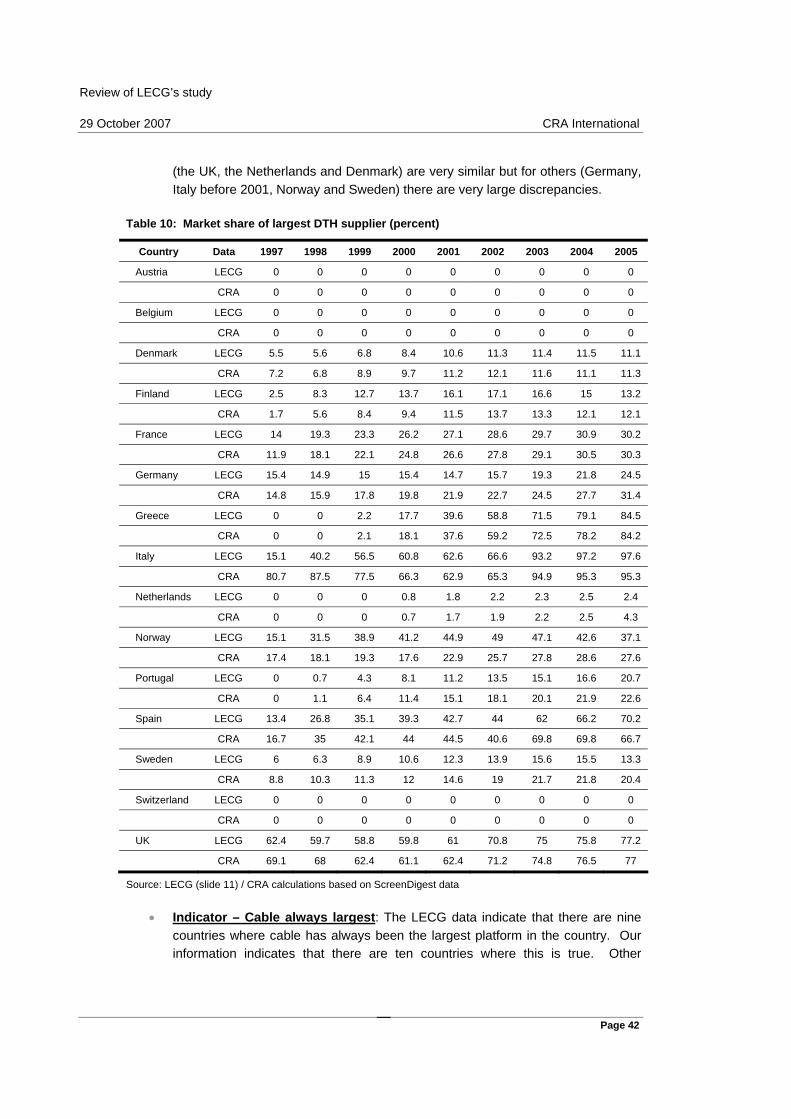
Review of LECG’s study 29 October 2007 CRA International
Page 42
(the UK, the Netherlands and Denmark) are very similar but for others (Germany, Italy before 2001, Norway and Sweden) there are very large discrepancies.
Table 10: Market share of largest DTH supplier (percent)
Country Data 1997 1998 1999 2000 2001 2002 2003 2004 2005
Austria LECG 0 0 0 0 0 0 0 0 0
CRA 0 0 0 0 0 0 0 0 0
Belgium LECG 0 0 0 0 0 0 0 0 0
CRA 0 0 0 0 0 0 0 0 0
Denmark LECG 5.5 5.6 6.8 8.4 10.6 11.3 11.4 11.5 11.1
CRA 7.2 6.8 8.9 9.7 11.2 12.1 11.6 11.1 11.3
Finland LECG 2.5 8.3 12.7 13.7 16.1 17.1 16.6 15 13.2
CRA 1.7 5.6 8.4 9.4 11.5 13.7 13.3 12.1 12.1
France LECG 14 19.3 23.3 26.2 27.1 28.6 29.7 30.9 30.2
CRA 11.9 18.1 22.1 24.8 26.6 27.8 29.1 30.5 30.3
Germany LECG 15.4 14.9 15 15.4 14.7 15.7 19.3 21.8 24.5
CRA 14.8 15.9 17.8 19.8 21.9 22.7 24.5 27.7 31.4
Greece LECG 0 0 2.2 17.7 39.6 58.8 71.5 79.1 84.5
CRA 0 0 2.1 18.1 37.6 59.2 72.5 78.2 84.2
Italy LECG 15.1 40.2 56.5 60.8 62.6 66.6 93.2 97.2 97.6
CRA 80.7 87.5 77.5 66.3 62.9 65.3 94.9 95.3 95.3
Netherlands LECG 0 0 0 0.8 1.8 2.2 2.3 2.5 2.4
CRA 0 0 0 0.7 1.7 1.9 2.2 2.5 4.3
Norway LECG 15.1 31.5 38.9 41.2 44.9 49 47.1 42.6 37.1
CRA 17.4 18.1 19.3 17.6 22.9 25.7 27.8 28.6 27.6
Portugal LECG 0 0.7 4.3 8.1 11.2 13.5 15.1 16.6 20.7
CRA 0 1.1 6.4 11.4 15.1 18.1 20.1 21.9 22.6
Spain LECG 13.4 26.8 35.1 39.3 42.7 44 62 66.2 70.2
CRA 16.7 35 42.1 44 44.5 40.6 69.8 69.8 66.7
Sweden LECG 6 6.3 8.9 10.6 12.3 13.9 15.6 15.5 13.3
CRA 8.8 10.3 11.3 12 14.6 19 21.7 21.8 20.4
Switzerland LECG 0 0 0 0 0 0 0 0 0
CRA 0 0 0 0 0 0 0 0 0
UK LECG 62.4 59.7 58.8 59.8 61 70.8 75 75.8 77.2
CRA 69.1 68 62.4 61.1 62.4 71.2 74.8 76.5 77
Source: LECG (slide 11) / CRA calculations based on ScreenDigest data
• Indicator – Cable always largest: The LECG data indicate that there are nine countries where cable has always been the largest platform in the country. Our information indicates that there are ten countries where this is true. Other
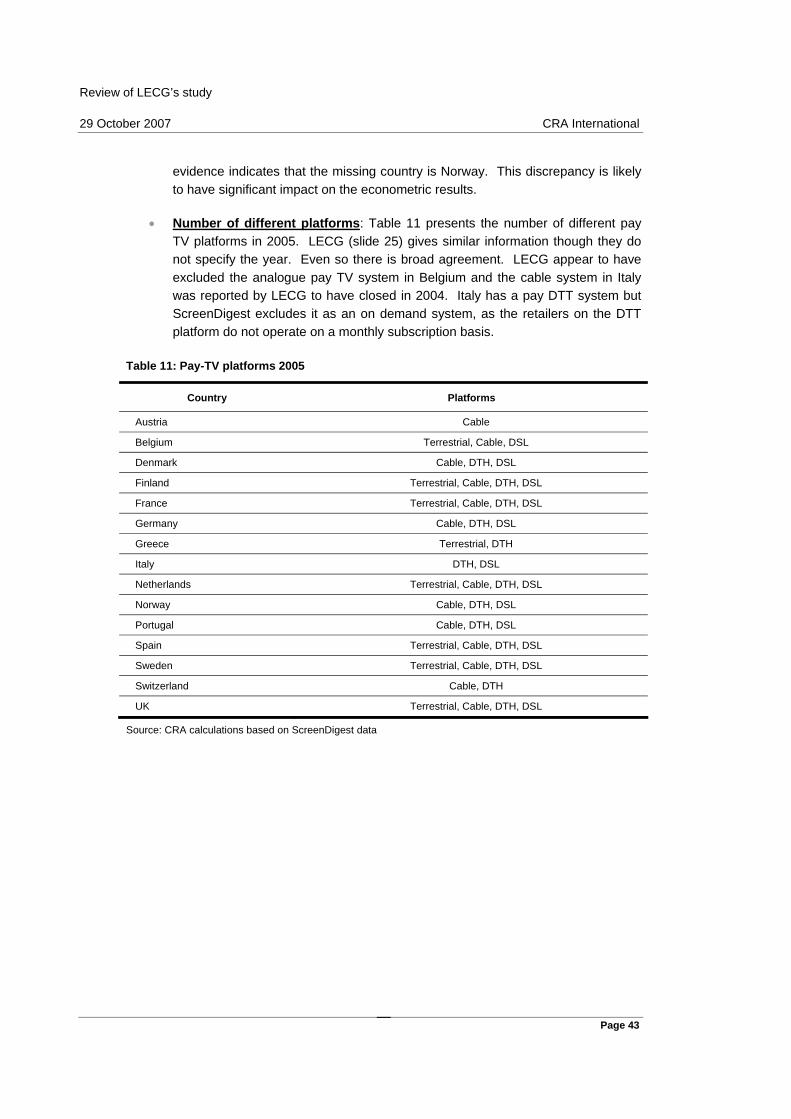
Review of LECG’s study 29 October 2007 CRA International
Page 43
evidence indicates that the missing country is Norway. This discrepancy is likely to have significant impact on the econometric results.
• Number of different platforms: Table 11 presents the number of different pay TV platforms in 2005. LECG (slide 25) gives similar information though they do not specify the year. Even so there is broad agreement. LECG appear to have excluded the analogue pay TV system in Belgium and the cable system in Italy was reported by LECG to have closed in 2004. Italy has a pay DTT system but ScreenDigest excludes it as an on demand system, as the retailers on the DTT platform do not operate on a monthly subscription basis.
Table 11: Pay-TV platforms 2005
Country Platforms
Austria Cable
Belgium Terrestrial, Cable, DSL
Denmark Cable, DTH, DSL
Finland Terrestrial, Cable, DTH, DSL
France Terrestrial, Cable, DTH, DSL
Germany Cable, DTH, DSL
Greece Terrestrial, DTH
Italy DTH, DSL
Netherlands Terrestrial, Cable, DTH, DSL
Norway Cable, DTH, DSL
Portugal Cable, DTH, DSL
Spain Terrestrial, Cable, DTH, DSL
Sweden Terrestrial, Cable, DTH, DSL
Switzerland Cable, DTH
UK Terrestrial, Cable, DTH, DSL
Source: CRA calculations based on ScreenDigest data
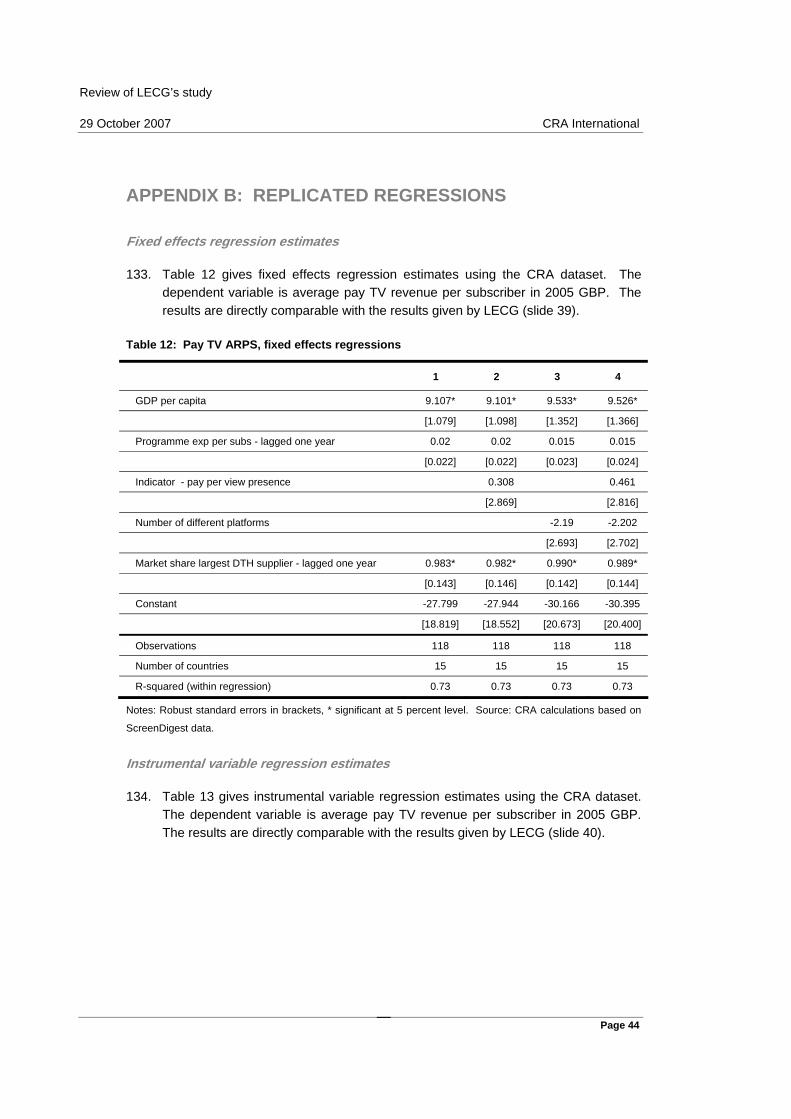
Review of LECG’s study 29 October 2007 CRA International
Page 44
APPENDIX B: REPLICATED REGRESSIONS
Fixed effects regression estimates
133. Table 12 gives fixed effects regression estimates using the CRA dataset. The dependent variable is average pay TV revenue per subscriber in 2005 GBP. The results are directly comparable with the results given by LECG (slide 39).
Table 12: Pay TV ARPS, fixed effects regressions
1 2 3 4
GDP per capita 9.107* 9.101* 9.533* 9.526*
[1.079] [1.098] [1.352] [1.366]
Programme exp per subs - lagged one year 0.02 0.02 0.015 0.015
[0.022] [0.022] [0.023] [0.024]
Indicator - pay per view presence 0.308 0.461
[2.869] [2.816]
Number of different platforms -2.19 -2.202
[2.693] [2.702]
Market share largest DTH supplier - lagged one year 0.983* 0.982* 0.990* 0.989*
[0.143] [0.146] [0.142] [0.144]
Constant -27.799 -27.944 -30.166 -30.395
[18.819] [18.552] [20.673] [20.400]
Observations 118 118 118 118
Number of countries 15 15 15 15
R-squared (within regression) 0.73 0.73 0.73 0.73
Notes: Robust standard errors in brackets, * significant at 5 percent level. Source: CRA calculations based on
ScreenDigest data.
Instrumental variable regression estimates
134. Table 13 gives instrumental variable regression estimates using the CRA dataset. The dependent variable is average pay TV revenue per subscriber in 2005 GBP. The results are directly comparable with the results given by LECG (slide 40).
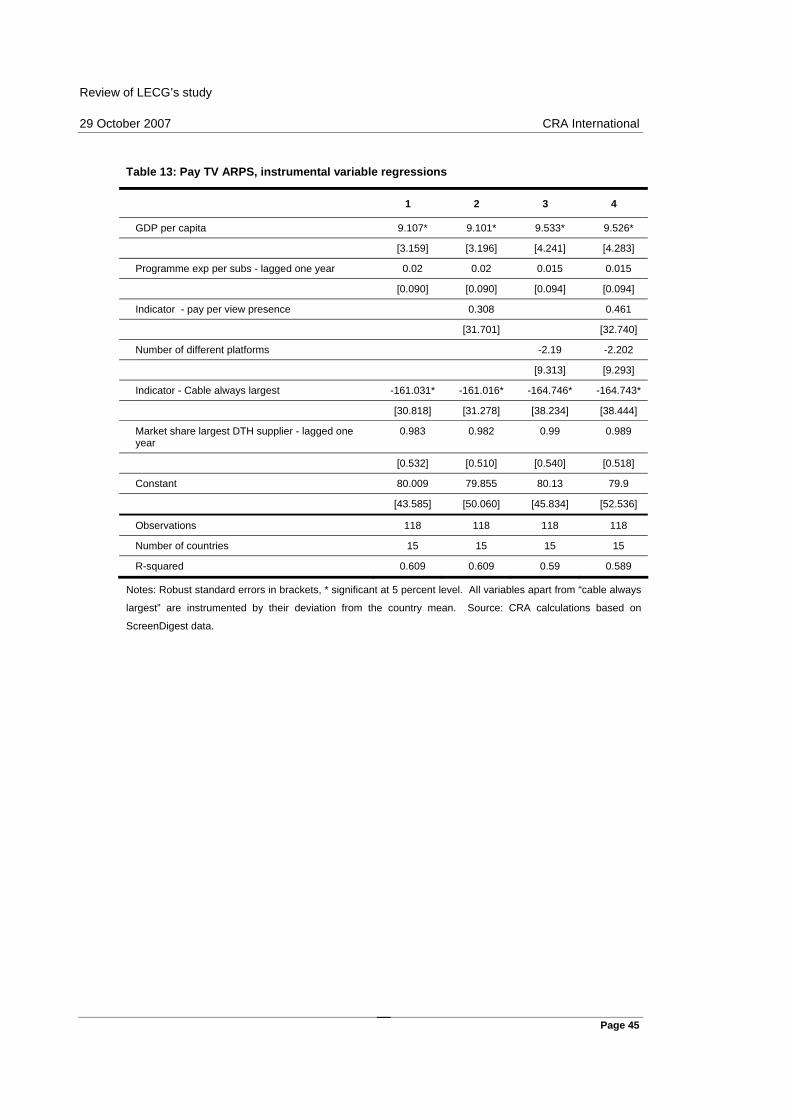
Review of LECG’s study 29 October 2007 CRA International
Page 45
Table 13: Pay TV ARPS, instrumental variable regressions
1 2 3 4
GDP per capita 9.107* 9.101* 9.533* 9.526*
[3.159] [3.196] [4.241] [4.283]
Programme exp per subs - lagged one year 0.02 0.02 0.015 0.015
[0.090] [0.090] [0.094] [0.094]
Indicator - pay per view presence 0.308 0.461
[31.701] [32.740]
Number of different platforms -2.19 -2.202
[9.313] [9.293]
Indicator - Cable always largest -161.031* -161.016* -164.746* -164.743*
[30.818] [31.278] [38.234] [38.444]
Market share largest DTH supplier - lagged one year
0.983 0.982 0.99 0.989
[0.532] [0.510] [0.540] [0.518]
Constant 80.009 79.855 80.13 79.9
[43.585] [50.060] [45.834] [52.536]
Observations 118 118 118 118
Number of countries 15 15 15 15
R-squared 0.609 0.609 0.59 0.589
Notes: Robust standard errors in brackets, * significant at 5 percent level. All variables apart from “cable always
largest” are instrumented by their deviation from the country mean. Source: CRA calculations based on
ScreenDigest data.
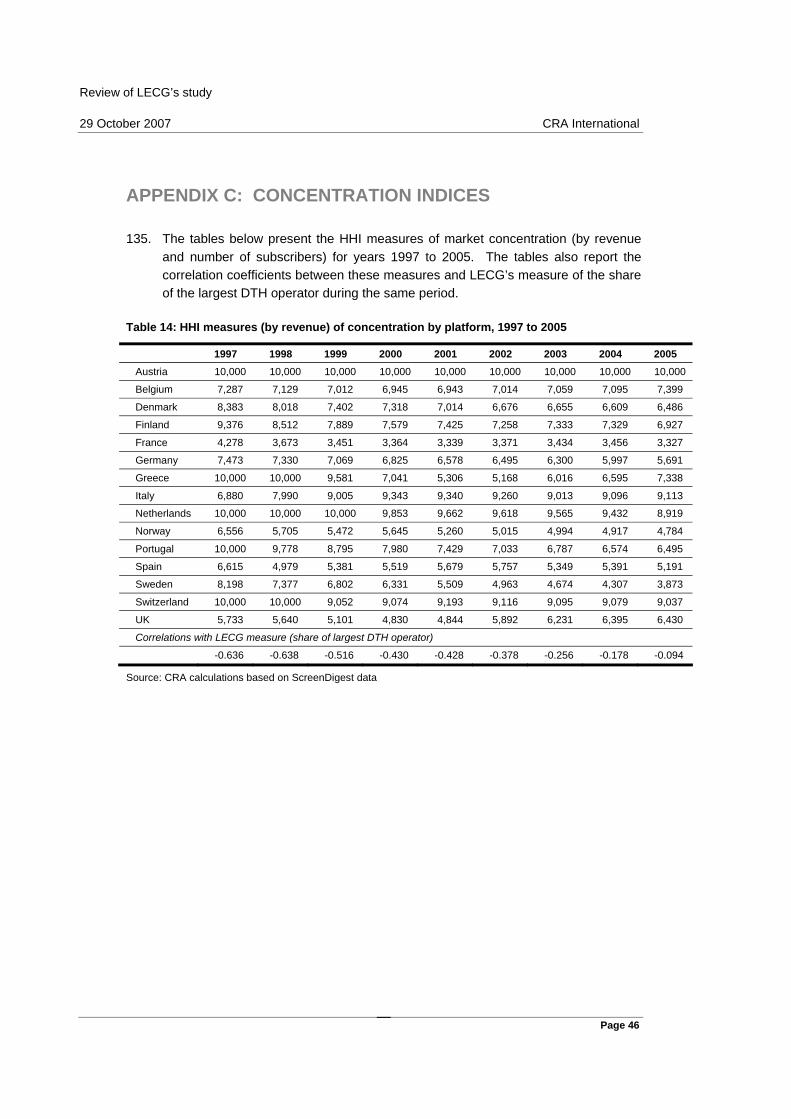
Review of LECG’s study 29 October 2007 CRA International
Page 46
APPENDIX C: CONCENTRATION INDICES
135. The tables below present the HHI measures of market concentration (by revenue and number of subscribers) for years 1997 to 2005. The tables also report the correlation coefficients between these measures and LECG’s measure of the share of the largest DTH operator during the same period.
Table 14: HHI measures (by revenue) of concentration by platform, 1997 to 2005
1997 1998 1999 2000 2001 2002 2003 2004 2005 Austria 10,000 10,000 10,000 10,000 10,000 10,000 10,000 10,000 10,000
Belgium 7,287 7,129 7,012 6,945 6,943 7,014 7,059 7,095 7,399
Denmark 8,383 8,018 7,402 7,318 7,014 6,676 6,655 6,609 6,486
Finland 9,376 8,512 7,889 7,579 7,425 7,258 7,333 7,329 6,927
France 4,278 3,673 3,451 3,364 3,339 3,371 3,434 3,456 3,327
Germany 7,473 7,330 7,069 6,825 6,578 6,495 6,300 5,997 5,691
Greece 10,000 10,000 9,581 7,041 5,306 5,168 6,016 6,595 7,338
Italy 6,880 7,990 9,005 9,343 9,340 9,260 9,013 9,096 9,113
Netherlands 10,000 10,000 10,000 9,853 9,662 9,618 9,565 9,432 8,919
Norway 6,556 5,705 5,472 5,645 5,260 5,015 4,994 4,917 4,784
Portugal 10,000 9,778 8,795 7,980 7,429 7,033 6,787 6,574 6,495
Spain 6,615 4,979 5,381 5,519 5,679 5,757 5,349 5,391 5,191
Sweden 8,198 7,377 6,802 6,331 5,509 4,963 4,674 4,307 3,873
Switzerland 10,000 10,000 9,052 9,074 9,193 9,116 9,095 9,079 9,037
UK 5,733 5,640 5,101 4,830 4,844 5,892 6,231 6,395 6,430
Correlations with LECG measure (share of largest DTH operator)
-0.636 -0.638 -0.516 -0.430 -0.428 -0.378 -0.256 -0.178 -0.094
Source: CRA calculations based on ScreenDigest data
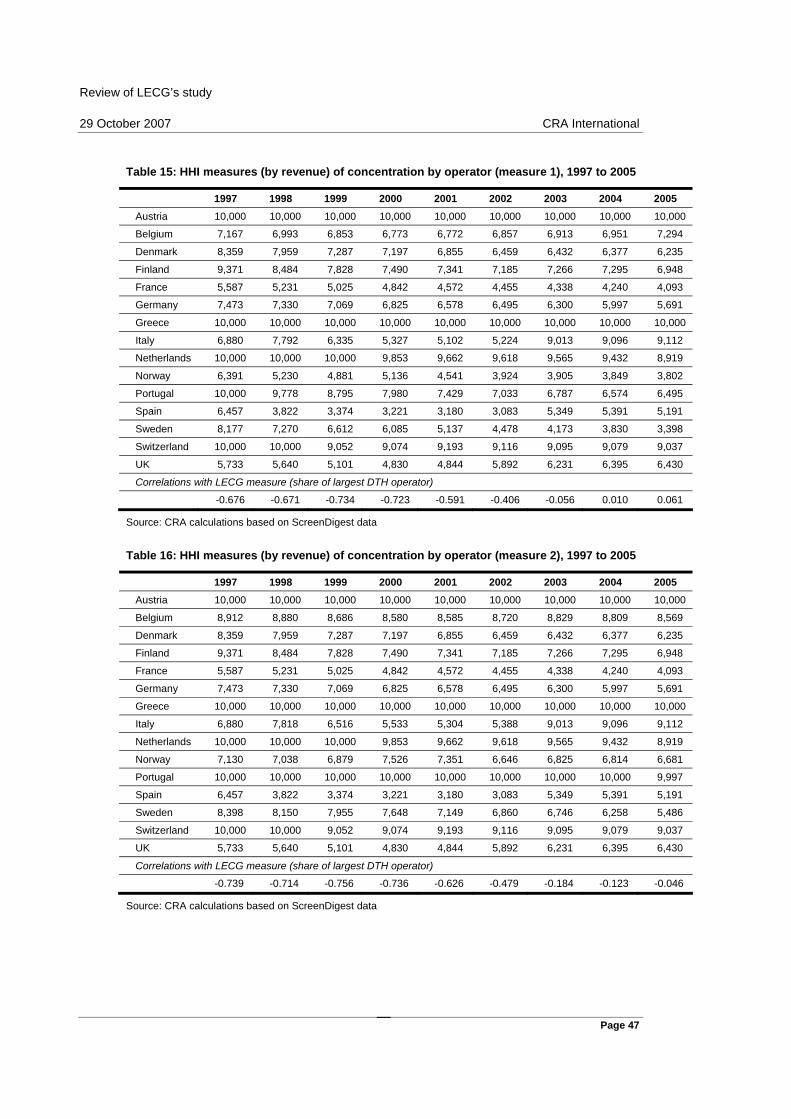
Review of LECG’s study 29 October 2007 CRA International
Page 47
Table 15: HHI measures (by revenue) of concentration by operator (measure 1), 1997 to 2005
1997 1998 1999 2000 2001 2002 2003 2004 2005 Austria 10,000 10,000 10,000 10,000 10,000 10,000 10,000 10,000 10,000
Belgium 7,167 6,993 6,853 6,773 6,772 6,857 6,913 6,951 7,294
Denmark 8,359 7,959 7,287 7,197 6,855 6,459 6,432 6,377 6,235
Finland 9,371 8,484 7,828 7,490 7,341 7,185 7,266 7,295 6,948
France 5,587 5,231 5,025 4,842 4,572 4,455 4,338 4,240 4,093
Germany 7,473 7,330 7,069 6,825 6,578 6,495 6,300 5,997 5,691
Greece 10,000 10,000 10,000 10,000 10,000 10,000 10,000 10,000 10,000
Italy 6,880 7,792 6,335 5,327 5,102 5,224 9,013 9,096 9,112
Netherlands 10,000 10,000 10,000 9,853 9,662 9,618 9,565 9,432 8,919
Norway 6,391 5,230 4,881 5,136 4,541 3,924 3,905 3,849 3,802
Portugal 10,000 9,778 8,795 7,980 7,429 7,033 6,787 6,574 6,495
Spain 6,457 3,822 3,374 3,221 3,180 3,083 5,349 5,391 5,191
Sweden 8,177 7,270 6,612 6,085 5,137 4,478 4,173 3,830 3,398
Switzerland 10,000 10,000 9,052 9,074 9,193 9,116 9,095 9,079 9,037
UK 5,733 5,640 5,101 4,830 4,844 5,892 6,231 6,395 6,430
Correlations with LECG measure (share of largest DTH operator)
-0.676 -0.671 -0.734 -0.723 -0.591 -0.406 -0.056 0.010 0.061
Source: CRA calculations based on ScreenDigest data
Table 16: HHI measures (by revenue) of concentration by operator (measure 2), 1997 to 2005
1997 1998 1999 2000 2001 2002 2003 2004 2005 Austria 10,000 10,000 10,000 10,000 10,000 10,000 10,000 10,000 10,000
Belgium 8,912 8,880 8,686 8,580 8,585 8,720 8,829 8,809 8,569
Denmark 8,359 7,959 7,287 7,197 6,855 6,459 6,432 6,377 6,235
Finland 9,371 8,484 7,828 7,490 7,341 7,185 7,266 7,295 6,948
France 5,587 5,231 5,025 4,842 4,572 4,455 4,338 4,240 4,093
Germany 7,473 7,330 7,069 6,825 6,578 6,495 6,300 5,997 5,691
Greece 10,000 10,000 10,000 10,000 10,000 10,000 10,000 10,000 10,000
Italy 6,880 7,818 6,516 5,533 5,304 5,388 9,013 9,096 9,112
Netherlands 10,000 10,000 10,000 9,853 9,662 9,618 9,565 9,432 8,919
Norway 7,130 7,038 6,879 7,526 7,351 6,646 6,825 6,814 6,681
Portugal 10,000 10,000 10,000 10,000 10,000 10,000 10,000 10,000 9,997
Spain 6,457 3,822 3,374 3,221 3,180 3,083 5,349 5,391 5,191
Sweden 8,398 8,150 7,955 7,648 7,149 6,860 6,746 6,258 5,486
Switzerland 10,000 10,000 9,052 9,074 9,193 9,116 9,095 9,079 9,037
UK 5,733 5,640 5,101 4,830 4,844 5,892 6,231 6,395 6,430
Correlations with LECG measure (share of largest DTH operator)
-0.739 -0.714 -0.756 -0.736 -0.626 -0.479 -0.184 -0.123 -0.046
Source: CRA calculations based on ScreenDigest data

Review of LECG’s study 29 October 2007 CRA International
Page 48
Table 17: HHI measures (by number of subscribers) of concentration by platform, 1997 to 2005
1997 1998 1999 2000 2001 2002 2003 2004 2005 Austria 10,000 10,000 10,000 10,000 10,000 10,000 10,000 10,000 10,000
Belgium 10,000 10,000 10,000 10,000 10,000 10,000 10,000 10,000 9,838
Denmark 9,211 8,756 8,521 8,249 7,677 7,502 7,404 7,378 7,115
Finland 9,831 9,576 9,453 9,328 9,044 9,014 8,976 8,933 8,536
France 3,981 3,559 3,414 3,346 3,335 3,354 3,399 3,366 3,212
Germany 9,265 9,279 9,272 9,229 9,198 9,029 8,924 8,809 8,681
Greece 10,000 10,000 9,538 7,285 5,470 5,013 5,192 5,563 6,291
Italy 6,755 8,377 9,208 9,367 9,208 9,163 8,723 9,019 9,038
Netherlands 10,000 10,000 10,000 9,902 9,861 9,853 9,829 9,619 8,346
Norway 7,879 6,818 6,351 6,176 5,555 5,345 5,297 5,160 4,907
Portugal 10,000 9,675 8,410 7,825 7,224 6,946 6,718 6,539 6,578
Spain 6,431 4,941 4,572 3,834 4,133 4,200 4,057 4,027 4,671
Sweden 9,036 8,394 7,954 7,634 6,775 6,335 5,999 5,427 4,897
Switzerland 10,000 10,000 9,400 9,366 9,380 9,378 9,384 9,388 9,380
UK 5,206 5,008 4,390 4,194 4,157 5,456 5,616 5,537 5,494
Correlations with LECG measure (share of largest DTH operator)
-0.700 -0.710 -0.618 -0.586 -0.612 -0.579 -0.525 -0.467 -0.361
Number of subscribers refers to year end (Q4) of each year. Source: calculations based on ScreenDigest data.
Table 18: HHI measures (by number of subscribers) of concentration by operator (measure 1), 1997 to 2005
1997 1998 1999 2000 2001 2002 2003 2004 2005 Austria 10,000 10,000 10,000 10,000 10,000 10,000 10,000 10,000 10,000
Belgium 10,000 10,000 10,000 10,000 10,000 10,000 10,000 10,000 9,838
Denmark 9,205 8,736 8,490 8,205 7,590 7,399 7,289 7,259 6,971
Finland 9,831 9,575 9,452 9,324 9,036 9,005 8,966 8,931 8,545
France 5,008 4,678 4,494 4,325 4,242 4,174 4,122 3,964 3,814
Germany 9,265 9,279 9,272 9,229 9,198 9,029 8,924 8,809 8,681
Greece 10,000 10,000 10,000 10,000 9,439 10,000 10,000 10,000 10,000
Italy 6,755 8,090 5,792 5,093 4,994 5,312 8,723 9,019 9,036
Netherlands 10,000 10,000 10,000 9,902 9,861 9,853 9,829 9,619 8,346
Norway 7,813 6,623 6,065 5,845 5,000 4,674 4,609 4,454 4,140
Portugal 10,000 9,675 8,410 7,825 7,224 6,946 6,718 6,539 6,578
Spain 6,221 3,852 3,251 2,488 2,522 2,648 4,057 4,027 4,671
Sweden 9,024 8,355 7,891 7,563 6,650 6,175 5,827 5,265 4,737
Switzerland 10,000 10,000 9,400 9,367 9,381 9,379 9,385 9,389 9,381
UK 5,206 5,008 4,390 4,194 4,157 5,456 5,616 5,537 5,494
Correlations with LECG measure (share of largest DTH operator)
-0.743 -0.745 -0.828 -0.815 -0.749 -0.572 -0.333 -0.262 -0.161
Number of subscribers refers to year end (Q4) of each year. Source: CRA calculations based on ScreenDigest
data.

Review of LECG’s study 29 October 2007 CRA International
Page 49
Table 19: HHI measures (by number of subscribers) of concentration by operator (measure 2), 1997 to 2005
1997 1998 1999 2000 2001 2002 2003 2004 2005 Austria 10,000 10,000 10,000 10,000 10,000 10,000 10,000 10,000 10,000
Belgium 10,000 10,000 10,000 10,000 10,000 10,000 10,000 10,000 9,838
Denmark 9,205 8,736 8,490 8,205 7,590 7,399 7,289 7,259 6,971
Finland 9,831 9,575 9,452 9,324 9,036 9,005 8,966 8,931 8,545
France 5,008 4,678 4,494 4,325 4,242 4,174 4,122 3,964 3,814
Germany 9,265 9,279 9,272 9,229 9,198 9,029 8,924 8,809 8,681
Greece 10,000 10,000 10,000 10,000 9,439 10,000 10,000 10,000 10,000
Italy 6,755 8,119 5,988 5,316 5,211 5,467 8,723 9,019 9,036
Netherlands 10,000 10,000 10,000 9,902 9,861 9,853 9,829 9,619 8,346
Norway 8,543 8,047 7,761 7,667 7,295 7,203 7,160 7,064 6,667
Portugal 10,000 10,000 10,000 10,000 10,000 10,000 10,000 10,000 9,993
Spain 6,221 3,852 3,251 2,488 2,522 2,648 4,057 4,027 4,671
Sweden 9,351 9,096 8,806 8,538 7,959 7,695 7,430 6,735 6,076
Switzerland 10,000 10,000 9,400 9,367 9,381 9,379 9,385 9,389 9,381
UK 5,206 5,008 4,390 4,194 4,157 5,456 5,616 5,537 5,494
Correlations with LECG measure (share of largest DTH operator)
-0.739 -0.725 -0.803 -0.794 -0.740 -0.582 -0.397 -0.334 -0.229
Number of subscribers refers to year end (Q4) of each year. Source: CRA calculations based on ScreenDigest
data.
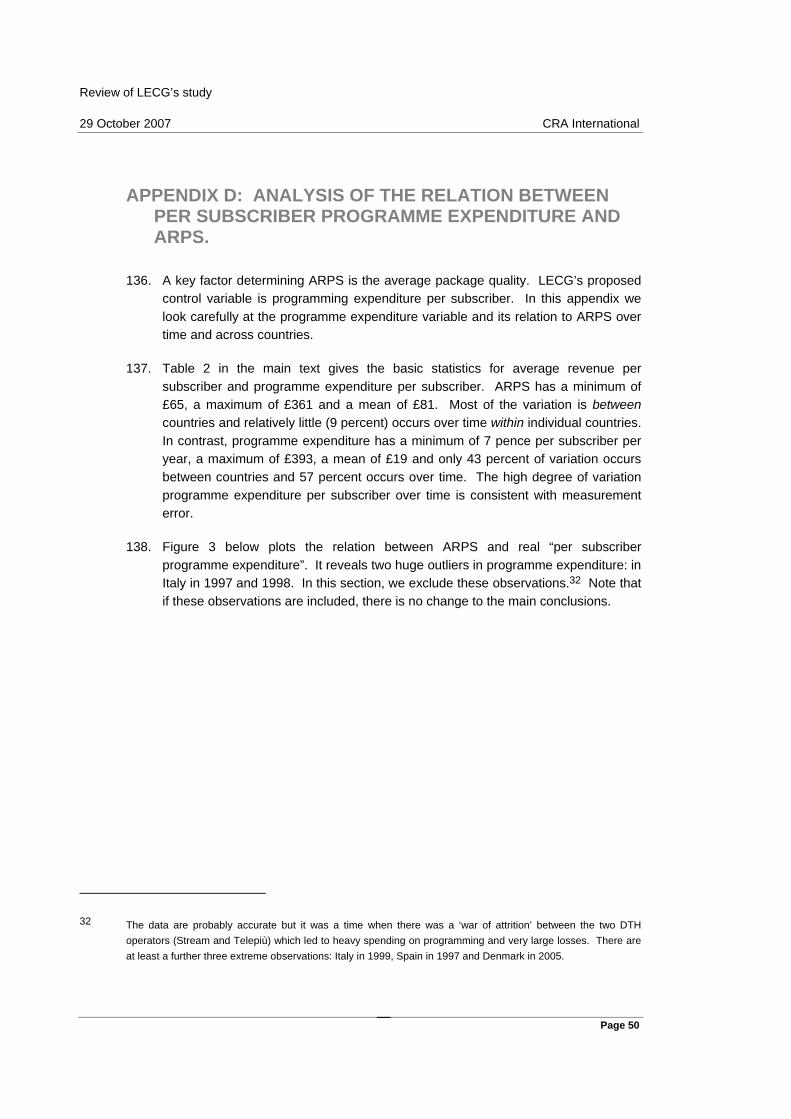
Review of LECG’s study 29 October 2007 CRA International
Page 50
APPENDIX D: ANALYSIS OF THE RELATION BETWEEN PER SUBSCRIBER PROGRAMME EXPENDITURE AND ARPS.
136. A key factor determining ARPS is the average package quality. LECG’s proposed control variable is programming expenditure per subscriber. In this appendix we look carefully at the programme expenditure variable and its relation to ARPS over time and across countries.
137. Table 2 in the main text gives the basic statistics for average revenue per subscriber and programme expenditure per subscriber. ARPS has a minimum of £65, a maximum of £361 and a mean of £81. Most of the variation is between countries and relatively little (9 percent) occurs over time within individual countries. In contrast, programme expenditure has a minimum of 7 pence per subscriber per year, a maximum of £393, a mean of £19 and only 43 percent of variation occurs between countries and 57 percent occurs over time. The high degree of variation programme expenditure per subscriber over time is consistent with measurement error.
138. Figure 3 below plots the relation between ARPS and real “per subscriber programme expenditure”. It reveals two huge outliers in programme expenditure: in Italy in 1997 and 1998. In this section, we exclude these observations.32 Note that if these observations are included, there is no change to the main conclusions.
32 The data are probably accurate but it was a time when there was a ‘war of attrition’ between the two DTH operators (Stream and Telepiù) which led to heavy spending on programming and very large losses. There are at least a further three extreme observations: Italy in 1999, Spain in 1997 and Denmark in 2005.
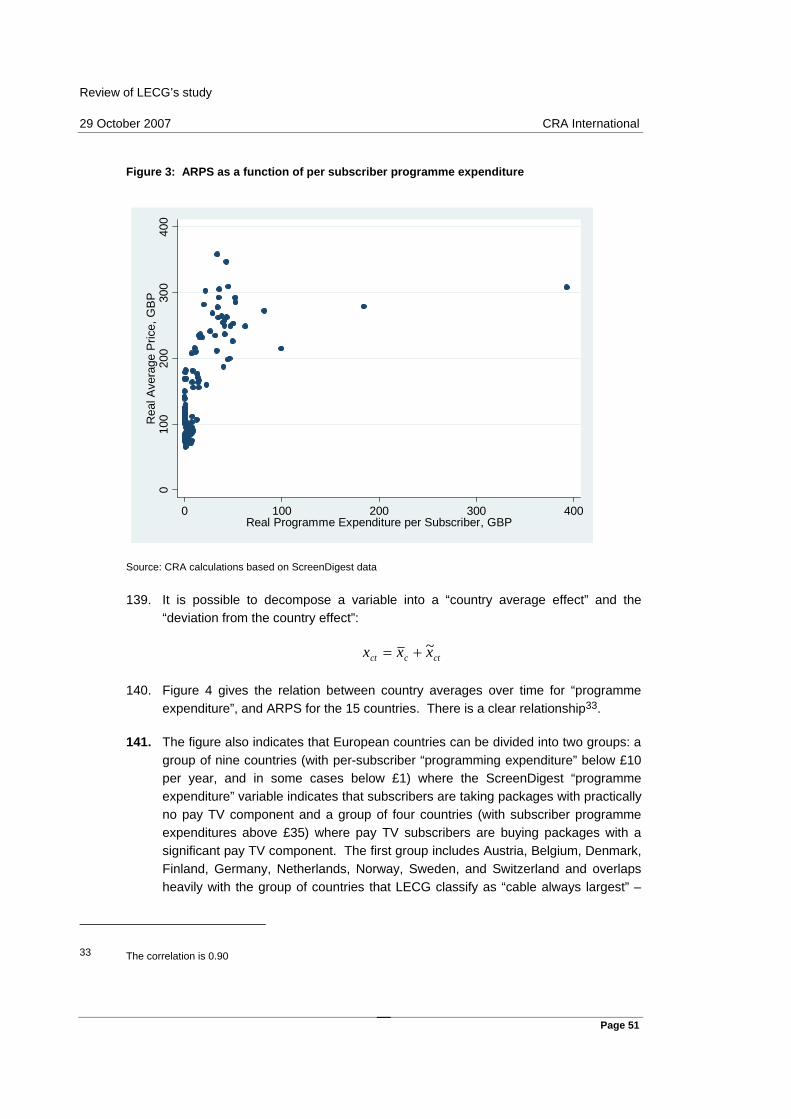
Review of LECG’s study 29 October 2007 CRA International
Page 51
Figure 3: ARPS as a function of per subscriber programme expenditure 0
100
200
300
400
Rea
l Ave
rage
Pric
e, G
BP
0 100 200 300 400Real Programme Expenditure per Subscriber, GBP
Source: CRA calculations based on ScreenDigest data
139. It is possible to decompose a variable into a “country average effect” and the “deviation from the country effect”:
ctcct xxx ~+=
140. Figure 4 gives the relation between country averages over time for “programme expenditure”, and ARPS for the 15 countries. There is a clear relationship33.
141. The figure also indicates that European countries can be divided into two groups: a group of nine countries (with per-subscriber “programming expenditure” below £10 per year, and in some cases below £1) where the ScreenDigest “programme expenditure” variable indicates that subscribers are taking packages with practically no pay TV component and a group of four countries (with subscriber programme expenditures above £35) where pay TV subscribers are buying packages with a significant pay TV component. The first group includes Austria, Belgium, Denmark, Finland, Germany, Netherlands, Norway, Sweden, and Switzerland and overlaps heavily with the group of countries that LECG classify as “cable always largest” –
33 The correlation is 0.90
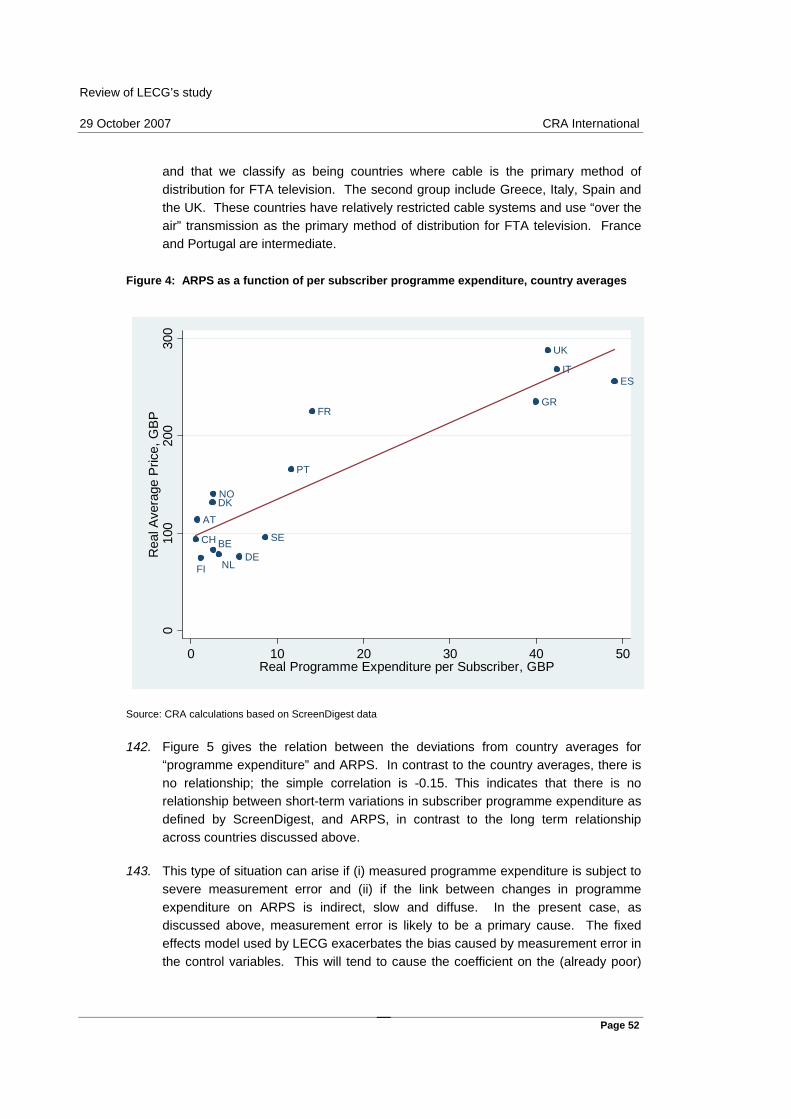
Review of LECG’s study 29 October 2007 CRA International
Page 52
and that we classify as being countries where cable is the primary method of distribution for FTA television. The second group include Greece, Italy, Spain and the UK. These countries have relatively restricted cable systems and use “over the air” transmission as the primary method of distribution for FTA television. France and Portugal are intermediate.
Figure 4: ARPS as a function of per subscriber programme expenditure, country averages
AT
BE
DK
FI
FR
DE
GR
IT
NL
NO
PT
ES
SECH
UK
010
020
030
0R
eal A
vera
ge P
rice,
GB
P
0 10 20 30 40 50Real Programme Expenditure per Subscriber, GBP
Source: CRA calculations based on ScreenDigest data
142. Figure 5 gives the relation between the deviations from country averages for “programme expenditure” and ARPS. In contrast to the country averages, there is no relationship; the simple correlation is -0.15. This indicates that there is no relationship between short-term variations in subscriber programme expenditure as defined by ScreenDigest, and ARPS, in contrast to the long term relationship across countries discussed above.
143. This type of situation can arise if (i) measured programme expenditure is subject to severe measurement error and (ii) if the link between changes in programme expenditure on ARPS is indirect, slow and diffuse. In the present case, as discussed above, measurement error is likely to be a primary cause. The fixed effects model used by LECG exacerbates the bias caused by measurement error in the control variables. This will tend to cause the coefficient on the (already poor)
Review of LECG’s study 29 October 2007 CRA International
Page 53
proxy for quality to be further attenuated towards zero, underestimating the effects of quality on ARPS.
Figure 5: ARPS as a function of subscriber programme expenditure, deviations from country averages
-50
050
100
Rea
l Ave
rage
Pric
e, G
BP
-20 0 20 40 60Real Programme Expenditure per Subscriber, GBP
Source: CRA calculations based on ScreenDigest data