autonomous vehicles to evolve to a new urban experience
TRANSCRIPT

I
Autonomous Vehicles to Evolve to a New Urban Experience
This project has received funding from the European Union’s Horizon 2020
research and innovation programme under grant agreement No 769033
DELIVERABLE
D8.1 First Iteration Environmental Impact
Ref. Ares(2019)6396183 - 16/10/2019

D8.1 First Iteration Environmental Impact
2
Disclaimer This document reflects only the author’s view and the European Commission is not
responsible for any use that may be made of the information it contains.
Document Information Grant Agreement Number 769033 Full Title Autonomous Vehicles to Evolve to a New Urban
Experience
Acronym AVENUE
Deliverable D8.1 First Iteration Environmental Impact
Due Date 31.08.2019
Work Package WP8
Lead Partner HS PF (Pforzheim University)
Leading Author Dominik Huber
Dissemination Level Public, restricted
Document History Version Date Author Description of change 0.1 01.07.2019 Dominik Huber First draft
0.2 15.08.2019 Eliane Nemoto, Tobias
Viere
Internal review – amendments
and comments
0.3 17.08.2019 Dominik Huber Revised version for project-
internal review
0.4 20.08.2019 Athanasios Papadakis Project-internal review -
comments
0.5 26.08.2019 Antonios Lalas,
Konstantinos Votis
Project-internal review -
comments
0.6 29.08.2019 Dominik Huber Revised version
0.7 30.08.2019 Tobias Viere Revised version
1.0 31.08.2019 Dominik Huber Final version

D8.1 First Iteration Environmental Impact
3
Table of Contents Disclaimer ........................................................................................................................... 2
Document Information ....................................................................................................... 2
Document History .............................................................................................................. 2
Table of Contents ............................................................................................................... 3
List of Figures ..................................................................................................................... 4
Acronyms ............................................................................................................................ 5
1 Introduction ..................................................................................................................... 6
2 Goal and Scope ................................................................................................................ 6
2.1 Goal .......................................................................................................................... 6
2.2 Technical system boundaries and cut-off criteria`s .................................................. 8
2.3 Geographical system boundaries ............................................................................. 9
2.4 Time frame ............................................................................................................. 10
2.5 Availability of data and depth of the study ............................................................ 11
2.6 Details concerning impact assessment ................................................................... 11
2.7 Functional unit ........................................................................................................ 12
3 Life Cycle Inventory and Model ..................................................................................... 15
3.1 Building a model based on information out of literature ....................................... 15
3.1.1 Electric minibus .............................................................................................................. 16
3.1.2 Battery ........................................................................................................................... 19
3.1.3 Autonomous Vehicle Components ................................................................................ 23
3.1.4 Use Phase ...................................................................................................................... 25
3.1.5 End of Life Treatment .................................................................................................... 26
3.2 Further comprehension of the model .................................................................... 26
4 Outlook .......................................................................................................................... 27
5 Literature ....................................................................................................................... 28
Appendix I: Consulted studies for selecting impact categories ........................................ 31
Appendix II: Data collection sheet .................................................................................... 34
Appendix III: Conversion to NAVYA minibus .................................................................... 35
Appendix IV: Li-Ion battery and subcomponent production ............................................ 36
D8.1 First Iteration Environmental Impact
4
List of Figures Figure 1: system boundaries for NAVYA minibus 9
Figure 2: Frequency of reported impact categories 12
Figure 3: Foreground whole life cycle model 16
Figure 4: Foreground life cycle model bus 19
Figure 5: Foreground model battery components 23
Figure 6: Required components installed in an autonomous minibus 24
Figure 7: Foreground model AV components 25
Figure 8: General approach for conducting LCA studies on minibuses within
AVENUE 27

D8.1 First Iteration Environmental Impact
5
Acronyms AD Autonomous Driving
ADP Abiotic Depletion Potential
AP Acidification Potential
AV Autonomous Vehicle
BMS Battery Management System
BOM Bill of material
EoL End-of-Life
EP Eutrophication Potential
EPD Environmental Product Declaration
EU European Union
FAETP Freshwater Aquatic Ecotoxicity Potential
FSETP Freshwater Sediment Ecotoxicity Potential
fU functional Unit
GWP 100 Global Warming Potential 100
HT Human Toxicity
IES Institute of Environment and Sustainability
ILCD International Reference Life Cycle Data System
IR Ionizing Radiation
IT Information Technology
kWh kilowatt hours
LCA Life Cycle Assessment
LCI Life Cycle Inventory
LFP Iron Phosphate Lithium-Ion
LiDARS Light Detection and Ranging Sensors
Li-FePO4 Lithium Iron Phosphate
MAETP Marine Aquatic Eco-Toxicity Potential
M Meters
MJ Megajoules
MSETP Marine Sediment Eco-Toxicity Potential
NCM Nickel Cobalt Manganese Lithium-Ion
NiMH Nickel Metal Hybrid
ODP Ozone Layer Depletion Potential
PKM Passenger Kilometer
POCP Photochemical Ozone Creation Potential
TETP Terrestrial Eco-Toxicity Potential
TKM Transport Kilometers
TTW Tank-to-wheel
WLTP World Harmonized Light Vehicle Test Procedure
WTW Well-to-wheel
WP Work Package
VDA Verband Der Automobilindustrie
D8.1 First Iteration Environmental Impact
6
1 Introduction The target of the AVENUE project is to demonstrate and pilot the adaptability and
efficiency of the deployment of small and medium autonomous vehicles (AV’s) in Lyon,
Luxembourg, Geneva, Copenhagen and 2-3 replicator cities as of the 3d year of the
project. The AVENUE vision for future public transport in urban and suburban areas is that
autonomous vehicles will ensure safe, rapid, economic, sustainable and personalised
transport of passengers, while minimising vehicle changes. The goal is to provide door to
door autonomous transport allowing commuters to benefit from autonomous vehicles.
At the end of the AVENUE project - 4 year period - the mission is to have demonstrated
that autonomous vehicles will become the future solution for public transport. The
AVENUE project will demonstrate the economic, environmental and social potential of
autonomous vehicles - for both companies and public commuters - while assessing the
vehicle road behaviour safety.
WP8 concentrates in an overall sustainability assessment of autonomous minibuses in
future public transportation systems.
Task 8.1 elaborates the environmental impacts of autonomous minibuses by means of life
cycle assessment and related tools.
In this Deliverable D8.1 we elaborate goal and scope as well as the life cycle inventory
model for a NAVYA minibus as used within the AVENUE project. Thereby, D8.1 provides
the basis for later research within WP 8 Task 8.1, namely an in-depth LCA study of the
project’s minibuses and for an assessment of the environmental benefits and challenges
of such minibuses within the whole mobility system.
This deliverable was authored by Dominik Huber in collaboration with Guy Fournier,
Eliane Nemoto and Tobias Viere (all Pforzheim University) and supported by further
project partners, NAVYA and TPG in particular.
2 Goal and Scope
2.1 Goal In order to point out environmental burden of a NAVYA minibus within the AVENUE project, a life cycle assessment (LCA) is conducted. Gained findings will feed into recommendations for both public transport operators as well as regulatory authorities. Given recommendations should be of help when planning holistically and installing required measures for adapting and deploying autonomous vehicles within a scope of the next 10 years. According to the “General guide for Life Cycle Assessment – Detailed guidance” published by the Institute of Environment and Sustainability of the European Commission, the study can be classified as study type C (IES, 2010, p. 43-48). Due to the guidance, a C study is characterized as descriptive accounting only and therefore the purpose is

D8.1 First Iteration Environmental Impact
7
to document the system under study. Based on the findings of the results, there will not be directly a decision derived. These results are more of informational character and together with other findings within the project will be later on part of recommendations but will be also used for further research.
So, the aim of this study is to first, assess environmental impacts of a fully autonomous minibus manufactured by NAVYA with a 33 kilowatt hours (kWh) lithium iron phosphate (Li-FePO4) battery. Secondly, it compares and classifies the results within the public transport sector, and thirdly it generally gains knowledge about environmental impacts of specific characterizations of autonomous driving (AD). For classification of the results, the following impact categories have been chosen: Climate Change, Eutrophication Potential, Acidification Potential, Photochemical Ozone Depletion Potential, Abiotic Depletion Potential for non-fossil resources, and Ecotoxicity (“Details concerning impact assessment”).
There is no need the LCA has to answer all these questions at the same time. However, it should be customizable, so that simple modification according to the desired information should be possible. For instance, the LCA for the minibus is modelled based on a total mileage of 500.000 km and an average capacity of 6 passengers per ride. Now different scenarios should be considered, e.g. total mileage increases due to high demand up to 800.000 km and the average capacity is correspondingly 10 passengers per ride. The model should be able to reflect such different assumptions. Additionally, results of only specific components and functions should be possible to state, for instance the impacts for autonomous components. In order to classify the autonomous minibus within the transport system, the systems function is characterized by providing transport from one point to another by using any available means of transport.
The target audience of this report are the contracting authority, the European Union, the minibus manufacturer, NAVYA, and all people of natural interest. Within the AVENUE project, the LCA is part of work package 8 “Socio-economic and environmental evaluation”.
In the following, some technical information is provided in order to classify the studied minibus. First, the minibus disposes a total passenger capacity of 15 people, in particular 11 seating places and 4 standing places. The empty weight of the minibus is 2,400 kg, whereas the gross weight holds up to 3,450 kg (NAVYA, n.n., p. 22). Therefore, the minibus can be classified within the vehicle category M2 according to the Directive 2007/46/CE published by the European Union. Due to the rather small transport capacity for passengers when comparing with bigger transport buses, this type of bus is also referred to as minibus. The minibus is 4.75 m long, 2,11 m wide and 2,65 m high. The propulsion of the vehicle is electric, so an electric motor is fueled by a lithium iron phosphate (LiFePO4) battery pack with a capacity of 33 kWh. This technology enables the minibus to run maximal 25 km/h (NAVYA, n.n., p. 22).

D8.1 First Iteration Environmental Impact
8
2.2 Technical system boundaries and cut-off criteria`s
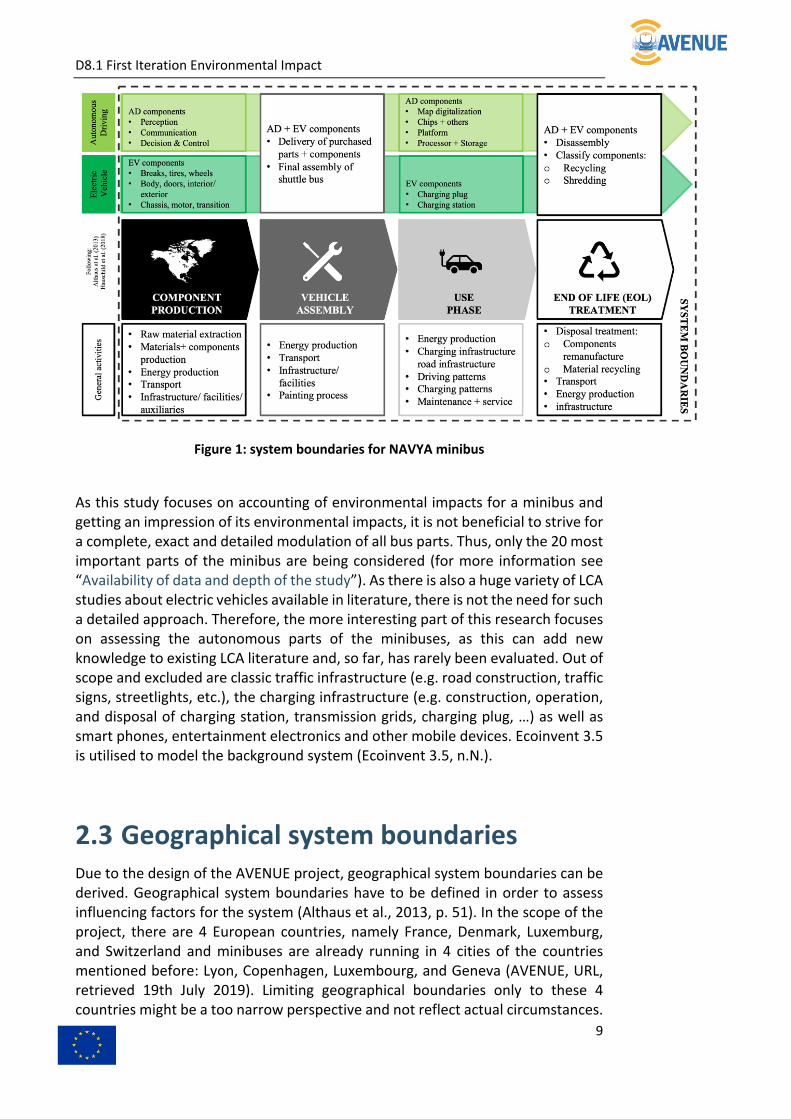
For the evaluation of the impacts of the minibus, technical system boundaries need to be defined appropriately. This step is necessary in order to quantify appropriately elementary flows from eco- to technosphere, e.g. in the form of raw material extraction or energy and the release, for instance of emissions into air, soil and water from techno- into ecosphere. With this in mind, several guides recommend following a cradle-to-grave approach for vehicle LCA studies (Althaus et al., 2013, p. 44 ff.; EPD International AB, 2018, p. 8 f.). On the other hand, a commonly used basis for the assessment of emissions of vehicles are also well-to-wheel (WTW) or tank-to-wheel (TTW) analysis (Harris et al., 2018). The WTW analysis is considering the energy carrier to drive a vehicle during operation and comprises well-to-tank and tank-to-wheel (Harris et al., 2018, p. 2). The TTW analysis contains information about on-board energy conversion to propel the vehicle over the lifetime mileage (Harris et al., 2018). All these analyses only report parts of the life cycle of a vehicle or consider energy consumption only, so none is accounting over the entire life cycle and for the involvement of the complete minibus. An LCA can provide WTW and TTW information, but these are not the results that are aimed for in this study as following such approaches would neglect crucial steps that should be taken into account. Specifically, the EPD framework proposes to include all upstream, core and downstream processes (EPD International AB, 2018, p. 8 f.). The eLCAr guidelines, which aims on providing advice when modelling electric vehicles, suggests taking raw material extraction, energy generation, vehicle manufacturing and recycling, operation and road charging infrastructure into account (Althaus et al., 2013, p. 47). Particularly excluded are facilities and infrastructure not related to the study itself (EPD International AB, 2018, p. 8 f.). Hence, the system of this study includes production, operation and treatment at the end of life (EoL) of the NAVYA minibus. In particular, the system boundaries contain component production, the vehicle assembly, the use phase, and the EoL treatment (Error! Reference source not found.).
D8.1 First Iteration Environmental Impact
9
Figure 1: system boundaries for NAVYA minibus
As this study focuses on accounting of environmental impacts for a minibus and getting an impression of its environmental impacts, it is not beneficial to strive for a complete, exact and detailed modulation of all bus parts. Thus, only the 20 most important parts of the minibus are being considered (for more information see “Availability of data and depth of the study”). As there is also a huge variety of LCA studies about electric vehicles available in literature, there is not the need for such a detailed approach. Therefore, the more interesting part of this research focuses on assessing the autonomous parts of the minibuses, as this can add new knowledge to existing LCA literature and, so far, has rarely been evaluated. Out of scope and excluded are classic traffic infrastructure (e.g. road construction, traffic signs, streetlights, etc.), the charging infrastructure (e.g. construction, operation, and disposal of charging station, transmission grids, charging plug, …) as well as smart phones, entertainment electronics and other mobile devices. Ecoinvent 3.5 is utilised to model the background system (Ecoinvent 3.5, n.N.).
2.3 Geographical system boundaries Due to the design of the AVENUE project, geographical system boundaries can be derived. Geographical system boundaries have to be defined in order to assess influencing factors for the system (Althaus et al., 2013, p. 51). In the scope of the project, there are 4 European countries, namely France, Denmark, Luxemburg, and Switzerland and minibuses are already running in 4 cities of the countries mentioned before: Lyon, Copenhagen, Luxembourg, and Geneva (AVENUE, URL, retrieved 19th July 2019). Limiting geographical boundaries only to these 4 countries might be a too narrow perspective and not reflect actual circumstances.

D8.1 First Iteration Environmental Impact
10
This is also due to the fact that NAVYA minibuses are already sold all over the world, operating in different countries outside the European Union. Among others, data used in the AVENUE project were gathered from all operation experience of the minibus manufacture including outside of the European Union. In order to make use of data gathered in other European cities too, the geographic system boundaries are not only limited to the 4 European cities targeted by the AVENUE project. Therefore, the scope of the geographic system boundaries is limited to entire Europe. Whereas data are not available for Europe, one can rely on data of a worldwide scope, e.g. when modelling the background system and working with data bases.
2.4 Time frame Equally important to the definition of proper geographical system boundaries is choosing an appropriate time frame for the model. The model itself is aligned to the life time of the autonomous minibus, which accounts for the production process, the operation and the disposal of the minibus. The entire time frame for the foreground system is estimated to be 15 years, because for operation only values between 12 and 15 years are used (McKenziel, Durango-Cohen, 2011, p. 2; Harris et al., 2018, p. 5). While this time frame holds for the modelling of input-output balance, time frames of impact categories are much longer, e.g. the framing time for global worming potential 100 (GWP 100) is 100 years (Hauschild, Huijbregts, 2015, p. 43). Depending on the category, typical LCA approaches are followed analogically. In terms of data collection, it has been gathered by NAVYA between April till June 2019. For modelling the background process, the most recently available data base has been used (ecoinvent 3.5).
In contrast to the time frame for the model itself arises the question of the validity of the used data. As the autonomous minibuses comprises a high level of components depending on latest technology, technical advancement will outdate today’s technology very soon. Consequently, the validity for such a model is assumed to be much shorter than the scope of the LCA study itself. While one guideline advocates for a particular time frame for the data being used, e.g. maximum of 3 years (EPD International AB, 2018, p. 11), another is appealing to the validity of data more generally. Thus, data should be used as long as they represent the described system and are valid (Althaus et al., 2013, p. 51). To sum it up, validity for data may hold 3 years and later on one should carefully consider whether the data are still valid or, if necessary, need to be updated.

D8.1 First Iteration Environmental Impact
11
2.5 Availability of data and depth of the study
In order to conduct this study, data are gathered from different sources. Due to confidential policies, NAVYA is not able to provide an entire bill of material (BOM) but agreed on providing the 20 most important parts of an average minibus. Importance thereby refers to weight, size and market price of the parts. Data, that NAVYA is not able to provide, can be collected alternatively at their suppliers or the transport operators. On the other hand, additional required data can be taken from literature, e.g. Hawkins et al. (2012), etc. These acquired data then will be complemented by the data base ecoinvent 3.5. It is also important to point out that an in-detail model of the minibus is not expedient. This also can lead to a certain amount of uncertainty, for instance, important parts are chosen due to size, weight and economic value. This approach does not ensure, that most important parts are also the ones with the greatest impact on environment. An additional amount of uncertainty is generated when collecting data, as there might not be all the data available in the desired form and detail.
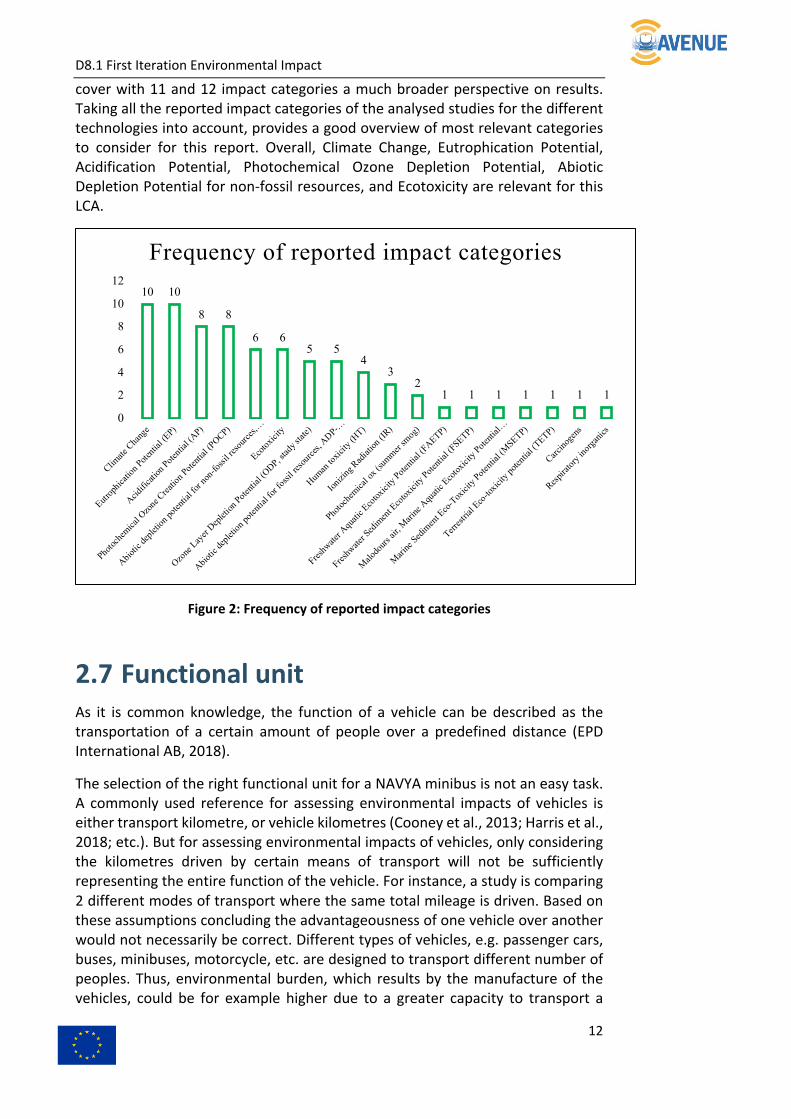
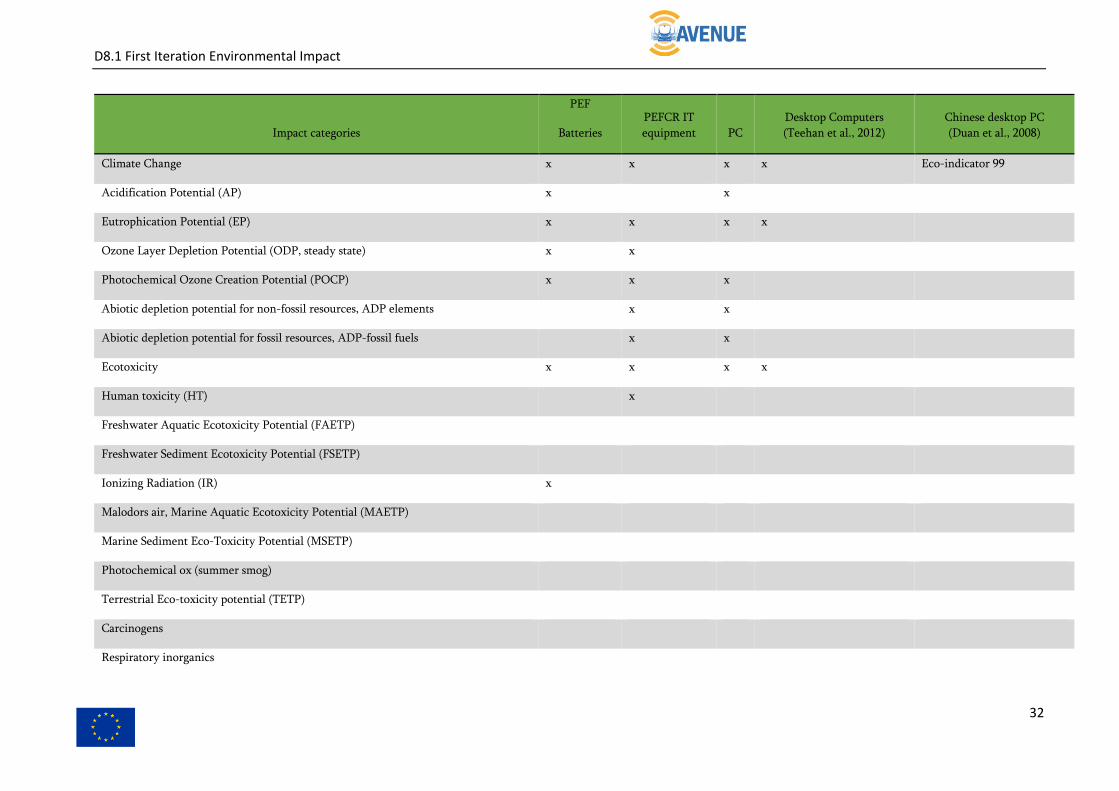
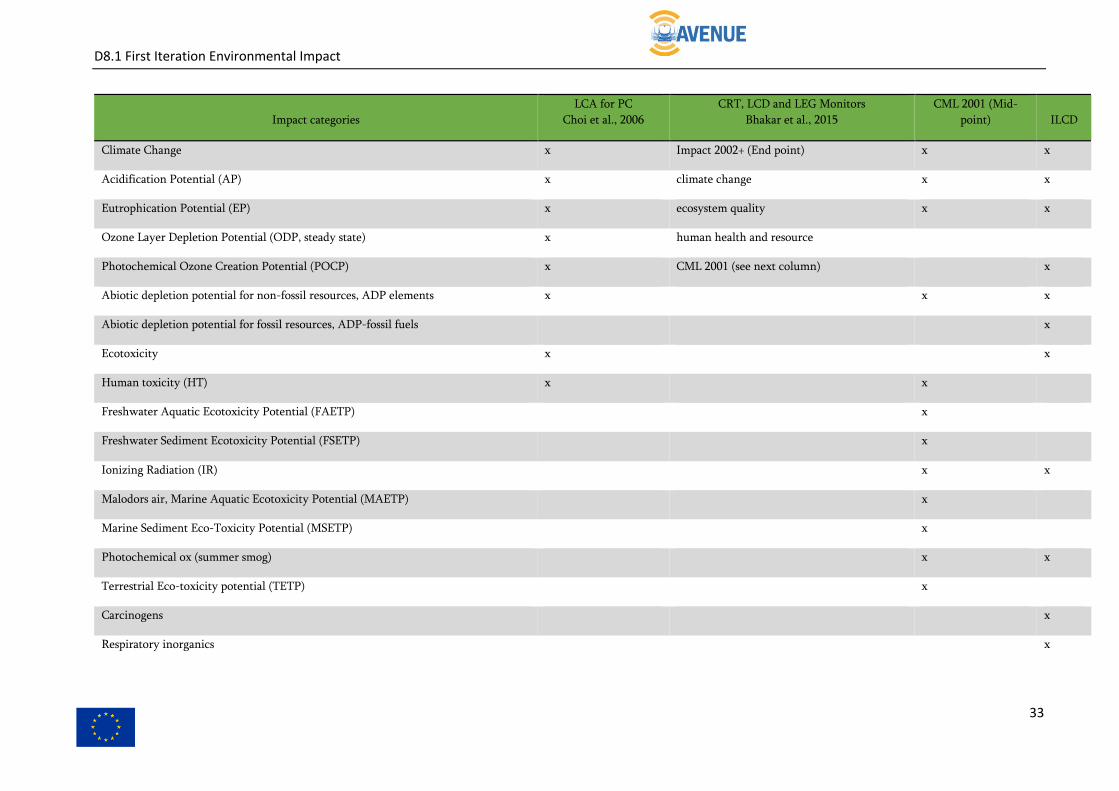
2.6 Details concerning impact assessment In general, many LCAs done in the automotive industry are based on data modelled with the GREET (Greenhouse gases, Regulated Emissions and Energy use in Transportation) model (Burnham et al., 2006). A challenging problem within defining appropriate impact categories for this study was the involvement of different technologies. When taking a closer look to different LCA-studies, it was found that categories like Climate Change, Acidification Potential (AP), Eutrophication Potential (EP), and Photochemical Ozone Creation Potential (POCP) are reported for all different means of transport studies (Table 5: Related studies and reported impact categories). In fact, these impact categories are chosen for most of the considered studies (Figure 2: Frequency of reported impact categories). To choose the relevant categories, the following documents have been consulted: Environmental Product Declaration (EDP) of public transport, Product Category Rules (PCR) of public and private buses, Environmental Certificate for Mercedes Benz A-Class, Product Environmental Footprint (PEF) for batteries, Product Environmental Footprint Category Rule (PEFCR) for IT equipment, LCA studies about PC and desktop computers, Chinese desktop PC, CRT, LCD and LEG Monitors, comprehended by impact modelling approaches like CML 2001 (Midpoint) and the ILCD handbook.
It is noteworthy, that for reports on battery and information technology (IT) devices, Ecotoxicity in particular, but also Human Toxicity and Abiotic Depletion Potential are of greater importance (Figure 2: Frequency of reported impact categories). Contrary, international recognized methods like CML 2001 on midpoint level and the impact categories proposed by ILCD-guidance are able to
D8.1 First Iteration Environmental Impact
12
cover with 11 and 12 impact categories a much broader perspective on results. Taking all the reported impact categories of the analysed studies for the different technologies into account, provides a good overview of most relevant categories to consider for this report. Overall, Climate Change, Eutrophication Potential, Acidification Potential, Photochemical Ozone Depletion Potential, Abiotic Depletion Potential for non-fossil resources, and Ecotoxicity are relevant for this LCA.
Figure 2: Frequency of reported impact categories
2.7 Functional unit As it is common knowledge, the function of a vehicle can be described as the transportation of a certain amount of people over a predefined distance (EPD International AB, 2018).
The selection of the right functional unit for a NAVYA minibus is not an easy task. A commonly used reference for assessing environmental impacts of vehicles is either transport kilometre, or vehicle kilometres (Cooney et al., 2013; Harris et al., 2018; etc.). But for assessing environmental impacts of vehicles, only considering the kilometres driven by certain means of transport will not be sufficiently representing the entire function of the vehicle. For instance, a study is comparing 2 different modes of transport where the same total mileage is driven. Based on these assumptions concluding the advantageousness of one vehicle over another would not necessarily be correct. Different types of vehicles, e.g. passenger cars, buses, minibuses, motorcycle, etc. are designed to transport different number of peoples. Thus, environmental burden, which results by the manufacture of the vehicles, could be for example higher due to a greater capacity to transport a
10 10
8 8
6 65 5
43
21 1 1 1 1 1 1
0
2
4
6
8
10
12
Climate
Cha
nge
Eutro
phica
tion P
oten
tial (
EP)
Acidifi
catio
n Pot
entia
l (AP)
Photo
chem
ical O
zone
Cre
ation
Pot
entia
l (POCP)
Abioti
c dep
letio
n pot
entia
l for
non-
foss
il re
sour
ces,…
Ecoto
xicit
y
Ozone
Lay
er Dep
letio
n Pot
entia
l (ODP, s
tady s
tate)
Abioti
c dep
letio
n pot
entia
l for
fossi
l res
ourc
es, A
DP-…
Human
toxi
city (
HT)
Ioni
zing R
adiat
ion (I
R)
Photo
chem
ical o
x (su
mmer
smog
)
Fresh
water A
quati
c Eco
toxici
ty P
oten
tial (
FAETP)
Fresh
water S
edim
ent E
cotox
icity
Pot
entia
l (FSETP)
Malo
dour
s air,
Mar
ine A
quati
c Eco
toxi
city P
oten
tial…
Mar
ine S
edim
ent E
co-T
oxici
ty P
oten
tial (
MSETP)
Terres
trial
Eco-to
xicit
y pote
ntial
(TETP)
Carcin
ogen
s
Respir
atory
inor
gani
cs
Frequency of reported impact categories

D8.1 First Iteration Environmental Impact
13
higher number of people. In other words, 2 vehicles both performing the same total mileage of 200.000 km would not describe the function of these vehicles sufficiently as the vehicle models still can vary. Assessing the difference of vehicle models is of importance, as for example material requirement may vary. Logically, a vehicle that is transporting more people, will require more space and capacity. Therefore, some parts need to be bigger or are demanded in a higher quantity in order to be applied for transportation of more people. For this reason, also material extraction will increase due to the production of bigger and more parts. Obviously, environmental burdens will rise for more parts and a bigger vehicle model, e.g. a bus, will result in higher environmental impacts than a standard passenger car. This difference is also becoming obvious when comparing the weights of vehicles. While an empty standard passenger vehicle, e.g. Mercedes A 160, weights 1.350 kg and can transport up to 5 persons (Mercedes, 2019, p. 89), an empty NAVYA minibus weights 2.400 kg and can transport up to 15 passengers (NAVYA, n.n., p. 22).
As a result, these characteristics should be taken into account when conducting such studies and impacts should not only be distributed over kilometres, but also over the number of transported people. By taking the number of people into account, the difference of vehicle models can be captured, as a higher number of transported people would consequently lead to an increased demand of materials to produce parts for vehicles being capable of offering more capacity.
Furthermore, it is necessary to consider the capacity of means of transport and thus to be able to distribute the burden equally among the passengers. Hence, the number of passengers transported, and the total distance driven in kilometres are determining the functional unit and different assumptions of both values can derive in totally different results. When assessing public transport services, it should be accounted whether this service is offered for only 1 passenger, or if it can be used by 60 passengers at the same time. Only then, impacts of different means of transport can be compared meaningful. Taking both kilometres and passengers into account will also describe the function of the transport system best. Additionally, when this functional unit would be chosen for assessing all means of transport, comparability would be ensured within all the different means of public transport (buses, trains, subways, metros, minibuses, private passenger cars, taxis, bicycles, scooters, motorbike, …). This is beneficial for this work, as later on, the autonomous minibus shall be classified within the public transport system. Therefore, the functional unit (fU) is chosen to be 1 passenger kilometre (PKM) of public transport, so the transportation of 1 passenger for 1 kilometre. This number can be calculated by multiplying the total passenger transported with the total distance covered (Equation 1: Calculation of PKM).
!"# = %&%'(*'++,-.,/%/'-+*&/%,0(-234,/&5*,&*(,)∗ %&%'(08+%'-9,9&:,/,0(;3)
Equation 1: Calculation of PKM
After all, the choice of this fU is in alliance with the Product Category Rules for Public and Private Buses and Coaches published by the EPD International AB in

D8.1 First Iteration Environmental Impact
14
2018. Moreover, choosing this fU has the advantageous of easily scaling the systems once parameters like total mileage or average passenger capacity want to be changed. The reference flow further specifies the fU of 1 PKM. Correspondingly, the reference flow is driving 1 passenger kilometre with an autonomous, electric minibus operating fully autonomously, powered by an Li-FePO4 battery, which is manufactured by NAVYA. Currently, the minibuses are deployed in 4 European cities and are running in typical urban environment, e.g. where residential and commercial buildings are located (AVENUE, URL, retrieved 19th July 2019). They are operating on normal streets interacting with other traffic participants. So far, speed of the buses is limited to a maximum of 25 km/h (AVENUE, URL, retrieved 19th July 2019). Correspondingly, the transportation is limited to local public transport, meaning that long-distance transportation is excluded from this assessment and not further considered. This is an essential characteristic of the minibus, as it involves low speeds due to operation in urban areas and not requiring high speeds when driving on highways. Beside of the speed limit, the location of operation affects also the range of the vehicle. Electric vehicles are limited in their range and can only drive as far as electricity can be provided by the battery. Once the bus has consumed most of the electricity and the battery is running low on electricity, the battery needs to be recharged. Within an urban area, charging network is denser than on highways and rural areas. Consequently, charging within an urban area is easier as there is a greater availability of charging stations. This matters especially for the right size of the battery. Range anxiety is one of the reasons for oversizing batteries in electric vehicles (European Environment Agency, 2018, p. 8). An over dimensioned battery results not only in heavier weight, but also in more emissions as a bigger battery requires more material than an appropriate sized one. Thus, operating in an area with great charging infrastructure availability, there is no need to install a battery in an NAVYA minibus to provide more energy than actually needed for operating the minibus. Unfortunately, no detailed information regarding the lifetime of a battery installed in a NAVYA minibus in terms of the amount of energy, one minibus is consuming over the entire life cycle are provided and so no information can be given regarding the lifetime of a battery in years.
The same lack of data holds for the life time of one minibus. So far, no values are available for the expected kilometre a minibus can drive over its entire life cycle and no information can be given about the years a minibus is normally operating. Information for a realistic calculation are crucial as all environmental impacts will be reported per functional unit (Equation 2: Reported results).
<%20=/,+2(%+ = >-:8/&-3,-%'(83*'9%1!'++,-.,/;8(&3,%,/
Equation 2: Reported results

D8.1 First Iteration Environmental Impact
15
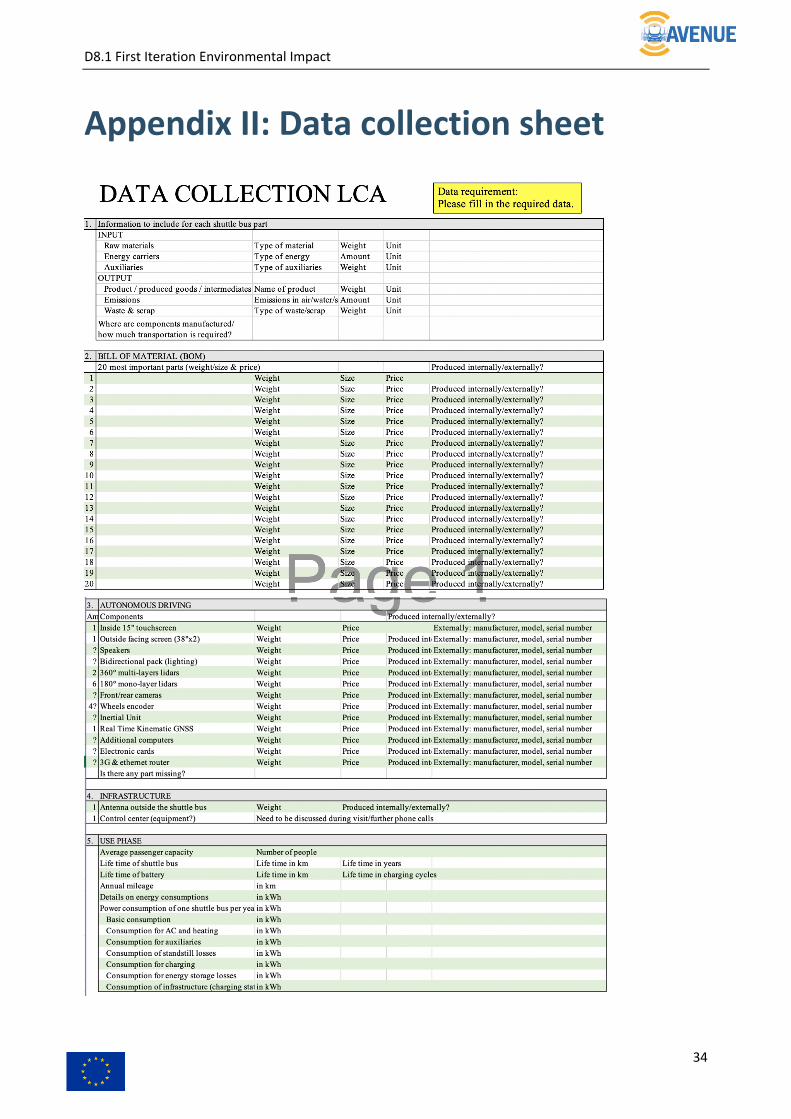
3 Life Cycle Inventory and Model As it is general knowledge, the modelling of inputs and outputs require the collection of primary data. Before the modelling, an appointment with the minibus manufacturer NAVYA was scheduled. The purpose of this meeting was to explain the method of LCA, address the need of data and make clear how detailed data are required in order to be used in the LCA. To give NAVYA some guidance and make clear, which data are required, an excel file was provided (“Appendix II: Data collection sheet”). Additional to the required data, an example has been given to visualize which data shall be gathered and how detailed the information needs to be. As an example, the study of Hawkins et al., 2012 was taken. The file was sent out on 25th of April 2019. During the data collection phase, the system should already be modelled in the software program Umberto LCA+ (ifu, n.N.) according to data from literature. The idea was to first build a theoretical model based on data from literature. Once primary data from NAVYA are available, the model can be adjusted according to information of the manufacturer and real data can be used. This approach is supposed to decrease the workload when data are available. Furthermore, data from literature can backup gaps, where data could not be collected properly.
3.1 Building a model based on information out of literature
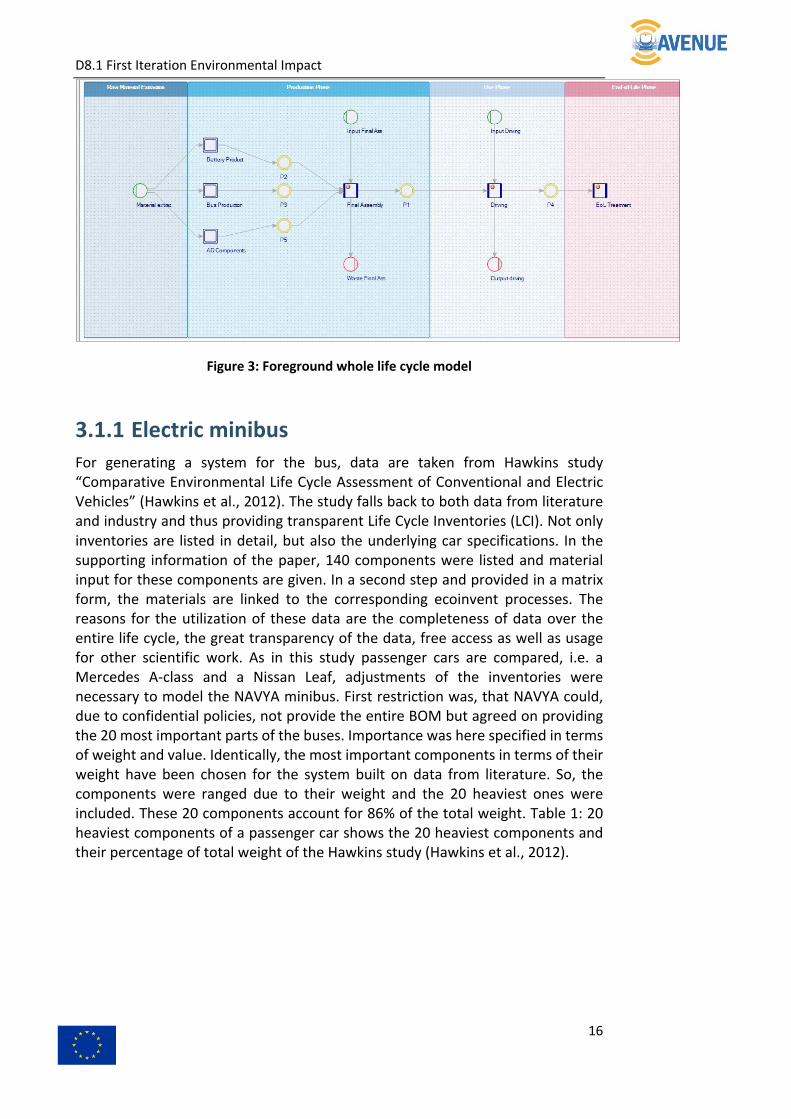
As a matter of fact, an AV comprises of 3 major technologies: the electric vehicle, the battery and the autonomous components. Therefore, the model distinguished for the raw material extraction phase between these 3 technologies. For the production phase, the AV components, the battery and the electric vehicle was modelled separately and in a final assembly step brought together. In the final assembly, the autonomous minibus was created and ready for use. Through the use phase, all 3 technologies were considered as one unit. After the bus cannot be used for operation anymore, it will be disposed. For the treatment at the EoL, the bus is separated into the 3 major technologies again. This approach is followed as there might be different forms of disposal treatment (recycling, thermal use, …), depending on the technology. In the next part, explanation of data for building the theoretical model is presented. A system overview of the Umberto model is given in Figure 3: .
D8.1 First Iteration Environmental Impact
16
Figure 3: Foreground whole life cycle model
3.1.1 Electric minibus For generating a system for the bus, data are taken from Hawkins study “Comparative Environmental Life Cycle Assessment of Conventional and Electric Vehicles” (Hawkins et al., 2012). The study falls back to both data from literature and industry and thus providing transparent Life Cycle Inventories (LCI). Not only inventories are listed in detail, but also the underlying car specifications. In the supporting information of the paper, 140 components were listed and material input for these components are given. In a second step and provided in a matrix form, the materials are linked to the corresponding ecoinvent processes. The reasons for the utilization of these data are the completeness of data over the entire life cycle, the great transparency of the data, free access as well as usage for other scientific work. As in this study passenger cars are compared, i.e. a Mercedes A-class and a Nissan Leaf, adjustments of the inventories were necessary to model the NAVYA minibus. First restriction was, that NAVYA could, due to confidential policies, not provide the entire BOM but agreed on providing the 20 most important parts of the buses. Importance was here specified in terms of weight and value. Identically, the most important components in terms of their weight have been chosen for the system built on data from literature. So, the components were ranged due to their weight and the 20 heaviest ones were included. These 20 components account for 86% of the total weight. Table 1: 20 heaviest components of a passenger car shows the 20 heaviest components and their percentage of total weight of the Hawkins study (Hawkins et al., 2012).

D8.1 First Iteration Environmental Impact
17
20 heaviest components of a passenger car
Total weight for passenger car 1.363,1
9
k
g
100
%
Body-in-white 211,22 k
g
15% Body and Doors
Doors, including trunk lid 105,07 k
g
8% Body and Doors
Electric Motor, Other 94,27 k
g
7% EV Motor &
Transmission
Battery Passive Cooling System 80,00 k
g
6% EV Motor &
Transmission
Inverter, for motor 74,24 k
g
5% EV Motor &
Transmission
Inverter, for charging 74,24 k
g
5% EV Motor &
Transmission
Driveshaft/axle 73,94 k
g
5% Chassis
Body panels 67,47 k
g
5% Body and Doors
HVAC (GREET) 54,97 k
g
4% Interior
Other, Seating and restraint (GREET
data)
49,81 k
g
4% Interior
Wheels (x4) 41,58 k
g
3% Tires and wheels
Corner suspension 40,82 k
g
3% Chassis
Electric Motor, Copper Windings, Base 38,58 k
g
3% EV Motor &
Transmission
Tires (x4) 37,78 k
g
3% Tires and wheels

D8.1 First Iteration Environmental Impact
18
Cradle 29,94 k
g
2% Chassis
Brakes, hardware 28,76 k
g
2% Brakes
Steering system 22,23 k
g
2% Chassis
Other, Trim and Insulation (GREET data) 18,65 k
g
1% Interior
Side body glass (6) 12,53 k
g
1% Body and Doors
Doors, including trunk lid, interior
plastics etc.
12,00 k
g
1% Interior
SUM 1.168,1
0
k
g
86%
Table 1: 20 heaviest components of a passenger car
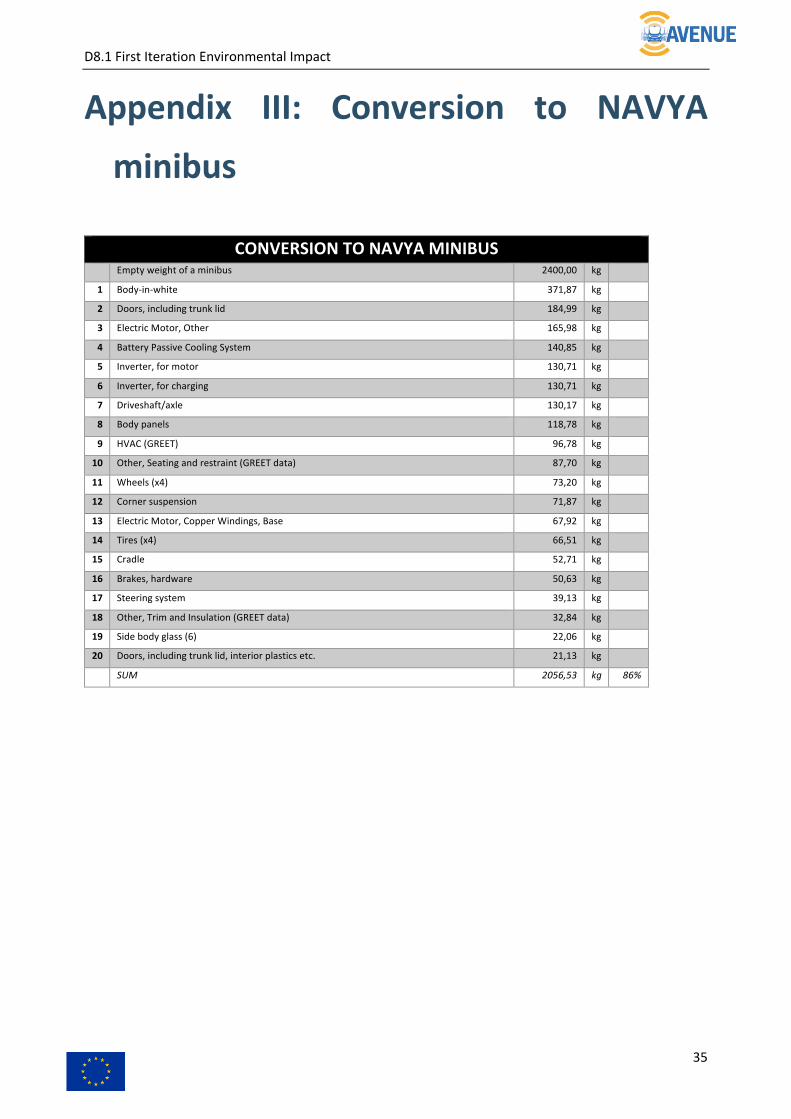
In a next step, the empty weight of a NAVYA minibus of 2.400 kg was taken and via the component’s percentage for passenger vehicles, the weight for the bus components was calculated. This was done for all the 20 components, while the table for the NAVYA minibus can be found in “Appendix III: Conversion to NAVYA minibus”. Of course, not all processes and materials can simple be scaled up. That is why some assumptions need to be taken. First and most important, refers to the concept of the vehicles. It is assumed, that there is no other functional difference between passenger cars and minibus than the weight. To phrase this another way round, we can conclude that a minibus requires exactly the same parts as a passenger car and there is no difference in functional architecture. They only differ in weight. Second, as the battery is included in a separate step, it is excluded here. Thirdly, assembly material is not scaled up. Hawkins study is based on models of Mercedes and Nissan. Both companies are well established and have technologically very advanced production factories. The study is already considering the high level of automatization and the required materials. Even though the minibus is heavier and possibly would result in a higher utilization of materials, this is assumed not to be the case for production at NAVYA. The production factory of NAVYA is not yet technologically that advanced as a production plant of Mercedes or Nissan. Where for example Mercedes would use an entire assembly line, NAVYA might move their products around manually. For this reason, assembly material is not scaled up and equal amounts are used as for the production of a passenger vehicle. Fourth, tires and wheels are not adjusted to the heavier weight of the minibus. According to information of NAVYA, a minibus is equipped with 4 215/60 R17 tires and alloy wheels. As minibuses are not differing much in length (difference of 30,5 cm between NAVYA minibus and

D8.1 First Iteration Environmental Impact
19
Nissan Leaf) and width (difference of 34 cm between NAVYA minibus and Nissan Leaf), it can be simplified, that both means of transport run on the same type of wheels. Moreover, when summing up the weight of materials used for tires & wheels, one gets the total weight of 79 kg. Dividing the 79 kg by 4 wheels and tires, 1 wheel and tire is 19,75 kg. The weight of 20 kg per wheel and tire is a standard weight and can be used for many different types (Krug, URL, retrieved 8th July 2019). Another challenge rose as scrap material was listed among inputs. Scrap can be used both as an input and thereby sum up with the primary material the total weight of 1 component or it could be produced during the manufacturing process and thereby be considered as waste. But when comparing the total material input of steel e.g. for body and doors of 470,20 kg and the sum of all types of steel only accounting for 389 kg, the missing difference of 81,73 kg has to be the scrap steel used as secondary material input. So, all the scrap was taken as material input. Figure 4: shows the modelling of the minibus in Umberto.
Figure 4: Foreground life cycle model bus
3.1.2 Battery Batteries are many times identified to be the main driver for environmental burdens when assessing electric vehicle (Biemann et al., 2019). For this reason, they are not presented together with the vehicle, but modelled separately. To represent the battery in the model, data from Majeau-Bettez paper “Life Cycle Environmental Assessment of Lithium-Ion and Nickel Metal Hydride battery for Plug-In Hybrid and Battery Electric Vehicles” has been applied (Majeau-Bettez et al., 2011). By consulting electrochemical studies, dismantling reports, and industry figures, data gathered of different literature sources were complemented resulting in complete and transparent inventories for 3 different battery tips for the entire life cycle (Majeau-Bettez et al., 2011, p. 2): nickel metal hybrid (NiMH),

D8.1 First Iteration Environmental Impact
20
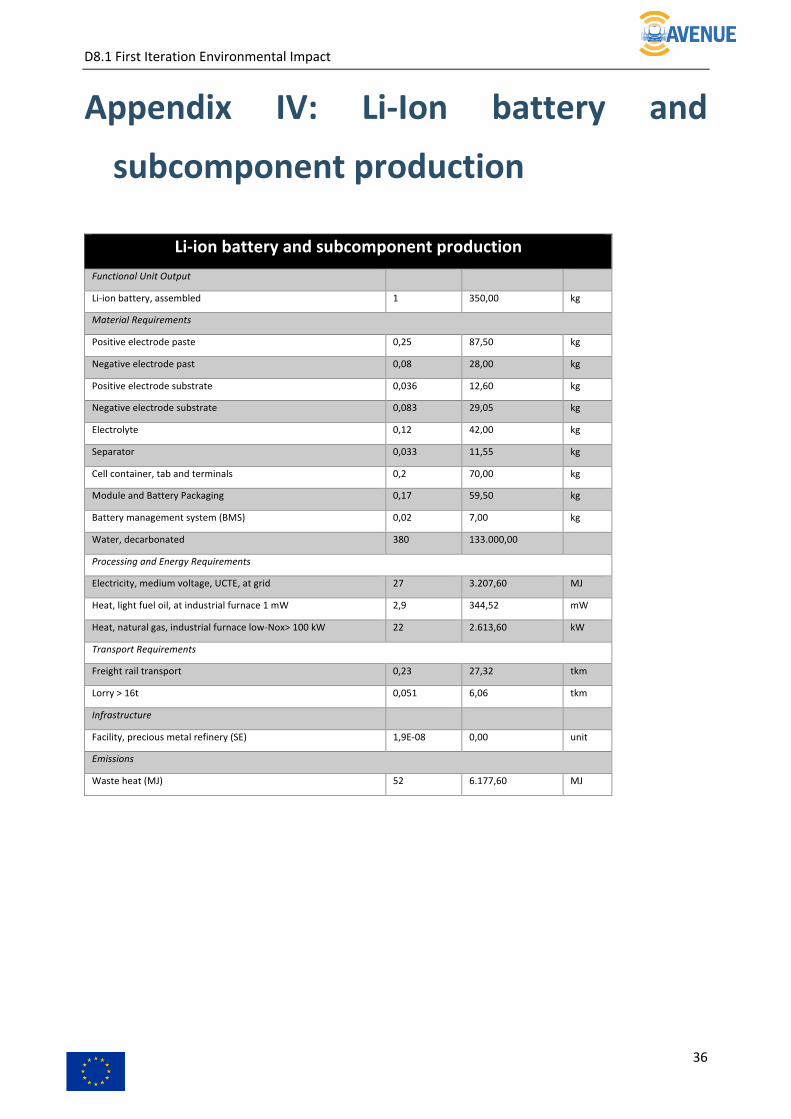
nickel cobalt manganese lithium-ion (NCM), and iron phosphate lithium-ion (LFP) batteries (Majeau-Bettez et al., 2011, p. 1). For an LFP battery, these subcomponents are required: Positive electrode paste, negative electrode paste, positive electrode substrate, negative electrode substrate, electrolyte, separator, cell container, module and battery packaging, and battery management system (BMS). At the beginning of the supporting information, electrochemical characteristics, component mass breakdown and performance information are given. This is followed by a breakdown of components for 1 kg of battery. Additionally, the supporting information provides detailed information for each production step for manufacturing batteries about the functional unit, material -, processing and energy -, and transport requirements, infrastructure and emissions. Table 2: Li-ion battery and subcomponent production provides information about requirements for 1 kg battery (Majeau-Bettez et al., 2011).
Li-ion battery and subcomponent production 1 Battery
Functional Unit Output
Li-ion battery, assembled (kg) 1
Material Requirements
Positive electrode paste for Li-ion battery (kg) 0,25
Negative electrode past for Li-ion battery (kg) 0,08
Positive electrode substrate for Li-ion battery (kg) 0,036
Negative electrode substrate for Li-Ion battery (kg) 0,083
Electrolyte for Li-ion battery (kg) 0,12
Separator (kg) 0,033
Cell container, tab and terminals (kg) 0,2
Module and Battery Packaging (kg) 0,17
Battery management system (BMS) (kg) 0,02
Water, decarbonated 380
Processing and Energy Requirements
Electricity, medium voltage, UCTE, at grid (MJ) 27
Heat, light fuel oil, at industrial furnace 1 mW 2,9
Heat, natural gas, industrial furnace low-Nox> 100 kW 22
D8.1 First Iteration Environmental Impact
21
Transport Requirements
Freight rail transport (tkm) 0,23
Lorry > 16t (tkm) 0,051
Infrastructure
Facility, precious metal refinery (SE) (unit) 1,9E-08
Emissions
Waste heat (MJ) 52
Table 2: Li-ion battery and subcomponent production
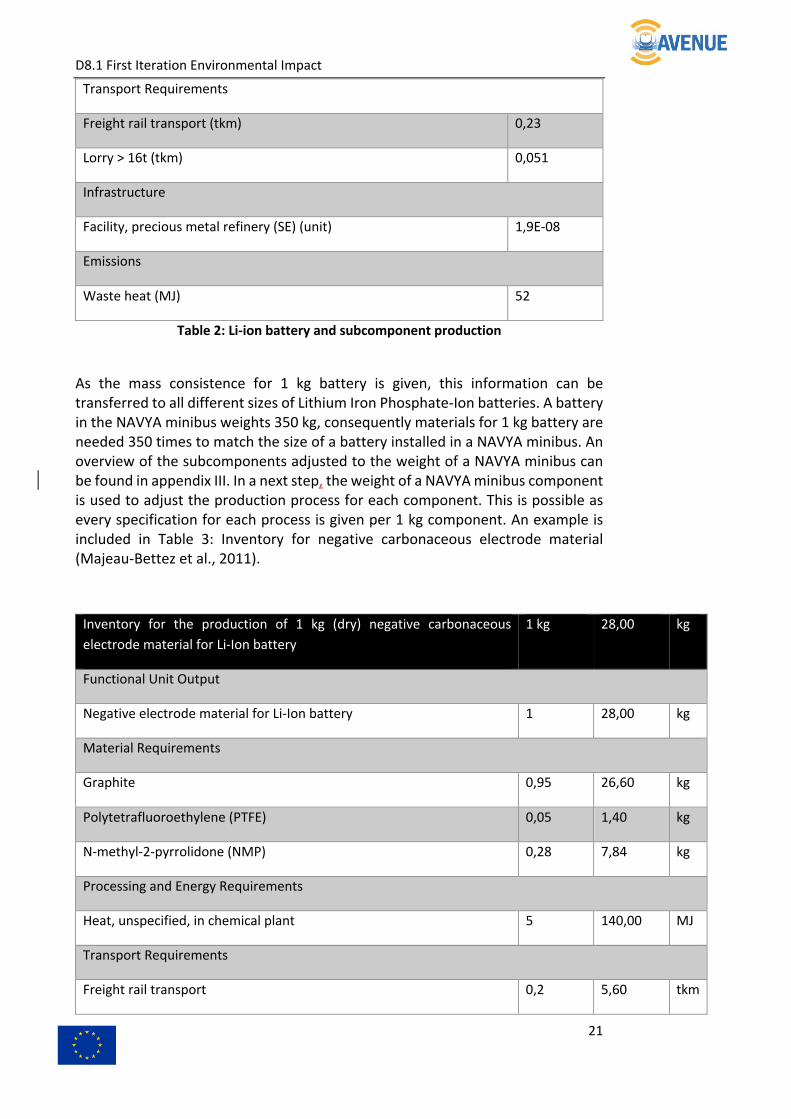
As the mass consistence for 1 kg battery is given, this information can be transferred to all different sizes of Lithium Iron Phosphate-Ion batteries. A battery in the NAVYA minibus weights 350 kg, consequently materials for 1 kg battery are needed 350 times to match the size of a battery installed in a NAVYA minibus. An overview of the subcomponents adjusted to the weight of a NAVYA minibus can be found in appendix III. In a next step, the weight of a NAVYA minibus component is used to adjust the production process for each component. This is possible as every specification for each process is given per 1 kg component. An example is included in Table 3: Inventory for negative carbonaceous electrode material (Majeau-Bettez et al., 2011).
Inventory for the production of 1 kg (dry) negative carbonaceous
electrode material for Li-Ion battery
1 kg 28,00 kg
Functional Unit Output
Negative electrode material for Li-Ion battery 1 28,00 kg
Material Requirements
Graphite 0,95 26,60 kg
Polytetrafluoroethylene (PTFE) 0,05 1,40 kg
N-methyl-2-pyrrolidone (NMP) 0,28 7,84 kg
Processing and Energy Requirements
Heat, unspecified, in chemical plant 5 140,00 MJ
Transport Requirements
Freight rail transport 0,2 5,60 tkm

D8.1 First Iteration Environmental Impact
22
Lorry > 16t 0,1 2,80 tkm
Emissions
Heat waste 5 140,00 MJ
N-methyl-2-pyrrolidone (NMP), to air, unspecified 0,28 7,84 kg
Table 3: Inventory for negative carbonaceous electrode material
Similar procedure is done for every other component, too and so the process specifications were adjusted for the battery applied in a NAVYA minibus. For one reason, data from Majeau-Bettez et al., 2011 have been chosen for modelling the battery as the processes are documented with great transparency and completeness. Additionally, the data can be modified easily as information are provided about the functional unit for each process and data are used in other studies (e.g. Biemann et al., 2019, …). Beside the data of Majeau-Bettez, data for the Product Environmental Footprint Category Rules on High Specific Energy Rechargeable Batteries for Mobile Applications, published by the Advanced Rechargeable & Lithium Batteries association, has been considered, too (The Advanced Rechargeable & Lithium Batteries Association, 2018). Finally, they have not been taken as transparency and completeness was found to be higher in the data of Majeau-Bettez. For sure, these data are also not directly transferable and certain assumptions need to be considered.
In order to adjust the functional unit of the battery, the total weight of the battery and the material weight of each component are directly proportional. In other words, when you vary the weight of the battery, the material share of each component will remain the same and e.g. a heavier battery would not require a different structure of materials. Consequently, to model a 350 kg battery and since all materials are listed per 1 kg of battery, one would need 350 times the amount of material requirements as when modelling the smaller battery. This goes hand in hand with the second assumption. In order to model a bigger battery, more auxiliaries for processing and more energy is required. The higher process and energy requirements are of the same share as the relation between e.g. 1 kg of battery and 350 kg of battery, meaning that they are also directly proportional. In summary, to produce a 350 times heavier battery, also 350 times more process and energy requirements are necessary. In contrast to the bus components, where assembly is assumed to be the same for passenger vehicles and the minibus, battery process and energy requirements are scaled up. This is feasible since for the battery production the industry is well-established, and a high degree of automation is assumed. Thus, producing more parts, will necessarily result in a higher utilization of all involved processes and energy requirements. Therefore, the correlation between process and energy requirements and total weight is also supposed to be directly proportional. For reported emissions, same assumptions hold as for process and energy requirements. When there is assumed to be used more material input, it would also result in a rise of output. This does not only apply for material streams, but also for emissions, so it is just logical that, once

D8.1 First Iteration Environmental Impact
23
more process and material requirements are used, more emissions are produced. Therefore, a direct proportion between emissions and total weight is as well assumed. Fourth assumption is contradictory to assumptions made before: for transport data, the numbers will be taken directly from literature and without any conversion included in the model. This is due to the fact that heavier components only will not require additional transport activities. Therefore, it is presumed that bigger and heavier components result in the same transport activities as smaller ones. Additionally, and in order to be aligned with the transport activities used to model the bus, the same transport is assumed (e.g. for rail transport the ecoinvent process “Transport, freight, rail [DE]” and for lorry transport “transport, lorry 16-32t, EURO[5] is taken). The modelling of the battery in Umberto is shown in Figure 5: .
Figure 5: Foreground model battery components
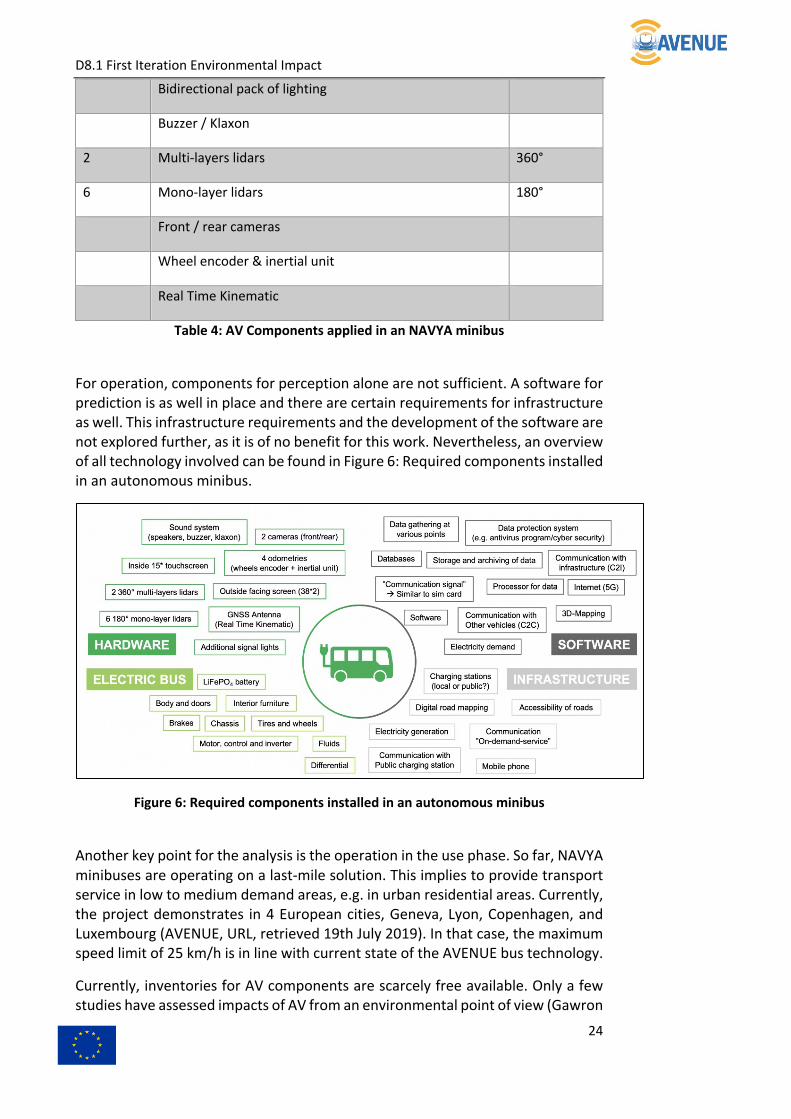
3.1.3 Autonomous Vehicle Components Beside of typical vehicle components like brakes, engine, interior, etc., additional technical components need to be put in place in order to run autonomously. These are an inside 15” touchscreen, an outside facing screen, additional speakers and bidirectional pack of lighting, a buzzer and an klaxon, 2 360° multi-layers lidars, 6 180° mono-layer lidars, front and rear cameras, an wheel encoder and an inertial unit and a real time kinematic. Table 4: AV Components applied in an NAVYA minibus lists Autonomous Vehicle (AV) components installed in 1 NAVYA minibus (NAVYA, n.n., p. 22-23).
AV components applied in an NAVYA minibus
Number Components Range
1 15” touchscreen
1 Outside facing screen 38”x2
Speakers
D8.1 First Iteration Environmental Impact
24
Bidirectional pack of lighting
Buzzer / Klaxon
2 Multi-layers lidars 360°
6 Mono-layer lidars 180°
Front / rear cameras
Wheel encoder & inertial unit
Real Time Kinematic
Table 4: AV Components applied in an NAVYA minibus
For operation, components for perception alone are not sufficient. A software for prediction is as well in place and there are certain requirements for infrastructure as well. This infrastructure requirements and the development of the software are not explored further, as it is of no benefit for this work. Nevertheless, an overview of all technology involved can be found in Figure 6: Required components installed in an autonomous minibus.
Figure 6: Required components installed in an autonomous minibus
Another key point for the analysis is the operation in the use phase. So far, NAVYA minibuses are operating on a last-mile solution. This implies to provide transport service in low to medium demand areas, e.g. in urban residential areas. Currently, the project demonstrates in 4 European cities, Geneva, Lyon, Copenhagen, and Luxembourg (AVENUE, URL, retrieved 19th July 2019). In that case, the maximum speed limit of 25 km/h is in line with current state of the AVENUE bus technology.
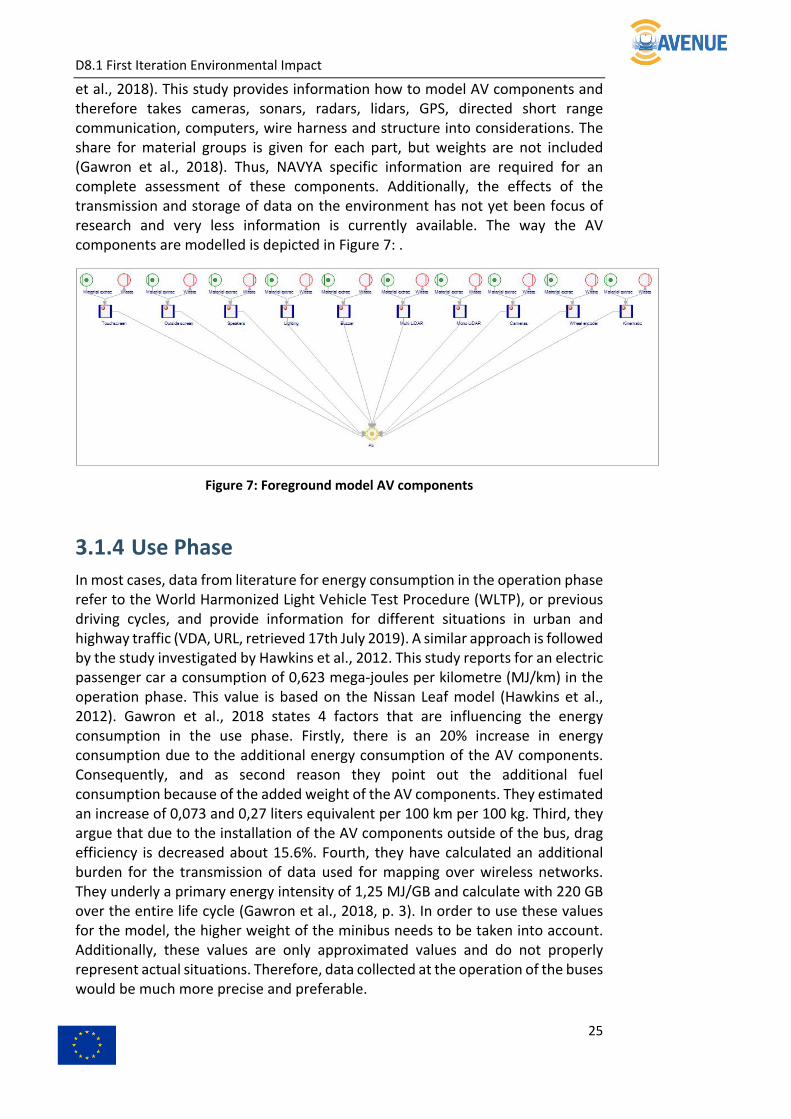
Currently, inventories for AV components are scarcely free available. Only a few studies have assessed impacts of AV from an environmental point of view (Gawron
D8.1 First Iteration Environmental Impact
25
et al., 2018). This study provides information how to model AV components and therefore takes cameras, sonars, radars, lidars, GPS, directed short range communication, computers, wire harness and structure into considerations. The share for material groups is given for each part, but weights are not included (Gawron et al., 2018). Thus, NAVYA specific information are required for an complete assessment of these components. Additionally, the effects of the transmission and storage of data on the environment has not yet been focus of research and very less information is currently available. The way the AV components are modelled is depicted in Figure 7: .
Figure 7: Foreground model AV components
3.1.4 Use Phase In most cases, data from literature for energy consumption in the operation phase refer to the World Harmonized Light Vehicle Test Procedure (WLTP), or previous driving cycles, and provide information for different situations in urban and highway traffic (VDA, URL, retrieved 17th July 2019). A similar approach is followed by the study investigated by Hawkins et al., 2012. This study reports for an electric passenger car a consumption of 0,623 mega-joules per kilometre (MJ/km) in the operation phase. This value is based on the Nissan Leaf model (Hawkins et al., 2012). Gawron et al., 2018 states 4 factors that are influencing the energy consumption in the use phase. Firstly, there is an 20% increase in energy consumption due to the additional energy consumption of the AV components. Consequently, and as second reason they point out the additional fuel consumption because of the added weight of the AV components. They estimated an increase of 0,073 and 0,27 liters equivalent per 100 km per 100 kg. Third, they argue that due to the installation of the AV components outside of the bus, drag efficiency is decreased about 15.6%. Fourth, they have calculated an additional burden for the transmission of data used for mapping over wireless networks. They underly a primary energy intensity of 1,25 MJ/GB and calculate with 220 GB over the entire life cycle (Gawron et al., 2018, p. 3). In order to use these values for the model, the higher weight of the minibus needs to be taken into account. Additionally, these values are only approximated values and do not properly represent actual situations. Therefore, data collected at the operation of the buses would be much more precise and preferable.
D8.1 First Iteration Environmental Impact
26
3.1.5 End of Life Treatment The End of Life Treatment of vehicles is well regulated by DIRECTIVE 2000/53/EC (European Parliament, 2000). From the 1st January 2015 on, the reuse and recovery have to be at least 95% of an average weight per vehicle and year. For reuse and recycling, at least 85% of an average weight per vehicle and year has to be realized (European Parliament, 2000). More guidance on how to model the EoL Treatment is given by the “Guidelines for the LCA of electric vehicles” (Althaus et al., 2013). Furthermore, Hawkins et al. 2012 is reporting material inputs for the EoL treatment. The model of the EoL treatment will be part of the deliverable D8.2.
3.2 Further comprehension of the model As stated in previous sections information for the 20 most important components will be provided by the manufacturer NAVYA. No details about material input can be given at this point of the project, but later on results will be reported in detail..

D8.1 First Iteration Environmental Impact
27
4 Outlook This deliverable summarizes the current state of assessing autonomous minibuses in environmental terms within the AVENUE project. It provides a framework and basis for further analysis and detailed data gathering. Upcoming activities within task 8.1 of WP8 will focus on the following aspects, among others. The research has shown that AV components need to be further investigated. Gawron et al. is providing the share of materials for some AV components, but for the entire modelling further studies might have to be consulted, e.g. Ciroth et al., 2011. Another aspect that needs further investigation is the minibus use phase. The energy consumption can be influenced by different impacts and literature is providing abundant values (Hawkins et al., 2012; Gawron et al., 2019). Additional information can be gathered from driving cycles, e.g. WLTP (VDA, URL, retrieved 17th July 2019). Beside the calculation of energy consumption, the conversion of the product flow to the functional unit still has to be done. After the autonomous minibus has been in use and reached the end of the operation time, it needs to be disposed. Strong regulations are existing for the EoL treatment within the European Union (European Parliament, 2000). Furthermore, the guidelines for the LCA of electric cars describe in detail how to model the treatment at the EoL (Althaus et al., 2013, p. 106-112) and material input is, among others, provided by Hawkins (Hawkins et al., 2012). Once refinements for the above-mentioned aspects have been made, further data from NAVYA can be included in the theoretical model and adjustments can be done correspondingly. Fig. 8 summarizes the general approach for conducting an LCA for a NAVYA minibus.
Figure 8: General approach for conducting LCA studies on minibuses within AVENUE
D8.1 First Iteration Environmental Impact
28
5 Literature Althaus, H., Bütler, T., Del Duce, A., Dettmer, T., Egede, P., Phlschläger, G., Szczechowicz, E., (2013): Operational guidance for Life Cycle Assessment studies of the European Green Cars initiative. PDF. URL: http://www.elcar-project.eu/fileadmin/dokumente/Guideline_versions/ eLCAr_guidelines.pdf.
Avenue: Project, https://avenue.unige.ch/?page_id=262. Retrieved 19th of July 2019.
Bhakar, V., Agur, A., Digalwar, A., Sangwan, K., Life Cycle Assessment of CRT, LCD and LED Monitors, 22nd CIRP conference on Life Cycle Engineering, 2015, p. 432-437.
Biemann, K., Helms, H., Jöhrens, J., Kämper, C., Lambrecht, U., Meyer, K., (2019): Klimabilanz von Elektroautos. Einflussfaktoren und Verbesserungspotenzial.
Burnham, A., Wang, M., Wu, Y., (2006): Development and Application of GREET 2.7 – The Transportation Vehicle-Cycle Model.
Choi, B., Shin, H., Lee, S., Hur, T., Life Cycle Assessment of a Personal Computer and its Effective Recycling Rate, The international Journal of Life Cycle Assessment, 2006 (11), No. 2, p. 122-128.
Ciroth, A., Franze, J., (2011), LCA of an Ecolabled Notebook, Consideration of Social and Environmental Impacts Along the Entire Life Cycle.
Cooney, G., Hawkins, T., Marriott, J., Life Cycle Assessment of Diesel and Electric Public Transportation Buses, Journal of Industrial Ecology, 2013 (17), No. 5, p. 689-699.
Daimler AG, (2019): A-Klasse Kompaktlimousine und Limousine. Preisliste gültig ab 15. Mai 2019. PDF. URL: https://www.mercedes-benz.de/passengercars/mercedes-benz-cars/models/a-class/hatchback-w177/buy-and-own/pricelists/_jcr_content/downloadbox/downloadcolumn1/ download.attachment.Preisliste_A_Klasse_WV177_190625.pdf.
Daimler AG, (2018): Environmental Certificate Mercedes-Benz A-Class. Life Cycle Overall Documentation. PDF. URL: https://www.daimler.com/documents/sustainability/product/daimler-environmental-certificate-mb-a-class.pdf.
Duan, H., Eugster, M., Hischier, R., Streicher-Porte, M., Li, J., Life cycle assessment study of a Chinese desktop personal computer, Science of the Total Environment, 2009 (407), p. 1755-1764.

D8.1 First Iteration Environmental Impact
29
Ecoinvent, database ecoinvent 3.5.
Ecoinvent, database ecoinvent 2.2.
European Environment Agency (EEA), (2018): Electric vehicles from life cycle and circular economy perspectives. TERM 2018: Transport and Environment Reporting Mechanism (TERM) report.
European Parliament (2000): Directive 2000/53/EC of the European Parliament and the Council of 18 September 2000 on end-of life vehicles.
Gawron, J., Keoleian, G., Kleine, R., Wallington, T., Kim, H., Life Cycle Assessment of Connected and Automated Vehicles: Sensing and Computing Subsystem and Vehicle Level Effects, Environmental Science & Technology, 2018, 52, p. 3249-3256.
Guinée, J.B.; Gorrée, M.; Heijungs, R.; Huppes, G.; Kleijn, R.; Koning, A. de; Oers, L. van; Wegener Sleeswijk, A.; Suh, S.; Udo de Haes, H.A.; Bruijn, H. de; Duin, R. van; Huijbregts, M.A.J. Handbook on life cycle assessment. Operational guide to the ISO standards. Dordrecht. 2002.
Harris, A., Soban, D., Smyth, B., Best, R., Renewable and Sustainable Energy Reviews, 2018, 97, p. 569-579.
Hauschild, M., Huijbregts, M.,(2015): Life Cycle Impact Assessment. LCA Compendium – The Complete World of Life Cycle Assessment. Heidelberg i.a. Springer.
Hawkins, T., Singh, B., Majeau-Bettez, G., Strømman, A, Comparative Environmental Life Cycle Assessment of Conventional and Electric Vehicles, Journal of Industrial Ecology, 2012 (12), No. 1, 53-64.
Institute for Environment and Sustainability (IES), (2010). International Reference Life Cycle Data System (ILCD) Handbook. General guide for Life Cycle Assessment – Detailed guidance. Luxembourg. PDF. URL: http://publications.jrc.ec.europa.eu/repository/bitstream/JRC48157/ ilcd_handbook-general_guide_for_lca-detailed_guidance_12march2010_isbn_fin.pdf.
International AB, (2018): Public and private buses and coaches. Product category classification: UN CPC 49112 & 49113. PDF. URL: https://www.environdec.com/PCR/Detail/?Pcr=11094.
Krug, P., (n.n.), Reifen versenden, Felgen versenden, URL: https://versandrechner.de/impressum.htm, retrieved: 8th of July 2019.
Majeau-Bettez, G., Hawkins, T., Strømman, A., Life Cycle Environmental Assessment of Lithium-Ion and Nickel Metal Hydride Batteries for Plug-In Hybrid and Battery Electric Vehicles, Environmental Science & Technology, 2011, 45, 4548-4554.
D8.1 First Iteration Environmental Impact
30
McKenzie, E., Durango-Cohen, P., Environmental life-cycle assessment of transit buses with alternative fuel technology, Transportation Research Part D, 2012, 12, p. 39-47.
Naeler, R., Reichmuth, D., Anair, D., (2015): Cleaner Cars from Cradle to Grave. How Electric Cars Beat Gasoline Cars on Lifetime Global Warming Emissions.
Navya, (n.n.). Providing fluid mobility with autonomous shuttles. Lyon. PDF. URL: https://navya.tech/wp-content/uploads/documents/Brochure_Shuttle_EN.pdf.
N.n. (2018): Product Environmental Footprint Category Rule. PDF. URL: http://ec.europa.eu/environment/eussd/smgp/documents/PEFCR_ITequipment.pdf.
Teehan, P., Kandlikar, M., Sources of Variation in Life Cycle Assessments of Desktop Computers, Journal of Industrial Ecology, 2012 (16), No. S1, p. 182-194.
The Advanced Rechargeable & Lithium Batteries Association, (2018): PEFCR – Product Environmental Footprint. Category Rules for High Specific Energy Rechargeable Batteries for Mobile Applications. PDF. URL: http://ec.europa.eu/environment/eussd/smgp/pdf/ PEFCR_Batteries.pdf.
Verband der Automobilindustrie, URL: https://www.vda.de/en/topics/environment-and-climate/exhaust-emissions/wltp-worldwide-harmonized-light-vehicles-test-procedure, retrieved: 17th of August 2019

D8.1 First Iteration Environmental Impact
31
Appendix I: Consulted studies for selecting impact categories Impact categories EPD of public transport PCR Public & private buses Mercedes A-Class
Climate Change x x x
Acidification Potential (AP) x x x
Eutrophication Potential (EP) x x x
Ozone Layer Depletion Potential (ODP, steady state) x x
Photochemical Ozone Creation Potential (POCP) x x x
Abiotic depletion potential for non-fossil resources, ADP elements x
Abiotic depletion potential for fossil resources, ADP-fossil fuels x x
Ecotoxicity
Human toxicity (HT) x
Freshwater Aquatic Ecotoxicity Potential (FAETP)
Freshwater Sediment Ecotoxicity Potential (FSETP)
Ionizing Radiation (IR)
Malodors air, Marine Aquatic Ecotoxicity Potential (MAETP)
Marine Sediment Eco-Toxicity Potential (MSETP)
Photochemical ox (summer smog)
Terrestrial Eco-toxicity potential (TETP)
Carcinogens
Respiratory inorganics
Table 5: Related studies and reported impact categories
D8.1 First Iteration Environmental Impact
32
Impact categories
PEF
Batteries
PEFCR IT
equipment PC
Desktop Computers
(Teehan et al., 2012)
Chinese desktop PC
(Duan et al., 2008)
Climate Change x x x x Eco-indicator 99
Acidification Potential (AP) x x
Eutrophication Potential (EP) x x x x
Ozone Layer Depletion Potential (ODP, steady state) x x
Photochemical Ozone Creation Potential (POCP) x x x
Abiotic depletion potential for non-fossil resources, ADP elements x x
Abiotic depletion potential for fossil resources, ADP-fossil fuels x x
Ecotoxicity x x x x
Human toxicity (HT) x
Freshwater Aquatic Ecotoxicity Potential (FAETP)
Freshwater Sediment Ecotoxicity Potential (FSETP)
Ionizing Radiation (IR) x
Malodors air, Marine Aquatic Ecotoxicity Potential (MAETP)
Marine Sediment Eco-Toxicity Potential (MSETP)
Photochemical ox (summer smog)
Terrestrial Eco-toxicity potential (TETP)
Carcinogens
Respiratory inorganics
D8.1 First Iteration Environmental Impact
33
Impact categories
LCA for PC
Choi et al., 2006
CRT, LCD and LEG Monitors
Bhakar et al., 2015
CML 2001 (Mid-
point) ILCD
Climate Change x Impact 2002+ (End point) x x
Acidification Potential (AP) x climate change x x
Eutrophication Potential (EP) x ecosystem quality x x
Ozone Layer Depletion Potential (ODP, steady state) x human health and resource
Photochemical Ozone Creation Potential (POCP) x CML 2001 (see next column) x
Abiotic depletion potential for non-fossil resources, ADP elements x x x
Abiotic depletion potential for fossil resources, ADP-fossil fuels x
Ecotoxicity x x
Human toxicity (HT) x x
Freshwater Aquatic Ecotoxicity Potential (FAETP) x
Freshwater Sediment Ecotoxicity Potential (FSETP) x
Ionizing Radiation (IR) x x
Malodors air, Marine Aquatic Ecotoxicity Potential (MAETP) x
Marine Sediment Eco-Toxicity Potential (MSETP) x
Photochemical ox (summer smog) x x
Terrestrial Eco-toxicity potential (TETP) x
Carcinogens x
Respiratory inorganics x
D8.1 First Iteration Environmental Impact
34
Appendix II: Data collection sheet
D8.1 First Iteration Environmental Impact
35
Appendix III: Conversion to NAVYA
minibus
CONVERSION TO NAVYA MINIBUS Empty weight of a minibus 2400,00 kg
1 Body-in-white 371,87 kg
2 Doors, including trunk lid 184,99 kg
3 Electric Motor, Other 165,98 kg
4 Battery Passive Cooling System 140,85 kg
5 Inverter, for motor 130,71 kg
6 Inverter, for charging 130,71 kg
7 Driveshaft/axle 130,17 kg
8 Body panels 118,78 kg
9 HVAC (GREET) 96,78 kg
10 Other, Seating and restraint (GREET data) 87,70 kg
11 Wheels (x4) 73,20 kg
12 Corner suspension 71,87 kg
13 Electric Motor, Copper Windings, Base 67,92 kg
14 Tires (x4) 66,51 kg
15 Cradle 52,71 kg
16 Brakes, hardware 50,63 kg
17 Steering system 39,13 kg
18 Other, Trim and Insulation (GREET data) 32,84 kg
19 Side body glass (6) 22,06 kg
20 Doors, including trunk lid, interior plastics etc. 21,13 kg
SUM 2056,53 kg 86%
D8.1 First Iteration Environmental Impact
36
Appendix IV: Li-Ion battery and
subcomponent production
Li-ion battery and subcomponent production
Functional Unit Output
Li-ion battery, assembled 1 350,00 kg
Material Requirements
Positive electrode paste 0,25 87,50 kg
Negative electrode past 0,08 28,00 kg
Positive electrode substrate 0,036 12,60 kg
Negative electrode substrate 0,083 29,05 kg
Electrolyte 0,12 42,00 kg
Separator 0,033 11,55 kg
Cell container, tab and terminals 0,2 70,00 kg
Module and Battery Packaging 0,17 59,50 kg
Battery management system (BMS) 0,02 7,00 kg
Water, decarbonated 380 133.000,00
Processing and Energy Requirements
Electricity, medium voltage, UCTE, at grid 27 3.207,60 MJ
Heat, light fuel oil, at industrial furnace 1 mW 2,9 344,52 mW
Heat, natural gas, industrial furnace low-Nox> 100 kW 22 2.613,60 kW
Transport Requirements
Freight rail transport 0,23 27,32 tkm
Lorry > 16t 0,051 6,06 tkm
Infrastructure
Facility, precious metal refinery (SE) 1,9E-08 0,00 unit
Emissions
Waste heat (MJ) 52 6.177,60 MJ